I Department of Biomedical Sciences University of Veterinary Medicine Vienna Institute of Pharmacology and Toxicology Head: Univ. Prof. Dr. Veronika Sexl Oxygen consumption of J774A.1 macrophages associated with mitochondrial respiration and production of reactive oxygen species Bachelor thesis submitted for the fulfilment of the requirements for the degree of Bachelor of Science (BSc.) University of Veterinary Medicine Vienna submitted by Nikola Knoll Vienna, June 2020

Welcome message from author
This document is posted to help you gain knowledge. Please leave a comment to let me know what you think about it! Share it to your friends and learn new things together.
Transcript
I
Department of Biomedical Sciences
University of Veterinary Medicine Vienna
Institute of Pharmacology and Toxicology
Head: Univ. Prof. Dr. Veronika Sexl
Oxygen consumption of J774A.1 macrophages associated with mitochondrial respiration and
production of reactive oxygen species
Bachelor thesis submitted for the fulfilment of the requirements for the degree of
Bachelor of Science (BSc.)
University of Veterinary Medicine Vienna
submitted by
Nikola Knoll
Vienna, June 2020
II
Supervisor: Ao. Univ. Prof. Dr. Katrin Staniek
University of Veterinary Medicine Vienna
Department of Biomedical Sciences
Institute for Pharmacology and Toxicology
Veterinärplatz 1
1210 Vienna
Reviewer: Dipl.-Biol. Dr. rer.nat. Rudolf Moldzio
University of Veterinary Medicine Vienna
Department of Biomedical Sciences
Institute of Medical Biochemistry
Veterinärplatz 1
1210 Vienna
III
TABLE OF CONTENT
1 Introduction ........................................................................................................................... 1
1.1 Macrophages: cells of the innate immune system .................................................................. 1
1.2 Activation of macrophages .................................................................................................... 2
1.2.1 Classically activated macrophages ..................................................................... 3
1.2.2 Wound-healing macrophages ............................................................................. 3
1.2.3 Regulatory macrophages .................................................................................... 3
1.3 Oxygen consumption of activated macrophages.................................................................... 4
1.3.1 Mitochondrial respiration ..................................................................................... 4
1.3.2 Oxidative burst.................................................................................................... 6
1.4 NADPH oxidase and ROS production .................................................................................... 7
1.5 Antioxidative enzymes ........................................................................................................... 8
1.6 Macrophages as host cells for pathogens: Leishmania .......................................................... 9
1.7 Defence mechanisms of Leishmania against the oxidative burst ......................................... 12
2 Materials and Methods ........................................................................................................ 15
2.1 Chemicals............................................................................................................................ 15
2.2 Cell culture of J774A.1 macrophages .................................................................................. 16
2.3 Cell counting of J774A.1 macrophages ............................................................................... 16
2.4 Cell culture of Leishmania tarentolae promastigotes ............................................................ 18
2.5 Cell counting of Leishmania tarentolae promastigotes ......................................................... 18
2.6 Determination of protein concentration of J774A.1 macrophages ........................................ 18
2.7 Measurement of oxygen consumption ................................................................................. 20
2.8 Statistical analysis ............................................................................................................... 21
3 Results ................................................................................................................................. 22
3.1 Protein content of J774A.1 macrophages ............................................................................ 22
IV
3.2 Mitochondrial and NOX2-associated oxygen consumption of J774A.1 macrophages .......... 23
3.3 Effects of Leishmania tarentolae promastigotes on oxygen consumption of J774A.1
macrophages ....................................................................................................................... 34
4 Discussion ........................................................................................................................... 40
5 Summary .............................................................................................................................. 46
6 Zusammenfassung .............................................................................................................. 47
7 Abbreviations ...................................................................................................................... 48
8 List of Figures...................................................................................................................... 49
9 References ........................................................................................................................... 53
10 Acknowledgements ............................................................................................................. 56
1
1 INTRODUCTION
1.1 Macrophages: cells of the innate immune system
Once a pathogen manages to overcome anatomical barriers of a host organism and breaks
through the epithelial layer, the cells of the innate immune response are the first line of
defense. If the pathogen survives this early immune response, the adaptive immune system
is activated. Important cells of the innate immune system are macrophages, granulocytes
(neutrophil, basophil, and eosinophil), mast cells, and dendritic cells, which origin from the
common myeloid progenitor. Macrophages, granulocytes, and dendritic cells are the immune
system’s phagocytes. Macrophages appear in almost all tissues, many tissue-resident
macrophages develop during embryogenesis, whereas other macrophages differentiate from
the blood-circulating monocytes that migrate into tissue. Unlike some other cells from the
immune system, macrophages live relatively long and participate during both, the innate and
adaptive immune response, mostly by phagocyting microorganisms and killing them. Besides
their phagocytic activity for the immune system, macrophages act as scavenger cells to
eliminate dead cells and cell debris. Moreover, the production of inflammatory mediators is
an important function of the macrophages to activate other immune cells (Murphy and
Weaver 2018).
As macrophages act as major effector cells of the innate immune system by recognizing
pathogens and malignant cells and consequently eliminating them, they also play a key role
in tissue homeostasis, development, and repair. Not only do macrophages have a variety of
functions, but also the macrophage population is very diverse where different types emerge
from distinct developmental hematopoietic sites. For example, microglia from the brain origin
from the embryonic yolk sac, whereas tissue-resident macrophages found in the liver, lung,
spleen, pancreas, and kidney arise from the fetal liver. Both, the microglia and tissue-
resident macrophages populate tissues during embryogenesis and self-renew in adulthood.
In the contrary to these long-living macrophages, macrophages arising from the post-natal
bone marrow only migrate into tissues due to an inflammation and only live for a short
amount of time (Bernarreggi et al. 2019).
There is a vast diversity of tissue-specific macrophage populations in the body like
osteoclasts of the bone, alveolar macrophages in the lung, microglia in the brain, histiocytes
in connective tissue, macrophages in the gastrointestinal tract, Kupffer cells in the liver,
macrophages in the spleen, and macrophages in the peritoneum (Mosser and Edwards
2
2008). It has been shown that this heterogeneity in macrophage populations is mainly due to
the tissue environment, where epigenetic programmes are directed into the tissue-specific
phenotype. Therefore, distinct genetic expression profiles would be very likely, since these
various phenotypes have different expressions of transcription factors they require for their
functions. Even though tissue macrophages are mostly independent from the blood’s
monocytes, after inflammation of tissues like the heart, however, monocyte-derived
macrophages can replace embryonic macrophages. Moreover, macrophages have a
remarkable plasticity, showing that adaptions to new environments are possible. Expression
of certain genes may still be dependent on the cell’s origin but epigenetics and gene
expression profiles can be altered due to new environments. Hence, macrophage plasticity
can play an important role in chronic inflammations, for example, since cell polarization does
not necessarily have to be irreversible (Davies and Taylor 2015).
1.2 Activation of macrophages
Macrophages can recognize pathogen-associated molecular patterns (PAMPs) with pattern
recognition receptors (PRRs). PAMPs are mannose-rich oligosaccharides, peptidoglycans,
lipopolysaccharides, or unmethylated CpG DNA, which are a part of lots of microorganisms
or viruses but not of the host cells. Some of the PRRs are located in the membrane, others in
the cytoplasm. Once PAMPs bind to a macrophage’s PRRs, the release of cytokines and
small lipid mediators of inflammation is initiated, as well as the phagocytosis of the pathogen.
Cytokine release causes the dilation of local blood vessels, which leads to swelling, redness,
and increased heat. More inflammatory cells (mainly macrophages and neutrophils) migrate
to the site of infection and release pain-causing inflammatory mediators (Murphy and Weaver
2018).
Macrophage activation is traditionally divided into M1 and M2 polarizations, where M1 is
classically activated by e.g. lipopolysaccharide and M2 alternatively by e.g. interleukin (IL) 4.
It appears, however, that activated macrophages are not just M1 or M2 because of the
heterogeneity of macrophages resident in tissues during homeostasis and inflammation
(Davies and Taylor 2015). Mosser and Edwards suggest a classification in classically
activated macrophages with microbicidal activity, wound-healing macrophages with functions
in tissue repair, and regulatory macrophages with anti-inflammatory activity (Mosser and
Edwards 2008).
3
1.2.1 Classically activated macrophages
Stimulation with both interferon-γ (IFNγ) and tumor-necrosis factor (TNF) leads to classically
activated macrophages, which are characterized by increased microbicidal or tumoricidal
capacity and a release of pro-inflammatory cytokines and mediators. Especially natural killer
cells are early producers of IFNγ but cannot sustain classically activated macrophages,
which is why cells of the adaptive immunity, especially T helper 1 cells, are important for a
stable host defense by classically activated macrophages. An enhanced ability of killing by
an increase of the production of reactive oxygen species (ROS) by classically activated
macrophages is especially important for fighting against intracellular pathogens. IFNγ and
TNF lead to Toll-like receptor or TNF receptor ligation, activation of signal transducer and
activator of transcription (STAT) molecules, nuclear factor-κB (NFκB), and mitogen-activated
protein kinases (MAPKs). Impairment of this signaling pathway has been shown to decrease
host defense against intracellular pathogens like Leishmania spp. Intracellular pathogens like
Leishmania spp. or Mycobacterium tuberculosis impair efficient macrophage activation by
interfering with the IFNγ signaling pathway. Moreover, if classically activated macrophages
are not regulated appropriately, damage to host tissue, insulin resistance, or predisposition of
neoplastic transformation can occur with dangerous consequences (Mosser and Edwards
2008).
1.2.2 Wound-healing macrophages
IL-4 produced by basophils, mast cells, and also other granulocytes during tissue injury is
probably the main factor in generating extracellular matrix producing wound-healing
macrophages out of resident macrophages. IL-4 can also be secreted by T helper 2 cells in
response to disruption at mucosal surfaces in the lung or intestine. Wound-healing
macrophages only have limited functions in antigen-presenting or oxidative burst and are
more susceptible to some pathogens. Intracellular pathogens like the fungus Cryptococcus
neoformans, the parasite Leishmania major, or bacteria Mycobacterium tuberculosis,
Francisella tularensis, and Yersinia enterocilitica seem to use this lack in immune response
of wound-healing macrophages for their advantage (Mosser and Edwards 2008).
1.2.3 Regulatory macrophages
Regulatory macrophages are activated through immune complexes, prostaglandins, G-
protein-coupled receptor ligands, apoptotic cells, IL-10, and glucocorticoids. Host defense of
this macrophage population is decreased, as well as the transcription of genes of pro-
inflammatory cytokines, but production of anti-inflammatory IL-10 is stimulated and
4
phagocytosis of apoptotic bodies is not impaired. Pathogens exploit the inhibiting effect of
regulatory macrophages on the immune response by mimicking some of the stimuli that
activate regulatory macrophages. Leishmania spp., for example, enter the macrophages
through binding to immunoglobulin G and docking on its Fc receptor on macrophages, which
is also causing regulatory macrophage activation and thus providing the protozoan a host
cell that is permissive to intracellular growth. African trypanosomes, Bacillus anthracis,
Coxiella burnetti, Dengue virus, and Ross river virus are all exploiting the inhibitory effect on
the immune response of regulatory macrophages. Spread and survival of the pathogens are
increased, since pathogen-killing mechanisms are impaired (Mosser and Edwards 2008).
1.3 Oxygen consumption of activated macrophages
1.3.1 Mitochondrial respiration
Macrophages as most eukaryotic cells use mitochondria for the generation of adenosine
triphosphate (ATP). During energy conversion in the mitochondrion, oxygen is used as the
final acceptor of the electron transport chain consisting of four protein complexes located in
the inner mitochondrial membrane and is reduced into water. Electrons are mainly donated
from the reduced nicotinamide adenine dinucleotide (NADH), which originates from previous
reactions during glycolysis and the citrate cycle, and are passed from one respiratory chain
complex to the next, where energy levels decrease with every complex, while redox energy
is used to pump protons through the membrane into the intermembrane space to produce an
electrochemical gradient. This electrochemical gradient is later used to drive ATP production
via the ATP synthase.
NADH binds to the matrix side of mitochondrial complex I, the NADH dehydrogenase
complex, where it donates electrons. Electrons are passed to ubiquinone which is reduced to
ubiquinol and transports the electrons to cytochrome c reductase, complex III of the
respiratory chain. Complex II, the succinate dehydrogenase, does not serve as a proton
pump but electrons are also fed into the electron transport chain by ubiquinol after oxidation
of succinate and transported to cytochrome c reductase. Cytochrome c further carries
electrons to the last complex in the electron transport chain. The last complex, cytochrome c
oxidase or also referred to as complex IV, transports the electrons from cytochrome c to
molecular oxygen, where oxygen is reduced. In order to produce water out of one molecule
5
of oxygen, four electrons and four protons are necessary. In complex IV, the following
reaction (reaction 1) takes place to produce water (Alberts et al. 2015):
4 H+ + 4 e- + O2 ——→ 2 H2O (reaction 1)
Consequently, oxygen is constantly required for energy conversion in mitochondria, which is
seen as oxygen consumption. Cellular respiration provides more energy than anaerobic
metabolism. Moreover, usually up to 90 % of oxygen uptake in cells is accounted by
cytochrome c oxidase, which underlies its importance in aerobic life (Alberts et al. 2015).
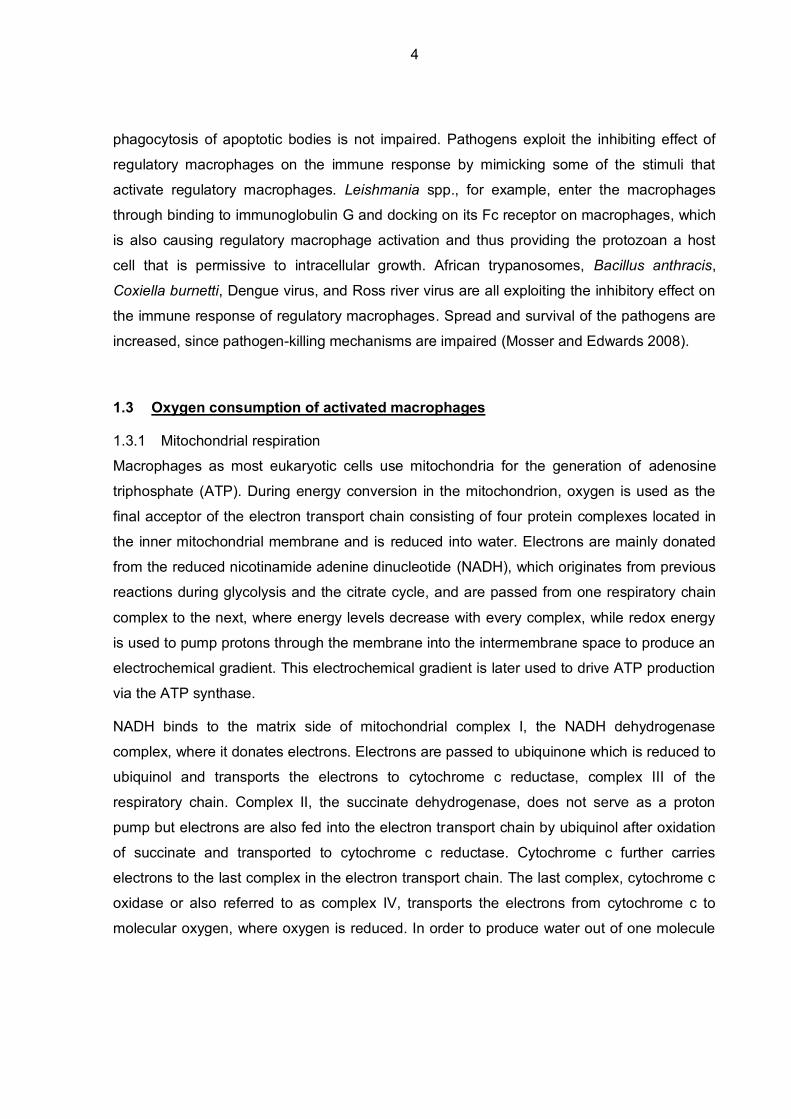
Respiratory chain complexes can be selectively inhibited by several substances (Figure 1),
thus blocking oxygen consumption and energy conversion in mitochondria. For example,
rotenone, a poison naturally occurring in roots, seeds and stems of many different plants,
e.g. derris species, is a classical inhibitor of complex I. The antibiotics antimycin A and
myxothiazol are selective inhibitors of complex III. While antimycin A binds to this complex at
the matrix side of the inner mitochondrial membrane, myxothiazol inhibits complex III by
binding to its outer side. Cyanide is a known inhibitor of complex IV and, hence, ATP
production (Herrero and Barja 1997, Dettmer et al. 2013).
Figure 1: Mitochondrial oxygen consumption and its selective inhibitors: Mitochondrial
complexes I-IV are located in the inner mitochondrial membrane and transport electrons
donated from NADH and succinate along the electron transport chain. At complex IV,
electrons finally reduce molecular oxygen to water.
I
IIe-
e-
III IVO2
+4H+
2H O2
NADH
Succinate
Matrix
Intermembrane Space
6
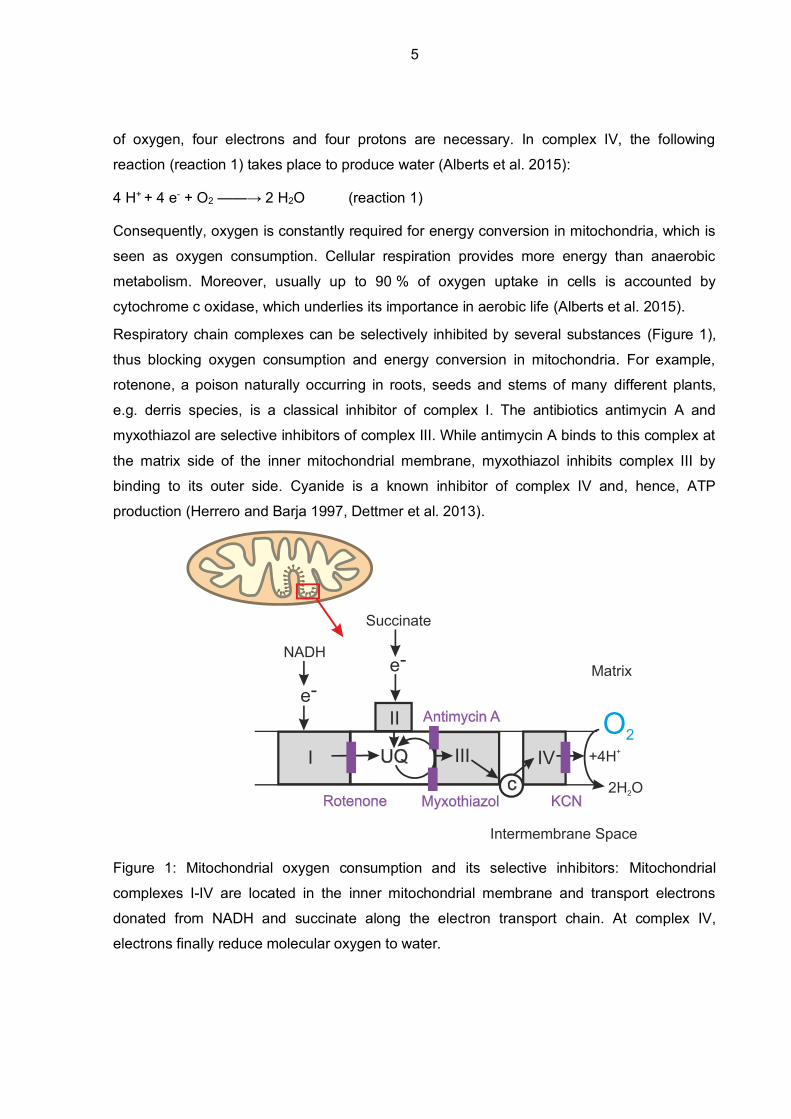
1.3.2 Oxidative burst
In addition to the mitochondrial oxygen consumption, activated macrophages consume
molecular oxygen due to the production of ROS, such as superoxide radical anions and
subsequently hydrogen peroxide, via their membrane-bound NADPH oxidase (NOX2). This
is called respiratory or oxidative burst. Hence, an increased phagocytic activity can result in
enhanced oxygen uptake (Figure 2) (Lepoivre et al. 1982). The model substance, phorbol
12-myristate 13-acetate (PMA) can stimulate NOX2-dependent oxygen consumption via an
activation of protein kinase C (PKC) (Rist and Naftalin 1993).
More details regarding the regulation of NOX2 and ROS production are given in the next
chapter (see §1.4).
Figure 2: Oxidative burst of macrophages is accompanied with increased non-mitochondrial
oxygen uptake and production of superoxide radical anions. phorbol 12-myristate 13-acetate
can artificially stimulate NADPH oxidase (NOX2) via an activation of protein kinase C (PKC).
Apoptotic host cells
Cancer cells
Cell debris
Phagolysosome
O2.
O2. O2
.O2.
O2.O2
.
O2.
O2.
O2.
O2.
O2.
O2.
NADPH
Pentose-phosphatepathway
Microorganisms
Leishmania ?
NADP+
NOX2
NOX2O2
Phorbol 12-myristate13-acetate
PKC
7
1.4 NADPH oxidase and ROS production
By activating macrophages with different chemotactic and phagocytic molecules, cytotoxic
granular proteins like lysozyme, proteases, phospholipases, and cationic proteins are
secreted into the phagolysosome, which destructs the pathogen. This pathway is mostly
oxygen-independent, whereas in aerobic conditions ROS, such as superoxide radical anions
and subsequently hydrogen peroxide, are produced by macrophages via NOX2 to kill
pathogens. The following reaction (reaction 2) takes place when molecular oxygen, at the
expanse of the reduced nicotinamide adenine dinucleotide phosphate (NADPH), is reduced
to superoxide radical anions (Rist and Naftalin 1993):
2 O2 + NADPH ——→ 2 O2●- + NADP+ + H+ (reaction 2)
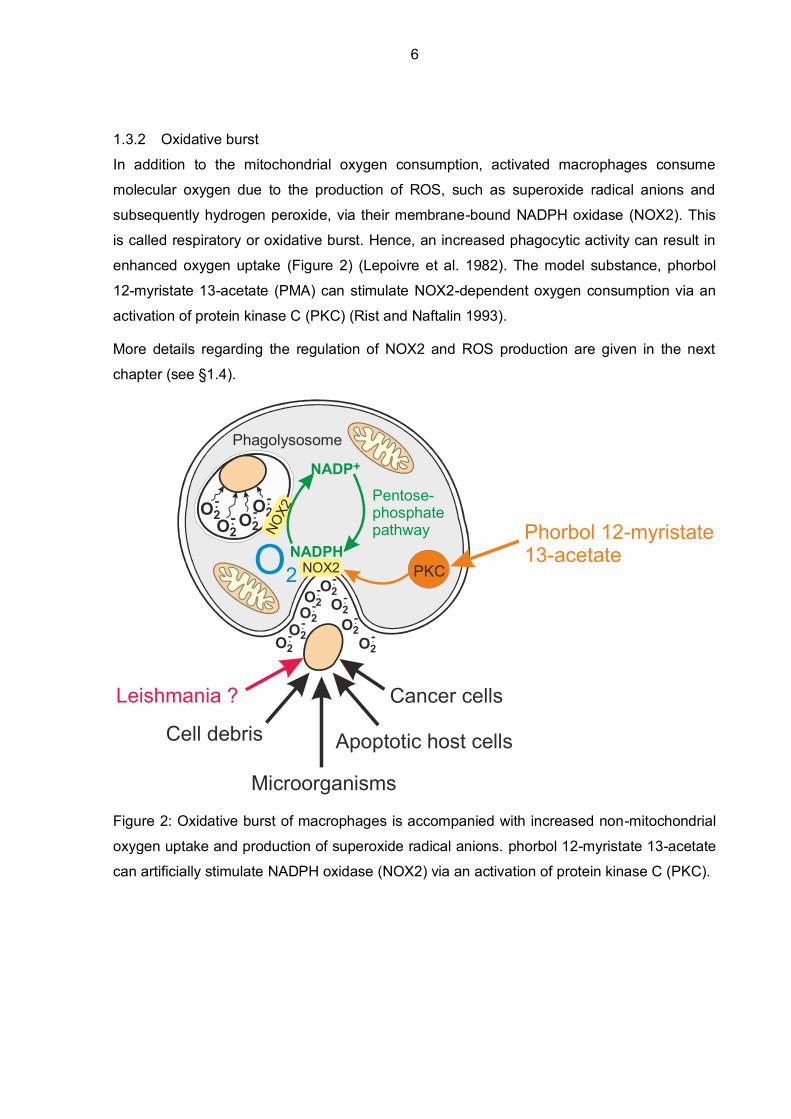
NOX2 possesses six transmembrane domains, two heme-binding sites, and an NADPH-
binding site on the cytoplasmic side. Once PAMPs, like mentioned above, bind to the PRRs
of macrophages, the NOX2 is activated quickly (Singel and Segal 2016). Assembly of the
subunits to the phagosomal or plasma membrane is necessary, since NOX2, a multi-subunit
enzyme, is inactive and unassembled in resting cells. First, PKC phosphorylates a cytosolic
subunit p47phox, which is part of the cytosolic heterotrimer comprised of p47phox, p40phox, and
p67phox. The heterotrimer then translocates to the membrane and interacts with the
membrane-bound flavocytochrome b558 (Lodge and Descoteaux 2006). The cytochrome in
the membrane consists of subunits gp91phox and p22phox. After translocation of the
heterotrimer and the GTPase Rac to the membrane-bound subunits and successful
assembly, molecular oxygen can be partially reduced to superoxide radical anions and in a
next step converted to other products like hydrogen peroxide (Singel and Segal 2016)
(Figure 3).
Chronic granulomatous disease or Crohn’s like inflammatory bowel disease are caused by
defective NOX2 activity. Moreover, there are other isoforms of NADPH oxidase that have a
wide range of functions, why it is not surprising that impairment of this enzyme is linked with
several pathologies, including neurodegenerative diseases, cancer, and atherosclerosis
(Singel and Segal 2016).
In contrast, if ROS production gets out of control, severe tissue damage can be a
consequence which can be seen e.g. in rheumatoid arthritis (Rist and Naftalin 1993).
8
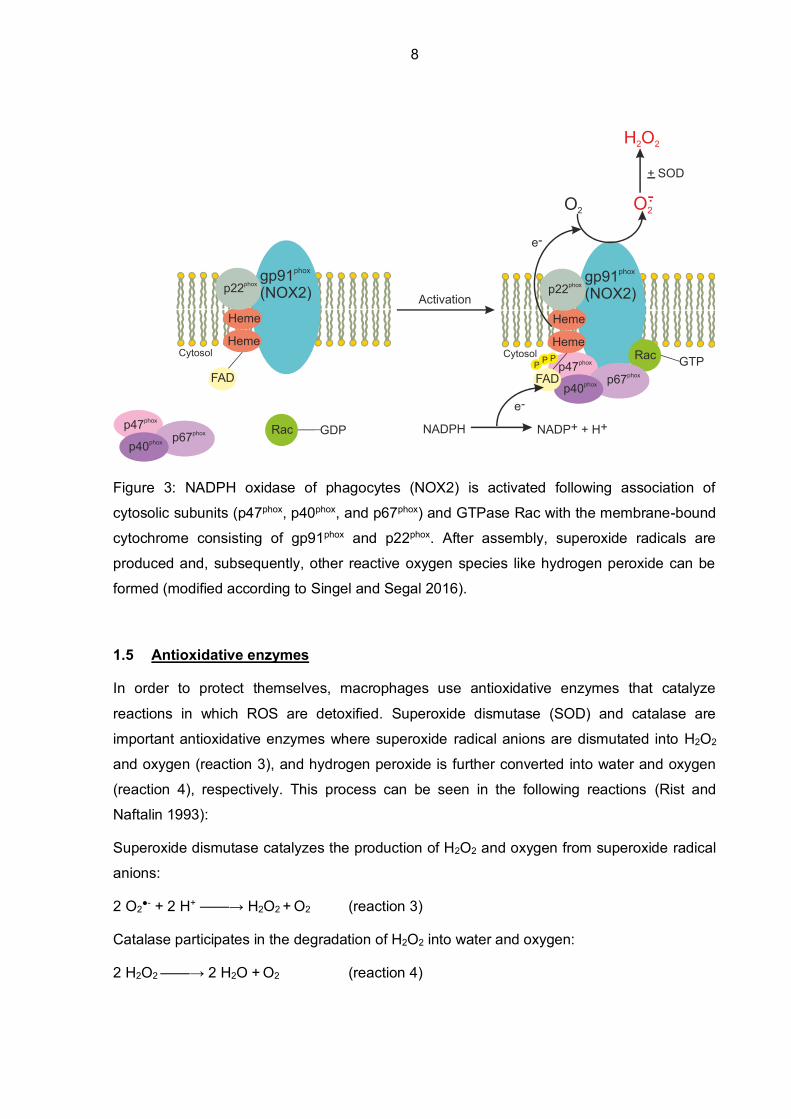
Figure 3: NADPH oxidase of phagocytes (NOX2) is activated following association of
cytosolic subunits (p47phox, p40phox, and p67phox) and GTPase Rac with the membrane-bound
cytochrome consisting of gp91phox and p22phox. After assembly, superoxide radicals are
produced and, subsequently, other reactive oxygen species like hydrogen peroxide can be
formed (modified according to Singel and Segal 2016).
1.5 Antioxidative enzymes
In order to protect themselves, macrophages use antioxidative enzymes that catalyze
reactions in which ROS are detoxified. Superoxide dismutase (SOD) and catalase are
important antioxidative enzymes where superoxide radical anions are dismutated into H2O2
and oxygen (reaction 3), and hydrogen peroxide is further converted into water and oxygen
(reaction 4), respectively. This process can be seen in the following reactions (Rist and
Naftalin 1993):
Superoxide dismutase catalyzes the production of H2O2 and oxygen from superoxide radical
anions:
2 O2●- + 2 H+ ——→ H2O2 + O2 (reaction 3)
Catalase participates in the degradation of H2O2 into water and oxygen:
2 H2O2 ——→ 2 H2O + O2 (reaction 4)
H O2 2
O2
GDP
Activation
O2-.
gp91(NOX2)
phox
e-
e-
Heme
Rac GTPPCytosol
p47phox
p67phox
p40phox
p22phox
Heme
FAD
PP
NADPH NADP+ + H+
gp91(NOX2)
phox
Heme
Rac
Cytosol
p47phox
p67phox
p40phox
p22phox
Heme
FAD
+ SOD
9
As can be seen, during the oxidative burst molecular oxygen is consumed (reaction 2), while
in the presence of antioxidative enzymes, SOD (reaction 3) and catalase (reaction 4), oxygen
is partially recovered. This would result in decreased oxygen consumption in comparison to
unprotected macrophages.
1.6 Macrophages as host cells for pathogens: Leishmania
A big variety of intracellular pathogens use macrophages as host cells for their own
advantage, which is paradoxic since macrophages function as innate immune cells and are
well equipped for pathogen elimination. Phagocytosis, killing of the pathogens, and a release
of pro-inflammatory mediators are key functions of macrophages. Internalized
microorganisms are engulfed in a phagosome and finally, a phagolysosome is generated.
The environment in phagolysosomes is very hostile for efficient pathogen destruction. V-
ATPase is responsible for the acidic milieu by pumping protons into the phagolysosomal
lumen. This ensures the right environment for lysosomal hydrolytic enzymes, impairs the
growth of bacteria, and interferes with some bacterial metabolic pathways. Other pathogen-
degrading factors under oxidative conditions are ROS which are produced by NOX2 but also
reactive nitrogen species generated by the inducible nitric oxide synthase. And, finally,
limited essential nutrition plays also a role in pathogen degradation in the phagolysosomes.
Moreover, autophagy and the generation of an autophagosome is not only important for
homeostasis of the cell but is also used by the cell for degradation of intracellular pathogens.
NOX2-produced ROS, for example, play a role in initiating this antimicrobial process. Another
way of inhibiting the spread of the pathogen by macrophages is programmed cell death,
thereby eliminating the niche of replication of intracellular pathogens. Among other factors,
ROS, again, are a factor in this way of infection control.
Taken all these mechanisms together, it seems clear, that pathogens surviving inside of
macrophages must have developed mechanisms to interfere with these degradative
pathways. Important examples for intracellular bacteria that use macrophages as their
replication niche are: Salmonella enterica, Chlamydia pneumoniae, Brucella suis, Legionella
pneumophila, Coxiella burnetii, and Mycobacterium tuberculosis representing intravacuolar
bacteria, whereas Burkholderia pseudomallei, Francisella tularensis, and Listeria
monocytogenes use the macrophagal cytoplasm for replication.
10
For ensuring intravacuolar surviving, accessory secretion systems are essential in releasing
effector proteins into the host cell’s cytoplasm. Common strategies used by intravacuolar
bacteria are the formation of remodeled membrane-enclosed compartments or delay of
phagosome maturation to avoid degradation in phagolysosomes. Moreover, effector proteins
are secreted that impair autophagy and host cell death by stimulating pro-survival pathways
and inhibit pro-apoptotic pathways. Once, intravacuolar bacteria ensured surviving and
replication in their niche, they are well hidden from sensors of the innate immune system.
Cytosolic bacteria’s replication takes place in the cytoplasm after escaping from the
phagosome. Additionally, virulence factors are released in the host cell manipulating the
host’s immune responses, cell death and autophagy pathways (Mitchell et al. 2016).
Not only bacteria can reside within macrophages but also other pathogens like parasites use
them for their replication and survival. The intracellular protozoan Trypanosoma cruzi infects
macrophages and makes them unable to present T. cruzi antigens to CD4 T cells. The
developed disease caused by T. cruzi is called Chagas’ disease (La Flamme et al. 1997).
Another example of intracellular parasites are the vector-borne parasites Leishmania that
use primarily tissue-resident macrophages for their intracellular replication (Mosser and
Edwards 2008) and will be discussed in more detail.
The disease caused by Leishmania spp. is generally referred to as leishmaniasis, where
different forms of the disease can be identified. Cutaneous leishmaniasis is less severe and
affects around 1.5 million people worldwide, whereas the lethal visceral leishmaniasis causes
approximately 70,000 deaths every year of the 500,000 cases. Pathogenic Leishmania
donovani is responsible for the visceral form of leishmaniasis and is especially problematic in
tropical and temperate regions (Banerjee et al. 2016). Leishmaniasis is a neglected tropical
disease and the clinical presentation is not only dependent on the parasite species but also
on the host’s immune system (Kaye and Scott 2011). Overall, around 350 million people are
currently at risk regarding leishmaniasis (Taylor et al. 2010), but because of global warming,
the disease is spreading into other areas as well (Geroldinger et al. 2019).
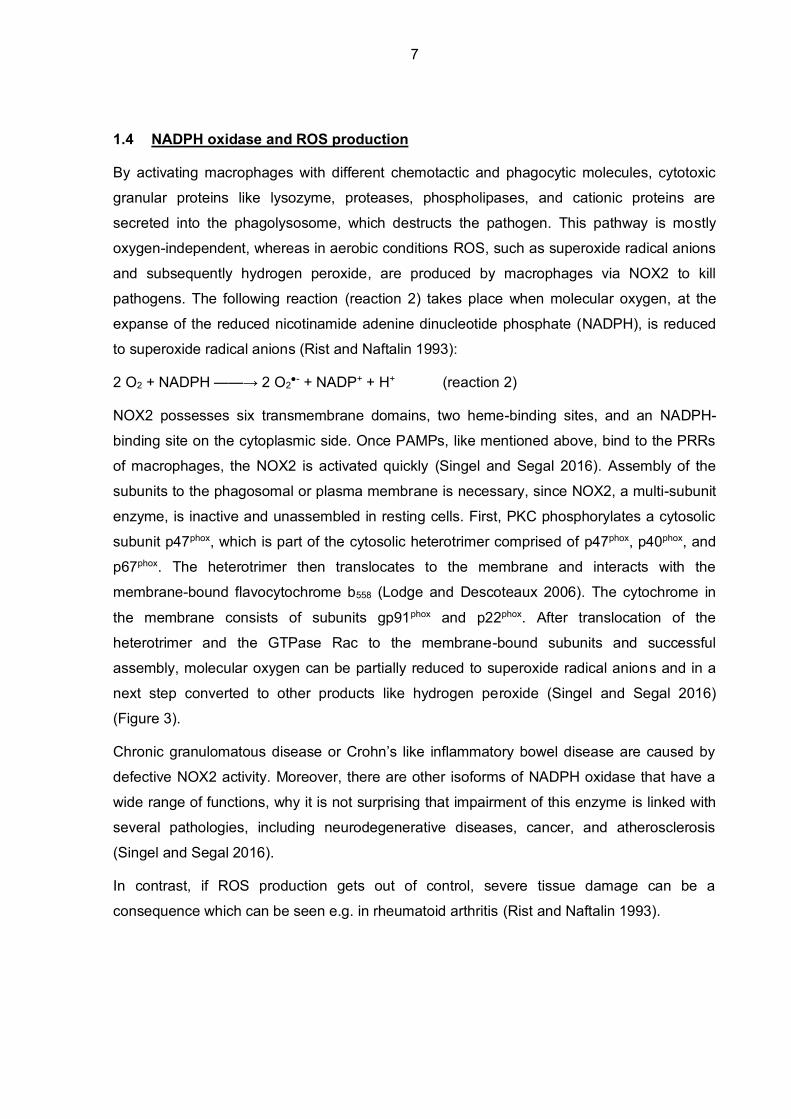
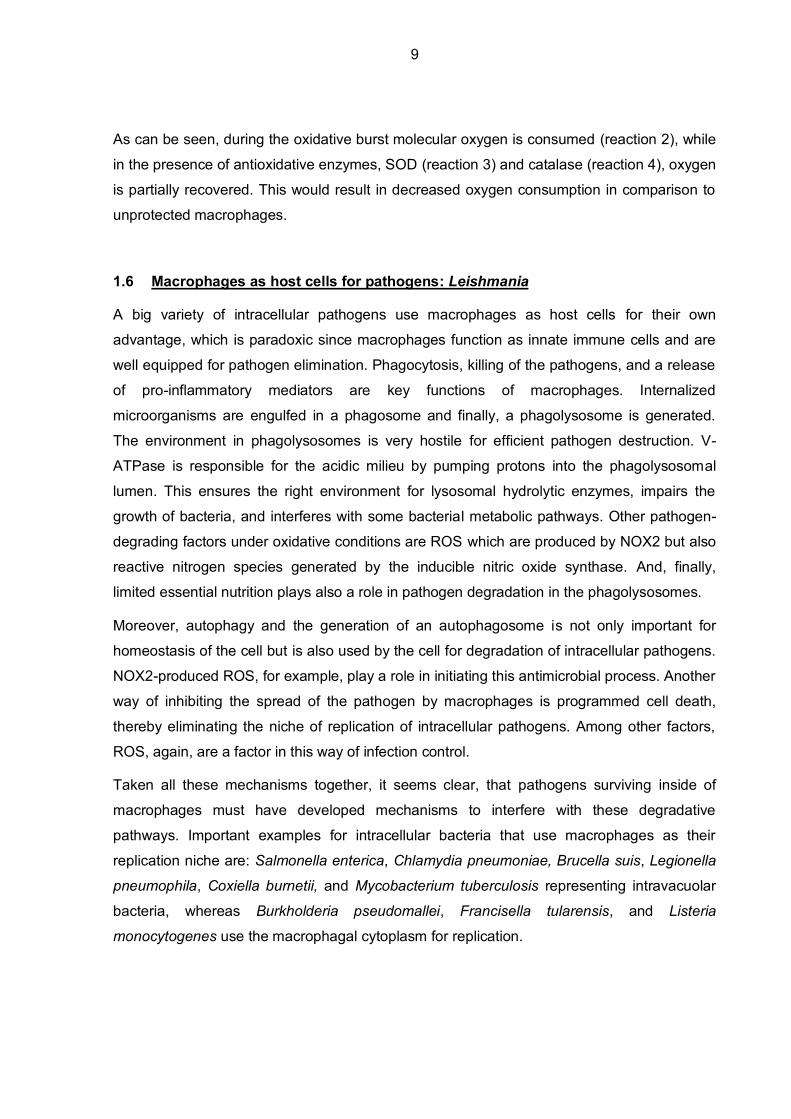
Leishmaniasis is a vector-borne disease, where the promastigotic form of the parasite is
found in sandflies, the vector, and is translocated into the host organism, e.g. human, by a
blood meal, where it lives as amastigotic form in macrophagal phagolysosomes (Banerjee et
al. 2016) (Figure 4). Leishmania amastigotes residing in macrophages are responsible for
clinical symptoms of the disease. New antileishmanial drugs are of great necessity, since
11
commonly used drugs like amphotericin B are becoming less efficient due to developing
resistances by the parasite. Serving as a model organism in drug screening (Taylor et al.
2010) and basic research to study the process of infection, the non-pathogenic species
Leishmania tarentolae can be used. Phagocytosis of the parasite by macrophages and
replication of the amastigotic form in the macrophagal phagolysosomes are infection stages
of great interest. Usually, pathogen uptake is accompanied by an oxidative burst, but
Leishmania spp. manage to survive within this hostile environment using a variety of
mechanisms, including interference with NOX2 assembly (Geroldinger et al. 2019), and
delay in phagosome maturation (Banerjee et al. 2016).
Figure 4: Leishmania life cycle, where the promastigotic form of the parasite is translocated
to the mammalian host by a blood meal of the insect vector, the sandfly. There it resides and
replicates in macrophagal phagolysosomes as amastigotic form until the parasite is taken up
by another blood meal of the next sandfly.
Source Wikipedia: https://en.wikipedia.org/wiki/Leishmaniasis#/media/File:Leishmaniasis_life_cycle_diagram_en.svg
12
1.7 Defence mechanisms of Leishmania against the oxidative burst
Antimicrobial activity of ROS produced by NOX2 has been well documented but interestingly,
Leishmania spp. manage to suppress this oxidative burst. This suppression of ROS
production is caused by several mechanisms (Saha et al. 2019).
Starting with pathogen uptake by macrophages, Leishmania spp. have developed a strategy
to evade NOX2 activation. In order to be internalized, the parasite has to attach to certain
receptors expressed on the macrophage membrane. Usually, PKC is activated after
phagocytosis of pathogens, which then leads to NOX2 assembly and ROS production to kill
the pathogen. Internalization of Leishmania donovani amastigotes turned out to take place
without the phosphorylation of p47phox, thereby preventing NOX2 assembly and consequently
ROS production (Lodge and Descoteaux 2006).
After phagocytosis, the next step is to inhibit phagosomal maturation in order to ensure a
niche for survival and replication. Leishmania spp. manage to e.g. block lysosome fusion,
disrupt microdomains of the phagosome, exclude NOX2 and V-type ATPase from the
phagosomal membrane, inhibit expression of not only NOX2 but also of inducible nitric oxide
synthase which produces antimicrobial reactive nitrogen species. Interestingly, reactive
oxygen and nitrogen species do not only show antimicrobial activity but are also known to be
involved in phagosome maturation (Banerjee et al. 2016). Responsible for several
mechanisms in host-pathogen interaction is lipophosphoglycan (LPG), the most abundant
surface molecule of Leishmania. In Leishmania donovani it was shown that LPG integrates
into lipid microdomains of the phagosome membrane and impairs the fusion of the
phagosome with the lysosome, but also impairs the recruitment of the V-ATPase, thereby
preventing phagosome acidification (Kaye and Scott 2011).
In addition, the cytokine milieu is manipulated by the parasite to create a pathogen-favorable
environment. MAPKs are involved in a wide variety of signaling pathways, including pro- and
anti-inflammatory signal transduction. By upregulation of p44/42 MAPK IL-10 is produced,
which has anti-inflammatory activity, whereas the impairment of p38 MAPK leads to a
decrease in IL-12 levels (Banerjee et al. 2016). The leishmanial virulence factor major
surface protease (MSP) was shown to inactivate p38 MAPK but also seems to affect
phagosome maturation by acting on peri-phagosomal actin accumulation. Moreover, MSP
cleaves a subunit of NFκB, which leads to an impairment of inflammation regulation (Kaye
and Scott 2011). Supporting these findings, Leishmania spp. have been shown to interfere
13
with the IFNγ signaling pathway, thereby impairing efficient activation of classically activated
macrophages, which are important for sufficient antimicrobial activity, like ROS production
(Mosser and Edwards 2008).
A study by Saha et al. showed how NOX2 assembly was hindered by the upregulation of the
enzyme heme oxygenase-1 (HO-1) during Leishmania donovani infection. Heme-degrading
activity by HO-1 impairs gp91phox expression which consequently results in an ineffective
NOX2 activity. This process can be reversed by restoring heme concentrations. Moreover,
heme degradation led to CO release, which prevented the production of pro-inflammatory
cytokines. Another effect of HO-1 that favors parasite survival is the upregulation of SOD, an
antioxidant enzyme, consequently decreasing superoxide radical levels. Not only Leishmania
donovani exploit HO-1 activity, but also the intracellular bacteria Mycobacterium abscessus
and Burkholderia pseudomallei (Saha et al. 2019).
By applying mechanisms that avoid the oxidative burst, Leishmania spp. are not only
protecting themselves from the direct antimicrobial effects of ROS, but also from oxidative
burst-mediated macrophage apoptosis, since programmed cell death is another way of
eliminating the pathogen and limiting spread of infection. Macrophages infected with
Leishmania donovani showed a higher resistance to apoptosis mediated by hydrogen
peroxide. Leishmania spp. are not the only ones preventing host cell apoptosis, also
Chlamydia, Escherichia coli, Mycobacterium tuberculosis, Toxoplasma gondii, and
Plasmodium berghei seem to take advantage of this strategy. Leishmania donovani support
host cell survival by impairment of cell death triggered by an oxidative burst by exploiting
suppressors of cytokine signaling (SOCS) proteins. Induction of SOCS proteins during
infection leads to increased levels of thioredoxin and inhibition of the caspase cascade by
dephosphorylating MAPKs. Thioredoxin, as well as glutathione, are important antioxidants
and they stabilize protein-tyrosine phosphatases, which can be inactivated through ROS-
mediated oxidation (e.g. H2O2). MAPKs can be dephosphorylated by these phosphatases,
preventing caspase cascade initiation, which shows the part of thioredoxin playing in this
context. Summed up, SOCS and thioredoxin are exploited during Leishmania donovani
infection and act in coordination to prevent apoptosis triggered by oxidative burst. By
silencing SOCS, cell death increases and persistence of infection diminishes (Srivastav et al.
2014).
14
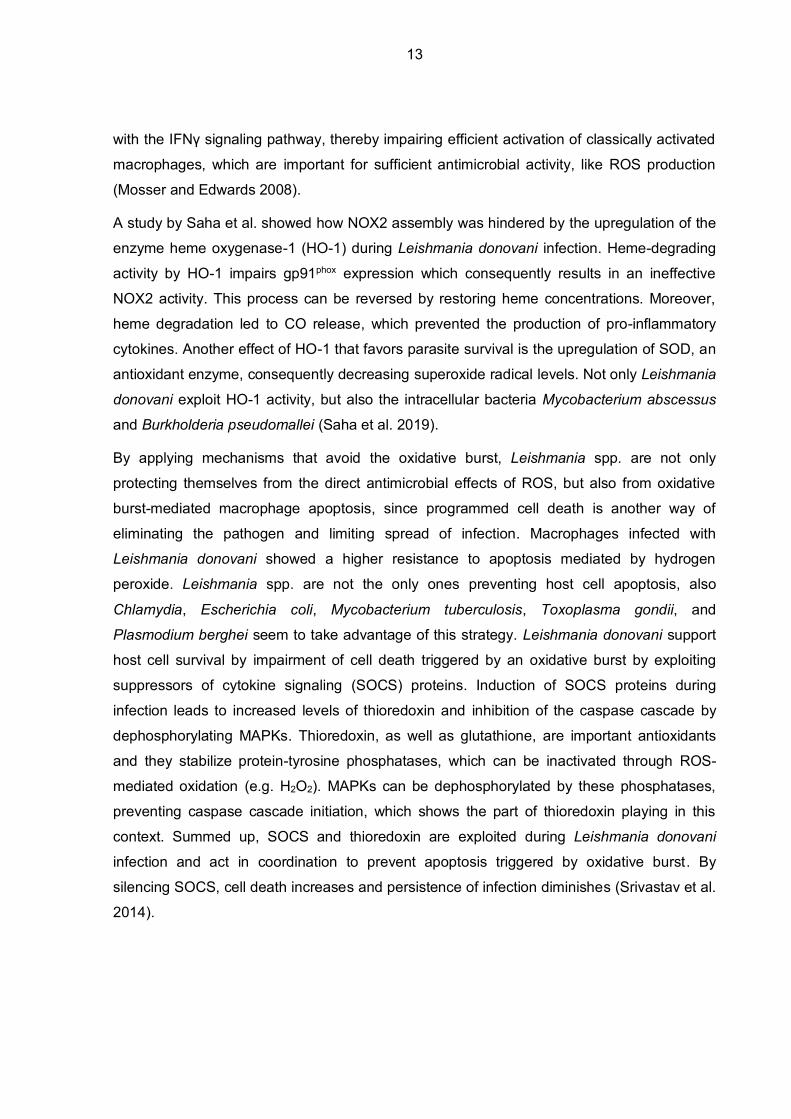
Since activated macrophages consume oxygen not only via their mitochondrial respiration
but also due to an increased production of reactive oxygen species, the aim of this bachelor
thesis was to investigate whether oxygen consumption of the murine macrophage cell line
J774A.1 can be:
i. selectively inhibited by inhibitors of the mitochondrial electron transport chain,
ii. selectively influenced by stimulant and inhibitor of NADPH oxidase (NOX2),
iii. modified in the presence of extracellular antioxidative enzymes (superoxide
dismutase and/or catalase),
iv. stimulated in the presence of Leishmania tarentolae promastigotes.
15
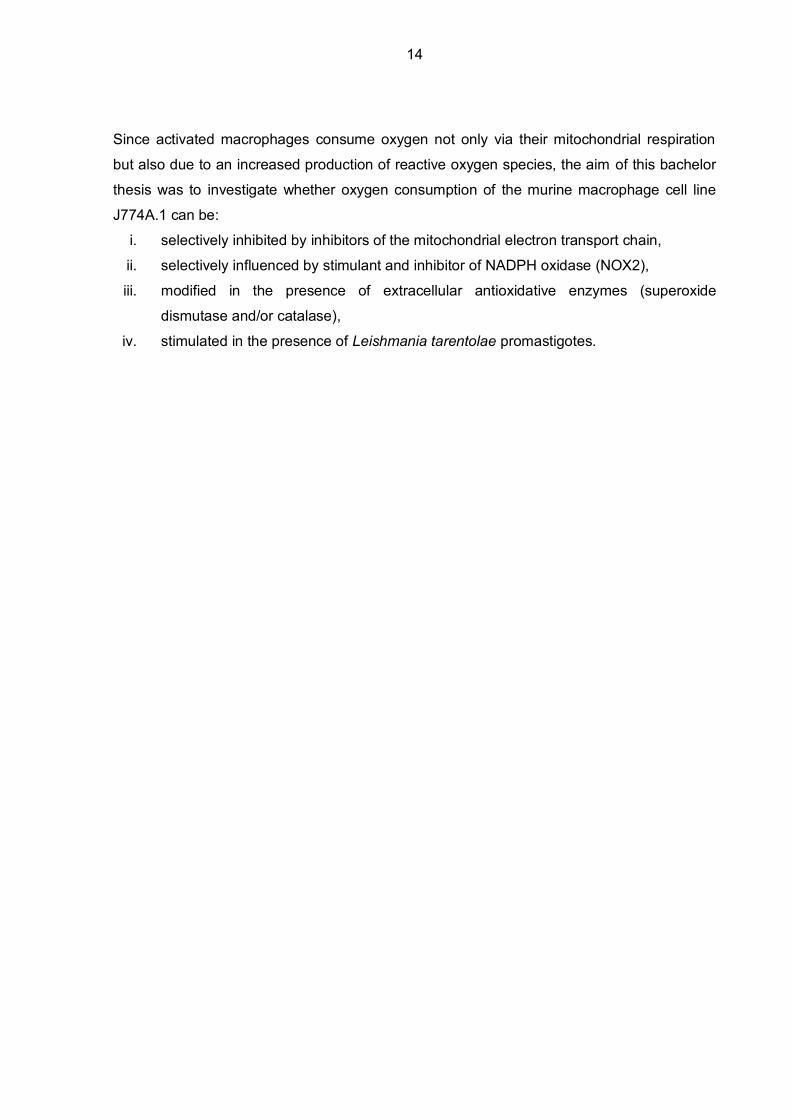
2 MATERIALS AND METHODS
2.1 Chemicals
The chemicals that were used for the experiments are listed in the following table.
Table: Used chemicals
Chemicals Manufacturer Purity
Brain heart infusion (No.53286, brain heart broth) Sigma-Aldrich for microbiology
Bovine serum albumin (BSA), fraction V Fluka >96 %
Catalase (19,900 U/mg solid) Sigma
CuSO4 pentahydrate Merck per analysis
D-(+)-glucose monohydrate Merck for biochemical
use
Dimethyl sulfoxide (DMSO) VWR (prolabo
chemicals)
>99.8 %
Diphenyleneiodonium chloride (DPI) Sigma-Aldrich ≥98 %
Dulbecco’s modified eagle medium (DMEM),
powder, high glucose, pyruvate
Thermo Fisher
Scientific
-
Foetal calf serum (FCS), low endotoxin Bio&Sell -
Hemin (porcine) Sigma -
KCl Merck per analysis
KCN Sigma ≥98 %
KH2PO4 Merck per analysis
Myxothiazol Sigma ~95 %
NaCl Merck per analysis
NaHCO3 Merck per analysis
Na2HPO4 Merck per analysis
NaOH Merck per analysis
16
Penicillin (20,000 U/ml)/streptomycin
(20,000 µg/ml)
Lonza -
Phorbol 12-myristate 13-acetate (PMA) Sigma-Aldrich ≥99 %
Potassium iodide Merck per analysis
Potassium sodium tartrate, tetrahydrate Merck per analysis
Sodium dithionite (Na2S2O4) Merck per analysis
Superoxide dismutase (SOD) (3125 U/mg solid) Sigma
Trichloroacetic acid Merck per analysis
Ultrapure Milli-Q water from a Milli-Q Advantage A10 water purification system (Merck
Millipore, Darmstadt, Germany) was used for preparing aqueous solutions and DMSO as an
organic solvent for preparing lipophilic stock solutions. Chemicals dissolved in DMSO were:
myxothiazol, PMA, and hemin. DPI was dissolved in DMSO/H2O (1:1, v/v).
2.2 Cell culture of J774A.1 macrophages
The macrophages used for the experiments were from the murine macrophage cell line
J774A.1 (ATCC®, TIB-67™, Wesel, Germany) and were cultured in DMEM with 3.7 g/l
NaHCO3, 25,000 U/l penicillin and 25 mg/l streptomycin preventing bacterial contamination,
and 10 % heat-inactivated FCS. The cells were grown in sterile 50 ml TubeSpin® bioreactor
tubes with gas-permeable caps (TPP, Trasadingen, Switzerland) on a roller culture
apparatus (5 rpm) of own design in a Heraeus Cytoperm 8080 incubator (Thermo Electron
Corporation, Vienna, Austria) at a temperature of 37 °C and a CO2 concentration of 5 %.
Passaging was performed twice a week; on Mondays the desired cell number was
200,000 cells/ml and on Thursdays 100,000 cells/ml.
2.3 Cell counting of J774A.1 macrophages
Cell counting of J774 cells was performed before every passage and every experiment.
Depending on the cell density, either undiluted or diluted (1:4) cell suspension was loaded on
a Thoma counting chamber (Paul Marienfeld GmbH, Lauda-Königshofen, Germany).
17
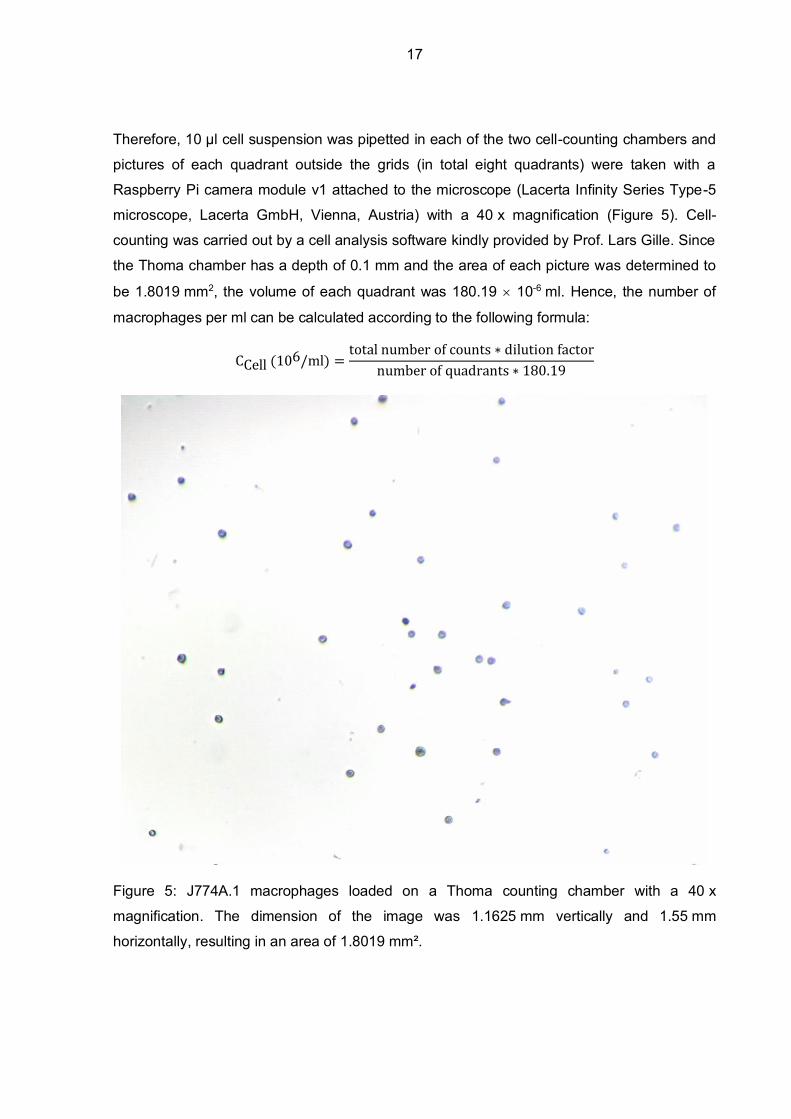
Therefore, 10 µl cell suspension was pipetted in each of the two cell-counting chambers and
pictures of each quadrant outside the grids (in total eight quadrants) were taken with a
Raspberry Pi camera module v1 attached to the microscope (Lacerta Infinity Series Type-5
microscope, Lacerta GmbH, Vienna, Austria) with a 40 x magnification (Figure 5). Cell-
counting was carried out by a cell analysis software kindly provided by Prof. Lars Gille. Since
the Thoma chamber has a depth of 0.1 mm and the area of each picture was determined to
be 1.8019 mm2, the volume of each quadrant was 180.19 10-6 ml. Hence, the number of
macrophages per ml can be calculated according to the following formula:
CCell (106/ml) =total number of counts ∗ dilution factor
number of quadrants ∗ 180.19
Figure 5: J774A.1 macrophages loaded on a Thoma counting chamber with a 40 x
magnification. The dimension of the image was 1.1625 mm vertically and 1.55 mm
horizontally, resulting in an area of 1.8019 mm².
18
2.4 Cell culture of Leishmania tarentolae promastigotes
Leishmania tarentolae promastigotes (LtP) (LEXSY host strain P10, biosafety level 1, Jena
Bioscience GmbH, Jena, Germany) were cultured in brain heart infusion (BHI) medium,
which contained 37 g/l BHI, 5 mg/l hemin, and 25,000 U/l penicillin and 25 mg/l streptomycin
against contamination caused by bacteria. The tubes used for the LtP culture were sterile
50 ml TubeSpin® bioreactor tubes with gas-permeable caps (TPP, Trasadingen, Switzerland)
and the cells were incubated (incubator Ehret GmbH Life Science Solutions, Emmendingen,
Germany) at 26 °C with constant shaking (0.05 s-1). On Mondays, Wednesdays, and Fridays
the cells were passaged with a desired optical density (OD) of 0.3 on Mondays and
Wednesdays, and 0.1 on Fridays (see §2.5).
LtP were cultured and kindly provided by Prof. Lars Gille and his bachelor student Lara
Näglein.
2.5 Cell counting of Leishmania tarentolae promastigotes
In order to perform the passage with a sufficient number of cells, the cell number per ml had
to be identified. That was accomplished by using a photometer (U-1100, Hitachi Ltd., Tokyo,
Japan) for measuring the OD of LtP at 600 nm in 1.5 ml semi-micro cuvettes with a layer
thickness of 1 cm (BRAND GmbH, Wertheim, Germany). As a reference, the complete BHI
medium without the cells was used. After determining the OD of the diluted LtP suspension
(700 µl BHI medium plus 100 µl LtP suspension), the following formula was used to calculate
the cell number per ml:
CCell (106/ml) = OD600nm dilution factor 0.969 124.
The factor 0.969 is the conversion factor of g/l dry weight and 124 infers that 1 g dry weight/l
corresponds to 124 106 cells/ml (Fritsche 2008).
2.6 Determination of protein concentration of J774A.1 macrophages
Before determining the protein concentration by the Biuret method, J774 cells were washed
in phosphate-buffered saline (PBS) consisting of 137 mM NaCl, 2.7 mM KCl, 4.3 mM
Na2HPO4, and 1.4 mM KH2PO4, pH 7.4. That was necessary because the cell culture
medium containing 10 % FCS has a high protein concentration itself and would, therefore,
19
interfere especially with cell suspensions containing only low protein concentrations. First,
the cells were centrifuged in a Sorvall LYNX 6000 centrifuge (Thermo Fisher GmbH, Vienna,
Austria) for 10 minutes at 20 °C and 510 g. After discarding the supernatant, the pellet was
resuspended in PBS and centrifuged again under the same conditions. Then, the pellet was
again resuspended in PBS.
Duplicates of PBS-washed J774 cells (250 µl, each) were filled up with MQ-water to 1 ml and
additionally, 200 µl of trichloroacetic acid (3 M) were added to each sample. After an
incubation time of 10 minutes at room temperature, the samples were centrifuged for
10 minutes at 2500 g and 25 °C (Hettich® Universal 16R centrifuge, Tuttlingen, Germany).
Supernatants were discarded and 1 ml of Biuret reaction solution, consisting of 12.02 mM
CuSO4, 31.89 mM potassium sodium tartrate, 30.12 mM potassium iodide and 0.2 M NaOH,
was added to each pellet. The pellets were dissolved and incubated for 10 minutes at room
temperature. Then, the extinction of the samples was measured photometrically (U-1100
photometer Hitachi Ltd., Tokyo, Japan) at a wavelength of 546 nm in 1.5 ml semi-micro
cuvettes with a layer thickness of 1 cm (BRAND GmbH, Wertheim, Germany) with MQ-water
as a reference. There were two sets of measurements: first, the extinctions of the samples
were determined without adding potassium cyanide, second, a few grains of KCN were
added to the samples. KCN decolorizes the formed blue copper-protein complexes and
therefore, turbidity errors caused by lipids or interfering pigments can be eliminated (Bode et
al. 1968). Biuret solution without dissolved protein pellet served as the blank and was
measured in duplicate. The value of extinction after addition of KCN was subtracted from the
extinction value without KCN and the mean was calculated for the duplicates. This value was
subtracted from the extinction values of the protein-containing samples, where the extinction
in presence of KCN was also subtracted from the value without KCN. Those ∆E values were
used to calculate the protein concentrations of the samples. The following formulas were
used for calculations (Bode et al. 1968, Gruber 2015):
∆E = ∆E 𝑠𝑎𝑚𝑝𝑙𝑒(𝐸−𝐾𝐶𝑁 − 𝐸+𝐾𝐶𝑁) − ∆E 𝑏𝑙𝑎𝑛𝑘(𝐸−𝐾𝐶𝑁 − 𝐸+𝐾𝐶𝑁)
c =∆E
ε ∗ d∗ Vf
c ... protein concentration in the sample [mg/ml]
ΔE ... difference of extinction in the absence and presence of KCN
d... layer thickness of the cuvette (= 1 cm)
20
Vf... dilution factor (μl total volume/μl sample volume)
ε ... 0.21227 mg-1 ml cm-1 (extinction coefficient determined from a calibration curve
using BSA as a standard)
2.7 Measurement of oxygen consumption
The oxygen consumption of J774 cells was measured with a Clark-type oxygen electrode
(Hansatech Instruments, Norfolk, United Kingdom). The platinum cathode and silver anode
were immersed in electrolyte (50 % saturated KCl solution) and covered by an oxygen-
permeable polytetrafluoroethylene membrane. The temperature was regulated by a
thermostat (mgw Lauda, Lauda-Königshofen, Germany) and set to 37 °C, keeping the
oxygen electrode disc and the electrode chamber (DW1, Hansatech Instruments) at constant
temperature. A magnetic stirrer ensured oxygen diffusion to the electrode. Connected to the
electrode, an oxygen electrode control box (CB1D, Hansatech Instruments) polarized the
electrode at 700 mV and converted oxygen-dependent current changes into voltage signals.
Connected over an analog-digital converter, the signals were shown on a computer using the
MCREC software kindly provided by Prof. Lars Gille.
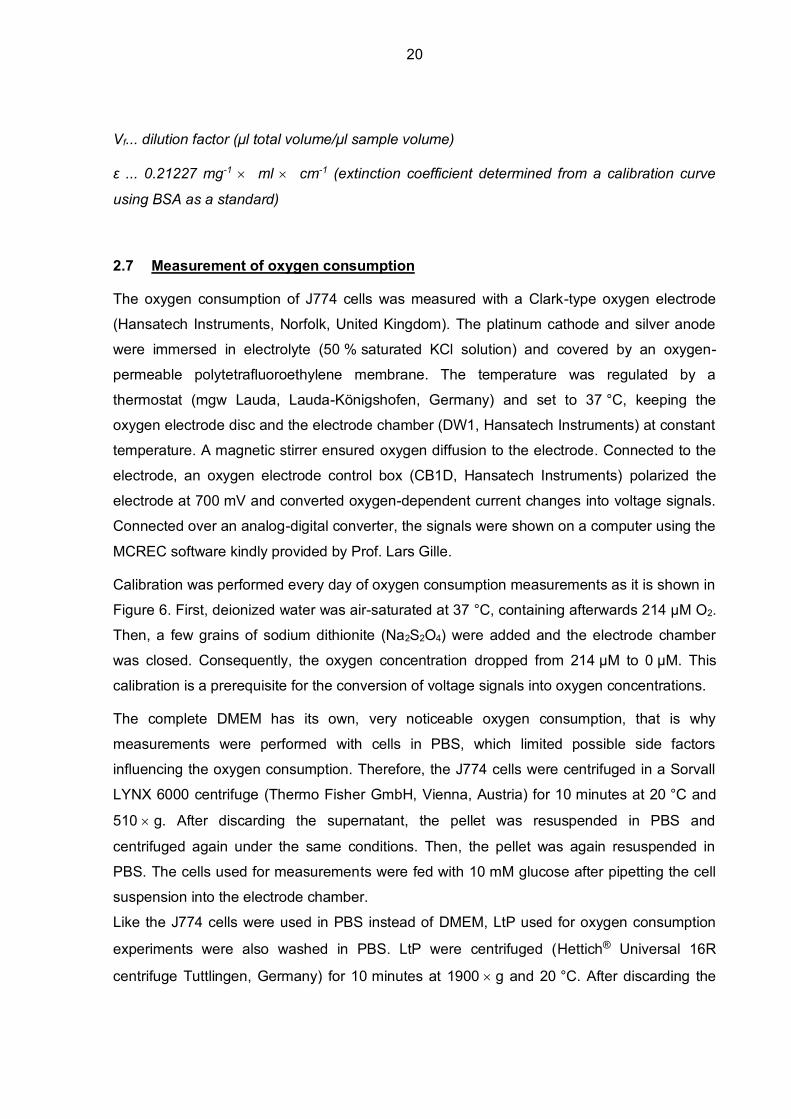
Calibration was performed every day of oxygen consumption measurements as it is shown in
Figure 6. First, deionized water was air-saturated at 37 °C, containing afterwards 214 µM O2.
Then, a few grains of sodium dithionite (Na2S2O4) were added and the electrode chamber
was closed. Consequently, the oxygen concentration dropped from 214 µM to 0 µM. This
calibration is a prerequisite for the conversion of voltage signals into oxygen concentrations.
The complete DMEM has its own, very noticeable oxygen consumption, that is why
measurements were performed with cells in PBS, which limited possible side factors
influencing the oxygen consumption. Therefore, the J774 cells were centrifuged in a Sorvall
LYNX 6000 centrifuge (Thermo Fisher GmbH, Vienna, Austria) for 10 minutes at 20 °C and
510 g. After discarding the supernatant, the pellet was resuspended in PBS and
centrifuged again under the same conditions. Then, the pellet was again resuspended in
PBS. The cells used for measurements were fed with 10 mM glucose after pipetting the cell
suspension into the electrode chamber.
Like the J774 cells were used in PBS instead of DMEM, LtP used for oxygen consumption
experiments were also washed in PBS. LtP were centrifuged (Hettich® Universal 16R
centrifuge Tuttlingen, Germany) for 10 minutes at 1900 g and 20 °C. After discarding the
21
supernatant, the pellet was resuspended in PBS and centrifuged again under the same
conditions. In the end, the pellet was again resuspended in PBS.
Figure 6: Calibration of oxygen electrode with air-saturated deionized water (214 µM oxygen)
at 37 °C, where a few grains of sodium dithionite were added (0 µM oxygen).
2.8 Statistical analysis
The software MCREC was used for calculating oxygen consumption rates of J774 cells in
nmol O2/min/ml. Further analysis and processing of the data as well as generation of figures
were performed with Microsoft® Excel 2010 and MicroCal Origin® 6.1 (OriginLab Corp.,
Northampton, MA, USA). Data are shown as means ± standard error of mean (SEM).
Statistically significant differences between the respective experimental groups of p < 0.05
were identified using unpaired or paired two-tailed Students t-test where appropriate.
22
3 RESULTS
3.1 Protein content of J774A.1 macrophages
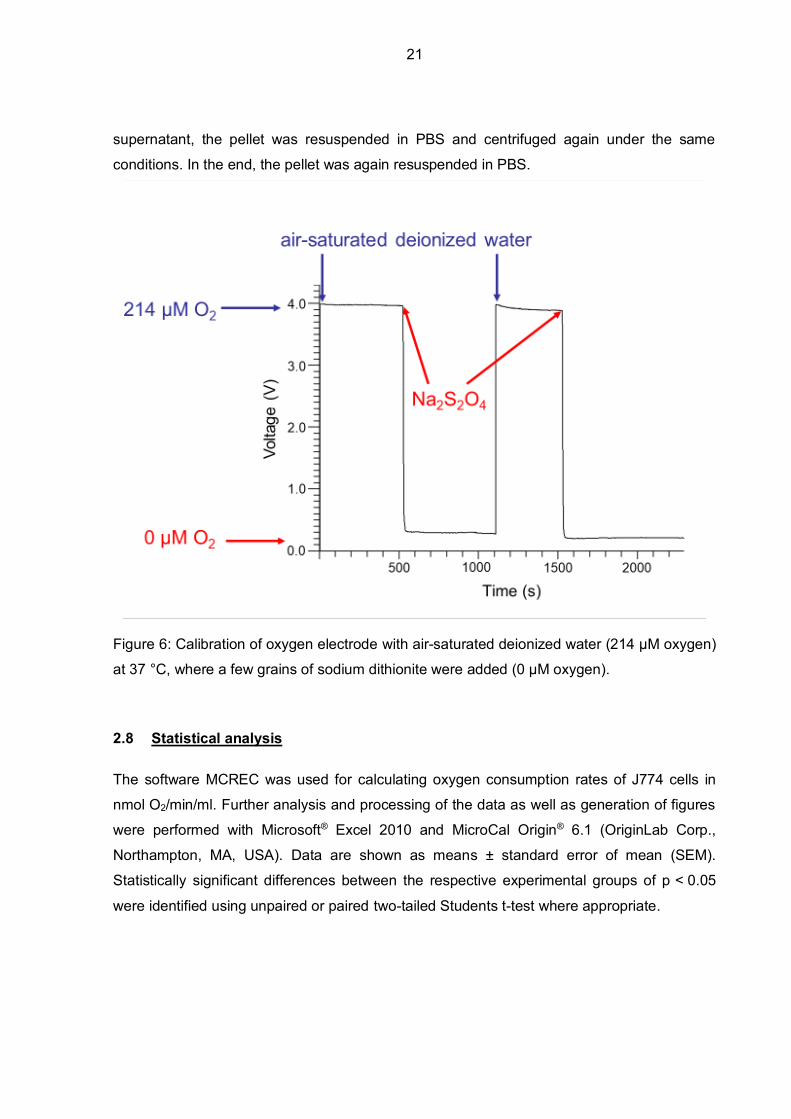
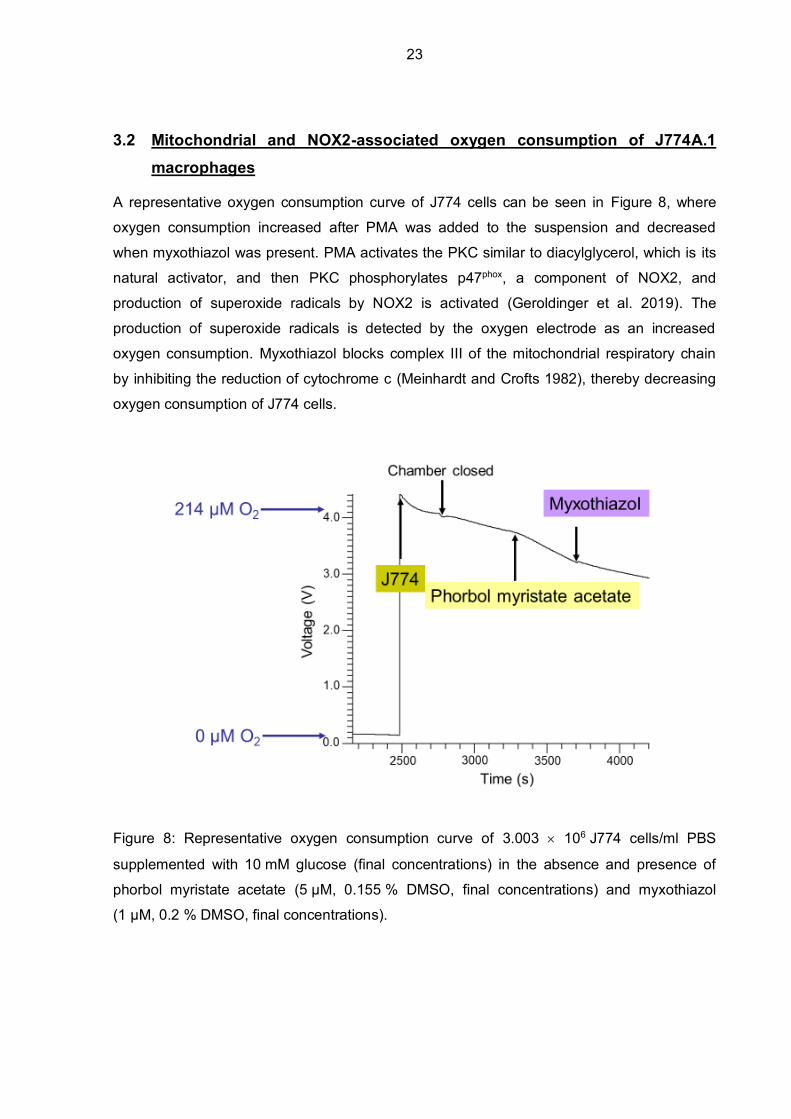
Determination of protein concentration was used to verify accuracy of cell-counting of J774
cells. Aliquots of cell suspensions in PBS that were used for oxygen consumption
measurements were used to determine the protein concentration in the sample. Since the
cell numbers for each experimental day were counted, determined protein concentrations
[mg/ml] of these cell suspensions were finally set into relation to the number of J774 cells/ml
(Figure 7). The mean protein content of 23 independent cell suspensions was 0.511 ± 0.029
mg protein/ml and the mean cell number was 2.40 ± 0.12 106 J774 cells/ml. Finally, 106
J774 cells contained 0.216 ± 0.011 mg protein.
Figure 7: Relation of protein content to cell count of J774 suspension in PBS. Data represent
means of 23 independent cell suspensions that were analyzed in duplicate.
0.0 0.5 1.0 1.5 2.0 2.5 3.0 3.50.0
0.2
0.4
0.6
0.8
Linear Regression:Protein content = 0.20992 x Cell count (106/ml)R = 0.60712p = 0.00595n = 23
Prot
ein
cont
ent (
mg/
ml)
Cell count x 106/ml
23
3.2 Mitochondrial and NOX2-associated oxygen consumption of J774A.1 macrophages
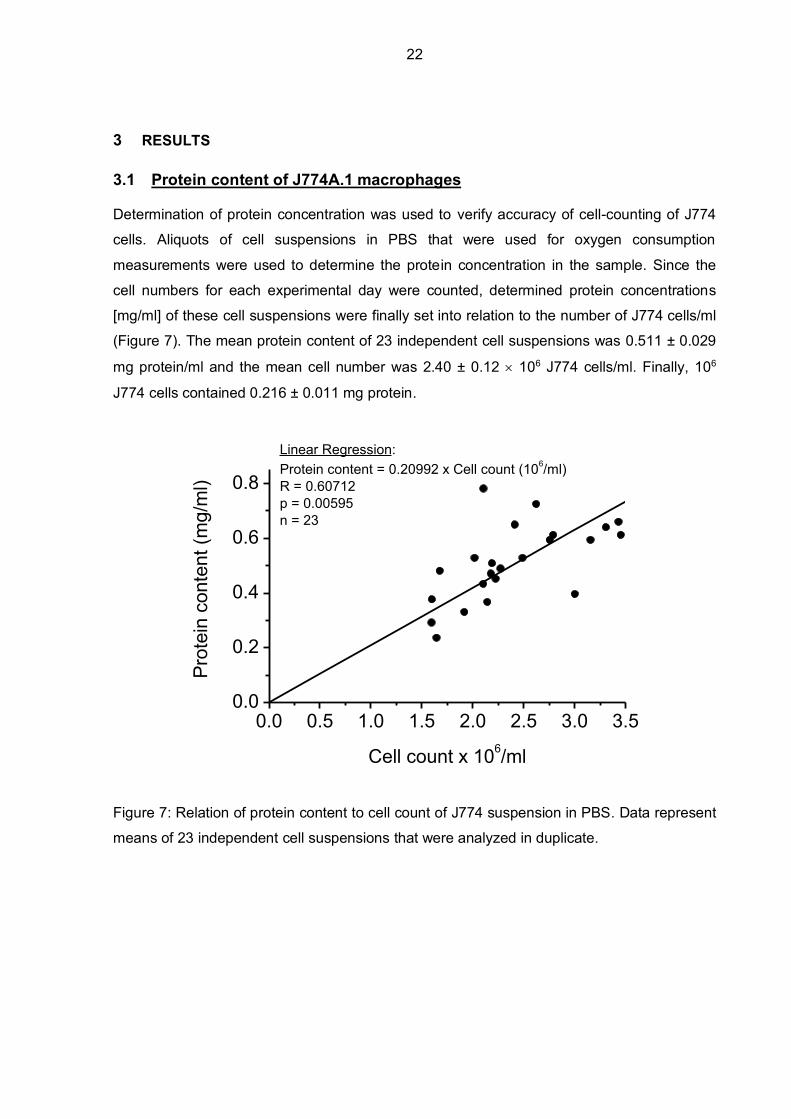
A representative oxygen consumption curve of J774 cells can be seen in Figure 8, where
oxygen consumption increased after PMA was added to the suspension and decreased
when myxothiazol was present. PMA activates the PKC similar to diacylglycerol, which is its
natural activator, and then PKC phosphorylates p47phox, a component of NOX2, and
production of superoxide radicals by NOX2 is activated (Geroldinger et al. 2019). The
production of superoxide radicals is detected by the oxygen electrode as an increased
oxygen consumption. Myxothiazol blocks complex III of the mitochondrial respiratory chain
by inhibiting the reduction of cytochrome c (Meinhardt and Crofts 1982), thereby decreasing
oxygen consumption of J774 cells.
Figure 8: Representative oxygen consumption curve of 3.003 106 J774 cells/ml PBS
supplemented with 10 mM glucose (final concentrations) in the absence and presence of
phorbol myristate acetate (5 µM, 0.155 % DMSO, final concentrations) and myxothiazol
(1 µM, 0.2 % DMSO, final concentrations).
24
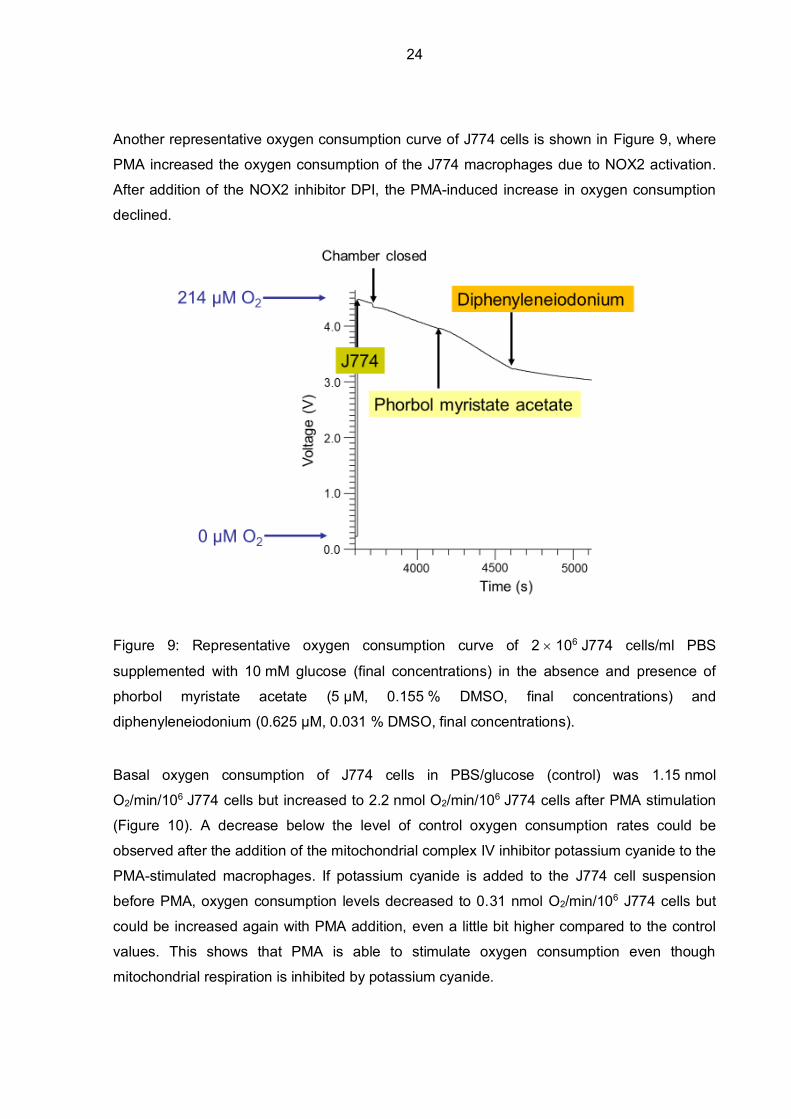
Another representative oxygen consumption curve of J774 cells is shown in Figure 9, where
PMA increased the oxygen consumption of the J774 macrophages due to NOX2 activation.
After addition of the NOX2 inhibitor DPI, the PMA-induced increase in oxygen consumption
declined.
Figure 9: Representative oxygen consumption curve of 2 106 J774 cells/ml PBS
supplemented with 10 mM glucose (final concentrations) in the absence and presence of
phorbol myristate acetate (5 µM, 0.155 % DMSO, final concentrations) and
diphenyleneiodonium (0.625 µM, 0.031 % DMSO, final concentrations).
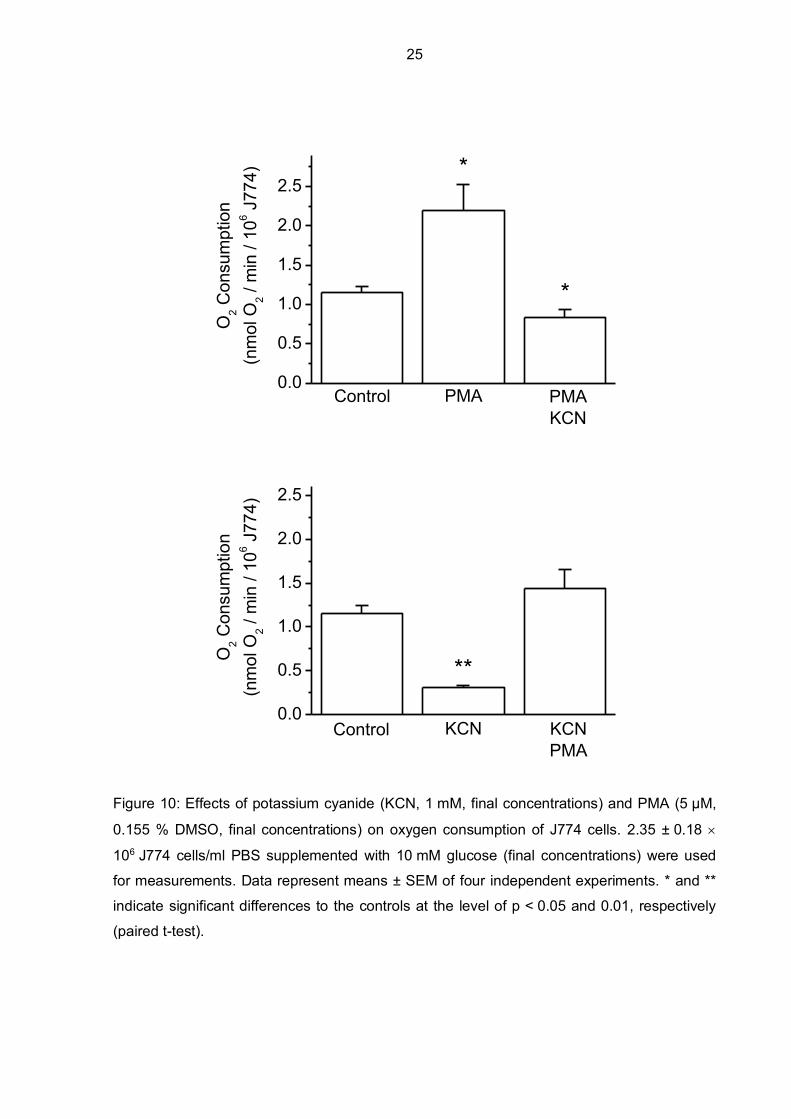
Basal oxygen consumption of J774 cells in PBS/glucose (control) was 1.15 nmol
O2/min/106 J774 cells but increased to 2.2 nmol O2/min/106 J774 cells after PMA stimulation
(Figure 10). A decrease below the level of control oxygen consumption rates could be
observed after the addition of the mitochondrial complex IV inhibitor potassium cyanide to the
PMA-stimulated macrophages. If potassium cyanide is added to the J774 cell suspension
before PMA, oxygen consumption levels decreased to 0.31 nmol O2/min/106 J774 cells but
could be increased again with PMA addition, even a little bit higher compared to the control
values. This shows that PMA is able to stimulate oxygen consumption even though
mitochondrial respiration is inhibited by potassium cyanide.
25
Figure 10: Effects of potassium cyanide (KCN, 1 mM, final concentrations) and PMA (5 µM,
0.155 % DMSO, final concentrations) on oxygen consumption of J774 cells. 2.35 ± 0.18
106 J774 cells/ml PBS supplemented with 10 mM glucose (final concentrations) were used
for measurements. Data represent means ± SEM of four independent experiments. * and **
indicate significant differences to the controls at the level of p < 0.05 and 0.01, respectively
(paired t-test).
0.0
0.5
1.0
1.5
2.0
2.5*
*
PMAKCN
PMAControl
O2 C
onsu
mpt
ion
(nm
ol O
2 / m
in /
106 J
774)
0.0
0.5
1.0
1.5
2.0
2.5
**
KCNPMA
KCNControl
O2 C
onsu
mpt
ion
(nm
ol O
2 / m
in /
106 J
774)
26
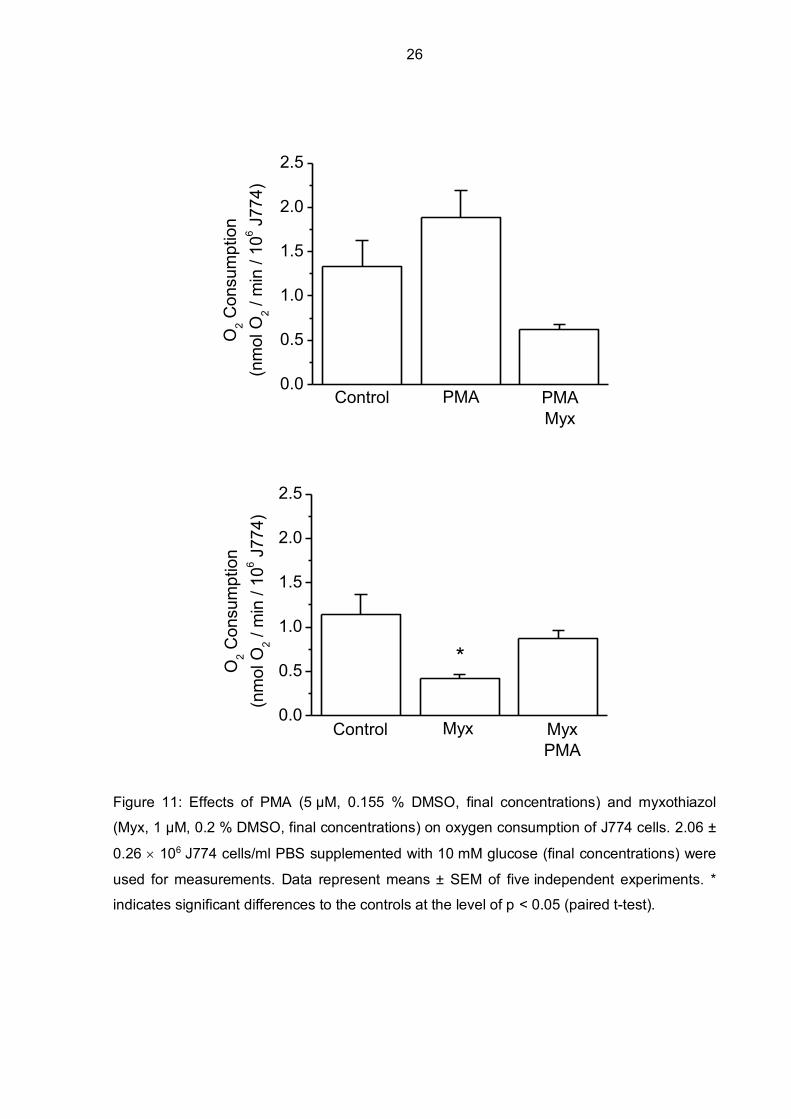
Figure 11: Effects of PMA (5 µM, 0.155 % DMSO, final concentrations) and myxothiazol
(Myx, 1 µM, 0.2 % DMSO, final concentrations) on oxygen consumption of J774 cells. 2.06 ±
0.26 106 J774 cells/ml PBS supplemented with 10 mM glucose (final concentrations) were
used for measurements. Data represent means ± SEM of five independent experiments. *
indicates significant differences to the controls at the level of p < 0.05 (paired t-test).
0.0
0.5
1.0
1.5
2.0
2.5
PMAMyx
PMAControl
O2 C
onsu
mpt
ion
(nm
ol O
2 / m
in /
106 J
774)
0.0
0.5
1.0
1.5
2.0
2.5
*
MyxPMA
MyxControl
O2 C
onsu
mpt
ion
(nm
ol O
2 / m
in /
106 J
774)
27
Using myxothiazol to block mitochondrial respiration by inhibiting complex III instead of
potassium cyanide (complex IV inhibitor) showed similar effects. As indicated in Figure 11,
oxygen consumption of J774 cells was decreased by 63 % compared to the control when
myxothiazol was added but could be increased again by adding PMA, moderately lower
compared to the control, however. This shows that PMA is able to stimulate oxygen
consumption of J774 cells even though mitochondrial respiration is inhibited by myxothiazol.
When PMA was added to the cell suspension first, oxygen consumption levels were higher
compared to the control but decreased after adding myxothiazol below oxygen consumption
levels of the control J774 cells.
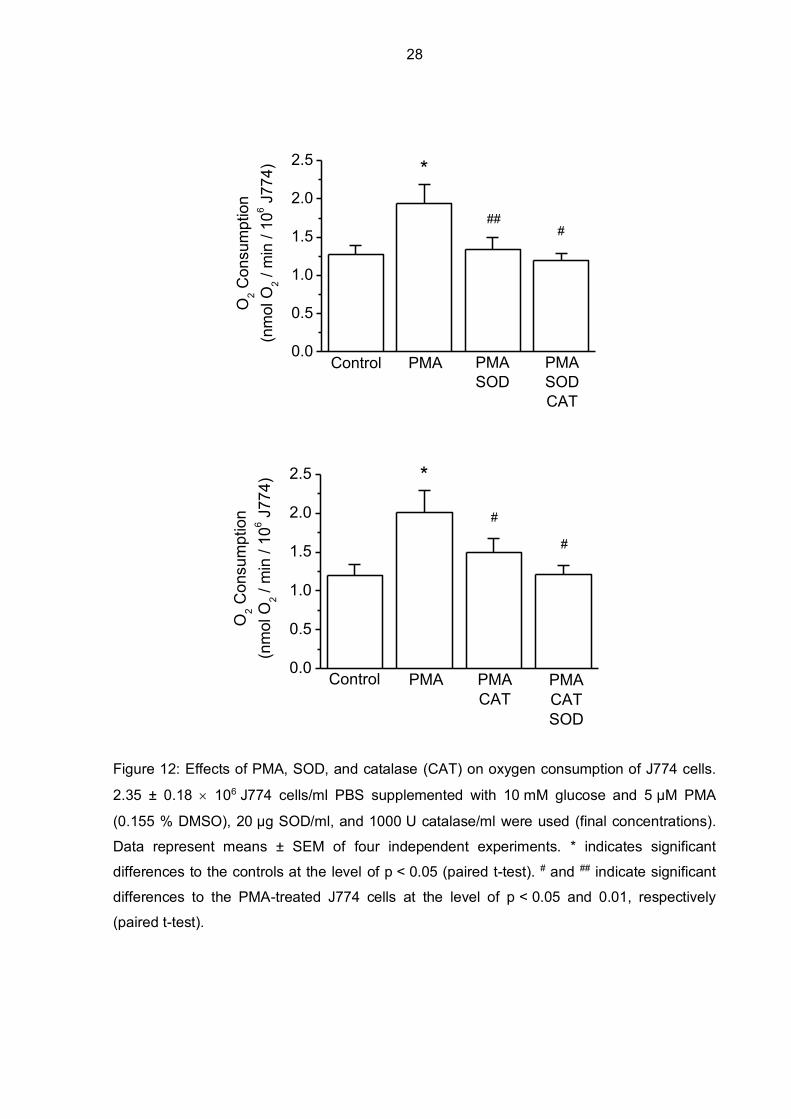
Antioxidative enzymes like SOD and catalase are used by macrophages to protect
themselves from superoxide radicals and hydrogen peroxide and to detoxify these ROS.
Oxygen can be partially recovered, since SOD catalyzes the reaction of superoxide anion
dismutation to hydrogen peroxide and oxygen, and catalase further converts hydrogen
peroxide into water and oxygen (Rist and Naftalin 1993). Results of how oxygen can be
partially recovered with these antioxidative enzymes after NOX2 stimulation with PMA are
shown in Figure 12, where PMA was used to stimulate ROS production via NOX2 and SOD
and catalase significantly recovered oxygen partially, which is seen as decreased oxygen
consumption in the figure. Surprisingly, even if catalase is added before SOD, a significant
decrease in oxygen consumption compared to unprotected J774 cells can be noticed as well.
28
Figure 12: Effects of PMA, SOD, and catalase (CAT) on oxygen consumption of J774 cells.
2.35 ± 0.18 106 J774 cells/ml PBS supplemented with 10 mM glucose and 5 µM PMA
(0.155 % DMSO), 20 µg SOD/ml, and 1000 U catalase/ml were used (final concentrations).
Data represent means ± SEM of four independent experiments. * indicates significant
differences to the controls at the level of p < 0.05 (paired t-test). # and ## indicate significant
differences to the PMA-treated J774 cells at the level of p < 0.05 and 0.01, respectively
(paired t-test).
0.0
0.5
1.0
1.5
2.0
2.5
###
*
PMASODCAT
PMASOD
PMAControl
O2 C
onsu
mpt
ion
(nm
ol O
2 / m
in /
106 J
774)
0.0
0.5
1.0
1.5
2.0
2.5
#
#
*
PMACATSOD
PMACAT
PMAControl
O2 C
onsu
mpt
ion
(nm
ol O
2 / m
in /
106 J
774)
29
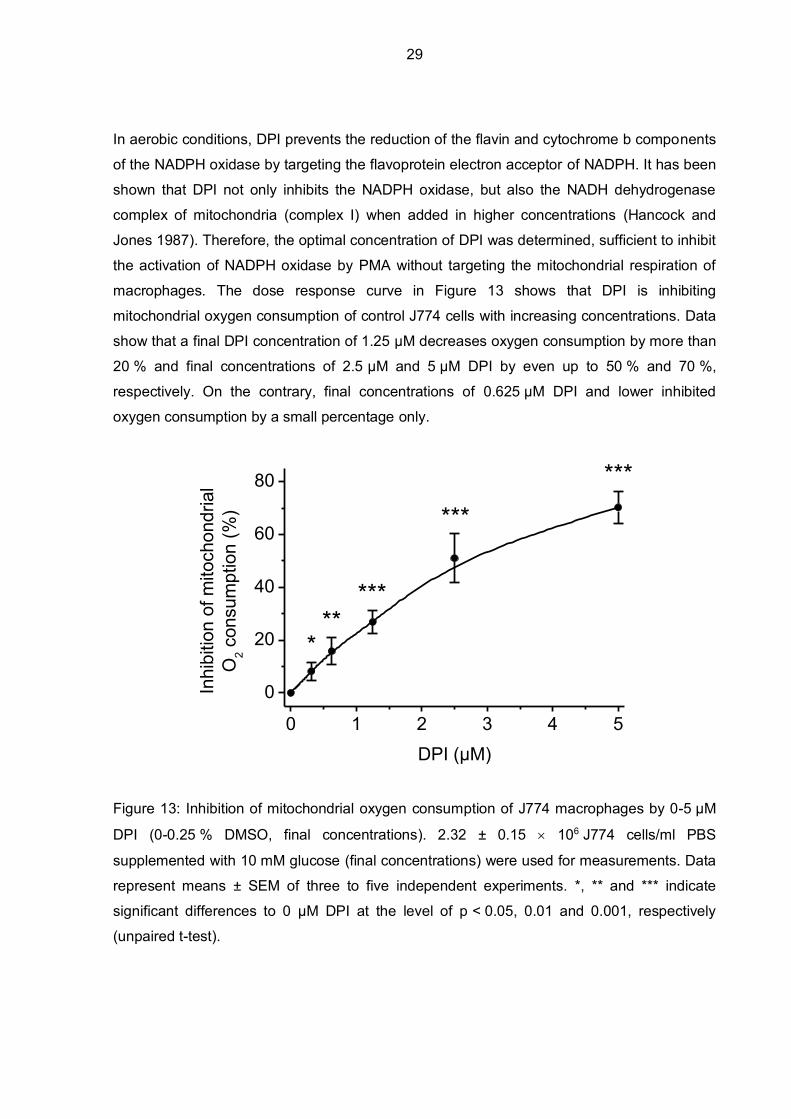
In aerobic conditions, DPI prevents the reduction of the flavin and cytochrome b components
of the NADPH oxidase by targeting the flavoprotein electron acceptor of NADPH. It has been
shown that DPI not only inhibits the NADPH oxidase, but also the NADH dehydrogenase
complex of mitochondria (complex I) when added in higher concentrations (Hancock and
Jones 1987). Therefore, the optimal concentration of DPI was determined, sufficient to inhibit
the activation of NADPH oxidase by PMA without targeting the mitochondrial respiration of
macrophages. The dose response curve in Figure 13 shows that DPI is inhibiting
mitochondrial oxygen consumption of control J774 cells with increasing concentrations. Data
show that a final DPI concentration of 1.25 µM decreases oxygen consumption by more than
20 % and final concentrations of 2.5 µM and 5 µM DPI by even up to 50 % and 70 %,
respectively. On the contrary, final concentrations of 0.625 µM DPI and lower inhibited
oxygen consumption by a small percentage only.
Figure 13: Inhibition of mitochondrial oxygen consumption of J774 macrophages by 0-5 µM
DPI (0-0.25 % DMSO, final concentrations). 2.32 ± 0.15 106 J774 cells/ml PBS
supplemented with 10 mM glucose (final concentrations) were used for measurements. Data
represent means ± SEM of three to five independent experiments. *, ** and *** indicate
significant differences to 0 µM DPI at the level of p < 0.05, 0.01 and 0.001, respectively
(unpaired t-test).
0 1 2 3 4 5
0
20
40
60
80
*****
***
***
*
Inhi
bitio
n of
mito
chon
dria
lO
2 con
sum
ptio
n (%
)
DPI (µM)
30
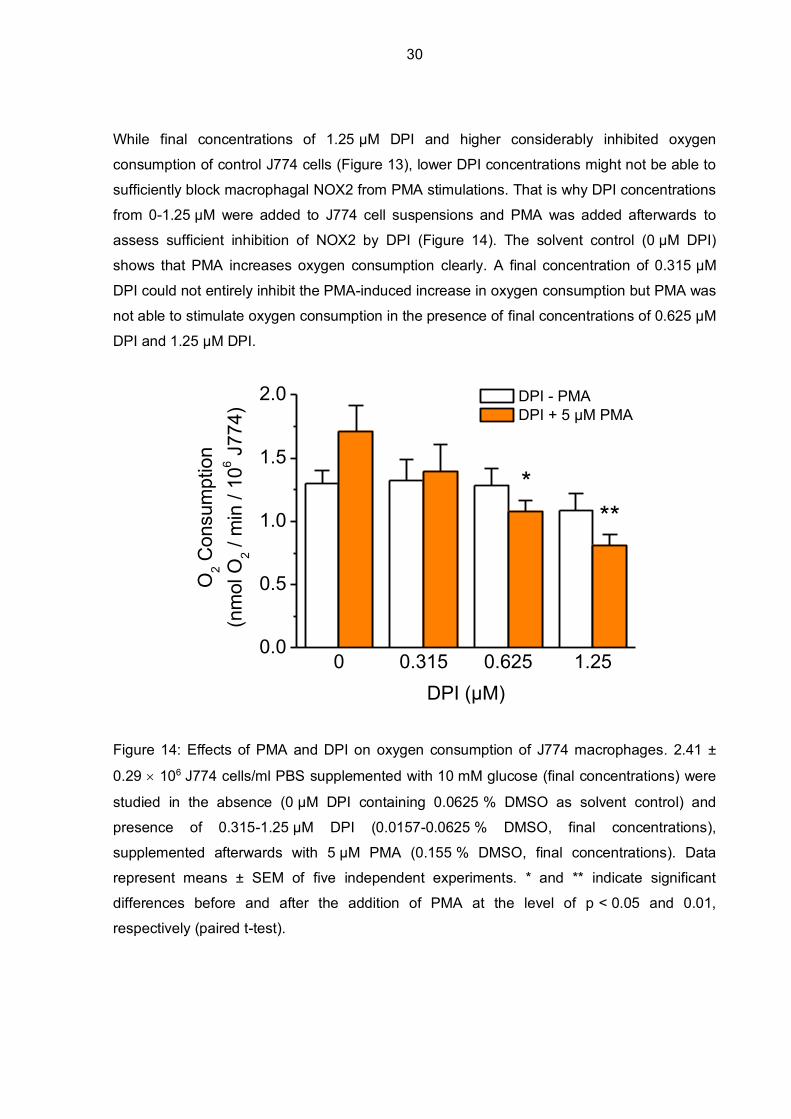
While final concentrations of 1.25 µM DPI and higher considerably inhibited oxygen
consumption of control J774 cells (Figure 13), lower DPI concentrations might not be able to
sufficiently block macrophagal NOX2 from PMA stimulations. That is why DPI concentrations
from 0-1.25 µM were added to J774 cell suspensions and PMA was added afterwards to
assess sufficient inhibition of NOX2 by DPI (Figure 14). The solvent control (0 µM DPI)
shows that PMA increases oxygen consumption clearly. A final concentration of 0.315 µM
DPI could not entirely inhibit the PMA-induced increase in oxygen consumption but PMA was
not able to stimulate oxygen consumption in the presence of final concentrations of 0.625 µM
DPI and 1.25 µM DPI.
Figure 14: Effects of PMA and DPI on oxygen consumption of J774 macrophages. 2.41 ±
0.29 106 J774 cells/ml PBS supplemented with 10 mM glucose (final concentrations) were
studied in the absence (0 µM DPI containing 0.0625 % DMSO as solvent control) and
presence of 0.315-1.25 µM DPI (0.0157-0.0625 % DMSO, final concentrations),
supplemented afterwards with 5 µM PMA (0.155 % DMSO, final concentrations). Data
represent means ± SEM of five independent experiments. * and ** indicate significant
differences before and after the addition of PMA at the level of p < 0.05 and 0.01,
respectively (paired t-test).
0 0.315 0.625 1.250.0
0.5
1.0
1.5
2.0
***
O2 C
onsu
mpt
ion
(nm
ol O
2 / m
in /
106 J
774)
DPI (µM)
DPI - PMA DPI + 5 µM PMA
31
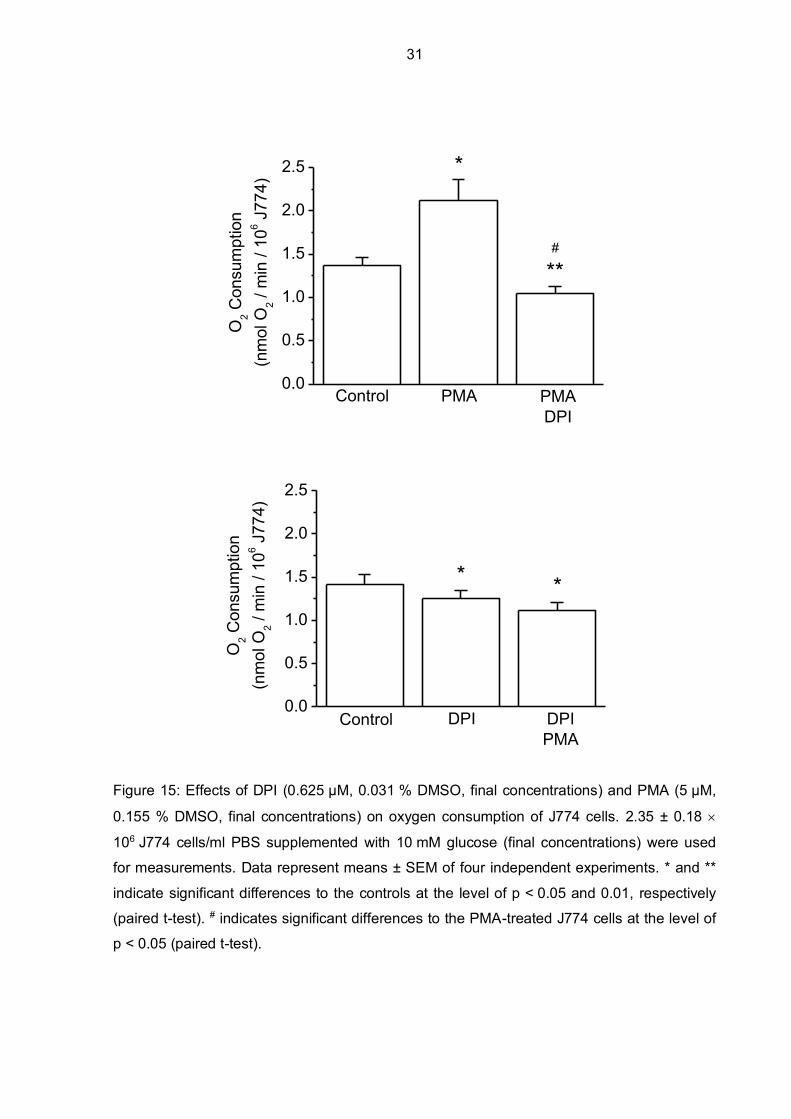
Figure 15: Effects of DPI (0.625 µM, 0.031 % DMSO, final concentrations) and PMA (5 µM,
0.155 % DMSO, final concentrations) on oxygen consumption of J774 cells. 2.35 ± 0.18
106 J774 cells/ml PBS supplemented with 10 mM glucose (final concentrations) were used
for measurements. Data represent means ± SEM of four independent experiments. * and **
indicate significant differences to the controls at the level of p < 0.05 and 0.01, respectively
(paired t-test). # indicates significant differences to the PMA-treated J774 cells at the level of
p < 0.05 (paired t-test).
0.0
0.5
1.0
1.5
2.0
2.5
#
*
**
PMADPI
PMAControl
O2 C
onsu
mpt
ion
(nm
ol O
2 / m
in /
106 J
774)
0.0
0.5
1.0
1.5
2.0
2.5
**
DPIPMA
DPIControl
O2 C
onsu
mpt
ion
(nm
ol O
2 / m
in /
106 J
774)
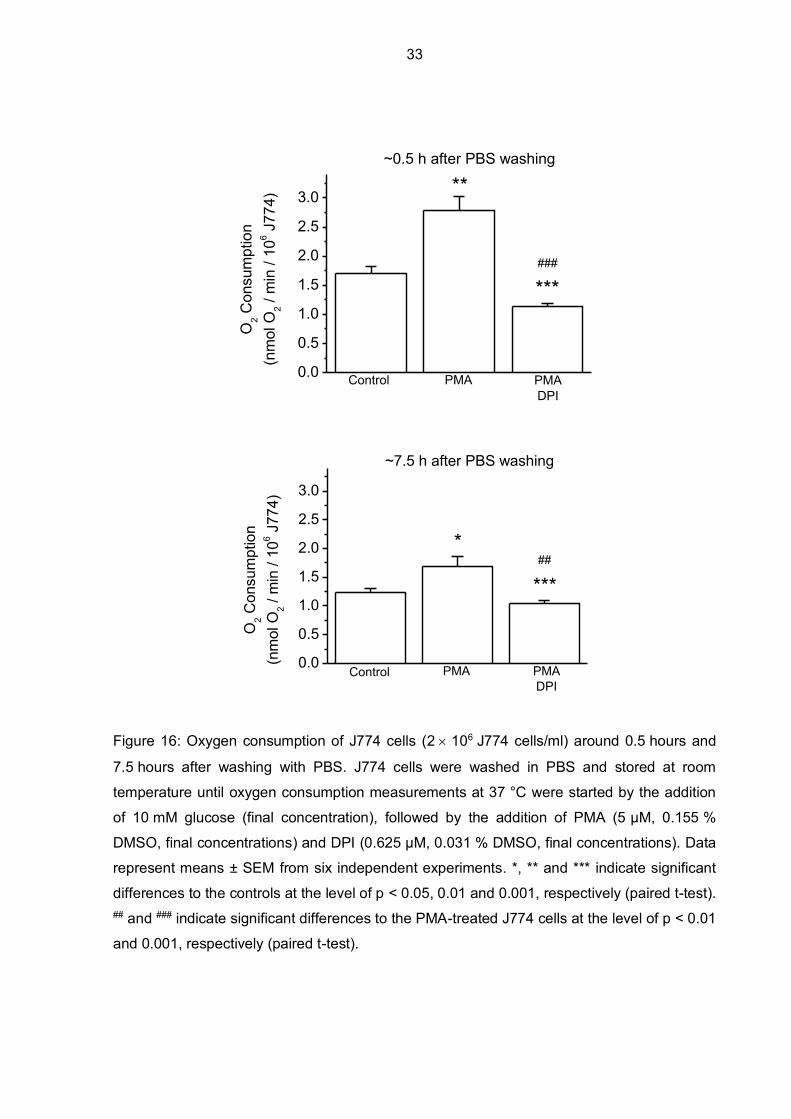
32
Considering the results from Figure 13 and Figure 14, a final concentration of 0.625 µM DPI
was used in further experiments. It was determined if NOX2 is sufficiently inhibited by DPI
regarding PMA stimulation without targeting mitochondrial respiration (Figure 15). Data show
that a final concentration of 0.625 µM DPI significantly inhibits the increased oxygen
consumption of J774 cells after PMA-induced stimulation and furthermore, that PMA
stimulation of oxygen consumption is not possible if DPI was added beforehand. Moreover,
oxygen consumption decreased significantly but only to a small amount after DPI was added
compared to basal oxygen consumption of control J774 cells.
Since oxygen consumption measurements were usually performed over several hours after
washing J774 macrophages with PBS, it was of interest to explore if time had an effect on
basal oxygen consumption rates and on the response of cells to a stimulation by PMA.
Therefore, oxygen consumption measurements of J774 cells were performed right after they
were washed with PBS (after around 0.5 hours), and repeated after approximately 7.5 hours.
In Figure 16, the upper graph shows an increase of oxygen consumption stimulated by PMA
0.5 hours after washing the cells with PBS. A significant increase in oxygen uptake (increase
from 1.7 nmol O2/min/106 J774 cells to 2.8 nmol O2/min/106 J774 cells) is noticeable and
after adding DPI to the cell suspension, oxygen consumption decreased significantly. In the
lower graph, a PMA-induced increase in oxygen consumption of J774 cells is detected but to
a much smaller amount (from 1.2 nmol O2/min/106 J774 cells to 1.7 nmol O2/min/106 J774
cells), still significant however. Effects of DPI appear not to be much affected by time. Also it
is interesting, that basal oxygen consumption of J774 macrophages supplemented with
glucose time-dependently decreased over the span of a day (1.7 nmol O2/min/106 J774 cells
vs. 1.2 nmol O2/min/106 J774 cells).
33
Figure 16: Oxygen consumption of J774 cells (2 106 J774 cells/ml) around 0.5 hours and
7.5 hours after washing with PBS. J774 cells were washed in PBS and stored at room
temperature until oxygen consumption measurements at 37 °C were started by the addition
of 10 mM glucose (final concentration), followed by the addition of PMA (5 µM, 0.155 %
DMSO, final concentrations) and DPI (0.625 µM, 0.031 % DMSO, final concentrations). Data
represent means ± SEM from six independent experiments. *, ** and *** indicate significant
differences to the controls at the level of p < 0.05, 0.01 and 0.001, respectively (paired t-test). ## and ### indicate significant differences to the PMA-treated J774 cells at the level of p < 0.01
and 0.001, respectively (paired t-test).
0.0
0.5
1.0
1.5
2.0
2.5
3.0
###
***
**~0.5 h after PBS washing
PMADPI
PMAControl
O2 C
onsu
mpt
ion
(nm
ol O
2 / m
in /
106 J
774)
0.0
0.5
1.0
1.5
2.0
2.5
3.0
##
***
*
~7.5 h after PBS washing
PMADPI
PMAControl
O2 C
onsu
mpt
ion
(nm
ol O
2 / m
in /
106 J
774)
34
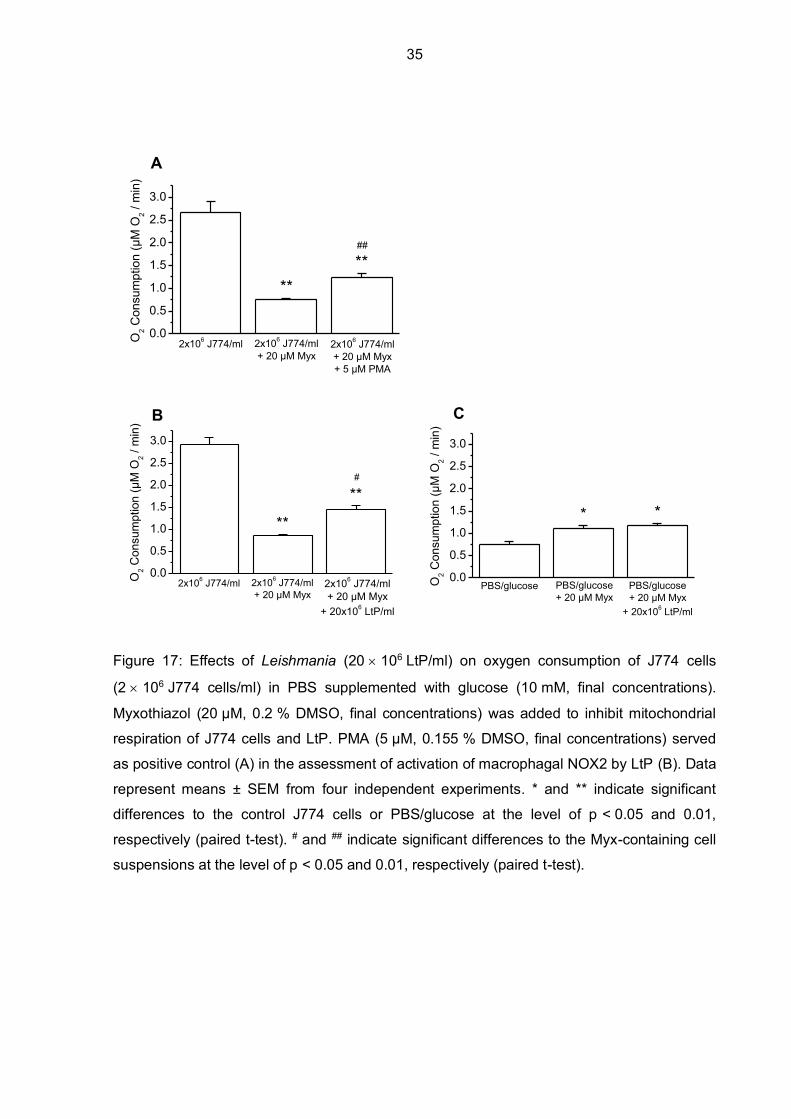
3.3 Effects of Leishmania tarentolae promastigotes on oxygen consumption of J774A.1 macrophages
Data in Figure 17 show how the addition of LtP to the J774 cell suspension (ratio of J774
cells to LtP was 1:10) influenced oxygen consumption. Artificial stimulation of NOX2 by PMA
served as positive control in the assessment of activation of macrophagal NOX2 by LtP.
Myxothiazol was used to inhibit mitochondrial respiration both in J774 cells and LtP. When
LtP were added to the myxothiazol-inhibited J774 cells, a significant increase in oxygen
consumption was detected, similar to the positive control where PMA was used instead of
LtP. To check the effectivity of myxothiazol in regards to LtP, LtP were added to PBS/glucose
in the absence of J774 cells but in the presence of myxothiazol. There was no additional
increase in oxygen consumption noticeable, inferring that myxothiazol sufficiently blocked
LtP respiration. Moreover, it can be seen that PBS/glucose also consumes oxygen to some
extent.
In the next sets of experiments, macrophagal NOX2 activity in the presence of LtP was
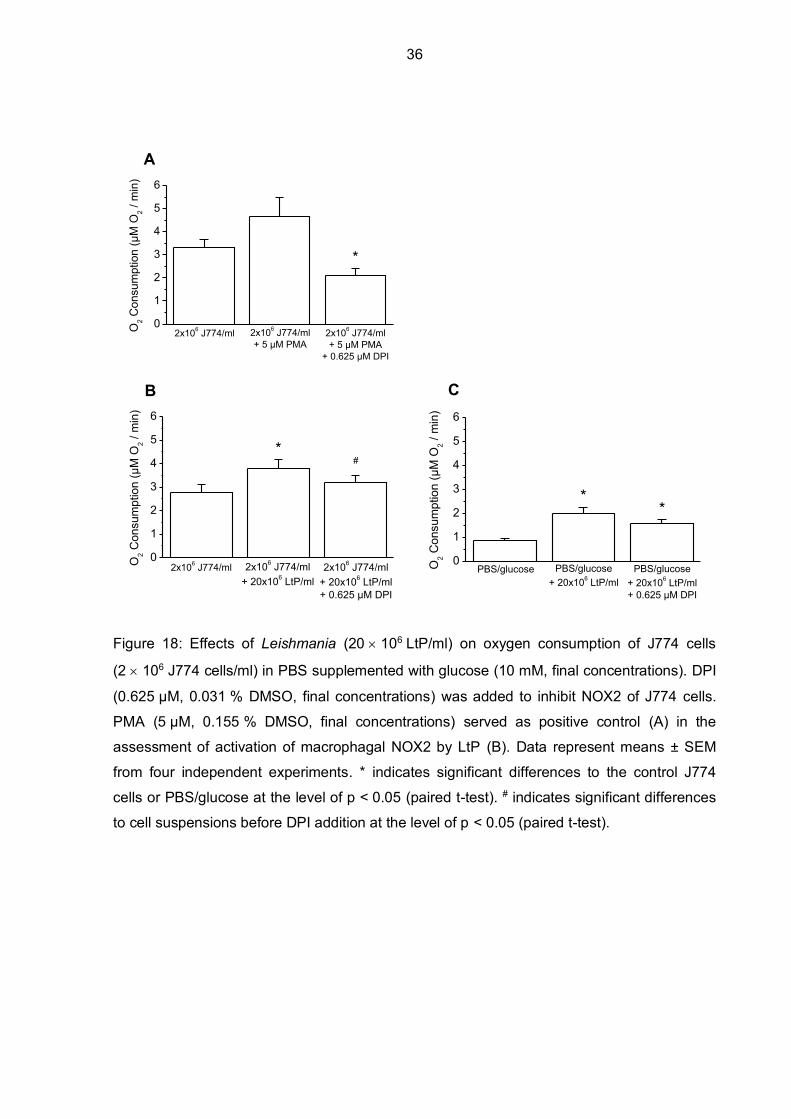
further investigated by using DPI to block NOX2. Figure 18 shows how oxygen consumption
decreased in the positive control (PMA) after DPI was added (p = 0.0526). J774-dependent
oxygen consumption in the presence of LtP (ratio of J774 cells to LtP was 1:10) showed a
significant increase in oxygen consumption. Since mitochondrial respiration was not
inhibited, this additional oxygen consumption could be related to mitochondrial respiration of
LtP. Moreover, when DPI was added, only a small but significant decrease in oxygen
consumption was noticeable. DPI should rather affect NOX2 activity in J774 cells and not
mitochondrial oxygen consumption of LtP. To test the effects of DPI on LtP, DPI was added
to a LtP suspension in PBS/glucose without J774 cells. It turned out, that oxygen
consumption of LtP decreased in the presence of DPI (0.625 µM, final concentrations),
however not significantly.
35
Figure 17: Effects of Leishmania (20 106 LtP/ml) on oxygen consumption of J774 cells
(2 106 J774 cells/ml) in PBS supplemented with glucose (10 mM, final concentrations).
Myxothiazol (20 µM, 0.2 % DMSO, final concentrations) was added to inhibit mitochondrial
respiration of J774 cells and LtP. PMA (5 µM, 0.155 % DMSO, final concentrations) served
as positive control (A) in the assessment of activation of macrophagal NOX2 by LtP (B). Data
represent means ± SEM from four independent experiments. * and ** indicate significant
differences to the control J774 cells or PBS/glucose at the level of p < 0.05 and 0.01,
respectively (paired t-test). # and ## indicate significant differences to the Myx-containing cell
suspensions at the level of p < 0.05 and 0.01, respectively (paired t-test).
0.0
0.5
1.0
1.5
2.0
2.5
3.0
##
****
2x10⁶ J774/ml 2x10⁶ J774/ml+ 20 µM Myx+ 5 µM PMA
2x10⁶ J774/ml+ 20 µM Myx
O2 C
onsu
mpt
ion
(µM
O2 /
min
)
0.0
0.5
1.0
1.5
2.0
2.5
3.0
#
**
**
2x10⁶ J774/ml+ 20 µM Myx
+ 20x106 LtP/ml
2x10⁶ J774/ml+ 20 µM Myx
2x10⁶ J774/ml O2 C
onsu
mpt
ion
(µM
O2 /
min
)
0.0
0.5
1.0
1.5
2.0
2.5
3.0
* *
PBS/glucose+ 20 µM Myx
+ 20x106 LtP/ml
PBS/glucose+ 20 µM Myx
PBS/glucose O2 C
onsu
mpt
ion
(µM
O2 /
min
)
A
B C
36
Figure 18: Effects of Leishmania (20 106 LtP/ml) on oxygen consumption of J774 cells
(2 106 J774 cells/ml) in PBS supplemented with glucose (10 mM, final concentrations). DPI
(0.625 µM, 0.031 % DMSO, final concentrations) was added to inhibit NOX2 of J774 cells.
PMA (5 µM, 0.155 % DMSO, final concentrations) served as positive control (A) in the
assessment of activation of macrophagal NOX2 by LtP (B). Data represent means ± SEM
from four independent experiments. * indicates significant differences to the control J774
cells or PBS/glucose at the level of p < 0.05 (paired t-test). # indicates significant differences
to cell suspensions before DPI addition at the level of p < 0.05 (paired t-test).
0
1
2
3
4
5
6
*
2x106 J774/ml+ 5 µM PMA
+ 0.625 µM DPI
2x10⁶ J774/ml+ 5 µM PMA
2x10⁶ J774/mlO2 C
onsu
mpt
ion
(µM
O2 /
min
)
0
1
2
3
4
5
6
#*
2x10⁶ J774/ml+ 20x106 LtP/ml+ 0.625 µM DPI
2x10⁶ J774/ml+ 20x106 LtP/ml
2x10⁶ J774/ml O2 C
onsu
mpt
ion
(µM
O2 /
min
)
0
1
2
3
4
5
6
**
PBS/glucose+ 20x106 LtP/ml+ 0.625 µM DPI
PBS/glucose+ 20x106 LtP/ml
PBS/glucoseO2 C
onsu
mpt
ion
(µM
O2 /
min
)
A
B C
37
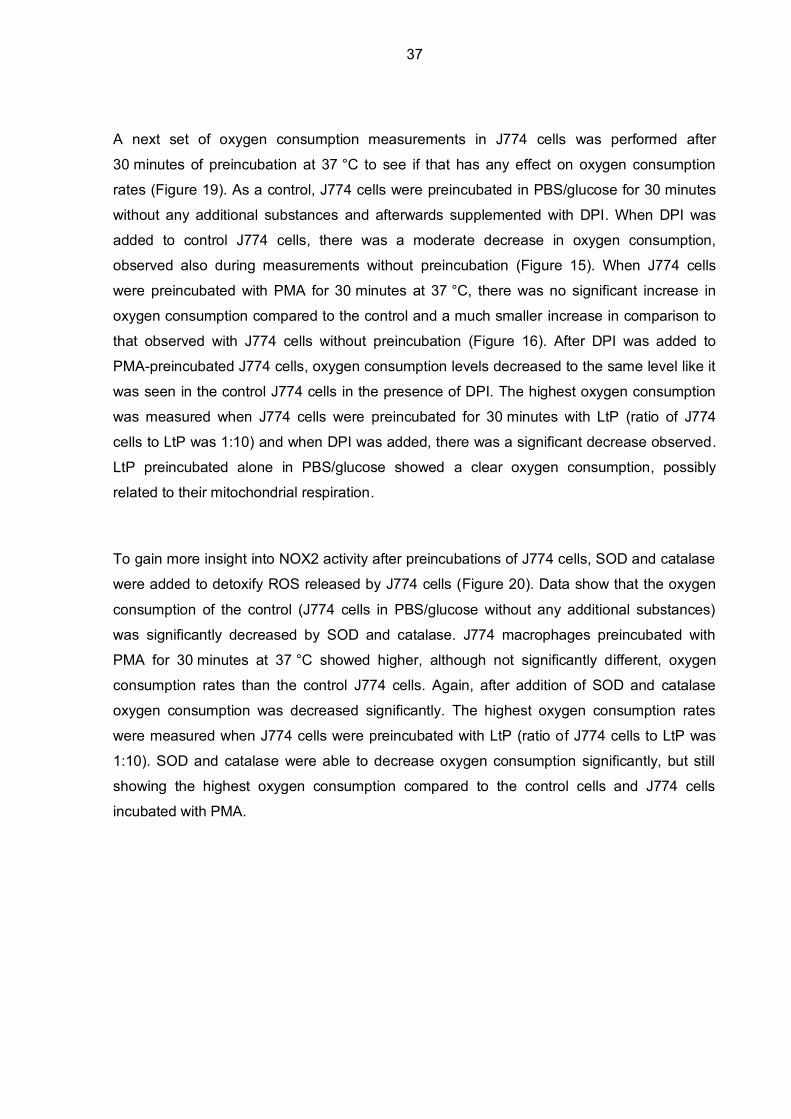
A next set of oxygen consumption measurements in J774 cells was performed after
30 minutes of preincubation at 37 °C to see if that has any effect on oxygen consumption
rates (Figure 19). As a control, J774 cells were preincubated in PBS/glucose for 30 minutes
without any additional substances and afterwards supplemented with DPI. When DPI was
added to control J774 cells, there was a moderate decrease in oxygen consumption,
observed also during measurements without preincubation (Figure 15). When J774 cells
were preincubated with PMA for 30 minutes at 37 °C, there was no significant increase in
oxygen consumption compared to the control and a much smaller increase in comparison to
that observed with J774 cells without preincubation (Figure 16). After DPI was added to
PMA-preincubated J774 cells, oxygen consumption levels decreased to the same level like it
was seen in the control J774 cells in the presence of DPI. The highest oxygen consumption
was measured when J774 cells were preincubated for 30 minutes with LtP (ratio of J774
cells to LtP was 1:10) and when DPI was added, there was a significant decrease observed.
LtP preincubated alone in PBS/glucose showed a clear oxygen consumption, possibly
related to their mitochondrial respiration.
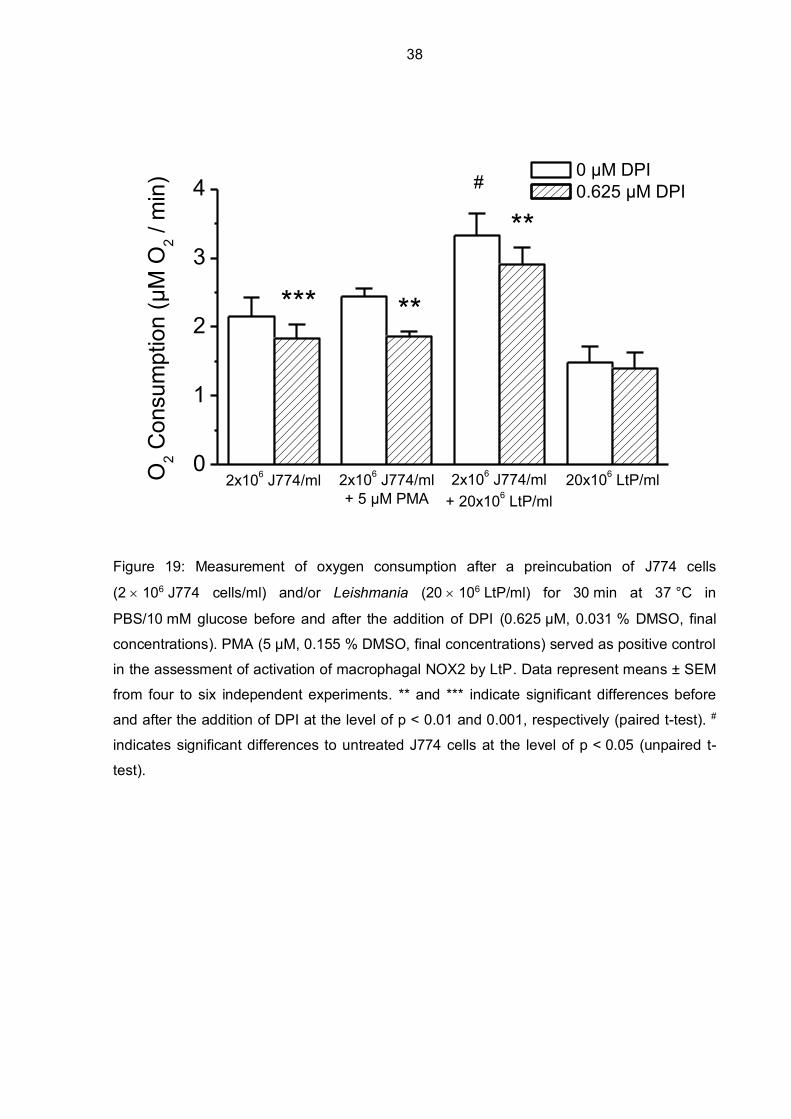
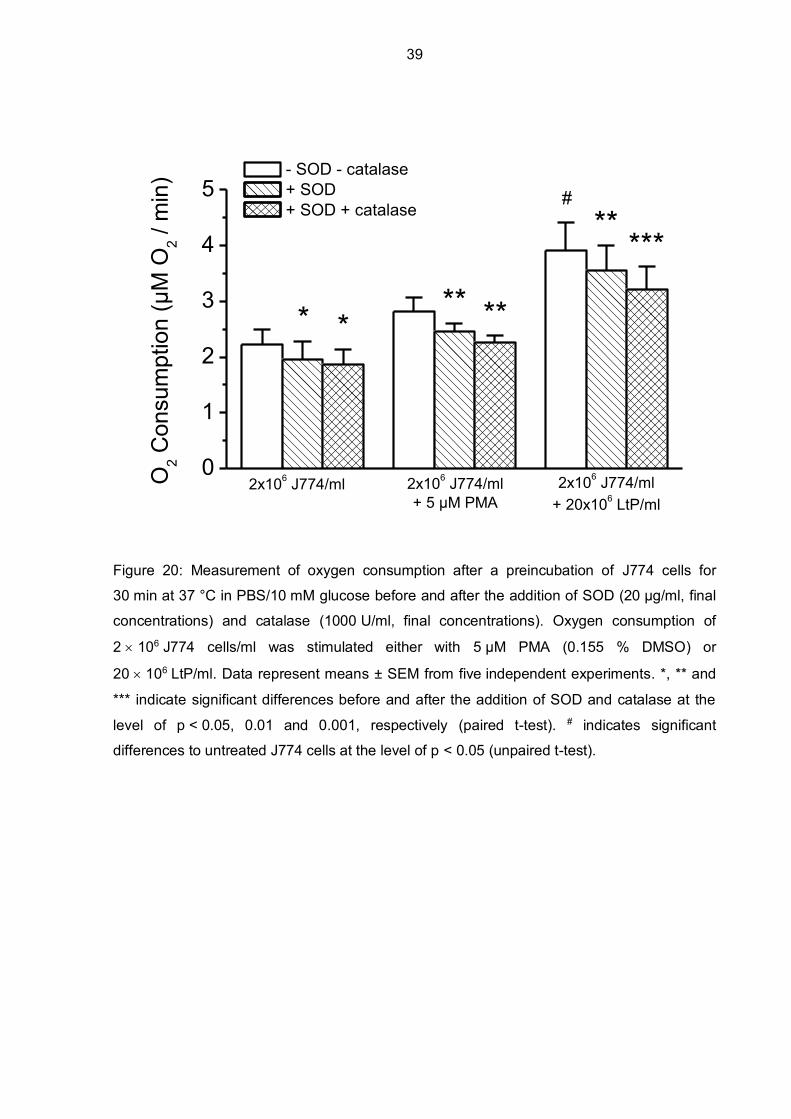
To gain more insight into NOX2 activity after preincubations of J774 cells, SOD and catalase
were added to detoxify ROS released by J774 cells (Figure 20). Data show that the oxygen
consumption of the control (J774 cells in PBS/glucose without any additional substances)
was significantly decreased by SOD and catalase. J774 macrophages preincubated with
PMA for 30 minutes at 37 °C showed higher, although not significantly different, oxygen
consumption rates than the control J774 cells. Again, after addition of SOD and catalase
oxygen consumption was decreased significantly. The highest oxygen consumption rates
were measured when J774 cells were preincubated with LtP (ratio of J774 cells to LtP was
1:10). SOD and catalase were able to decrease oxygen consumption significantly, but still
showing the highest oxygen consumption compared to the control cells and J774 cells
incubated with PMA.
38
Figure 19: Measurement of oxygen consumption after a preincubation of J774 cells
(2 106 J774 cells/ml) and/or Leishmania (20 106 LtP/ml) for 30 min at 37 °C in
PBS/10 mM glucose before and after the addition of DPI (0.625 µM, 0.031 % DMSO, final
concentrations). PMA (5 µM, 0.155 % DMSO, final concentrations) served as positive control
in the assessment of activation of macrophagal NOX2 by LtP. Data represent means ± SEM
from four to six independent experiments. ** and *** indicate significant differences before
and after the addition of DPI at the level of p < 0.01 and 0.001, respectively (paired t-test). #
indicates significant differences to untreated J774 cells at the level of p < 0.05 (unpaired t-
test).
0
1
2
3
4 #
**
*** **
20x106 LtP/ml2x106 J774/ml+ 20x106 LtP/ml
2x10⁶ J774/ml+ 5 µM PMA
2x10⁶ J774/ml
0 µM DPI 0.625 µM DPI
O2 C
onsu
mpt
ion
(µM
O2 /
min
)
39
Figure 20: Measurement of oxygen consumption after a preincubation of J774 cells for
30 min at 37 °C in PBS/10 mM glucose before and after the addition of SOD (20 µg/ml, final
concentrations) and catalase (1000 U/ml, final concentrations). Oxygen consumption of
2 106 J774 cells/ml was stimulated either with 5 µM PMA (0.155 % DMSO) or
20 106 LtP/ml. Data represent means ± SEM from five independent experiments. *, ** and
*** indicate significant differences before and after the addition of SOD and catalase at the
level of p < 0.05, 0.01 and 0.001, respectively (paired t-test). # indicates significant
differences to untreated J774 cells at the level of p < 0.05 (unpaired t-test).
0
1
2
3
4
5 #
*****
******
2x10⁶ J774/ml+ 20x106 LtP/ml
2x10⁶ J774/ml+ 5 µM PMA
2x10⁶ J774/ml
- SOD - catalase + SOD + SOD + catalase
O2 C
onsu
mpt
ion
(µM
O2 /
min
)
40
4 DISCUSSION
Macrophages as most eukaryotic cells consume oxygen in order to generate ATP in the
mitochondria, since cellular respiration provides more energy than anaerobic metabolism.
During energy conversion in the mitochondrion, oxygen is used as the final acceptor of the
electron transport chain, where electrons are passed from one complex to another and
finally, oxygen is reduced into water (Alberts et al. 2015). Respiratory chain complexes can
be selectively inhibited by several substances, thus blocking oxygen consumption and
energy conversion in mitochondria. Myxothiazol, for example, inhibits complex III and
potassium cyanide is a known inhibitor of complex IV and, hence, ATP production (Herrero
and Barja 1997, Dettmer et al. 2013). In addition to the mitochondrial oxygen consumption,
activated macrophages consume molecular oxygen due to the production of ROS, such as
superoxide radical anions and subsequently hydrogen peroxide, via their NOX2. Thus, an
increased phagocytic activity can result in enhanced oxygen uptake (Lepoivre et al. 1982).
As a model substance, PMA can stimulate NOX2-dependent oxygen consumption via an
activation of PKC (Rist and Naftalin 1993). In order to protect themselves from these ROS,
macrophages use antioxidative enzymes that catalyze reactions in which ROS are detoxified.
SOD and catalase are important antioxidative enzymes where superoxide radical anions are
dismutated into H2O2 and oxygen, and hydrogen peroxide is further converted into water and
oxygen, respectively (Rist and Naftalin 1993).
Results from oxygen consumption measurements showed that potassium cyanide and
myxothiazol are inhibiting mitochondrial respiration to a large extent (Figure 10 and Figure
11). An explanation why oxygen consumption does not drop to zero could be that PBS
showed to consume oxygen itself in the range of 0.82 µM O2/min (Figure 17 and Figure 18).
PMA was able to increase oxygen consumption even when mitochondrial complex inhibitors
were present in the macrophagal suspension, which would infer that ROS production by
NOX2 is induced. To check whether ROS were actually produced, antioxidant enzymes
(SOD, catalase) were added to the macrophagal suspension and oxygen was successfully
partially recovered, as it is expected when NOX2 produces superoxide radical anions and
hydrogen peroxide as a consequence. Interesting was, however, that similar effects were
observed when catalase was added to the macrophagal suspension before SOD (Figure 12),
which would mean that somehow hydrogen peroxide is produced. This raises the question if
endogenous SOD activity is present. Rist and Naftalin observed that 85 % of the detected
oxygen consumption of macrophages stimulated with PMA declined after addition of
41
exogenous SOD and catalase. They further concluded that endogenous SOD and catalase
only have minor effects on the stoichiometry of macrophagal oxygen consumption in the
presence of PMA (Rist and Naftalin 1993). Superoxide radicals can, however, spontaneously
dismutate into hydrogen peroxide. It was shown in former studies that at neutral pH, the rate
constant for the second order spontaneous dismutation is rather high, being around 2
107 M-1 s-1 (McCord and Fridovich 1969). Therefore, it can be assumed that in addition to
superoxide radicals, hydrogen peroxide was produced in our cell suspensions.
Further supporting that PMA is actually stimulating NOX2 under our conditions is that when
DPI was added to PMA-stimulated J774 cells, oxygen consumption was decreased after the
PMA-induced increase. Under our conditions a final DPI concentration of 0.625 µM was
sufficient to block NOX2 with only minimal interference into mitochondrial respiration (Figure
15). Comparing our data with results of Hancock and Jones, the same final concentrations
for potassium cyanide (1 mM) and PMA (5 µM) were used in oxygen consumption
measurements and our results are consistent with their findings. On the contrary, under their
conditions, 13 µM DPI caused 50 % inhibition of mitochondrial respiration and 0.9 µM DPI
was necessary for 50 % NOX2 inhibition (Hancock and Jones 1987), whereas our data
showed that already a final concentration of 2.5 µM DPI was enough to decrease
mitochondrial oxygen consumption by up to 50 %. Moreover, 0.625 µM DPI was inhibiting
PMA-induced oxygen uptake of NOX2 completely. It should be mentioned that they used
primary rat macrophages, while we used a murine macrophage cell line. Murine bone
marrow-derived macrophages were used in a study by Bhunia et al. where they observed an
increase in oxygen consumption rates from 1.41 (control macrophages) to 7.02 nmol
O2/min/106 cells after PMA stimulation (1 µg/ml corresponding to 1.62 µM) (Bhunia et al.
1996). In the contrary to their increase of 5.61 nmol O2/min/106 cells in the presence of PMA,
under our conditions only an increase of usually not more than 1.5 nmol O2/min/106 J774
cells was observed when PMA (5 µM) was added. The control oxygen consumption rates (no
substances added) that were measured in our experiments, however, were similar to those
found in literature (Bhunia et al. 1996, James et al. 1998). A reason why Bhunia et al. (1996)
achieved a higher increase in oxygen consumption after PMA stimulation could be that they
used primary cells, whereas we used a macrophage cell line. In neutrophils it was shown,
that primary blood-derived neutrophils had significantly enhanced antimicrobial activity, which
could be stimulated with PMA, whereas a neutrophil cell line showed less antimicrobial
activity. Moreover, ROS formation was significantly reduced in the cell line compared to the
42
primary neutrophils (Yaseen et al. 2017). Another aspect that should be mentioned is that
higher oxygen consumptions of J774 cells were observed under our conditions shortly after
washing cells with PBS than ~7.5 hours later (Figure 16). Shortly after the cells were washed
with PBS, basal oxygen consumption rates of 1.7 nmol O2/min/106 J774 cells were achieved
and increased to 2.8 nmol O2/min/106 J774 cells after PMA stimulation.
Since NOX2 can also be activated during phagocytosis of pathogens (Lepoivre et al. 1982), it
was of interest to study the effects of an intracellular pathogen on oxygen consumption of
macrophages. As a model organism in drug screening (Taylor et al. 2010) and basic
research to study the process of infection, the non-pathogenic species Leishmania tarentolae
(biosafety level 1) can be used. Usually, pathogen uptake by macrophages is accompanied
by an oxidative burst, but Leishmania spp., manage to survive within this hostile environment
using a variety of mechanisms, including interference with NOX2 assembly (Geroldinger et
al. 2019) and delay in phagosome maturation (Banerjee et al. 2016).
Considering the recent finding that adherent J774A.1 macrophages were able to
phagocytose LtP and that these Leishmania successfully multiplied and persisted for
48 hours inside J774 cells (Geroldinger et al. 2019), LtP were added to J774 cell
suspensions and oxygen consumption was measured. It turned out that LtP caused a similar
increase in oxygen consumption when added to myxothiazol-inhibited J774 cells compared
to the positive control, where J774 cells were stimulated with PMA after being inhibited by
myxothiazol (0.58 µM O2/min vs. 0.48 µM O2/min, Figure 17). Since myxothiazol inhibits not
only macrophagal mitochondrial respiration but also respiration of LtP (the oxygen
consumption of LtP in the absence of J774 cells but in the presence of myxothiazol
increased only by 0.07 µM O2/min), the increase in oxygen consumption that was observed
when LtP were added to the myxothiazol-treated J774 cells could be due to a NOX2
activation by LtP. Futhermore, DPI was used to block NOX2 activity to further investigate the
effects of LtP on macrophagal NOX2 under our conditions. Data showed that when LtP were
added to the J774 cell suspension, oxygen consumption increased but with the addition of
DPI there was a significant decrease in oxygen consumption (Figure 18). Oxygen
consumption in the presence of DPI was still higher than oxygen consumption of only J774
cells but since LtP consume oxygen themselves (if not inhibited by myxothiazol) this was not
surprising. This could further support that LtP added to J774 cells stimulated NOX2 to some
amount which then can be blocked by DPI. Interesting was, that DPI moderately, however
not significantly, decreased oxygen consumption of LtP in PBS/glucose. It could be possible
43
that leishmanial mitochondria respond more sensitive to DPI and that 0.625 µM DPI was still
too high for leishmanial mitochondria. The effect of DPI on LtP should be further investigated.
Bhunia et al. showed that Leishmania donovani triggered a superoxide radical anion
production in bone marrow-derived macrophages 15 minutes after Leishmania addition (1:10
ratio of macrophages to parasites) (Bhunia et al. 1996). In the present study, a preincubation
time of 30 minutes was applied and oxygen consumption was measured afterwards (Figure
19 and Figure 20). Preincubation of J774 cells with PMA showed a rather low increase in
oxygen consumption in comparison to non-preincubated samples. This observation is
consistent with findings of Rist and Naftalin, where the maximum rate of oxygen consumption
of PMA-activated cells was maintained only for 15-20 minutes (Rist and Naftalin 1993). A
much higher increase in oxygen consumption was measured when LtP were added to J774
cells and preincubated for 30 minutes. This could be because of the additional mitochondrial
oxygen consumption of LtP or because they stimulated NOX2 of J774 cells. When DPI was
added, oxygen consumption decreased which supports the argument of NOX2 activation
(Figure 19). Moreover, when SOD and catalase were added to the preincubated J774/LtP
suspension, a significant decrease in oxygen consumption was observed (Figure 20). This
further supports NOX2 activation of J774 cells in presence of LtP.
Bhunia et al. divided the process of Leishmania infection into two phases, attachment and
internalization. They found that attachment of the parasite significantly induced superoxide
radical anion production of macrophages and, hence, oxygen consumption, but once
Leishmania donovani were internalized, transduction pathways were impaired and triggering
of effector molecules was stopped (Bhunia et al. 1996). This might not completely apply to
our findings, since we used Leishmania tarentolae and not Leishmania donovani, but it could
support the argument that NOX2 was activated by LtP due to attachment of the parasites to
the macrophages and oxygen consumption might decrease later once LtP are internalized.
Different preincubation times of J774 cells with LtP before oxygen consumption
measurements could give more insight if, or to what extent, oxygen consumption changes
over the duration J774 cells are faced with LtP. Another aspect that should be considered
are the differences between promastigotes and amastigotes. In Leishmania donovani,
promastigotes induced NOX2 activity by phosphorylation of p47phox, whereas amastigotes
only caused p47phox phosphorylation that was barely detectable 15-30 minutes after
phagocytosis initiation (Lodge and Descoteaux 2006). Promastigotes are not affecting the
overall production of ROS in macrophages but NOX2 assembly is locally inhibited in the
44
phagosomal membrane due to LPG integration into the membrane. This local inhibition of the
respiratory burst is ensuring promastigote survival after phagocytosis but in general, ROS
formation is detected. On the contrary, amastigotes are actively impairing NOX2 activity and
ROS production when they are phagocytosed (Van Assche et al. 2011).
To determine if changes in oxygen consumption of J774 cells in the presence of LtP were
caused by a NOX2-mediated increase in oxygen uptake via ROS production, methods for
detection of ROS production could be applied. Some authors used SOD-inhibitable
cytochrome c reduction (Kayashima et al. 1980, Lepoivre et al. 1982, Hancock and Jones
1987, Bhunia et al. 1996), whereas Geroldinger et al. (2019) established an electron spin
resonance method for superoxide radical detection directly in adherent J774 cells and they
came to the conclusion that LtP were able to increase radical formation but to a much
smaller amount compared to the positive control where J774 cells were stimulated with PMA.
Moreover, a dihydroethidium-based assay was used as another method for radical detection,
but less specific, to verify the results obtained from electron spin resonance measurements.
Results showed that LtP did not trigger radical formation to a high extent. In the study of
Geroldinger et al. (2019) adherent J774 cells were used for infection with LtP, whereas in this
bachelor thesis we used J774 cells in suspensions for our oxygen consumption
measurements and a J774 cells to LtP ratio of 1:10 was used. This leads to the next aspect
that should be investigated further, namely comparing oxygen consumption of J774 cells in
suspension, measured e.g. with the Clark-type oxygen electrode, and adherent cells, where
OxoPlates with integrated fluorescence oxygen sensors could be used (Monzote et al. 2016).
It should be mentioned that Leishmania spp. are very diverse and parasite establishment,
survival, and persistence varies within each host-pathogen combination, which should be
considered for the development of treatments. Only looking at the structure of LPG, the most
abundant molecule on the surface of Leishmania and associated with the impairment of
phagosome maturation, a diversity among the different species of Leishmania can be noted.
This diversity does not only apply to Leishmania spp., but also to the host cells, the
macrophages, which appear heterogenous in regards to the tissue they are located at (Kaye
and Scott 2011). Moreover, there are differences between human and murine macrophages
in regards to Leishmania infection. In mice, superoxide radical production during the early
stages of Leishmania donovani infection only plays a minor part compared to the formation of
reactive nitrogen species (Lodge and Descoteaux 2006).
45
In conclusion, in this bachelor thesis it was shown that oxygen consumption measurements
in murine J774A.1 macrophages in the presence and absence of Leishmania tarentolae
promastigotes, inhibitors of the mitochondrial respiratory chain, modulators of NADPH
oxidase as well as extracellular antioxidative enzymes give additional insights into the redox
biology and interactions that take place during early stages of Leishmania infections in
macrophages. Understanding of these processes is of fundamental importance for
developing new antileishmanial drugs. New drugs and therapies are a great necessity since
only limited treatment options exist which are unsatisfactory due to resistances developed by
Leishmania and the side effects they cause (Van Assche et al. 2011).
46
5 SUMMARY
Macrophages are important innate immune cells playing a big role in eliminating intruding
pathogens. By phagocytosing microorganisms, macrophages release pro-inflammatory
mediators and are able to kill pathogens in their phagolysosomes. One of these destructive
mechanisms is the oxidative burst, in which the NADPH oxidase (NOX2) produces reactive
oxygen species (ROS) like superoxide radicals or hydrogen peroxide. However, several
pathogens have evolved strategies to reside and even replicate within macrophages, for
example the vector-borne parasites Leishmania. Leishmania are hypothesized to suppress
the macrophagal oxidative burst to ensure their survival.
In this bachelor thesis, measurements of oxygen consumption of macrophages of the murine
cell line J774A.1 associated with their mitochondrial respiration and ROS production were
performed to investigate how different substances but also the non-pathogenic Leishmania
tarentolae promastigotes (LtP) influence macrophagal oxygen consumption.
Apart from mitochondrial respiration, also the activated NOX2 is consuming oxygen. This
consumed oxygen can be partially recovered by antioxidant enzymes like superoxide
dismutase or catalase, protecting macrophages from ROS they produce during the oxidative
burst. Phorbol myristate acetate (PMA) was used as positive control to artificially stimulate
macrophagal NOX2 and diphenyleneiodonium chloride (DPI) served as an NOX2 inhibitor.
Results show that KCN and myxothiazol effectively inhibited mitochondrial respiration, while
PMA stimulated macrophagal oxygen consumption even after mitochondrial respiration was
blocked. LtP increased oxygen consumption in J774 cell suspensions similar to PMA that
activated the macrophagal NOX2. In J774 suspensions preincubated with LtP for 30 minutes,
giving LtP enough time for attachment or internalization, even higher oxygen consumption
rates were observed. This could suggest LtP-induced NOX2 stimulation, since DPI,
superoxide dismutase and catalase partially decreased this rise in oxygen consumption.
In conclusion, oxygen consumption measurements in macrophages give additional insights
into processes taking place during early stages of Leishmania infections which is of
fundamental importance for developing new antileishmanial drugs.
47
6 ZUSAMMENFASSUNG
Makrophagen spielen als Zellen des angeborenen Immunsystems eine wichtige Rolle bei der
Eliminierung eindringender Pathogene. Nach der Phagozytose der Mikroorganismen setzen
Makrophagen pro-inflammatorische Mediatoren frei und können diese Pathogene in ihren
Phagolysosomen abtöten. Einer dieser destruktiven Mechanismen ist der oxidative Burst, bei
dem die NADPH-Oxidase (NOX2) reaktive Sauerstoffspezies (ROS), zum Beispiel
Superoxidradikale oder Wasserstoffperoxid, bildet. Nichtsdestotrotz haben verschiedene
Pathogene Strategien entwickelt, um in Makrophagen zu überleben und können sich sogar
replizieren. Ein Beispiel sind die von Vektoren übertragenen Parasiten Leishmanien. Es wird
angenommen, dass Leishmanien den oxidativen Burst von Makrophagen unterdrücken
können, um ihr Überleben zu sichern.
In dieser Bachelorarbeit wurden Messungen des Sauerstoffverbrauchs von Makrophagen
der murinen Zelllinie J774A.1 im Zusammenhang mit ihrer mitochondrialen Atmung und
Sauerstoffradikalbildung durchgeführt, um herauszufinden, wie verschiedene Substanzen,
aber auch die nichtpathogenen Leishmania tarentolae Promastigoten (LtP), den
Sauerstoffverbrauch der Makrophagen beeinflussen können.
Neben der mitochondrialen Atmung verbraucht auch die aktivierte NOX2 Sauerstoff. Dieser
verbrauchte Sauerstoff kann teilweise durch antioxidative Enzyme wie Superoxiddismutase
oder Katalase, welche Makrophagen während des oxidativen Bursts vor ROS schützen,
rückgewonnen werden. Phorbolmyristatacetat (PMA) wurde als Positivkontrolle zur NOX2-
Stimulation von Makrophagen verwendet und Diphenyleneiodoniumchlorid (DPI) diente als
NOX2-Inhibitor. Die Ergebnisse zeigen, dass KCN und Myxothiazol effektiv die
mitochondriale Atmung hemmen, während PMA auch nach Hemmung der Mitochondrien
noch NOX2 stimulieren kann. LtP erhöhten den Sauerstoffverbrauch der J774 Zellen ähnlich
wie PMA durch eine Aktivierung der NOX2. Noch höhere Sauerstoffverbrauchsraten wurden
in J774 Suspensionen beobachtet, die 30 Minuten mit LtP vorinkubiert wurden, um den LtP
genug Zeit für eine Bindung oder eine Internalisierung zu geben. Das könnte auf eine LtP-
induzierte NOX2-Stimulation hinweisen, weil DPI, Superoxiddismutase und Katalase diesen
Anstieg des Sauerstoffverbrauchs teilweise wieder reduzieren konnten.
Zusammenfassend geben die Sauerstoffverbrauchsmessungen an Makrophagen einen
zusätzlichen Einblick in Prozesse, die während der frühen Infektionsphasen stattfinden, was
von fundamentaler Bedeutung für die Entwicklung neuer Medikamente gegen Leishmanien
ist.
48
7 ABBREVIATIONS
ATP adenosine triphosphate
BHI brain heart infusion
BSA bovine serum albumin
CAT catalase
DMEM Dulbecco’s modified eagle medium
DMSO dimethyl sulfoxide
DPI diphenyleneiodonium chloride
FCS foetal calf serum
HO-1 heme oxygenase-1
IFNγ interferon-γ
IL interleukin
LPG lipophosphoglycan
LtP Leishmania tarentolae promastigotes
MAPKs mitogen-activated protein kinases
MSP major surface protease
Myx myxothiazol
NADH nicotinamide adenine dinucleotide, reduced
NADPH nicotinamide adenine dinucleotide phosphate, reduced
NFκB nuclear factor-κB
NOX2 NADPH oxidase
OD optical density
PAMPs pathogen-associated molecular patterns
PBS phosphate-buffered saline
PKC protein kinase C
PMA phorbol 12-myristate 13-acetate
PRRs pattern recognition receptors
ROS reactive oxygen species
SEM standard error of mean
SOCS suppressors of cytokine signaling
SOD superoxide dismutase
STAT signal transducer and activator of transcription
TNF tumor-necrosis factor
49
8 LIST OF FIGURES
Figure 1: Mitochondrial oxygen consumption and its selective inhibitors: Mitochondrial
complexes I-IV are located in the inner mitochondrial membrane and transport electrons
donated from NADH and succinate along the electron transport chain. At complex IV,
electrons finally reduce molecular oxygen to water. ....................................................... 5
Figure 2: Oxidative burst of macrophages is accompanied with increased non-mitochondrial
oxygen uptake and production of superoxide radical anions. phorbol 12-myristate 13-
acetate can artificially stimulate NADPH oxidase (NOX2) via an activation of protein
kinase C (PKC). ............................................................................................................. 6
Figure 3: NADPH oxidase of phagocytes (NOX2) is activated following association of
cytosolic subunits (p47phox, p40phox, and p67phox) and GTPase Rac with the membrane-
bound cytochrome consisting of gp91phox and p22phox. After assembly, superoxide
radicals are produced and, subsequently, other reactive oxygen species like hydrogen
peroxide can be formed (modified according to Singel and Segal 2016). ....................... 8
Figure 4: Leishmania life cycle, where the promastigotic form of the parasite is translocated
to the mammalian host by a blood meal of the insect vector, the sandfly. There it resides
and replicates in macrophagal phagolysosomes as amastigotic form until the parasite is
taken up by another blood meal of the next sandfly. ..................................................... 11
Figure 5: J774A.1 macrophages loaded on a Thoma counting chamber with a 40 x
magnification. The dimension of the image was 1.1625 mm vertically and 1.55 mm
horizontally, resulting in an area of 1.8019 mm². .......................................................... 17
Figure 6: Calibration of oxygen electrode with air-saturated deionized water (214 µM oxygen)
at 37 °C, where a few grains of sodium dithionite were added (0 µM oxygen). ............. 21
Figure 7: Relation of protein content to cell count of J774 suspension in PBS. Data represent
means of 23 independent cell suspensions that were analyzed in duplicate. ................ 22
Figure 8: Representative oxygen consumption curve of 3.003 106 J774 cells/ml PBS
supplemented with 10 mM glucose (final concentrations) in the absence and presence
of phorbol myristate acetate (5 µM, 0.155 % DMSO, final concentrations) and
myxothiazol (1 µM, 0.2 % DMSO, final concentrations). ............................................... 23
Figure 9: Representative oxygen consumption curve of 2 106 J774 cells/ml PBS
supplemented with 10 mM glucose (final concentrations) in the absence and presence
50
of phorbol myristate acetate (5 µM, 0.155 % DMSO, final concentrations) and
diphenyleneiodonium (0.625 µM, 0.031 % DMSO, final concentrations). ..................... 24
Figure 10: Effects of potassium cyanide (KCN, 1 mM, final concentrations) and PMA (5 µM,
0.155 % DMSO, final concentrations) on oxygen consumption of J774 cells. 2.35 ± 0.18
106 J774 cells/ml PBS supplemented with 10 mM glucose (final concentrations) were
used for measurements. Data represent means ± SEM of four independent
experiments. * and ** indicate significant differences to the controls at the level of
p < 0.05 and 0.01, respectively (paired t-test). .............................................................. 25
Figure 11: Effects of PMA (5 µM, 0.155 % DMSO, final concentrations) and myxothiazol
(Myx, 1 µM, 0.2 % DMSO, final concentrations) on oxygen consumption of J774 cells.
2.06 ± 0.26 106 J774 cells/ml PBS supplemented with 10 mM glucose (final
concentrations) were used for measurements. Data represent means ± SEM of
five independent experiments. * indicates significant differences to the controls at the
level of p < 0.05 (paired t-test). ..................................................................................... 26
Figure 12: Effects of PMA, SOD, and catalase (CAT) on oxygen consumption of J774 cells.
2.35 ± 0.18 106 J774 cells/ml PBS supplemented with 10 mM glucose and 5 µM PMA
(0.155 % DMSO), 20 µg SOD/ml, and 1000 U catalase/ml were used (final
concentrations). Data represent means ± SEM of four independent experiments. *
indicates significant differences to the controls at the level of p < 0.05 (paired t-test). #
and ## indicate significant differences to the PMA-treated J774 cells at the level of
p < 0.05 and 0.01, respectively (paired t-test). .............................................................. 28
Figure 13: Inhibition of mitochondrial oxygen consumption of J774 macrophages by 0-5 µM
DPI (0-0.25 % DMSO, final concentrations). 2.32 ± 0.15 106 J774 cells/ml PBS
supplemented with 10 mM glucose (final concentrations) were used for measurements.
Data represent means ± SEM of three to five independent experiments. *, ** and ***
indicate significant differences to 0 µM DPI at the level of p < 0.05, 0.01 and 0.001,
respectively (unpaired t-test). ....................................................................................... 29
Figure 14: Effects of PMA and DPI on oxygen consumption of J774 macrophages. 2.41 ±
0.29 106 J774 cells/ml PBS supplemented with 10 mM glucose (final concentrations)
were studied in the absence (0 µM DPI containing 0.0625 % DMSO as solvent control)
and presence of 0.315-1.25 µM DPI (0.0157-0.0625 % DMSO, final concentrations),
supplemented afterwards with 5 µM PMA (0.155 % DMSO, final concentrations). Data
51
represent means ± SEM of five independent experiments. * and ** indicate significant
differences before and after the addition of PMA at the level of p < 0.05 and 0.01,
respectively (paired t-test). ........................................................................................... 30
Figure 15: Effects of DPI (0.625 µM, 0.031 % DMSO, final concentrations) and PMA (5 µM,
0.155 % DMSO, final concentrations) on oxygen consumption of J774 cells. 2.35 ± 0.18
106 J774 cells/ml PBS supplemented with 10 mM glucose (final concentrations) were
used for measurements. Data represent means ± SEM of four independent
experiments. * and ** indicate significant differences to the controls at the level of
p < 0.05 and 0.01, respectively (paired t-test). # indicates significant differences to the
PMA-treated J774 cells at the level of p < 0.05 (paired t-test). ..................................... 31
Figure 16: Oxygen consumption of J774 cells (2 106 J774 cells/ml) around 0.5 hours and
7.5 hours after washing with PBS. J774 cells were washed in PBS and stored at room
temperature until oxygen consumption measurements at 37 °C were started by the
addition of 10 mM glucose (final concentration), followed by the addition of PMA (5 µM,
0.155 % DMSO, final concentrations) and DPI (0.625 µM, 0.031 % DMSO, final
concentrations). Data represent means ± SEM from six independent experiments. *, **
and *** indicate significant differences to the controls at the level of p < 0.05, 0.01 and
0.001, respectively (paired t-test). ## and ### indicate significant differences to the PMA-
treated J774 cells at the level of p < 0.01 and 0.001, respectively (paired t-test). ......... 33
Figure 17: Effects of Leishmania (20 106 LtP/ml) on oxygen consumption of J774 cells
(2 106 J774 cells/ml) in PBS supplemented with glucose (10 mM, final concentrations).
Myxothiazol (20 µM, 0.2 % DMSO, final concentrations) was added to inhibit
mitochondrial respiration of J774 cells and LtP. PMA (5 µM, 0.155 % DMSO, final
concentrations) served as positive control (A) in the assessment of activation of
macrophagal NOX2 by LtP (B). Data represent means ± SEM from four independent
experiments. * and ** indicate significant differences to the control J774 cells or
PBS/glucose at the level of p < 0.05 and 0.01, respectively (paired t-test). # and ##
indicate significant differences to the Myx-containing cell suspensions at the level of
p < 0.05 and 0.01, respectively (paired t-test). .............................................................. 35
Figure 18: Effects of Leishmania (20 106 LtP/ml) on oxygen consumption of J774 cells
(2 106 J774 cells/ml) in PBS supplemented with glucose (10 mM, final concentrations).
DPI (0.625 µM, 0.031 % DMSO, final concentrations) was added to inhibit NOX2 of
52
J774 cells. PMA (5 µM, 0.155 % DMSO, final concentrations) served as positive control
(A) in the assessment of activation of macrophagal NOX2 by LtP (B). Data represent
means ± SEM from four independent experiments. * indicates significant differences to
the control J774 cells or PBS/glucose at the level of p < 0.05 (paired t-test). # indicates
significant differences to cell suspensions before DPI addition at the level of p < 0.05
(paired t-test). ............................................................................................................... 36
Figure 19: Measurement of oxygen consumption after a preincubation of J774 cells
(2 106 J774 cells/ml) and/or Leishmania (20 106 LtP/ml) for 30 min at 37 °C in
PBS/10 mM glucose before and after the addition of DPI (0.625 µM, 0.031 % DMSO,
final concentrations). PMA (5 µM, 0.155 % DMSO, final concentrations) served as
positive control in the assessment of activation of macrophagal NOX2 by LtP. Data
represent means ± SEM from four to six independent experiments. ** and *** indicate
significant differences before and after the addition of DPI at the level of p < 0.01 and
0.001, respectively (paired t-test). # indicates significant differences to untreated J774
cells at the level of p < 0.05 (unpaired t-test). ............................................................... 38
Figure 20: Measurement of oxygen consumption after a preincubation of J774 cells for
30 min at 37 °C in PBS/10 mM glucose before and after the addition of SOD (20 µg/ml,
final concentrations) and catalase (1000 U/ml, final concentrations). Oxygen
consumption of 2 106 J774 cells/ml was stimulated either with 5 µM PMA (0.155 %
DMSO) or 20 106 LtP/ml. Data represent means ± SEM from five independent
experiments. *, ** and *** indicate significant differences before and after the addition of
SOD and catalase at the level of p < 0.05, 0.01 and 0.001, respectively (paired t-test). #
indicates significant differences to untreated J774 cells at the level of p < 0.05 (unpaired
t-test). ........................................................................................................................... 39
53
9 REFERENCES
Alberts B, Johnson A, Lewis J, Morgan D, Raff M, Roberts K, Walter P. 2015. Molecular
Biology of The Cell. Sixth edition. New York: Garland Science, 766-772.
Banerjee S, Bose D, Chatterjee N, Das S, Chakraborty S, Das T, Das Saha K. 2016.
Attenuated Leishmania induce pro-inflammatory mediators and influence leishmanicidal
activity by p38 MAPK dependent phagosome maturation in Leishmania donovani co-
infected macrophages. Scientific Reports, 6:1–14.
Bernarreggi D, Pouyanfard S, Kaufman DS, Diego S. 2019. Development of innate immune
cells from human pluripotent stem cells. Experimental Hematology, 71:13–23.
Bhunia AK, Sarkar D, Das PK. 1996. Leishmania donovani attachment stimulates PKC-
mediated oxidative events in bone marrow-derived macrophages. Journal of Eukaryotic
Microbiology, 43:373–379.
Bode C, Goebell H, Stähler E. 1968. Zur Eliminierung von Trübungsfehlern bei der
Eiweißbestimmung mit der Biuretmethode. Zeitschrift für klinische Chemie und klinische
Biochemie, 6:418–422.
Davies LC, Taylor PR. 2015. Tissue-resident macrophages: then and now. Immunology,
144:541–548.
Dettmer U, Folkerts M, Kunisch R, Lantermann A, Schindler E, Sönnichsen A. 2013.
Kurzlehrbuch Biochemie. 1. Auflage. München: Elsevier Urban & Fischer, 147-148.
Fritsche C. 2008. Untersuchungen zur optimalen Kultivierung von Leishmania tarentolae
[Dissertation]. Halle-Wittenberg: Martin-Luther-Universität.
Geroldinger G, Rezk M, Idris R, Gruber V, Tonner M, Moldzio R, Staniek K, Monzote L, Gille
L. 2019. Techniques to study phagocytosis and uptake of Leishmania tarentolae by
J774 macrophages. Experimental Parasitology, 197:57–64.
Gruber V-E. 2015. Cell culture of Leishmania tarentolae and its application [Bachelor thesis].
Vienna: University of Veterinary Medicine Vienna.
Hancock JT, Jones OTG. 1987. The inhibition by diphenyleneiodonium and its analogues of
superoxide generation by macrophages. Biochemical Journal, 242:103–107.
Herrero A, Barja G. 1997. Sites and mechanisms responsible for the low rate of free radical
production of heart mitochondria in the long-lived pigeon. Mechanisms of Ageing and
54
Development, 98:95–111.
James PE, Grinberg OY, Swartz HM. 1998. Superoxide production by phagocytosing
macrophages in relation to the intracellular distribution of oxygen. Journal of Leukocyte
Biology, 64.
Kayashima K, Onoue K, Nakagawara A, Minakami S. 1980. Superoxide activities of
macrophages as studied by using cytochalasin E and lectins as synergistic stimulants
for superoxide release. Microbiology and Immunology, 24:449–461.
Kaye P, Scott P. 2011. Leishmaniasis: complexity at the host – pathogen interface. Nature
Reviews Microbiology, 9:604–615.
La Flamme AC, Kahn SJ, Rudensky AY, Van Voorhis WC. 1997. Trypanosoma cruzi-
infected macrophages are defective in major histocompatibility complex class II antigen
presentation. European Journal of Immunology, 27:3085–3094.
Lepoivre M, Tenu J, Petit J. 1982. Transmembrane potential variations accompanying the
PMA-triggered 02 and H202 release by mouse peritoneal macrophages. FEBS Letters,
149:233–239.
Lodge R, Descoteaux A. 2006. Phagocytosis of Leishmania donovani amastigotes is Rac1
dependent and occurs in the absence of NADPH oxidase activation. European Journal
of Immunology, 36:2735–2744.
McCord JM, Fridovich I. 1969. Superoxide dismutase. An enzymic function for erythrocuprein
(hemocuprein). The Journal of Biological Chemistry, 244:6049–6055.
Meinhardt SW, Crofts AR. 1982. The site and mechanism of action of myxothiazol as an
inhibitor of electron transfer in Rhodopseudomonas sphaeroides. FEBS Letters,
149:217–222.
Mitchell G, Chen C, Portnoy DA. 2016. Strategies used by bacteria to grow in macrophages.
Microbiology Spectrum, 4:1–22.
Monzote L, Lackova A, Staniek K, Steinbauer S, Pichler G, Jäger W, Gille L. 2016. The
antileishmanial activity of xanthohumol is mediated by mitochondrial inhibition.
Parasitology, 144:747–759.
Mosser DM, Edwards JP. 2008. Exploring the full spectrum of macrophage activation. Nature
Reviews Immunology, 8:958–969.
55
Murphy K, Weaver C. 2018. Janeway Immunologie. 9. Auflage. Berlin: Springer-Verlag
GmbH Deutschland, 7-15.
Rist RJ, Naftalin RJ. 1993. Glucose- and phorbol myristate acetate-stimulated oxygen
consumption and superoxide production in rat peritoneal macrophages is inhibited by
dexamethasone. Biochemical Journal, 291:509–514.
Saha S, Basu M, Guin S, Gupta P, Mitterstiller A, Weiss G, Jana K, Ukil A. 2019. Leishmania
donovani exploits macrophage heme oxygenase-1 to neutralize oxidative burst and TLR
signaling-dependent host defense. The Journal of Immunology, 202:827–840.
Singel KL, Segal BH. 2016. NOX2-dependent regulation of inflammation. Clinical Science
(London), 130:479–490.
Srivastav S, Ball WB, Gupta P, Giri J, Ukil A, Das PK. 2014. Leishmania donovani prevents
oxidative burst-mediated apoptosis of host macrophages through selective induction of
suppressors of cytokine signaling (SOCS) proteins. The Journal of Biological Chemistry,
289:1092–1105.
Taylor VM, Munoz DL, Cedeno DL, Velez ID, Jones MA, Robledo SM. 2010. Leishmania
tarentolae: Utility as an in vitro model for screening of antileishmanial agents.
Experimental Parasitology, 126(4):471–475.
Van Assche T, Deschacht M, da Luz I, Maes L, Cos P. 2011. Leishmania-macrophage
interactions: Insights into the redox biology. Free Radical Biology & Medicine, 51:337–
351.
Yaseen R, Blodkamp S, Lüthje P, Reuner F, Völlger L, Naim HY, Von Köckritz-Blickwede M.
2017. Antimicrobial activity of HL-60 cells compared to primary blood-derived
neutrophils against Staphylococcus aureus. Journal of Negative Results in Biomedicine,
16:1–7.
56
10 ACKNOWLEDGEMENTS
First, I want to deeply thank my supervisor Prof, Katrin Staniek for being immensely
supportive, encouraging, and patient throughout this work. I really appreciate the nice
workplace she created but also that she shared her experience, knowledge, and time so
generously.
I also want to express my gratitude to Prof. Lars Gille who shared his expertise, and his
bachelor student Lara Näglein who created a nice working atmosphere.
Moreover, the financial support for this work by the Austrian Science Fund (FWF) under
grant P 27814-B22 is acknowledged.
Finally, I want to thank Rudolf Moldzio for giving constructive feedback and for the time he
shared to discuss the content of this bachelor thesis. His helpful advice has been much
appreciated.
Related Documents