1 JFE Group Growth Strategy November 30, 2010 Hajime Bada, President and CEO JFE Holdings, Inc. Securities code: 5411

Welcome message from author
This document is posted to help you gain knowledge. Please leave a comment to let me know what you think about it! Share it to your friends and learn new things together.
Transcript
1
JFE Group Growth Strategy
November 30, 2010
Hajime Bada, President and CEO
JFE Holdings, Inc.
Securities code: 5411

2
Table of Contents
1. JFE Key Facts page 3
2. JFE Steel’s Overall Strengths page 7
3. JFE Steel’s Technological Strengths page 11
4. JFE Steel’s Growth Strategies page 19
5. Results Forecast for FY 2010 page 34
This presentation material is not a disclosure document based on the Financial Instruments and Exchange Act, and neither its accuracy nor integrity are ensured. Forecasts made in this material are based on information available at the time of this investor meeting and may include uncertainties. Please refrain from making any investment decision based solely on this material. The company does not assume any responsibility for any loss resulting from the use of this material.

3
1. JFE Key Facts
JFE Key Facts
1. JFE Key Facts
4
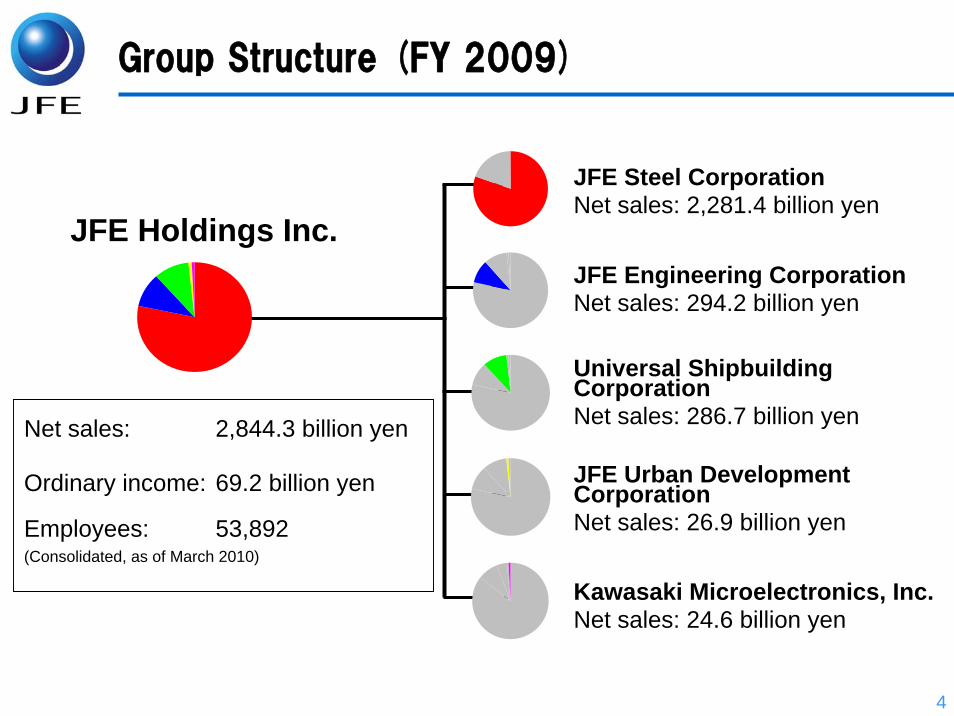
JFE Holdings Inc.
Net sales: 2,844.3 billion yen
Ordinary income: 69.2 billion yen
Employees: 53,892 (Consolidated, as of March 2010)
JFE Steel CorporationNet sales: 2,281.4 billion yen
JFE Engineering CorporationNet sales: 294.2 billion yen
JFE Urban Development CorporationNet sales: 26.9 billion yen
Kawasaki Microelectronics, Inc.Net sales: 24.6 billion yen
Universal Shipbuilding CorporationNet sales: 286.7 billion yen
Group Structure (FY 2009)

5
Upward-trending Output and Results
26.48 27.01 27.65 26.72 29.04
30.52
26.55 25.83 29.00
33.00
20.00
25.00
30.00
35.00
FY 02 FY 03 FY 04 FY 05 FY 06 FY 07 FY 08 FY 09 FY 10 FY 11
104.7 218.4
460.6 517.3 513.5 502.9 400.5
69.2 220
0100200300400500600
FY 02 FY 03 FY 04 FY 05 FY 06 FY 07 FY 08 FY 09 FY 10
Production: Crude Steel Production
Profit: Ordinary Income(Target)
(million tons)
(billion yen)

6
Four Key Challenges
Technological evolution looking to 2020Development of business in AsiaDevelopment of environmental and energy businessBalancing financial base versus long-term investment
The JFE Group is addressing four key challenges in response to major developments following the global economic crisis, particularly downturns in developed economies including Japan and the robust recovery of emerging economies centered on Asia.
7
2. JFE Steel’s Overall Strengths2. JFE Steel’s Overall Strengths
8
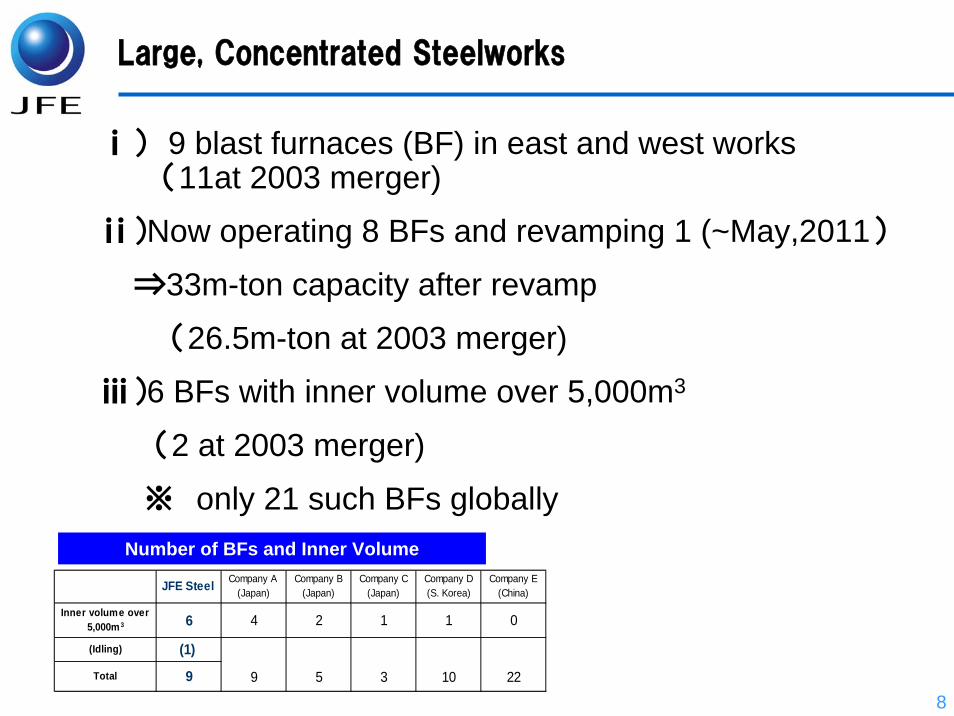
Large, Concentrated Steelworks
Number of BFs and Inner Volume
JFE Steel Company A(Japan)
Company B(Japan)
Company C(Japan)
Company D(S. Korea)
Company E(China)
Inner volume over5,000m3 6 4 2 1 1 0
(Idling) (1)
Total 9 9 5 3 10 22
ⅰ) 9 blast furnaces (BF) in east and west works (11at 2003 merger)
ⅱ)Now operating 8 BFs and revamping 1 (~May,2011)
⇒33m-ton capacity after revamp
(26.5m-ton at 2003 merger)
ⅲ)6 BFs with inner volume over 5,000m3
(2 at 2003 merger)
※ only 21 such BFs globally
9
ContractCustomers
61%
Dealers11%
GroupCompanies/Allied
SecondaryProcessing
makers28%
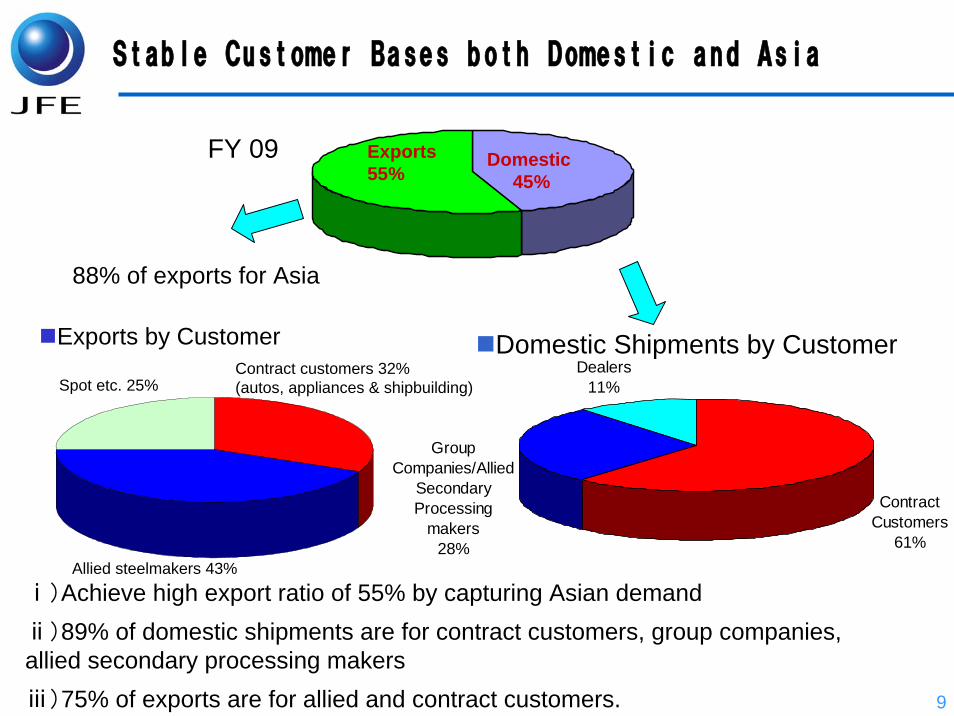
FY 09
Domestic Shipments by Customer
Stable Customer Bases both Domestic and Asia
Exports by Customer
Allied steelmakers 43%
Contract customers 32%(autos, appliances & shipbuilding)Spot etc. 25%
Domestic45%
Exports 55%
88% of exports for Asia
ⅰ)Achieve high export ratio of 55% by capturing Asian demand ⅱ)89% of domestic shipments are for contract customers, group companies, allied secondary processing makers ⅲ)75% of exports are for allied and contract customers.

10
Expansion of shipments to Allied Steelmakers
Shipments to Allied Steelmakers (in thousand ton)
Shipments to allied steelmakers, following a temporary decrease due to the global economic crisis triggered by the collapse of Lehman in FY2008, continue to increase as the company captured growing demand for high-end steel in Asian markets.
3000
3500
4000
4500
5000
5500
FY20
03
FY20
04
FY20
05
FY20
06
FY20
07
FY20
08
FY20
09
FY20
10(e
)
11
3. JFE Steel’s Technological Strengths

12
Increasing Needs for High-end Steel
The demand for quality will continue to rise:
• More safety• More comfort• More cost reduction• More energy efficiency• More advanced (frontier) energy
Customers will increasingly demand high-end steel for sophisticated quality needs, sometimes even seemingly contradictory needs (ex., high strength and high formability) .

13
0
20
40
60
80
100
120
2010 11 12 13 14 15 16 17 18 19 20
Automobiles
Packages
ElectricalappliancesShipbuilding
Petroleum gas
Asia’s High-end Steel Market GrowthAdditional demand 33 million tons by 2020
Additional demand by 2020: 33 million tons Shares: Automobiles 13 million tons, petroleum gas 10 m/t, electrical appliances 7 m/t, and shipbuilding 3 m/t
(million tons)
14
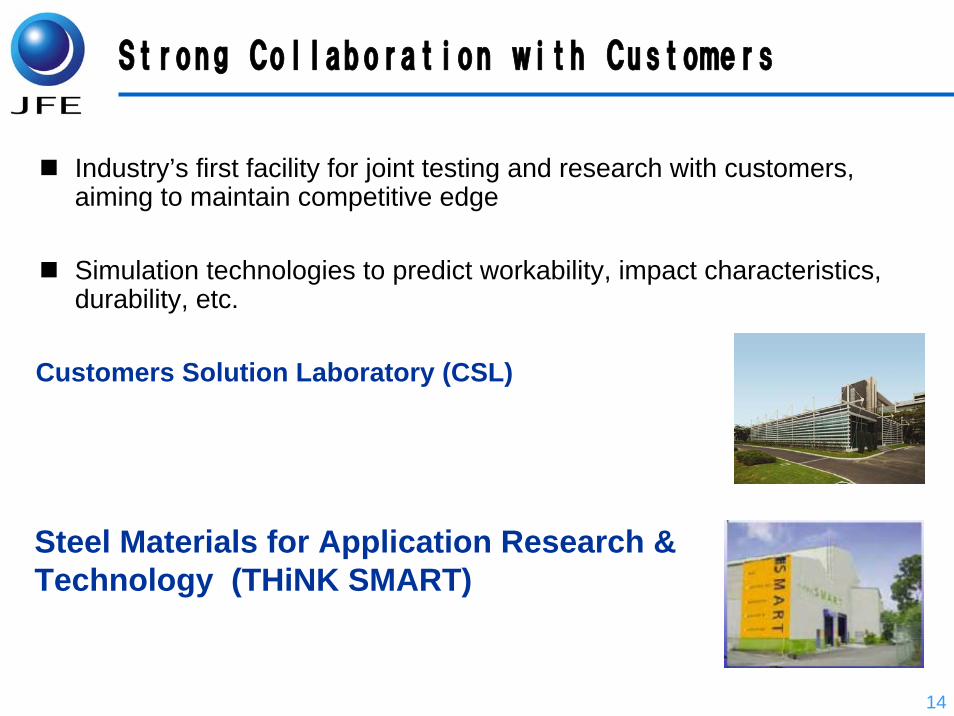
Strong Collaboration with Customers
Customers Solution Laboratory (CSL)
Steel Materials for Application Research & Technology (THiNK SMART)
Industry’s first facility for joint testing and research with customers, aiming to maintain competitive edge
Simulation technologies to predict workability, impact characteristics, durability, etc.

15
Our studies show that JFE product’s high formability is superior to Competitors’ products at all strength levels.
Elon
gati
on:
EL(%
)
Tensile strength: TS (MPa)
Strength
Form
abilit
y
Quality of products depends on balance between the strength and formability(elongation)
JFE products
CompanyX products(JFE estimate)
Superior Materials: High-tensile Steel (Automotive Steel Sheet)

16
JFE Automotive Steel Sheet is Used Worldwide
■JFE Steel’s steel sheet technology is used in 12% of all automobiles produced worldwide.
- Among Japanese autos, more than 25% worldwideand 35% in Asia-Oceania region.
※JFE Steel’s steel sheet consists of that shipped from JFE and JFE-licensed alliance partners overseas.
■Automakers rate JFE Steel highly for - Advanced technologies
- Sophisticated business capabilities ・ Early vendor involvement ・ Dependable deliveries
・ Skilled sales force■Our advantages will increase with the rise of new demand for
hybrid automobiles and electric-motor automobiles whichneed high-end electrical steel sheets for their motors.
※

17
World’s first completely continuous high-end plate production process
Plate Manufacturing Line
Rolling Quenching Tempering
Cooling bedSuper-OLAC
Hot levelerFinishing train
HOPRougher
Furnace for slab
Super-OLAC
○High speed cooling technology
⇒Achieve the same level of cooling
speed as that of sheet
○Homogeneous cooling technology
⇒Halve the dispersion (60 to 27Mpa)
HOP
○Induction heating system
⇒Enhance efficiency on tempering
Heating speed :70× faster (0.15 to 10℃/s )
○Uniform temperature control
⇒Increase temperature accuracy to ±10℃
Achieving large scale cut in production term (1/20th)
Saves energy and reduces inventories
18
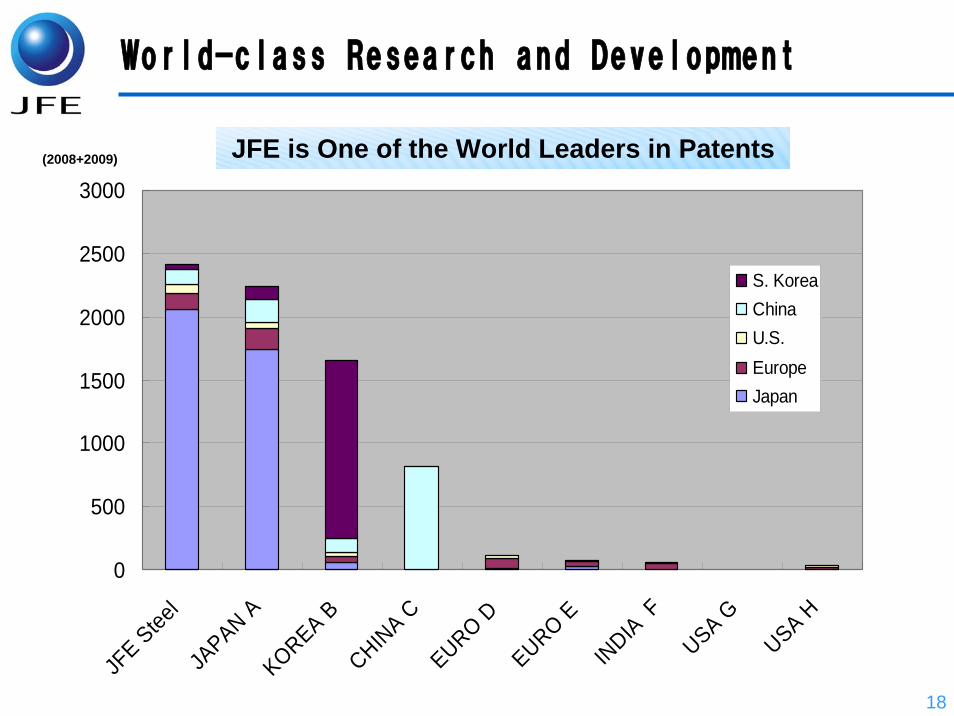
World-class Research and Development
JFE is One of the World Leaders in Patents
0
500
1000
1500
2000
2500
3000
JFE Stee
lJA
PAN AKOREA B
CHINA C
EURO DEURO EIN
DIA F
USA G
USA H
S. KoreaChinaU.S.EuropeJapan
(2008+2009)
19
4. JFE Steel’s Growth Strategies

20
Emerging Countries’ Growing Use of Steel
Apparent Crude Steel Consumption per Person
1964Tokyo
Olympics
1970OsakaExpo
Japan 447
1988Seoul
Olympics
S. Korea
974.1
China
2010Shanghai
Expo
2008Beijing
Olympics 422.1
India49.80
200
400
600
800
1000
1200
1400
50 55 60 65 70 75 80 85 90 95 2000 05
Cru
de S
teel
Con
sum
ptio
n (k
g/ p
er p
erso
n)
JapanS. KoreaChinaIndia
Lehmancrash
• Chinese and Japanese consumption are equal• Potential increase in India
21
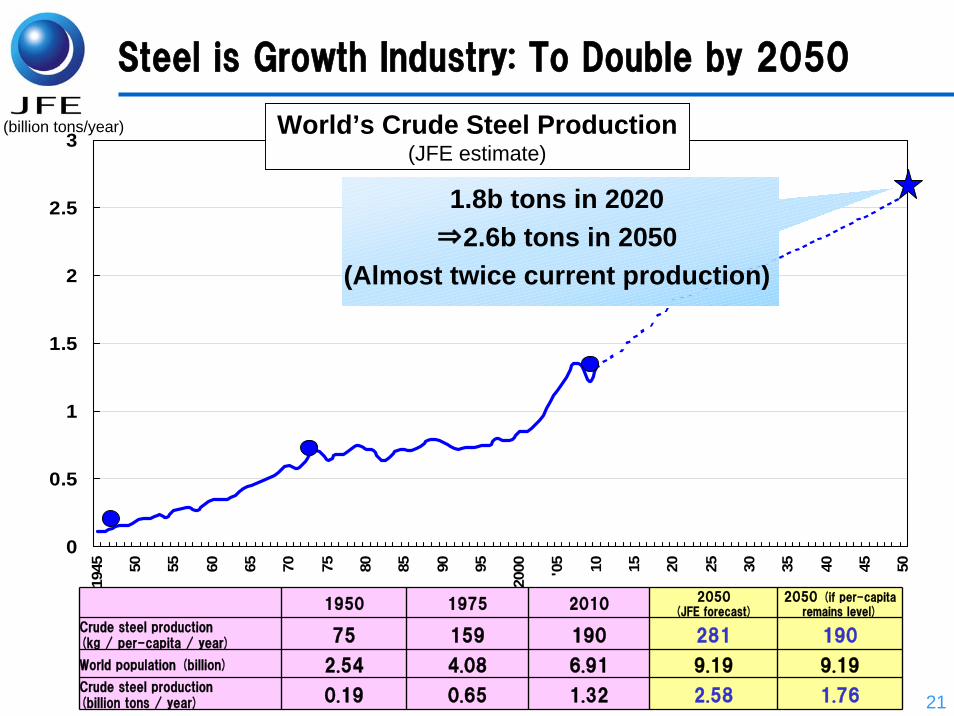
Steel is Growth Industry: To Double by 2050
0
0.5
1
1.5
2
2.5
3
1945 50 55 60 65 70 75 80 85 90 95
2000 '05 10 15 20 25 30 35 40 45 50
(billion tons/year) World’s Crude Steel Production (JFE estimate)
1950 1975 20102050
(JFE forecast)2050 (if per-capita
remains level)
Crude steel production(kg / per-capita / year) 75 159 190 281 190
World population (billion) 2.54 4.08 6.91 9.19 9.19Crude steel production(billion tons / year) 0.19 0.65 1.32 2.58 1.76
1.8b tons in 2020⇒2.6b tons in 2050
(Almost twice current production)

22
2001 20090
100(%)
60
40
80
Middle Class Drives High-end Steel Demand
20
Poor
Middle
The Indian middle class is driving high-end steel demand through its growing consumption of the 3Cs (cars, [air]coolers and color TVs), the same phenomenon seen in Japan’s “economic miracle” era in the 1960s.
Example: Growing ratio of India’s middle-class populationWealthy

23
China(10.25 mil tons)
South Western Asia(5.40 mil tons)
Middle and Near East(6.63 mil tons)
Hot-rolledsheet
Cold-rolledsheet
Plate
Regional Import Volumes in 2009(see legend)
2.56
1.23
2.84
0.58
1.393.42
Export Expansion Focusing on Asia
3.51
3.71
5.56
East Asia(12.78 mil tons)
10.25
3.13
12.78
4.25
5.4
6.63
0
5
10
15
20
25
30
35
Total imports Exports fromJapan
35.06 mil tons 8.32 mil tons
China
Middle and Near East
South Western Asia
East Asia
Legend
3.96
0.94
5.35
Total imports are smaller than the exports from Japan.

24
Develop Business Models that Respond to Each Market
Localization
Distance from Japan
S. Korea China ThailandEast
AsiaIndia
Middle East
North America
South America
Europe
Exports
Vertical Alliances
(Export semi-
finished goods)
Dongkuk
HyundaiHysco
Tongbu
GJSS
Tin Plate Mill
TCR
TCS
JSG
Tin Plate Mill CSI
Tin Plate Mill
Localization
Study feasibility of integrated steel work projects
AK Steel
Study feasibility of slab projects
Technological
Alliances
Dongkuk
HyundaiHysco
AK Steel
(USS)
TKS
GMH
(JSW)
Expand Sales

25
For 33 million tons capacity (9 BFs)
Production IncreaseRaise production from 29 million tons in 2010 (8 blast furnaces) to about 33 million tons (9 blast furnaces) from 2011⇒+3.5 million tons increase in exports
Export IncreaseHigh-end products for autos, ships, electrical appliances, etc.:increase of 33 million tons over 10 yearsCustomized commodity-grade steel
StrategiesLeverage strengths of partner trading companies in specific countriesStrengthen established relationships and develop new alliancesStrengthen relationships with core rerollers
26
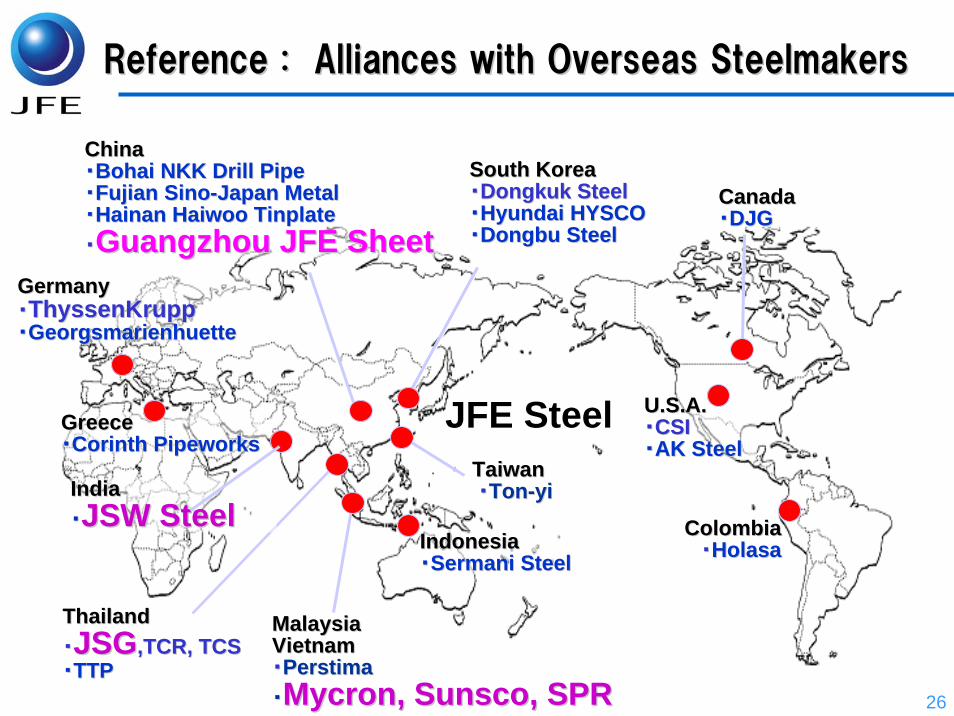
Reference : Alliances with Overseas SteelmakersReference : Alliances with Overseas SteelmakersReference : Alliances with Overseas Steelmakers
GreeceGreece・・Corinth Corinth PipeworksPipeworks
CanadaCanada・・DJGDJG
U.S.A.U.S.A.・・CSICSI・・AK SteelAK Steel
South Korea・Dongkuk Steel・Hyundai HYSCO・Dongbu Steel
South KoreaSouth Korea・・DongkukDongkuk SteelSteel・・Hyundai HYSCOHyundai HYSCO・・DongbuDongbu SteelSteel
JFE SteelJFE Steel
ThailandThailand・・JSGJSG,,TCR, TCSTCR, TCS・・TTPTTP
ColombiaColombia・・HolasaHolasaIndonesiaIndonesia
・・SermaniSermani SteelSteel
MalaysiaMalaysia Vietnam Vietnam ・・PerstimaPerstima・・MycronMycron, , SunscoSunsco, SPR, SPR
GermanyGermany・・ThyssenKruppThyssenKrupp・・GeorgsmarienhuetteGeorgsmarienhuette
ChinaChina・・BohaiBohai NKK Drill PipeNKK Drill Pipe・・Fujian SinoFujian Sino--Japan MetalJapan Metal・・Hainan Hainan HaiwooHaiwoo TinplateTinplate・・Guangzhou JFE SheetGuangzhou JFE Sheet
Taiwan Taiwan ・・TonTon--yiyiIndiaIndia
・・JSW SteelJSW Steel
27
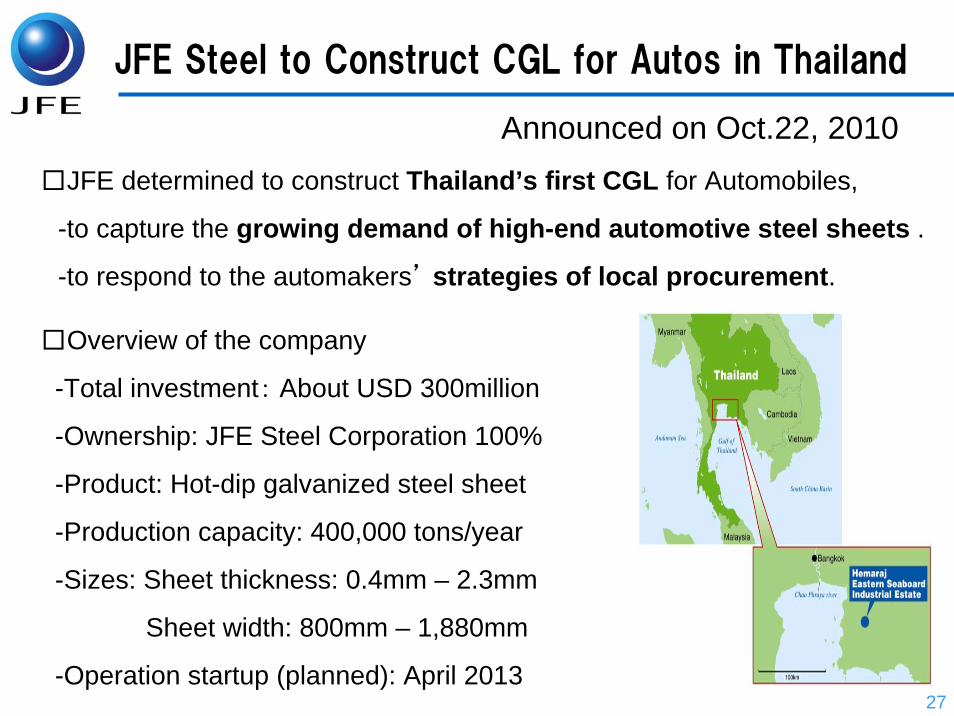
□JFE determined to construct Thailand’s first CGL for Automobiles,
-to capture the growing demand of high-end automotive steel sheets .
-to respond to the automakers’ strategies of local procurement.
□Overview of the company
-Total investment: About USD 300million
-Ownership: JFE Steel Corporation 100%
-Product: Hot-dip galvanized steel sheet
-Production capacity: 400,000 tons/year
-Sizes: Sheet thickness: 0.4mm – 2.3mm
Sheet width: 800mm – 1,880mm
-Operation startup (planned): April 2013
Hemaraj Eastern Seaboard Industrial
Announced on Oct.22, 2010
JFE Steel to Construct CGL for Autos in Thailand

28
Equipment Shipments(operating) (1,000t/p.a.)
High-end SteelAuto (GA) 600
400Under Construction Electric (GI) 200
Auto (CRC) 500
1,800 400 Electric (CRC) 200
CRC 200
900
CAL
PL-TCM No.2 CGL
No.1 CGL
Expansion of Capacity in Guangzhou, China
Guangzhou JFE Steel Sheet (JFE ownership: 50%)Phase 2: Construction start from Oct.,2007. Operation start in FY2011
Providing HRC
JFE Steel

29
JFE STEEL & JSW STEEL COME TOGETHER IN A STRATEGIC COLLABORATION
Announced on Jul. 27th ,2010
(A) Collaboration for Automotive Steel Production:・ Supply of substrate materials for hot rolled, cold rolled and galvanized products.・Joint service activities including application engineering and product
development for automotive customers.
(B) Further Collaboration in the near future: ・Production of steel products other than automotive steel. ・Saving energy ・Quality and yield improvement programs
・Performance audit of JSW facilities・Benchmarking of techno-economic parameters between the parties・JFE’s shareholding of JSW

30
JFE has determined to acquire Jeong An Vina Co to capture the strong demand for construction steel pipe especially in Vietnam where many projects for ports, railways and other major infrastructures are being launched.
Company OverviewShare: JFE Steel 35%, Maruichi Steel Tube 35%, Toyota Tsusho 30%
Total investment:18 billion Korean won (about 1.3billion Yen)
Production capacity: 50,000 tons/year
Facilities: Spiral steel pipe production
Coating
Products: Steel pipe pile
Steel pipe sheet pile
JFE Steel Acquires Spiral Steel Pipe Maker in Vietnam
Announced on Nov.15th,2010

31
15%
18%
30%30%
0%
10%
20%
30%
40%
Current FY2011
Ore
Coal
Ex. Ore:Acquired a 6.5% interest in NAMISA in Brazil (‘08)
Ex. Coal: Acquired a 20% interest in new Byerwen Coal in Australia(‘09)
Ex. Ore:Acquired a 6.5% interest in NAMISA in Brazil (‘08)
Ex. Coal: Acquired a 20% interest in new Byerwen Coal in Australia(‘09)
Increasing Self-Sufficiency RatioIncreased from 15% to 18% by acquisition of Australian Coal Mine interests (JFE Shoji Trade announced on Oct. 20, 2010)

32
700 Billion yen is scheduled to spend by FY2011.
・100 Bn for JSW (Completed)・400 Bn for Capex ・200 Bn for prospective investments
-mainly for the mining interests acquisition -remainder for expansion of alliance network
Plan for the Investment and Capex

33
(Appendix)JFE-Group expansion to China
Auto
Tinplate
SMLS pipe
Drum
Resources
Coil center
Bohai NKK Drill Pipe
Pancheng Yihong Pipe
Guangzhou JFE Steel Sheet
Fujian Sino-Japan Metal
Fujian Ton Yi
Hainan Haiwoo Tinplate
Jiangsu Ton Yi
Wuhan Excellent Steel Center
Inner Mongolia ERDOSEJM Manganese Alloy
Named companies: JFE steel equity holding
Non-named companies:JFE Group companies equity holding

34
5. Results Forecast for FY 2010

35
Results Forecast for FY 2010
Improving to three times of FY2009
(billion yen)
FY2009(A) 1H Total
Net Sales 2,844 1,572 3,360
Operating income 89 115 230
Ordinary Income 69 105 220
Net Income 46 46 110
FY2010(e)

36
Financial Forecast for FY10
Sales/Recurring Profit by Business Segment
1H 2H Total 1H 2H(e) Total
Steel Net Sales 1,062 1,219 2,281 1,370 1,531 2,900Ordinary Income ▲ 72 105 32 88 112 200
Engineering Net Sales 117 177 294 105 165 270Ordinary Income 3 11 13 3 5 8
Shipbuilding Net Sales 139 148 287 107 103 210Ordinary Income 10 11 22 13 1 13
Others Net Sales 23 29 52 21 17 38Ordinary Income ▲ 2 ▲ 1 ▲ 3 0 ▲ 1 ▲ 1
Adjustments Net Sales ▲ 34 ▲ 36 ▲ 70 ▲ 30 ▲ 29 ▲ 58Ordinary Income 4 1 5 1 ▲ 1 ▲ 1
Total Net Sales 1,307 1,537 2,844 1,572 1,788 3,360Ordinary Income ▲ 58 127 69 105 115 220
FY2009 FY2010(e)

37
10.5
17.5 26.3
58.570.5
68.8
49.0
0
10
20
30
40
50
60
70
80
FY 03 FY 04 FY 05 FY 06 FY 07 FY 08 FY 09
(billion yen)
Proactive Return to Shareholders
Yield(%) 2.0% 1.6% 3.3% 2.5% 1.7% 2.0% 0.5%
Basic Policy for pay-out ratio is around 25%.
15
45
100
120 120
90
2030
69.7
16.1 16.4 18
23.426.6 25.3
23.2
0
50
100
150
200
FY02 FY03 FY04 FY05 FY06 FY07 FY08 FY09
0
20
40
60
80
Yen/Share
Payout Ratio
Midterm dividend in 2010 :20 yen/share
38
Thank you very much for your kind attention
Related Documents