1 http://dx.doi.org/10.1016/j.fcr.2011.10.009 Field Crops Research (2011) Author version post-print Selection of intermittent drought tolerant lines across years and locations in the reference collection of groundnut (Arachis hypogaea L.) F. Hamidou ab , P. Ratnakumar c , O. Halilou a , O. Mponda d , T. Kapewa e , E. Monyo e , I. Faye f , B. R. Ntare g , S.N. Nigam c , H.D. Upadhyaya c , and V. Vadez c,* a International Crops Research Institute for the Semi-Arid Tropics (ICRISAT), Sahelian Center, BP 12404, Niamey, Niger b Department of Biology, Faculty of Sciences, University Abdou Moumouni, PO Box 10662, Niamey, Niger c International Crops Research Institute for the Semi-Arid Tropics (ICRISAT), Patancheru, Greater Hyderabad 502 324, AP, India d Nalendiele Research Station, Mtwara, Tanzania e Chitedze Research Station, Lilongwe, Malawi f CNRA Bambey, Senegal g ICRISAT Bamako, Mali *Corresponding author: Tel.: +91 40 3071 3463; fax: +91 40 4071 3074 E-mail address: [email protected] (V. Vadez).

j.fcr.2011.10.009 Arachis hypogaea - [email protected]/3925/1/vadez-merged-2011.pdf ... accessions from a composite collection using data on 21 SSR markers ... (Valley Irrigation
Mar 23, 2018
Welcome message from author
This document is posted to help you gain knowledge. Please leave a comment to let me know what you think about it! Share it to your friends and learn new things together.
Transcript
1
http://dx.doi.org/10.1016/j.fcr.2011.10.009
Field Crops Research (2011)
Author version post-print
Selection of intermittent drought tolerant lines across years and locations in the
reference collection of groundnut (Arachis hypogaea L.)
F. Hamidouab, P. Ratnakumarc, O. Haliloua, O. Mpondad, T. Kapewae, E. Monyoe, I.
Fayef, B. R. Ntareg, S.N. Nigamc, H.D. Upadhyayac, and V. Vadezc,*
a International Crops Research Institute for the Semi-Arid Tropics (ICRISAT), Sahelian
Center, BP 12404, Niamey, Nigerb Department of Biology, Faculty of Sciences, University Abdou Moumouni, PO Box
10662, Niamey, NigercInternational Crops Research Institute for the Semi-Arid Tropics (ICRISAT),
Patancheru, Greater Hyderabad 502 324, AP, IndiadNalendiele Research Station, Mtwara, Tanzania
eChitedze Research Station, Lilongwe, MalawifCNRA Bambey, SenegalgICRISAT Bamako, Mali
*Corresponding author: Tel.: +91 40 3071 3463; fax: +91 40 4071 3074
E-mail address: [email protected] (V. Vadez).

2
Abstract
Intermittent drought is the most important yield limiting factor affecting groundnut
(Arachis hypogaea L) production in rain-fed regions of Sub-Saharan Africa and Asia.
Improvement of crop adaptation to drought is needed and this starts by having a thorough
assessment of a large and representative set of germplasm. In this study, 247 lines
belonging to the reference collection of groundnut were assessed under well-watered
(WW) and intermittent water stress (WS) conditions in India and Niger for two years,
following similar experimental protocols. The WS treatment reduced pod yield (31-46%),
haulm yield (8-55%) and the harvest index (1-10%). Besides a strong treatment effect,
yield differences within locations and years, were attributed to both genotypic and
genotype-by-treatment interactions. Pod yield under WW and WS conditions were
closely related in both years (Patancheru, r2 = 0.42 and r2 = 0.50; Sadore, r2 = 0.22 and r2
= 0.23). By contrast, within location and treatment, pod and haulm yields were affected
predominantly by genotype-by-year (G x Y) effects, especially under WS. Within
treatment across locations and years, pod and haulm yields were mostly ruled by
genotypic effects, which allowed identifying a group of entries with contrasting pod yield
across locations under WS. However, genotype and genotype by environment (GGE)
biplot analyses distinguished India from Niger, suggesting that the selection remains
environment-specific and also revealed dissimilarity between years in Niger. A close
relationship was observed between yield and pod growth rate (r2 = 0.51), and partition (r2
= 0.33) under WS conditions, whereas no significant relationship was found between
yield under WS and SCMR, or specific leaf area (SLA). These results showing a close
interaction between the environmental conditions and the genotypic response to
intermittent drought shows the necessity to carefully choose environments that truly
represent target environments. This is an important result in the current breeding context
of marker-assisted recurrent selection or genome-wide selection. This work opens also
new ways for the breeding of drought tolerant groundnut, by bringing new highly
contrasting lines currently used for crossing and deciphering drought adaptation traits to
better understand GxE interactions, while it challenges the relevance of long-time used
surrogates such as SCMR or SLA.
3
Keywords: GxE interaction, yield, traits, mega environment, principal component
analysis, marker-assisted recurrent selection
1. Introduction
Drought is by far the most important factor contributing to crop yield loss in the semi
arid tropics (SAT) characterized by low and erratic rainfall. Therefore, identification of
genotypes that have a better ability to use limited available water is important to enhance
crop productivity in the SAT. Groundnut (Arachis hypogaea L.) is an important food and
cash crop grown mainly under rainfed conditions in the semi arid regions. Unpredictable
and intermittent periods of water deficit commonly occur during its growth period
(Vorasoot et al., 2003). Drought stress has depressive effects on groundnut productivity
(Nageswara Rao et al., 1989; Nautiyal et al, 2002, Nigam et al., 2005, Songsri et al.,
2008). The depressive effect of drought on growth and yield components depends on the
time, the intensity and/or the duration of drought stress (Nautiyal et al., 2002; Nigam et
al., 2005). Intermittent drought, which is an episodic water deficit during plant growth, is
the most prevalent drought type affecting groundnut production in the rain-fed regions of
SAT and remains a major limiting factor in groundnut productivity, evaluated to 500
million US$ every year (Sharma and Lavanya, 2002). Therefore, breeding for drought
adaptation is an important strategy in alleviating drought effects on groundnut
productivity.
There are numerous reports on groundnut response to drought but most studies have
been limited to small numbers of groundnut genotypes (e.g. Vorasoot et al., 2003). Other
studies have used larger number of germplasm (e.g. thirty six, sixty, and one hundred
twenty in Ndunguru et al., 1995; Jongrungklang et al., 2008 and Painawadee et al., 2009)
and revealed a significant genotypic variation in drought tolerance. However, none of
these studies used a structured set of germplasm representative of the genetic variation
available in the germplasm collection. Therefore, our hypothesis is that testing a larger
and representative range of groundnut genotypes could lead to the identification of new
and/or better sources of intermittent drought tolerance for targeted groundnut breeding
4
programs, following the example in other crops (Krishnamurthy et al., 2010). The
germplasm collection of groundnut holds 15,445 accessions and would provide an
adequate resource to identify tolerance sources. To provide a gateway to the germplasm
collection, a mini core collection consisting of 184 accessions (Upadhyaya et al., 2002)
has been developed. More recently, a reference collection of 300 genetically most diverse
accessions from a composite collection using data on 21 SSR markers (Upadhyaya et al.,
2008) has been assembled.
Assessing such a reference collection in different locations (environment) and years is
also an important step in the selection of contrasting entries, especially to determine
whether genotypes showing good performance under drought across locations and
environments is possible, or whether the selection needs to be environment-specific. The
genotype × environment (G×E) interaction in groundnut under drought, as it occurs in
many other crops, indeed complicates selection and slows down the breeding progress
(Wright et al., 1996; Mothilal et al., 2010). However, this has not been done on large and
representative sets of entries in groundnut. It is also critical to carry out an assessment of
genotypes under both fully irrigated conditions and water stress conditions to examine
whether the genotypes’ response interacts with the water regime or whether the yield
under stress is in fact mostly depended on the yield potential. For example, Bidinger and
Mahalakshmi (1987) showed that about half of the pearl millet yield under terminal
drought conditions depended on the yield under controlled conditions. Similar situation
occurred in a salinity tolerance study of chickpea (Vadez et al., 2007). Reflecting the
breeder’s perspective, Blum (1996) and Panthuwan et al., (2002) argue that potential
yield has a large impact on yield only under moderate drought stress conditions, before
stress is severe enough to induce a genotype and environment (GxE) interaction for yield.
Recently, Boontang et al., (2010) reported that for pod yield of groundnut, high potential
under well watered conditions alone gave significant contribution to maintaining high
pod yield under drought. However, Talebi et al., (2009) found that the grain yield under
irrigated conditions was adversely correlated with rain-fed condition and suggested that
high potential yield of wheat under optimal conditions does not necessarily result in
improved yield under stress conditions. So, the question of the significance of a
genotype-by-treatment interaction remains open and needs to be tested in groundnut to

5
guide the breeding objectives. This is particularly important for the current shifts in
breeding, where new approaches such as marker-assisted recurrent selection or genome-
wide selection (MARS, GWS) involve the phenotyping in a fairly limited number of
environments.
The overall objective of the present research was to select genotypes with high
tolerance to intermittent drought. This effort included the following steps: (1) assess the
range of interaction between genotype and water regime; (2) assess the range of
interaction between the genotype and season within treatment and location, and between
the genotype and the location within treatment; (3) identify a set of contrasting material;
(4) identify field-measured traits related to better performance of genotypes under
intermittent drought stress conditions.
2. Material and methods
2.1. Experimental conditions
Two experiments were conducted in the field during the rainy season 2008 and 2009
(between August and December, at a late planting date to avoid the bulk of rains, and so
that there was no rain during the treatment imposition period) at the ICRISAT Sahelian
Centre in (Sadore, Niger, 45 km south of Niamey city, 13° N, 2° E). Other two
experiments were conducted at ICRISAT headquarters (Patancheru, AP, India, 17° 30' N;
78° 16' E; altitude 549 m) between November 2008 and April 2009 and November 2009-
April 2010. In Patancheru, a postrainy planting was used because a late planting in the
rainy season usually exposes the crop to severe groundnut bud necrosis and was then not
reliable. The soils at the ICRISAT Sahelian Centre (ISC) are arenosols (World Reference
Base) with low pH, a very low water holding capacity, low inherent soil fertility and
organic matter content. At ICRISAT headquarters Patancheru (IHQ) the soils used for
growing groundnut are sandy-clay loam Alfisol, with a pH of about 7.0. In both sites,
crops was maintained pest and disease free by regular observations of possible attack and
preventing sprays for the most common pests and diseases.
In Sadore experiments, fertilizer NPK (15-15-15) at a rate of 200 kg ha-1, and farm
yard manure (200 kg ha-1) were incorporated; the field was plowed and irrigated twice
with a one day interval before sowing. Two hundred sixty eight (268) genotypes,
6
including 247 entries of the groundnut reference collection were evaluated in two
consecutive years, referred to as ISC08 and ISC09 trials. Seeds were sown by hand; the
268 entries were planted in 6 replicated plots arranged in an incomplete randomised
block design. Each plot (2m2) contained 2 rows (2m long, 50 cm distance between rows)
and 20 plants per row. Plants were irrigated two times per week with 20 mm of water
using a linear movement system (Valley Irrigation Inc) until drought stress imposition.
Plots were regularly observed for good agronomic control, calcium-ammonium-nitrate
(200 kg ha-1) and gypsum (200 kg ha-1) were applied during pod formation at 60 days
after sowing.
At Patancheru experiments, basal fertilizer single super phosphate (SSP) (375 kg/ha)
was applied before sowing. The field was previously cultivated with pearl millet and
maintained under fully irrigated conditions so that the soil moisture profile was full at the
time of planting. Seeds were also hand planted in 2-row plots of four meters long with 33
cm between rows and 10 cm between plants. In the first and second year, referred to as
IHQ08 and IHQ09 trials, 288 and 320 entries were tested, which included in both cases
258 entries from the reference collection itself including the 247 entries that were tested
in Niger. The experimental design was an Alpha-lattice design with water treatment as
the main factor and genotypes as sub-factors in three replications, with 16 blocks and 19
plots per block in IHQ08 and 16 blocks and 20 plots per block in IHQ09.
2.2. Management of irrigation for treatment application
Crop was maintained fully irrigated until flowering time by providing about 40 mm
weekly. The plants were exposed to intermittent stress from the time to flowering (30-45
days after sowing in Sadore and 40-45 days after sowing in Patancheru until maturity in
both locations. The drought stress was imposed by irrigating drought stress (WS) plots
only once every two times that the well-watered (WW) plots were irrigated. This
consisted in providing a first 40 mm irrigation for all plots (WW and WS) at the time of
flowering. The second irrigation was supplied to the WW plots only based on the
estimated evapotranspiration, about 7 days later. The third irrigation was supplied to all
plots (both WW and WS) and the decision to irrigate was based on a leaf wilting

7
assessment of the WS plots, irrigation being supplied when the wilting score of a
majority of WS plots reached a value of 3. The fourth irrigation was supplied to the WW
only, while the fifth irrigation supplied again to both WW and WS. Therefore, odd
number irrigations were applied to both WW and WS treatments, whereas even number
irrigations were given to WW only and this scheme was followed until maturity. The
scoring of wilting symptoms was recorded early on a visual score of 1-5 where, 1 = no
wilting symptoms, score 2 = few leaves wilted in a few plants from the plot, score 3 = a
majority of plants in a plot have wilted leaves, but none has reached permanent wilting,
score 4 = a minority of plants show at least partial symptoms of permanent wilting and
score 5 = most plants show symptoms of permanent wilting. Dry-down assessment under
controlled imposition of water stress show a score of 3 is reached when the transpiration
of the water stress plants is about 30-40% of the transpiration of the well-watered (WW)
plants, indicative of a substantial stress (Ratnakumar et al., 2009; Bhatnagar-Mathur et
al., 2007). All irrigation provided 40 mm, so that following this irrigation scheme, the
irrigation of WS plots was half of that in the WW plots.
2.3. Measurements
Parameters were measured before and/or during drought stress imposition. These
included time to emergency, time to flowering (50% of the plants started flowering) and
maturity. The SPAD chlorophyll meter reading (SCMR) was recorded using SPAD-502
(Minolta Corp. Ramsey, NJ, USA) in IHQ08 and ISC09 experiments in three plants per
plot and two fully developed leaves per plant. At the same time, the specific leaf area
(SLA) was measured by sampling two most fully developed leaves per plant in three
plants per plot. The leaflet were taken out, leaf area measured, and leaf dry weight
measured after drying for two days in a forced-air oven at 70ºC. To record the maturity
date, 1-2 border plants were randomly picked, pods number was counted and the internal
pod wall was examined. Mature pods are indicated by the blackening of the internal pod
wall (Williams & Drexler, 1981) and when at least, 80% of pods were mature. At Sadore,
the entire two rows per plot were harvested (2.0 m2). At Patancheru, 2 linear meters
within each row were harvested (1.33 m2). The plants were air-dried during one week
8
before pods were separated from the haulms along with some roots that came up with the
pods on lifting. Haulm weights (Hwt) and pod weight (Pwt) were recorded. At Sadore,
crop growth rate (C, kg ha-1 per day), pod growth rate (R, kg ha-1 per day) and
partitioning (p, proportion of dry matter partitioned into pods) were estimated following a
modified procedure from Williams and Saxena (1991) and using five representative
plants per plot:
C = (Hwt + (Pwt ×1.65))/T2), R = (Pwt ×1.65)/(T2-T1-15), P = R/C
Where T2 is the number of days from sowing to harvest, T1 is the number of days from
sowing to flowering and 15 is the number of days between flowering and the start of pod
expansion (Ntare et al., 2001).
Hwt and Pwt were used to determine the total biomass (Bt = Hwt + Pwt x 1.65) and
the pods yield (Yp, t ha-1). Pods weight was multiplied with a correction factor of 1.65
(Duncan et al., 1978) to adjust for the differences in the energy requirement for
producing pod dry matter compared with vegetative part. Harvest index (HI) was
determined as a ratio of adjusted pod weight to total biomass (HI = 1.65*Pwt/Bt).
2.4. Statistical analysis
The results analysed using GENSTAT program version 10 (Genstat, Release 10.1).
The analysis of variance procedure for a linear mixed model was used. The Residual
Maximum Likelihood (ReML) method of Genstat was used to obtain the unbiased
estimate of the variance components and the best linear unbiased predictions (BLUPs) for
the different parameters measured within each treatment, considering genotypes as
random and replications as fixed effects. The significance of the genetic variability
among accessions within treatment was assessed from the standard error of the estimate
of genetic variance σ2g. Two way analyses of variance were also performed to assess the
effects of water treatment (T) and genotype-by-water treatment (GxT) interaction, year
(Y) and genotype-by-year (GxY) interaction, and environment (E) and genotype-by-
environment (GxE) interaction, for the different traits measured. In this case, variation
components involving G were considered as random effects whereas T, Y, E and
replication effects were considered as fixed. The significance of genetic variability across
treatments or of the interaction effect was assessed in a manner similar to the above. The
9
significance of the fixed effects was assessed using the Wald statistic. The purpose of
these different two-way analysis was to assess different possibilities of interactions
between genotypes and either the year (reflecting on possible weather condition
differences), or the environment (reflecting possible soil/field differences).
3. Results
3.1. Water treatment effect, genotype x water treatment interaction (GxT) and range of
mean of yield and its components
The analysis of variance for pod yield, haulm yield and harvest index (HI) of the 268
genotypes grown in Sadore (ISC08 and ISC09) and 288 (IHQ08) and 306 (IHQ09)
genotypes grown in Patancheru under WW and WS treatments are presented in Table 1.
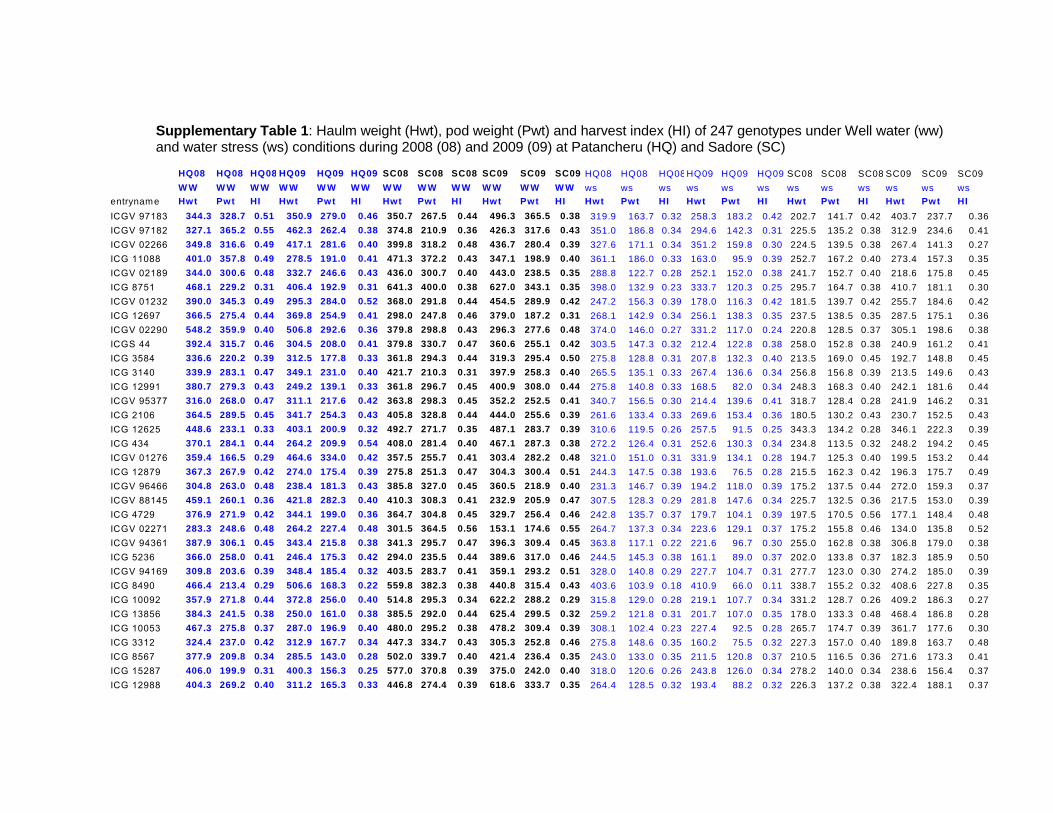
Yields and components of the entire set across both environments is provided in
Supplementary Table 1. Genotype and water treatment effects were significant (P<0.05)
for pod yield, haulm yield and HI in the two locations during the 2 years except for a
non-significant G effect on pod yield in IHQ08. In Patancheru, the G x T interaction was
significant for all three parameters in IHQ08 and for pod yield and HI in IHQ09 whereas
in Sadore it was significant for pod yield and HI in ISC08 and for haulm yield and HI in
ISC09. It appeared also that in both locations and years, the magnitude of the G effect
was always superior to the effect of the GxT interaction for all three traits, except for pod
and haulm yield in IHQ08, indicating that mostly genotypic effect drove the differences
in pod and haulm yield and HI within location-year combinations. The pod yield decrease
due to drought stress was 46 % and 36% in IHQ08 and IHQ09, and 41% and 31% in
ISC08 and ISC09. Haulm weight decreased 23 and 8% in IHQ08 and IHQ09, but as nuch
as 55% and 38% in ISC08 and ISC09. The trial’s grand mean pod yields at Sadore under
both water treatments were higher than those in Patancheru in both years (Table 1). The
grand means of HI were similar in the two locations across years and treatments.
The predominant genotype effect on the pod yield within year and location were also
shown by the significant relationships between pod yield under WW conditions and that
under WS conditions (Fig. 1). However, these relationships were higher in Patancheru
(R2 = 0.43 and 0.50 in IHQ08 and IHQ09 respectively) than in Sadore (R2 = 0.22 and 0.23
in ISC08 and ISC09).

10
3.2. Year effect and genotype by year interaction (G x Y)
Within each location, there was a significant year (Y) effect for pod yield, haulm yield
and harvest index (HI) for each of the water treatments, except HI under WS in
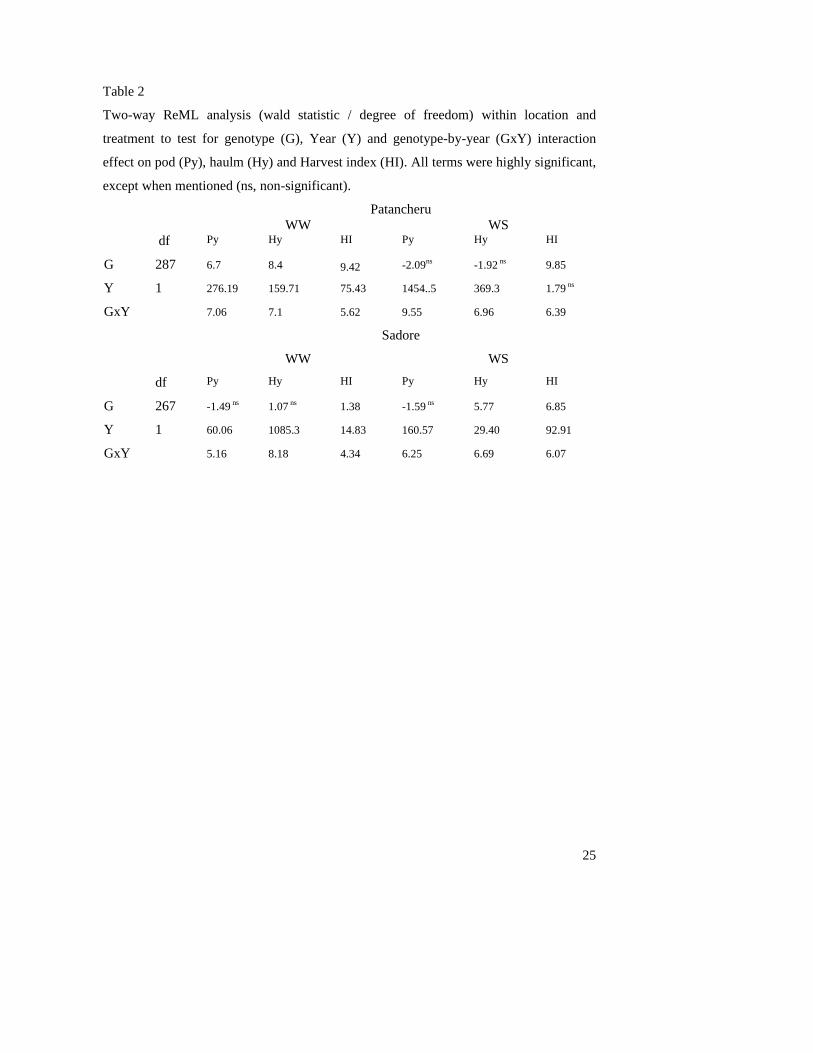
Patancheru (Table 2). Under WW conditions, the G effect was significant for the three
parameters at Patancheru while it was non significant at Sadore. Under WS conditions,
the G effect was non significant for pod yield but significant for HI at both locations. The
G effect was significant for haulm under WS only at Sadore (Table 2). Significant
genotype-by-year (GxY) interaction was observed for pod, haulm and harvest index for
each of the water treatments at the two locations (Table 2). In contrast to most GxT
interactions, the magnitude of the GxY effect under WS condition was higher than the
magnitude of the G effect for both pod and haulm yield in both locations. By contrast,
under WW conditions in Patancheru, the magnitude of G and GxY effects were similar
for pod and haulm yield, although in Sadore, these effects were not similar.
The high significance of GxY interaction under WS conditions suggests a close
interaction between the environmental conditions and the genotypic response to drought,
leading to GxY variation for pod, haulm and HI. At Patancheru, the daily mean VPD
especially during reproductive period (approximately between 40 and 80 DAS) was 1.4
and 1.18 MPKa in 2008 and 2009 respectively (Figure 2). The minimum temperature at
Patancheru during the reproductive period was 150C in both 2008 and 2009 but there was
some notable maximum temperature differences between the years (32.7 and 30.60C
respectively in 2008 and 2009). In Sadore, the daily VPD during reproductive period (40-
80 DAS) was higher in ISC08 (2.22 MPKa) than in ISC09 (1.9 MPKa) (Figure 2). The
minimum temperature in Sadore during the reproductive period was 21.0 and 23.90C in
2008 and 2009 respectively while the maximum temperature in 2008 and 2009 was
respectively 38.1 and 37.10C. Therefore, there were clear differences in the weather
conditions across years within locations.
3.2. Environment effect and genotype by environment interaction (GxE)
An important question of this work was whether the same or different genotypes
would be selected for high yield under WS or WW across locations. This question was
11
not relevant to this work only but to the overall shift in breeding approach towards
MARS or GWS, approaches that involves phenotyping in a fairly limited number of
environments. This information was also highly relevant to decide on the most suitable
breeding strategy for groundnut. Within treatment, genotype and environment effects
were significant for HI under both water treatments. For pod yield, genotype effect was
significant only under WS but not under WW conditions. The genotype effect was
significant for haulm yield under both WW and WS conditions but the environment
effect was significant only under WW conditions. A significant GxE interaction was
observed for haulm and harvest index under both water regimes but for pod yield this
interaction was significant only under WW conditions. The magnitude of the G effect
was higher than the magnitude of the GxE interaction for haulm yield and HI under WS
conditions whereas the contrary was observed under WW conditions. The high
significance of G effect under WS compared to GxE indicates that despite the fact that
genotypes showed different performances across years within locations and water
treatment for the three traits (Table 2), the differences in pod, haulm yield, and HI across
year-treatments combination were mostly due to genotypic effects under WS and by GxE
interaction effects under WW conditions.
3.3. Genotype and Genotype by Environment (GGE) biplot analysis
To identify genotypes with either broad or specific adaptation under different water
regimes at the two locations, we used GGE biplot which represents graphically the
genotype (G) main effects plus genotype-by-environment interaction (GxE) effects.
Figure 3a shows each genotype’s position relative to the ideal genotype (center of the
target), based on the mean performance and stability under WS conditions at Patancheru
and Sadore in 2008 and 2009. For example, genotypes ICGV 97183 (no244), ICGV
97182 (no243), ICGV 01232 (no211) and ICGV 02189 (no217) were top yielding
genotypes for their highest coordinates on the average environment coordinate (AEC)
abscissa. These genotypes were also the most stable across locations under WS
conditions as they positioned near the average environment coordinate (AEC) abscissa.
For example also, genotypes ICG 11862 (no30), ICG 12235 (no33), ICG 4598 (no134),
ICGV 99001 (no246) had among the lowest coordinates on the AEC abscissa and were
12
the lowest yielding genotypes under WS conditions across environments. The GGE biplot
also revealed the close location of both Patancheru trials (IHG08 and IHQ09) whereas
Sadore trials (ISC08 and ISC09) were very distant.
The four location trials (IHQ08, IHQ09, ISC08, and ISC09) were positioned in two
sectors (Figure 3b). IHQ08, IHQ09, and ISC08 were located in a same mega environment
(ME1). By contrast, ISC09 was located in a second mega environment (ME2). ICGV
97183 (no244) and ICGV 02266 (no219) which are on the vertices of ME1 sector were
the highest yielding in ME1 while ICG 5475 (no152) was the highest yielding in ME2.
IHQ08 and IHQ09 are far from the biplot origin indicating they had high discriminating
ability.
Based on that, the performance of genotypes was compared in environments IHQ09
and ISC09, representative of each mega-environment in order to identify specifically
adapted genotypes for each location (Figure 4)., Genotypes performing above average
were at the right of the vertical axis for Patancheru, and above the horizontal axis for
Sadore. The list of the 25 best genotypes for Patancheru and Sadore is provided in
Supplementary Table 2.
On the basis of GGE biplots (Fig. 4), genotypes consistently contrasting across both
locations were listed in Table 4. The most tolerant genotypes were those in the top and
far right corner of the biplot. Similarly, the most sensitive genotypes were those in the
bottom and far left corner of the biplot. To pinpoint those lines showing consistent
performance (highest / lowest performance) across both locations, the yields under WS of
lines identified from Fig. 4 were normalized in each year and environment against the
respective mean trial yield. Then these normalized values were averaged across locations
and years and ranked from top to bottom. Since, one purpose of the work was to select
contrasting entries for breeders, who usually prefer using genotypes with good agronomic
performance, the mean pod yield under WW conditions of lines identified from Fig. 4
were averaged across the four year-location combinations and varied between about 180
and 350 kg m-2. Genotypes having a mean below 230 gm-2, i.e. about one standard
deviation below the grand mean, were excluded from the list. Therefore, Table 4 provides
a list of the 50 most contrasting lines across environments under WS conditions, based on
13
the average of their normalized yield under WS conditions, however excluding entries
having a relatively low agronomic performance under WW conditions
3.4. Correlations between pod yield and related traits
Since pod yield under WS conditions was significantly related to pod yield under WW
conditions in both years at Patancheru and Sadore (Figure 1), the pod yield under WS
conditions could not be attributed to the drought tolerance of genotypes alone, but to a
yield potential component, accounting for 42, 50, 22, and 23% of the pod yield variation
under WS in IHQ08, IHQ09, ISC08, and ISC09, plus a residual (Res) yield variation
explained by the WS effect and attributable to drought tolerance per se. The residual
yields unexplained by the yield potential were computed as the difference between yield
under WS (Yws) and the predicted yield under WS (Ŷws), Res = Yws–Ŷws.
Ŷws was calculated based on the regression equation coefficients of the relationships
between yield under WW and WS conditions, such as:
Ŷws = 0.39 Yww + 16.4 and Ŷws = 0.45 Yww + 8 (IHQ08 and IHQ09 respectively).
Ŷws = 0.20 Yww + 64.6 and Ŷws = 0.32 Yww + 66.2 (ISC08 and ISC09 respectively)
Residuals for pod yield, averaged over 2 years in each environments, ranged from -40 to
41 g m-2 in Sadore and from -82 to 46 g m-2 in Patancheru. The absolute values of this
range (81 and 128 g m-2 in Patancheru and Sadore respectively) were similar to the WS
pod yield average in Patancheru and to 50% of those in Sadore, indicating a large range
of genotypic variation for drought tolerance per se in the two locations. We also tested
possible relationships between pod yield and flowering and maturity but found no
significant relationship (data not shown).
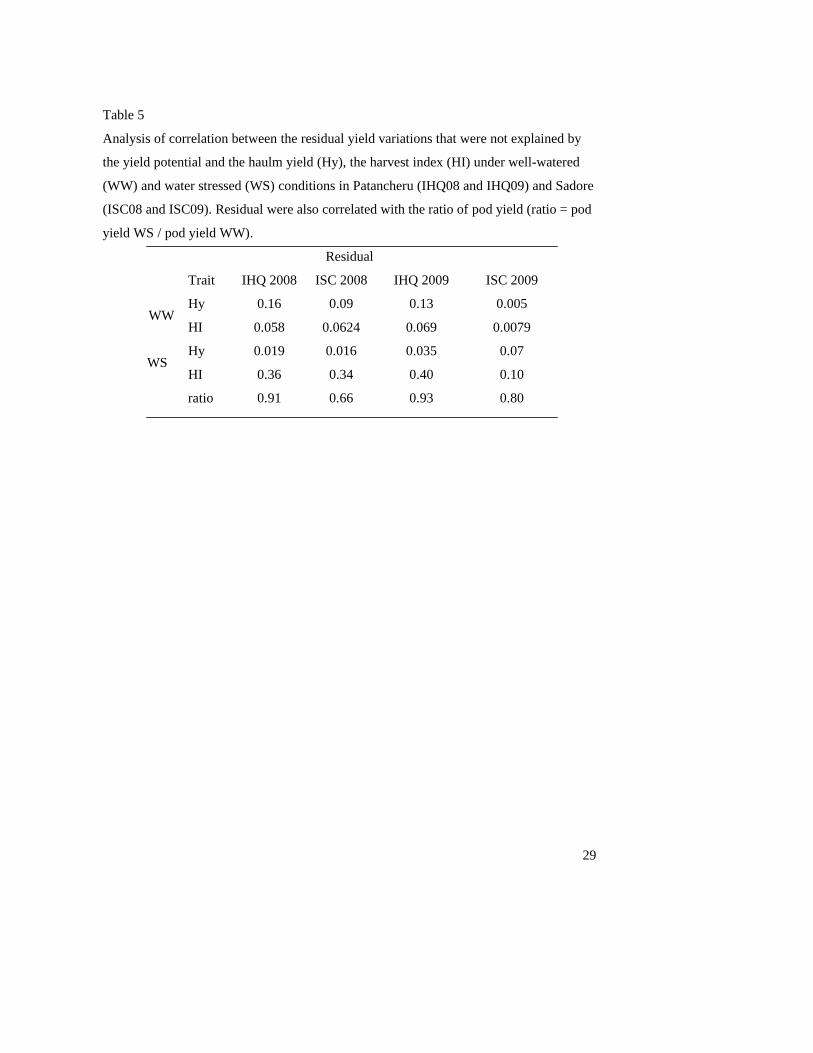
The residuals were strongly related to the harvest index under WS conditions (r2 = 0.36
and 0.40 for IHQ08 and IHQ09, r2 = 0.34 and 0.10 for ISCQ08 and ISCQ09) while no
relation was observed under WW treatment at the two locations in both years (Table 5).
In contrast, the residuals were poorly correlated to the haulm yield. The residuals were
also highly correlated to the ratio of pod yield, i.e. pod yield under (Pod yield WS / pod
yield WW) (Table 5), showing that the ratio of pod yield could be used as a simple proxy
for the residuals and then to discriminate genotypic differences in water stress tolerance.
A significant relationship was observed between the residuals and plant growth rate (C)
14
(r2 = 0.15), pod growth rate (R) (r2 = 0.51) and partition index (P) (r2 = 0.33) under WS
conditions in 2008 whereas no significant relationship was found under WW conditions
in 2008 and under both water regimes in 2009 (Table 6). The heritability (h2) of C, R and
P was high under the two water regimes in both years at Sadore (Table 6).
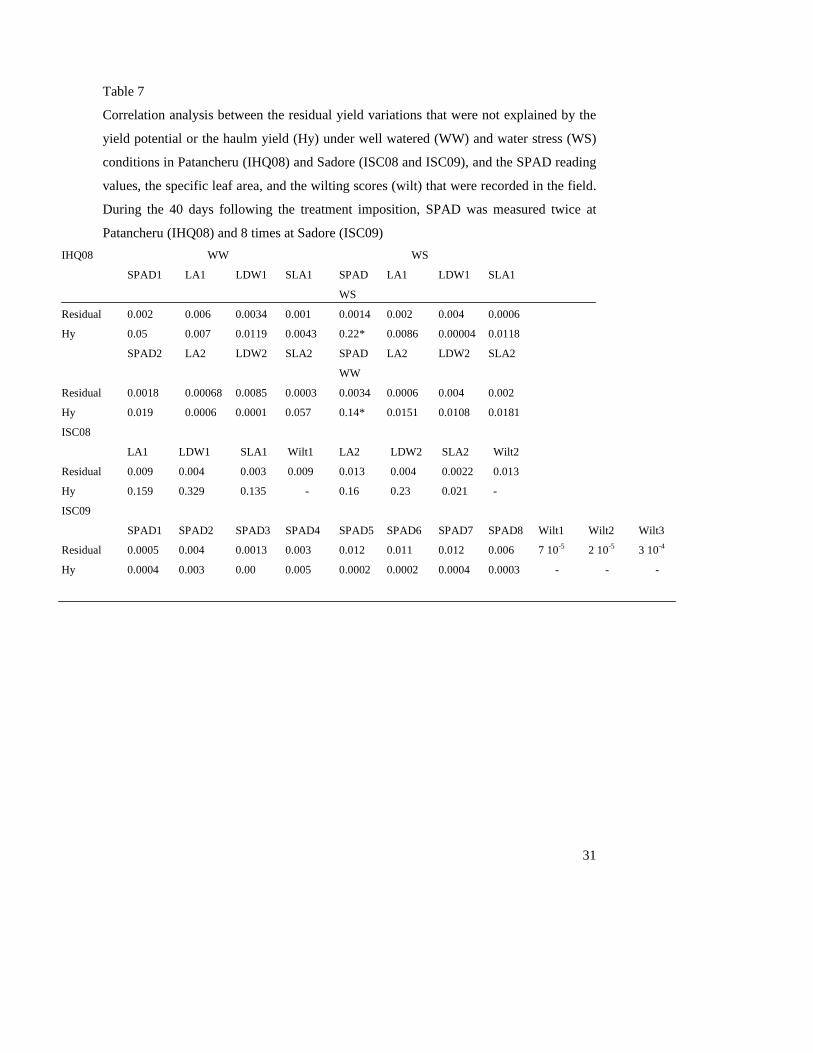
Correlations were also tested between residuals or haulm weight and SPAD (Soil and
Plant Analyzer Development, Japan) chlorophyll metter reading (SCMR), leaf area (LA),
leaf dry weight (LDW) and specific leaf area (SLA) measured during the water stress
period at Patancheru and/or Sadore in 2008 and/or 2009 (Table 7). In all cases, residuals
were unrelated to SPAD reading, SLA or wilt (leaf scoring) across water regimes and
locations, regardless of the date when the SPAD / SLA/wilt measurement were made. At
Patancheru, a significant relationship was observed only between Hwt and SPAD under
WS conditions in 2008. At Sadore in 2008, residual was correlated to LA and SLA only
under WW while Hwt was related to LA and LDW under both water regimes. These
relationships were not observed in 2009.
4. Discussion
The present research showed a large genotypic variation for pod yield, haulm yield and
harvest index under the two water regimes in the two locations and reports new source of
highly contrasting germplasm for pod yield under intermittent drought. A combined
analysis across environments showed the predominance of genotypic effects on the pod
yield under WS. However, predominant genotype-by-year interaction affected pod yield
under WS within both environments. Therefore, under drought stress, some genotypes
showed specific adaptation while some genotypes revealed a broad adaptation to
environment, and two mega environments were identified by GGE biplots, one including
both Patancheru datasets plus one season in Niger, the second one including the other
season in Niger. This study also showed a relationship between the pod yields under WS
and WW conditions. The residual yields not explained by the yield potential, which
accounted for drought tolerance per se, were significantly correlated to the harvest index
in the two locations and to the pod partition rate, but they were not correlated to either
SPAD readings or to SLA. The large variation for pod yield under drought, the new lines
identified, and the preliminary ideas on the cause for the tolerance open a great scope for
15
improving groundnut’s drought adaptation and for better understanding the mechanisms
of tolerance.
Large genotypic variation for pod yield, haulm yield and harvest index under control
(WW) and drought (WS) conditions within locations and across year was observed in this
study. Combined analyses of variance for these traits under WS conditions across years
and environments indicated that the magnitude of GxE interaction was lesser than the
magnitude of genotype effect, suggesting that the selection for best genotypes was similar
in both environments (Patancheru and Sadore). The predominance of G effect indicates
that genotypic effect drove the differences in pod and haulm yield and HI and that
genotypes with broad adaptation could be identified (Table 4). Genotypes ICGV 97183,
ICGV 97182, ICGV 01232 and ICGV 02189 were indeed high yielding under WS and
stable in the two environments, indicating limited interaction of these genotypes with the
environment. These lines are currently being used in the crossing program at ICRISAT
and they are also used, along with a set of highly sensitive lines to understand the
underlying mechanisms of drought tolerance, using both field and controlled environment
(Ratnakumar et al., 2009; Ratnakumar and Vadez, 2011).
However, GGE biplot also revealed some dissimilarity between Patancheru and
Sadore under drought conditions and showed the existence of two mega environments.
The GGE biplot pins the slight differences between the environments suggesting that it is
effective for analyzing GxE interactions through the identification of mega environments.
We observed that during the experimental period, the VPD in Sadore was higher than in
Patancheru. In addition, the soil in Sadore are arenosols while there is a sandy-clay loam
Alfisol in Patancheru. Since the protocol for imposing the water stress was rigorously the
same at Patancheru and Sadore, the existence of two mega environments suggests that the
selection for best genotypes is not similar but specific to the environment, which is
contrary to previous findings on a more limited set of breeding lines (Ntare, pers.
Comm.). The mega environment delimitation showed highest yielding genotypes in
Patancheru, ICG 1132, ICG 12697 and IGC 2106 indeed differed from the top genotypes
at Sadore, ICG 12625, ICG 434 and ICGV 02290. These data clearly indicate that a
16
specific adaptation of groundnut genotype needs to be understood. Nevertheless these
lines are currently exploited for future groundnut breeding for drought adaptation.
Under WS conditions, our results indeed showed a significant genotype and genotype-
by-year (GxY) interaction effects for pod, haulm and harvest index at each of the two
locations. The magnitude of the GxY effect was higher than the magnitude of the G effect
for pod and haulm yield. The high significance of GxY interaction under drought
conditions suggests a close interaction between the environmental conditions in which
the experiments were carried out and the genotypic response to drought, leading to some
differences in how genotypes performed across years. The difference of genotypes
performance under water stress compared to well water conditions suggests that
intermittent drought tolerance is adaptive. These results agree with previous findings on
groundnut (Girdthai et al., 2010; Mothilal et al., 2010; Hariprasanna et al., 2008;
Mekontchou et al., 2006; Ntare et al., 1998). Our interpretation is that the differences in
VPD between the seasons within an environment, or across environment could have
played a major role. Differences in the sensitivity of transpiration to the vapor pressure
deficit have indeed been found in groundnut (Devi et al., 2010). This trait, which gets
triggered at VPD around 2 kPa, close to the mean values in the trials, could lead to major
water savings in VPD-sensitive genotypes, with likely major effect on their water
relations and response to drought. Although we have not measured any transpiration
response, it is a possibility that this trait could have played a role in those days when the
VPD was above 2 kPa, as was the case in Sadore in 2008. Therefore, the significant GxY
interaction observed in this study suggests that genotypic response is driven by how
specific plant productive processes interact with the environment, and calls for a better
understanding of the mechanisms that lead to increasing yield in different mega-
environment, something critical for making targeted progress in the breeding of drought
tolerant varieties. This information is also critical in the context of using marker-assisted
recurrent selection (MARS) for breeding (Bernardot and Charcosset, 2006) and where the
quantitative trait loci (QTL) are first identified before being used in recombination
between most promising progenies. Large GxY interaction, and the existence of different
mega-environments clearly indicates that caution should be used while using MARS, to
17
ensure that QTL detection is made in locations that are representative of most stress
environments.
The pod yield under stress conditions was significantly related to pod yield under non
stress conditions at both locations and years. Similar results were previously observed on
groundnut (Songsri et al., 2008a; Songsri et al., 2008b; Vorasoot et al., 2003; Ntare et al.,
2001) and other crops (Vadez et al. 2007, Ober et al., 2002). These results showed that
the genotypic variation for pod yield under WS conditions could be divided into a
component of yield potential and a component of tolerance to intermittent drought per se.
Therefore drought tolerance per se, was closely related to the pod growth rate and the
partition rate (r2 = 0.51, r2 = 0.33 respectively) under WS conditions. These findings
suggest that fast pod filling contributed significantly to the higher pod yield under
intermittent drought. Similar results were observed in previous studies (Songsri et al.,
2008; Painawade et al., 2009; Ntare et al., 1998; Vorasoot et al., 2003). Ntare et al.,
(2001) reported a positive correlation between the partition and yield under water deficit
and high temperature conditions and suggest partitioning as a screening tool for
development of heat-tolerant genotypes, especially in the Sahelian environment.
Moreover, partition is less affected by environment and indirect selection for yield via
partitioning would result in a 22 % increase over direct selection for yield (Ntare et al.,
1998).
In this study, a close relationship was also observed between the residuals and the
harvest index, which points to the likely importance of having reproduction tolerance to
drought conditions in groundnut. This was also related to the lack of a significant
relationship between the residuals and the haulm weights. For the improvement of
drought tolerance based on yield, many studies suggested that an alternative breeding
strategy is to use surrogates traits specially when GxE interaction is highly significant
(Nageswara Rao et al., 2001; Nigam et al., 2005, Painawade et al., 2009). However, if
any trait is to be used as an indirect selection criterion for yield improvement, heritability
of such trait should be greater than the heritability of yield (Ntare et al., 1998). Our
results showed that the heritability of pod yield was 78% in 2008 and 87% in 2009 at
Sadore while the heritability of pod growth rate and partition were respectively 76.8%
18
and 69% in 2008, 48% and 59% in 2009. Investigations are needed to confirm the use of
these traits as selection criteria for improving intermittent drought tolerance in groundnut.
In addition, our results showed very clearly the lack of any relationship with SPAD
reading and SLA. These surrogate traits for transpiration efficiency have been widely
used and recommended for drought tolerance screening (Nageswara Rao et al., 2001;
Nautiyal et al., 2002; Bindu Madhava et al., 2003; Nigam et al., 2005; Sheshshayee et al.,
2006; Upadhyaya, 2005). However, more recent report shows that care should be taken in
their use (Krushnamurthy et al., 2007; Devi et al., 2011). Here we clearly show here that
they have a likely limited use for groundnut selection for drought tolerance.
Conclusion
This work reports a large variation for pod yield under intermittent stress conditions and
therefore provide new sources of tolerance that are currently used in breeding and to
better understand the mechanisms of adaptation, and their interactions with the
environment. Importantly, we showed clear evidence that these interactions with the
environment condition their response to drought, which indicates that care should be
taken when choosing groundnut testing environments. This has important consequences
for the choice of the breeding strategy to breed for improve drought adaptation in
groundnut, and it also requires research on the mechanistic causes of these large GxY
interactions.
Acknowledgements
The work was supported by a grant from the Bill and Melinda Gates Foundation
(Tropical Legume I project) through the Generation Challenge Program managed by
CIMMYT. Authors are grateful to Mr P Arjun Rao for expert field assistance in India and
to Boulama K Taya in Niger.
References

19
Bernardo, R., Charcosset, A., 2006. Usefulness of gene information in marker-assisted
recurrent selection: A simulation appraisal. Crop Sci. 46, 614–621.
Bhatnagar-Mathur, P., Devi, J., Lavanya, M., Reddy, D.S., Vadez, V., Serraj, R.,
Yamaguchi-Shinozaki, K., Sharma, K.K., 2007. Stress-inducible expression of At
DREB1A in transgenic peanut (Arachis hypogaea L.) increases transpiration
efficiency under water-limiting conditions. Plant Cell Rep. 26, 2071-2082.
Bindu Madhava, H., Sheshshayee, M.S., Shankar, A.G., Prasad, T.G., Udayakumar, M.,
2003. Use of SPAD chlorophyll meter to assess transpiration efficiency of peanut.
Pages 3-9 in Breeding of Drought-Resistant Peanut 2003 (Cruickshank AW,
Rachaputi NC, Wright GC, Nigam S.N, eds.). Proceedings of a Collaborative
Review Meeting, 25-27 Feb, Hyderabad, India. ACIAR Proceedings No. 112,
Canberra.
Bidinger, F.R., Mahalakshmi, V., Rao, G.D.P., 1987. Assessment of drought resistance in
pearl millet (Pennisetum americanum (L.) Leeke). I Factors affecting yield under
stress. Aust. J. Agric. Res. 38, 37-48.
Blum, A., 1996. Crop responses to drought and the interpretation of adaptation. Plant
Growth Regul. 20, 135–148.
Boontang, S., Songsri, P., Jogloy, S., Akkasaeng, C., Vorasoot, N.,
Tantisuwichwong, N., Patanothai, A., 2010. Evaluation of peanut cultivars
commonlyg in Thailand under water limited conditions. Asian J. Plant Sci. 9, 320-
328.
Devi, J.M., Bhatnagar-Mathur, P., Sharma, K.K., Serraj, R., Anwar, S.Y., Vadez, V., 2011.
Relationships between transpiration efficiency (TE) and its surrogate traits in the
rd29A:DREB1A transgenic groundnut). J. Agron.Crop Sci. 197, 272-283
Duncan, W.G., McLoud, D.E., McGraw, R.L., Boote, K.J. 1978. Physiological aspects of
peanut yield improvement. Crop Sci. 18, 1015-1020.
Hariprasanna, K., Chuni, L., Radhakrishnan, T., 2008. Genotype x environment
interaction and stability analysis in large seeded genotypes of groundnut (Arachis
hypogaea L.). J. Oilseed. Res. 25, 125-131.
Jongrungklang N., Tomsan, B., Vorassot, N., Jogloy, S., Kesmala, T., Panatothai, A.,
2008. Identification of peanut genotypes with water use efficiency under drought

20
stress conditions from peanut germplasm of diverse origins. Asian J. Plant Sci. 7,
628-638.
Krishnamurthy, L., Vadez, V., Devi, M.J., Serraj, R., Nigam, S.N., Sheshshayee, M.S.,
Chandra, S., Rupakula, A., 2007. Variation in transpiration efficiency and its related
traits in a groundnut (Arachis hypogaea L.) mapping population. Field Crops Res.
103, 189-197.
Krishnamurthy, L.K., Kashiwagib, J., Gaura, P.M., Upadhyaya, H.D., Vadez, V., 2010.
Sources of tolerance to terminal drought in the chickpea (Cicer arietinum L.)
minicore germplasm. Field Crops Res. 119, 322–330.
Mekontchou1, T., Ngueguim, N., Fobasso, M., 2006. Stability Analysis for Yield and
Yield Components of Selected Peanut Breeding Lines (Arachis hypogaea L.) in the
North Province of Cameroon. Tropicultura 24, 2, 90-94.
Mothilal, A., Vindhiya Varman, P., Manivannan, N., 2010. Phenotypic stability for
kernel yield in groundnut (Arachis hypogaea L.). Electronic J. Plant Breed. 1, 173-
176.
Nageswara Rao, R.C., Williams, J.H., Singh, M., 1989. Genotypic sensitivity to drought
and yield potential of peanut. Agron. J. 81, 887–893.
Nageswara Rao, R.C., Talwar, H.S., Wright, G.C., 2001. Rapid assessment of specific
leaf area and leaf nitrogen in peanut (Arachis hypogaea L.) using a chlorophyll
meter. J. Agron. Crop Sci. 186, 175–182.
Nautiyal, P. C., Nageswara Rao, R.C., Joshi, Y.C., 2002. Moisture-deficit-induced
changes in leaf water content, leaf carbon exchange rate and biomass production in
groundnut cultivars differing in specific leaf area. Field Crops Res. 74, 67–79.
Ndunguru, B. J., Ntare, B.R., Williams, J.H., Greenberg, D.C., 1995. Assessment of
groundnut cultivars for end-of-season drought tolerance in a Sahelian environment.
J. Agric. Sci. 125, 79-85.
Nigam, S. N., Chandra, S., Rupa Sridevi, Manohar Bhukta, K., Reddy, A.G.S.,
Nageswara Rao, R.C., Wright, G.C., Reddy, P.V., Deshmukh, M.P., Mathur, R.K.,
Basu, M.S., Vasundhara, S., Vindhiya Varman, P., Nagda, A.K., 2005. Efficiency
of physiological trait-based and empirical selection approaches for drought tolerance
in groundnut. Ann. App. Biol. 146, 433–439.

21
Ntare, B. R., Williams, J.H., 1998. Heritability and Genotype x Environment interaction
for yield and components of yield. Model in the segregating populations under semi-
arid conditions. Afric. Crop Sci. J., 6, 119-127.
Ntare, B. R. , Williams, J.H., Dougbedji, F., 2001. Evaluation of groundnut genotypes
for heat tolerance under field conditions in a Sahelian environment using a simple
physiological model for yield. J. Agric. Sci. 136, 81-88.
Ober, E.S., Luterbacher, M.C., 2002. Genotypic variation for drought tolerance in Beta
vulgaris. Ann. Bot. 89, 916-924.
Painawadee, M., Jogloy, S., Kesmala, T., Akkasaeng, C., Patanothai, A., 2009.
Heritability and correlation of drought resistant traits and agronomics traits in
Peanut (Arachis hypogaea L.), Asian J. Plant Sci. 8, 325-334.
Panthuwan, G., Fokai, S., Cooper, M., Rajatasereekul, S., O’Toole, J.C., 2002. Yield
response of rice genotypes to different types of drought under rainfed lowlands. Part
1: grain yield and yield components. Field Crop Res. 41, 45–54.
Ratnakumar, P., Vadez, V., Nigam, S.N., Krishnamurthy, L., 2009. Assessment of
transpiration efficiency in peanut (Arachis hypogaea L.) under drought by lysimetric
system. Plant Biol. 11, 124-130.
Ratnakumar, P., Vadez, V., 2011. Groundnut (Arachis hypogaea L.) genotypes tolerant to
intermittent drought maintain a high harvest index and have small leaf canopy under
stress. Funct. Plant Biol. (in press).
Sharma, K.K., Lavanya M., 2002. Recent developments in transgenics for abiotic stress
in legumes of the semi-arid tropics. In. M. Ivanaga (ed.) Genetic Engineering of
Crop Plants for Abiotic Stress. JIRCAS Working Report No. 23: 61-73; JIRCAS:
Tsukuba, Japan.
Sheshshayee, M.S., Bindumadhava, H., Rachaputi, N.R., Prasad, T.G., Udayakumar, M.,
Wright, G.C., 2006. Leaf chlorophyll concentration relates to transpiration
efficiency in peanut. Ann. Appl. Biol., 148, 7-15.
Songsri, P., Jogloy, S., Kesmala, T., Vorasoot, N., Akkasaeng, C., Patanothai, A.,
Holbrook, C.C., 2008a. Heritability of drought resistance traits and correlation of
drought resistance and agronomic traits in peanut. Crop Sci. 48, 245-253.

22
Songsri, P., Jogloy, S., Kesmala, T., Vorasoot, N., Akkasaeng, C., Patanothai, A.,
Holbrook, C.C., 2008b. Response of reproductive characters of drought resistant
peanut genotypes to drought. Asian J. Plant Sci., 7, 425-439.
Talebi, R., Fayaz, F., Amir, M.N., 2009. Effective selection criteria for assessing drought
stress tolerancein durum wheat (Triticum durum Desf.). Gen. Appl. Plant Phys., 35,
64–74.
Girdthai, T., Jogloy, S., Vorasoot, N., Akkasaeng, C., Wongkaew, S., Holbrook, C.C.,
Patanothai, A., 2010. Heritability of, and genotypic correlations between, aflatoxin
traits and physiological traits for drought tolerance under end of season drought in
peanut (Arachis hypogaea L.). Field Crops Res. 118, 169–176.
Upadhyaya, H.D., Bramel, P.J., Ortiz, R., Sube Singh., 2002. Developing a mini core of
peanut for utilization of genetic resources. Crop Sci. 42, 2150-2156.
Upadhyaya, H.D., Dwivedi, S.L., Varshney, R.K., Hoisington, D.A., Gowda, C.L.L.,
2008. Using genetic and genomic resources to broaden the genetic base of cultivated
groundnut. Page 6, Abstract Book. AAGB 2008., 3rd International Conference of
the Peanut Research Community on Advances in Arachis through Genomics and
biotechnology, 4-8 November 2008, ICRISAT, Hyderabad Andhra Pradesh, India.
Upadhyaya, H.D., 2005. Variability for drought resistance related traits in the mini core
collection of peanut. Crop Science 45(4), 1432-1440.
Vadez, V., Krishnamurthy, L., Serraj, R., Gaur, P.M., Upadhyaya, H.D., Hoisington,
D.A., Varshney, R.K., Turner, N.C., Siddique, K.H.M., 2007. Large variation in
salinity tolerance in chickpea is explained by differences in sensitivity at the
reproductive stage. Field Crops Res. 104, 123–129.
Vorasoot, N., Songsri, P., Akkasaeng, C., Jogloy, S., Patanothai, A., 2003. Effect of
water stress on yield and agronomic characters of peanut (Arachis hypogaea L.).
Songklanakarin J. Sci. Technol. 25, 283-284.
Williams, E.J., Drexler, J.S. 1981. A non-destructive method for determining peanut pod
maturity. Peanut Sci. 8, 134-141.
Williams, J.H., Saxena N.P., 1991. The use of non destructives measurement and
physiological models of yield determination to investigate factors determining

23
differences in seeds yield between genotypes of ‘desi’ Chickpeas (Cicer arietum).
Ann. Appl. Biol., 109, 105-112.
Wright, G.C., Nageswara Rao, R.C., Basu, M.S., 1996. A physiological approach to the
understanding of genotype by environment interactions: A case study on
improvement of drought adaptation in groundnut. p. 365–380. In M. Cooper and
G.L. Hammer (ed.) Plant adaptation and crop improvement. CAB Int., Wallingford,
UK.
24
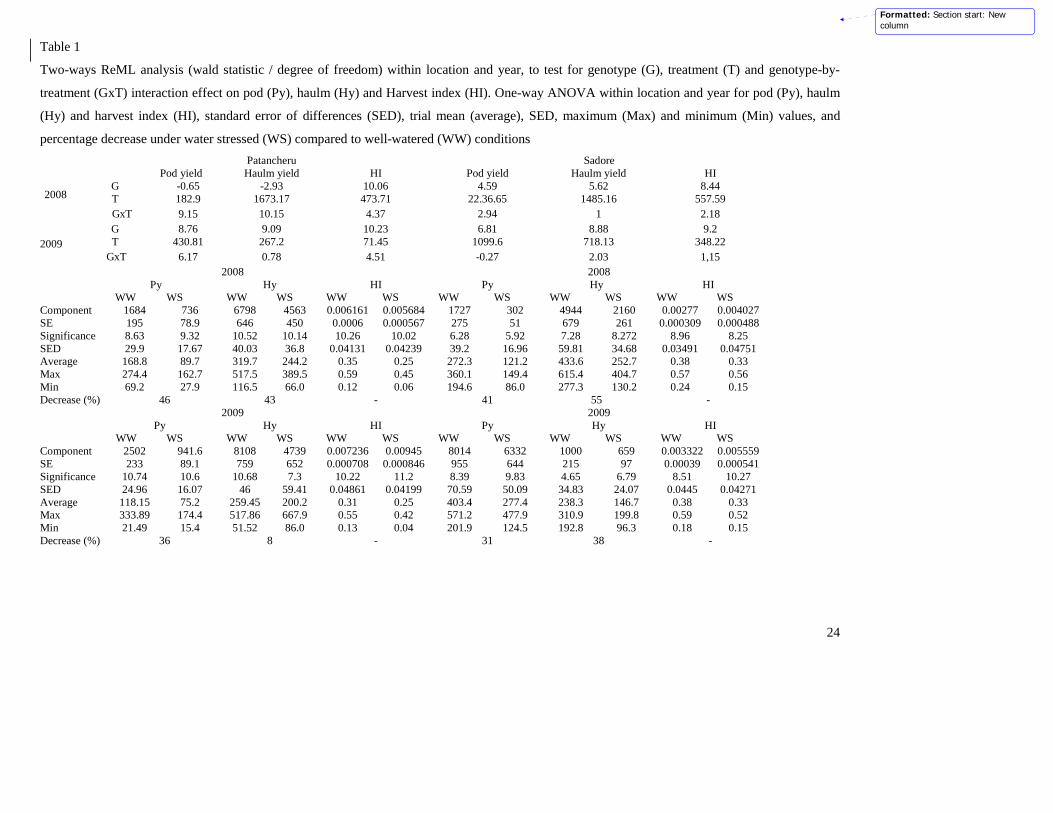
Table 1
Two-ways ReML analysis (wald statistic / degree of freedom) within location and year, to test for genotype (G), treatment (T) and genotype-by-
treatment (GxT) interaction effect on pod (Py), haulm (Hy) and Harvest index (HI). One-way ANOVA within location and year for pod (Py), haulm
(Hy) and harvest index (HI), standard error of differences (SED), trial mean (average), SED, maximum (Max) and minimum (Min) values, and
percentage decrease under water stressed (WS) compared to well-watered (WW) conditions
Patancheru Sadore Pod yield Haulm yield HI Pod yield Haulm yield HI
G -0.65 -2.93 10.06 4.59 5.62 8.44T 182.9 1673.17 473.71 22.36.65 1485.16 557.592008
GxT 9.15 10.15 4.37 2.94 1 2.18G 8.76 9.09 10.23 6.81 8.88 9.2T 430.81 267.2 71.45 1099.6 718.13 348.222009
GxT 6.17 0.78 4.51 -0.27 2.03 1,152008 2008
Py Hy HI Py Hy HI WW WS WW WS WW WS WW WS WW WS WW WS
Component 1684 736 6798 4563 0.006161 0.005684 1727 302 4944 2160 0.00277 0.004027SE 195 78.9 646 450 0.0006 0.000567 275 51 679 261 0.000309 0.000488Significance 8.63 9.32 10.52 10.14 10.26 10.02 6.28 5.92 7.28 8.272 8.96 8.25SED 29.9 17.67 40.03 36.8 0.04131 0.04239 39.2 16.96 59.81 34.68 0.03491 0.04751Average 168.8 89.7 319.7 244.2 0.35 0.25 272.3 121.2 433.6 252.7 0.38 0.33Max 274.4 162.7 517.5 389.5 0.59 0.45 360.1 149.4 615.4 404.7 0.57 0.56Min 69.2 27.9 116.5 66.0 0.12 0.06 194.6 86.0 277.3 130.2 0.24 0.15Decrease (%) 46 43 - 41 55 -
2009 2009 Py Hy HI Py Hy HI
WW WS WW WS WW WS WW WS WW WS WW WSComponent 2502 941.6 8108 4739 0.007236 0.00945 8014 6332 1000 659 0.003322 0.005559SE 233 89.1 759 652 0.000708 0.000846 955 644 215 97 0.00039 0.000541Significance 10.74 10.6 10.68 7.3 10.22 11.2 8.39 9.83 4.65 6.79 8.51 10.27SED 24.96 16.07 46 59.41 0.04861 0.04199 70.59 50.09 34.83 24.07 0.0445 0.04271Average 118.15 75.2 259.45 200.2 0.31 0.25 403.4 277.4 238.3 146.7 0.38 0.33Max 333.89 174.4 517.86 667.9 0.55 0.42 571.2 477.9 310.9 199.8 0.59 0.52Min 21.49 15.4 51.52 86.0 0.13 0.04 201.9 124.5 192.8 96.3 0.18 0.15Decrease (%) 36 8 - 31 38 -
Formatted: Section start: Newcolumn
25
Table 2
Two-way ReML analysis (wald statistic / degree of freedom) within location and
treatment to test for genotype (G), Year (Y) and genotype-by-year (GxY) interaction
effect on pod (Py), haulm (Hy) and Harvest index (HI). All terms were highly significant,
except when mentioned (ns, non-significant).
PatancheruWW WS
df Py Hy HI Py Hy HI
G 287 6.7 8.4 9.42 -2.09ns -1.92 ns 9.85
Y 1 276.19 159.71 75.43 1454..5 369.3 1.79 ns
GxY 7.06 7.1 5.62 9.55 6.96 6.39
Sadore
WW WS
df Py Hy HI Py Hy HI
G 267 -1.49 ns 1.07 ns 1.38 -1.59 ns 5.77 6.85
Y 1 60.06 1085.3 14.83 160.57 29.40 92.91
GxY 5.16 8.18 4.34 6.25 6.69 6.07

26

27
Table 3
Two-way ReML analysis (wald statistic / degree of freedom) within treatment to test for
genotype (G), environment (E) and genotype-by-environment (GxE) interaction effects
on pod (Py), haulm (Hy) and harvest index (HI). All terms were highly significant, except
when mentioned (ns, non-significant).
WW
df Py Hy HI
G 247 0.56 ns 4.3 4.76
E 3 416.03 128.24 89.04
GxE 991 1.88 ns 5.18 6.42
WS
df Py Hy HI
G 247 3.69 5.84 7.67
E 3 488.75 0.81 308.6
GxE 991 -1.09 ns 1.32 ns 5.1

28
Table 4
Pod weight (Py, in g m-2) and harvest index (HI) of consistently contrasting genotypes (30
tolerant and 20 sensitive) in Patancheru and Sadore under intermittent water stress. Genotype
values under well watered conditions are also reported.
WS WWPatancheru Sadore Patancheru Sadore
Entry name Py HI Py HI P HI P HIICGV 97183 173.46 0.37 189.66 0.39 303.87 0.49 316.50 0.41ICGV 97182 164.54 0.33 184.87 0.40 313.76 0.47 264.25 0.39ICGV 02266 165.45 0.32 140.39 0.32 299.09 0.45 299.30 0.43ICGV 02189 137.31 0.33 164.24 0.43 273.61 0.46 269.59 0.37ICG 11088 140.92 0.36 162.24 0.38 274.41 0.45 285.51 0.42ICG 12697 140.61 0.34 156.82 0.36 265.16 0.42 217.50 0.39ICG 8751 126.60 0.24 172.90 0.34 211.01 0.31 371.56 0.36ICGV 01232 136.32 0.40 162.14 0.42 314.65 0.50 290.88 0.43ICG 3140 135.84 0.33 153.23 0.41 257.06 0.43 234.31 0.35ICGS 44 135.05 0.35 157.00 0.39 261.85 0.44 292.87 0.44ICG 3584 130.56 0.36 158.92 0.45 199.04 0.36 294.87 0.47ICGV 95377 148.06 0.35 137.30 0.30 242.82 0.45 275.41 0.43ICG 2106 143.39 0.35 141.34 0.43 271.88 0.44 292.22 0.41ICGV 02290 131.48 0.25 163.53 0.37 326.25 0.38 288.22 0.46ICGV 01276 142.54 0.29 139.29 0.42 250.27 0.35 268.92 0.44ICGV 88145 137.99 0.31 142.73 0.37 271.18 0.38 257.11 0.44ICGV 02271 133.18 0.36 145.82 0.49 238.02 0.48 269.55 0.55ICGV 02022 144.98 0.40 133.12 0.41 244.17 0.50 222.71 0.41ICGV 96466 132.35 0.39 148.40 0.41 222.12 0.46 272.97 0.42ICG 434 128.36 0.33 153.86 0.39 247.02 0.49 284.35 0.39ICG 4729 119.89 0.38 159.45 0.52 235.44 0.39 280.59 0.45ICG 12991 111.42 0.33 174.98 0.42 209.24 0.38 302.32 0.45ICGV 02038 141.47 0.40 128.89 0.38 241.73 0.48 212.81 0.41ICG 4750 130.02 0.35 134.70 0.40 223.06 0.37 280.59 0.42ICGV 87378 138.02 0.34 129.77 0.37 308.02 0.45 253.56 0.42ICG 15287 123.31 0.30 148.20 0.35 178.11 0.28 306.44 0.40ICGV 94169 122.78 0.30 154.01 0.34 194.50 0.36 288.44 0.46ICG 12879 112.00 0.33 169.01 0.46 221.64 0.41 275.86 0.49ICG 8567 126.87 0.36 144.91 0.38 176.42 0.31 288.04 0.37ICG 12625 105.46 0.25 178.22 0.34 217.01 0.33 277.69 0.37
Tolerant
Mean 135.34 0.34 154.33 0.39 249.75 0.41 277.83 0.42
ICG 5663 84.27 0.14 100.46 0.24 179.60 0.21 274.16 0.37ICG 13723 71.08 0.16 124.92 0.25 157.71 0.25 291.79 0.46ICG 14482 62.87 0.15 135.41 0.29 213.58 0.27 287.91 0.39ICG 10010 59.54 0.14 132.68 0.28 185.43 0.26 341.24 0.41ICG 9961 69.38 0.11 122.58 0.32 197.11 0.26 306.95 0.43ICG 1834 71.26 0.22 117.18 0.42 191.07 0.34 213.73 0.39ICG 3053 72.73 0.15 116.13 0.27 176.12 0.26 232.13 0.32ICG 8106 65.45 0.28 119.92 0.29 182.89 0.33 223.60 0.30ICG 2777 49.77 0.10 143.90 0.26 182.01 0.25 327.06 0.42ICG 2772 70.88 0.11 110.74 0.31 191.89 0.23 222.56 0.36ICG 721 59.05 0.11 130.39 0.26 185.84 0.22 214.51 0.31ICG 8760 67.22 0.12 110.30 0.22 184.66 0.29 291.73 0.31ICG 14523 55.36 0.25 129.95 0.25 165.06 0.20 270.53 0.38ICGV 99001 80.00 0.24 89.59 0.21 196.47 0.36 201.62 0.29ICG 5286 65.76 0.12 104.06 0.32 215.12 0.28 233.71 0.35ICG 12000 50.51 0.07 126.21 0.29 140.48 0.17 281.68 0.40ICG 4598 57.10 0.09 111.32 0.26 146.65 0.16 279.26 0.38ICG 12235 52.08 0.12 121.48 0.24 118.20 0.17 297.15 0.34ICG 13787 48.54 0.08 114.09 0.26 164.09 0.21 277.92 0.37ICG 11862 54.18 0.10 63.39 0.18 152.29 0.20 290.16 0.41
Sensitive
Mean 107.11 0.26 139.39 0.35 220.95 0.35 273.96 0.40
29
Table 5
Analysis of correlation between the residual yield variations that were not explained by
the yield potential and the haulm yield (Hy), the harvest index (HI) under well-watered
(WW) and water stressed (WS) conditions in Patancheru (IHQ08 and IHQ09) and Sadore
(ISC08 and ISC09). Residual were also correlated with the ratio of pod yield (ratio = pod
yield WS / pod yield WW).
Residual
Trait IHQ 2008 ISC 2008 IHQ 2009 ISC 2009
Hy 0.16 0.09 0.13 0.005WW
HI 0.058 0.0624 0.069 0.0079
Hy 0.019 0.016 0.035 0.07WS
HI 0.36 0.34 0.40 0.10
ratio 0.91 0.66 0.93 0.80

30
Table 6
Heritability of the plant growth rate (C), the pod growth rate (R), and the partition index
(P). Correlation coefficients between the residual, the pod yield ratio (ratio = pod yield
WS / pod yield WW), or the harvest index (HI) and the plant growth rate, the pod growth
rate, and the partition index under well-watered (WW) and water stressed (WS)
conditions in Sadore in 2008 and 2009 (ISC08 and ISC09)
ISC08
Heritability(%)
residual Ratio HI
C 83 0.008 0.22 0.009
R 83.5 0.0003 0.17 0.23WW
P 48 0.022 0.016 0.61
C 76.8 0.15 0.018 0.018
R 76.8 0.51 0.12 0.37WS
P 69 0.33 0.10 0.80
ISC09
C 40.6 0.028 0.06 0.002
R 59 0.009 0.05 0.16WW
P 39.3 0.004 0.0007 0.56
C 44.8 0.025 0.008 0.045
R 48 0.074 0.043 0.35WS
P 59 0.087 0.083 0.81
31
Table 7
Correlation analysis between the residual yield variations that were not explained by the
yield potential or the haulm yield (Hy) under well watered (WW) and water stress (WS)
conditions in Patancheru (IHQ08) and Sadore (ISC08 and ISC09), and the SPAD reading
values, the specific leaf area, and the wilting scores (wilt) that were recorded in the field.
During the 40 days following the treatment imposition, SPAD was measured twice at
Patancheru (IHQ08) and 8 times at Sadore (ISC09)
IHQ08 WW WS
SPAD1 LA1 LDW1 SLA1 SPAD
WS
LA1 LDW1 SLA1
Residual 0.002 0.006 0.0034 0.001 0.0014 0.002 0.004 0.0006
Hy 0.05 0.007 0.0119 0.0043 0.22* 0.0086 0.00004 0.0118
SPAD2 LA2 LDW2 SLA2 SPAD
WW
LA2 LDW2 SLA2
Residual 0.0018 0.00068 0.0085 0.0003 0.0034 0.0006 0.004 0.002
Hy 0.019 0.0006 0.0001 0.057 0.14* 0.0151 0.0108 0.0181
ISC08
LA1 LDW1 SLA1 Wilt1 LA2 LDW2 SLA2 Wilt2
Residual 0.009 0.004 0.003 0.009 0.013 0.004 0.0022 0.013
Hy 0.159 0.329 0.135 - 0.16 0.23 0.021 -
ISC09
SPAD1 SPAD2 SPAD3 SPAD4 SPAD5 SPAD6 SPAD7 SPAD8 Wilt1 Wilt2 Wilt3
Residual 0.0005 0.004 0.0013 0.003 0.012 0.011 0.012 0.006 7 10-5 2 10-5 3 10-4
Hy 0.0004 0.003 0.00 0.005 0.0002 0.0002 0.0004 0.0003 - - -
32
Figure Captions
Fig.1. relationship between pod yield (g m-2) under well watered (ww) and water stressed
conditions across year and location: IHQ08 (A), IHQ09 (B), ISC08 (C), and ISC09 (D).
Fig. 2. Vapor pressure deficit (VPD) (A), minimum temperatures (Tp min, dashed lines)
and maximum temperatures (Tp max, solid lines) (B) during the groundnut cropping
season (in days after sowing) of 2008 (open symbols) and 2009 (closed symbols) in
Sadore (ISC08 and ISC09) (triangle) and Patancheru (IHQ08 and IHQ09) (circle). Arrow
headed horizontal line indicate approximate reproductive period (40-90 DAS).
Fig. 3. Ranking of genotypes based on the mean performance and stability of pod yield
under WS conditions in Patancheru and Sadore during the experimental period of 2008
and 2009 (A). Comparison of GGE biplots indicating the existence of mega environment
for the experimental sites of Patancheru and Sadore during the experimental period of
2008 and 2009 (B). The principal component 1 (PC1) and2 (PC2) are represented as the
X- and Y-axis and explained respectively 43.2% and 35.5% of the phenotypic variation.
The AEC represents the average environment coordinate.
Fig. 4. Comparison biplot of the pod yield performances of 247 genotypes using the pod
yield in Patancheru in 2009 and that in Sadore in 2009 as a representation of the two
major mega environments.
HQ08 HQ08 HQ08 HQ09 HQ09 HQ09 SC08 SC08 SC08 SC09 SC09 SC09 HQ08 HQ08 HQ08HQ09 HQ09 HQ09 SC08 SC08 SC08 SC09 SC09 SC09W W W W W W W W W W W W W W W W W W W W W W W W ws ws ws ws ws ws ws ws ws ws ws ws
entryname Hwt Pwt HI Hwt Pwt HI Hwt Pwt HI Hwt Pwt HI Hwt Pwt HI Hwt Pwt HI Hwt Pwt HI Hwt Pwt HIICGV 97183 344.3 328.7 0.51 350.9 279.0 0.46 350.7 267.5 0.44 496.3 365.5 0.38 319.9 163.7 0.32 258.3 183.2 0.42 202.7 141.7 0.42 403.7 237.7 0.36ICGV 97182 327.1 365.2 0.55 462.3 262.4 0.38 374.8 210.9 0.36 426.3 317.6 0.43 351.0 186.8 0.34 294.6 142.3 0.31 225.5 135.2 0.38 312.9 234.6 0.41ICGV 02266 349.8 316.6 0.49 417.1 281.6 0.40 399.8 318.2 0.48 436.7 280.4 0.39 327.6 171.1 0.34 351.2 159.8 0.30 224.5 139.5 0.38 267.4 141.3 0.27ICG 11088 401.0 357.8 0.49 278.5 191.0 0.41 471.3 372.2 0.43 347.1 198.9 0.40 361.1 186.0 0.33 163.0 95.9 0.39 252.7 167.2 0.40 273.4 157.3 0.35ICGV 02189 344.0 300.6 0.48 332.7 246.6 0.43 436.0 300.7 0.40 443.0 238.5 0.35 288.8 122.7 0.28 252.1 152.0 0.38 241.7 152.7 0.40 218.6 175.8 0.45ICG 8751 468.1 229.2 0.31 406.4 192.9 0.31 641.3 400.0 0.38 627.0 343.1 0.35 398.0 132.9 0.23 333.7 120.3 0.25 295.7 164.7 0.38 410.7 181.1 0.30ICGV 01232 390.0 345.3 0.49 295.3 284.0 0.52 368.0 291.8 0.44 454.5 289.9 0.42 247.2 156.3 0.39 178.0 116.3 0.42 181.5 139.7 0.42 255.7 184.6 0.42ICG 12697 366.5 275.4 0.44 369.8 254.9 0.41 298.0 247.8 0.46 379.0 187.2 0.31 268.1 142.9 0.34 256.1 138.3 0.35 237.5 138.5 0.35 287.5 175.1 0.36ICGV 02290 548.2 359.9 0.40 506.8 292.6 0.36 379.8 298.8 0.43 296.3 277.6 0.48 374.0 146.0 0.27 331.2 117.0 0.24 220.8 128.5 0.37 305.1 198.6 0.38ICGS 44 392.4 315.7 0.46 304.5 208.0 0.41 379.8 330.7 0.47 360.6 255.1 0.42 303.5 147.3 0.32 212.4 122.8 0.38 258.0 152.8 0.38 240.9 161.2 0.41ICG 3584 336.6 220.2 0.39 312.5 177.8 0.33 361.8 294.3 0.44 319.3 295.4 0.50 275.8 128.8 0.31 207.8 132.3 0.40 213.5 169.0 0.45 192.7 148.8 0.45ICG 3140 339.9 283.1 0.47 349.1 231.0 0.40 421.7 210.3 0.31 397.9 258.3 0.40 265.5 135.1 0.33 267.4 136.6 0.34 256.8 156.8 0.39 213.5 149.6 0.43ICG 12991 380.7 279.3 0.43 249.2 139.1 0.33 361.8 296.7 0.45 400.9 308.0 0.44 275.8 140.8 0.33 168.5 82.0 0.34 248.3 168.3 0.40 242.1 181.6 0.44ICGV 95377 316.0 268.0 0.47 311.1 217.6 0.42 363.8 298.3 0.45 352.2 252.5 0.41 340.7 156.5 0.30 214.4 139.6 0.41 318.7 128.4 0.28 241.9 146.2 0.31ICG 2106 364.5 289.5 0.45 341.7 254.3 0.43 405.8 328.8 0.44 444.0 255.6 0.39 261.6 133.4 0.33 269.6 153.4 0.36 180.5 130.2 0.43 230.7 152.5 0.43ICG 12625 448.6 233.1 0.33 403.1 200.9 0.32 492.7 271.7 0.35 487.1 283.7 0.39 310.6 119.5 0.26 257.5 91.5 0.25 343.3 134.2 0.28 346.1 222.3 0.39ICG 434 370.1 284.1 0.44 264.2 209.9 0.54 408.0 281.4 0.40 467.1 287.3 0.38 272.2 126.4 0.31 252.6 130.3 0.34 234.8 113.5 0.32 248.2 194.2 0.45ICGV 01276 359.4 166.5 0.29 464.6 334.0 0.42 357.5 255.7 0.41 303.4 282.2 0.48 321.0 151.0 0.31 331.9 134.1 0.28 194.7 125.3 0.40 199.5 153.2 0.44ICG 12879 367.3 267.9 0.42 274.0 175.4 0.39 275.8 251.3 0.47 304.3 300.4 0.51 244.3 147.5 0.38 193.6 76.5 0.28 215.5 162.3 0.42 196.3 175.7 0.49ICGV 96466 304.8 263.0 0.48 238.4 181.3 0.43 385.8 327.0 0.45 360.5 218.9 0.40 231.3 146.7 0.39 194.2 118.0 0.39 175.2 137.5 0.44 272.0 159.3 0.37ICGV 88145 459.1 260.1 0.36 421.8 282.3 0.40 410.3 308.3 0.41 232.9 205.9 0.47 307.5 128.3 0.29 281.8 147.6 0.34 225.7 132.5 0.36 217.5 153.0 0.39ICG 4729 376.9 271.9 0.42 344.1 199.0 0.36 364.7 304.8 0.45 329.7 256.4 0.46 242.8 135.7 0.37 179.7 104.1 0.39 197.5 170.5 0.56 177.1 148.4 0.48ICGV 02271 283.3 248.6 0.48 264.2 227.4 0.48 301.5 364.5 0.56 153.1 174.6 0.55 264.7 137.3 0.34 223.6 129.1 0.37 175.2 155.8 0.46 134.0 135.8 0.52ICGV 94361 387.9 306.1 0.45 343.4 215.8 0.38 341.3 295.7 0.47 396.3 309.4 0.45 363.8 117.1 0.22 221.6 96.7 0.30 255.0 162.8 0.38 306.8 179.0 0.38ICG 5236 366.0 258.0 0.41 246.4 175.3 0.42 294.0 235.5 0.44 389.6 317.0 0.46 244.5 145.3 0.38 161.1 89.0 0.37 202.0 133.8 0.37 182.3 185.9 0.50ICGV 94169 309.8 203.6 0.39 348.4 185.4 0.32 403.5 283.7 0.41 359.1 293.2 0.51 328.0 140.8 0.29 227.7 104.7 0.31 277.7 123.0 0.30 274.2 185.0 0.39ICG 8490 466.4 213.4 0.29 506.6 168.3 0.22 559.8 382.3 0.38 440.8 315.4 0.43 403.6 103.9 0.18 410.9 66.0 0.11 338.7 155.2 0.32 408.6 227.8 0.35ICG 10092 357.9 271.8 0.44 372.8 256.0 0.40 514.8 295.3 0.34 622.2 288.2 0.29 315.8 129.0 0.28 219.1 107.7 0.34 331.2 128.7 0.26 409.2 186.3 0.27ICG 13856 384.3 241.5 0.38 250.0 161.0 0.38 385.5 292.0 0.44 625.4 299.5 0.32 259.2 121.8 0.31 201.7 107.0 0.35 178.0 133.3 0.48 468.4 186.8 0.28ICG 10053 467.3 275.8 0.37 287.0 196.9 0.40 480.0 295.2 0.38 478.2 309.4 0.39 308.1 102.4 0.23 227.4 92.5 0.28 265.7 174.7 0.39 361.7 177.6 0.30ICG 3312 324.4 237.0 0.42 312.9 167.7 0.34 447.3 334.7 0.43 305.3 252.8 0.46 275.8 148.6 0.35 160.2 75.5 0.32 227.3 157.0 0.40 189.8 163.7 0.48ICG 8567 377.9 209.8 0.34 285.5 143.0 0.28 502.0 339.7 0.40 421.4 236.4 0.35 243.0 133.0 0.35 211.5 120.8 0.37 210.5 116.5 0.36 271.6 173.3 0.41ICG 15287 406.0 199.9 0.31 400.3 156.3 0.25 577.0 370.8 0.39 375.0 242.0 0.40 318.0 120.6 0.26 243.8 126.0 0.34 278.2 140.0 0.34 238.6 156.4 0.37ICG 12988 404.3 269.2 0.40 311.2 165.3 0.33 446.8 274.4 0.39 618.6 333.7 0.35 264.4 128.5 0.32 193.4 88.2 0.32 226.3 137.2 0.38 322.4 188.1 0.37
Supplementary Table 1: Haulm weight (Hwt), pod weight (Pwt) and harvest index (HI) of 247 genotypes under Well water (ww)and water stress (ws) conditions during 2008 (08) and 2009 (09) at Patancheru (HQ) and Sadore (SC)

ICGV 02286 448.9 282.8 0.38 286.7 308.8 0.60 331.5 246.5 0.41 454.7 364.6 0.41 421.1 144.4 0.23 288.6 120.5 0.28 251.0 102.2 0.28 393.8 171.3 0.27ICGV 87378 393.8 322.2 0.46 376.9 293.8 0.45 467.0 312.7 0.39 238.7 194.5 0.44 315.8 151.0 0.31 216.0 125.0 0.37 258.7 131.3 0.33 195.1 128.2 0.42ICG 9809 390.1 276.0 0.42 256.0 157.4 0.38 480.7 309.0 0.38 394.1 241.1 0.39 224.2 142.9 0.40 185.8 90.2 0.34 266.2 126.8 0.33 195.5 172.3 0.48ICG 4750 387.9 254.4 0.40 346.2 191.7 0.34 442.2 351.3 0.44 319.1 209.8 0.39 270.8 118.3 0.29 223.8 141.7 0.40 261.5 168.2 0.39 171.5 101.2 0.40ICG 11687 350.3 237.9 0.40 275.4 130.5 0.29 488.7 358.7 0.43 295.8 351.8 0.56 267.1 145.0 0.35 143.8 71.6 0.35 174.3 118.5 0.42 305.7 193.6 0.39ICG 1519 338.3 240.7 0.42 268.8 164.1 0.37 284.0 268.3 0.47 295.9 264.6 0.47 225.2 132.9 0.37 175.6 90.7 0.35 165.5 144.2 0.48 241.6 161.0 0.46ICG 3421 351.7 276.2 0.45 311.7 183.4 0.35 337.0 294.0 0.46 260.0 216.9 0.46 211.8 133.5 0.40 197.6 94.7 0.34 240.8 167.5 0.40 137.5 132.3 0.52ICGV 02446 417.1 239.0 0.35 530.5 321.1 0.37 442.3 219.2 0.33 430.2 277.3 0.39 360.8 164.0 0.30 320.9 124.3 0.26 250.2 79.0 0.23 291.7 159.8 0.29ICG 11542 324.6 212.7 0.39 321.4 157.8 0.30 500.2 309.2 0.38 670.3 369.7 0.34 254.5 76.1 0.21 221.4 90.5 0.29 285.7 137.7 0.33 531.1 222.4 0.29ICG 1137 324.5 191.5 0.36 256.7 137.2 0.32 404.5 279.8 0.40 414.8 277.3 0.40 241.3 128.5 0.35 196.4 113.9 0.38 198.5 130.0 0.41 217.6 153.9 0.44ICG 11219 448.2 215.3 0.31 433.2 165.8 0.25 573.8 360.2 0.38 339.2 276.7 0.45 349.7 86.9 0.17 318.3 64.4 0.14 413.8 122.7 0.23 345.4 252.0 0.40ICGV 86590 416.1 300.7 0.43 434.9 240.8 0.35 429.7 348.7 0.40 360.3 239.1 0.41 424.8 122.8 0.20 293.4 121.3 0.28 287.0 147.8 0.33 242.4 134.0 0.40ICG 11322 451.8 291.1 0.39 374.6 265.7 0.42 269.7 238.3 0.47 314.7 196.2 0.38 331.2 118.9 0.25 330.8 133.0 0.27 184.5 121.3 0.39 175.6 152.3 0.47ICG 6407 319.6 198.0 0.37 311.5 177.4 0.35 549.2 269.0 0.33 623.0 407.8 0.41 247.6 102.9 0.28 193.3 91.6 0.33 266.8 133.0 0.34 438.0 196.9 0.29ICG 2031 385.7 249.0 0.39 293.9 171.8 0.35 431.8 369.5 0.47 308.4 154.4 0.40 247.6 123.9 0.33 234.7 106.1 0.31 222.0 148.5 0.40 194.5 140.7 0.44ICGV 93470 251.6 279.8 0.56 225.9 241.8 0.55 347.8 323.3 0.48 280.7 221.2 0.47 230.3 139.4 0.39 172.0 111.7 0.41 178.2 128.2 0.42 169.4 139.3 0.46ICG 11386 440.0 243.9 0.35 491.0 253.9 0.33 508.0 299.8 0.38 397.4 173.9 0.30 355.5 145.7 0.28 365.8 97.7 0.19 241.7 102.2 0.21 417.5 170.7 0.30ICG 4764 316.8 211.7 0.42 364.5 213.5 0.36 413.5 304.2 0.42 327.8 216.1 0.40 277.2 114.9 0.28 259.0 121.5 0.31 316.0 165.5 0.33 185.9 113.3 0.38ICGV 87921 338.9 296.6 0.48 278.6 219.3 0.45 358.3 241.5 0.40 459.4 214.7 0.33 303.7 150.3 0.31 221.7 140.6 0.40 172.3 102.0 0.38 272.5 122.3 0.33ICG 3240 338.8 234.8 0.41 270.6 135.6 0.30 402.8 260.7 0.38 431.2 294.2 0.40 249.0 114.7 0.31 184.7 101.4 0.37 279.7 136.7 0.32 282.5 162.1 0.38ICG 297 272.8 212.3 0.44 327.3 206.9 0.38 493.0 364.2 0.43 468.4 309.6 0.40 228.8 100.3 0.30 226.4 125.6 0.36 197.3 94.0 0.31 291.0 194.7 0.40ICG 1487 308.8 247.2 0.46 340.3 180.5 0.33 424.5 275.3 0.38 373.7 267.9 0.42 214.4 116.8 0.36 209.4 102.4 0.34 281.2 152.0 0.35 208.3 143.2 0.41ICG 5327 429.5 260.5 0.37 576.0 248.5 0.29 323.2 280.5 0.46 493.9 235.2 0.34 438.1 121.1 0.19 385.7 94.0 0.17 251.9 141.8 0.36 229.9 156.4 0.41ICG 4670 354.2 261.5 0.43 362.0 211.0 0.36 441.0 310.0 0.40 293.8 209.3 0.42 232.5 115.6 0.33 264.1 142.1 0.35 272.2 157.2 0.39 169.6 97.7 0.36ICG 8517 453.6 141.7 0.20 363.3 183.9 0.32 634.8 429.5 0.39 487.6 217.9 0.29 277.9 89.6 0.23 273.5 110.4 0.28 274.2 148.5 0.34 397.1 163.3 0.24ICG 36 340.7 233.9 0.41 379.3 174.6 0.29 424.7 245.8 0.36 397.6 220.0 0.36 276.6 110.5 0.28 214.2 99.1 0.32 201.8 135.3 0.40 289.9 166.0 0.37ICG 5745 442.8 321.9 0.42 447.4 328.4 0.43 474.8 305.0 0.38 421.9 340.2 0.46 363.7 121.0 0.23 271.2 124.6 0.31 256.7 116.5 0.30 256.3 148.5 0.37ICGV 92234 316.5 210.6 0.39 270.7 151.2 0.34 509.2 305.2 0.37 534.2 247.2 0.30 232.0 97.5 0.29 205.9 98.5 0.33 208.3 124.3 0.38 416.9 189.9 0.22ICG 14985 364.8 238.2 0.39 426.6 169.3 0.26 368.3 378.3 0.50 314.5 250.0 0.44 261.3 112.3 0.29 330.9 72.2 0.15 221.3 151.8 0.40 272.8 171.5 0.38ICG 9507 348.5 241.6 0.41 341.6 178.4 0.32 467.7 312.2 0.39 476.5 322.7 0.40 288.1 90.1 0.22 224.4 90.1 0.28 230.0 105.8 0.32 480.9 220.0 0.31ICG 3673 346.7 187.4 0.33 243.2 142.9 0.34 373.8 284.2 0.46 623.5 375.9 0.42 266.0 83.3 0.22 223.9 99.4 0.30 272.8 145.7 0.33 305.1 177.1 0.34ICGV 98294 356.7 341.7 0.51 173.4 153.5 0.50 353.5 224.8 0.38 504.8 284.9 0.36 268.2 193.3 0.43 137.6 58.5 0.31 252.5 108.8 0.30 321.2 143.7 0.27ICG 11144 356.2 238.2 0.40 312.8 145.8 0.29 530.7 377.8 0.42 587.7 283.1 0.33 239.6 98.9 0.28 246.2 118.7 0.32 235.7 139.2 0.37 496.1 147.1 0.24ICG 3746 319.2 256.1 0.46 236.7 157.6 0.38 422.3 287.3 0.39 305.8 229.8 0.42 238.6 143.8 0.38 179.3 79.4 0.31 294.7 172.8 0.37 146.4 105.9 0.43ICG 1711 345.1 219.4 0.38 322.5 154.4 0.30 321.0 265.3 0.43 442.2 260.9 0.40 232.5 110.9 0.32 196.0 95.9 0.33 156.0 131.0 0.37 248.7 164.2 0.40ICG 862 382.8 224.4 0.36 476.2 172.9 0.24 356.3 217.7 0.37 376.0 269.2 0.40 392.6 132.2 0.23 338.3 78.5 0.16 202.7 106.0 0.35 403.2 182.4 0.28ICGV 87160 325.9 251.1 0.44 329.2 267.5 0.46 335.8 262.7 0.41 291.1 255.8 0.45 249.1 85.2 0.24 252.1 111.1 0.30 261.7 138.0 0.34 324.9 164.7 0.34
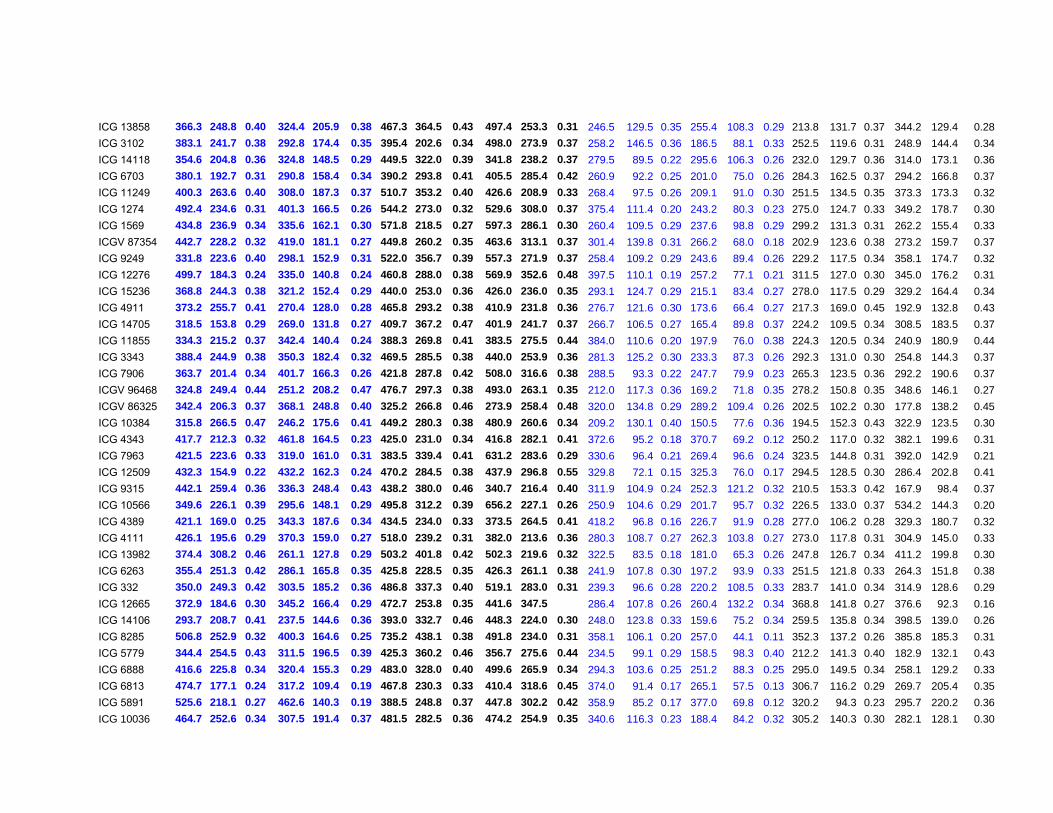
ICG 13858 366.3 248.8 0.40 324.4 205.9 0.38 467.3 364.5 0.43 497.4 253.3 0.31 246.5 129.5 0.35 255.4 108.3 0.29 213.8 131.7 0.37 344.2 129.4 0.28ICG 3102 383.1 241.7 0.38 292.8 174.4 0.35 395.4 202.6 0.34 498.0 273.9 0.37 258.2 146.5 0.36 186.5 88.1 0.33 252.5 119.6 0.31 248.9 144.4 0.34ICG 14118 354.6 204.8 0.36 324.8 148.5 0.29 449.5 322.0 0.39 341.8 238.2 0.37 279.5 89.5 0.22 295.6 106.3 0.26 232.0 129.7 0.36 314.0 173.1 0.36ICG 6703 380.1 192.7 0.31 290.8 158.4 0.34 390.2 293.8 0.41 405.5 285.4 0.42 260.9 92.2 0.25 201.0 75.0 0.26 284.3 162.5 0.37 294.2 166.8 0.37ICG 11249 400.3 263.6 0.40 308.0 187.3 0.37 510.7 353.2 0.40 426.6 208.9 0.33 268.4 97.5 0.26 209.1 91.0 0.30 251.5 134.5 0.35 373.3 173.3 0.32ICG 1274 492.4 234.6 0.31 401.3 166.5 0.26 544.2 273.0 0.32 529.6 308.0 0.37 375.4 111.4 0.20 243.2 80.3 0.23 275.0 124.7 0.33 349.2 178.7 0.30ICG 1569 434.8 236.9 0.34 335.6 162.1 0.30 571.8 218.5 0.27 597.3 286.1 0.30 260.4 109.5 0.29 237.6 98.8 0.29 299.2 131.3 0.31 262.2 155.4 0.33ICGV 87354 442.7 228.2 0.32 419.0 181.1 0.27 449.8 260.2 0.35 463.6 313.1 0.37 301.4 139.8 0.31 266.2 68.0 0.18 202.9 123.6 0.38 273.2 159.7 0.37ICG 9249 331.8 223.6 0.40 298.1 152.9 0.31 522.0 356.7 0.39 557.3 271.9 0.37 258.4 109.2 0.29 243.6 89.4 0.26 229.2 117.5 0.34 358.1 174.7 0.32ICG 12276 499.7 184.3 0.24 335.0 140.8 0.24 460.8 288.0 0.38 569.9 352.6 0.48 397.5 110.1 0.19 257.2 77.1 0.21 311.5 127.0 0.30 345.0 176.2 0.31ICG 15236 368.8 244.3 0.38 321.2 152.4 0.29 440.0 253.0 0.36 426.0 236.0 0.35 293.1 124.7 0.29 215.1 83.4 0.27 278.0 117.5 0.29 329.2 164.4 0.34ICG 4911 373.2 255.7 0.41 270.4 128.0 0.28 465.8 293.2 0.38 410.9 231.8 0.36 276.7 121.6 0.30 173.6 66.4 0.27 217.3 169.0 0.45 192.9 132.8 0.43ICG 14705 318.5 153.8 0.29 269.0 131.8 0.27 409.7 367.2 0.47 401.9 241.7 0.37 266.7 106.5 0.27 165.4 89.8 0.37 224.2 109.5 0.34 308.5 183.5 0.37ICG 11855 334.3 215.2 0.37 342.4 140.4 0.24 388.3 269.8 0.41 383.5 275.5 0.44 384.0 110.6 0.20 197.9 76.0 0.38 224.3 120.5 0.34 240.9 180.9 0.44ICG 3343 388.4 244.9 0.38 350.3 182.4 0.32 469.5 285.5 0.38 440.0 253.9 0.36 281.3 125.2 0.30 233.3 87.3 0.26 292.3 131.0 0.30 254.8 144.3 0.37ICG 7906 363.7 201.4 0.34 401.7 166.3 0.26 421.8 287.8 0.42 508.0 316.6 0.38 288.5 93.3 0.22 247.7 79.9 0.23 265.3 123.5 0.36 292.2 190.6 0.37ICGV 96468 324.8 249.4 0.44 251.2 208.2 0.47 476.7 297.3 0.38 493.0 263.1 0.35 212.0 117.3 0.36 169.2 71.8 0.35 278.2 150.8 0.35 348.6 146.1 0.27ICGV 86325 342.4 206.3 0.37 368.1 248.8 0.40 325.2 266.8 0.46 273.9 258.4 0.48 320.0 134.8 0.29 289.2 109.4 0.26 202.5 102.2 0.30 177.8 138.2 0.45ICG 10384 315.8 266.5 0.47 246.2 175.6 0.41 449.2 280.3 0.38 480.9 260.6 0.34 209.2 130.1 0.40 150.5 77.6 0.36 194.5 152.3 0.43 322.9 123.5 0.30ICG 4343 417.7 212.3 0.32 461.8 164.5 0.23 425.0 231.0 0.34 416.8 282.1 0.41 372.6 95.2 0.18 370.7 69.2 0.12 250.2 117.0 0.32 382.1 199.6 0.31ICG 7963 421.5 223.6 0.33 319.0 161.0 0.31 383.5 339.4 0.41 631.2 283.6 0.29 330.6 96.4 0.21 269.4 96.6 0.24 323.5 144.8 0.31 392.0 142.9 0.21ICG 12509 432.3 154.9 0.22 432.2 162.3 0.24 470.2 284.5 0.38 437.9 296.8 0.55 329.8 72.1 0.15 325.3 76.0 0.17 294.5 128.5 0.30 286.4 202.8 0.41ICG 9315 442.1 259.4 0.36 336.3 248.4 0.43 438.2 380.0 0.46 340.7 216.4 0.40 311.9 104.9 0.24 252.3 121.2 0.32 210.5 153.3 0.42 167.9 98.4 0.37ICG 10566 349.6 226.1 0.39 295.6 148.1 0.29 495.8 312.2 0.39 656.2 227.1 0.26 250.9 104.6 0.29 201.7 95.7 0.32 226.5 133.0 0.37 534.2 144.3 0.20ICG 4389 421.1 169.0 0.25 343.3 187.6 0.34 434.5 234.0 0.33 373.5 264.5 0.41 418.2 96.8 0.16 226.7 91.9 0.28 277.0 106.2 0.28 329.3 180.7 0.32ICG 4111 426.1 195.6 0.29 370.3 159.0 0.27 518.0 239.2 0.31 382.0 213.6 0.36 280.3 108.7 0.27 262.3 103.8 0.27 273.0 117.8 0.31 304.9 145.0 0.33ICG 13982 374.4 308.2 0.46 261.1 127.8 0.29 503.2 401.8 0.42 502.3 219.6 0.32 322.5 83.5 0.18 181.0 65.3 0.26 247.8 126.7 0.34 411.2 199.8 0.30ICG 6263 355.4 251.3 0.42 286.1 165.8 0.35 425.8 228.5 0.35 426.3 261.1 0.38 241.9 107.8 0.30 197.2 93.9 0.33 251.5 121.8 0.33 264.3 151.8 0.38ICG 332 350.0 249.3 0.42 303.5 185.2 0.36 486.8 337.3 0.40 519.1 283.0 0.31 239.3 96.6 0.28 220.2 108.5 0.33 283.7 141.0 0.34 314.9 128.6 0.29ICG 12665 372.9 184.6 0.30 345.2 166.4 0.29 472.7 253.8 0.35 441.6 347.5 286.4 107.8 0.26 260.4 132.2 0.34 368.8 141.8 0.27 376.6 92.3 0.16ICG 14106 293.7 208.7 0.41 237.5 144.6 0.36 393.0 332.7 0.46 448.3 224.0 0.30 248.0 123.8 0.33 159.6 75.2 0.34 259.5 135.8 0.34 398.5 139.0 0.26ICG 8285 506.8 252.9 0.32 400.3 164.6 0.25 735.2 438.1 0.38 491.8 234.0 0.31 358.1 106.1 0.20 257.0 44.1 0.11 352.3 137.2 0.26 385.8 185.3 0.31ICG 5779 344.4 254.5 0.43 311.5 196.5 0.39 425.3 360.2 0.46 356.7 275.6 0.44 234.5 99.1 0.29 158.5 98.3 0.40 212.2 141.3 0.40 182.9 132.1 0.43ICG 6888 416.6 225.8 0.34 320.4 155.3 0.29 483.0 328.0 0.40 499.6 265.9 0.34 294.3 103.6 0.25 251.2 88.3 0.25 295.0 149.5 0.34 258.1 129.2 0.33ICG 6813 474.7 177.1 0.24 317.2 109.4 0.19 467.8 230.3 0.33 410.4 318.6 0.45 374.0 91.4 0.17 265.1 57.5 0.13 306.7 116.2 0.29 269.7 205.4 0.35ICG 5891 525.6 218.1 0.27 462.6 140.3 0.19 388.5 248.8 0.37 447.8 302.2 0.42 358.9 85.2 0.17 377.0 69.8 0.12 320.2 94.3 0.23 295.7 220.2 0.36ICG 10036 464.7 252.6 0.34 307.5 191.4 0.37 481.5 282.5 0.36 474.2 254.9 0.35 340.6 116.3 0.23 188.4 84.2 0.32 305.2 140.3 0.30 282.1 128.1 0.30
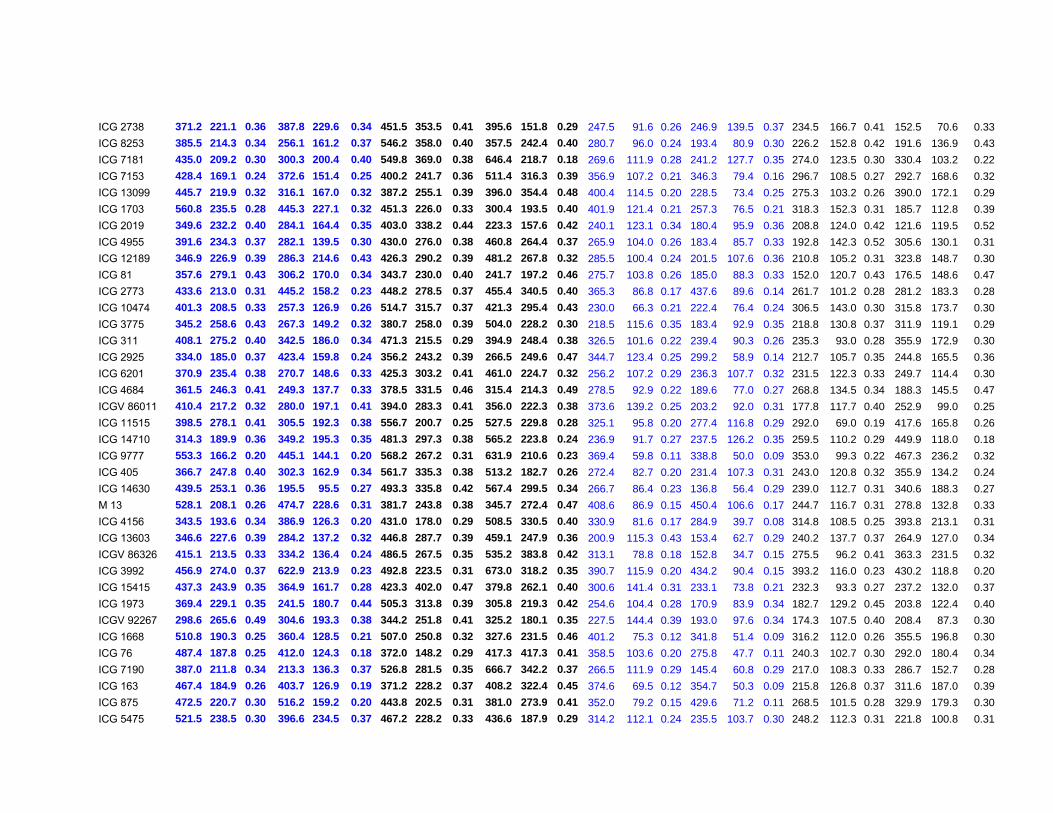
ICG 2738 371.2 221.1 0.36 387.8 229.6 0.34 451.5 353.5 0.41 395.6 151.8 0.29 247.5 91.6 0.26 246.9 139.5 0.37 234.5 166.7 0.41 152.5 70.6 0.33ICG 8253 385.5 214.3 0.34 256.1 161.2 0.37 546.2 358.0 0.40 357.5 242.4 0.40 280.7 96.0 0.24 193.4 80.9 0.30 226.2 152.8 0.42 191.6 136.9 0.43ICG 7181 435.0 209.2 0.30 300.3 200.4 0.40 549.8 369.0 0.38 646.4 218.7 0.18 269.6 111.9 0.28 241.2 127.7 0.35 274.0 123.5 0.30 330.4 103.2 0.22ICG 7153 428.4 169.1 0.24 372.6 151.4 0.25 400.2 241.7 0.36 511.4 316.3 0.39 356.9 107.2 0.21 346.3 79.4 0.16 296.7 108.5 0.27 292.7 168.6 0.32ICG 13099 445.7 219.9 0.32 316.1 167.0 0.32 387.2 255.1 0.39 396.0 354.4 0.48 400.4 114.5 0.20 228.5 73.4 0.25 275.3 103.2 0.26 390.0 172.1 0.29ICG 1703 560.8 235.5 0.28 445.3 227.1 0.32 451.3 226.0 0.33 300.4 193.5 0.40 401.9 121.4 0.21 257.3 76.5 0.21 318.3 152.3 0.31 185.7 112.8 0.39ICG 2019 349.6 232.2 0.40 284.1 164.4 0.35 403.0 338.2 0.44 223.3 157.6 0.42 240.1 123.1 0.34 180.4 95.9 0.36 208.8 124.0 0.42 121.6 119.5 0.52ICG 4955 391.6 234.3 0.37 282.1 139.5 0.30 430.0 276.0 0.38 460.8 264.4 0.37 265.9 104.0 0.26 183.4 85.7 0.33 192.8 142.3 0.52 305.6 130.1 0.31ICG 12189 346.9 226.9 0.39 286.3 214.6 0.43 426.3 290.2 0.39 481.2 267.8 0.32 285.5 100.4 0.24 201.5 107.6 0.36 210.8 105.2 0.31 323.8 148.7 0.30ICG 81 357.6 279.1 0.43 306.2 170.0 0.34 343.7 230.0 0.40 241.7 197.2 0.46 275.7 103.8 0.26 185.0 88.3 0.33 152.0 120.7 0.43 176.5 148.6 0.47ICG 2773 433.6 213.0 0.31 445.2 158.2 0.23 448.2 278.5 0.37 455.4 340.5 0.40 365.3 86.8 0.17 437.6 89.6 0.14 261.7 101.2 0.28 281.2 183.3 0.28ICG 10474 401.3 208.5 0.33 257.3 126.9 0.26 514.7 315.7 0.37 421.3 295.4 0.43 230.0 66.3 0.21 222.4 76.4 0.24 306.5 143.0 0.30 315.8 173.7 0.30ICG 3775 345.2 258.6 0.43 267.3 149.2 0.32 380.7 258.0 0.39 504.0 228.2 0.30 218.5 115.6 0.35 183.4 92.9 0.35 218.8 130.8 0.37 311.9 119.1 0.29ICG 311 408.1 275.2 0.40 342.5 186.0 0.34 471.3 215.5 0.29 394.9 248.4 0.38 326.5 101.6 0.22 239.4 90.3 0.26 235.3 93.0 0.28 355.9 172.9 0.30ICG 2925 334.0 185.0 0.37 423.4 159.8 0.24 356.2 243.2 0.39 266.5 249.6 0.47 344.7 123.4 0.25 299.2 58.9 0.14 212.7 105.7 0.35 244.8 165.5 0.36ICG 6201 370.9 235.4 0.38 270.7 148.6 0.33 425.3 303.2 0.41 461.0 224.7 0.32 256.2 107.2 0.29 236.3 107.7 0.32 231.5 122.3 0.33 249.7 114.4 0.30ICG 4684 361.5 246.3 0.41 249.3 137.7 0.33 378.5 331.5 0.46 315.4 214.3 0.49 278.5 92.9 0.22 189.6 77.0 0.27 268.8 134.5 0.34 188.3 145.5 0.47ICGV 86011 410.4 217.2 0.32 280.0 197.1 0.41 394.0 283.3 0.41 356.0 222.3 0.38 373.6 139.2 0.25 203.2 92.0 0.31 177.8 117.7 0.40 252.9 99.0 0.25ICG 11515 398.5 278.1 0.41 305.5 192.3 0.38 556.7 200.7 0.25 527.5 229.8 0.28 325.1 95.8 0.20 277.4 116.8 0.29 292.0 69.0 0.19 417.6 165.8 0.26ICG 14710 314.3 189.9 0.36 349.2 195.3 0.35 481.3 297.3 0.38 565.2 223.8 0.24 236.9 91.7 0.27 237.5 126.2 0.35 259.5 110.2 0.29 449.9 118.0 0.18ICG 9777 553.3 166.2 0.20 445.1 144.1 0.20 568.2 267.2 0.31 631.9 210.6 0.23 369.4 59.8 0.11 338.8 50.0 0.09 353.0 99.3 0.22 467.3 236.2 0.32ICG 405 366.7 247.8 0.40 302.3 162.9 0.34 561.7 335.3 0.38 513.2 182.7 0.26 272.4 82.7 0.20 231.4 107.3 0.31 243.0 120.8 0.32 355.9 134.2 0.24ICG 14630 439.5 253.1 0.36 195.5 95.5 0.27 493.3 335.8 0.42 567.4 299.5 0.34 266.7 86.4 0.23 136.8 56.4 0.29 239.0 112.7 0.31 340.6 188.3 0.27M 13 528.1 208.1 0.26 474.7 228.6 0.31 381.7 243.8 0.38 345.7 272.4 0.47 408.6 86.9 0.15 450.4 106.6 0.17 244.7 116.7 0.31 278.8 132.8 0.33ICG 4156 343.5 193.6 0.34 386.9 126.3 0.20 431.0 178.0 0.29 508.5 330.5 0.40 330.9 81.6 0.17 284.9 39.7 0.08 314.8 108.5 0.25 393.8 213.1 0.31ICG 13603 346.6 227.6 0.39 284.2 137.2 0.32 446.8 287.7 0.39 459.1 247.9 0.36 200.9 115.3 0.43 153.4 62.7 0.29 240.2 137.7 0.37 264.9 127.0 0.34ICGV 86326 415.1 213.5 0.33 334.2 136.4 0.24 486.5 267.5 0.35 535.2 383.8 0.42 313.1 78.8 0.18 152.8 34.7 0.15 275.5 96.2 0.41 363.3 231.5 0.32ICG 3992 456.9 274.0 0.37 622.9 213.9 0.23 492.8 223.5 0.31 673.0 318.2 0.35 390.7 115.9 0.20 434.2 90.4 0.15 393.2 116.0 0.23 430.2 118.8 0.20ICG 15415 437.3 243.9 0.35 364.9 161.7 0.28 423.3 402.0 0.47 379.8 262.1 0.40 300.6 141.4 0.31 233.1 73.8 0.21 232.3 93.3 0.27 237.2 132.0 0.37ICG 1973 369.4 229.1 0.35 241.5 180.7 0.44 505.3 313.8 0.39 305.8 219.3 0.42 254.6 104.4 0.28 170.9 83.9 0.34 182.7 129.2 0.45 203.8 122.4 0.40ICGV 92267 298.6 265.6 0.49 304.6 193.3 0.38 344.2 251.8 0.41 325.2 180.1 0.35 227.5 144.4 0.39 193.0 97.6 0.34 174.3 107.5 0.40 208.4 87.3 0.30ICG 1668 510.8 190.3 0.25 360.4 128.5 0.21 507.0 250.8 0.32 327.6 231.5 0.46 401.2 75.3 0.12 341.8 51.4 0.09 316.2 112.0 0.26 355.5 196.8 0.30ICG 76 487.4 187.8 0.25 412.0 124.3 0.18 372.0 148.2 0.29 417.3 417.3 0.41 358.5 103.6 0.20 275.8 47.7 0.11 240.3 102.7 0.30 292.0 180.4 0.34ICG 7190 387.0 211.8 0.34 213.3 136.3 0.37 526.8 281.5 0.35 666.7 342.2 0.37 266.5 111.9 0.29 145.4 60.8 0.29 217.0 108.3 0.33 286.7 152.7 0.28ICG 163 467.4 184.9 0.26 403.7 126.9 0.19 371.2 228.2 0.37 408.2 322.4 0.45 374.6 69.5 0.12 354.7 50.3 0.09 215.8 126.8 0.37 311.6 187.0 0.39ICG 875 472.5 220.7 0.30 516.2 159.2 0.20 443.8 202.5 0.31 381.0 273.9 0.41 352.0 79.2 0.15 429.6 71.2 0.11 268.5 101.5 0.28 329.9 179.3 0.30ICG 5475 521.5 238.5 0.30 396.6 234.5 0.37 467.2 228.2 0.33 436.6 187.9 0.29 314.2 112.1 0.24 235.5 103.7 0.30 248.2 112.3 0.31 221.8 100.8 0.31

ICGV 92206 214.0 259.9 0.59 166.6 167.2 0.53 331.8 363.7 0.53 256.8 210.0 0.43 176.1 135.5 0.45 117.9 58.2 0.38 131.8 118.8 0.48 206.3 116.1 0.39ICG 5662 467.4 203.5 0.28 367.6 158.9 0.26 502.0 278.8 0.34 546.3 261.6 0.33 333.5 93.5 0.20 303.9 97.9 0.23 327.3 124.6 0.26 308.5 111.6 0.25ICG 14834 503.2 284.5 0.36 394.3 168.4 0.27 333.0 221.8 0.39 587.9 403.9 0.42 294.1 92.1 0.21 424.4 92.0 0.15 270.2 73.8 0.19 415.8 167.7 0.28ICG 10185 508.1 227.6 0.29 478.4 175.7 0.26 653.8 265.0 0.27 598.7 278.0 0.26 367.7 74.3 0.13 373.6 60.1 0.10 325.7 102.2 0.24 483.3 187.1 0.28ICG 14466 512.0 168.2 0.21 449.0 130.3 0.18 441.5 219.7 0.33 556.2 336.5 0.36 355.1 75.7 0.15 298.3 47.0 0.10 303.0 106.8 0.26 370.8 192.3 0.34ICG 6057 550.9 157.5 0.19 456.7 130.8 0.17 565.8 285.3 0.33 533.8 260.6 0.30 430.8 80.6 0.13 351.9 54.7 0.10 339.5 82.2 0.19 447.2 202.4 0.29ICG 5609 354.7 252.1 0.42 305.5 165.9 0.33 561.0 293.3 0.33 491.9 207.0 0.27 268.1 110.1 0.28 215.0 83.2 0.28 270.5 107.2 0.27 337.6 118.3 0.25ICG 4538 532.8 186.9 0.23 447.8 143.5 0.20 479.2 234.8 0.33 303.3 209.9 0.51 431.1 76.7 0.12 341.4 50.5 0.09 339.5 109.2 0.24 217.2 181.0 0.46ICG 9037 415.1 161.5 0.25 435.2 139.8 0.20 484.5 259.8 0.34 491.3 321.2 0.39 421.0 104.7 0.17 344.3 65.1 0.13 263.2 98.5 0.28 318.6 148.2 0.29ICG 5827 355.4 185.2 0.32 443.6 182.9 0.26 651.7 317.7 0.32 612.6 321.7 0.34 308.2 98.2 0.22 394.2 84.8 0.14 383.2 82.0 0.16 442.0 148.2 0.20ICG 13491 374.1 243.6 0.39 344.3 173.1 0.31 490.3 213.5 0.30 483.4 286.1 0.37 314.6 84.0 0.18 250.3 94.7 0.26 313.0 93.7 0.22 367.2 140.3 0.28ICG 3027 518.8 240.0 0.30 309.6 114.4 0.21 516.0 272.5 0.34 554.1 294.3 0.34 413.2 97.3 0.16 252.0 48.7 0.13 350.7 108.2 0.25 362.8 157.5 0.29ICG 2857 489.2 165.8 0.24 330.3 190.1 0.33 562.3 280.0 0.32 464.6 316.3 0.41 459.1 64.5 0.09 327.9 64.7 0.14 263.5 75.8 0.22 363.5 205.5 0.31ICG 4527 546.3 262.9 0.31 393.4 143.4 0.23 344.2 182.2 0.34 372.9 270.6 0.42 369.7 87.0 0.16 306.7 54.0 0.11 258.8 105.3 0.28 370.6 163.9 0.30ICG 11109 414.8 156.4 0.24 325.0 95.6 0.16 603.2 350.2 0.38 422.7 302.0 0.43 318.9 72.1 0.16 336.6 47.2 0.09 332.7 86.7 0.20 380.2 201.3 0.32ICG 12370 570.9 233.5 0.27 558.9 194.2 0.24 561.2 277.7 0.33 615.3 288.2 0.32 337.4 75.8 0.16 406.2 66.7 0.10 260.0 97.5 0.28 343.2 166.5 0.33ICG 5221 492.3 285.3 0.36 344.3 135.4 0.24 488.0 345.2 0.41 501.3 213.6 0.28 382.2 90.9 0.17 227.0 85.7 0.27 299.0 108.2 0.26 321.6 121.3 0.29ICG 15309 401.0 212.7 0.33 281.6 154.4 0.33 404.8 299.0 0.42 463.1 225.6 0.28 287.3 87.0 0.21 227.3 67.3 0.21 241.7 140.3 0.36 305.1 111.1 0.26ICG 5494 357.3 261.4 0.43 325.2 192.8 0.37 503.0 242.8 0.33 471.4 235.8 0.35 219.8 109.0 0.32 221.0 95.2 0.30 242.2 101.8 0.29 226.1 99.7 0.33ICG 12672 511.1 193.4 0.25 546.3 228.4 0.28 423.8 226.1 0.35 184.1 207.0 0.59 336.3 81.2 0.16 408.8 75.4 0.13 307.3 109.0 0.26 300.8 139.6 0.32ICG 9987 546.8 220.4 0.27 413.7 219.3 0.33 717.5 246.3 0.24 673.9 277.8 0.24 322.2 100.8 0.21 283.3 85.1 0.21 402.8 98.7 0.19 541.6 118.2 0.17ICG 1142 382.1 251.4 0.39 251.3 125.6 0.29 341.0 224.5 0.39 517.3 286.3 0.36 248.5 81.0 0.23 166.4 62.2 0.29 233.3 125.5 0.36 310.9 133.7 0.32ICG 7969 416.8 229.8 0.35 275.8 103.2 0.20 581.7 341.5 0.37 632.0 313.0 0.34 261.3 69.2 0.18 154.9 45.0 0.22 267.3 162.7 0.37 286.5 125.2 0.28ICG 14475 571.2 257.6 0.30 446.5 180.1 0.26 419.8 207.8 0.32 516.9 301.9 0.36 357.8 76.7 0.15 283.6 59.9 0.14 294.7 95.2 0.24 346.7 167.6 0.31ICG 15042 381.0 155.7 0.26 366.6 176.5 0.30 377.3 236.7 0.38 368.6 259.6 0.42 326.9 92.4 0.20 233.3 57.7 0.17 280.0 133.2 0.31 205.8 113.8 0.30ICG 532 489.4 265.3 0.34 335.9 137.1 0.24 474.2 230.5 0.32 465.7 268.6 0.35 405.6 87.9 0.15 294.9 72.6 0.17 245.2 83.2 0.25 375.9 153.2 0.26ICG 111 529.7 247.0 0.30 443.9 158.8 0.24 410.8 216.3 0.35 438.5 205.8 0.32 342.0 88.6 0.18 413.0 71.0 0.11 276.8 114.7 0.28 302.9 122.5 0.28ICG 14482 482.9 186.4 0.25 542.9 240.8 0.29 461.9 235.6 0.31 415.2 340.2 0.46 456.6 78.5 0.11 209.1 47.3 0.18 329.9 97.8 0.25 343.6 173.0 0.33ICG 13895 407.6 257.9 0.38 377.4 151.4 0.25 452.8 349.8 0.44 340.5 330.3 0.50 307.1 77.8 0.17 328.7 71.0 0.15 253.0 115.5 0.31 251.3 132.1 0.40ICG 5016 395.0 145.8 0.23 273.9 116.0 0.25 462.5 266.7 0.37 540.9 342.8 0.40 319.3 89.8 0.19 304.2 61.7 0.14 293.2 98.5 0.24 424.6 146.2 0.21ICG 9362 409.8 194.1 0.30 270.2 148.8 0.32 361.8 341.8 0.49 353.6 238.4 0.44 266.2 104.4 0.27 226.6 89.4 0.27 166.2 109.0 0.40 156.8 90.8 0.38ICG 4998 404.2 145.2 0.21 392.1 123.4 0.18 410.2 195.0 0.32 425.7 309.4 0.43 299.1 78.5 0.19 410.0 79.5 0.14 256.3 85.0 0.24 382.2 150.0 0.23ICG 13723 429.3 193.8 0.29 337.7 121.7 0.21 295.2 271.5 0.46 492.7 312.1 0.47 336.2 93.2 0.20 262.6 49.0 0.12 270.7 102.3 0.25 414.8 147.5 0.25ICG 2777 505.6 229.9 0.30 401.1 134.2 0.20 473.7 300.7 0.37 430.1 353.5 0.46 313.4 61.6 0.14 304.7 37.9 0.07 306.8 128.7 0.29 429.5 159.1 0.23ICG 442 361.4 268.9 0.43 370.9 171.2 0.29 374.0 187.4 0.34 573.9 252.3 0.28 267.1 114.6 0.29 198.7 61.9 0.22 268.5 93.0 0.26 276.6 117.2 0.27ICG 11457 468.5 184.1 0.25 366.3 104.6 0.16 442.3 265.2 0.35 468.0 225.6 0.32 255.5 49.7 0.17 377.5 47.4 0.07 327.3 110.5 0.24 376.4 178.4 0.30ICG 10010 568.1 228.0 0.27 356.6 142.9 0.25 558.7 318.2 0.36 497.6 364.3 0.47 321.6 62.0 0.13 260.1 57.1 0.15 255.3 143.2 0.36 445.9 122.2 0.21
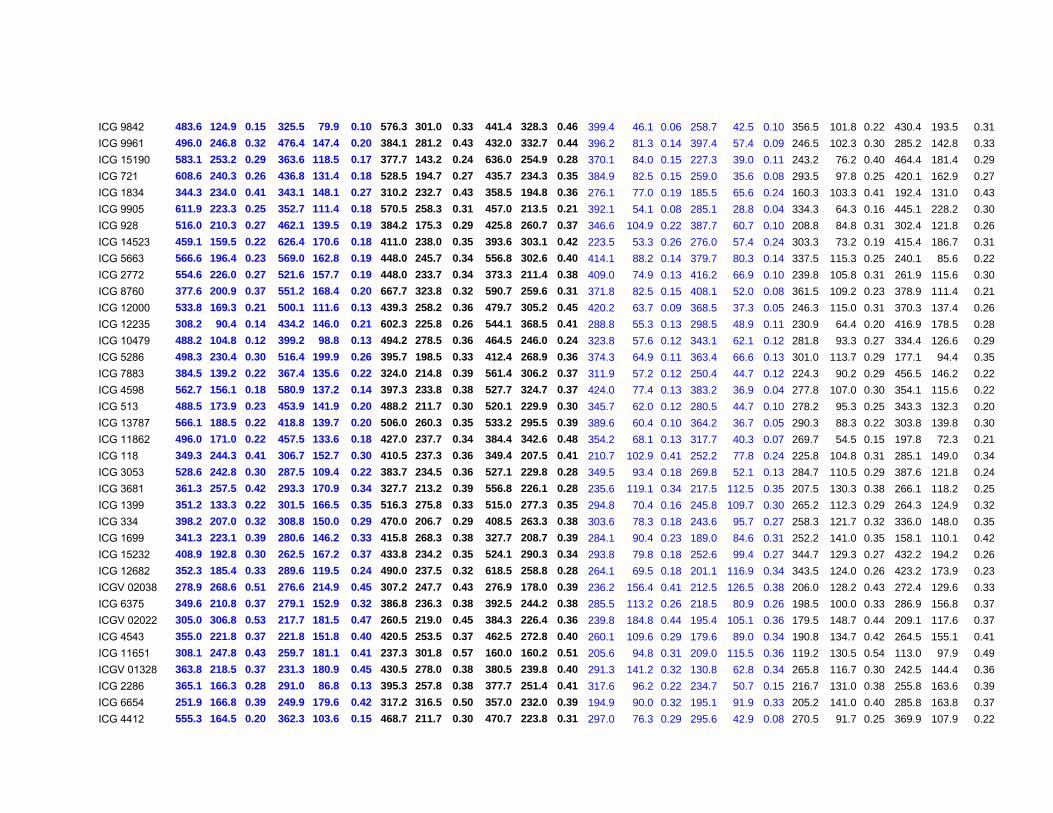
ICG 9842 483.6 124.9 0.15 325.5 79.9 0.10 576.3 301.0 0.33 441.4 328.3 0.46 399.4 46.1 0.06 258.7 42.5 0.10 356.5 101.8 0.22 430.4 193.5 0.31ICG 9961 496.0 246.8 0.32 476.4 147.4 0.20 384.1 281.2 0.43 432.0 332.7 0.44 396.2 81.3 0.14 397.4 57.4 0.09 246.5 102.3 0.30 285.2 142.8 0.33ICG 15190 583.1 253.2 0.29 363.6 118.5 0.17 377.7 143.2 0.24 636.0 254.9 0.28 370.1 84.0 0.15 227.3 39.0 0.11 243.2 76.2 0.40 464.4 181.4 0.29ICG 721 608.6 240.3 0.26 436.8 131.4 0.18 528.5 194.7 0.27 435.7 234.3 0.35 384.9 82.5 0.15 259.0 35.6 0.08 293.5 97.8 0.25 420.1 162.9 0.27ICG 1834 344.3 234.0 0.41 343.1 148.1 0.27 310.2 232.7 0.43 358.5 194.8 0.36 276.1 77.0 0.19 185.5 65.6 0.24 160.3 103.3 0.41 192.4 131.0 0.43ICG 9905 611.9 223.3 0.25 352.7 111.4 0.18 570.5 258.3 0.31 457.0 213.5 0.21 392.1 54.1 0.08 285.1 28.8 0.04 334.3 64.3 0.16 445.1 228.2 0.30ICG 928 516.0 210.3 0.27 462.1 139.5 0.19 384.2 175.3 0.29 425.8 260.7 0.37 346.6 104.9 0.22 387.7 60.7 0.10 208.8 84.8 0.31 302.4 121.8 0.26ICG 14523 459.1 159.5 0.22 626.4 170.6 0.18 411.0 238.0 0.35 393.6 303.1 0.42 223.5 53.3 0.26 276.0 57.4 0.24 303.3 73.2 0.19 415.4 186.7 0.31ICG 5663 566.6 196.4 0.23 569.0 162.8 0.19 448.0 245.7 0.34 556.8 302.6 0.40 414.1 88.2 0.14 379.7 80.3 0.14 337.5 115.3 0.25 240.1 85.6 0.22ICG 2772 554.6 226.0 0.27 521.6 157.7 0.19 448.0 233.7 0.34 373.3 211.4 0.38 409.0 74.9 0.13 416.2 66.9 0.10 239.8 105.8 0.31 261.9 115.6 0.30ICG 8760 377.6 200.9 0.37 551.2 168.4 0.20 667.7 323.8 0.32 590.7 259.6 0.31 371.8 82.5 0.15 408.1 52.0 0.08 361.5 109.2 0.23 378.9 111.4 0.21ICG 12000 533.8 169.3 0.21 500.1 111.6 0.13 439.3 258.2 0.36 479.7 305.2 0.45 420.2 63.7 0.09 368.5 37.3 0.05 246.3 115.0 0.31 370.3 137.4 0.26ICG 12235 308.2 90.4 0.14 434.2 146.0 0.21 602.3 225.8 0.26 544.1 368.5 0.41 288.8 55.3 0.13 298.5 48.9 0.11 230.9 64.4 0.20 416.9 178.5 0.28ICG 10479 488.2 104.8 0.12 399.2 98.8 0.13 494.2 278.5 0.36 464.5 246.0 0.24 323.8 57.6 0.12 343.1 62.1 0.12 281.8 93.3 0.27 334.4 126.6 0.29ICG 5286 498.3 230.4 0.30 516.4 199.9 0.26 395.7 198.5 0.33 412.4 268.9 0.36 374.3 64.9 0.11 363.4 66.6 0.13 301.0 113.7 0.29 177.1 94.4 0.35ICG 7883 384.5 139.2 0.22 367.4 135.6 0.22 324.0 214.8 0.39 561.4 306.2 0.37 311.9 57.2 0.12 250.4 44.7 0.12 224.3 90.2 0.29 456.5 146.2 0.22ICG 4598 562.7 156.1 0.18 580.9 137.2 0.14 397.3 233.8 0.38 527.7 324.7 0.37 424.0 77.4 0.13 383.2 36.9 0.04 277.8 107.0 0.30 354.1 115.6 0.22ICG 513 488.5 173.9 0.23 453.9 141.9 0.20 488.2 211.7 0.30 520.1 229.9 0.30 345.7 62.0 0.12 280.5 44.7 0.10 278.2 95.3 0.25 343.3 132.3 0.20ICG 13787 566.1 188.5 0.22 418.8 139.7 0.20 506.0 260.3 0.35 533.2 295.5 0.39 389.6 60.4 0.10 364.2 36.7 0.05 290.3 88.3 0.22 303.8 139.8 0.30ICG 11862 496.0 171.0 0.22 457.5 133.6 0.18 427.0 237.7 0.34 384.4 342.6 0.48 354.2 68.1 0.13 317.7 40.3 0.07 269.7 54.5 0.15 197.8 72.3 0.21ICG 118 349.3 244.3 0.41 306.7 152.7 0.30 410.5 237.3 0.36 349.4 207.5 0.41 210.7 102.9 0.41 252.2 77.8 0.24 225.8 104.8 0.31 285.1 149.0 0.34ICG 3053 528.6 242.8 0.30 287.5 109.4 0.22 383.7 234.5 0.36 527.1 229.8 0.28 349.5 93.4 0.18 269.8 52.1 0.13 284.7 110.5 0.29 387.6 121.8 0.24ICG 3681 361.3 257.5 0.42 293.3 170.9 0.34 327.7 213.2 0.39 556.8 226.1 0.28 235.6 119.1 0.34 217.5 112.5 0.35 207.5 130.3 0.38 266.1 118.2 0.25ICG 1399 351.2 133.3 0.22 301.5 166.5 0.35 516.3 275.8 0.33 515.0 277.3 0.35 294.8 70.4 0.16 245.8 109.7 0.30 265.2 112.3 0.29 264.3 124.9 0.32ICG 334 398.2 207.0 0.32 308.8 150.0 0.29 470.0 206.7 0.29 408.5 263.3 0.38 303.6 78.3 0.18 243.6 95.7 0.27 258.3 121.7 0.32 336.0 148.0 0.35ICG 1699 341.3 223.1 0.39 280.6 146.2 0.33 415.8 268.3 0.38 327.7 208.7 0.39 284.1 90.4 0.23 189.0 84.6 0.31 252.2 141.0 0.35 158.1 110.1 0.42ICG 15232 408.9 192.8 0.30 262.5 167.2 0.37 433.8 234.2 0.35 524.1 290.3 0.34 293.8 79.8 0.18 252.6 99.4 0.27 344.7 129.3 0.27 432.2 194.2 0.26ICG 12682 352.3 185.4 0.33 289.6 119.5 0.24 490.0 237.5 0.32 618.5 258.8 0.28 264.1 69.5 0.18 201.1 116.9 0.34 343.5 124.0 0.26 423.2 173.9 0.23ICGV 02038 278.9 268.6 0.51 276.6 214.9 0.45 307.2 247.7 0.43 276.9 178.0 0.39 236.2 156.4 0.41 212.5 126.5 0.38 206.0 128.2 0.43 272.4 129.6 0.33ICG 6375 349.6 210.8 0.37 279.1 152.9 0.32 386.8 236.3 0.38 392.5 244.2 0.38 285.5 113.2 0.26 218.5 80.9 0.26 198.5 100.0 0.33 286.9 156.8 0.37ICGV 02022 305.0 306.8 0.53 217.7 181.5 0.47 260.5 219.0 0.45 384.3 226.4 0.36 239.8 184.8 0.44 195.4 105.1 0.36 179.5 148.7 0.44 209.1 117.6 0.37ICG 4543 355.0 221.8 0.37 221.8 151.8 0.40 420.5 253.5 0.37 462.5 272.8 0.40 260.1 109.6 0.29 179.6 89.0 0.34 190.8 134.7 0.42 264.5 155.1 0.41ICG 11651 308.1 247.8 0.43 259.7 181.1 0.41 237.3 301.8 0.57 160.0 160.2 0.51 205.6 94.8 0.31 209.0 115.5 0.36 119.2 130.5 0.54 113.0 97.9 0.49ICGV 01328 363.8 218.5 0.37 231.3 180.9 0.45 430.5 278.0 0.38 380.5 239.8 0.40 291.3 141.2 0.32 130.8 62.8 0.34 265.8 116.7 0.30 242.5 144.4 0.36ICG 2286 365.1 166.3 0.28 291.0 86.8 0.13 395.3 257.8 0.38 377.7 251.4 0.41 317.6 96.2 0.22 234.7 50.7 0.15 216.7 131.0 0.38 255.8 163.6 0.39ICG 6654 251.9 166.8 0.39 249.9 179.6 0.42 317.2 316.5 0.50 357.0 232.0 0.39 194.9 90.0 0.32 195.1 91.9 0.33 205.2 141.0 0.40 285.8 163.8 0.37ICG 4412 555.3 164.5 0.20 362.3 103.6 0.15 468.7 211.7 0.30 470.7 223.8 0.31 297.0 76.3 0.29 295.6 42.9 0.08 270.5 91.7 0.25 369.9 107.9 0.22

ICG 10701 329.8 213.9 0.39 187.1 116.1 0.36 358.7 371.8 0.52 252.7 189.1 0.42 229.6 112.9 0.34 162.8 68.8 0.30 221.8 133.6 0.41 356.8 96.6 0.21ICG 8106 395.1 220.9 0.35 285.3 144.9 0.31 530.3 257.5 0.33 496.6 189.7 0.27 204.8 66.6 0.23 147.2 64.3 0.32 278.0 131.5 0.32 321.8 108.3 0.26ICGV 91116 323.8 182.6 0.34 237.2 180.9 0.44 481.3 251.0 0.34 587.9 282.4 0.34 215.1 75.6 0.24 167.8 103.8 0.41 314.2 104.5 0.25 394.4 158.7 0.29ICG 4798 329.5 187.5 0.35 278.4 92.2 0.16 414.8 276.7 0.41 402.3 202.2 0.35 170.8 52.8 0.25 211.3 55.0 0.18 222.5 133.5 0.37 400.5 147.8 0.27ICG 5195 326.6 210.6 0.38 281.5 167.0 0.35 446.5 244.5 0.35 398.7 198.7 0.30 254.9 114.7 0.30 183.7 79.9 0.30 232.7 136.5 0.38 237.4 108.8 0.34ICG 9418 304.6 181.4 0.36 202.8 132.0 0.38 371.2 266.7 0.42 611.9 276.5 0.32 263.4 108.6 0.27 144.2 58.6 0.30 199.7 125.8 0.39 240.5 98.9 0.29ICG 7243 332.0 162.1 0.30 215.5 98.3 0.24 442.5 228.0 0.34 488.9 317.0 0.41 339.5 84.0 0.17 253.9 42.5 0.11 286.8 84.7 0.25 298.8 166.5 0.31ICGV 02194 302.4 133.7 0.26 342.5 268.7 0.45 498.7 241.5 0.32 471.5 202.0 0.31 251.2 98.7 0.28 295.1 147.4 0.33 256.3 108.2 0.30 243.1 121.3 0.33ICG 397 296.2 220.5 0.43 268.5 168.6 0.38 349.3 245.2 0.41 307.7 181.0 0.38 237.8 105.6 0.30 185.7 118.8 0.41 182.8 122.5 0.38 227.5 124.7 0.36ICG 10890 207.5 195.8 0.52 170.0 118.2 0.40 345.5 333.0 0.49 303.7 215.4 0.41 218.8 89.2 0.29 142.3 65.5 0.33 173.2 164.5 0.48 208.7 95.7 0.32ICG 1823 354.5 257.1 0.42 236.4 152.2 0.37 431.8 207.2 0.32 557.4 201.9 0.23 301.6 133.5 0.30 192.2 111.9 0.38 248.3 82.8 0.28 303.8 98.5 0.25ICG 6402 310.4 128.9 0.24 357.1 177.5 0.31 336.7 196.3 0.36 541.2 218.3 0.25 327.7 90.0 0.19 231.6 79.0 0.24 213.4 102.5 0.45 346.2 86.0 0.18ICGV 99001 429.2 222.1 0.33 267.1 170.9 0.39 380.0 186.8 0.32 488.4 216.4 0.26 288.2 82.1 0.20 193.1 77.9 0.28 266.0 80.0 0.23 347.7 99.2 0.18ICG 7867 341.0 155.7 0.28 266.8 151.5 0.34 374.0 294.3 0.43 513.7 169.5 0.26 263.9 68.3 0.18 144.3 47.3 0.19 199.3 121.2 0.38 274.7 104.0 0.17ICG 188 436.9 162.1 0.24 349.1 123.7 0.22 505.5 195.5 0.28 641.3 177.5 0.22 364.7 54.2 0.09 159.6 39.0 0.16 263.5 67.0 0.20 331.4 65.4 0.15ICG 9666 495.1 206.0 0.27 244.1 90.4 0.18 401.8 232.2 0.36 300.2 195.3 0.39 364.1 84.5 0.16 213.1 41.1 0.12 269.7 85.0 0.24 198.7 151.7 0.45ICGV 02148 341.0 162.9 0.29 303.9 192.0 0.38 343.4 208.6 0.36 280.0 200.2 0.40 257.0 86.5 0.24 435.1 88.1 0.23 237.5 111.4 0.31 204.7 138.4 0.42ICG 115 354.8 208.7 0.36 280.6 178.1 0.38 468.8 223.8 0.33 463.6 160.7 0.25 287.3 127.9 0.29 208.5 113.5 0.36 258.8 102.3 0.27 228.0 112.0 0.28ICG 1415 321.2 144.6 0.27 253.4 123.4 0.29 446.0 258.0 0.36 353.3 215.9 0.38 248.1 61.7 0.17 174.3 73.9 0.30 256.0 146.7 0.35 164.0 94.8 0.38ICG 1534 305.5 149.2 0.30 249.2 109.9 0.25 385.7 196.7 0.32 578.3 266.3 0.32 239.8 80.8 0.24 165.2 36.3 0.16 245.8 107.9 0.34 402.3 124.8 0.23ICG 14127 448.7 177.2 0.26 197.2 96.1 0.26 484.3 283.0 0.36 462.0 192.1 0.29 302.5 99.3 0.22 157.7 49.3 0.22 239.5 124.3 0.33 246.8 94.4 0.29ICG 15234 247.9 148.0 0.35 253.1 148.8 0.36 245.0 184.0 0.42 418.5 263.9 0.45 213.0 81.2 0.27 185.7 62.5 0.24 238.5 104.0 0.29 490.2 161.2 0.23ICG 15233 347.3 224.8 0.39 318.1 225.2 0.41 305.5 145.2 0.32 437.5 158.4 0.31 240.7 106.9 0.31 322.8 173.4 0.35 237.0 121.5 0.33 287.7 170.7 0.36ICG 15405 281.3 195.6 0.41 245.8 163.0 0.40 319.8 225.7 0.41 292.0 172.2 0.39 218.4 90.7 0.29 216.3 81.2 0.27 237.8 114.8 0.31 260.6 92.9 0.20ICG 12921 443.0 217.8 0.31 225.4 112.2 0.26 392.7 136.5 0.26 491.9 244.1 0.33 257.7 122.5 0.32 194.4 84.8 0.31 320.0 115.0 0.27 446.7 186.3 0.22ICG 9449 323.7 147.2 0.28 108.5 60.8 0.17 386.7 261.0 0.40 405.1 264.0 0.35 222.5 58.3 0.19 82.8 16.3 0.10 178.5 113.7 0.40 337.5 144.4 0.29ICG 8083 216.7 191.2 0.50 119.9 76.3 0.35 251.7 270.0 0.51 396.3 189.1 0.32 127.7 65.1 0.37 95.5 22.6 0.19 83.7 87.3 0.56 207.6 68.5 0.26ICG 6394 317.8 109.9 0.18 236.1 219.3 0.42 320.0 169.3 0.34 351.1 207.3 0.37 278.8 61.2 0.15 164.2 36.8 0.15 180.4 94.5 0.38 248.6 103.5 0.31
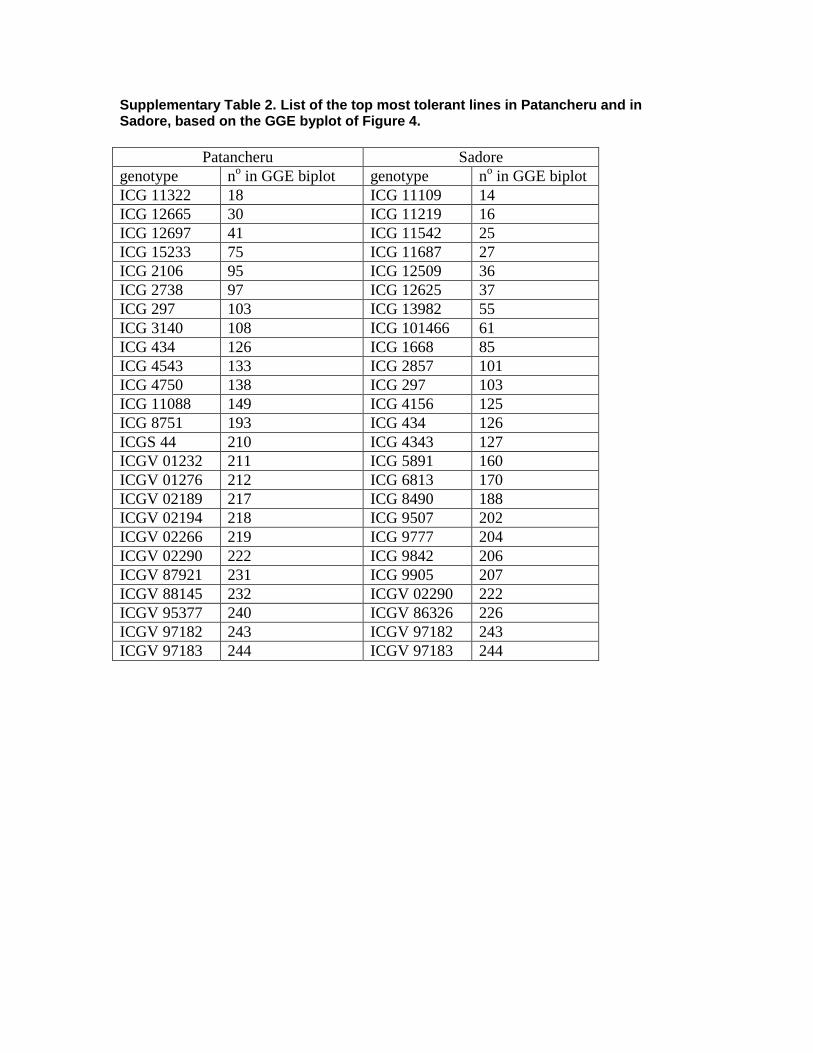
Supplementary Table 2. List of the top most tolerant lines in Patancheru and inSadore, based on the GGE byplot of Figure 4.
Patancheru Sadoregenotype no in GGE biplot genotype no in GGE biplotICG 11322 18 ICG 11109 14ICG 12665 30 ICG 11219 16ICG 12697 41 ICG 11542 25ICG 15233 75 ICG 11687 27ICG 2106 95 ICG 12509 36ICG 2738 97 ICG 12625 37ICG 297 103 ICG 13982 55ICG 3140 108 ICG 101466 61ICG 434 126 ICG 1668 85ICG 4543 133 ICG 2857 101ICG 4750 138 ICG 297 103ICG 11088 149 ICG 4156 125ICG 8751 193 ICG 434 126ICGS 44 210 ICG 4343 127ICGV 01232 211 ICG 5891 160ICGV 01276 212 ICG 6813 170ICGV 02189 217 ICG 8490 188ICGV 02194 218 ICG 9507 202ICGV 02266 219 ICG 9777 204ICGV 02290 222 ICG 9842 206ICGV 87921 231 ICG 9905 207ICGV 88145 232 ICGV 02290 222ICGV 95377 240 ICGV 86326 226ICGV 97182 243 ICGV 97182 243ICGV 97183 244 ICGV 97183 244
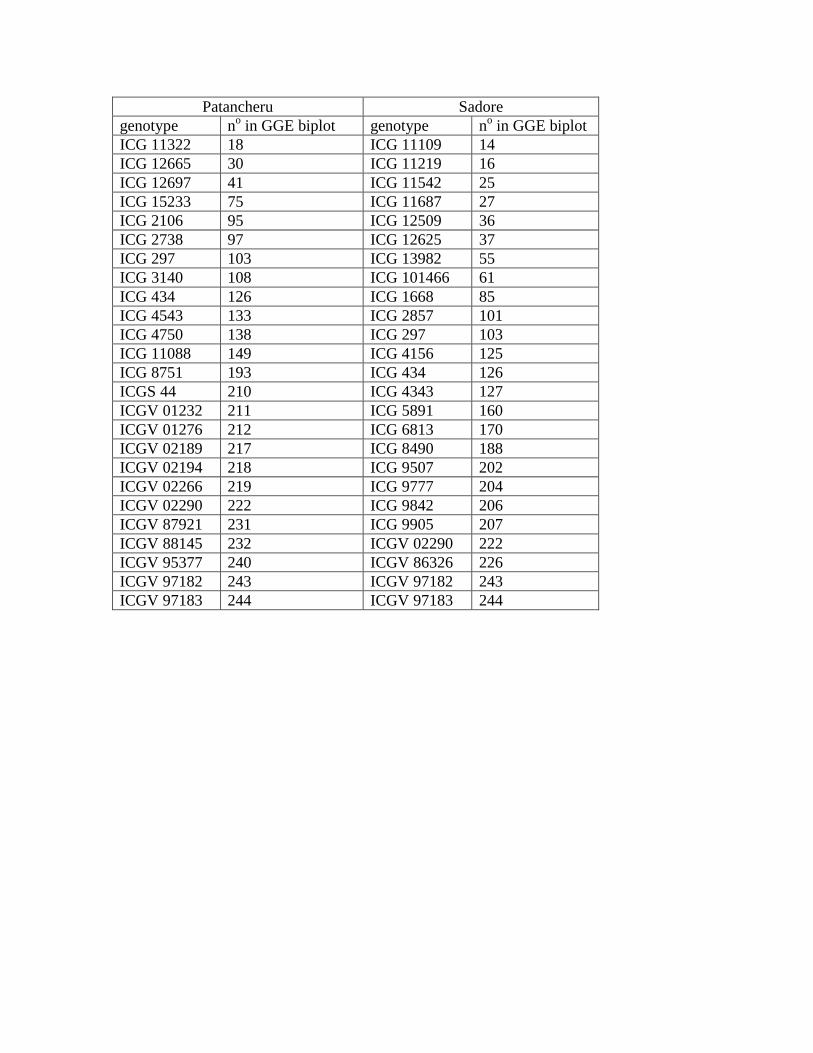
Patancheru Sadoregenotype no in GGE biplot genotype no in GGE biplotICG 11322 18 ICG 11109 14ICG 12665 30 ICG 11219 16ICG 12697 41 ICG 11542 25ICG 15233 75 ICG 11687 27ICG 2106 95 ICG 12509 36ICG 2738 97 ICG 12625 37ICG 297 103 ICG 13982 55ICG 3140 108 ICG 101466 61ICG 434 126 ICG 1668 85ICG 4543 133 ICG 2857 101ICG 4750 138 ICG 297 103ICG 11088 149 ICG 4156 125ICG 8751 193 ICG 434 126ICGS 44 210 ICG 4343 127ICGV 01232 211 ICG 5891 160ICGV 01276 212 ICG 6813 170ICGV 02189 217 ICG 8490 188ICGV 02194 218 ICG 9507 202ICGV 02266 219 ICG 9777 204ICGV 02290 222 ICG 9842 206ICGV 87921 231 ICG 9905 207ICGV 88145 232 ICGV 02290 222ICGV 95377 240 ICGV 86326 226ICGV 97182 243 ICGV 97182 243ICGV 97183 244 ICGV 97183 244

y = 0.2062x + 64.618R2 = 0.2269
0.0
20.0
40.0
60.0
80.0
100.0
120.0
140.0
160.0
180.0
200.0
0.0 100.0 200.0 300.0 400.0 500.0
Pod yield (g/Pl-1) - Well-watered
Pod
yiel
d (g
/Pl-1
) - W
ater
str
esse
d
y = 0.3914x + 16.408R2 = 0.4274
0.0
50.0
100.0
150.0
200.0
250.0
0.0 50.0 100.0 150.0 200.0 250.0 300.0 350.0 400.0
Pod yield (g/Pl-1) - Well-watered
Pod
yiel
d (g
/Pl-1
) - W
ater
stre
ssed
y = 0.4534x + 8.0072R2 = 0.5003
0.0
20.0
40.0
60.0
80.0
100.0
120.0
140.0
160.0
180.0
200.0
0.0 50.0 100.0 150.0 200.0 250.0 300.0 350.0 400.0
Pod yield (g/Pl-1) - Well-watered
Pod
yiel
d (g
/Pl-1
) - W
ater
stre
ssed
y = 0.3232x + 66.178R2 = 0.232
0.0
50.0
100.0
150.0
200.0
250.0
300.0
0.0 100.0 200.0 300.0 400.0 500.0
Pod yield (g/Pl-1) - Well-watered
Pod
yiel
d (g
/Pl-1
) - W
ater
str
esse
d
A
CD
B
Figure 1
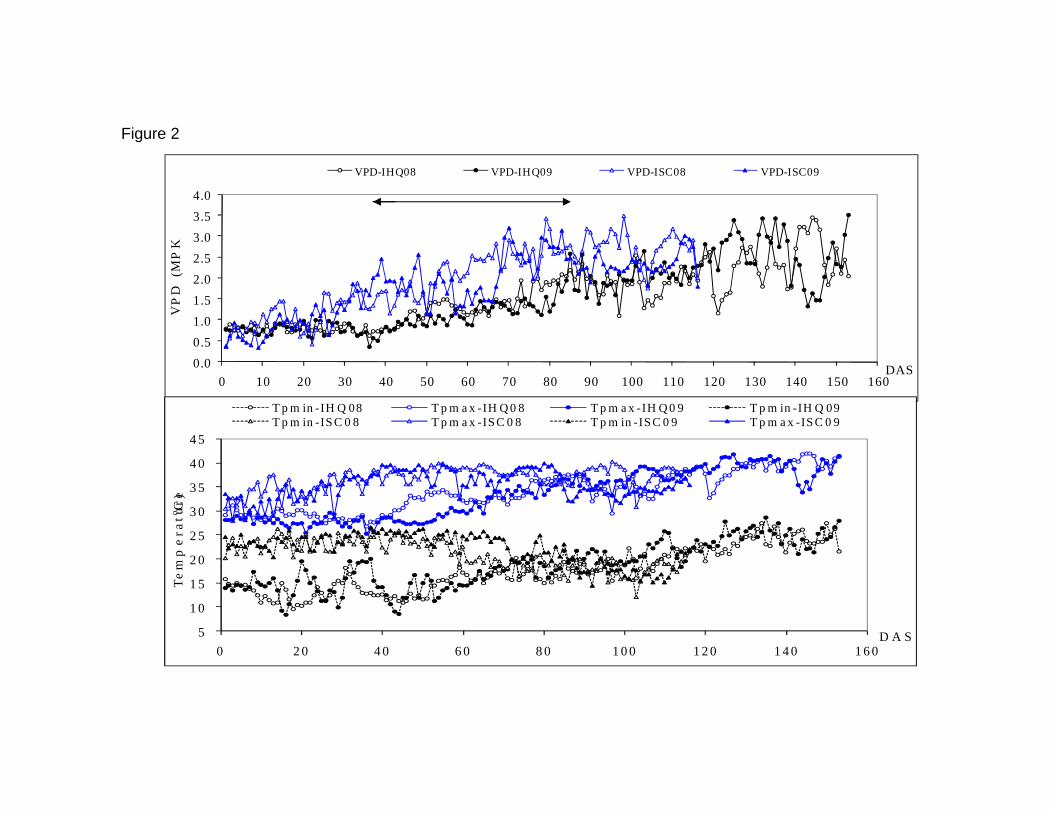
0.0
0.5
1.0
1.5
2.0
2.5
3.0
3.5
4.0
0 10 20 30 40 50 60 70 80 90 100 110 120 130 140 150 160
VP
D (
MP
Ka
)
DAS
VPD-IHQ08 VPD-IHQ09 VPD-ISC08 VPD-ISC09
5
1 0
1 5
2 0
2 5
3 0
3 5
4 0
4 5
0 2 0 4 0 6 0 8 0 1 0 0 1 2 0 1 4 0 1 6 0
Te
mp
er a
t ur
e (
o C)
D A S
T p m in -IH Q 08 T p m a x -IH Q 0 8 T p m a x -IH Q 0 9 T p m in -IH Q 09T p m in -IS C 0 8 T p m a x -IS C 0 8 T p m in -IS C 0 9 T p m a x -IS C 0 9
Figure 2

220
110
160
207
85
111
86
247
87
245
88
243
89
241
90
239
91237
92
235
93233
94
231
95
229
96
22797
22598
223
99
221
100
218
101
216
102
214
103 212
104
210
105
2106
4107
6108
8
10910
209
1214
112
16
11318
114
20
115
22
116
24 11726
118
28
119
30
120
32121
34
122
3612338
124 40
12542
126
44
127
46
128
48
12950
130
52
131 54
132
56
133
58
134
60
135
62136
64
137
66138
68
139
70
140
72
141
74
142
7614378
144
80
145 82
146
84147246 148
242
149
238150
234
151230
152
226
153
222
154
217155
213
156 1157
5
158
9
159
13208
17
16121
162
25
163
29164
33
165
37
16641167
45
168
49
169
53
170
57
17162
17265 173
69
174
73
175
77
176
81206
83177
240178
232
179
224
180215181 3
182 11
183
19
184
27
185
35
186
43
18751
188
59
189
67
190
75
191
244
192 228193
211194
15195
31
196
47197
63
198
79
199
219
200
23
201
55
202
236
39
71
7
203204 205
Sadore2
Patancheru2Sadore1
Patancheru1
PC1
PC2
Genotype scoresEnvironment scoresAEC
AEC
Figure 3a : Ranking genotypes based on the mean performance and stabilityofpod yield underws conditions at Patancheru and Sadore during the experimentalperiod of 2008 and 2009.PC1 = principal component 1 (43.22%), PC2 = principal component2 (35.47%)
220
110
160
207
85
111
86
247
87
245
88
243
89
241
90
239
91237
92
235
93233
94
231
95
229
96
22797
22598
223
99
221
100
218
101
216
102
214
103 212
104
210
105
2106
4107
6108
8
10910
209
1214
112
16
11318
114
20
115
22
116
24 11726
118
28
119
30
120
32121
34
122
3612338
124 40
12542
126
44
127
46
128
48
12950
130
52
131 54
132
56
133
58
134
60
135
62136
64
137
66138
68
139
70
140
72
141
74
142
7614378
144
80
145 82
146
84147246 148
242
149
238150
234
151230
152
226
153
222
154
217155
213
156 1157
5
158
9
159
13208
17
16121
162
25
163
29164
33
165
37
16641167
45
168
49
169
53
170
57
17162
17265 173
69
174
73
175
77
176
81206
83177
240178
232
179
224
180215181 3
182 11
183
19
184
27
185
35
186
43
18751
188
59
189
67
190
75
191
244
192 228193
211194
15195
31
196
47197
63
198
79
199
219
200
23
201
55
202
236
39
71
7
203204 205
Sadore2
Patancheru2Sadore1
Patancheru1
PC1
PC2
Genotype scoresEnvironment scoresAEC
AEC
220
110
160
207
85
111
86
247
87
245
88
243
89
241
90
239
91237
92
235
93233
94
231
95
229
96
22797
22598
223
99
221
100
218
101
216
102
214
103 212
104
210
105
2106
4107
6108
8
10910
209
1214
112
16
11318
114
20
115
22
116
24 11726
118
28
119
30
120
32121
34
122
3612338
124 40
12542
126
44
127
46
128
48
12950
130
52
131 54
132
56
133
58
134
60
135
62136
64
137
66138
68
139
70
140
72
141
74
142
7614378
144
80
145 82
146
84147246 148
242
149
238150
234
151230
152
226
153
222
154
217155
213
156 1157
5
158
9
159
13208
17
16121
162
25
163
29164
33
165
37
16641167
45
168
49
169
53
170
57
17162
17265 173
69
174
73
175
77
176
81206
83177
240178
232
179
224
180215181 3
182 11
183
19
184
27
185
35
186
43
18751
188
59
189
67
190
75
191
244
192 228193
211194
15195
31
196
47197
63
198
79
199
219
200
23
201
55
202
236
39
71
7
203204 205
Sadore2
Patancheru2Sadore1
Patancheru1
PC1
PC2
Genotype scoresEnvironment scoresAEC
AECAEC
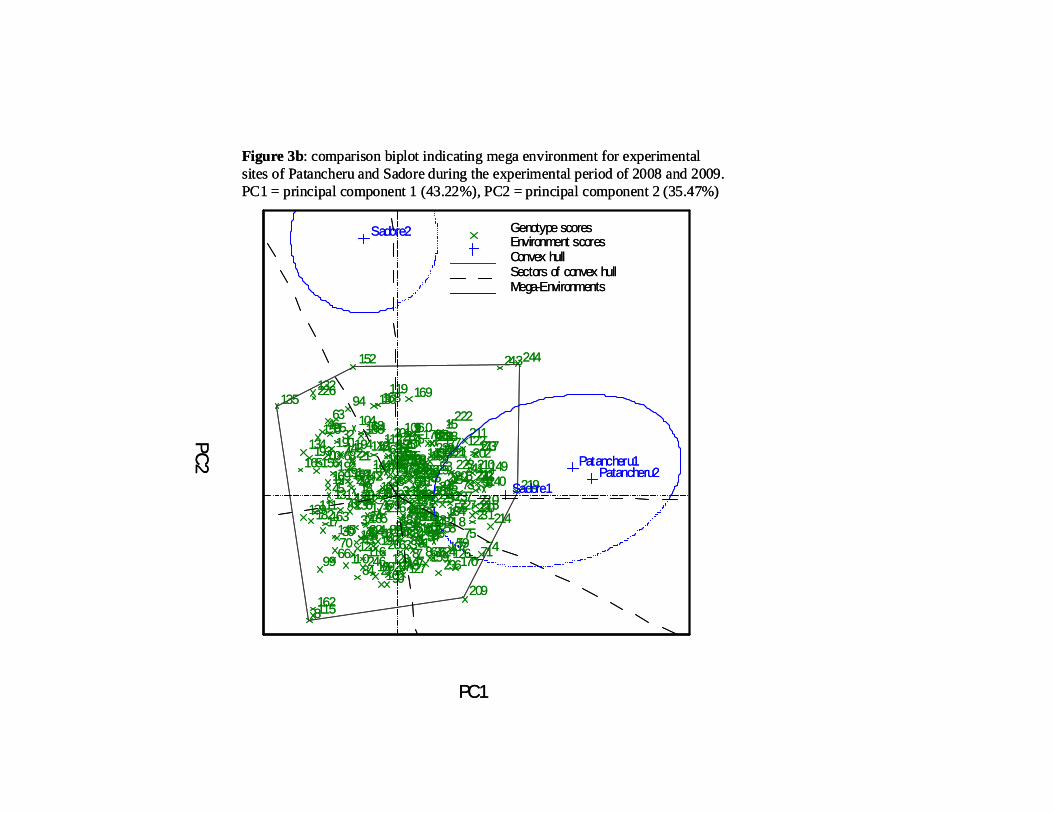
41
82
119
242
228
107
120108
246
109
244
110
241
111
239112
237113
235
114
233
115
1
116
3117
5
1187
229
9
11
121
13
12215
123
17
12419
12521
126
23
127
25
12827
129
29
130
31131
33
132
35133
37
134
39
135
231136
43137
45
138
47
13949
140
51
141
53142
55143
57144
59145 61
146
63
147
65
148
67149
69
150
71
151 73
152
75
153
77
15479
155
81
156
83
15785
158
87 15989
160
91
161
93
162
95
163
97164
99
165
101
166103167
105
168
247
169
243
170
238
171
234
1722 173
6
17410
175
14
176
18
177
22
178
26179
30180
34
181
38182
42
18346
18450
185
54
186
58
18762
188
66189
70
190
74
191
78
192
230
193
86
194
90
195
94
196
98197 102
198106
199
240
200232
201
8
202
16
203
24
204
32
20540
206
48
207
56
208
64
209
72
210
80
211
88
212
96
213
104
214
236
21512
21628
21744
21860
21976 220
92
221
245
222
2022352
22484
4
36
68
100
225
226
227
Patancheru2Patancheru1
Sadore1
Sadore2
PC2
PC1
Genotype scoresEnvironment scoresConvex hullSectors of convex hullMega-Environments
Figure 3b: comparison biplot indicating mega environment for experimentalsites of Patancheru and Sadore during the experimental period of 2008 and 2009.PC1 = principal component 1 (43.22%), PC2 = principal component 2 (35.47%)
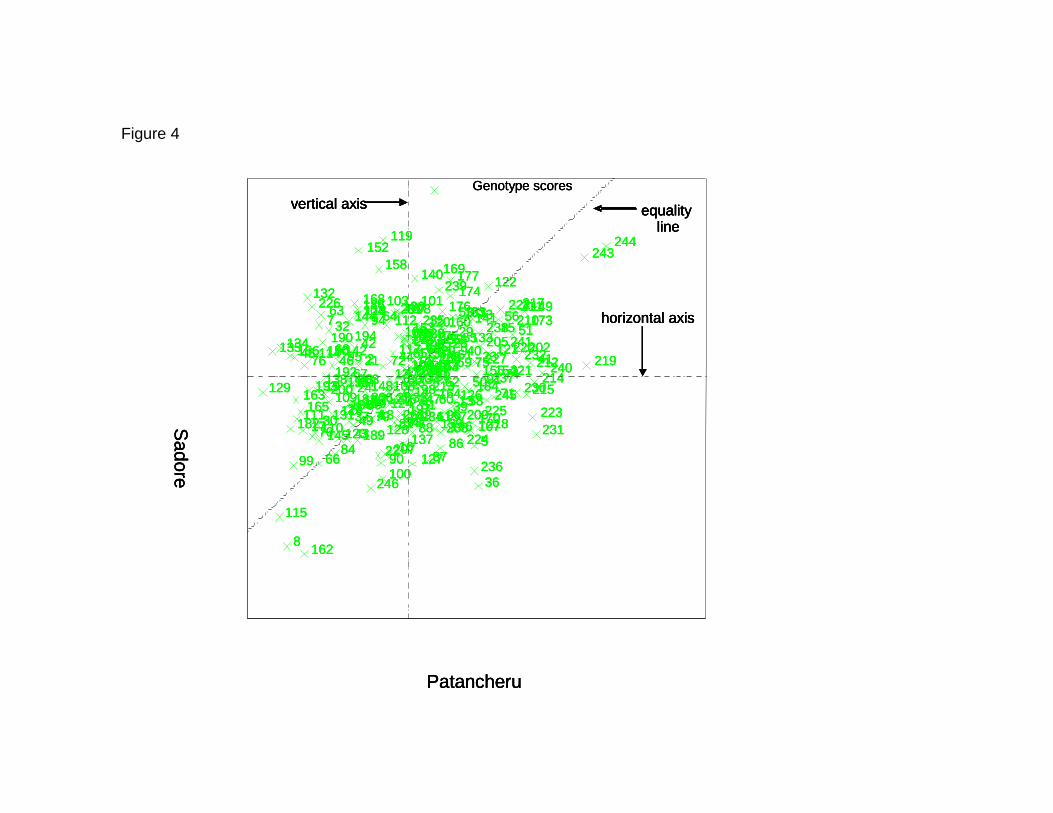
Figure 4
239
237
114
115
240
116
242117
244
118
246
119
1120
3
121
5
122
7
123
9
124
11
125
13126
15
127
17 128
19129
21
130
23
131
25
132
27
13329134
31135
33136
35
137
37
138
39
13941
140
43
141
45 14247 143
49
14451
145
53
146
55
147
57
148
59
149
61
150
63
15165
152
67
15369
154
71
155
73
15675
157
77
158
79 15981
16083
161 85
162
87
16389
16491
16593
166
95
16797
168
99
169
101
170
103
171
105
172
107
173
109
174
111
175113
176
241
177
245
1782
179
618010
181 14
18218
183
22
184
26185
30
186
34187
38
18842
189
46
190
5019154192
58193 62
194
66
195
70 196
74
197
78
198
82199
86
200
90
20194
202
98203
102
204106
205
110
206
238
207
247
208
8
209
16
210
24
21132
21240
21348 214
56
215
64
216
72
217
8021888
219
96
220
104
221
112222
4 223
20
224
36
225
52
226
68227
84
228
100
229
243
230
28
231
60
23292
2331276
108
44
234
235
236
Patancheru
Sadore
Genotype scores
equalityline
vertical axis
horizontal axis
239
237
114
115
240
116
242117
244
118
246
119
1120
3
121
5
122
7
123
9
124
11
125
13126
15
127
17 128
19129
21
130
23
131
25
132
27
13329134
31135
33136
35
137
37
138
39
13941
140
43
141
45 14247 143
49
14451
145
53
146
55
147
57
148
59
149
61
150
63
15165
152
67
15369
154
71
155
73
15675
157
77
158
79 15981
16083
161 85
162
87
16389
16491
16593
166
95
16797
168
99
169
101
170
103
171
105
172
107
173
109
174
111
175113
176
241
177
245
1782
179
618010
181 14
18218
183
22
184
26185
30
186
34187
38
18842
189
46
190
5019154192
58193 62
194
66
195
70 196
74
197
78
198
82199
86
200
90
20194
202
98203
102
204106
205
110
206
238
207
247
208
8
209
16
210
24
21132
21240
21348 214
56
215
64
216
72
217
8021888
219
96
220
104
221
112222
4 223
20
224
36
225
52
226
68227
84
228
100
229
243
230
28
231
60
23292
2331276
108
44
234
235
236
Patancheru
Sadore
Genotype scores
equalityline
equalityline
vertical axisvertical axis
horizontal axishorizontal axis
Related Documents