National Council for Voluntary Organisations gvng voce and support to cvl socety The UK Cvl Socety Almanac 2010 Jenny Clark David Kane Karl Wilding Jenny Wilton

Welcome message from author
This document is posted to help you gain knowledge. Please leave a comment to let me know what you think about it! Share it to your friends and learn new things together.
Transcript
�
National Council for Voluntary Organisationsg�v�ng vo�ce and support to c�v�l soc�ety
The UK C�v�l Soc�ety Almanac 2010Jenny ClarkDavid KaneKarl WildingJenny Wilton
��
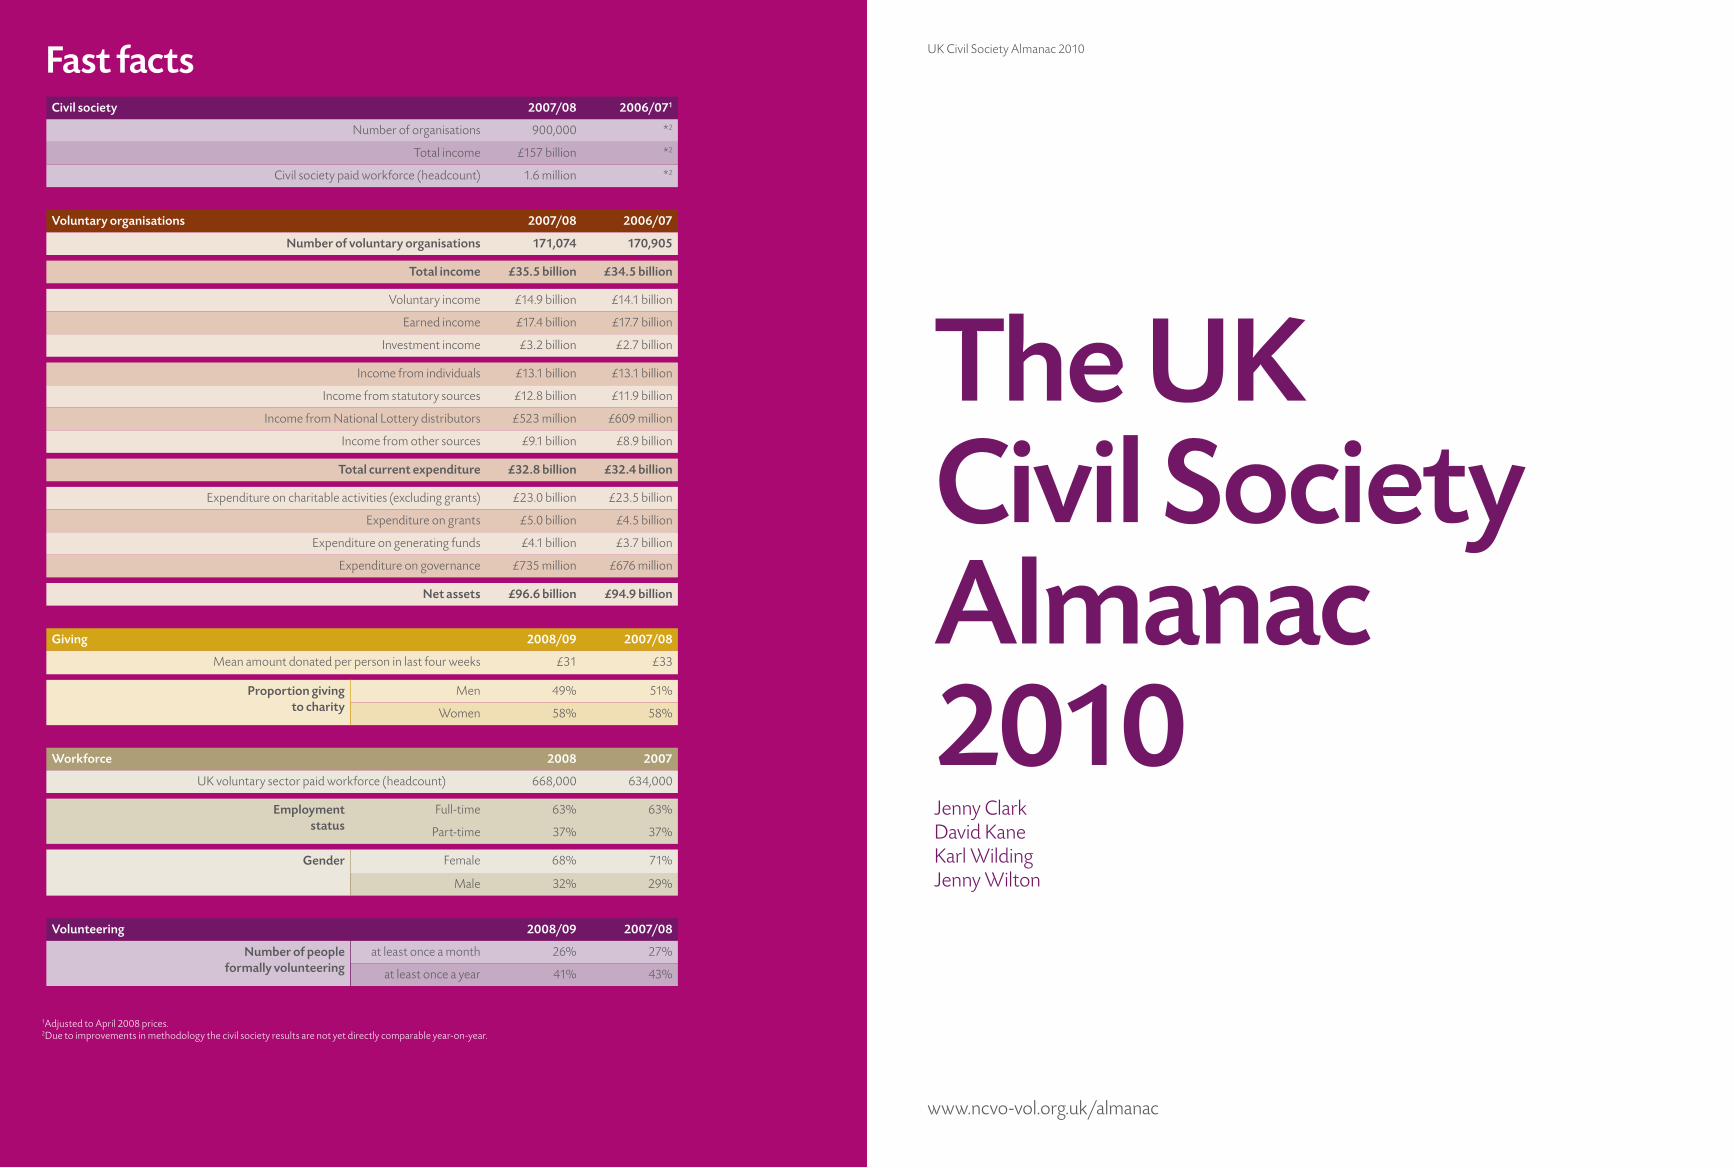
1Adjusted to April 2008 prices.2Due to improvements in methodology the civil society results are not yet directly comparable year-on-year.
Civil society 2007/08 2006/071
Number of organisations 900,000 *2
Total income £157 billion *2
Civil society paid workforce (headcount) 1.6 million *2
Voluntary organisations 2007/08 2006/07
Number of voluntary organisations 171,074 170,905
Total income £35.5 billion £34.5 billion
Voluntary income £14.9 billion £14.1 billion
Earned income £17.4 billion £17.7 billion
Investment income £3.2 billion £2.7 billion
Income from individuals £13.1 billion £13.1 billion
Income from statutory sources £12.8 billion £11.9 billion
Income from National Lottery distributors £523 million £609 million
Income from other sources £9.1 billion £8.9 billion
Total current expenditure £32.8 billion £32.4 billion
Expenditure on charitable activities (excluding grants) £23.0 billion £23.5 billion
Expenditure on grants £5.0 billion £4.5 billion
Expenditure on generating funds £4.1 billion £3.7 billion
Expenditure on governance £735 million £676 million
Net assets £96.6 billion £94.9 billion
Giving 2008/09 2007/08
Mean amount donated per person in last four weeks £31 £33
Proportion giving to charity
Men 49% 51%
Women 58% 58%
Workforce 2008 2007
UK voluntary sector paid workforce (headcount) 668,000 634,000
Employment status
Full-time 63% 63%
Part-time 37% 37%
Gender Female 68% 71%
Male 32% 29%
Volunteering 2008/09 2007/08
Number of people formally volunteering
at least once a month 26% 27%
at least once a year 41% 43%
Fast facts
A m
ap o
f civ
il so
ciet
y
Cha
riti
es
(£69
bill
ion)
Mut
uals
and
co
-ope
rati
ves
(£63
bill
ion)
Fina
ncia
l mut
uals
(20)
Frie
ndly
soci
etie
s(2
00)
Co
-ope
rati
ve tr
ust
scho
ols (
30)
Clu
bs a
nd
soci
etie
s(6
,60
0)
Empl
oyee
-ow
ned
busi
ness
es (2
00)
GP
co-o
ps a
nd
mut
uals
(40)
Cre
dit u
nion
s(4
90)
Bui
ldin
g so
ciet
ies
(50)
Foot
ball
supp
orte
rs tr
usts
(170
)
Co
-ope
rati
ves
(4,6
00)
Info
rmal
org
anis
atio
ns(~
600,
000)
Com
mun
ity
inte
rest
co
mpa
nies
(£60
0 m
illio
n)(1
,40
0)
Ben
evol
ent s
ocie
ties
(£31
0 m
illio
n)(2
,20
0)
Hou
sing
ass
ocia
tion
s(£
12 b
illio
n)(1
,820
)
Fait
h gr
oups
(£4
billi
on)
(13,
700)
Spor
ts c
lubs
(£5
billi
on)
(127
,00
0)
Gen
eral
ch
arit
ies
(171
,00
0)
Com
mon
in
vest
men
t fu
nds (
60)
Polit
ical
par
ties
(£76
mill
ion)
(1
61)
Trad
e as
soci
atio
ns(2
90)
Leis
ure
trus
ts(1
20)
Exce
pted
cha
riti
es(4
,00
0)
Uni
vers
itie
s(1
70)
Gov
ernm
ent c
hari
ties
(e
xclu
ded
- 460
)
Inde
pend
ent
scho
ols
(2,4
10)
Trad
e un
ions
(£1
billi
on)
(190
)
Oth
er c
ompa
nies
lim
ited
by
guar
ante
e(£
6 bi
llion
)(2
2,70
0)
The
box
es o
n th
is fig
ure
are
not t
o sc
ale,
and
do
not r
epre
sent
num
eric
or
fina
ncia
l wei
ght.
The
num
bers
in b
rack
ets s
how
the
inco
me
and
num
ber o
f org
anis
atio
ns in
eac
h pa
rt o
f civ
il so
ciet
y. T
his fi
gure
is ju
st
one
poss
ible
sim
plifi
catio
n of
a m
uch
mor
e co
mpl
icat
ed le
gal,
regu
lato
ry a
nd o
rgan
isat
iona
l lan
dsca
pe, a
nd th
ere
are
man
y cr
osso
vers
and
dup
licat
ions
bet
wee
n th
e pa
rts o
f civ
il so
ciet
y sh
own.
UK Civil Society Almanac 2010
www.ncvo-vol.org.uk/almanac
���
The UK C�v�l Soc�ety Almanac 2010Jenny ClarkDavid KaneKarl WildingJenny Wilton
��
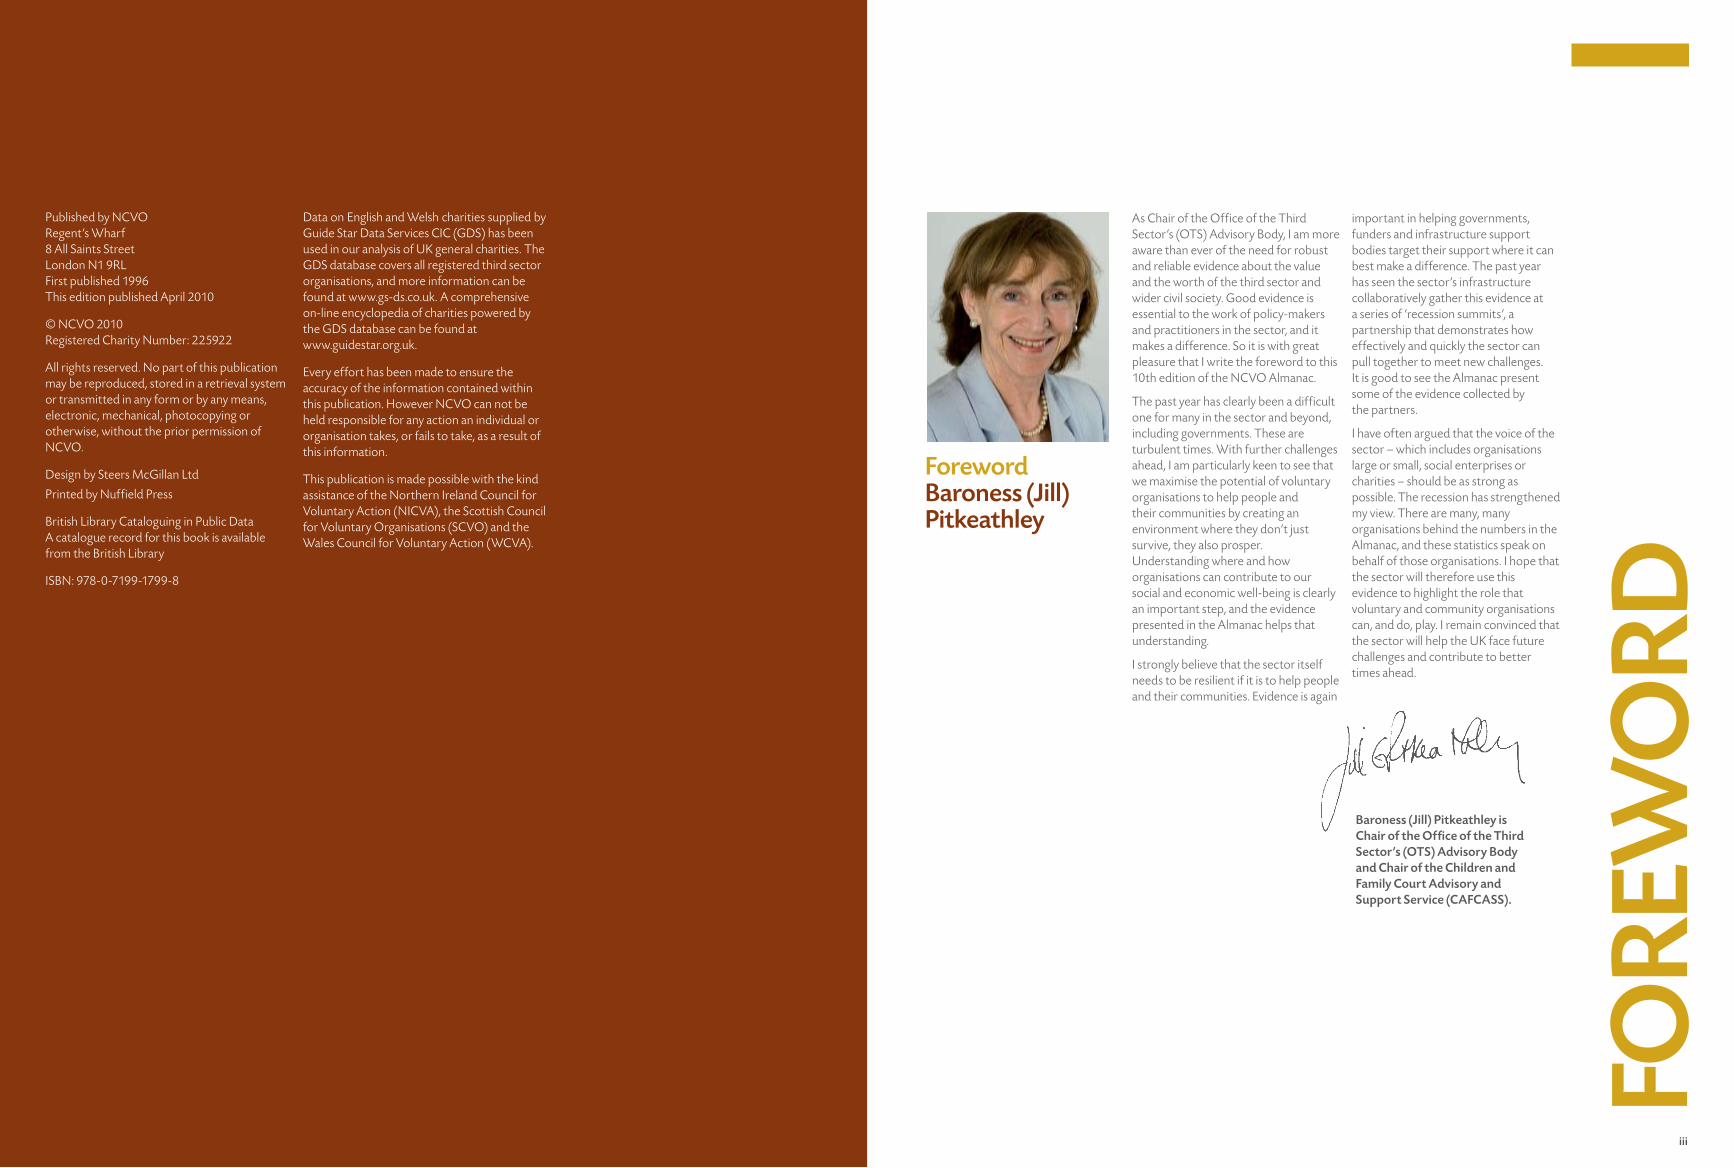
As Chair of the Office of the Third Sector’s (OTS) Advisory Body, I am more aware than ever of the need for robust and reliable evidence about the value and the worth of the third sector and wider civil society. Good evidence is essential to the work of policy-makers and practitioners in the sector, and it makes a difference. So it is with great pleasure that I write the foreword to this 10th edition of the NCVO Almanac.
The past year has clearly been a difficult one for many in the sector and beyond, including governments. These are turbulent times. With further challenges ahead, I am particularly keen to see that we maximise the potential of voluntary organisations to help people and their communities by creating an environment where they don’t just survive, they also prosper. Understanding where and how organisations can contribute to our social and economic well-being is clearly an important step, and the evidence presented in the Almanac helps that understanding.
I strongly believe that the sector itself needs to be resilient if it is to help people and their communities. Evidence is again
important in helping governments, funders and infrastructure support bodies target their support where it can best make a difference. The past year has seen the sector’s infrastructure collaboratively gather this evidence at a series of ‘recession summits’, a partnership that demonstrates how effectively and quickly the sector can pull together to meet new challenges. It is good to see the Almanac present some of the evidence collected by the partners.
I have often argued that the voice of the sector – which includes organisations large or small, social enterprises or charities – should be as strong as possible. The recession has strengthened my view. There are many, many organisations behind the numbers in the Almanac, and these statistics speak on behalf of those organisations. I hope that the sector will therefore use this evidence to highlight the role that voluntary and community organisations can, and do, play. I remain convinced that the sector will help the UK face future challenges and contribute to better times ahead.
Foreword Baroness (J�ll) P�tkeathley
Baroness (J�ll) P�tkeathley �s Cha�r of the Office of the Th�rd Sector’s (OTS) Adv�sory Body and Cha�r of the Ch�ldren and Fam�ly Court Adv�sory and Support Serv�ce (CAFCASS).
FOre
wO
rdU
K C
IVIL
SO
CIe
TY
A
LMA
NA
C 2
010
Published by NCVORegent’s Wharf8 All Saints StreetLondon N1 9RLFirst published 1996This edition published April 2010
© NCVO 2010Registered Charity Number: 225922
All rights reserved. No part of this publication may be reproduced, stored in a retrieval system or transmitted in any form or by any means, electronic, mechanical, photocopying or otherwise, without the prior permission of NCVO.
Design by Steers McGillan Ltd
Printed by Nuffield Press
British Library Cataloguing in Public Data A catalogue record for this book is available from the British Library
ISBN: 978-0-7199-1799-8
Data on English and Welsh charities supplied by Guide Star Data Services CIC (GDS) has been used in our analysis of UK general charities. The GDS database covers all registered third sector organisations, and more information can be found at www.gs-ds.co.uk. A comprehensive on-line encyclopedia of charities powered by the GDS database can be found at www.guidestar.org.uk.
Every effort has been made to ensure the accuracy of the information contained within this publication. However NCVO can not be held responsible for any action an individual or organisation takes, or fails to take, as a result of this information.
This publication is made possible with the kind assistance of the Northern Ireland Council for Voluntary Action (NICVA), the Scottish Council for Voluntary Organisations (SCVO) and the Wales Council for Voluntary Action (WCVA).
������
�v
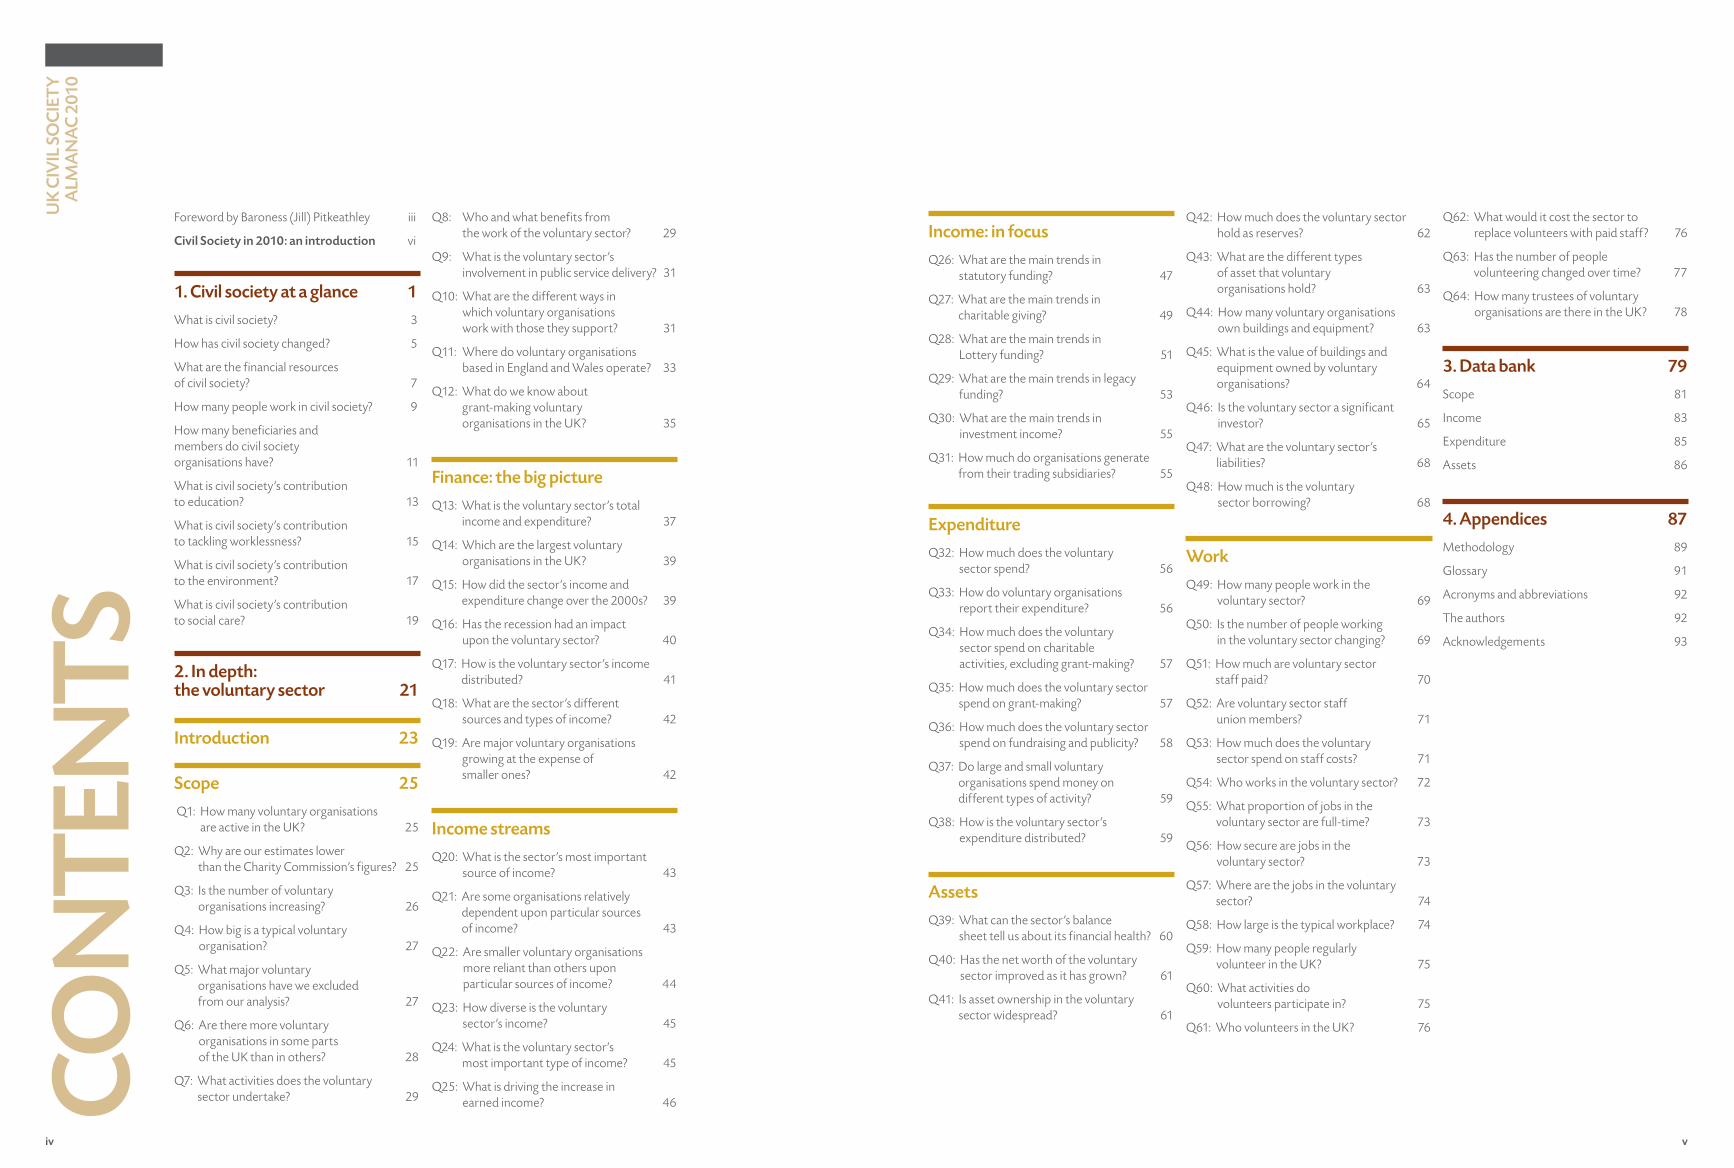
Income: �n focus
Q26: What are the main trends in statutory funding? 47
Q27: What are the main trends in charitable giving? 49
Q28: What are the main trends in Lottery funding? 51
Q29: What are the main trends in legacy funding? 53
Q30: What are the main trends in investment income? 55
Q31: How much do organisations generate from their trading subsidiaries? 55
expend�ture
Q32: How much does the voluntary sector spend? 56
Q33: How do voluntary organisations report their expenditure? 56
Q34: How much does the voluntary sector spend on charitable activities, excluding grant-making? 57
Q35: How much does the voluntary sector spend on grant-making? 57
Q36: How much does the voluntary sector spend on fundraising and publicity? 58
Q37: Do large and small voluntary organisations spend money on different types of activity? 59
Q38: How is the voluntary sector’s expenditure distributed? 59
Assets
Q39: What can the sector’s balance sheet tell us about its financial health? 60
Q40: Has the net worth of the voluntary sector improved as it has grown? 61
Q41: Is asset ownership in the voluntary sector widespread? 61
Q42: How much does the voluntary sector hold as reserves? 62
Q43: What are the different types of asset that voluntary organisations hold? 63
Q44: How many voluntary organisations own buildings and equipment? 63
Q45: What is the value of buildings and equipment owned by voluntary organisations? 64
Q46: Is the voluntary sector a significant investor? 65
Q47: What are the voluntary sector’s liabilities? 68
Q48: How much is the voluntary sector borrowing? 68
work
Q49: How many people work in the voluntary sector? 69
Q50: Is the number of people working in the voluntary sector changing? 69
Q51: How much are voluntary sector staff paid? 70
Q52: Are voluntary sector staff union members? 71
Q53: How much does the voluntary sector spend on staff costs? 71
Q54: Who works in the voluntary sector? 72
Q55: What proportion of jobs in the voluntary sector are full-time? 73
Q56: How secure are jobs in the voluntary sector? 73
Q57: Where are the jobs in the voluntary sector? 74
Q58: How large is the typical workplace? 74
Q59: How many people regularly volunteer in the UK? 75
Q60: What activities do volunteers participate in? 75
Q61: Who volunteers in the UK? 76
Q62: What would it cost the sector to replace volunteers with paid staff? 76
Q63: Has the number of people volunteering changed over time? 77
Q64: How many trustees of voluntary organisations are there in the UK? 78
3. data bank 79
Scope 81
Income 83
Expenditure 85
Assets 86
4. Append�ces 87
Methodology 89
Glossary 91
Acronyms and abbreviations 92
The authors 92
Acknowledgements 93
v
Foreword by Baroness (Jill) Pitkeathley iii
C�v�l Soc�ety �n 2010: an �ntroduct�on vi
1. C�v�l soc�ety at a glance 1
What is civil society? 3
How has civil society changed? 5
What are the financial resources of civil society? 7
How many people work in civil society? 9
How many beneficiaries and members do civil society organisations have? 11
What is civil society’s contribution to education? 13
What is civil society’s contribution to tackling worklessness? 15
What is civil society’s contribution to the environment? 17
What is civil society’s contribution to social care? 19
2. In depth: the voluntary sector 21
Introduct�on 23
Scope 25
Q1: How many voluntary organisations are active in the UK? 25
Q2: Why are our estimates lower than the Charity Commission’s figures? 25
Q3: Is the number of voluntary organisations increasing? 26
Q4: How big is a typical voluntary organisation? 27
Q5: What major voluntary organisations have we excluded from our analysis? 27
Q6: Are there more voluntary organisations in some parts of the UK than in others? 28
Q7: What activities does the voluntary sector undertake? 29
Q8: Who and what benefits from the work of the voluntary sector? 29
Q9: What is the voluntary sector’s involvement in public service delivery? 31
Q10: What are the different ways in which voluntary organisations work with those they support? 31
Q11: Where do voluntary organisations based in England and Wales operate? 33
Q12: What do we know about grant-making voluntary organisations in the UK? 35
F�nance: the b�g p�cture
Q13: What is the voluntary sector’s total income and expenditure? 37
Q14: Which are the largest voluntary organisations in the UK? 39
Q15: How did the sector’s income and expenditure change over the 2000s? 39
Q16: Has the recession had an impact upon the voluntary sector? 40
Q17: How is the voluntary sector’s income distributed? 41
Q18: What are the sector’s different sources and types of income? 42
Q19: Are major voluntary organisations growing at the expense of smaller ones? 42
Income streams
Q20: What is the sector’s most important source of income? 43
Q21: Are some organisations relatively dependent upon particular sources of income? 43
Q22: Are smaller voluntary organisations more reliant than others upon particular sources of income? 44
Q23: How diverse is the voluntary sector’s income? 45
Q24: What is the voluntary sector’s most important type of income? 45
Q25: What is driving the increase in earned income? 46CO
NTe
NTS
UK
CIV
IL S
OC
IeT
Y
ALM
AN
AC
201
0
v� v��
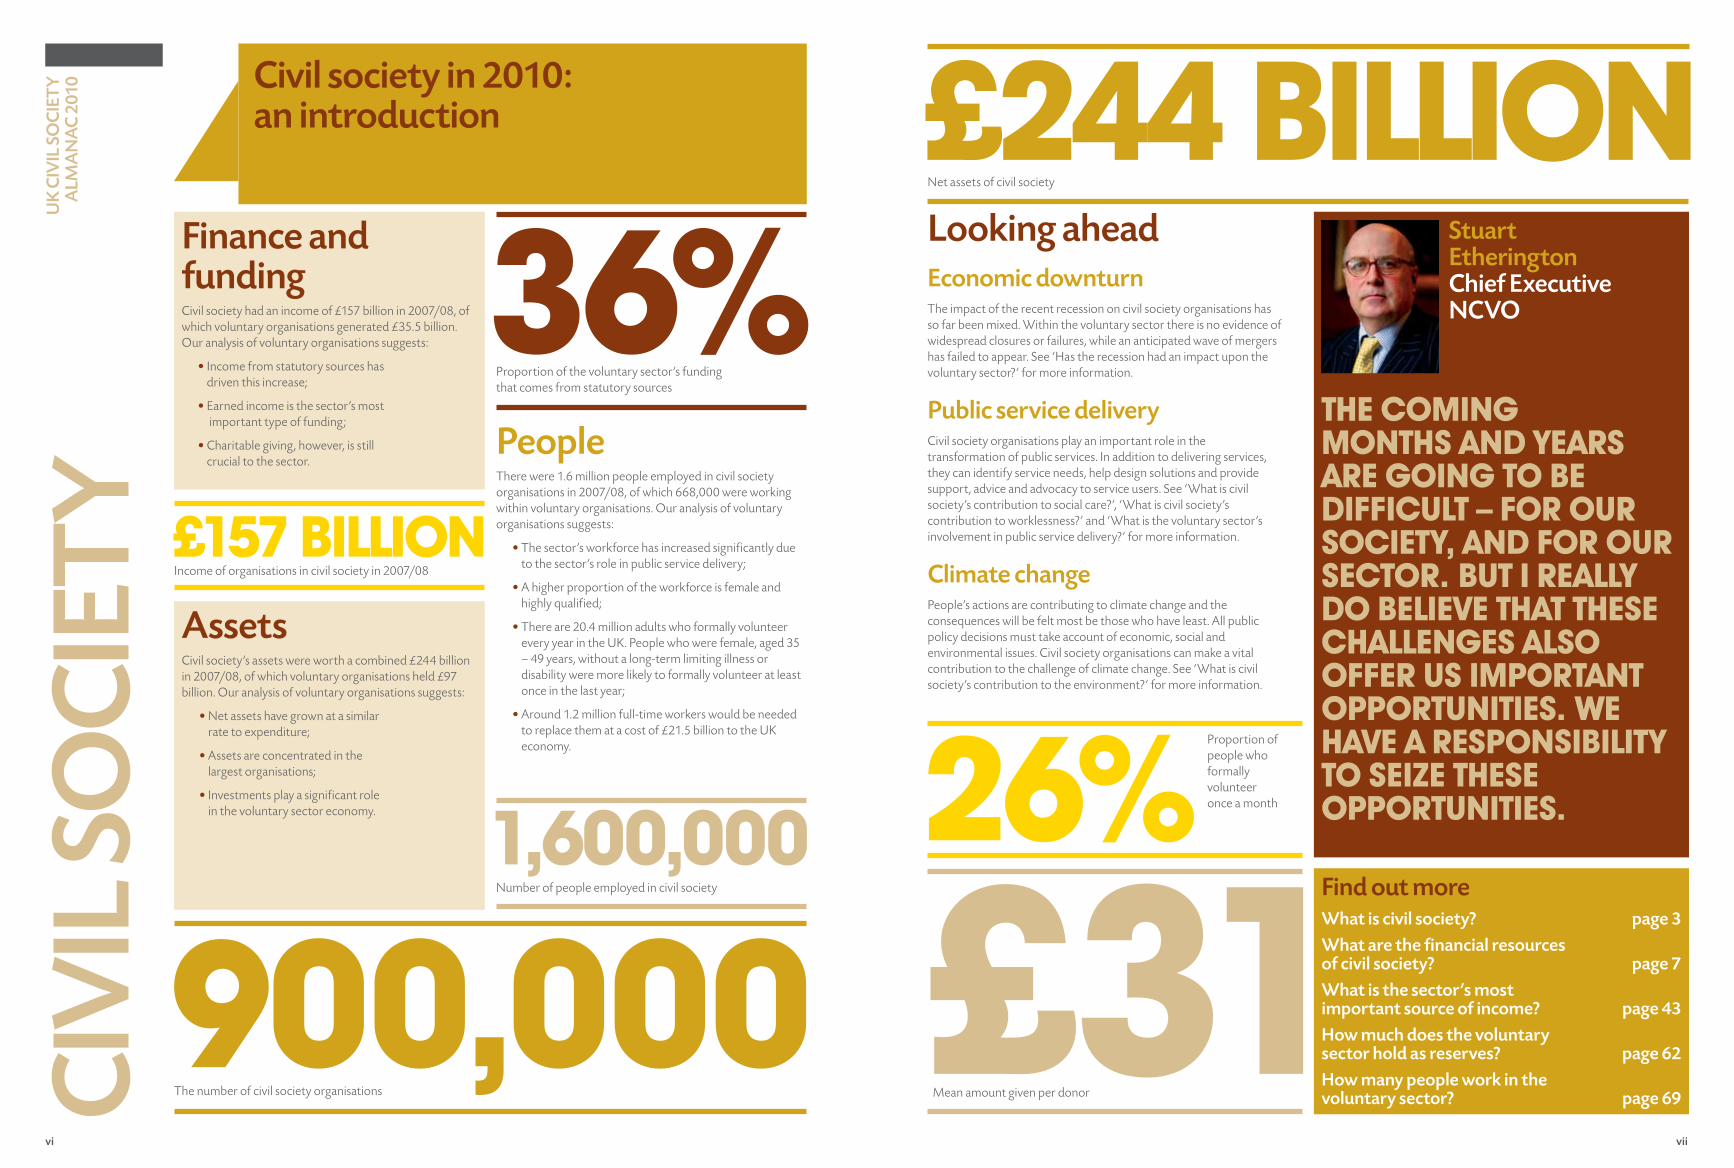
£31
The coming monThs and years are going To be difficulT – for our socieTy, and for our secTor. buT i really do believe ThaT These challenges also offer us imporTanT opporTuniTies. We have a responsibiliTy To seize These opporTuniTies.
F�nance and fund�ngCivil society had an income of £157 billion in 2007/08, of which voluntary organisations generated £35.5 billion. Our analysis of voluntary organisations suggests:
• Income from statutory sources has driven this increase;
• Earned income is the sector’s most important type of funding;
• Charitable giving, however, is still crucial to the sector.
AssetsCivil society’s assets were worth a combined £244 billion in 2007/08, of which voluntary organisations held £97 billion. Our analysis of voluntary organisations suggests:
• Net assets have grown at a similar rate to expenditure;
• Assets are concentrated in the largest organisations;
• Investments play a significant role in the voluntary sector economy.
PeopleThere were 1.6 million people employed in civil society organisations in 2007/08, of which 668,000 were working within voluntary organisations. Our analysis of voluntary organisations suggests:
• The sector’s workforce has increased significantly due to the sector’s role in public service delivery;
• A higher proportion of the workforce is female and highly qualified;
• There are 20.4 million adults who formally volunteer every year in the UK. People who were female, aged 35 – 49 years, without a long-term limiting illness or disability were more likely to formally volunteer at least once in the last year;
• Around 1.2 million full-time workers would be needed to replace them at a cost of £21.5 billion to the UK economy.
Look�ng aheadeconom�c downturnThe impact of the recent recession on civil society organisations has so far been mixed. Within the voluntary sector there is no evidence of widespread closures or failures, while an anticipated wave of mergers has failed to appear. See ‘Has the recession had an impact upon the voluntary sector?’ for more information.
Publ�c serv�ce del�veryCivil society organisations play an important role in the transformation of public services. In addition to delivering services, they can identify service needs, help design solutions and provide support, advice and advocacy to service users. See ‘What is civil society’s contribution to social care?’, ‘What is civil society’s contribution to worklessness?’ and ‘What is the voluntary sector’s involvement in public service delivery?’ for more information.
Cl�mate changePeople’s actions are contributing to climate change and the consequences will be felt most be those who have least. All public policy decisions must take account of economic, social and environmental issues. Civil society organisations can make a vital contribution to the challenge of climate change. See ‘What is civil society’s contribution to the environment?’ for more information.
900,000The number of civil society organisations
£244 billionNet assets of civil society
36%Proportion of the voluntary sector’s funding that comes from statutory sources
26%Proportion of people who formally volunteer once a month
F�nd out morewhat �s c�v�l soc�ety? page 3
what are the financ�al resourcesof c�v�l soc�ety? page 7
what �s the sector’s most �mportant source of �ncome? page 43
How much does the voluntarysector hold as reserves? page 62
How many people work �n the voluntary sector? page 69C
IVIL
SO
CIe
TY
C�v�l soc�ety �n 2010: an �ntroduct�on
UK
CIV
IL S
OC
IeT
Y
ALM
AN
AC
201
0
Mean amount given per donor
Stuart ether�ngton Ch�ef execut�ve NCVO
£157 billionIncome of organisations in civil society in 2007/08
1,600,000Number of people employed in civil society
CIV
IL S
OC
IET
Y
AT A
GLA
NC
E
1Section Contents
p3 What is civil society? p5 How has civil society changed?p7 What are the financial resources
of civil society? p9 How many people work in civil society? p11 How many beneficiaries and members
do civil society organisations have?p13 What is civil society’s contribution
to education? p15 What is civil society’s contribution
to tackling worklessness? p17 What is civil society’s contribution
to the environment?p19 What is civil society’s contribution
to social care?
1 �
3 �
SEC
TIO
N 1
: C
IVIL
SO
CIE
TY
AT
A G
LAN
CE
CIV
IL S
OC
IETY
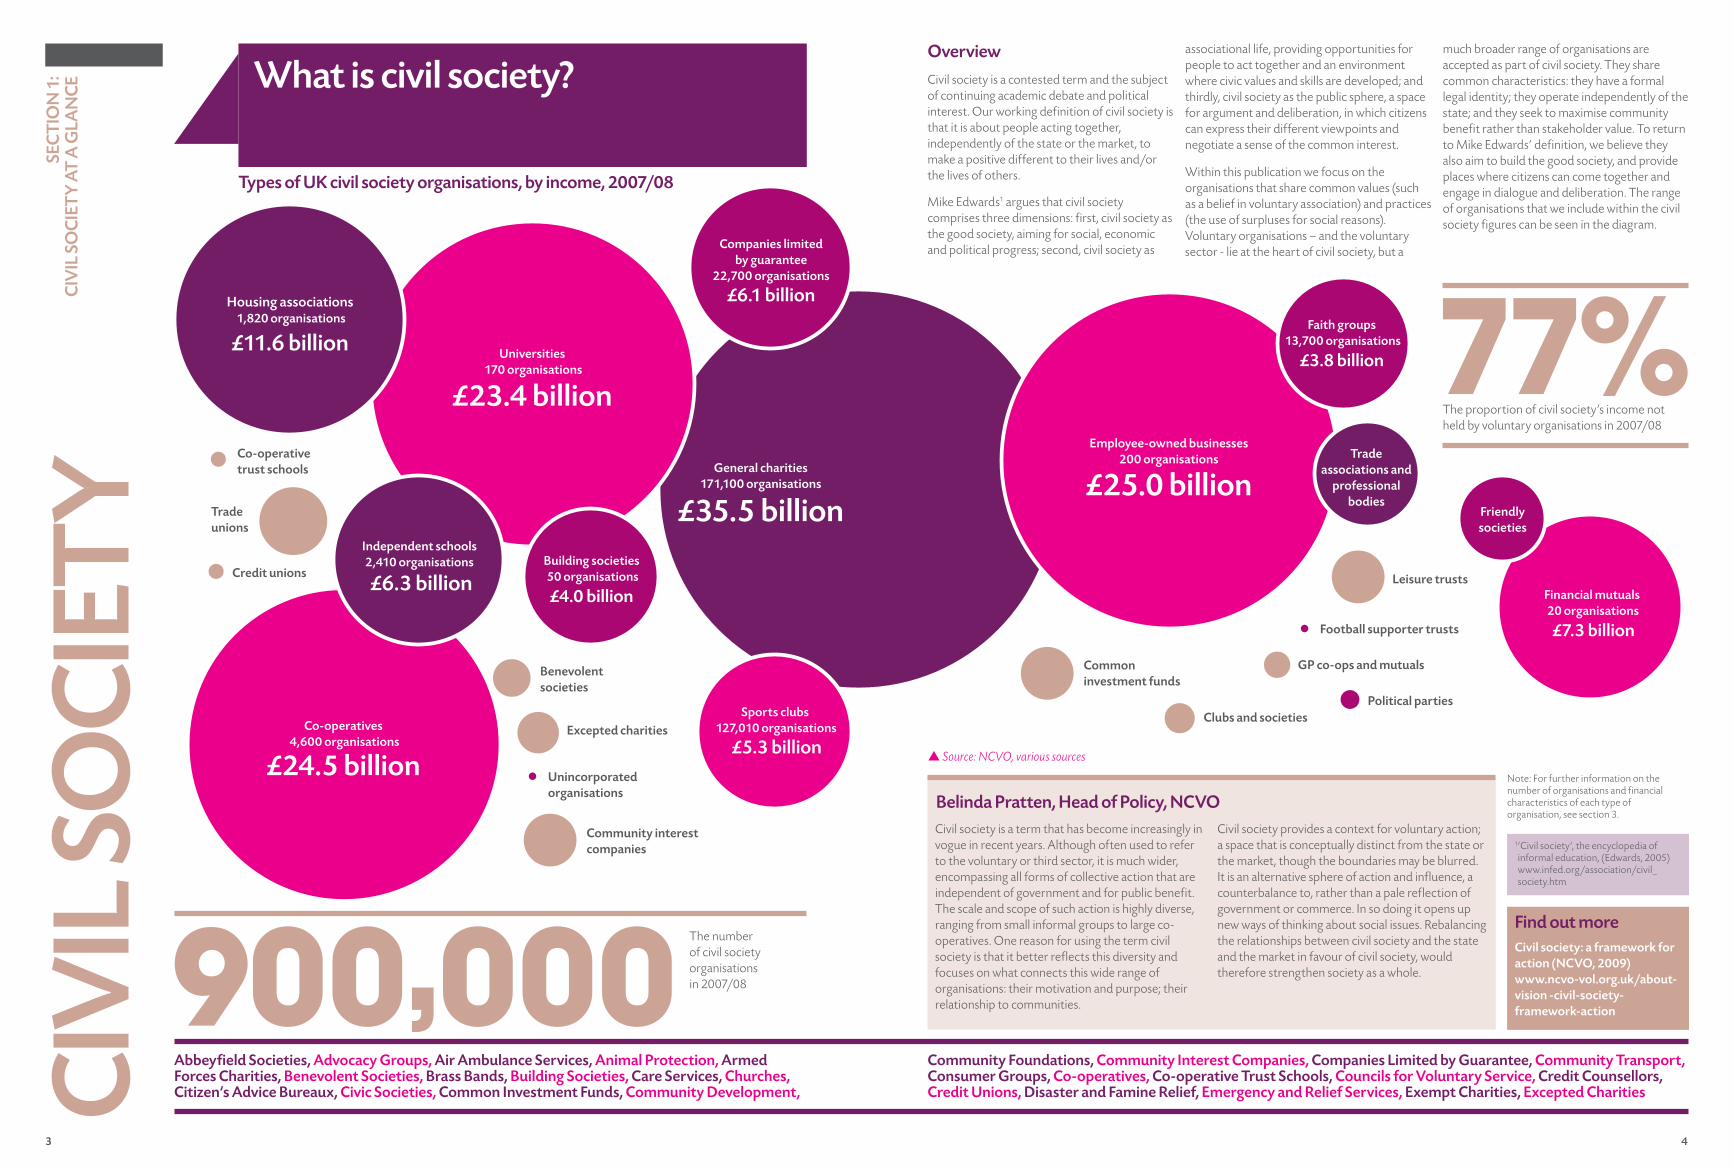
Types of UK civil society organisations, by income, �007/08
p Source: NCVO, various sources
Note: For further information on the number of organisations and financial characteristics of each type of organisation, see section 3.
77%The proportion of civil society’s income not held by voluntary organisations in 2007/08
General charities171,100 organisations
£35.5 billion
900,000The number of civil society organisations in 2007/08
Co-operatives �,600 organisations
£��.5 billion
Universities 170 organisations
£�3.� billion
Independent schools�,�10 organisations
£6.3 billion
Housing associations 1,8�0 organisations
£11.6 billion
Companies limited by guarantee
��,700 organisations
£6.1 billion
Common investment funds
Credit unions
Football supporter trusts
Co-operative trust schools
Political parties
Leisure trusts
GP co-ops and mutuals
Sports clubs 1�7,010 organisations
£5.3 billion
Building societies 50 organisations
£�.0 billion
Benevolent societies
Trade unions
Excepted charities
Community interest companies
Clubs and societies
Unincorporated organisations
What is civil society?
Employee-owned businesses�00 organisations
£�5.0 billion
Financial mutuals �0 organisations
£7.3 billion
Faith groups 13,700 organisations
£3.8 billion
Trade associations and
professional bodies
Friendly societies
Overview
Civil society is a contested term and the subject of continuing academic debate and political interest. Our working definition of civil society is that it is about people acting together, independently of the state or the market, to make a positive different to their lives and/or the lives of others.
Mike Edwards1 argues that civil society comprises three dimensions: first, civil society as the good society, aiming for social, economic and political progress; second, civil society as
associational life, providing opportunities for people to act together and an environment where civic values and skills are developed; and thirdly, civil society as the public sphere, a space for argument and deliberation, in which citizens can express their different viewpoints and negotiate a sense of the common interest.
Within this publication we focus on the organisations that share common values (such as a belief in voluntary association) and practices (the use of surpluses for social reasons). Voluntary organisations – and the voluntary sector - lie at the heart of civil society, but a
much broader range of organisations are accepted as part of civil society. They share common characteristics: they have a formal legal identity; they operate independently of the state; and they seek to maximise community benefit rather than stakeholder value. To return to Mike Edwards’ definition, we believe they also aim to build the good society, and provide places where citizens can come together and engage in dialogue and deliberation. The range of organisations that we include within the civil society figures can be seen in the diagram.
Civil society is a term that has become increasingly in vogue in recent years. Although often used to refer to the voluntary or third sector, it is much wider, encompassing all forms of collective action that are independent of government and for public benefit. The scale and scope of such action is highly diverse, ranging from small informal groups to large co-operatives. One reason for using the term civil society is that it better reflects this diversity and focuses on what connects this wide range of organisations: their motivation and purpose; their relationship to communities.
Civil society provides a context for voluntary action; a space that is conceptually distinct from the state or the market, though the boundaries may be blurred. It is an alternative sphere of action and influence, a counterbalance to, rather than a pale reflection of government or commerce. In so doing it opens up new ways of thinking about social issues. Rebalancing the relationships between civil society and the state and the market in favour of civil society, would therefore strengthen society as a whole.
Belinda Pratten, Head of Policy, NCVO
Abbeyfield Societies, Advocacy Groups, Air Ambulance Services, Animal Protection, Armed Forces Charities, Benevolent Societies, Brass Bands, Building Societies, Care Services, Churches, Citizen’s Advice Bureaux, Civic Societies, Common Investment Funds, Community Development,
Community Foundations, Community Interest Companies, Companies Limited by Guarantee, Community Transport, Consumer Groups, Co-operatives, Co-operative Trust Schools, Councils for Voluntary Service, Credit Counsellors, Credit Unions, Disaster and Famine Relief, Emergency and Relief Services, Exempt Charities, Excepted Charities
Find out moreCivil society: a framework for action (NCVO, �009) www.ncvo-vol.org.uk/about-vision -civil-society-framework-action
1 ‘Civil society’, the encyclopedia of informal education, (Edwards, 2005) www.infed.org/association/civil_society.htm
5 6
600,000
SEC
TIO
N 1
: C
IVIL
SO
CIE
TY
AT
A G
LAN
CE
CIV
IL S
OC
IETY
Number of UK voluntary sector and civil society organisations, �007/08
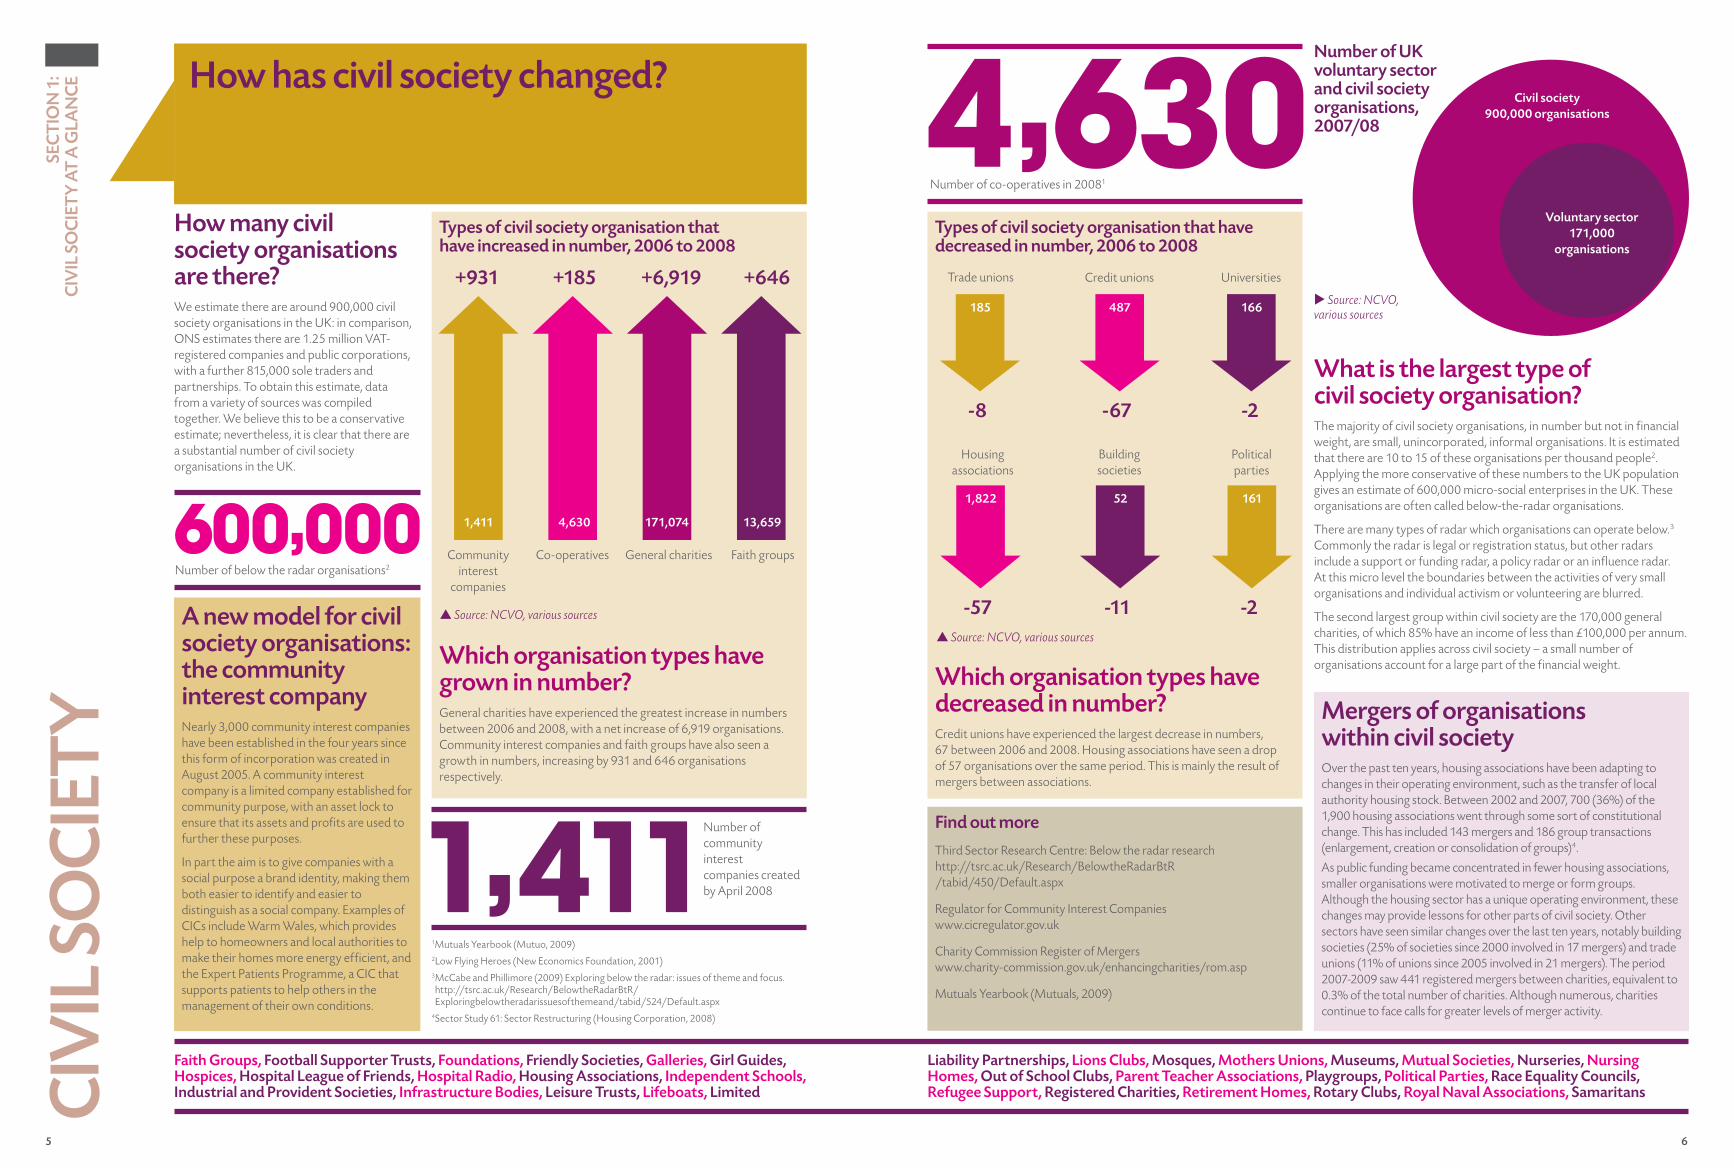
How has civil society changed?
What is the largest type of civil society organisation?The majority of civil society organisations, in number but not in financial weight, are small, unincorporated, informal organisations. It is estimated that there are 10 to 15 of these organisations per thousand people2. Applying the more conservative of these numbers to the UK population gives an estimate of 600,000 micro-social enterprises in the UK. These organisations are often called below-the-radar organisations.
There are many types of radar which organisations can operate below.3 Commonly the radar is legal or registration status, but other radars include a support or funding radar, a policy radar or an influence radar. At this micro level the boundaries between the activities of very small organisations and individual activism or volunteering are blurred.
The second largest group within civil society are the 170,000 general charities, of which 85% have an income of less than £100,000 per annum. This distribution applies across civil society – a small number of organisations account for a large part of the financial weight.
How many civil society organisations are there? We estimate there are around 900,000 civil society organisations in the UK: in comparison, ONS estimates there are 1.25 million VAT-registered companies and public corporations, with a further 815,000 sole traders and partnerships. To obtain this estimate, data from a variety of sources was compiled together. We believe this to be a conservative estimate; nevertheless, it is clear that there are a substantial number of civil society organisations in the UK.
Which organisation types have grown in number?General charities have experienced the greatest increase in numbers between 2006 and 2008, with a net increase of 6,919 organisations. Community interest companies and faith groups have also seen a growth in numbers, increasing by 931 and 646 organisations respectively.
A new model for civil society organisations: the community interest companyNearly 3,000 community interest companies have been established in the four years since this form of incorporation was created in August 2005. A community interest company is a limited company established for community purpose, with an asset lock to ensure that its assets and profits are used to further these purposes.
In part the aim is to give companies with a social purpose a brand identity, making them both easier to identify and easier to distinguish as a social company. Examples of CICs include Warm Wales, which provides help to homeowners and local authorities to make their homes more energy efficient, and the Expert Patients Programme, a CIC that supports patients to help others in the management of their own conditions.
Which organisation types have decreased in number?Credit unions have experienced the largest decrease in numbers, 67 between 2006 and 2008. Housing associations have seen a drop of 57 organisations over the same period. This is mainly the result of mergers between associations.
4,630Number of co-operatives in 20081
Number of below the radar organisations2
p Source: NCVO, various sources
1Mutuals Yearbook (Mutuo, 2009)2Low Flying Heroes (New Economics Foundation, 2001)3 McCabe and Phillimore (2009) Exploring below the radar: issues of theme and focus. http://tsrc.ac.uk/Research/BelowtheRadarBtR/Exploringbelowtheradarissuesofthemeand/tabid/524/Default.aspx
4Sector Study 61: Sector Restructuring (Housing Corporation, 2008)
Types of civil society organisation that have increased in number, �006 to �008
Types of civil society organisation that have decreased in number, �006 to �008
Civil society 900,000 organisations
Voluntary sector 171,000
organisations
Mergers of organisations within civil societyOver the past ten years, housing associations have been adapting to changes in their operating environment, such as the transfer of local authority housing stock. Between 2002 and 2007, 700 (36%) of the 1,900 housing associations went through some sort of constitutional change. This has included 143 mergers and 186 group transactions (enlargement, creation or consolidation of groups)4.
As public funding became concentrated in fewer housing associations, smaller organisations were motivated to merge or form groups. Although the housing sector has a unique operating environment, these changes may provide lessons for other parts of civil society. Other sectors have seen similar changes over the last ten years, notably building societies (25% of societies since 2000 involved in 17 mergers) and trade unions (11% of unions since 2005 involved in 21 mergers). The period 2007-2009 saw 441 registered mergers between charities, equivalent to 0.3% of the total number of charities. Although numerous, charities continue to face calls for greater levels of merger activity.
1,411Number of community interest companies created by April 2008
Find out more
Third Sector Research Centre: Below the radar research http://tsrc.ac.uk/Research/BelowtheRadarBtR /tabid/450/Default.aspx
Regulator for Community Interest Companies www.cicregulator.gov.uk
Charity Commission Register of Mergers www.charity-commission.gov.uk/enhancingcharities/rom.asp
Mutuals Yearbook (Mutuals, 2009)
Community interest
companies
1,�11 �,630 171,07� 13,659
+931 +185 +6,919 +6�6
Co-operatives General charities Faith groups
Trade unions
185
Credit unions
�87
Universities
166
Housing associations
1,8��
Building societies
5�
-8 -67 -�
-57 -11 -�
Political parties
161
Faith Groups, Football Supporter Trusts, Foundations, Friendly Societies, Galleries, Girl Guides, Hospices, Hospital League of Friends, Hospital Radio, Housing Associations, Independent Schools, Industrial and Provident Societies, Infrastructure Bodies, Leisure Trusts, Lifeboats, Limited
Liability Partnerships, Lions Clubs, Mosques, Mothers Unions, Museums, Mutual Societies, Nurseries, Nursing Homes, Out of School Clubs, Parent Teacher Associations, Playgroups, Political Parties, Race Equality Councils, Refugee Support, Registered Charities, Retirement Homes, Rotary Clubs, Royal Naval Associations, Samaritans
u Source: NCVO, various sources
p Source: NCVO, various sources
7 8
SEC
TIO
N 1
: C
IVIL
SO
CIE
TY
AT
A G
LAN
CE
CIV
IL S
OC
IETY
What are the financial resources of civil society?
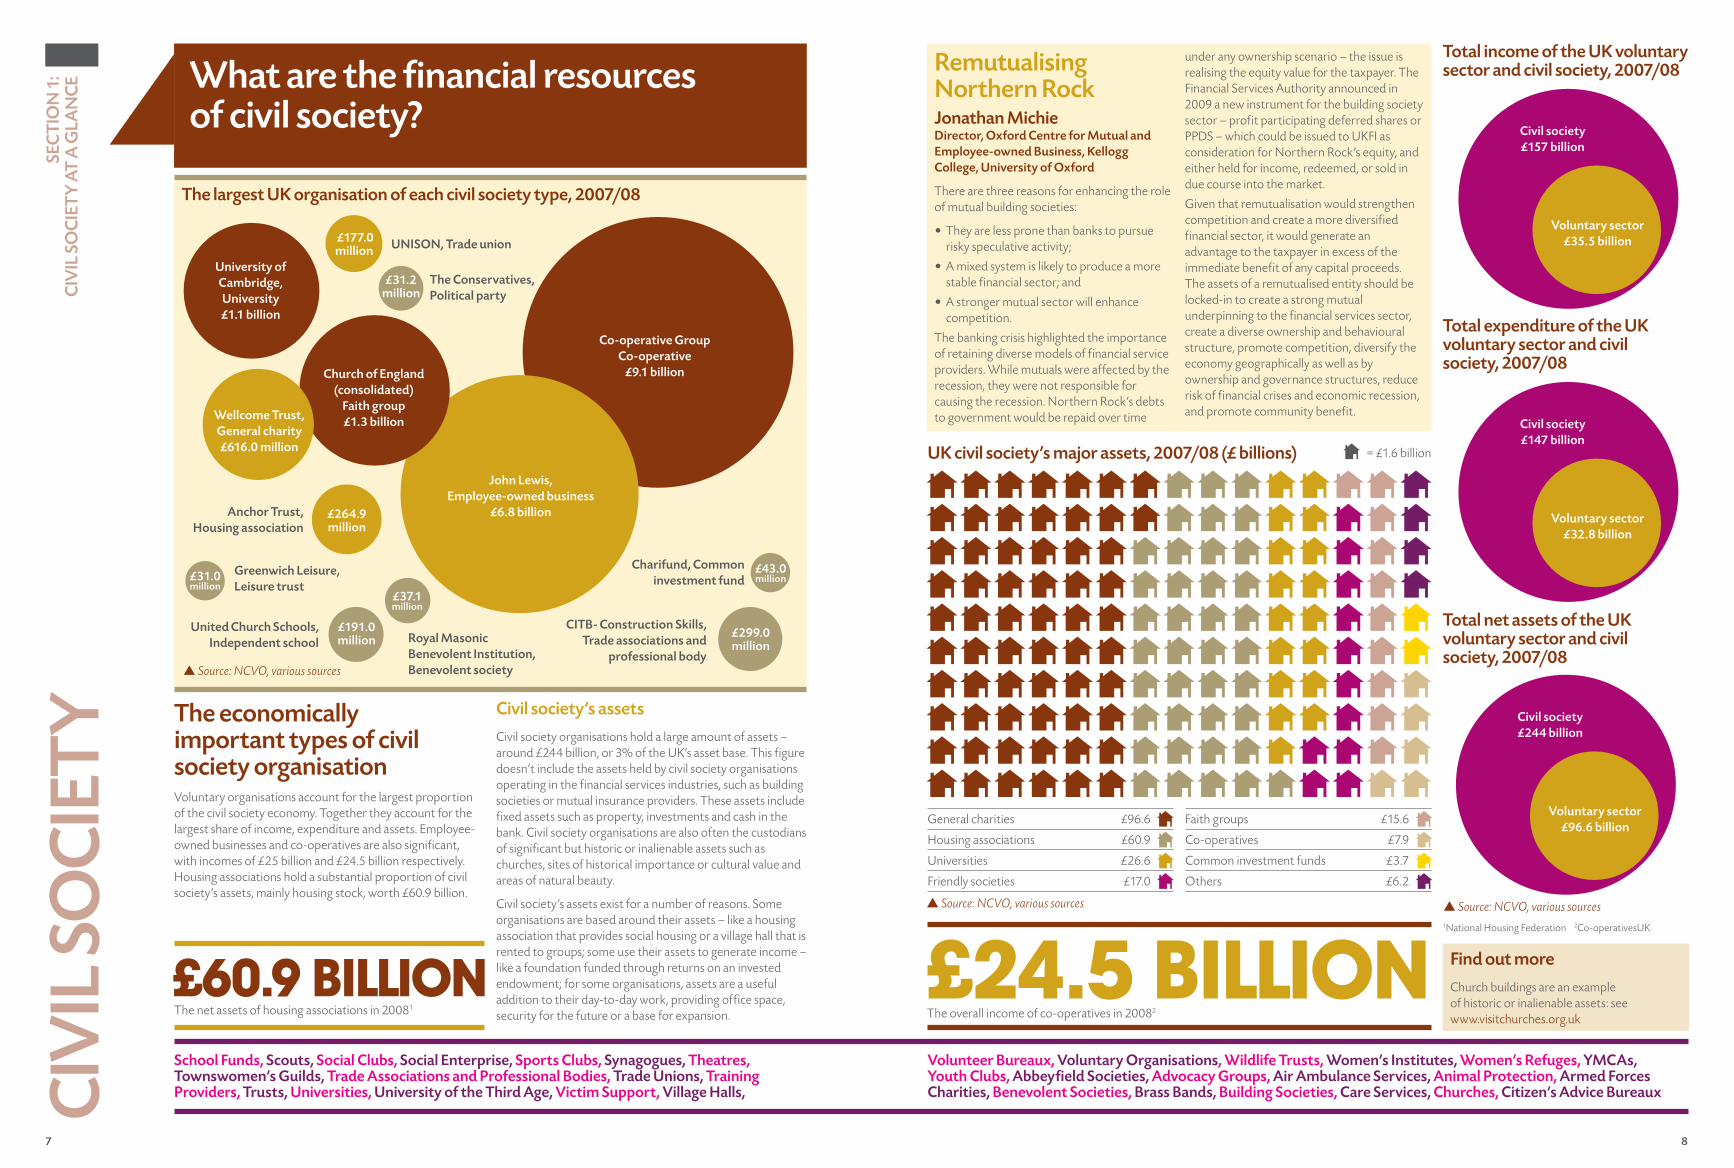
Total income of the UK voluntary sector and civil society, �007/08
£24.5 billionThe overall income of co-operatives in 20082
Remutualising Northern Rock Jonathan MichieDirector, Oxford Centre for Mutual and Employee-owned Business, Kellogg College, University of Oxford
There are three reasons for enhancing the role of mutual building societies:
• They are less prone than banks to pursue risky speculative activity;
• A mixed system is likely to produce a more stable financial sector; and
• A stronger mutual sector will enhance competition.
The banking crisis highlighted the importance of retaining diverse models of financial service providers. While mutuals were affected by the recession, they were not responsible for causing the recession. Northern Rock’s debts to government would be repaid over time
under any ownership scenario – the issue is realising the equity value for the taxpayer. The Financial Services Authority announced in 2009 a new instrument for the building society sector – profit participating deferred shares or PPDS – which could be issued to UKFI as consideration for Northern Rock’s equity, and either held for income, redeemed, or sold in due course into the market.
Given that remutualisation would strengthen competition and create a more diversified financial sector, it would generate an advantage to the taxpayer in excess of the immediate benefit of any capital proceeds. The assets of a remutualised entity should be locked-in to create a strong mutual underpinning to the financial services sector, create a diverse ownership and behavioural structure, promote competition, diversify the economy geographically as well as by ownership and governance structures, reduce risk of financial crises and economic recession, and promote community benefit.
p Source: NCVO, various sources
Total expenditure of the UK voluntary sector and civil society, �007/08
Total net assets of the UK voluntary sector and civil society, �007/08
The largest UK organisation of each civil society type, �007/08
The economically important types of civil society organisationVoluntary organisations account for the largest proportion of the civil society economy. Together they account for the largest share of income, expenditure and assets. Employee-owned businesses and co-operatives are also significant, with incomes of £25 billion and £24.5 billion respectively. Housing associations hold a substantial proportion of civil society’s assets, mainly housing stock, worth £60.9 billion.
£60.9 billion The net assets of housing associations in 20081
Find out more
Church buildings are an example of historic or inalienable assets: see www.visitchurches.org.uk
p Source: NCVO, various sources
UK civil society’s major assets, �007/08 (£ billions)
p Source: NCVO, various sources
Civil society’s assets
Civil society organisations hold a large amount of assets – around £244 billion, or 3% of the UK’s asset base. This figure doesn’t include the assets held by civil society organisations operating in the financial services industries, such as building societies or mutual insurance providers. These assets include fixed assets such as property, investments and cash in the bank. Civil society organisations are also often the custodians of significant but historic or inalienable assets such as churches, sites of historical importance or cultural value and areas of natural beauty.
Civil society’s assets exist for a number of reasons. Some organisations are based around their assets – like a housing association that provides social housing or a village hall that is rented to groups; some use their assets to generate income – like a foundation funded through returns on an invested endowment; for some organisations, assets are a useful addition to their day-to-day work, providing office space, security for the future or a base for expansion.
Faith groups £15.6
Co-operatives £7.9
Common investment funds £3.7
Others £6.2
General charities £96.6
Housing associations £60.9
Universities £26.6
Friendly societies £17.0
= £1.6 billion
Co-operative GroupCo-operative
£9.1 billion
John Lewis,Employee-owned business
£6.8 billion
University of Cambridge,University£1.1 billion
Anchor Trust, Housing association
Royal Masonic Benevolent Institution,Benevolent society
The Conservatives, Political party
UNISON, Trade union
CITB- Construction Skills, Trade associations and
professional body
United Church Schools, Independent school
Greenwich Leisure, Leisure trust
Charifund, Common investment fund
Church of England (consolidated)
Faith group£1.3 billion
£191.0million
£�99.0million
£�6�.9million
£177.0million
£31.�million
£31.0million
£�3.0million
Wellcome Trust, General charity£616.0 million
Voluntary sector£96.6 billion
Civil society£��� billion
1National Housing Federation 2Co-operativesUK
School Funds, Scouts, Social Clubs, Social Enterprise, Sports Clubs, Synagogues, Theatres, Townswomen’s Guilds, Trade Associations and Professional Bodies, Trade Unions, Training Providers, Trusts, Universities, University of the Third Age, Victim Support, Village Halls,
Volunteer Bureaux, Voluntary Organisations, Wildlife Trusts, Women’s Institutes, Women’s Refuges, YMCAs, Youth Clubs, Abbeyfield Societies, Advocacy Groups, Air Ambulance Services, Animal Protection, Armed Forces Charities, Benevolent Societies, Brass Bands, Building Societies, Care Services, Churches, Citizen’s Advice Bureaux
£37.1million
Voluntary sector£3�.8 billion
Civil society£1�7 billion
Voluntary sector£35.5 billion
Civil society£157 billion
9 10
SEC
TIO
N 1
: C
IVIL
SO
CIE
TY
AT
A G
LAN
CE
CIV
IL S
OC
IETY
How many people work in civil society?
Paid staff by type of civil society organisation, UK, �007/08
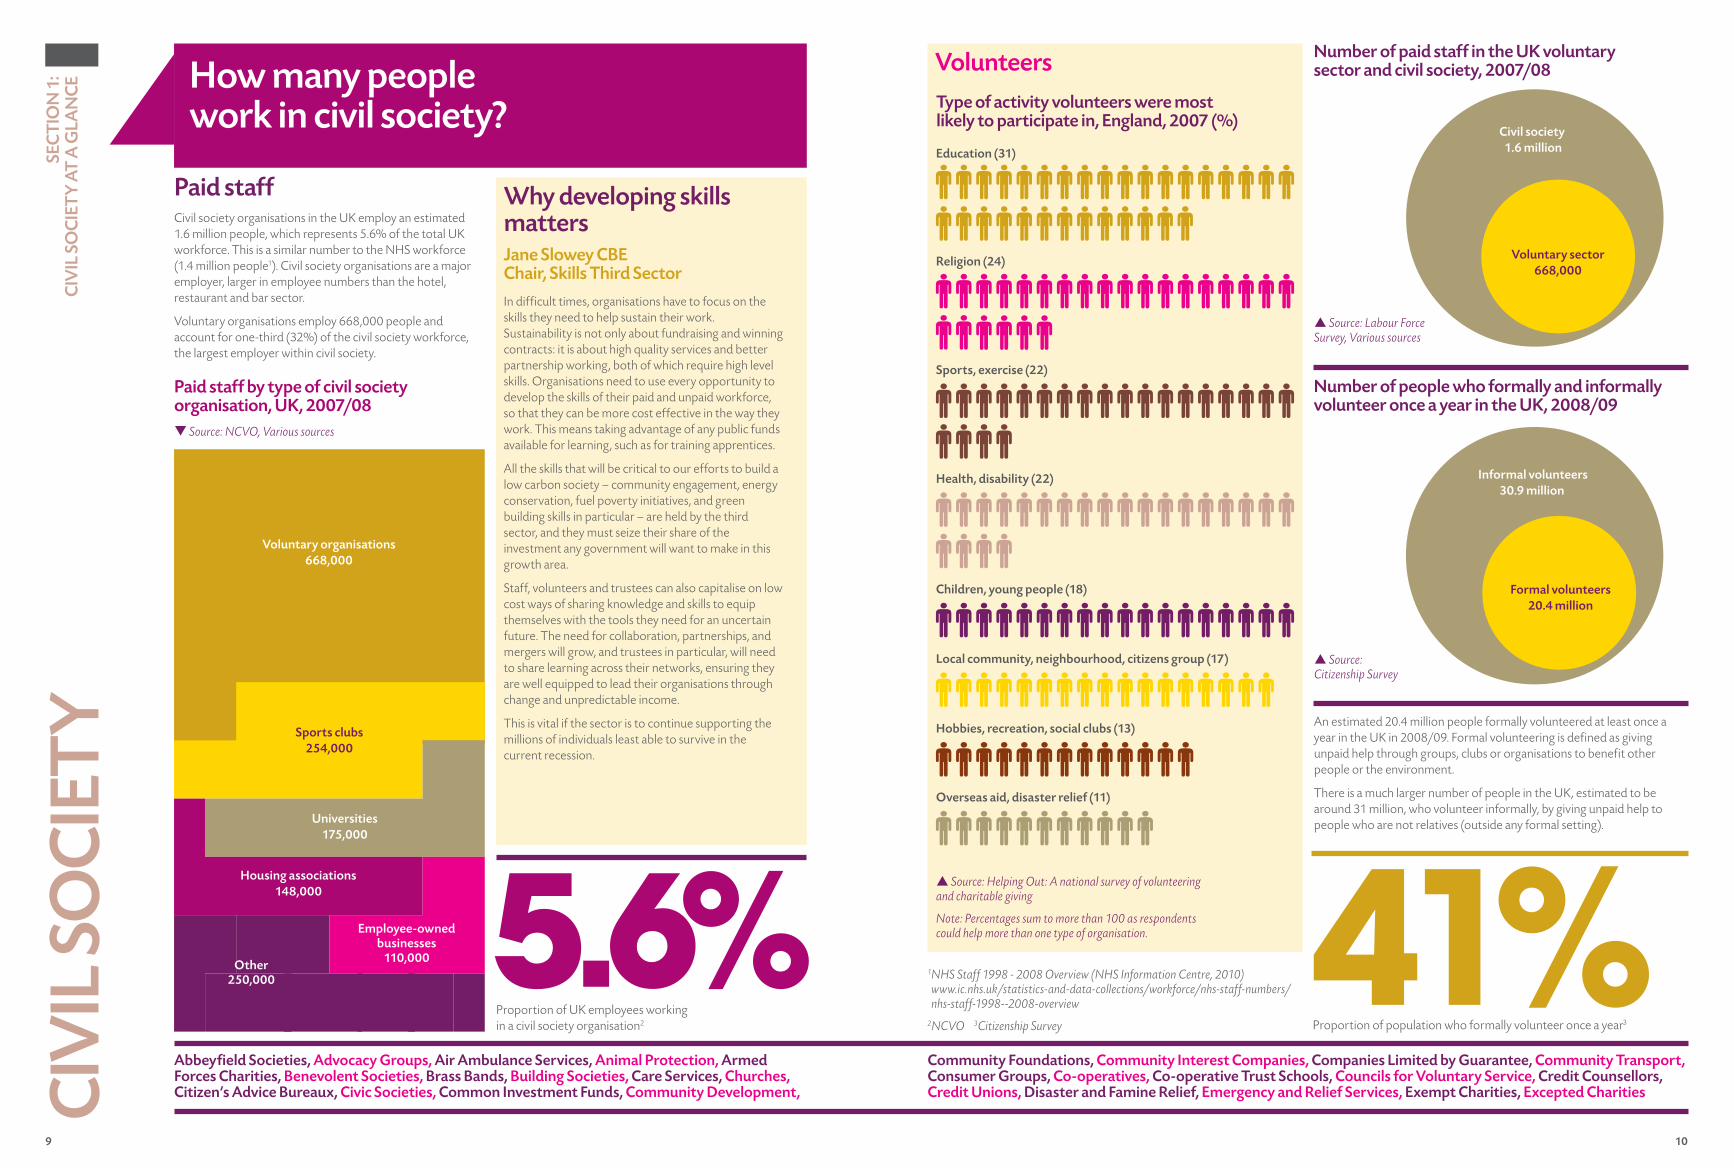
Paid staff Civil society organisations in the UK employ an estimated 1.6 million people, which represents 5.6% of the total UK workforce. This is a similar number to the NHS workforce (1.4 million people1). Civil society organisations are a major employer, larger in employee numbers than the hotel, restaurant and bar sector.
Voluntary organisations employ 668,000 people and account for one-third (32%) of the civil society workforce, the largest employer within civil society.
An estimated 20.4 million people formally volunteered at least once a year in the UK in 2008/09. Formal volunteering is defined as giving unpaid help through groups, clubs or organisations to benefit other people or the environment.
There is a much larger number of people in the UK, estimated to be around 31 million, who volunteer informally, by giving unpaid help to people who are not relatives (outside any formal setting).
41%Proportion of population who formally volunteer once a year3
Why developing skills matters Jane Slowey CBE Chair, Skills Third Sector
In difficult times, organisations have to focus on the skills they need to help sustain their work. Sustainability is not only about fundraising and winning contracts: it is about high quality services and better partnership working, both of which require high level skills. Organisations need to use every opportunity to develop the skills of their paid and unpaid workforce, so that they can be more cost effective in the way they work. This means taking advantage of any public funds available for learning, such as for training apprentices.
All the skills that will be critical to our efforts to build a low carbon society – community engagement, energy conservation, fuel poverty initiatives, and green building skills in particular – are held by the third sector, and they must seize their share of the investment any government will want to make in this growth area.
Staff, volunteers and trustees can also capitalise on low cost ways of sharing knowledge and skills to equip themselves with the tools they need for an uncertain future. The need for collaboration, partnerships, and mergers will grow, and trustees in particular, will need to share learning across their networks, ensuring they are well equipped to lead their organisations through change and unpredictable income.
This is vital if the sector is to continue supporting the millions of individuals least able to survive in the current recession.
q Source: NCVO, Various sources
1 NHS Staff 1998 - 2008 Overview (NHS Information Centre, 2010) www.ic.nhs.uk/statistics-and-data-collections/workforce/nhs-staff-numbers/nhs-staff-1998--2008-overview
2NCVO 3Citizenship Survey
5.6%Proportion of UK employees working in a civil society organisation2
p Source: Citizenship Survey
Number of paid staff in the UK voluntary sector and civil society, �007/08
p Source: Labour Force Survey, Various sources
Number of people who formally and informally volunteer once a year in the UK, �008/09
Civil society 1.6 million
Voluntary sector 668,000
Informal volunteers 30.9 million
Formal volunteers �0.� million
Voluntary organisations668,000
Sports clubs�5�,000
Universities175,000
Housing associations1�8,000
Employee-owned businesses
110,000Other�50,000
Abbeyfield Societies, Advocacy Groups, Air Ambulance Services, Animal Protection, Armed Forces Charities, Benevolent Societies, Brass Bands, Building Societies, Care Services, Churches, Citizen’s Advice Bureaux, Civic Societies, Common Investment Funds, Community Development,
Community Foundations, Community Interest Companies, Companies Limited by Guarantee, Community Transport, Consumer Groups, Co-operatives, Co-operative Trust Schools, Councils for Voluntary Service, Credit Counsellors, Credit Unions, Disaster and Famine Relief, Emergency and Relief Services, Exempt Charities, Excepted Charities
p Source: Helping Out: A national survey of volunteering and charitable giving
Note: Percentages sum to more than 100 as respondents could help more than one type of organisation.
Type of activity volunteers were most likely to participate in, England, �007 (%)
Education (31)
Religion (��)
Sports, exercise (��)
Health, disability (��)
Children, young people (18)
Local community, neighbourhood, citizens group (17)
Hobbies, recreation, social clubs (13)
Overseas aid, disaster relief (11)
Volunteers
11 1�
100,000,000
SEC
TIO
N 1
: C
IVIL
SO
CIE
TY
AT
A G
LAN
CE
CIV
IL S
OC
IETY
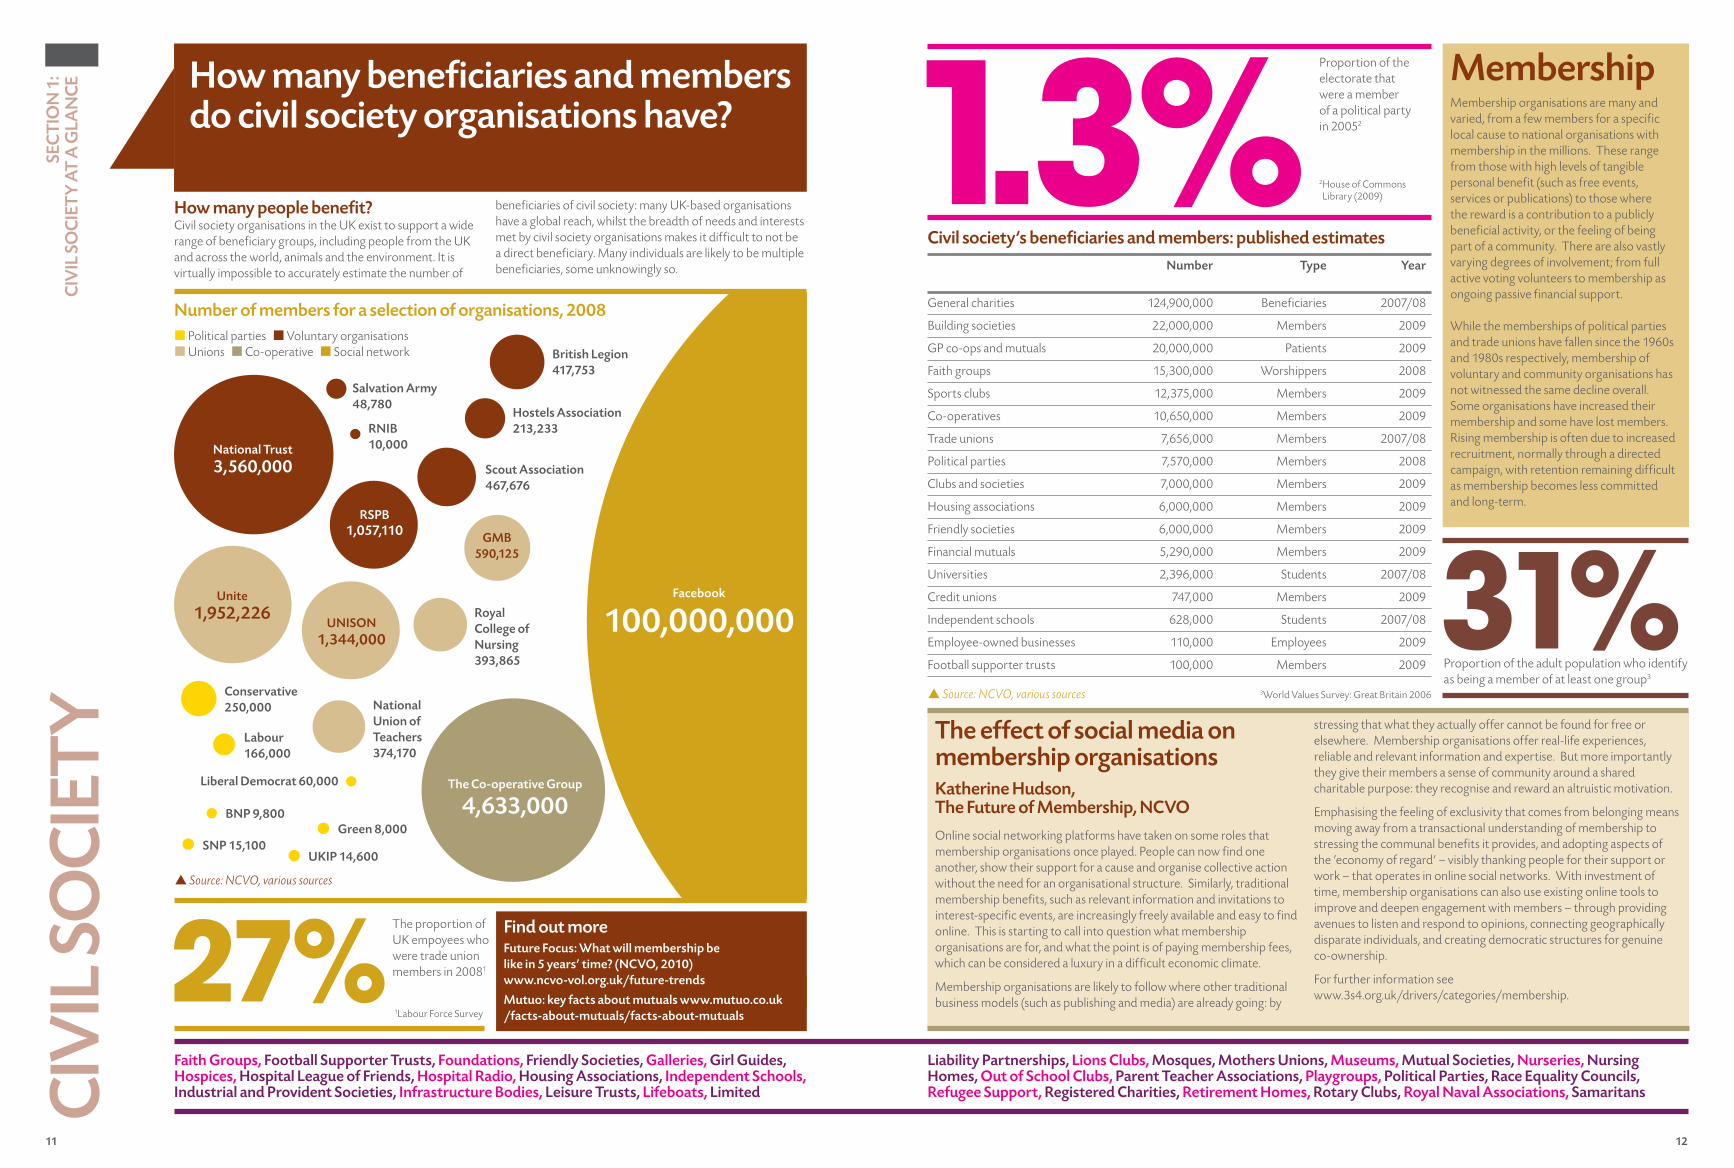
How many beneficiaries and members do civil society organisations have?
How many people benefit?Civil society organisations in the UK exist to support a wide range of beneficiary groups, including people from the UK and across the world, animals and the environment. It is virtually impossible to accurately estimate the number of
beneficiaries of civil society: many UK-based organisations have a global reach, whilst the breadth of needs and interests met by civil society organisations makes it difficult to not be a direct beneficiary. Many individuals are likely to be multiple beneficiaries, some unknowingly so.
MembershipMembership organisations are many and varied, from a few members for a specific local cause to national organisations with membership in the millions. These range from those with high levels of tangible personal benefit (such as free events, services or publications) to those where the reward is a contribution to a publicly beneficial activity, or the feeling of being part of a community. There are also vastly varying degrees of involvement; from full active voting volunteers to membership as ongoing passive financial support. While the memberships of political parties and trade unions have fallen since the 1960s and 1980s respectively, membership of voluntary and community organisations has not witnessed the same decline overall. Some organisations have increased their membership and some have lost members. Rising membership is often due to increased recruitment, normally through a directed campaign, with retention remaining difficult as membership becomes less committed and long-term.
The effect of social media on membership organisationsKatherine Hudson, The Future of Membership, NCVO
Online social networking platforms have taken on some roles that membership organisations once played. People can now find one another, show their support for a cause and organise collective action without the need for an organisational structure. Similarly, traditional membership benefits, such as relevant information and invitations to interest-specific events, are increasingly freely available and easy to find online. This is starting to call into question what membership organisations are for, and what the point is of paying membership fees, which can be considered a luxury in a difficult economic climate.
Membership organisations are likely to follow where other traditional business models (such as publishing and media) are already going: by
stressing that what they actually offer cannot be found for free or elsewhere. Membership organisations offer real-life experiences, reliable and relevant information and expertise. But more importantly they give their members a sense of community around a shared charitable purpose: they recognise and reward an altruistic motivation.
Emphasising the feeling of exclusivity that comes from belonging means moving away from a transactional understanding of membership to stressing the communal benefits it provides, and adopting aspects of the ‘economy of regard’ – visibly thanking people for their support or work – that operates in online social networks. With investment of time, membership organisations can also use existing online tools to improve and deepen engagement with members – through providing avenues to listen and respond to opinions, connecting geographically disparate individuals, and creating democratic structures for genuine co-ownership.
For further information see www.3s4.org.uk/drivers/categories/membership.
p Source: NCVO, various sources
Find out moreFuture Focus: What will membership be like in 5 years’ time? (NCVO, �010) www.ncvo-vol.org.uk/future-trends
Mutuo: key facts about mutuals www.mutuo.co.uk /facts-about-mutuals/facts-about-mutuals
27%The proportion of UK empoyees who were trade union members in 20081
1.3%Proportion of the electorate that were a member of a political party in 20052
31%Proportion of the adult population who identify as being a member of at least one group3
Number of members for a selection of organisations, �008
Number Type Year
General charities 124,900,000 Beneficiaries 2007/08
Building societies 22,000,000 Members 2009
GP co-ops and mutuals 20,000,000 Patients 2009
Faith groups 15,300,000 Worshippers 2008
Sports clubs 12,375,000 Members 2009
Co-operatives 10,650,000 Members 2009
Trade unions 7,656,000 Members 2007/08
Political parties 7,570,000 Members 2008
Clubs and societies 7,000,000 Members 2009
Housing associations 6,000,000 Members 2009
Friendly societies 6,000,000 Members 2009
Financial mutuals 5,290,000 Members 2009
Universities 2,396,000 Students 2007/08
Credit unions 747,000 Members 2009
Independent schools 628,000 Students 2007/08
Employee-owned businesses 110,000 Employees 2009
Football supporter trusts 100,000 Members 2009
p Source: NCVO, various sources
British Legion �17,753
Hostels Association �13,�33
Scout Association �67,676
RNIB 10,000
Salvation Army �8,780
National Trust 3,560,000
RSPB 1,057,110
Unite 1,95�,��6
UNISON 1,3��,000
GMB 590,1�5
Conservative �50,000
Labour 166,000
Liberal Democrat 60,000
BNP 9,800Green 8,000
SNP 15,100UKIP 1�,600
Royal College of Nursing 393,865
National Union of Teachers 37�,170
The Co-operative Group
�,633,000
¢ Political parties ¢ Voluntary organisations ¢ Unions ¢ Co-operative ¢ Social network
3World Values Survey: Great Britain 2006
Faith Groups, Football Supporter Trusts, Foundations, Friendly Societies, Galleries, Girl Guides, Hospices, Hospital League of Friends, Hospital Radio, Housing Associations, Independent Schools, Industrial and Provident Societies, Infrastructure Bodies, Leisure Trusts, Lifeboats, Limited
Liability Partnerships, Lions Clubs, Mosques, Mothers Unions, Museums, Mutual Societies, Nurseries, Nursing Homes, Out of School Clubs, Parent Teacher Associations, Playgroups, Political Parties, Race Equality Councils, Refugee Support, Registered Charities, Retirement Homes, Rotary Clubs, Royal Naval Associations, Samaritans
1Labour Force Survey
2 House of Commons Library (2009)
Civil society’s beneficiaries and members: published estimates
13 1�
Civil society
Formal education providers
The State
SEC
TIO
N 1
: C
IVIL
SO
CIE
TY
AT
A G
LAN
CE
CIV
IL S
OC
IETY
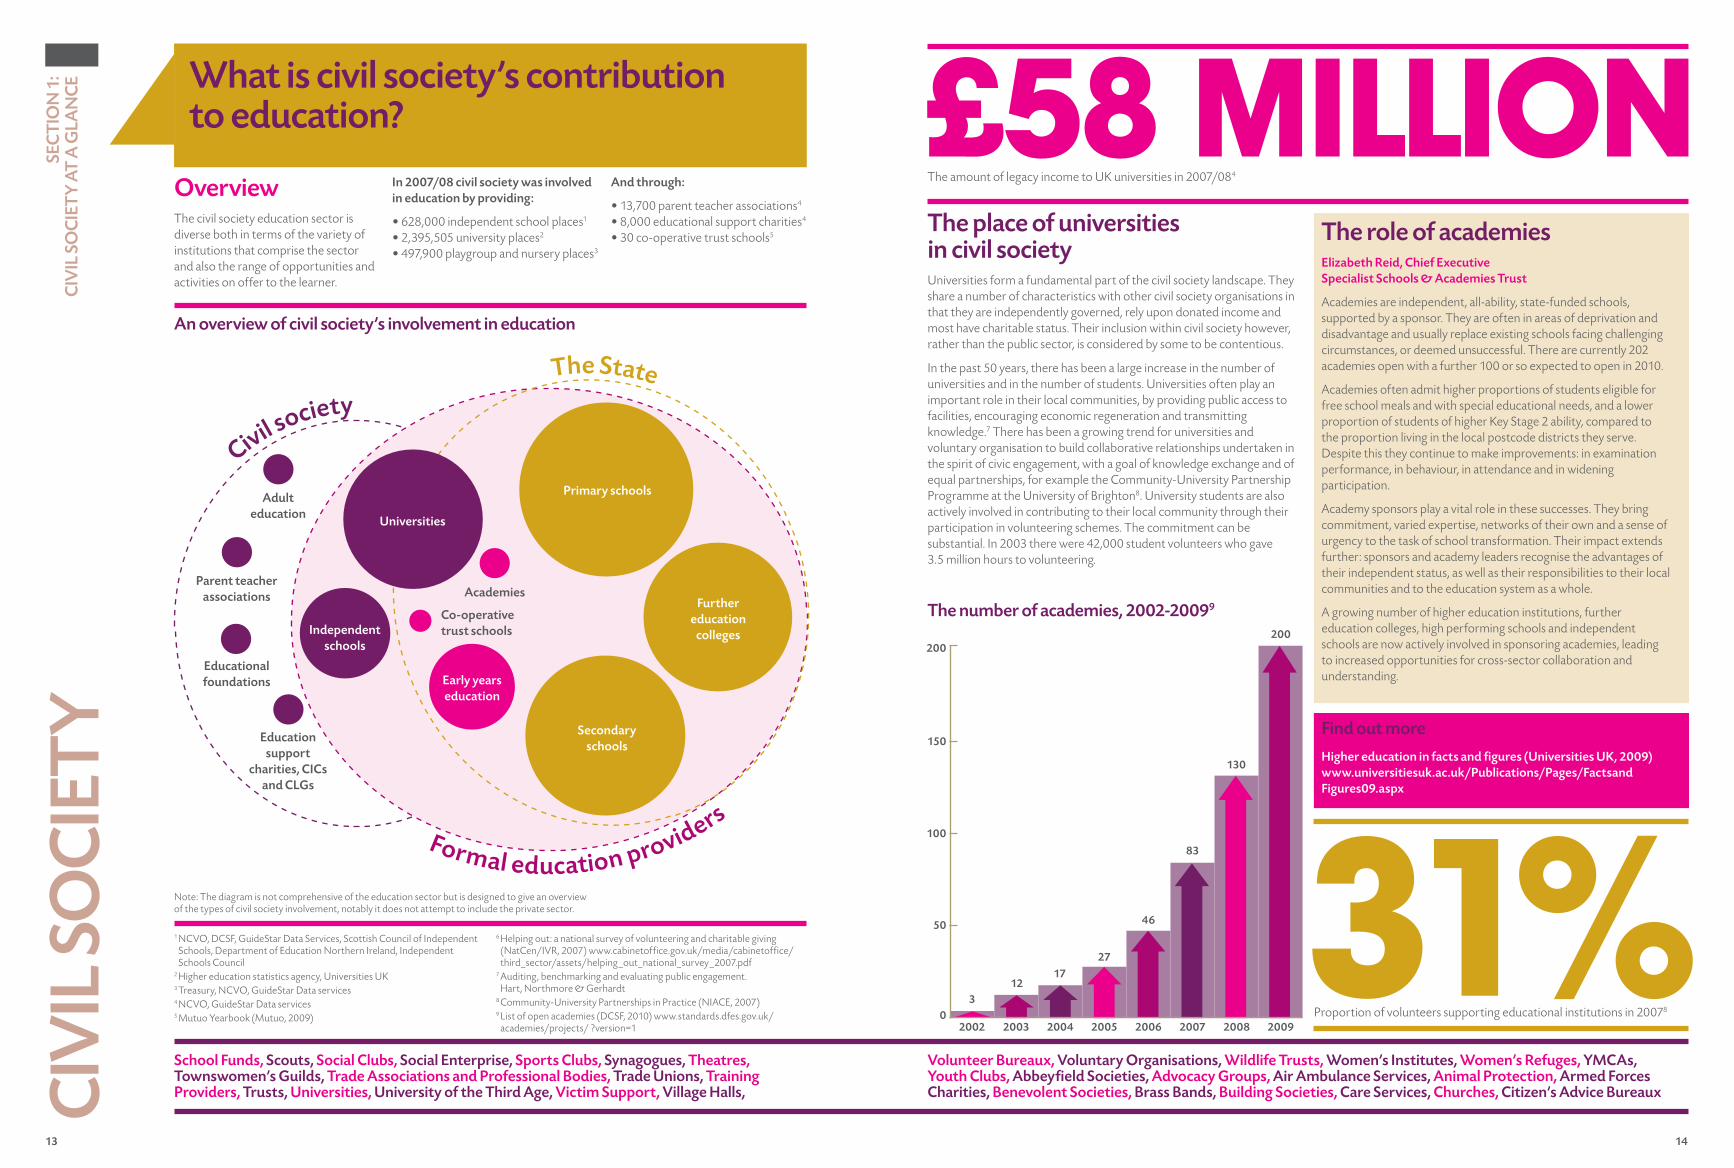
What is civil society’s contribution to education?
School Funds, Scouts, Social Clubs, Social Enterprise, Sports Clubs, Synagogues, Theatres, Townswomen’s Guilds, Trade Associations and Professional Bodies, Trade Unions, Training Providers, Trusts, Universities, University of the Third Age, Victim Support, Village Halls,
Volunteer Bureaux, Voluntary Organisations, Wildlife Trusts, Women’s Institutes, Women’s Refuges, YMCAs, Youth Clubs, Abbeyfield Societies, Advocacy Groups, Air Ambulance Services, Animal Protection, Armed Forces Charities, Benevolent Societies, Brass Bands, Building Societies, Care Services, Churches, Citizen’s Advice Bureaux
An overview of civil society’s involvement in education
1 NCVO, DCSF, GuideStar Data Services, Scottish Council of Independent Schools, Department of Education Northern Ireland, Independent Schools Council
2 Higher education statistics agency, Universities UK3 Treasury, NCVO, GuideStar Data services4 NCVO, GuideStar Data services5 Mutuo Yearbook (Mutuo, 2009)
6 Helping out: a national survey of volunteering and charitable giving (NatCen/IVR, 2007) www.cabinetoffice.gov.uk/media/cabinetoffice/third_sector/assets/helping_out_national_survey_2007.pdf
7 Auditing, benchmarking and evaluating public engagement. Hart, Northmore & Gerhardt
8 Community-University Partnerships in Practice (NIACE, 2007) 9 List of open academies (DCSF, 2010) www.standards.dfes.gov.uk/academies/projects/ ?version=1
£58 millionThe amount of legacy income to UK universities in 2007/084
31%Proportion of volunteers supporting educational institutions in 20078
The place of universities in civil societyUniversities form a fundamental part of the civil society landscape. They share a number of characteristics with other civil society organisations in that they are independently governed, rely upon donated income and most have charitable status. Their inclusion within civil society however, rather than the public sector, is considered by some to be contentious.
In the past 50 years, there has been a large increase in the number of universities and in the number of students. Universities often play an important role in their local communities, by providing public access to facilities, encouraging economic regeneration and transmitting knowledge.7 There has been a growing trend for universities and voluntary organisation to build collaborative relationships undertaken in the spirit of civic engagement, with a goal of knowledge exchange and of equal partnerships, for example the Community-University Partnership Programme at the University of Brighton8. University students are also actively involved in contributing to their local community through their participation in volunteering schemes. The commitment can be substantial. In 2003 there were 42,000 student volunteers who gave 3.5 million hours to volunteering.
Find out more
Higher education in facts and figures (Universities UK, �009) www.universitiesuk.ac.uk/Publications/Pages/Factsand Figures09.aspx
The role of academiesElizabeth Reid, Chief Executive Specialist Schools & Academies Trust
Academies are independent, all-ability, state-funded schools, supported by a sponsor. They are often in areas of deprivation and disadvantage and usually replace existing schools facing challenging circumstances, or deemed unsuccessful. There are currently 202 academies open with a further 100 or so expected to open in 2010.
Academies often admit higher proportions of students eligible for free school meals and with special educational needs, and a lower proportion of students of higher Key Stage 2 ability, compared to the proportion living in the local postcode districts they serve. Despite this they continue to make improvements: in examination performance, in behaviour, in attendance and in widening participation.
Academy sponsors play a vital role in these successes. They bring commitment, varied expertise, networks of their own and a sense of urgency to the task of school transformation. Their impact extends further: sponsors and academy leaders recognise the advantages of their independent status, as well as their responsibilities to their local communities and to the education system as a whole.
A growing number of higher education institutions, further education colleges, high performing schools and independent schools are now actively involved in sponsoring academies, leading to increased opportunities for cross-sector collaboration and understanding.
The number of academies, �00�-�0099
0�00� �003 �00� �005 �006 �007 �008 �009
50
100
150
�00
OverviewThe civil society education sector is diverse both in terms of the variety of institutions that comprise the sector and also the range of opportunities and activities on offer to the learner.
In �007/08 civil society was involved in education by providing:
• 628,000 independent school places1
• 2,395,505 university places2
• 497,900 playgroup and nursery places3
And through:
• 13,700 parent teacher associations4
• 8,000 educational support charities4 • 30 co-operative trust schools5
Note: The diagram is not comprehensive of the education sector but is designed to give an overview of the types of civil society involvement, notably it does not attempt to include the private sector.
Early yearseducation
Academies
Co-operative trust schoolsIndependent
schools
Education support
charities, CICs and CLGs
Educational foundations
Parent teacher associations
Adult education
Primary schools
Further education
colleges
Secondary schools
Universities
31�
17�7
�6
83
130
�00
15 16
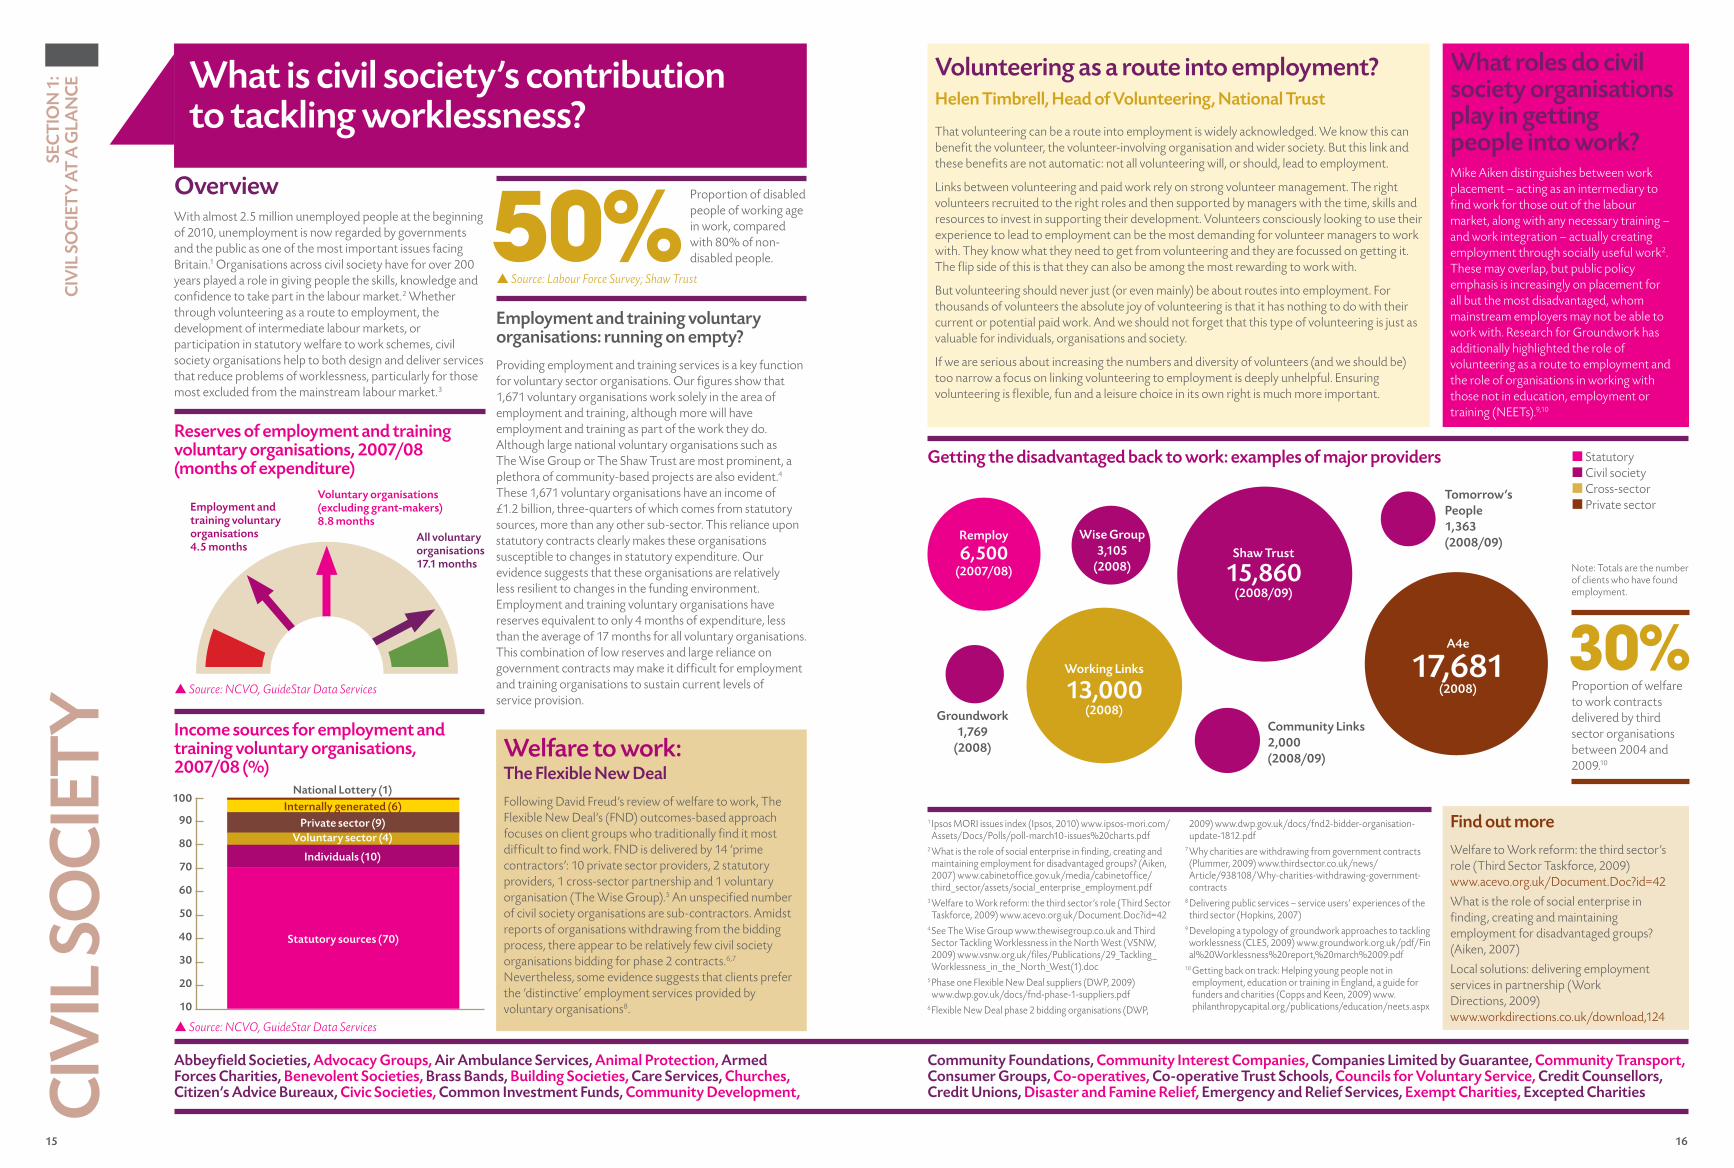
All voluntary organisations 17.1 months
Employment and training voluntary organisations �.5 months
Voluntary organisations (excluding grant-makers) 8.8 months
SEC
TIO
N 1
: C
IVIL
SO
CIE
TY
AT
A G
LAN
CE
CIV
IL S
OC
IETY
Abbeyfield Societies, Advocacy Groups, Air Ambulance Services, Animal Protection, Armed Forces Charities, Benevolent Societies, Brass Bands, Building Societies, Care Services, Churches, Citizen’s Advice Bureaux, Civic Societies, Common Investment Funds, Community Development,
Community Foundations, Community Interest Companies, Companies Limited by Guarantee, Community Transport, Consumer Groups, Co-operatives, Co-operative Trust Schools, Councils for Voluntary Service, Credit Counsellors, Credit Unions, Disaster and Famine Relief, Emergency and Relief Services, Exempt Charities, Excepted Charities
What is civil society’s contribution to tackling worklessness?
OverviewWith almost 2.5 million unemployed people at the beginning of 2010, unemployment is now regarded by governments and the public as one of the most important issues facing Britain.1 Organisations across civil society have for over 200 years played a role in giving people the skills, knowledge and confidence to take part in the labour market.2 Whether through volunteering as a route to employment, the development of intermediate labour markets, or participation in statutory welfare to work schemes, civil society organisations help to both design and deliver services that reduce problems of worklessness, particularly for those most excluded from the mainstream labour market.3
Reserves of employment and training voluntary organisations, �007/08 (months of expenditure)
Getting the disadvantaged back to work: examples of major providers
Welfare to work: The Flexible New Deal
Following David Freud’s review of welfare to work, The Flexible New Deal’s (FND) outcomes-based approach focuses on client groups who traditionally find it most difficult to find work. FND is delivered by 14 ‘prime contractors’: 10 private sector providers, 2 statutory providers, 1 cross-sector partnership and 1 voluntary organisation (The Wise Group).5 An unspecified number of civil society organisations are sub-contractors. Amidst reports of organisations withdrawing from the bidding process, there appear to be relatively few civil society organisations bidding for phase 2 contracts.6,7 Nevertheless, some evidence suggests that clients prefer the ‘distinctive’ employment services provided by voluntary organisations8.
50%Proportion of disabled people of working age in work, compared with 80% of non-disabled people.
30%Proportion of welfare to work contracts delivered by third sector organisations between 2004 and 2009.10
Find out more
Welfare to Work reform: the third sector’s role (Third Sector Taskforce, 2009) www.acevo.org.uk/Document.Doc?id=42
What is the role of social enterprise in finding, creating and maintaining employment for disadvantaged groups? (Aiken, 2007)
Local solutions: delivering employment services in partnership (Work Directions, 2009) www.workdirections.co.uk/download,124
Employment and training voluntary organisations: running on empty?
Providing employment and training services is a key function for voluntary sector organisations. Our figures show that 1,671 voluntary organisations work solely in the area of employment and training, although more will have employment and training as part of the work they do. Although large national voluntary organisations such as The Wise Group or The Shaw Trust are most prominent, a plethora of community-based projects are also evident.4 These 1,671 voluntary organisations have an income of £1.2 billion, three-quarters of which comes from statutory sources, more than any other sub-sector. This reliance upon statutory contracts clearly makes these organisations susceptible to changes in statutory expenditure. Our evidence suggests that these organisations are relatively less resilient to changes in the funding environment. Employment and training voluntary organisations have reserves equivalent to only 4 months of expenditure, less than the average of 17 months for all voluntary organisations. This combination of low reserves and large reliance on government contracts may make it difficult for employment and training organisations to sustain current levels of service provision.
p Source: NCVO, GuideStar Data Services
1 Ipsos MORI issues index (Ipsos, 2010) www.ipsos-mori.com/Assets/Docs/Polls/poll-march10-issues%20charts.pdf
2 What is the role of social enterprise in finding, creating and maintaining employment for disadvantaged groups? (Aiken, 2007) www.cabinetoffice.gov.uk/media/cabinetoffice/third_sector/assets/social_enterprise_employment.pdf
3 Welfare to Work reform: the third sector’s role (Third Sector Taskforce, 2009) www.acevo.org.uk/Document.Doc?id=42
4 See The Wise Group www.thewisegroup.co.uk and Third Sector Tackling Worklessness in the North West (VSNW, 2009) www.vsnw.org.uk/files/Publications/29_Tackling_Worklessness_in_the_North_West(1).doc
5 Phase one Flexible New Deal suppliers (DWP, 2009) www.dwp.gov.uk/docs/fnd-phase-1-suppliers.pdf
6 Flexible New Deal phase 2 bidding organisations (DWP,
p Source: Labour Force Survey; Shaw Trust
Volunteering as a route into employment?Helen Timbrell, Head of Volunteering, National Trust
That volunteering can be a route into employment is widely acknowledged. We know this can benefit the volunteer, the volunteer-involving organisation and wider society. But this link and these benefits are not automatic: not all volunteering will, or should, lead to employment.
Links between volunteering and paid work rely on strong volunteer management. The right volunteers recruited to the right roles and then supported by managers with the time, skills and resources to invest in supporting their development. Volunteers consciously looking to use their experience to lead to employment can be the most demanding for volunteer managers to work with. They know what they need to get from volunteering and they are focussed on getting it. The flip side of this is that they can also be among the most rewarding to work with.
But volunteering should never just (or even mainly) be about routes into employment. For thousands of volunteers the absolute joy of volunteering is that it has nothing to do with their current or potential paid work. And we should not forget that this type of volunteering is just as valuable for individuals, organisations and society.
If we are serious about increasing the numbers and diversity of volunteers (and we should be) too narrow a focus on linking volunteering to employment is deeply unhelpful. Ensuring volunteering is flexible, fun and a leisure choice in its own right is much more important.
What roles do civil society organisations play in getting people into work? Mike Aiken distinguishes between work placement – acting as an intermediary to find work for those out of the labour market, along with any necessary training – and work integration – actually creating employment through socially useful work2. These may overlap, but public policy emphasis is increasingly on placement for all but the most disadvantaged, whom mainstream employers may not be able to work with. Research for Groundwork has additionally highlighted the role of volunteering as a route to employment and the role of organisations in working with those not in education, employment or training (NEETs).9,10
2009) www.dwp.gov.uk/docs/fnd2-bidder-organisation-update-1812.pdf
7 Why charities are withdrawing from government contracts (Plummer, 2009) www.thirdsector.co.uk/news/Article/938108/Why-charities-withdrawing-government-contracts
8 Delivering public services – service users’ experiences of the third sector (Hopkins, 2007)
9 Developing a typology of groundwork approaches to tackling worklessness (CLES, 2009) www.groundwork.org.uk/pdf/Final%20Worklessness%20report,%20march%2009.pdf
10 Getting back on track: Helping young people not in employment, education or training in England, a guide for funders and charities (Copps and Keen, 2009) www.philanthropycapital.org/publications/education/neets.aspx
Note: Totals are the number of clients who have found employment.
10
�0
30
�0
50
60
70
80
90
100
Statutory sources (70)
Individuals (10)
Voluntary sector (�)Private sector (9)
National Lottery (1)Internally generated (6)
p Source: NCVO, GuideStar Data Services
Income sources for employment and training voluntary organisations, �007/08 (%)
¢ Statutory¢ Civil society¢ Cross-sector¢ Private sector
Wise Group3,105
(�008)Shaw Trust
15,860(�008/09)
Remploy
6,500(�007/08)
A�e
17,681(�008)
Groundwork1,769
(�008)
Working Links
13,000(�008)
Community Links�,000(�008/09)
Tomorrow’s People1,363(�008/09)
17 18
SEC
TIO
N 1
: C
IVIL
SO
CIE
TY
AT
A G
LAN
CE
CIV
IL S
OC
IETY
What is civil society’s contribution to the environment?
Find out moreGoing green: charities and environmental responsibility (Charity Commission, �008) www.charity-commission.gov.uk/Library/publications /pdfs/rs17text.pdf
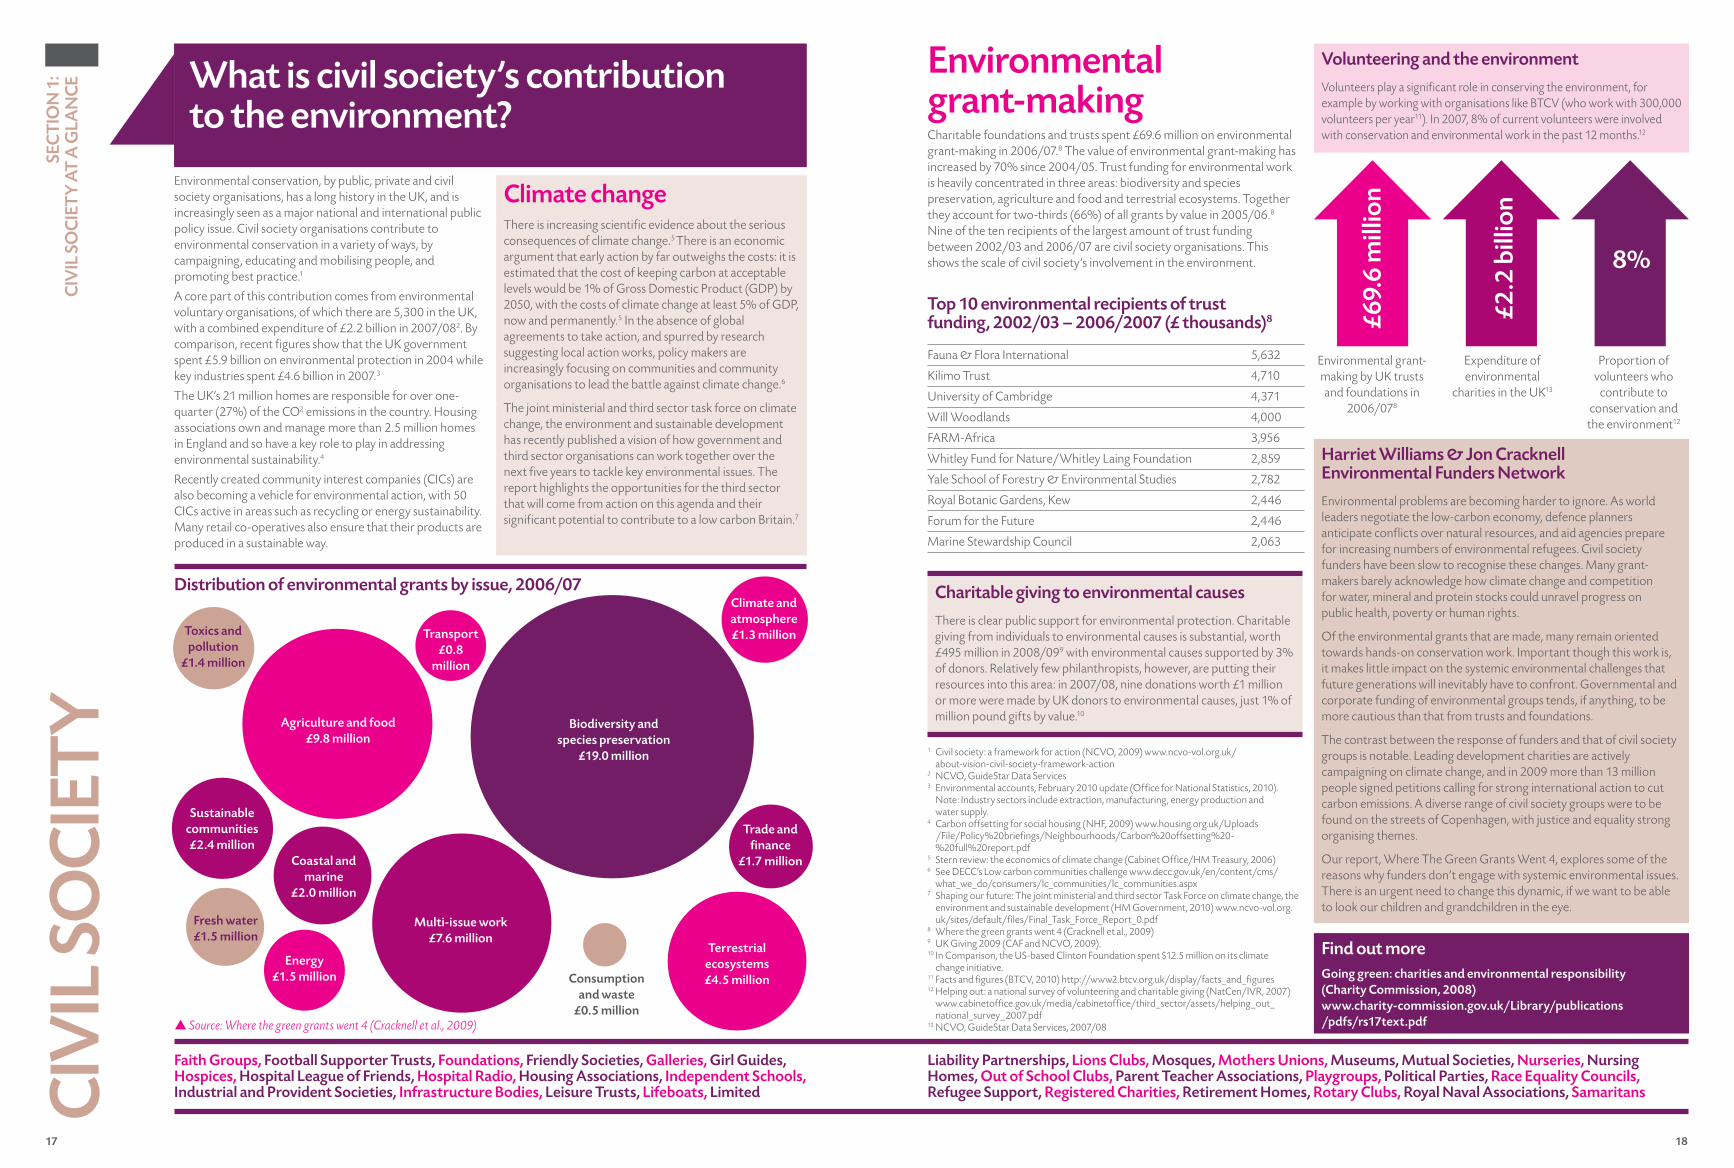
Environmental conservation, by public, private and civil society organisations, has a long history in the UK, and is increasingly seen as a major national and international public policy issue. Civil society organisations contribute to environmental conservation in a variety of ways, by campaigning, educating and mobilising people, and promoting best practice.1
A core part of this contribution comes from environmental voluntary organisations, of which there are 5,300 in the UK, with a combined expenditure of £2.2 billion in 2007/082. By comparison, recent figures show that the UK government spent £5.9 billion on environmental protection in 2004 while key industries spent £4.6 billion in 2007.3
The UK’s 21 million homes are responsible for over one-quarter (27%) of the CO2 emissions in the country. Housing associations own and manage more than 2.5 million homes in England and so have a key role to play in addressing environmental sustainability.4
Recently created community interest companies (CICs) are also becoming a vehicle for environmental action, with 50 CICs active in areas such as recycling or energy sustainability. Many retail co-operatives also ensure that their products are produced in a sustainable way.
Climate changeThere is increasing scientific evidence about the serious consequences of climate change.5 There is an economic argument that early action by far outweighs the costs: it is estimated that the cost of keeping carbon at acceptable levels would be 1% of Gross Domestic Product (GDP) by 2050, with the costs of climate change at least 5% of GDP, now and permanently.5 In the absence of global agreements to take action, and spurred by research suggesting local action works, policy makers are increasingly focusing on communities and community organisations to lead the battle against climate change.6
The joint ministerial and third sector task force on climate change, the environment and sustainable development has recently published a vision of how government and third sector organisations can work together over the next five years to tackle key environmental issues. The report highlights the opportunities for the third sector that will come from action on this agenda and their significant potential to contribute to a low carbon Britain.7
Environmental grant-makingCharitable foundations and trusts spent £69.6 million on environmental grant-making in 2006/07.8 The value of environmental grant-making has increased by 70% since 2004/05. Trust funding for environmental work is heavily concentrated in three areas: biodiversity and species preservation, agriculture and food and terrestrial ecosystems. Together they account for two-thirds (66%) of all grants by value in 2005/06.8 Nine of the ten recipients of the largest amount of trust funding between 2002/03 and 2006/07 are civil society organisations. This shows the scale of civil society’s involvement in the environment.
Distribution of environmental grants by issue, �006/07
p Source: Where the green grants went 4 (Cracknell et al., 2009)
Fauna & Flora International 5,632
Kilimo Trust 4,710
University of Cambridge 4,371
Will Woodlands 4,000
FARM-Africa 3,956
Whitley Fund for Nature/Whitley Laing Foundation 2,859
Yale School of Forestry & Environmental Studies 2,782
Royal Botanic Gardens, Kew 2,446
Forum for the Future 2,446
Marine Stewardship Council 2,063
Top 10 environmental recipients of trust funding, �00�/03 – �006/�007 (£ thousands)8
1 Civil society: a framework for action (NCVO, 2009) www.ncvo-vol.org.uk/ about-vision-civil-society-framework-action
2 NCVO, GuideStar Data Services3 Environmental accounts, February 2010 update (Office for National Statistics, 2010).
Note: Industry sectors include extraction, manufacturing, energy production and water supply.
4 Carbon offsetting for social housing (NHF, 2009) www.housing.org.uk/Uploads /File/Policy%20briefings/Neighbourhoods/Carbon%20offsetting%20-%20full%20report.pdf
5 Stern review: the economics of climate change (Cabinet Office/HM Treasury, 2006) 6 See DECC’s Low carbon communities challenge www.decc.gov.uk/en/content/cms/
what_we_do/consumers/lc_communities/lc_communities.aspx7 Shaping our future: The joint ministerial and third sector Task Force on climate change, the
environment and sustainable development (HM Government, 2010) www.ncvo-vol.org.uk/sites/default/files/Final_Task_Force_Report_0.pdf
8 Where the green grants went 4 (Cracknell et al., 2009)9 UK Giving 2009 (CAF and NCVO, 2009).10 In Comparison, the US-based Clinton Foundation spent $12.5 million on its climate
change initiative. 11 Facts and figures (BTCV, 2010) http://www2.btcv.org.uk/display/facts_and_figures 12 Helping out: a national survey of volunteering and charitable giving (NatCen/IVR, 2007)
www.cabinetoffice.gov.uk/media/cabinetoffice/third_sector/assets/helping_out_national_survey_2007.pdf
13 NCVO, GuideStar Data Services, 2007/08
Charitable giving to environmental causes
There is clear public support for environmental protection. Charitable giving from individuals to environmental causes is substantial, worth £495 million in 2008/099 with environmental causes supported by 3% of donors. Relatively few philanthropists, however, are putting their resources into this area: in 2007/08, nine donations worth £1 million or more were made by UK donors to environmental causes, just 1% of million pound gifts by value.10
Volunteering and the environment
Volunteers play a significant role in conserving the environment, for example by working with organisations like BTCV (who work with 300,000 volunteers per year11). In 2007, 8% of current volunteers were involved with conservation and environmental work in the past 12 months.12
Harriet Williams & Jon Cracknell Environmental Funders Network
Environmental problems are becoming harder to ignore. As world leaders negotiate the low-carbon economy, defence planners anticipate conflicts over natural resources, and aid agencies prepare for increasing numbers of environmental refugees. Civil society funders have been slow to recognise these changes. Many grant-makers barely acknowledge how climate change and competition for water, mineral and protein stocks could unravel progress on public health, poverty or human rights.
Of the environmental grants that are made, many remain oriented towards hands-on conservation work. Important though this work is, it makes little impact on the systemic environmental challenges that future generations will inevitably have to confront. Governmental and corporate funding of environmental groups tends, if anything, to be more cautious than that from trusts and foundations.
The contrast between the response of funders and that of civil society groups is notable. Leading development charities are actively campaigning on climate change, and in 2009 more than 13 million people signed petitions calling for strong international action to cut carbon emissions. A diverse range of civil society groups were to be found on the streets of Copenhagen, with justice and equality strong organising themes.
Our report, Where The Green Grants Went 4, explores some of the reasons why funders don’t engage with systemic environmental issues. There is an urgent need to change this dynamic, if we want to be able to look our children and grandchildren in the eye.
Biodiversity and species preservation
£19.0 million
Climate and atmosphere£1.3 million
Coastal and marine
£�.0 million
Consumption and waste
£0.5 million
Fresh water£1.5 million
Multi-issue work£7.6 million
Terrestrial ecosystems£�.5 million
Trade and finance
£1.7 million
Transport£0.8
million
Energy£1.5 million
Agriculture and food£9.8 million
Toxics and pollution
£1.� million
Sustainable communities£�.� million
£69.
6 m
illio
n
£�.�
bill
ion
8%
Environmental grant-making by UK trusts and foundations in
2006/078
Expenditure of environmental
charities in the UK13
Proportion of volunteers who contribute to
conservation and the environment12
Faith Groups, Football Supporter Trusts, Foundations, Friendly Societies, Galleries, Girl Guides, Hospices, Hospital League of Friends, Hospital Radio, Housing Associations, Independent Schools, Industrial and Provident Societies, Infrastructure Bodies, Leisure Trusts, Lifeboats, Limited
Liability Partnerships, Lions Clubs, Mosques, Mothers Unions, Museums, Mutual Societies, Nurseries, Nursing Homes, Out of School Clubs, Parent Teacher Associations, Playgroups, Political Parties, Race Equality Councils, Refugee Support, Registered Charities, Retirement Homes, Rotary Clubs, Royal Naval Associations, Samaritans
19 �0
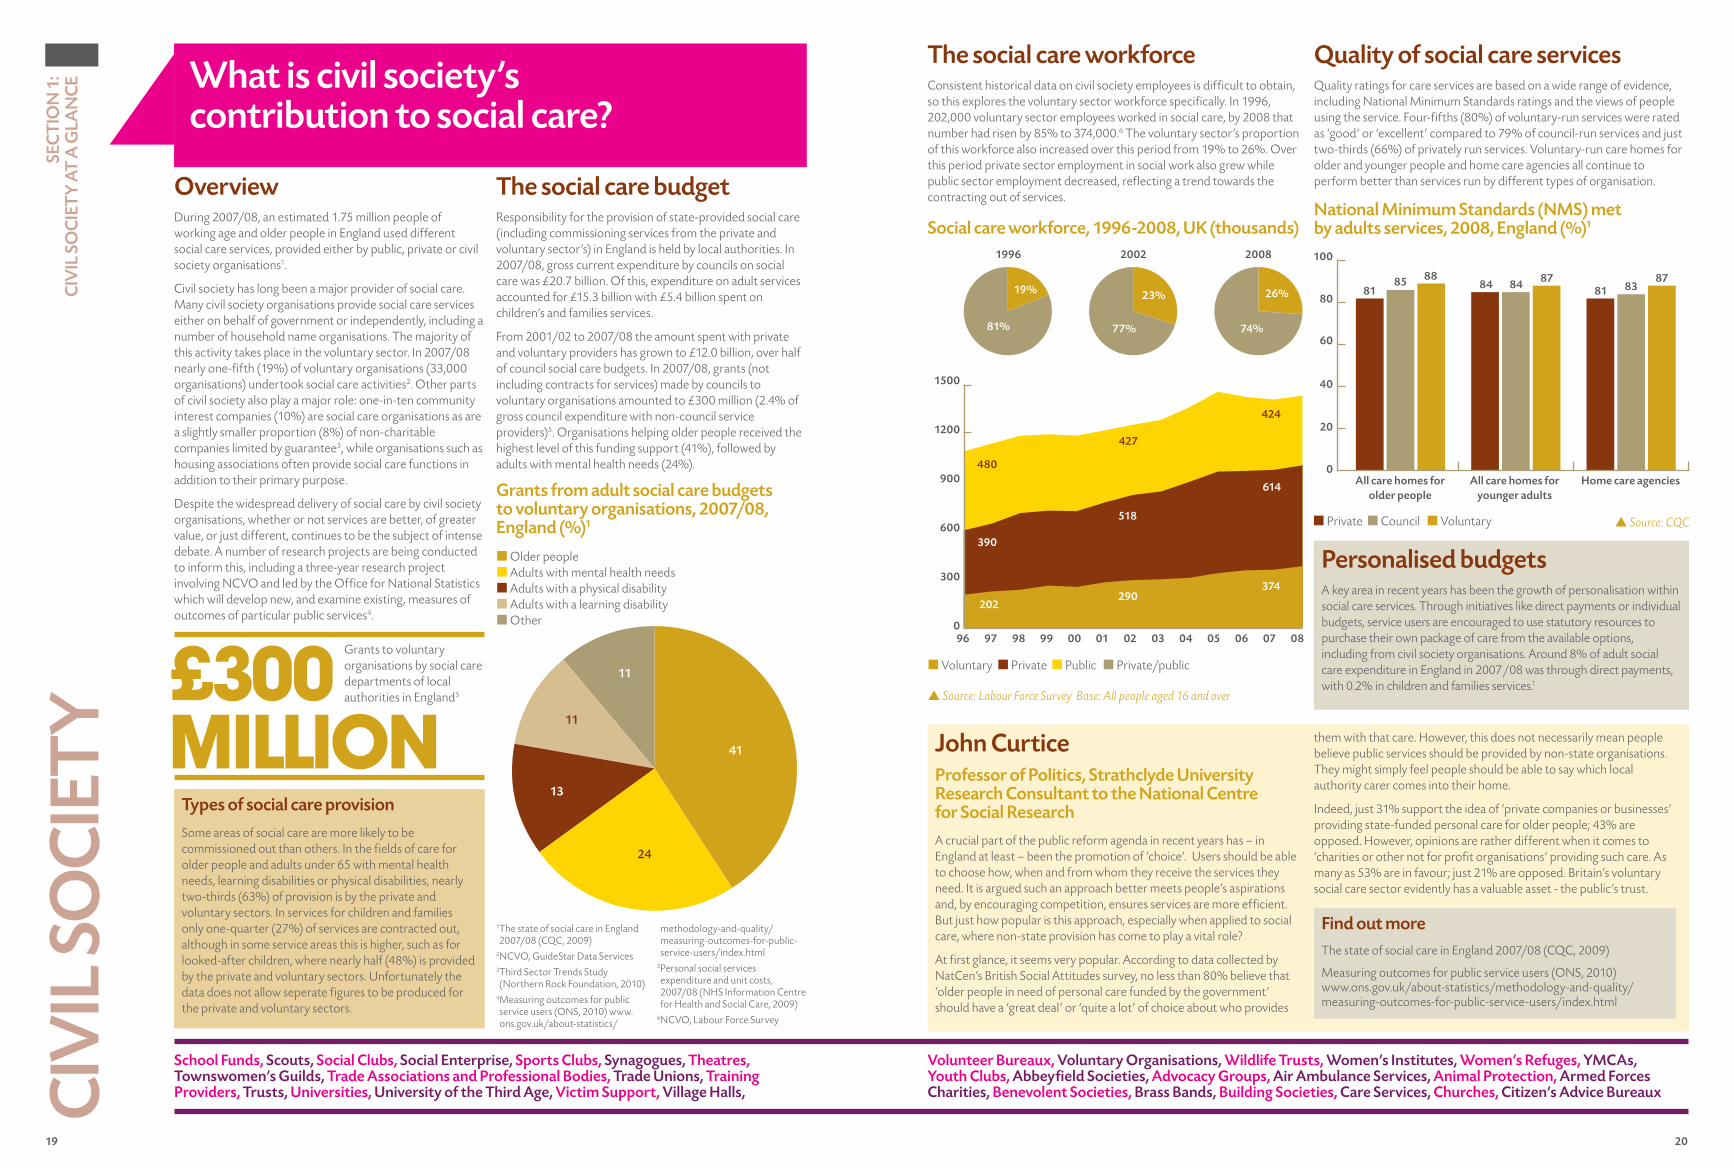
The social care budgetResponsibility for the provision of state-provided social care (including commissioning services from the private and voluntary sector’s) in England is held by local authorities. In 2007/08, gross current expenditure by councils on social care was £20.7 billion. Of this, expenditure on adult services accounted for £15.3 billion with £5.4 billion spent on children’s and families services.
From 2001/02 to 2007/08 the amount spent with private and voluntary providers has grown to £12.0 billion, over half of council social care budgets. In 2007/08, grants (not including contracts for services) made by councils to voluntary organisations amounted to £300 million (2.4% of gross council expenditure with non-council service providers)5. Organisations helping older people received the highest level of this funding support (41%), followed by adults with mental health needs (24%).
SEC
TIO
N 1
: C
IVIL
SO
CIE
TY
AT
A G
LAN
CE
CIV
IL S
OC
IETY
What is civil society’s contribution to social care?
OverviewDuring 2007/08, an estimated 1.75 million people of working age and older people in England used different social care services, provided either by public, private or civil society organisations1.
Civil society has long been a major provider of social care. Many civil society organisations provide social care services either on behalf of government or independently, including a number of household name organisations. The majority of this activity takes place in the voluntary sector. In 2007/08 nearly one-fifth (19%) of voluntary organisations (33,000 organisations) undertook social care activities2. Other parts of civil society also play a major role: one-in-ten community interest companies (10%) are social care organisations as are a slightly smaller proportion (8%) of non-charitable companies limited by guarantee3, while organisations such as housing associations often provide social care functions in addition to their primary purpose.
Despite the widespread delivery of social care by civil society organisations, whether or not services are better, of greater value, or just different, continues to be the subject of intense debate. A number of research projects are being conducted to inform this, including a three-year research project involving NCVO and led by the Office for National Statistics which will develop new, and examine existing, measures of outcomes of particular public services4.
1 The state of social care in England 2007/08 (CQC, 2009)
2 NCVO, GuideStar Data Services3 Third Sector Trends Study (Northern Rock Foundation, 2010)
4 Measuring outcomes for public service users (ONS, 2010) www.ons.gov.uk/about-statistics/
methodology-and-quality/measuring-outcomes-for-public-service-users/index.html
5 Personal social services expenditure and unit costs, 2007/08 (NHS Information Centre for Health and Social Care, 2009)
6NCVO, Labour Force Survey
Grants from adult social care budgets to voluntary organisations, �007/08, England (%)1
The social care workforceConsistent historical data on civil society employees is difficult to obtain, so this explores the voluntary sector workforce specifically. In 1996, 202,000 voluntary sector employees worked in social care, by 2008 that number had risen by 85% to 374,000.6 The voluntary sector’s proportion of this workforce also increased over this period from 19% to 26%. Over this period private sector employment in social work also grew while public sector employment decreased, reflecting a trend towards the contracting out of services.
Social care workforce, 1996-�008, UK (thousands)
p Source: Labour Force Survey Base: All people aged 16 and over
Quality of social care servicesQuality ratings for care services are based on a wide range of evidence, including National Minimum Standards ratings and the views of people using the service. Four-fifths (80%) of voluntary-run services were rated as ‘good’ or ‘excellent’ compared to 79% of council-run services and just two-thirds (66%) of privately run services. Voluntary-run care homes for older and younger people and home care agencies all continue to perform better than services run by different types of organisation.
Personalised budgetsA key area in recent years has been the growth of personalisation within social care services. Through initiatives like direct payments or individual budgets, service users are encouraged to use statutory resources to purchase their own package of care from the available options, including from civil society organisations. Around 8% of adult social care expenditure in England in 2007/08 was through direct payments, with 0.2% in children and families services.1
John CurticeProfessor of Politics, Strathclyde University Research Consultant to the National Centre for Social Research
A crucial part of the public reform agenda in recent years has – in England at least – been the promotion of ‘choice’. Users should be able to choose how, when and from whom they receive the services they need. It is argued such an approach better meets people’s aspirations and, by encouraging competition, ensures services are more efficient. But just how popular is this approach, especially when applied to social care, where non-state provision has come to play a vital role?
At first glance, it seems very popular. According to data collected by NatCen’s British Social Attitudes survey, no less than 80% believe that ‘older people in need of personal care funded by the government’ should have a ‘great deal’ or ‘quite a lot’ of choice about who provides
them with that care. However, this does not necessarily mean people believe public services should be provided by non-state organisations. They might simply feel people should be able to say which local authority carer comes into their home.
Indeed, just 31% support the idea of ‘private companies or businesses’ providing state-funded personal care for older people; 43% are opposed. However, opinions are rather different when it comes to ‘charities or other not for profit organisations’ providing such care. As many as 53% are in favour; just 21% are opposed. Britain’s voluntary social care sector evidently has a valuable asset - the public’s trust.
�1
��
13
11
11£300 million
Grants to voluntary organisations by social care departments of local authorities in England5
¢ Older people ¢ Adults with mental health needs ¢ Adults with a physical disability ¢ Adults with a learning disability ¢ Other
National Minimum Standards (NMS) met by adults services, �008, England (%)1
0All care homes for
older peopleAll care homes for
younger adultsHome care agencies
�0
�0
60
80
100
8185 88
8� 8� 8781 83
87
¢ Private ¢ Council ¢ Voluntary p Source: CQC
¢ Voluntary ¢ Private ¢ Public ¢ Private/public
1500
1�00
900
600
300
096 97 98 99 00 01 0� 03 0� 05 06 07 08
81%
19% �3%
77% 7�%
�6%
School Funds, Scouts, Social Clubs, Social Enterprise, Sports Clubs, Synagogues, Theatres, Townswomen’s Guilds, Trade Associations and Professional Bodies, Trade Unions, Training Providers, Trusts, Universities, University of the Third Age, Victim Support, Village Halls,
Volunteer Bureaux, Voluntary Organisations, Wildlife Trusts, Women’s Institutes, Women’s Refuges, YMCAs, Youth Clubs, Abbeyfield Societies, Advocacy Groups, Air Ambulance Services, Animal Protection, Armed Forces Charities, Benevolent Societies, Brass Bands, Building Societies, Care Services, Churches, Citizen’s Advice Bureaux
Types of social care provision
Some areas of social care are more likely to be commissioned out than others. In the fields of care for older people and adults under 65 with mental health needs, learning disabilities or physical disabilities, nearly two-thirds (63%) of provision is by the private and voluntary sectors. In services for children and families only one-quarter (27%) of services are contracted out, although in some service areas this is higher, such as for looked-after children, where nearly half (48%) is provided by the private and voluntary sectors. Unfortunately the data does not allow seperate figures to be produced for the private and voluntary sectors.
Find out moreThe state of social care in England 2007/08 (CQC, 2009)
Measuring outcomes for public service users (ONS, 2010) www.ons.gov.uk/about-statistics/methodology-and-quality/ measuring-outcomes-for-public-service-users/index.html
1996 �00� �008
�80
��7
���
61�
518
390
�0��90
37�

21 22
IN D
EPTH
:
2Section Contents
p23 Introduction p25 Scopep37 Finance: the big picture p43 Income streams p47 Income: in focus p56 Expenditurep60 Assets p69 Work
THE
VO
LUN
TARY
SEC
TOR
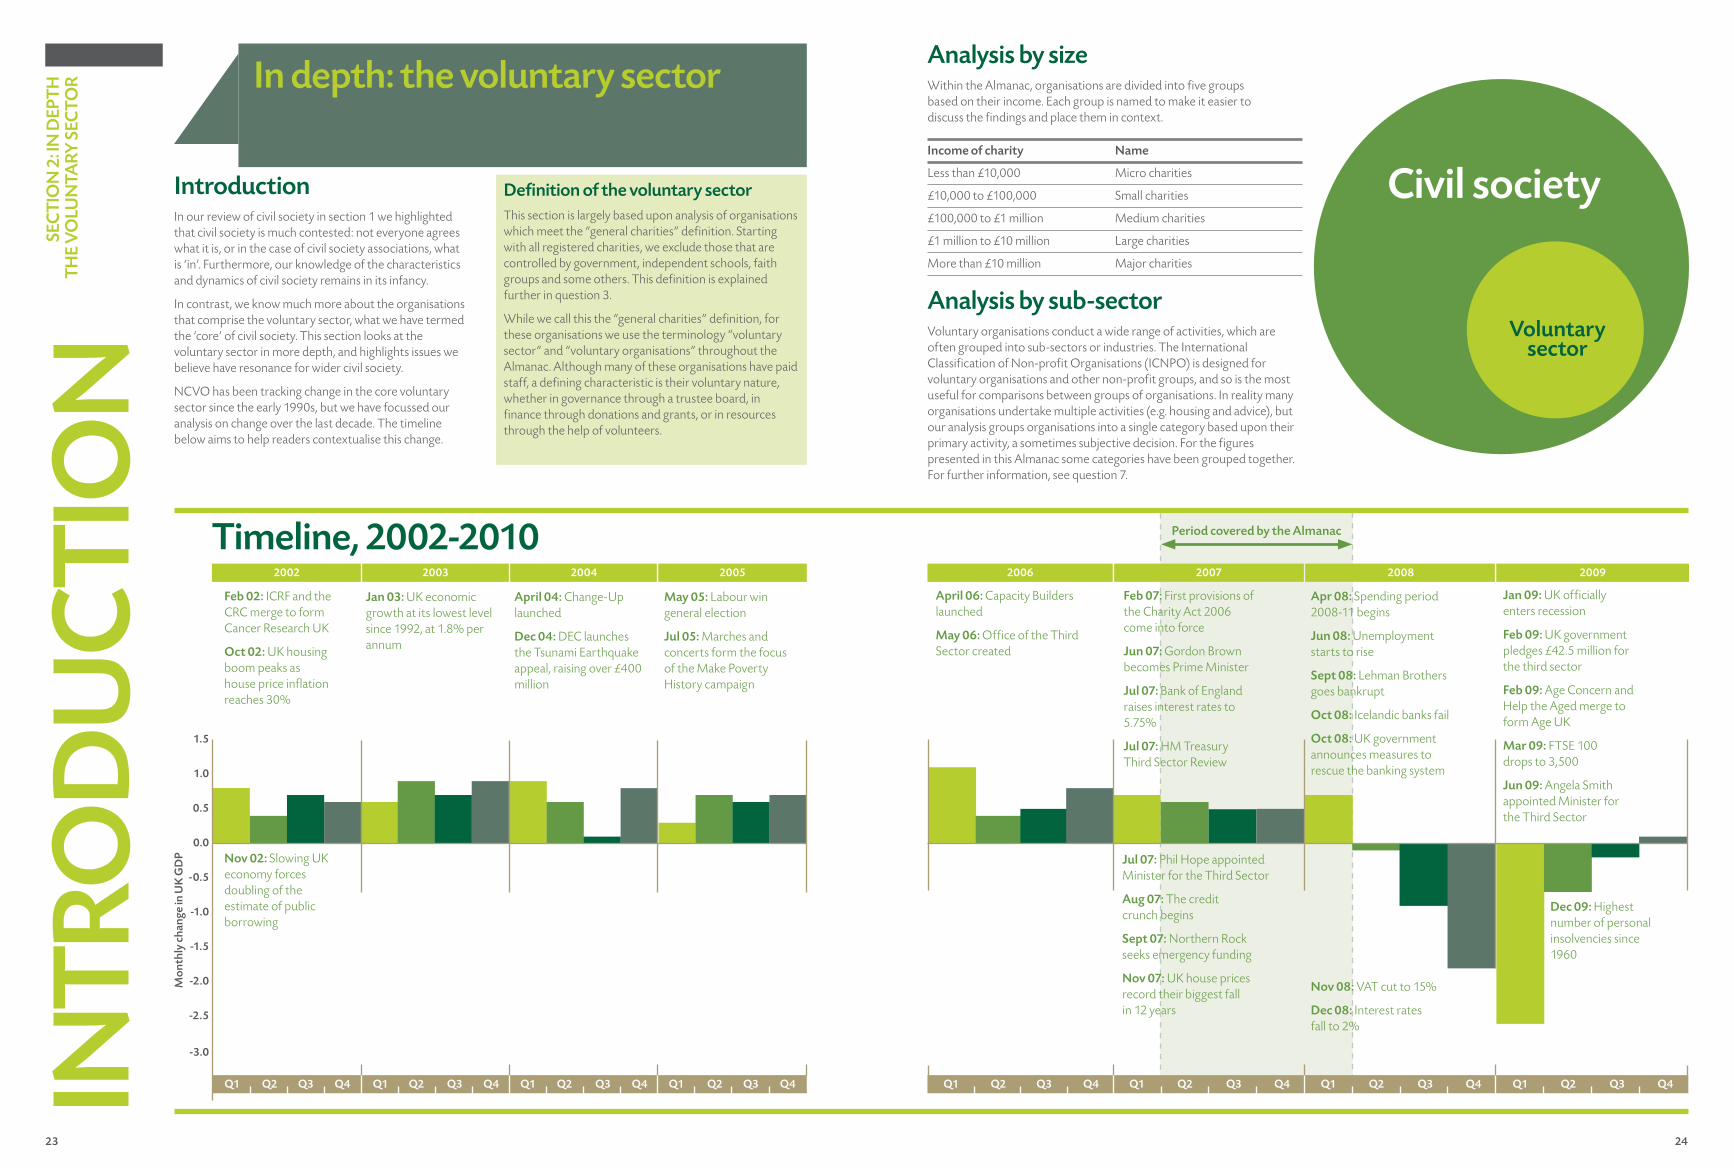
23 24
Period covered by the Almanac
SEC
TIO
N 2
: IN
DEP
TH
THE
VO
LUN
TARY
SEC
TOR
INTR
OD
UC
TIO
N
Analysis by sub-sectorVoluntary organisations conduct a wide range of activities, which are often grouped into sub-sectors or industries. The International Classification of Non-profit Organisations (ICNPO) is designed for voluntary organisations and other non-profit groups, and so is the most useful for comparisons between groups of organisations. In reality many organisations undertake multiple activities (e.g. housing and advice), but our analysis groups organisations into a single category based upon their primary activity, a sometimes subjective decision. For the figures presented in this Almanac some categories have been grouped together. For further information, see question 7.
IntroductionIn our review of civil society in section 1 we highlighted that civil society is much contested: not everyone agrees what it is, or in the case of civil society associations, what is ‘in’. Furthermore, our knowledge of the characteristics and dynamics of civil society remains in its infancy.
In contrast, we know much more about the organisations that comprise the voluntary sector, what we have termed the ‘core’ of civil society. This section looks at the voluntary sector in more depth, and highlights issues we believe have resonance for wider civil society.
NCVO has been tracking change in the core voluntary sector since the early 1990s, but we have focussed our analysis on change over the last decade. The timeline below aims to help readers contextualise this change.
Income of charity Name
Less than £10,000 Micro charities
£10,000 to £100,000 Small charities
£100,000 to £1 million Medium charities
£1 million to £10 million Large charities
More than £10 million Major charities
Analysis by sizeWithin the Almanac, organisations are divided into five groups based on their income. Each group is named to make it easier to discuss the findings and place them in context.
Definition of the voluntary sector This section is largely based upon analysis of organisations which meet the “general charities” definition. Starting with all registered charities, we exclude those that are controlled by government, independent schools, faith groups and some others. This definition is explained further in question 3.
While we call this the “general charities” definition, for these organisations we use the terminology “voluntary sector” and “voluntary organisations” throughout the Almanac. Although many of these organisations have paid staff, a defining characteristic is their voluntary nature, whether in governance through a trustee board, in finance through donations and grants, or in resources through the help of volunteers.
In depth: the voluntary sector
Voluntary sector
Civil society
Timeline, 2002-20102006 2007 2008 2009
Q1 Q2 Q3 Q4 Q1 Q2 Q3 Q4 Q1 Q2 Q3 Q4 Q1 Q2 Q3 Q4
April 06: Capacity Builders launched
May 06: Office of the Third Sector created
Apr 08: Spending period 2008-11 begins
Jun 08: Unemployment starts to rise
Sept 08: Lehman Brothers goes bankrupt
Oct 08: Icelandic banks fail
Oct 08: UK government announces measures to rescue the banking system
Jan 09: UK officially enters recession
Feb 09: UK government pledges £42.5 million for the third sector
Feb 09: Age Concern and Help the Aged merge to form Age UK
Mar 09: FTSE 100 drops to 3,500
Jun 09: Angela Smith appointed Minister for the Third Sector
Dec 09: Highest number of personal insolvencies since 1960
Nov 08: VAT cut to 15%
Dec 08: Interest rates fall to 2%
Feb 07: First provisions of the Charity Act 2006 come into force
Jun 07: Gordon Brown becomes Prime Minister
Jul 07: Bank of England raises interest rates to 5.75%
Jul 07: HM Treasury Third Sector Review
Jul 07: Phil Hope appointed Minister for the Third Sector
Aug 07: The credit crunch begins
Sept 07: Northern Rock seeks emergency funding
Nov 07: UK house prices record their biggest fall in 12 years
2003 2004 2005
Feb 02: ICRF and the CRC merge to form Cancer Research UK
Oct 02: UK housing boom peaks as house price inflation reaches 30%
Jan 03: UK economic growth at its lowest level since 1992, at 1.8% per annum
May 05: Labour win general election
Jul 05: Marches and concerts form the focus of the Make Poverty History campaign
April 04: Change-Up launched
Dec 04: DEC launches the Tsunami Earthquake appeal, raising over £400 million
2002
-3.0
1.5
1.0
0.5
0.0
-0.5
-1.0
-1.5
-2.0
-2.5
Q2 Q2 Q3 Q4 Q1 Q2 Q3 Q4 Q1 Q2 Q3 Q4Q1 Q1Q3 Q4
Nov 02: Slowing UK economy forces doubling of the estimate of public borrowing
Mon
thly
cha
nge
in U
K G
DP
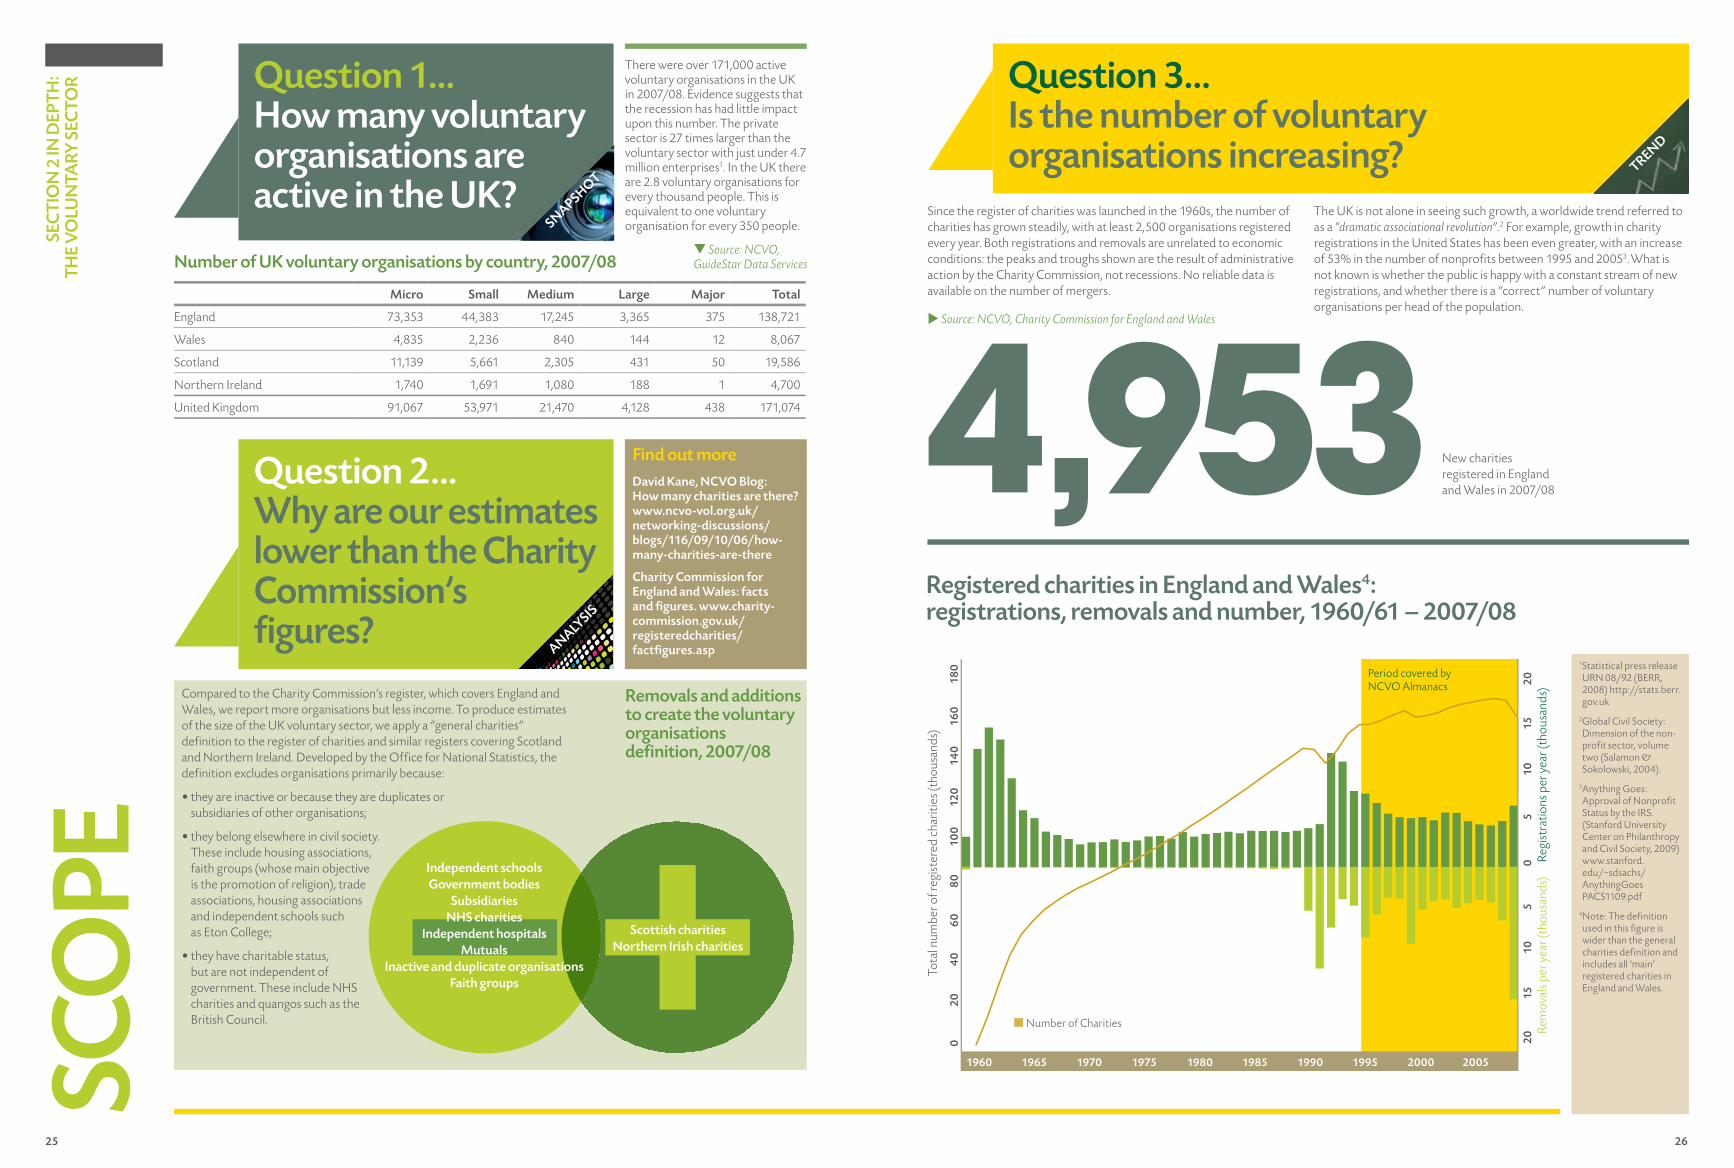
25 26
Question 2…Why are our estimates lower than the Charity Commission’s figures?
SEC
TIO
N 2
IN D
EPTH
: TH
E V
OLU
NTA
RY S
ECTO
R Question 1…How many voluntary organisations are active in the UK?
There were over 171,000 active voluntary organisations in the UK in 2007/08. Evidence suggests that the recession has had little impact upon this number. The private sector is 27 times larger than the voluntary sector with just under 4.7 million enterprises1. In the UK there are 2.8 voluntary organisations for every thousand people. This is equivalent to one voluntary organisation for every 350 people.
Micro Small Medium Large Major Total
England 73,353 44,383 17,245 3,365 375 138,721
Wales 4,835 2,236 840 144 12 8,067
Scotland 11,139 5,661 2,305 431 50 19,586
Northern Ireland 1,740 1,691 1,080 188 1 4,700
United Kingdom 91,067 53,971 21,470 4,128 438 171,074
Removals and additions to create the voluntary organisations definition, 2007/08
ANALYSIS
Find out more David Kane, NCVO Blog: How many charities are there? www.ncvo-vol.org.uk/networking-discussions/blogs/116/09/10/06/how-many-charities-are-there
Charity Commission for England and Wales: facts and figures. www.charity-commission.gov.uk/registeredcharities/factfigures.asp
SNAPSHOT
1Statistical press release URN 08/92 (BERR, 2008) http://stats.berr.gov.uk
2Global Civil Society: Dimension of the non-profit sector, volume two (Salamon & Sokolowski, 2004).
3Anything Goes: Approval of Nonprofit Status by the IRS. (Stanford University Center on Philanthropy and Civil Society, 2009) www.stanford.edu/~sdsachs/AnythingGoes PACS1109.pdf
4Note: The definition used in this figure is wider than the general charities definition and includes all ‘main’ registered charities in England and Wales.
Independent schoolsGovernment bodies
SubsidiariesNHS charities
Independent hospitalsMutuals
Inactive and duplicate organisationsFaith groups
Scottish charitiesNorthern Irish charities
Registered charities in England and Wales4:registrations, removals and number, 1960/61 – 2007/08
Question 3…Is the number of voluntary organisations increasing? TREND
Since the register of charities was launched in the 1960s, the number of charities has grown steadily, with at least 2,500 organisations registered every year. Both registrations and removals are unrelated to economic conditions: the peaks and troughs shown are the result of administrative action by the Charity Commission, not recessions. No reliable data is available on the number of mergers.
The UK is not alone in seeing such growth, a worldwide trend referred to as a “dramatic associational revolution”.2 For example, growth in charity registrations in the United States has been even greater, with an increase of 53% in the number of nonprofits between 1995 and 20053.What is not known is whether the public is happy with a constant stream of new registrations, and whether there is a “correct” number of voluntary organisations per head of the population.
4,953 New charities registered in England and Wales in 2007/08
Rem
oval
s per
yea
r (th
ousa
nds)
R
egis
trat
ions
per
yea
r (th
ousa
nds)
020
40
8010
012
014
016
018
060
2015
100
510
1520
5
Tota
l num
ber o
f reg
iste
red
char
ities
(tho
usan
ds)
1960 1965 1970 1975 1980 1985 1990 1995 2000 2005SCO
PENumber of UK voluntary organisations by country, 2007/08
q Source: NCVO, GuideStar Data Services
Compared to the Charity Commission’s register, which covers England and Wales, we report more organisations but less income. To produce estimates of the size of the UK voluntary sector, we apply a “general charities” definition to the register of charities and similar registers covering Scotland and Northern Ireland. Developed by the Office for National Statistics, the definition excludes organisations primarily because:
• they are inactive or because they are duplicates or subsidiaries of other organisations;
• they belong elsewhere in civil society. These include housing associations,faith groups (whose main objective is the promotion of religion), tradeassociations, housing associationsand independent schools such as Eton College;
• they have charitable status, but are not independent ofgovernment. These include NHS charities and quangos such as the British Council.
Period covered by NCVO Almanacs
■ Number of Charities
u Source: NCVO, Charity Commission for England and Wales
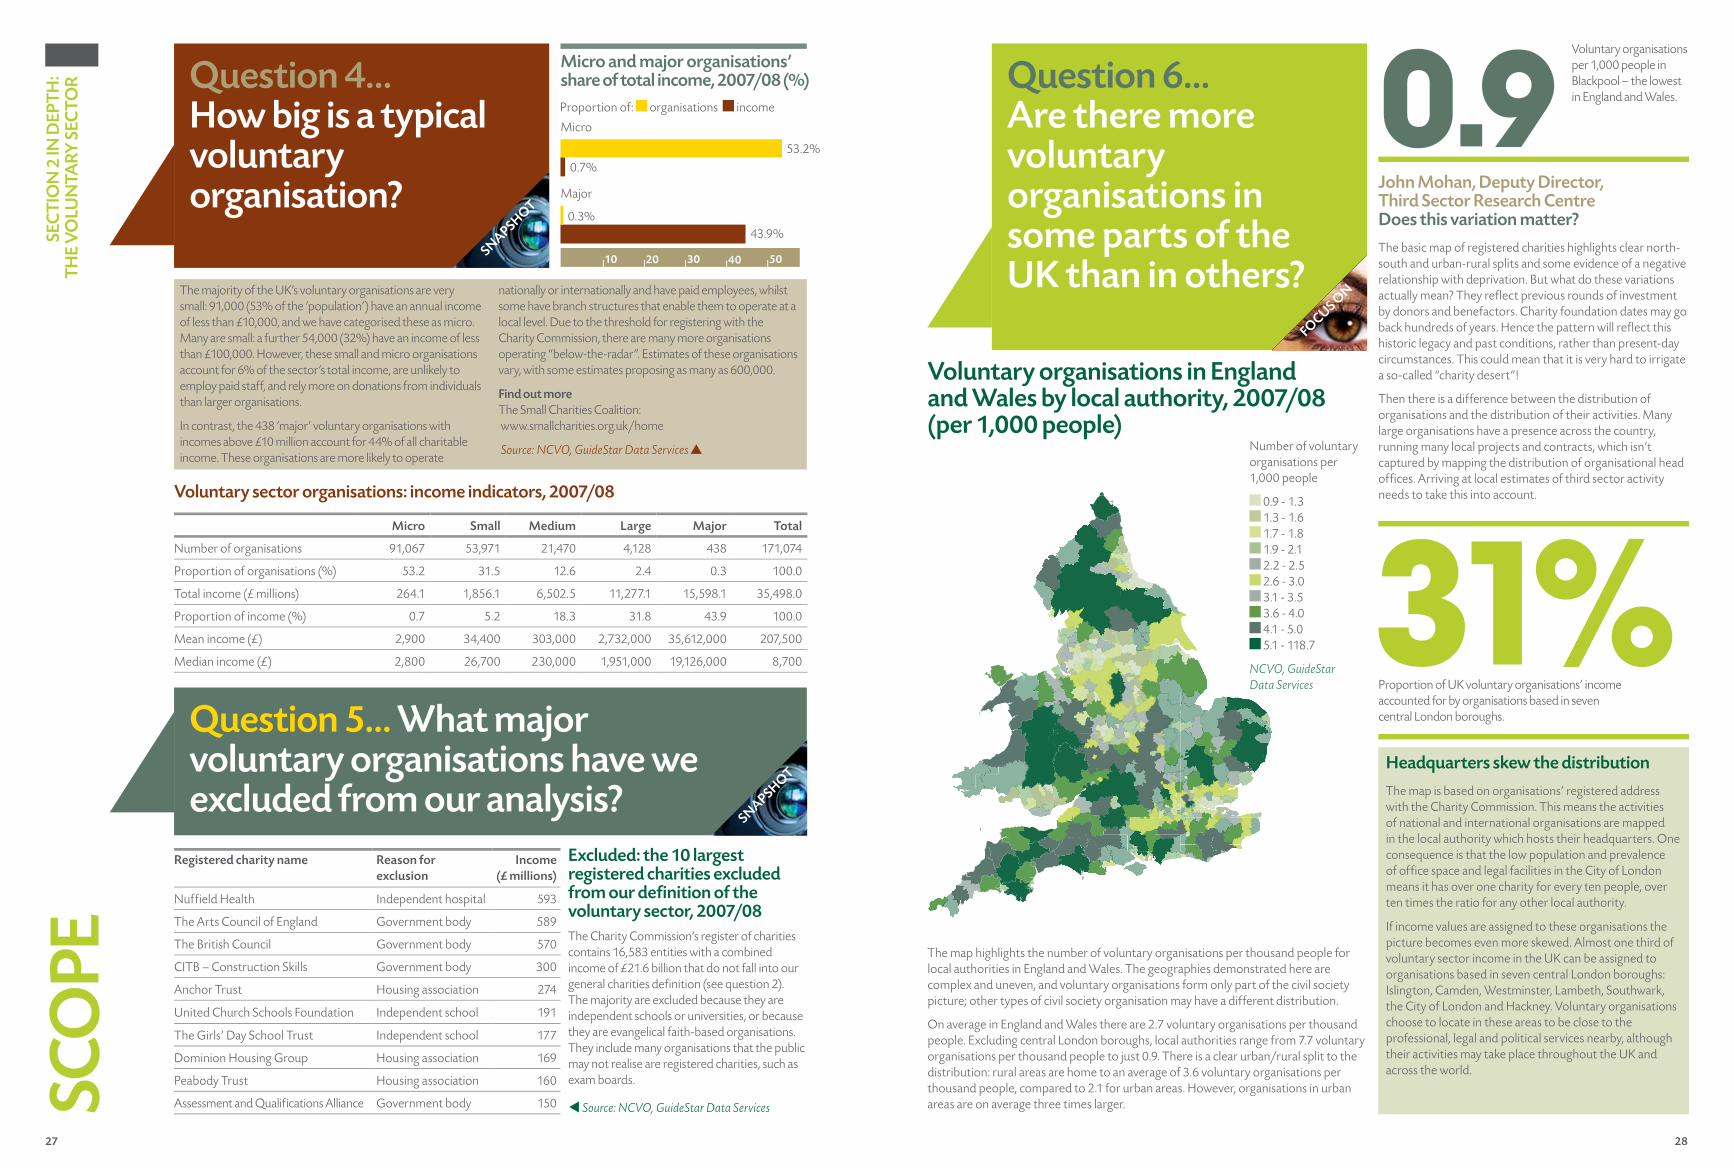
27 28
SEC
TIO
N 2
IN D
EPTH
: TH
E V
OLU
NTA
RY S
ECTO
R
The majority of the UK’s voluntary organisations are very small: 91,000 (53% of the ‘population’) have an annual income of less than £10,000, and we have categorised these as micro. Many are small: a further 54,000 (32%) have an income of less than £100,000. However, these small and micro organisations account for 6% of the sector’s total income, are unlikely to employ paid staff, and rely more on donations from individuals than larger organisations.
In contrast, the 438 ‘major’ voluntary organisations with incomes above £10 million account for 44% of all charitable income. These organisations are more likely to operate
nationally or internationally and have paid employees, whilst some have branch structures that enable them to operate at a local level. Due to the threshold for registering with the Charity Commission, there are many more organisations operating “below-the-radar”. Estimates of these organisations vary, with some estimates proposing as many as 600,000.
Find out moreThe Small Charities Coalition: www.smallcharities.org.uk/home
Source: NCVO, GuideStar Data Services
Question 4…How big is a typical voluntary organisation?
SNAPSHOT
Micro Small Medium Large Major Total
Number of organisations 91,067 53,971 21,470 4,128 438 171,074
Proportion of organisations (%) 53.2 31.5 12.6 2.4 0.3 100.0
Total income (£ millions) 264.1 1,856.1 6,502.5 11,277.1 15,598.1 35,498.0
Proportion of income (%) 0.7 5.2 18.3 31.8 43.9 100.0
Mean income (£) 2,900 34,400 303,000 2,732,000 35,612,000 207,500
Median income (£) 2,800 26,700 230,000 1,951,000 19,126,000 8,700
|30 |40 |50
43.9%0.3%
|10 |20
Micro
Major
53.2%0.7%
Voluntary sector organisations: income indicators, 2007/08
Micro and major organisations’ share of total income, 2007/08 (%)
Question 5… What major voluntary organisations have we excluded from our analysis?
The Charity Commission’s register of charities contains 16,583 entities with a combined income of £21.6 billion that do not fall into our general charities definition (see question 2). The majority are excluded because they are independent schools or universities, or because they are evangelical faith-based organisations. They include many organisations that the public may not realise are registered charities, such as exam boards.
Registered charity name Reason for exclusion
Income (£ millions)
Nuffield Health Independent hospital 593
The Arts Council of England Government body 589
The British Council Government body 570
CITB – Construction Skills Government body 300
Anchor Trust Housing association 274
United Church Schools Foundation Independent school 191
The Girls’ Day School Trust Independent school 177
Dominion Housing Group Housing association 169
Peabody Trust Housing association 160
Assessment and Qualifications Alliance Government body 150
Excluded: the 10 largest registered charities excluded from our definition of the voluntary sector, 2007/08
Proportion of: organisations income
John Mohan, Deputy Director,Third Sector Research Centre Does this variation matter?
The basic map of registered charities highlights clear north-south and urban-rural splits and some evidence of a negative relationship with deprivation. But what do these variations actually mean? They reflect previous rounds of investment by donors and benefactors. Charity foundation dates may go back hundreds of years. Hence the pattern will reflect this historic legacy and past conditions, rather than present-day circumstances. This could mean that it is very hard to irrigate a so-called “charity desert”!
Then there is a difference between the distribution of organisations and the distribution of their activities. Many large organisations have a presence across the country, running many local projects and contracts, which isn’t captured by mapping the distribution of organisational head offices. Arriving at local estimates of third sector activity needs to take this into account.
Headquarters skew the distribution
The map is based on organisations’ registered address with the Charity Commission. This means the activities of national and international organisations are mapped in the local authority which hosts their headquarters. One consequence is that the low population and prevalence of office space and legal facilities in the City of London means it has over one charity for every ten people, over ten times the ratio for any other local authority.
If income values are assigned to these organisations the picture becomes even more skewed. Almost one third of voluntary sector income in the UK can be assigned to organisations based in seven central London boroughs: Islington, Camden, Westminster, Lambeth, Southwark, the City of London and Hackney. Voluntary organisations choose to locate in these areas to be close to the professional, legal and political services nearby, although their activities may take place throughout the UK and across the world.
Question 6…Are there more voluntary organisations in some parts of the UK than in others?
Voluntary organisations in England and Wales by local authority, 2007/08 (per 1,000 people)
Number of voluntary organisations per 1,000 people
0.9 - 1.31.3 - 1.61.7 - 1.81.9 - 2.12.2 - 2.52.6 - 3.03.1 - 3.53.6 - 4.04.1 - 5.05.1 - 118.7
NCVO, GuideStar Data Services
Voluntary organisations per 1,000 people in Blackpool – the lowest in England and Wales.0.9
SNAPSHOT
FOCUS ON
SCO
PE
Proportion of UK voluntary organisations’ income accounted for by organisations based in seven central London boroughs.
31%
The map highlights the number of voluntary organisations per thousand people for local authorities in England and Wales. The geographies demonstrated here are complex and uneven, and voluntary organisations form only part of the civil society picture; other types of civil society organisation may have a different distribution.
On average in England and Wales there are 2.7 voluntary organisations per thousand people. Excluding central London boroughs, local authorities range from 7.7 voluntary organisations per thousand people to just 0.9. There is a clear urban/rural split to the distribution: rural areas are home to an average of 3.6 voluntary organisations per thousand people, compared to 2.1 for urban areas. However, organisations in urban areas are on average three times larger.t Source: NCVO, GuideStar Data Services
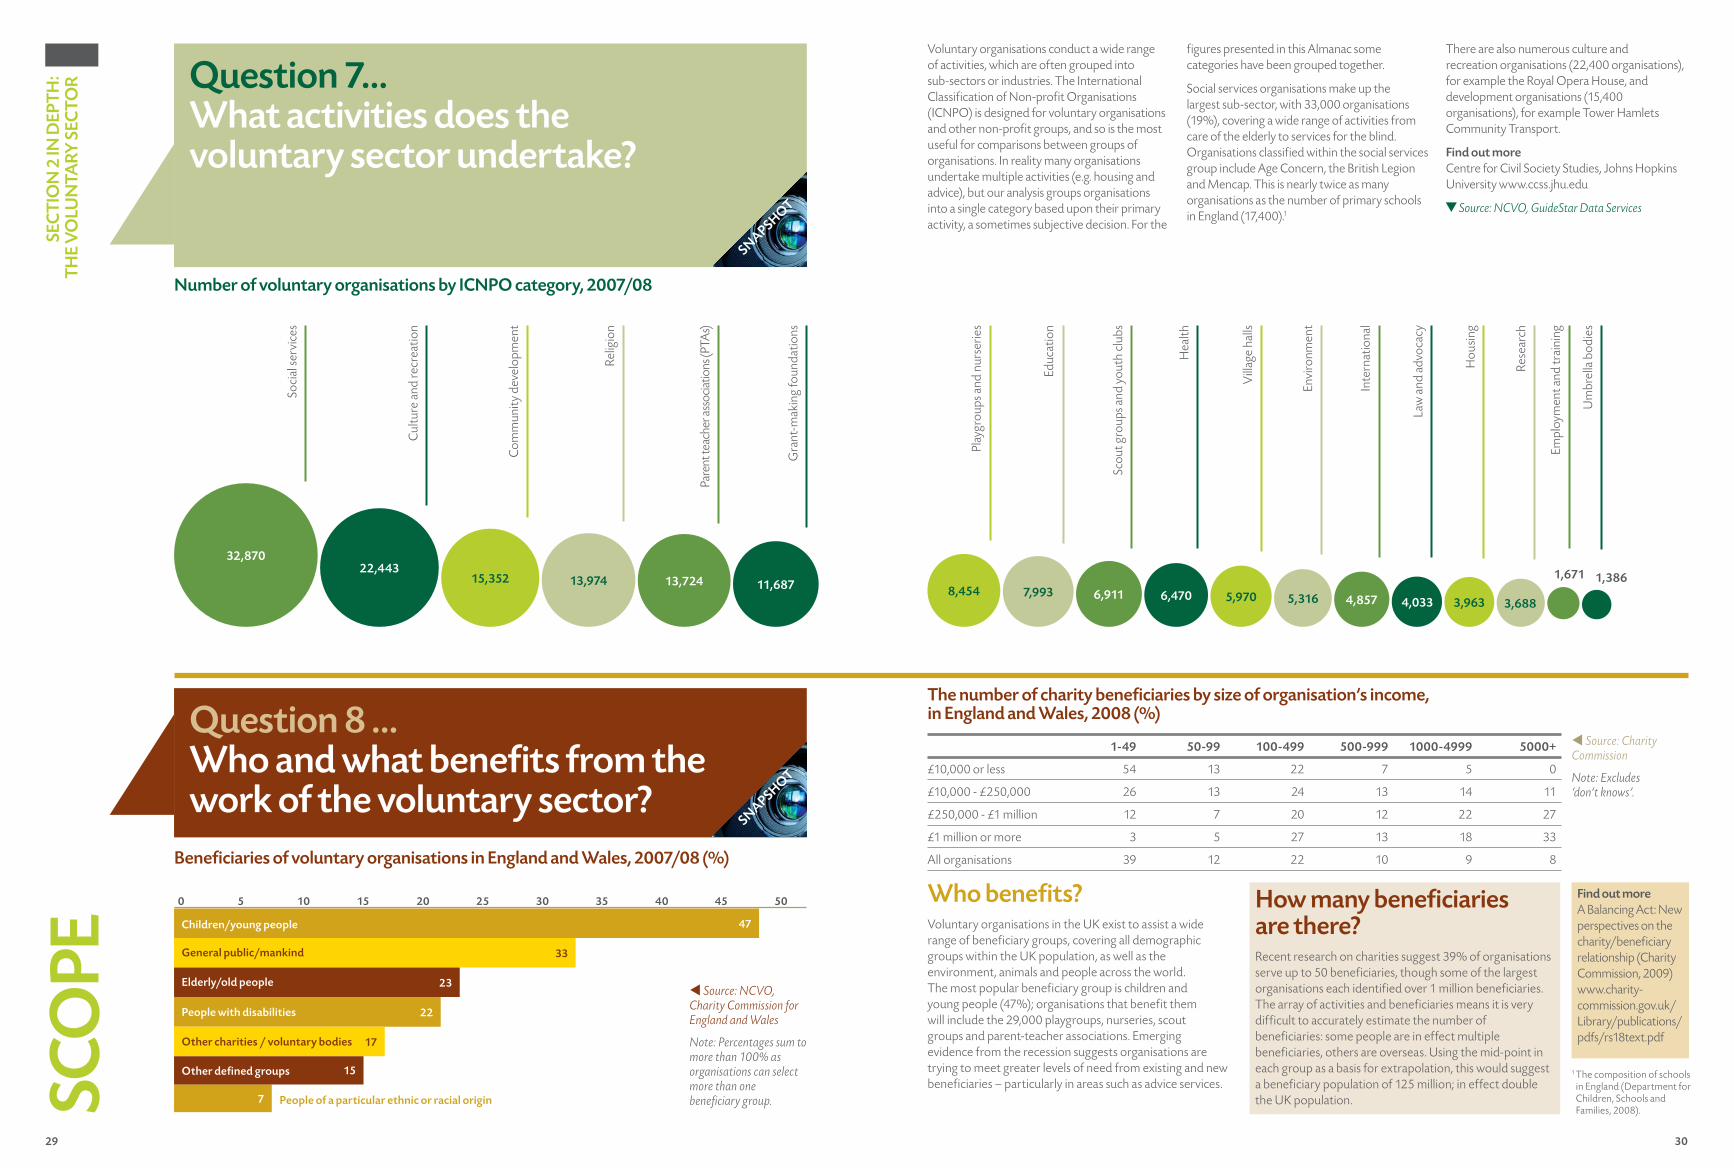
29 30
0 5 10 15 20 25 30 35 40 45 50
SE
CT
ION
2 IN
DE
PT
H:
TH
E V
OLU
NTA
RY
SE
CT
OR Question 7…
What activities does the voluntary sector undertake?
SNAPSH
OT
Number of voluntary organisations by ICNPO category, 2007/08
Voluntary organisations conduct a wide range of activities, which are often grouped into sub-sectors or industries. The International Classifi cation of Non-profi t Organisations (ICNPO) is designed for voluntary organisations and other non-profi t groups, and so is the most useful for comparisons between groups of organisations. In reality many organisations undertake multiple activities (e.g. housing and advice), but our analysis groups organisations into a single category based upon their primary activity, a sometimes subjective decision. For the
fi gures presented in this Almanac some categories have been grouped together.
Social services organisations make up the largest sub-sector, with 33,000 organisations (19%), covering a wide range of activities from care of the elderly to services for the blind. Organisations classifi ed within the social services group include Age Concern, the British Legion and Mencap. This is nearly twice as many organisations as the number of primary schools in England (17,400).1
There are also numerous culture and recreation organisations (22,400 organisations), for example the Royal Opera House, and development organisations (15,400 organisations), for example Tower Hamlets Community Transport.
Find out more
Centre for Civil Society Studies, Johns Hopkins University www.ccss.jhu.edu
Source: NCVO, GuideStar Data Services
1 The composition of schools in England (Department for Children, Schools and Families, 2008).
Question 8 …Who and what benefi ts from the work of the voluntary sector?
SNAPSH
OT
How many benefi ciaries are there?Recent research on charities suggest 39% of organisations serve up to 50 benefi ciaries, though some of the largest organisations each identifi ed over 1 million benefi ciaries. The array of activities and benefi ciaries means it is very diffi cult to accurately estimate the number of benefi ciaries: some people are in effect multiple benefi ciaries, others are overseas. Using the mid-point in each group as a basis for extrapolation, this would suggest a benefi ciary population of 125 million; in effect double the UK population.
Who benefi ts?Voluntary organisations in the UK exist to assist a wide range of benefi ciary groups, covering all demographic groups within the UK population, as well as the environment, animals and people across the world. The most popular benefi ciary group is children and young people (47%); organisations that benefi t them will include the 29,000 playgroups, nurseries, scout groups and parent-teacher associations. Emerging evidence from the recession suggests organisations are trying to meet greater levels of need from existing and new benefi ciaries – particularly in areas such as advice services.
Find out more
A Balancing Act: New perspectives on the charity/benefi ciary relationship (Charity Commission, 2009) www.charity-commission.gov.uk/Library/publications/pdfs/rs18text.pdf
Benefi ciaries of voluntary organisations in England and Wales, 2007/08 (%)
47
33
23
22
17
Children/young people
General public/mankind
Elderly/old people
People with disabilities
Other charities / voluntary bodies
People of a particular ethnic or racial origin7
Other defi ned groups
The number of charity benefi ciaries by size of organisation’s income, in England and Wales, 2008 (%)
1-49 50-99 100-499 500-999 1000-4999 5000+
£10,000 or less 54 13 22 7 5 0
£10,000 - £250,000 26 13 24 13 14 11
£250,000 - £1 million 12 7 20 12 22 27
£1 million or more 3 5 27 13 18 33
All organisations 39 12 22 10 9 8
t Source: Charity Commission
Note: Excludes ‘don’t knows’.
t Source: NCVO, Charity Commission for England and Wales
Note: Percentages sum to more than 100% as organisations can select more than one benefi ciary group.SC
OP
E
Soci
al se
rvic
es
Cul
ture
and
recr
eatio
n
Com
mun
ity d
evel
opm
ent
Relig
ion
Pare
nt te
ache
r ass
ocia
tions
(PTA
s)
Gra
nt-m
akin
g fo
unda
tions
32,870
Play
grou
ps a
nd n
urse
ries
Um
brel
la b
odie
s
Empl
oym
ent a
nd tr
aini
ng
Rese
arch
Hou
sing
Law
and
adv
ocac
y
Inte
rnat
iona
l
Envi
ronm
ent
Vill
age
halls
Hea
lth
Scou
t gro
ups a
nd y
outh
clu
bs
Educ
atio
n
22,44315,352 13,974 13,724 11,687
8,454 7,993 6,911 6,470 5,970 5,316 4,857 4,033 3,963 3,688
1,386
15
1,671
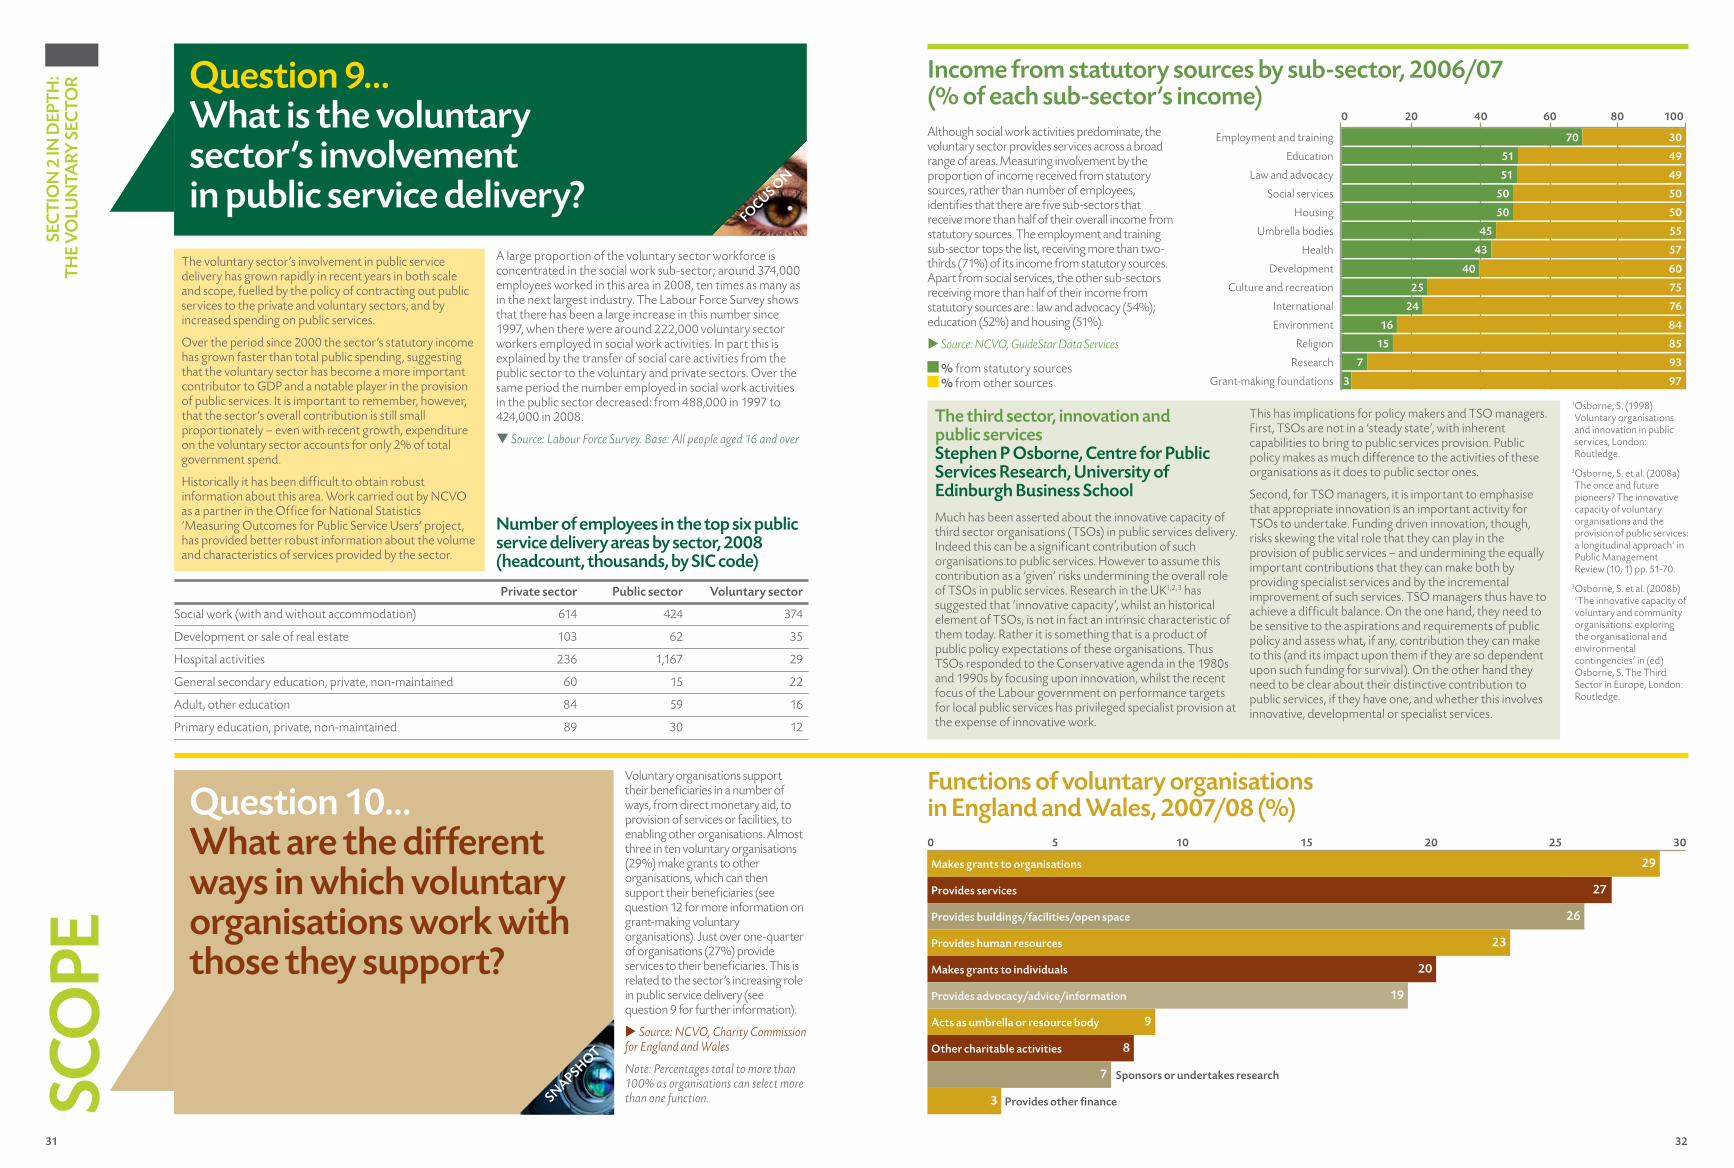
31 32
Provides services
9Acts as umbrella or resource body
29
27
26
23
20
19
8
7
3 Provides other finance
Sponsors or undertakes research
Other charitable activities
Provides advocacy/advice/information
Makes grants to individuals
Provides human resources
Provides buildings/facilities/open space
0 5 10 20 2515
Although social work activities predominate, the voluntary sector provides services across a broad range of areas. Measuring involvement by the proportion of income received from statutory sources, rather than number of employees, identifies that there are five sub-sectors that receive more than half of their overall income from statutory sources. The employment and training sub-sector tops the list, receiving more than two-thirds (71%) of its income from statutory sources. Apart from social services, the other sub-sectors receiving more than half of their income from statutory sources are : law and advocacy (54%); education (52%) and housing (51%).
u Source: NCVO, GuideStar Data Services
Voluntary organisations support their beneficiaries in a number of ways, from direct monetary aid, to provision of services or facilities, to enabling other organisations. Almost three in ten voluntary organisations (29%) make grants to other organisations, which can then support their beneficiaries (see question 12 for more information on grant-making voluntary organisations). Just over one-quarter of organisations (27%) provide services to their beneficiaries. This is related to the sector’s increasing role in public service delivery (see question 9 for further information).
u Source: NCVO, Charity Commission for England and Wales
Note: Percentages total to more than 100% as organisations can select more than one function.
Question 9…What is the voluntary sector’s involvement in public service delivery?
FOCUS ON
The voluntary sector’s involvement in public service delivery has grown rapidly in recent years in both scale and scope, fuelled by the policy of contracting out public services to the private and voluntary sectors, and by increased spending on public services.
Over the period since 2000 the sector’s statutory income has grown faster than total public spending, suggesting that the voluntary sector has become a more important contributor to GDP and a notable player in the provision of public services. It is important to remember, however, that the sector’s overall contribution is still small proportionately – even with recent growth, expenditure on the voluntary sector accounts for only 2% of total government spend.
Historically it has been difficult to obtain robust information about this area. Work carried out by NCVO as a partner in the Office for National Statistics ‘Measuring Outcomes for Public Service Users’ project, has provided better robust information about the volume and characteristics of services provided by the sector.
A large proportion of the voluntary sector workforce is concentrated in the social work sub-sector; around 374,000 employees worked in this area in 2008, ten times as many as in the next largest industry. The Labour Force Survey shows that there has been a large increase in this number since 1997, when there were around 222,000 voluntary sector workers employed in social work activities. In part this is explained by the transfer of social care activities from the public sector to the voluntary and private sectors. Over the same period the number employed in social work activities in the public sector decreased: from 488,000 in 1997 to 424,000 in 2008.
q Source: Labour Force Survey. Base: All people aged 16 and over
SEC
TIO
N 2
IN D
EPTH
: TH
E V
OLU
NTA
RY S
ECTO
R
Number of employees in the top six public service delivery areas by sector, 2008 (headcount, thousands, by SIC code)
Private sector Public sector Voluntary sector
Social work (with and without accommodation) 614 424 374
Development or sale of real estate 103 62 35
Hospital activities 236 1,167 29
General secondary education, private, non-maintained 60 15 22
Adult, other education 84 59 16
Primary education, private, non-maintained 89 30 12
The third sector, innovation and public services Stephen P Osborne, Centre for Public Services Research, University of Edinburgh Business SchoolMuch has been asserted about the innovative capacity of third sector organisations (TSOs) in public services delivery. Indeed this can be a significant contribution of such organisations to public services. However to assume this contribution as a ‘given’ risks undermining the overall role of TSOs in public services. Research in the UK1,2,3 has suggested that ‘innovative capacity’, whilst an historical element of TSOs, is not in fact an intrinsic characteristic of them today. Rather it is something that is a product of public policy expectations of these organisations. Thus TSOs responded to the Conservative agenda in the 1980s and 1990s by focusing upon innovation, whilst the recent focus of the Labour government on performance targets for local public services has privileged specialist provision at the expense of innovative work.
This has implications for policy makers and TSO managers. First, TSOs are not in a ‘steady state’, with inherent capabilities to bring to public services provision. Public policy makes as much difference to the activities of these organisations as it does to public sector ones.
Second, for TSO managers, it is important to emphasise that appropriate innovation is an important activity for TSOs to undertake. Funding driven innovation, though, risks skewing the vital role that they can play in the provision of public services – and undermining the equally important contributions that they can make both by providing specialist services and by the incremental improvement of such services. TSO managers thus have to achieve a difficult balance. On the one hand, they need to be sensitive to the aspirations and requirements of public policy and assess what, if any, contribution they can make to this (and its impact upon them if they are so dependent upon such funding for survival). On the other hand they need to be clear about their distinctive contribution to public services, if they have one, and whether this involves innovative, developmental or specialist services.
1 Osborne, S. (1998) Voluntary organisations and innovation in public services, London: Routledge.
2 Osborne, S. et al. (2008a) The once and future pioneers? The innovative capacity of voluntary organisations and the provision of public services: a longitudinal approach’ in Public Management Review (10, 1) pp. 51-70.
3 Osborne, S. et al. (2008b) ‘The innovative capacity of voluntary and community organisations: exploring the organisational and environmental contingencies’ in (ed) Osborne, S. The Third Sector in Europe, London: Routledge.
Question 10…What are the different ways in which voluntary organisations work with those they support?
SNAPSHOT
Functions of voluntary organisations in England and Wales, 2007/08 (%)
Income from statutory sources by sub-sector, 2006/07 (% of each sub-sector’s income)
% from statutory sources % from other sources
Employment and training
Education
Law and advocacy
Social services
Housing
Umbrella bodies
Health
Development
Culture and recreation
International
Environment
Religion
Research
Grant-making foundations
0 20 40 80 10060
51
51
50
50
45
43
40
25
24
16
15
7
3
70 30
49
49
50
50
55
57
60
75
76
84
85
93
97
Makes grants to organisations
SCO
PE
30
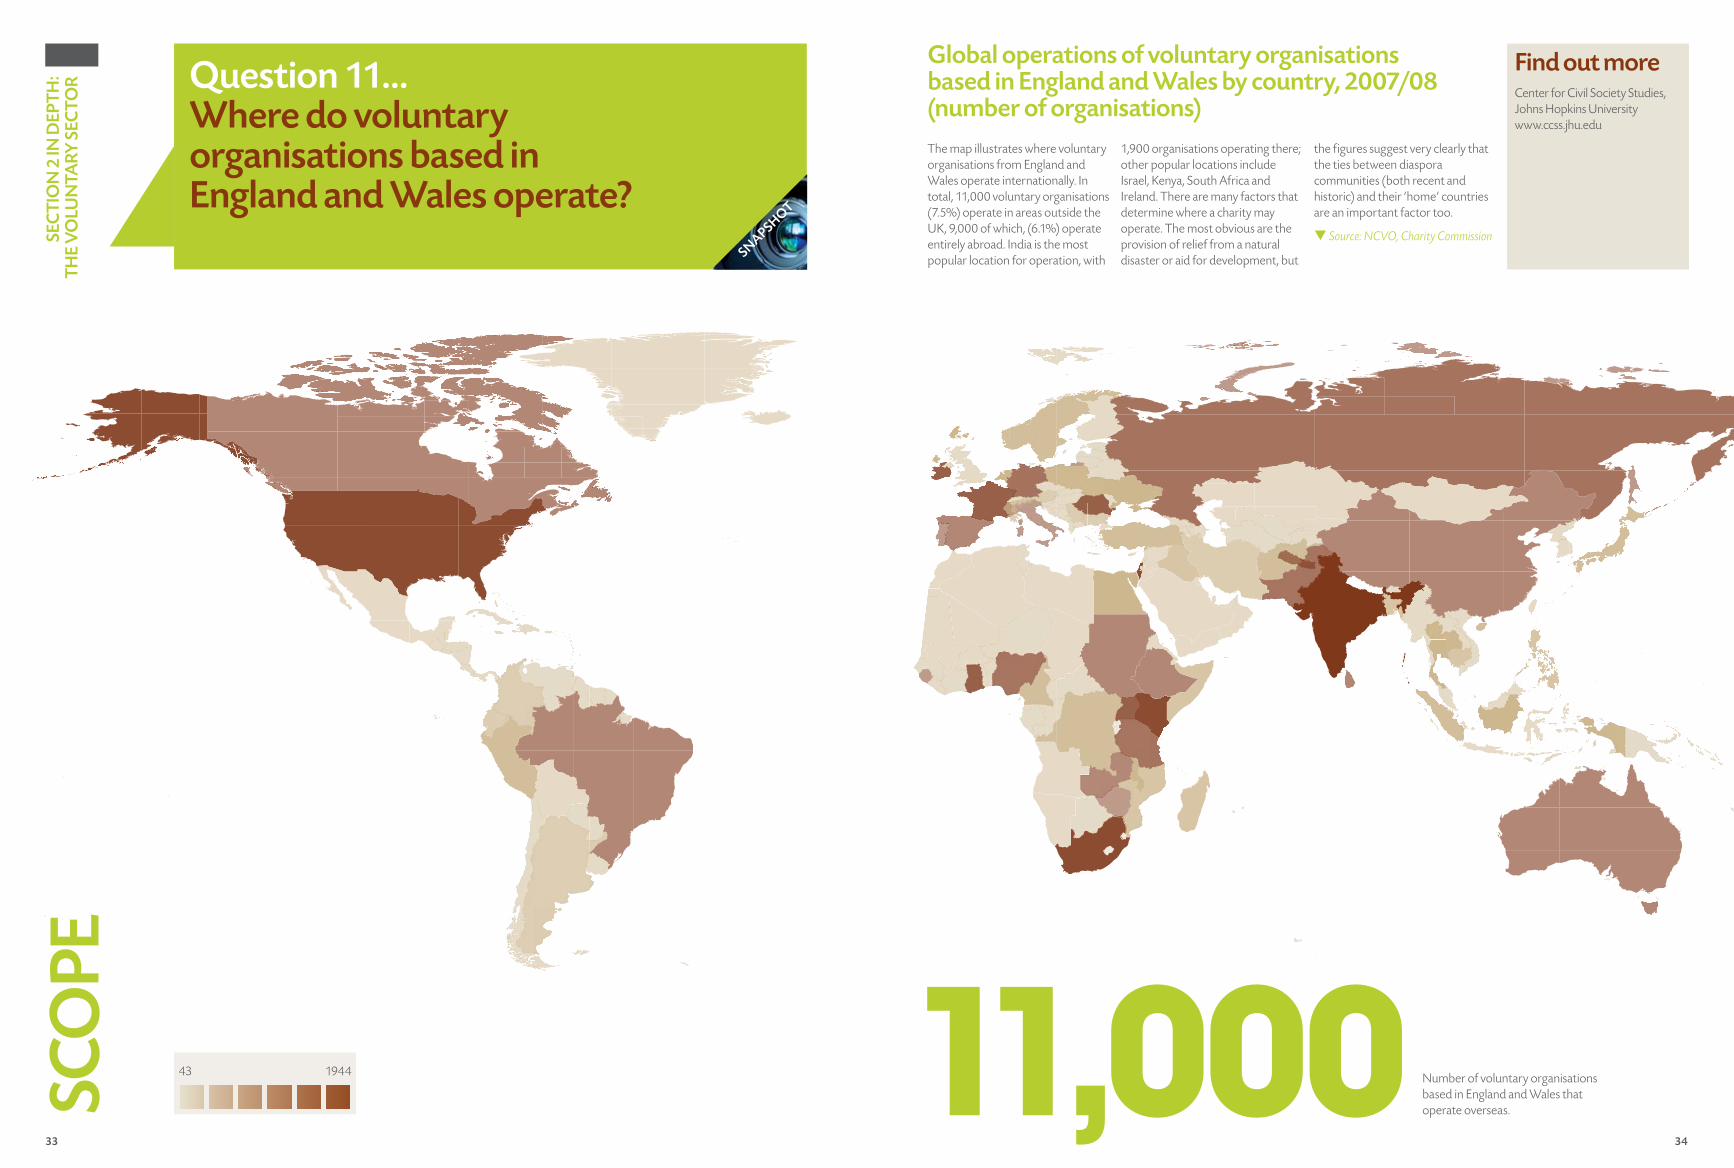
33 34
SEC
TIO
N 2
IN D
EPTH
: TH
E V
OLU
NTA
RY S
ECTO
R
11,000 Number of voluntary organisations based in England and Wales that operate overseas.
Question 11…Where do voluntary organisations based in England and Wales operate?
SNAPSHOT
Global operations of voluntary organisations based in England and Wales by country, 2007/08 (number of organisations)The map illustrates where voluntary organisations from England and Wales operate internationally. In total, 11,000 voluntary organisations (7.5%) operate in areas outside the UK, 9,000 of which, (6.1%) operate entirely abroad. India is the most popular location for operation, with
1,900 organisations operating there; other popular locations include Israel, Kenya, South Africa and Ireland. There are many factors that determine where a charity may operate. The most obvious are the provision of relief from a natural disaster or aid for development, but
the figures suggest very clearly that the ties between diaspora communities (both recent and historic) and their ‘home’ countries are an important factor too.
q Source: NCVO, Charity Commission
Find out moreCenter for Civil Society Studies, Johns Hopkins University www.ccss.jhu.edu
SCO
PE
43 1944
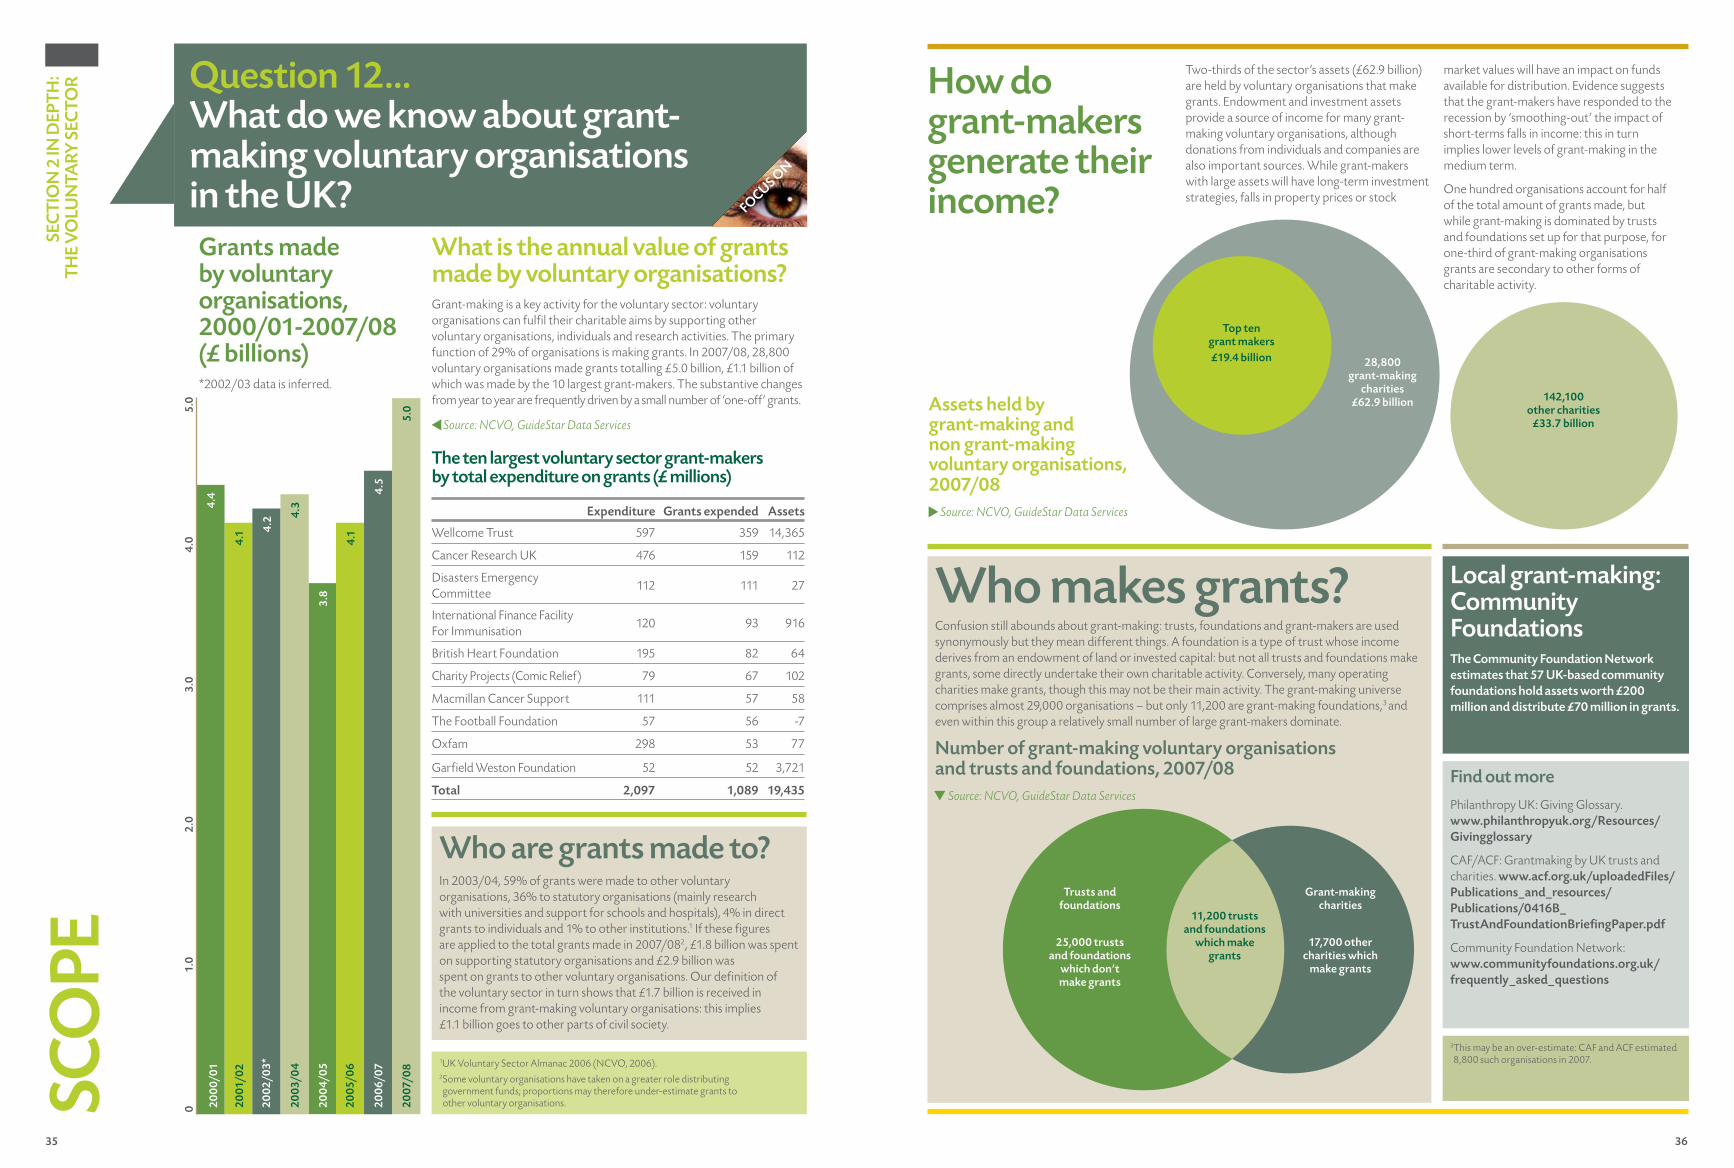
35 36
3.8
4.1
SEC
TIO
N 2
IN D
EPTH
: TH
E V
OLU
NTA
RY S
ECTO
R
What is the annual value of grants made by voluntary organisations?Grant-making is a key activity for the voluntary sector: voluntary organisations can fulfil their charitable aims by supporting other voluntary organisations, individuals and research activities. The primary function of 29% of organisations is making grants. In 2007/08, 28,800 voluntary organisations made grants totalling £5.0 billion, £1.1 billion of which was made by the 10 largest grant-makers. The substantive changes from year to year are frequently driven by a small number of ‘one-off’ grants.
Source: NCVO, GuideStar Data Services
How do grant-makers generate their income?
Two-thirds of the sector’s assets (£62.9 billion) are held by voluntary organisations that make grants. Endowment and investment assets provide a source of income for many grant-making voluntary organisations, although donations from individuals and companies are also important sources. While grant-makers with large assets will have long-term investment strategies, falls in property prices or stock
market values will have an impact on funds available for distribution. Evidence suggests that the grant-makers have responded to the recession by ‘smoothing-out’ the impact of short-terms falls in income: this in turn implies lower levels of grant-making in the medium term.
One hundred organisations account for half of the total amount of grants made, but while grant-making is dominated by trusts and foundations set up for that purpose, for one-third of grant-making organisations grants are secondary to other forms of charitable activity.
Question 12…What do we know about grant-making voluntary organisations in the UK? FOCUS O
N
4.4
4.2 4.
3
01.
02
.03.
04.
0
200
0/01
2001
/02
2002
/03*
2003
/04
200
4/05
4.1
4.5
5.0
2005
/06
2006
/07
2007
/08
5.0
Grants made by voluntary organisations, 2000/01-2007/08 (£ billions)*2002/03 data is inferred.
Who are grants made to?In 2003/04, 59% of grants were made to other voluntary organisations, 36% to statutory organisations (mainly research with universities and support for schools and hospitals), 4% in direct grants to individuals and 1% to other institutions.1 If these figures are applied to the total grants made in 2007/082, £1.8 billion was spent on supporting statutory organisations and £2.9 billion was spent on grants to other voluntary organisations. Our definition of the voluntary sector in turn shows that £1.7 billion is received in income from grant-making voluntary organisations: this implies £1.1 billion goes to other parts of civil society.
Assets held by grant-making and non grant-making voluntary organisations, 2007/08
Source: NCVO, GuideStar Data Services
Who makes grants?Confusion still abounds about grant-making: trusts, foundations and grant-makers are used synonymously but they mean different things. A foundation is a type of trust whose income derives from an endowment of land or invested capital: but not all trusts and foundations make grants, some directly undertake their own charitable activity. Conversely, many operating charities make grants, though this may not be their main activity. The grant-making universe comprises almost 29,000 organisations – but only 11,200 are grant-making foundations,3 and even within this group a relatively small number of large grant-makers dominate.
Local grant-making: Community FoundationsThe Community Foundation Network estimates that 57 UK-based community foundations hold assets worth £200 million and distribute £70 million in grants.
Find out more
Philanthropy UK: Giving Glossary. www.philanthropyuk.org/Resources/Givingglossary
CAF/ACF: Grantmaking by UK trusts and charities. www.acf.org.uk/uploadedFiles/Publications_and_resources/Publications/0416B_TrustAndFoundationBriefingPaper.pdf
Community Foundation Network: www.communityfoundations.org.uk/frequently_asked_questions
1UK Voluntary Sector Almanac 2006 (NCVO, 2006). 2 Some voluntary organisations have taken on a greater role distributing government funds; proportions may therefore under-estimate grants to other voluntary organisations.
142,100 other charities
£33.7 billion
Top ten grant makers £19.4 billion 28,800
grant-making charities
£62.9 billion
Number of grant-making voluntary organisations and trusts and foundations, 2007/08
Source: NCVO, GuideStar Data Services
Trusts and foundations
25,000 trusts and foundations
which don’t make grants
11,200 trusts and foundations
which make grants
Grant-making charities
17,700 other charities which
make grants
3 This may be an over-estimate: CAF and ACF estimated 8,800 such organisations in 2007.
SCO
PE
Expenditure Grants expended Assets
Wellcome Trust 597 359 14,365
Cancer Research UK 476 159 112
Disasters Emergency Committee
112 111 27
International Finance Facility For Immunisation
120 93 916
British Heart Foundation 195 82 64
Charity Projects (Comic Relief) 79 67 102
Macmillan Cancer Support 111 57 58
The Football Foundation 57 56 -7
Oxfam 298 53 77
Garfield Weston Foundation 52 52 3,721
Total 2,097 1,089 19,435
The ten largest voluntary sector grant-makers by total expenditure on grants (£ millions)
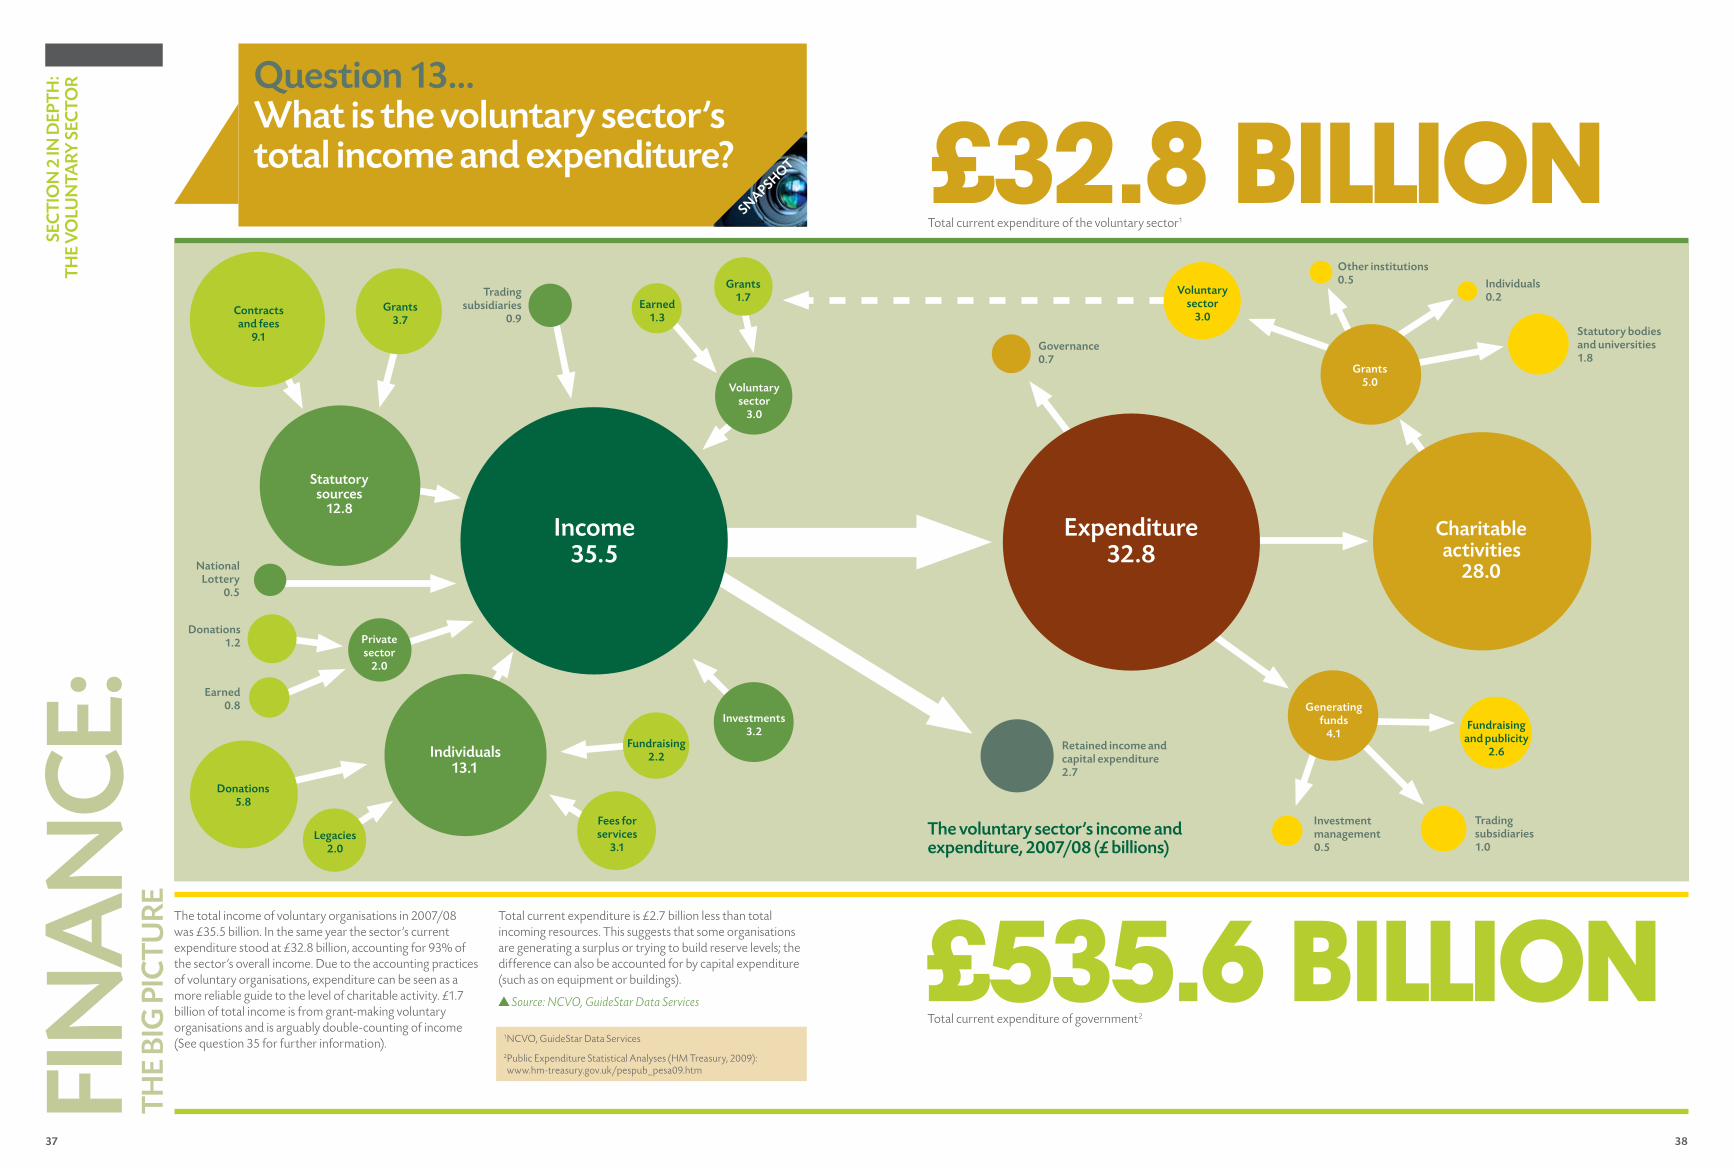
37 38
SEC
TIO
N 2
IN D
EPTH
: TH
E V
OLU
NTA
RY S
ECTO
R
The total income of voluntary organisations in 2007/08 was £35.5 billion. In the same year the sector’s current expenditure stood at £32.8 billion, accounting for 93% of the sector’s overall income. Due to the accounting practices of voluntary organisations, expenditure can be seen as a more reliable guide to the level of charitable activity. £1.7 billion of total income is from grant-making voluntary organisations and is arguably double-counting of income (See question 35 for further information).
Total current expenditure is £2.7 billion less than total incoming resources. This suggests that some organisations are generating a surplus or trying to build reserve levels; the difference can also be accounted for by capital expenditure (such as on equipment or buildings).
Source: NCVO, GuideStar Data Services
Question 13…What is the voluntary sector’s total income and expenditure?
SNAPSHOT £32.8 billionTotal current expenditure of the voluntary sector1
Retained income and capital expenditure 2.7
Governance 0.7
Individuals 0.2
Statutory bodies and universities 1.8
Fundraising and publicity
2.6
Trading subsidiaries 1.0
Investment management 0.5
£535.6 billion
Fundraising 2.2Individuals
13.1
Fees for services
3.1
Generating funds
4.1
Voluntary sector
3.0
National Lottery
0.5
Statutory sources
12.8
Grants 3.7
Contracts and fees
9.1
Voluntary sector
3.0
Grants 1.7Trading
subsidiaries 0.9
Donations 1.2
Earned 0.8
Donations 5.8
Legacies 2.0
Private sector
2.0
1NCVO, GuideStar Data Services
2 Public Expenditure Statistical Analyses (HM Treasury, 2009): www.hm-treasury.gov.uk/pespub_pesa09.htm FI
NA
NC
E:TH
E BI
G P
ICTU
RE
Income 35.5
Expenditure 32.8
Other institutions 0.5
Grants 5.0
The voluntary sector’s income and expenditure, 2007/08 (£ billions)
Charitable activities
28.0
Earned 1.3
Investments 3.2
Total current expenditure of government2
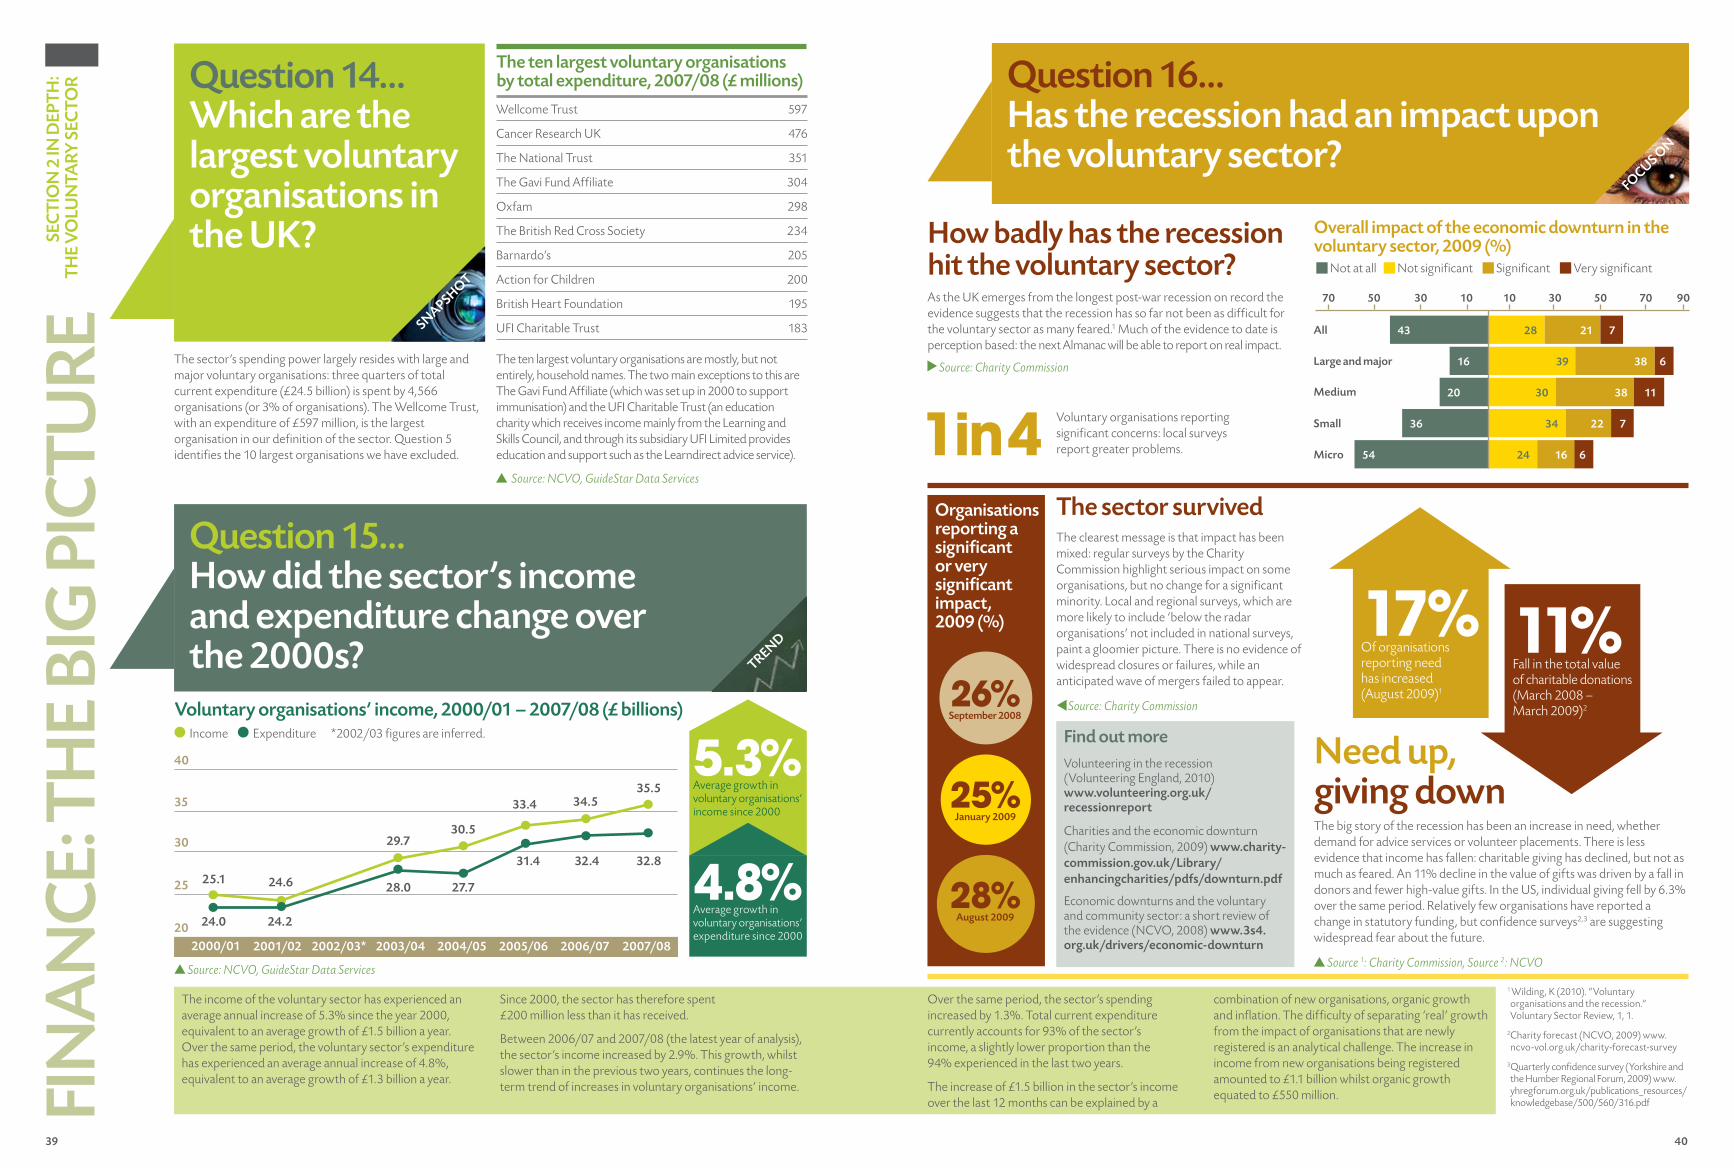
39 40
20
SEC
TIO
N 2
IN D
EPTH
: TH
E V
OLU
NTA
RY S
ECTO
R
The sector’s spending power largely resides with large and major voluntary organisations: three quarters of total current expenditure (£24.5 billion) is spent by 4,566 organisations (or 3% of organisations). The Wellcome Trust, with an expenditure of £597 million, is the largest organisation in our definition of the sector. Question 5 identifies the 10 largest organisations we have excluded.
The ten largest voluntary organisations are mostly, but not entirely, household names. The two main exceptions to this are The Gavi Fund Affiliate (which was set up in 2000 to support immunisation) and the UFI Charitable Trust (an education charity which receives income mainly from the Learning and Skills Council, and through its subsidiary UFI Limited provides education and support such as the Learndirect advice service).
Source: NCVO, GuideStar Data Services
The income of the voluntary sector has experienced an average annual increase of 5.3% since the year 2000, equivalent to an average growth of £1.5 billion a year. Over the same period, the voluntary sector’s expenditure has experienced an average annual increase of 4.8%, equivalent to an average growth of £1.3 billion a year.
Since 2000, the sector has therefore spent £200 million less than it has received.
Between 2006/07 and 2007/08 (the latest year of analysis), the sector’s income increased by 2.9%. This growth, whilst slower than in the previous two years, continues the long-term trend of increases in voluntary organisations’ income.
Question 14…Which are the largest voluntary organisations in the UK?
SNAPSHOT
Wellcome Trust 597
Cancer Research UK 476
The National Trust 351
The Gavi Fund Affiliate 304
Oxfam 298
The British Red Cross Society 234
Barnardo’s 205
Action for Children 200
British Heart Foundation 195
UFI Charitable Trust 183
The ten largest voluntary organisations by total expenditure, 2007/08 (£ millions) Question 16…
Has the recession had an impact upon the voluntary sector?
FOCUS ON
Question 15…How did the sector’s income and expenditure change over the 2000s? TREND
Over the same period, the sector’s spending increased by 1.3%. Total current expenditure currently accounts for 93% of the sector’s income, a slightly lower proportion than the 94% experienced in the last two years.
The increase of £1.5 billion in the sector’s income over the last 12 months can be explained by a
combination of new organisations, organic growth and inflation. The difficulty of separating ‘real’ growth from the impact of organisations that are newly registered is an analytical challenge. The increase in income from new organisations being registered amounted to £1.1 billion whilst organic growth equated to £550 million.
Voluntary organisations’ income, 2000/01 – 2007/08 (£ billions)
40
2000/01
35
30
25
Income Expenditure *2002/03 figures are inferred.
2001/02 2002/03* 2003/04 2004/05 2005/06 2006/07 2007/08
5.3%Average growth in voluntary organisations’ income since 2000
4.8%Average growth in voluntary organisations’ expenditure since 2000
How badly has the recession hit the voluntary sector? As the UK emerges from the longest post-war recession on record the evidence suggests that the recession has so far not been as difficult for the voluntary sector as many feared.1 Much of the evidence to date is perception based: the next Almanac will be able to report on real impact.
Source: Charity Commission
The sector survivedThe clearest message is that impact has been mixed: regular surveys by the Charity Commission highlight serious impact on some organisations, but no change for a significant minority. Local and regional surveys, which are more likely to include ‘below the radar organisations’ not included in national surveys, paint a gloomier picture. There is no evidence of widespread closures or failures, while an anticipated wave of mergers failed to appear.
Source: Charity Commission
1 Wilding, K (2010). “Voluntary organisations and the recession.” Voluntary Sector Review, 1, 1.
2 Charity forecast (NCVO, 2009) www.ncvo-vol.org.uk/charity-forecast-survey
3 Quarterly confidence survey (Yorkshire and the Humber Regional Forum, 2009) www.yhregforum.org.uk/publications_resources/knowledgebase/500/560/316.pdf
Need up, giving downThe big story of the recession has been an increase in need, whether demand for advice services or volunteer placements. There is less evidence that income has fallen: charitable giving has declined, but not as much as feared. An 11% decline in the value of gifts was driven by a fall in donors and fewer high-value gifts. In the US, individual giving fell by 6.3% over the same period. Relatively few organisations have reported a change in statutory funding, but confidence surveys2,3 are suggesting widespread fear about the future.
Source 1: Charity Commission, Source 2: NCVO
Find out moreVolunteering in the recession (Volunteering England, 2010) www.volunteering.org.uk/recessionreport
Charities and the economic downturn (Charity Commission, 2009) www.charity-commission.gov.uk/Library/enhancingcharities/pdfs/downturn.pdf
Economic downturns and the voluntary and community sector: a short review of the evidence (NCVO, 2008) www.3s4.org.uk/drivers/economic-downturn
17%Of organisations reporting need has increased (August 2009)1
26%September 2008
25%January 2009
28%August 2009
Organisations reporting a significant or very significant impact, 2009 (%)
Voluntary organisations reporting significant concerns: local surveys report greater problems.1in4
Not at all Not significant Significant Very significant
Overall impact of the economic downturn in the voluntary sector, 2009 (%)
43All 28 21 7
16Large and major 39 38 6
20Medium 30 38 11
36Small 34 22 7
54Micro 24 16 6
10 1030 30 505070 70 90
11%Fall in the total value of charitable donations (March 2008 – March 2009)2
FIN
AN
CE:
TH
E BI
G P
ICTU
RE
25.1 24.6
29.730.5
33.4 34.535.5
32.832.431.4
27.728.0
24.224.0
Source: NCVO, GuideStar Data Services
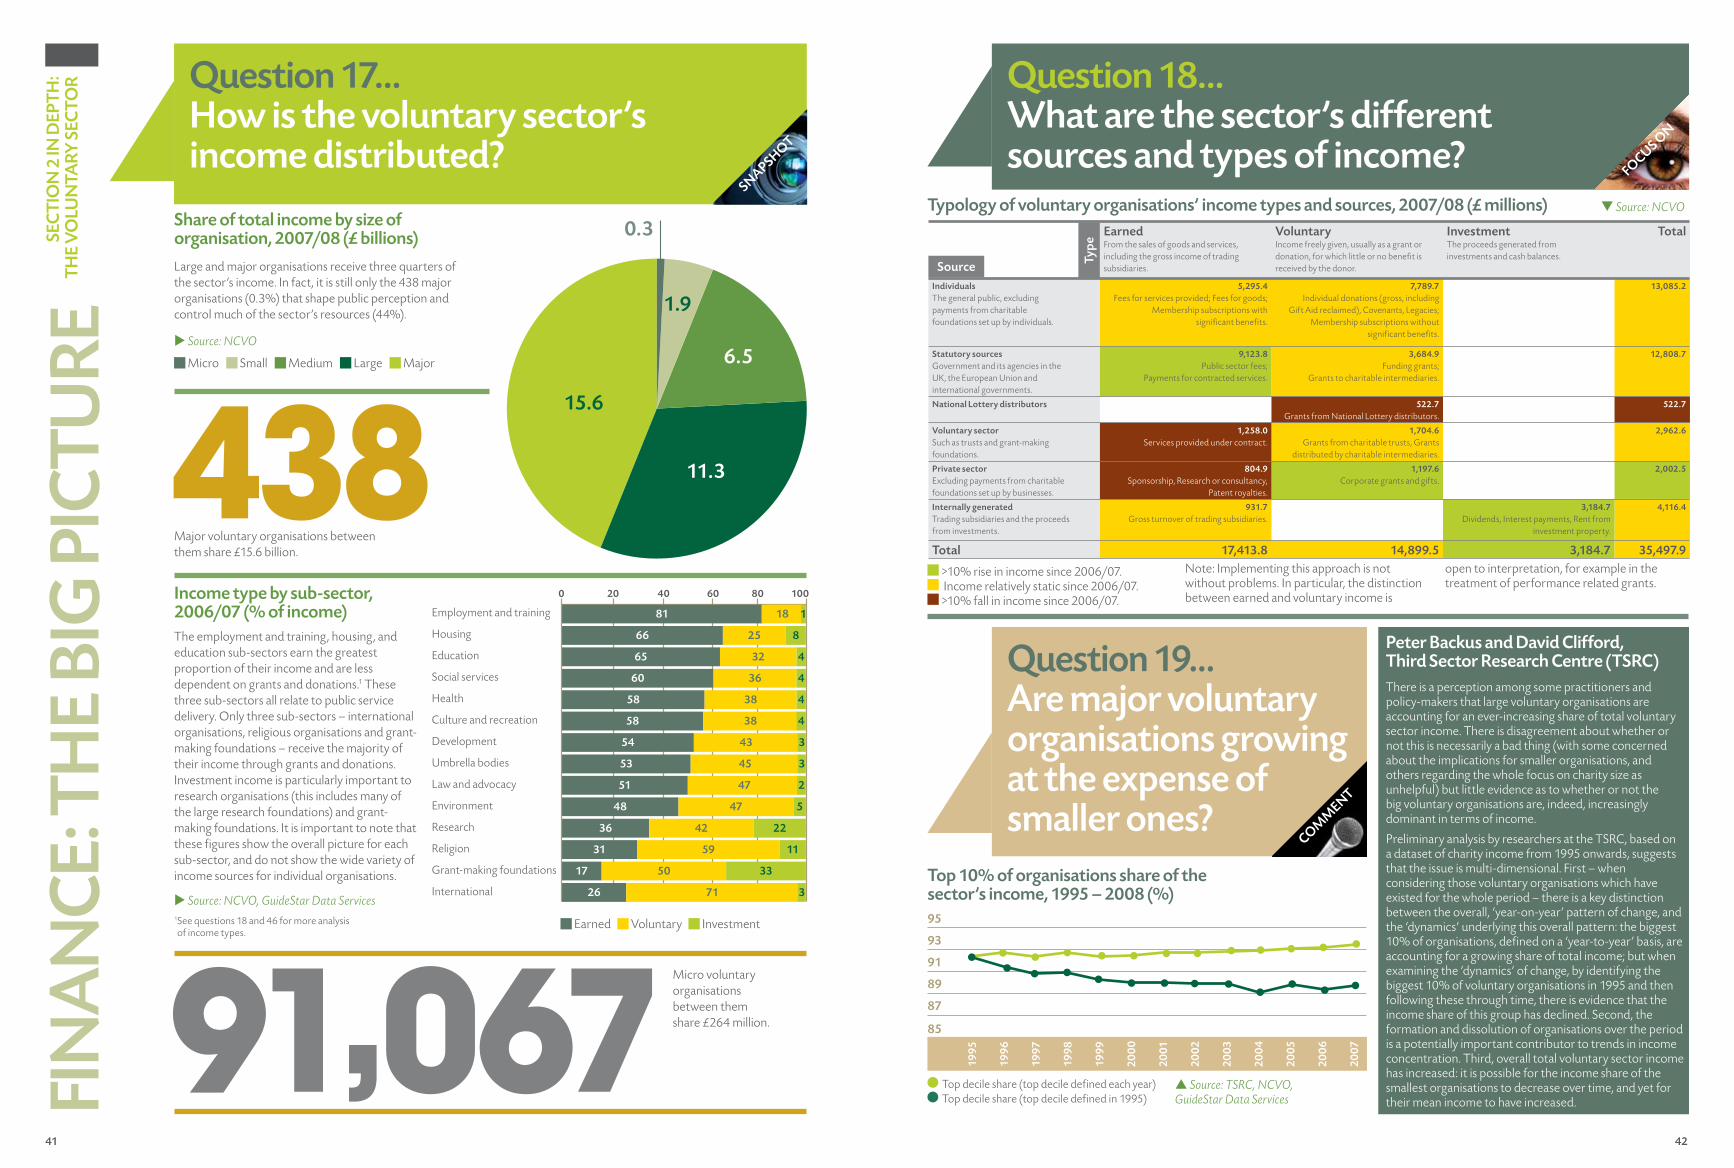
41 42
85
87
89
91
93
95
Earned From the sales of goods and services, including the gross income of trading subsidiaries.
Voluntary Income freely given, usually as a grant or donation, for which little or no benefit is received by the donor.
Investment The proceeds generated from investments and cash balances.
Total
Individuals The general public, excluding payments from charitable foundations set up by individuals.
5,295.4Fees for services provided; Fees for goods;
Membership subscriptions with significant benefits.
7,789.7Individual donations (gross, including
Gift Aid reclaimed), Covenants, Legacies;Membership subscriptions without
significant benefits.
13,085.2
Statutory sources Government and its agencies in the UK, the European Union and international governments.
9,123.8Public sector fees;
Payments for contracted services.
3,684.9Funding grants;
Grants to charitable intermediaries.
12,808.7
National Lottery distributors 522.7Grants from National Lottery distributors.
522.7
Voluntary sector Such as trusts and grant-making foundations.
1,258.0Services provided under contract.
1,704.6Grants from charitable trusts, Grants
distributed by charitable intermediaries.
2,962.6
Private sector Excluding payments from charitable foundations set up by businesses.
804.9Sponsorship, Research or consultancy,
Patent royalties.
1,197.6Corporate grants and gifts.
2,002.5
Internally generated Trading subsidiaries and the proceeds from investments.
931.7Gross turnover of trading subsidiaries.
3,184.7 Dividends, Interest payments, Rent from
investment property.
4,116.4
Total 17,413.8 14,899.5 3,184.7 35,497.9
There is a perception among some practitioners and policy-makers that large voluntary organisations are accounting for an ever-increasing share of total voluntary sector income. There is disagreement about whether or not this is necessarily a bad thing (with some concerned about the implications for smaller organisations, and others regarding the whole focus on charity size as unhelpful) but little evidence as to whether or not the big voluntary organisations are, indeed, increasingly dominant in terms of income.
Preliminary analysis by researchers at the TSRC, based on a dataset of charity income from 1995 onwards, suggests that the issue is multi-dimensional. First – when considering those voluntary organisations which have existed for the whole period – there is a key distinction between the overall, ‘year-on-year’ pattern of change, and the ‘dynamics’ underlying this overall pattern: the biggest 10% of organisations, defined on a ‘year-to-year’ basis, are accounting for a growing share of total income; but when examining the ‘dynamics’ of change, by identifying the biggest 10% of voluntary organisations in 1995 and then following these through time, there is evidence that the income share of this group has declined. Second, the formation and dissolution of organisations over the period is a potentially important contributor to trends in income concentration. Third, overall total voluntary sector income has increased: it is possible for the income share of the smallest organisations to decrease over time, and yet for their mean income to have increased.
SEC
TIO
N 2
IN D
EPTH
: TH
E V
OLU
NTA
RY S
ECTO
R
Micro Small Medium Large Major
438
91,067 Micro voluntary organisations between them share £264 million.
Share of total income by size of organisation, 2007/08 (£ billions)
Large and major organisations receive three quarters of the sector’s income. In fact, it is still only the 438 major organisations (0.3%) that shape public perception and control much of the sector’s resources (44%).
Income type by sub-sector, 2006/07 (% of income)
60 8040 100200
26 71 3
17 50 33
31 59 11
36 42 22
48 47 5
51 47 2
53 45 3
54 43 3
58 38 4
58 38 4
60 36 4
65 32 4
66 25 8
81 18 1Employment and training
Housing
Education
Social services
Health
Culture and recreation
Development
Umbrella bodies
Law and advocacy
Environment
Research
Religion
Grant-making foundations
International
Earned Voluntary Investment
u Source: NCVO
The employment and training, housing, and education sub-sectors earn the greatest proportion of their income and are less dependent on grants and donations.1 These three sub-sectors all relate to public service delivery. Only three sub-sectors – international organisations, religious organisations and grant-making foundations – receive the majority of their income through grants and donations.
Investment income is particularly important to research organisations (this includes many of the large research foundations) and grant-making foundations. It is important to note that these figures show the overall picture for each sub-sector, and do not show the wide variety of income sources for individual organisations.
u Source: NCVO, GuideStar Data Services1 See questions 18 and 46 for more analysis of income types.
Question 19…Are major voluntary organisations growing at the expense of smaller ones?
COMM
ENT
Peter Backus and David Clifford, Third Sector Research Centre (TSRC)
Top 10% of organisations share of the sector’s income, 1995 – 2008 (%)
2001
2000
1999
1998
1997
1996
1995
2002
2003
2004
2005
2006
2007
Top decile share (top decile defined each year) Top decile share (top decile defined in 1995)
p Source: TSRC, NCVO, GuideStar Data Services
1.9
6.5
11.3
15.6
0.3
Major voluntary organisations between them share £15.6 billion.
Question 18…What are the sector’s different sources and types of income?
FIN
AN
CE:
TH
E BI
G P
ICTU
RE
Typology of voluntary organisations’ income types and sources, 2007/08 (£ millions) q Source: NCVO
>10% rise in income since 2006/07. Income relatively static since 2006/07. >10% fall in income since 2006/07.
Note: Implementing this approach is not without problems. In particular, the distinction between earned and voluntary income is
open to interpretation, for example in the treatment of performance related grants.
Question 17…How is the voluntary sector’s income distributed?
SNAPSHOT
FOCUS ON
Type
Source
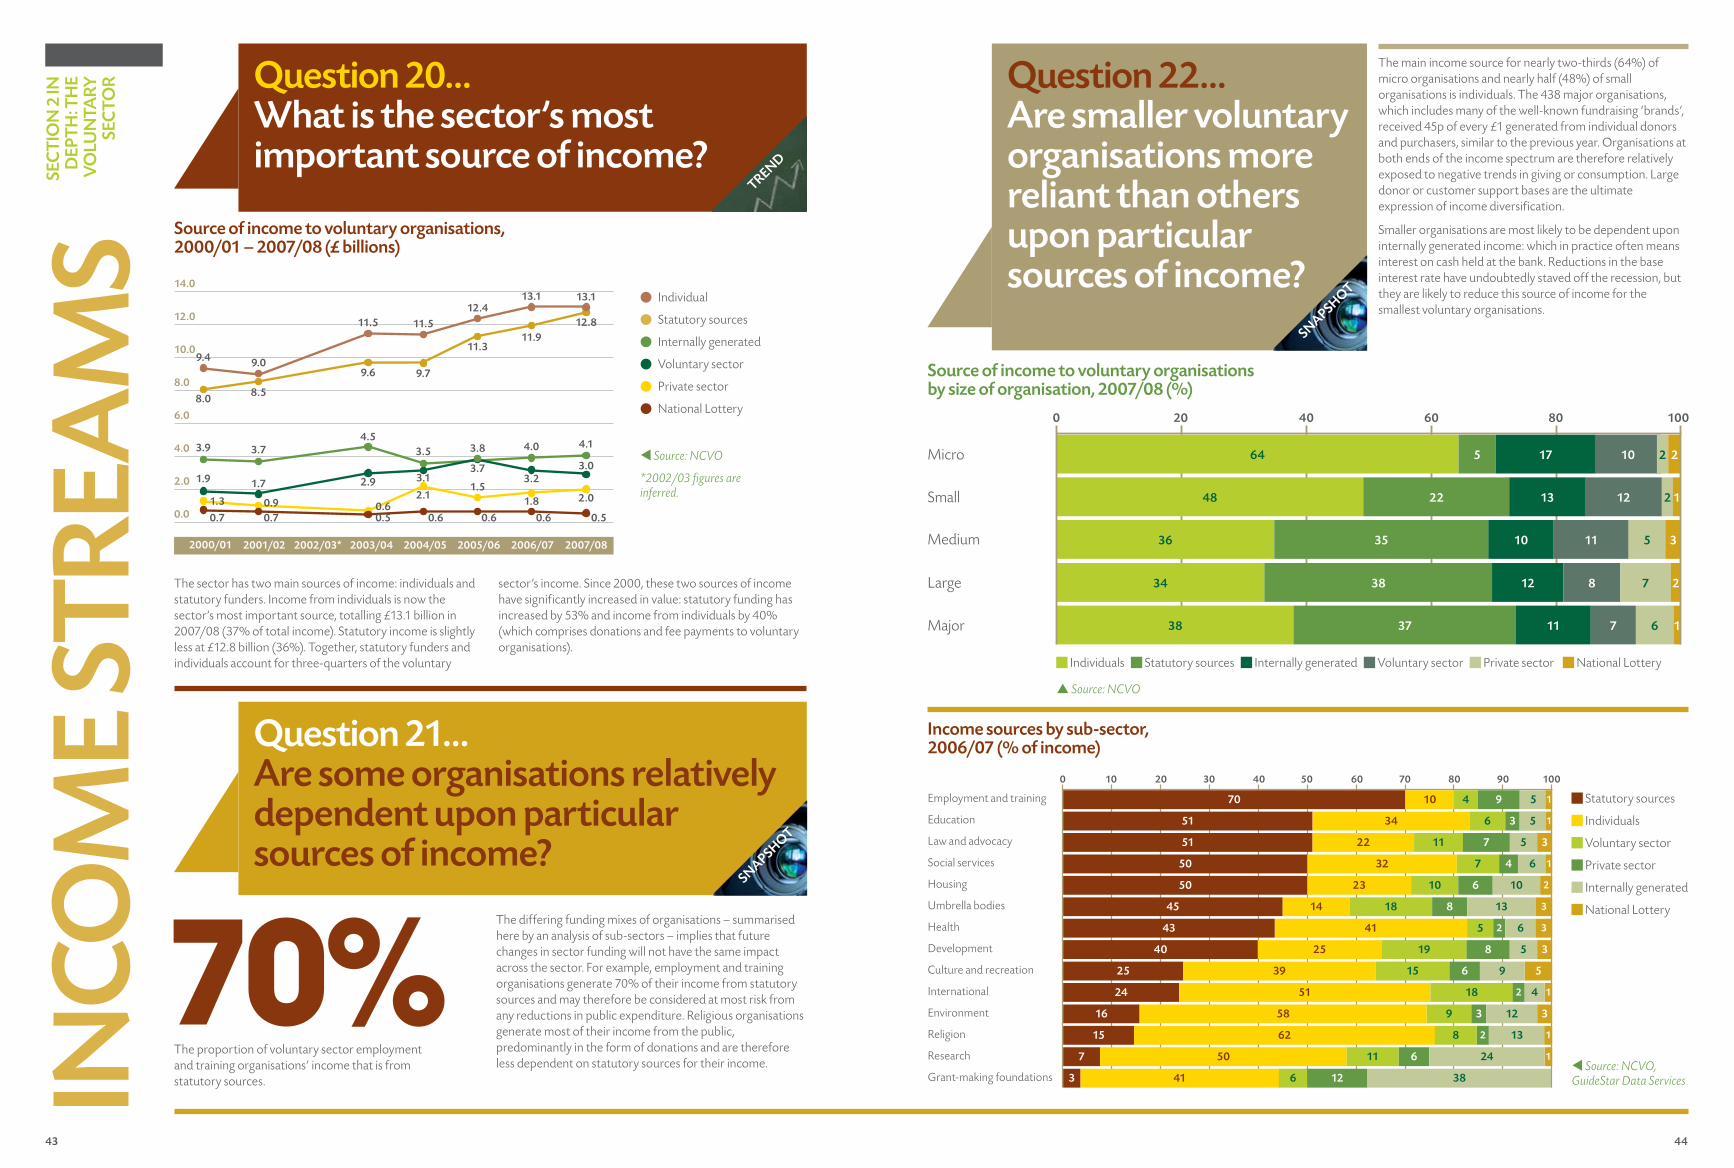
43 44
SEC
TIO
N 2
IN
DEP
TH: T
HE
VO
LUN
TARY
SE
CTO
R Question 20…What is the sector’s most important source of income?
Source of income to voluntary organisations, 2000/01 – 2007/08 (£ billions)
t Source: NCVO
*2002/03 figures are inferred.
The sector has two main sources of income: individuals and statutory funders. Income from individuals is now the sector’s most important source, totalling £13.1 billion in 2007/08 (37% of total income). Statutory income is slightly less at £12.8 billion (36%). Together, statutory funders and individuals account for three-quarters of the voluntary
sector’s income. Since 2000, these two sources of income have significantly increased in value: statutory funding has increased by 53% and income from individuals by 40% (which comprises donations and fee payments to voluntary organisations).
2000/01 2001/02 2002/03* 2003/04 2004/05 2005/06 2006/07 2007/08
0.0
2.0
6.0
8.0
10.0
12.0
14.0
4.0
9.4 9.0
11.5 11.512.4
13.1 13.1
8.0 8.5
9.6 9.7
11.311.9
12.8
3.9 3.7
1.7
0.70.9
1.9
0.7
1.3
4.5
2.9
0.60.5
3.5
3.1
2.1
0.6
3.8
3.7
1.5
0.6
4.0
3.2
1.8
0.6
4.1
3.0
2.0
0.5
Individual
Statutory sources
Internally generated
Voluntary sector
Private sector
National Lottery
TREND
Question 21…Are some organisations relatively dependent upon particular sources of income?
SNAPSHOT
Income sources by sub-sector, 2006/07 (% of income)
The differing funding mixes of organisations – summarised here by an analysis of sub-sectors – implies that future changes in sector funding will not have the same impact across the sector. For example, employment and training organisations generate 70% of their income from statutory sources and may therefore be considered at most risk from any reductions in public expenditure. Religious organisations generate most of their income from the public, predominantly in the form of donations and are therefore less dependent on statutory sources for their income.
70% The proportion of voluntary sector employment and training organisations’ income that is from statutory sources. INCO
ME
STRE
AM
SQuestion 22…Are smaller voluntary organisations more reliant than others upon particular sources of income?
SNAPSHOT
1
3
1
5
30 4020 50100
41 6
7 50
15
16
24
25
40
43
45
50
51
51
Employment and training
Education
Law and advocacy
Social services
Housing
Umbrella bodies
Health
Development
Culture and recreation
International
Environment
Religion
Research
Grant-making foundations
80 9070 10060
70 10 4 9 5 1
34 6 3 5 1
22 11
5
7 5 3
32 7 4 6 1
50 23 10 6 10 2
14 18 8 13 3
41 5 2 6 3
25 19 8 5 3
39 15 6 9
51 18 2 4
958 3 12
62 8 2 13 1
11 6 24
3 12 38t Source: NCVO, GuideStar Data Services
Statutory sources
Individuals
Voluntary sector
Private sector
Internally generated
National Lottery
The main income source for nearly two-thirds (64%) of micro organisations and nearly half (48%) of small organisations is individuals. The 438 major organisations, which includes many of the well-known fundraising ‘brands’, received 45p of every £1 generated from individual donors and purchasers, similar to the previous year. Organisations at both ends of the income spectrum are therefore relatively exposed to negative trends in giving or consumption. Large donor or customer support bases are the ultimate expression of income diversification.
Smaller organisations are most likely to be dependent upon internally generated income: which in practice often means interest on cash held at the bank. Reductions in the base interest rate have undoubtedly staved off the recession, but they are likely to reduce this source of income for the smallest voluntary organisations.
Source of income to voluntary organisations by size of organisation, 2007/08 (%)
p Source: NCVO
Micro
Small
Medium
Large
Major
0
64 5 17 10
20 40 60 80 100
2 2
48 22 13 12 2 1
36 35 10 11 5 3
34 38 12 8 7 2
38 37 11 7 6 1
Individuals Statutory sources Internally generated Voluntary sector Private sector National Lottery
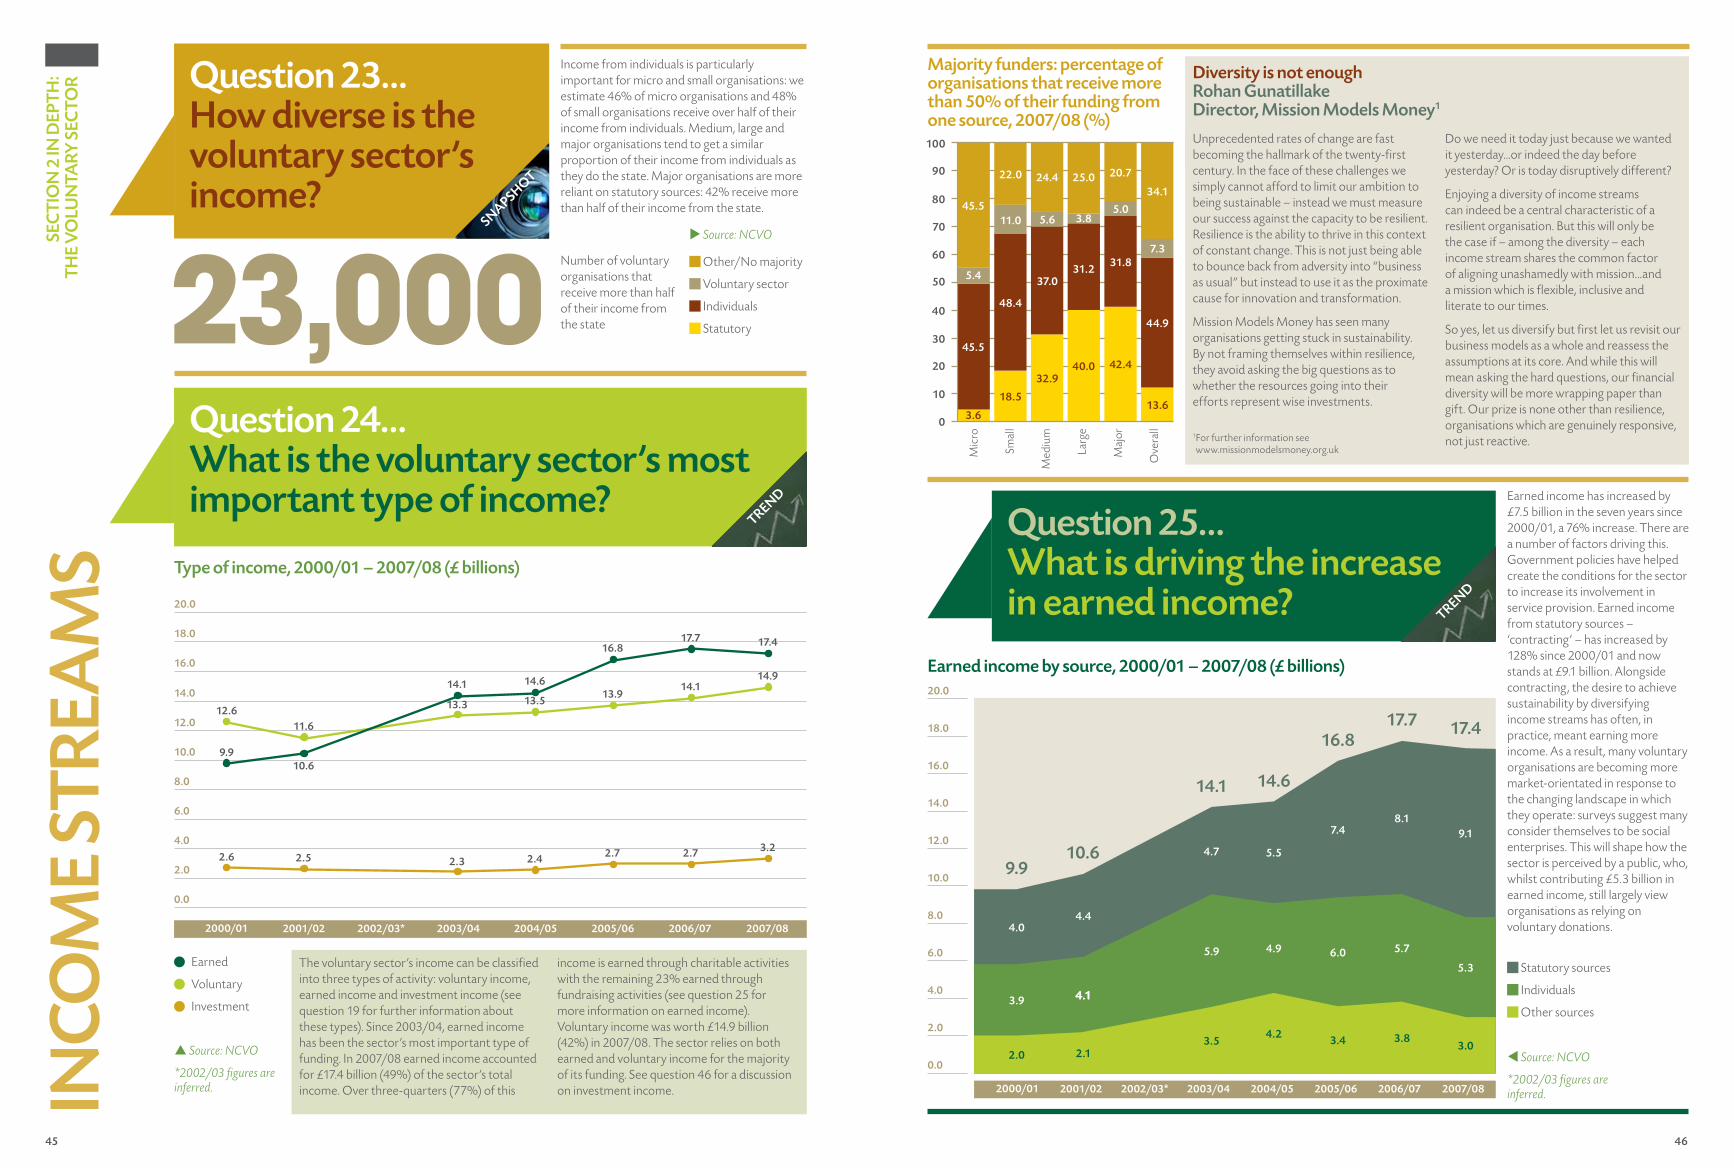
45 46
Question 23…How diverse is the voluntary sector’s income?
Majority funders: percentage of organisations that receive more than 50% of their funding from one source, 2007/08 (%)
Income from individuals is particularly important for micro and small organisations: we estimate 46% of micro organisations and 48% of small organisations receive over half of their income from individuals. Medium, large and major organisations tend to get a similar proportion of their income from individuals as they do the state. Major organisations are more reliant on statutory sources: 42% receive more than half of their income from the state.
SNAPSHOT
23,000 Number of voluntary organisations that receive more than half of their income from the state
u Source: NCVO
Unprecedented rates of change are fast becoming the hallmark of the twenty-first century. In the face of these challenges we simply cannot afford to limit our ambition to being sustainable – instead we must measure our success against the capacity to be resilient. Resilience is the ability to thrive in this context of constant change. This is not just being able to bounce back from adversity into “business as usual” but instead to use it as the proximate cause for innovation and transformation.
Mission Models Money has seen many organisations getting stuck in sustainability. By not framing themselves within resilience, they avoid asking the big questions as to whether the resources going into their efforts represent wise investments.
Do we need it today just because we wanted it yesterday...or indeed the day before yesterday? Or is today disruptively different?
Enjoying a diversity of income streams can indeed be a central characteristic of a resilient organisation. But this will only be the case if – among the diversity – each income stream shares the common factor of aligning unashamedly with mission...and a mission which is flexible, inclusive and literate to our times.
So yes, let us diversify but first let us revisit our business models as a whole and reassess the assumptions at its core. And while this will mean asking the hard questions, our financial diversity will be more wrapping paper than gift. Our prize is none other than resilience, organisations which are genuinely responsive, not just reactive.
SEC
TIO
N 2
IN D
EPTH
: TH
E V
OLU
NTA
RY S
ECTO
RIN
COM
E ST
REA
MS
Diversity is not enough Rohan GunatillakeDirector, Mission Models Money1
Other/No majority
Voluntary sector
Individuals
Statutory
Question 24…What is the voluntary sector’s most important type of income?
Type of income, 2000/01 – 2007/08 (£ billions)
The voluntary sector’s income can be classified into three types of activity: voluntary income, earned income and investment income (see question 19 for further information about these types). Since 2003/04, earned income has been the sector’s most important type of funding. In 2007/08 earned income accounted for £17.4 billion (49%) of the sector’s total income. Over three-quarters (77%) of this
income is earned through charitable activities with the remaining 23% earned through fundraising activities (see question 25 for more information on earned income). Voluntary income was worth £14.9 billion (42%) in 2007/08. The sector relies on both earned and voluntary income for the majority of its funding. See question 46 for a discussion on investment income.
1 For further information see www.missionmodelsmoney.org.ukM
icro
Smal
l
Med
ium
Larg
e
Maj
or
Ove
rall
90
100
80
70
60
50
40
30
20
10
03.6
45.5
5.4
45.5
22.0
11.0
48.4
18.5
24.4
5.6
37.0
32.9
25.0
3.8
31.2
40.0
20.7
5.0
31.8
42.4
34.1
7.3
44.9
13.6
TREND
Earned
Voluntary
Investment
0.0
2.0
6.0
8.0
10.0
12.0
14.0
4.0
16.0
18.0
20.0
2000/01 2001/02 2002/03* 2003/04 2004/05 2005/06 2006/07 2007/08
12.611.6
13.3 13.513.9
14.114.9
9.910.6
14.1 14.6
17.7 17.416.8
2.6 2.5 2.3 2.4 2.7 2.7 3.2
p Source: NCVO
*2002/03 figures are inferred.
Question 25…What is driving the increase in earned income? TREND
Earned income has increased by £7.5 billion in the seven years since 2000/01, a 76% increase. There are a number of factors driving this. Government policies have helped create the conditions for the sector to increase its involvement in service provision. Earned income from statutory sources – ‘contracting’ – has increased by 128% since 2000/01 and now stands at £9.1 billion. Alongside contracting, the desire to achieve sustainability by diversifying income streams has often, in practice, meant earning more income. As a result, many voluntary organisations are becoming more market-orientated in response to the changing landscape in which they operate: surveys suggest many consider themselves to be social enterprises. This will shape how the sector is perceived by a public, who, whilst contributing £5.3 billion in earned income, still largely view organisations as relying on voluntary donations.
Earned income by source, 2000/01 – 2007/08 (£ billions)
6.0
8.0
4.0
0.0
2.0
10.0
12.0
14.0
16.0
18.0
20.0
2000/01 2001/02 2002/03* 2003/04 2004/05 2005/06 2006/07 2007/08
2.0 2.13.5
4.2 3.4 3.83.0
3.9 4.1
5.9 4.9 6.0 5.7
5.3
4.0
4.1
4.4
4.7 5.5
7.48.1
9.1
9.910.6
14.1 14.6
16.817.7 17.4
t Source: NCVO
*2002/03 figures are inferred.
Statutory sources
Individuals
Other sources
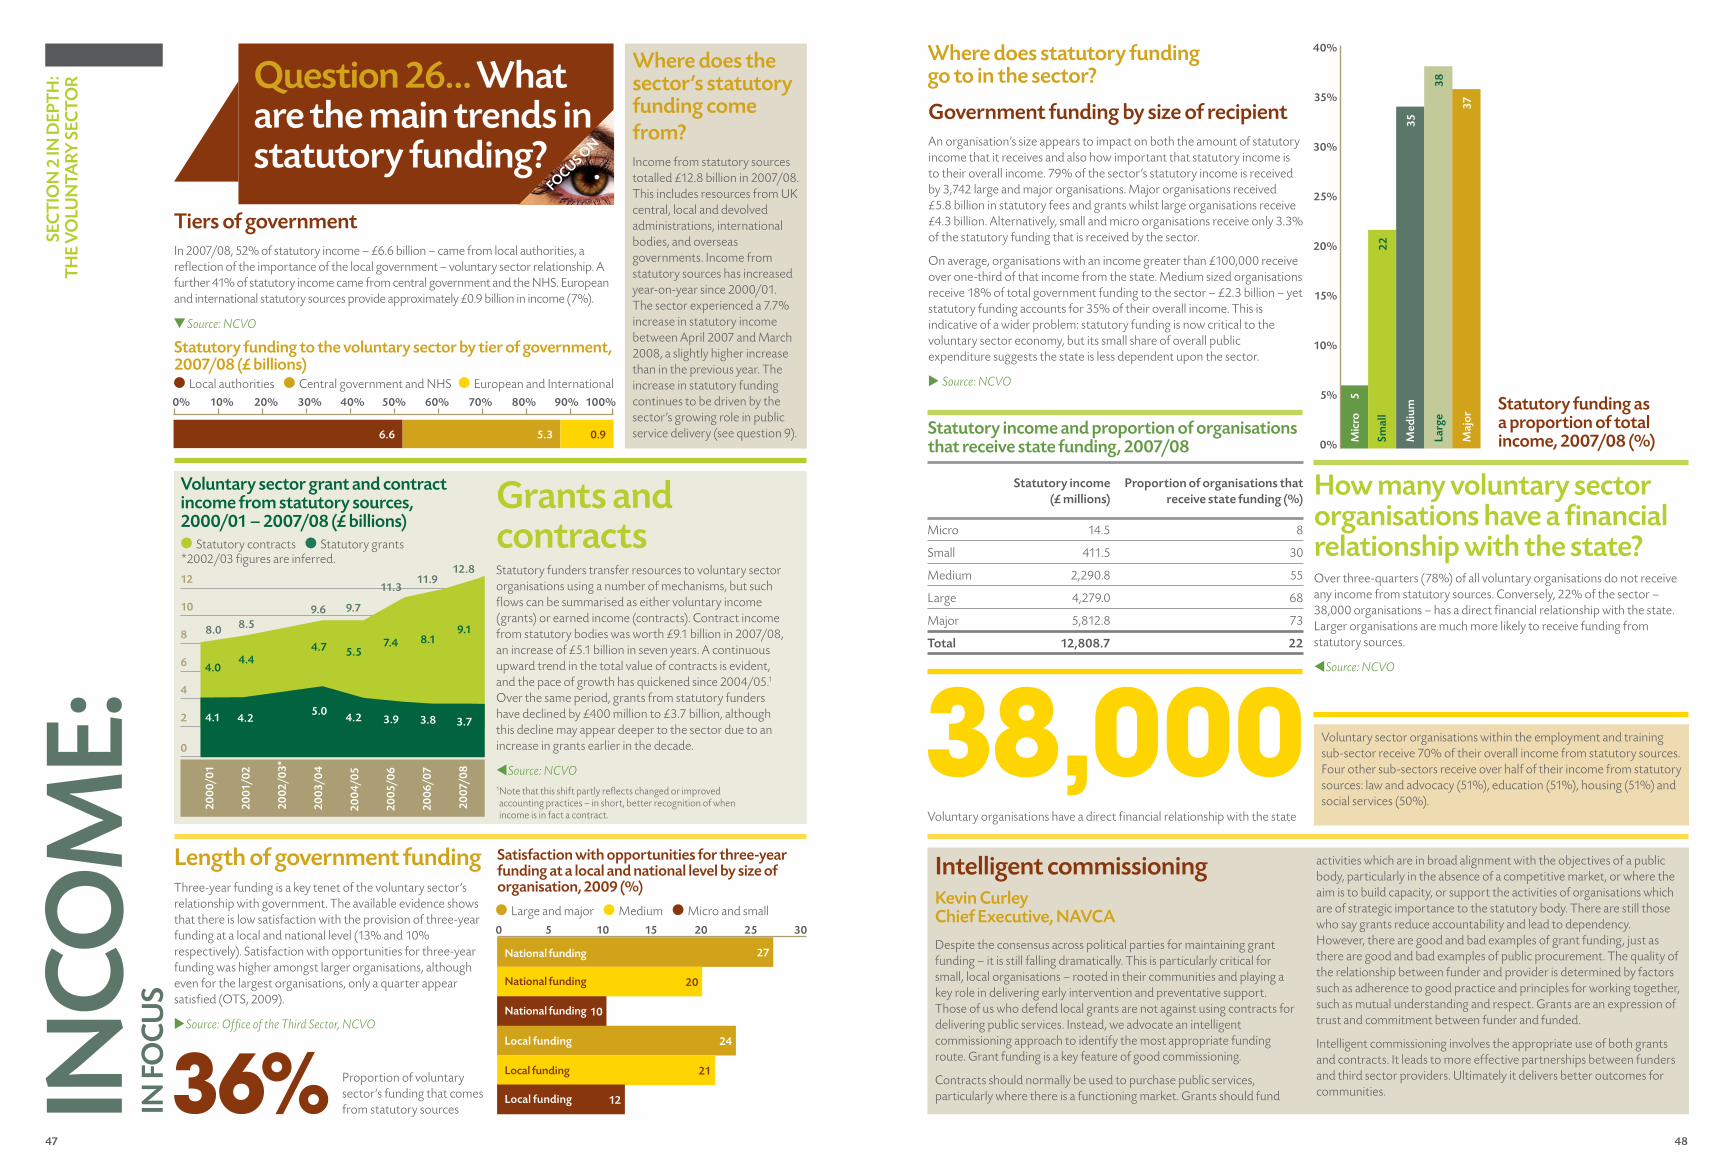
47 48
10
12
0
2
4
6
8
SE
CT
ION
2 IN
DE
PT
H:
TH
E V
OLU
NTA
RY
SE
CT
OR
Intelligent commissioningKevin CurleyChief Executive, NAVCA
Despite the consensus across political parties for maintaining grant funding – it is still falling dramatically. This is particularly critical for small, local organisations – rooted in their communities and playing a key role in delivering early intervention and preventative support. Those of us who defend local grants are not against using contracts for delivering public services. Instead, we advocate an intelligent commissioning approach to identify the most appropriate funding route. Grant funding is a key feature of good commissioning.
Contracts should normally be used to purchase public services, particularly where there is a functioning market. Grants should fund
activities which are in broad alignment with the objectives of a public body, particularly in the absence of a competitive market, or where the aim is to build capacity, or support the activities of organisations which are of strategic importance to the statutory body. There are still those who say grants reduce accountability and lead to dependency. However, there are good and bad examples of grant funding, just as there are good and bad examples of public procurement. The quality of the relationship between funder and provider is determined by factors such as adherence to good practice and principles for working together, such as mutual understanding and respect. Grants are an expression of trust and commitment between funder and funded.
Intelligent commissioning involves the appropriate use of both grants and contracts. It leads to more effective partnerships between funders and third sector providers. Ultimately it delivers better outcomes for communities.
Question 26… What are the main trends in statutory funding?
INC
OM
E:IN
FO
CU
S
Statutory funding to the voluntary sector by tier of government, 2007/08 (£ billions)
6.6 5.3 0.9
50% 60%40% 70% 80%30%20% 90% 100%10%0%
Grants and contracts Statutory funders transfer resources to voluntary sector organisations using a number of mechanisms, but such fl ows can be summarised as either voluntary income (grants) or earned income (contracts). Contract income from statutory bodies was worth £9.1 billion in 2007/08, an increase of £5.1 billion in seven years. A continuous upward trend in the total value of contracts is evident, and the pace of growth has quickened since 2004/05.1 Over the same period, grants from statutory funders have declined by £400 million to £3.7 billion, although this decline may appear deeper to the sector due to an increase in grants earlier in the decade.
Source: NCVO1 Note that this shift partly refl ects changed or improved accounting practices – in short, better recognition of when income is in fact a contract.
Satisfaction with opportunities for three-year funding at a local and national level by size of organisation, 2009 (%)
Length of government fundingThree-year funding is a key tenet of the voluntary sector’s relationship with government. The available evidence shows that there is low satisfaction with the provision of three-year funding at a local and national level (13% and 10% respectively). Satisfaction with opportunities for three-year funding was higher amongst larger organisations, although even for the largest organisations, only a quarter appear satisfi ed (OTS, 2009).
Source: Offi ce of the Third Sector, NCVO
27
20
10
24
21
National funding
National funding
National funding
Local funding
Local funding
0 5 10 15 20 25 30
36% Proportion of voluntary sector’s funding that comes from statutory sources
Where does the sector’s statutory funding come from?Income from statutory sources totalled £12.8 billion in 2007/08. This includes resources from UK central, local and devolved administrations, international bodies, and overseas governments. Income from statutory sources has increased year-on-year since 2000/01. The sector experienced a 7.7% increase in statutory income between April 2007 and March 2008, a slightly higher increase than in the previous year. The increase in statutory funding continues to be driven by the sector’s growing role in public service delivery (see question 9).
Tiers of governmentIn 2007/08, 52% of statutory income – £6.6 billion – came from local authorities, a refl ection of the importance of the local government – voluntary sector relationship. A further 41% of statutory income came from central government and the NHS. European and international statutory sources provide approximately £0.9 billion in income (7%).
Source: NCVO
12Local funding
Large and major Medium Micro and small
Local authorities Central government and NHS European and International
Statutory income
(£ millions)
Proportion of organisations that
receive state funding (%)
Micro 14.5 8
Small 411.5 30
Medium 2,290.8 55
Large 4,279.0 68
Major 5,812.8 73
Total 12,808.7 22
Statutory income and proportion of organisations that receive state funding, 2007/08
Where does statutory funding go to in the sector?
Government funding by size of recipientAn organisation’s size appears to impact on both the amount of statutory income that it receives and also how important that statutory income is to their overall income. 79% of the sector’s statutory income is received by 3,742 large and major organisations. Major organisations received £5.8 billion in statutory fees and grants whilst large organisations receive £4.3 billion. Alternatively, small and micro organisations receive only 3.3% of the statutory funding that is received by the sector.
On average, organisations with an income greater than £100,000 receive over one-third of that income from the state. Medium sized organisations receive 18% of total government funding to the sector – £2.3 billion – yet statutory funding accounts for 35% of their overall income. This is indicative of a wider problem: statutory funding is now critical to the voluntary sector economy, but its small share of overall public expenditure suggests the state is less dependent upon the sector.
Source: NCVO
FOCU
S ON
Statutory funding as a proportion of total income, 2007/08 (%)
How many voluntary sector organisations have a fi nancial relationship with the state?Over three-quarters (78%) of all voluntary organisations do not receive any income from statutory sources. Conversely, 22% of the sector – 38,000 organisations – has a direct fi nancial relationship with the state. Larger organisations are much more likely to receive funding from statutory sources.
Source: NCVO
Voluntary sector organisations within the employment and training sub-sector receive 70% of their overall income from statutory sources. Four other sub-sectors receive over half of their income from statutory sources: law and advocacy (51%), education (51%), housing (51%) and social services (50%).
Voluntary organisations have a direct fi nancial relationship with the state
5
22
35
38
37
Mic
ro
Sm
all
Me
diu
m
La
rge
Ma
jor
40%
Voluntary sector grant and contract income from statutory sources, 2000/01 – 2007/08 (£ billions)
20
06/
07
20
05/
06
20
04/
05
20
03/
04
20
02
/0
3*
20
01/
02
20
00/
01
20
07/
08
Statutory contracts Statutory grants *2002/03 fi gures are inferred.
8.08.5
9.6 9.7
11.311.9
12.8
9.18.17.4
5.54.74.4
4.0
4.1 4.25.0
4.2 3.9 3.8 3.7
0%
5%
10%
15%
20%
25%
30%
35%
38,000
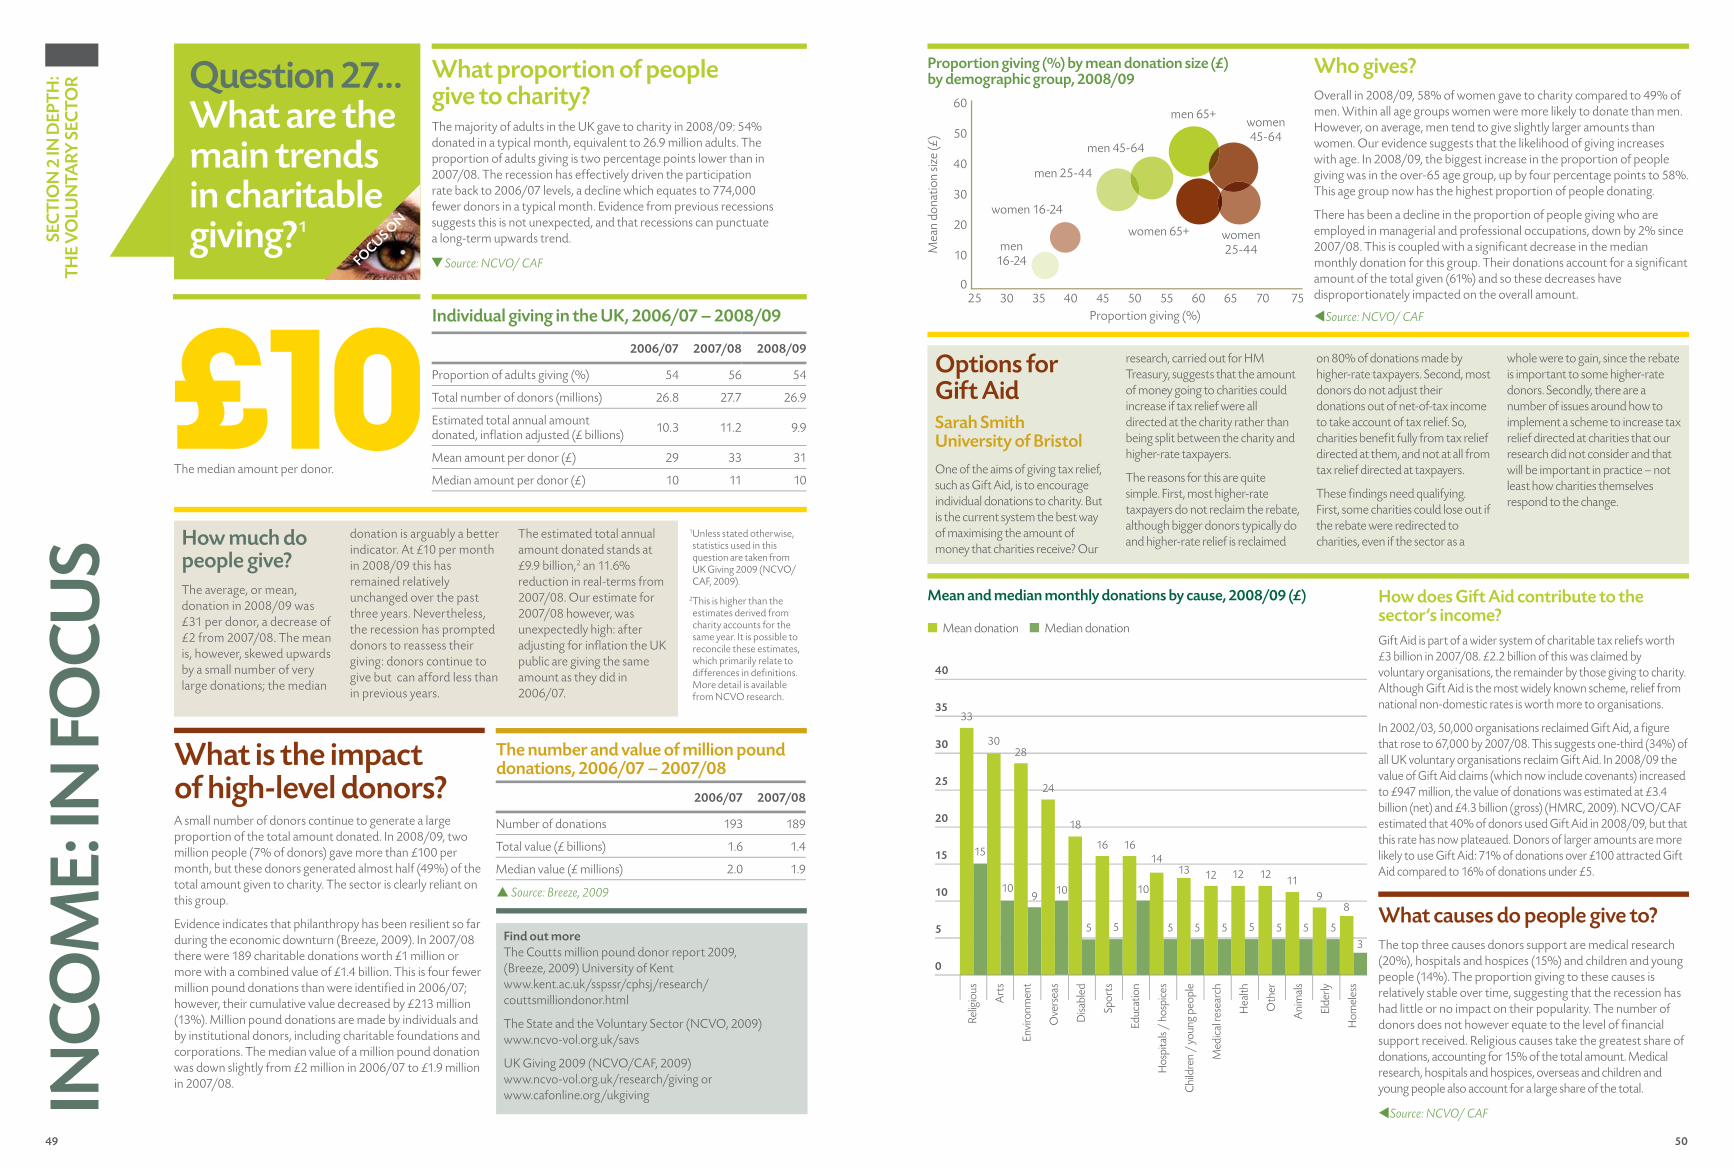
49 50
SEC
TIO
N 2
IN D
EPTH
: TH
E V
OLU
NTA
RY S
ECTO
R Question 27…What are the main trends in charitable giving?1
What proportion of people give to charity?The majority of adults in the UK gave to charity in 2008/09: 54% donated in a typical month, equivalent to 26.9 million adults. The proportion of adults giving is two percentage points lower than in 2007/08. The recession has effectively driven the participation rate back to 2006/07 levels, a decline which equates to 774,000 fewer donors in a typical month. Evidence from previous recessions suggests this is not unexpected, and that recessions can punctuate a long-term upwards trend.
Source: NCVO/ CAFFOCUS ON
INCO
ME:
IN FO
CU
S
How does Gift Aid contribute to the sector’s income?Gift Aid is part of a wider system of charitable tax reliefs worth £3 billion in 2007/08. £2.2 billion of this was claimed by voluntary organisations, the remainder by those giving to charity. Although Gift Aid is the most widely known scheme, relief from national non-domestic rates is worth more to organisations.
In 2002/03, 50,000 organisations reclaimed Gift Aid, a figure that rose to 67,000 by 2007/08. This suggests one-third (34%) of all UK voluntary organisations reclaim Gift Aid. In 2008/09 the value of Gift Aid claims (which now include covenants) increased to £947 million, the value of donations was estimated at £3.4 billion (net) and £4.3 billion (gross) (HMRC, 2009). NCVO/CAF estimated that 40% of donors used Gift Aid in 2008/09, but that this rate has now plateaued. Donors of larger amounts are more likely to use Gift Aid: 71% of donations over £100 attracted Gift Aid compared to 16% of donations under £5.
Find out moreThe Coutts million pound donor report 2009, (Breeze, 2009) University of Kentwww.kent.ac.uk/sspssr/cphsj/research/couttsmilliondonor.html
The State and the Voluntary Sector (NCVO, 2009)www.ncvo-vol.org.uk/savs
UK Giving 2009 (NCVO/CAF, 2009)www.ncvo-vol.org.uk/research/giving or www.cafonline.org/ukgiving
Options for Gift AidSarah SmithUniversity of Bristol
One of the aims of giving tax relief, such as Gift Aid, is to encourage individual donations to charity. But is the current system the best way of maximising the amount of money that charities receive? Our
research, carried out for HM Treasury, suggests that the amount of money going to charities could increase if tax relief were all directed at the charity rather than being split between the charity and higher-rate taxpayers.
The reasons for this are quite simple. First, most higher-rate taxpayers do not reclaim the rebate, although bigger donors typically do and higher-rate relief is reclaimed
on 80% of donations made by higher-rate taxpayers. Second, most donors do not adjust their donations out of net-of-tax income to take account of tax relief. So, charities benefit fully from tax relief directed at them, and not at all from tax relief directed at taxpayers.
These findings need qualifying. First, some charities could lose out if the rebate were redirected to charities, even if the sector as a
whole were to gain, since the rebate is important to some higher-rate donors. Secondly, there are a number of issues around how to implement a scheme to increase tax relief directed at charities that our research did not consider and that will be important in practice – not least how charities themselves respond to the change.
2006/07 2007/08 2008/09
Proportion of adults giving (%) 54 56 54
Total number of donors (millions) 26.8 27.7 26.9
Estimated total annual amountdonated, inflation adjusted (£ billions) 10.3 11.2 9.9
Mean amount per donor (£) 29 33 31
Median amount per donor (£) 10 11 10
Individual giving in the UK, 2006/07 – 2008/09
2006/07 2007/08
Number of donations 193 189
Total value (£ billions) 1.6 1.4
Median value (£ millions) 2.0 1.9
The number and value of million pound donations, 2006/07 – 2007/08 What is the impact
of high-level donors?A small number of donors continue to generate a large proportion of the total amount donated. In 2008/09, two million people (7% of donors) gave more than £100 per month, but these donors generated almost half (49%) of the total amount given to charity. The sector is clearly reliant on this group.
Evidence indicates that philanthropy has been resilient so far during the economic downturn (Breeze, 2009). In 2007/08 there were 189 charitable donations worth £1 million or more with a combined value of £1.4 billion. This is four fewer million pound donations than were identified in 2006/07; however, their cumulative value decreased by £213 million (13%). Million pound donations are made by individuals and by institutional donors, including charitable foundations and corporations. The median value of a million pound donation was down slightly from £2 million in 2006/07 to £1.9 million in 2007/08.
The median amount per donor.
How much do people give?The average, or mean, donation in 2008/09 was £31 per donor, a decrease of £2 from 2007/08. The mean is, however, skewed upwards by a small number of very large donations; the median
donation is arguably a better indicator. At £10 per month in 2008/09 this has remained relatively unchanged over the past three years. Nevertheless, the recession has prompted donors to reassess their giving: donors continue to give but can afford less than in previous years.
The estimated total annual amount donated stands at £9.9 billion,2 an 11.6% reduction in real-terms from 2007/08. Our estimate for 2007/08 however, was unexpectedly high: after adjusting for inflation the UK public are giving the same amount as they did in 2006/07.
Who gives?Overall in 2008/09, 58% of women gave to charity compared to 49% of men. Within all age groups women were more likely to donate than men. However, on average, men tend to give slightly larger amounts than women. Our evidence suggests that the likelihood of giving increases with age. In 2008/09, the biggest increase in the proportion of people giving was in the over-65 age group, up by four percentage points to 58%. This age group now has the highest proportion of people donating.
There has been a decline in the proportion of people giving who are employed in managerial and professional occupations, down by 2% since 2007/08. This is coupled with a significant decrease in the median monthly donation for this group. Their donations account for a significant amount of the total given (61%) and so these decreases have disproportionately impacted on the overall amount.
Source: NCVO/ CAF
Proportion giving (%) by mean donation size (£) by demographic group, 2008/09
Mean and median monthly donations by cause, 2008/09 (£)
£101Unless stated otherwise, statistics used in this question are taken from UK Giving 2009 (NCVO/CAF, 2009).
2This is higher than the estimates derived from charity accounts for the same year. It is possible to reconcile these estimates, which primarily relate to differences in definitions. More detail is available from NCVO research.
p Source: Breeze, 2009
60
50
40
30
20
10
025 30 35 40 45 50 55 60 65 70 75
men 16-24
women 16-24
men 25-44
men 45-64
men 65+women 45-64
women 25-44
women 65+
Proportion giving (%)
Mea
n do
natio
n siz
e (£
)
Relig
ious
Art
s
Envi
ronm
ent
Ove
rsea
s
Disa
bled
Spor
ts
Educ
atio
n
Hos
pita
ls /
hosp
ices
Chi
ldre
n /
youn
g pe
ople
Med
ical
rese
arch
Hea
lth
Oth
er
Ani
mal
s
Elde
rly
Hom
eles
s
40
35
30
25
20
15
5
10
■ Mean donation ■ Median donation
33
3028
24
18
16 1614
13 12 12 12 119
8
35555555
10
55
10910
15
What causes do people give to?The top three causes donors support are medical research (20%), hospitals and hospices (15%) and children and young people (14%). The proportion giving to these causes is relatively stable over time, suggesting that the recession has had little or no impact on their popularity. The number of donors does not however equate to the level of financial support received. Religious causes take the greatest share of donations, accounting for 15% of the total amount. Medical research, hospitals and hospices, overseas and children and young people also account for a large share of the total.
Source: NCVO/ CAF
0
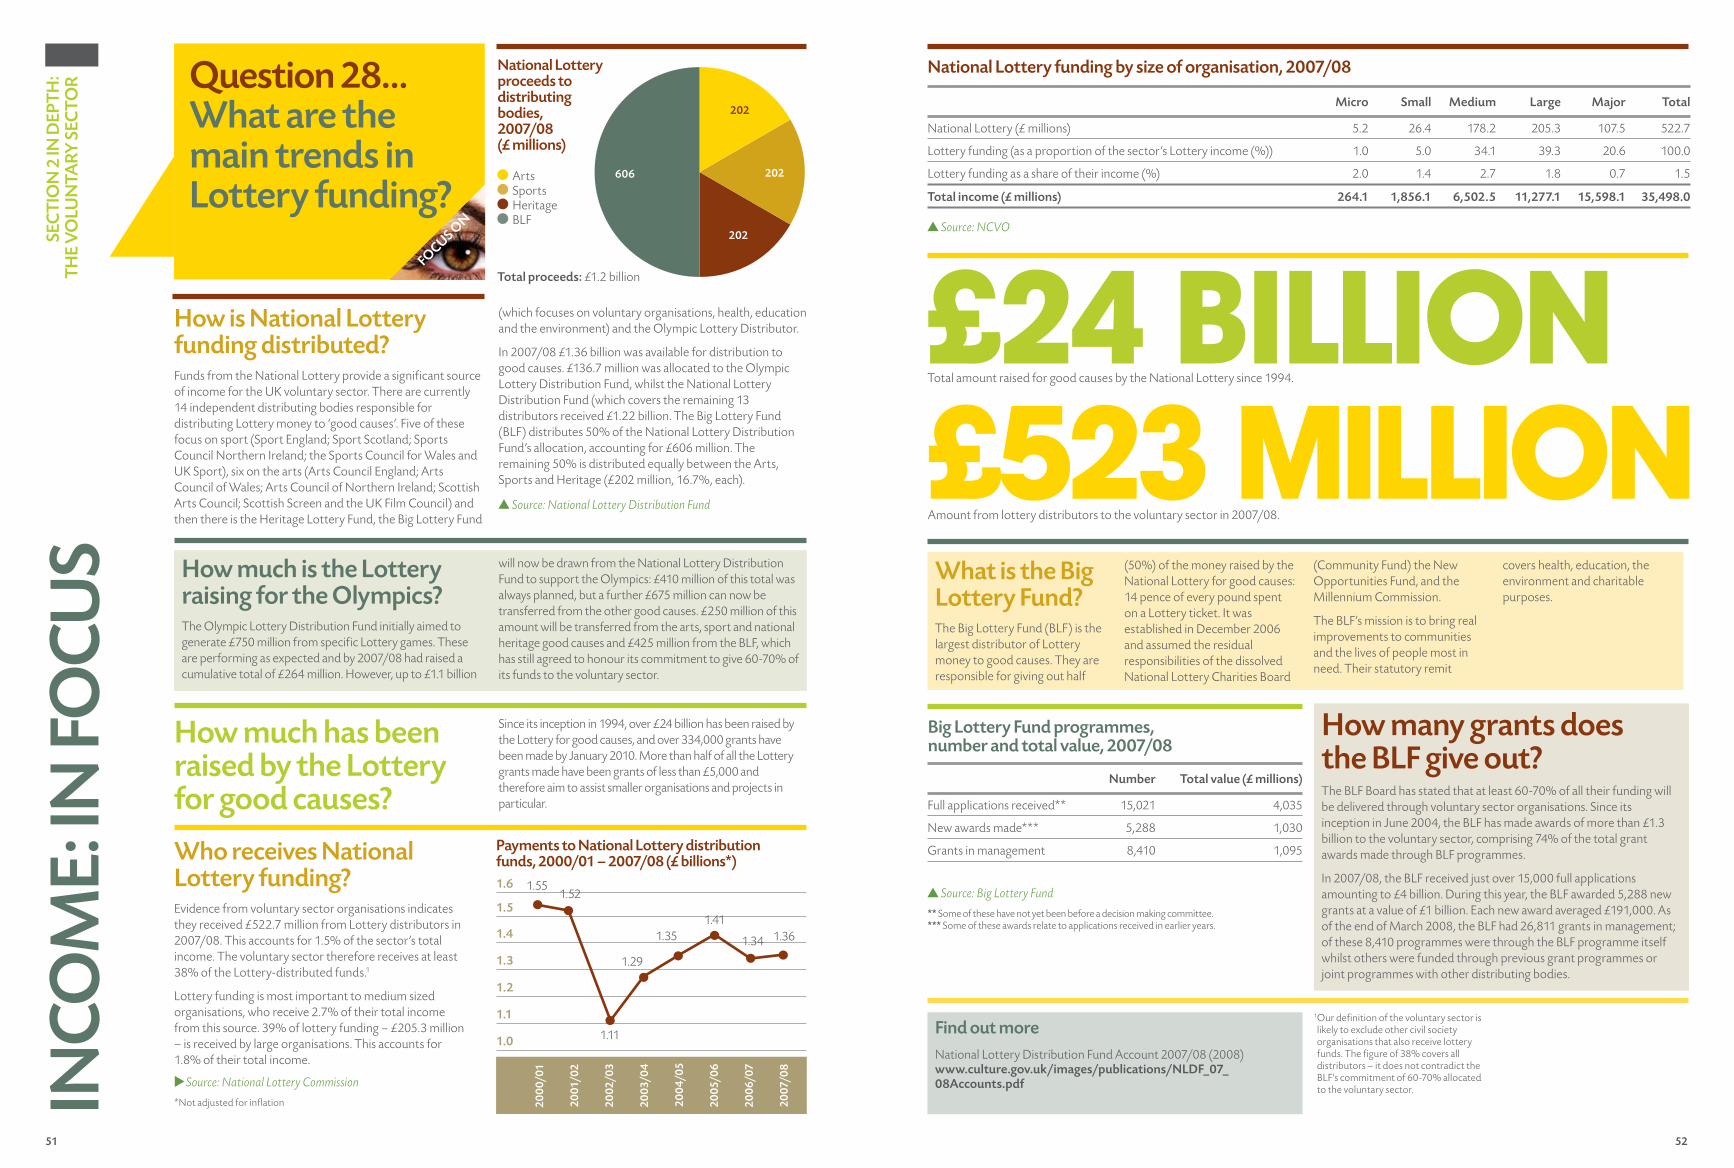
51 52
SEC
TIO
N 2
IN D
EPTH
: TH
E V
OLU
NTA
RY S
ECTO
R Question 28…What are the main trends in Lottery funding?
FOCUS ON
INCO
ME:
IN FO
CU
S
How many grants does the BLF give out? The BLF Board has stated that at least 60-70% of all their funding will be delivered through voluntary sector organisations. Since its inception in June 2004, the BLF has made awards of more than £1.3 billion to the voluntary sector, comprising 74% of the total grant awards made through BLF programmes.
In 2007/08, the BLF received just over 15,000 full applications amounting to £4 billion. During this year, the BLF awarded 5,288 new grants at a value of £1 billion. Each new award averaged £191,000. As of the end of March 2008, the BLF had 26,811 grants in management; of these 8,410 programmes were through the BLF programme itself whilst others were funded through previous grant programmes or joint programmes with other distributing bodies.
Find out moreNational Lottery Distribution Fund Account 2007/08 (2008) www.culture.gov.uk/images/publications/NLDF_07_08Accounts.pdf
Arts Sports Heritage BLF
606
202
202
202
National Lottery proceeds to distributing bodies, 2007/08 (£ millions)
Total proceeds: £1.2 billion
How is National Lottery funding distributed?Funds from the National Lottery provide a significant source of income for the UK voluntary sector. There are currently 14 independent distributing bodies responsible for distributing Lottery money to ‘good causes’. Five of these focus on sport (Sport England; Sport Scotland; Sports Council Northern Ireland; the Sports Council for Wales and UK Sport), six on the arts (Arts Council England; Arts Council of Wales; Arts Council of Northern Ireland; Scottish Arts Council; Scottish Screen and the UK Film Council) and then there is the Heritage Lottery Fund, the Big Lottery Fund
(which focuses on voluntary organisations, health, education and the environment) and the Olympic Lottery Distributor.
In 2007/08 £1.36 billion was available for distribution to good causes. £136.7 million was allocated to the Olympic Lottery Distribution Fund, whilst the National Lottery Distribution Fund (which covers the remaining 13 distributors received £1.22 billion. The Big Lottery Fund (BLF) distributes 50% of the National Lottery Distribution Fund’s allocation, accounting for £606 million. The remaining 50% is distributed equally between the Arts, Sports and Heritage (£202 million, 16.7%, each).
Source: National Lottery Distribution Fund
How much is the Lottery raising for the Olympics? The Olympic Lottery Distribution Fund initially aimed to generate £750 million from specific Lottery games. These are performing as expected and by 2007/08 had raised a cumulative total of £264 million. However, up to £1.1 billion
will now be drawn from the National Lottery Distribution Fund to support the Olympics: £410 million of this total was always planned, but a further £675 million can now be transferred from the other good causes. £250 million of this amount will be transferred from the arts, sport and national heritage good causes and £425 million from the BLF, which has still agreed to honour its commitment to give 60-70% of its funds to the voluntary sector.
How much has been raised by the Lottery for good causes?
Since its inception in 1994, over £24 billion has been raised by the Lottery for good causes, and over 334,000 grants have been made by January 2010. More than half of all the Lottery grants made have been grants of less than £5,000 and therefore aim to assist smaller organisations and projects in particular.
Who receives National Lottery funding?Evidence from voluntary sector organisations indicates they received £522.7 million from Lottery distributors in 2007/08. This accounts for 1.5% of the sector’s total income. The voluntary sector therefore receives at least 38% of the Lottery-distributed funds.1
Lottery funding is most important to medium sized organisations, who receive 2.7% of their total income from this source. 39% of lottery funding – £205.3 million – is received by large organisations. This accounts for 1.8% of their total income.
Source: National Lottery Commission
*Not adjusted for inflation
Payments to National Lottery distribution funds, 2000/01 – 2007/08 (£ billions*)
1.0
1.1
1.2
1.3
1.4
2006
/07
2005
/06
2004
/05
2003
/04
2002
/03
2001
/02
2000
/01
2007
/08
1.5
1.6
National Lottery funding by size of organisation, 2007/08
Micro Small Medium Large Major Total
National Lottery (£ millions) 5.2 26.4 178.2 205.3 107.5 522.7
Lottery funding (as a proportion of the sector’s Lottery income (%)) 1.0 5.0 34.1 39.3 20.6 100.0
Lottery funding as a share of their income (%) 2.0 1.4 2.7 1.8 0.7 1.5
Total income (£ millions) 264.1 1,856.1 6,502.5 11,277.1 15,598.1 35,498.0
Source: NCVO
Number Total value (£ millions)
Full applications received** 15,021 4,035
New awards made*** 5,288 1,030
Grants in management 8,410 1,095
Big Lottery Fund programmes, number and total value, 2007/08
Source: Big Lottery Fund
** Some of these have not yet been before a decision making committee. *** Some of these awards relate to applications received in earlier years.
£523 millionAmount from lottery distributors to the voluntary sector in 2007/08.
£24 billionTotal amount raised for good causes by the National Lottery since 1994.
1 Our definition of the voluntary sector is likely to exclude other civil society organisations that also receive lottery funds. The figure of 38% covers all distributors – it does not contradict the BLF’s commitment of 60-70% allocated to the voluntary sector.
What is the Big Lottery Fund? The Big Lottery Fund (BLF) is the largest distributor of Lottery money to good causes. They are responsible for giving out half
(50%) of the money raised by the National Lottery for good causes: 14 pence of every pound spent on a Lottery ticket. It was established in December 2006 and assumed the residual responsibilities of the dissolved National Lottery Charities Board
(Community Fund) the New Opportunities Fund, and the Millennium Commission.
The BLF’s mission is to bring real improvements to communities and the lives of people most in need. Their statutory remit
covers health, education, the environment and charitable purposes.
1.551.52
1.11
1.29
1.351.41
1.34 1.36
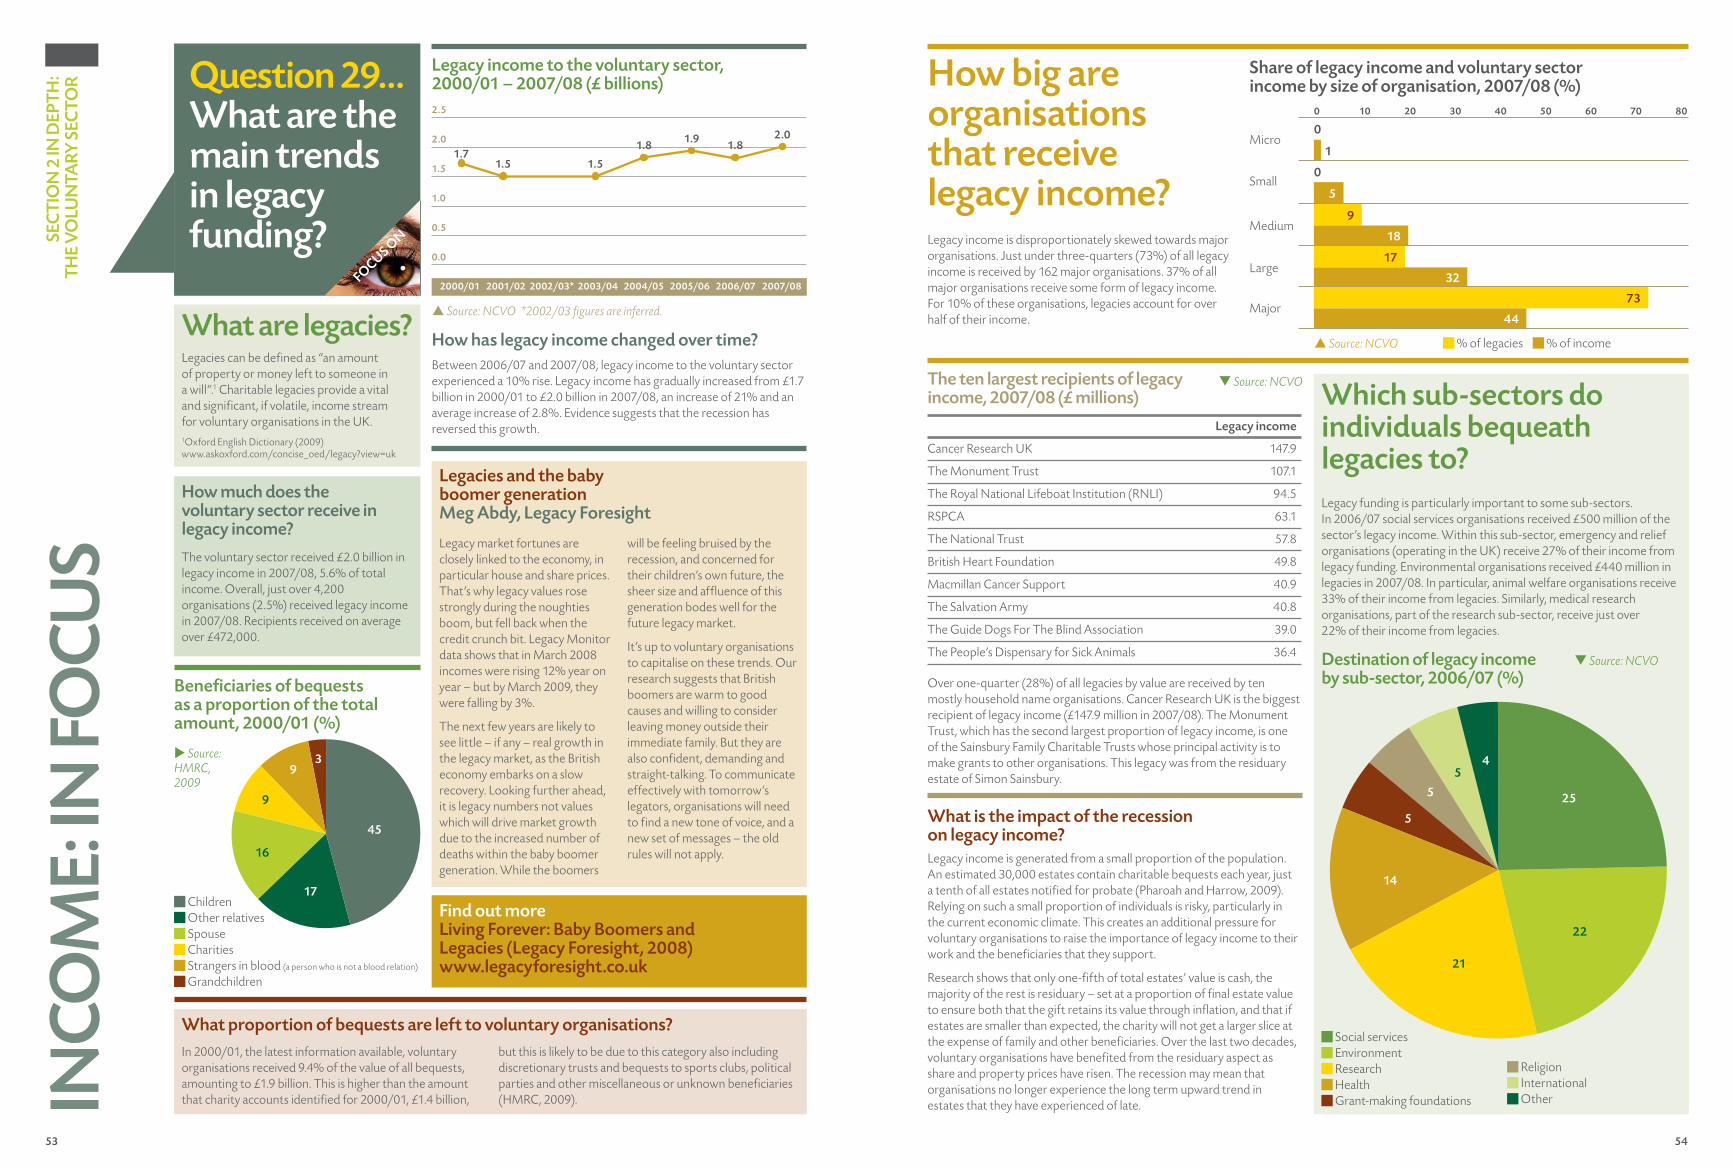
53 54
17
32
73
44
What proportion of bequests are left to voluntary organisations?
Question 29…What are the main trends in legacy funding? S
EC
TIO
N 2
IN D
EP
TH
: T
HE
VO
LUN
TAR
Y S
EC
TO
RIN
CO
ME:
IN F
OC
US
p Source: NCVO *2002/03 fi gures are inferred.
FOCU
S ON
What are legacies? Legacies can be defi ned as “an amount of property or money left to someone in a will”.1 Charitable legacies provide a vital and signifi cant, if volatile, income stream for voluntary organisations in the UK.1Oxford English Dictionary (2009) www.askoxford.com/concise_oed/legacy?view=uk
How much does the voluntary sector receive in legacy income?
The voluntary sector received £2.0 billion in legacy income in 2007/08, 5.6% of total income. Overall, just over 4,200 organisations (2.5%) received legacy income in 2007/08. Recipients received on average over £472,000.
How has legacy income changed over time? Between 2006/07 and 2007/08, legacy income to the voluntary sector experienced a 10% rise. Legacy income has gradually increased from £1.7 billion in 2000/01 to £2.0 billion in 2007/08, an increase of 21% and an average increase of 2.8%. Evidence suggests that the recession has reversed this growth.
Legacy income to the voluntary sector, 2000/01 – 2007/08 (£ billions)
Share of legacy income and voluntary sector income by size of organisation, 2007/08 (%)How big are
organisations that receive legacy income?Legacy income is disproportionately skewed towards major organisations. Just under three-quarters (73%) of all legacy income is received by 162 major organisations. 37% of all major organisations receive some form of legacy income. For 10% of these organisations, legacies account for over half of their income.
Legacy income
Cancer Research UK 147.9
The Monument Trust 107.1
The Royal National Lifeboat Institution (RNLI) 94.5
RSPCA 63.1
The National Trust 57.8
British Heart Foundation 49.8
Macmillan Cancer Support 40.9
The Salvation Army 40.8
The Guide Dogs For The Blind Association 39.0
The People’s Dispensary for Sick Animals 36.4
The ten largest recipients of legacy income, 2007/08 (£ millions) Which sub-sectors do
individuals bequeath legacies to?
Legacy funding is particularly important to some sub-sectors. In 2006/07 social services organisations received £500 million of the sector’s legacy income. Within this sub-sector, emergency and relief organisations (operating in the UK) receive 27% of their income from legacy funding. Environmental organisations received £440 million in legacies in 2007/08. In particular, animal welfare organisations receive 33% of their income from legacies. Similarly, medical research organisations, part of the research sub-sector, receive just over 22% of their income from legacies.
Destination of legacy income by sub-sector, 2006/07 (%)Benefi ciaries of bequests
as a proportion of the total amount, 2000/01 (%)
What is the impact of the recession on legacy income? Legacy income is generated from a small proportion of the population. An estimated 30,000 estates contain charitable bequests each year, just a tenth of all estates notifi ed for probate (Pharoah and Harrow, 2009). Relying on such a small proportion of individuals is risky, particularly in the current economic climate. This creates an additional pressure for voluntary organisations to raise the importance of legacy income to their work and the benefi ciaries that they support.
Research shows that only one-fi fth of total estates’ value is cash, the majority of the rest is residuary – set at a proportion of fi nal estate value to ensure both that the gift retains its value through infl ation, and that if estates are smaller than expected, the charity will not get a larger slice at the expense of family and other benefi ciaries. Over the last two decades, voluntary organisations have benefi ted from the residuary aspect as share and property prices have risen. The recession may mean that organisations no longer experience the long term upward trend in estates that they have experienced of late.
Legacy market fortunes are closely linked to the economy, in particular house and share prices. That’s why legacy values rose strongly during the noughties boom, but fell back when the credit crunch bit. Legacy Monitor data shows that in March 2008 incomes were rising 12% year on year – but by March 2009, they were falling by 3%.
The next few years are likely to see little – if any – real growth in the legacy market, as the British economy embarks on a slow recovery. Looking further ahead, it is legacy numbers not values which will drive market growth due to the increased number of deaths within the baby boomer generation. While the boomers
will be feeling bruised by the recession, and concerned for their children’s own future, the sheer size and affl uence of this generation bodes well for the future legacy market.
It’s up to voluntary organisations to capitalise on these trends. Our research suggests that British boomers are warm to good causes and willing to consider leaving money outside their immediate family. But they are also confi dent, demanding and straight-talking. To communicate effectively with tomorrow’s legators, organisations will need to fi nd a new tone of voice, and a new set of messages – the old rules will not apply.
0.0
0.5
1.5
2.0
2.5
1.0
2003/04 2004/05 2005/06 2006/07 2007/082002/03*2001/022000/01
1.71.5 1.5
1.81.9
1.82.0
Legacies and the baby boomer generationMeg Abdy, Legacy Foresight
Find out moreLiving Forever: Baby Boomers and Legacies (Legacy Foresight, 2008) www.legacyforesight.co.uk
In 2000/01, the latest information available, voluntary organisations received 9.4% of the value of all bequests, amounting to £1.9 billion. This is higher than the amount that charity accounts identifi ed for 2000/01, £1.4 billion,
but this is likely to be due to this category also including discretionary trusts and bequests to sports clubs, political parties and other miscellaneous or unknown benefi ciaries (HMRC, 2009).
u Source: HMRC, 2009
Children Other relatives Spouse Charities Strangers in blood (a person who is not a blood relation)
Grandchildren
5
9
18
0 10 20 30 40 50 60 70 80
Micro
Small
Medium
Large
Major
0
1
0
p Source: NCVO % of legacies % of income
q Source: NCVO
Over one-quarter (28%) of all legacies by value are received by ten mostly household name organisations. Cancer Research UK is the biggest recipient of legacy income (£147.9 million in 2007/08). The Monument Trust, which has the second largest proportion of legacy income, is one of the Sainsbury Family Charitable Trusts whose principal activity is to make grants to other organisations. This legacy was from the residuary estate of Simon Sainsbury.
Social services Environment Research Health Grant-making foundations
Religion International Other
25
22
21
14
5
5
54
q Source: NCVO
45
16
9
9
17
3
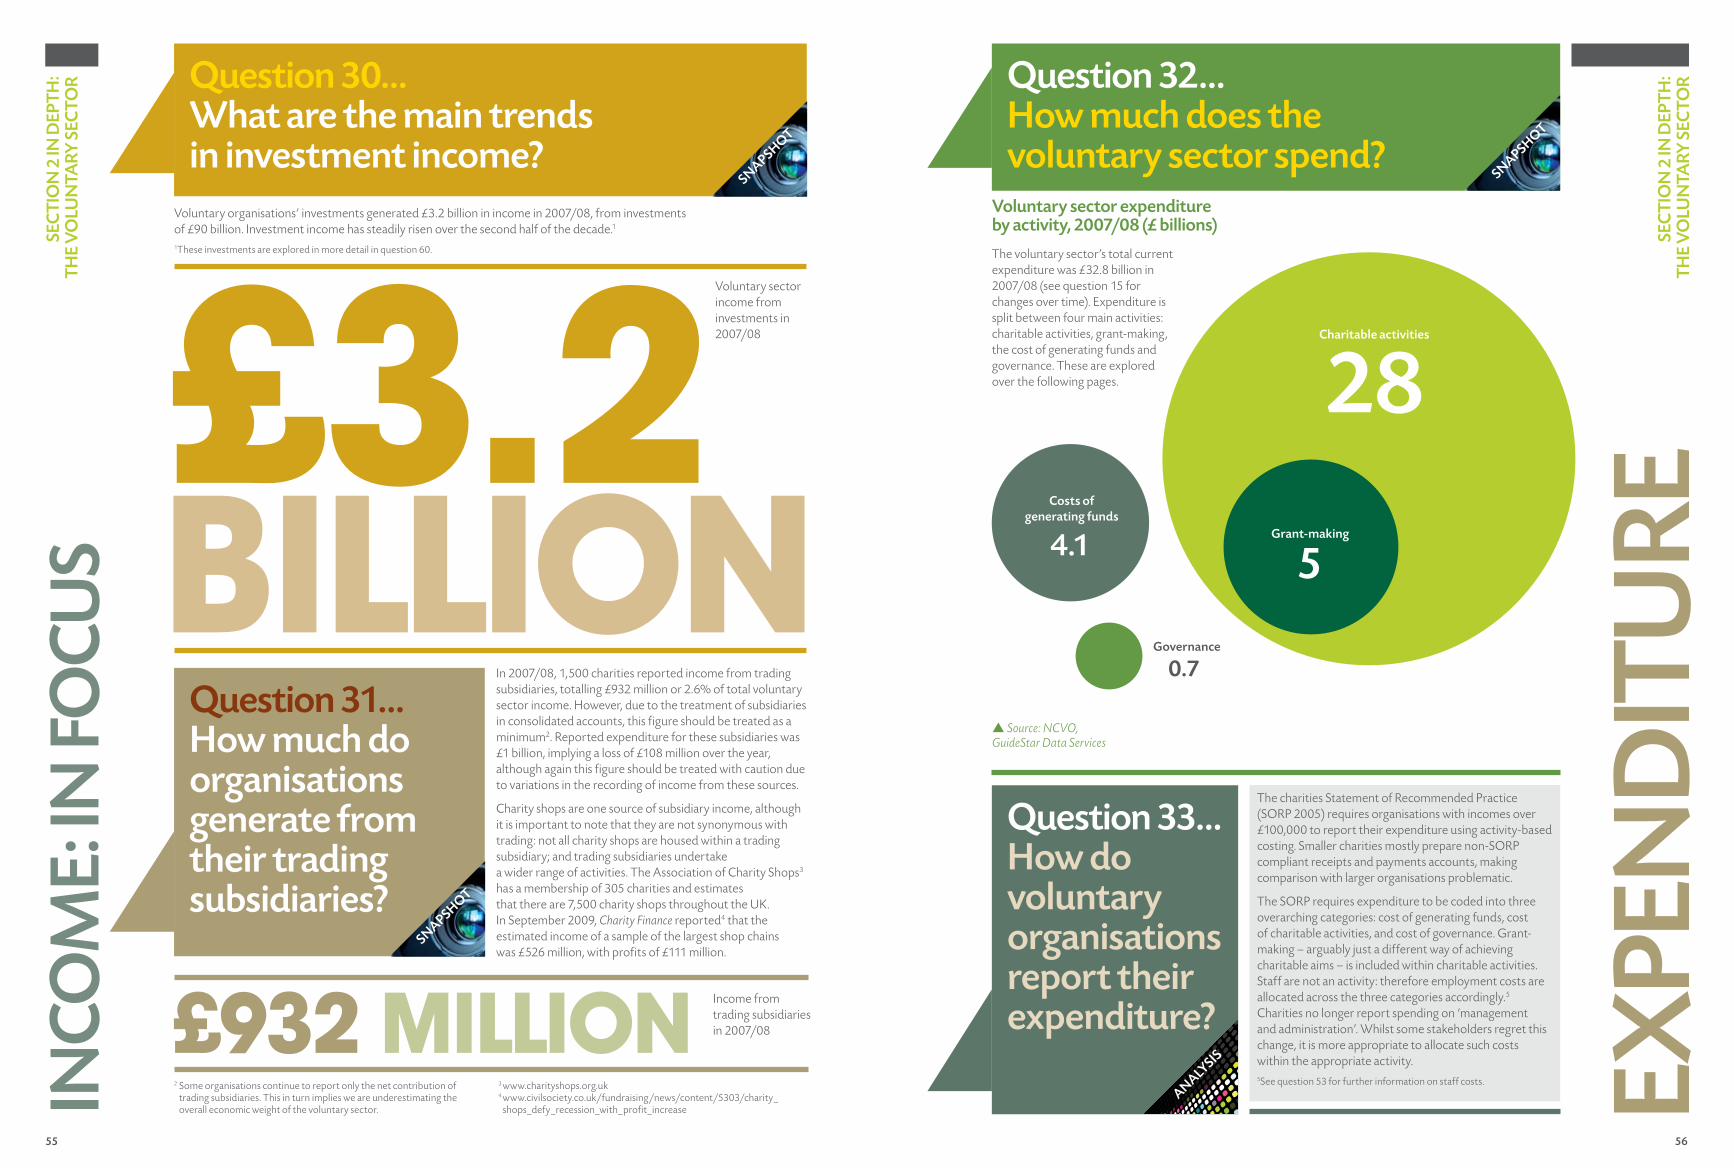
55 56
SEC
TIO
N 2
IN D
EPTH
: TH
E V
OLU
NTA
RY S
ECTO
RIN
COM
E: IN
FOC
US
SEC
TIO
N 2
IN D
EPTH
: TH
E V
OLU
NTA
RY S
ECTO
REx
PEN
DIT
URE
Question 30…What are the main trends in investment income?
SNAPSHOT
Question 31…How much do organisations generate from their trading subsidiaries?
SNAPSHOT
billion
Voluntary organisations’ investments generated £3.2 billion in income in 2007/08, from investments of £90 billion. Investment income has steadily risen over the second half of the decade.1
1These investments are explored in more detail in question 60.
Voluntary sector income from investments in 2007/08
In 2007/08, 1,500 charities reported income from trading subsidiaries, totalling £932 million or 2.6% of total voluntary sector income. However, due to the treatment of subsidiaries in consolidated accounts, this figure should be treated as a minimum2. Reported expenditure for these subsidiaries was £1 billion, implying a loss of £108 million over the year, although again this figure should be treated with caution due to variations in the recording of income from these sources.
Charity shops are one source of subsidiary income, although it is important to note that they are not synonymous with trading: not all charity shops are housed within a trading subsidiary; and trading subsidiaries undertake a wider range of activities. The Association of Charity Shops3 has a membership of 305 charities and estimates that there are 7,500 charity shops throughout the UK. In September 2009, Charity Finance reported4 that the estimated income of a sample of the largest shop chains was £526 million, with profits of £111 million.
£932 million Income from trading subsidiaries in 2007/08
2 Some organisations continue to report only the net contribution of trading subsidiaries. This in turn implies we are underestimating the overall economic weight of the voluntary sector.
3 www.charityshops.org.uk 4 www.civilsociety.co.uk/fundraising/news/content/5303/charity_shops_defy_recession_with_profit_increase
Question 32…How much does the voluntary sector spend?
Voluntary sector expenditure by activity, 2007/08 (£ billions)
The voluntary sector’s total current expenditure was £32.8 billion in 2007/08 (see question 15 for changes over time). Expenditure is split between four main activities: charitable activities, grant-making, the cost of generating funds and governance. These are explored over the following pages.
p Source: NCVO, GuideStar Data Services
The charities Statement of Recommended Practice (SORP 2005) requires organisations with incomes over £100,000 to report their expenditure using activity-based costing. Smaller charities mostly prepare non-SORP compliant receipts and payments accounts, making comparison with larger organisations problematic.
The SORP requires expenditure to be coded into three overarching categories: cost of generating funds, cost of charitable activities, and cost of governance. Grant-making – arguably just a different way of achieving charitable aims – is included within charitable activities. Staff are not an activity: therefore employment costs are allocated across the three categories accordingly.5 Charities no longer report spending on ‘management and administration’. Whilst some stakeholders regret this change, it is more appropriate to allocate such costs within the appropriate activity. 5See question 53 for further information on staff costs.
Question 33…How do voluntary organisations report their expenditure?
SNAPSHOT
ANALYSIS
£3.20.7
Governance
5Grant-making
28Charitable activities
4.1
Costs of generating funds
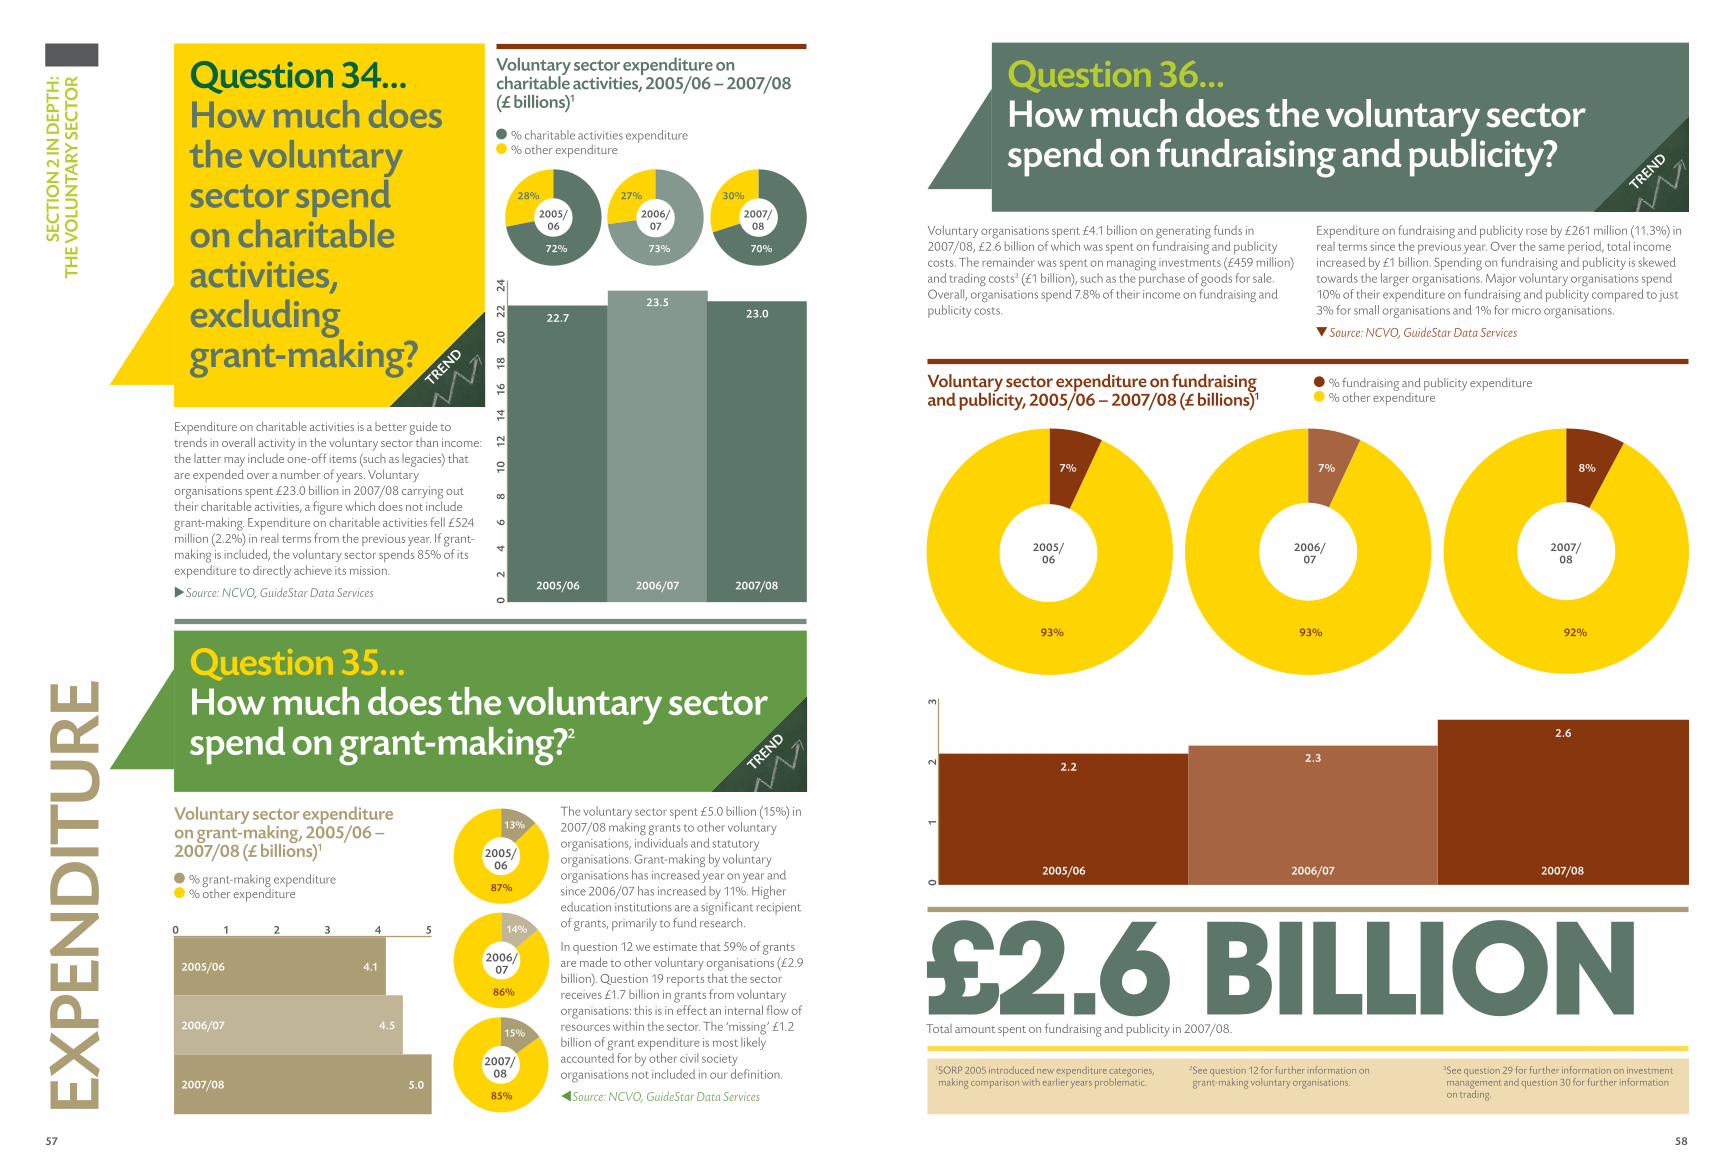
57 58
SE
CT
ION
2 IN
DE
PT
H:
TH
E V
OLU
NTA
RY
SE
CT
OR Question 34…
How much does the voluntary sector spend on charitable activities, excluding grant-making?
EX
PE
ND
ITU
RE
Expenditure on charitable activities is a better guide to trends in overall activity in the voluntary sector than income: the latter may include one-off items (such as legacies) that are expended over a number of years. Voluntary organisations spent £23.0 billion in 2007/08 carrying out their charitable activities, a fi gure which does not include grant-making. Expenditure on charitable activities fell £524 million (2.2%) in real terms from the previous year. If grant-making is included, the voluntary sector spends 85% of its expenditure to directly achieve its mission.
Source: NCVO, GuideStar Data Services
Question 35…How much does the voluntary sector spend on grant-making?2
TREND
TREND
Voluntary sector expenditure on charitable activities, 2005/06 – 2007/08 (£ billions)1
The voluntary sector spent £5.0 billion (15%) in 2007/08 making grants to other voluntary organisations, individuals and statutory organisations. Grant-making by voluntary organisations has increased year on year and since 2006/07 has increased by 11%. Higher education institutions are a signifi cant recipient of grants, primarily to fund research.
In question 12 we estimate that 59% of grants are made to other voluntary organisations (£2.9 billion). Question 19 reports that the sector receives £1.7 billion in grants from voluntary organisations: this is in effect an internal fl ow of resources within the sector. The ‘missing’ £1.2 billion of grant expenditure is most likely accounted for by other civil society organisations not included in our defi nition.
Source: NCVO, GuideStar Data Services
Voluntary sector expenditure on grant-making, 2005/06 – 2007/08 (£ billions)1
Question 36…How much does the voluntary sector spend on fundraising and publicity?
TREND
Voluntary sector expenditure on fundraising and publicity, 2005/06 – 2007/08 (£ billions)1
Voluntary organisations spent £4.1 billion on generating funds in 2007/08, £2.6 billion of which was spent on fundraising and publicity costs. The remainder was spent on managing investments (£459 million) and trading costs3 (£1 billion), such as the purchase of goods for sale. Overall, organisations spend 7.8% of their income on fundraising and publicity costs.
Expenditure on fundraising and publicity rose by £261 million (11.3%) in real terms since the previous year. Over the same period, total income increased by £1 billion. Spending on fundraising and publicity is skewed towards the larger organisations. Major voluntary organisations spend 10% of their expenditure on fundraising and publicity compared to just 3% for small organisations and 1% for micro organisations.
Source: NCVO, GuideStar Data Services
% fundraising and publicity expenditure % other expenditure
% charitable activities expenditure % other expenditure
2007/08
70%
30%
2006/07
73%
27%
72%
2005/06
28%
87%
2005/06
13%
2006/07
86%
14%
2007/08
85%
15%
£2.6 BILLIONTotal amount spent on fundraising and publicity in 2007/08.
2005/06
93%
7%
93%
7%
2006/07
2007/08
92%
8%
0 1 2 3 4 5
5.02007/08
4.12005/06
4.52006/07
01
41
61
82
02
22
41
21
06
42
8
% grant-making expenditure % other expenditure
1 SORP 2005 introduced new expenditure categories, making comparison with earlier years problematic.
2 See question 12 for further information on grant-making voluntary organisations.
3 See question 29 for further information on investment management and question 30 for further information on trading.
01
23
22.7
23.523.0
2005/06 2006/07 2007/08
2.2
2005/06
2.3
2006/07
2.6
2007/08
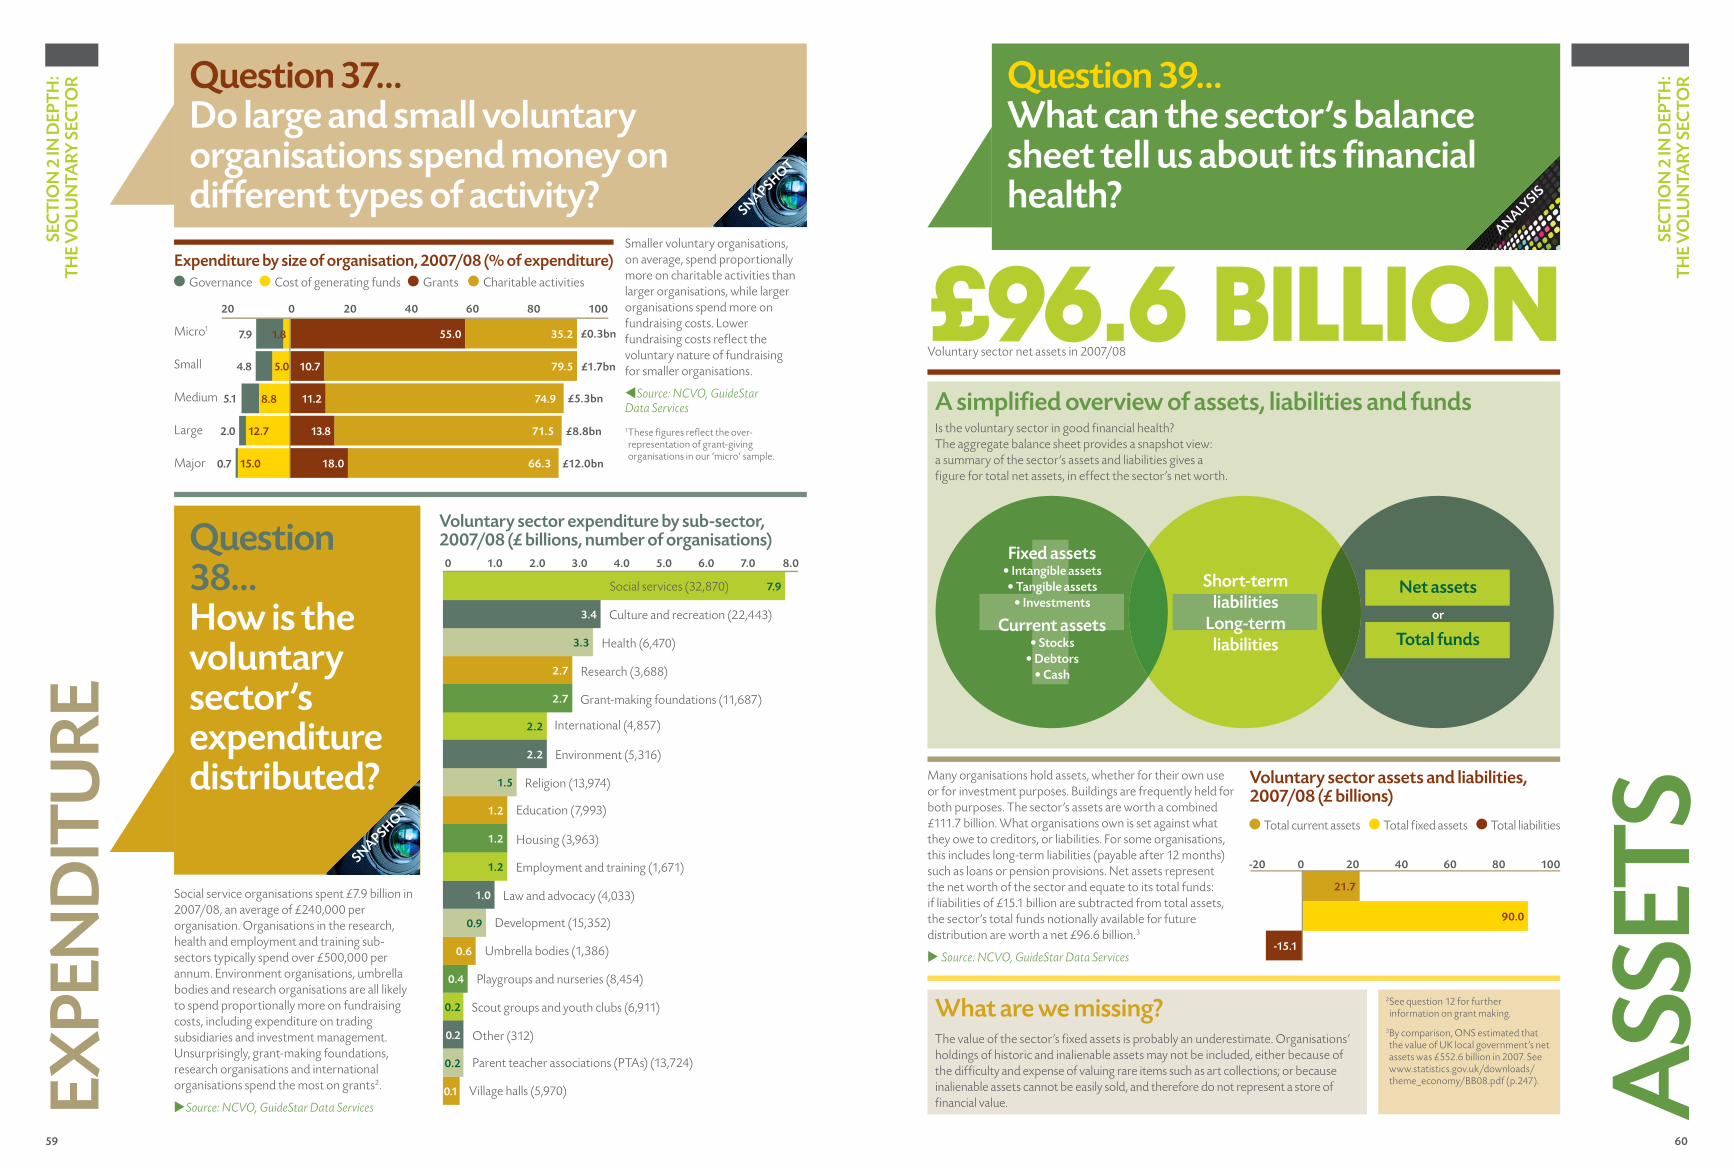
59 60
0.1
0.2
0.4
0.6
0.9
1.0
1.2
1.2
1.5
2.2
2.7
3.3
3.4
SE
CT
ION
2 IN
DE
PT
H:
TH
E V
OLU
NTA
RY
SE
CT
OR
EX
PE
ND
ITU
RE
Question 38…How is the voluntary sector’s expenditure distributed?
SE
CT
ION
2 IN
DE
PT
H:
TH
E V
OLU
NTA
RY
SE
CT
OR
ASS
ETS
Question 39…What can the sector’s balance sheet tell us about its fi nancial health?
ANALY
SIS
£96.6 BILLION Voluntary sector net assets in 2007/08
Is the voluntary sector in good fi nancial health? The aggregate balance sheet provides a snapshot view: a summary of the sector’s assets and liabilities gives a fi gure for total net assets, in effect the sector’s net worth.
A simplifi ed overview of assets, liabilities and funds
Short-term liabilities
Long-term liabilities
Fixed assets• Intangible assets
• Tangible assets
• Investments
Current assets• Stocks
• Debtors
• Cash
Net assets
or
Total funds
Many organisations hold assets, whether for their own use or for investment purposes. Buildings are frequently held for both purposes. The sector’s assets are worth a combined £111.7 billion. What organisations own is set against what they owe to creditors, or liabilities. For some organisations, this includes long-term liabilities (payable after 12 months) such as loans or pension provisions. Net assets represent the net worth of the sector and equate to its total funds: if liabilities of £15.1 billion are subtracted from total assets, the sector’s total funds notionally available for future distribution are worth a net £96.6 billion.3
Source: NCVO, GuideStar Data Services
Voluntary sector assets and liabilities, 2007/08 (£ billions)
2 See question 12 for further information on grant making.
3 By comparison, ONS estimated that the value of UK local government’s net assets was £552.6 billion in 2007. See www.statistics.gov.uk/downloads/theme_economy/BB08.pdf (p.247).
Total current assets Total fi xed assets Total liabilities
21.7
90.0
-15.1
-20 0 20 40 60 80 100
What are we missing? The value of the sector’s fi xed assets is probably an underestimate. Organisations’ holdings of historic and inalienable assets may not be included, either because of the diffi culty and expense of valuing rare items such as art collections; or because inalienable assets cannot be easily sold, and therefore do not represent a store of fi nancial value.
Question 37…Do large and small voluntary organisations spend money on different types of activity?
SNAPSH
OT
Expenditure by size of organisation, 2007/08 (% of expenditure)Smaller voluntary organisations, on average, spend proportionally more on charitable activities than larger organisations, while larger organisations spend more on fundraising costs. Lower fundraising costs refl ect the voluntary nature of fundraising for smaller organisations.
Source: NCVO, GuideStar Data Services
0.2
0.2
7.9
2.7
0 2.0 3.0 4.0 8.05.0 6.0 7.0
2.2
1.2
1.0
Social services (32,870)
Health (6,470)
Research (3,688)
Grant-making foundations (11,687)
International (4,857)
Environment (5,316)
Religion (13,974)
Education (7,993)
Housing (3,963)
Employment and training (1,671)
Law and advocacy (4,033)
Development (15,352)
Umbrella bodies (1,386)
Playgroups and nurseries (8,454)
Scout groups and youth clubs (6,911)
Other (312)
Parent teacher associations (PTAs) (13,724)
Village halls (5,970)
Culture and recreation (22,443)
Voluntary sector expenditure by sub-sector, 2007/08 (£ billions, number of organisations)
Social service organisations spent £7.9 billion in 2007/08, an average of £240,000 per organisation. Organisations in the research, health and employment and training sub-sectors typically spend over £500,000 per annum. Environment organisations, umbrella bodies and research organisations are all likely to spend proportionally more on fundraising costs, including expenditure on trading subsidiaries and investment management. Unsurprisingly, grant-making foundations, research organisations and international organisations spend the most on grants2.
Source: NCVO, GuideStar Data Services
SNAPSH
OT
20 0 20 40 60 80 100
Governance Cost of generating funds Grants Charitable activities
Micro1
Small
Medium
Large
Major
1 These fi gures refl ect the over-representation of grant-giving organisations in our ‘micro’ sample.
55.0 35.2
10.7 79.5
11.2 74.9
13.8 71.5
18.0 66.3
5.0
8.8
12.7
15.00.7
2.0
5.1
4.8
7.9 1.8
£12.0bn
£8.8bn
£5.3bn
£1.7bn
£0.3bn
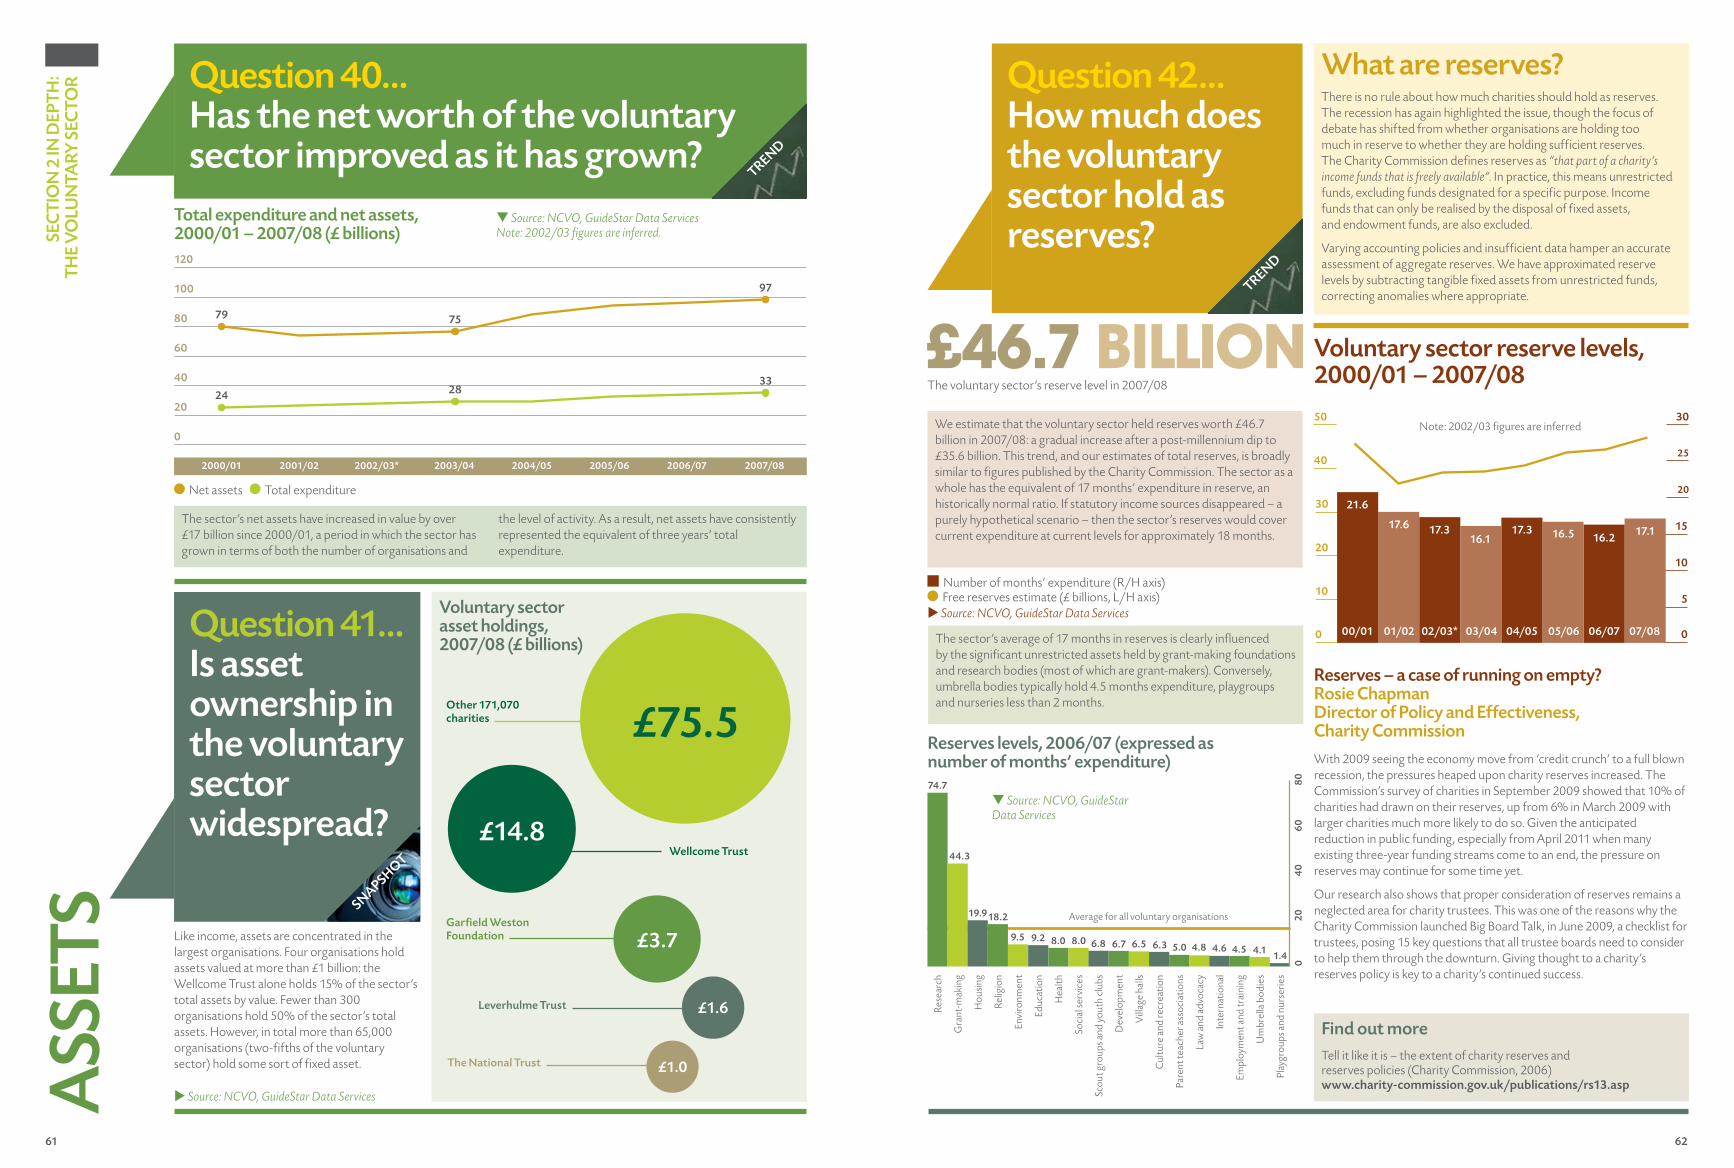
61 62
£46.7 billionThe voluntary sector’s reserve level in 2007/08
What are reserves?There is no rule about how much charities should hold as reserves. The recession has again highlighted the issue, though the focus of debate has shifted from whether organisations are holding too much in reserve to whether they are holding sufficient reserves. The Charity Commission defines reserves as “that part of a charity’s income funds that is freely available”. In practice, this means unrestricted funds, excluding funds designated for a specific purpose. Income funds that can only be realised by the disposal of fixed assets, and endowment funds, are also excluded.
Varying accounting policies and insufficient data hamper an accurate assessment of aggregate reserves. We have approximated reserve levels by subtracting tangible fixed assets from unrestricted funds, correcting anomalies where appropriate.
We estimate that the voluntary sector held reserves worth £46.7 billion in 2007/08: a gradual increase after a post-millennium dip to £35.6 billion. This trend, and our estimates of total reserves, is broadly similar to figures published by the Charity Commission. The sector as a whole has the equivalent of 17 months’ expenditure in reserve, an historically normal ratio. If statutory income sources disappeared – a purely hypothetical scenario – then the sector’s reserves would cover current expenditure at current levels for approximately 18 months.
Reserves levels, 2006/07 (expressed as number of months’ expenditure)
SEC
TIO
N 2
IN D
EPTH
: TH
E V
OLU
NTA
RY S
ECTO
RA
SSET
SQuestion 40…Has the net worth of the voluntary sector improved as it has grown?
TREND
Question 41…Is asset ownership in the voluntary sector widespread?
SNAPSHOT
u Source: NCVO, GuideStar Data Services
Like income, assets are concentrated in the largest organisations. Four organisations hold assets valued at more than £1 billion: the Wellcome Trust alone holds 15% of the sector’s total assets by value. Fewer than 300 organisations hold 50% of the sector’s total assets. However, in total more than 65,000 organisations (two-fifths of the voluntary sector) hold some sort of fixed asset.
Question 42…How much does the voluntary sector hold as reserves?
TREND
q Source: NCVO, GuideStar Data Services
The sector’s average of 17 months in reserves is clearly influenced by the significant unrestricted assets held by grant-making foundations and research bodies (most of which are grant-makers). Conversely, umbrella bodies typically hold 4.5 months expenditure, playgroups and nurseries less than 2 months.
Find out moreTell it like it is – the extent of charity reserves and reserves policies (Charity Commission, 2006) www.charity-commission.gov.uk/publications/rs13.asp
0
20
60
80
100
40
2003/04 2004/05 2005/06 2006/07 2007/082002/03*2001/022000/01
79
120
The sector’s net assets have increased in value by over £17 billion since 2000/01, a period in which the sector has grown in terms of both the number of organisations and
the level of activity. As a result, net assets have consistently represented the equivalent of three years’ total expenditure.
Total expenditure and net assets, 2000/01 – 2007/08 (£ billions)
q Source: NCVO, GuideStar Data Services Note: 2002/03 figures are inferred.
97
75
2433
28
Net assets Total expenditure
Voluntary sector reserve levels, 2000/01 – 2007/08
Number of months’ expenditure (R/H axis) Free reserves estimate (£ billions, L/H axis) u Source: NCVO, GuideStar Data Services
Rese
arch
Gra
nt-m
akin
g
Hou
sing
Relig
ion
Envi
ronm
ent
Educ
atio
n
Hea
lth
Soci
al se
rvic
es
Dev
elop
men
t
Vill
age
halls
Law
and
adv
ocac
y
Inte
rnat
iona
l
Empl
oym
ent a
nd tr
aini
ng
Um
brel
la b
odie
s
Play
grou
ps a
nd n
urse
ries
Voluntary sector asset holdings, 2007/08 (£ billions)
Garfield Weston Foundation
Leverhulme Trust
The National Trust
Other 171,070 charities
Wellcome Trust
£75.5
£14.8
£3.7
£1.6
£1.0
0
20
10
30
40
50
0
5
10
15
20
30
25
Note: 2002/03 figures are inferred
21.6
17.6 17.316.1
17.3 16.5 16.2 17.1
00/01 01/02 02/03* 03/04 04/05 05/06 06/07 07/08
Reserves – a case of running on empty? Rosie Chapman Director of Policy and Effectiveness, Charity Commission
With 2009 seeing the economy move from ‘credit crunch’ to a full blown recession, the pressures heaped upon charity reserves increased. The Commission’s survey of charities in September 2009 showed that 10% of charities had drawn on their reserves, up from 6% in March 2009 with larger charities much more likely to do so. Given the anticipated reduction in public funding, especially from April 2011 when many existing three-year funding streams come to an end, the pressure on reserves may continue for some time yet.
Our research also shows that proper consideration of reserves remains a neglected area for charity trustees. This was one of the reasons why the Charity Commission launched Big Board Talk, in June 2009, a checklist for trustees, posing 15 key questions that all trustee boards need to consider to help them through the downturn. Giving thought to a charity’s reserves policy is key to a charity’s continued success.
Scou
t gro
ups a
nd y
outh
clu
bs
Cul
ture
and
recr
eatio
n
Pare
nt te
ache
r ass
ocia
tions
80
020
40
60
Average for all voluntary organisations
74.7
44.3
19.918.2
9.5 9.2 8.0 8.0 6.8 6.7 6.5 6.3 5.0 4.8 4.6 4.5 4.1 1.4
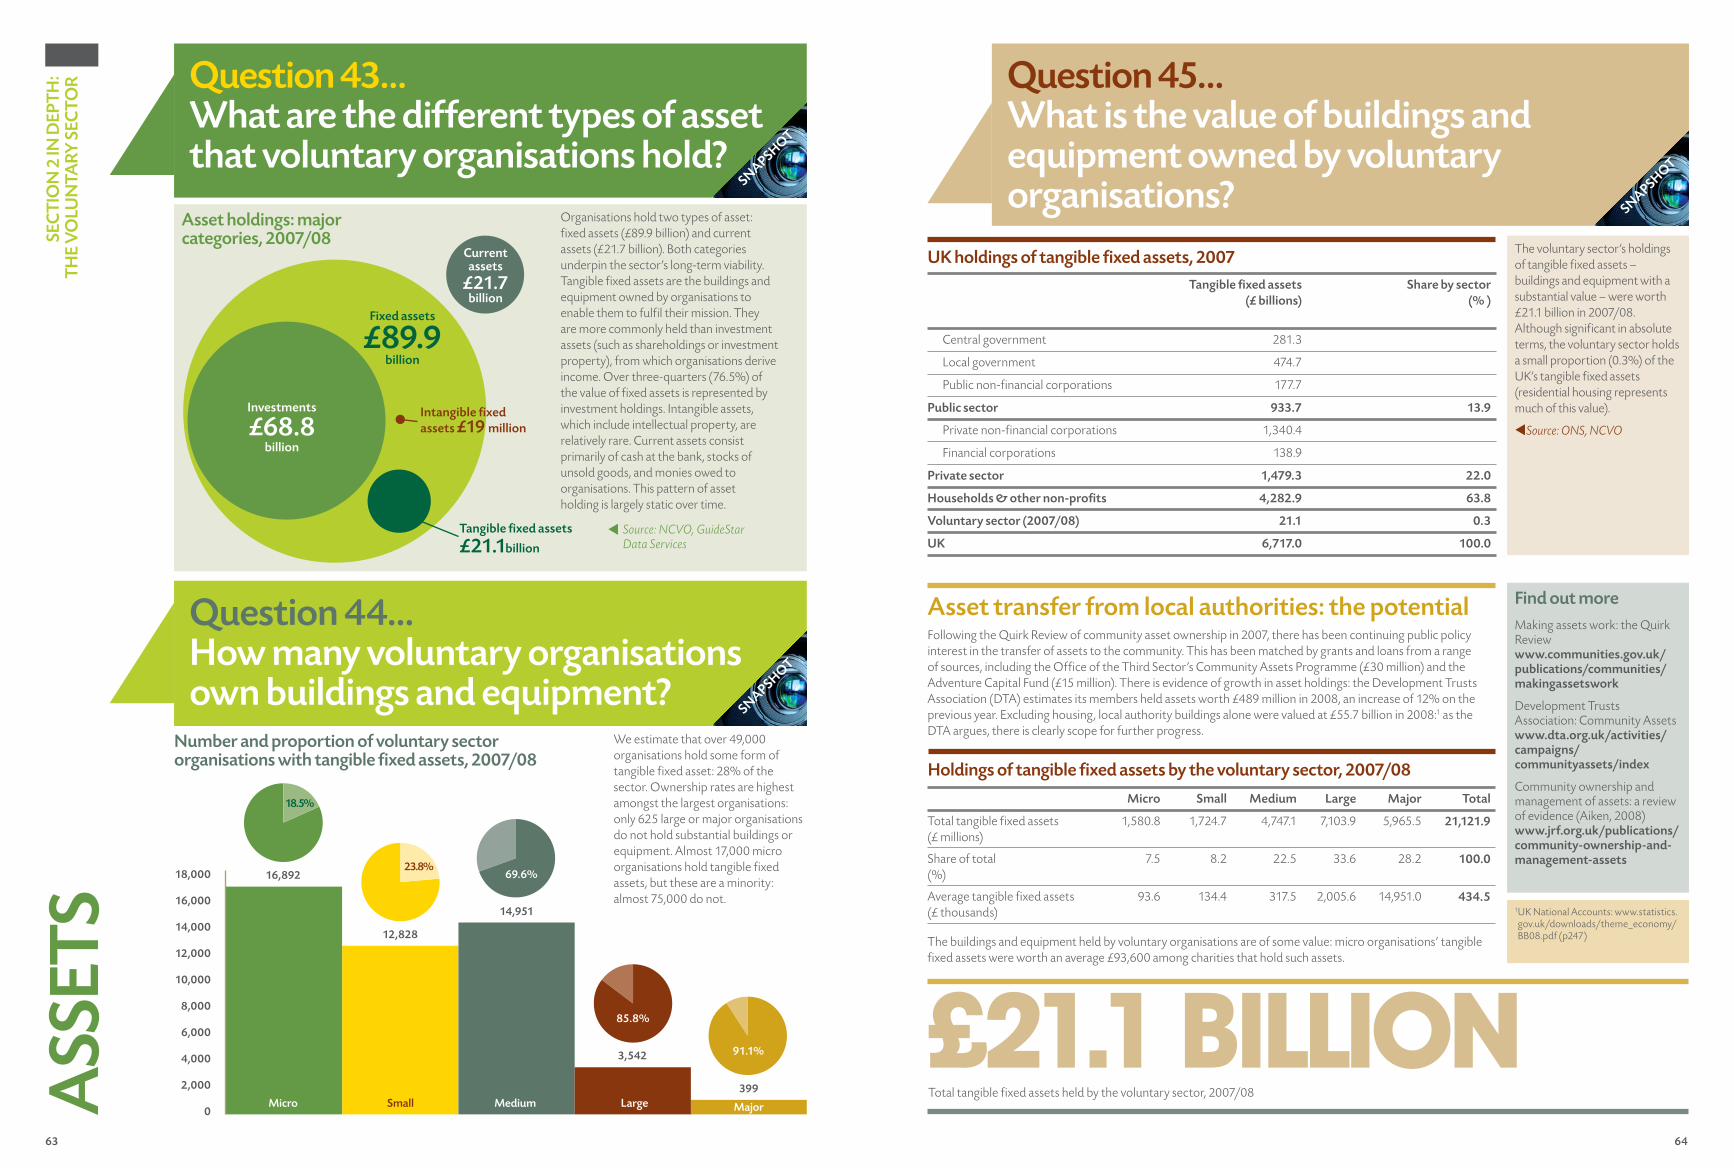
63 64
SE
CT
ION
2 IN
DE
PT
H:
TH
E V
OLU
NTA
RY
SE
CT
OR
ASS
ETS 1 UK National Accounts: www.statistics.
gov.uk/downloads/theme_economy/BB08.pdf (p247)
Question 45…What is the value of buildings and equipment owned by voluntary organisations? SN
APSHO
T
Organisations hold two types of asset: fi xed assets (£89.9 billion) and current assets (£21.7 billion). Both categories underpin the sector’s long-term viability. Tangible fi xed assets are the buildings and equipment owned by organisations to enable them to fulfi l their mission. They are more commonly held than investment assets (such as shareholdings or investment property), from which organisations derive income. Over three-quarters (76.5%) of the value of fi xed assets is represented by investment holdings. Intangible assets, which include intellectual property, are relatively rare. Current assets consist primarily of cash at the bank, stocks of unsold goods, and monies owed to organisations. This pattern of asset holding is largely static over time.
Source: NCVO, GuideStar Data Services
Asset holdings: major categories, 2007/08
Question 43…What are the different types of asset that voluntary organisations hold?
SNAPSH
OT
Find out more
Making assets work: the Quirk Review www.communities.gov.uk/publications/communities/makingassetswork
Development Trusts Association: Community Assets www.dta.org.uk/activities/campaigns/communityassets/index
Community ownership and management of assets: a review of evidence (Aiken, 2008)www.jrf.org.uk/publications/community-ownership-and-management-assets
Asset transfer from local authorities: the potentialFollowing the Quirk Review of community asset ownership in 2007, there has been continuing public policy interest in the transfer of assets to the community. This has been matched by grants and loans from a range of sources, including the Offi ce of the Third Sector’s Community Assets Programme (£30 million) and the Adventure Capital Fund (£15 million). There is evidence of growth in asset holdings: the Development Trusts Association (DTA) estimates its members held assets worth £489 million in 2008, an increase of 12% on the previous year. Excluding housing, local authority buildings alone were valued at £55.7 billion in 2008:1 as the DTA argues, there is clearly scope for further progress.
Holdings of tangible fi xed assets by the voluntary sector, 2007/08
The buildings and equipment held by voluntary organisations are of some value: micro organisations’ tangible fi xed assets were worth an average £93,600 among charities that hold such assets.
Tangible fi xed assets
(£ billions)
Share by sector
(% )
Central government 281.3
Local government 474.7
Public non-fi nancial corporations 177.7
Public sector 933.7 13.9
Private non-fi nancial corporations 1,340.4
Financial corporations 138.9
Private sector 1,479.3 22.0
Households & other non-profi ts 4,282.9 63.8
Voluntary sector (2007/08) 21.1 0.3
UK 6,717.0 100.0
UK holdings of tangible fi xed assets, 2007The voluntary sector’s holdings of tangible fi xed assets – buildings and equipment with a substantial value – were worth £21.1 billion in 2007/08. Although signifi cant in absolute terms, the voluntary sector holds a small proportion (0.3%) of the UK’s tangible fi xed assets (residential housing represents much of this value).
Source: ONS, NCVO
Micro Small Medium Large Major Total
Total tangible fi xed assets (£ millions)
1,580.8 1,724.7 4,747.1 7,103.9 5,965.5 21,121.9
Share of total (%)
7.5 8.2 22.5 33.6 28.2 100.0
Average tangible fi xed assets (£ thousands)
93.6 134.4 317.5 2,005.6 14,951.0 434.5
£21.1 BILLIONTotal tangible fi xed assets held by the voluntary sector, 2007/08
Question 44…How many voluntary organisations own buildings and equipment?
Number and proportion of voluntary sector organisations with tangible fi xed assets, 2007/08
SNAPSH
OT
We estimate that over 49,000 organisations hold some form of tangible fi xed asset: 28% of the sector. Ownership rates are highest amongst the largest organisations: only 625 large or major organisations do not hold substantial buildings or equipment. Almost 17,000 micro organisations hold tangible fi xed assets, but these are a minority: almost 75,000 do not.
18.5%
23.8%
85.8%
91.1%
69.6%16,892
12,828
14,951
3,542
399
Micro Small Medium Large Major
18,000
16,000
14,000
12,000
10,000
8,000
6,000
4,000
2,000
0
Current assets
£21.7 billion
Intangible fi xed
assets £19 million
Tangible fi xed assets
£21.1billion
Fixed assets
£89.9 billion
Investments
£68.8
billion
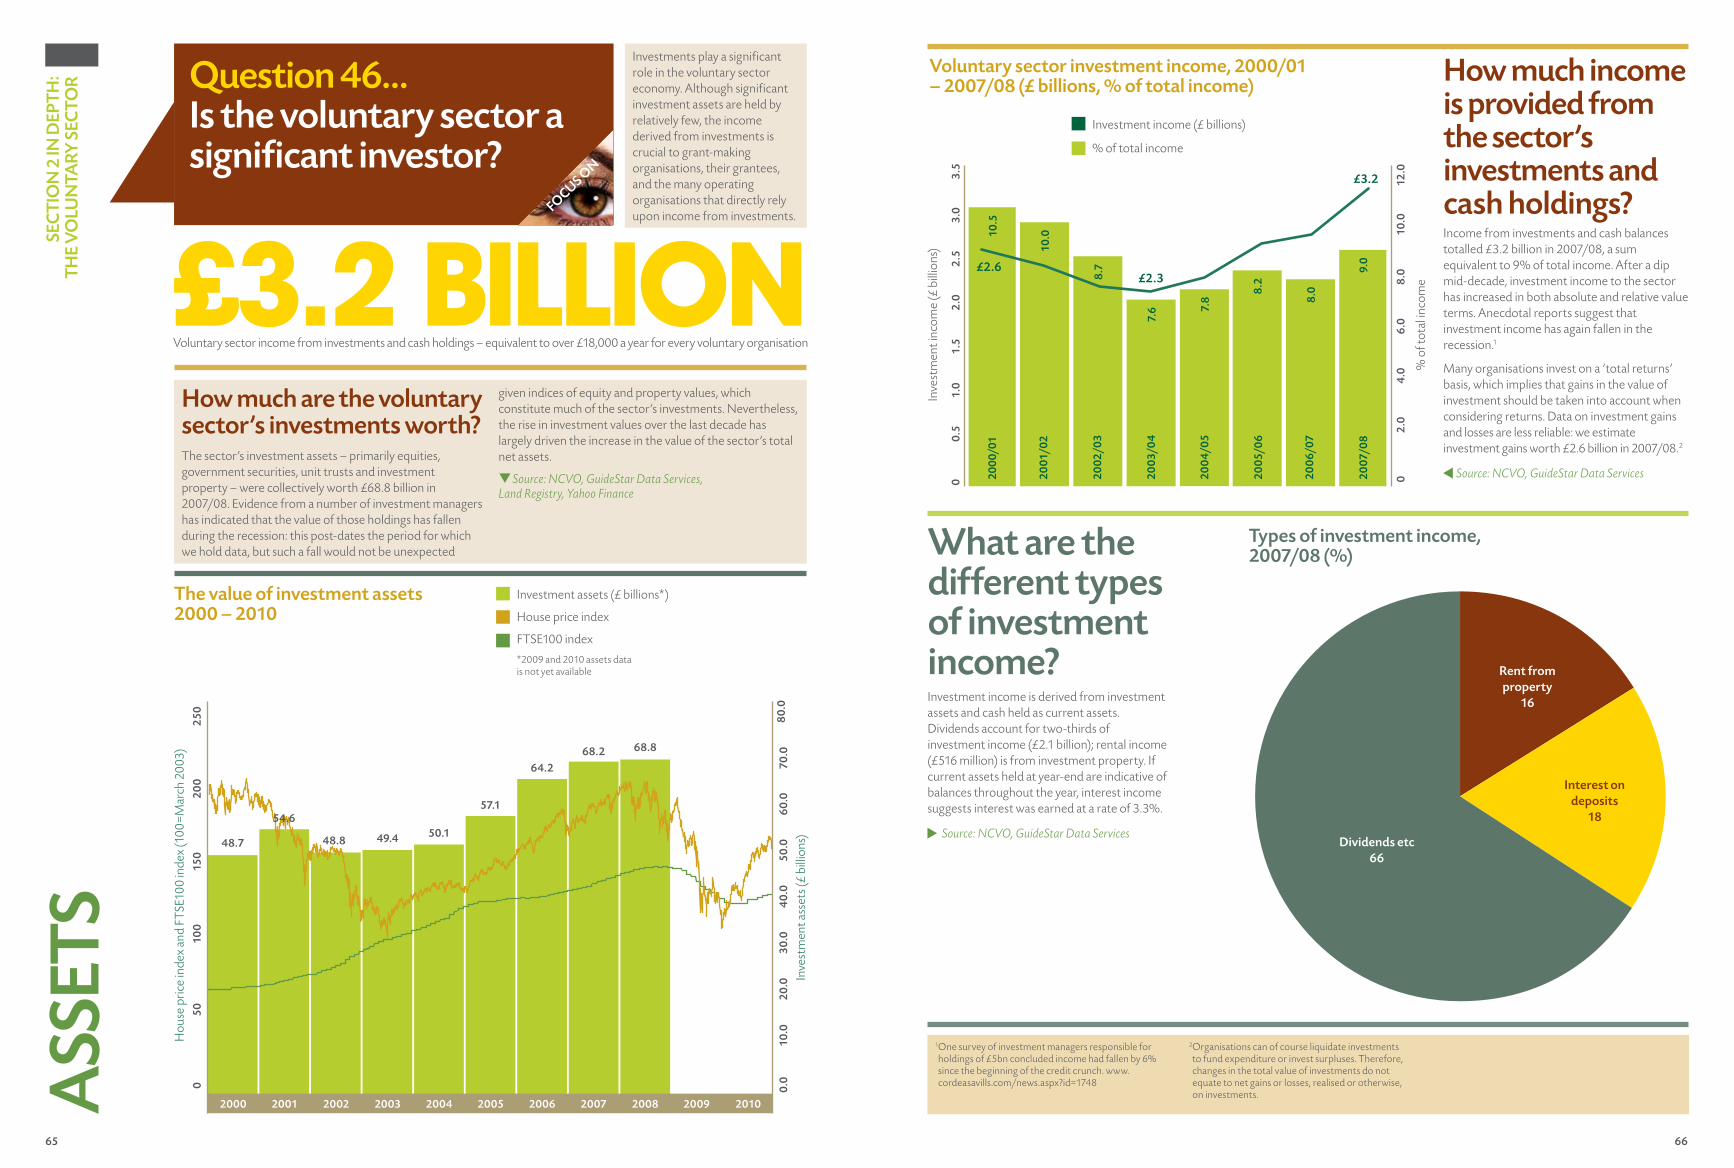
65 66
How much are the voluntary sector’s investments worth?The sector’s investment assets – primarily equities, government securities, unit trusts and investment property – were collectively worth £68.8 billion in 2007/08. Evidence from a number of investment managers has indicated that the value of those holdings has fallen during the recession: this post-dates the period for which we hold data, but such a fall would not be unexpected
given indices of equity and property values, which constitute much of the sector’s investments. Nevertheless, the rise in investment values over the last decade has largely driven the increase in the value of the sector’s total net assets.
qSource: NCVO, GuideStar Data Services, Land Registry, Yahoo Finance
SEC
TIO
N 2
IN D
EPTH
: TH
E V
OLU
NTA
RY S
ECTO
RA
SSET
S
1 One survey of investment managers responsible for holdings of £5bn concluded income had fallen by 6% since the beginning of the credit crunch. www.cordeasavills.com/news.aspx?id=1748
2 Organisations can of course liquidate investments to fund expenditure or invest surpluses. Therefore, changes in the total value of investments do not equate to net gains or losses, realised or otherwise, on investments.
Investments play a significant role in the voluntary sector economy. Although significant investment assets are held by relatively few, the income derived from investments is crucial to grant-making organisations, their grantees, and the many operating organisations that directly rely upon income from investments.
Question 46…Is the voluntary sector a significant investor?
£3.2 billionVoluntary sector income from investments and cash holdings – equivalent to over £18,000 a year for every voluntary organisation
FOCUS ON
Voluntary sector investment income, 2000/01 – 2007/08 (£ billions, % of total income)
How much income is provided from the sector’s investments and cash holdings?Income from investments and cash balances totalled £3.2 billion in 2007/08, a sum equivalent to 9% of total income. After a dip mid-decade, investment income to the sector has increased in both absolute and relative value terms. Anecdotal reports suggest that investment income has again fallen in the recession.1
Many organisations invest on a ‘total returns’ basis, which implies that gains in the value of investment should be taken into account when considering returns. Data on investment gains and losses are less reliable: we estimate investment gains worth £2.6 billion in 2007/08.2
Source: NCVO, GuideStar Data Services
What are the different types of investment income?Investment income is derived from investment assets and cash held as current assets. Dividends account for two-thirds of investment income (£2.1 billion); rental income (£516 million) is from investment property. If current assets held at year-end are indicative of balances throughout the year, interest income suggests interest was earned at a rate of 3.3%.
Source: NCVO, GuideStar Data Services
The value of investment assets 2000 – 2010
Types of investment income, 2007/08 (%)
Dividends etc 66
Rent from property
16
Interest on deposits
18In
vest
men
t ass
ets (
£ bi
llion
s)
050
100
150
200
250
0.0
10.0
20.0
40.
050
.060
.070
.080
.030
.0
Hou
se p
rice
inde
x an
d FT
SE10
0 in
dex
(100
=Mar
ch 2
003)
00.
5
10.5
10.0
8.7
7.6 7.
8
2000
/01
2001
/02
2002
/03
2003
/04
200
4/05
8.2
8.0
9.0
2005
/06
2006
/07
2007
/08
1.0
1.5
2.0
2.5
3.0
3.5
02
.04.
06.
08
.010
.012
.0
£2.6£2.3
£3.2
2000 2001 2002 2003 2004 2005 2006 2007 2008 2009 2010
Investment assets (£ billions*)
House price index
FTSE100 index
*2009 and 2010 assets data is not yet available
48.7
54.6
48.8 49.4 50.1
57.1
64.268.2 68.8
Inve
stm
ent i
ncom
e (£
bill
ions
)
% o
f tot
al in
com
e
Investment income (£ billions)
% of total income
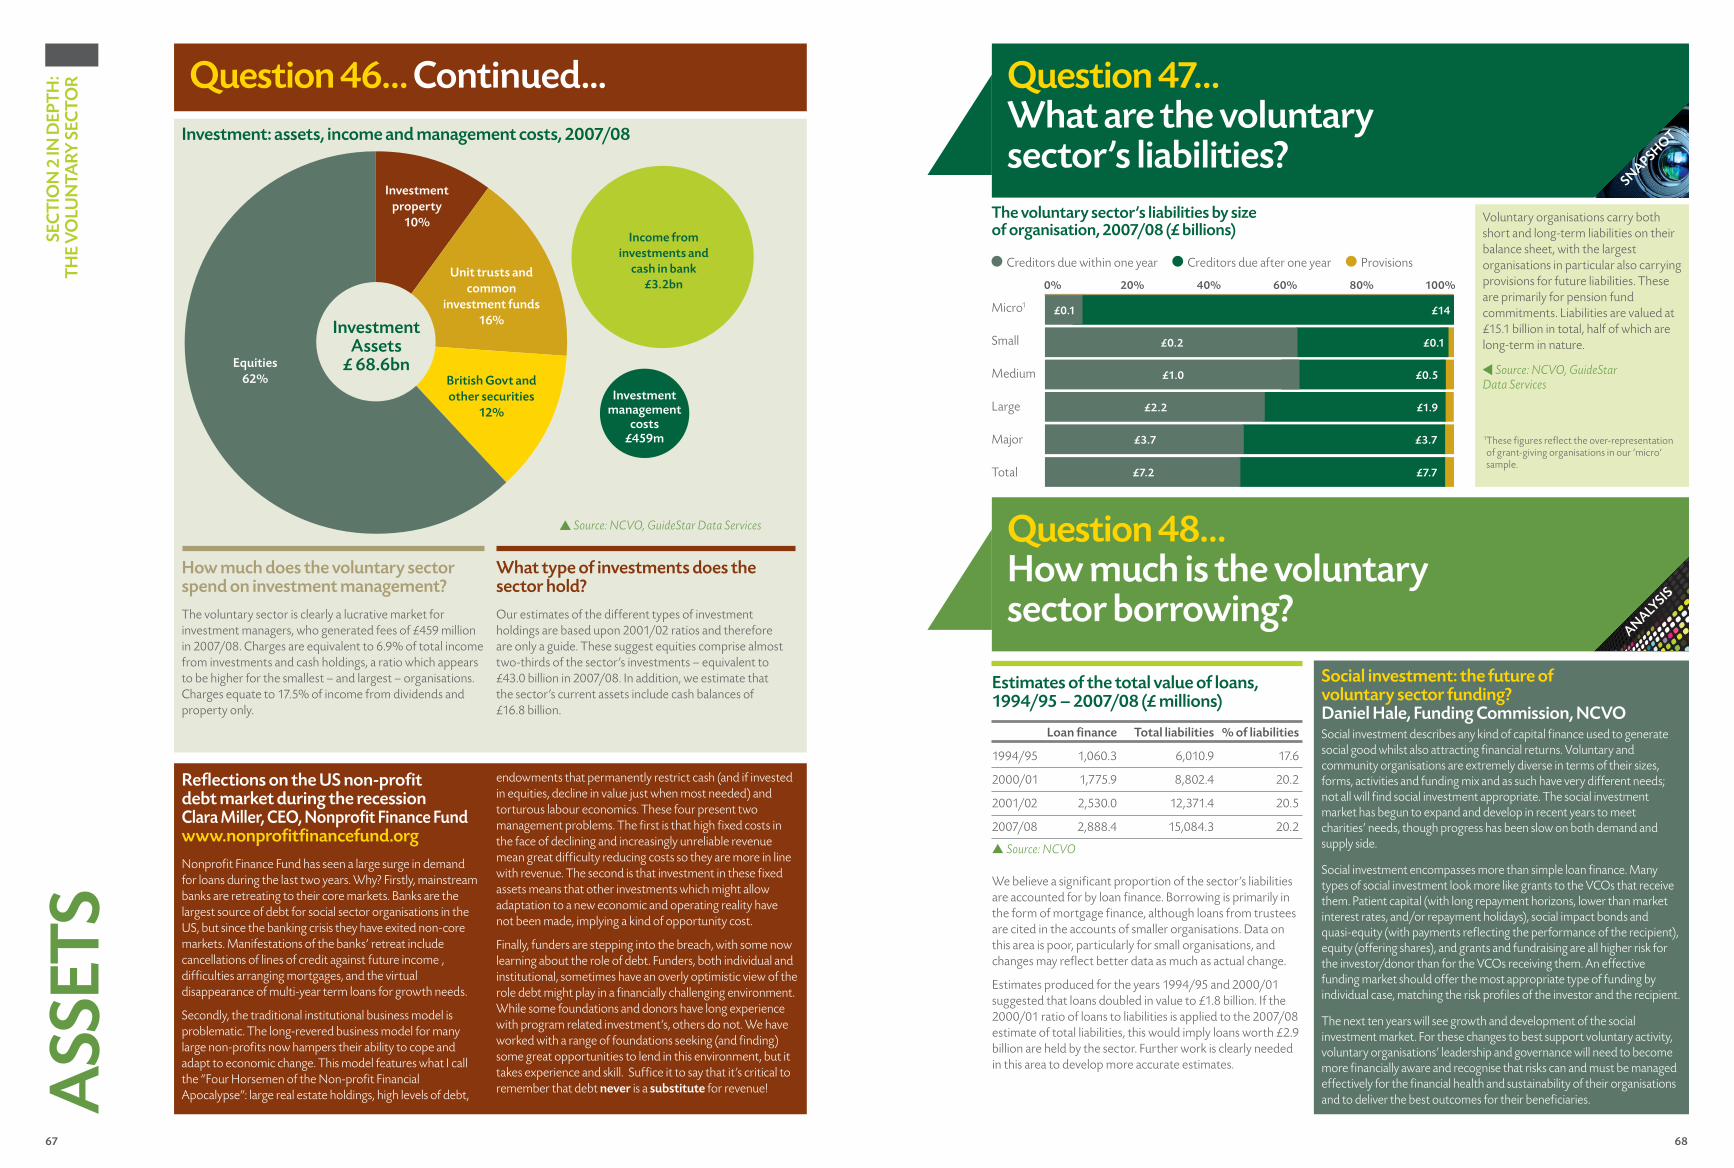
67 68
Question 47…What are the voluntary sector’s liabilities?
SE
CT
ION
2 IN
DE
PT
H:
TH
E V
OLU
NTA
RY
SE
CT
OR
ASS
ETS
SNAPSH
OT
The voluntary sector’s liabilities by size of organisation, 2007/08 (£ billions)
0% 20% 40% 60% 80% 100%
Creditors due within one year Creditors due after one year Provisions
Micro1
Small
Medium
Large
Major
Total
£14
£0.1
£0.5
£1.9
£3.7
£7.7
£0.1
£0.2
£1.0
£2.2
£3.7
£7.2
Loan fi nance Total liabilities % of liabilities
1994/95 1,060.3 6,010.9 17.6
2000/01 1,775.9 8,802.4 20.2
2001/02 2,530.0 12,371.4 20.5
2007/08 2,888.4 15,084.3 20.2
▲ Source: NCVO
Question 48…How much is the voluntary sector borrowing?
ANALY
SIS
We believe a signifi cant proportion of the sector’s liabilities are accounted for by loan fi nance. Borrowing is primarily in the form of mortgage fi nance, although loans from trustees are cited in the accounts of smaller organisations. Data on this area is poor, particularly for small organisations, and changes may refl ect better data as much as actual change.
Estimates produced for the years 1994/95 and 2000/01 suggested that loans doubled in value to £1.8 billion. If the 2000/01 ratio of loans to liabilities is applied to the 2007/08 estimate of total liabilities, this would imply loans worth £2.9 billion are held by the sector. Further work is clearly needed in this area to develop more accurate estimates.
Voluntary organisations carry both short and long-term liabilities on their balance sheet, with the largest organisations in particular also carrying provisions for future liabilities. These are primarily for pension fund commitments. Liabilities are valued at £15.1 billion in total, half of which are long-term in nature.
Source: NCVO, GuideStar Data Services
Estimates of the total value of loans, 1994/95 – 2007/08 (£ millions)
Social investment: the future of voluntary sector funding?Daniel Hale, Funding Commission, NCVOSocial investment describes any kind of capital fi nance used to generate social good whilst also attracting fi nancial returns. Voluntary and community organisations are extremely diverse in terms of their sizes, forms, activities and funding mix and as such have very different needs; not all will fi nd social investment appropriate. The social investment market has begun to expand and develop in recent years to meet charities’ needs, though progress has been slow on both demand and supply side.
Social investment encompasses more than simple loan fi nance. Many types of social investment look more like grants to the VCOs that receive them. Patient capital (with long repayment horizons, lower than market interest rates, and/or repayment holidays), social impact bonds and quasi-equity (with payments refl ecting the performance of the recipient), equity (offering shares), and grants and fundraising are all higher risk for the investor/donor than for the VCOs receiving them. An effective funding market should offer the most appropriate type of funding by individual case, matching the risk profi les of the investor and the recipient.
The next ten years will see growth and development of the social investment market. For these changes to best support voluntary activity, voluntary organisations’ leadership and governance will need to become more fi nancially aware and recognise that risks can and must be managed effectively for the fi nancial health and sustainability of their organisations and to deliver the best outcomes for their benefi ciaries.
How much does the voluntary sector spend on investment management?
The voluntary sector is clearly a lucrative market for investment managers, who generated fees of £459 million in 2007/08. Charges are equivalent to 6.9% of total income from investments and cash holdings, a ratio which appears to be higher for the smallest – and largest – organisations. Charges equate to 17.5% of income from dividends and property only.
Investment: assets, income and management costs, 2007/08
What type of investments does the sector hold?
Our estimates of the different types of investment holdings are based upon 2001/02 ratios and therefore are only a guide. These suggest equities comprise almost two-thirds of the sector’s investments – equivalent to £43.0 billion in 2007/08. In addition, we estimate that the sector’s current assets include cash balances of £16.8 billion.
Income from
investments and
cash in bank
£3.2bn
Investment management
costs£459m
Investment Assets
£ 68.6bn
Investment
property
10%
Equities
62% British Govt and
other securities
12%
Unit trusts and
common
investment funds
16%
Question 46… Continued...
Refl ections on the US non-profi t debt market during the recession Clara Miller, CEO, Nonprofi t Finance Fundwww.nonprofi tfi nancefund.org
Nonprofi t Finance Fund has seen a large surge in demand for loans during the last two years. Why? Firstly, mainstream banks are retreating to their core markets. Banks are the largest source of debt for social sector organisations in the US, but since the banking crisis they have exited non-core markets. Manifestations of the banks’ retreat include cancellations of lines of credit against future income , diffi culties arranging mortgages, and the virtual disappearance of multi-year term loans for growth needs.
Secondly, the traditional institutional business model is problematic. The long-revered business model for many large non-profi ts now hampers their ability to cope and adapt to economic change. This model features what I call the “Four Horsemen of the Non-profi t Financial Apocalypse”: large real estate holdings, high levels of debt,
Source: NCVO, GuideStar Data Services
endowments that permanently restrict cash (and if invested in equities, decline in value just when most needed) and torturous labour economics. These four present two management problems. The fi rst is that high fi xed costs in the face of declining and increasingly unreliable revenue mean great diffi culty reducing costs so they are more in line with revenue. The second is that investment in these fi xed assets means that other investments which might allow adaptation to a new economic and operating reality have not been made, implying a kind of opportunity cost.
Finally, funders are stepping into the breach, with some now learning about the role of debt. Funders, both individual and institutional, sometimes have an overly optimistic view of the role debt might play in a fi nancially challenging environment. While some foundations and donors have long experience with program related investment’s, others do not. We have worked with a range of foundations seeking (and fi nding) some great opportunities to lend in this environment, but it takes experience and skill. Suffi ce it to say that it’s critical to remember that debt never is a substitute for revenue!
1 These fi gures refl ect the over-representation of grant-giving organisations in our ‘micro’ sample.
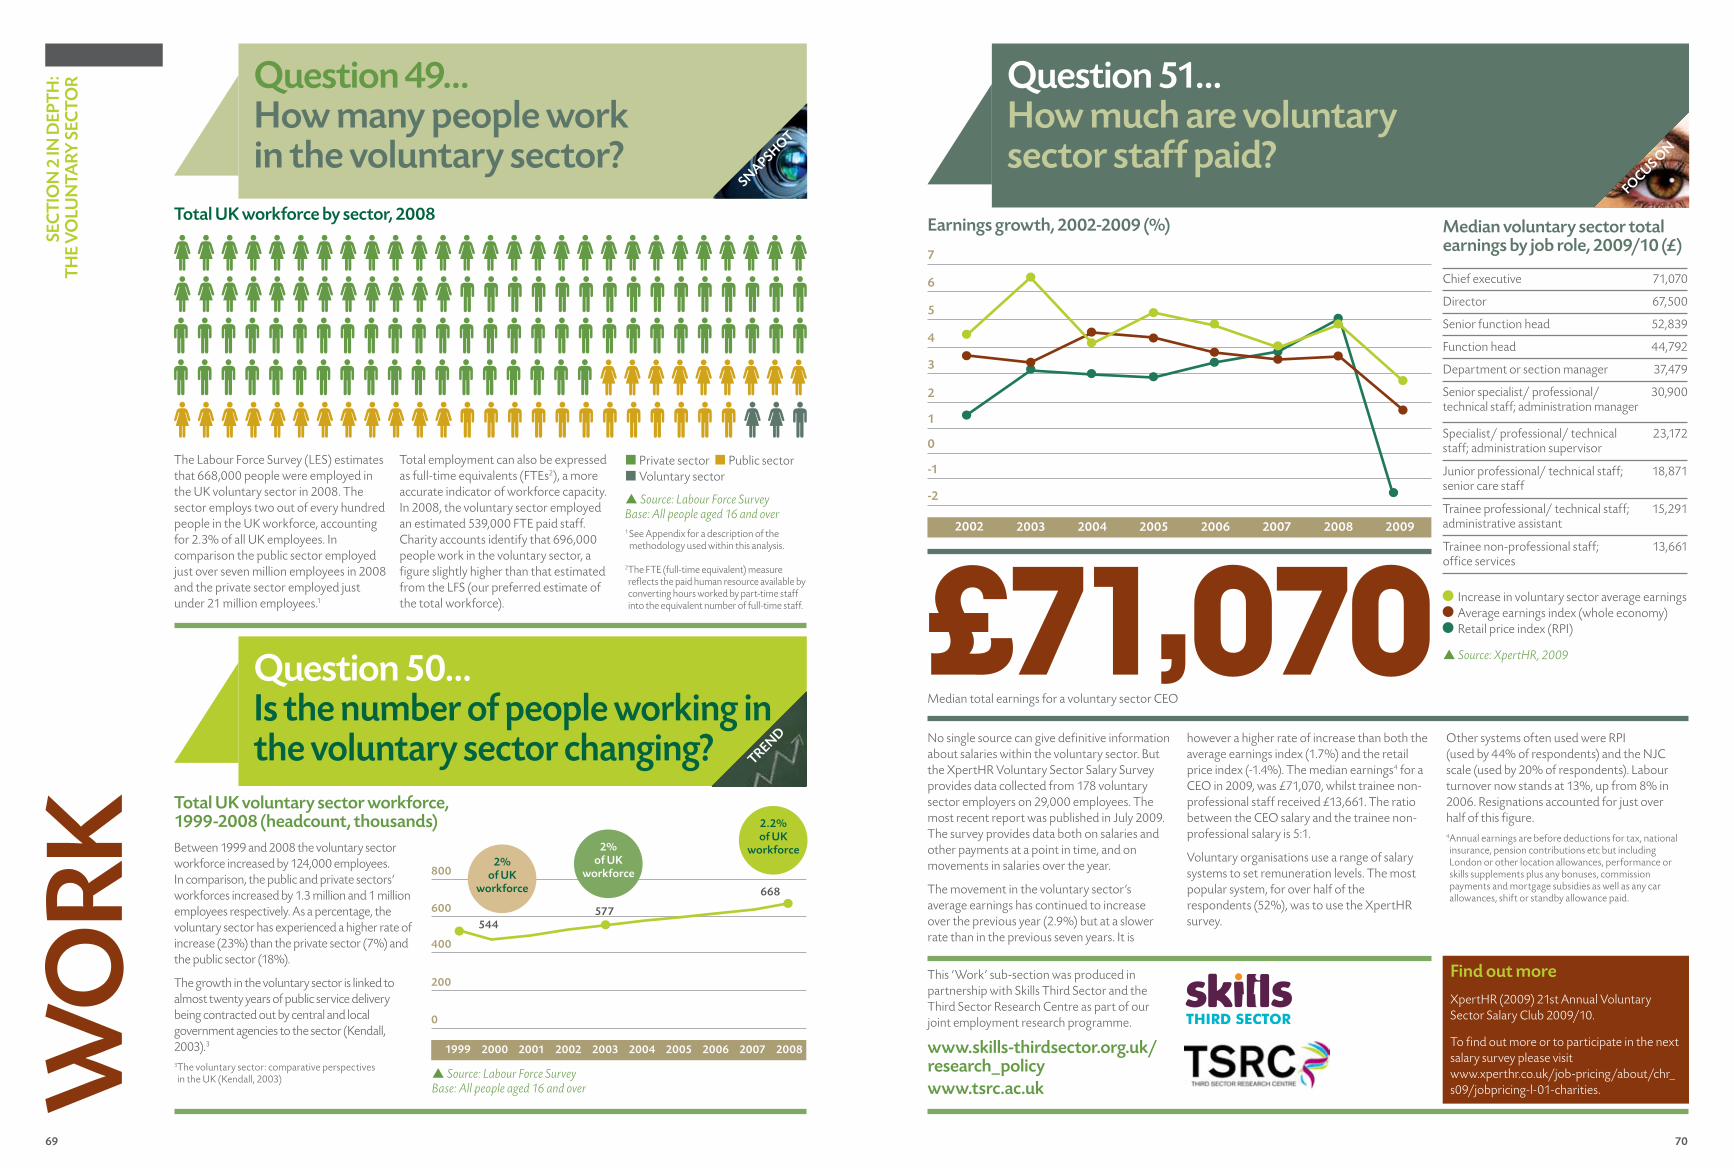
69 70
-1
4
3
2
1
5
SEC
TIO
N 2
IN D
EPTH
: TH
E V
OLU
NTA
RY S
ECTO
R Question 49…How many people work in the voluntary sector?
SNAPSHOT
WO
RK
Question 50…Is the number of people working in the voluntary sector changing? TREND
Total UK voluntary sector workforce, 1999-2008 (headcount, thousands)
p Source: Labour Force Survey Base: All people aged 16 and over
Between 1999 and 2008 the voluntary sector workforce increased by 124,000 employees. In comparison, the public and private sectors’ workforces increased by 1.3 million and 1 million employees respectively. As a percentage, the voluntary sector has experienced a higher rate of increase (23%) than the private sector (7%) and the public sector (18%).
The growth in the voluntary sector is linked to almost twenty years of public service delivery being contracted out by central and local government agencies to the sector (Kendall, 2003).3
3 The voluntary sector: comparative perspectives in the UK (Kendall, 2003)
Question 51…How much are voluntary sector staff paid?
FOCUS ON
Median voluntary sector total earnings by job role, 2009/10 (£)
Chief executive 71,070
Director 67,500
Senior function head 52,839
Function head 44,792
Department or section manager 37,479
Senior specialist/ professional/ technical staff; administration manager
30,900
Specialist/ professional/ technical staff; administration supervisor
23,172
Junior professional/ technical staff; senior care staff
18,871
Trainee professional/ technical staff; administrative assistant
15,291
Trainee non-professional staff; office services
13,661
Earnings growth, 2002-2009 (%)
Find out more
XpertHR (2009) 21st Annual Voluntary Sector Salary Club 2009/10.
To find out more or to participate in the next salary survey please visit www.xperthr.co.uk/job-pricing/about/chr_s09/jobpricing-l-01-charities.
Median total earnings for a voluntary sector CEO
£71,070-2
6
7
0
2002 2003 2004 2005 2006 2007 2008 2009
Increase in voluntary sector average earnings Average earnings index (whole economy) Retail price index (RPI)
p Source: XpertHR, 2009
This ‘Work’ sub-section was produced in partnership with Skills Third Sector and the Third Sector Research Centre as part of our joint employment research programme.
www.skills-thirdsector.org.uk/research_policywww.tsrc.ac.uk
1999 2000 2001 2002 2003 2004 2005 2006 2007 2008
600
400
200
0
800
544577
668
2% of UK
workforce
2% of UK
workforce
2.2% of UK
workforce
No single source can give definitive information about salaries within the voluntary sector. But the XpertHR Voluntary Sector Salary Survey provides data collected from 178 voluntary sector employers on 29,000 employees. The most recent report was published in July 2009. The survey provides data both on salaries and other payments at a point in time, and on movements in salaries over the year.
The movement in the voluntary sector’s average earnings has continued to increase over the previous year (2.9%) but at a slower rate than in the previous seven years. It is
however a higher rate of increase than both the average earnings index (1.7%) and the retail price index (-1.4%). The median earnings4 for a CEO in 2009, was £71,070, whilst trainee non-professional staff received £13,661. The ratio between the CEO salary and the trainee non-professional salary is 5:1.
Voluntary organisations use a range of salary systems to set remuneration levels. The most popular system, for over half of the respondents (52%), was to use the XpertHR survey.
Other systems often used were RPI (used by 44% of respondents) and the NJC scale (used by 20% of respondents). Labour turnover now stands at 13%, up from 8% in 2006. Resignations accounted for just over half of this figure. 4 Annual earnings are before deductions for tax, national insurance, pension contributions etc but including London or other location allowances, performance or skills supplements plus any bonuses, commission payments and mortgage subsidies as well as any car allowances, shift or standby allowance paid.
Total UK workforce by sector, 2008
The Labour Force Survey (LES) estimates that 668,000 people were employed in the UK voluntary sector in 2008. The sector employs two out of every hundred people in the UK workforce, accounting for 2.3% of all UK employees. In comparison the public sector employed just over seven million employees in 2008 and the private sector employed just under 21 million employees.1
Total employment can also be expressed as full-time equivalents (FTEs2), a more accurate indicator of workforce capacity. In 2008, the voluntary sector employed an estimated 539,000 FTE paid staff. Charity accounts identify that 696,000 people work in the voluntary sector, a figure slightly higher than that estimated from the LFS (our preferred estimate of the total workforce).
1 See Appendix for a description of the methodology used within this analysis.
2 The FTE (full-time equivalent) measure reflects the paid human resource available by converting hours worked by part-time staff into the equivalent number of full-time staff.
p Source: Labour Force SurveyBase: All people aged 16 and over
¢ Private sector ¢ Public sector ¢ Voluntary sector
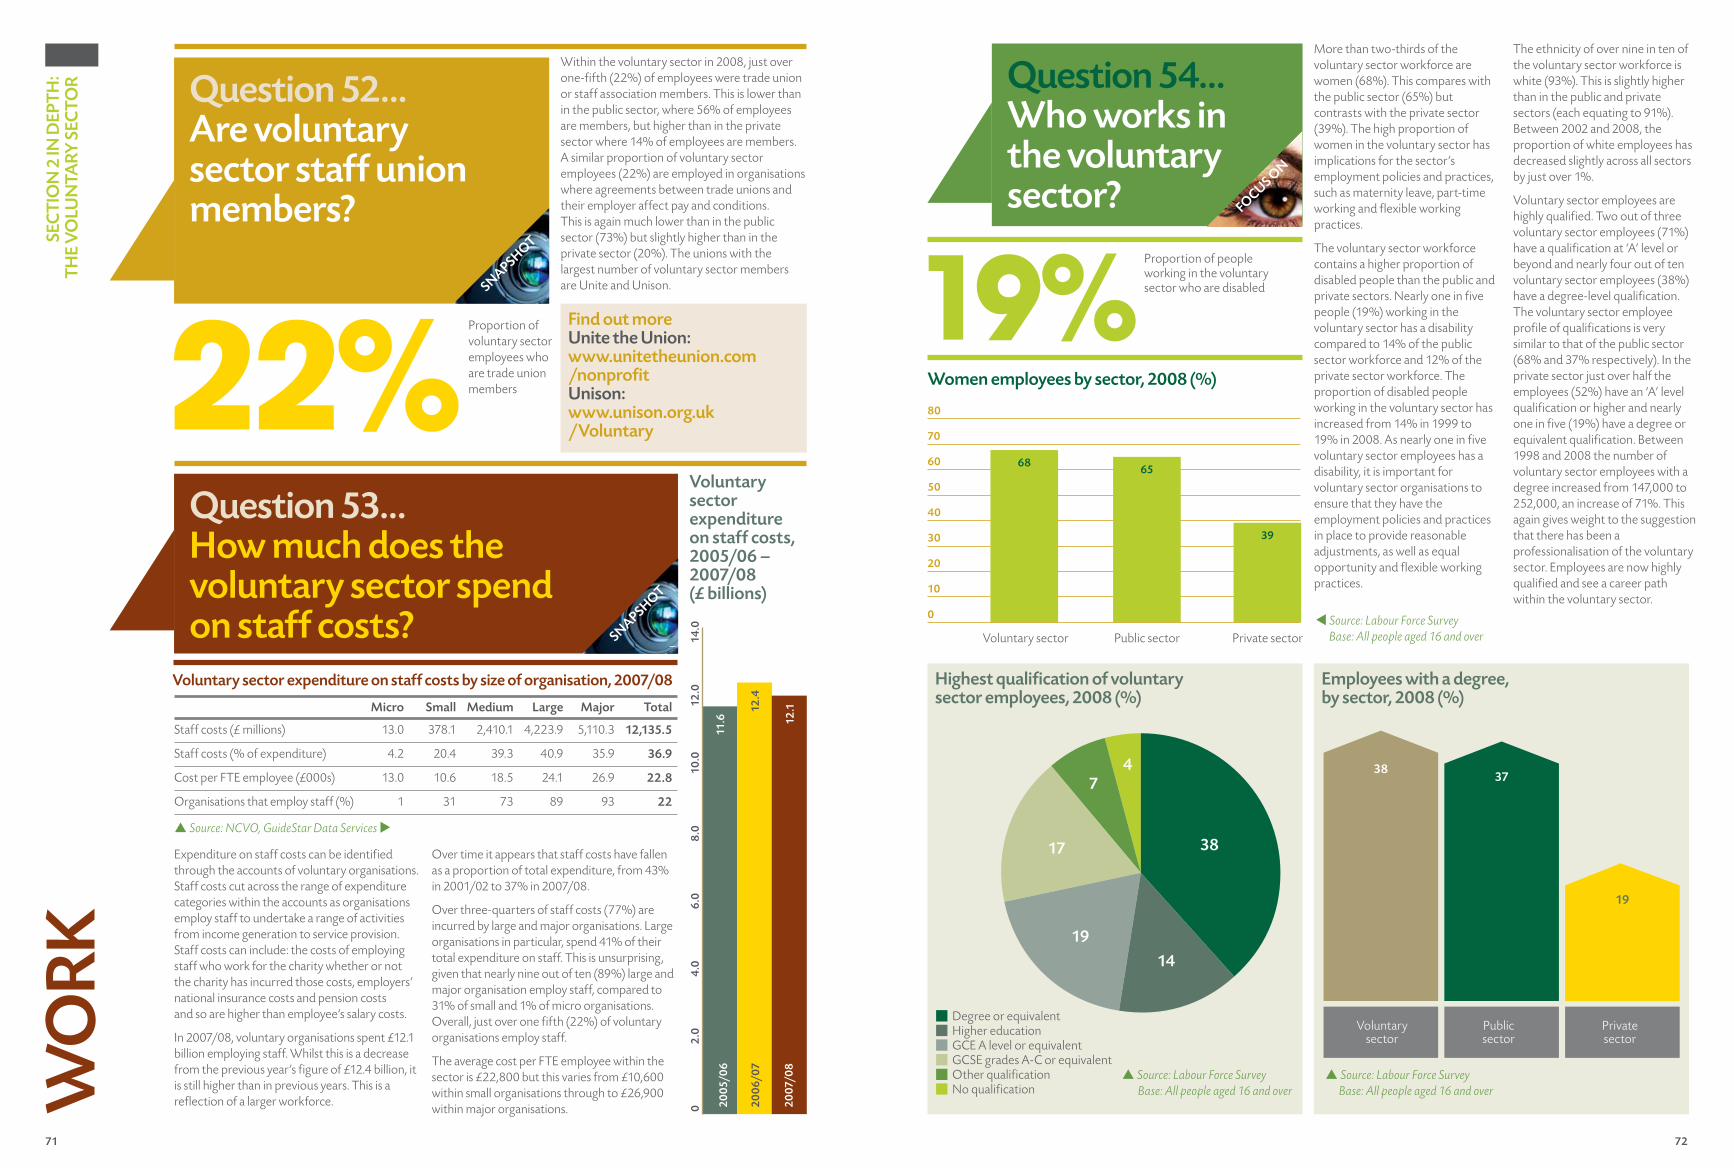
71 72
More than two-thirds of the voluntary sector workforce are women (68%). This compares with the public sector (65%) but contrasts with the private sector (39%). The high proportion of women in the voluntary sector has implications for the sector’s employment policies and practices, such as maternity leave, part-time working and flexible working practices.
The voluntary sector workforce contains a higher proportion of disabled people than the public and private sectors. Nearly one in five people (19%) working in the voluntary sector has a disability compared to 14% of the public sector workforce and 12% of the private sector workforce. The proportion of disabled people working in the voluntary sector has increased from 14% in 1999 to 19% in 2008. As nearly one in five voluntary sector employees has a disability, it is important for voluntary sector organisations to ensure that they have the employment policies and practices in place to provide reasonable adjustments, as well as equal opportunity and flexible working practices.
The ethnicity of over nine in ten of the voluntary sector workforce is white (93%). This is slightly higher than in the public and private sectors (each equating to 91%). Between 2002 and 2008, the proportion of white employees has decreased slightly across all sectors by just over 1%.
Voluntary sector employees are highly qualified. Two out of three voluntary sector employees (71%) have a qualification at ‘A’ level or beyond and nearly four out of ten voluntary sector employees (38%) have a degree-level qualification. The voluntary sector employee profile of qualifications is very similar to that of the public sector (68% and 37% respectively). In the private sector just over half the employees (52%) have an ‘A’ level qualification or higher and nearly one in five (19%) have a degree or equivalent qualification. Between 1998 and 2008 the number of voluntary sector employees with a degree increased from 147,000 to 252,000, an increase of 71%. This again gives weight to the suggestion that there has been a professionalisation of the voluntary sector. Employees are now highly qualified and see a career path within the voluntary sector.
Women employees by sector, 2008 (%)
SEC
TIO
N 2
IN D
EPTH
: TH
E V
OLU
NTA
RY S
ECTO
R Question 52…Are voluntary sector staff union members?
SNAPSHOT
WO
RKWithin the voluntary sector in 2008, just over one-fifth (22%) of employees were trade union or staff association members. This is lower than in the public sector, where 56% of employees are members, but higher than in the private sector where 14% of employees are members. A similar proportion of voluntary sector employees (22%) are employed in organisations where agreements between trade unions and their employer affect pay and conditions. This is again much lower than in the public sector (73%) but slightly higher than in the private sector (20%). The unions with the largest number of voluntary sector members are Unite and Unison.
Find out more Unite the Union: www.unitetheunion.com /nonprofit Unison: www.unison.org.uk /Voluntary 22%
Proportion of voluntary sector employees who are trade union members
Question 53…How much does the voluntary sector spend on staff costs? SNAPSHOT
Expenditure on staff costs can be identified through the accounts of voluntary organisations. Staff costs cut across the range of expenditure categories within the accounts as organisations employ staff to undertake a range of activities from income generation to service provision. Staff costs can include: the costs of employing staff who work for the charity whether or not the charity has incurred those costs, employers’ national insurance costs and pension costs and so are higher than employee’s salary costs.
In 2007/08, voluntary organisations spent £12.1 billion employing staff. Whilst this is a decrease from the previous year’s figure of £12.4 billion, it is still higher than in previous years. This is a reflection of a larger workforce.
Over time it appears that staff costs have fallen as a proportion of total expenditure, from 43% in 2001/02 to 37% in 2007/08.
Over three-quarters of staff costs (77%) are incurred by large and major organisations. Large organisations in particular, spend 41% of their total expenditure on staff. This is unsurprising, given that nearly nine out of ten (89%) large and major organisation employ staff, compared to 31% of small and 1% of micro organisations. Overall, just over one fifth (22%) of voluntary organisations employ staff.
The average cost per FTE employee within the sector is £22,800 but this varies from £10,600 within small organisations through to £26,900 within major organisations.
Voluntary sector expenditure on staff costs by size of organisation, 2007/08
11.6
12.4
12.1
02
.04.
06.
08
.0
2005
/06
2006
/07
2007
/08
10.0
12.0
14.0
Micro Small Medium Large Major Total
Staff costs (£ millions) 13.0 378.1 2,410.1 4,223.9 5,110.3 12,135.5
Staff costs (% of expenditure) 4.2 20.4 39.3 40.9 35.9 36.9
Cost per FTE employee (£000s) 13.0 10.6 18.5 24.1 26.9 22.8
Organisations that employ staff (%) 1 31 73 89 93 22
p Source: NCVO, GuideStar Data Services u
t Source: Labour Force Survey Base: All people aged 16 and over
19%Proportion of people working in the voluntary sector who are disabled
Question 54…Who works in the voluntary sector? FOCUS O
N
40
20
60
80
70
10
50
30 39
6568
Voluntary sector Public sector Private sector
p Source: Labour Force Survey Base: All people aged 16 and over
Highest qualification of voluntary sector employees, 2008 (%)
Employees with a degree, by sector, 2008 (%)
74
38
14
17
19
Degree or equivalent Higher education GCE A level or equivalent GCSE grades A-C or equivalent Other qualification No qualification
19
3738
Voluntary sector
Public sector
Private sector
Voluntary sector expenditure on staff costs, 2005/06 – 2007/08 (£ billions)
p Source: Labour Force Survey Base: All people aged 16 and over
0
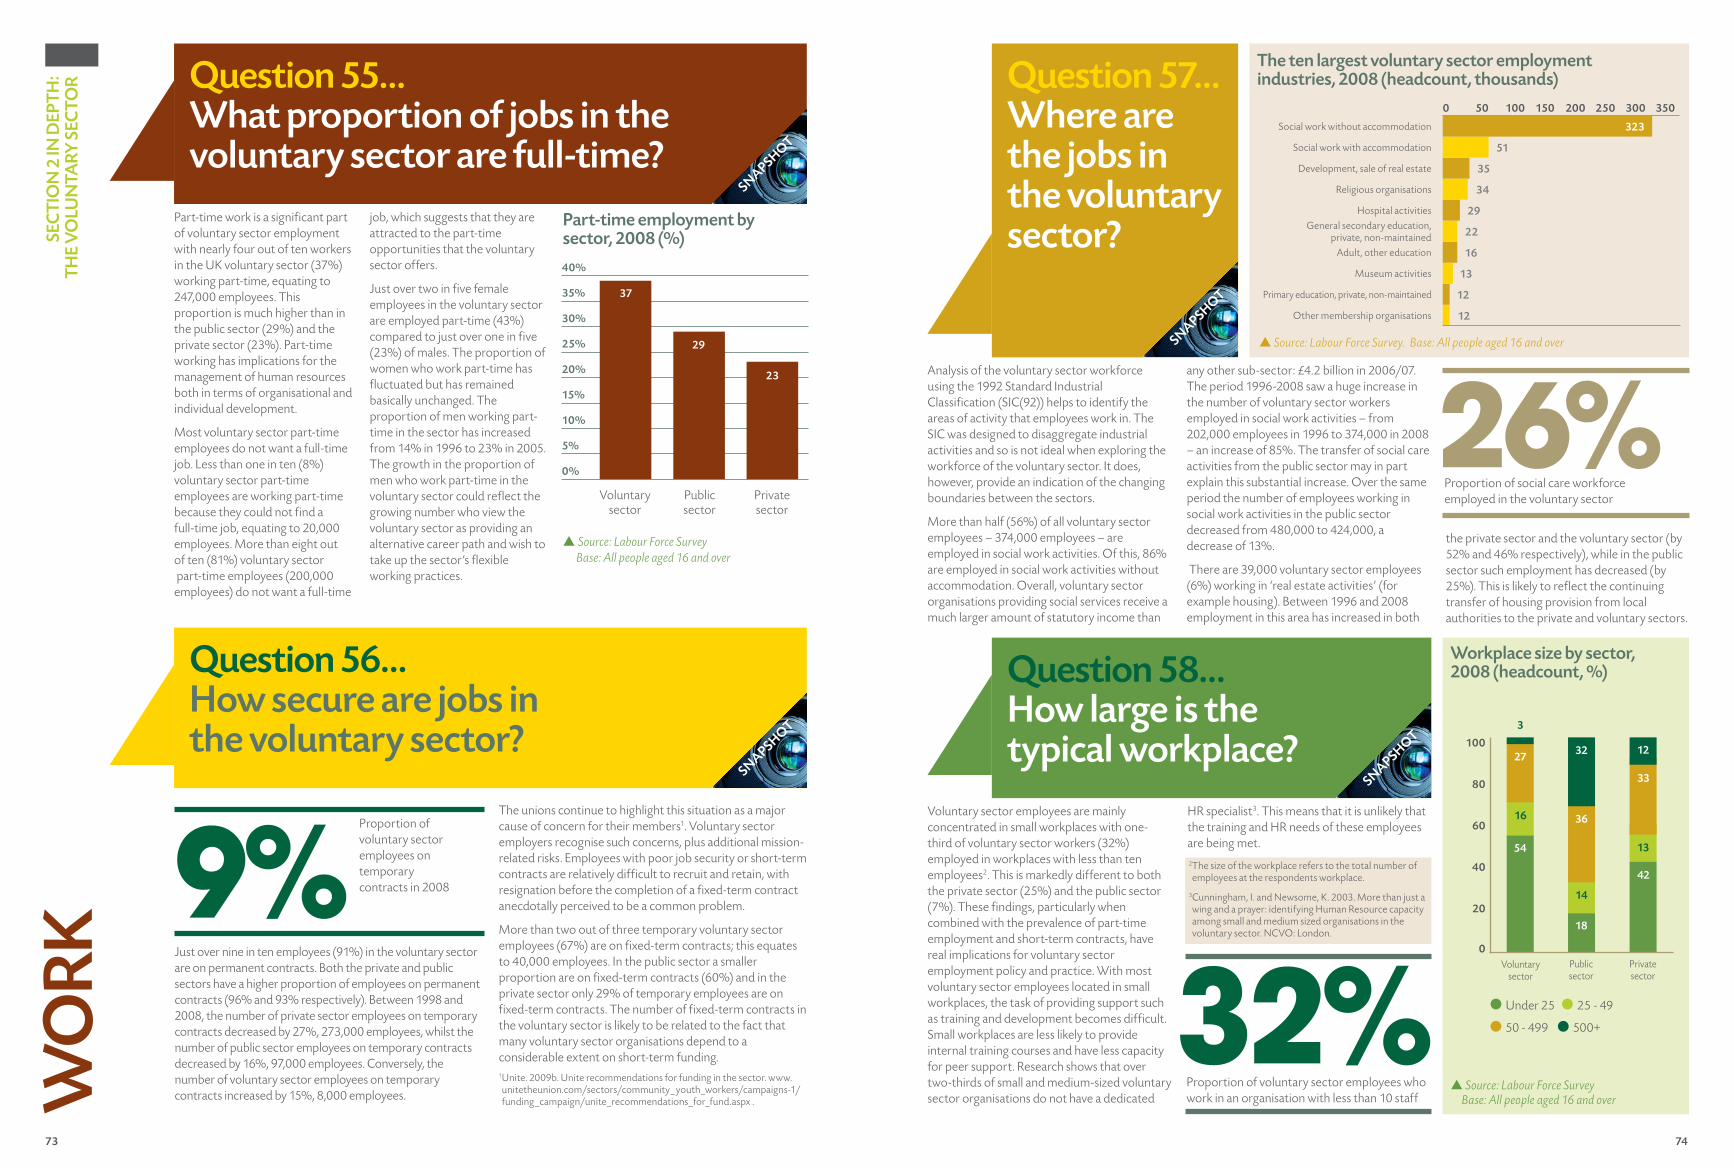
73 74
The ten largest voluntary sector employment industries, 2008 (headcount, thousands)
Analysis of the voluntary sector workforce using the 1992 Standard Industrial Classifi cation (SIC(92)) helps to identify the areas of activity that employees work in. The SIC was designed to disaggregate industrial activities and so is not ideal when exploring the workforce of the voluntary sector. It does, however, provide an indication of the changing boundaries between the sectors.
More than half (56%) of all voluntary sector employees – 374,000 employees – are employed in social work activities. Of this, 86% are employed in social work activities without accommodation. Overall, voluntary sector organisations providing social services receive a much larger amount of statutory income than
any other sub-sector: £4.2 billion in 2006/07. The period 1996-2008 saw a huge increase in the number of voluntary sector workers employed in social work activities – from 202,000 employees in 1996 to 374,000 in 2008 – an increase of 85%. The transfer of social care activities from the public sector may in part explain this substantial increase. Over the same period the number of employees working in social work activities in the public sector decreased from 480,000 to 424,000, a decrease of 13%.
There are 39,000 voluntary sector employees (6%) working in ‘real estate activities’ (for example housing). Between 1996 and 2008 employment in this area has increased in both
the private sector and the voluntary sector (by 52% and 46% respectively), while in the public sector such employment has decreased (by 25%). This is likely to refl ect the continuing transfer of housing provision from local authorities to the private and voluntary sectors.
Just over nine in ten employees (91%) in the voluntary sector are on permanent contracts. Both the private and public sectors have a higher proportion of employees on permanent contracts (96% and 93% respectively). Between 1998 and 2008, the number of private sector employees on temporary contracts decreased by 27%, 273,000 employees, whilst the number of public sector employees on temporary contracts decreased by 16%, 97,000 employees. Conversely, the number of voluntary sector employees on temporary contracts increased by 15%, 8,000 employees.
The unions continue to highlight this situation as a major cause of concern for their members1. Voluntary sector employers recognise such concerns, plus additional mission-related risks. Employees with poor job security or short-term contracts are relatively diffi cult to recruit and retain, with resignation before the completion of a fi xed-term contract anecdotally perceived to be a common problem.
More than two out of three temporary voluntary sector employees (67%) are on fi xed-term contracts; this equates to 40,000 employees. In the public sector a smaller proportion are on fi xed-term contracts (60%) and in the private sector only 29% of temporary employees are on fi xed-term contracts. The number of fi xed-term contracts in the voluntary sector is likely to be related to the fact that many voluntary sector organisations depend to a considerable extent on short-term funding.1 Unite. 2009b. Unite recommendations for funding in the sector. www.unitetheunion.com/sectors/community_youth_workers/campaigns-1/funding_campaign/unite_recommendations_for_fund.aspx .
SE
CT
ION
2 IN
DE
PT
H:
TH
E V
OLU
NTA
RY
SE
CT
OR Question 55…
What proportion of jobs in the voluntary sector are full-time?
SNAPSH
OT
WO
RK
Part-time employment by sector, 2008 (%)
p Source: Labour Force Survey Base: All people aged 16 and over
20%
10%
30%
40%
35%
5%
25%
15%
Voluntary sector
Public sector
Private sector
Part-time work is a signifi cant part of voluntary sector employment with nearly four out of ten workers in the UK voluntary sector (37%) working part-time, equating to 247,000 employees. This proportion is much higher than in the public sector (29%) and the private sector (23%). Part-time working has implications for the management of human resources both in terms of organisational and individual development.
Most voluntary sector part-time employees do not want a full-time job. Less than one in ten (8%) voluntary sector part-time employees are working part-time because they could not fi nd a full-time job, equating to 20,000 employees. More than eight out of ten (81%) voluntary sector part-time employees (200,000 employees) do not want a full-time
job, which suggests that they are attracted to the part-time opportunities that the voluntary sector offers.
Just over two in fi ve female employees in the voluntary sector are employed part-time (43%) compared to just over one in fi ve (23%) of males. The proportion of women who work part-time has fl uctuated but has remained basically unchanged. The proportion of men working part-time in the sector has increased from 14% in 1996 to 23% in 2005. The growth in the proportion of men who work part-time in the voluntary sector could refl ect the growing number who view the voluntary sector as providing an alternative career path and wish to take up the sector’s fl exible working practices.
Voluntary sector employees are mainly concentrated in small workplaces with one-third of voluntary sector workers (32%) employed in workplaces with less than ten employees2. This is markedly different to both the private sector (25%) and the public sector (7%). These fi ndings, particularly when combined with the prevalence of part-time employment and short-term contracts, have real implications for voluntary sector employment policy and practice. With most voluntary sector employees located in small workplaces, the task of providing support such as training and development becomes diffi cult. Small workplaces are less likely to provide internal training courses and have less capacity for peer support. Research shows that over two-thirds of small and medium-sized voluntary sector organisations do not have a dedicated
HR specialist3. This means that it is unlikely that the training and HR needs of these employees are being met.
Question 56…How secure are jobs in the voluntary sector?
SNAPSH
OT
Proportion of voluntary sector employees on temporary contracts in 20089%
Question 57…Where are the jobs in the voluntary sector?
SNAPSH
OT
Social work without accommodation
p Source: Labour Force Survey. Base: All people aged 16 and over
26%Proportion of social care workforce employed in the voluntary sector
323
0 50 100 150 200 250 300 350
12
12
13
16
22
29
34
35
Social work with accommodation
Development, sale of real estate
Religious organisations
Hospital activitiesGeneral secondary education,
private, non-maintainedAdult, other education
Museum activities
Primary education, private, non-maintained
Other membership organisations
Question 58…How large is the typical workplace?
SNAPSH
OT
32%Proportion of voluntary sector employees who work in an organisation with less than 10 staff
Workplace size by sector, 2008 (headcount, %)
p Source: Labour Force Survey Base: All people aged 16 and over
0
20
40
60
80
100
Voluntary sector
Public sector
Private sector
Under 25 25 - 49
50 - 499 500+
2 The size of the workplace refers to the total number of employees at the respondents workplace.
3 Cunningham, I. and Newsome, K. 2003. More than just a wing and a prayer: identifying Human Resource capacity among small and medium sized organisations in the voluntary sector. NCVO: London.
51
37
29
23
13
42
33
12
14
18
36
32
16
54
27
3
0%
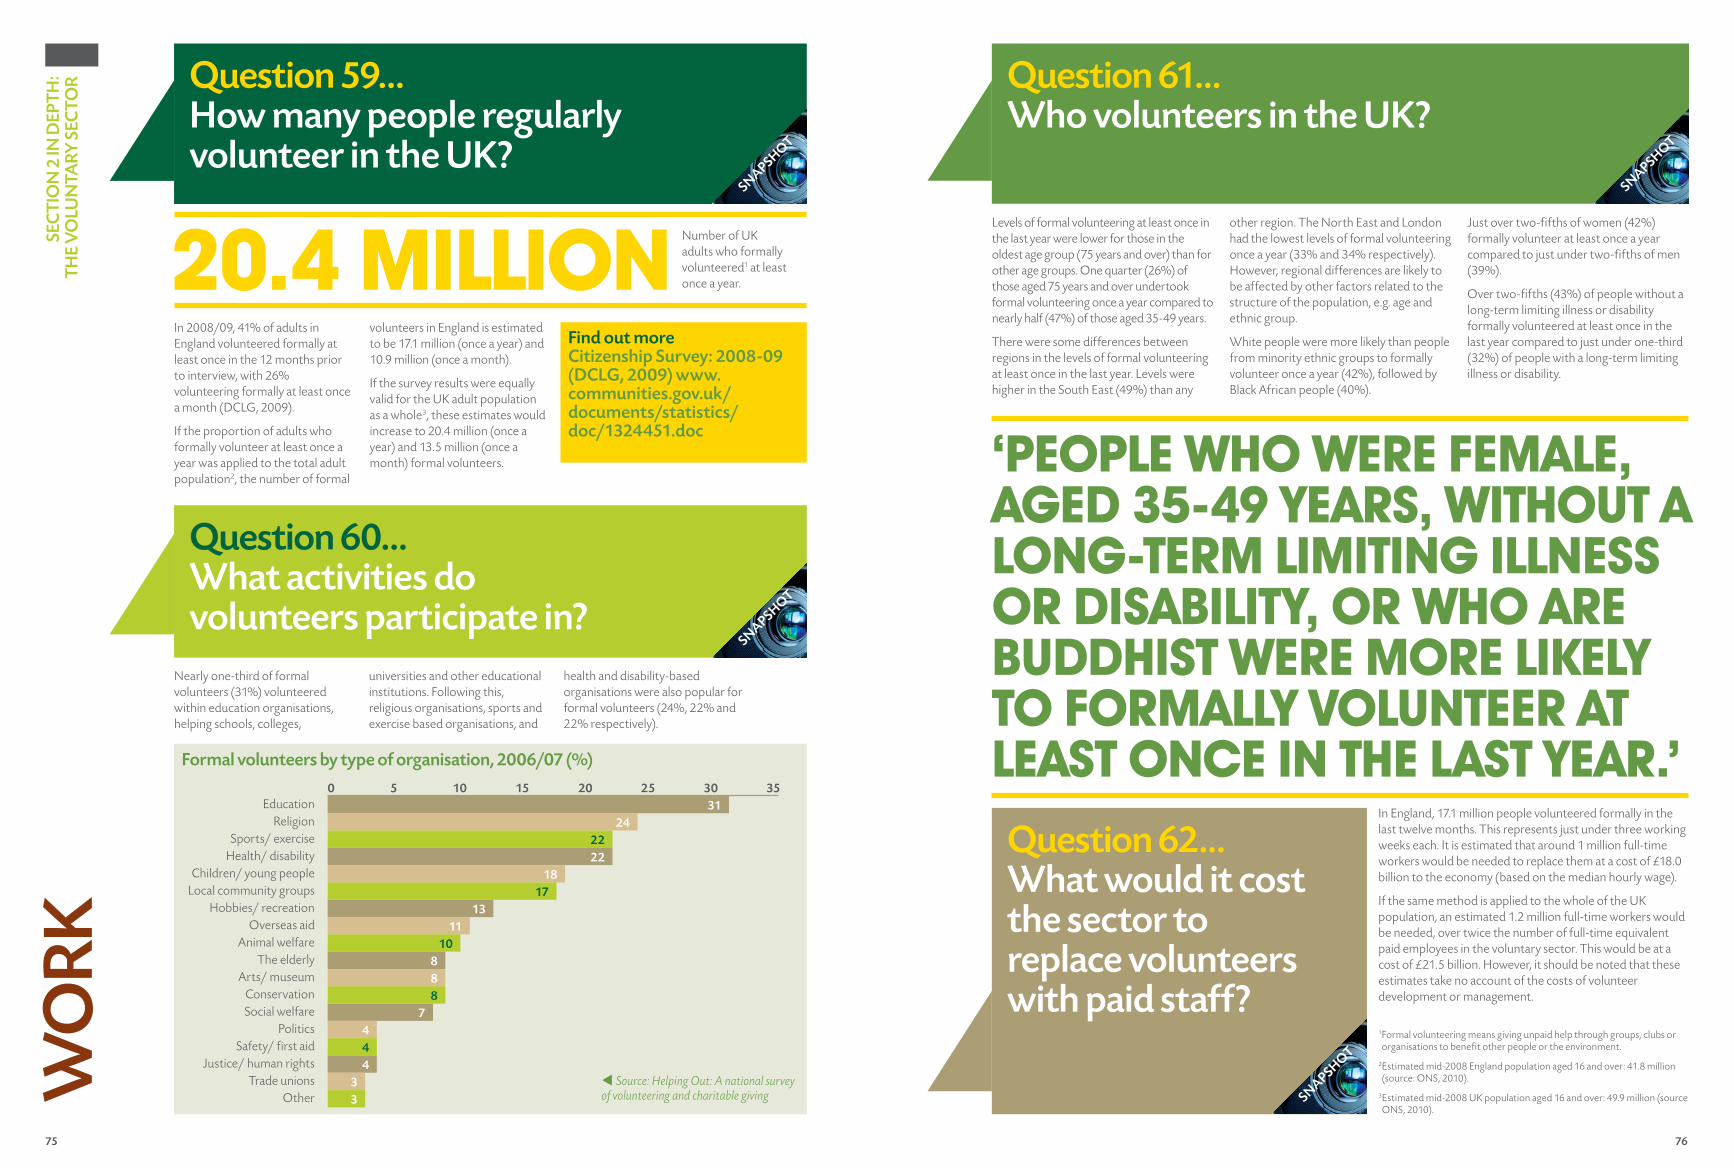
75 76
Formal volunteers by type of organisation, 2006/07 (%)
SE
CT
ION
2 IN
DE
PT
H:
TH
E V
OLU
NTA
RY
SE
CT
OR Question 59…
How many people regularly volunteer in the UK?
SNAPSH
OT
WO
RK
In England, 17.1 million people volunteered formally in the last twelve months. This represents just under three working weeks each. It is estimated that around 1 million full-time workers would be needed to replace them at a cost of £18.0 billion to the economy (based on the median hourly wage).
If the same method is applied to the whole of the UK population, an estimated 1.2 million full-time workers would be needed, over twice the number of full-time equivalent paid employees in the voluntary sector. This would be at a cost of £21.5 billion. However, it should be noted that these estimates take no account of the costs of volunteer development or management.
In 2008/09, 41% of adults in England volunteered formally at least once in the 12 months prior to interview, with 26% volunteering formally at least once a month (DCLG, 2009).
If the proportion of adults who formally volunteer at least once a year was applied to the total adult population2, the number of formal
volunteers in England is estimated to be 17.1 million (once a year) and 10.9 million (once a month).
If the survey results were equally valid for the UK adult population as a whole3, these estimates would increase to 20.4 million (once a year) and 13.5 million (once a month) formal volunteers.
Levels of formal volunteering at least once in the last year were lower for those in the oldest age group (75 years and over) than for other age groups. One quarter (26%) of those aged 75 years and over undertook formal volunteering once a year compared to nearly half (47%) of those aged 35-49 years.
There were some differences between regions in the levels of formal volunteering at least once in the last year. Levels were higher in the South East (49%) than any
other region. The North East and London had the lowest levels of formal volunteering once a year (33% and 34% respectively). However, regional differences are likely to be affected by other factors related to the structure of the population, e.g. age and ethnic group.
White people were more likely than people from minority ethnic groups to formally volunteer once a year (42%), followed by Black African people (40%).
Just over two-fi fths of women (42%) formally volunteer at least once a year compared to just under two-fi fths of men (39%).
Over two-fi fths (43%) of people without a long-term limiting illness or disability formally volunteered at least once in the last year compared to just under one-third (32%) of people with a long-term limiting illness or disability.
Question 62…What would it cost the sector to replace volunteers with paid staff?
SNAPSH
OT
Question 61…Who volunteers in the UK?
SNAPSH
OT
Question 60…What activities do volunteers participate in?
SNAPSH
OT
Nearly one-third of formal volunteers (31%) volunteered within education organisations, helping schools, colleges,
universities and other educational institutions. Following this, religious organisations, sports and exercise based organisations, and
health and disability-based organisations were also popular for formal volunteers (24%, 22% and 22% respectively).
Find out moreCitizenship Survey: 2008-09 (DCLG, 2009) www.communities.gov.uk/documents/statistics/doc/1324451.doc
20.4 MILLION Number of UK adults who formally volunteered1 at least once a year.
0 5 10 15 20 25 30
EducationReligion
Sports/ exerciseHealth/ disability
Children/ young peopleLocal community groups
Hobbies/ recreationOverseas aid
Animal welfareThe elderly
Arts/ museumConservation
Social welfarePolitics
Safety/ fi rst aidJustice/ human rights
Trade unionsOther
35
31
24
22
22
18
17
13
11
10
8
8
8
7
4
4
4
3
3
‘PEOPLE WHO WERE FEMALE, AGED 35-49 YEARS, WITHOUT A LONG-TERM LIMITING ILLNESS OR DISABILITY, OR WHO ARE BUDDHIST WERE MORE LIKELY TO FORMALLY VOLUNTEER AT LEAST ONCE IN THE LAST YEAR.’
t Source: Helping Out: A national survey of volunteering and charitable giving
1 Formal volunteering means giving unpaid help through groups, clubs or organisations to benefi t other people or the environment.
2 Estimated mid-2008 England population aged 16 and over: 41.8 million (source: ONS, 2010).
3 Estimated mid-2008 UK population aged 16 and over: 49.9 million (source ONS, 2010).
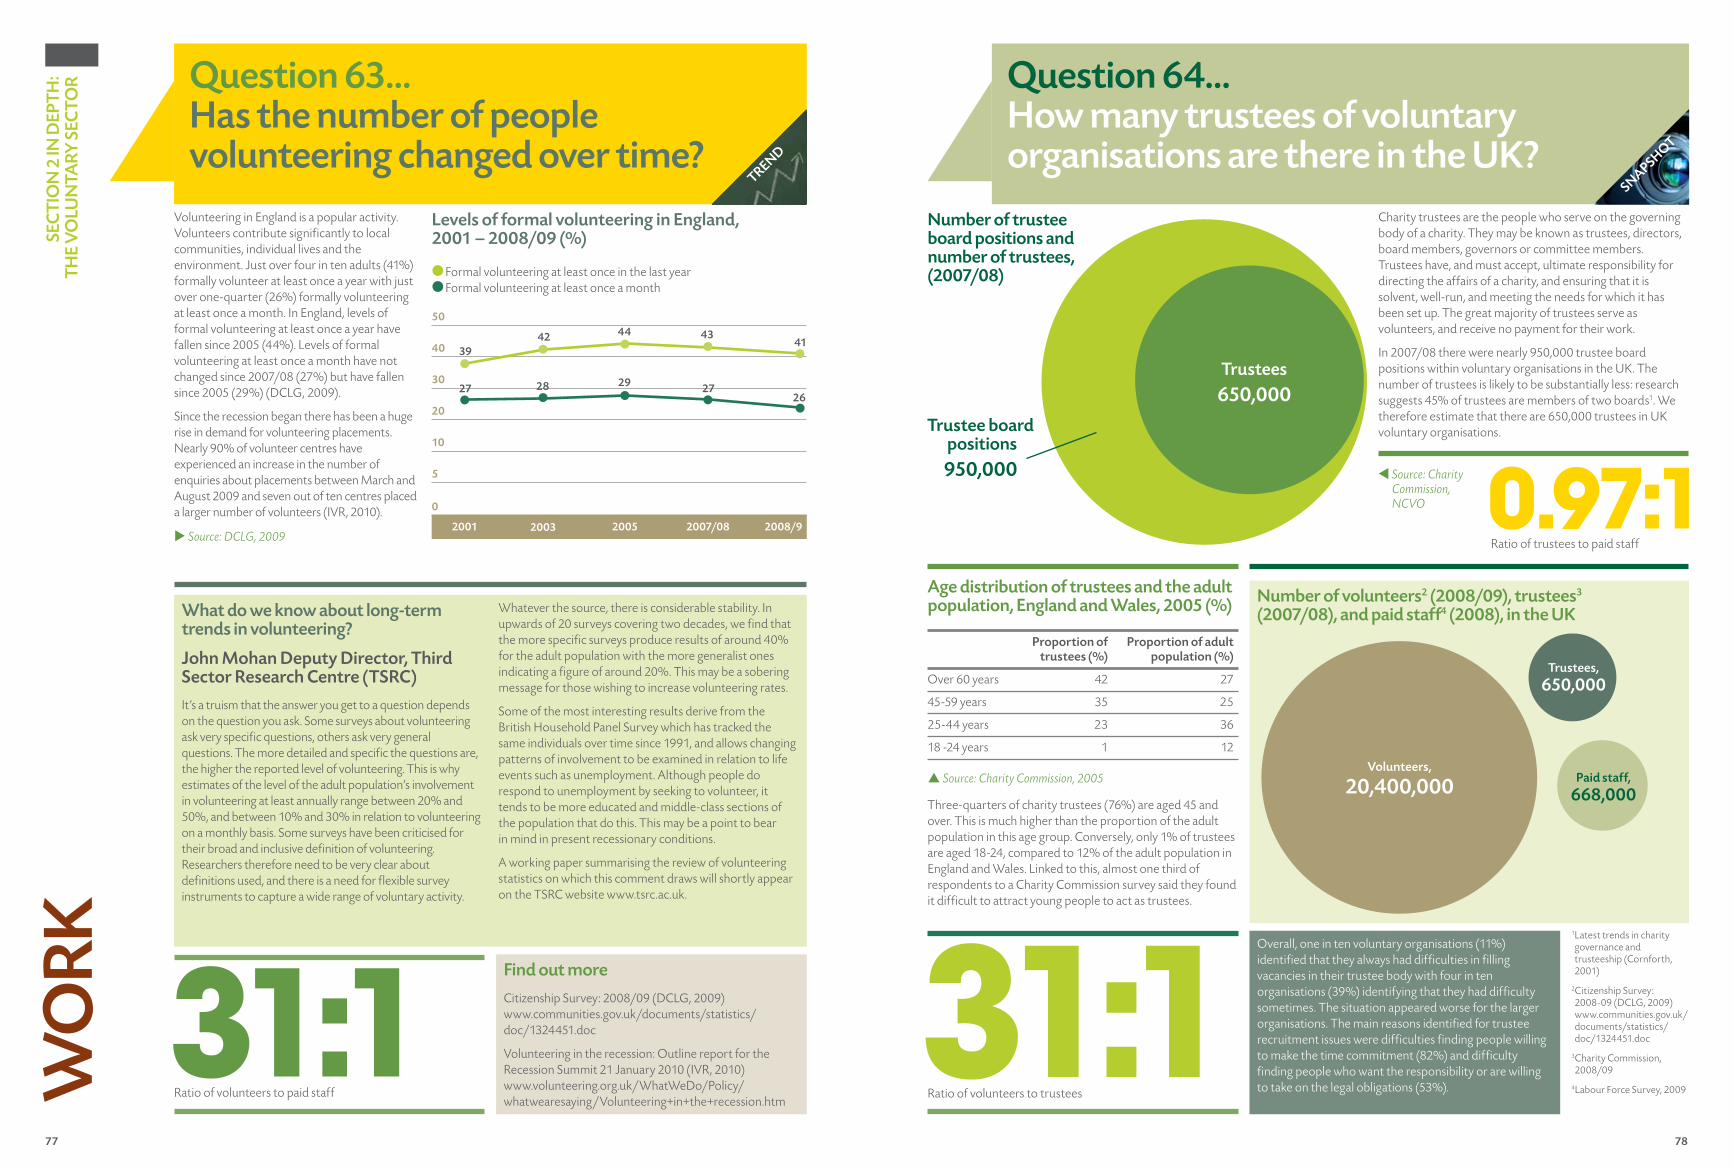
77 78
40
5
10
20
30
0
Question 63...Has the number of people volunteering changed over time?
Question 64...How many trustees of voluntary organisations are there in the UK?
SEC
TIO
N 2
IN D
EPTH
: TH
E V
OLU
NTA
RY S
ECTO
RW
ORK
TREND
Volunteering in England is a popular activity. Volunteers contribute significantly to local communities, individual lives and the environment. Just over four in ten adults (41%) formally volunteer at least once a year with just over one-quarter (26%) formally volunteering at least once a month. In England, levels of formal volunteering at least once a year have fallen since 2005 (44%). Levels of formal volunteering at least once a month have not changed since 2007/08 (27%) but have fallen since 2005 (29%) (DCLG, 2009).
Since the recession began there has been a huge rise in demand for volunteering placements. Nearly 90% of volunteer centres have experienced an increase in the number of enquiries about placements between March and August 2009 and seven out of ten centres placed a larger number of volunteers (IVR, 2010).
SNAPSHOT
Charity trustees are the people who serve on the governing body of a charity. They may be known as trustees, directors, board members, governors or committee members. Trustees have, and must accept, ultimate responsibility for directing the affairs of a charity, and ensuring that it is solvent, well-run, and meeting the needs for which it has been set up. The great majority of trustees serve as volunteers, and receive no payment for their work.
In 2007/08 there were nearly 950,000 trustee board positions within voluntary organisations in the UK. The number of trustees is likely to be substantially less: research suggests 45% of trustees are members of two boards1. We therefore estimate that there are 650,000 trustees in UK voluntary organisations.
Overall, one in ten voluntary organisations (11%) identified that they always had difficulties in filling vacancies in their trustee body with four in ten organisations (39%) identifying that they had difficulty sometimes. The situation appeared worse for the larger organisations. The main reasons identified for trustee recruitment issues were difficulties finding people willing to make the time commitment (82%) and difficulty finding people who want the responsibility or are willing to take on the legal obligations (53%).
0.97:1Ratio of trustees to paid staff
Number of trustee board positions and number of trustees, (2007/08)
t Source: Charity Commission, NCVO
Trustees650,000
Trustee board positions 950,000
Age distribution of trustees and the adult population, England and Wales, 2005 (%)
Proportion of trustees (%)
Proportion of adult population (%)
Over 60 years 42 27
45-59 years 35 25
25-44 years 23 36
18 -24 years 1 12
Three-quarters of charity trustees (76%) are aged 45 and over. This is much higher than the proportion of the adult population in this age group. Conversely, only 1% of trustees are aged 18-24, compared to 12% of the adult population in England and Wales. Linked to this, almost one third of respondents to a Charity Commission survey said they found it difficult to attract young people to act as trustees.
p Source: Charity Commission, 2005
Number of volunteers2 (2008/09), trustees3 (2007/08), and paid staff4 (2008), in the UK
31:1Ratio of volunteers to trustees
Volunteers,
20,400,000
Trustees, 650,000
Paid staff, 668,000
u Source: DCLG, 2009
Levels of formal volunteering in England, 2001 – 2008/09 (%)
2007/082001
Formal volunteering at least once in the last year Formal volunteering at least once a month
2008/9
50
What do we know about long-term trends in volunteering?
John Mohan Deputy Director, Third Sector Research Centre (TSRC)
It’s a truism that the answer you get to a question depends on the question you ask. Some surveys about volunteering ask very specific questions, others ask very general questions. The more detailed and specific the questions are, the higher the reported level of volunteering. This is why estimates of the level of the adult population’s involvement in volunteering at least annually range between 20% and 50%, and between 10% and 30% in relation to volunteering on a monthly basis. Some surveys have been criticised for their broad and inclusive definition of volunteering. Researchers therefore need to be very clear about definitions used, and there is a need for flexible survey instruments to capture a wide range of voluntary activity.
Whatever the source, there is considerable stability. In upwards of 20 surveys covering two decades, we find that the more specific surveys produce results of around 40% for the adult population with the more generalist ones indicating a figure of around 20%. This may be a sobering message for those wishing to increase volunteering rates.
Some of the most interesting results derive from the British Household Panel Survey which has tracked the same individuals over time since 1991, and allows changing patterns of involvement to be examined in relation to life events such as unemployment. Although people do respond to unemployment by seeking to volunteer, it tends to be more educated and middle-class sections of the population that do this. This may be a point to bear in mind in present recessionary conditions.
A working paper summarising the review of volunteering statistics on which this comment draws will shortly appear on the TSRC website www.tsrc.ac.uk.
1 Latest trends in charity governance and trusteeship (Cornforth, 2001)
2 Citizenship Survey: 2008-09 (DCLG, 2009) www.communities.gov.uk/documents/statistics/doc/1324451.doc
3 Charity Commission, 2008/09
4Labour Force Survey, 2009
2003 2005
3942 44 43
41
27 28 29 2726
Find out more
Citizenship Survey: 2008/09 (DCLG, 2009) www.communities.gov.uk/documents/statistics/doc/1324451.doc
Volunteering in the recession: Outline report for the Recession Summit 21 January 2010 (IVR, 2010) www.volunteering.org.uk/WhatWeDo/Policy/whatwearesaying/Volunteering+in+the+recession.htm
31:1Ratio of volunteers to paid staff

79 80
DAT
A B
AN
K
3Section Contents
p81 Scope p83 Income p85 Expenditure p86 Assets

81 82
SEC
TIO
N 3
:D
ATA
BA
NK
SCO
pENumber of
organisationsIncome
(£ millions)Expenditure
(£ millions)Net assets (£ millions)
paid staff
Data quality
General charities 171,100 35,500 32,850 96,630 668,0001 Good
Co-operatives 4,600 24,490 24,030 7,870 16,520 Good
Universities 170 23,440 22,880 26,620 174,9502 Good
Housing associations 1,820 11,570 9,980 60,910 148,100 Good
Independent schools 2,410 6,260 5,880 6,960 53,0902 Good
Building societies 50 4,000 3,090 - 42,300 Good
Trade associations and professional bodies 290 2,070 1,980 2,270 16,880 Good
Trade unions 190 1,040 900 1,130 12,390 Good
Common investment funds 60 640 460 3,740 1,640 Good
Credit unions 490 60 40 590 1,000 Good
Political parties 161 76 68 -19 590 Good
Employee-owned businesses 200 25,000 23,0003 8,0003 110,000 Limited
Financial mutuals 16 7,250 6,8003 - 26,300 Limited
Companies limited by guarantee 22,700 6,100 5,930 1,670 41,100 Limited
Faith groups 13,700 3,780 3,470 15,580 43,700 Limited
Friendly societies 200 1,650 1,5403 17,000 5,000 Limited
Leisure trusts 120 630 5903 - 26,000 Limited
Community interest companies 1,400 600 590 50 4,300 Limited
Benevolent societies 2,200 310 280 2,050 3,200 Limited
Clubs and societies 6,600 200 1903 90 8,600 Limited
GP co-ops and mutuals 40 150 1403 - 8,000 Limited
Football supporter trusts 170 10 103 10 100 Limited
Sports clubs 127,010 5,330 5,090 - 254,000 Poor
Excepted charities 4,000 400 3803 - - Poor
Co-operative trust schools 30 - - - - Poor
Unincorporated organisations 600,000 - - - - Poor
Duplications 59,500 3,200 3,000 7,000 60,800
Total size of civil society 900,000 157,000 115,000 236,000 1,605,000
Total size of civil society (including estimates of missing values)
900,000 157,000 147,000 244,000 1,605,000
▲ Source: NCVO, Various sources
Size of civil society by type of organisation, 2007/08
Number of organisations
Number of organisations (per 1,000 population)
Income (£ millions)
Expenditure (£ millions)
Assets (£ millions)
North East 4,818 1.9 762.0 720.8 1,378.0
North West 14,029 2.0 2,143.3 1,989.3 3,363.9
Yorkshire and the Humber 11,023 2.1 1,615.3 1,520.6 2,301.8
East Midlands 11,617 2.6 1,229.2 1,105.9 2,357.3
West Midlands 12,467 2.3 1,733.9 1,596.8 3,647.5
East of England 17,515 3.1 1,844.5 1,656.9 4,272.9
London 23,081 3.0 14,733.4 13,785.0 53,442.2
South East 25,616 3.1 4,223.0 3,904.3 9,375.7
South West 18,555 3.6 2,573.9 2,329.8 5,951.4
England 138,721 2.7 30,858.5 28,609.4 86,090.7
Wales 8,067 2.7 1,006.6 851.5 1,444.1
Scotland 19,586 3.8 3,062.8 2,840.8 8,358.4
Northern Ireland 4,700 2.6 570.1 544.4 737.5
UK 171,074 2.8 35,498.0 32,846.1 96,630.7
Distribution of voluntary organisations and their financial characteristics by region and UK country, 2007/08
▲ Source: NCVO, GuideStar Data Services, SCVO, NICVA
Distribution of voluntary organisations and their financial characteristics by area of activity, 2007/08
Number of organisations
Income (£ millions)
Expenditure (£ millions)
Assets (£ millions)
Mean income (£)
Culture and recreation 22,443 3,647.5 3,395.6 6,054.5 162,521
Education 7,993 1,312.8 1,220.9 2,642.8 164,245
Parent teacher associations 13,724 180.7 168.1 171.1 13,167
Playgroups and nurseries 8,454 407.0 386.1 164.7 48,146
Research 3,688 2,441.9 2,690.7 19,878.5 662,121
Health 6,470 3,386.6 3,275.6 4,750.2 523,432
Social services 32,870 8,338.0 7,901.0 12,295.3 253,666
Scout groups and youth clubs 6,911 215.6 194.8 378.6 31,196
Environment 5,316 2,382.1 2,175.6 4,248.9 448,091
Community development 15,352 913.1 863.7 1,511.8 59,481
Housing 3,963 1,325.5 1,178.4 4,575.8 334,461
Employment and training 1,671 1,197.6 1,154.2 691.9 716,707
Village halls 5,970 82.0 72.6 206.6 13,732
Law and advocacy 4,033 1,077.3 1,033.8 629.3 267,126
Grant-making foundations 11,687 3,444.6 2,669.1 28,397.1 294,740
Umbrella bodies 1,386 602.9 595.1 620.0 434,985
International 4,857 2,264.9 2,226.6 1,824.0 466,311
Religion 13,974 1,705.4 1,461.2 5,590.5 122,040
Other 312 572.5 182.9 1,999.0 1,835,076
Total 171,074 35,498.0 32,846.1 96,630.6 207,501
▲ Source: NCVO, GuideStar Data Services
1Estimated using the Labour Force Survey2Academic staff only3Value is estimated using ratio of income and expenditure from other parts of civil society
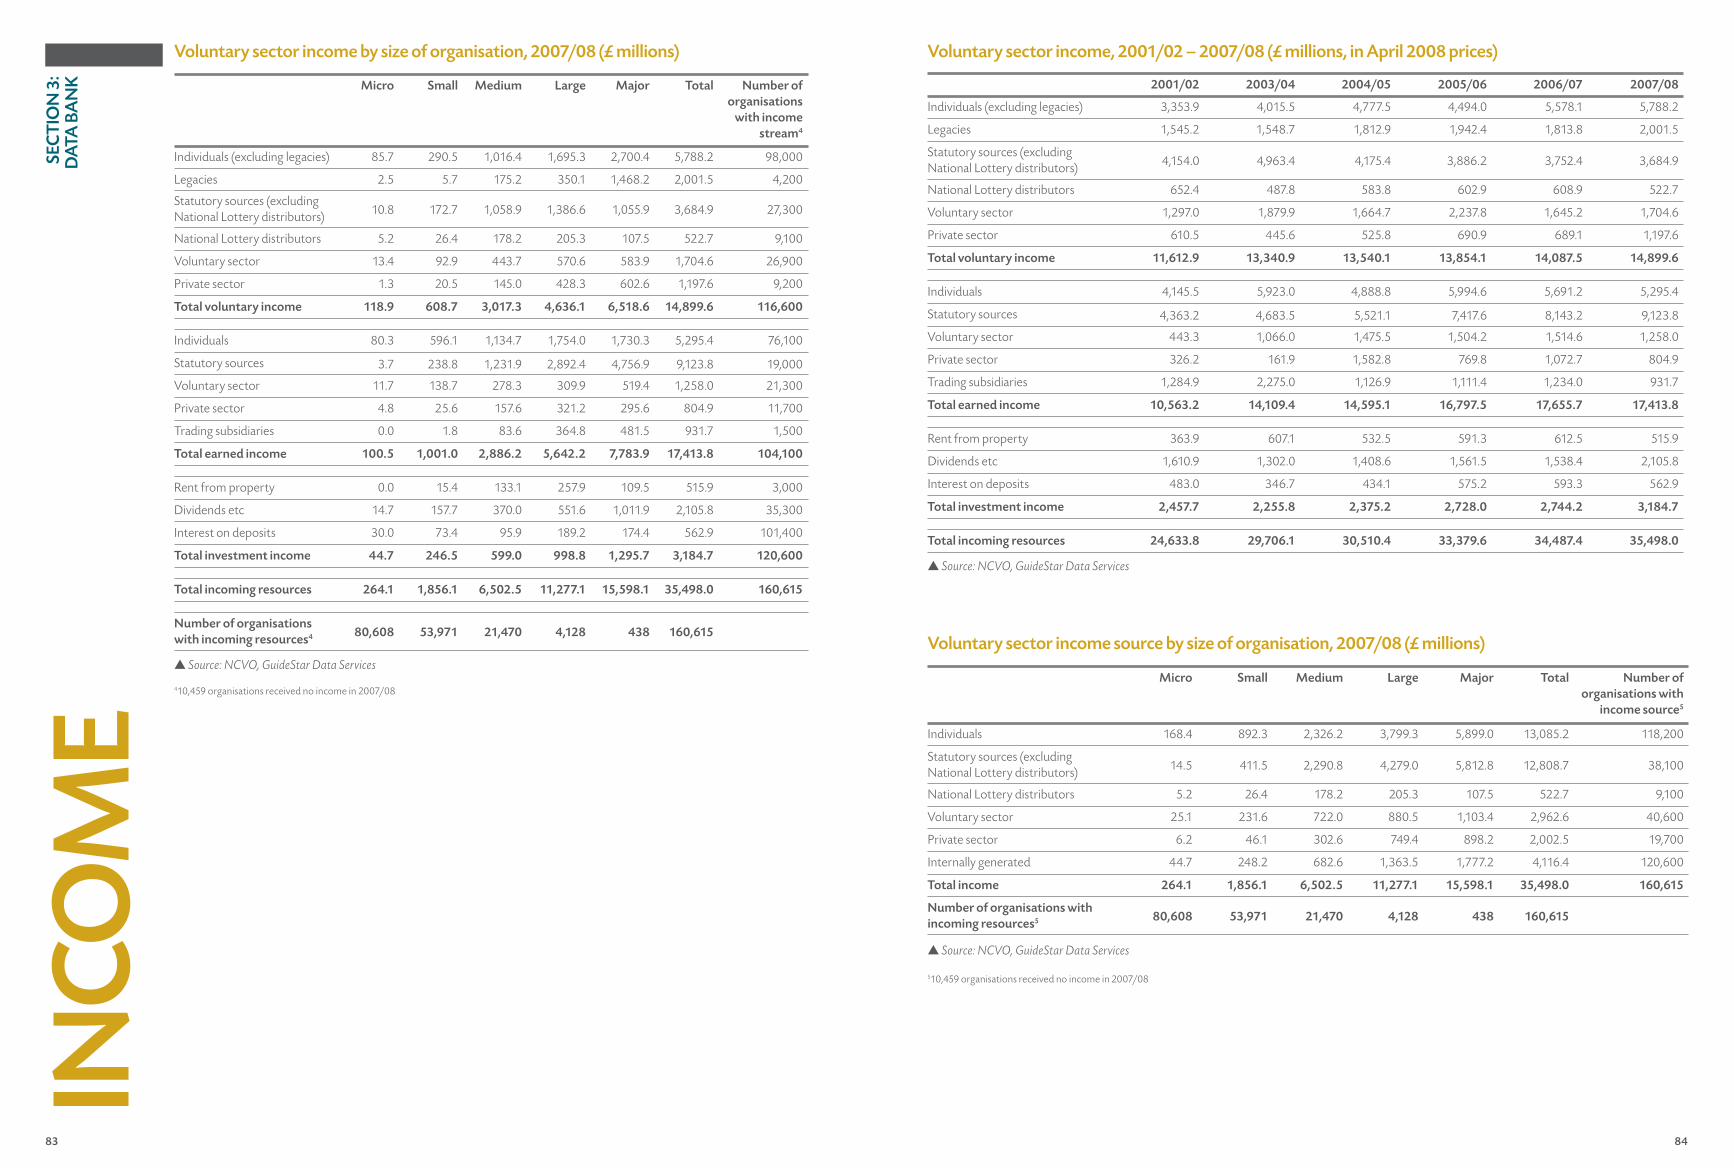
83 84
SEC
TIO
N 3
:D
ATA
BA
NK
INCO
ME
Voluntary sector income by size of organisation, 2007/08 (£ millions) Voluntary sector income, 2001/02 – 2007/08 (£ millions, in April 2008 prices)
Micro Small Medium Large Major Total Number of organisations
with income stream4
Individuals (excluding legacies) 85.7 290.5 1,016.4 1,695.3 2,700.4 5,788.2 98,000
Legacies 2.5 5.7 175.2 350.1 1,468.2 2,001.5 4,200
Statutory sources (excluding National Lottery distributors) 10.8 172.7 1,058.9 1,386.6 1,055.9 3,684.9 27,300
National Lottery distributors 5.2 26.4 178.2 205.3 107.5 522.7 9,100
Voluntary sector 13.4 92.9 443.7 570.6 583.9 1,704.6 26,900
Private sector 1.3 20.5 145.0 428.3 602.6 1,197.6 9,200
Total voluntary income 118.9 608.7 3,017.3 4,636.1 6,518.6 14,899.6 116,600
Individuals 80.3 596.1 1,134.7 1,754.0 1,730.3 5,295.4 76,100
Statutory sources 3.7 238.8 1,231.9 2,892.4 4,756.9 9,123.8 19,000
Voluntary sector 11.7 138.7 278.3 309.9 519.4 1,258.0 21,300
Private sector 4.8 25.6 157.6 321.2 295.6 804.9 11,700
Trading subsidiaries 0.0 1.8 83.6 364.8 481.5 931.7 1,500
Total earned income 100.5 1,001.0 2,886.2 5,642.2 7,783.9 17,413.8 104,100
Rent from property 0.0 15.4 133.1 257.9 109.5 515.9 3,000
Dividends etc 14.7 157.7 370.0 551.6 1,011.9 2,105.8 35,300
Interest on deposits 30.0 73.4 95.9 189.2 174.4 562.9 101,400
Total investment income 44.7 246.5 599.0 998.8 1,295.7 3,184.7 120,600
Total incoming resources 264.1 1,856.1 6,502.5 11,277.1 15,598.1 35,498.0 160,615
Number of organisations with incoming resources4 80,608 53,971 21,470 4,128 438 160,615
▲ Source: NCVO, GuideStar Data Services
2001/02 2003/04 2004/05 2005/06 2006/07 2007/08
Individuals (excluding legacies) 3,353.9 4,015.5 4,777.5 4,494.0 5,578.1 5,788.2
Legacies 1,545.2 1,548.7 1,812.9 1,942.4 1,813.8 2,001.5
Statutory sources (excluding National Lottery distributors) 4,154.0 4,963.4 4,175.4 3,886.2 3,752.4 3,684.9
National Lottery distributors 652.4 487.8 583.8 602.9 608.9 522.7
Voluntary sector 1,297.0 1,879.9 1,664.7 2,237.8 1,645.2 1,704.6
Private sector 610.5 445.6 525.8 690.9 689.1 1,197.6
Total voluntary income 11,612.9 13,340.9 13,540.1 13,854.1 14,087.5 14,899.6
Individuals 4,145.5 5,923.0 4,888.8 5,994.6 5,691.2 5,295.4
Statutory sources 4,363.2 4,683.5 5,521.1 7,417.6 8,143.2 9,123.8
Voluntary sector 443.3 1,066.0 1,475.5 1,504.2 1,514.6 1,258.0
Private sector 326.2 161.9 1,582.8 769.8 1,072.7 804.9
Trading subsidiaries 1,284.9 2,275.0 1,126.9 1,111.4 1,234.0 931.7
Total earned income 10,563.2 14,109.4 14,595.1 16,797.5 17,655.7 17,413.8
Rent from property 363.9 607.1 532.5 591.3 612.5 515.9
Dividends etc 1,610.9 1,302.0 1,408.6 1,561.5 1,538.4 2,105.8
Interest on deposits 483.0 346.7 434.1 575.2 593.3 562.9
Total investment income 2,457.7 2,255.8 2,375.2 2,728.0 2,744.2 3,184.7
Total incoming resources 24,633.8 29,706.1 30,510.4 33,379.6 34,487.4 35,498.0
▲ Source: NCVO, GuideStar Data Services
Voluntary sector income source by size of organisation, 2007/08 (£ millions)
▲ Source: NCVO, GuideStar Data Services
Micro Small Medium Large Major Total Number of organisations with
income source5
Individuals 168.4 892.3 2,326.2 3,799.3 5,899.0 13,085.2 118,200
Statutory sources (excluding National Lottery distributors) 14.5 411.5 2,290.8 4,279.0 5,812.8 12,808.7 38,100
National Lottery distributors 5.2 26.4 178.2 205.3 107.5 522.7 9,100
Voluntary sector 25.1 231.6 722.0 880.5 1,103.4 2,962.6 40,600
Private sector 6.2 46.1 302.6 749.4 898.2 2,002.5 19,700
Internally generated 44.7 248.2 682.6 1,363.5 1,777.2 4,116.4 120,600
Total income 264.1 1,856.1 6,502.5 11,277.1 15,598.1 35,498.0 160,615
Number of organisations with incoming resources5 80,608 53,971 21,470 4,128 438 160,615
410,459 organisations received no income in 2007/08
510,459 organisations received no income in 2007/08
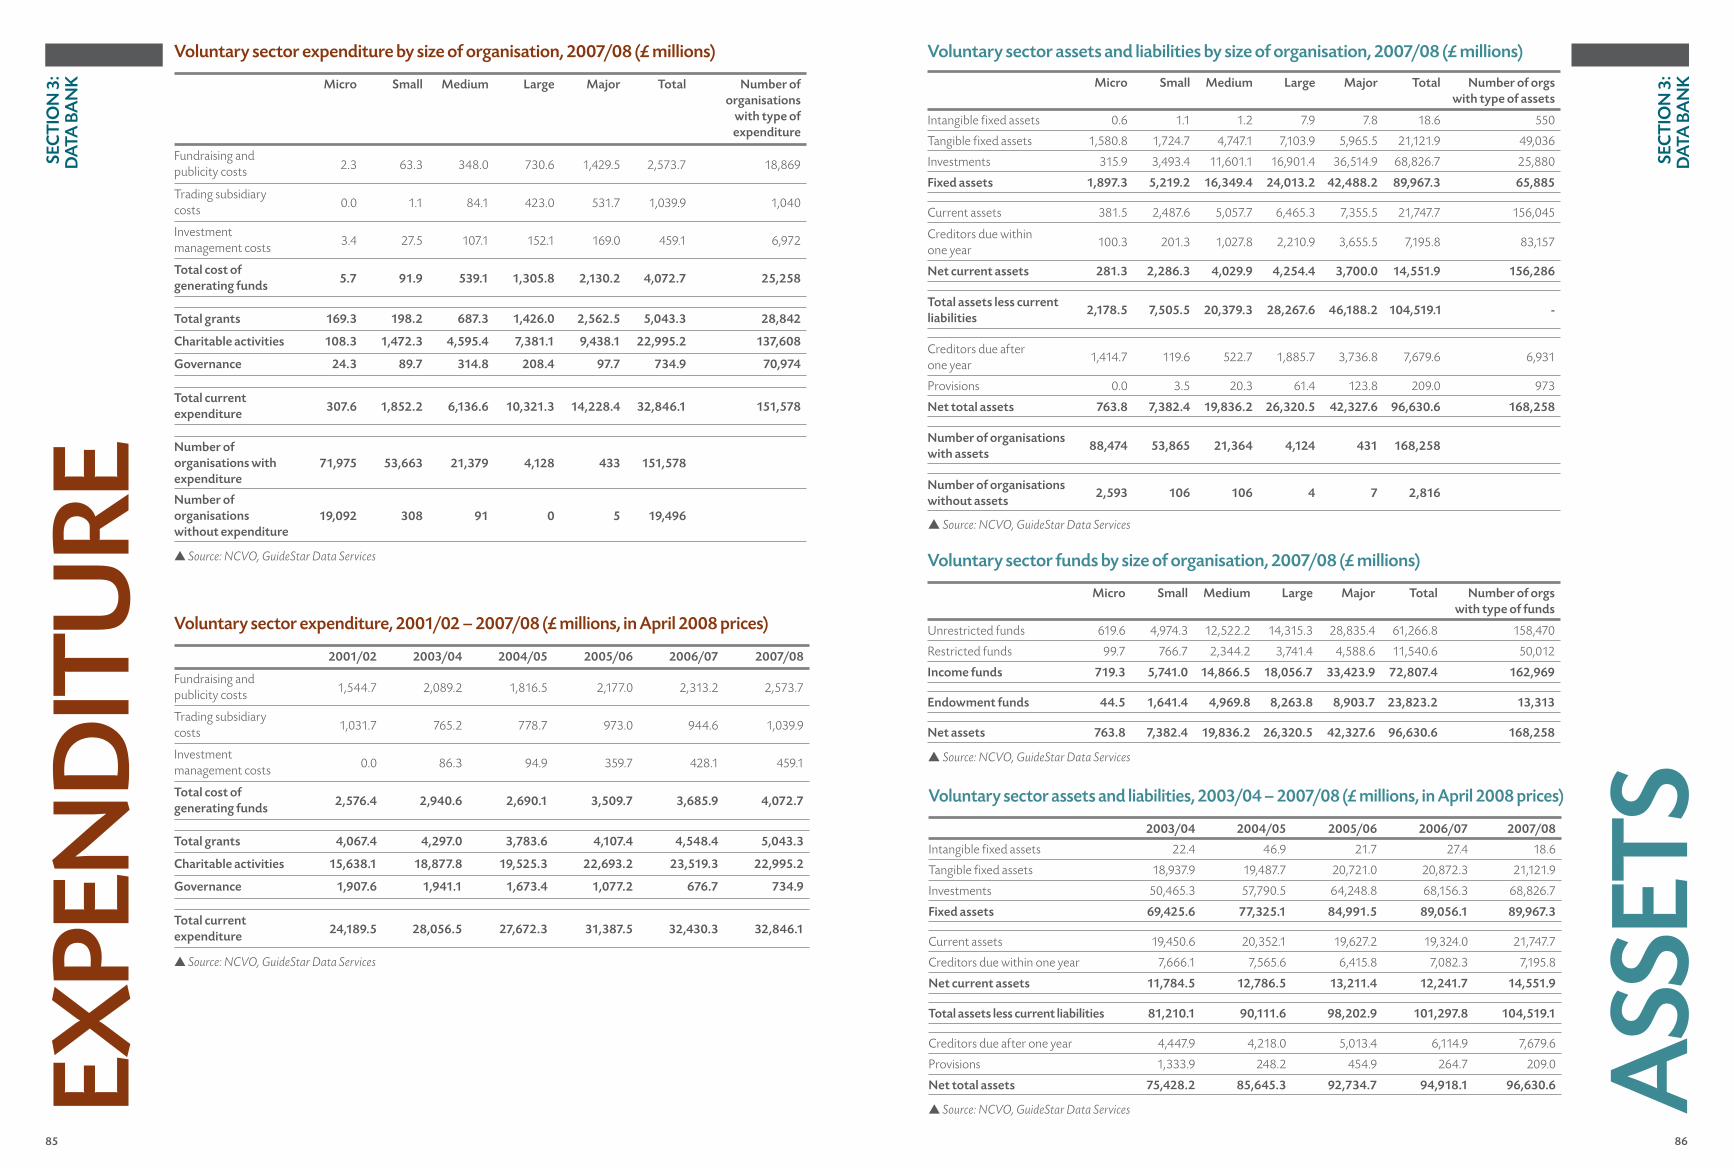
85 86
SEC
TIO
N 3
:D
ATA
BA
NK
ExpE
ND
ITU
rEVoluntary sector expenditure by size of organisation, 2007/08 (£ millions)
Micro Small Medium Large Major Total Number of organisations
with type of expenditure
Fundraising and publicity costs 2.3 63.3 348.0 730.6 1,429.5 2,573.7 18,869
Trading subsidiary costs 0.0 1.1 84.1 423.0 531.7 1,039.9 1,040
Investment management costs 3.4 27.5 107.1 152.1 169.0 459.1 6,972
Total cost of generating funds 5.7 91.9 539.1 1,305.8 2,130.2 4,072.7 25,258
Total grants 169.3 198.2 687.3 1,426.0 2,562.5 5,043.3 28,842
Charitable activities 108.3 1,472.3 4,595.4 7,381.1 9,438.1 22,995.2 137,608
Governance 24.3 89.7 314.8 208.4 97.7 734.9 70,974
Total current expenditure 307.6 1,852.2 6,136.6 10,321.3 14,228.4 32,846.1 151,578
Number of organisations with expenditure
71,975 53,663 21,379 4,128 433 151,578
Number of organisations without expenditure
19,092 308 91 0 5 19,496
Voluntary sector expenditure, 2001/02 – 2007/08 (£ millions, in April 2008 prices)
▲ Source: NCVO, GuideStar Data Services
ASS
ETS
SEC
TIO
N 3
:D
ATA
BA
NK
Voluntary sector assets and liabilities by size of organisation, 2007/08 (£ millions)
Micro Small Medium Large Major Total Number of orgs with type of assets
Intangible fixed assets 0.6 1.1 1.2 7.9 7.8 18.6 550
Tangible fixed assets 1,580.8 1,724.7 4,747.1 7,103.9 5,965.5 21,121.9 49,036
Investments 315.9 3,493.4 11,601.1 16,901.4 36,514.9 68,826.7 25,880
Fixed assets 1,897.3 5,219.2 16,349.4 24,013.2 42,488.2 89,967.3 65,885
Current assets 381.5 2,487.6 5,057.7 6,465.3 7,355.5 21,747.7 156,045
Creditors due within one year
100.3 201.3 1,027.8 2,210.9 3,655.5 7,195.8 83,157
Net current assets 281.3 2,286.3 4,029.9 4,254.4 3,700.0 14,551.9 156,286
Total assets less current liabilities
2,178.5 7,505.5 20,379.3 28,267.6 46,188.2 104,519.1 -
Creditors due after one year
1,414.7 119.6 522.7 1,885.7 3,736.8 7,679.6 6,931
Provisions 0.0 3.5 20.3 61.4 123.8 209.0 973
Net total assets 763.8 7,382.4 19,836.2 26,320.5 42,327.6 96,630.6 168,258
Number of organisations with assets
88,474 53,865 21,364 4,124 431 168,258
Number of organisations without assets
2,593 106 106 4 7 2,816
p Source: NCVO, GuideStar Data Services
Voluntary sector funds by size of organisation, 2007/08 (£ millions)
Micro Small Medium Large Major Total Number of orgs with type of funds
Unrestricted funds 619.6 4,974.3 12,522.2 14,315.3 28,835.4 61,266.8 158,470
Restricted funds 99.7 766.7 2,344.2 3,741.4 4,588.6 11,540.6 50,012
Income funds 719.3 5,741.0 14,866.5 18,056.7 33,423.9 72,807.4 162,969
Endowment funds 44.5 1,641.4 4,969.8 8,263.8 8,903.7 23,823.2 13,313
Net assets 763.8 7,382.4 19,836.2 26,320.5 42,327.6 96,630.6 168,258
p Source: NCVO, GuideStar Data Services
Voluntary sector assets and liabilities, 2003/04 – 2007/08 (£ millions, in April 2008 prices)
2003/04 2004/05 2005/06 2006/07 2007/08
Intangible fixed assets 22.4 46.9 21.7 27.4 18.6
Tangible fixed assets 18,937.9 19,487.7 20,721.0 20,872.3 21,121.9
Investments 50,465.3 57,790.5 64,248.8 68,156.3 68,826.7
Fixed assets 69,425.6 77,325.1 84,991.5 89,056.1 89,967.3
Current assets 19,450.6 20,352.1 19,627.2 19,324.0 21,747.7
Creditors due within one year 7,666.1 7,565.6 6,415.8 7,082.3 7,195.8
Net current assets 11,784.5 12,786.5 13,211.4 12,241.7 14,551.9
Total assets less current liabilities 81,210.1 90,111.6 98,202.9 101,297.8 104,519.1
Creditors due after one year 4,447.9 4,218.0 5,013.4 6,114.9 7,679.6
Provisions 1,333.9 248.2 454.9 264.7 209.0
Net total assets 75,428.2 85,645.3 92,734.7 94,918.1 96,630.6
▲ Source: NCVO, GuideStar Data Services
2001/02 2003/04 2004/05 2005/06 2006/07 2007/08
Fundraising and publicity costs 1,544.7 2,089.2 1,816.5 2,177.0 2,313.2 2,573.7
Trading subsidiary costs 1,031.7 765.2 778.7 973.0 944.6 1,039.9
Investment management costs 0.0 86.3 94.9 359.7 428.1 459.1
Total cost of generating funds 2,576.4 2,940.6 2,690.1 3,509.7 3,685.9 4,072.7
Total grants 4,067.4 4,297.0 3,783.6 4,107.4 4,548.4 5,043.3
Charitable activities 15,638.1 18,877.8 19,525.3 22,693.2 23,519.3 22,995.2
Governance 1,907.6 1,941.1 1,673.4 1,077.2 676.7 734.9
Total current expenditure 24,189.5 28,056.5 27,672.3 31,387.5 32,430.3 32,846.1
▲ Source: NCVO, GuideStar Data Services

87 88
APP
END
ICES
4Section Contents
p89 Methodology p91 Glossary p92 Acronyms and abbreviations p92 The authors p93 Acknowledgements
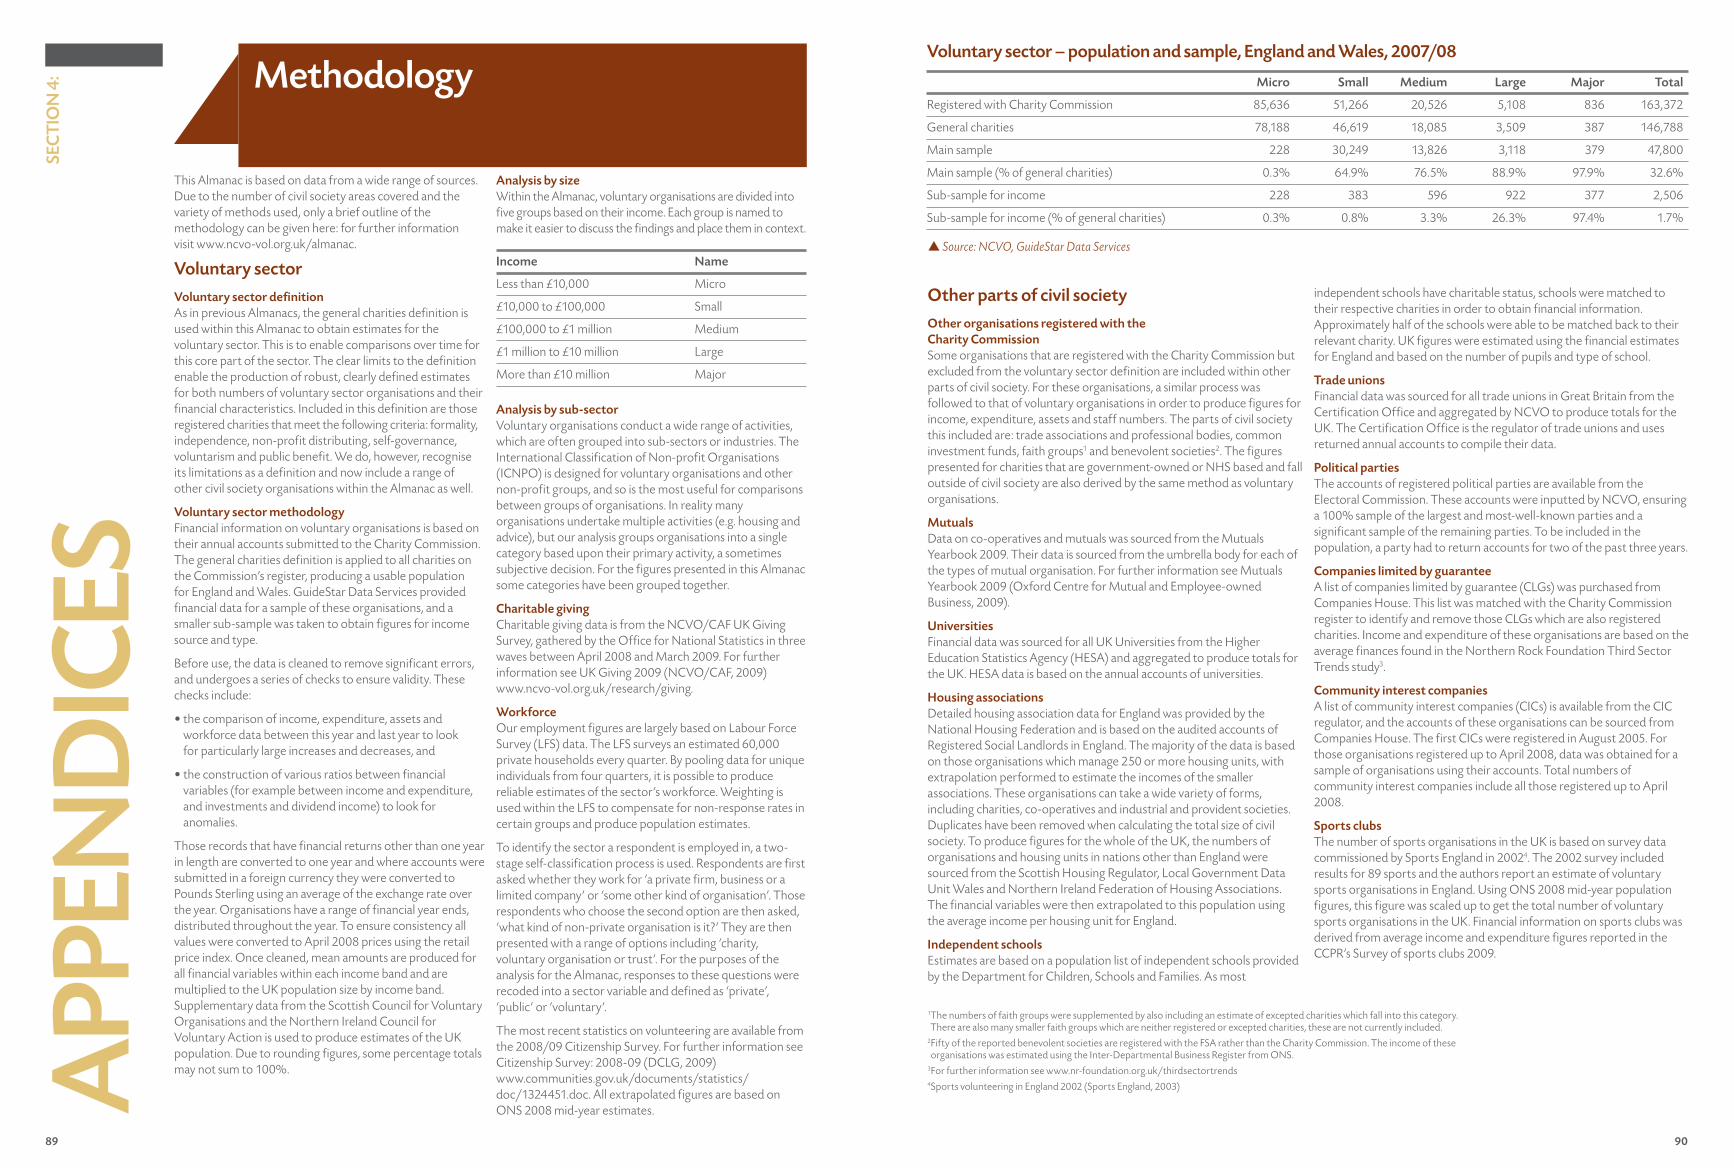
89 90
SEC
TIO
N 4
:
APP
END
ICES
This Almanac is based on data from a wide range of sources. Due to the number of civil society areas covered and the variety of methods used, only a brief outline of the methodology can be given here: for further information visit www.ncvo-vol.org.uk/almanac.
Voluntary sector
Voluntary sector definitionAs in previous Almanacs, the general charities definition is used within this Almanac to obtain estimates for the voluntary sector. This is to enable comparisons over time for this core part of the sector. The clear limits to the definition enable the production of robust, clearly defined estimates for both numbers of voluntary sector organisations and their financial characteristics. Included in this definition are those registered charities that meet the following criteria: formality, independence, non-profit distributing, self-governance, voluntarism and public benefit. We do, however, recognise its limitations as a definition and now include a range of other civil society organisations within the Almanac as well.
Voluntary sector methodologyFinancial information on voluntary organisations is based on their annual accounts submitted to the Charity Commission. The general charities definition is applied to all charities on the Commission’s register, producing a usable population for England and Wales. GuideStar Data Services provided financial data for a sample of these organisations, and a smaller sub-sample was taken to obtain figures for income source and type.
Before use, the data is cleaned to remove significant errors, and undergoes a series of checks to ensure validity. These checks include:
• the comparison of income, expenditure, assets and workforce data between this year and last year to look for particularly large increases and decreases, and
• the construction of various ratios between financial variables (for example between income and expenditure, and investments and dividend income) to look for anomalies.
Those records that have financial returns other than one year in length are converted to one year and where accounts were submitted in a foreign currency they were converted to Pounds Sterling using an average of the exchange rate over the year. Organisations have a range of financial year ends, distributed throughout the year. To ensure consistency all values were converted to April 2008 prices using the retail price index. Once cleaned, mean amounts are produced for all financial variables within each income band and are multiplied to the UK population size by income band. Supplementary data from the Scottish Council for Voluntary Organisations and the Northern Ireland Council for Voluntary Action is used to produce estimates of the UK population. Due to rounding figures, some percentage totals may not sum to 100%.
1 The numbers of faith groups were supplemented by also including an estimate of excepted charities which fall into this category. There are also many smaller faith groups which are neither registered or excepted charities, these are not currently included.
2 Fifty of the reported benevolent societies are registered with the FSA rather than the Charity Commission. The income of these organisations was estimated using the Inter-Departmental Business Register from ONS.
3 For further information see www.nr-foundation.org.uk/thirdsectortrends 4Sports volunteering in England 2002 (Sports England, 2003)
Methodology
Analysis by sizeWithin the Almanac, voluntary organisations are divided into five groups based on their income. Each group is named to make it easier to discuss the findings and place them in context.
Analysis by sub-sectorVoluntary organisations conduct a wide range of activities, which are often grouped into sub-sectors or industries. The International Classification of Non-profit Organisations (ICNPO) is designed for voluntary organisations and other non-profit groups, and so is the most useful for comparisons between groups of organisations. In reality many organisations undertake multiple activities (e.g. housing and advice), but our analysis groups organisations into a single category based upon their primary activity, a sometimes subjective decision. For the figures presented in this Almanac some categories have been grouped together.
Charitable givingCharitable giving data is from the NCVO/CAF UK Giving Survey, gathered by the Office for National Statistics in three waves between April 2008 and March 2009. For further information see UK Giving 2009 (NCVO/CAF, 2009) www.ncvo-vol.org.uk/research/giving.
WorkforceOur employment figures are largely based on Labour Force Survey (LFS) data. The LFS surveys an estimated 60,000 private households every quarter. By pooling data for unique individuals from four quarters, it is possible to produce reliable estimates of the sector’s workforce. Weighting is used within the LFS to compensate for non-response rates in certain groups and produce population estimates.
To identify the sector a respondent is employed in, a two-stage self-classification process is used. Respondents are first asked whether they work for ‘a private firm, business or a limited company’ or ‘some other kind of organisation’. Those respondents who choose the second option are then asked, ‘what kind of non-private organisation is it?’ They are then presented with a range of options including ‘charity, voluntary organisation or trust’. For the purposes of the analysis for the Almanac, responses to these questions were recoded into a sector variable and defined as ‘private’, ‘public’ or ‘voluntary’.
The most recent statistics on volunteering are available from the 2008/09 Citizenship Survey. For further information see Citizenship Survey: 2008-09 (DCLG, 2009) www.communities.gov.uk/documents/statistics/doc/1324451.doc. All extrapolated figures are based on ONS 2008 mid-year estimates.
p Source: NCVO, GuideStar Data Services
Voluntary sector – population and sample, England and Wales, 2007/08
Micro Small Medium Large Major Total
Registered with Charity Commission 85,636 51,266 20,526 5,108 836 163,372
General charities 78,188 46,619 18,085 3,509 387 146,788
Main sample 228 30,249 13,826 3,118 379 47,800
Main sample (% of general charities) 0.3% 64.9% 76.5% 88.9% 97.9% 32.6%
Sub-sample for income 228 383 596 922 377 2,506
Sub-sample for income (% of general charities) 0.3% 0.8% 3.3% 26.3% 97.4% 1.7%
Other parts of civil society
Other organisations registered with the Charity CommissionSome organisations that are registered with the Charity Commission but excluded from the voluntary sector definition are included within other parts of civil society. For these organisations, a similar process was followed to that of voluntary organisations in order to produce figures for income, expenditure, assets and staff numbers. The parts of civil society this included are: trade associations and professional bodies, common investment funds, faith groups1 and benevolent societies2. The figures presented for charities that are government-owned or NHS based and fall outside of civil society are also derived by the same method as voluntary organisations.
MutualsData on co-operatives and mutuals was sourced from the Mutuals Yearbook 2009. Their data is sourced from the umbrella body for each of the types of mutual organisation. For further information see Mutuals Yearbook 2009 (Oxford Centre for Mutual and Employee-owned Business, 2009).
UniversitiesFinancial data was sourced for all UK Universities from the Higher Education Statistics Agency (HESA) and aggregated to produce totals for the UK. HESA data is based on the annual accounts of universities.
Housing associationsDetailed housing association data for England was provided by the National Housing Federation and is based on the audited accounts of Registered Social Landlords in England. The majority of the data is based on those organisations which manage 250 or more housing units, with extrapolation performed to estimate the incomes of the smaller associations. These organisations can take a wide variety of forms, including charities, co-operatives and industrial and provident societies. Duplicates have been removed when calculating the total size of civil society. To produce figures for the whole of the UK, the numbers of organisations and housing units in nations other than England were sourced from the Scottish Housing Regulator, Local Government Data Unit Wales and Northern Ireland Federation of Housing Associations. The financial variables were then extrapolated to this population using the average income per housing unit for England.
Independent schoolsEstimates are based on a population list of independent schools provided by the Department for Children, Schools and Families. As most
Income Name
Less than £10,000 Micro
£10,000 to £100,000 Small
£100,000 to £1 million Medium
£1 million to £10 million Large
More than £10 million Major
independent schools have charitable status, schools were matched to their respective charities in order to obtain financial information. Approximately half of the schools were able to be matched back to their relevant charity. UK figures were estimated using the financial estimates for England and based on the number of pupils and type of school.
Trade unionsFinancial data was sourced for all trade unions in Great Britain from the Certification Office and aggregated by NCVO to produce totals for the UK. The Certification Office is the regulator of trade unions and uses returned annual accounts to compile their data.
Political partiesThe accounts of registered political parties are available from the Electoral Commission. These accounts were inputted by NCVO, ensuring a 100% sample of the largest and most-well-known parties and a significant sample of the remaining parties. To be included in the population, a party had to return accounts for two of the past three years.
Companies limited by guaranteeA list of companies limited by guarantee (CLGs) was purchased from Companies House. This list was matched with the Charity Commission register to identify and remove those CLGs which are also registered charities. Income and expenditure of these organisations are based on the average finances found in the Northern Rock Foundation Third Sector Trends study3.
Community interest companiesA list of community interest companies (CICs) is available from the CIC regulator, and the accounts of these organisations can be sourced from Companies House. The first CICs were registered in August 2005. For those organisations registered up to April 2008, data was obtained for a sample of organisations using their accounts. Total numbers of community interest companies include all those registered up to April 2008.
Sports clubsThe number of sports organisations in the UK is based on survey data commissioned by Sports England in 20024. The 2002 survey included results for 89 sports and the authors report an estimate of voluntary sports organisations in England. Using ONS 2008 mid-year population figures, this figure was scaled up to get the total number of voluntary sports organisations in the UK. Financial information on sports clubs was derived from average income and expenditure figures reported in the CCPR’s Survey of sports clubs 2009.
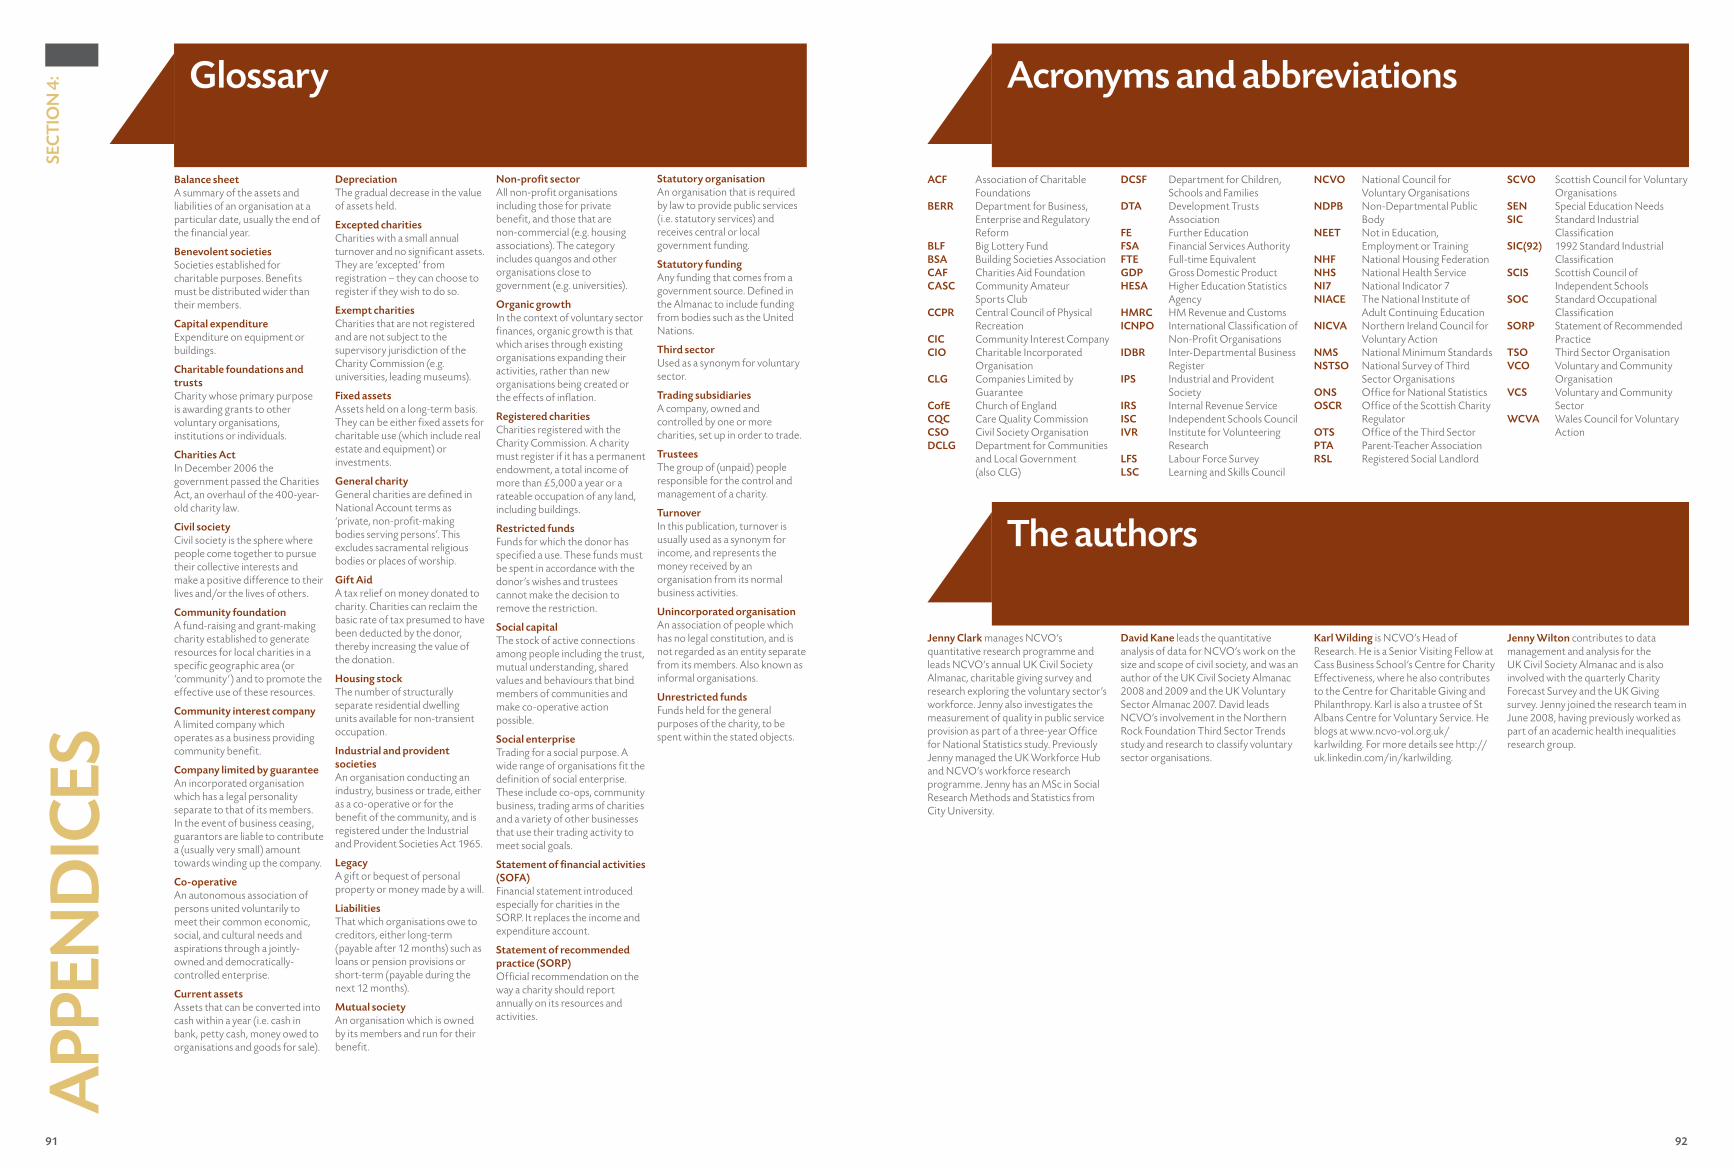
91 92
SEC
TIO
N 4
:
APP
END
ICES
Balance sheet A summary of the assets and liabilities of an organisation at a particular date, usually the end of the financial year.
Benevolent societies Societies established for charitable purposes. Benefits must be distributed wider than their members.
Capital expenditure Expenditure on equipment or buildings.
Charitable foundations and trusts Charity whose primary purpose is awarding grants to other voluntary organisations, institutions or individuals.
Charities Act In December 2006 the government passed the Charities Act, an overhaul of the 400-year-old charity law.
Civil society Civil society is the sphere where people come together to pursue their collective interests and make a positive difference to their lives and/or the lives of others.
Community foundation A fund-raising and grant-making charity established to generate resources for local charities in a specific geographic area (or ‘community’) and to promote the effective use of these resources.
Community interest company A limited company which operates as a business providing community benefit.
Company limited by guarantee An incorporated organisation which has a legal personality separate to that of its members. In the event of business ceasing, guarantors are liable to contribute a (usually very small) amount towards winding up the company.
Co-operative An autonomous association of persons united voluntarily to meet their common economic, social, and cultural needs and aspirations through a jointly-owned and democratically-controlled enterprise.
Current assets Assets that can be converted into cash within a year (i.e. cash in bank, petty cash, money owed to organisations and goods for sale).
Depreciation The gradual decrease in the value of assets held.
Excepted charities Charities with a small annual turnover and no significant assets. They are ‘excepted’ from registration – they can choose to register if they wish to do so.
Exempt charities Charities that are not registered and are not subject to the supervisory jurisdiction of the Charity Commission (e.g. universities, leading museums).
Fixed assets Assets held on a long-term basis. They can be either fixed assets for charitable use (which include real estate and equipment) or investments.
General charity General charities are defined in National Account terms as ‘private, non-profit-making bodies serving persons’. This excludes sacramental religious bodies or places of worship.
Gift Aid A tax relief on money donated to charity. Charities can reclaim the basic rate of tax presumed to have been deducted by the donor, thereby increasing the value of the donation.
Housing stock The number of structurally separate residential dwelling units available for non-transient occupation.
Industrial and provident societies An organisation conducting an industry, business or trade, either as a co-operative or for the benefit of the community, and is registered under the Industrial and Provident Societies Act 1965.
Legacy A gift or bequest of personal property or money made by a will.
Liabilities That which organisations owe to creditors, either long-term (payable after 12 months) such as loans or pension provisions or short-term (payable during the next 12 months).
Mutual society An organisation which is owned by its members and run for their benefit.
Non-profit sector All non-profit organisations including those for private benefit, and those that are non-commercial (e.g. housing associations). The category includes quangos and other organisations close to government (e.g. universities).
Organic growth In the context of voluntary sector finances, organic growth is that which arises through existing organisations expanding their activities, rather than new organisations being created or the effects of inflation.
Registered charities Charities registered with the Charity Commission. A charity must register if it has a permanent endowment, a total income of more than £5,000 a year or a rateable occupation of any land, including buildings.
Restricted funds Funds for which the donor has specified a use. These funds must be spent in accordance with the donor’s wishes and trustees cannot make the decision to remove the restriction.
Social capital The stock of active connections among people including the trust, mutual understanding, shared values and behaviours that bind members of communities and make co-operative action possible.
Social enterprise Trading for a social purpose. A wide range of organisations fit the definition of social enterprise. These include co-ops, community business, trading arms of charities and a variety of other businesses that use their trading activity to meet social goals.
Statement of financial activities (SOFA) Financial statement introduced especially for charities in the SORP. It replaces the income and expenditure account.
Statement of recommended practice (SORP) Official recommendation on the way a charity should report annually on its resources and activities.
Statutory organisation An organisation that is required by law to provide public services (i.e. statutory services) and receives central or local government funding.
Statutory funding Any funding that comes from a government source. Defined in the Almanac to include funding from bodies such as the United Nations.
Third sector Used as a synonym for voluntary sector.
Trading subsidiaries A company, owned and controlled by one or more charities, set up in order to trade.
Trustees The group of (unpaid) people responsible for the control and management of a charity.
Turnover In this publication, turnover is usually used as a synonym for income, and represents the money received by an organisation from its normal business activities.
Unincorporated organisation An association of people which has no legal constitution, and is not regarded as an entity separate from its members. Also known as informal organisations.
Unrestricted funds Funds held for the general purposes of the charity, to be spent within the stated objects.
Glossary
ACF Association of Charitable Foundations
BERR Department for Business, Enterprise and Regulatory Reform
BLF Big Lottery FundBSA Building Societies AssociationCAF Charities Aid FoundationCASC Community Amateur
Sports ClubCCPR Central Council of Physical
RecreationCIC Community Interest CompanyCIO Charitable Incorporated
OrganisationCLG Companies Limited by
GuaranteeCofE Church of EnglandCQC Care Quality CommissionCSO Civil Society OrganisationDCLG Department for Communities
and Local Government (also CLG)
DCSF Department for Children, Schools and Families
DTA Development Trusts Association
FE Further EducationFSA Financial Services AuthorityFTE Full-time EquivalentGDP Gross Domestic ProductHESA Higher Education Statistics
AgencyHMRC HM Revenue and CustomsICNPO International Classification of
Non-Profit OrganisationsIDBR Inter-Departmental Business
RegisterIPS Industrial and Provident
SocietyIRS Internal Revenue ServiceISC Independent Schools CouncilIVR Institute for Volunteering
ResearchLFS Labour Force SurveyLSC Learning and Skills Council
NCVO National Council for Voluntary Organisations
NDPB Non-Departmental Public Body
NEET Not in Education, Employment or Training
NHF National Housing FederationNHS National Health ServiceNI7 National Indicator 7NIACE The National Institute of
Adult Continuing EducationNICVA Northern Ireland Council for
Voluntary ActionNMS National Minimum StandardsNSTSO National Survey of Third
Sector OrganisationsONS Office for National StatisticsOSCR Office of the Scottish Charity
RegulatorOTS Office of the Third SectorPTA Parent-Teacher AssociationRSL Registered Social Landlord
SCVO Scottish Council for Voluntary Organisations
SEN Special Education NeedsSIC Standard Industrial
ClassificationSIC(92) 1992 Standard Industrial
ClassificationSCIS Scottish Council of
Independent SchoolsSOC Standard Occupational
ClassificationSORP Statement of Recommended
PracticeTSO Third Sector OrganisationVCO Voluntary and Community
OrganisationVCS Voluntary and Community
SectorWCVA Wales Council for Voluntary
Action
Acronyms and abbreviations
Jenny Clark manages NCVO’s quantitative research programme and leads NCVO’s annual UK Civil Society Almanac, charitable giving survey and research exploring the voluntary sector’s workforce. Jenny also investigates the measurement of quality in public service provision as part of a three-year Office for National Statistics study. Previously Jenny managed the UK Workforce Hub and NCVO’s workforce research programme. Jenny has an MSc in Social Research Methods and Statistics from City University.
David Kane leads the quantitative analysis of data for NCVO’s work on the size and scope of civil society, and was an author of the UK Civil Society Almanac 2008 and 2009 and the UK Voluntary Sector Almanac 2007. David leads NCVO’s involvement in the Northern Rock Foundation Third Sector Trends study and research to classify voluntary sector organisations.
Karl Wilding is NCVO’s Head of Research. He is a Senior Visiting Fellow at Cass Business School’s Centre for Charity Effectiveness, where he also contributes to the Centre for Charitable Giving and Philanthropy. Karl is also a trustee of St Albans Centre for Voluntary Service. He blogs at www.ncvo-vol.org.uk/karlwilding. For more details see http://uk.linkedin.com/in/karlwilding.
Jenny Wilton contributes to data management and analysis for the UK Civil Society Almanac and is also involved with the quarterly Charity Forecast Survey and the UK Giving survey. Jenny joined the research team in June 2008, having previously worked as part of an academic health inequalities research group.
The authors
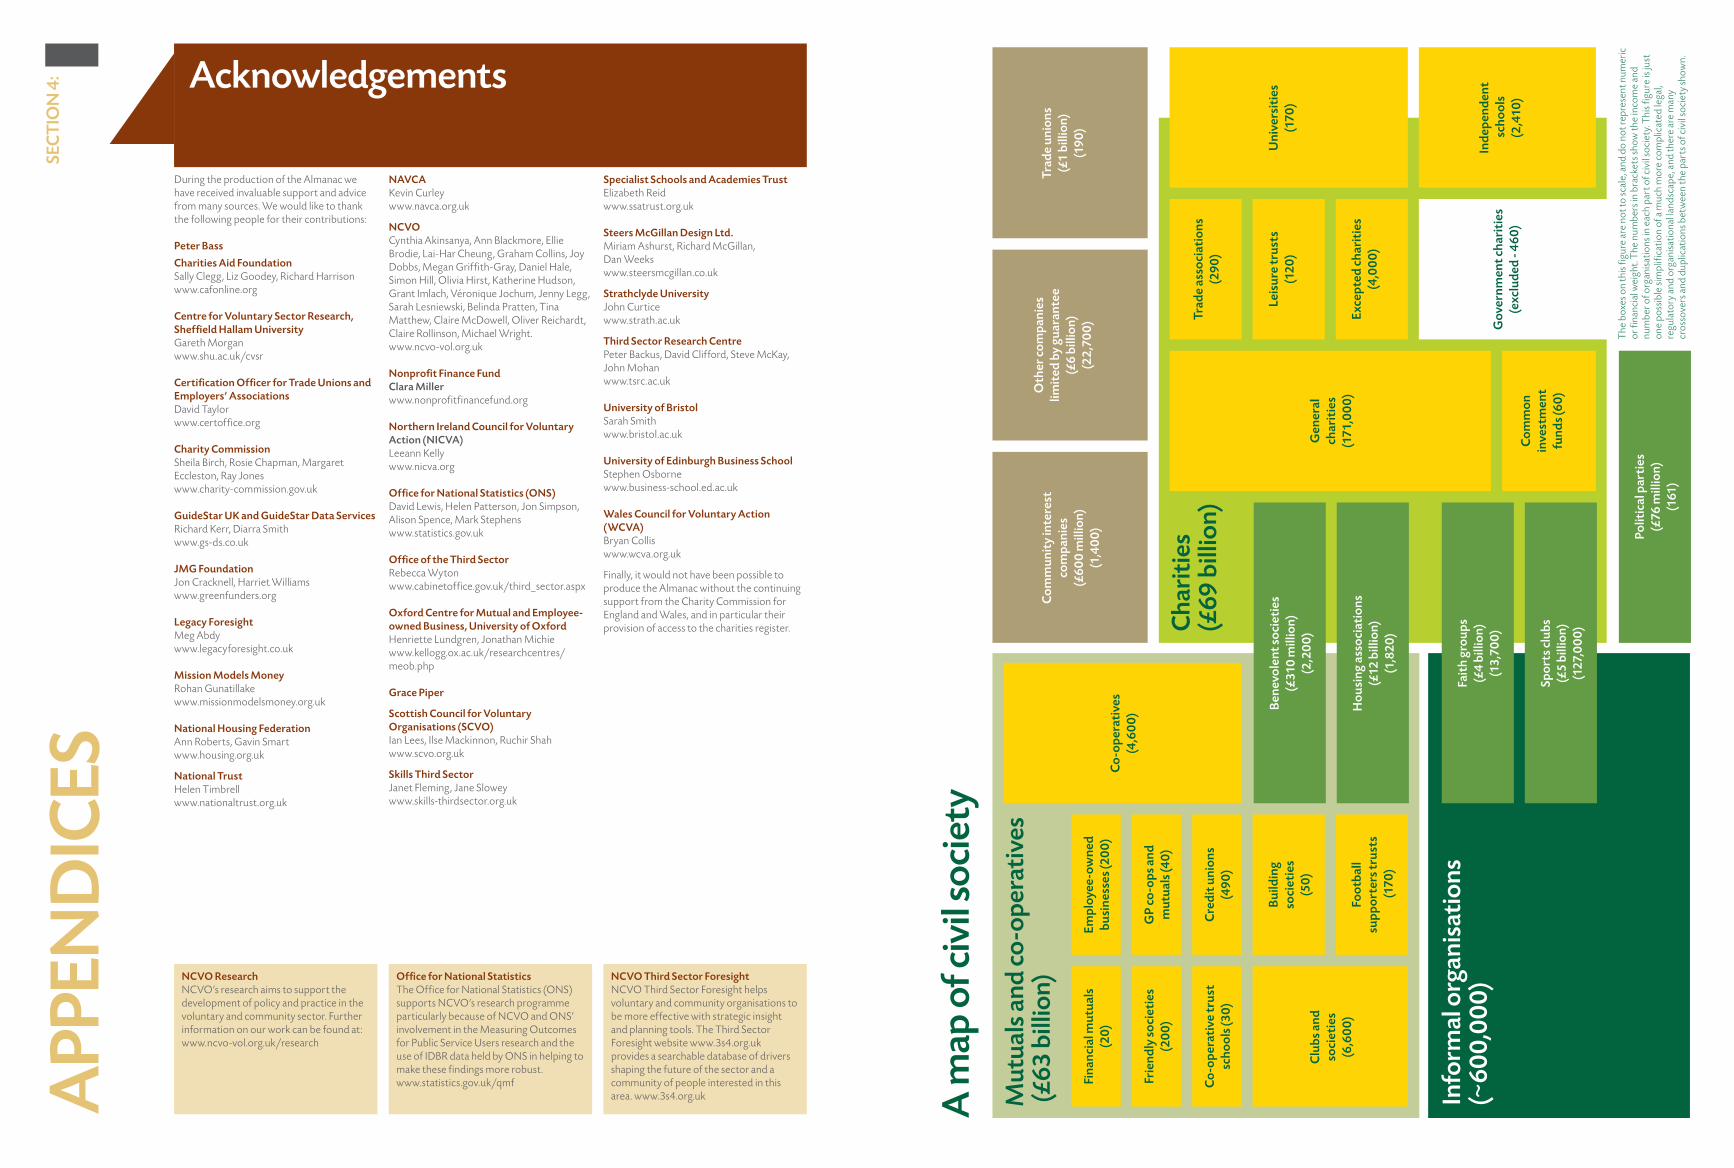
�v v
1Adjusted to April 2008 prices.2Due to improvements in methodology the civil society results are not yet directly comparable year-on-year.
Civil society 2007/08 2006/071
Number of organisations 900,000 *2
Total income £157 billion *2
Civil society paid workforce (headcount) 1.6 million *2
Voluntary organisations 2007/08 2006/07
Number of voluntary organisations 171,074 170,905
Total income £35.5 billion £34.5 billion
Voluntary income £14.9 billion £14.1 billion
Earned income £17.4 billion £17.7 billion
Investment income £3.2 billion £2.7 billion
Income from individuals £13.1 billion £13.1 billion
Income from statutory sources £12.8 billion £11.9 billion
Income from National Lottery distributors £523 million £609 million
Income from other sources £9.1 billion £8.9 billion
Total current expenditure £32.8 billion £32.4 billion
Expenditure on charitable activities (excluding grants) £23.0 billion £23.5 billion
Expenditure on grants £5.0 billion £4.5 billion
Expenditure on generating funds £4.1 billion £3.7 billion
Expenditure on governance £735 million £676 million
Net assets £96.6 billion £94.9 billion
Giving 2008/09 2007/08
Mean amount donated per person in last four weeks £31 £33
Proportion giving to charity
Men 49% 51%
Women 58% 58%
Workforce 2008 2007
UK voluntary sector paid workforce (headcount) 668,000 634,000
Employment status
Full-time 63% 63%
Part-time 37% 37%
Gender Female 68% 71%
Male 32% 29%
Volunteering 2008/09 2007/08
Number of people formally volunteering
at least once a month 26% 27%
at least once a year 41% 43%
Fast facts
A m
ap o
f civ
il so
ciet
y
Cha
riti
es
(£69
bill
ion)
Mut
uals
and
co
-ope
rati
ves
(£63
bill
ion)
Fina
ncia
l mut
uals
(20)
Frie
ndly
soci
etie
s(2
00)
Co
-ope
rati
ve tr
ust
scho
ols (
30)
Clu
bs a
nd
soci
etie
s(6
,60
0)
Empl
oyee
-ow
ned
busi
ness
es (2
00)
GP
co-o
ps a
nd
mut
uals
(40)
Cre
dit u
nion
s(4
90)
Bui
ldin
g so
ciet
ies
(50)
Foot
ball
supp
orte
rs tr
usts
(170
)
Co
-ope
rati
ves
(4,6
00)
Info
rmal
org
anis
atio
ns(~
600,
000)
Com
mun
ity
inte
rest
co
mpa
nies
(£60
0 m
illio
n)(1
,40
0)
Ben
evol
ent s
ocie
ties
(£31
0 m
illio
n)(2
,20
0)
Hou
sing
ass
ocia
tion
s(£
12 b
illio
n)(1
,820
)
Fait
h gr
oups
(£4
billi
on)
(13,
700)
Spor
ts c
lubs
(£5
billi
on)
(127
,00
0)
Gen
eral
ch
arit
ies
(171
,00
0)
Com
mon
in
vest
men
t fu
nds (
60)
Polit
ical
par
ties
(£76
mill
ion)
(1
61)
Trad
e as
soci
atio
ns(2
90)
Leis
ure
trus
ts(1
20)
Exce
pted
cha
riti
es(4
,00
0)
Uni
vers
itie
s(1
70)
Gov
ernm
ent c
hari
ties
(e
xclu
ded
- 460
)
Inde
pend
ent
scho
ols
(2,4
10)
Trad
e un
ions
(£1
billi
on)
(190
)
Oth
er c
ompa
nies
lim
ited
by
guar
ante
e(£
6 bi
llion
)(2
2,70
0)
The
box
es o
n th
is fig
ure
are
not t
o sc
ale,
and
do
not r
epre
sent
num
eric
or
fina
ncia
l wei
ght.
The
num
bers
in b
rack
ets s
how
the
inco
me
and
num
ber o
f org
anis
atio
ns in
eac
h pa
rt o
f civ
il so
ciet
y. T
his fi
gure
is ju
st
one
poss
ible
sim
plifi
catio
n of
a m
uch
mor
e co
mpl
icat
ed le
gal,
regu
lato
ry a
nd o
rgan
isat
iona
l lan
dsca
pe, a
nd th
ere
are
man
y cr
osso
vers
and
dup
licat
ions
bet
wee
n th
e pa
rts o
f civ
il so
ciet
y sh
own.
SEC
TIO
N 4
:
APP
END
ICES
During the production of the Almanac we have received invaluable support and advice from many sources. We would like to thank the following people for their contributions:
Peter Bass
Char�t�es A�d Foundat�on Sally Clegg, Liz Goodey, Richard Harrison www.cafonline.org
Centre for Voluntary Sector Research, Sheffield Hallam Un�vers�ty Gareth Morgan www.shu.ac.uk/cvsr
Cert�ficat�on Officer for Trade Un�ons and Employers’ Assoc�at�ons David Taylor www.certoffice.org
Char�ty Comm�ss�on Sheila Birch, Rosie Chapman, Margaret Eccleston, Ray Jones www.charity-commission.gov.uk
Gu�deStar UK and Gu�deStar Data Serv�ces Richard Kerr, Diarra Smith www.gs-ds.co.uk
JMG Foundat�on Jon Cracknell, Harriet Williams www.greenfunders.org
Legacy Fores�ght Meg Abdy www.legacyforesight.co.uk
M�ss�on Models Money Rohan Gunatillake www.missionmodelsmoney.org.uk
Nat�onal Hous�ng Federat�on Ann Roberts, Gavin Smart www.housing.org.uk
Nat�onal Trust Helen Timbrell www.nationaltrust.org.uk
NAVCA Kevin Curley www.navca.org.uk
NCVO Cynthia Akinsanya, Ann Blackmore, Ellie Brodie, Lai-Har Cheung, Graham Collins, Joy Dobbs, Megan Griffith-Gray, Daniel Hale, Simon Hill, Olivia Hirst, Katherine Hudson, Grant Imlach, Véronique Jochum, Jenny Legg, Sarah Lesniewski, Belinda Pratten, Tina Matthew, Claire McDowell, Oliver Reichardt, Claire Rollinson, Michael Wright. www.ncvo-vol.org.uk
Nonprofit F�nance Fund Clara M�ller www.nonprofitfinancefund.org
Northern Ireland Counc�l for Voluntary Act�on (NICVA) Leeann Kelly www.nicva.org
Office for Nat�onal Stat�st�cs (ONS) David Lewis, Helen Patterson, Jon Simpson, Alison Spence, Mark Stephens www.statistics.gov.uk
Office of the Th�rd Sector Rebecca Wyton www.cabinetoffice.gov.uk/third_sector.aspx
Oxford Centre for Mutual and Employee-owned Bus�ness, Un�vers�ty of Oxford Henriette Lundgren, Jonathan Michie www.kellogg.ox.ac.uk/researchcentres/meob.php
Grace P�per
Scott�sh Counc�l for Voluntary Organ�sat�ons (SCVO) Ian Lees, Ilse Mackinnon, Ruchir Shah www.scvo.org.uk
Sk�lls Th�rd Sector Janet Fleming, Jane Slowey www.skills-thirdsector.org.uk
Spec�al�st Schools and Academ�es Trust Elizabeth Reid www.ssatrust.org.uk
Steers McG�llan Des�gn Ltd. Miriam Ashurst, Richard McGillan, Dan Weeks www.steersmcgillan.co.uk
Strathclyde Un�vers�ty John Curtice www.strath.ac.uk
Th�rd Sector Research Centre Peter Backus, David Clifford, Steve McKay, John Mohan www.tsrc.ac.uk
Un�vers�ty of Br�stol Sarah Smith www.bristol.ac.uk
Un�vers�ty of Ed�nburgh Bus�ness School Stephen Osborne www.business-school.ed.ac.uk
Wales Counc�l for Voluntary Act�on (WCVA) Bryan Collis www.wcva.org.uk
Finally, it would not have been possible to produce the Almanac without the continuing support from the Charity Commission for England and Wales, and in particular their provision of access to the charities register.
Acknowledgements
NCVO Research NCVO’s research aims to support the development of policy and practice in the voluntary and community sector. Further information on our work can be found at: www.ncvo-vol.org.uk/research
NCVO Th�rd Sector Fores�ght NCVO Third Sector Foresight helps voluntary and community organisations to be more effective with strategic insight and planning tools. The Third Sector Foresight website www.3s4.org.uk provides a searchable database of drivers shaping the future of the sector and a community of people interested in this area. www.3s4.org.uk
Office for Nat�onal Stat�st�cs The Office for National Statistics (ONS) supports NCVO’s research programme particularly because of NCVO and ONS’ involvement in the Measuring Outcomes for Public Service Users research and the use of IDBR data held by ONS in helping to make these findings more robust. www.statistics.gov.uk/qmf
National Council for Voluntary Organisations Regent’s Wharf 8 All Saints Street London N1 9RL
T: 020 7713 6161 F: 020 7713 6300 E: [email protected] www.ncvo-vol.org.uk
Textphone: 0800 01 88 111
Charity Registration: 225922
The paper used for this publication is sourced from sustainable forests.
SteersMcGillan Design Ltd 01225 465546
£125
This publication can be made available in large print and alternative formats on request.
Please contact NCVO on 020 7713 6161 for more information.
The new Civil Society Almanac – now in its 10th edition – is a completely revised, easy-to-use version of NCVO’s major annual reference publication. It draws together trends, facts and information from our own research programme, plus the latest available data from government surveys, academic research, and research by voluntary organisations.
The Almanac is aimed at policy makers and practitioners with an interest in voluntary organisations and civil society. It reports key trends and characteristics on a range of topics, including funding and finance, spending, workforce and employment, volunteering and beneficiaries. The Almanac focuses on how voluntary organisations at the heart of civil society have changed over the last decade, often comparing trends with the public and private sectors.
NCVO believes its members and those with a stake in civil society need the best quality evidence base to help them inform policy and practice and plan for the future.
To find our more about our research visit www.ncvo-vol.org.uk/research or our dedicated futures programme, www.3s4.org.uk.
‘In attempting to gauge civil society in this way, the Almanac is breaking new ground.’
The Guardian
Related Documents


