Jejak Vol 13 (1) (2020): 170-187 DOI: https://doi.org/10.15294/jejak.v13i1.22816 JEJAK Journal of Economics and Policy http://journal.unnes.ac.id/nju/index.php/jejak Economic Growth in Indonesian New Outonomous: Social-Economic Perspective Mahameru Rosy Rochmatullah 1 , 2 Jaka Winarna, 3 Evi Gantyowati 1 Faculty of Economics and Business, Muhammadiyah University, Surakarta 2,3 Faculty of Economics and Business, Sebelas Maret University, Surakarta Permalink/DOI: https://doi.org/10.15294/jejak.v13i1.22816 Received: December 2019; Accepted: January 2020; Published: march 2020 Abstract This study explores the Indonesian economic growth in the new autonomous regions using social - economy perspective. More specifically, social - economic issues are proxied on population, poverty rates, education levels, local tax revenues, and distribution of local government social assistance. Meanwhile, community economic growth is proxied by GRDP per capita (PE). The Indonesian economic growth and social-economy issues are measured using Ordinary Least Square (OLS). This study uses new autonomous regions data in Indonesia formed in 2003 – 2008. Employing multiple linear regression, the test results revealed that variable of local tax revenue (PD) was consistently able to explain PE. The same results are shown in the robustness test, where researchers predict the economic growth of the community with the Human Development Index (HDI). In the discussion section, community economic growth represented by PE continues to increase along with the increase in PD and HDI. The conclusion in this study is community economic growth increased since 2009, marked by an increase in PD along with HDI. As an implication, researchers suggest that practitioners and academics use local taxes to measure the community economy in new autonomous regions in Indonesia. Key words : New Autonomous Regions, Social-Economy Issues, GRDP per Capita, Local Tax Revenue, Human Development How to Cite: Rochmatullah, M., Winarna, J., & Gantyowatiti, E. (2020). Economic Growth in Indonesian New Outonomous: Social-Economic Perspective. JEJAK: Jurnal Ekonomi dan Kebijakan, 13(1). doi:https://doi.org/10.15294/jejak.v13i1.22816 Corresponding author : Mahameru Rosy Rochmatullah Address: Jl.A.Yani Tromol Pos 2 Pabelan Sukoharjo E-mail: [email protected] p-ISSN 1979-715X e-ISSN 2460-5123

Welcome message from author
This document is posted to help you gain knowledge. Please leave a comment to let me know what you think about it! Share it to your friends and learn new things together.
Transcript
Jejak Vol 13 (1) (2020): 170-187 DOI: https://doi.org/10.15294/jejak.v13i1.22816
JEJAK Journal of Economics and Policy
http://journal.unnes.ac.id/nju/index.php/jejak
Economic Growth in Indonesian New Outonomous: Social-Economic Perspective
Mahameru Rosy Rochmatullah1 , 2Jaka Winarna, 3Evi Gantyowati
1Faculty of Economics and Business, Muhammadiyah University, Surakarta 2,3Faculty of Economics and Business, Sebelas Maret University, Surakarta
Permalink/DOI: https://doi.org/10.15294/jejak.v13i1.22816
Received: December 2019; Accepted: January 2020; Published: march 2020
Abstract
This study explores the Indonesian economic growth in the new autonomous regions using social - economy perspective. More specifically, social - economic issues are proxied on population, poverty rates, education levels, local tax revenues, and distribution of local government social assistance. Meanwhile, community economic growth is proxied by GRDP per capita (PE). The Indonesian economic growth and social-economy issues are measured using Ordinary Least Square (OLS). This study uses new autonomous regions data in Indonesia formed in 2003 – 2008. Employing multiple linear regression, the test results revealed that variable of local tax revenue (PD) was consistently able to explain PE. The same results are shown in the robustness test, where researchers predict the economic growth of the community with the Human Development Index (HDI). In the discussion section, community economic growth represented by PE continues to increase along with the increase in PD and HDI. The conclusion in this study is community economic growth increased since 2009, marked by an increase in PD along with HDI. As an implication, researchers suggest that practitioners and academics use local taxes to measure the community economy in new autonomous regions in Indonesia.
Key words : New Autonomous Regions, Social-Economy Issues, GRDP per Capita, Local Tax
Revenue, Human Development
How to Cite: Rochmatullah, M., Winarna, J., & Gantyowatiti, E. (2020). Economic Growth in Indonesian New
Outonomous: Social-Economic Perspective. JEJAK: Jurnal Ekonomi dan Kebijakan, 13(1).
doi:https://doi.org/10.15294/jejak.v13i1.22816
Corresponding author : Mahameru Rosy Rochmatullah Address: Jl.A.Yani Tromol Pos 2 Pabelan Sukoharjo E-mail: [email protected]
p-ISSN 1979-715X
e-ISSN 2460-5123
171
Rochmatullah, M. R, Winarna, J., & Gantyowati, E. Economic Growth in Indonesian New Outonomous: Social-Economic Perspective
INTRODUCTION
Regional expansion is a manifestation
of the implementation of decentralization of
government in Indonesia since 1999 which is
regulated in Law no.22/1999. In practice,
regional expansion has resulted in many new
autonomous regions consisting of new
provinces, new regencies and new
municipals. In Law no.22/1999 it has been
explained that one Province/Regency/
Municipal can be divided into two or more
new autonomous regions. Meanwhile, the
old area which has several fragmented
regions is called the main area. Data from the
Ministry of Home Affairs shows that from
1999 to 2013 there were 220 new autonomous
regions consisting of 8 Provinces, 178
Regencies and 34 Municipals. Historically,
the formation of new autonomous regions in
the 1999-2013 period is described in Table 1.
The purpose of forming a new
autonomous region based on Law no.
22/1999 is to improve the performance of
public services and accelerate the welfare of
the people which manifests in improving the
economy between regions in Indonesia.
BAPPENAS & UNDP (2008) have conducted
evaluation studies on the division of regions
in 10 new regencies that were cursed in 1999
such as Tebo, Sorolangun, East Lampung,
Way Kanan, Bengkayang, Banggai islands, Buol,
North Luwu, and Lembata for 5 years (2001 -
2005). However, the results of the study show
that GRDP per capita in new autonomous
regions tends to fluctuate while parent regions
are more stable. These results indicate that the
economy of the people living in new
autonomous regions is not yet stable. In this
study, researchers aimed to re-evaluate the
economy of the community in new autonomous
regions in Indonesia.
One effort that needs to be done in order
to develop the regional economy is to strive for
community development in the region
(Rodríguez-Pose & Palavicini-Corona, 2013). In
the explanation of article 6 Government
Regulation no. 78/2007 states that one indicator
of community development in the new
autonomous region is the growth of Gross
Regional Domestic Product (GRDP) per capita
which represents an increase in the economic
welfare of its people. Meanwhile, the level of
economic prosperity of the community is
related to the quality of living standards of the
people of a country (Rodríguez-Pose &
Palavicini-Corona, 2013; Shekarian &
Gholizadeh, 2013). This means that community
development in new autonomous regions will
lead to the goal of improving the quality of life
of the people in the area.
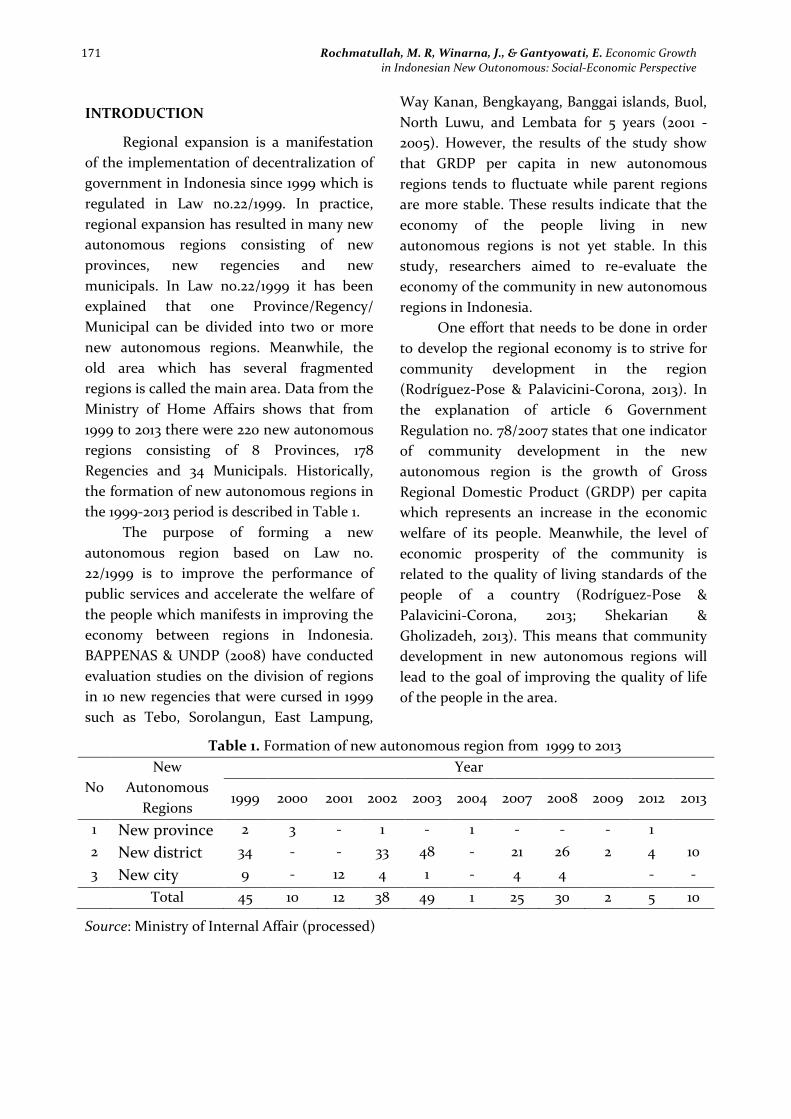
Table 1. Formation of new autonomous region from 1999 to 2013
No
New
Autonomous
Regions
Year
1999 2000 2001 2002 2003 2004 2007 2008 2009 2012 2013
1 New province 2 3 - 1 - 1 - - - 1
2 New district 34 - - 33 48 - 21 26 2 4 10
3 New city 9 - 12 4 1 - 4 4 - -
Total 45 10 12 38 49 1 25 30 2 5 10
Source: Ministry of Internal Affair (processed)

JEJAK Journal of Economics and Policy Vol 13 (1) (2020): 170-187 172
Previous studies have reported that
gross regional domestic product (GRDP)
influences regional finances such as savings,
credit, regional income, and regional
expenditure (Rahman & Chamelia, 2015). In
addition, another study shows that the
indicator that is often used in assessing
economic welfare in a region is the GRDP
(Chansarn, 2014). This study specifically
assesses the economy of the new
autonomous people using the GRDP per
capita benchmark that refers to social-
economic theory. This theory was developed
by Dalton & Cassel (1924) who studied the
continuity between "individual" social
problems that had an impact on macro
economic problems namely regions and
countries. Furthermore, the discussion
developed in social-economic theory is how
social problems can trigger economic
consequences and vice versa.
Implicitly, social-economic theory has
been discussed in several previous studies.
Firman (2010) argues that the economic
welfare is closely related to the independence
of the region in obtaining capital to meet all
its needs such as the acquisition of local
taxes and levies as well as other original
legitimate income areas, the ability of people
in the region to face rising costs of basic
needs, availability of employment, the
amount population, and the level of
education of the people. Bere, Otoiu and
Precup (2014) also reported that regional
economic growth in the country of Romania
was determined by human capital which was
proxied by unemployment, population, and
population migration. Other studies also
explain that the population in Indonesia has
a tendency to migrate to other regions due to
lack of employment opportunities, lack of
public facilities, and difficult access to other
welfare (Lu, 2010; Skoufias & Olivieri, 2013).
In its development, several studies have also
discussed the issue of social economy connected
to the problem of social inclusion (Cace &
Stănescu, 2013), community welfare (Lim &
Endo, 2016; Fonte & Cucco, 2017), social
responsibility (Lee, Byun & Park, 2018), and
environmental impacts (Fan, Fang & Zhang,
2019; Luo & Zuo, 2019).
Based on a number of previous studies,
this study will analyze the effect of social-
economic issues that are proxied by poverty,
population, education, tax and social assistance
of local governments on the economic growth
of the community as proxied by GRDP per
capita (PE). The analysis process is carried out
by identifying the indicators that affect PE, and
discussing the results of testing using a graph of
PE growth and its indicators to assess the
economic growth of the new autonomous
regions community. Robustness test will also be
carried out in order to strengthen the analysis
results.
Increasing the population can improve the
economy of a region. In the "Causal Loop on
Regional Development Dynamic Model"
developed by Faoziyah (2016) shows that an
increase in population will improve the
economy and this will be followed by an
increase in the workforce in an area. In
addition, the reception of fiscal transfers to the
regions will also be even greater because one of
the determining factors is population growth
(Crowley & Sobel, 2011). This means, population
growth is an indicator of community economic
growth in an area. Thus, the hypothesis (H1)
formulated in this study is "the population has a
significant positive effect on GRDP per capita".
In general, poverty is a challenge facing all
countries and the international community as a
whole (Liu, Liu, & Zhou, 2017). In Indonesia, the
main contributors to poverty are residents in
rural areas who are mostly farmers (Suryahadi,
Suryadarma, & Sumarto, 2009). They further
explained that the most effective

173
Rochmatullah, M. R, Winarna, J., & Gantyowati, E. Economic Growth in Indonesian New Outonomous: Social-Economic Perspective
poverty alleviation strategy was the
economic development of rural
communities. Other studies have also shown
that Indonesia and the Philippines have
made great progress in increasing health
coverage and maintaining income for the
chronic poor in recent years, after decades of
neglect (Ramesh, 2014). Thus, the researcher
will use poverty indicators to assess the
economy of the people in the new
autonomous regions in Indonesia.
Hypothesis (H2) formulated in this study is
"poverty is a factor inhibiting regional
economic growth so that it has a significant
negative effect on GRDP per capita growth".
Hromcová & Agnese (2019) have
proven that the current era of globalization is
the willingness of people to pursue higher
education related to the willingness of the
labor market to accommodate graduates.
Meanwhile, Li & Wu (2018) explained that
the level of education represented the quality
of human capital owned by the community
as an important factor needed by many
companies to obtain a quality workforce.
Both studies indicate that the level of
education is a necessity for business activities
in an area. Thus, the level of public
education can be used as an indicator of
community economic growth in an area.
Hypothesis (H3) formulated in this study is
"the population who have taken tertiary
education (bachelor) has a significant
positive effect on GRDP per capita".
Based on Law no. 28/2009, some local
tax revenues in Indonesia include motor
vehicle tax, motor vehicle fuel tax, hotel
business tax, restaurant business tax,
entertainment venue tax, advertisement tax,
street lighting tax, nonmetallic mineral
business tax, parking tax, water, and land
and building taxes. Some of the local tax
revenue sources represent the economic
capabilities of the people in the area. As
Bigio & Zilberman (2011) report that tax is not
only related to business profits but also related
to the amount of labor income employed.
Vuichard, Stauch & Dällenbach (2019) have also
proven that an increase in local resource taxes
indicates an increase in community income.
Thus, local tax revenue is an indicator of
economic growth in the community in an area.
The hypothesis (H4) formulated in this study is
"regional tax revenue has a significant positive
effect on GRDP per capita".
Dhanani & Islam (2002) argued that in
order to cope with social risks intervention from
the government was needed in order to improve
the stabilization of a country's economy by
implementing social protection programs. In
Indonesia, regulations on social protection are
contained in Government Regulation No.
45/2013 which regulates the distribution of
social assistance in the form of consumption
assistance, working capital assistance, health
insurance and education insurance. This means,
social risk management has been implemented
in Indonesia in order to improve the economy
of its people. Previous studies have proven that
social risk management is able to free people
from poverty through prevention and
mitigation programs (Holzmann & Jørgensen,
2000; Vykopalová, 2016). Thus, the distribution
of social assistance by local governments can
also be used as an indicator of community
economic growth in the region. The hypothesis
(H5) formulated in this study is "the
distribution of social assistance has a significant
positive effect on GRDP per capita".
This study uses the issue of social
economy to re-evaluate the economy of the new
autonomous people in Indonesia. Observations
focused on population (JP), poverty rate (AK),
education level (TP), distribution of social
assistance (BS), and local tax revenue (PD).
Some of these indicators will be tested whether
there is a significant influence on the
community's economy which is proxied by
GRDP per capita (PE). The results of this study
JEJAK Journal of Economics and Policy Vol 13 (1) (2020): 170-187 174
are expected to provide the latest scientific
studies related to the economic growth of
the new autonomous peoples in Indonesia.
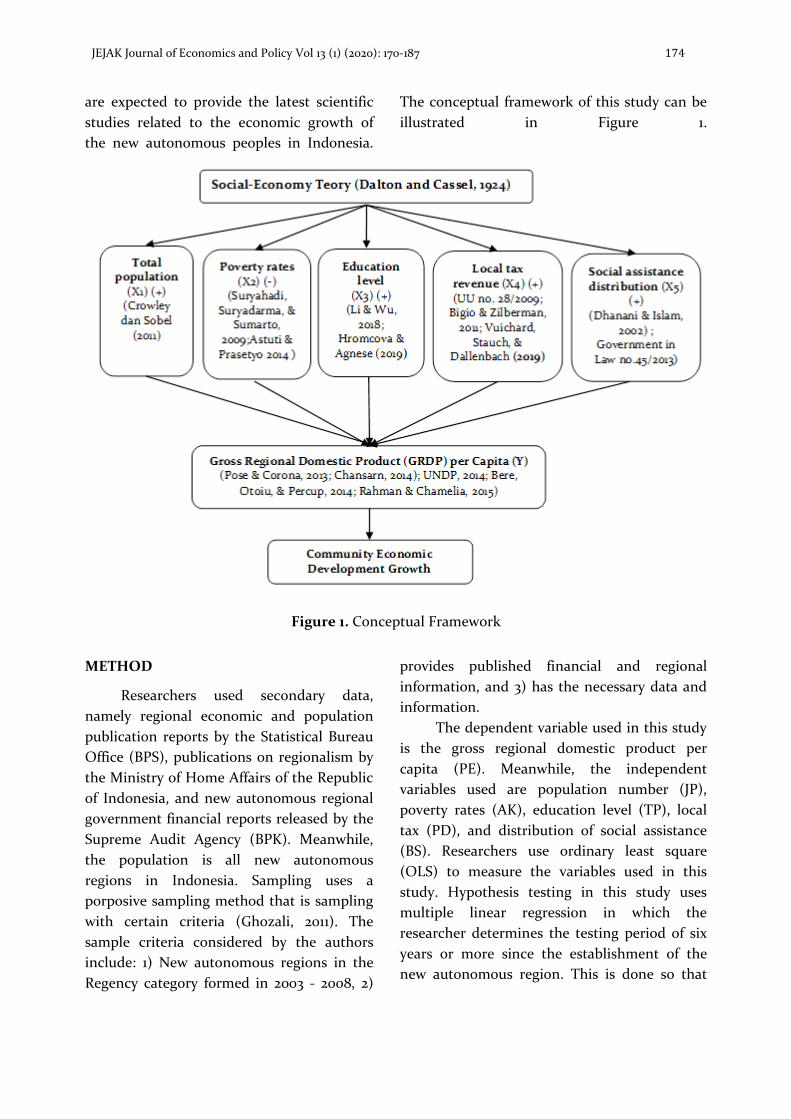
The conceptual framework of this study can be
illustrated in Figure 1.
Figure 1. Conceptual Framework
METHOD
Researchers used secondary data,
namely regional economic and population
publication reports by the Statistical Bureau
Office (BPS), publications on regionalism by
the Ministry of Home Affairs of the Republic
of Indonesia, and new autonomous regional
government financial reports released by the
Supreme Audit Agency (BPK). Meanwhile,
the population is all new autonomous
regions in Indonesia. Sampling uses a
porposive sampling method that is sampling
with certain criteria (Ghozali, 2011). The
sample criteria considered by the authors
include: 1) New autonomous regions in the
Regency category formed in 2003 - 2008, 2)
provides published financial and regional
information, and 3) has the necessary data and
information.
The dependent variable used in this study
is the gross regional domestic product per
capita (PE). Meanwhile, the independent
variables used are population number (JP),
poverty rates (AK), education level (TP), local
tax (PD), and distribution of social assistance
(BS). Researchers use ordinary least square
(OLS) to measure the variables used in this
study. Hypothesis testing in this study uses
multiple linear regression in which the
researcher determines the testing period of six
years or more since the establishment of the
new autonomous region. This is done so that

175
Rochmatullah, M. R, Winarna, J., & Gantyowati, E. Economic Growth in Indonesian New Outonomous: Social-Economic Perspective
the results of the analysis are not biased
because before the age of six years or more,
new autonomous regions is still in a
transition period and is still in the first
period of government so that regional
development progress cannot be used as a
guideline.
Hypothesis testing uses multiple linear
regression methods to detect indicators that
affect GRDP per capita (PE). This analysis
was carried out using benchmarks of
simultaneous regression testing (Significance
F), benchmarks of partial regression testing
(coefficient β), and testing the coefficient of
determination (R2). Testing is broken down
into three stages of testing. The analysis
process consists of three stages of testing,
namely 1) Testing in all selected new
autonomous regions. 2) The second phase of
testing is carried out by breaking down the
testing into three parts based on the year of
establishment of the new autonomous
regions (2003, 2007, and 2008). In the third
stage, testing is carried out on all new
autonomous regions per year classified
according to the age of new autonomous
regions ≥ 6 years. This was done so that all
new autonomous regions that were observed
had met the age criteria of 6 years or more.
Formula 1 is a regression equation for each
stage of hypothesis testing.
Hypothesis Test Regression Equations
Stage 1
PE i = α + β1 JP i + β2 AK i + β3 TP i + β4 PD i
+ β5 BS i + µ
Stage 2
PE i(t) = α + β1 AK i(t) + β2 JP i(t) + β3 TP i(t)
+ β4 PD i(t) + β5 BS i(t) + µ
Stage 3
PE i(n) = α + β1 AK i(n) + β2 JP i(n) + β3
TPi(n) + β4 PD i(n) + β5 BS i (n)
+ µ
Where:
PE = Logarithm of GRDP value per capita
JP = Logarithm total population
AK = Logarithms number of poor
population
TP = Logarithms number of residents
educated S1 (Bachelor's)
PD = Logarithm the amount of local tax
revenue
BS = Logarithms number of distributed
local government social assistance
α = Constant
β = Coefficient
I = Regions of- i
t = Year of establishment new
autonomous regions
n = 2014 – 2018
RESULTS AND DISCUSSION
The population of this study has been
determined, namely all new autonomous
regions formed from 1999 - 2013 consisting of 8
Provinces, 178 Regencies and 34 Cities. Based on
the criteria set out in this study, sampling using
a purposive method resulted in 73 selected
districts with a year of observation from 2009 to
2018. Data observations began since the new
autonomous regions was 6 years old. As
explained in the reseach method section, new
autonomous regions that are still aged up to five
years are still in transition and the results of
regional development cannot be used as
guidelines. In detail, the number of samples and
the number of observations of the data can be
seen in Table 2.
In the first stage of testing, the results
showed the p-value variable population (JP
0,000 under 1% significance, but the coefficient
value of the β-coefficient was negative. These
results indicate the JP variable has a significant
negative effect, so Hypothesis H1 is rejected.
The results shown in the variable number
poverty (AK) and social assistance distribution
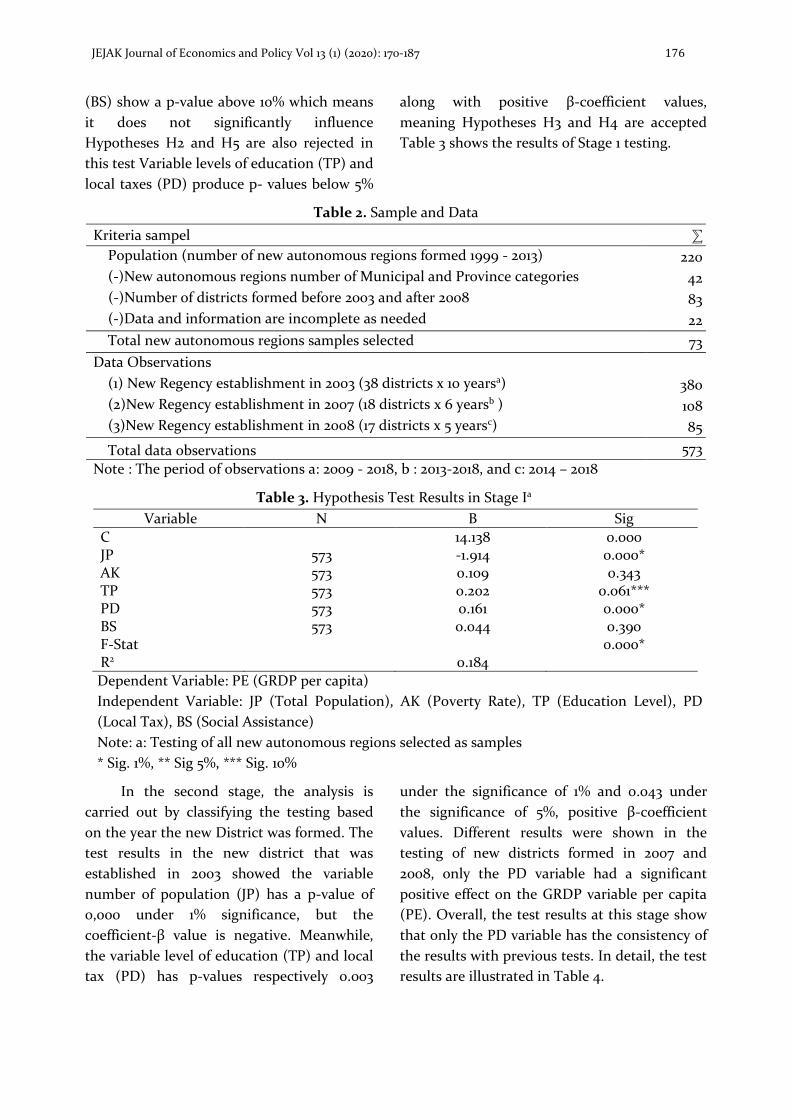
JEJAK Journal of Economics and Policy Vol 13 (1) (2020): 170-187 176
(BS) show a p-value above 10% which means
it does not significantly influence
Hypotheses H2 and H5 are also rejected in
this test Variable levels of education (TP) and
local taxes (PD) produce p- values below 5%
along with positive β-coefficient values,
meaning Hypotheses H3 and H4 are accepted
Table 3 shows the results of Stage 1 testing.
Table 2. Sample and Data
Kriteria sampel ⅀
Population (number of new autonomous regions formed 1999 - 2013) 220
(-)New autonomous regions number of Municipal and Province categories 42
(-)Number of districts formed before 2003 and after 2008 83
(-)Data and information are incomplete as needed 22
Total new autonomous regions samples selected 73
Data Observations
(1) New Regency establishment in 2003 (38 districts x 10 yearsa) 380
(2)New Regency establishment in 2007 (18 districts x 6 yearsb ) 108
(3)New Regency establishment in 2008 (17 districts x 5 yearsc) 85
Total data observations 573
Note : The period of observations a: 2009 - 2018, b : 2013-2018, and c: 2014 – 2018
Table 3. Hypothesis Test Results in Stage Ia
Variable N Β Sig
C 14.138 0.000 JP 573 -1.914 0.000* AK 573 0.109 0.343 TP 573 0.202 0.061*** PD 573 0.161 0.000* BS 573 0.044 0.390 F-Stat 0.000* R2 0.184
Dependent Variable: PE (GRDP per capita)
Independent Variable: JP (Total Population), AK (Poverty Rate), TP (Education Level), PD
(Local Tax), BS (Social Assistance)
Note: a: Testing of all new autonomous regions selected as samples
* Sig. 1%, ** Sig 5%, *** Sig. 10%
In the second stage, the analysis is
carried out by classifying the testing based
on the year the new District was formed. The
test results in the new district that was
established in 2003 showed the variable
number of population (JP) has a p-value of
0,000 under 1% significance, but the
coefficient-β value is negative. Meanwhile,
the variable level of education (TP) and local
tax (PD) has p-values respectively 0.003
under the significance of 1% and 0.043 under
the significance of 5%, positive β-coefficient
values. Different results were shown in the
testing of new districts formed in 2007 and
2008, only the PD variable had a significant
positive effect on the GRDP variable per capita
(PE). Overall, the test results at this stage show
that only the PD variable has the consistency of
the results with previous tests. In detail, the test
results are illustrated in Table 4.

177
Rochmatullah, M. R, Winarna, J., & Gantyowati, E. Economic Growth in Indonesian New Outonomous: Social-Economic Perspective
Table 4. Hypothesis Test Results in Stage II
Variable
New Autonomous Regions
2003a
New Autonomous Regions
2007b
New Autonomous
Regions 2008c
N Β Sig N β Sig N β Sig
C 8.463 0.000 7.889 0.034 7.009 0.031
JP 380 -2.851 0.000* 108 -0.729 0.427 85 -0.322 0.694
AK 380 0.210 0.064 108 0.038 0.832 85 0.013 0.950
TP 380 0.337 0.003* 108 -0.046 0.805 85 -0.169 0.356
PD 380 0.059 0.043** 108 0.221 0.000* 85 0.218 0.013**
BS 380 -0.015 0.587 108 0.115 0.150 85 -0.005 0.951
F-Stat 0.000* 0.000* 0.029**
R2 0.145 0.296 0.144
Dependent Variable: PE (GRDP per capita)
Independent Variable: JP (Total Population), AK (Poverty Rate), TP (Education Level), PD (Local
Tax), BS (Social Assistance)
Note: The period of observations a: 2009 - 2018, b : 2013-2018, and c: 2014 - 2018
* Sig. 1%, ** Sig 5%, *** Sig. 10%
Table 5. Hypothesis Test Results in Stage IIIa
Variable N 2014 2015 2016 2017 2018
β Sig Β Sig Β Sig Β Sig Β Sig
C 8.057 0.034 10.131 0.005 4.118 0.007 9.098 0.001 1.231 0.009
JP 73 -
3.166
0.125 -3.423 0.076*
**
-1.287 0.428 -4.271 0.005
*
0.559 0.699
AK 73 0.320 0.362 0.117 0.769 -
0.396
0.136 0.850 0.001* -
0.358
0.254
TP 73 0.418 0.271 0.440 0.123 0.475 0.144 0.526 0.152 -0.381 0.202
PD 73 0.225 0.070
***
0.305 0.013*
*
0.264 0.025
**
0.421 0.001* 0.355 0.006*
BS 73 0.061 0.768 -0.291 0.116 0.153 0.349 -
0.029
0.839 0.068 0.693
F-Stat 0.000
*
0.000* 0.000
*
0.000
*
0.005*
R2 0.203 0.271 0.211 0.263 0.207
Dependent variabel : PE (PDRB per Kapita)
Independent Variable: JP (Total Population), AK (Poverty Rate), TP (Education Level), PD (Local
Tax), BS (Social Assistance)
Note: a: Testing all new autonomous regions per year with criteria ≥ 6 years
* Sig. ≤ 1%, ** Sig ≤ 5%, *** Sig. 10%
In the third stage, researchers try to
test the data of all new autonomous regions
that are observed annually together. Tests
are classified from 2014 to 2018 so that the
new autonomous regions formation in 2008
meets the age criteria ≥ 6 years. Table 5 shows
the results of the third phase of testing which
shows that the local tax variable (PD)
consistently obtained significant results during
the 5 years of testing. This result is indicated by

JEJAK Journal of Economics and Policy Vol 13 (1) (2020): 170-187 178
p value below 1% significance with positive β
coefficient.
The results of all testing stages show
that the regional tax variable (PD)
consistently has a significant positive effect
on the GRDP variable per capita (PE). These
results indicate that local tax revenue is one
indicator that can be used to measure the
economic growth of people in new
autonomous regions. Based on the entire
results of the study, the researcher decided
that only hypothesis (H4) was accepted in
this study.
Furthermore, researchers conducted a
robustness test of results (robustness test) to
strengthen the test results that have been
obtained. Robustness test is done with the same
steps as the previous test. Researchers are trying
to replace the GRDP variable per capita (PE)
with the human development index (HDI).
Researchers used the HDI data available in the
Central Statistics Agency of the Republic of
Indonesia (BPS). Human development index
(HDI) represents the welfare of the community
in the fields of health, education, and minimum
living standards (Chansarn, 2014; Tadjoeddin,
2015). These three aspects reflect the economic
capacity of the community in financing their
health, education needs and achieving a decent
standard of living. This is the reason researchers
use the HDI as a substitute for GRDP per capita
(PE) in the robustness test.
Table 6. Robustness Test Results in Stage 1a
Variabel N Β Sig
C 10.989 0.000
JP 573 -1.068 0.908
AK 573 0.105 0.603
TP 573 0.111 0.035**
PD 573 0.076 0.000*
BS 573 0.018 0.472
F_Stat 0.000
R2 0.118
Dependent Variable: HDI (Human Development Index)
Independent Variable: JP (Total Population), AK (Poverty Rate), TP (Education Level), PD (Local
Tax), BS (Social Assistance)
Note: a: Testing of all new autonomous regions selected as samples
* Sig. 1%, ** Sig 5%, *** Sig. 10%
Table 6 is the result of the robustness
test stage 1 which shows that there are two
variables namely the level of education (TP)
and local tax (PD) which have a significant
positive effect on the human development
index (HDI). TP variable obtained p value
0.035 below the significance of 5% with a
positive β-coefficient. These results indicate
that PD and TP have a significant positive
effect on HDI. While other variables did not
obtain significant results.
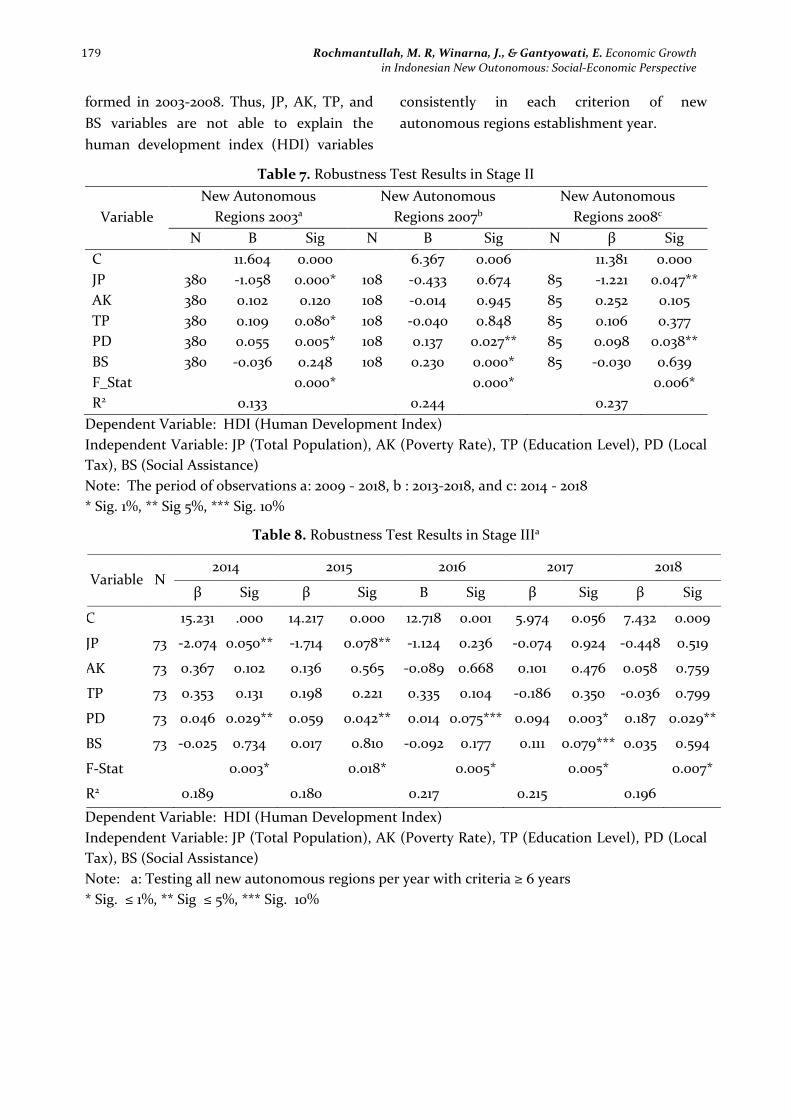
The robustness test results stage 2 are set
out in Table 7 which shows the local tax variable
(PD) obtains a p value below the 5%
significance with a positive β coefficient on each
new autonomous regions formed in 2003-2008.
This means that the PD obtains the significance
of the results consistently in this test. Other
variables show different results in each DOB
179
Rochmantullah, M. R, Winarna, J., & Gantyowati, E. Economic Growth in Indonesian New Outonomous: Social-Economic Perspective
formed in 2003-2008. Thus, JP, AK, TP, and
BS variables are not able to explain the
human development index (HDI) variables
consistently in each criterion of new
autonomous regions establishment year.
Table 7. Robustness Test Results in Stage II
Variable
New Autonomous
Regions 2003a
New Autonomous
Regions 2007b
New Autonomous
Regions 2008c
N Β Sig N Β Sig N β Sig
C 11.604 0.000 6.367 0.006 11.381 0.000
JP 380 -1.058 0.000* 108 -0.433 0.674 85 -1.221 0.047**
AK 380 0.102 0.120 108 -0.014 0.945 85 0.252 0.105
TP 380 0.109 0.080* 108 -0.040 0.848 85 0.106 0.377
PD 380 0.055 0.005* 108 0.137 0.027** 85 0.098 0.038**
BS 380 -0.036 0.248 108 0.230 0.000* 85 -0.030 0.639
F_Stat 0.000* 0.000* 0.006*
R2 0.133 0.244 0.237
Dependent Variable: HDI (Human Development Index)
Independent Variable: JP (Total Population), AK (Poverty Rate), TP (Education Level), PD (Local
Tax), BS (Social Assistance)
Note: The period of observations a: 2009 - 2018, b : 2013-2018, and c: 2014 - 2018
* Sig. 1%, ** Sig 5%, *** Sig. 10%
Table 8. Robustness Test Results in Stage IIIa
Dependent Variable: HDI (Human Development Index)
Independent Variable: JP (Total Population), AK (Poverty Rate), TP (Education Level), PD (Local
Tax), BS (Social Assistance)
Note: a: Testing all new autonomous regions per year with criteria ≥ 6 years
* Sig. ≤ 1%, ** Sig ≤ 5%, *** Sig. 10%
Variable N 2014 2015 2016 2017 2018
β Sig β Sig Β Sig β Sig β Sig
C 15.231 .000 14.217 0.000 12.718 0.001 5.974 0.056 7.432 0.009
JP 73 -2.074 0.050** -1.714 0.078** -1.124 0.236 -0.074 0.924 -0.448 0.519
AK 73 0.367 0.102 0.136 0.565 -0.089 0.668 0.101 0.476 0.058 0.759
TP 73 0.353 0.131 0.198 0.221 0.335 0.104 -0.186 0.350 -0.036 0.799
PD 73 0.046 0.029** 0.059 0.042** 0.014 0.075*** 0.094 0.003* 0.187 0.029**
BS 73 -0.025 0.734 0.017 0.810 -0.092 0.177 0.111 0.079*** 0.035 0.594
F-Stat 0.003* 0.018* 0.005* 0.005* 0.007*
R2 0.189 0.180 0.217 0.215 0.196
JEJAK Journal of Economics and Policy Vol 13 (1) (2020): 170-187 180
Table 8 is an illustration of the results
of the robustness test in stage 3 which shows
the local tax variable (PD) obtains the same
significance of the results in each test in 2014
- 2018. These results are marked with p
values below 5% significance with positive β
coefficients. While the population (JP),
poverty (AK), education (TP) and social
assistance (BS) variables are unable to
explain the human development index
variable (HDI) consistently in each
observation year (2014 - 2018).
Overall robustness test results show
results that are consistent with the results of
previous tests, which means strengthening
the test results in this study. In the
discussion section, the researcher will use
the local tax variable (PD) as an indicator of
community economic growth in the new
autonomous regions which will be compared
to the GRDP per capita growth (PE) and the
human development index (HDI).
Studies in various countries have
proven that taxes are closely related to
social-economic development. Studies in the
State of Serbia show that local governments
must have a much more active role in
managing local tax policies to overcome the
problem of very high unemployment, low
levels of domestic product per capita, high
debt and trade deficits (Aničić, J and
Đurović, 2016). This study implies that local
tax revenue is a determinant of the success of
the community's social and economic
development in an area. In addition, the case
in Hungary also shows that local government
transparency in tax collection can increase
public compliance to pay taxes (Sipos, 2015).
In Switzerland, a tax on local resources that
benefits the whole community is preferred
over providing opportunities for local
residents to invest (Vuichard, Stauch and
Dällenbach, 2019). This means, an increase or
decrease in local tax revenue is an economic
consequence that is received by the region from
the growth of social welfare in the area. In this
study, the results of the analysis reveal that local
tax is one indicator that is able to explain the
economic conditions of people in the area. As
such, these results support previous studies.
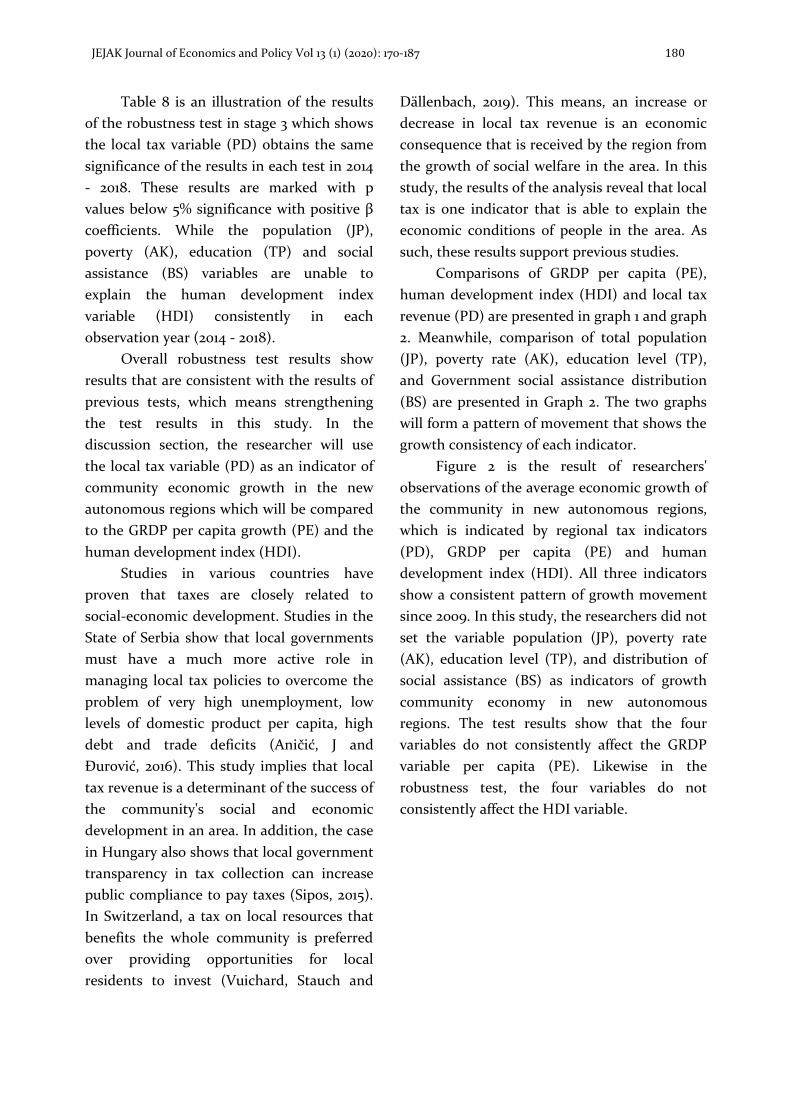
Comparisons of GRDP per capita (PE),
human development index (HDI) and local tax
revenue (PD) are presented in graph 1 and graph
2. Meanwhile, comparison of total population
(JP), poverty rate (AK), education level (TP),
and Government social assistance distribution
(BS) are presented in Graph 2. The two graphs
will form a pattern 0f movement that shows the
growth consistency of each indicator.
Figure 2 is the result of researchers'
observations of the average economic growth of
the community in new autonomous regions,
which is indicated by regional tax indicators
(PD), GRDP per capita (PE) and human
development index (HDI). All three indicators
show a consistent pattern of growth movement
since 2009. In this study, the researchers did not
set the variable population (JP), poverty rate
(AK), education level (TP), and distribution of
social assistance (BS) as indicators of growth
community economy in new autonomous
regions. The test results show that the four
variables do not consistently affect the GRDP
variable per capita (PE). Likewise in the
robustness test, the four variables do not
consistently affect the HDI variable.
181
Rochmatullah, M. R, Winarna, J., & Gantyowati, E. Economic Growth in Indonesian New Outonomous: Social-Economic Perspective
Source: Data processed by researchers (2019)
Note: a: PE (Mean of GRDP per Capita), b: PD
(Mean of local tax revenue), c: IPM (Mean of
Human Development Index)
Figure 2. Growth of PEa, PDb, and HDIc
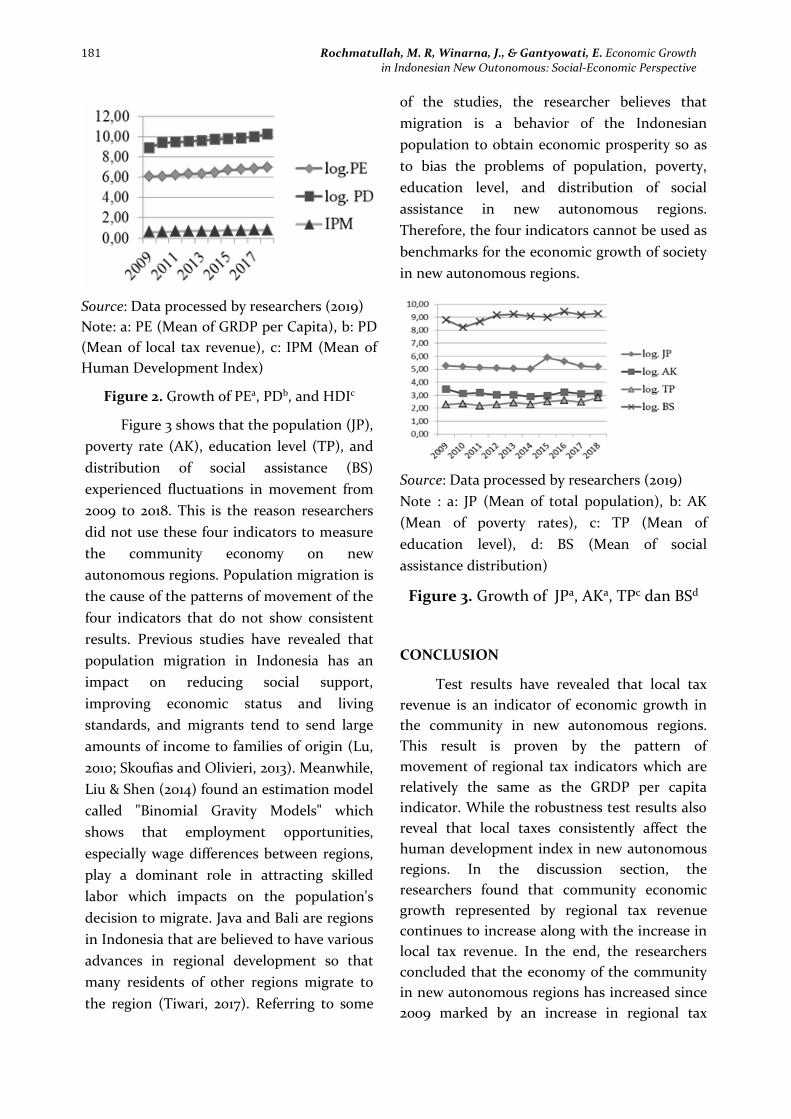
Figure 3 shows that the population (JP),
poverty rate (AK), education level (TP), and
distribution of social assistance (BS)
experienced fluctuations in movement from
2009 to 2018. This is the reason researchers
did not use these four indicators to measure
the community economy on new
autonomous regions. Population migration is
the cause of the patterns of movement of the
four indicators that do not show consistent
results. Previous studies have revealed that
population migration in Indonesia has an
impact on reducing social support,
improving economic status and living
standards, and migrants tend to send large
amounts of income to families of origin (Lu,
2010; Skoufias and Olivieri, 2013). Meanwhile,
Liu & Shen (2014) found an estimation model
called "Binomial Gravity Models" which
shows that employment opportunities,
especially wage differences between regions,
play a dominant role in attracting skilled
labor which impacts on the population's
decision to migrate. Java and Bali are regions
in Indonesia that are believed to have various
advances in regional development so that
many residents of other regions migrate to
the region (Tiwari, 2017). Referring to some
of the studies, the researcher believes that
migration is a behavior of the Indonesian
population to obtain economic prosperity so as
to bias the problems of population, poverty,
education level, and distribution of social
assistance in new autonomous regions.
Therefore, the four indicators cannot be used as
benchmarks for the economic growth of society
in new autonomous regions.
Source: Data processed by researchers (2019)
Note : a: JP (Mean of total population), b: AK
(Mean of poverty rates), c: TP (Mean of
education level), d: BS (Mean of social
assistance distribution)
Figure 3. Growth of JPa, AKa, TPc dan BSd
CONCLUSION
Test results have revealed that local tax
revenue is an indicator of economic growth in
the community in new autonomous regions.
This result is proven by the pattern of
movement of regional tax indicators which are
relatively the same as the GRDP per capita
indicator. While the robustness test results also
reveal that local taxes consistently affect the
human development index in new autonomous
regions. In the discussion section, the
researchers found that community economic
growth represented by regional tax revenue
continues to increase along with the increase in
local tax revenue. In the end, the researchers
concluded that the economy of the community
in new autonomous regions has increased since
2009 marked by an increase in regional tax

JEJAK Journal of Economics and Policy Vol 13 (1) (2020): 170-187 182
revenues along with human development in
the area.
This study has proven that regional tax
revenue is an indicator of economic growth
in the community in new autonomous
regions. These results provide an overview
for all academics and practitioners in the
field of economics to utilize the findings of
this study to develop the implementation of
community economic measurements in the
area and further research development.
Researchers hope that future studies on the
regional economy can use local tax indicators
as a measure of the economic well-being of
people in the region.
ACKNOWLEDGEMENT
The researchers would like to express their
thanks to Dr. Agung Prabowo and Dr. Agung
Nur probohudono who always contributes
suggestions and opinions in the completion
of this article. In addition, researchers greatly
appreciate the lecturers of Universitas
Muhammadiyah Surakarta and Universitas
Sebelas Maret Surakarta who have inspired
researchers to actively conduct research
development.
REFERENCES
Aničić, J., Jelić, M. & Đurović, J. M. (2016).
Local Tax Policy in the Function of
Development of Municipalities in
Serbia. Procedia - Social and
Behavioral Sciences, 221, 262-269.
Bappenas. & Undp. (2008). Evaluation study
on the impact of regional division
2001-2007, BRIDGE (Building and
Reinventing Decentralized
Governance), (July 2008), ISBN: 978-
979-17554-1-2.
Bere, R. C., Otoiu, A. & Precup, I. B. (2014).
Determinants of Economic Growth in
Cities Acting as Growth Polishing in
Regions from Romania. Procedia
Economics and Finance, 10, 357–365.
Bigio, S. & Zilberman, E. (2011). Optimal self-
employment income tax enforcement.
Journal of Public Economics, 95, 1021-
1035.
Cace, S. & Stănescu, S. M. (2013). Role of Social
Economy to Increase Social Inclusion.
Procedia - Social and Behavioral Sciences,
92, 117-121.
Chansarn, S. (2014). The Evaluation of
Sustainable Human Development: A
Cross-country Analysis of Employment
Slack-based DEA. Procedia
Environmental Sciences, 20, 3–11.
Crowley, G. R. & Sobel, R. S. (2011). Does fiscal
decentralization constraint Leviathan?
New evidence from local property tax
competition. Public Choice, 149, 5–30.
Dalton, H. & Cassel, G. (1924) 'The Theory of
Social Economy’. Economica, 11, 223-226.
Dhanani, S. and Islam, I. (2002). Poverty,
vulnerability and social protection in a
period of crisis: The case of Indonesia.
World Development, 30 (7), 1211-1231.
Fan, Y., Fang, C., & Zhang, Q. (2019).
Coordinated coupling development
between social economy and ecological
environment in Chinese provincial
capital cities-assessment and policy
implications. Journal of Cleaner
Production, 229, 289–298.
Faoziyah, U. (2016). Who Benefits? The Case of
the Suramadu Bridge Construction.
Procedia - Social and Behavioral Sciences,
227, 60–69.
Firman, T. (2010). Multi-local government
under Indonesia's decentralization
reform: The case of Kartamantul (The

183
Rochmatullah, M. R, Winarna, J., & Gantyowati, E. Economic Growth in Indonesian New Outonomous: Social-Economic Perspective
Greater Yogyakarta). Habitat
International, 34 (4), 400–405.
Fonte, M. & Cucco, I. (2017). Cooperatives
and alternative food networks in Italy.
The long road towards a social
economy in agriculture. Journal of
Rural Studies, 53, 291-302.
Ghozali, I. (2011). Application of Multivariate
Analysis with SPSS Program. Issue 5.
Semarang: Publishing Company of
Diponegoro University.
Holzmann, R. & Jørgensen, S. (2000). Social
Risk Management: A new conceptual
framework for Social Protection, and
beyond. Social Protection Discussion
Papers, 21314 (0006), 1–30.
Hromcová, J. & Agnese, P. (2019).
Globalization, welfare, and the
attitudes toward higher education,
Economic Modeling, 81, 503-517.
Lee, J. H., Byun, H. S. & Park, K. S. (2018).
Product market competition and
corporate social responsibility
activities: Perspectives from an
emerging economy. Pacific-Basin
Finance Journal, 49, 60-80.
Li, Z. & Wu, M. (2018). Education and welfare
program compliance: Firm-level
evidence from a pension reform in
China. China Economic Review, 48, 1–
13.
Lim, S. H. & Endo, C. (2016). The
development of the social economy
in the welfare mix: Political dynamics
between the state and the third
sector. Social Science Journal, 53(4),
486–494.
Liu, Y., Liu, J., & Zhou, Y. (2017). Spatio-
temporal patterns of rural poverty in
China and targeted poverty
alleviation strategies. Journal of Rural
Studies, 52, 66–75.
Liu, Y. & Shen, J. (2014). Spatial patterns and
determinants of skilled internal
migration in China, 2000-2005. Papers in
Regional Science, 93 (4), 749–771.
Lu, Y. (2010). Rural-urban migration and health:
evidence from longitudinal data in
Indonesia. Social science & medicine, 70
(3), 412-9.
Luo, Z. & Zuo, Q. (2019) Evaluating the
coordinated development of social
economy, water, and ecology in a
heavily disturbed basin based on the
distributed hydrology model and the
harmony theory. Journal of Hydrology,
574, 226–241.
Rahman, Y. A. & Chamelia, A. L. (2015). Factors
Influencing Central Java Regency / City
GRDP in 2008-2012. Trace (Journal of
Economics and Policy), 8 (1), 88-99.
Ramesh, M. (2014). Social Protection in
Indonesia and the Philippines: Work in
Progress. Journal of Southeast Asian
Economies, 31 (1), 40-56.
Rodríguez-Pose, A. & Palavicini-Corona, E. I.
(2013). Does local economic
development really work? Assessing LED
across Mexican municipalities.
Geoforum, 44, 303-315.
Shekarian, E. and Gholizadeh, A. A. (2013).
Application of adaptive network based
fuzzy inference system method in
economic welfare. Knowledge-Based
Systems, 39, 151–158.
Sipos, A. (2015). Determining Factors of Tax-
morale with Special Emphasis on the
Tax Revenues of Local Self-governments.
Procedia Economics and Finance, 30(15),
758-767.
Skoufias, E. & Olivieri, S. (2013). Sources of
spatial welfare disparities in Indonesia:

JEJAK Journal of Economics and Policy Vol 13 (1) (2020): 170-187 184
Household endowments or returns ?.
Journal of Asian Economics, 29, 62–79.
Suryahadi, A., Suryadarma, D. & Sumarto, S.
(2009). The effects of location and
sectoral components of economic
growth on poverty: Evidence from
Indonesia. Journal of Development
Economics, 89(1), 109–117.
Tadjoeddin, M. Z. (2015). Spatial Dimensions
of Key Employment Outcomes in
Indonesia. Journal of Comparative
Asian Development, 14(3), 466–509.
Tiwari, S. (2017). Does Local Development
Influence Outmigration Decisions?
Evidence from Indonesia. World
Development, 93, 108–124.
Vuichard, P., Stauch, A., & Dällenbach, N.
(2019). Individual or collective?
Community investment, local taxes,
and the social acceptance of wind
energy in Switzerland. Energy Research
and Social Science, 58, article. 101275.
Vykopalová, H. (2016). Social Risk
Management as a Strategy in the Fight
Against Poverty and Social Exclusion.
DANUBE: Law and Economics Review,
7(2), 123-129.
_______. 1999. Law of the Republic of
Indonesia No. 22 of 1999 concerning
Regional Government.
_______. 2007. Government Regulation of the
Republic of Indonesia No. 78 of 2007
concerning Procedures for Formation,
Elimination and Merger of Regions.
_______. 2009. Law of the Republic of
Indonesia No. 28 of 2009 concerning
Regional Taxes and Regional Levies.
_______. 2013. Government Regulation of the
Republic of Indonesia No. 45 of 2013
concerning Procedures for the
Implementation of the State Revenue
and Expenditure Budget.

185
Rochmatullah, M. R, Winarna, J., & Gantyowati, E. Economic Growth in Indonesian New Outonomous: Social-Economic Perspective
APPENDICES
Table 9. Operational Variables
No Variables Variable Type Abbreviation Measurement
1 The Indonesian
economic growth Dependent
PE Logarithm of GRDP value per
capita in the new autonomous
region which was established in
2003 - 2008.
HDI Human development index in the
new autonomous region which was
established in 2003 - 2008.
2 Total population Independent JP Logarithm total population in the
new autonomous region which was
established in 2003 - 2008.
3 Poverty rates Independent AK Logarithms number of poor
population in the new autonomous
region which was established in
2003 - 2008.
4 Education level Independent TP Logarithms number of residents
educated S1 (Bachelor's) in the new
autonomous region which was
established in 2003 - 2008.
5 Local tax revenue Independent PD Logarithm the amount of local tax
revenue in the new autonomous
region which was established in
2003 - 2008.
6 Social assistance
distribution
Independent BS Logarithms number of distributed
local government social assistance
in the new autonomous region
which was established in 2003 -
2008.

JEJAK Journal of Economics and Policy Vol 13 (1) (2020): 170-187 186
Table 10. Test Results of All New Autonomous Regions Selected as Samples
Model 1 B Std. Error t Sig. Tolerance VIF ∑ Sig. Glejser
Test
(Constant) 14.138 1.751 8.075 0.000
JP -1.914 0.438 -4.369 0.000 0.197 5.068 0.055
AK 0.109 0.115 0.950 0.343 0.336 2.976 0.560
TP 0.202 0.108 1.878 0.061 0.354 2.828 0.133
PD 0.161 0.038 4.232 0.000 0.980 1.020 0.812
BS 0.044 0.051 0.860 0.390 0.980 1.020 0.118
R-Square 0.184
Run Test 0.368
F- Stat 0.000
Dependent Variable: PE
Figure 4. Normal P-Plot of Regression Standardized Residual
(All New Autonomous Regions Selected)
187
Rochmatullah, M. R, Winarna, J., & Gantyowati, E. Economic Growth in Indonesian New Outonomous: Social-Economic Perspective
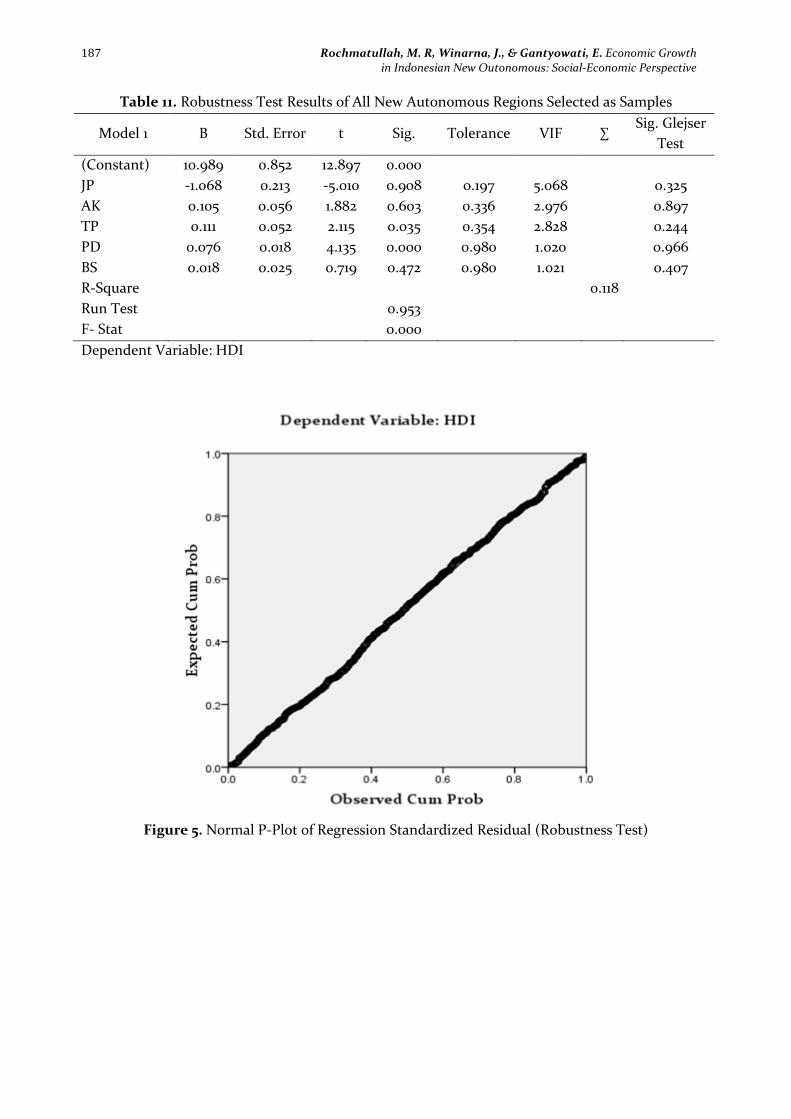
Table 11. Robustness Test Results of All New Autonomous Regions Selected as Samples
Model 1 B Std. Error t Sig. Tolerance VIF ∑ Sig. Glejser
Test
(Constant) 10.989 0.852 12.897 0.000
JP -1.068 0.213 -5.010 0.908 0.197 5.068 0.325
AK 0.105 0.056 1.882 0.603 0.336 2.976 0.897
TP 0.111 0.052 2.115 0.035 0.354 2.828 0.244
PD 0.076 0.018 4.135 0.000 0.980 1.020 0.966
BS 0.018 0.025 0.719 0.472 0.980 1.021 0.407
R-Square 0.118
Run Test 0.953
F- Stat 0.000
Dependent Variable: HDI
Figure 5. Normal P-Plot of Regression Standardized Residual (Robustness Test)
Related Documents