Clean Fuels Project Diesel Hydrotreating Unit Scoping Study Lauren Brickner Chi Lo Pamela Morse Jacobs Engineering Liaisons: Daniel LaRiviere Gary Gough

Welcome message from author
This document is posted to help you gain knowledge. Please leave a comment to let me know what you think about it! Share it to your friends and learn new things together.
Transcript

Clean Fuels Project Diesel Hydrotreating Unit
Scoping Study
Lauren Brickner Chi Lo
Pamela Morse
Jacobs Engineering Liaisons: Daniel LaRiviere
Gary Gough
Project Description and Scope
l New regulations require highway diesel to have below 15 ppm of sulfur (reduced from 500 ppm)
l Benefit of producing ultra low sulfur diesel (ULSD) is about $0.10/gal
l Evaluate ability of existing equipment to adapt to modified process to produce ULSD
l Economic feasibility of producing ULSD
Design: Material & Energy Balances
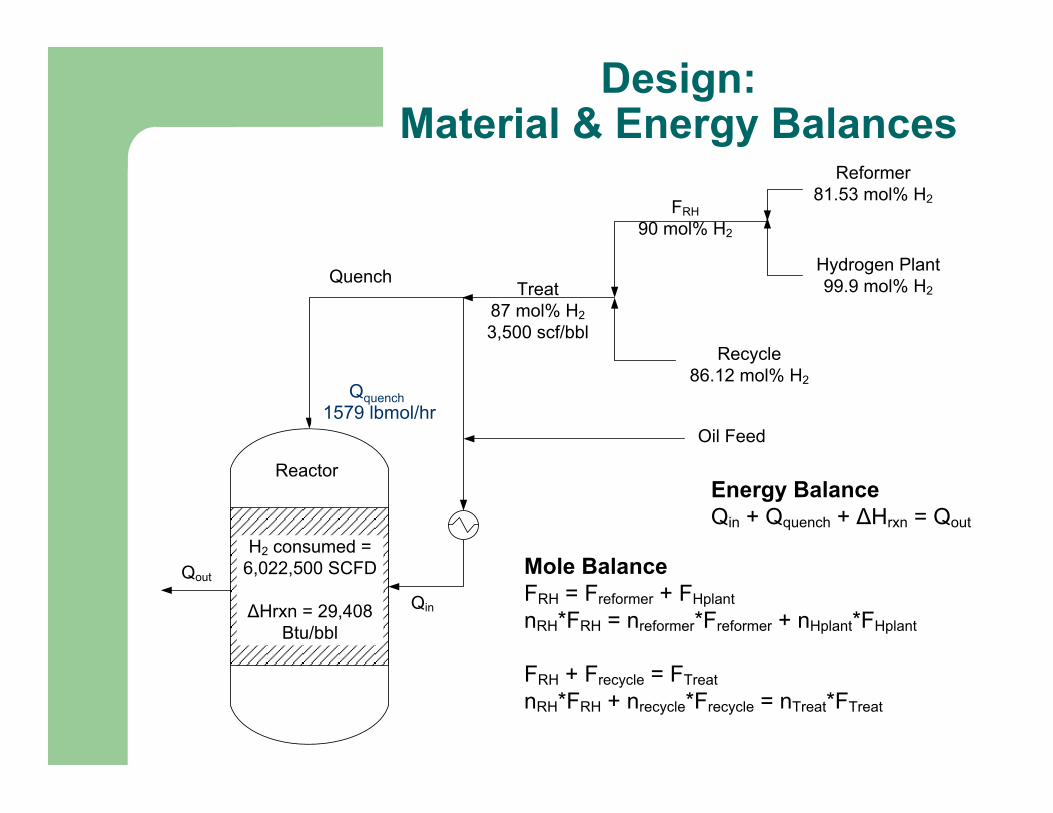
Reactor
QuenchTreat
87 mol% H23,500 scf/bbl
H2 consumed = 6,022,500 SCFD
ΔHrxn = 29,408 Btu/bbl
Recycle86.12 mol% H2
Hydrogen Plant99.9 mol% H2
Reformer81.53 mol% H2FRH
90 mol% H2
Oil Feed
Qquench
Qin
Qout Mole BalanceFRH = Freformer + FHplantnRH*FRH = nreformer*Freformer + nHplant*FHplant
FRH + Frecycle = FTreatnRH*FRH + nrecycle*Frecycle = nTreat*FTreat
Energy BalanceQin + Qquench + ΔHrxn = Qout
Qquench 1579 lbmol/hr
Design: Heaters
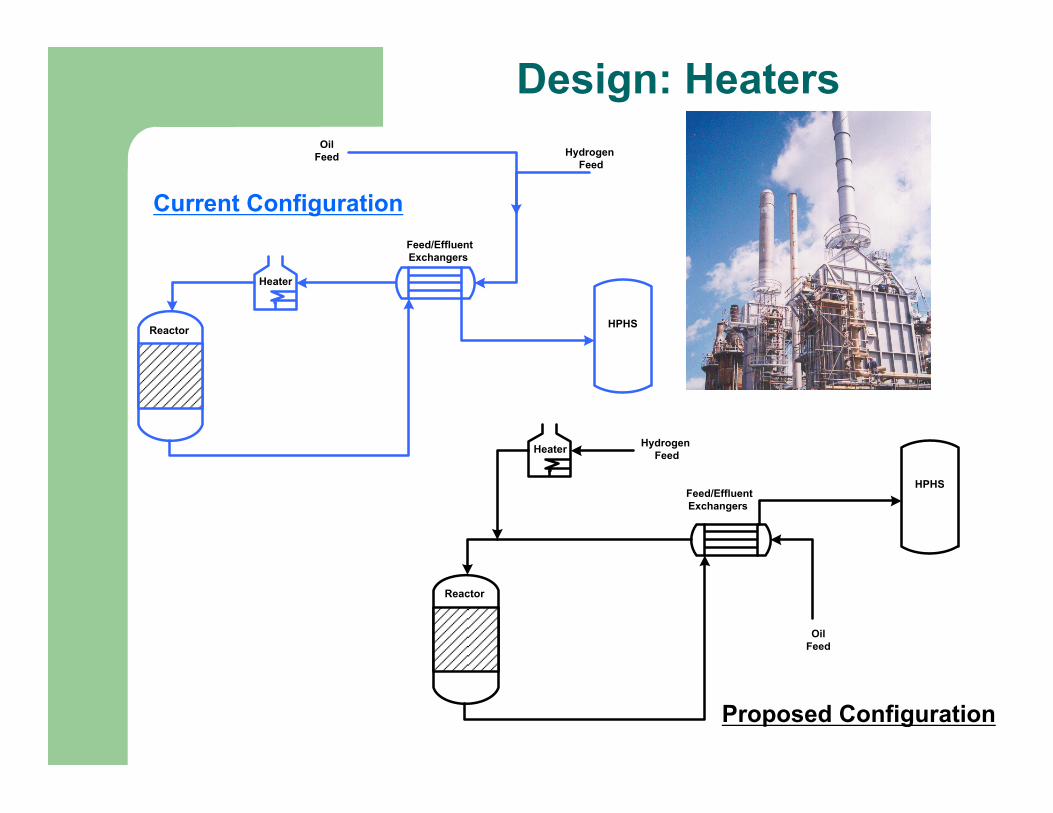
Heater
HPHSReactor
Oil Feed Hydrogen
Feed
Feed/Effluent Exchangers
Heater
HPHS
Reactor
Oil Feed
Hydrogen Feed
Feed/Effluent Exchangers
Current Configuration
Proposed Configuration
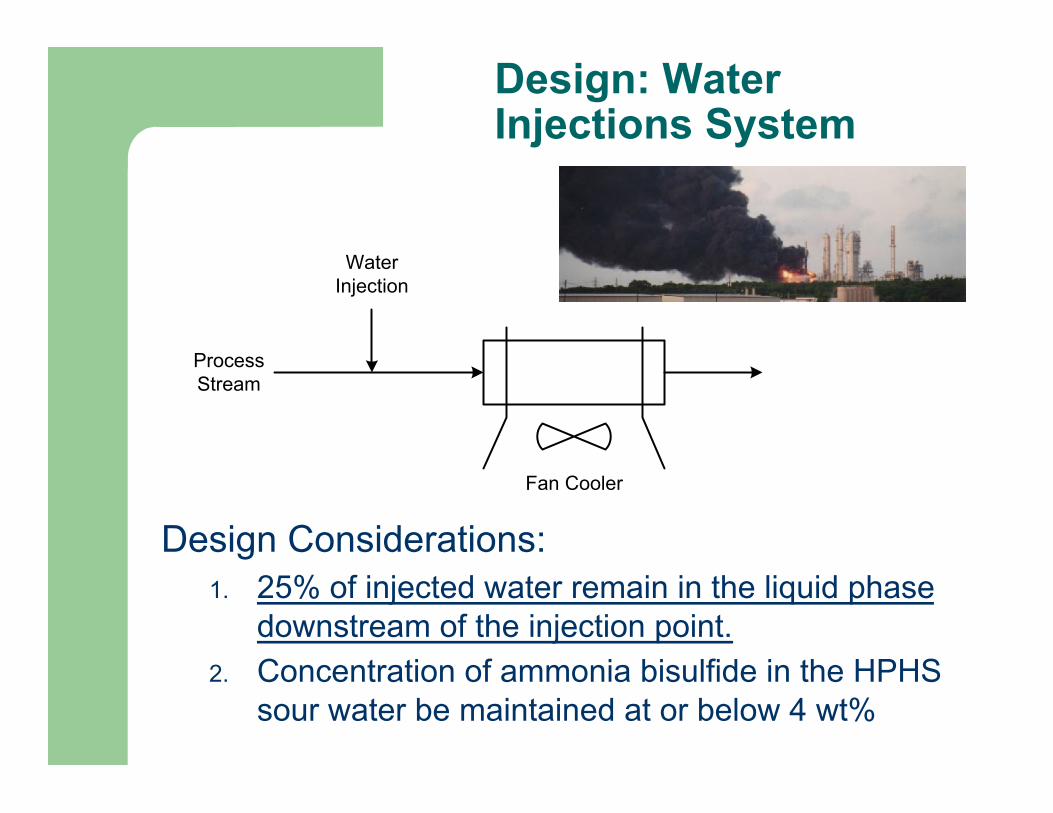
Design: Water Injections System
ProcessStream
Fan Cooler
Water Injection
Design Considerations: 1. 25% of injected water remain in the liquid phase
downstream of the injection point. 2. Concentration of ammonia bisulfide in the HPHS
sour water be maintained at or below 4 wt%
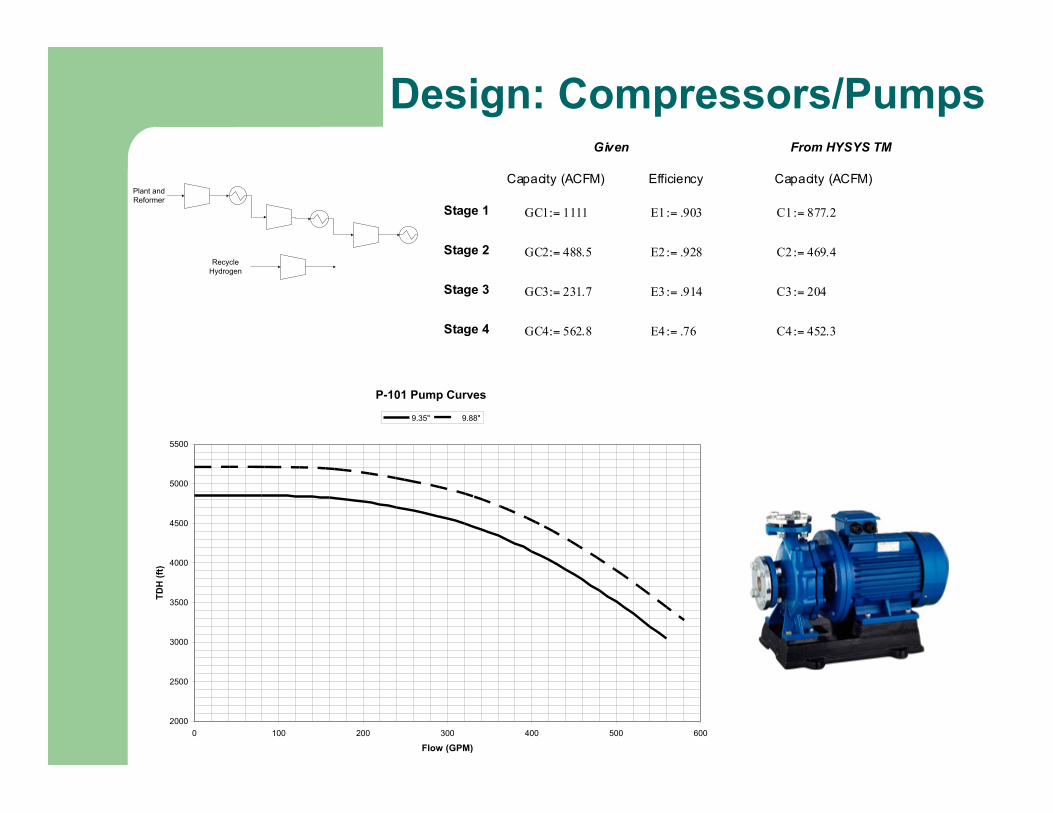
Design: Compressors/Pumps
Recycle Hydrogen
Plant and Reformer
Given From HYSYS TM
Capacity (ACFM) Efficiency Capacity (ACFM) Horsepower
Stage 1 GC1 1111:= E1 .903:= C1 877.2:= H1 610.5hp⋅:=
Stage 2 GC2 488.5:= E2 .928:= C2 469.4:= H2 820.1hp⋅:=
Stage 3 GC3 231.7:= E3 .914:= C3 204:= H3 565.6hp⋅:=
Stage 4 GC4 562.8:= E4 .76:= C4 452.3:= H4 395.5hp⋅:=
P-101 Pump Curves
2000
2500
3000
3500
4000
4500
5000
5500
0 100 200 300 400 500 600
Flow (GPM)
TDH
(ft)
9.35" 9.88"

Design: Separators and Fractionator
Specifications Naphtha Kerosene Diesel (ULSD)Distillation Sim Dist. D-86 D-8610%, °F - 401 max -90%, °F - 550 max 640 maxEnd Point, °F 400 max 572 max -
Product Specifications
Design Goals: 1. Ensure products are
separated to desired specifications
2. Ensure adequate vapor/liquid disengagement
3. Ensure adequate surge capacity

Design Conclusions / Recommendations
1. New Feed Tank § To ensure constant feed flow § Be a holding tank for catalyst change out and shutdowns
2. New Feed Pump § Flow = 590 GPM § Total dynamic head (TDH) = 4142 ft § Max impeller diameter TDH = 3200 ft
3. Heat Exchangers § Replace reactor feed/effluent exchangers § Add heat exchanger to feed
4. Compressor § Required hp = 2378 (motors rated at 4000 hp) § Adequate capacity § No changes to be made

Design Conclusions / Recommendations
5. Water Injection System § 8330 lb/hr water required to remove ammonia bisulfide
6. High Pressure Hot Separator § Adequate vapor/liquid disengagement § Surge capacity too small § Will not replace – install safety devices to prevent overflow
7. Fractionating Tower § Produces adequate product specifications § Replace trays to prevent weeping
8. Piping § Sized to fit constraints of: maximum velocity, slug flow, ΔP/100 ft
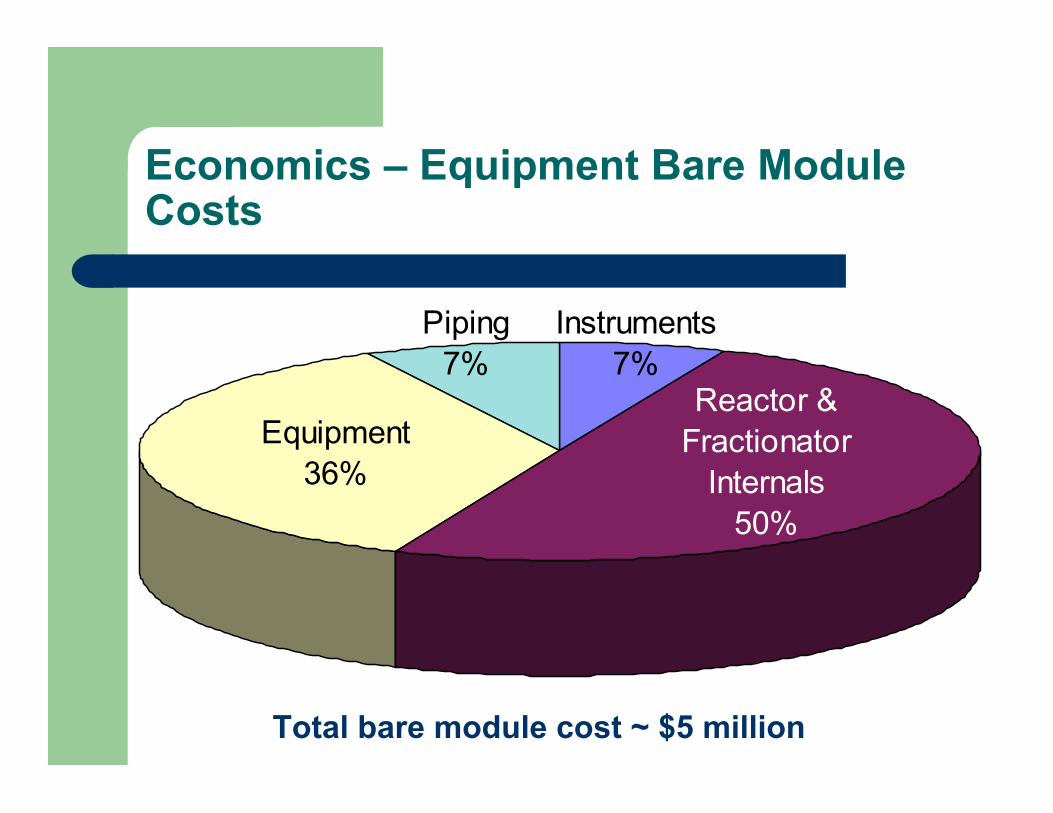
Economics – Equipment Bare Module Costs
Total bare module cost ~ $5 million
Equipment Costs
Instruments7%
Piping7%
Reactor & Fractionator
Internals50%
Equipment36%
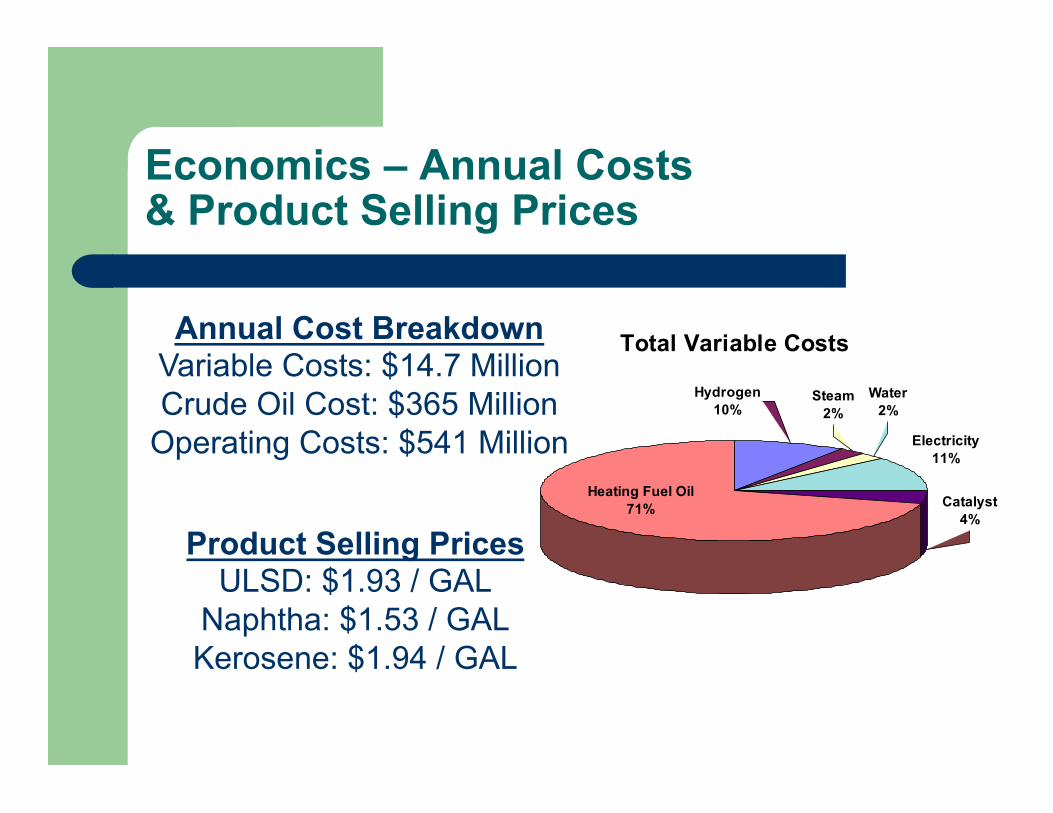
Total Variable Costs
Catalyst4%
Heating Fuel Oil 71%
Electricity11%
Steam2%
Hydrogen10%
Water2%
Economics – Annual Costs & Product Selling Prices
Annual Cost Breakdown Variable Costs: $14.7 Million Crude Oil Cost: $365 Million
Operating Costs: $541 Million
Product Selling Prices ULSD: $1.93 / GAL
Naphtha: $1.53 / GAL Kerosene: $1.94 / GAL
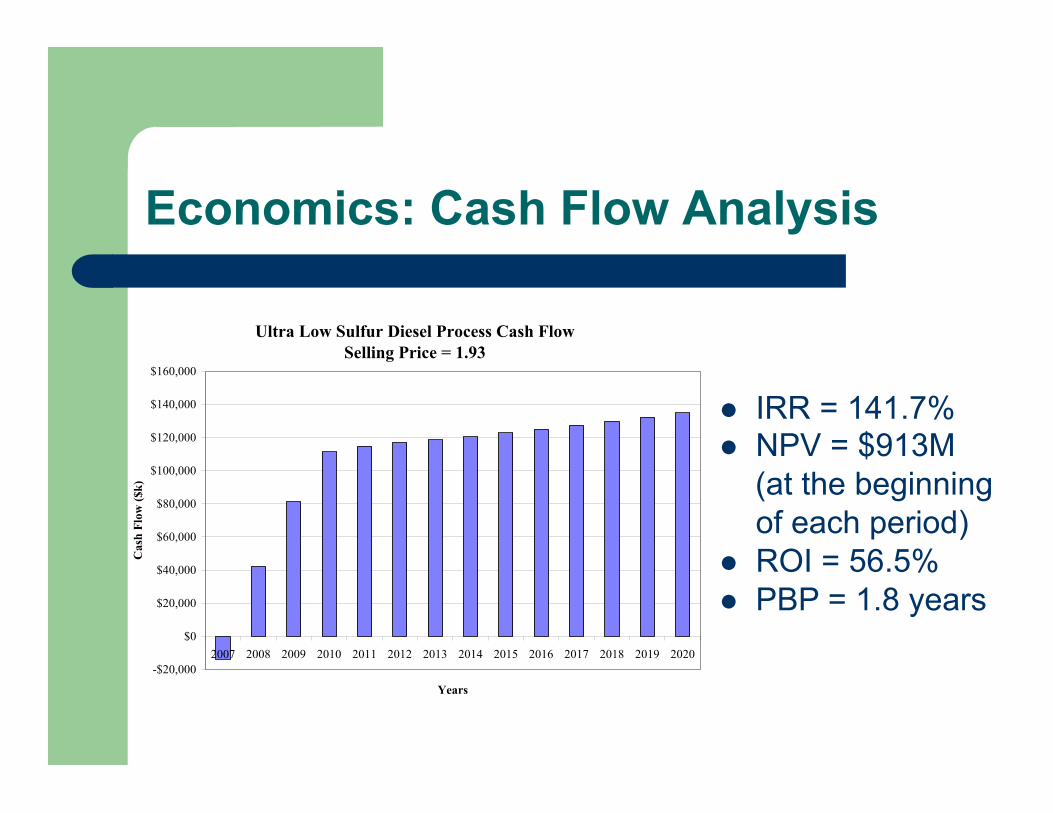
Economics: Cash Flow Analysis
Ultra Low Sulfur Diesel Process Cash FlowSelling Price = 1.93
-$20,000
$0
$20,000
$40,000
$60,000
$80,000
$100,000
$120,000
$140,000
$160,000
2007 2008 2009 2010 2011 2012 2013 2014 2015 2016 2017 2018 2019 2020
Years
Cas
h Fl
ow ($
k)
l IRR = 141.7% l NPV = $913M (at the beginning
of each period) l ROI = 56.5% l PBP = 1.8 years
Comments and Future Recommendations
l Liaison/Student Communication l Project description and equipment
documentation l Time constraints l Project scope
To our liaisons (Dan and Gary)
and Jacobs Engineering
Related Documents