Time- and space-resolved spectroscopy of dynamic hohlraum interiors J.E. Bailey a, * , G.A. Chandler a , G.A. Rochau a , Y. Maron b , S.A. Slutz a , G.S. Dunham c , I. Golovkin d , P.W. Lake a , R.W. Lemke a , J.M. Lucas c , J.J. MacFarlane d , T.A. Mehlhorn a , T.C. Moore c , D.G. Schroen e , E. Stambulchik b , K. Youngblood e a Sandia National Laboratories, Albuquerq ue, NM 87185- 1196, USA b Weizmann Institute of Science, Rehovot, Israel c K-Tech Corporatio n, Albuqu erque, NM 87185, USA d Prism Computational Science, Madison, WI 53703, USA e Schafer Corporation, Livermore, CA 94550, USA Received 28 July 2005 Available online 30 September 2005 Abstract A dynamic hohlraum is created when an annular z-pinch plasma implodes onto a cylindrical 0.014 g/cc 6-mm-diameter CH 2 foam. The im- pact launches a radiating shock that propagates toward the axis at w350 mm/ns. The radiation trapped by the tungsten z-pinch plasma forms a w200 eV hohlraum that provides X-rays for indirect drive inertial confinement fusion capsule implosion experiments. We are developing the ability to diagnose the hohlraum interior using emission and absorption spectroscopy of Si atoms added as a tracer to the central portion of the foam. Time- and space-resolved Si spectra are recorded with an elliptical crystal spectrometer viewing the cylindrical hohlraum end- on. A rectangular aperture at the end of the hohlraum restricts the field of view so that the 1D spectrometer resolution corresponds approximately to the hohlraum radial direction. This enables distinguishing between spectra from the unshocked radiation-heated foam and from the shocked foam. Typical spectral lines observed include the Si Lya with its He-like satellites and the He-like resonance sequence including He a, Heb, and Heg, along with some of their associated Li-like satellites. Work is in progress to infer the hohlraum conditions using collisional eradiative mod- eling that accounts for the radiation environment and includes both opacity effects and detailed Stark broadening calculations. These 6-mm-scale radiation-heated plasmas might eventually also prove suitable for testing Stark broadening line profile calculations or for opacity measurements. Ó 2005 Published by Elsevier B.V. Keywords: Inertial confinement fusion; K-shell spectra; Hohlraum 1. Introduction A dynamic hohlraum is formed when a cylindrical annular z-pinch plasma is accelerated onto a low density cylindrical CH 2 foam located at the axis [1e3]. The pinch plasma impact launches a radiating shock in the CH 2 foam that propagates to- ward the axis at w350 mm/ns. The z-pinch is composed of a high-Z element such as tungsten. The radiation is trapped by the tungsten plasma, forming a hohlraum ( Fig. 1). Inertial confin ement fusion (ICF) capsu le implo sions can be drive n by the radiation that exists at the hohlraum center, prior to the arrival of the radiating shock. Such implosions are an in- ter est ing ICF app roa ch bec ause the ene rgy del ivere d to the capsule can be large. Recent experiments have imploded cap- sules that absorbed more than 40 kJ of X-ray s, which is withi n an order of magnitude of the energy believed necessary for ICF ignition [4e6]. However, successful ICF requires precise control over the radiation symmetry, drive pulse time history, and peak radiation temperatures exceeding 250 eV, in addition to large capsule absorbed energies. The eventual development of methods to address these needs depends on accurate diagno- sis, understanding, and control over the complex physics that exists within the dynamic hohlraum interior. In this paper we describe the progre ss towa rd deve lopment of Si trace r spec tro scopy as a di agnosti c of the dynami c * Corresponding author. Tel.: C1 505 845 7203. E-mail address: [email protected] (J.E. Bailey). 1574-1818/$ - see front matter Ó 2005 Published by Elsevier B.V. doi:10.1016/j.hedp.2005.08.004 High Energy Density Physics 1 (2005) 21 e30 www.elsevier.com/locate/hedp

Welcome message from author
This document is posted to help you gain knowledge. Please leave a comment to let me know what you think about it! Share it to your friends and learn new things together.
Transcript

8/3/2019 J.E. Bailey et al- Time- and space-resolved spectroscopy of dynamic hohlraum interiors
http://slidepdf.com/reader/full/je-bailey-et-al-time-and-space-resolved-spectroscopy-of-dynamic-hohlraum 1/10
Time- and space-resolved spectroscopy of dynamic hohlraum interiors
J.E. Bailey a,*, G.A. Chandler a, G.A. Rochau a, Y. Maron b, S.A. Slutz a, G.S. Dunham c,I. Golovkin d, P.W. Lake a, R.W. Lemke a, J.M. Lucas c, J.J. MacFarlane d, T.A. Mehlhorn a,
T.C. Moore c, D.G. Schroen e, E. Stambulchik b, K. Youngblood e
a Sandia National Laboratories, Albuquerque, NM 87185-1196, USAb Weizmann Institute of Science, Rehovot, Israel
c K-Tech Corporation, Albuquerque, NM 87185, USAd Prism Computational Science, Madison, WI 53703, USA
e Schafer Corporation, Livermore, CA 94550, USA
Received 28 July 2005
Available online 30 September 2005
Abstract
A dynamic hohlraum is created when an annular z-pinch plasma implodes onto a cylindrical 0.014 g/cc 6-mm-diameter CH2 foam. The im-
pact launches a radiating shock that propagates toward the axis at w350 mm/ns. The radiation trapped by the tungsten z-pinch plasma forms
a w200 eV hohlraum that provides X-rays for indirect drive inertial confinement fusion capsule implosion experiments. We are developing
the ability to diagnose the hohlraum interior using emission and absorption spectroscopy of Si atoms added as a tracer to the central portion
of the foam. Time- and space-resolved Si spectra are recorded with an elliptical crystal spectrometer viewing the cylindrical hohlraum end-
on. A rectangular aperture at the end of the hohlraum restricts the field of view so that the 1D spectrometer resolution corresponds approximately
to the hohlraum radial direction. This enables distinguishing between spectra from the unshocked radiation-heated foam and from the shocked
foam. Typical spectral lines observed include the Si Lya with its He-like satellites and the He-like resonance sequence including Hea, Heb, andHeg, along with some of their associated Li-like satellites. Work is in progress to infer the hohlraum conditions using collisionaleradiative mod-
eling that accounts for the radiation environment and includes both opacity effects and detailed Stark broadening calculations. These 6-mm-scale
radiation-heated plasmas might eventually also prove suitable for testing Stark broadening line profile calculations or for opacity measurements.
Ó 2005 Published by Elsevier B.V.
Keywords: Inertial confinement fusion; K-shell spectra; Hohlraum
1. Introduction
A dynamic hohlraum is formed when a cylindrical annular
z-pinch plasma is accelerated onto a low density cylindricalCH2 foam located at the axis [1e3]. The pinch plasma impact
launches a radiating shock in the CH2 foam that propagates to-
ward the axis at w350 mm/ns. The z-pinch is composed of
a high-Z element such as tungsten. The radiation is trapped
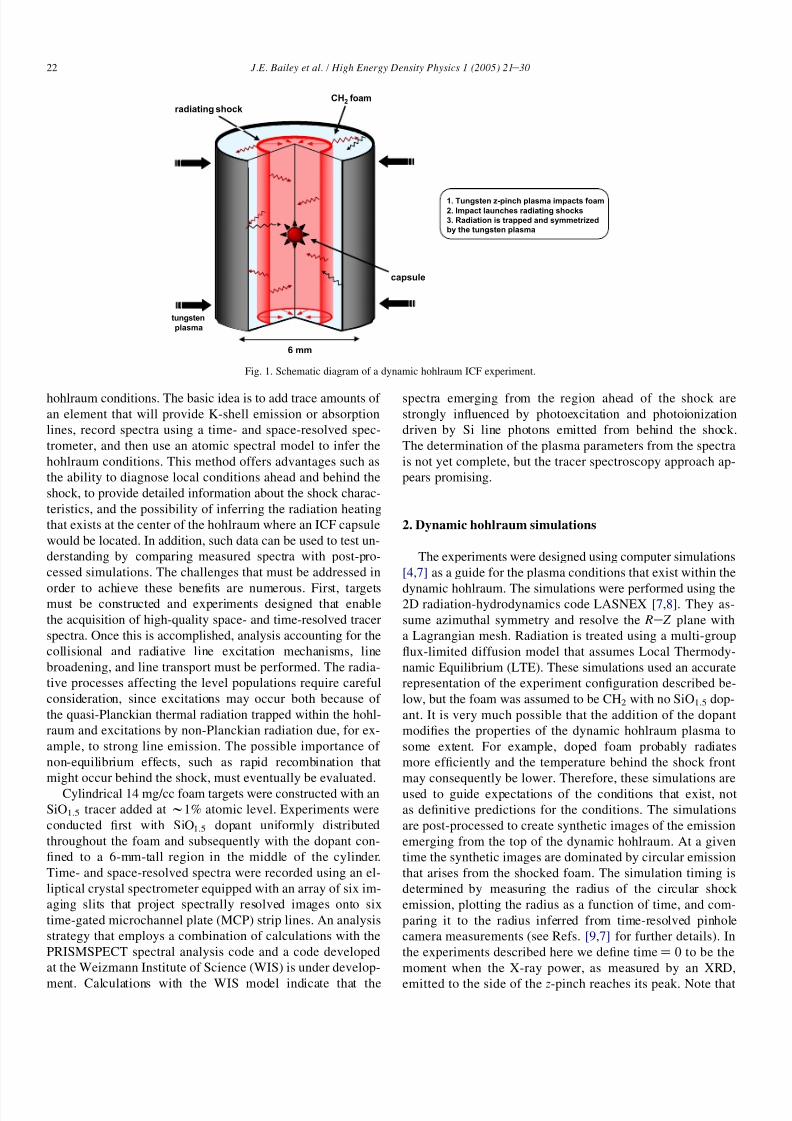
by the tungsten plasma, forming a hohlraum (Fig. 1). Inertial
confinement fusion (ICF) capsule implosions can be driven
by the radiation that exists at the hohlraum center, prior to
the arrival of the radiating shock. Such implosions are an in-
teresting ICF approach because the energy delivered to the
capsule can be large. Recent experiments have imploded cap-
sules that absorbed more than 40 kJ of X-rays, which is withinan order of magnitude of the energy believed necessary for
ICF ignition [4e6]. However, successful ICF requires precise
control over the radiation symmetry, drive pulse time history,
and peak radiation temperatures exceeding 250 eV, in addition
to large capsule absorbed energies. The eventual development
of methods to address these needs depends on accurate diagno-
sis, understanding, and control over the complex physics that
exists within the dynamic hohlraum interior.
In this paper we describe the progress toward development
of Si tracer spectroscopy as a diagnostic of the dynamic* Corresponding author. Tel.: C1 505 845 7203.
E-mail address: [email protected] (J.E. Bailey).
1574-1818/$ - see front matter Ó 2005 Published by Elsevier B.V.
doi:10.1016/j.hedp.2005.08.004
High Energy Density Physics 1 (2005) 21e30www.elsevier.com/locate/hedp
8/3/2019 J.E. Bailey et al- Time- and space-resolved spectroscopy of dynamic hohlraum interiors
http://slidepdf.com/reader/full/je-bailey-et-al-time-and-space-resolved-spectroscopy-of-dynamic-hohlraum 2/10
hohlraum conditions. The basic idea is to add trace amounts of
an element that will provide K-shell emission or absorption
lines, record spectra using a time- and space-resolved spec-
trometer, and then use an atomic spectral model to infer the
hohlraum conditions. This method offers advantages such as
the ability to diagnose local conditions ahead and behind the
shock, to provide detailed information about the shock charac-
teristics, and the possibility of inferring the radiation heating
that exists at the center of the hohlraum where an ICF capsule
would be located. In addition, such data can be used to test un-
derstanding by comparing measured spectra with post-pro-
cessed simulations. The challenges that must be addressed in
order to achieve these benefits are numerous. First, targetsmust be constructed and experiments designed that enable
the acquisition of high-quality space- and time-resolved tracer
spectra. Once this is accomplished, analysis accounting for the
collisional and radiative line excitation mechanisms, line
broadening, and line transport must be performed. The radia-
tive processes affecting the level populations require careful
consideration, since excitations may occur both because of
the quasi-Planckian thermal radiation trapped within the hohl-
raum and excitations by non-Planckian radiation due, for ex-
ample, to strong line emission. The possible importance of
non-equilibrium effects, such as rapid recombination that
might occur behind the shock, must eventually be evaluated.
Cylindrical 14 mg/cc foam targets were constructed with an
SiO1.5 tracer added at w1% atomic level. Experiments were
conducted first with SiO1.5 dopant uniformly distributed
throughout the foam and subsequently with the dopant con-
fined to a 6-mm-tall region in the middle of the cylinder.
Time- and space-resolved spectra were recorded using an el-
liptical crystal spectrometer equipped with an array of six im-
aging slits that project spectrally resolved images onto six
time-gated microchannel plate (MCP) strip lines. An analysis
strategy that employs a combination of calculations with the
PRISMSPECT spectral analysis code and a code developed
at the Weizmann Institute of Science (WIS) is under develop-
ment. Calculations with the WIS model indicate that the
spectra emerging from the region ahead of the shock are
strongly influenced by photoexcitation and photoionization
driven by Si line photons emitted from behind the shock.
The determination of the plasma parameters from the spectra
is not yet complete, but the tracer spectroscopy approach ap-
pears promising.
2. Dynamic hohlraum simulations
The experiments were designed using computer simulations
[4,7] as a guide for the plasma conditions that exist within the
dynamic hohlraum. The simulations were performed using the2D radiation-hydrodynamics code LASNEX [7,8]. They as-
sume azimuthal symmetry and resolve the Re Z plane with
a Lagrangian mesh. Radiation is treated using a multi-group
flux-limited diffusion model that assumes Local Thermody-
namic Equilibrium (LTE). These simulations used an accurate
representation of the experiment configuration described be-
low, but the foam was assumed to be CH2 with no SiO1.5 dop-
ant. It is very much possible that the addition of the dopant
modifies the properties of the dynamic hohlraum plasma to
some extent. For example, doped foam probably radiates
more efficiently and the temperature behind the shock front
may consequently be lower. Therefore, these simulations are
used to guide expectations of the conditions that exist, not
as definitive predictions for the conditions. The simulations
are post-processed to create synthetic images of the emission
emerging from the top of the dynamic hohlraum. At a given
time the synthetic images are dominated by circular emission
that arises from the shocked foam. The simulation timing is
determined by measuring the radius of the circular shock
emission, plotting the radius as a function of time, and com-
paring it to the radius inferred from time-resolved pinhole
camera measurements (see Refs. [9,7] for further details). In
the experiments described here we define timeZ 0 to be the
moment when the X-ray power, as measured by an XRD,
emitted to the side of the z-pinch reaches its peak. Note that
CH2 foam
tungsten
plasma
radiating shock
1. Tungsten z-pinch plasma impacts foam
2. Impact launches radiating shocks
3. Radiation is trapped and symmetrized
by the tungsten plasma
capsule
6 mm
Fig. 1. Schematic diagram of a dynamic hohlraum ICF experiment.
22 J.E. Bailey et al. / High Energy Density Physics 1 (2005) 21e 30
8/3/2019 J.E. Bailey et al- Time- and space-resolved spectroscopy of dynamic hohlraum interiors
http://slidepdf.com/reader/full/je-bailey-et-al-time-and-space-resolved-spectroscopy-of-dynamic-hohlraum 3/10
with this time definition, typical capsule implosions are com-
pleted at approximately t Zÿ4 ns to ÿ3 ns [5].
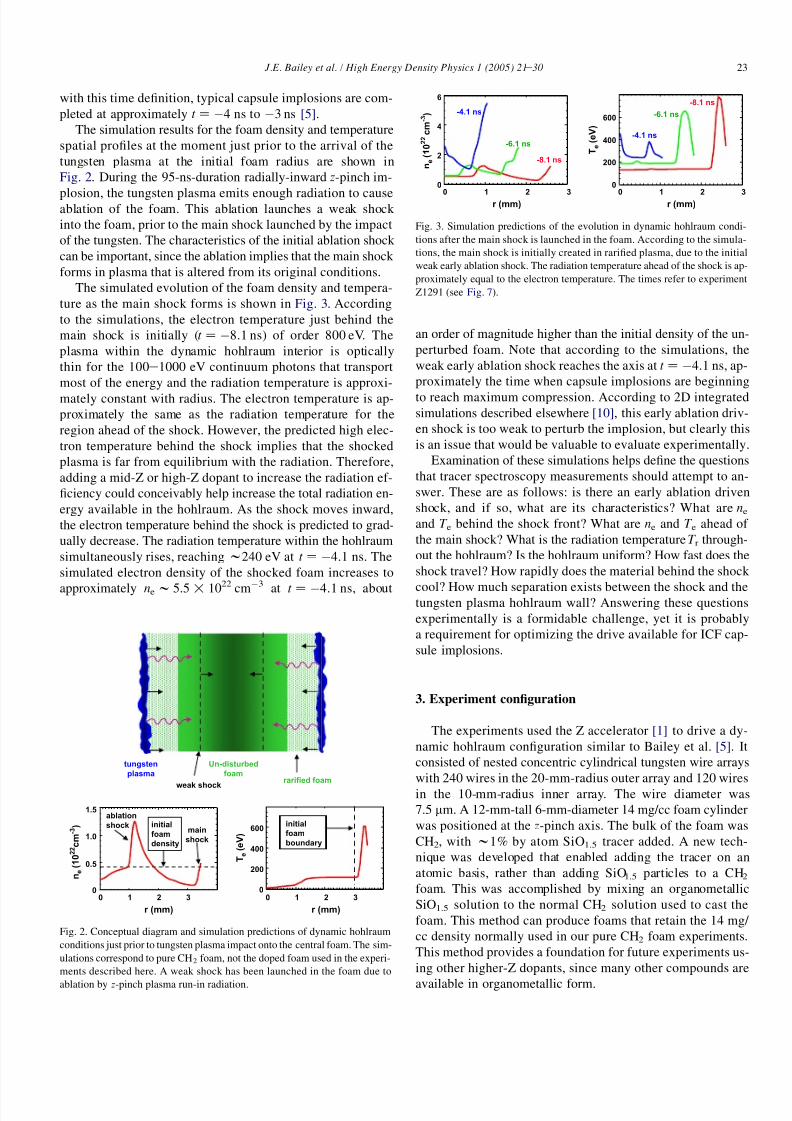
The simulation results for the foam density and temperature
spatial profiles at the moment just prior to the arrival of the
tungsten plasma at the initial foam radius are shown in
Fig. 2. During the 95-ns-duration radially-inward z-pinch im-
plosion, the tungsten plasma emits enough radiation to causeablation of the foam. This ablation launches a weak shock
into the foam, prior to the main shock launched by the impact
of the tungsten. The characteristics of the initial ablation shock
can be important, since the ablation implies that the main shock
forms in plasma that is altered from its original conditions.
The simulated evolution of the foam density and tempera-
ture as the main shock forms is shown in Fig. 3. According
to the simulations, the electron temperature just behind the
main shock is initially (t Zÿ8.1 ns) of order 800 eV. The
plasma within the dynamic hohlraum interior is optically
thin for the 100e1000 eV continuum photons that transport
most of the energy and the radiation temperature is approxi-
mately constant with radius. The electron temperature is ap-
proximately the same as the radiation temperature for the
region ahead of the shock. However, the predicted high elec-
tron temperature behind the shock implies that the shocked
plasma is far from equilibrium with the radiation. Therefore,
adding a mid-Z or high-Z dopant to increase the radiation ef-
ficiency could conceivably help increase the total radiation en-
ergy available in the hohlraum. As the shock moves inward,
the electron temperature behind the shock is predicted to grad-
ually decrease. The radiation temperature within the hohlraum
simultaneously rises, reaching w240 eV at t Zÿ4.1 ns. The
simulated electron density of the shocked foam increases to
approximately new 5.5! 1022
cmÿ3
at t Zÿ
4.1 ns, about
an order of magnitude higher than the initial density of the un-
perturbed foam. Note that according to the simulations, the
weak early ablation shock reaches the axis at t Zÿ4.1 ns, ap-
proximately the time when capsule implosions are beginning
to reach maximum compression. According to 2D integratedsimulations described elsewhere [10], this early ablation driv-
en shock is too weak to perturb the implosion, but clearly this
is an issue that would be valuable to evaluate experimentally.
Examination of these simulations helps define the questions
that tracer spectroscopy measurements should attempt to an-
swer. These are as follows: is there an early ablation driven
shock, and if so, what are its characteristics? What are ne
and T e behind the shock front? What are ne and T e ahead of
the main shock? What is the radiation temperature T r through-
out the hohlraum? Is the hohlraum uniform? How fast does the
shock travel? How rapidly does the material behind the shock
cool? How much separation exists between the shock and thetungsten plasma hohlraum wall? Answering these questions
experimentally is a formidable challenge, yet it is probably
a requirement for optimizing the drive available for ICF cap-
sule implosions.
3. Experiment configuration
The experiments used the Z accelerator [1] to drive a dy-
namic hohlraum configuration similar to Bailey et al. [5]. It
consisted of nested concentric cylindrical tungsten wire arrays
with 240 wires in the 20-mm-radius outer array and 120 wires
in the 10-mm-radius inner array. The wire diameter was
7.5 mm. A 12-mm-tall 6-mm-diameter 14 mg/cc foam cylinder
was positioned at the z-pinch axis. The bulk of the foam was
CH2, with w1% by atom SiO1.5 tracer added. A new tech-
nique was developed that enabled adding the tracer on an
atomic basis, rather than adding SiO1.5 particles to a CH2
foam. This was accomplished by mixing an organometallic
SiO1.5 solution to the normal CH2 solution used to cast the
foam. This method can produce foams that retain the 14 mg/
cc density normally used in our pure CH2 foam experiments.
This method provides a foundation for future experiments us-
ing other higher-Z dopants, since many other compounds are
available in organometallic form.
r (mm) r (mm)
0 1 2 3
n e
( 1 0 2 2 c m - 3 )
0
2
4
6
-8.1 ns
-6.1 ns
-4.1 ns
T e
( e V )
0
200
400
600
-8.1 ns
-6.1 ns
-4.1 ns
0 1 2 3
0 .3
Fig. 3. Simulation predictions of the evolution in dynamic hohlraum condi-
tions after the main shock is launched in the foam. According to the simula-
tions, the main shock is initially created in rarified plasma, due to the initial
weak early ablation shock. The radiation temperature ahead of the shock is ap-
proximately equal to the electron temperature. The times refer to experiment
Z1291 (see Fig. 7).
tungsten
plasma
Un-disturbed
foamrarified foam
weak shock
0 .0 0 .1 0 .2 0 .3 0 .4
0 .5
1 .0
1 .5
n e
( 1 0 2 2 c m - 3 )
r (mm)
0 1 2 3
r (mm)
0 1 2 30
0.5
1.0
1.5ablation
shockmain
shock
initial
foam
density
T e
( e V )
0
200
400
600initial
foam
boundary
0 .0 0 .1 0 .2 0 .3 0 .40 .0
0 .2
0 .4
0 .6
0 .8
Fig. 2. Conceptual diagram and simulation predictions of dynamic hohlraum
conditions just prior to tungsten plasma impact onto the central foam. The sim-
ulations correspond to pure CH2 foam, not the doped foam used in the experi-
ments described here. A weak shock has been launched in the foam due to
ablation by z-pinch plasma run-in radiation.
23 J.E. Bailey et al. / High Energy Density Physics 1 (2005) 21e 30

8/3/2019 J.E. Bailey et al- Time- and space-resolved spectroscopy of dynamic hohlraum interiors
http://slidepdf.com/reader/full/je-bailey-et-al-time-and-space-resolved-spectroscopy-of-dynamic-hohlraum 4/10
The primary diagnostic used in these experiments was
a time- and space-resolved elliptical crystal spectrometer
viewing the top of the cylindrical foam target, along the
z-pinch axis [11,12]. An array of six 50-mm-wide space-
resolving slits projected magnificationZ 0.5 spectrally re-
solved images onto six time-gated MCP strip lines. The spatial
resolution was approximatelyw
220 mm and the field of viewwasw8 mm at the source. The spectral dispersion was provid-
ed by a 3 cm! 10 cm Pentaerythritol (PET) crystal bent to an
ellipse with eccentricityZ 0.976 and a 288.0 cm focal length.
The spectral range covered was approximately 5.1e6.7 A and
the resolving power was approximately l / dlw 800. The time
gate was generated by a w1 ns FWHM, w400 V pulse in ini-
tial experiments and aw300 ps FWHM, 700 V pulse in subse-
quent experiments. In both cases the voltage was applied to the
4-mm-wide strip lines in an open circuit configuration. The
time resolution was estimated to be w0.5 ns with a 1 ns or
2 ns interval between frames. The spectra were recorded on
Kodak TMAX film and the film response was unfolded using
a calibrated step wedge. The spectra were processed by first
creating a separate image for each frame. The data were cor-
rected for the space direction deviations caused by crystal im-
perfections [12] and the wavelength scale was applied using
the instrument geometry with the Lya (lZ 6.180 A) as a ref-
erence. The spectral intensity is corrected for the filter trans-
mission, the crystal reflectivity, and the instrument geometry.
No correction was applied for the MCP photocathode efficien-
cy as calibrations of the actual response were unavailable. This
could lead to errors when comparing spectral lines separated
by w1 A, but should be relatively unimportant for closely
spaced lines.
A variety of other diagnostics were employed as secondaryinstruments [13]. The self-emission from the shock was mea-
sured with a time-gated filtered X-ray pinhole camera viewing
along the target axis from below. Arrays of filtered X-ray di-
odes (XRDs) and filtered diamond photoconducting detectors
measured the X-ray emission from the top, bottom and side.
Two space-resolving time integrated convex crystal spectrom-
eters viewed the Si emission from the top of the cylinder.
4. Results
Initial proof-of-principle experiments used a dopant that
was uniformly distributed throughout the foam. Data froma uniform dopant experiment (Z1117) confirmed that such
foams produced measurable Si line emission (Figs. 4 and 5).
The first four frames at ÿ6.7 ns to ÿ3.7 ns span the period
leading to up peak compression of a typical ICF implosion ex-
periment. The shock velocity was the same as in previous ex-
periments, but in all the experiments presented here the shock
timing relative to the side on XRD peak was earlier than in
previous experiments by approximately 1.5 ns. This timing
difference may be because the side on XRD peak is partially
controlled by random aspects of the z-pinch stagnation physics
that are unrelated to the dynamic hohlraum shock trajectory. It
is presently unknown whether this difference might also have
a contribution from a difference in the sample, e.g., doping the
foam with SiO1.5, or from a timing error in one or the other set
of experiments. The Lya is the brightest feature observed in
the data shown in Figs. 4 and 5. Heb, Heg, and Hed were
also observed in emission. The latter transitions consist of
a broad emission peak with a self-absorption dip. A likely
cause of the broadening is opacity; the line center optical
depths calculated using the conditions expected from the sim-
ulations are up tow1000. The origin of the self-absorption dip
in the He-like features is possibly due to cooling plasma that
jets out of the diagnostic aperture. The decrease in Lya signal
intensity with time may be consistent with the simulation re-
sults suggesting that the T e decreases with time. However,this signal is also affected by the chordal integration of the
1D imaging spectrometer viewing a circular object with a radi-
us that decreases with time. In addition, the variation of MCP
detector sensitivity must be evaluated before any strong con-
clusions are drawn.
frame 1
-6.7 ns
frame 2
-5.6 ns
frame 3
-4.6 ns
frame 4
-3.7 ns
frame 5
-2.7 ns
Ly HeHeHe
Fig. 4. Time- and space-resolved X-ray spectrum recorded in experiment Z1117. This initial proof-of-principle experiment used a foam that was uniformly doped
throughout its volume and a circular 4.5-mm-diameter diagnostic aperture at the top of the foam. Each frame is space-resolved along the vertical direction. The
wavelength axis is horizontal. The times are measured with respect to the peak in the side on X-ray power.
24 J.E. Bailey et al. / High Energy Density Physics 1 (2005) 21e 30

8/3/2019 J.E. Bailey et al- Time- and space-resolved spectroscopy of dynamic hohlraum interiors
http://slidepdf.com/reader/full/je-bailey-et-al-time-and-space-resolved-spectroscopy-of-dynamic-hohlraum 5/10
The initial experiments, e.g., as shown in Figs. 4 and 5,
were performed using a circular 4.5-mm-diameter diagnostic
aperture at the top of the foam. This maximizes the signal,
but it implies that each spatial resolution element of the spec-
tra is composed of contributions from a variety of radii, since
a 1D resolving instrument integrates over chords parallel to the
dispersion plane. This makes it difficult to differentiate be-
tween emission arising from the shocked plasma and the un-
shocked plasma. In subsequent experiments a rectangular
aperture was used to alleviate this problem, as illustrated in
Fig. 6. The rectangular aperture restricts the field of view so
that the spatial resolution corresponds more closely to the ra-
dial coordinate of the cylinder. This approximation remains
valid as long as the radius of interest is large compared to
the half width of the rectangular aperture. This enables unam-biguous discrimination between the emission from shocked
and unshocked foam, a critical capability if we are to
understand the radiation flow into the central region of the
hohlraum ahead of the shock.
The other major difference in this second set of experi-
ments was the implementation of a multi-casting fabrication
technique that allowed the SiO1.5 dopant to be restricted to
the central 6-mm-tall region of the foam. This avoids gradients
due to foam plasma that jets out the diagnostic aperture during
the experiment. It also provides the basis for future experi-
ments that alter the line opacity by changing the height of
the doped region. The disadvantage of these two changes is
that the signal is reduced.
Time-resolved spectra recorded in an experiment with the
restricted view, as shown in Fig. 6, and the localized dopant
are shown in Fig. 7. This experiment (Z1291) used a foam
doped over the central 6-mm-region and a 1.5! 7 mm rectan-gular diagnostic aperture. Thus, the radial profile of the emis-
sion across the shock was well-resolved for shock radii of
about 1 mm or greater. Note that the use of a 7-mm-long ap-
erture enabled the observation of emission from any plasma
ablated beyond the original foam location by the early time
z-pinch radiation. Good quality spectra were recorded in the
first four frames in this experiment. Schematic diagrams indi-
cating the approximate shock size and the field of view restric-
tion provided by the diagnostic aperture are shown to the right
of each frame in Fig. 7. A sequence of lineouts through the im-
ages shown in Fig. 7 is shown in Fig. 8. These spectra demon-
strated that sufficient signal could be obtained with w1% Si
dopant, a 6-mm-tall doped region, and the restricted signal
provided when a rectangular aperture was used. In addition,
employing a local-dopant in the central 6-mm-tall region
greatly reduced the self-absorption of the He-like features, in
comparison with the uniform dopant experiment. There is still
a residual self-absorbed profile in lines observed on time inte-
grated spectrometers in the vicinity of the cylinder axis. The
origin of this residual self-absorption is presently unknown,
but may be related to temperature gradients that could exist
at the boundary between the doped and undoped region.
Some further improvements are clearly possible. The align-
ment of the images onto the frames was not perfect, so that
the emission from the top segment of the shock was missing
frame 1
frame 2
frame 3
frame 4 He He
Ly
i n t e n s i t y
(Angstroms)
5.65.2 6.0 6.4
Fig. 5. Lineouts of the uniform dopant Z1117 spectra. Each lineout averages over a 0.6-mm-tall region at the top of the spectral image. This region corresponds
approximately to the emission from the shocked foam.
CH2+
SiO1.5
CH2
CH2
7 mm
(a) (c)(b)
Fig. 6. Target characteristics used in Z1291, an experiment using a restricted
field of view and localized dopant. A schematic diagram illustrating the local
foam doping over the central 6-mm-tall region is shown in (a). A radiograph of
the target recorded before the experiment is shown in (b). An optical photo-
graph of the top of the target after it was attached to the diagnostic aperture
is shown in (c). The white foam is visible through the 1.5 ! 7 mm slot cut
into the gold-coated aperture plate. The 7-mm-long slot enables viewing the
target beyond the initial 6-mm-diameter.
25 J.E. Bailey et al. / High Energy Density Physics 1 (2005) 21e 30

8/3/2019 J.E. Bailey et al- Time- and space-resolved spectroscopy of dynamic hohlraum interiors
http://slidepdf.com/reader/full/je-bailey-et-al-time-and-space-resolved-spectroscopy-of-dynamic-hohlraum 6/10
on frame 1 and partially missing on frame 2. There are also
some artifacts due to MCP and crystal defects. In addition,
the electrical gating of the MCP strip lines in this experiment
used a w300 ps FWHM pulse injected at one end. The oppo-
site end of the strip line was inadvertently operated in an open
circuit configuration, so that the pulse reflects. The reflected
pulse adds to the incident pulse, but the relative time changes
as a function of distance along the strip. The pulse width is
comparable to the transit time, so that the applied gate voltage
varies with position. Thus, the gain varies by more than an or-
der of magnitude (see Ref. [14]). The pulse was injected at
the long wavelength end and consequently the line intensities
closer to the long wavelength end are reduced. This makes
comparisons of lines separated by more than 0.1e0.2 A prob-
lematic, although comparisons of closely spaced lines, the
line profiles, and the spatial dependence of the lines remain
valid.
5. Analysis and discussion
The focus of our analysis efforts is on the experiment
shown in Fig. 7, as it provides almost-pure radial resolution
and the local doping avoids the complication associated with
absorption by cooler plasma in the vicinity of the diagnostic
aperture. The frame 2 and frame 3 spectral images in Fig. 7
consist of bright emission features at radii of approximately
2.2 mm and 1.66 mm, respectively. In frame 4 the freeefree
continuum and optically thin satellites to the Lya have well-
defined bright emission features that peak at approximately
0.93 mm radius, while the resonance line intensities are fairly
constant with radius. We associate the bright emission feature
in these three frames with the shock, since the radius as a func-
tion of time determined from the spectra is essentially the
same as the shock radius measured with a filtered time-re-
solved pinhole camera. The feature in frame 1 is also pre-
sumed to be associated with the shock, although the
instrument misalignment precludes the determination of the
radius. The shock velocity inferred from the spectral data is
w350 mm/ns, which is in good agreement with pinhole cam-
era data. Assuming constant velocity, the radius in frame 1
is approximately 2.9 mm, comparable to the initial foam radi-
us. The emission feature spatial width is approximately 1 mm
in frames 1e3, significantly larger than the w250 mm width
measured with pinhole imaging in previous experiments using
undoped foam. This difference is not understood, but it could
be due in part to defects in the construction or alignment of the
foam cylinder with respect to the z-pinch.
Ly HeHeHeHeLy
shock
shock
radiation
heated
foam
aperture
shock
artifact
artifact
frame 4
-4.1 ns
frame 3
-6.1 ns
frame 2
-8.1 ns
frame 1
-10.0 ns
Fig. 7. The space- and time-resolved spectra recorded in the restricted view local-dopant experiment Z1291. The intensity of each image has been adjusted to
optimize the display. The approximate shock location and the field of view restriction provided by the rectangular aperture are shown to the side of each image.
The shock emission is represented by the red circle and the portion of the shock emission that is blocked by the aperture is marked with a dashed circle. The space-
resolving slit is perpendicular to the long dimension of the slot aperture. The space direction is vertical in each frame and the wavelength axis is horizontal. In
frames 1 and 2 the emission arises only from the shocked foam region. In frame 3 the emission from the radiation-heated foam ahead of the shock is clearly visible.
In frame 4 the resonance line emission intensity from ahead of the shock is comparable to the intensity from behind the shock.
26 J.E. Bailey et al. / High Energy Density Physics 1 (2005) 21e 30

8/3/2019 J.E. Bailey et al- Time- and space-resolved spectroscopy of dynamic hohlraum interiors
http://slidepdf.com/reader/full/je-bailey-et-al-time-and-space-resolved-spectroscopy-of-dynamic-hohlraum 7/10
In the frames 1 and 2 data, no emission is observed from
the central region of the foam, ahead of the shock. This
does not rule out the possibility that a relatively narrow
(wfew hundred micron) region ahead of the shock front is
photopumped by sufficiently strong emission from behind
the shock to contribute some of the observed emission on
the inside edge of the shock feature. Later in time (frames 3
and 4) emission from the hohlraum interior ahead of the shock
becomes bright enough to be measured. Indeed, the spatial
profile of the optically thick Lya, Heb and Heg lines is fairly
constant with radius in frame 4. The important qualitative ob-
servation from this experimental configuration is that emission
lines which should be sensitive to the plasma conditions are
recorded from both the shocked foam and from the radia-
tion-heated foam ahead of the shock, at times of interest for
ICF capsule experiments.
Although we will not endeavor here to infer quantitative in-
formation from the experimental data, we can, nevertheless,
gain insight by examination of variations in calculated synthet-
ic spectra. A sequence of calculations at different plasma tem-
peratures and densities was performed with the PRISMSPECT
code [15]. This code calculates detailed NLTE atomic popula-
tions, including the relevant collisional processes. An optional
radiation field can also be included, as photoionization, photo-
excitation, and opacity can be included self-consistently in the
calculation of the populations. Emergent spectra are calculated
for a specified plasma thickness, including opacity effects and
Stark broadening [16]. The spectral calculations include the
combined effects of Si, O, C, and H atoms present in the ex-
periment of interest. However, the Stark broadening calcula-
tions do not include the ion dynamic effects on the Si
emission due to the presence of H and C atoms, which will
not affect the qualitative nature of the discussion to follow.
The other major approximation in these calculations is that,
by definition, the calculated emergent spectra represent the
emission from a uniform plasma at a single temperature and
density. The effects of the local radiation field are calculated
self-consistently, but the possible photo processes due to emis-
sion at other locations in the plasma are not included. For ex-
ample, strong Si line emission from the shocked plasma can
potentially pump the levels in the unshocked plasma (see be-
low). Work is in progress to incorporate such non-local pro-
cesses in the SPECT3D code. Despite these approximations,
single point calculations can be quickly run for many plasma
conditions, providing insight into the trends expected for the
spectra.
An example of a set of PRISMSPECT calculations is
shown in Fig. 9. These NLTE calculations were all run with
an externally imposed Planckian radiation field with
T rZ 187 eV. The ordinate for the left hand side spectra is
-4.1
-6.1
t (ns)
i n t e n s i t y
0.0
0.2
0.8
0.4
0.6
i n t e
n s i t y
0.0
0.2
0.8
0.4
0.6
(Angstroms)
5.2 6.0 6.45.6
(Angstroms)
5.2 6.0 6.45.6
Un-shocked foam
Shocked foamLy
Ly
Ly
Ly
He
He
He
He
He
He
-4.1
-6.1
-8.1
-10.0
t (ns)
Fig. 8. Lineouts from the shocked and unshocked foam regions in experiment Z1291. The intensity scales are the same for each lineout in order to illustrate the
intensity variation with time and space, but each lineout is displaced vertically to enable a clear display. Lineouts from the unshocked region are not shown for
frames 1 and 2, since no spectral lines are visible at these times. Note that these lineouts are averages over the indicated regions, but interesting spatial variations
are present in the vicinity of the shock.
27 J.E. Bailey et al. / High Energy Density Physics 1 (2005) 21e 30

8/3/2019 J.E. Bailey et al- Time- and space-resolved spectroscopy of dynamic hohlraum interiors
http://slidepdf.com/reader/full/je-bailey-et-al-time-and-space-resolved-spectroscopy-of-dynamic-hohlraum 8/10
the emergent intensity calculated for a 6-mm-tall slab of
plasma at the specified density and temperature. The ordinate
for the right hand plots is the optical depth at the same condi-
tions. The spectra have the instrumental resolution included by
convolution. These calculations indicate that the absolute
emergent intensity increases dramatically with increasing tem-
perature and density. This may be an extremely valuable de-
pendence, even though the present instrument is not
absolutely calibrated. Changes in the conditions as a function
of time or space should produce easily measurable changes in
the intensity. Other potentially useful characteristics of these
spectra include the variation in relative line intensities from
different charge states as a function of temperature and the
growth in the line widths with increasing density. Note that
the optical depth plots indicate that the resonance lines are
substantially optically thick for the conditions calculated
here. Only some of the satellites and possibly the Hed line
are optically thin. This implies that an accurate accounting
of opacity is crucial to the analysis. Comparisons with optical-
ly thin calculations show that in most cases, optical depth ef-
fects account for most of the observed line width.
The top spectrum in Fig. 9 at T Z 187 eV and r Z 0.014 g/
cc is comparable to conditions predicted ahead of the shock
(see Figs. 2 and 3). The spectra at higher temperature and den-
sity values are closer to expected characteristics of the shocked
foam. Armed with these observations, the simulation results
described above imply that the emission from ahead of the
shock should be 10e100 times weaker than behind the shock.
This expectation is not matched by the experiment, after
t wÿ6 ns. Thus, either the simulation results are not very sim-
ilar to the experiment, or one of the approximations employed
in the PRISMSPECT calculations is not valid. The results of
more complete calculations using the WIS model (see below)
show that neglecting the non-local photopumping processes is
responsible for a major portion of this discrepancy. These cal-
culations imply that Si line emission from the shocked foam
region plays a major role in exciting the line emission from
the region ahead of the shock. The simulation fidelity is still
an open question that must be tested.
For comparison with the experiments it is important to re-
member that the data in Fig. 7 are not suitable for comparing
line intensities unless the lines are very close together and that
the spatial direction for the spectra in Fig. 4 is a blend of radial
locations (caused by the circular aperture). However, the spec-
tra in Fig. 7, which are from the experiment with the restricted
view and the localized SiO1.5 (schematically illustrated in
Fig. 6) demonstrate that for shock radii of less than w1 mm
the spectral emission ahead of the shock is comparable to
the emission from behind the shock. Then the relative intensi-
ties from the data in Fig. 4 can be considered qualitatively
(Angstroms) (Angstroms)
Te=187 eV; = 0.014 g/cc
Te=300 eV; = 0.014 g/cc
Te=500 eV; = 0.014 g/cc
Te=500 eV; = 0.056 g/cc
Te=500 eV; = 0.098 g/cc
0.0
0.4
0.2
0.0
2.0
4.0
10
20
0
0
20
40
60
0
100
50
5.0 5.5 6.0 6.5 7.0 5.0 5.5 6.0 6.5 7.0
HeLyHe
He
Ly
0.1
1.0
10
100
1000
0.1
1.0
10
100
0.1
1.0
10
100
0.1
1.0
10
100
0.1
1.0
10
100
1000 HeLy
He
He
Ly
Fig. 9. A set of PRISMSPECT synthetic spectrum calculations at the indicated temperatures and densities. The spectrum emerging from the 6-mm-tall doped foam
is shown on the left and the corresponding optical depth is shown on the right.
28 J.E. Bailey et al. / High Energy Density Physics 1 (2005) 21e 30

8/3/2019 J.E. Bailey et al- Time- and space-resolved spectroscopy of dynamic hohlraum interiors
http://slidepdf.com/reader/full/je-bailey-et-al-time-and-space-resolved-spectroscopy-of-dynamic-hohlraum 9/10
characteristic of either the shocked or unshocked foam. Note
that this is a broad observation and there are in fact some po-
tentially important differences between the shocked and un-shocked foam emissions.
A different analysis approach was pursued using a colli-
sionaleradiative model constructed at the Weizmann Institute
of Science (the WIS model [17]). This model also employs
an NLTE calculation of the level populations accounting for
collisional and radiative processes. This model was tailored
specifically to this problem, including as intrinsic line shapes
detailed calculations of the Stark broadening that account for
the H and C ion dynamics effect on the Si line profile [18].
In addition, this model uses a two dimensional treatment of
the radiation field that enables the non-local photopumping to
be included. For this purpose the plasma is divided intoa three-zone system as shown in Fig. 10. The central zone rep-
resents the unshocked foam and the shocked region is divided
into two separate regions. For each zone the radiation transport
equation is solved self-consistently with the population kinet-
ics. Computational limitations restrict this solution to one loca-
tion per zone, selected to be the position half way between the
center of the zone and the edge. The transport equation is
solved for a set of six ray paths along each of the orthogonal
coordinate directions. This provides a preliminary approxima-
tion for the total radiation field at that location, including the
Planckian radiation that fills the hohlraum, the line and contin-
uum radiation originating from elsewhere within the plasma,
and the line and continuum radiation originating from the local
region. The total radiation determined for the single locationwithin each zone is then used as an approximation for the radi-
ation field everywhere within the zone. This enables the calcu-
lation of emergent spectra as a function of radius for a specified
set of plasma conditions within the three zones. These calcula-
tions are intensive and the number of excited levels was re-
duced as a compromise to speed up the computations. More
detailed kinetics can be used as the analysis is refined.
The WIS model was used to address the question of
whether non-local radiative processes have an important ef-
fect on the populations, particularly for the unshocked
foam. The unshocked foam properties are the most likely to
be influenced by non-local radiation, since the temperature
is expected to be lower. Calculations were performed using
conditions suggested by the simulations (see Fig. 10). Tem-
peratures of 300e400 eV were chosen for the shocked region,
since higher temperatures will make any non-local photo-
pumping effects even more important. The calculated spec-
trum emerging from the top of the unshocked foam is
shown as a red curve in Fig. 11. To address the question of
non-local photopumping importance, a second set of calcula-
tions performed with the line radiation emitted by the
shocked foam switched off is shown as the blue curve in
Fig. 11. This calculation demonstrates that the excited states
in the unshocked foam are mainly populated by photopump-
ing, since the emission is orders of magnitude smaller whenthe photopumping is not included.
The conclusion that non-local photopumping is responsi-
ble for the line emission emerging from the unshocked
foam is consistent with the data shown in Fig. 7. In particu-
lar, the similarity of the spectra from ahead and behind the
shock in frame 4 would be difficult to explain if this effect
was not included. Nevertheless, the model is rather complex
un-shocked foam175 eV; 0.014 g/cc
Tr = 175 eV
shocked foam
300 eV; 0.042 g/cc
shocked foam
400 eV; 0.042 g/cc
1mm
0.45 mm
0.45 mm
Fig. 10. Schematic diagram of the WIS model calculations used to evaluate the
importance on non-local radiation on the spectra emerging from the unshocked
foam. The radiation transport equation is solved along the four directions in-
dicated plus the two directions in and out of the page, for a single location
within each zone.
Un-normalized
Red=full model
Blue=no Si line photopumping
normalized
Red=full model
Blue=no Si line photopumping
(Angstroms)
5.0 5.5 6.0 6.5
(Angstroms)
5.0 5.5 6.0 6.5
Ly
Ly
Ly
He
Ly
He
He
He Ly
Ly
He
He
He
He
Fig. 11. Synthetic spectra calculated with the WIS model from the 6-mm-tall doped foam region ahead of the shock (inner shaded region in Fig. 10). The red curve
corresponds to the full radiation field calculation and the blue curve has the line emission from the two shocked regions turned off.
29 J.E. Bailey et al. / High Energy Density Physics 1 (2005) 21e 30
8/3/2019 J.E. Bailey et al- Time- and space-resolved spectroscopy of dynamic hohlraum interiors
http://slidepdf.com/reader/full/je-bailey-et-al-time-and-space-resolved-spectroscopy-of-dynamic-hohlraum 10/10
and further scrutiny is in progress. Assuming that this con-
clusion is substantiated, an analysis strategy can now be for-
mulated. We intend to analyze the plasma conditions from
the shocked foam first, since non-local radiation effects are
either small or negligible for this region. This allows the
plasma conditions to be inferred from the locally observed
line intensities and profiles. Once the shocked foam charac-teristics are determined, synthetic spectra emerging from
the unshocked foam, accounting for the non-local radiation,
can be computed for a variety of unshocked foam conditions.
Comparison of these synthetic spectra with data should lead
to a determination of the conditions in the unshocked foam.
In the unshocked foam the dominant heating mechanism is
still the Planckian radiation field filling the hohlraum and
the dominant ionization mechanism is collisional ionization
by the free electrons. Therefore, the emergent spectra are still
expected to be sensitive to the local temperature and density
conditions, even though the predominant excitation is due to
the non-local radiation. The interpretation of such data in the
presence of combined thermal and non-thermal radiation
fields is complex. However, we regard the effective photo-
pumping processes to be beneficial, since otherwise it might
be very difficult to observe emission spectra from the radia-
tion-heated plasma ahead of the shock.
The successful interpretation of these data should lead to
greatly improved understanding of the radiation available for
driving ICF capsule implosions. In addition, these plasmas
have intrinsic interest, as the ability to create a uniform 6-
mm-scale plasma heated by radiation to greater than 200 eV
is unique to the best of our knowledge. It is conceivable that
these plasmas may be useful for evaluation of Stark broadening
calculations, since the initial density is known. This depends onwhether an early ablation shock significantly alters the initial
conditions. Stark broadening calibrations would obviously re-
quire lower dopant levels to reduce opacity broadening, but
this should be easily achievable. Alternatively, such plasmas
may be useful for opacity studies. A major challenge for this ap-
plication is the development of a backlighter source bright
enough to overwhelm the self-emission. The Z beamlet laser
may be suitable for this purpose. The possibility of applying dy-
namic hohlraum plasmas for these applications will be clarified
by quantitative interpretation of the actual plasma conditions.
Acknowledgements
We thank the Z accelerator, diagnostics, materials process-
ing, target fabrication, and wire array teams for invaluable and
dedicated technical assistance. L.P. Mix provided data pro-
cessing assistance and R.C. Mancini provided comments on
the manuscript. We are also grateful to R.J. Leeper andM.K. Matzen for support and encouragement. Sandia is a mul-
tiprogram laboratory operated by Sandia Corporation,
a Lockheed Martin Company, for the U.S. Department of En-
ergy under contract No. DE-AC04-94AL85000.
References
[1] M.K. Matzen, Phys. Plasmas 4 (1997) 1519.
[2] V.P. Smirnov, Plasma Phys. Controlled Fusion 33 (1991) 1697.
[3] J.H. Brownell, R.L. Bowers, K.D. McLenthan, D.L. Peterson, Phys. Plas-
mas 5 (1998) 2071.
[4] S.A. Slutz, J.E. Bailey, G.A. Chandler, G.R. Bennett, G. Cooper,
J.S. Lash, et al., Phys. Plasmas 10 (2003) 1875.[5] J.E. Bailey, G.A. Chandler, S.A. Slutz, I. Golovkin, P.W. Lake,
J.J. MacFarlane, et al., Phys. Rev. Lett. 92 (2004) 085002.
[6] C.L. Ruiz, G.W. Cooper, S.A. Slutz, J.E. Bailey, G.A. Chandler,
T.J. Nash, et al., Phys. Rev. Lett. 93 (2004) 015001.
[7] R.W. Lemke, J.E. Bailey, G.A. Chandler, T.J. Nash, S.A. Slutz,
T.A. Mehlhorn, et al., Phys. Plasmas 12 (2004) 012703.
[8] G. Zimmerman, W. Kruer, Comments Plasma Phys. Controlled Fusion 2
(1975) 85.
[9] J.E. Bailey, G.A. Chandler, S.A. Slutz, G.R. Bennett, G. Cooper,
J.S. Lash, et al., Phys. Rev. Lett. 89 (2002) 095004.
[10] S.A. Slutz, in preparation.
[11] B.L. Henke, H.T. Yamada, T.J. Tanaka, Rev. Sci. Instrum. 54 (1983)
1311.
[12] P.W. Lake, J.E. Bailey, G.A. Rochau, T.C. Moore, D. Petmecky, P. Gard,
Rev. Sci. Instrum. 75 (2004) 3690.[13] T.J. Nash, M.S. Derzon, G.A. Chandler, D.L. Fehl, R.J. Leeper,
J.L. Porter, et al., Rev. Sci. Instrum. 72 (2001) 1167.
[14] J.D. Kilkenny, Laser Part. Beams 9 (1991) 49e69.
[15] J.J. MacFarlane, I.E. Golovkin, P.R. Woodruff, in: B. Hammel,
D. Meyerhofer, J. Meyerter Vehn, H. Azechi (Eds.), Proceedings of iner-
tial fusion science and applications 2003, American Nuclear Society, La
Grange Park, Il, 2004, p. 457.
[16] D.A. Haynes, Private communication, 2003.
[17] V. Fisher, Y. Maron, Private communication, 2005.
[18] E. Stambulchik, Y. Maron, I. J. Almiev, J. Quant. Spectrosc. Radiat.
Transf. this issue. E. Stambulchik, K. Tsigutkin, Y. Maron, Europhysics
Conference Abstracts 27A (2003) 1.58.
30 J.E. Bailey et al. / High Energy Density Physics 1 (2005) 21e 30
Related Documents


