Feasibility Studies on Joint Crediting Mechanism Projects towards Environmentally Sustainable Cities in Asia JCM Large Scale Feasibility Project to Promote Water Saving and Energy Saving Products in Vietnam March 2014 Mitsubishi UFJ Morgan Stanley Securities Co., Ltd.

Welcome message from author
This document is posted to help you gain knowledge. Please leave a comment to let me know what you think about it! Share it to your friends and learn new things together.
Transcript
Feasibility Studies on Joint Crediting Mechanism Projects
towards Environmentally Sustainable Cities in Asia
JCM Large Scale Feasibility Project to
Promote Water Saving and Energy Saving Products in Vietnam
March 2014
Mitsubishi UFJ Morgan Stanley Securities Co., Ltd.
Summary

1. Purpose
The primary purpose of this project (“Project”) is to establish a water-saving mechanism
reducing the emission of carbon dioxide (“CO2”) in order to develop a large-scale nationwide Joint
Crediting Mechanism (“JCM”) while solving water-related challenges faced by Vietnam including
shortage, leakage and contamination of water.
In this Project we will verify two sub-projects of introducing water-saving equipments, and
rainwater utilization / purification system, as well as discussing finance scheme to promote
water-saving equipments.
2. Introduction and Verification of Water-Saving Equipments
<Background>
There are energy demands at water purification facility or sewage treatment facility for supply
and treatment of water and water-saving showers and toilets will contribute to reducing energy and
saving heating energy. In view of the study of 2012 conducted by the Ministry of Economy, Trade
and Industry Japan (“METI”), Mitsubishi UFJ Morgan Stanley Securities (“MUMSS”) and TOTO
(“TOTO”) came to a conclusion that promotion of water-saving equipments will certainly generate
credits.
In the study of 2012, energy-saving was expected not only from the water and sewage system
based on the credit methodology but also in the water supply system within the building. However,
there was not enough insight on how to reflect such effect on the credit methodology.
In this Project, we established a water-saving credit methodology for hotels to estimate
energy-saving effect not only from the water and sewage system but also from the water supply
system within the building to discuss applicability of a large-scale JCM project.
<Outline of Project>
This Project is aimed at estimating the level of water and CO2 reduction through the
introduction of water-saving equipments in hotels in Vietnam based on the quantified water-saving
effect taken from various measurement devices (measurement of water and hot water, water pumps,
heat sources etc).
We attempt water saving during the actual water-consumption scenes in each guest room using
water-saving showers and toilets equipped with the advanced Japanese water-saving technology.
Chronological shift of water consumption will be modeled using a measurement device installed in
guest rooms and various pumps. Level of energy saved for hot-water shower will also be modeled.
In addition, we will determine the default value in MRV methodology to estimate the volume of
CO2 reduction upon analysis of the measurements taken and establish water usage patterns for
1
water-saving showers and toilets.
Our study was conducted at Renaissance Riverside Hotel Saigon, a five-star hotel in Ho Chi
Minh City (“HCMC”) upon replacement of the toilet and shower facilities in 150 rooms out of 336
guest rooms in total with TOTO water-saving equipments.
<Outcome of Study>
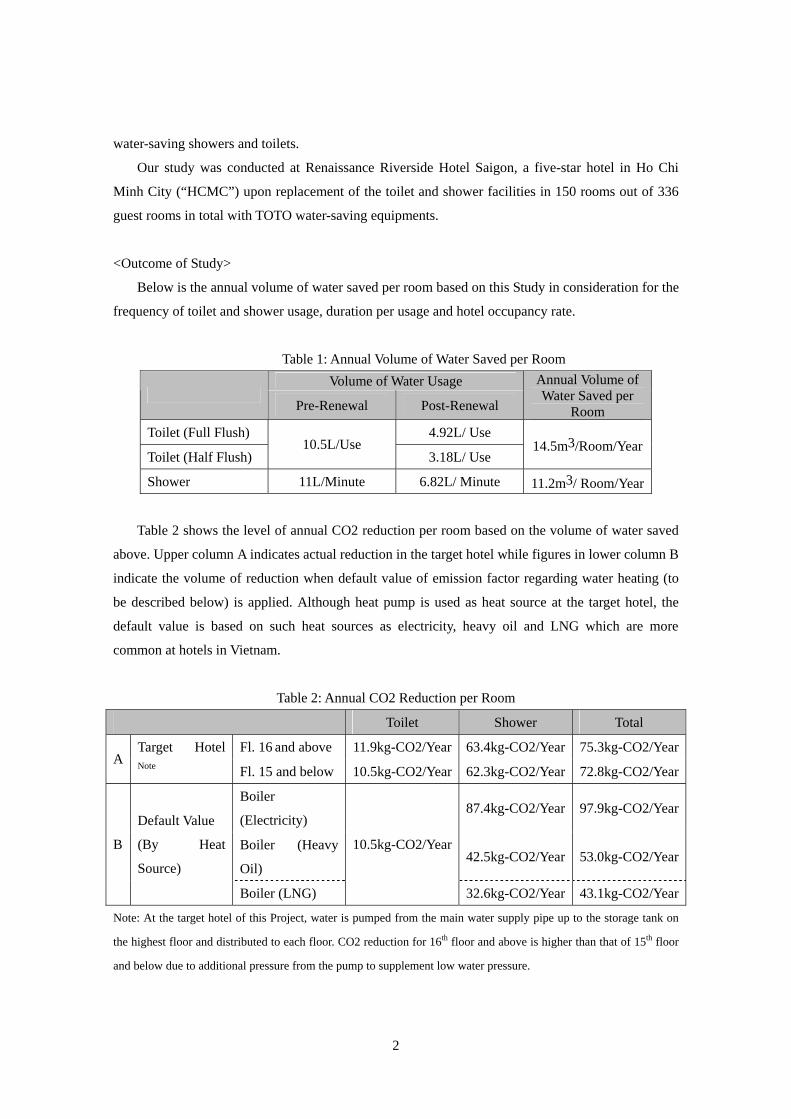
Below is the annual volume of water saved per room based on this Study in consideration for the
frequency of toilet and shower usage, duration per usage and hotel occupancy rate.
Table 1: Annual Volume of Water Saved per Room Volume of Water Usage
Pre-Renewal Post-Renewal
Annual Volume of Water Saved per
Room Toilet (Full Flush) 4.92L/ Use
Toilet (Half Flush) 10.5L/Use
3.18L/ Use 14.5m3/Room/Year
Shower 11L/Minute 6.82L/ Minute 11.2m3/ Room/Year
Table 2 shows the level of annual CO2 reduction per room based on the volume of water saved
above. Upper column A indicates actual reduction in the target hotel while figures in lower column B
indicate the volume of reduction when default value of emission factor regarding water heating (to
be described below) is applied. Although heat pump is used as heat source at the target hotel, the
default value is based on such heat sources as electricity, heavy oil and LNG which are more
common at hotels in Vietnam.
Table 2: Annual CO2 Reduction per Room
Toilet Shower Total
Fl. 16 and above 11.9kg-CO2/Year 63.4kg-CO2/Year 75.3kg-CO2/YearA
Target Hotel Note Fl. 15 and below 10.5kg-CO2/Year 62.3kg-CO2/Year 72.8kg-CO2/Year
Boiler
(Electricity) 87.4kg-CO2/Year 97.9kg-CO2/Year
Boiler (Heavy
Oil) 42.5kg-CO2/Year 53.0kg-CO2/Year
B
Default Value
(By Heat
Source)
Boiler (LNG)
10.5kg-CO2/Year
32.6kg-CO2/Year 43.1kg-CO2/Year
Note: At the target hotel of this Project, water is pumped from the main water supply pipe up to the storage tank on
the highest floor and distributed to each floor. CO2 reduction for 16th floor and above is higher than that of 15th floor
and below due to additional pressure from the pump to supplement low water pressure.
2
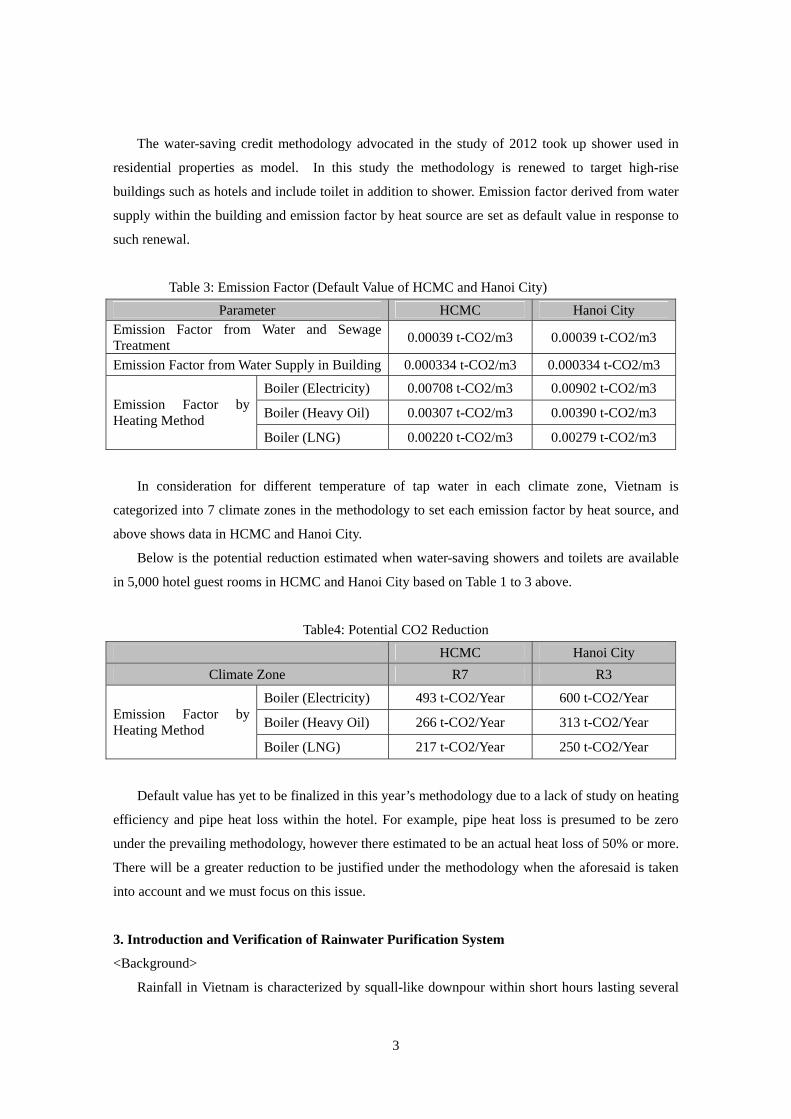
The water-saving credit methodology advocated in the study of 2012 took up shower used in
residential properties as model. In this study the methodology is renewed to target high-rise
buildings such as hotels and include toilet in addition to shower. Emission factor derived from water
supply within the building and emission factor by heat source are set as default value in response to
such renewal.
Table 3: Emission Factor (Default Value of HCMC and Hanoi City)
Parameter HCMC Hanoi City Emission Factor from Water and Sewage Treatment 0.00039 t-CO2/m3 0.00039 t-CO2/m3
Emission Factor from Water Supply in Building 0.000334 t-CO2/m3 0.000334 t-CO2/m3
Boiler (Electricity) 0.00708 t-CO2/m3 0.00902 t-CO2/m3
Boiler (Heavy Oil) 0.00307 t-CO2/m3 0.00390 t-CO2/m3 Emission Factor by Heating Method
Boiler (LNG) 0.00220 t-CO2/m3 0.00279 t-CO2/m3
In consideration for different temperature of tap water in each climate zone, Vietnam is
categorized into 7 climate zones in the methodology to set each emission factor by heat source, and
above shows data in HCMC and Hanoi City.
Below is the potential reduction estimated when water-saving showers and toilets are available
in 5,000 hotel guest rooms in HCMC and Hanoi City based on Table 1 to 3 above.
Table4: Potential CO2 Reduction
HCMC Hanoi City Climate Zone R7 R3
Boiler (Electricity) 493 t-CO2/Year 600 t-CO2/Year
Boiler (Heavy Oil) 266 t-CO2/Year 313 t-CO2/Year Emission Factor by Heating Method
Boiler (LNG) 217 t-CO2/Year 250 t-CO2/Year
Default value has yet to be finalized in this year’s methodology due to a lack of study on heating
efficiency and pipe heat loss within the hotel. For example, pipe heat loss is presumed to be zero
under the prevailing methodology, however there estimated to be an actual heat loss of 50% or more.
There will be a greater reduction to be justified under the methodology when the aforesaid is taken
into account and we must focus on this issue.
3. Introduction and Verification of Rainwater Purification System
<Background>
Rainfall in Vietnam is characterized by squall-like downpour within short hours lasting several
3

days resulting in frequent flood in urban areas paved with asphalt. HCMC is plagued by flood
damages every year and response to climate change and corresponding rise in sea level and
abnormal weather is urgently needed.
Collection and utilization of rainwater will significantly help to turn around the urban flooding
issues among other things and reduce water consumption which will improve water supply in
Vietnam after all. It will also decelerate the worsening urban environment caused by inundation or
leakage of untreated sewage at the time of rainfall.
<Outline of Project>
In this Project, we calculated the level of water saving and CO2 reduction by use of rainwater
collected from the rooftop of tenanted building, large hotel and parking space in HCMC to discuss
the potential of rainwater utilization as well as level of water saving and CO2 reduction based on the
precedents in Japan.
In addition, we verified the benefit and safety of Japanese water purification system when
rainwater is used.
<Outcome of Study>
The method of curbing rainwater runoff is based on the concept of creating a delay in runoff
through the temporary storage of rainwater during peak hours as illustrated below. Such delay in
peak-hour runoff helps keeping the influx of rainwater into rivers within their capacity and mitigates
urban flood.
inflow to tank
time
wat
er fl
ow
amount of water stored
Inflow of Rainwater in Storage Facility Runoff from Storage Facility and Control
Effect
Illustration 1: Concept of Runoff Control at Storage Facility
Below is the estimated level of water saving and CO2 reduction by use of rainwater at 3 sites.
4
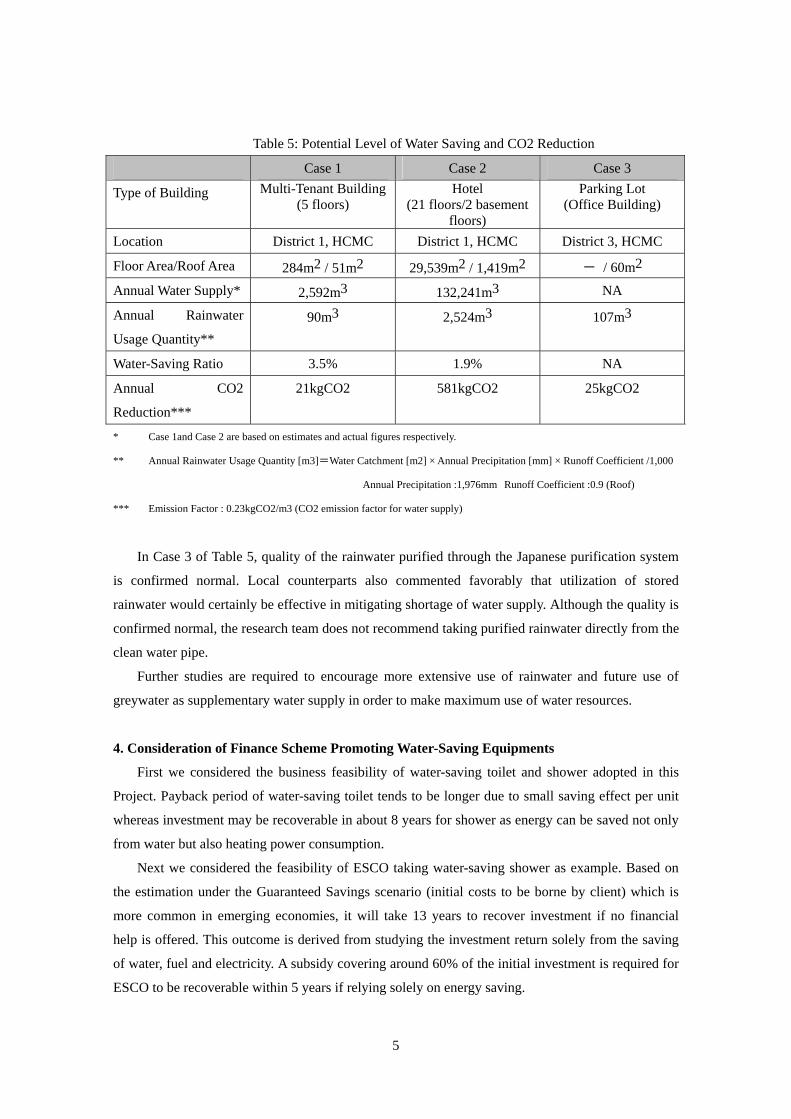
Table 5: Potential Level of Water Saving and CO2 Reduction
Case 1 Case 2 Case 3
Type of Building Multi-Tenant Building(5 floors)
Hotel (21 floors/2 basement
floors)
Parking Lot (Office Building)
Location District 1, HCMC District 1, HCMC District 3, HCMC
Floor Area/Roof Area 284m2 / 51m2 29,539m2 / 1,419m2 - / 60m2
Annual Water Supply* 2,592m3 132,241m3 NA
Annual Rainwater
Usage Quantity** 90m3 2,524m3 107m3
Water-Saving Ratio 3.5% 1.9% NA
Annual CO2
Reduction***
21kgCO2 581kgCO2 25kgCO2
* Case 1and Case 2 are based on estimates and actual figures respectively.
** Annual Rainwater Usage Quantity [m3]=Water Catchment [m2] × Annual Precipitation [mm] × Runoff Coefficient /1,000
Annual Precipitation :1,976mm Runoff Coefficient :0.9 (Roof)
*** Emission Factor : 0.23kgCO2/m3 (CO2 emission factor for water supply)
In Case 3 of Table 5, quality of the rainwater purified through the Japanese purification system
is confirmed normal. Local counterparts also commented favorably that utilization of stored
rainwater would certainly be effective in mitigating shortage of water supply. Although the quality is
confirmed normal, the research team does not recommend taking purified rainwater directly from the
clean water pipe.
Further studies are required to encourage more extensive use of rainwater and future use of
greywater as supplementary water supply in order to make maximum use of water resources.
4. Consideration of Finance Scheme Promoting Water-Saving Equipments
First we considered the business feasibility of water-saving toilet and shower adopted in this
Project. Payback period of water-saving toilet tends to be longer due to small saving effect per unit
whereas investment may be recoverable in about 8 years for shower as energy can be saved not only
from water but also heating power consumption.
Next we considered the feasibility of ESCO taking water-saving shower as example. Based on
the estimation under the Guaranteed Savings scenario (initial costs to be borne by client) which is
more common in emerging economies, it will take 13 years to recover investment if no financial
help is offered. This outcome is derived from studying the investment return solely from the saving
of water, fuel and electricity. A subsidy covering around 60% of the initial investment is required for
ESCO to be recoverable within 5 years if relying solely on energy saving.
5

Due to the nature of product, other benefits are also considered when purchasing toilet or shower
which are unrelated to energy-saving such as functionality, user-friendliness, brand image etc. Hence
it is not appropriate to assess their benefits in view of the payout period alone. In case of commercial
facilities including hotels, ESCO proposal based on the combination of such facilities as rather
costly boilers and heat pumps will be more appealing where a great deal of energy can be saved.
6
Table of Contents
Chapter 1 Outline of Project ..............................................................................................................5 1.1 Purpose of Project .................................................................................................................5 1.2 Outline of Project..................................................................................................................5 1.3 Project Implementation Scheme ...........................................................................................6
Chapter 2 Environment Surrounding Water Supply of Vietnam .......................................................8 2.1 Clean water ...........................................................................................................................8
2.1.1 Coverage of Water Supply Network .............................................................................8 2.1.2 Water Tariff ...................................................................................................................8 2.1.3 Standards and Management of Water Quality...............................................................9
2.2 Sewage ..................................................................................................................................9 2.3 Flood Countermeasures ......................................................................................................10
Chapter 3 Verification test of water saving equipment implementation..........................................11 3.1 Project overview .................................................................................................................11 3.2 Hotel Overview...................................................................................................................13 3.3 Baseline water usage and energy consumption analysis (input and output model) ............13 3.4 Overview of existing facilities (baseline function)...........................................................13 3.5 Overview of the installed fittings (Project function)...........................................................14 3.6 Method of measuring energy and water saved....................................................................14
3.6.1 Understanding the overall hotel water volume usage .................................................14 3.6.2 Measurement of electricity consumed by the lifting pump and pressure pump..........15 3.6.3 Measurement of electricity consumed by the heat pump ............................................15
Chapter 4 Test results of water saving equipment implementation .................................................16 4.1 Analysis based on input and output model of total water volume and energy reduction
amount (water supply meter value, electricity amount value) ........................................................16 4.2 Analysis based on measurements........................................................................................17
4.2.1 Water usage behavioral modeling based on measurements ........................................17 4.2.2 Calculating the effects from the measurement model .................................................17
4.3 Analysis of the water supply pumps’ power .......................................................................17 4.4 Analysis of the heat pump’s power .....................................................................................18
Chapter 5 Evaluating CO2 reduction potential................................................................................21 5.1 Reduction CO2, water resources and energy in the project ................................................21 5.2 The projected potential CO2 reduced in hotels...................................................................25
Chapter 6 Environmental Benefit of Rainwater Utilization ............................................................30 6.1 Rainfall Situation in Vietnam..............................................................................................30
1
6.2 Outline of Rainwater Utilization.........................................................................................30 6.2.1 Benefit of Rainwater Utilization .................................................................................30 6.2.2 Runoff Control Facilities.............................................................................................31
6.3 Urban Flood Mitigation Mechanism...................................................................................32 6.4 Rainwater Utilization Technology and Verification Method...............................................33
6.4.1 Calculation of Collected Rainwater ............................................................................33 6.4.2 System Showcase........................................................................................................34
6.5 Reduction Effect of Clean Water Consumption ..................................................................36 6.6 Important Notes of Planning Rainwater Utilization............................................................37 6.7 Importance and Benefit of Rainwater Storage ....................................................................37
Chapter 7 Verification of Rainwater Utilization Benefits at model buildings in Vietnam...............39 7.1 Particulars of Surveyed Building ........................................................................................39 7.2 Estimated Rainwater Usage and Water-Saving Effect ........................................................40 7.3 Analysis of Other Cases......................................................................................................41 7.4 Ripple Effect across Ho Chi Minh City ..............................................................................43
Chapter 8 Rainwater Utilization Test...............................................................................................46 8.1 Particulars of Test Building.................................................................................................46 8.2 Applicable Laws and Regulations.......................................................................................48 8.3 Result of Water Quality Check ...........................................................................................48
Chapter 9 Consideration of Finance Scheme in Promoting Energy & Water-Saving Equipments..50 9.1 What is ESCO? ...................................................................................................................50 9.2 ESCO in Vietnam and Obstacles.........................................................................................51
9.2.1 ESCO in Vietnam........................................................................................................51 9.2.2 Expansion of ESCO and Finance Related Obstacles ..................................................52
9.3 Japanese Government’s Assistance.....................................................................................53 9.3.1 Support Program to Respond to Climate Change (JICA) ...........................................53 9.3.2 Funding Support (Fund) for “Leap Frog”-Style Development ...................................55 9.3.3 ADB Trust Fund..........................................................................................................56
9.4 Finance Scheme for Water-Saving Equipments ..................................................................56 9.4.1 Business Feasibility of Water-Saving Equipments......................................................57 9.4.2 Business Feasibility of ESCO .....................................................................................58
2
List of Figures
Figure 1.3-1 Project Implementation Structure.....................................................................................7
Figure 2.3-1 Road Inundation..............................................................................................................10
Figure 3.1-1 Project Structure..............................................................................................................12
Figure 3.1-2 Yearly Schedule...............................................................................................................12
Figure 3.4-1 Existing facilities (toilet and shower).............................................................................14
Figure 3.5-1 Facilities after upgrade (toilet and shower).....................................................................14
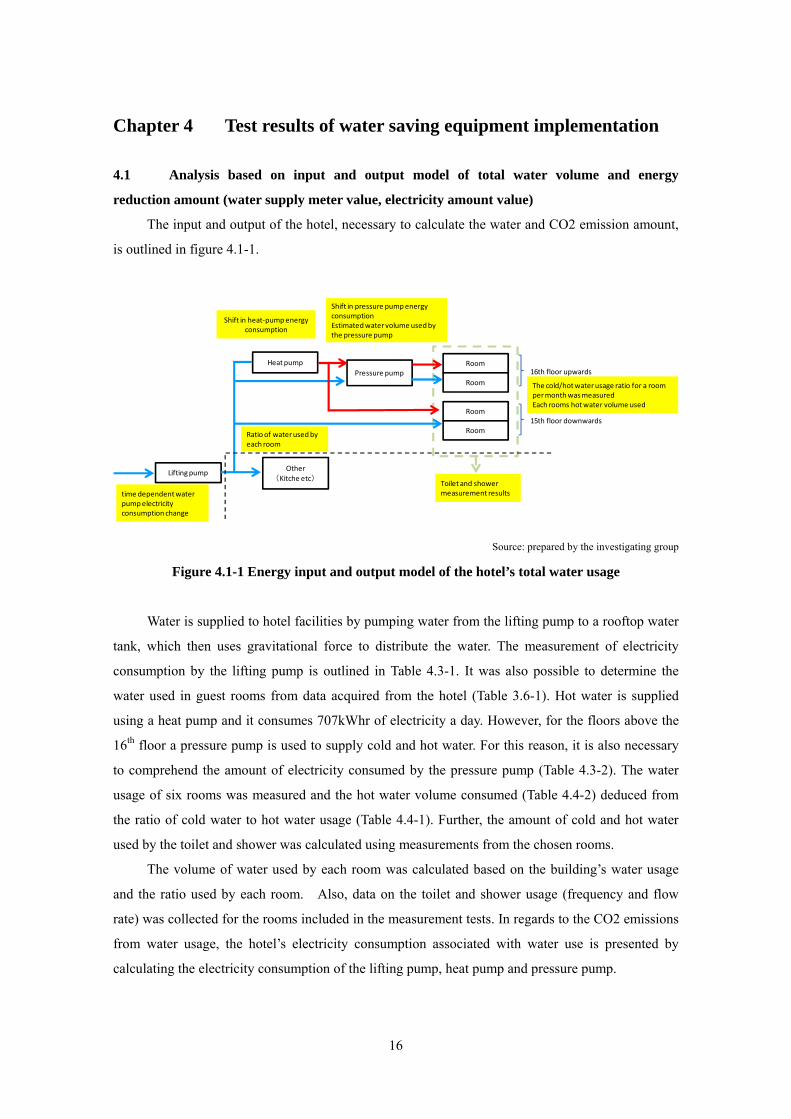
Figure 4.1-1 Energy input and output model of the hotel’s total water usage.....................................16
Figure 5.1-1 Flowchart of calculation method selection.....................................................................23
Figure 5.2-1 CO2 reduction potential cumulative amount..................................................................27
Figure 5.2-2 Outline of differing heat source’s energy efficiency.......................................................27
Figure 5.2-3 CO2 reduction potential: cumulative amount based on hotel’s internal hot water supply
system..................................................................................................................................................29
Figure 6.1-1 Rainfall in Hanoi, Ho Chi Minh and Tokyo....................................................................30
Figure 6.2-1 Classification of Storage and Immersion Facilities........................................................32
Figure 6.3-1 Concept of Runoff Control at Immersion and Storage Facilities....................................33
Figure 6.4-1 Showcase of Rainwater Utilization System....................................................................35
Figure 7.1-1 Rooftop Floor Plan..........................................................................................................39
Figure 7.1-2 Cross-Sectional View......................................................................................................40
Figure 7.3-1 Aerial Photo of Renaissance Riverside Hotel Saigon.....................................................42
Figure 7.4-1 Central District of Ho Chi Minh City (Left) and Sumida-Ward Tokyo (Right)..............44
Figure 8.1-1 Rooftop View...................................................................................................................46
Figure 8.1-2 Cross-Sectional View of System.....................................................................................47
Figure 8.1-3 Actual Implementation of Water Purification System.....................................................47
Figure 9.2-1 Historic Performance of Loan Rates in Vietnam............................................................52
Figure 9.3-2 Example of an ESCO Support Program: Two-Step Loan...............................................56
Figure 9.4-1 Client ESCO Cash Flow (Business Year/Accumulated).................................................60
Figure 9.4-2 Client ESCO Cash Flow (Business Year/Accumulated).................................................62
Figure 9.4-3 Client ESCO Cash Flow (Business Year/Accumulated).................................................64
Figure 9.4-4 Client ESCO Cash Flow (Business Year/Accumulated).................................................65
3
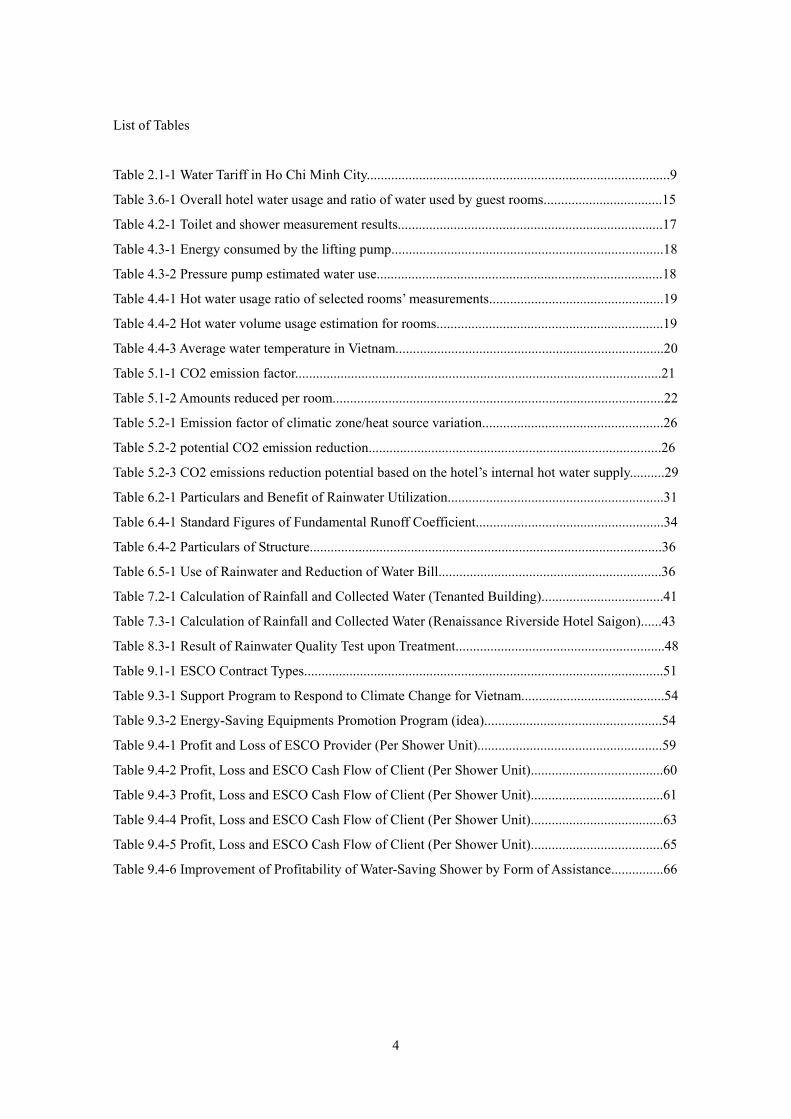
List of Tables
Table 2.1-1 Water Tariff in Ho Chi Minh City.......................................................................................9
Table 3.6-1 Overall hotel water usage and ratio of water used by guest rooms..................................15
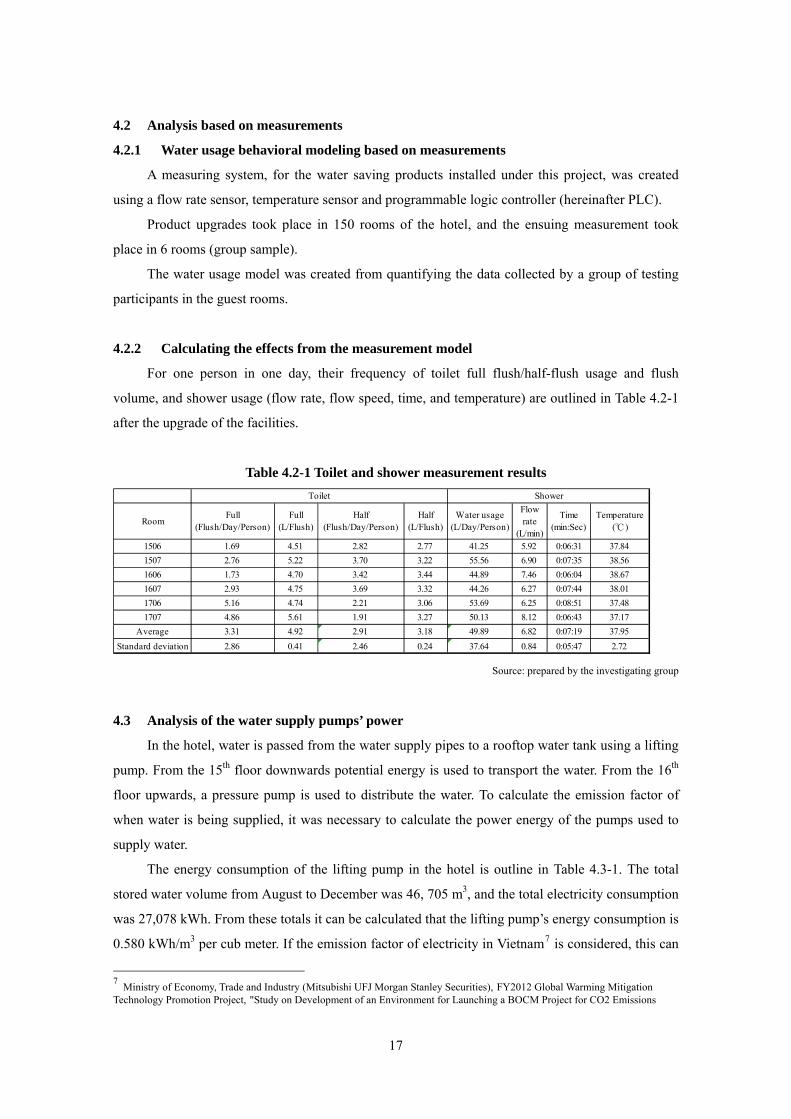
Table 4.2-1 Toilet and shower measurement results............................................................................17
Table 4.3-1 Energy consumed by the lifting pump..............................................................................18
Table 4.3-2 Pressure pump estimated water use..................................................................................18
Table 4.4-1 Hot water usage ratio of selected rooms’ measurements..................................................19
Table 4.4-2 Hot water volume usage estimation for rooms.................................................................19
Table 4.4-3 Average water temperature in Vietnam.............................................................................20
Table 5.1-1 CO2 emission factor.........................................................................................................21
Table 5.1-2 Amounts reduced per room...............................................................................................22
Table 5.2-1 Emission factor of climatic zone/heat source variation....................................................26
Table 5.2-2 potential CO2 emission reduction....................................................................................26
Table 5.2-3 CO2 emissions reduction potential based on the hotel’s internal hot water supply..........29
Table 6.2-1 Particulars and Benefit of Rainwater Utilization..............................................................31
Table 6.4-1 Standard Figures of Fundamental Runoff Coefficient......................................................34
Table 6.4-2 Particulars of Structure.....................................................................................................36
Table 6.5-1 Use of Rainwater and Reduction of Water Bill................................................................36
Table 7.2-1 Calculation of Rainfall and Collected Water (Tenanted Building)...................................41
Table 7.3-1 Calculation of Rainfall and Collected Water (Renaissance Riverside Hotel Saigon)......43
Table 8.3-1 Result of Rainwater Quality Test upon Treatment............................................................48
Table 9.1-1 ESCO Contract Types.......................................................................................................51
Table 9.3-1 Support Program to Respond to Climate Change for Vietnam.........................................54
Table 9.3-2 Energy-Saving Equipments Promotion Program (idea)...................................................54
Table 9.4-1 Profit and Loss of ESCO Provider (Per Shower Unit).....................................................59
Table 9.4-2 Profit, Loss and ESCO Cash Flow of Client (Per Shower Unit)......................................60
Table 9.4-3 Profit, Loss and ESCO Cash Flow of Client (Per Shower Unit)......................................61
Table 9.4-4 Profit, Loss and ESCO Cash Flow of Client (Per Shower Unit)......................................63
Table 9.4-5 Profit, Loss and ESCO Cash Flow of Client (Per Shower Unit)......................................65
Table 9.4-6 Improvement of Profitability of Water-Saving Shower by Form of Assistance...............66
4

Chapter 1 Outline of Project
1.1 Purpose of Project
The primary purpose of this project (“Project”) is to establish a water-saving mechanism
reducing the emission of carbon dioxide (“CO2”) in order to develop a large-scale nationwide Joint
Crediting Mechanism (“JCM”) while solving water-related challenges faced by Vietnam including
shortage, leakage and contamination of water.
1.2 Outline of Project
TOTO LTD., the leading partner in this Project ("TOTO") has evidenced through academic
researches that CO2 emission can be reduced by means of water-saving showers and toilets designed
for lower energy consumption in the water and sewage system as well as lower heat consumption
through saving hot water.
In response to these researches, a method of converting saved water into CO2 reduction from
the water facilities and equipments including showers and toilets has been adopted as the “(2010)
New Installation of Water-Saving Type Residential Facilities (Methodology No. 43)” in the domestic
credit business. This is the world’s first-ever credit business evolved from the correlation of water
and CO2 emission and there has been much global response including invitation to present at the
International Council for Research and Innovation in Building and Construction (“CIB”) and
Waterwise Conference hosted by a British water-saving promotion agency, or solicitation to write on
water-related English academic papers (“Water”). Such global reactions manifest worldwide
attention gathered on the future development of this Japanese water-saving credit business.
This Project is designed to establish a water-saving credit methodology for buildings in Ho
Chi Minh City, Vietnam, especially for hotels where significant volume of hot and cold water is
consumed among other structures.
<<Particulars of Project>>
・ Intended Target: Hotels in Ho Chi Minh City
・ Reduction of Water Consumption: To attempt water saving during the actual
water-consumption scenes in each guest room using water-saving showers and toilets
equipped with the advanced Japanese water-saving technology. The water-consumption
pattern will be modeled using a measurement device to record chronological shift of water
consumption. Level of energy saved for hot-water shower will also be modeled. In addition,
discussions will be held as to the setting of energy output unit at the time of water supply for
the water-supply pumping system.
・ Setting Default Value of MRV Methodology: To set the default value of MRV methodology in
5
estimating the volume of CO2 reduction upon analysis of the measurements taken from guest
rooms and illustration of the water usage patterns for water-saving showers and toilets.
In addition to verifying the widespread effect of these water and energy-saving equipments,
water-saving technology and urban flood prevention measures of Japan will be evaluated to illustrate
the validity of establishing a rainwater recycling system.
There are mandatory anti-inundation facilities installed in some areas of Japan such as river
channels to prevent flood or rainwater reserves to prevent rainwater runoff. Measures taken by
Yokohama City upon implementation of the Act on Countermeasures against Flood Damage of
Specified City Rivers dated June 2003 has since contributed to curb flood damages significantly.
Furthermore, measures have been adopted by Yokohama City such as the grant of subsidy for
the installation of rainwater storage tank in order to ensure favorable aquatic environment as well as
reinforced water recycling and improved rainwater penetration ability. Water stored in the rainwater
tank will be utilized not only to water plants and flowers as part of the water-saving initiatives but
also to make up for shortage when water supply is disrupted upon emergency such as fire and
earthquakes.
In our survey, quality of clean water in Ho Chi Minh City will be assessed in cooperation with
Japanese company which has previously introduced water purification device to Vietnam as well as
evaluating the level of improvement through the implementation of technology held by the company.
We will also conduct experiments on rainwater recycling in cooperation with the Energy
Conservation Center – Ho Chi Minh City (“ECC-HCMC”) to submit practical proposals on
rainwater usage.
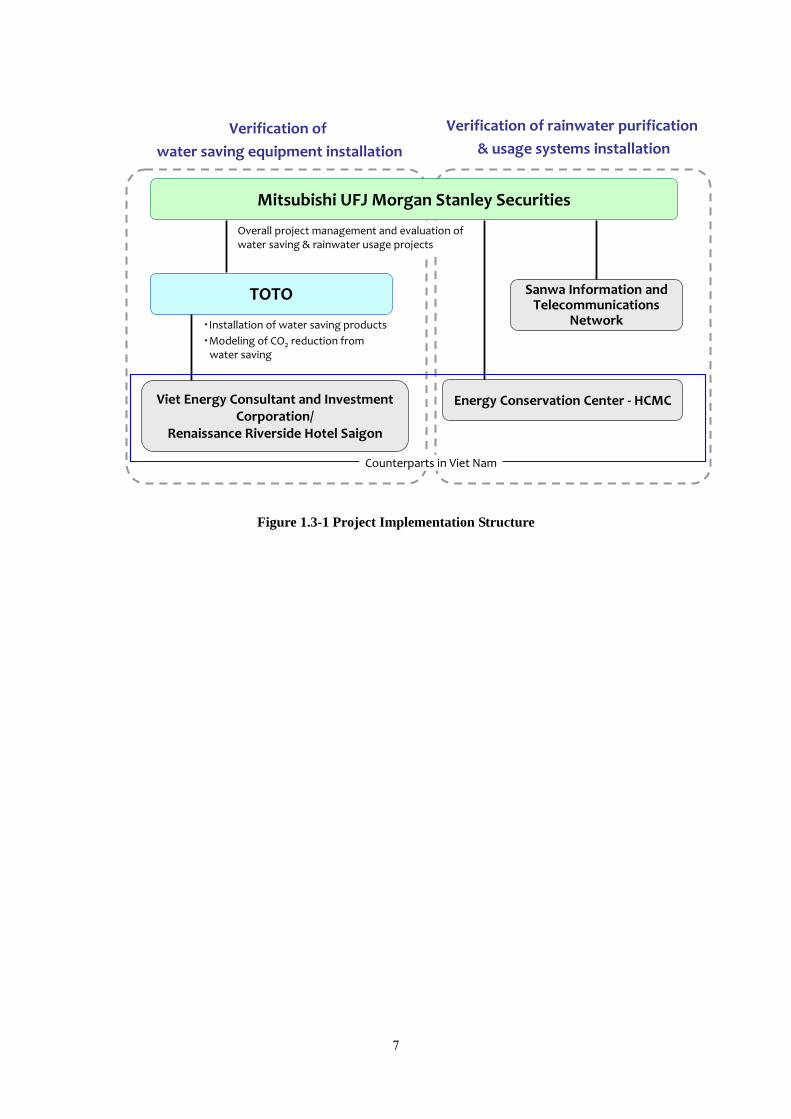
1.3 Project Implementation Scheme
Mitsubishi UFJ Morgan Stanley Securities (“MUMSS”), as the consignee of this Project, will
act as the overall project manager coordinating matters regarding water-saving and rainwater usage
projects in cooperation with Sinet Corp. and ECC-HCMC. TOTO will be responsible for the
verification of benefits gained upon installation of the water-saving equipments.
In addition, MUMSS will look for the most effective finance scheme for the Project.
6
Verification of water saving equipment installation
Verification of rainwater purification& usage systems installation
Mitsubishi UFJ Morgan Stanley Securities
TOTO
Viet Energy Consultant and Investment Corporation/
Renaissance Riverside Hotel Saigon
Energy Conservation Center ‐ HCMC
Overall project management and evaluation of water saving & rainwater usage projects
Sanwa Information and Telecommunications
Network・Installation of water saving products・Modeling of CO2 reduction from water saving
Counterparts in Viet Nam
Figure 1.3-1 Project Implementation Structure
7
Chapter 2 Environment Surrounding Water Supply of Vietnam
Current environment of Vietnam surrounding water supply is described as follows including
clean water and sewage conditions based on the “Survey on the Promotion of Global Contribution to
Water Supply 2008” reported by the Ministry of Health, Labor and Welfare, Japan.
2.1 Clean water
2.1.1 Coverage of Water Supply Network
WHO/UNICEF data illustrates that coverage ratio of the nationwide water supply network
(including water supply per household, public water supply, well, spring and rainwater) stands at
85% as at 2004. The urban area has almost been fully covered with the ratio of 99%. Despite
relatively low coverage of 80% in rural areas where 20% of the entire household is still faced with
water supply issues, the country has already reached the United Nations Millennium Development
Goals regarding clean water.
The challenges are that there remain strong funding demands for infrastructure in response to
the recent urbanization of rural areas prompted by population growth. Hearing from the Ministry of
Construction Vietnam reveals that local governments have no choice but to count on the central
government budget for infrastructure development and therefore they are faced with sluggish
progress.
2.1.2 Water Tariff
The nationwide average clean water tariff stands at around VND3,500/ m3(JPY20/ m3) as at
2008. The revenue dips below the cost of clean water project as it only covers 3/4 of the entire costs,
causing another issue of covering shortfall with taxes. While halting the increase of water tariff to
tide over the financial crisis of 2008, the central government has upheld its policy of imposing
optimal tariff to support the financial conditions of project and the tariff has gradually been raised in
line with such policy.
The tariff has been raised for the fourth consecutive year in Ho Chi Minh City since 2004
based on the decision made by the City People’s Council. The prevailing tariff rate following the last
hike of around 10% in January 2013 is shown below.
8
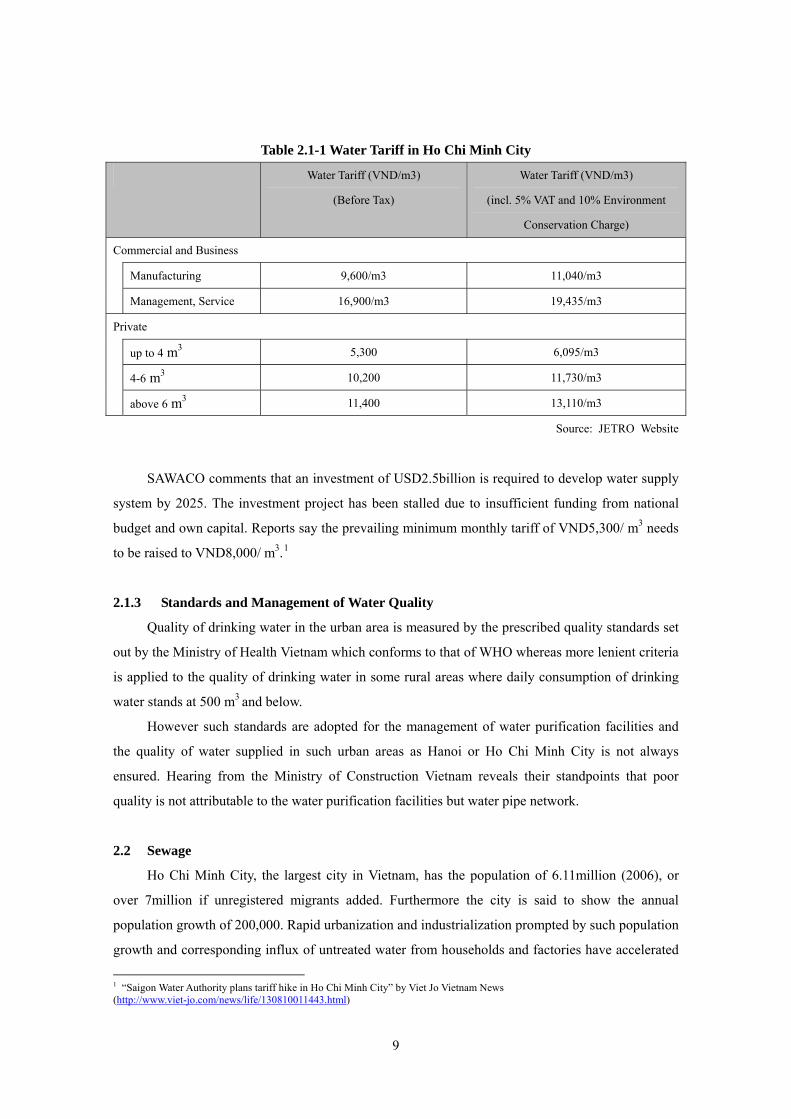
Table 2.1-1 Water Tariff in Ho Chi Minh City
Water Tariff (VND/m3)
(Before Tax)
Water Tariff (VND/m3)
(incl. 5% VAT and 10% Environment
Conservation Charge)
Commercial and Business
Manufacturing 9,600/m3 11,040/m3
Management, Service 16,900/m3 19,435/m3
Private
up to 4 m3 5,300 6,095/m3
4-6 m3 10,200 11,730/m3
above 6 m3 11,400 13,110/m3
Source: JETRO Website
SAWACO comments that an investment of USD2.5billion is required to develop water supply
system by 2025. The investment project has been stalled due to insufficient funding from national
budget and own capital. Reports say the prevailing minimum monthly tariff of VND5,300/ m3 needs
to be raised to VND8,000/ m3.1
2.1.3 Standards and Management of Water Quality
Quality of drinking water in the urban area is measured by the prescribed quality standards set
out by the Ministry of Health Vietnam which conforms to that of WHO whereas more lenient criteria
is applied to the quality of drinking water in some rural areas where daily consumption of drinking
water stands at 500 m3 and below.
However such standards are adopted for the management of water purification facilities and
the quality of water supplied in such urban areas as Hanoi or Ho Chi Minh City is not always
ensured. Hearing from the Ministry of Construction Vietnam reveals their standpoints that poor
quality is not attributable to the water purification facilities but water pipe network.
2.2 Sewage
Ho Chi Minh City, the largest city in Vietnam, has the population of 6.11million (2006), or
over 7million if unregistered migrants added. Furthermore the city is said to show the annual
population growth of 200,000. Rapid urbanization and industrialization prompted by such population
growth and corresponding influx of untreated water from households and factories have accelerated
1 “Saigon Water Authority plans tariff hike in Ho Chi Minh City” by Viet Jo Vietnam News (http://www.viet-jo.com/news/life/130810011443.html)
9

contamination of rivers and channels. In addition, inundation of town areas caused by the
combination of high tide and rainfall during the rainy season results in personal and collateral
damages while simultaneous gush of murky water adversely affects health and life of the residents.2
2.3 Flood Countermeasures
Urban cities of Vietnam are frequently suffering from flood damages including road
inundation caused by heavy rainfall during the rainy season.
Flood Prevention and Management Center of Ho Chi Minh City plans to carry out 13
anti-inundation works in the city in 2012 to get rid of 10 most-frequently inundated sites. The entire
investment stands at VND1,743billion (USD836.6billion or JPY6.4billion).
The city has another 21 sites which are frequently inundated by rain or high tide. They are
believed to be caused by blocked flow of canals and poor drainage systems in newly developed
residential districts or main roads.
Source: Poste3
Figure 2.3-1 Road Inundation
In addition, Ho Chi Minh City has been faced with progressive land subsidence which is
spreading into large areas in strips based on the survey conducted from 1996 to 2010.
Act of pumping groundwater on account of poor water supply network is said to be a cause of
land subsidence. Besides land subsidence, greater flood risks are feared caused by high tide.
Such initiatives as extensive introduction of water-saving equipments, utilization and storage
of rainwater advocated in this Project contribute to solving water-related issues posing serious
threats to the Vietnamese society.
2 “Sewage Management Capacity Development Project in Ho Chi Minh City” by JICA (http://www.jica.go.jp/project/vietnam/005/) 3 Poste(http://www.poste-vn.com/vietnamesediary/2012/11/17.html)
10
Chapter 3 Verification test of water saving equipment implementation
3.1 Project overview
Mitsubishi UFJ Morgan Stanley Securities (MUMSS) and TOTO have investigated the
feasibility of creating water saving credits under the Ministry of Economy, Trade and Industry’s
‘2012 Global warming prevention promotion project’. It was found that conditions in Vietnam are
conducive to the creation of carbon credits from the spread of water saving products; however, in
residences conditions are limited by poor infrastructure that lessens water pressure. Nevertheless,
large buildings such as hotels and apartments (hereinafter referred to as buildings) use a temporary
water storage tank, which mitigates low water pressure from water leakage. In this case, the
verification test was able to confirm that there is a large potential to reduce CO2.
Also, it was predicted that if a water saving project was carried out in buildings, not only
would energy be reduced from the water and sewerage systems as per existing credit methodology,
but also reduced from the buildings internal water supply system. However, the knowledge required
to integrate this into the existing methodology is currently not available. Nonetheless, analysis of
past reports show that energy costs from internal water supply systems have a potential reduction
increase of 1.5-2 times using domestic credit methodology.4
Accordingly, water saving credit methodology for the internal water systems of hotels was
created, and demonstrated that energy reductions could be made from not only water and sewerage
systems, but also the internal water supply systems of buildings. The feasibility of a large-scale JCM
project was then explored.
In this project, water saving products were introduced into Vietnamese hotels and the various
water saving effects were measured (cold water/hot water volume measurement, pumps involved in
water usage, heat sources) and then quantified – with the outlook of water and CO2 reduction. The
administrative structure of this project is outlined in Figure 3.1-1
4 Yasutoshi Shimizu et al(2013):CO2 emission factor for rainwater and reclaimed water used in buildings in Japan, Water, ,5,394-404
11
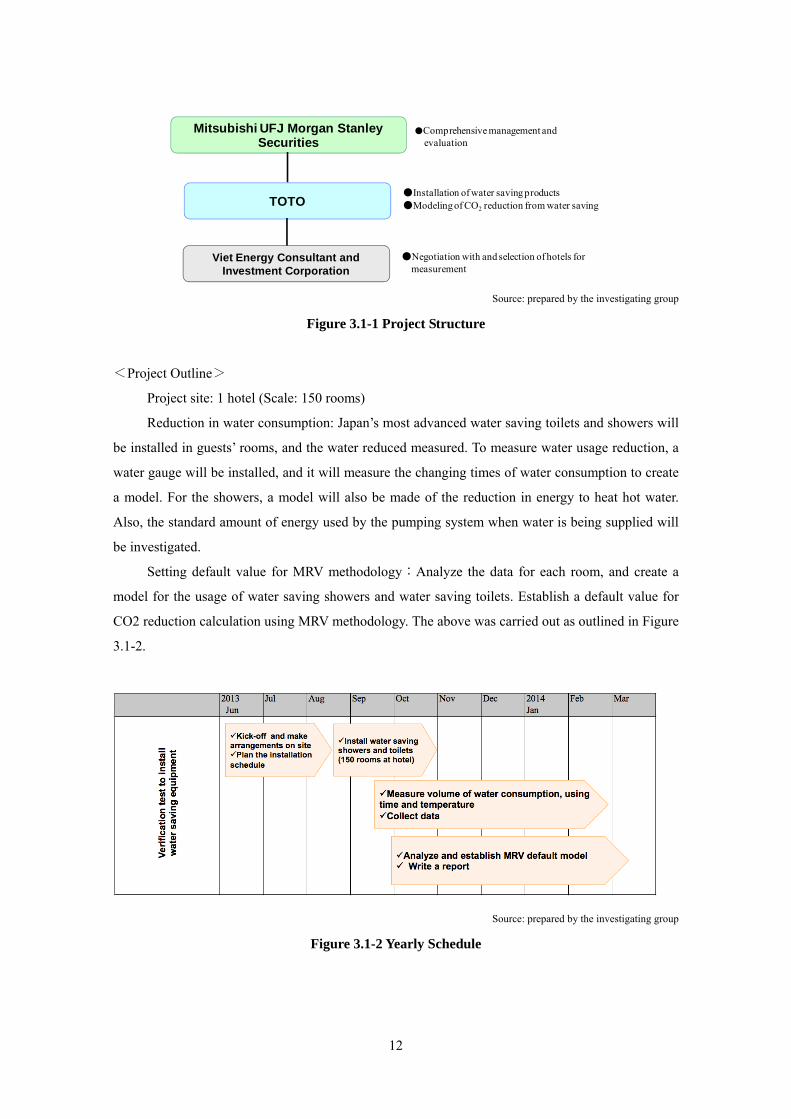
Mitsubishi UFJ Morgan StanleySecurities
TOTO
Viet Energy Consultant and Investment Corporation
●Comprehensive management andevaluation
●Installation of water saving products●Modeling of CO2 reduction from water saving
●Negotiation with and selection of hotels for measurement
Source: prepared by the investigating group
Figure 3.1-1 Project Structure
<Project Outline>
Project site: 1 hotel (Scale: 150 rooms)
Reduction in water consumption: Japan’s most advanced water saving toilets and showers will
be installed in guests’ rooms, and the water reduced measured. To measure water usage reduction, a
water gauge will be installed, and it will measure the changing times of water consumption to create
a model. For the showers, a model will also be made of the reduction in energy to heat hot water.
Also, the standard amount of energy used by the pumping system when water is being supplied will
be investigated.
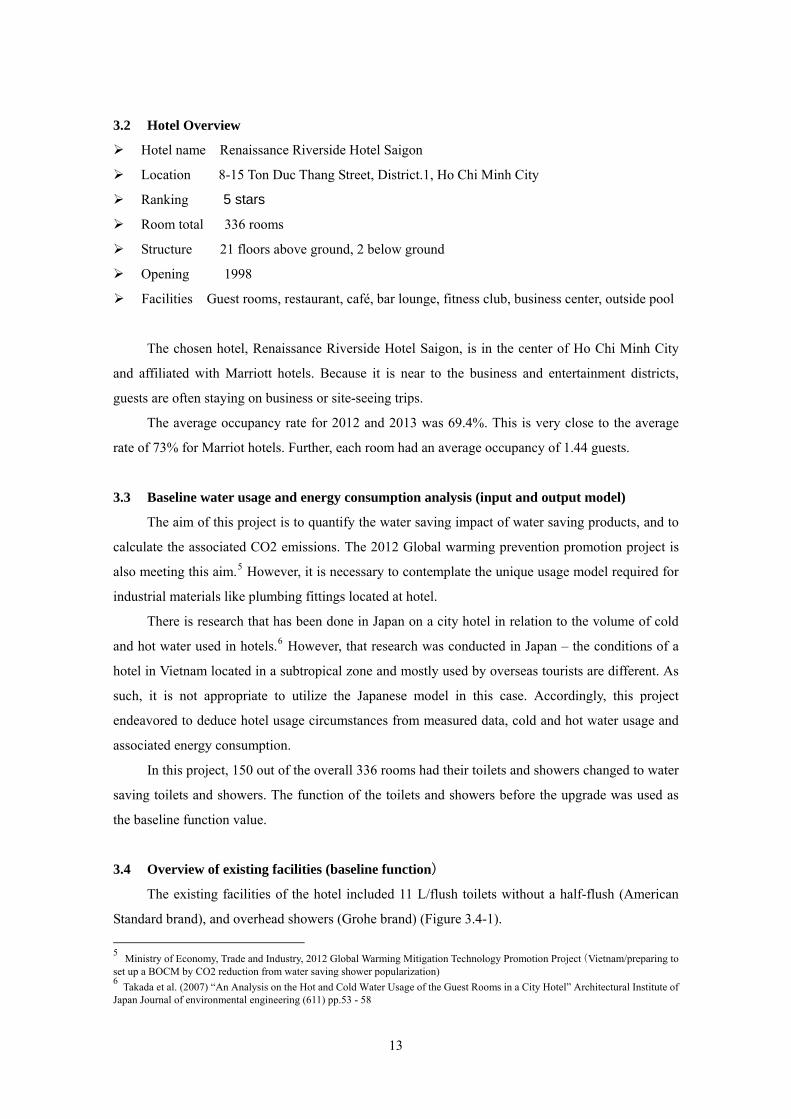
Setting default value for MRV methodology:Analyze the data for each room, and create a
model for the usage of water saving showers and water saving toilets. Establish a default value for
CO2 reduction calculation using MRV methodology. The above was carried out as outlined in Figure
3.1-2.
Source: prepared by the investigating group
Figure 3.1-2 Yearly Schedule
12
3.2 Hotel Overview
Hotel name Renaissance Riverside Hotel Saigon
Location 8-15 Ton Duc Thang Street, District.1, Ho Chi Minh City
Ranking 5 stars
Room total 336 rooms
Structure 21 floors above ground, 2 below ground
Opening 1998
Facilities Guest rooms, restaurant, café, bar lounge, fitness club, business center, outside pool
The chosen hotel, Renaissance Riverside Hotel Saigon, is in the center of Ho Chi Minh City
and affiliated with Marriott hotels. Because it is near to the business and entertainment districts,
guests are often staying on business or site-seeing trips.
The average occupancy rate for 2012 and 2013 was 69.4%. This is very close to the average
rate of 73% for Marriot hotels. Further, each room had an average occupancy of 1.44 guests.
3.3 Baseline water usage and energy consumption analysis (input and output model)
The aim of this project is to quantify the water saving impact of water saving products, and to
calculate the associated CO2 emissions. The 2012 Global warming prevention promotion project is
also meeting this aim.5 However, it is necessary to contemplate the unique usage model required for
industrial materials like plumbing fittings located at hotel.
There is research that has been done in Japan on a city hotel in relation to the volume of cold
and hot water used in hotels.6 However, that research was conducted in Japan – the conditions of a
hotel in Vietnam located in a subtropical zone and mostly used by overseas tourists are different. As
such, it is not appropriate to utilize the Japanese model in this case. Accordingly, this project
endeavored to deduce hotel usage circumstances from measured data, cold and hot water usage and
associated energy consumption.
In this project, 150 out of the overall 336 rooms had their toilets and showers changed to water
saving toilets and showers. The function of the toilets and showers before the upgrade was used as
the baseline function value.
3.4 Overview of existing facilities (baseline function)
The existing facilities of the hotel included 11 L/flush toilets without a half-flush (American
Standard brand), and overhead showers (Grohe brand) (Figure 3.4-1). 5 Ministry of Economy, Trade and Industry, 2012 Global Warming Mitigation Technology Promotion Project(Vietnam/preparing to set up a BOCM by CO2 reduction from water saving shower popularization) 6 Takada et al. (2007) “An Analysis on the Hot and Cold Water Usage of the Guest Rooms in a City Hotel” Architectural Institute of Japan Journal of environmental engineering (611) pp.53 - 58
13

Testers carried out a limited range of actions: toilet use, shower use, faucet use, and measured
the amount of water used. The average baseline was, shower flow rate: 11.0 L/min, toilet water
usage: 10.5 L(no half-flush).
Source: Prepared by the investigating group
Figure 3.4-1 Existing facilities (toilet and shower)
3.5 Overview of the installed fittings (Project function)
The newly installed fittings were a TOTO brand toilet, CST761DRS (full flush 4.8 L,
half-flush 3.0 L), a TOTO brand Air-in-shower DB200CAF_V1 (optimum flow rate 6.5 L/min),
which were made ready for use(Figure 3.5-1).
Source: Prepared by the investigating group
Figure 3.5-1 Facilities after upgrade (toilet and shower)
3.6 Method of measuring energy and water saved
3.6.1 Understanding the overall hotel water volume usage
Data regarding the overall water usage: the total hotel water usage, the ratio of water used by
rooms, and water pricing, was acquired by receiving information on the hotel’s water meter. The
results are shown in Table 3.6-1.
14
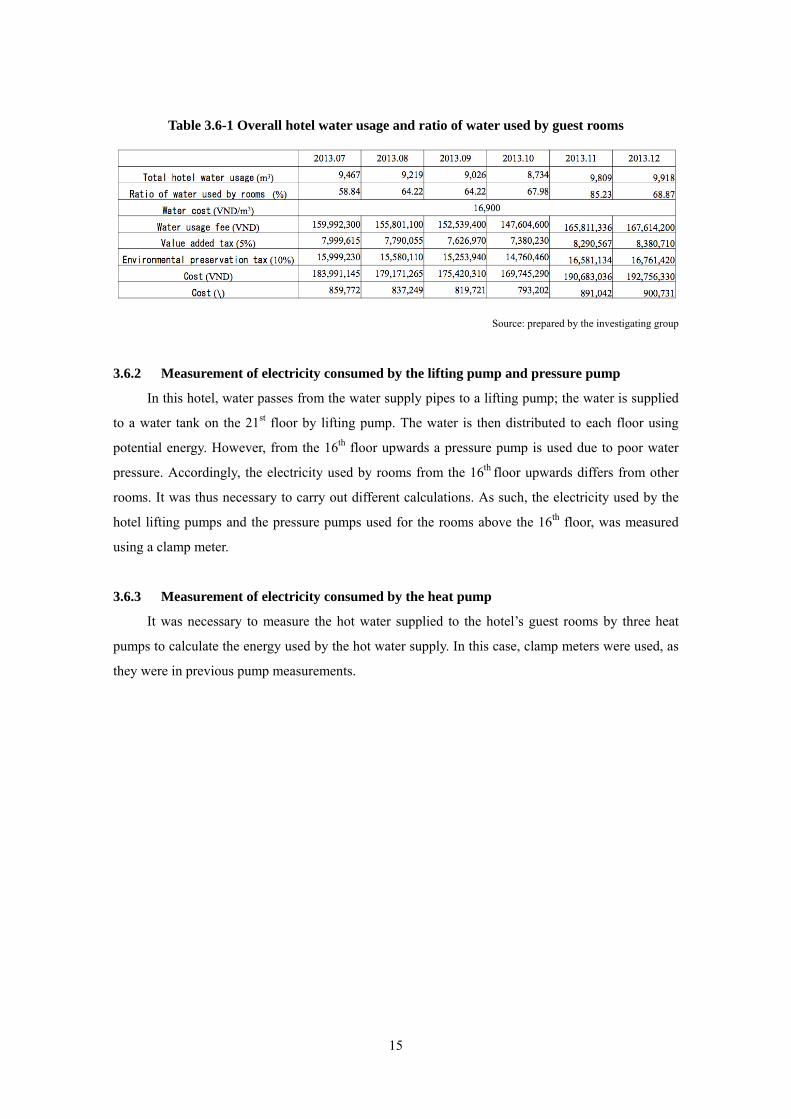
Table 3.6-1 Overall hotel water usage and ratio of water used by guest rooms
Source: prepared by the investigating group
3.6.2 Measurement of electricity consumed by the lifting pump and pressure pump
In this hotel, water passes from the water supply pipes to a lifting pump; the water is supplied
to a water tank on the 21st floor by lifting pump. The water is then distributed to each floor using
potential energy. However, from the 16th floor upwards a pressure pump is used due to poor water
pressure. Accordingly, the electricity used by rooms from the 16th floor upwards differs from other
rooms. It was thus necessary to carry out different calculations. As such, the electricity used by the
hotel lifting pumps and the pressure pumps used for the rooms above the 16th floor, was measured
using a clamp meter.
3.6.3 Measurement of electricity consumed by the heat pump
It was necessary to measure the hot water supplied to the hotel’s guest rooms by three heat
pumps to calculate the energy used by the hot water supply. In this case, clamp meters were used, as
they were in previous pump measurements.
15
Chapter 4 Test results of water saving equipment implementation
4.1 Analysis based on input and output model of total water volume and energy
reduction amount (water supply meter value, electricity amount value)
The input and output of the hotel, necessary to calculate the water and CO2 emission amount,
is outlined in figure 4.1-1.
Lifting pump
Heat pump
Other(Kitche etc)
Pressure pumpRoom
Room
Room
Room
Shift in heat‐pump energy consumption
Shift in pressure pump energy consumptionEstimatedwater volume used by the pressure pump
The cold/hot water usage ratio for a room per month was measured Each rooms hot water volume used
16th floor upwards
15th floor downwards
Toilet and shower measurement results
Ratio of water used by each room
time dependent water pump electricity consumption change
Source: prepared by the investigating group
Figure 4.1-1 Energy input and output model of the hotel’s total water usage
Water is supplied to hotel facilities by pumping water from the lifting pump to a rooftop water
tank, which then uses gravitational force to distribute the water. The measurement of electricity
consumption by the lifting pump is outlined in Table 4.3-1. It was also possible to determine the
water used in guest rooms from data acquired from the hotel (Table 3.6-1). Hot water is supplied
using a heat pump and it consumes 707kWhr of electricity a day. However, for the floors above the
16th floor a pressure pump is used to supply cold and hot water. For this reason, it is also necessary
to comprehend the amount of electricity consumed by the pressure pump (Table 4.3-2). The water
usage of six rooms was measured and the hot water volume consumed (Table 4.4-2) deduced from
the ratio of cold water to hot water usage (Table 4.4-1). Further, the amount of cold and hot water
used by the toilet and shower was calculated using measurements from the chosen rooms.
The volume of water used by each room was calculated based on the building’s water usage
and the ratio used by each room. Also, data on the toilet and shower usage (frequency and flow
rate) was collected for the rooms included in the measurement tests. In regards to the CO2 emissions
from water usage, the hotel’s electricity consumption associated with water use is presented by
calculating the electricity consumption of the lifting pump, heat pump and pressure pump.
16
4.2 Analysis based on measurements
4.2.1 Water usage behavioral modeling based on measurements
A measuring system, for the water saving products installed under this project, was created
using a flow rate sensor, temperature sensor and programmable logic controller (hereinafter PLC).
Product upgrades took place in 150 rooms of the hotel, and the ensuing measurement took
place in 6 rooms (group sample).
The water usage model was created from quantifying the data collected by a group of testing
participants in the guest rooms.
4.2.2 Calculating the effects from the measurement model
For one person in one day, their frequency of toilet full flush/half-flush usage and flush
volume, and shower usage (flow rate, flow speed, time, and temperature) are outlined in Table 4.2-1
after the upgrade of the facilities.
Table 4.2-1 Toilet and shower measurement results
RoomFull
(Flush/Day/Person)Full
(L/Flush)Half
(Flush/Day/Person)Half
(L/Flush)Water usage
(L/Day/Person)
Flowrate
(L/min)
Time(min:Sec)
Temperature(℃)
1506 1.69 4.51 2.82 2.77 41.25 5.92 0:06:31 37.841507 2.76 5.22 3.70 3.22 55.56 6.90 0:07:35 38.561606 1.73 4.70 3.42 3.44 44.89 7.46 0:06:04 38.671607 2.93 4.75 3.69 3.32 44.26 6.27 0:07:44 38.011706 5.16 4.74 2.21 3.06 53.69 6.25 0:08:51 37.481707 4.86 5.61 1.91 3.27 50.13 8.12 0:06:43 37.17
Average 3.31 4.92 2.91 3.18 49.89 6.82 0:07:19 37.95Standard deviation 2.86 0.41 2.46 0.24 37.64 0.84 0:05:47 2.72
Toilet Shower
Source: prepared by the investigating group
4.3 Analysis of the water supply pumps’ power
In the hotel, water is passed from the water supply pipes to a rooftop water tank using a lifting
pump. From the 15th floor downwards potential energy is used to transport the water. From the 16th
floor upwards, a pressure pump is used to distribute the water. To calculate the emission factor of
when water is being supplied, it was necessary to calculate the power energy of the pumps used to
supply water.
The energy consumption of the lifting pump in the hotel is outline in Table 4.3-1. The total
stored water volume from August to December was 46, 705 m3, and the total electricity consumption
was 27,078 kWh. From these totals it can be calculated that the lifting pump’s energy consumption is
0.580 kWh/m3 per cub meter. If the emission factor of electricity in Vietnam7 is considered, this can
7 Ministry of Economy, Trade and Industry (Mitsubishi UFJ Morgan Stanley Securities), FY2012 Global Warming Mitigation Technology Promotion Project, "Study on Development of an Environment for Launching a BOCM Project for CO2 Emissions
17
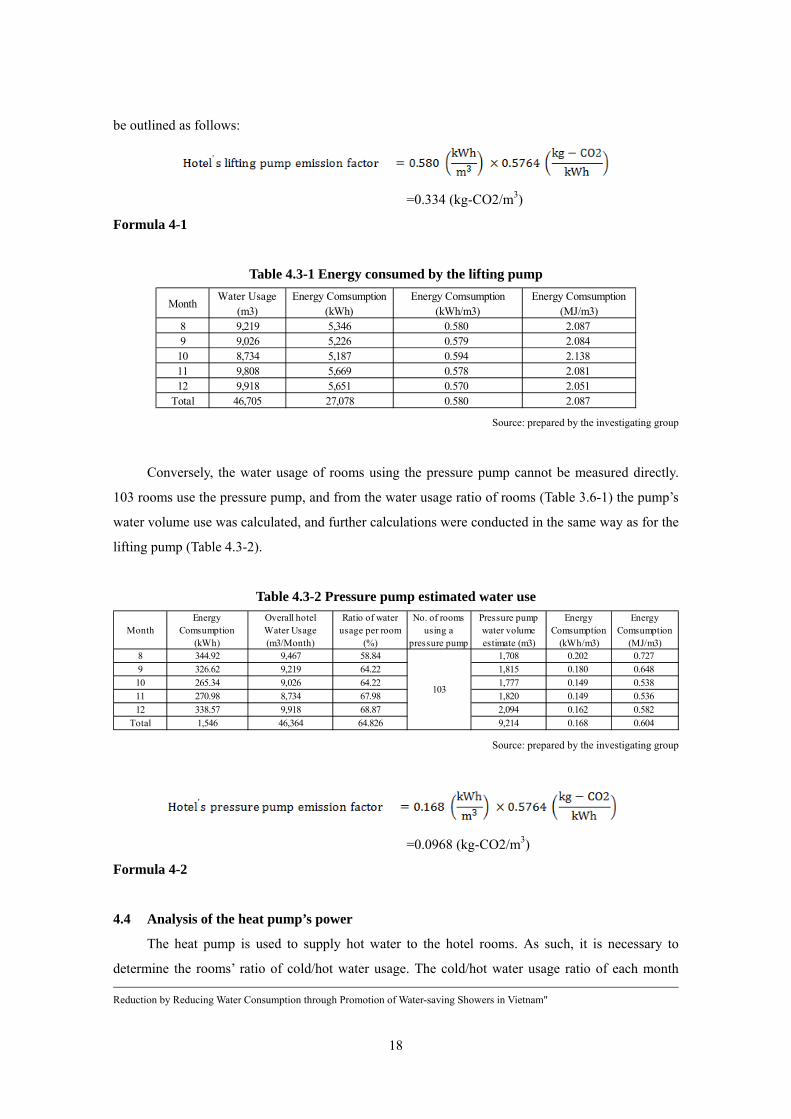
be outlined as follows:
=0.334 (kg-CO2/m3)
Formula 4-1
Table 4.3-1 Energy consumed by the lifting pump
MonthWater Usage
(m3)Energy Comsumption
(kWh)Energy Comsumption
(kWh/m3)Energy Comsumption
(MJ/m3)8 9,219 5,346 0.580 2.0879 9,026 5,226 0.579 2.084
10 8,734 5,187 0.594 2.13811 9,808 5,669 0.578 2.08112 9,918 5,651 0.570 2.051
Total 46,705 27,078 0.580 2.087 Source: prepared by the investigating group
Conversely, the water usage of rooms using the pressure pump cannot be measured directly.
103 rooms use the pressure pump, and from the water usage ratio of rooms (Table 3.6-1) the pump’s
water volume use was calculated, and further calculations were conducted in the same way as for the
lifting pump (Table 4.3-2).
Table 4.3-2 Pressure pump estimated water use
MonthEnergy
Comsumption(kWh)
Overall hotelWater Usage(m3/Month)
Ratio of waterusage per room
(%)
No. of roomsusing a
pressure pump
Pressure pumpwater volumeestimate (m3)
EnergyComsumption
(kWh/m3)
EnergyComsumption
(MJ/m3)8 344.92 9,467 58.84 1,708 0.202 0.7279 326.62 9,219 64.22 1,815 0.180 0.64810 265.34 9,026 64.22 1,777 0.149 0.53811 270.98 8,734 67.98 1,820 0.149 0.53612 338.57 9,918 68.87 2,094 0.162 0.582
Total 1,546 46,364 64.826 9,214 0.168 0.604
103
Source: prepared by the investigating group
=0.0968 (kg-CO2/m3)
Formula 4-2
4.4 Analysis of the heat pump’s power
The heat pump is used to supply hot water to the hotel rooms. As such, it is necessary to
determine the rooms’ ratio of cold/hot water usage. The cold/hot water usage ratio of each month Reduction by Reducing Water Consumption through Promotion of Water-saving Showers in Vietnam"
18
was calculated for the selected rooms and the results are outlined in Table 4.4-1.
Table 4.4-1 Hot water usage ratio of selected rooms’ measurements
Source: prepared by the investigating group
According to Table 4.4-1, the ratio of hot water usage to cold-water usage is 37.6%. Also,
using the values from Table 3.6-1, the volume of hot water used by each room was calculated as
follows: (Table 4.4-2).
Table 4.4-2 Hot water volume usage estimation for rooms
Source: prepared by investigating group
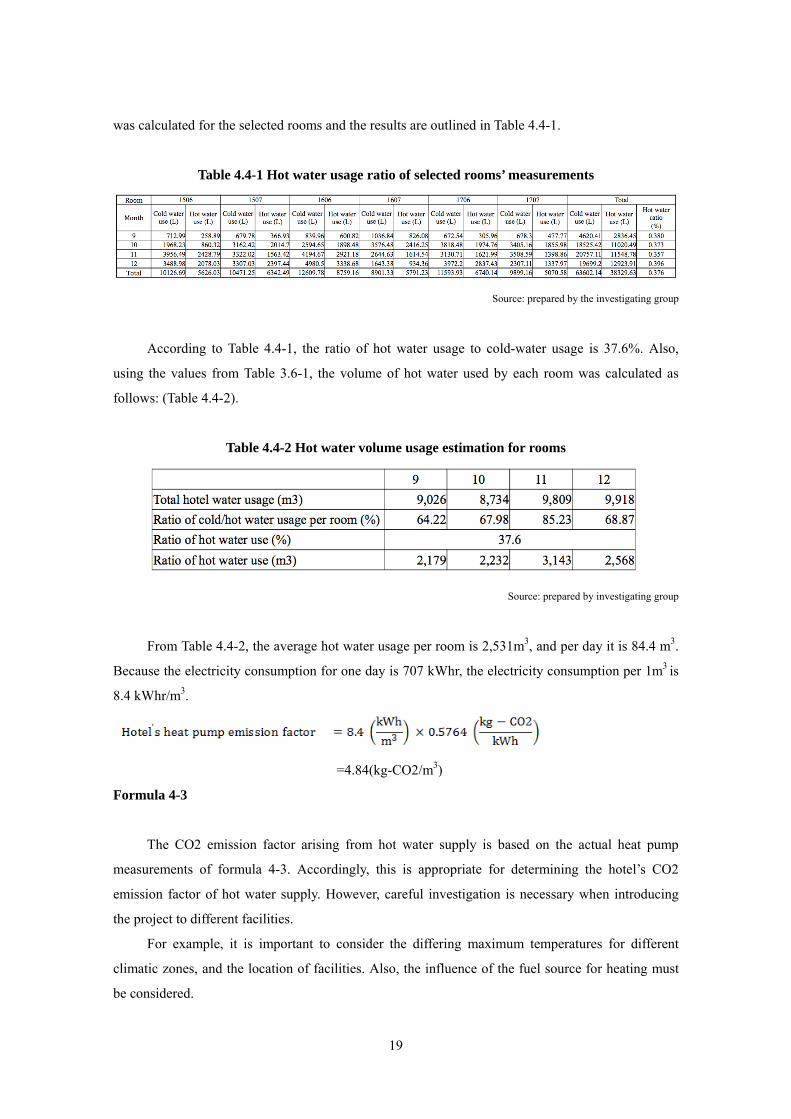
From Table 4.4-2, the average hot water usage per room is 2,531m3, and per day it is 84.4 m3.
Because the electricity consumption for one day is 707 kWhr, the electricity consumption per 1m3 is
8.4 kWhr/m3.
=4.84(kg-CO2/m3)
Formula 4-3
The CO2 emission factor arising from hot water supply is based on the actual heat pump
measurements of formula 4-3. Accordingly, this is appropriate for determining the hotel’s CO2
emission factor of hot water supply. However, careful investigation is necessary when introducing
the project to different facilities.
For example, it is important to consider the differing maximum temperatures for different
climatic zones, and the location of facilities. Also, the influence of the fuel source for heating must
be considered.
19
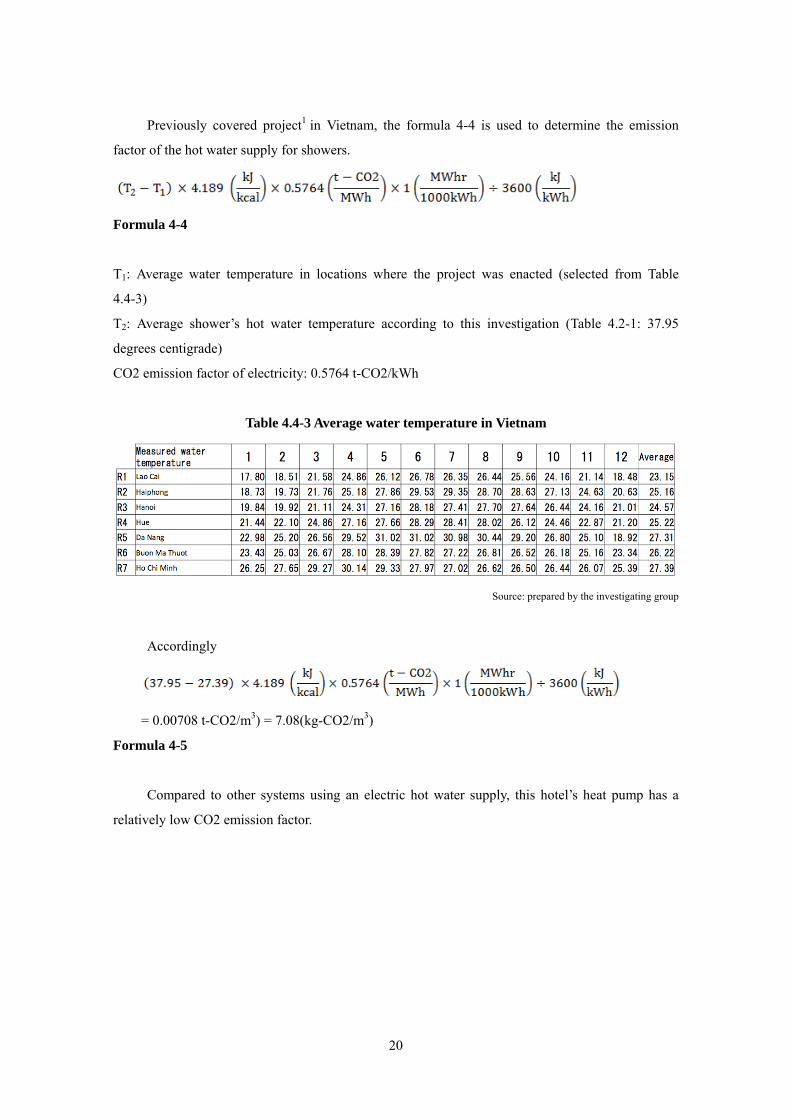
Previously covered project1 in Vietnam, the formula 4-4 is used to determine the emission
factor of the hot water supply for showers.
Formula 4-4
T1: Average water temperature in locations where the project was enacted (selected from Table
4.4-3)
T2: Average shower’s hot water temperature according to this investigation (Table 4.2-1: 37.95
degrees centigrade)
CO2 emission factor of electricity: 0.5764 t-CO2/kWh
Table 4.4-3 Average water temperature in Vietnam
Source: prepared by the investigating group
Accordingly
= 0.00708 t-CO2/m3) = 7.08(kg-CO2/m3)
Formula 4-5
Compared to other systems using an electric hot water supply, this hotel’s heat pump has a
relatively low CO2 emission factor.
20

Chapter 5 Evaluating CO2 reduction potential
The aim of this project was to undertake the reduction of a hotel’s thermal energy consumption
through water saving. This was in order to ultimately reduce CO2 emissions.
The emissions reduction was achieved by reducing the amount of energy used, which is
outlined below.
・The energy used by the water supply system and sewage works
・The energy used by the lifting pump and pressure pump inside the building (hotel)
・The energy used for heating by the hot water supply
The effect of water saving on CO2 reduction has been recognized in reports, such as the
December 2012 domestic credit methodology papers “Water saving household fixtures’
upgrade(Methodology 43)8” and “Water saving household fixtures’ new installation (Methodology
43-A)9”. In this way, the energy used by water supply and treatment has been garnering a lot of
attention.
Also, the UN recognizes the calculation this project has used for determining the GHG
emissions reduced from thermal energy by water-saving showerheads as small scale CDM
methodology ASM-II.M “Demand-side energy efficiency activities for installation of low-flow
water saving devices”10.
The investigation to determine the varying amounts of energy reduced is explained in the
following section.
5.1 Reduction CO2, water resources and energy in the project
Table 5.1-1 shows the emission factors calculated in Chapter 4.
Table 5.1-1 CO2 emission factor
Source: prepared by the investigating group
The amounts reduced per room are calculated by applying the hotel’s usage model and,
8 Domestic Clean Development Mechanism website http://jcdm.jp/process/data/043.pdf 9 Domestic Clean Development Mechanism website http://jcdm.jp/process/data/043-A.pdf 10 United Nations website: http://cdm.unfccc.int/methodologies/DB/HHDWO5LV9PEG6N3Y8X7J63I801N079
21
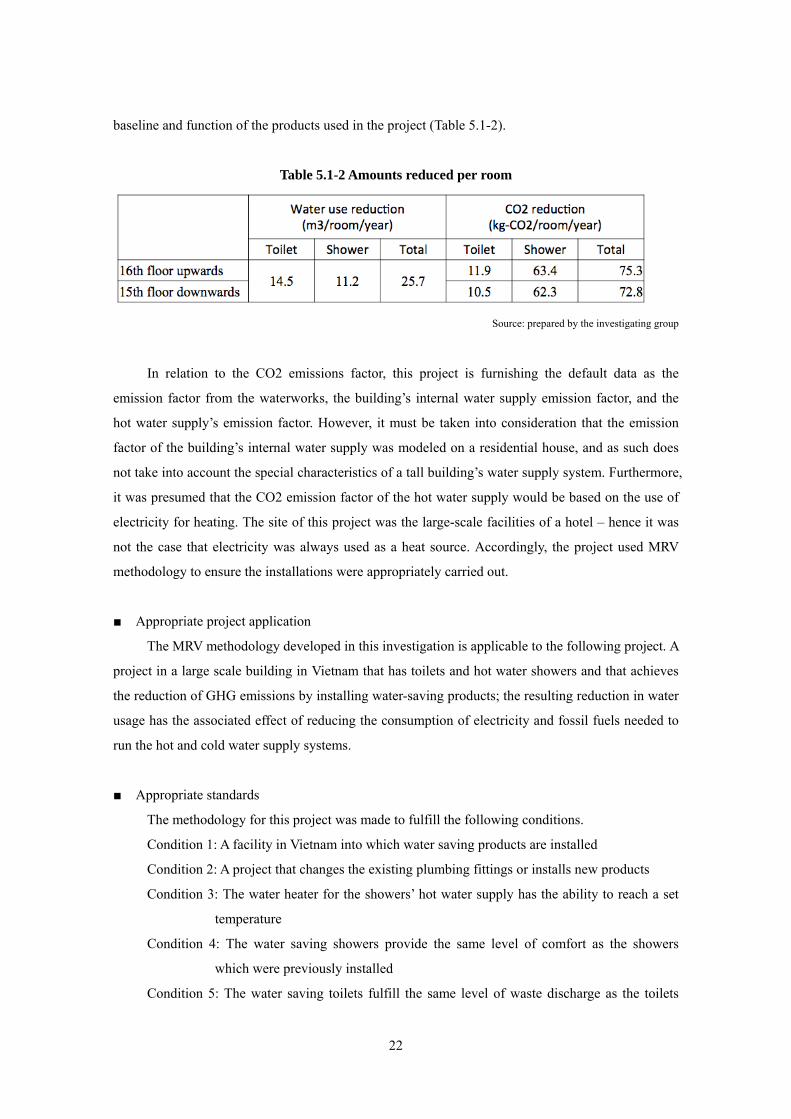
baseline and function of the products used in the project (Table 5.1-2).
Table 5.1-2 Amounts reduced per room
Source: prepared by the investigating group
In relation to the CO2 emissions factor, this project is furnishing the default data as the
emission factor from the waterworks, the building’s internal water supply emission factor, and the
hot water supply’s emission factor. However, it must be taken into consideration that the emission
factor of the building’s internal water supply was modeled on a residential house, and as such does
not take into account the special characteristics of a tall building’s water supply system. Furthermore,
it was presumed that the CO2 emission factor of the hot water supply would be based on the use of
electricity for heating. The site of this project was the large-scale facilities of a hotel – hence it was
not the case that electricity was always used as a heat source. Accordingly, the project used MRV
methodology to ensure the installations were appropriately carried out.
■ Appropriate project application
The MRV methodology developed in this investigation is applicable to the following project. A
project in a large scale building in Vietnam that has toilets and hot water showers and that achieves
the reduction of GHG emissions by installing water-saving products; the resulting reduction in water
usage has the associated effect of reducing the consumption of electricity and fossil fuels needed to
run the hot and cold water supply systems.
■ Appropriate standards
The methodology for this project was made to fulfill the following conditions.
Condition 1: A facility in Vietnam into which water saving products are installed
Condition 2: A project that changes the existing plumbing fittings or installs new products
Condition 3: The water heater for the showers’ hot water supply has the ability to reach a set
temperature
Condition 4: The water saving showers provide the same level of comfort as the showers
which were previously installed
Condition 5: The water saving toilets fulfill the same level of waste discharge as the toilets
22
which were previously installed
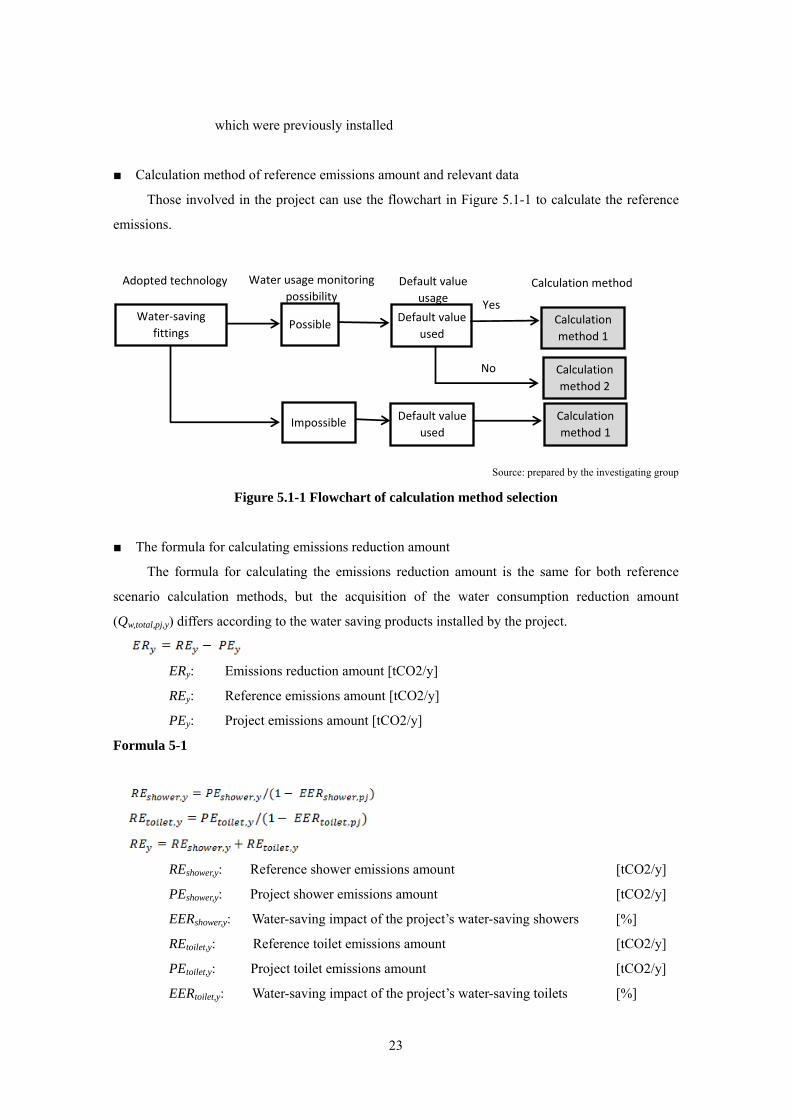
■ Calculation method of reference emissions amount and relevant data
Those involved in the project can use the flowchart in Figure 5.1-1 to calculate the reference
emissions.
Water‐savingfittings
Possible
Impossible
Default valueused
Default valueused
Calculationmethod 1
Calculationmethod 1
Calculationmethod 2
Yes
No
Water usage monitoringpossibility
Adopted technology Default valueusage
Calculation method
Source: prepared by the investigating group
Figure 5.1-1 Flowchart of calculation method selection
■ The formula for calculating emissions reduction amount
The formula for calculating the emissions reduction amount is the same for both reference
scenario calculation methods, but the acquisition of the water consumption reduction amount
(Qw,total,pj,y) differs according to the water saving products installed by the project.
ERy: Emissions reduction amount [tCO2/y]
REy: Reference emissions amount [tCO2/y]
PEy: Project emissions amount [tCO2/y]
Formula 5-1
REshower,y: Reference shower emissions amount [tCO2/y]
PEshower,y: Project shower emissions amount [tCO2/y]
EERshower,y: Water-saving impact of the project’s water-saving showers [%]
REtoilet,y: Reference toilet emissions amount [tCO2/y]
PEtoilet,y: Project toilet emissions amount [tCO2/y]
EERtoilet,y: Water-saving impact of the project’s water-saving toilets [%]
23
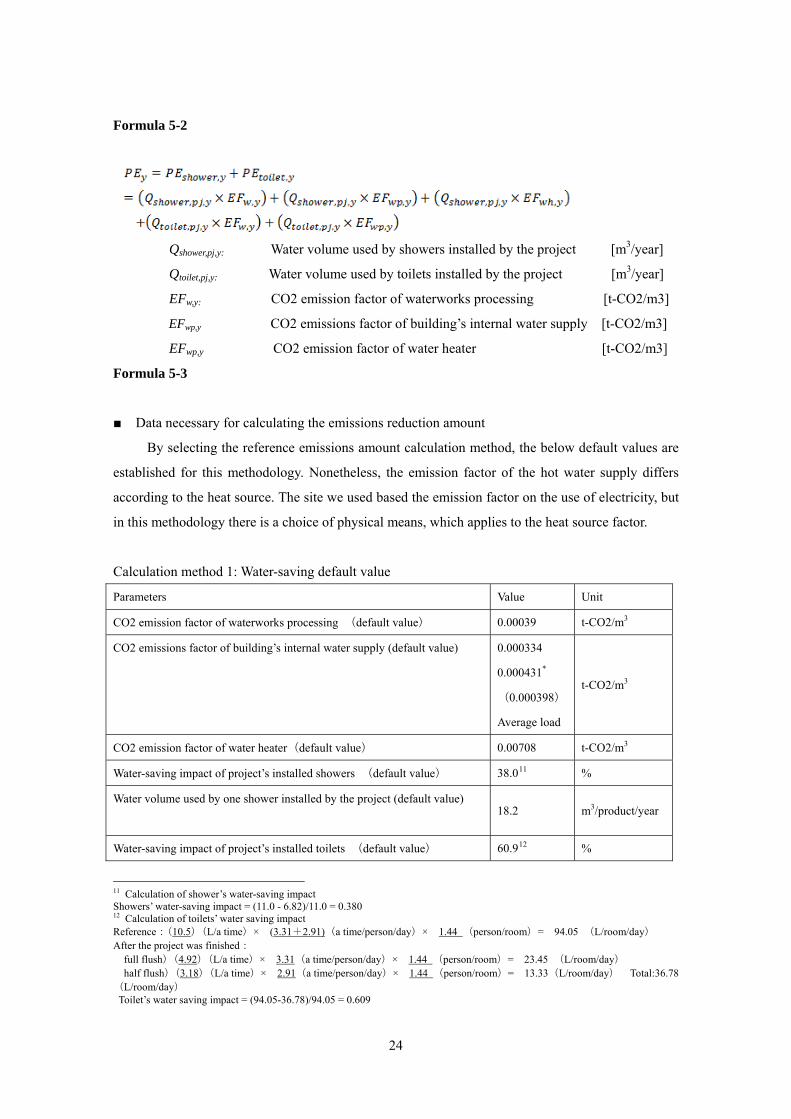
Formula 5-2
Qshower,pj,y: Water volume used by showers installed by the project [m3/year]
Qtoilet,pj,y: Water volume used by toilets installed by the project [m3/year]
EFw,y: CO2 emission factor of waterworks processing [t-CO2/m3]
EFwp,y CO2 emissions factor of building’s internal water supply [t-CO2/m3]
EFwp,y CO2 emission factor of water heater [t-CO2/m3]
Formula 5-3
■ Data necessary for calculating the emissions reduction amount
By selecting the reference emissions amount calculation method, the below default values are
established for this methodology. Nonetheless, the emission factor of the hot water supply differs
according to the heat source. The site we used based the emission factor on the use of electricity, but
in this methodology there is a choice of physical means, which applies to the heat source factor.
Calculation method 1: Water-saving default value
Parameters Value Unit
CO2 emission factor of waterworks processing (default value) 0.00039 t-CO2/m3
CO2 emissions factor of building’s internal water supply (default value) 0.000334
0.000431*
(0.000398)
Average load
t-CO2/m3
CO2 emission factor of water heater(default value) 0.00708 t-CO2/m3
Water-saving impact of project’s installed showers (default value) 38.011 %
Water volume used by one shower installed by the project (default value) 18.2 m3/product/year
Water-saving impact of project’s installed toilets (default value) 60.912 %
11 Calculation of shower’s water-saving impact Showers’ water-saving impact = (11.0 - 6.82)/11.0 = 0.380 12 Calculation of toilets’ water saving impact Reference:(10.5)(L/a time)× (3.31+2.91)(a time/person/day)× 1.44 (person/room)= 94.05 (L/room/day) After the project was finished: full flush)(4.92)(L/a time)× 3.31(a time/person/day)× 1.44 (person/room)= 23.45 (L/room/day) half flush)(3.18)(L/a time)× 2.91(a time/person/day)× 1.44 (person/room)= 13.33(L/room/day) Total:36.78(L/room/day) Toilet’s water saving impact = (94.05-36.78)/94.05 = 0.609
24

Water volume used by one toilet installed by the project (default value) 9.3 m3/product/year
Number of showers installed by the project Monitoring product/year
Number of toilets installed by the project Monitoring product/year
Calculation method 2: Water-saving project’s eigenvalue
Parameter Value Unit
CO2 emission factor of waterworks processing (default value) 0.00039 t-CO2/m3
CO2 emission factor of building’s internal water supply (default value) 0.000334
0.000431*
(0.000398)
Weighted average
t-CO2/m3
CO2 emission factor of the water heater (default value) 0.0070813 t-CO2/m3
Water-saving impact of project’s installed showers (default value) 38.0 %
Water volume used by one shower installed by the project Monitoring m3/product/year
Water-saving impact of project’s installed toilets (default value) 60.9 %
Water volume used by one toilet installed by the project Monitoring m3/product/year
* In the case where a pressure pump is present: the below calculations are based on the site of investigation, which was divided into
two types of rooms where water saving fittings were installed (16th floor upwards, 99 rooms, and 15th floor downwards, 51 rooms).
These calculations use the weighted average.
5.2 The projected potential CO2 reduced in hotels
There was an investigation of the potential amount that could be reduced if the project was
spread to other hotels in Vietnam. However, the input and output of energy used by the hot water
supply is influenced by its heat source and climatic zone, and this must be kept in mind for the
investigation.
■ Setting up a model for expansion
It is envisaged that water saving products will be installed into 5000 rooms in both Ho Chi
Minh City and in Hanoi City, with the consideration of the climatic zone’s influence on energy input
and output. Also, the heat sources are determined as electricity, heavy oil and gas. Accordingly, there
are 6 possible patterns as outlined below.
The emission factor of each pattern is outlined below in Table 5.2-1.
13 The default value differs according to the region in which the project was carried out – average water temperature and water supply systems are different. For example, those derived from electricity in Ho Chi Minh City are given.
25
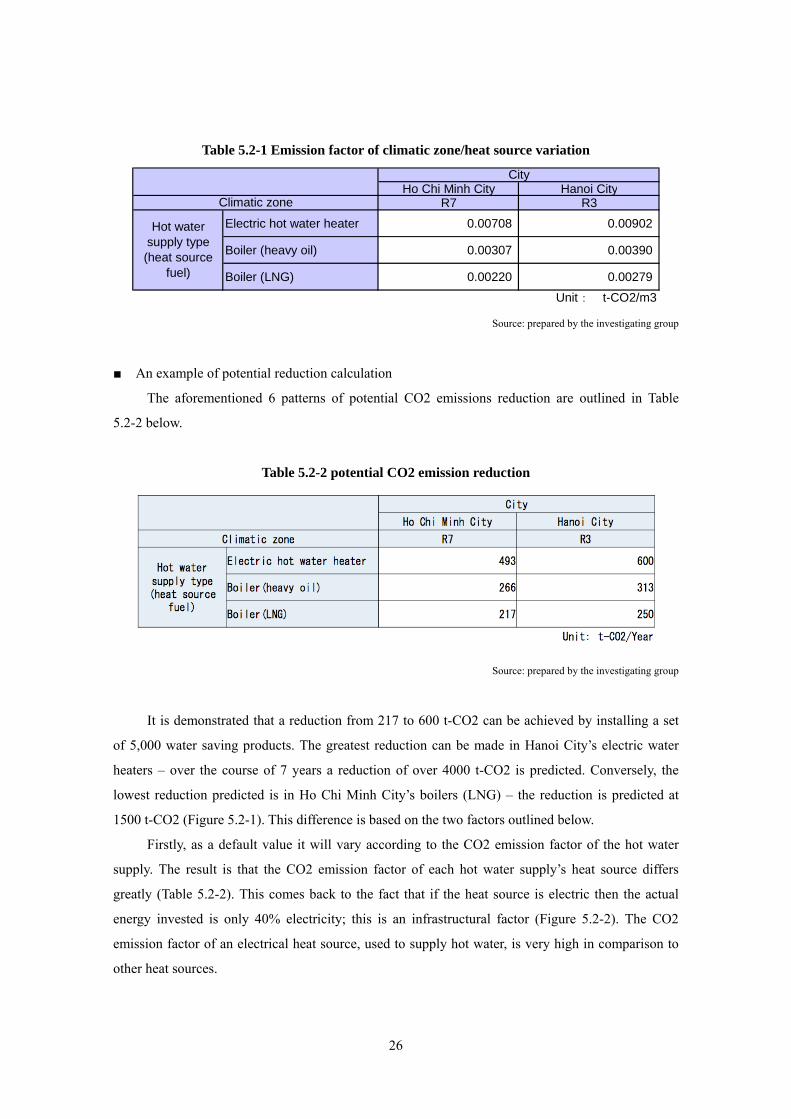
Table 5.2-1 Emission factor of climatic zone/heat source variation
Ho Chi Minh City Hanoi CityR7 R3
Electric hot water heater 0.00708 0.00902
Boiler (heavy oil) 0.00307 0.00390
Boiler (LNG) 0.00220 0.00279
Unit: t-CO2/m3
City
Climatic zone
Hot watersupply type(heat source
fuel)
Source: prepared by the investigating group
■ An example of potential reduction calculation
The aforementioned 6 patterns of potential CO2 emissions reduction are outlined in Table
5.2-2 below.
Table 5.2-2 potential CO2 emission reduction
Source: prepared by the investigating group
It is demonstrated that a reduction from 217 to 600 t-CO2 can be achieved by installing a set
of 5,000 water saving products. The greatest reduction can be made in Hanoi City’s electric water
heaters – over the course of 7 years a reduction of over 4000 t-CO2 is predicted. Conversely, the
lowest reduction predicted is in Ho Chi Minh City’s boilers (LNG) – the reduction is predicted at
1500 t-CO2 (Figure 5.2-1). This difference is based on the two factors outlined below.
Firstly, as a default value it will vary according to the CO2 emission factor of the hot water
supply. The result is that the CO2 emission factor of each hot water supply’s heat source differs
greatly (Table 5.2-2). This comes back to the fact that if the heat source is electric then the actual
energy invested is only 40% electricity; this is an infrastructural factor (Figure 5.2-2). The CO2
emission factor of an electrical heat source, used to supply hot water, is very high in comparison to
other heat sources.
26

0
500
1,000
1,500
2,000
2,500
3,000
3,500
4,000
4,500
1 2 3 4 5 6 7
(t‐CO2)
(Year)
Ho Chi Minh Electric hot water heater
Ho Chi Minh Boiler(heavy oil)
Ho Chi Minh Boiler(LNG)
Hanoi Electric hot water heater
Hanoi Boiler(heavy oil)
Hanoi Boiler(LNG)
Source: prepared by the investigating group
Figure 5.2-1 CO2 reduction potential cumulative amount
Source: prepared by the investigating group
Figure 5.2-2 Outline of differing heat source’s energy efficiency
Secondly, the climatic zone influences the energy input and output. The main reason for this is
that the CO2 emission factor of the heat source for the hot water supply is much larger than the CO2
emission factor of the waterworks and internal water supply infrastructure. Resultantly, it was found
that the default CO2 emission factor of a shower is high. Hence, regions of higher latitudes, which
have lower average water temperatures, have a much greater potential of CO2 reduction.
■ Further investigation for formula of the reduction potential
MRV methodology was advanced at the hotel, with an understanding of the influence of
differing emissions factor of heat sources for hot water supplies, and the variation in average water
27
temperature according to climatic zone. Accordingly, it was possible to estimate the water and CO2
reduction impact in the Vietnamese hotels, however, the hotel’s internal hot water supply system is
an area of further investigation due to the affect of the hot water heater’s energy input and output on
the CO2 emissions amount. The emission factor of the hot water heater was 4.84kg-CO2/m3, based
on the actual measurements of the hotel’s heat pump. (Formula 4-3), conversely, shows the electric
water heater’s emission factor is 7.08kg-CO2/m3 based on the default value of the aforementioned
project formula (Formula 4-5). This differentiation is derived from two factors related to the hotel’s
internal hot water supply system.
The first factor is the difference in thermal efficiency of the hot water supply. The hotel’s heat
pump has a COP (Coefficient of Performance) of 3.5, and this is theoretically an efficiency of
350%. This is not taken into account by the aforementioned project formula, which sets the
efficiency at 100%. In addition, it is widely stated that in many hotels in Vietnam, the heavy oil and
electric boilers have a thermal efficiency of 90%, and this must also be taken into account.
The second factor relates to the loss of heat through the plumbing system. According to
Masuda et al.14 over 50% of heat is lost through the internal plumbing system of a hotel. These
issues did not apply to the aforementioned project’s investigation into residential homes, and also
because many hotels have hot water heaters with a large capacity and were part of a central hot water
supply system.
The differing energy efficiencies of the heat sources included in the issues mentioned above
are outlined in figure 5.2-2. Infrastructural factors of electricity efficiency and electricity
transmission loss are incorporated into the discussion on methodology. Conversely, there is
insufficient knowledge on the hotel hot water heater’s energy efficiency and heat loss of the
plumbing system, to incorporate these into the methodology. Nevertheless, as mentioned previously,
the hotel’s internal hot water supply system impacts greatly on the hot water heater’s CO2 emissions
amount. Hence, the efficiency of the hotel’s internal hot water supply system is considered when
calculating the reduction potential. In this case, the electric hot water system can be divided into a
heat pump and electric boiler. It is widely stated that the heat pump’s efficiency in a majority of
cases is from 200% to 600%. However, this investigation’s formula sets it at 350%, which is
specified in the catalogue for the heat pump used in the Riverside Hotel. Furthermore, the electric
boiler is set at 90%, the same as heavy oil and gas boilers. Also, the heat lost from the plumbing
system is set at 50%. The results are outlined in Table 5.2-3.
The yearly CO2 emission reduction of a room that does not use a pressure pump is
72.8kg-CO2 as shown in Table 5.1-2. If that is applied to 5,000 rooms it becomes 364t-CO2. This
14 Masuda et al. (2012) “Measurement of heat loss from hot water supply system in a budget hotel”.
Architectural Institute of Japan: environment group (52), 301-304, 2012-05-25
28
value is close to the case of Ho Chi Minh City hot water supply, which uses a heat pump, and is
322t-CO2.
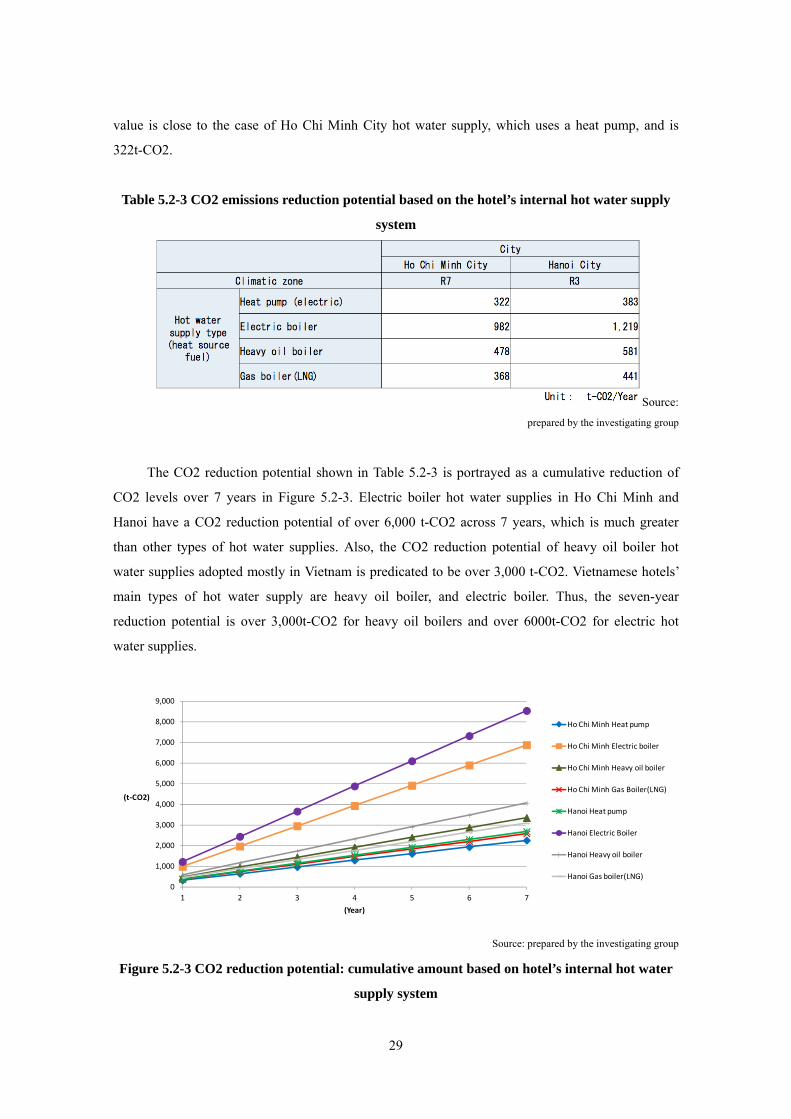
Table 5.2-3 CO2 emissions reduction potential based on the hotel’s internal hot water supply
system
Source:
prepared by the investigating group
The CO2 reduction potential shown in Table 5.2-3 is portrayed as a cumulative reduction of
CO2 levels over 7 years in Figure 5.2-3. Electric boiler hot water supplies in Ho Chi Minh and
Hanoi have a CO2 reduction potential of over 6,000 t-CO2 across 7 years, which is much greater
than other types of hot water supplies. Also, the CO2 reduction potential of heavy oil boiler hot
water supplies adopted mostly in Vietnam is predicated to be over 3,000 t-CO2. Vietnamese hotels’
main types of hot water supply are heavy oil boiler, and electric boiler. Thus, the seven-year
reduction potential is over 3,000t-CO2 for heavy oil boilers and over 6000t-CO2 for electric hot
water supplies.
0
1,000
2,000
3,000
4,000
5,000
6,000
7,000
8,000
9,000
1 2 3 4 5 6 7
(t‐CO2)
(Year)
Ho Chi Minh Heat pump
Ho Chi Minh Electric boiler
Ho Chi Minh Heavy oil boiler
Ho Chi Minh Gas Boiler(LNG)
Hanoi Heat pump
Hanoi Electric Boiler
Hanoi Heavy oil boiler
Hanoi Gas boiler(LNG)
Source: prepared by the investigating group
Figure 5.2-3 CO2 reduction potential: cumulative amount based on hotel’s internal hot water
supply system
29

Chapter 6 Environmental Benefit of Rainwater Utilization
6.1 Rainfall Situation in Vietnam
There is a clear distinction between rainy season and dry season in Vietnam and May to
October falls into rainy season. Rainfall in Vietnam is characterized by squall-like downpour within
short hours for several days resulting in frequent flood in urban areas paved with asphalt.
Collection and utilization of rainwater will undoubtedly contribute to the settlement of urban
flood issues and clean water is saved simultaneously together of which will turn around the water
supply situation and aggravating urban environment caused by flood in Vietnam.
Source: The Embassy of the Socialist Republic of Vietnam in the United Kingdom
30-Year Average Figures Monitored From 1981-2010, Japan Meteorological Agency15
Figure 6.1-1 Rainfall in Hanoi, Ho Chi Minh and Tokyo
6.2 Outline of Rainwater Utilization
6.2.1 Benefit of Rainwater Utilization
Followings are the key benefits of utilizing rainwater.
15Japan Meteorological Agency(http://www.data.jma.go.jp/obd/stats/etrn/index.php)
30

・ Lower tariff rates of clean water and sewage through the saving of clean water
・ Alternative water source at the time of disaster
・ Mitigation of urban flood damages
・Conservation of underground water through the curb in release of water into rivers
These benefits are categorized by water management and disaster prevention, water utilization,
environmental aspect, comfort and amenity (see Table 6.2-1 below).
Table 6.2-1 Particulars and Benefit of Rainwater Utilization
Assessment Function/Benefit
Water
Management/Disaster
Prevention
Runoff control, Peak flow reduction, Mitigation of load in rivers and drains
-Prevention of inundation, Reduction of water disasters, Reduction of drain and pipe
maintenance costs
Water Utilization Water supply at the time of disaster, for environmental management and landscaping, for
miscellaneous purposes, for field/road/snow sprinkler
-Reduction of tap water demands, Water-saving, Raising awareness of water resource
utilization
Environmental
Aspect
Secured water volume in rivers, Groundwater recharge and control of land subsidence,
Conservation and restoration of spring water, Preservation and rejuvenation of aquatic
ecosystem, Water supply to green areas, Mitigation of urban heat-island effect, Reduction of
nonpoint load, Reduction of combined sewage contamination load
-Conservation of aquatic environment, Preservation of ecosystem, Improvement of
micrometeorological conditions, Conservation of water quality
Comfort/Amenity Construction of waterfront and amenity (Sound of stream, Nature-friendly waterfront,
biotope etc)
-Formation of urban landscape, Enhanced recreational function
Source: Page 3, Latest List of Rainwater Storage and Immersion Facilities
6.2.2 Runoff Control Facilities
Runoff control facilities must be utilized as part of the measures to settle urban flood issues
which are classified into offsite and onsite facilities. The former refers to the reservoirs of rainwater
upon collection from rivers and sewage, whereas the latter refers to the facilities to prevent runoff of
rainwater by means of minimizing movement of rainwater, storage and immersion on the site of
rainfall.
Small-sized onsite storage facilities will be studied in this report through the analysis of their
impact upon extensive application.
31
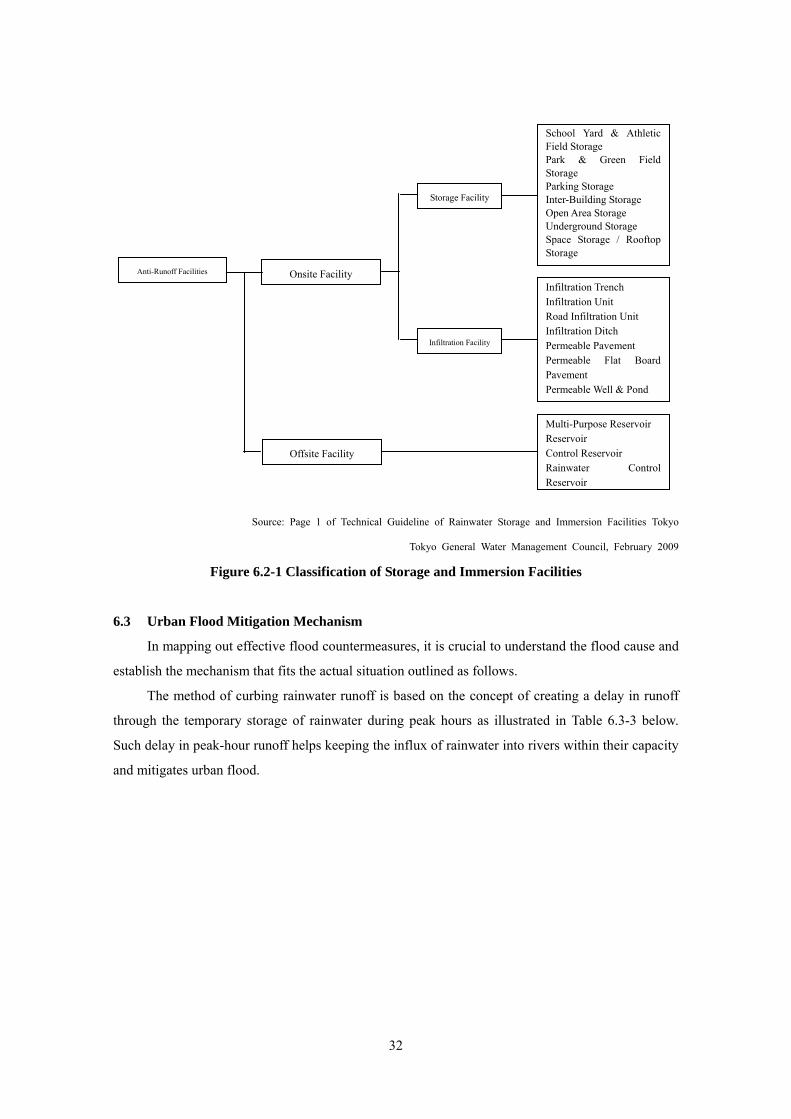
School Yard & Athletic Field Storage Park & Green Field Storage Parking Storage Inter-Building Storage Open Area Storage Underground Storage Space Storage / Rooftop Storage
Storage Facility
Source: Page 1 of Technical Guideline of Rainwater Storage and Immersion Facilities Tokyo
Tokyo General Water Management Council, February 2009
Figure 6.2-1 Classification of Storage and Immersion Facilities
6.3 Urban Flood Mitigation Mechanism
In mapping out effective flood countermeasures, it is crucial to understand the flood cause and
establish the mechanism that fits the actual situation outlined as follows.
The method of curbing rainwater runoff is based on the concept of creating a delay in runoff
through the temporary storage of rainwater during peak hours as illustrated in Table 6.3-3 below.
Such delay in peak-hour runoff helps keeping the influx of rainwater into rivers within their capacity
and mitigates urban flood.
Anti-Runoff Facilities Onsite Facility
Offsite Facility
Infiltration Facility
Infiltration Trench Infiltration Unit Road Infiltration Unit Infiltration Ditch Permeable Pavement Permeable Flat Board Pavement Permeable Well & Pond
Multi-Purpose Reservoir Reservoir Control Reservoir Rainwater Control Reservoir
32
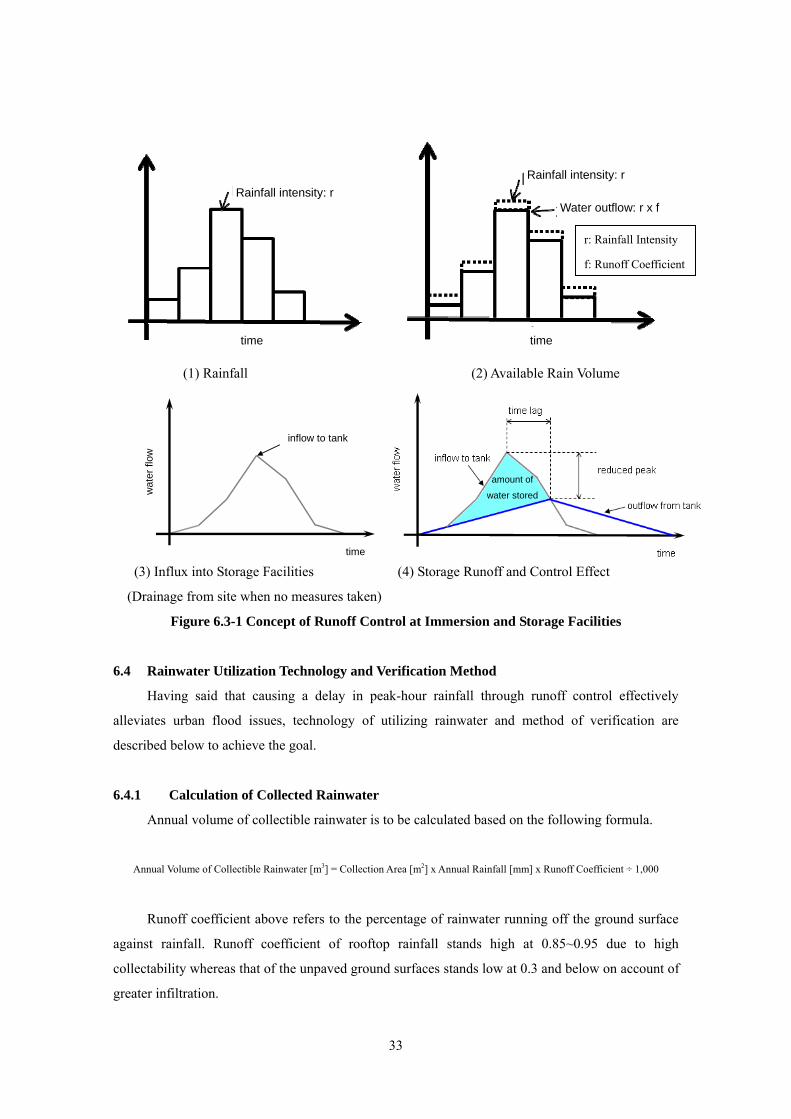
r: Rainfall Intensity
f: Runoff Coefficient
time time
Rainfall intensity: rRainfall intensity: r
Water outflow: r x f
(1) Rainfall (2) Available Rain Volume
inflow to tank
time
wat
er fl
ow
(3) Influx into Storage Facilities (4) Storage Runoff and Control Effect
water stored
amount of
(Drainage from site when no measures taken)
Figure 6.3-1 Concept of Runoff Control at Immersion and Storage Facilities
6.4 Rainwater Utilization Technology and Verification Method
Having said that causing a delay in peak-hour rainfall through runoff control effectively
alleviates urban flood issues, technology of utilizing rainwater and method of verification are
described below to achieve the goal.
6.4.1 Calculation of Collected Rainwater
Annual volume of collectible rainwater is to be calculated based on the following formula.
Annual Volume of Collectible Rainwater [m3] = Collection Area [m2] x Annual Rainfall [mm] x Runoff Coefficient ÷ 1,000
Runoff coefficient above refers to the percentage of rainwater running off the ground surface
against rainfall. Runoff coefficient of rooftop rainfall stands high at 0.85~0.95 due to high
collectability whereas that of the unpaved ground surfaces stands low at 0.3 and below on account of
greater infiltration.
33
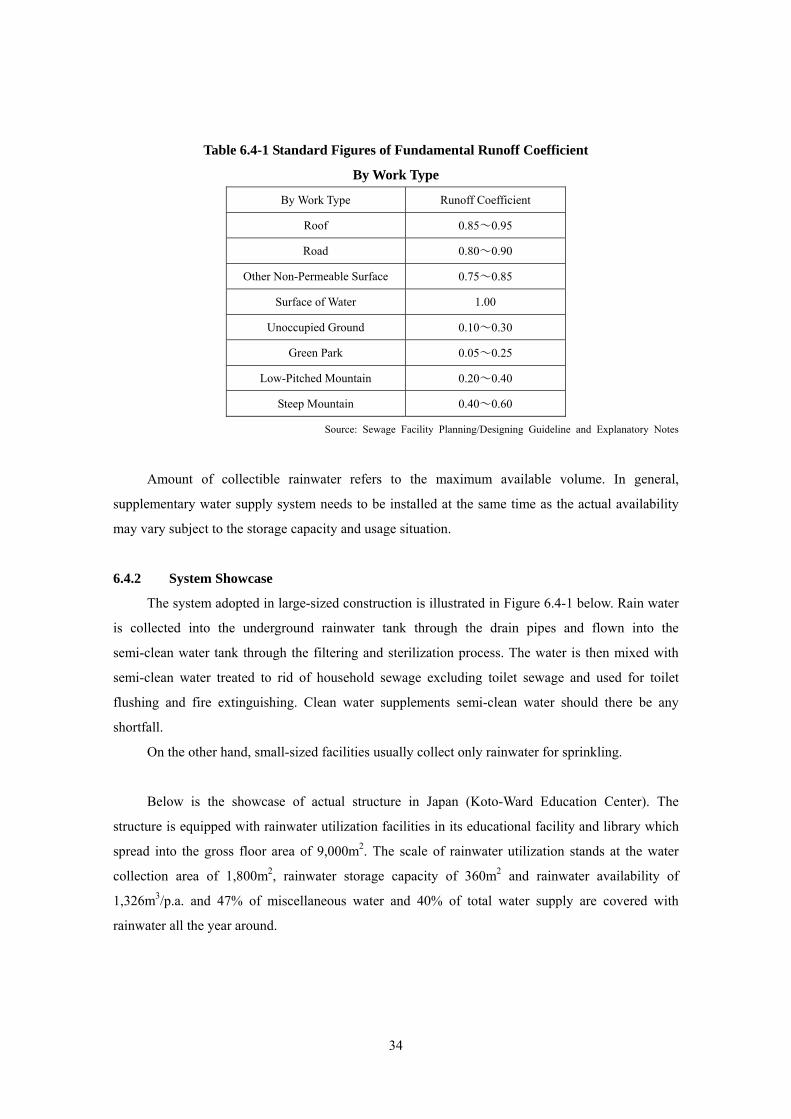
Table 6.4-1 Standard Figures of Fundamental Runoff Coefficient
By Work Type
By Work Type Runoff Coefficient
Roof 0.85~0.95
Road 0.80~0.90
Other Non-Permeable Surface 0.75~0.85
Surface of Water 1.00
Unoccupied Ground 0.10~0.30
Green Park 0.05~0.25
Low-Pitched Mountain 0.20~0.40
Steep Mountain 0.40~0.60
Source: Sewage Facility Planning/Designing Guideline and Explanatory Notes
Amount of collectible rainwater refers to the maximum available volume. In general,
supplementary water supply system needs to be installed at the same time as the actual availability
may vary subject to the storage capacity and usage situation.
6.4.2 System Showcase
The system adopted in large-sized construction is illustrated in Figure 6.4-1 below. Rain water
is collected into the underground rainwater tank through the drain pipes and flown into the
semi-clean water tank through the filtering and sterilization process. The water is then mixed with
semi-clean water treated to rid of household sewage excluding toilet sewage and used for toilet
flushing and fire extinguishing. Clean water supplements semi-clean water should there be any
shortfall.
On the other hand, small-sized facilities usually collect only rainwater for sprinkling.
Below is the showcase of actual structure in Japan (Koto-Ward Education Center). The
structure is equipped with rainwater utilization facilities in its educational facility and library which
spread into the gross floor area of 9,000m2. The scale of rainwater utilization stands at the water
collection area of 1,800m2, rainwater storage capacity of 360m2 and rainwater availability of
1,326m3/p.a. and 47% of miscellaneous water and 40% of total water supply are covered with
rainwater all the year around.
34

Source: Environment Conservation Office, Sumida-Ward Tokyo
Figure 6.4-1 Showcase of Rainwater Utilization System
35

Table 6.4-2 Particulars of Structure
Address 2-3 Toyo, Koto-Ward Tokyo
Purpose of Site
(Purpose of Facility)
Educational Center, Library
Commencement April 1985
Mission Water Resource Utilization, Sewage Load Reduction
Site Area 5,628m2
Floor Area 9,088m2
Water Collectible
Area
Building Roof and Balcony of 1,800m2
Rainwater Storage
Tank
Building Underground of 360m2
Purpose of
Rainwater Usage
Toilet Flushing, Pond Water, Coolant Water, Sprinkling, Cleaning, Car
Washing, Fire Extinguishing
Water Volume 1,326m2/Year
Water Processing Deposit Treatment, Crushed Stone Filtration, Strainer
Source Supply Clean Water
Source: Rainwater Utilization Handbook
6.5 Reduction Effect of Clean Water Consumption
According to the Rain Water Storage and Infiltration Facility Installation Manual for Landed
Property, privately-owned household may enjoy saving of clean water consumption by 6.8m3/month
through the utilization of rainwater which is equivalent to about 21% of the total water consumption
and is converted into the annual saving of around JPY11,000 with the pumping cost of stored water
included (calculation based on the household of five, water collection area of 116.1m2, capacity of
2.12m3 and water used for toilet flush).
Benefit of lowering water bill through the use of rainwater is illustrated below.
Table 6.5-1 Use of Rainwater and Reduction of Water Bill
Items Unit No Rainwater With
Rainwater
Notes
Rainwater Usage m3/ Month 0.0 6.8 Monthly Average of 16 Years
Water Consumption m3/ Month 32.0 25.2 Average Water Consumption
of 5-Member Household for
“No Rainwater” Category
36
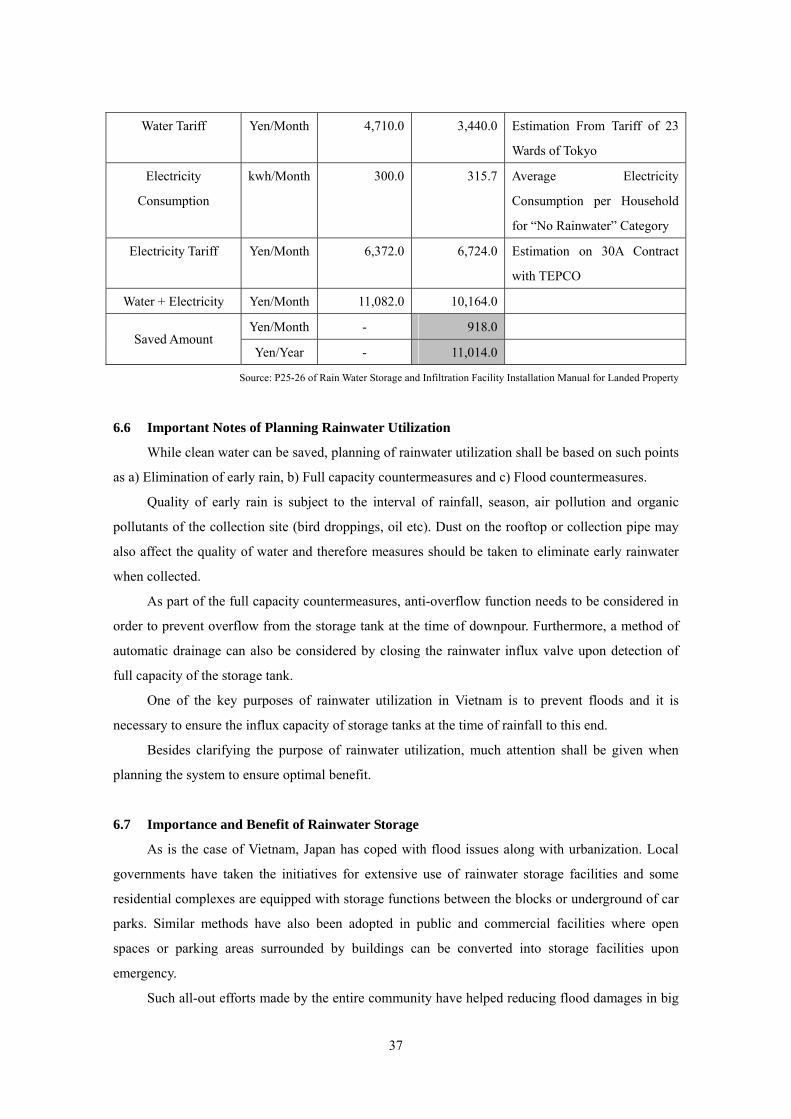
Water Tariff Yen/Month 4,710.0 3,440.0 Estimation From Tariff of 23
Wards of Tokyo
Electricity
Consumption
kwh/Month 300.0 315.7 Average Electricity
Consumption per Household
for “No Rainwater” Category
Electricity Tariff Yen/Month 6,372.0 6,724.0 Estimation on 30A Contract
with TEPCO
Water + Electricity Yen/Month 11,082.0 10,164.0
Yen/Month - 918.0 Saved Amount
Yen/Year - 11,014.0
Source: P25-26 of Rain Water Storage and Infiltration Facility Installation Manual for Landed Property
6.6 Important Notes of Planning Rainwater Utilization
While clean water can be saved, planning of rainwater utilization shall be based on such points
as a) Elimination of early rain, b) Full capacity countermeasures and c) Flood countermeasures.
Quality of early rain is subject to the interval of rainfall, season, air pollution and organic
pollutants of the collection site (bird droppings, oil etc). Dust on the rooftop or collection pipe may
also affect the quality of water and therefore measures should be taken to eliminate early rainwater
when collected.
As part of the full capacity countermeasures, anti-overflow function needs to be considered in
order to prevent overflow from the storage tank at the time of downpour. Furthermore, a method of
automatic drainage can also be considered by closing the rainwater influx valve upon detection of
full capacity of the storage tank.
One of the key purposes of rainwater utilization in Vietnam is to prevent floods and it is
necessary to ensure the influx capacity of storage tanks at the time of rainfall to this end.
Besides clarifying the purpose of rainwater utilization, much attention shall be given when
planning the system to ensure optimal benefit.
6.7 Importance and Benefit of Rainwater Storage
As is the case of Vietnam, Japan has coped with flood issues along with urbanization. Local
governments have taken the initiatives for extensive use of rainwater storage facilities and some
residential complexes are equipped with storage functions between the blocks or underground of car
parks. Similar methods have also been adopted in public and commercial facilities where open
spaces or parking areas surrounded by buildings can be converted into storage facilities upon
emergency.
Such all-out efforts made by the entire community have helped reducing flood damages in big
37

cities.
38
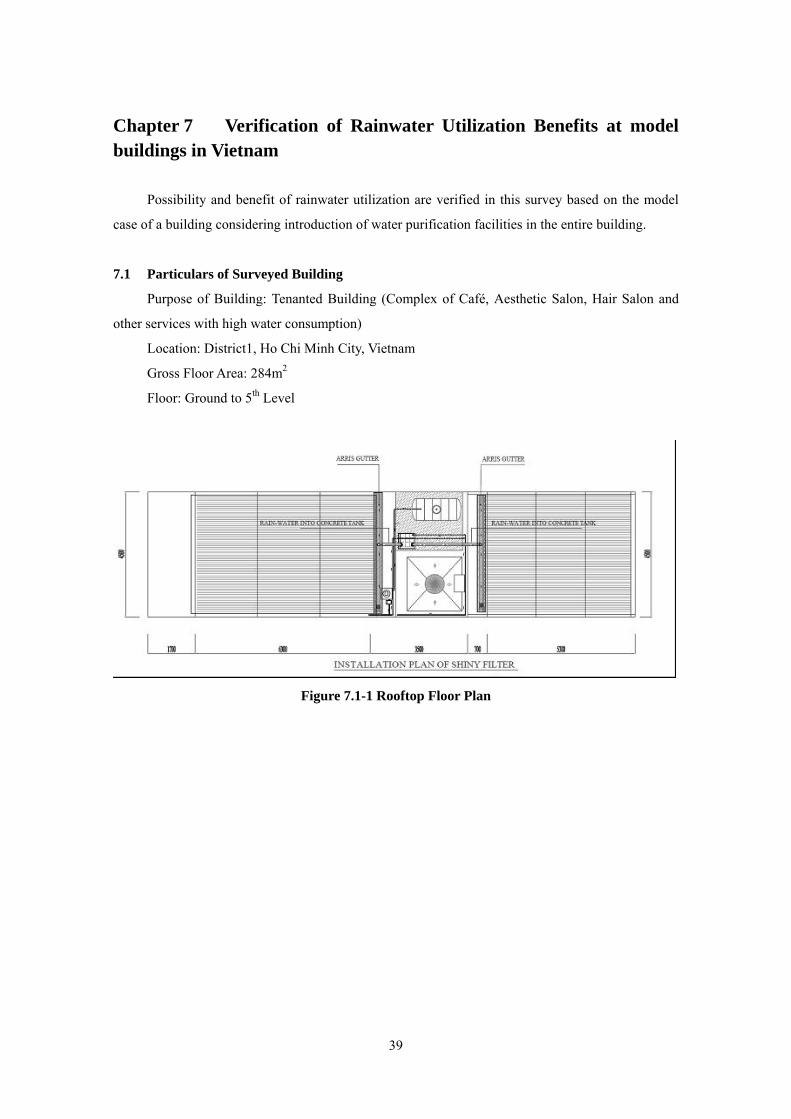
Chapter 7 Verification of Rainwater Utilization Benefits at model buildings in Vietnam
Possibility and benefit of rainwater utilization are verified in this survey based on the model
case of a building considering introduction of water purification facilities in the entire building.
7.1 Particulars of Surveyed Building
Purpose of Building: Tenanted Building (Complex of Café, Aesthetic Salon, Hair Salon and
other services with high water consumption)
Location: District1, Ho Chi Minh City, Vietnam
Gross Floor Area: 284m2
Floor: Ground to 5th Level
Figure 7.1-1 Rooftop Floor Plan
39
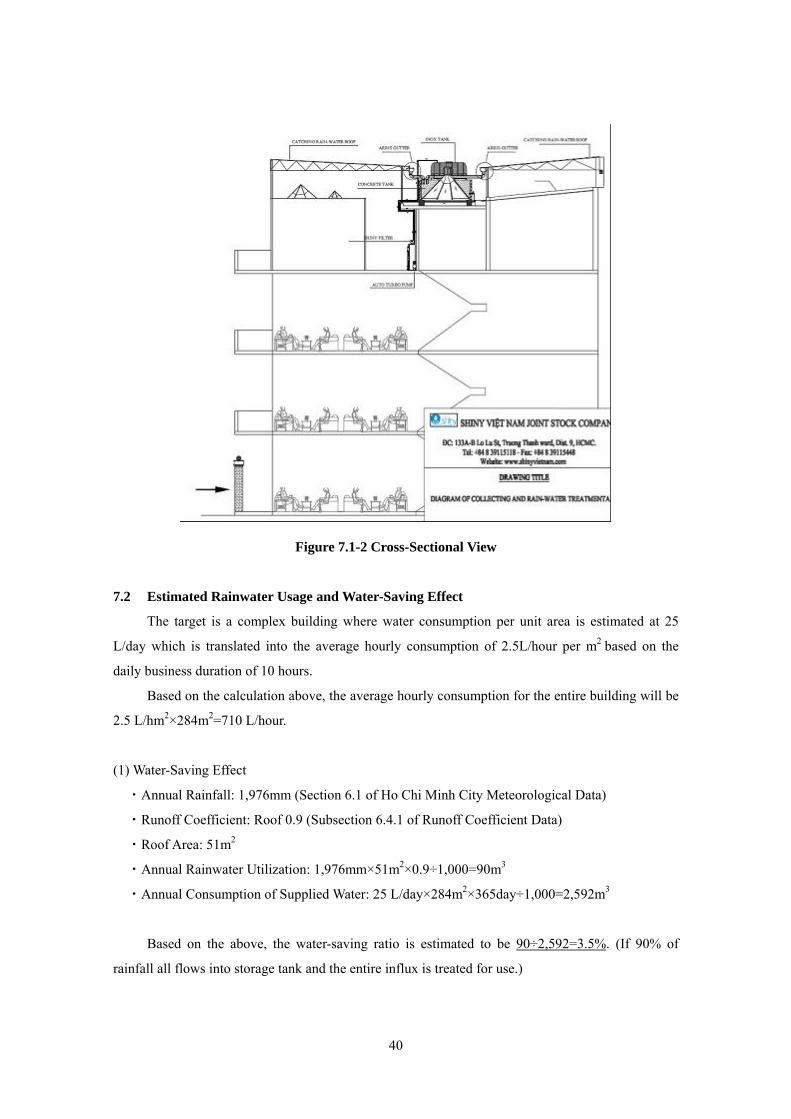
Figure 7.1-2 Cross-Sectional View
7.2 Estimated Rainwater Usage and Water-Saving Effect
The target is a complex building where water consumption per unit area is estimated at 25
L/day which is translated into the average hourly consumption of 2.5L/hour per m2 based on the
daily business duration of 10 hours.
Based on the calculation above, the average hourly consumption for the entire building will be
2.5 L/hm2×284m2=710 L/hour.
(1) Water-Saving Effect
・Annual Rainfall: 1,976mm (Section 6.1 of Ho Chi Minh City Meteorological Data)
・Runoff Coefficient: Roof 0.9 (Subsection 6.4.1 of Runoff Coefficient Data)
・Roof Area: 51m2
・Annual Rainwater Utilization: 1,976mm×51m2×0.9÷1,000=90m3
・Annual Consumption of Supplied Water: 25 L/day×284m2×365day÷1,000=2,592m3
Based on the above, the water-saving ratio is estimated to be 90÷2,592=3.5%. (If 90% of
rainfall all flows into storage tank and the entire influx is treated for use.)
40
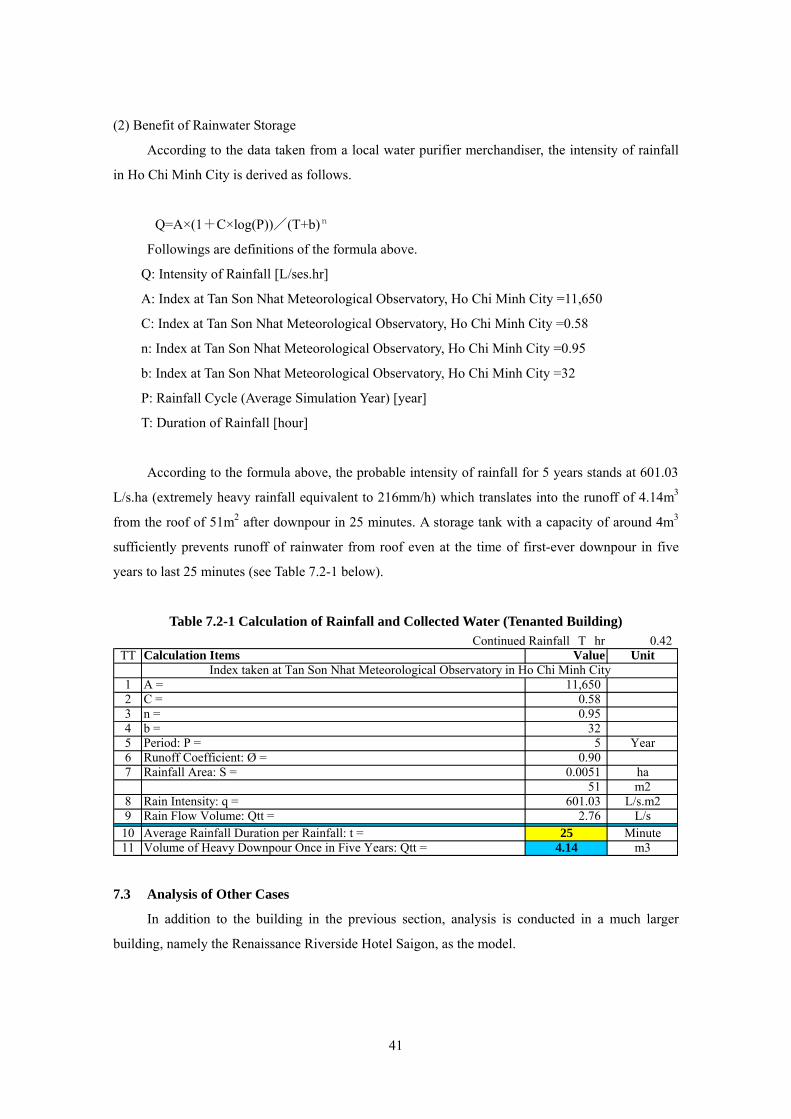
(2) Benefit of Rainwater Storage
According to the data taken from a local water purifier merchandiser, the intensity of rainfall
in Ho Chi Minh City is derived as follows.
Q=A×(1+C×log(P))/(T+b)n
Followings are definitions of the formula above.
Q: Intensity of Rainfall [L/ses.hr]
A: Index at Tan Son Nhat Meteorological Observatory, Ho Chi Minh City =11,650
C: Index at Tan Son Nhat Meteorological Observatory, Ho Chi Minh City =0.58
n: Index at Tan Son Nhat Meteorological Observatory, Ho Chi Minh City =0.95
b: Index at Tan Son Nhat Meteorological Observatory, Ho Chi Minh City =32
P: Rainfall Cycle (Average Simulation Year) [year]
T: Duration of Rainfall [hour]
According to the formula above, the probable intensity of rainfall for 5 years stands at 601.03
L/s.ha (extremely heavy rainfall equivalent to 216mm/h) which translates into the runoff of 4.14m3
from the roof of 51m2 after downpour in 25 minutes. A storage tank with a capacity of around 4m3
sufficiently prevents runoff of rainwater from roof even at the time of first-ever downpour in five
years to last 25 minutes (see Table 7.2-1 below).
Table 7.2-1 Calculation of Rainfall and Collected Water (Tenanted Building) Continued Rainfall T hr 0.42
TT Calculation Items Value Unit
1 A = 11,650 2 C = 0.58 3 n = 0.95 4 b = 32 5 Period: P = 5 Year6 Runoff Coefficient: Ø = 0.90 7 Rainfall Area: S = 0.0051 ha
51 m28 Rain Intensity: q = 601.03 L/s.m29 Rain Flow Volume: Qtt = 2.76 L/s
10 Average Rainfall Duration per Rainfall: t = 25 Minute11 Volume of Heavy Downpour Once in Five Years: Qtt = 4.14 m3
Index taken at Tan Son Nhat Meteorological Observatory in Ho Chi Minh City
7.3 Analysis of Other Cases
In addition to the building in the previous section, analysis is conducted in a much larger
building, namely the Renaissance Riverside Hotel Saigon, as the model.
41
(1) Particulars of Building
・Location: Ho Chi Minh City, Vietnam
・Gross Floor Area: 29,539m2
・Floor: Basement 1 to 21st Level
・Usage: Hotel
Source: Google, DigitalGlobe
Figure 7.3-1 Aerial Photo of Renaissance Riverside Hotel Saigon
(2) Consumption of Supplied Water
・Actual consumption of 2008 based on the survey: 132,241m3/year
・(Ref.) Annual consumption of supplied water estimated from the standard consumption at hotels
in Japan (reference material): 24.2 L/day×29,539m2×365day÷1,000=260,918m3
(3) Estimated Rainwater Usage and Water-Saving Effect
・Annual Rainfall: 1,976mm
・Runoff Coefficient: Roof 0.9
・Roof Area: 1,419m2 (incl. swimming pool)
・Annual Rainwater Usage:1,976mm×1,419m2×0.9÷1,000=2,524m3
・Annual Usage of Supplied Water: 132,241m3
Based on the above, the water-saving ratio is calculated to be 2,524÷132,241=1.9% (if 90% of
rainfall is all treated and used).
42
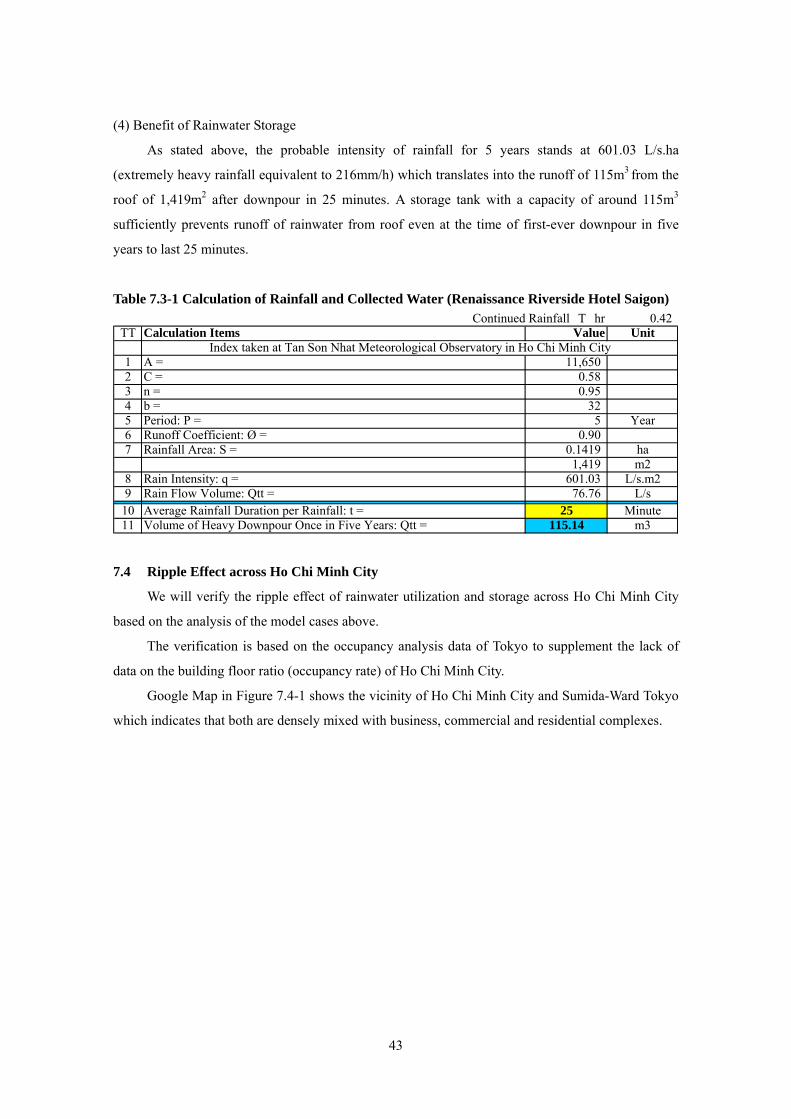
(4) Benefit of Rainwater Storage
As stated above, the probable intensity of rainfall for 5 years stands at 601.03 L/s.ha
(extremely heavy rainfall equivalent to 216mm/h) which translates into the runoff of 115m3 from the
roof of 1,419m2 after downpour in 25 minutes. A storage tank with a capacity of around 115m3
sufficiently prevents runoff of rainwater from roof even at the time of first-ever downpour in five
years to last 25 minutes.
Table 7.3-1 Calculation of Rainfall and Collected Water (Renaissance Riverside Hotel Saigon) Continued Rainfall T hr 0.42
TT Calculation Items Value Unit
1 A = 11,650 2 C = 0.58 3 n = 0.95 4 b = 32 5 Period: P = 5 Year6 Runoff Coefficient: Ø = 0.90 7 Rainfall Area: S = 0.1419 ha
1,419 m28 Rain Intensity: q = 601.03 L/s.m29 Rain Flow Volume: Qtt = 76.76 L/s
10 Average Rainfall Duration per Rainfall: t = 25 Minute11 Volume of Heavy Downpour Once in Five Years: Qtt = 115.14 m3
Index taken at Tan Son Nhat Meteorological Observatory in Ho Chi Minh City
7.4 Ripple Effect across Ho Chi Minh City
We will verify the ripple effect of rainwater utilization and storage across Ho Chi Minh City
based on the analysis of the model cases above.
The verification is based on the occupancy analysis data of Tokyo to supplement the lack of
data on the building floor ratio (occupancy rate) of Ho Chi Minh City.
Google Map in Figure 7.4-1 shows the vicinity of Ho Chi Minh City and Sumida-Ward Tokyo
which indicates that both are densely mixed with business, commercial and residential complexes.
43
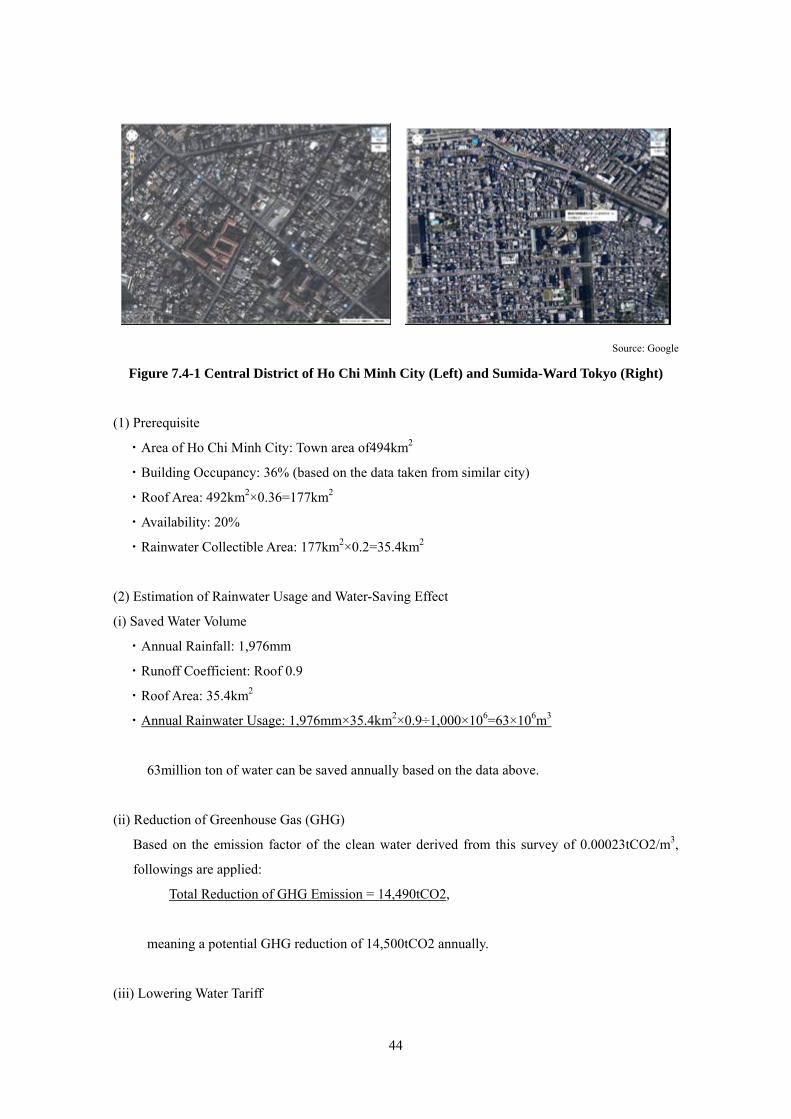
Source: Google
Figure 7.4-1 Central District of Ho Chi Minh City (Left) and Sumida-Ward Tokyo (Right)
(1) Prerequisite
・Area of Ho Chi Minh City: Town area of494km2
・Building Occupancy: 36% (based on the data taken from similar city)
・Roof Area: 492km2×0.36=177km2
・Availability: 20%
・Rainwater Collectible Area: 177km2×0.2=35.4km2
(2) Estimation of Rainwater Usage and Water-Saving Effect
(i) Saved Water Volume
・Annual Rainfall: 1,976mm
・Runoff Coefficient: Roof 0.9
・Roof Area: 35.4km2
・Annual Rainwater Usage: 1,976mm×35.4km2×0.9÷1,000×106=63×106m3
63million ton of water can be saved annually based on the data above.
(ii) Reduction of Greenhouse Gas (GHG)
Based on the emission factor of the clean water derived from this survey of 0.00023tCO2/m3,
followings are applied:
Total Reduction of GHG Emission = 14,490tCO2,
meaning a potential GHG reduction of 14,500tCO2 annually.
(iii) Lowering Water Tariff
44
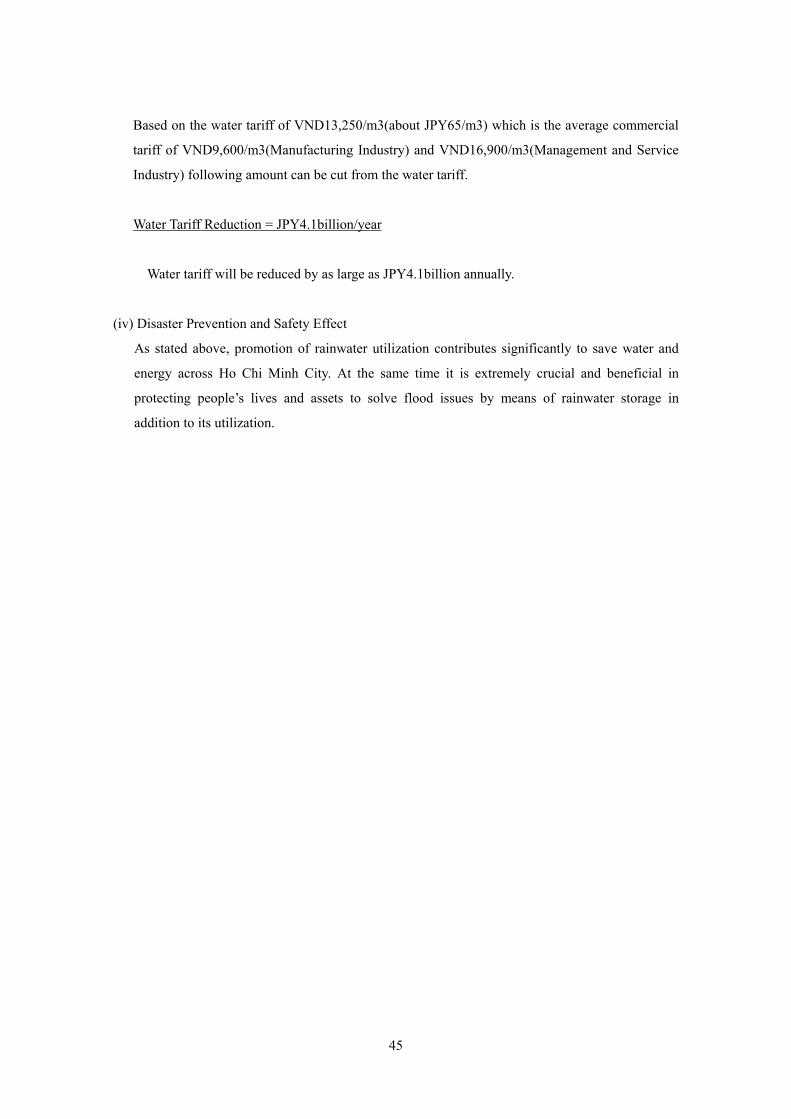
Based on the water tariff of VND13,250/m3(about JPY65/m3) which is the average commercial
tariff of VND9,600/m3(Manufacturing Industry) and VND16,900/m3(Management and Service
Industry) following amount can be cut from the water tariff.
Water Tariff Reduction = JPY4.1billion/year
Water tariff will be reduced by as large as JPY4.1billion annually.
(iv) Disaster Prevention and Safety Effect
As stated above, promotion of rainwater utilization contributes significantly to save water and
energy across Ho Chi Minh City. At the same time it is extremely crucial and beneficial in
protecting people’s lives and assets to solve flood issues by means of rainwater storage in
addition to its utilization.
45
Chapter 8 Rainwater Utilization Test
As part of the survey, we conducted rainwater utilization test using Japanese water purification
system in cooperation with ECC-HCMC. Based on the outcome of this test, we will pursue the
optimal method of rainwater utilization and finalize safe and workable proposals in accordance with
local applicable laws and regulations.
8.1 Particulars of Test Building
Purpose of Building: Parking Space of ECC-HCMC
Location: District 3, Ho Chi Minh City Vietnam
Rainwater Collectible Area: 60m2
Rainwater Tank Capacity: 1,000L
System Structure: Preliminary Treatment Device, Water Purification Device, Outlet Pump
Figure 8.1-1 Rooftop View
46
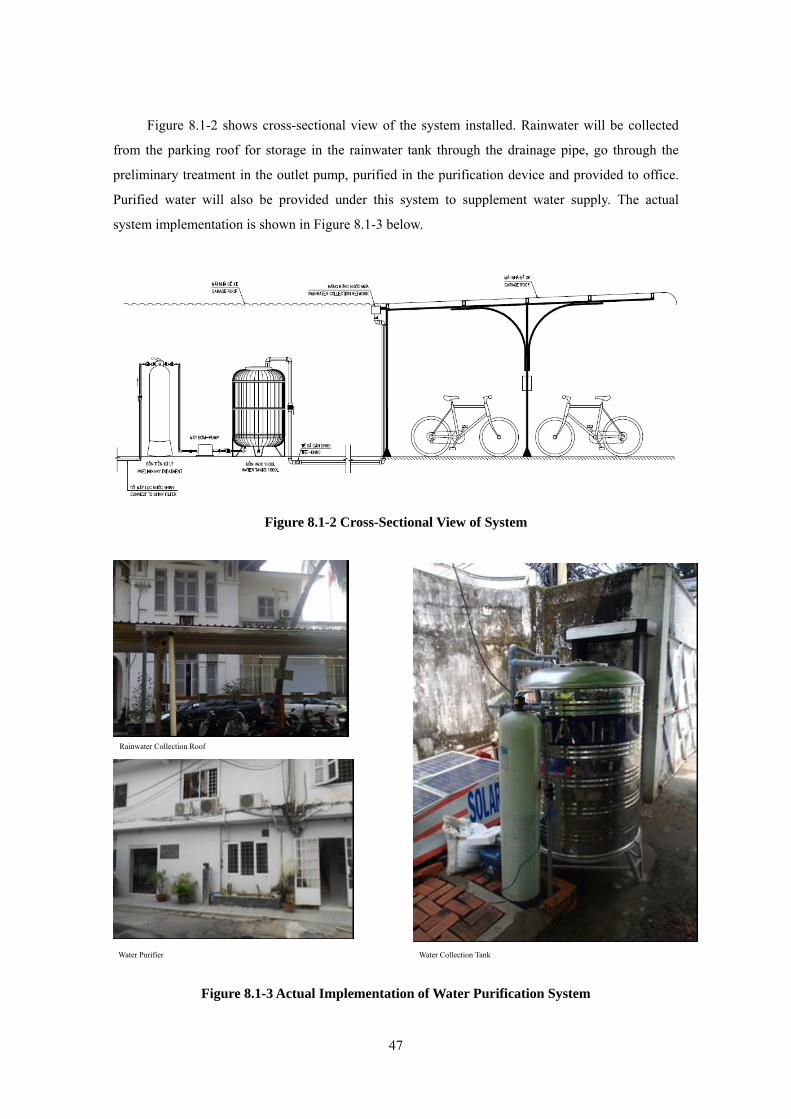
Figure 8.1-2 shows cross-sectional view of the system installed. Rainwater will be collected
from the parking roof for storage in the rainwater tank through the drainage pipe, go through the
preliminary treatment in the outlet pump, purified in the purification device and provided to office.
Purified water will also be provided under this system to supplement water supply. The actual
system implementation is shown in Figure 8.1-3 below.
Figure 8.1-2 Cross-Sectional View of System
Figure 8.1-3 Actual Implementation of Water Purification System
Water Collection Tank
Rainwater Collection Roof
Water Purifier
47
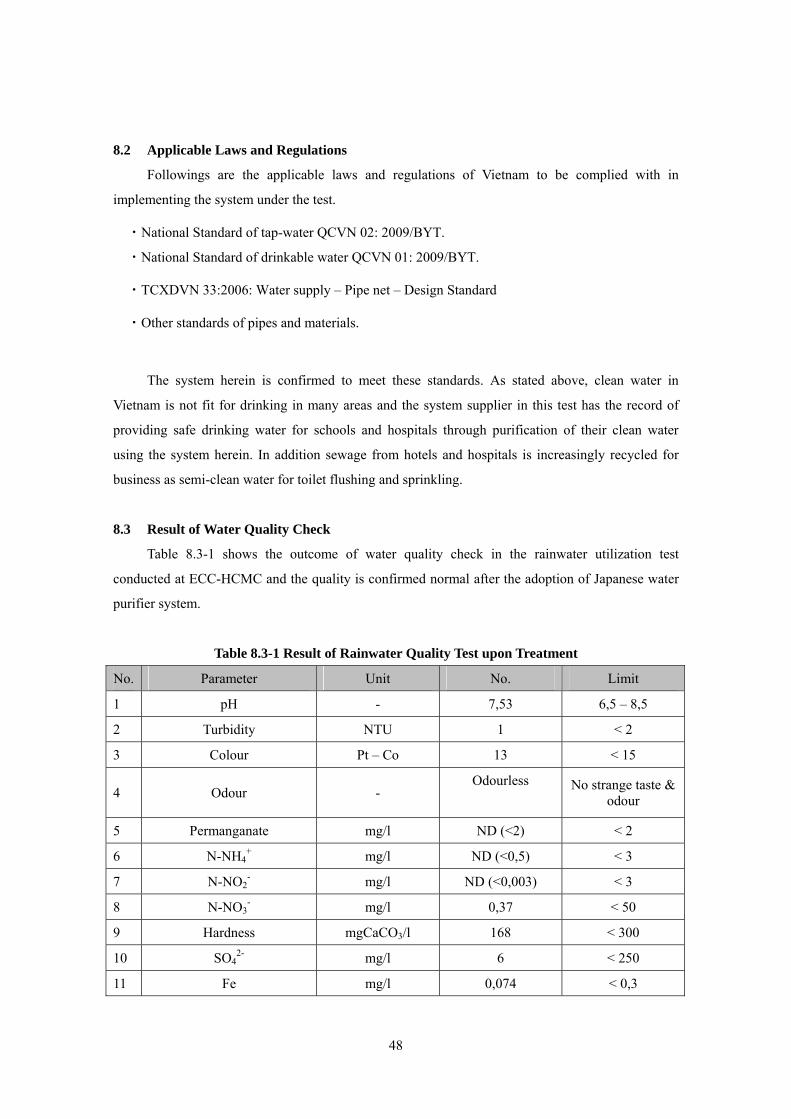
8.2 Applicable Laws and Regulations
Followings are the applicable laws and regulations of Vietnam to be complied with in
implementing the system under the test.
・National Standard of tap-water QCVN 02: 2009/BYT.
・National Standard of drinkable water QCVN 01: 2009/BYT.
・TCXDVN 33:2006: Water supply – Pipe net – Design Standard
・Other standards of pipes and materials.
The system herein is confirmed to meet these standards. As stated above, clean water in
Vietnam is not fit for drinking in many areas and the system supplier in this test has the record of
providing safe drinking water for schools and hospitals through purification of their clean water
using the system herein. In addition sewage from hotels and hospitals is increasingly recycled for
business as semi-clean water for toilet flushing and sprinkling.
8.3 Result of Water Quality Check
Table 8.3-1 shows the outcome of water quality check in the rainwater utilization test
conducted at ECC-HCMC and the quality is confirmed normal after the adoption of Japanese water
purifier system.
Table 8.3-1 Result of Rainwater Quality Test upon Treatment
No. Parameter Unit No. Limit
1 pH - 7,53 6,5 – 8,5
2 Turbidity NTU 1 < 2
3 Colour Pt – Co 13 < 15
4 Odour - Odourless
No strange taste &
odour
5 Permanganate mg/l ND (<2) < 2
6 N-NH4+ mg/l ND (<0,5) < 3
7 N-NO2- mg/l ND (<0,003) < 3
8 N-NO3- mg/l 0,37 < 50
9 Hardness mgCaCO3/l 168 < 300
10 SO42- mg/l 6 < 250
11 Fe mg/l 0,074 < 0,3
48
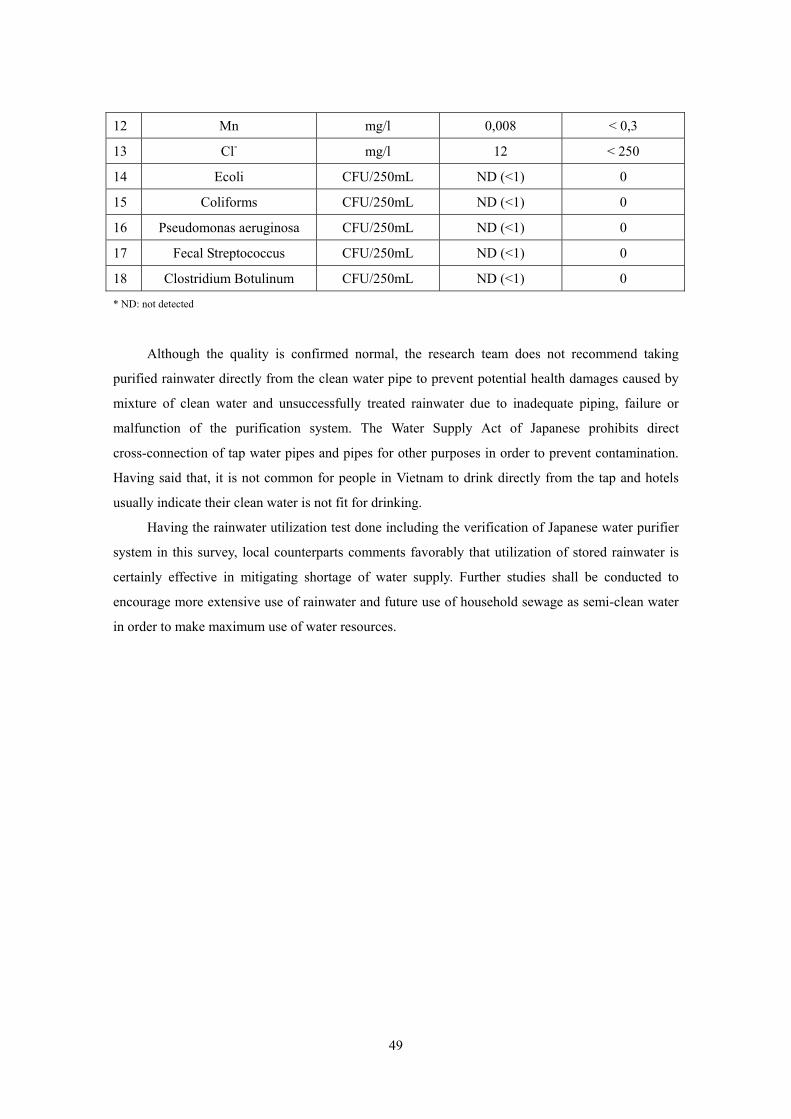
12 Mn mg/l 0,008 < 0,3
13 Cl- mg/l 12 < 250
14 Ecoli CFU/250mL ND (<1) 0
15 Coliforms CFU/250mL ND (<1) 0
16 Pseudomonas aeruginosa CFU/250mL ND (<1) 0
17 Fecal Streptococcus CFU/250mL ND (<1) 0
18 Clostridium Botulinum CFU/250mL ND (<1) 0
* ND: not detected
Although the quality is confirmed normal, the research team does not recommend taking
purified rainwater directly from the clean water pipe to prevent potential health damages caused by
mixture of clean water and unsuccessfully treated rainwater due to inadequate piping, failure or
malfunction of the purification system. The Water Supply Act of Japanese prohibits direct
cross-connection of tap water pipes and pipes for other purposes in order to prevent contamination.
Having said that, it is not common for people in Vietnam to drink directly from the tap and hotels
usually indicate their clean water is not fit for drinking.
Having the rainwater utilization test done including the verification of Japanese water purifier
system in this survey, local counterparts comments favorably that utilization of stored rainwater is
certainly effective in mitigating shortage of water supply. Further studies shall be conducted to
encourage more extensive use of rainwater and future use of household sewage as semi-clean water
in order to make maximum use of water resources.
49
Chapter 9 Consideration of Finance Scheme in Promoting Energy & Water-Saving Equipments
Vietnam has been faced with shortfall of energy, especially electricity due to rapid economic
growth and the Government of Vietnam has encouraged energy-saving initiatives t such issues. It is
urgently needed to set up a finance scheme to support energy-saving initiatives.
Despite cash-out from new energy-saving facilities, absence of direct cash flow from facility
investment makes it difficult to visualize energy-saving effect and such difficulty is probably one of
the obstacles to establishing a workable payout scheme. Taking such issues into account, we will
study energy-saving finance schemes including ESCO which makes apparent the monetary
advantage of energy-saving.
9.1 What is ESCO?
ESCO (Energy Service Company) is a scheme where all the principle energy-saving
renovation costs (including facility expenses, renovation fees and interests) are offset by the saving
of utility costs achieved through such renovation and ESCO provider offers funding-related services
as well as assessment of energy-saving effect, designing and construction, operation and
maintenance of energy-saving facilities. Clients (property owners etc) and ESCO provider sign a
energy-saving service agreement based on which the entire utility savings upon contract expiry shall
belong to the client.
Furthermore, ESCO project is characterized by the practice that ESCO provider guarantees the
effect of energy-saving to its client (performance guarantee). ESCO provider is consigned to manage
the entire process of construction, operation and management of the contract facility based on the
renovation plan drawn up upon energy-saving assessment. Should ESCO provider fail to achieve the
scheduled energy-saving effect at the time of contract and perform the expected utility saving ESCO
shall indemnify the client for losses based on the performance guarantee agreement. In this way
ESCO is a scheme of promoting energy-saving equipments through visualization of energy-saving
effects based on performance guarantee.
ESCO scheme is based on two types of contracts: Guaranteed Savings Agreement where client
(property owner) bears the initial renovation costs and Shared Savings Agreement where the initial
renovation costs are borne by ESCO provider. The latter enables client to save facility investment in
the first business year as it is borne by ESCO provider which is to be paid out from energy-cost
savings.
ESCO projects have been adopted in Japan since 1990’s and the entire project size reached
JPY30billion in FY2011 (214 projects) evidencing assurance of ESCO in Japan as effective method
50
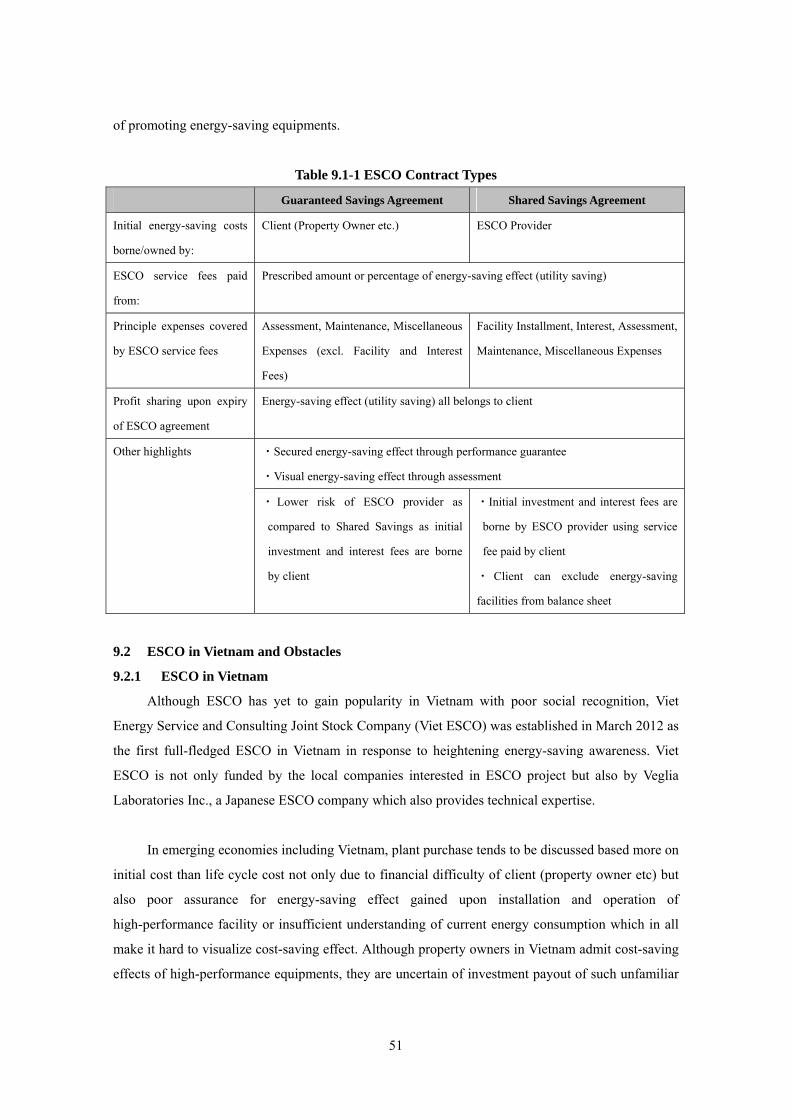
of promoting energy-saving equipments.
Table 9.1-1 ESCO Contract Types
Guaranteed Savings Agreement Shared Savings Agreement
Initial energy-saving costs
borne/owned by:
Client (Property Owner etc.) ESCO Provider
ESCO service fees paid
from:
Prescribed amount or percentage of energy-saving effect (utility saving)
Principle expenses covered
by ESCO service fees
Assessment, Maintenance, Miscellaneous
Expenses (excl. Facility and Interest
Fees)
Facility Installment, Interest, Assessment,
Maintenance, Miscellaneous Expenses
Profit sharing upon expiry
of ESCO agreement
Energy-saving effect (utility saving) all belongs to client
Other highlights ・Secured energy-saving effect through performance guarantee
・Visual energy-saving effect through assessment
・ Lower risk of ESCO provider as
compared to Shared Savings as initial
investment and interest fees are borne
by client
・Initial investment and interest fees are
borne by ESCO provider using service
fee paid by client
・ Client can exclude energy-saving
facilities from balance sheet
9.2 ESCO in Vietnam and Obstacles
9.2.1 ESCO in Vietnam
Although ESCO has yet to gain popularity in Vietnam with poor social recognition, Viet
Energy Service and Consulting Joint Stock Company (Viet ESCO) was established in March 2012 as
the first full-fledged ESCO in Vietnam in response to heightening energy-saving awareness. Viet
ESCO is not only funded by the local companies interested in ESCO project but also by Veglia
Laboratories Inc., a Japanese ESCO company which also provides technical expertise.
In emerging economies including Vietnam, plant purchase tends to be discussed based more on
initial cost than life cycle cost not only due to financial difficulty of client (property owner etc) but
also poor assurance for energy-saving effect gained upon installation and operation of
high-performance facility or insufficient understanding of current energy consumption which in all
make it hard to visualize cost-saving effect. Although property owners in Vietnam admit cost-saving
effects of high-performance equipments, they are uncertain of investment payout of such unfamiliar
51

new technology and therefore they tend to refrain from making huge investments and seek
alternatives with low initial costs.
ESCO will certainly encourage property owners to make investment decisions by providing
clear energy-saving effects evidenced through energy-saving assessment and verification of effects
as well as performance guarantee and (in case of Shared Savings Agreement) exemption from initial
costs which in all enable property owners to better visualize cash flow.
9.2.2 Expansion of ESCO and Finance Related Obstacles
While ESCO is a finance scheme expected to promote energy-saving equipments, procurement
cost borne by ESCO provider gives rise to financial obstacles to the full-fledged growth of ESCO
due to two major reasons. Bank interest rates in Vietnam are historically high and there is additional
financial burden for ESCO providers to procure funds due to short business track record.
i) High Interest Rates in Vietnam
Under the Shared Savings Agreement, ESCO provider shall bear the initial costs on behalf of
property owner and bank loans may be taken out should there be shortfall in own capital. Given the
permanently high loan interest rate of over 10% in Vietnam, ESCO provider needs to set high service
charge which reflects on the loan procurements costs. Similarly in case of Guaranteed Savings
Agreement, client itself bears high interest rate which poses financial hurdle to purchasing
energy-saving equipments.
8
10
12
14
16
18
20
Jan-2003
Jan-2004
Jan-2005
Jan-2006
Jan-2007
Jan-2008
Jan-2009
Jan-2010
Jan-2011
Jan-2012
Jan-2013
%
Source: Bloomberg (Original Source: IMF)
Figure 9.2-1 Historic Performance of Loan Rates in Vietnam16
16 Average Short-Term Loan Rates of Four Major National Commercial Banks of Vietnam
52

ii) Poor Funding Capacity of ESCO Provider
In many emerging economies including Vietnam, it is hard to take out bank loans for ESCO
project and procurement cost is high due to very little recognition or reputation of ESCO resulting in
insufficient track record and lack of corporate strength and credibility of ESCO provider.
Ordinary costs of energy-saving facilities primarily consist of service and maintenance fees
and interest charges in both cases of plant investment using client’s own capital or Shared Savings
Agreement. Provided that there is no significant difference in service and maintenance costs,
difference in procurement costs affect client’s burden which means success of ESCO proposal is
heavily dependent on offering as favorable finance scheme as possible.
Keeping the above in mind, it is crucial to support in procuring favorable finance terms and
build on the track record in order to clear the obstacles to fund procurement faced by ESCO provider,
raise awareness of ESCO model and put it on smooth track.
9.3 Japanese Government’s Assistance
There are various schemes provided by the Japanese Government for private companies to
promote the Joint Crediting Mechanism. We will take up finance-related assistance provided by the
Japanese Government contributing to raise awareness of ESCO and energy-saving equipments other
than direct assistance for JCM project.
9.3.1 Support Program to Respond to Climate Change (JICA)
The Support Program to Respond to Climate Change advocated by JICA is aimed at
strengthening approach taken by the Vietnamese Government to cope with climate change in
consideration for the policies advocated under the “National Target Program to Respond to Climate
Change (2009~2015): NTP-RCC” by the Vietnamese Government in 2008. The Program consists of
three terms; 1st term of 2010, 2nd term of 2011 and 3rd term during which Yen Loan Agreement was
signed between JICA and the Vietnamese Government in March 2013 disbursing scheduled
JPY15billion.
53
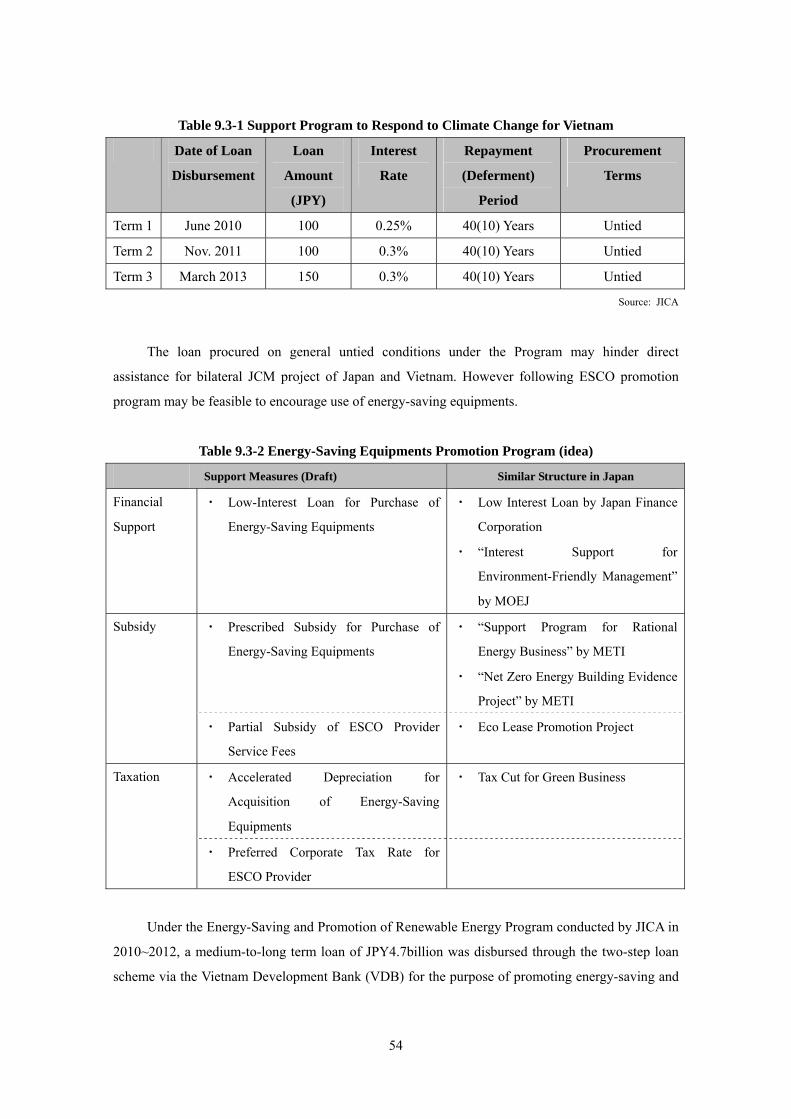
Table 9.3-1 Support Program to Respond to Climate Change for Vietnam
Date of Loan
Disbursement
Loan
Amount
(JPY)
Interest
Rate
Repayment
(Deferment)
Period
Procurement
Terms
Term 1 June 2010 100 0.25% 40(10) Years Untied
Term 2 Nov. 2011 100 0.3% 40(10) Years Untied
Term 3 March 2013 150 0.3% 40(10) Years Untied
Source: JICA
The loan procured on general untied conditions under the Program may hinder direct
assistance for bilateral JCM project of Japan and Vietnam. However following ESCO promotion
program may be feasible to encourage use of energy-saving equipments.
Table 9.3-2 Energy-Saving Equipments Promotion Program (idea)
Support Measures (Draft) Similar Structure in Japan
Financial
Support
・ Low-Interest Loan for Purchase of
Energy-Saving Equipments
・ Low Interest Loan by Japan Finance
Corporation
・ “Interest Support for
Environment-Friendly Management”
by MOEJ
Subsidy ・ Prescribed Subsidy for Purchase of
Energy-Saving Equipments
・ “Support Program for Rational
Energy Business” by METI
・ “Net Zero Energy Building Evidence
Project” by METI
・ Partial Subsidy of ESCO Provider
Service Fees
・ Eco Lease Promotion Project
Taxation ・ Accelerated Depreciation for
Acquisition of Energy-Saving
Equipments
・ Tax Cut for Green Business
・ Preferred Corporate Tax Rate for
ESCO Provider
Under the Energy-Saving and Promotion of Renewable Energy Program conducted by JICA in
2010~2012, a medium-to-long term loan of JPY4.7billion was disbursed through the two-step loan
scheme via the Vietnam Development Bank (VDB) for the purpose of promoting energy-saving and
54
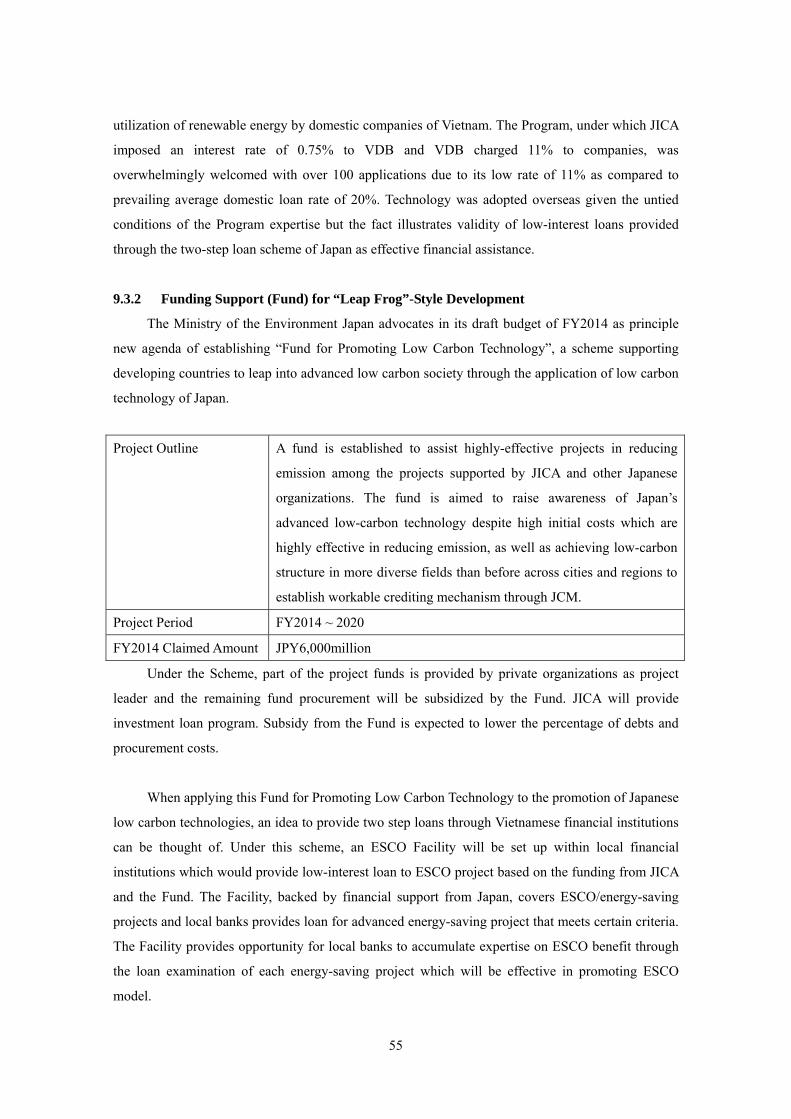
utilization of renewable energy by domestic companies of Vietnam. The Program, under which JICA
imposed an interest rate of 0.75% to VDB and VDB charged 11% to companies, was
overwhelmingly welcomed with over 100 applications due to its low rate of 11% as compared to
prevailing average domestic loan rate of 20%. Technology was adopted overseas given the untied
conditions of the Program expertise but the fact illustrates validity of low-interest loans provided
through the two-step loan scheme of Japan as effective financial assistance.
9.3.2 Funding Support (Fund) for “Leap Frog”-Style Development
The Ministry of the Environment Japan advocates in its draft budget of FY2014 as principle
new agenda of establishing “Fund for Promoting Low Carbon Technology”, a scheme supporting
developing countries to leap into advanced low carbon society through the application of low carbon
technology of Japan.
Project Outline A fund is established to assist highly-effective projects in reducing
emission among the projects supported by JICA and other Japanese
organizations. The fund is aimed to raise awareness of Japan’s
advanced low-carbon technology despite high initial costs which are
highly effective in reducing emission, as well as achieving low-carbon
structure in more diverse fields than before across cities and regions to
establish workable crediting mechanism through JCM.
Project Period FY2014 ~ 2020
FY2014 Claimed Amount JPY6,000million
Under the Scheme, part of the project funds is provided by private organizations as project
leader and the remaining fund procurement will be subsidized by the Fund. JICA will provide
investment loan program. Subsidy from the Fund is expected to lower the percentage of debts and
procurement costs.
When applying this Fund for Promoting Low Carbon Technology to the promotion of Japanese
low carbon technologies, an idea to provide two step loans through Vietnamese financial institutions
can be thought of. Under this scheme, an ESCO Facility will be set up within local financial
institutions which would provide low-interest loan to ESCO project based on the funding from JICA
and the Fund. The Facility, backed by financial support from Japan, covers ESCO/energy-saving
projects and local banks provides loan for advanced energy-saving project that meets certain criteria.
The Facility provides opportunity for local banks to accumulate expertise on ESCO benefit through
the loan examination of each energy-saving project which will be effective in promoting ESCO
model.
55

Low Carbon Technology
Promotion Fund
JICA
VietnamFinancial institution (bank)
loansubsidy
Company A
(conducts ESCO project)Company B
(ESCO project)・・・・
Low interest loan
ESCOFacility
Japanese
Technology providerSales of equipment
ESCO provider ESCO service( guaranteed savings contract)
Figure 9.3-2 Example of an ESCO Support Program: Two-Step Loan
9.3.3 ADB Trust Fund
As part of the “Leap Frog”-style funding support advocated by the Ministry of the
Environment Japan, funding from ADB Trust Fund is discussed in addition to the above fund idea in
order to subsidize advanced low carbon technology which is yet to be adopted due to high initial
cost.
Project Outline The contribution to ADB trust fund will be used to encourage
advanced technology currently unpopular due to high costs to be
adopted in ADB projects by supplementing additional costs. The
project is aimed at a leap transition into low-carbon society through
ADB development support as well as establishment of JCM crediting
scheme.
Project Period FY2014~2020
FY2014 Claimed Amount JPY3,000million
There are 50 over facilities provided by ADB including trust and other funds, among which is
the Clean Energy Financing Partnership Facility (CEFPF) set up in 2007 aiming at strengthening
energy guarantee in developing countries and combating climate change. The Facility is utilized for
promotion of clean energy development and covers ESCO. On top of this Facility, newly-established
trust fund will help supporting ESCO project promoting advanced energy-saving initiatives.
9.4 Finance Scheme for Water-Saving Equipments
In this section, we will study the potential availability of ESCO and business feasibility of
56
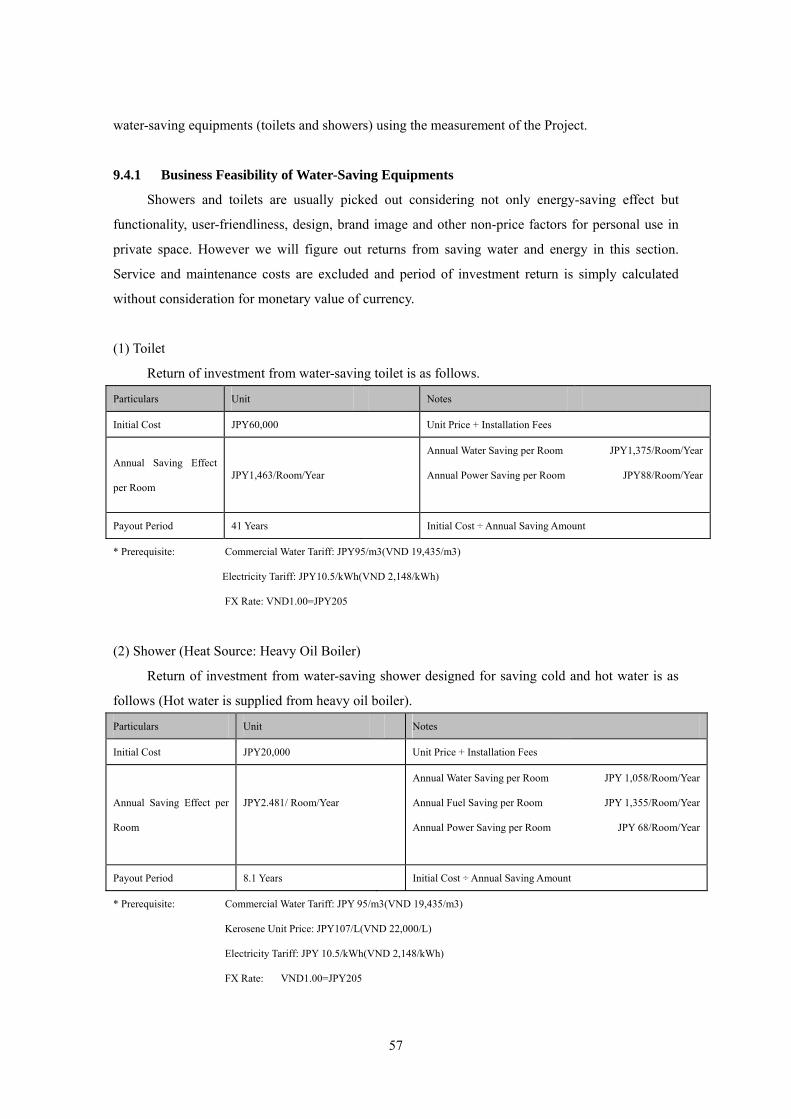
water-saving equipments (toilets and showers) using the measurement of the Project.
9.4.1 Business Feasibility of Water-Saving Equipments
Showers and toilets are usually picked out considering not only energy-saving effect but
functionality, user-friendliness, design, brand image and other non-price factors for personal use in
private space. However we will figure out returns from saving water and energy in this section.
Service and maintenance costs are excluded and period of investment return is simply calculated
without consideration for monetary value of currency.
(1) Toilet
Return of investment from water-saving toilet is as follows.
Particulars Unit Notes
Initial Cost JPY60,000 Unit Price + Installation Fees
Annual Saving Effect
per Room JPY1,463/Room/Year
Annual Water Saving per Room
Annual Power Saving per Room
JPY1,375/Room/Year
JPY88/Room/Year
Payout Period 41 Years Initial Cost ÷ Annual Saving Amount
* Prerequisite: Commercial Water Tariff: JPY95/m3(VND 19,435/m3)
Electricity Tariff: JPY10.5/kWh(VND 2,148/kWh)
FX Rate: VND1.00=JPY205
(2) Shower (Heat Source: Heavy Oil Boiler)
Return of investment from water-saving shower designed for saving cold and hot water is as
follows (Hot water is supplied from heavy oil boiler).
Particulars Unit Notes
Initial Cost JPY20,000 Unit Price + Installation Fees
Annual Saving Effect per
Room
JPY2.481/ Room/Year
Annual Water Saving per Room
Annual Fuel Saving per Room
Annual Power Saving per Room
JPY 1,058/Room/Year
JPY 1,355/Room/Year
JPY 68/Room/Year
Payout Period 8.1 Years Initial Cost ÷ Annual Saving Amount
* Prerequisite: Commercial Water Tariff: JPY 95/m3(VND 19,435/m3)
Kerosene Unit Price: JPY107/L(VND 22,000/L)
Electricity Tariff: JPY 10.5/kWh(VND 2,148/kWh)
FX Rate: VND1.00=JPY205
57

(3) Shower (Heat Source: Electric Boiler)
Return of investment from water-saving shower designed for saving cold and hot water is as
follows (Hot water is supplied from electric boiler).
Particulars Unit Notes
Initial Cost JPY20,000 Unit Price + Installation Fees
Annual Saving Effect per
Room 2,563/Room/Year
Annual Water Saving per Room
Annual Power Saving per Room
(Electric Boiler)
Annual Power Saving per Room
(In-House Water Supply)
JPY 1,058/Room/Year
JPY 1,437/Room/Year
JPY 68/Room/Year
Payout Period 7.8 Years Initial Cost ÷ Annual Saving Amount
* Prerequisite: Commercial Water Tariff: JPY 95/m3(VND 19,435/m3)
Electricity Tariff: JPY 10.5/kWh(VND 2,148/kWh)
FX Rate: VND1.00=JPY205
Payout period of water-saving toilet tends to be longer due to small saving effect per unit
gained mainly from saving water consumption whereas greater saving effect is expected for shower
from heating power cut. Figures derived from our calculation indicates that there is little difference
in the period of collection for both heavy oil boiler widely used at hotels in Ho Chi Minh City and
electric boiler which is less common as compared to heavy oil boiler.
9.4.2 Business Feasibility of ESCO
Considering the fitness of ESCO as effective finance scheme to promote water-saving facilities,
we will study the potential of its application to water-saving equipments. Setting aside the toilet due
to extremely prolonged payout period from water-saving, we will take up the shower from which
energy-saving should be achieved from heat-saving as well. ESCO is presumed to be in the form of
Guaranteed Savings Agreement (under which initial costs shall be borne by clients) which is more
common in developing economies.
In addition to the base case estimation where no financial subsidy is available for ESCO
project, another case will be studied based on the assumed financial assistance.
(1) Base Case Estimation
Followings are the prerequisites for the base case.
58
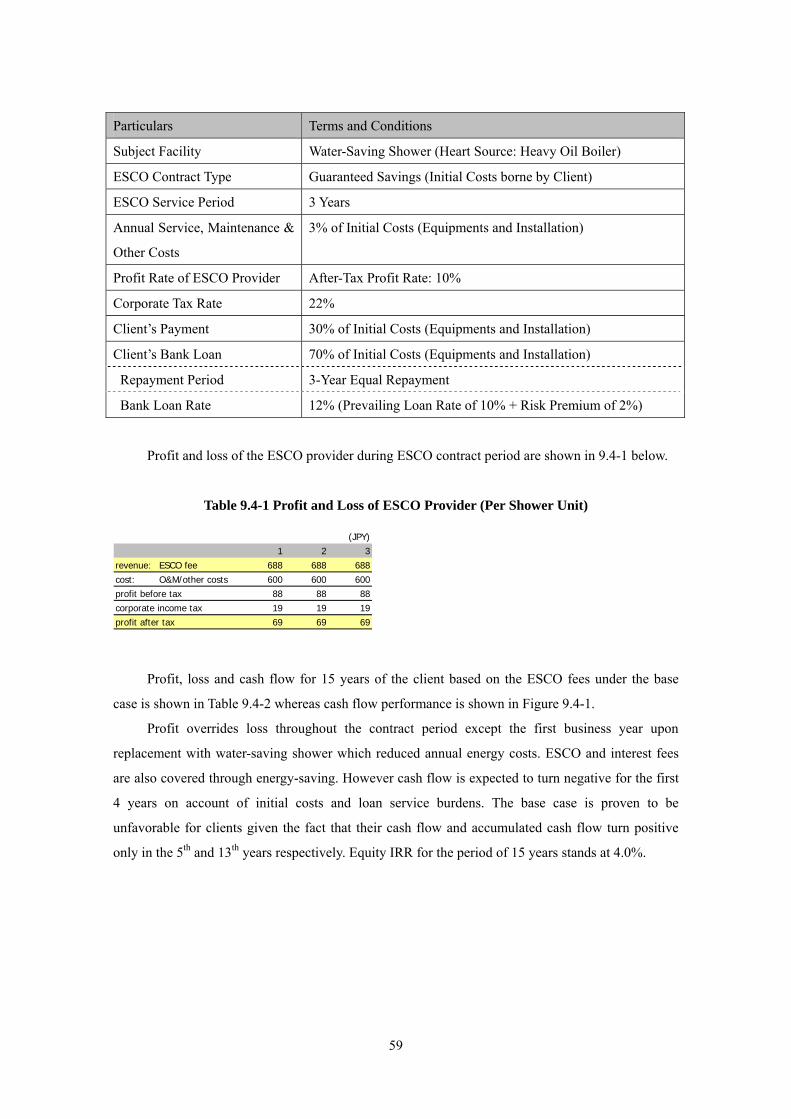
Particulars Terms and Conditions
Subject Facility Water-Saving Shower (Heart Source: Heavy Oil Boiler)
ESCO Contract Type Guaranteed Savings (Initial Costs borne by Client)
ESCO Service Period 3 Years
Annual Service, Maintenance &
Other Costs
3% of Initial Costs (Equipments and Installation)
Profit Rate of ESCO Provider After-Tax Profit Rate: 10%
Corporate Tax Rate 22%
Client’s Payment 30% of Initial Costs (Equipments and Installation)
Client’s Bank Loan 70% of Initial Costs (Equipments and Installation)
Repayment Period 3-Year Equal Repayment
Bank Loan Rate 12% (Prevailing Loan Rate of 10% + Risk Premium of 2%)
Profit and loss of the ESCO provider during ESCO contract period are shown in 9.4-1 below.
Table 9.4-1 Profit and Loss of ESCO Provider (Per Shower Unit)
(JPY)1 2 3
revenue: ESCO fee 688 688 688cost: O&M/other costs 600 600 600profit before tax 88 88 88corporate income tax 19 19 19profit after tax 69 69 69
Profit, loss and cash flow for 15 years of the client based on the ESCO fees under the base
case is shown in Table 9.4-2 whereas cash flow performance is shown in Figure 9.4-1.
Profit overrides loss throughout the contract period except the first business year upon
replacement with water-saving shower which reduced annual energy costs. ESCO and interest fees
are also covered through energy-saving. However cash flow is expected to turn negative for the first
4 years on account of initial costs and loan service burdens. The base case is proven to be
unfavorable for clients given the fact that their cash flow and accumulated cash flow turn positive
only in the 5th and 13th years respectively. Equity IRR for the period of 15 years stands at 4.0%.
59
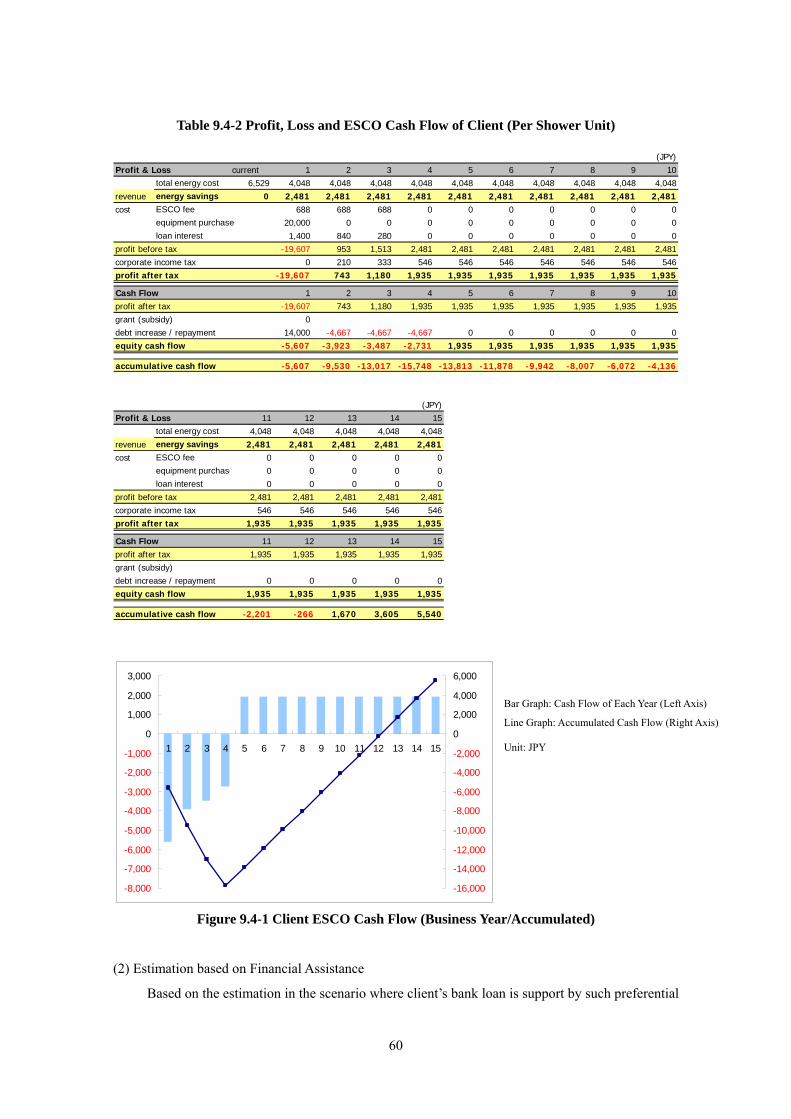
Table 9.4-2 Profit, Loss and ESCO Cash Flow of Client (Per Shower Unit)
(JPY)Profit & Loss current 1 2 3 4 5 6 7 8 9
total energy cost 6,529 4,048 4,048 4,048 4,048 4,048 4,048 4,048 4,048 4,048 4,048revenue energy savings 0 2,481 2,481 2,481 2,481 2,481 2,481 2,481 2,481 2,481 2,481cost ESCO fee 688 688 688 0 0 0 0 0 0 0
equipment purchase 20,000 0 0 0 0 0 0 0 0 0loan interest 1,400 840 280 0 0 0 0 0 0 0
profit before tax
10
953 1,513 2,481 2,481 2,481 2,481 2,481 2,481 2,481corporate income tax 0 210 333 546 546 546 546 546 546 546profit after tax 743 1,180 1,935 1,935 1,935 1,935 1,935 1,935 1,935
Cash Flow 1 2 3 4 5 6 7 8 9 10profit after tax 743 1,180 1,935 1,935 1,935 1,935 1,935 1,935 1,935grant (subsidy) 0debt increase / repayment 14,000 0 0 0 0 0 0equity cash flow 1,935 1,935 1,935 1,935 1,935 1,935
accumulative cash flow
-19,607
-19,607
-19,607
-4,667 -4,667 -4,667-5,607 -3,923 -3,487 -2,731
-5,607 -9,530 -13,017 -15,748 -13,813 -11,878 -9,942 -8,007 -6,072 -4,136
(JPY)Profit & Loss 11 12 13 14 15
total energy cost 4,048 4,048 4,048 4,048 4,048revenue energy savings 2,481 2,481 2,481 2,481 2,481cost ESCO fee 0 0 0 0 0
equipment purchase 0 0 0 0 0loan interest 0 0 0 0 0
profit before tax 2,481 2,481 2,481 2,481 2,481corporate income tax 546 546 546 546 546profit after tax 1,935 1,935 1,935 1,935 1,935
Cash Flow 11 12 13 14 15profit after tax 1,935 1,935 1,935 1,935 1,935grant (subsidy)debt increase / repayment 0 0 0 0 0equity cash flow 1,935 1,935 1,935 1,935 1,935
accumulative cash flow -2,201 -266 1,670 3,605 5,540
-8,000
-7,000
-6,000
-5,000
-4,000
-3,000
-2,000
-1,000
-16,000
-14,000
-12,000
-10,000
-8,000
-6,000
-4,000
-2,000
0
1,000
2,000
3,000
1 2 3 4 5 6 7 8 9 10 11 12 13 14 150
2,000
4,000
6,000
Line Graph: Accumulated Cash Flow (Right Axis)
Unit: JPY
Bar Graph: Cash Flow of Each Year (Left Axis)
Figure 9.4-1 Client ESCO Cash Flow (Business Year/Accumulated)
(2) Estimation based on Financial Assistance
Based on the estimation in the scenario where client’s bank loan is support by such preferential
60
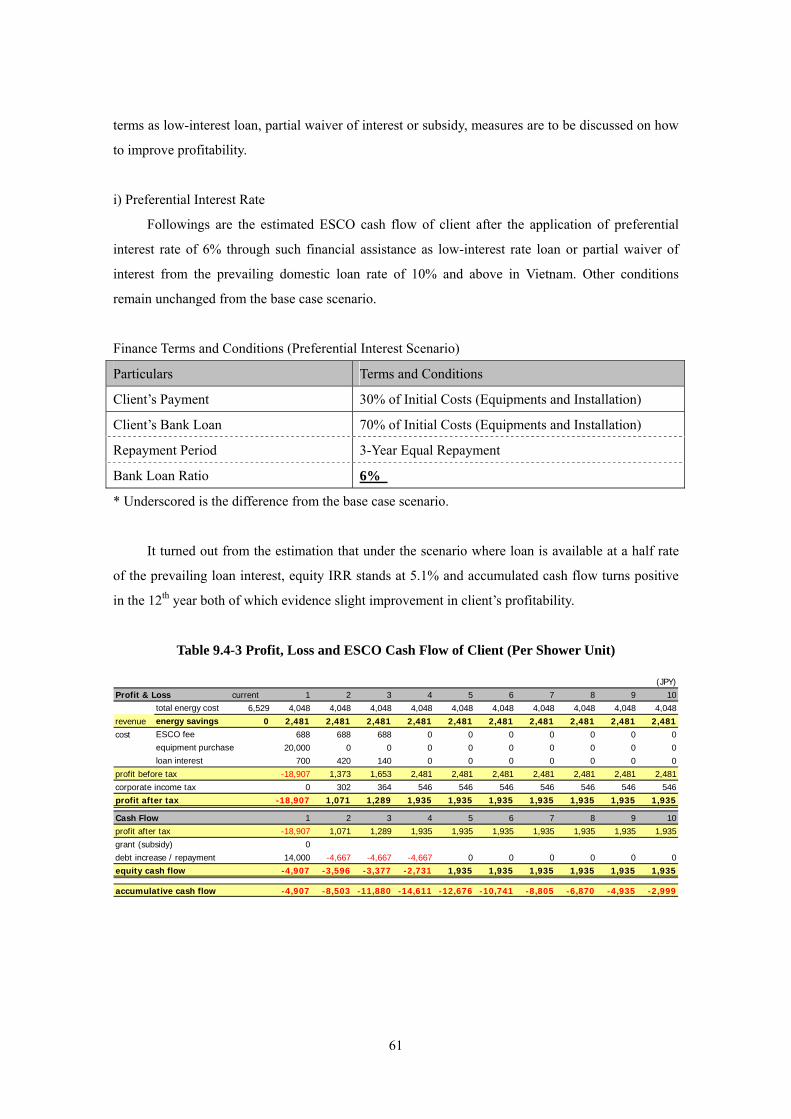
terms as low-interest loan, partial waiver of interest or subsidy, measures are to be discussed on how
to improve profitability.
i) Preferential Interest Rate
Followings are the estimated ESCO cash flow of client after the application of preferential
interest rate of 6% through such financial assistance as low-interest rate loan or partial waiver of
interest from the prevailing domestic loan rate of 10% and above in Vietnam. Other conditions
remain unchanged from the base case scenario.
Finance Terms and Conditions (Preferential Interest Scenario)
Particulars Terms and Conditions
Client’s Payment 30% of Initial Costs (Equipments and Installation)
Client’s Bank Loan 70% of Initial Costs (Equipments and Installation)
Repayment Period 3-Year Equal Repayment
Bank Loan Ratio 6%
* Underscored is the difference from the base case scenario.
It turned out from the estimation that under the scenario where loan is available at a half rate
of the prevailing loan interest, equity IRR stands at 5.1% and accumulated cash flow turns positive
in the 12th year both of which evidence slight improvement in client’s profitability.
Table 9.4-3 Profit, Loss and ESCO Cash Flow of Client (Per Shower Unit)
(JPY)Profit & Loss current 1 2 3 4 5 6 7 8 9
total energy cost 6,529 4,048 4,048 4,048 4,048 4,048 4,048 4,048 4,048 4,048 4,048revenue energy savings 0 2,481 2,481 2,481 2,481 2,481 2,481 2,481 2,481 2,481 2,481cost ESCO fee 688 688 688 0 0 0 0 0 0 0
equipment purchase 20,000 0 0 0 0 0 0 0 0 0loan interest 700 420 140 0 0 0 0 0 0 0
profit before tax
10
1,373 1,653 2,481 2,481 2,481 2,481 2,481 2,481 2,481corporate income tax 0 302 364 546 546 546 546 546 546 546profit after tax 1,071 1,289 1,935 1,935 1,935 1,935 1,935 1,935 1,935
Cash Flow 1 2 3 4 5 6 7 8 9 10profit after tax 1,071 1,289 1,935 1,935 1,935 1,935 1,935 1,935 1,935grant (subsidy) 0debt increase / repayment 14,000 0 0 0 0 0 0equity cash flow 1,935 1,935 1,935 1,935 1,935 1,935
accumulative cash flow
-18,907
-18,907
-18,907
-4,667 -4,667 -4,667-4,907 -3,596 -3,377 -2,731
-4,907 -8,503 -11,880 -14,611 -12,676 -10,741 -8,805 -6,870 -4,935 -2,999
61
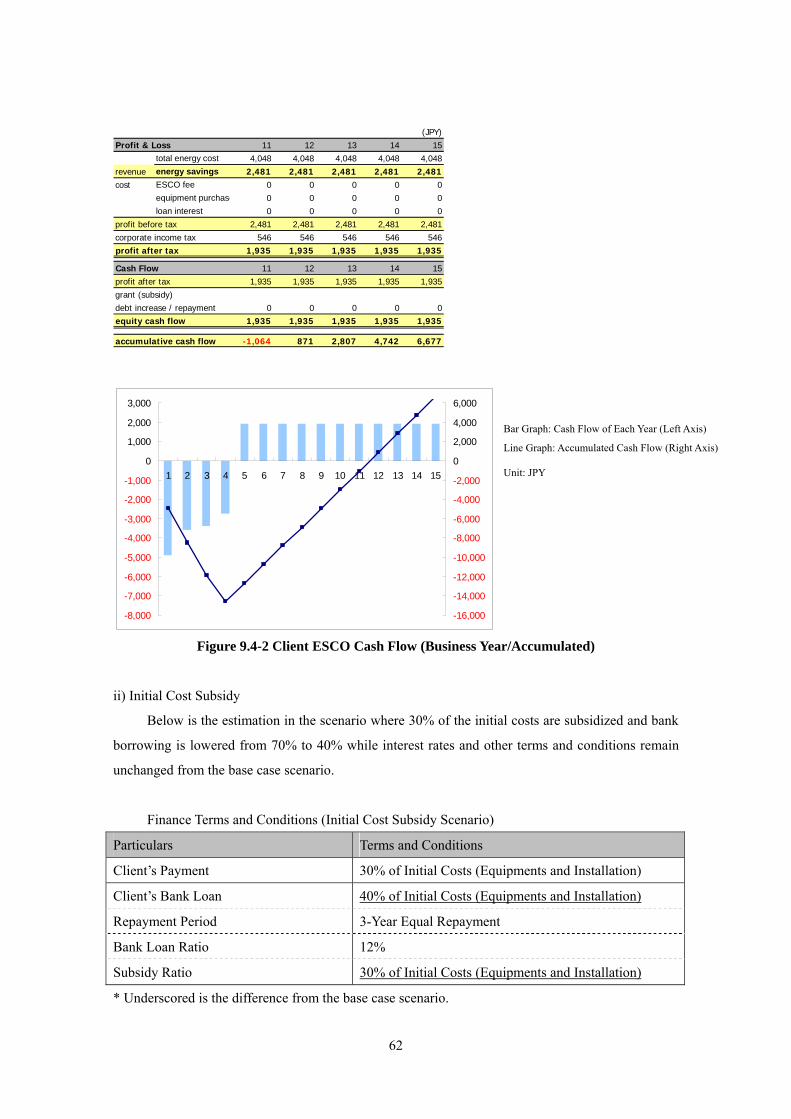
(JPY)Profit & Loss 11 12 13 14 15
total energy cost 4,048 4,048 4,048 4,048 4,048revenue energy savings 2,481 2,481 2,481 2,481 2,481cost ESCO fee 0 0 0 0 0
equipment purchase 0 0 0 0 0loan interest 0 0 0 0 0
profit before tax 2,481 2,481 2,481 2,481 2,481corporate income tax 546 546 546 546 546profit after tax 1,935 1,935 1,935 1,935 1,935
Cash Flow 11 12 13 14 15profit after tax 1,935 1,935 1,935 1,935 1,935grant (subsidy)debt increase / repayment 0 0 0 0 0equity cash flow 1,935 1,935 1,935 1,935 1,935
accumulative cash flow -1,064 871 2,807 4,742 6,677
-8,000
-7,000
-6,000
-5,000
-4,000
-3,000
-2,000
-1,000
-16,000
-14,000
-12,000
-10,000
-8,000
-6,000
-4,000
-2,000
0
1,000
2,000
3,000
1 2 3 4 5 6 7 8 9 10 11 12 13 14 150
2,000
4,000
6,000 Bar Graph: Cash Flow of Each Year (Left Axis)
Line Graph: Accumulated Cash Flow (Right Axis)
Unit: JPY
Figure 9.4-2 Client ESCO Cash Flow (Business Year/Accumulated)
ii) Initial Cost Subsidy
Below is the estimation in the scenario where 30% of the initial costs are subsidized and bank
borrowing is lowered from 70% to 40% while interest rates and other terms and conditions remain
unchanged from the base case scenario.
Finance Terms and Conditions (Initial Cost Subsidy Scenario)
Particulars Terms and Conditions
Client’s Payment 30% of Initial Costs (Equipments and Installation)
Client’s Bank Loan 40% of Initial Costs (Equipments and Installation)
Repayment Period 3-Year Equal Repayment
Bank Loan Ratio 12%
Subsidy Ratio 30% of Initial Costs (Equipments and Installation)
* Underscored is the difference from the base case scenario.
62

With the subsidy covering 30% of the initial investment, equity IRR significantly increases to
12.1%. There is a great leap from the base case scenario as accumulated cash flow turns positive in
the 9th year. However a period of 9 years to break even is generally deemed unaccepTable in making
investment decision.
Table 9.4-4 Profit, Loss and ESCO Cash Flow of Client (Per Shower Unit)
(JPY)Profit & Loss current 1 2 3 4 5 6 7 8 9
total energy cost 6,529 4,048 4,048 4,048 4,048 4,048 4,048 4,048 4,048 4,048 4,048revenue energy savings 0 2,481 2,481 2,481 2,481 2,481 2,481 2,481 2,481 2,481 2,481cost ESCO fee 688 688 688 0 0 0 0 0 0 0
equipment purchase 20,000 0 0 0 0 0 0 0 0 0loan interest 800 480 160 0 0 0 0 0 0 0
profit before tax
10
1,313 1,633 2,481 2,481 2,481 2,481 2,481 2,481 2,481corporate income tax 0 289 359 546 546 546 546 546 546 546profit after tax 1,024 1,274 1,935 1,935 1,935 1,935 1,935 1,935 1,935
Cash Flow 1 2 3 4 5 6 7 8 9 10profit after tax 1,024 1,274 1,935 1,935 1,935 1,935 1,935 1,935 1,935grant (subsidy) 6,000debt increase / repayment 8,000 0 0 0 0 0 0equity cash flow 1,935 1,935 1,935 1,935 1,935 1,935
accumulative cash flow 903 2,838
-19,007
-19,007
-19,007
-2,667 -2,667 -2,667-5,007 -1,643 -1,393 -731
-5,007 -6,650 -8,043 -8,774 -6,839 -4,903 -2,968 -1,033
(JPY)Profit & Loss 11 12 13 14 15
total energy cost 4,048 4,048 4,048 4,048 4,048revenue energy savings 2,481 2,481 2,481 2,481 2,481cost ESCO fee 0 0 0 0 0
equipment purchase 0 0 0 0 0loan interest 0 0 0 0 0
profit before tax 2,481 2,481 2,481 2,481 2,481corporate income tax 546 546 546 546 546profit after tax 1,935 1,935 1,935 1,935 1,935
Cash Flow 11 12 13 14 15profit after tax 1,935 1,935 1,935 1,935 1,935grant (subsidy)debt increase / repayment 0 0 0 0 0equity cash flow 1,935 1,935 1,935 1,935 1,935
accumulative cash flow 4,773 6,709 8,644 10,579 12,515
63
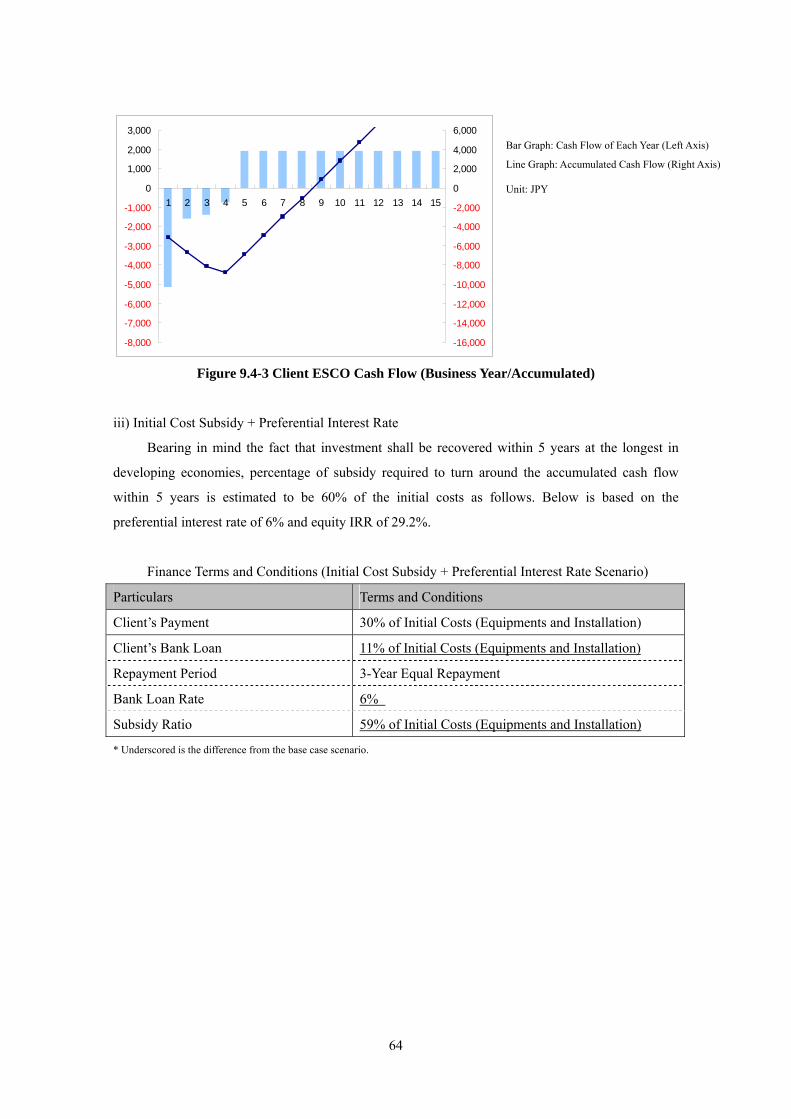
-8,000
-7,000
-6,000
-5,000
-4,000
-3,000
-2,000
-1,000
-16,000
-14,000
-12,000
-10,000
-8,000
-6,000
-4,000
-2,000
0
1,000
2,000
3,000
1 2 3 4 5 6 7 8 9 10 11 12 13 14 150
2,000
4,000
6,000
Unit: JPY
Bar Graph: Cash Flow of Each Year (Left Axis)
Line Graph: Accumulated Cash Flow (Right Axis)
Figure 9.4-3 Client ESCO Cash Flow (Business Year/Accumulated)
iii) Initial Cost Subsidy + Preferential Interest Rate
Bearing in mind the fact that investment shall be recovered within 5 years at the longest in
developing economies, percentage of subsidy required to turn around the accumulated cash flow
within 5 years is estimated to be 60% of the initial costs as follows. Below is based on the
preferential interest rate of 6% and equity IRR of 29.2%.
Finance Terms and Conditions (Initial Cost Subsidy + Preferential Interest Rate Scenario)
Particulars Terms and Conditions
Client’s Payment 30% of Initial Costs (Equipments and Installation)
Client’s Bank Loan 11% of Initial Costs (Equipments and Installation)
Repayment Period 3-Year Equal Repayment
Bank Loan Rate 6%
Subsidy Ratio 59% of Initial Costs (Equipments and Installation)
* Underscored is the difference from the base case scenario.
64
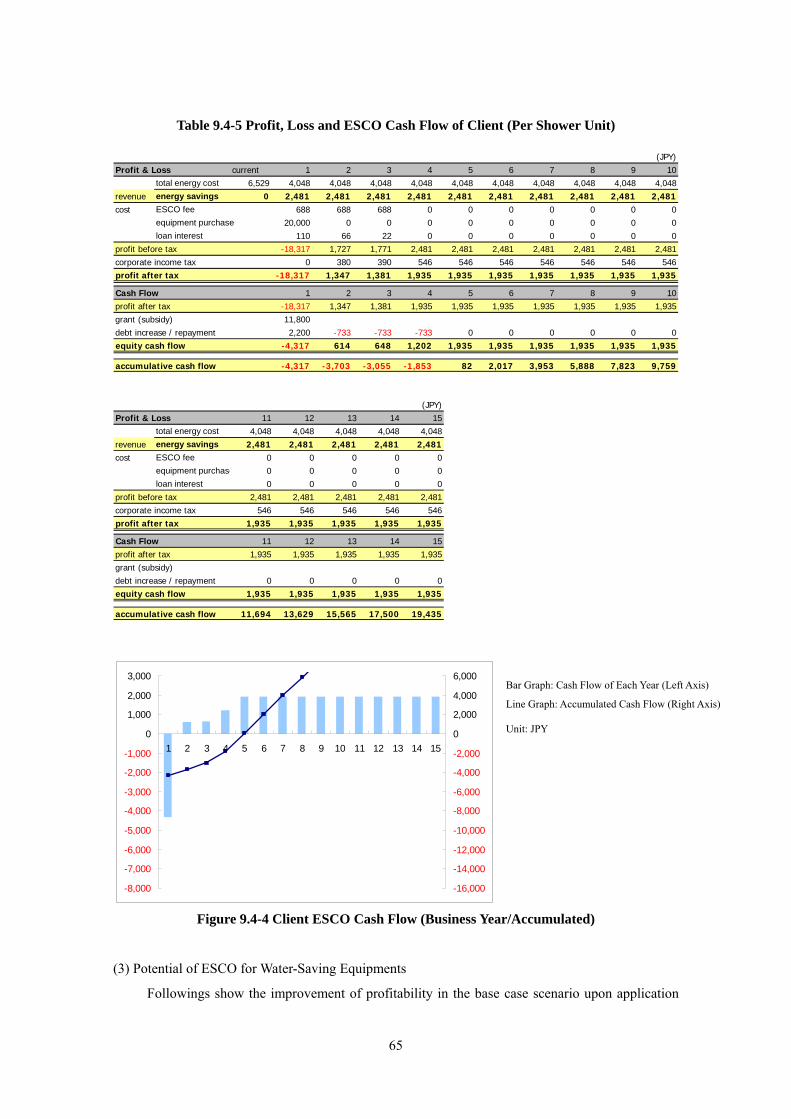
Table 9.4-5 Profit, Loss and ESCO Cash Flow of Client (Per Shower Unit)
(JPY)Profit & Loss current 1 2 3 4 5 6 7 8 9
total energy cost 6,529 4,048 4,048 4,048 4,048 4,048 4,048 4,048 4,048 4,048 4,048revenue energy savings 0 2,481 2,481 2,481 2,481 2,481 2,481 2,481 2,481 2,481 2,481cost ESCO fee 688 688 688 0 0 0 0 0 0 0
equipment purchase 20,000 0 0 0 0 0 0 0 0 0loan interest 110 66 22 0 0 0 0 0 0 0
profit before tax
10
1,727 1,771 2,481 2,481 2,481 2,481 2,481 2,481 2,481corporate income tax 0 380 390 546 546 546 546 546 546 546profit after tax 1,347 1,381 1,935 1,935 1,935 1,935 1,935 1,935 1,935
Cash Flow 1 2 3 4 5 6 7 8 9 10profit after tax 1,347 1,381 1,935 1,935 1,935 1,935 1,935 1,935 1,935grant (subsidy) 11,800debt increase / repayment 2,200 0 0 0 0 0 0equity cash flow 614 648 1,202 1,935 1,935 1,935 1,935 1,935 1,935
accumulative cash flow 82 2,017 3,953 5,888 7,823 9,759
-18,317
-18,317
-18,317
-733 -733 -733-4,317
-4,317 -3,703 -3,055 -1,853
(JPY)Profit & Loss 11 12 13 14 15
total energy cost 4,048 4,048 4,048 4,048 4,048revenue energy savings 2,481 2,481 2,481 2,481 2,481cost ESCO fee 0 0 0 0 0
equipment purchase 0 0 0 0 0loan interest 0 0 0 0 0
profit before tax 2,481 2,481 2,481 2,481 2,481corporate income tax 546 546 546 546 546profit after tax 1,935 1,935 1,935 1,935 1,935
Cash Flow 11 12 13 14 15profit after tax 1,935 1,935 1,935 1,935 1,935grant (subsidy)debt increase / repayment 0 0 0 0 0equity cash flow 1,935 1,935 1,935 1,935 1,935
accumulative cash flow 11,694 13,629 15,565 17,500 19,435
-8,000
-7,000
-6,000
-5,000
-4,000
-3,000
-2,000
-1,000
-16,000
-14,000
-12,000
-10,000
-8,000
-6,000
-4,000
-2,000
0
1,000
2,000
3,000
1 2 3 4 5 6 7 8 9 10 11 12 13 14 150
2,000
4,000
6,000Bar Graph: Cash Flow of Each Year (Left Axis)
Line Graph: Accumulated Cash Flow (Right Axis)
Unit: JPY
Figure 9.4-4 Client ESCO Cash Flow (Business Year/Accumulated)
(3) Potential of ESCO for Water-Saving Equipments
Followings show the improvement of profitability in the base case scenario upon application
65
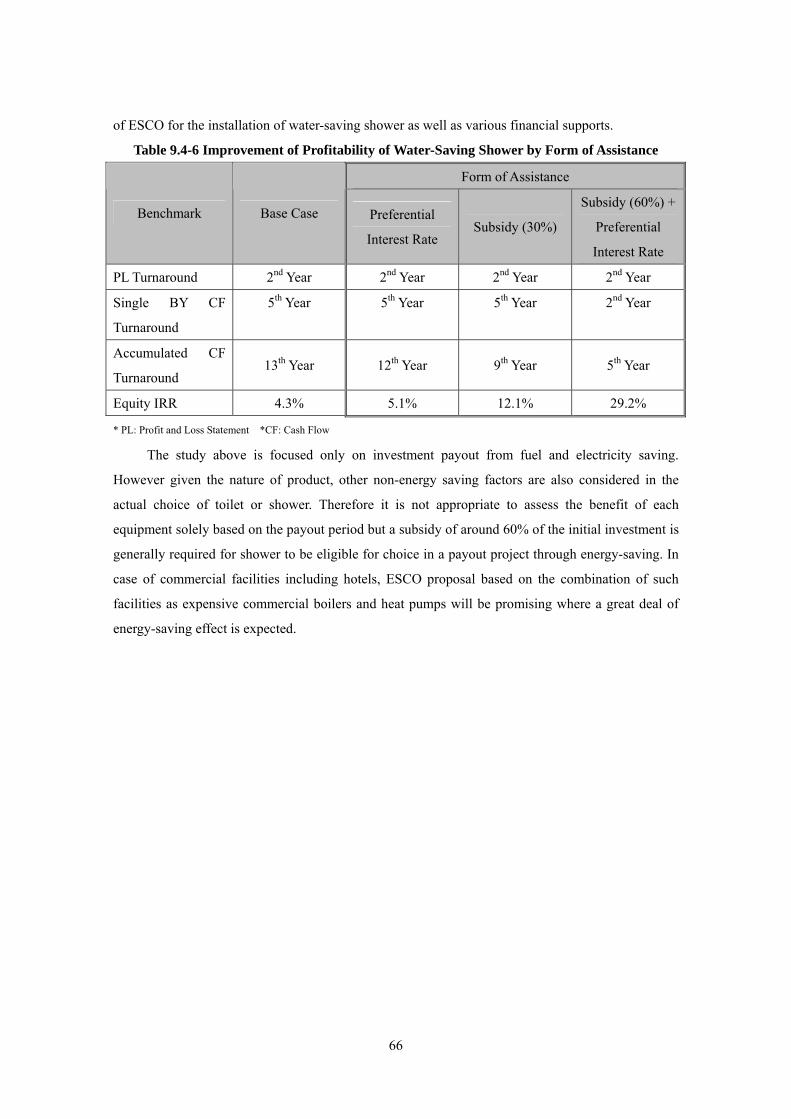
of ESCO for the installation of water-saving shower as well as various financial supports.
Table 9.4-6 Improvement of Profitability of Water-Saving Shower by Form of Assistance
Form of Assistance
Benchmark Base Case Preferential
Interest Rate Subsidy (30%)
Subsidy (60%) +
Preferential
Interest Rate
PL Turnaround 2nd Year 2nd Year 2nd Year 2nd Year
Single BY CF
Turnaround
5th Year 5th Year 5th Year 2nd Year
Accumulated CF
Turnaround 13th Year 12th Year 9th Year 5th Year
Equity IRR 4.3% 5.1% 12.1% 29.2%
* PL: Profit and Loss Statement *CF: Cash Flow
The study above is focused only on investment payout from fuel and electricity saving.
However given the nature of product, other non-energy saving factors are also considered in the
actual choice of toilet or shower. Therefore it is not appropriate to assess the benefit of each
equipment solely based on the payout period but a subsidy of around 60% of the initial investment is
generally required for shower to be eligible for choice in a payout project through energy-saving. In
case of commercial facilities including hotels, ESCO proposal based on the combination of such
facilities as expensive commercial boilers and heat pumps will be promising where a great deal of
energy-saving effect is expected.
66
Related Documents