3rd Quarter 2010 Results November 12 th , 2010

Welcome message from author
This document is posted to help you gain knowledge. Please leave a comment to let me know what you think about it! Share it to your friends and learn new things together.
Transcript
3rd Quarter 2010 ResultsNovember 12th, 2010
2
Disclaimer
The forward-looking statements presented herein are subject to risks and uncertainties. These
statements are based on the beliefs and assumptions of our management, and on information
currently available to us.
Forward-looking statements are not guarantees of performance. They involve risks,
uncertainties and assumptions because they relate to future events and therefore depend on
circumstances that may or may not occur. Our future operating results, financial condition,
strategies, market share and values may differ materially from those expressed in or suggested
by these forward-looking statements. Many of the factors that will determine these results and
values are beyond our ability to control or predict.
Forward-looking statements also include information concerning our possible or assumed future
operating results, as well as statements preceded by, followed by, or including the words
''believes,'' ''may,'' ''will,'' ''continues,'' ''expects,'‘ ''anticipates,'' ''intends,'' ''plans,'' ''estimates'' or
similar expressions.
3
Wesley Mendonça Batista
CEO of JBS USA
Joesley Mendonça Batista
CEO of JBS S.A.
Guilherme Arruda
Investors Relations
Presenters
Jeremiah O’Callaghan
Investors Relations Officer
Agenda
4
Market Overview
JBSS3
Analysis and
Measures
Company Overview
3Q10 Highlights
5
Our MissionTo be the best at what we set out to do, totally focused on our business, ensuring the best
products and services for our customers, solidity for our suppliers, satisfactory profitability for
our shareholders and the certainty of a better future for all our employees.
Our ValuesExcellence
Planning
Determination
Discipline
Availability
Openness
Simplicity
Who We Are
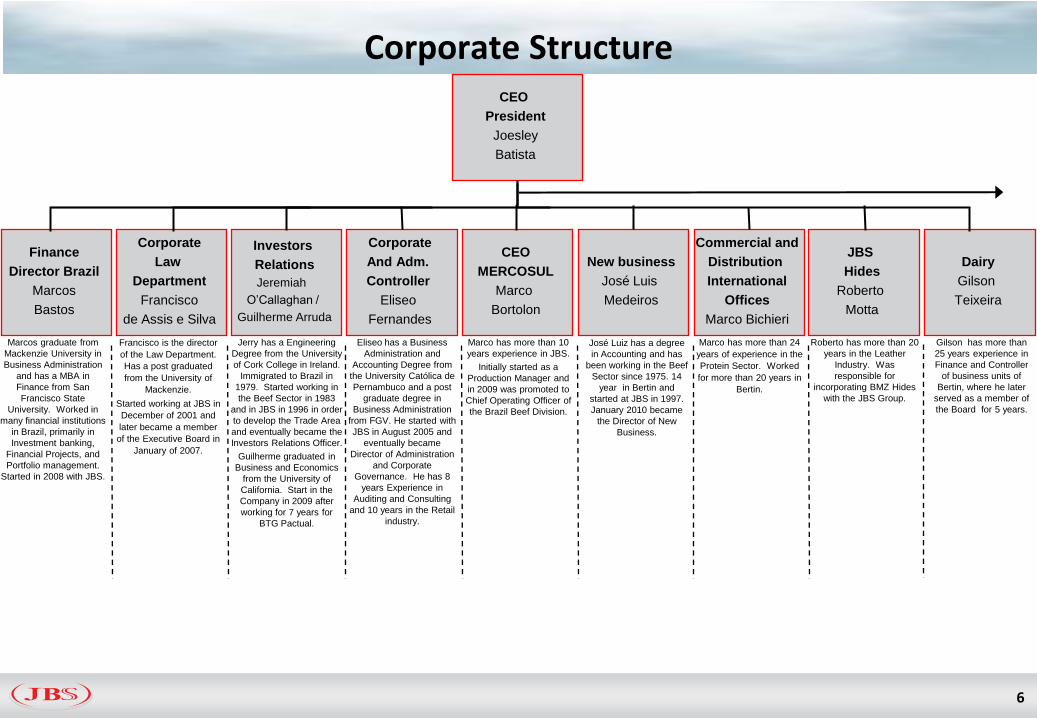
Corporate Structure
Investors
Relations
Jeremiah
O’Callaghan /
Guilherme Arruda
Finance
Director Brazil
Marcos
Bastos
Corporate
Law
Department
Francisco
de Assis e Silva
Marcos graduate from
Mackenzie University in
Business Administration
and has a MBA in
Finance from San
Francisco State
University. Worked in
many financial institutions
in Brazil, primarily in
Investment banking,
Financial Projects, and
Portfolio management.
Started in 2008 with JBS.
Francisco is the director
of the Law Department.
Has a post graduated
from the University of
Mackenzie.
Started working at JBS in
December of 2001 and
later became a member
of the Executive Board in
January of 2007.
Jerry has a Engineering
Degree from the University
of Cork College in Ireland.
Immigrated to Brazil in
1979. Started working in
the Beef Sector in 1983
and in JBS in 1996 in order
to develop the Trade Area
and eventually became the
Investors Relations Officer.
Guilherme graduated in
Business and Economics
from the University of
California. Start in the
Company in 2009 after
working for 7 years for
BTG Pactual.
Corporate
And Adm.
Controller
Eliseo
Fernandes
Eliseo has a Business
Administration and
Accounting Degree from
the University Católica de
Pernambuco and a post
graduate degree in
Business Administration
from FGV. He started with
JBS in August 2005 and
eventually became
Director of Administration
and Corporate
Governance. He has 8
years Experience in
Auditing and Consulting
and 10 years in the Retail
industry.
Dairy
Gilson
Teixeira
CEO
MERCOSUL
Marco
Bortolon
JBS
Hides
Roberto
Motta
New business
José Luis
Medeiros
Commercial and
Distribution
International
Offices
Marco Bichieri
CEO
President
Joesley
Batista
Marco has more than 10
years experience in JBS.
Initially started as a
Production Manager and
in 2009 was promoted to
Chief Operating Officer of
the Brazil Beef Division.
Marco has more than 24
years of experience in the
Protein Sector. Worked
for more than 20 years in
Bertin.
Roberto has more than 20
years in the Leather
Industry. Was
responsible for
incorporating BMZ Hides
with the JBS Group.
Gilson has more than
25 years experience in
Finance and Controller
of business units of
Bertin, where he later
served as a member of
the Board for 5 years.
José Luiz has a degree
in Accounting and has
been working in the Beef
Sector since 1975. 14
year in Bertin and
started at JBS in 1997.
January 2010 became
the Director of New
Business.
6
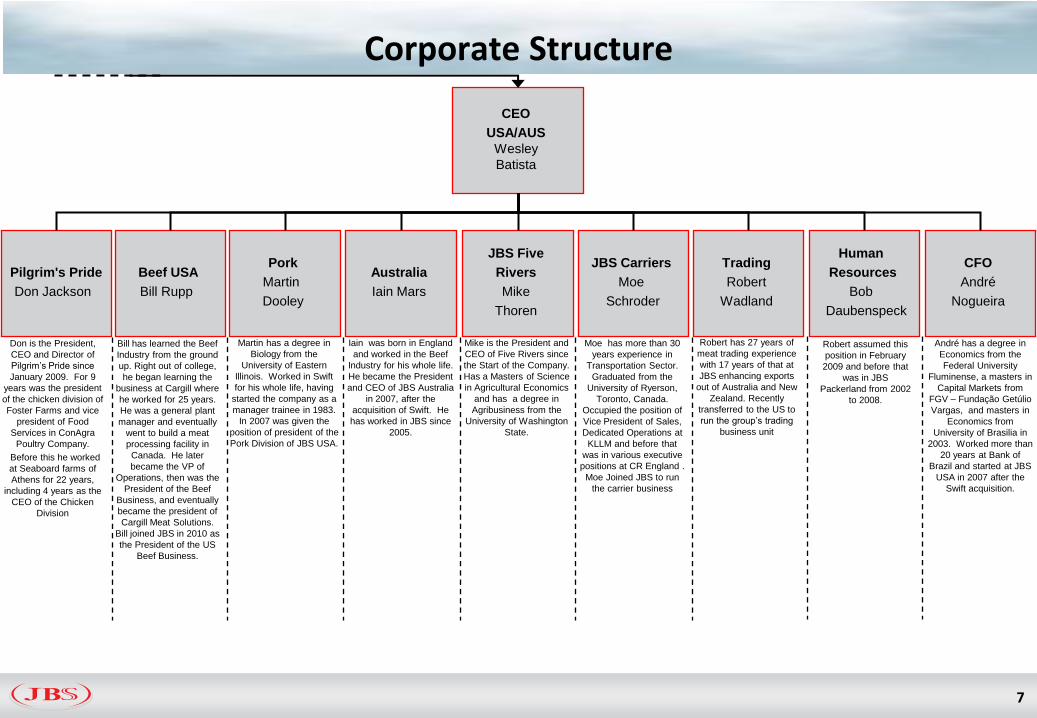
Corporate Structure
Australia
Iain Mars
Pilgrim's Pride
Don Jackson
Beef USA
Bill Rupp
JBS Five
Rivers
Mike
Thoren
JBS Carriers
Moe
Schroder
CEO
USA/AUS
Wesley
Batista
Pork
Martin
Dooley
Iain was born in England
and worked in the Beef
Industry for his whole life.
He became the President
and CEO of JBS Australia
in 2007, after the
acquisition of Swift. He
has worked in JBS since
2005.
Martin has a degree in
Biology from the
University of Eastern
Illinois. Worked in Swift
for his whole life, having
started the company as a
manager trainee in 1983.
In 2007 was given the
position of president of the
Pork Division of JBS USA.
Moe has more than 30
years experience in
Transportation Sector.
Graduated from the
University of Ryerson,
Toronto, Canada.
Occupied the position of
Vice President of Sales,
Dedicated Operations at
KLLM and before that
was in various executive
positions at CR England .
Moe Joined JBS to run
the carrier business
Mike is the President and
CEO of Five Rivers since
the Start of the Company.
Has a Masters of Science
in Agricultural Economics
and has a degree in
Agribusiness from the
University of Washington
State.
Bill has learned the Beef
Industry from the ground
up. Right out of college,
he began learning the
business at Cargill where
he worked for 25 years.
He was a general plant
manager and eventually
went to build a meat
processing facility in
Canada. He later
became the VP of
Operations, then was the
President of the Beef
Business, and eventually
became the president of
Cargill Meat Solutions.
Bill joined JBS in 2010 as
the President of the US
Beef Business.
Don is the President,
CEO and Director of
Pilgrim’s Pride since
January 2009. For 9
years was the president
of the chicken division of
Foster Farms and vice
president of Food
Services in ConAgra
Poultry Company.
Before this he worked
at Seaboard farms of
Athens for 22 years,
including 4 years as the
CEO of the Chicken
Division
Trading
Robert
Wadland
Robert has 27 years of
meat trading experience
with 17 years of that at
JBS enhancing exports
out of Australia and New
Zealand. Recently
transferred to the US to
run the group’s trading
business unit
CFO
André
Nogueira
Human
Resources
Bob
Daubenspeck
André has a degree in
Economics from the
Federal University
Fluminense, a masters in
Capital Markets from
FGV – Fundação Getúlio
Vargas, and masters in
Economics from
University of Brasilia in
2003. Worked more than
20 years at Bank of
Brazil and started at JBS
USA in 2007 after the
Swift acquisition.
Robert assumed this
position in February
2009 and before that
was in JBS
Packerland from 2002
to 2008.
7
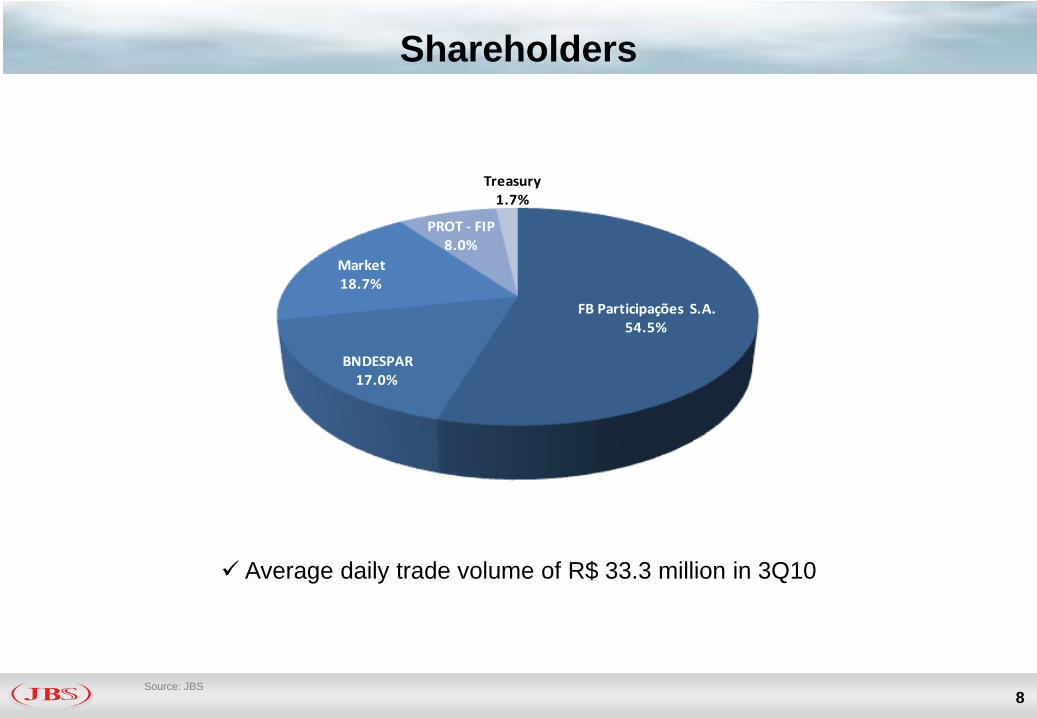
Shareholders
8Source: JBS
FB Participações S.A.54.5%
BNDESPAR17.0%
Market18.7%
PROT - FIP8.0%
Treasury1.7%
Average daily trade volume of R$ 33.3 million in 3Q10
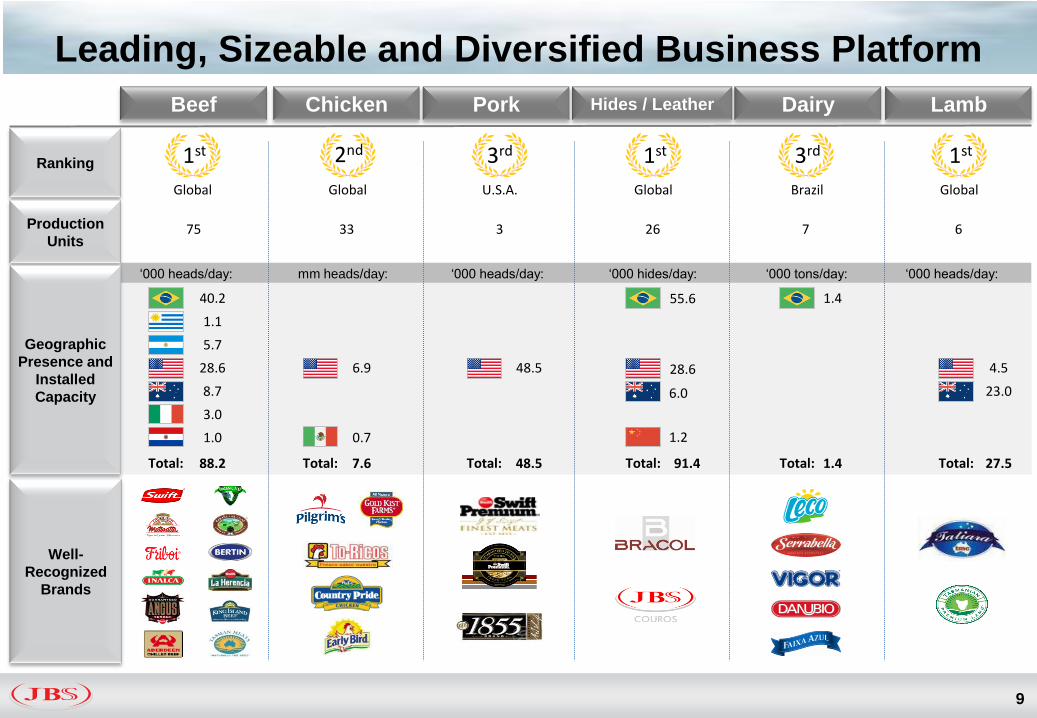
Leading, Sizeable and Diversified Business Platform
9
1stRanking
Well-
Recognized
Brands
Production
Units
Geographic
Presence and
Installed
Capacity
2nd 3rd 1st 3rd 1st
Global Global U.S.A. Global Brazil Global
Beef
40.2
1.1
5.7
28.6
8.7
3.0
1.0
‘000 heads/day:
6.9
0.7
mm heads/day:
48.5
‘000 heads/day: ‘000 hides/day:
1.4
‘000 tons/day:
4.5
23.0
‘000 heads/day:
Total: 88.2 Total: 7.6 Total: 48.5 Total: 91.4 Total: 1.4 Total: 27.5
Chicken Pork Hides / Leather Dairy Lamb
75 33 3 26 7 6
55.6
28.6
6.0
1.2
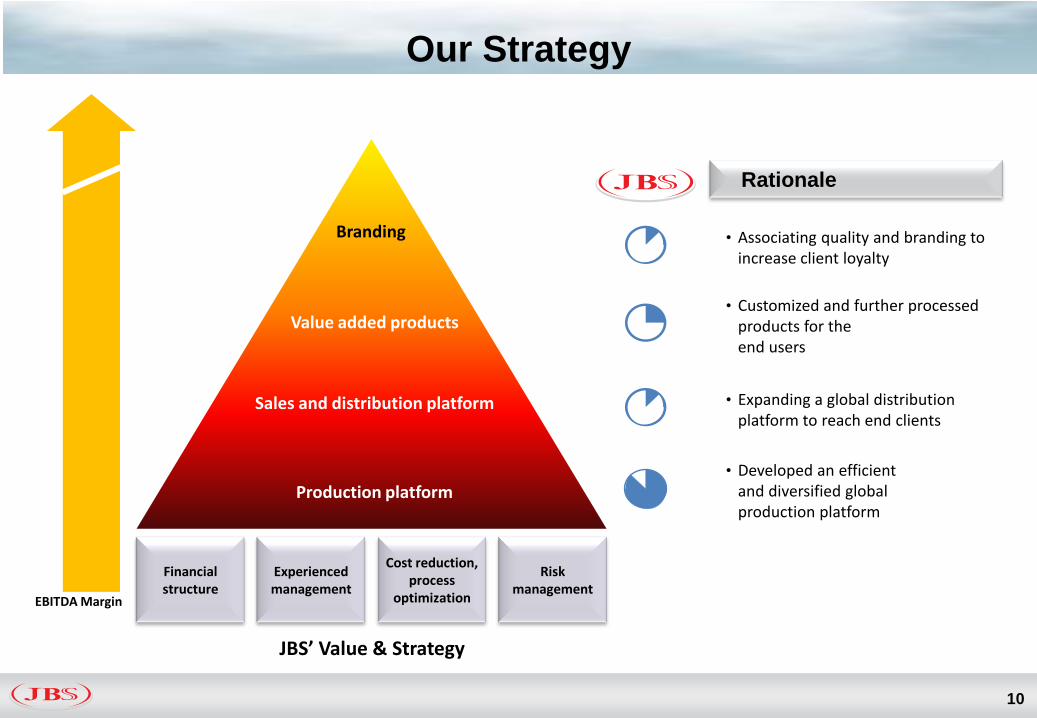
Our Strategy
10
Production platform
Sales and distribution platform
Value added products
Branding
JBS’ Value & Strategy
EBITDA Margin
Financial structure
Experienced management
Cost reduction, process
optimization
Risk management
• Developed an efficient and diversified global production platform
• Expanding a global distribution platform to reach end clients
• Customized and further processed products for the end users
• Associating quality and branding to increase client loyalty
Rationale
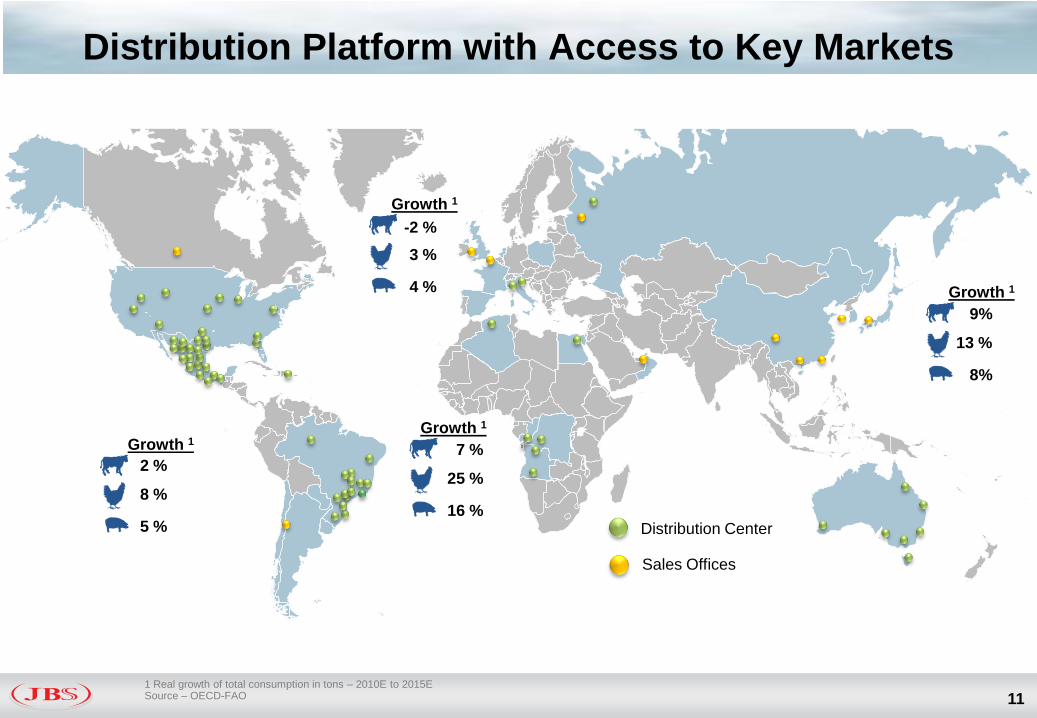
Distribution Platform with Access to Key Markets
111 Real growth of total consumption in tons – 2010E to 2015ESource – OECD-FAO
Distribution Center
Growth 1
2 %
5 %
8 %
Growth 1
7 %
16 %
25 %
Growth 1
9%
8%
13 %
Growth 1
4 %
3 %
-2 %
Sales Offices
Agenda
12
Market Overview
JBSS3
Analysis and
Measures
Company Overview
3Q10 Highlights
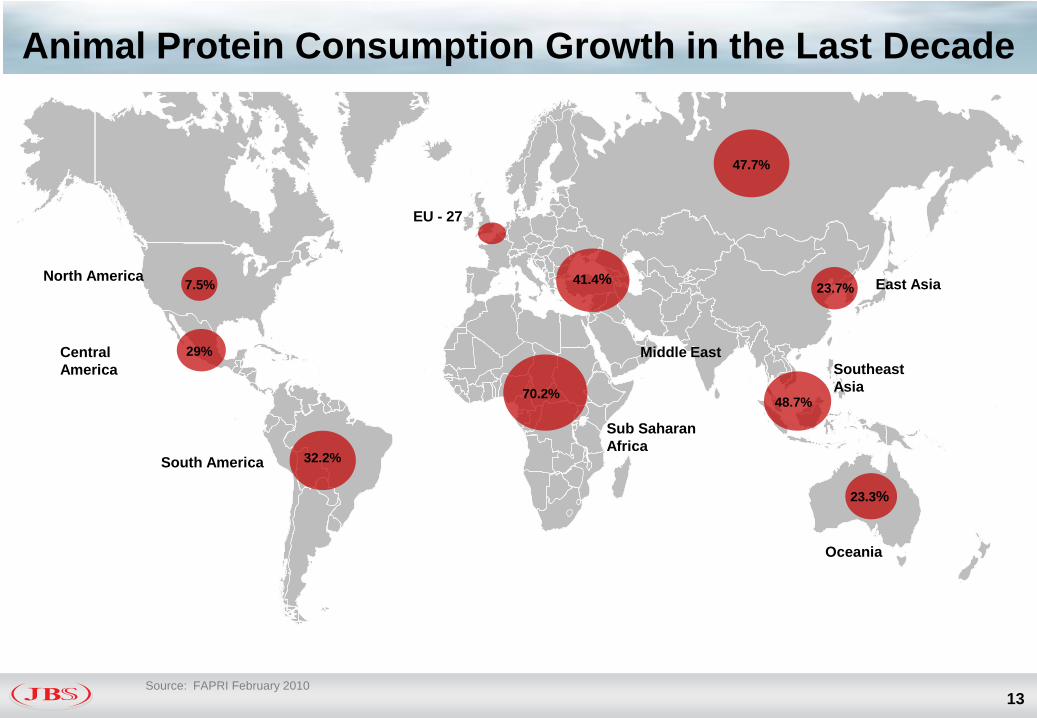
Animal Protein Consumption Growth in the Last Decade
13
3
Source: FAPRI February 2010
7.5%
29%
32.2%
70.2%
41.4%
47.7%
23.7%
23.3%
48.7%
North America
Central
America
South America
Sub Saharan
Africa
Middle EastSoutheast
Asia
East Asia
Oceania
EU - 27
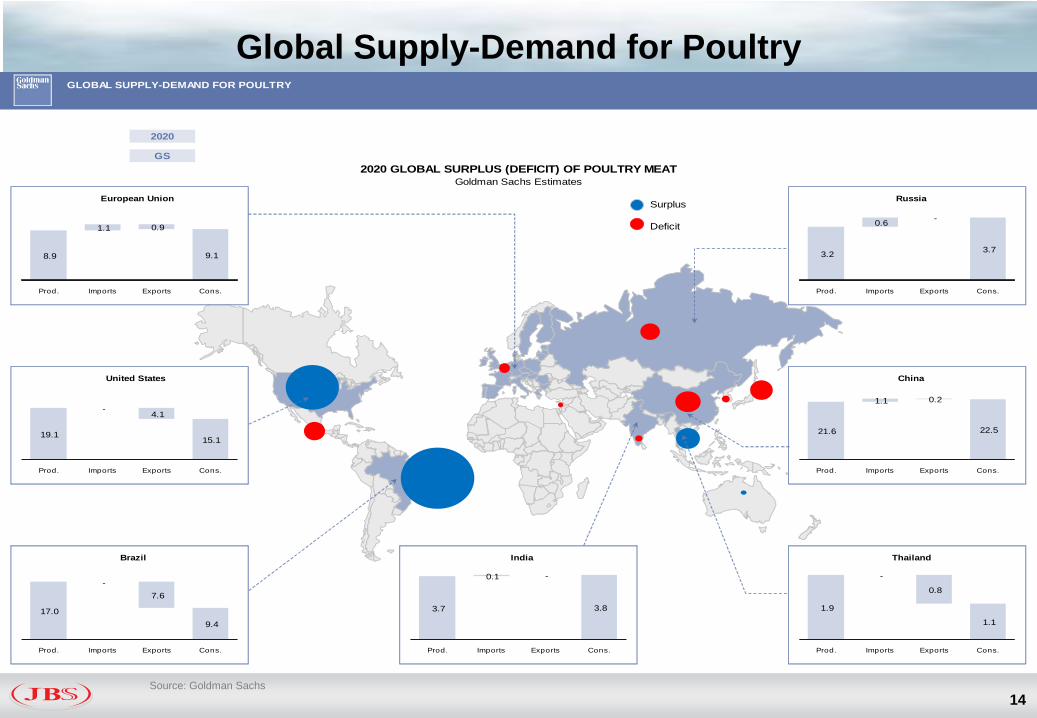
Global Supply-Demand for Poultry
14Source: Goldman Sachs
GLOBAL SUPPLY-DEMAND FOR POULTRY
Choose Year for Chart: 2020
Estimates for Chart GS
Goldman Sachs Estimates 2020 GLOBAL SURPLUS (DEFICIT) OF POULTRY MEAT
Goldman Sachs Estimates
Surplus
Deficit
8.9
1.1 0.9
9.1
Prod. Imports Exports Cons.
European Union
3.2
0.6 -
3.7
Prod. Imports Exports Cons.
Russia
19.1
-4.1
15.1
Prod. Imports Exports Cons.
United States
21.6
1.1 0.2
22.5
Prod. Imports Exports Cons.
China
17.0
-
7.6
9.4
Prod. Imports Exports Cons.
Brazil
1.9
-
0.8
1.1
Prod. Imports Exports Cons.
Thailand
3.7
0.1 -
3.8
Prod. Imports Exports Cons.
India
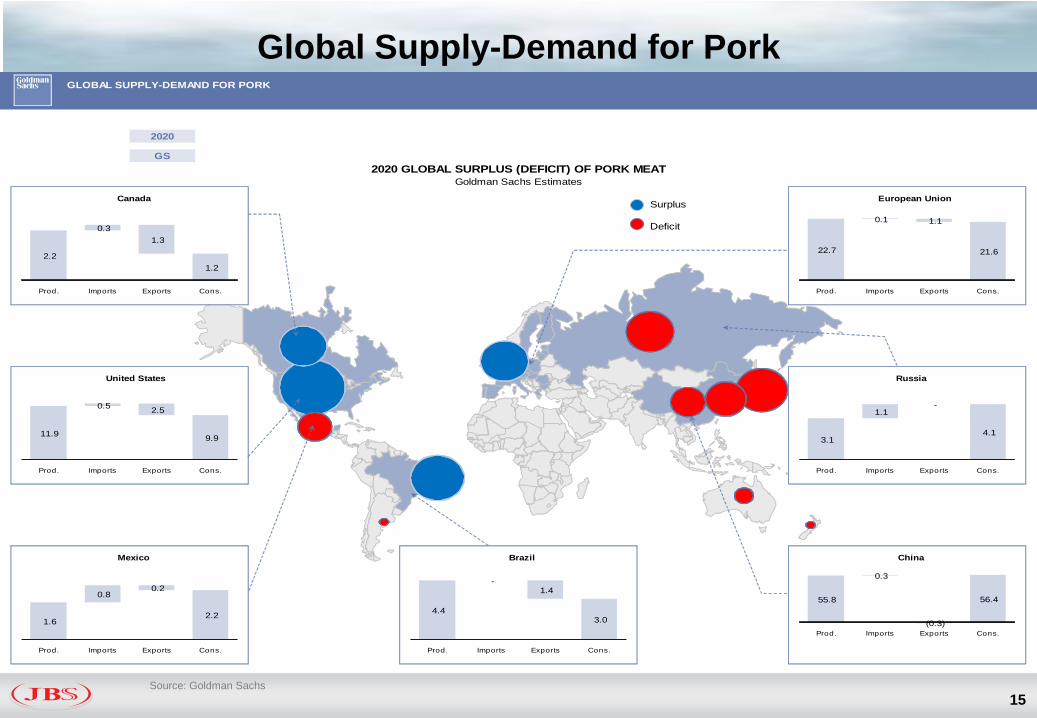
Global Supply-Demand for Pork
15Source: Goldman Sachs
GLOBAL SUPPLY-DEMAND FOR PORK
Choose Year for Chart: 2020
Estimates for Chart GS
Goldman Sachs Estimates 2020 GLOBAL SURPLUS (DEFICIT) OF PORK MEAT
Goldman Sachs Estimates
Surplus
Deficit
2.2
0.3
1.3
1.2
Prod. Imports Exports Cons.
Canada
22.7
0.1 1.1
21.6
Prod. Imports Exports Cons.
European Union
11.9
0.5 2.5
9.9
Prod. Imports Exports Cons.
United States
3.1
1.1 -
4.1
Prod. Imports Exports Cons.
Russia
1.6
0.8 0.2
2.2
Prod. Imports Exports Cons.
Mexico
55.8
0.3
(0.3)
56.4
Prod. Imports Exports Cons.
China
4.4
-1.4
3.0
Prod. Imports Exports Cons.
Brazil
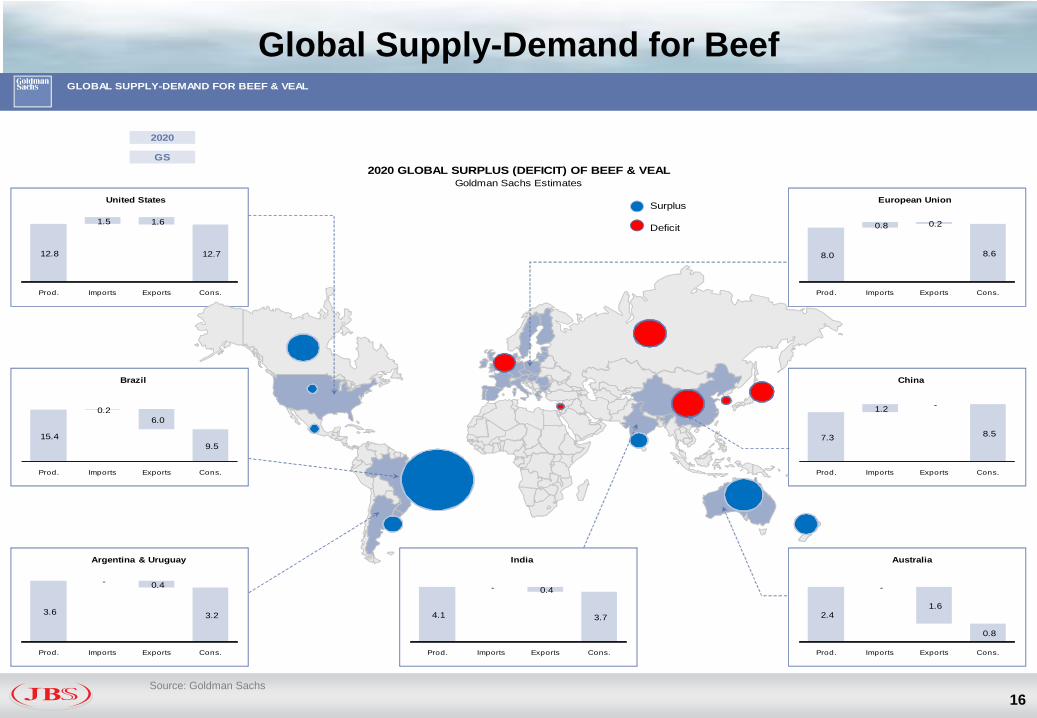
Global Supply-Demand for Beef
16Source: Goldman Sachs
GLOBAL SUPPLY-DEMAND FOR BEEF & VEAL
Choose Year for Chart: 2020
Estimates for Chart GS
Goldman Sachs Estimates 2020 GLOBAL SURPLUS (DEFICIT) OF BEEF & VEAL
Goldman Sachs Estimates
Surplus
Deficit
12.8
1.5 1.6
12.7
Prod. Imports Exports Cons.
United States
8.0
0.8 0.2
8.6
Prod. Imports Exports Cons.
European Union
15.4
0.2
6.0
9.5
Prod. Imports Exports Cons.
Brazil
7.3
1.2 -
8.5
Prod. Imports Exports Cons.
China
3.6
- 0.4
3.2
Prod. Imports Exports Cons.
Argentina & Uruguay
2.4
-
1.6
0.8
Prod. Imports Exports Cons.
Australia
4.1
- 0.4
3.7
Prod. Imports Exports Cons.
India
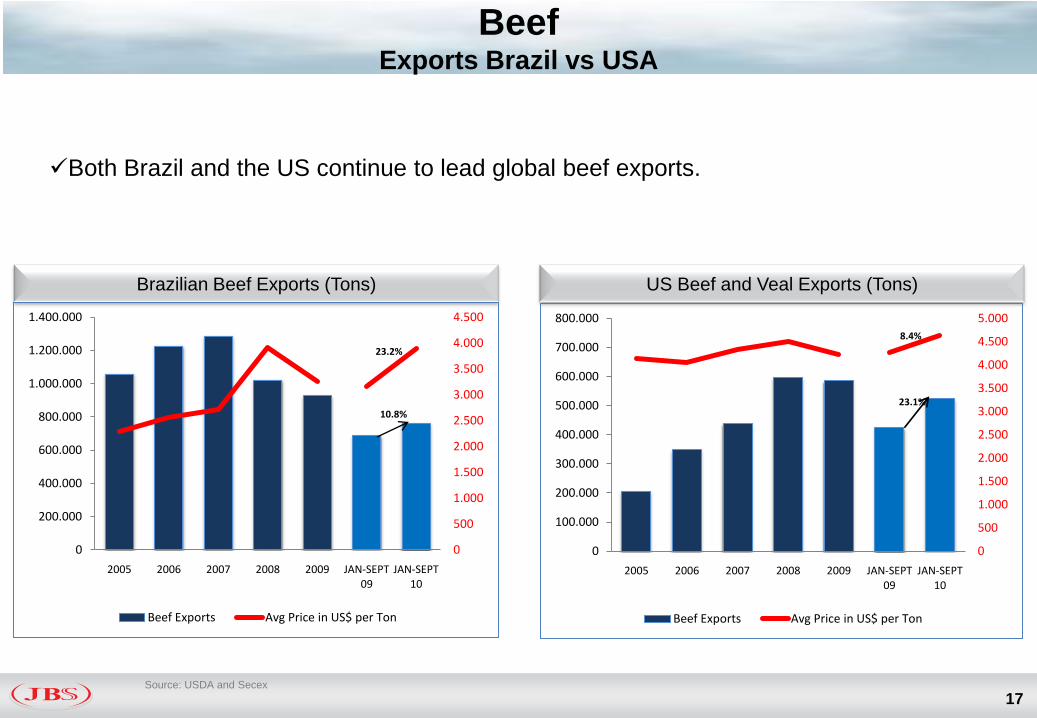
BeefExports Brazil vs USA
17Source: USDA and Secex
US Beef and Veal Exports (Tons)Brazilian Beef Exports (Tons)
Both Brazil and the US continue to lead global beef exports.
0
200.000
400.000
600.000
800.000
1.000.000
1.200.000
1.400.000
2005 2006 2007 2008 2009 JAN-SEPT 09
JAN-SEPT 10
0
500
1.000
1.500
2.000
2.500
3.000
3.500
4.000
4.500
Beef Exports Avg Price in US$ per Ton
10.8%
23.2%
0
100.000
200.000
300.000
400.000
500.000
600.000
700.000
800.000
2005 2006 2007 2008 2009 JAN-SEPT 09
JAN-SEPT 10
0
500
1.000
1.500
2.000
2.500
3.000
3.500
4.000
4.500
5.000
Beef Exports Avg Price in US$ per Ton
23.1%
8.4%
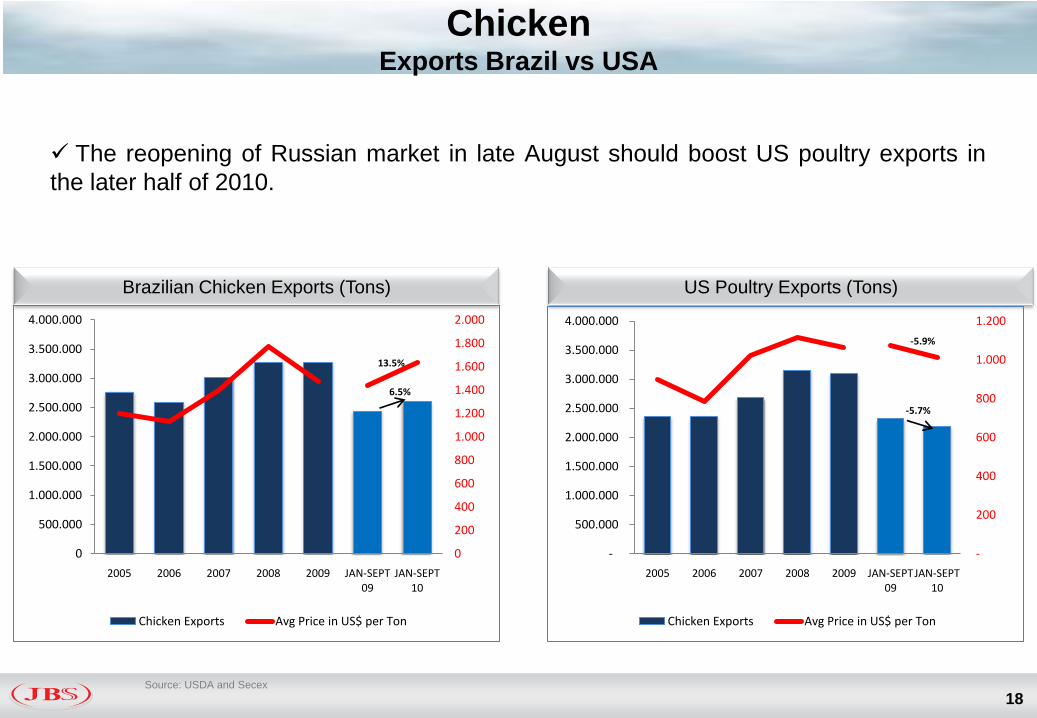
ChickenExports Brazil vs USA
18Source: USDA and Secex
Brazilian Chicken Exports (Tons) US Poultry Exports (Tons)
The reopening of Russian market in late August should boost US poultry exports in
the later half of 2010.
0
500.000
1.000.000
1.500.000
2.000.000
2.500.000
3.000.000
3.500.000
4.000.000
2005 2006 2007 2008 2009 JAN-SEPT 09
JAN-SEPT 10
0
200
400
600
800
1.000
1.200
1.400
1.600
1.800
2.000
Chicken Exports Avg Price in US$ per Ton
6.5%
13.5%
-
500.000
1.000.000
1.500.000
2.000.000
2.500.000
3.000.000
3.500.000
4.000.000
2005 2006 2007 2008 2009 JAN-SEPT 09
JAN-SEPT 10
-
200
400
600
800
1.000
1.200
Chicken Exports Avg Price in US$ per Ton
-5.7%
-5.9%
Agenda
19
Market Overview
JBSS3
Analysis and
Measures
Company Overview
3Q10 Highlights
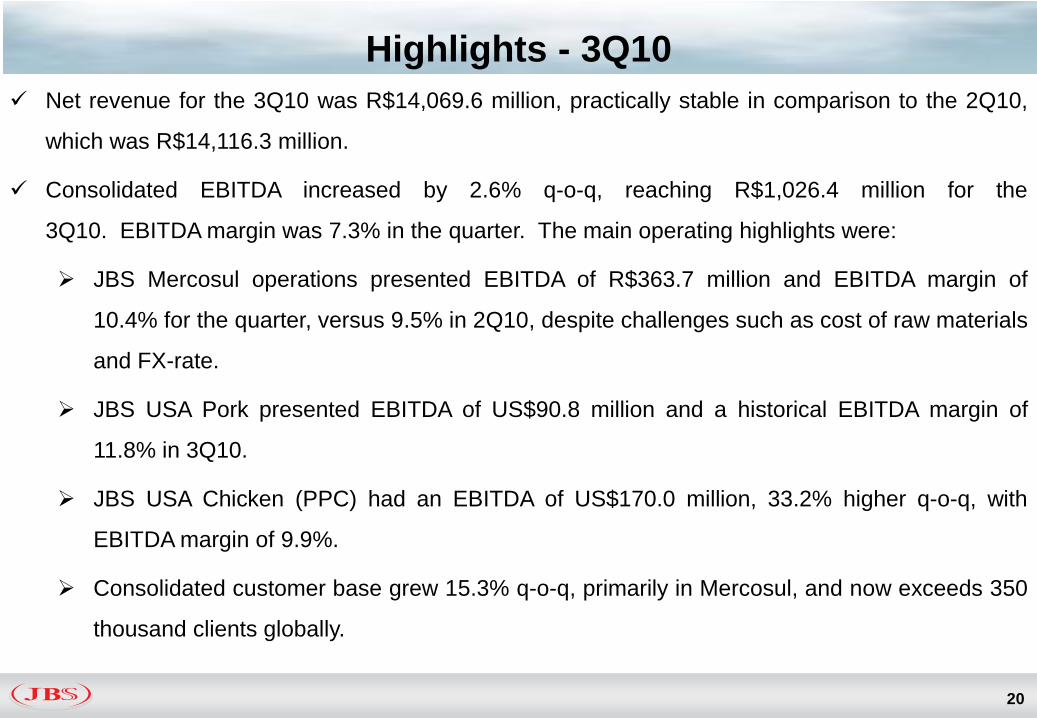
Highlights - 3Q10
20
Net revenue for the 3Q10 was R$14,069.6 million, practically stable in comparison to the 2Q10,
which was R$14,116.3 million.
Consolidated EBITDA increased by 2.6% q-o-q, reaching R$1,026.4 million for the
3Q10. EBITDA margin was 7.3% in the quarter. The main operating highlights were:
JBS Mercosul operations presented EBITDA of R$363.7 million and EBITDA margin of
10.4% for the quarter, versus 9.5% in 2Q10, despite challenges such as cost of raw materials
and FX-rate.
JBS USA Pork presented EBITDA of US$90.8 million and a historical EBITDA margin of
11.8% in 3Q10.
JBS USA Chicken (PPC) had an EBITDA of US$170.0 million, 33.2% higher q-o-q, with
EBITDA margin of 9.9%.
Consolidated customer base grew 15.3% q-o-q, primarily in Mercosul, and now exceeds 350
thousand clients globally.
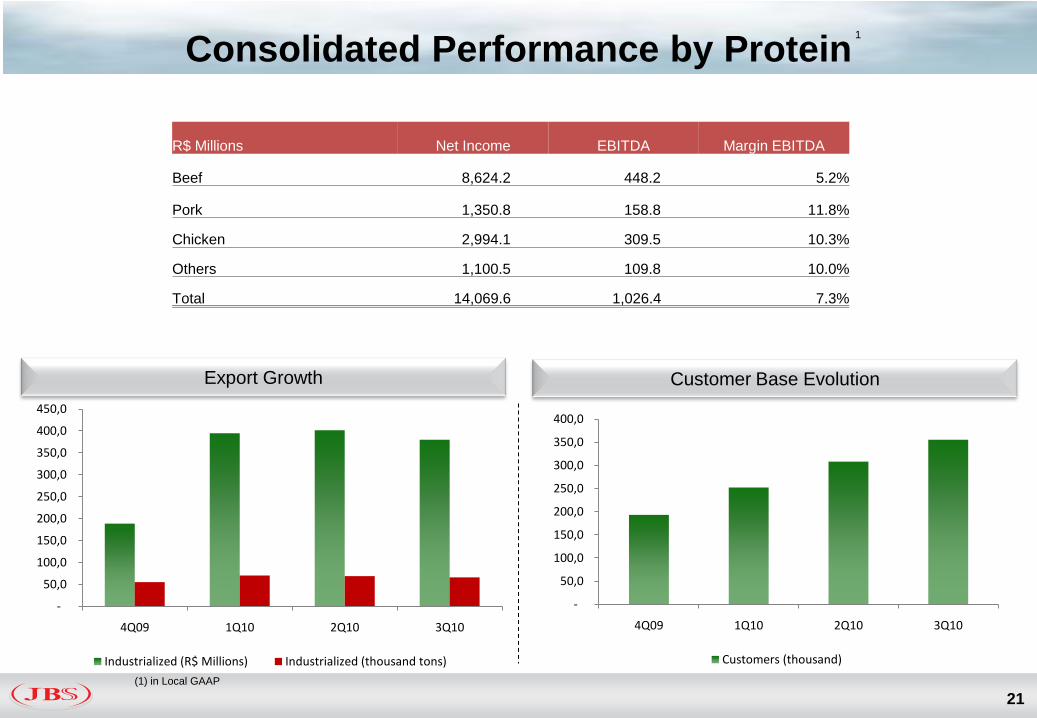
Consolidated Performance by Protein
21
Export Growth Customer Base Evolution
(1) in Local GAAP
R$ Millions Net Income EBITDA Margin EBITDA
Beef 8,624.2 448.2 5.2%
Pork 1,350.8 158.8 11.8%
Chicken 2,994.1 309.5 10.3%
Others 1,100.5 109.8 10.0%
Total 14,069.6 1,026.4 7.3%
1
-
50,0
100,0
150,0
200,0
250,0
300,0
350,0
400,0
4Q09 1Q10 2Q10 3Q10
Customers (thousand)
1
-
50,0
100,0
150,0
200,0
250,0
300,0
350,0
400,0
450,0
4Q09 1Q10 2Q10 3Q10
Industrialized (R$ Millions) Industrialized (thousand tons)
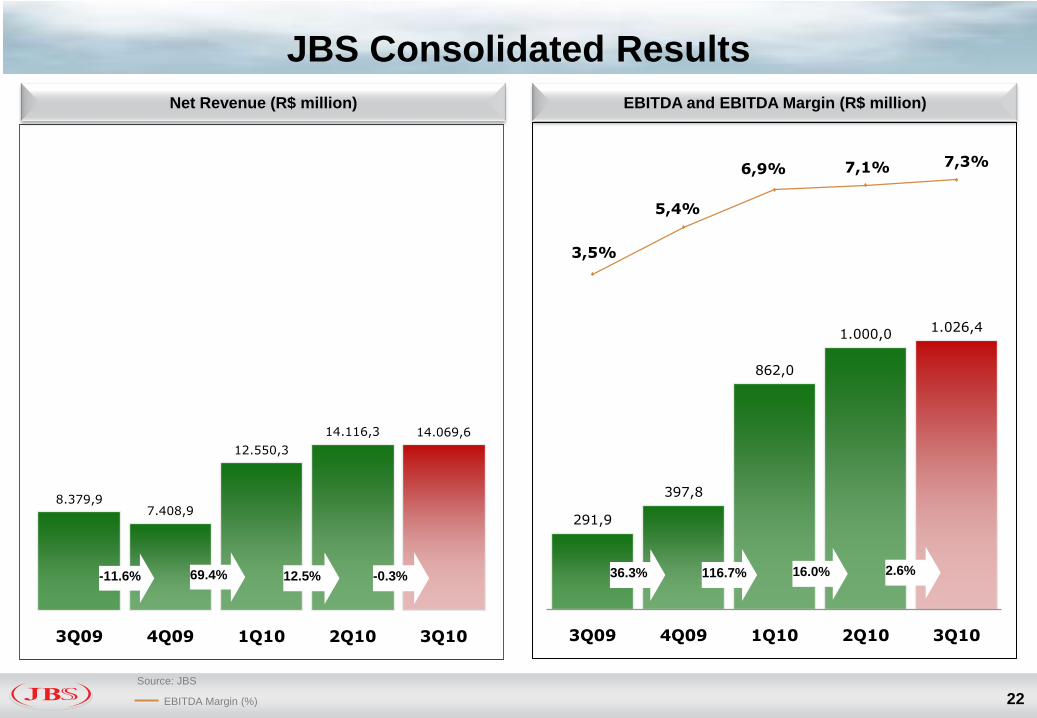
JBS Consolidated Results
22
Source: JBS
EBITDA Margin (%)
Net Revenue (R$ million) EBITDA and EBITDA Margin (R$ million)
8.379,97.408,9
12.550,3
14.116,3 14.069,6
3Q09 4Q09 1Q10 2Q10 3Q10
12.5%69.4% -0.3%-11.6%
291,9
397,8
862,0
1.000,01.026,4
3,5%
5,4%
6,9% 7,1% 7,3%
3Q09 4Q09 1Q10 2Q10 3Q10
36.3% 116.7% 16.0% 2.6%
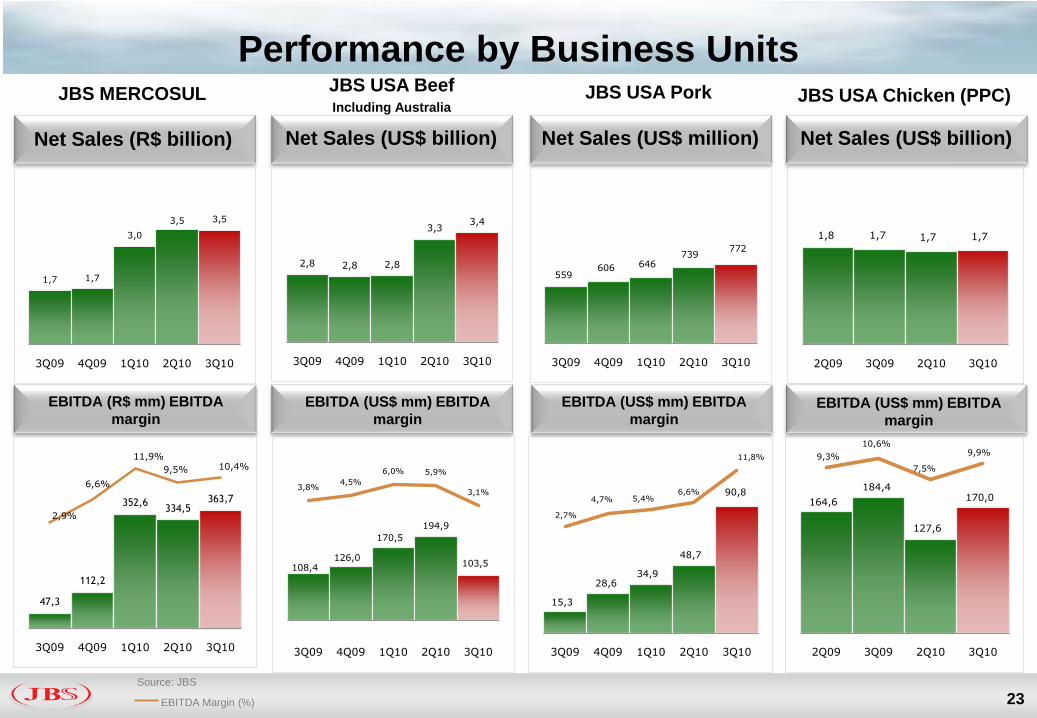
Performance by Business Units
23
Net Sales (US$ billion) Net Sales (US$ million) Net Sales (US$ billion)
EBITDA (US$ mm) EBITDA
margin
EBITDA (US$ mm) EBITDA
marginEBITDA (US$ mm) EBITDA
margin
JBS USA BeefIncluding Australia
JBS USA Pork JBS USA Chicken (PPC)
Source: JBS
EBITDA Margin (%)
Net Sales (R$ billion)
EBITDA (R$ mm) EBITDA
margin
JBS MERCOSUL
1,7 1,7
3,0
3,5 3,5
3Q09 4Q09 1Q10 2Q10 3Q10
2,8 2,8 2,8
3,33,4
3Q09 4Q09 1Q10 2Q10 3Q10
108,4126,0
170,5
194,9
103,5
3,8%4,5%
6,0% 5,9%
3,1%
3Q09 4Q09 1Q10 2Q10 3Q10
559606 646
739772
3Q09 4Q09 1Q10 2Q10 3Q10
15,3
28,634,9
48,7
90,8
2,7%
4,7% 5,4%6,6%
11,8%
3Q09 4Q09 1Q10 2Q10 3Q10
1,8 1,7 1,7 1,7
2Q09 3Q09 2Q10 3Q10
164,6
184,4
127,6
170,0
9,3%
10,6%
7,5%
9,9%
2Q09 3Q09 2Q10 3Q10
47,3
112,2
352,6334,5
363,7
2,9%
6,6%
11,9%
9,5% 10,4%
3Q09 4Q09 1Q10 2Q10 3Q10
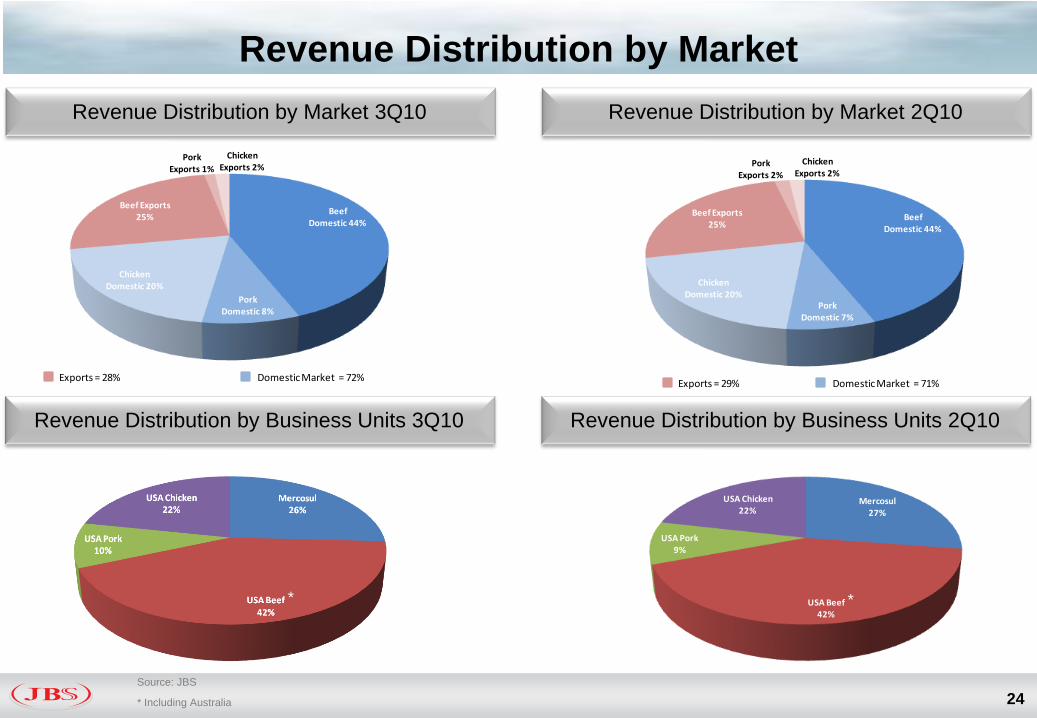
Revenue Distribution by Market
24
Revenue Distribution by Market 3Q10 Revenue Distribution by Market 2Q10
Revenue Distribution by Business Units 3Q10 Revenue Distribution by Business Units 2Q10
Beef Domestic 44%
Pork Domestic 7%
Chicken Domestic 20%
Beef Exports 25%
Pork Exports 2%
Chicken Exports 2%
Exports = 29% Domestic Market = 71%
Source: JBS
* Including Australia
Mercosul27%
USA Beef42%
USA Pork9%
USA Chicken22%
* *
Beef Domestic 44%
Pork Domestic 8%
Chicken Domestic 20%
Beef Exports 25%
Pork Exports 1%
Chicken Exports 2%
Exports = 28% Domestic Market = 72%
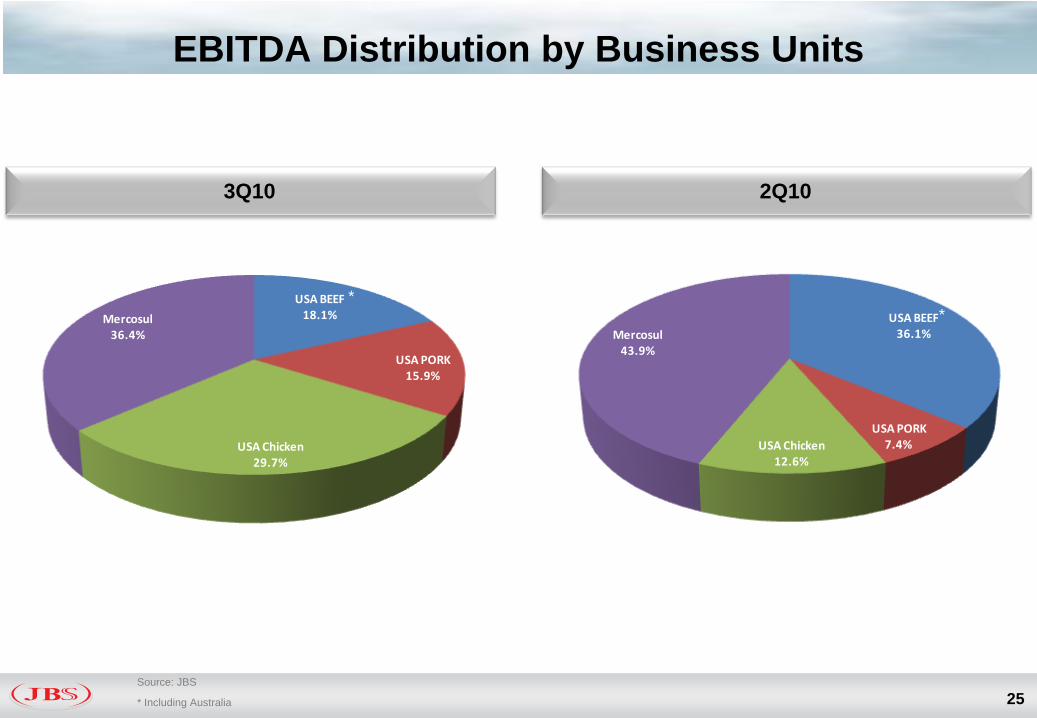
EBITDA Distribution by Business Units
25
3Q10 2Q10
USA BEEF18.1%
USA PORK15.9%
USA Chicken29.7%
Mercosul36.4%
USA BEEF36.1%
USA PORK7.4%USA Chicken
12.6%
Mercosul43.9%
Source: JBS
* Including Australia
**
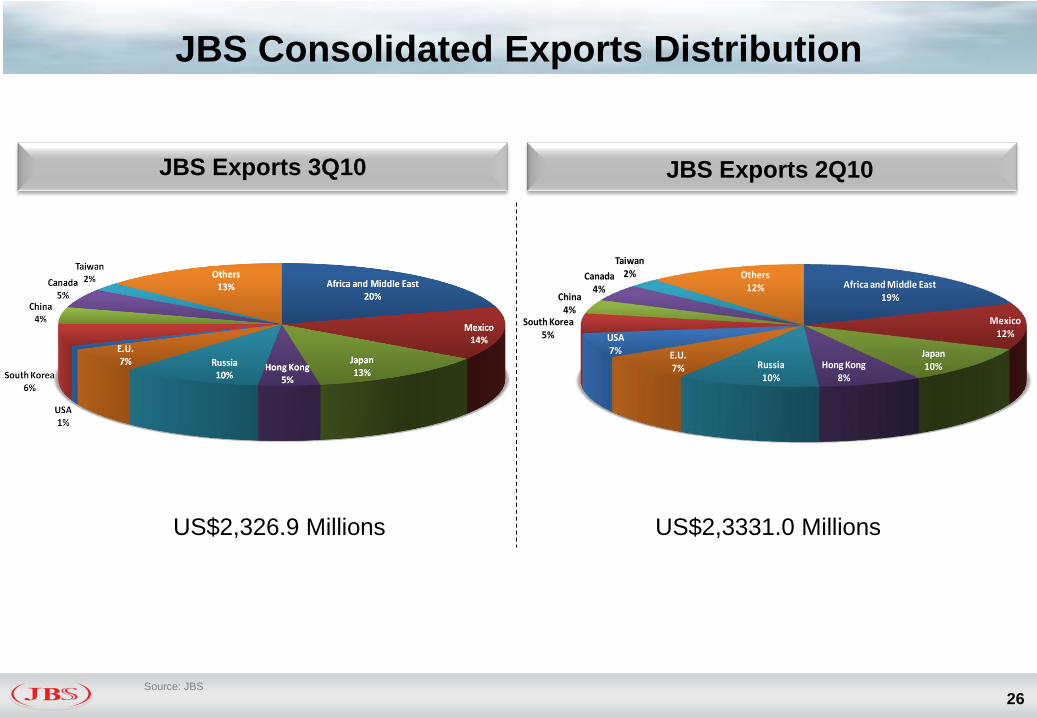
JBS Consolidated Exports Distribution
26
JBS Exports 3Q10 JBS Exports 2Q10
US$2,3331.0 MillionsUS$2,326.9 Millions
Source: JBS
Africa and Middle East19%
Mexico12%
Japan10%Hong Kong
8%Russia
10%
E.U.7%
USA7%
South Korea5%
China4%
Canada4%
Taiwan2% Others
12%
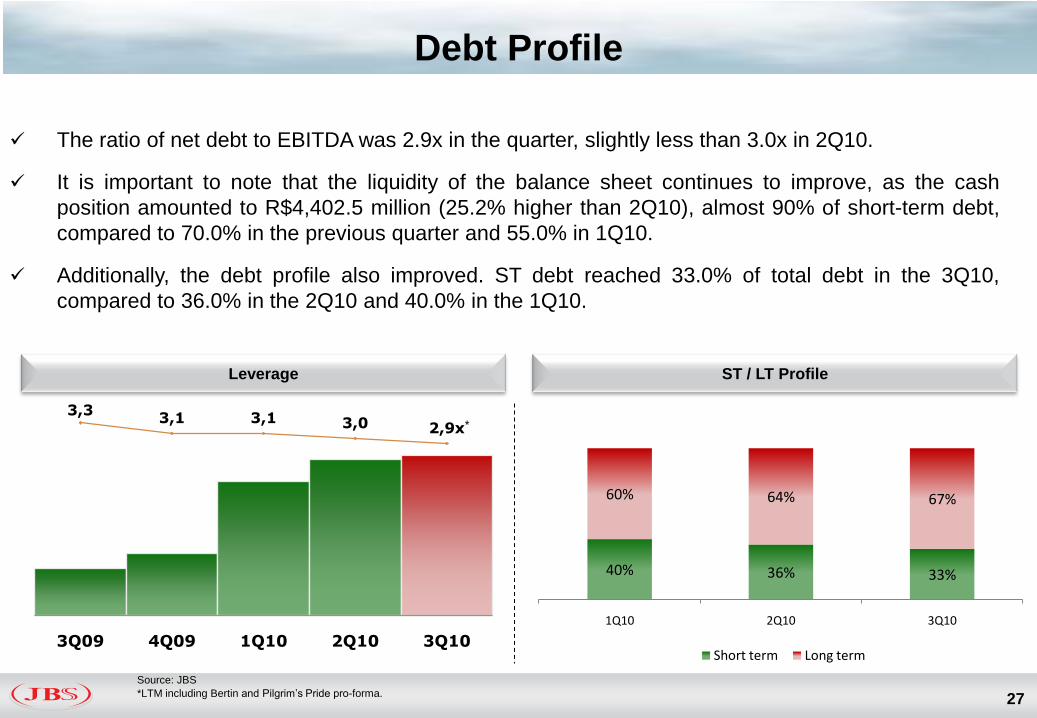
Debt Profile
27
The ratio of net debt to EBITDA was 2.9x in the quarter, slightly less than 3.0x in 2Q10.
It is important to note that the liquidity of the balance sheet continues to improve, as the cash
position amounted to R$4,402.5 million (25.2% higher than 2Q10), almost 90% of short-term debt,
compared to 70.0% in the previous quarter and 55.0% in 1Q10.
Additionally, the debt profile also improved. ST debt reached 33.0% of total debt in the 3Q10,
compared to 36.0% in the 2Q10 and 40.0% in the 1Q10.
*3,3
3,1 3,1 3,0 2,9x
3Q09 4Q09 1Q10 2Q10 3Q10
Leverage ST / LT Profile
40% 36% 33%
60% 64% 67%
1Q10 2Q10 3Q10
Short term Long term
Source: JBS
*LTM including Bertin and Pilgrim’s Pride pro-forma.
Agenda
28
Market Overview
JBSS3
Analysis and
Measures
Company Overview
3Q10 Highlights
Stock Performance
29Source: Bloomberg (Base 100 = 01/07/10)
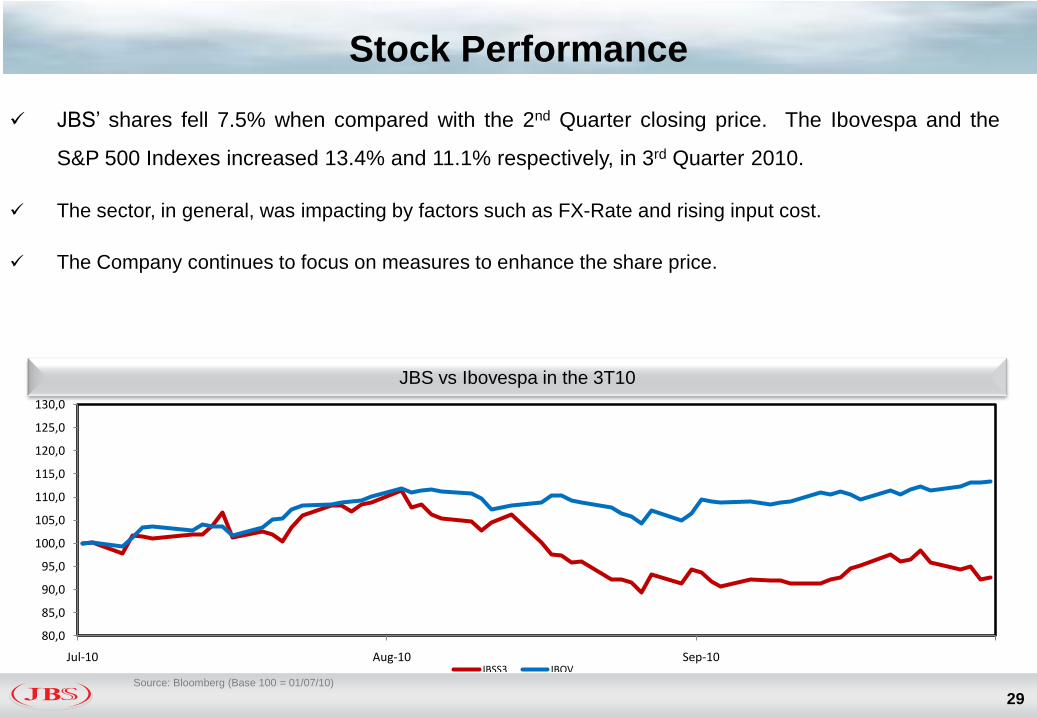
JBS’ shares fell 7.5% when compared with the 2nd Quarter closing price. The Ibovespa and the
S&P 500 Indexes increased 13.4% and 11.1% respectively, in 3rd Quarter 2010.
The sector, in general, was impacting by factors such as FX-Rate and rising input cost.
The Company continues to focus on measures to enhance the share price.
JBS vs Ibovespa in the 3T10
80,0
85,0
90,0
95,0
100,0
105,0
110,0
115,0
120,0
125,0
130,0
Jul-10 Aug-10 Sep-10JBSS3 IBOV
Ongoing Actions
30
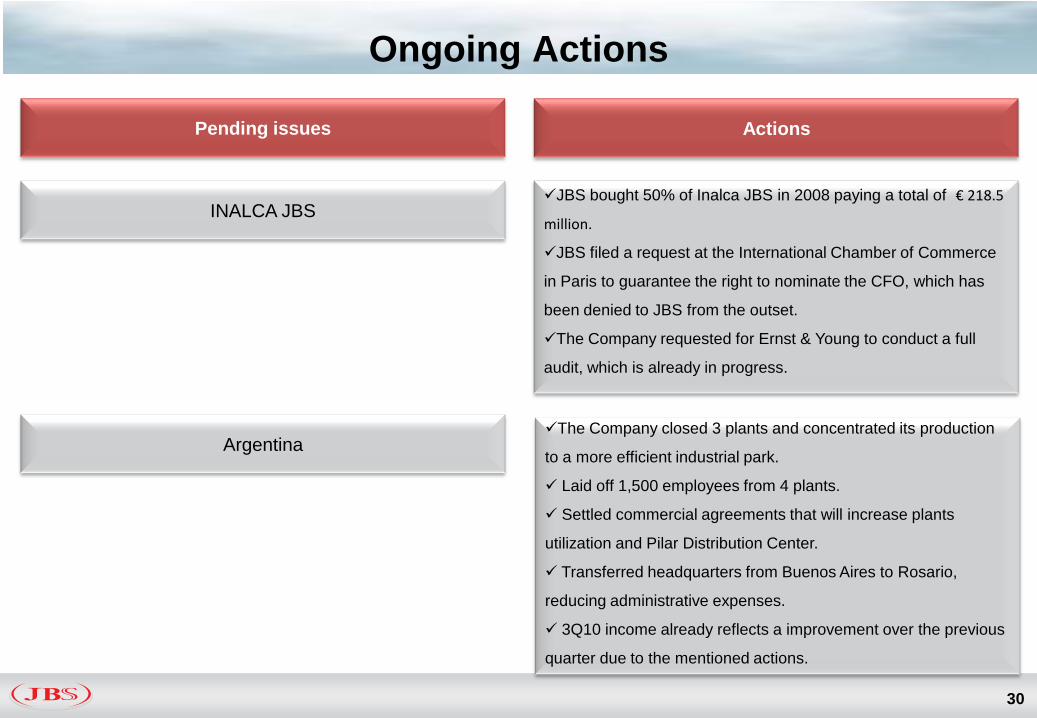
INALCA JBSJBS bought 50% of Inalca JBS in 2008 paying a total of € 218.5
million.
JBS filed a request at the International Chamber of Commerce
in Paris to guarantee the right to nominate the CFO, which has
been denied to JBS from the outset.
The Company requested for Ernst & Young to conduct a full
audit, which is already in progress.
Argentina
Pending issues Actions
The Company closed 3 plants and concentrated its production
to a more efficient industrial park.
Laid off 1,500 employees from 4 plants.
Settled commercial agreements that will increase plants
utilization and Pilar Distribution Center.
Transferred headquarters from Buenos Aires to Rosario,
reducing administrative expenses.
3Q10 income already reflects a improvement over the previous
quarter due to the mentioned actions.
Ongoing Actions
31
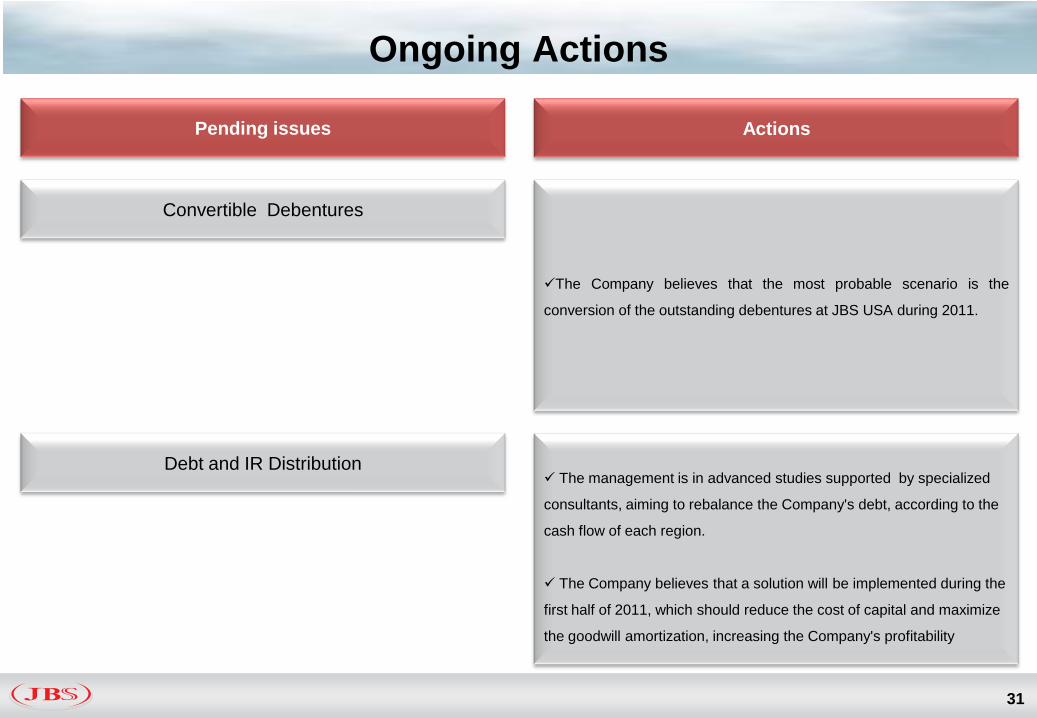
Convertible Debentures
The Company believes that the most probable scenario is the
conversion of the outstanding debentures at JBS USA during 2011.
Debt and IR Distribution
Pending issues Actions
The management is in advanced studies supported by specialized
consultants, aiming to rebalance the Company's debt, according to the
cash flow of each region.
The Company believes that a solution will be implemented during the
first half of 2011, which should reduce the cost of capital and maximize
the goodwill amortization, increasing the Company's profitability
Coverage by Equity Analysts
32
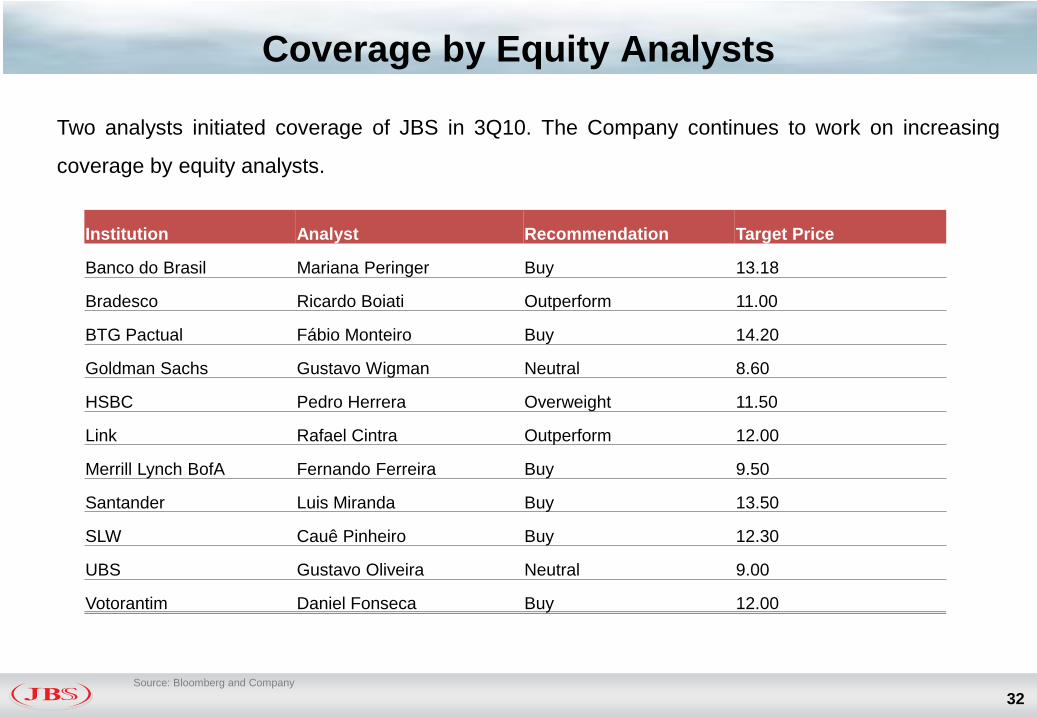
Two analysts initiated coverage of JBS in 3Q10. The Company continues to work on increasing
coverage by equity analysts.
Source: Bloomberg and Company
Institution Analyst Recommendation Target Price
Banco do Brasil Mariana Peringer Buy 13.18
Bradesco Ricardo Boiati Outperform 11.00
BTG Pactual Fábio Monteiro Buy 14.20
Goldman Sachs Gustavo Wigman Neutral 8.60
HSBC Pedro Herrera Overweight 11.50
Link Rafael Cintra Outperform 12.00
Merrill Lynch BofA Fernando Ferreira Buy 9.50
Santander Luis Miranda Buy 13.50
SLW Cauê Pinheiro Buy 12.30
UBS Gustavo Oliveira Neutral 9.00
Votorantim Daniel Fonseca Buy 12.00
Final Remarks
33
The efficiency gains, business diversification of the Company and expansion of the direct distribution
have been more than offset the increase in some input costs.
Global demand for protein continues solid and the Company believes that it can benefit from this
scenario through its market penetration around the world.
The Company remains committed to reducing its financial leverage.
The Company's management is taking the measures to address outstanding issues in order to
enhance share value.
JBS’ customer base continues to grow organically, particularly in Mercosul, and the Company remains
committed to expanding the global direct distribution

34“In God We Trust, Nature We Respect”
IR Contacts:
+55 11 3144 4447
www.jbs.com.br/ir
Thank You!
Related Documents