JASPERANALYSIS USER GUIDE RELEASE 3.7 http://www.jaspersoft.com

Welcome message from author
This document is posted to help you gain knowledge. Please leave a comment to let me know what you think about it! Share it to your friends and learn new things together.
Transcript

JASPERANALYSIS USER GUIDE
RELEASE 3.7
http://www.jaspersoft.com
Jaspersoft Style Guide and FrameMaker Template
2
© 2010 Jaspersoft Corporation. All rights reserved. Printed in the U.S.A. Jaspersoft, the Jaspersoft logo, JasperAnalysis, JasperServer, JasperETL, JasperReports, JasperStudio, iReport, and Jasper4 products are trademarks and/or registered trademarks of Jaspersoft Corporation in the United States and in jurisdictions throughout the world. All other company and product names are or may be trade names or trademarks of their respective owners.
This is version 0610-JST37-10 of the JasperAnalysis User Guide.

Table of Contents
TABLE OF CONTENTS
Chapter 1 Introduction to JasperAnalysis . . . . . . . . . . . . . . . . . . . . . . . . . . . . . . . . . . . . . . . . . . . . 51.1 Login . . . . . . . . . . . . . . . . . . . . . . . . . . . . . . . . . . . . . . . . . . . . . . . . . . . . . . . . . . . . . . . . . . . . . . . . . . . 51.2 External Sources of Information . . . . . . . . . . . . . . . . . . . . . . . . . . . . . . . . . . . . . . . . . . . . . . . . . . . . . . . 71.3 Jaspersoft ODBO Connect . . . . . . . . . . . . . . . . . . . . . . . . . . . . . . . . . . . . . . . . . . . . . . . . . . . . . . . . . . . 8
Chapter 2 Working with Analysis Views . . . . . . . . . . . . . . . . . . . . . . . . . . . . . . . . . . . . . . . . . . . . . 92.1 Opening an Analysis View . . . . . . . . . . . . . . . . . . . . . . . . . . . . . . . . . . . . . . . . . . . . . . . . . . . . . . . . . . . 92.2 Tool Bar . . . . . . . . . . . . . . . . . . . . . . . . . . . . . . . . . . . . . . . . . . . . . . . . . . . . . . . . . . . . . . . . . . . . . . . . 10
2.2.1 Drill into a Dimension Member . . . . . . . . . . . . . . . . . . . . . . . . . . . . . . . . . . . . . . . . . . . . . . . 102.2.2 Sort Across Hierarchy . . . . . . . . . . . . . . . . . . . . . . . . . . . . . . . . . . . . . . . . . . . . . . . . . . . . . . 112.2.3 Natural Order . . . . . . . . . . . . . . . . . . . . . . . . . . . . . . . . . . . . . . . . . . . . . . . . . . . . . . . . . . . . 112.2.4 Hierarchical Ascending and Descending . . . . . . . . . . . . . . . . . . . . . . . . . . . . . . . . . . . . . . . 112.2.5 Show Empty Rows & Columns . . . . . . . . . . . . . . . . . . . . . . . . . . . . . . . . . . . . . . . . . . . . . . . 122.2.6 Swap Axes . . . . . . . . . . . . . . . . . . . . . . . . . . . . . . . . . . . . . . . . . . . . . . . . . . . . . . . . . . . . . . 122.2.7 Edit Display Option . . . . . . . . . . . . . . . . . . . . . . . . . . . . . . . . . . . . . . . . . . . . . . . . . . . . . . . . 132.2.8 Show Chart . . . . . . . . . . . . . . . . . . . . . . . . . . . . . . . . . . . . . . . . . . . . . . . . . . . . . . . . . . . . . . 142.2.9 Edit Chart Options . . . . . . . . . . . . . . . . . . . . . . . . . . . . . . . . . . . . . . . . . . . . . . . . . . . . . . . . 152.2.10 Change Data Cube . . . . . . . . . . . . . . . . . . . . . . . . . . . . . . . . . . . . . . . . . . . . . . . . . . . . . . . . 152.2.11 Show MDX Query . . . . . . . . . . . . . . . . . . . . . . . . . . . . . . . . . . . . . . . . . . . . . . . . . . . . . . . . . 162.2.12 Export to Excel . . . . . . . . . . . . . . . . . . . . . . . . . . . . . . . . . . . . . . . . . . . . . . . . . . . . . . . . . . . 162.2.13 Export to PDF . . . . . . . . . . . . . . . . . . . . . . . . . . . . . . . . . . . . . . . . . . . . . . . . . . . . . . . . . . . . 172.2.14 Edit Output Operations . . . . . . . . . . . . . . . . . . . . . . . . . . . . . . . . . . . . . . . . . . . . . . . . . . . . . 172.2.15 Save Buttons . . . . . . . . . . . . . . . . . . . . . . . . . . . . . . . . . . . . . . . . . . . . . . . . . . . . . . . . . . . . 18
2.3 Navigation Table . . . . . . . . . . . . . . . . . . . . . . . . . . . . . . . . . . . . . . . . . . . . . . . . . . . . . . . . . . . . . . . . . 182.3.1 Expand/Collapse Position . . . . . . . . . . . . . . . . . . . . . . . . . . . . . . . . . . . . . . . . . . . . . . . . . . . 182.3.2 Expand/Collapse Member . . . . . . . . . . . . . . . . . . . . . . . . . . . . . . . . . . . . . . . . . . . . . . . . . . 192.3.3 Zoom In/Out . . . . . . . . . . . . . . . . . . . . . . . . . . . . . . . . . . . . . . . . . . . . . . . . . . . . . . . . . . . . . 192.3.4 Show Source Data (Drill-through) . . . . . . . . . . . . . . . . . . . . . . . . . . . . . . . . . . . . . . . . . . . . . 202.3.5 Expand All/Collapse All . . . . . . . . . . . . . . . . . . . . . . . . . . . . . . . . . . . . . . . . . . . . . . . . . . . . 202.3.6 Zoom Out All . . . . . . . . . . . . . . . . . . . . . . . . . . . . . . . . . . . . . . . . . . . . . . . . . . . . . . . . . . . . . 20
3
Jaspersoft Style Guide and FrameMaker Template
2.4 Drill-through Table . . . . . . . . . . . . . . . . . . . . . . . . . . . . . . . . . . . . . . . . . . . . . . . . . . . . . . . . . . . . . . . . 212.4.1 Edit Properties . . . . . . . . . . . . . . . . . . . . . . . . . . . . . . . . . . . . . . . . . . . . . . . . . . . . . . . . . . . 212.4.2 Output as CSV . . . . . . . . . . . . . . . . . . . . . . . . . . . . . . . . . . . . . . . . . . . . . . . . . . . . . . . . . . . 212.4.3 Page Controls . . . . . . . . . . . . . . . . . . . . . . . . . . . . . . . . . . . . . . . . . . . . . . . . . . . . . . . . . . . . 21
2.5 Saving an Analysis View . . . . . . . . . . . . . . . . . . . . . . . . . . . . . . . . . . . . . . . . . . . . . . . . . . . . . . . . . . . 21
Chapter 3 JasperAnalysis Administration . . . . . . . . . . . . . . . . . . . . . . . . . . . . . . . . . . . . . . . . . . . 233.1 Overview . . . . . . . . . . . . . . . . . . . . . . . . . . . . . . . . . . . . . . . . . . . . . . . . . . . . . . . . . . . . . . . . . . . . . . . 233.2 Working with Analysis Views . . . . . . . . . . . . . . . . . . . . . . . . . . . . . . . . . . . . . . . . . . . . . . . . . . . . . . . . 24
3.2.1 Overview of an Analysis View . . . . . . . . . . . . . . . . . . . . . . . . . . . . . . . . . . . . . . . . . . . . . . . 243.2.2 Creating an Analysis View with a Mondrian Connection . . . . . . . . . . . . . . . . . . . . . . . . . . . 253.2.3 Creating an Analysis View with an XML/A Connection . . . . . . . . . . . . . . . . . . . . . . . . . . . . . 293.2.4 Editing an Analysis View . . . . . . . . . . . . . . . . . . . . . . . . . . . . . . . . . . . . . . . . . . . . . . . . . . . 31
3.3 Working with Analysis Options . . . . . . . . . . . . . . . . . . . . . . . . . . . . . . . . . . . . . . . . . . . . . . . . . . . . . . . 323.3.1 Changing Analysis Options . . . . . . . . . . . . . . . . . . . . . . . . . . . . . . . . . . . . . . . . . . . . . . . . . 323.3.2 Flushing the Analysis Cache . . . . . . . . . . . . . . . . . . . . . . . . . . . . . . . . . . . . . . . . . . . . . . . . 38
3.4 Editing a Mondrian Connection . . . . . . . . . . . . . . . . . . . . . . . . . . . . . . . . . . . . . . . . . . . . . . . . . . . . . . 383.5 Editing an XML/A Connection . . . . . . . . . . . . . . . . . . . . . . . . . . . . . . . . . . . . . . . . . . . . . . . . . . . . . . . 413.6 Editing an Analysis Schema . . . . . . . . . . . . . . . . . . . . . . . . . . . . . . . . . . . . . . . . . . . . . . . . . . . . . . . . . 423.7 Editing a Data Source . . . . . . . . . . . . . . . . . . . . . . . . . . . . . . . . . . . . . . . . . . . . . . . . . . . . . . . . . . . . . 433.8 Access Grant Definitions . . . . . . . . . . . . . . . . . . . . . . . . . . . . . . . . . . . . . . . . . . . . . . . . . . . . . . . . . . . 44
3.8.1 Sample Access Grant Definition . . . . . . . . . . . . . . . . . . . . . . . . . . . . . . . . . . . . . . . . . . . . . . 463.8.2 Working with the Profile Attribute Table . . . . . . . . . . . . . . . . . . . . . . . . . . . . . . . . . . . . . . . . 463.8.3 Best Practices for Designing Access Control . . . . . . . . . . . . . . . . . . . . . . . . . . . . . . . . . . . . 48
3.9 XML/A Configuration . . . . . . . . . . . . . . . . . . . . . . . . . . . . . . . . . . . . . . . . . . . . . . . . . . . . . . . . . . . . . . 493.9.1 Creating a XML/A Source . . . . . . . . . . . . . . . . . . . . . . . . . . . . . . . . . . . . . . . . . . . . . . . . . . . 493.9.2 Editing an XML/A Source . . . . . . . . . . . . . . . . . . . . . . . . . . . . . . . . . . . . . . . . . . . . . . . . . . . 50
3.10 Logging . . . . . . . . . . . . . . . . . . . . . . . . . . . . . . . . . . . . . . . . . . . . . . . . . . . . . . . . . . . . . . . . . . . . . . . . 503.11 Technical Considerations . . . . . . . . . . . . . . . . . . . . . . . . . . . . . . . . . . . . . . . . . . . . . . . . . . . . . . . . . . . 51
3.11.1 XML/A Security . . . . . . . . . . . . . . . . . . . . . . . . . . . . . . . . . . . . . . . . . . . . . . . . . . . . . . . . . . . 513.11.2 Performance Tuning . . . . . . . . . . . . . . . . . . . . . . . . . . . . . . . . . . . . . . . . . . . . . . . . . . . . . . . 51
3.12 Troubleshooting . . . . . . . . . . . . . . . . . . . . . . . . . . . . . . . . . . . . . . . . . . . . . . . . . . . . . . . . . . . . . . . . . . 523.12.1 SugarCRM Sample Analysis View Fails in WebSphere . . . . . . . . . . . . . . . . . . . . . . . . . . . . 52
Glossary . . . . . . . . . . . . . . . . . . . . . . . . . . . . . . . . . . . . . . . . . . . . . . . . . . . . . . . . . . . . . . . . . . . . . . . 53
Index . . . . . . . . . . . . . . . . . . . . . . . . . . . . . . . . . . . . . . . . . . . . . . . . . . . . . . . . . . . . . . . . . . . . . . . . . . 59
4
Introduction to JasperAnalysis
CHAPTER 1 INTRODUCTION TO JASPERANALYSIS
Jaspersoft builds on JasperReports as a comprehensive family of Business Intelligence (BI) products, providing robust static and interactive reporting, report server, and data analysis capabilities. These capabilities are available as either stand-alone products, or as part of an integrated end-to-end BI suite utilizing common metadata and providing shared services, such as security, a repository, and scheduling. Jaspersoft exposes comprehensive public integration interfaces enabling seamless integration with other applications and the ability to easily add custom functionality.
The heart of the Jaspersoft BI Suite is JasperServer. For business intelligence users, Jaspersoft offers JasperAnalysis, which runs on JasperServer and helps you:
Make well informed business decisions by identifying trends, anomalies, and correlations in your data.Quickly and easily access your OLAP (On Line Analytical Processing) data through an intuitive web interface.Explore data by drilling, pivoting, filtering, visualizing, and defining alerts based on data values.
To use JasperAnalysis, you must supply analysis schemas in XML format, corresponding to data sources (such as JDBC or JNDI), and MDX queries. The built-in JasperAnalysis user interface assembles the schemas, data source, and MDX queries into interactive analysis views. Note that the application doesn’t generate schemas or MDX queries.
This introduction includes these sections:LoginExternal Sources of InformationJaspersoft ODBO Connect
If you want to extend your knowledge of Jaspersoft BI software, our Ultimate Guides document its advanced features and configuration. They also include best practice recommendations and numerous examples. The guides are available as downloadable PDFs. Community project users can purchase individual guides or bundled documentation packs from the Jaspersoft online store. Professional and Enterprise customers can download them from the support portal.
1.1 Login
To login to JasperAnalysis:1. Enter http://hostname:8080/jasperserver-pro in your browser (where hostname is the name of the computer
where JasperServer is installed).The Login page appears.
This guide only describes JasperAnalysis functionality. For more information on logging in to Home pages and on JasperServer in general, refer to the JasperServer User Guide.
5
Jaspersoft Style Guide and FrameMaker Template
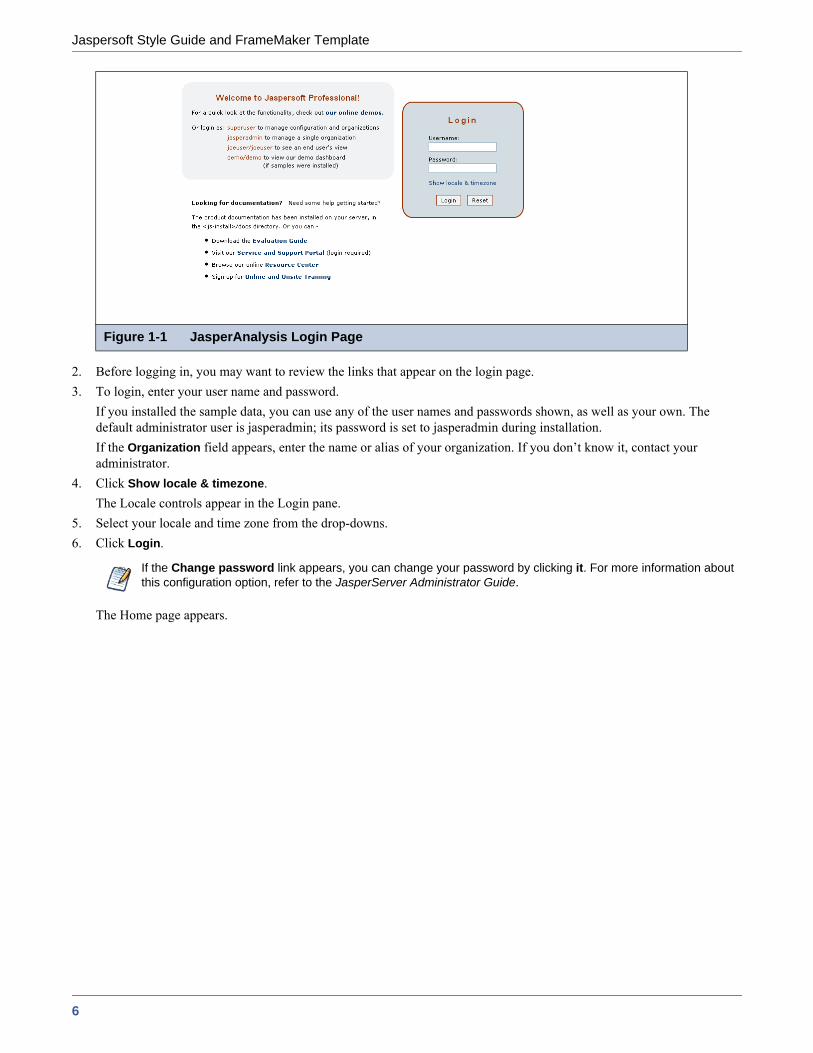
2. Before logging in, you may want to review the links that appear on the login page.3. To login, enter your user name and password.
If you installed the sample data, you can use any of the user names and passwords shown, as well as your own. The default administrator user is jasperadmin; its password is set to jasperadmin during installation.If the Organization field appears, enter the name or alias of your organization. If you don’t know it, contact your administrator.
4. Click Show locale & timezone. The Locale controls appear in the Login pane.
5. Select your locale and time zone from the drop-downs.6. Click Login.
The Home page appears.
Figure 1-1 JasperAnalysis Login Page
If the Change password link appears, you can change your password by clicking it. For more information about this configuration option, refer to the JasperServer Administrator Guide.
6
Introduction to JasperAnalysis
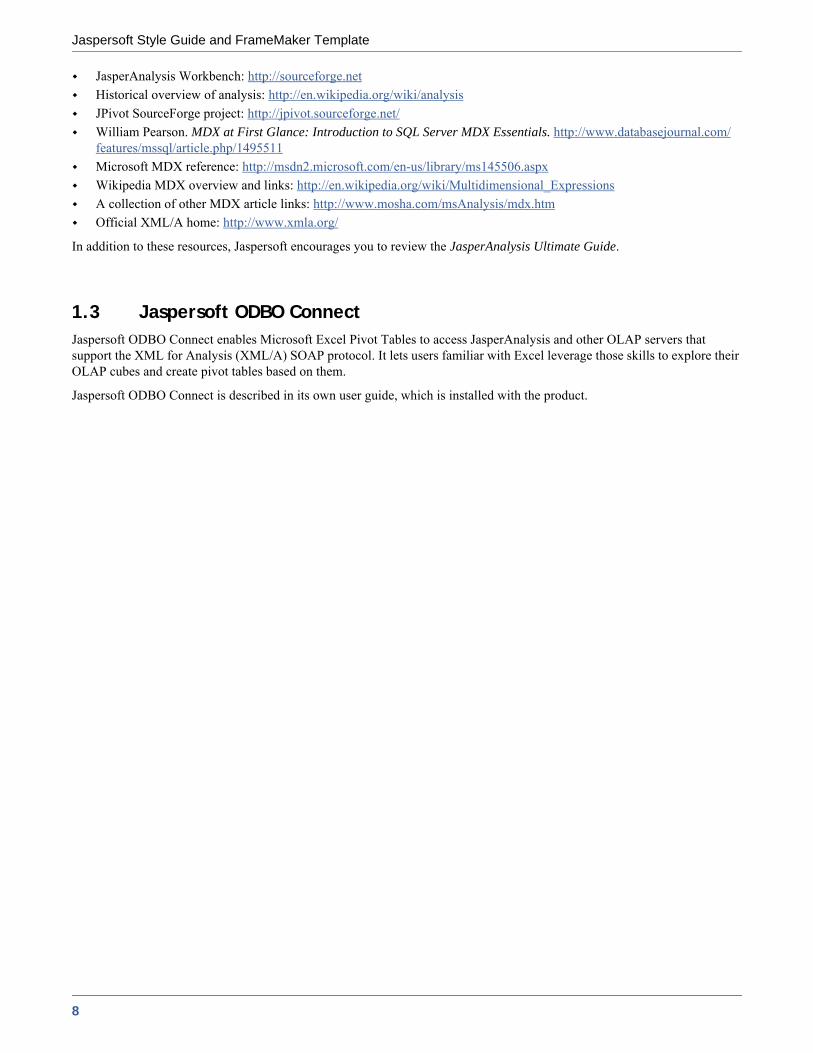
For administrators, the Home page has an additional option, manage the app:
1.2 External Sources of InformationAs analytic practices permeate the business sector, reference books about OLAP and MDX proliferate. While many focus on Microsoft SQL Server, the language concepts and syntax apply more broadly. The following resources can help you understand analysis:
Mondrian Technical Guide: http://www.jasperforge.org
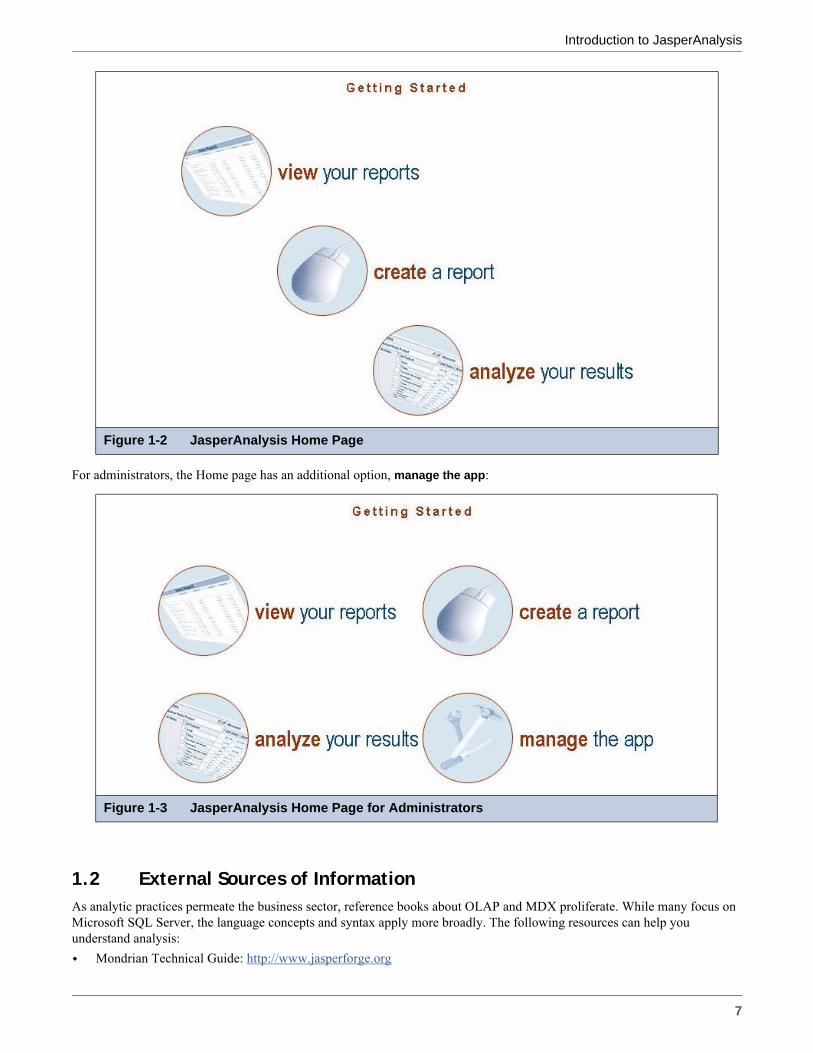
Figure 1-2 JasperAnalysis Home Page
Figure 1-3 JasperAnalysis Home Page for Administrators
7
Jaspersoft Style Guide and FrameMaker Template
JasperAnalysis Workbench: http://sourceforge.netHistorical overview of analysis: http://en.wikipedia.org/wiki/analysisJPivot SourceForge project: http://jpivot.sourceforge.net/William Pearson. MDX at First Glance: Introduction to SQL Server MDX Essentials. http://www.databasejournal.com/features/mssql/article.php/1495511Microsoft MDX reference: http://msdn2.microsoft.com/en-us/library/ms145506.aspxWikipedia MDX overview and links: http://en.wikipedia.org/wiki/Multidimensional_ExpressionsA collection of other MDX article links: http://www.mosha.com/msAnalysis/mdx.htmOfficial XML/A home: http://www.xmla.org/
In addition to these resources, Jaspersoft encourages you to review the JasperAnalysis Ultimate Guide.
1.3 Jaspersoft ODBO ConnectJaspersoft ODBO Connect enables Microsoft Excel Pivot Tables to access JasperAnalysis and other OLAP servers that support the XML for Analysis (XML/A) SOAP protocol. It lets users familiar with Excel leverage those skills to explore their OLAP cubes and create pivot tables based on them.
Jaspersoft ODBO Connect is described in its own user guide, which is installed with the product.
8
Working with Analysis Views
CHAPTER 2 WORKING WITH ANALYSIS VIEWS
JasperAnalysis is an OLAP (On Line Analytical Processing) application. OLAP applications help users analyze and understand complex data. JasperAnalysis Community edition uses JPivot for analytical processing while JasperAnalysis Professional and Enterprise provide an improved user interface
2.1 Opening an Analysis ViewAn analysis view consists of a connection and an MDX query. A connection consists of a data source, a schema, and an optional, an access control definition. JasperAnalysis contains a number of sample analysis views. Because the access control definition can provide different access to users with different roles, the view that you see depends on the permissions that apply to your roles. If you don’t see something you expect to see, check with your system administrator to ensure that you have the right access control profile. This guide assumes you are logged in as a user with the administrator role (that is, that you have access to the view and data it describes).
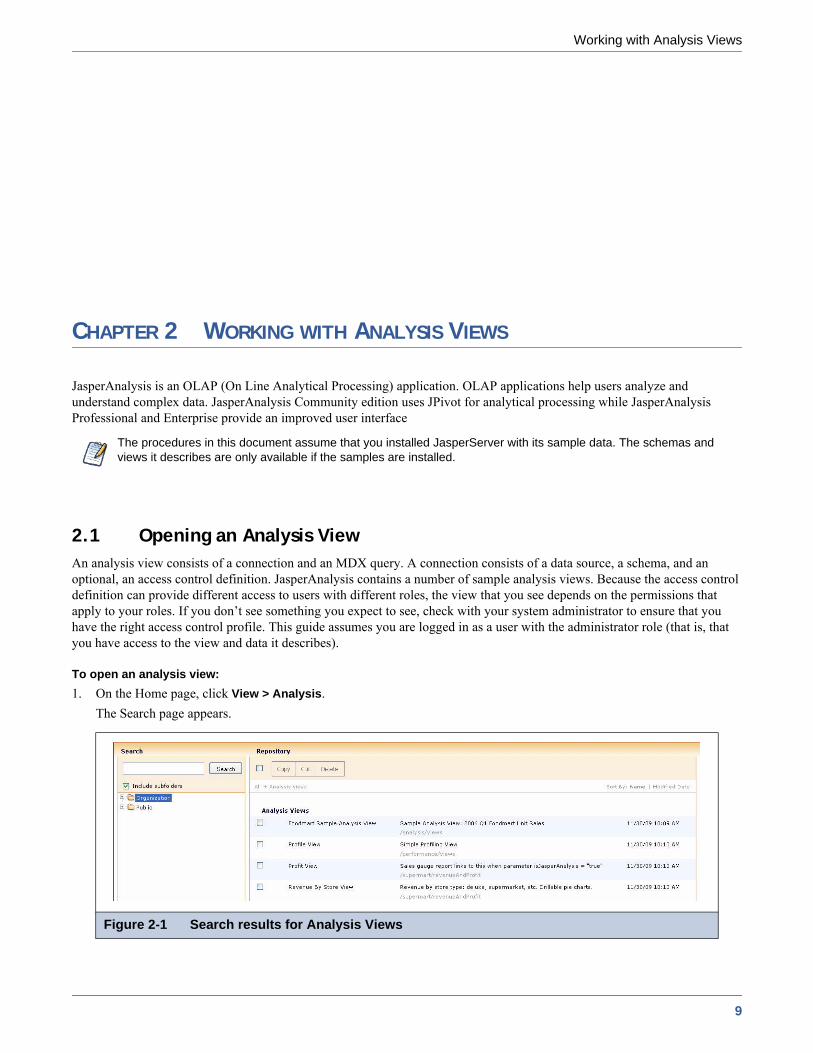
To open an analysis view:1. On the Home page, click View > Analysis.
The Search page appears.
The procedures in this document assume that you installed JasperServer with its sample data. The schemas and views it describes are only available if the samples are installed.
Figure 2-1 Search results for Analysis Views
9

Jaspersoft Style Guide and FrameMaker Template
2. To display an analysis view, right-click it and select View. For example, right-click Foodmart Sample Analysis View and select View to display the Foodmart sample.
JasperAnalysis displays the default state of the view. Click the tool bar buttons and values in the navigation table to explore the data.
2.2 Tool BarThe tool bar on left side of the view (Figure 2-2 on page 10) provides access to many JasperAnalysis operations and features described in the following sections.
2.2.1 Drill into a Dimension Member
Figure 2-2 Foodmart Sample Analysis View
Zoom on Drill Toggles (that is, turns on or off) the zoom in/out hyperlinks for hierarchy members. In the following navigation table, Zoom on Drill is selected; All Media and All Products are hyperlinks; click them to view the members of their hierarchies.
10
Working with Analysis Views
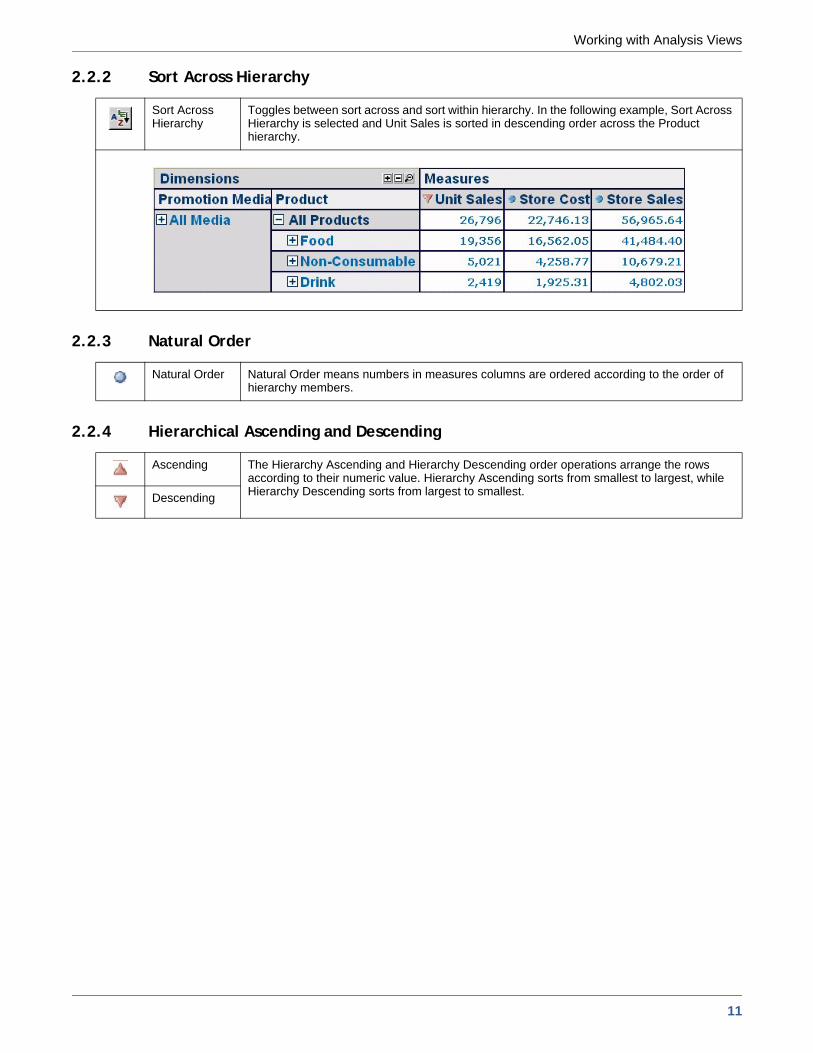
2.2.2 Sort Across Hierarchy
2.2.3 Natural Order
2.2.4 Hierarchical Ascending and Descending
Sort Across Hierarchy
Toggles between sort across and sort within hierarchy. In the following example, Sort Across Hierarchy is selected and Unit Sales is sorted in descending order across the Product hierarchy.
Natural Order Natural Order means numbers in measures columns are ordered according to the order of hierarchy members.
Ascending The Hierarchy Ascending and Hierarchy Descending order operations arrange the rows according to their numeric value. Hierarchy Ascending sorts from smallest to largest, while Hierarchy Descending sorts from largest to smallest.Descending
11
Jaspersoft Style Guide and FrameMaker Template
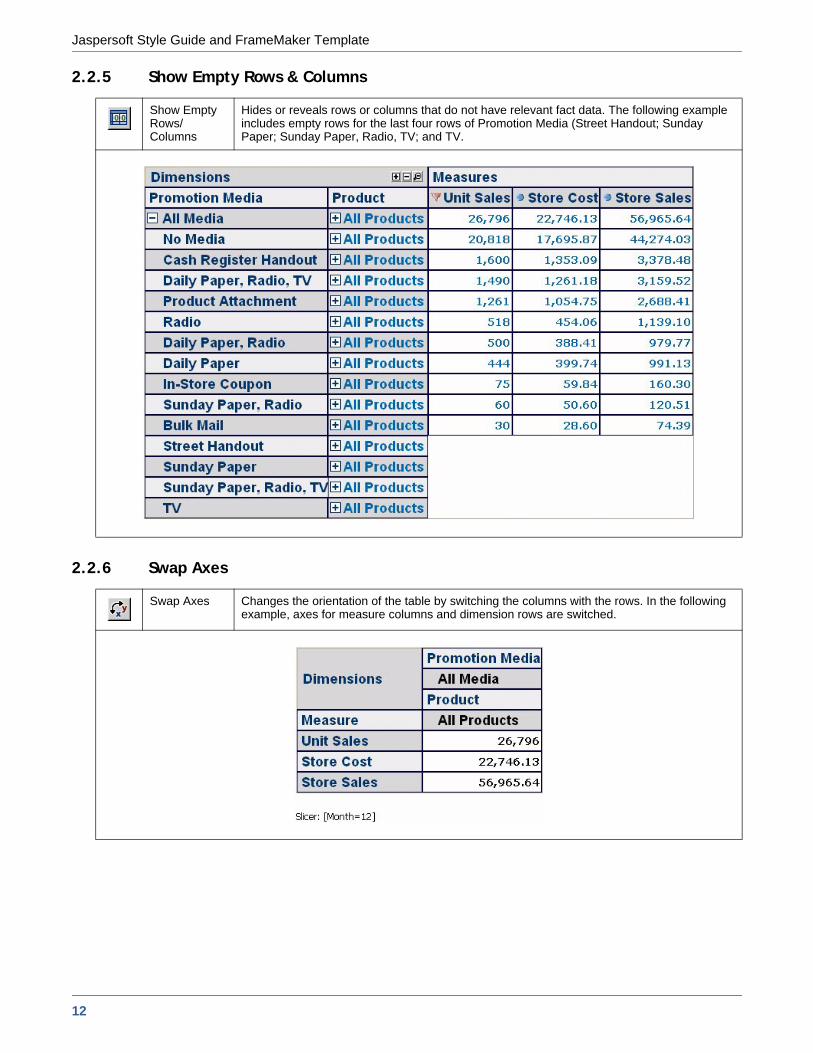
2.2.5 Show Empty Rows & Columns
2.2.6 Swap Axes
Show Empty Rows/Columns
Hides or reveals rows or columns that do not have relevant fact data. The following example includes empty rows for the last four rows of Promotion Media (Street Handout; Sunday Paper; Sunday Paper, Radio, TV; and TV.
Swap Axes Changes the orientation of the table by switching the columns with the rows. In the following example, axes for measure columns and dimension rows are switched.
12
Working with Analysis Views
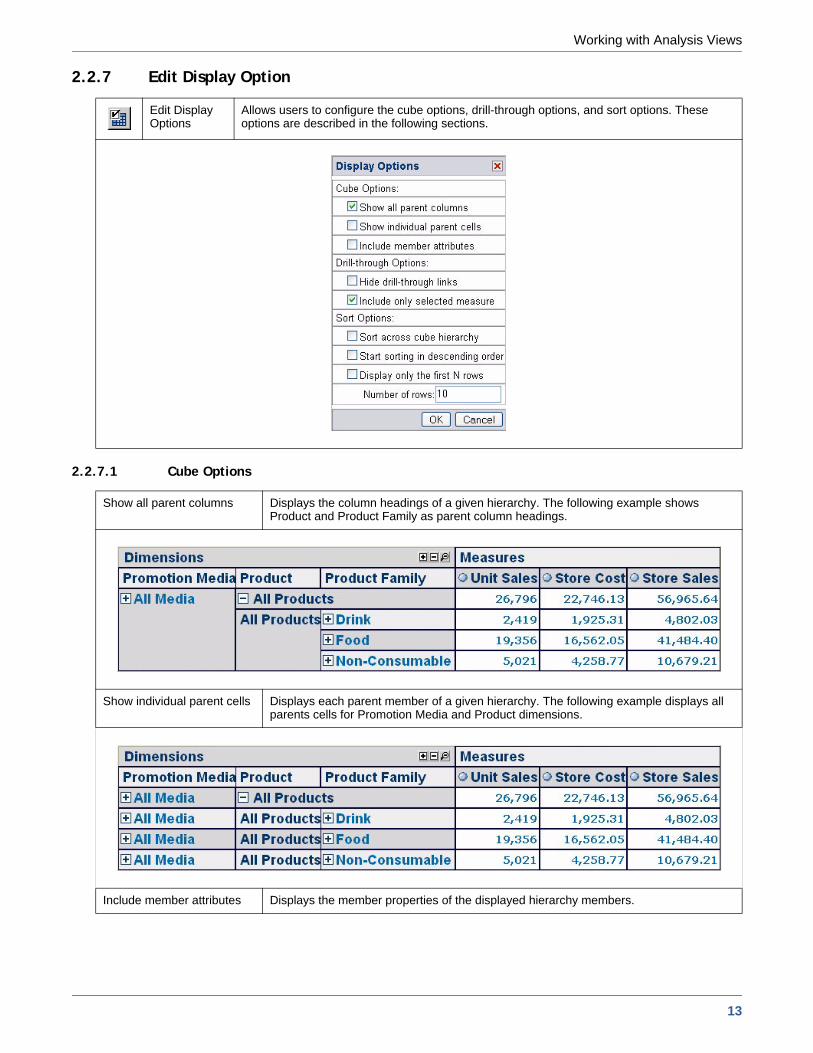
2.2.7 Edit Display Option
2.2.7.1 Cube Options
Edit Display Options
Allows users to configure the cube options, drill-through options, and sort options. These options are described in the following sections.
Show all parent columns Displays the column headings of a given hierarchy. The following example shows Product and Product Family as parent column headings.
Show individual parent cells Displays each parent member of a given hierarchy. The following example displays all parents cells for Promotion Media and Product dimensions.
Include member attributes Displays the member properties of the displayed hierarchy members.
13

Jaspersoft Style Guide and FrameMaker Template
2.2.7.2 Drill-through Operations
2.2.7.3 Sort Option
2.2.8 Show Chart
Show table below cube (on same page)
Displays the drill-through table below the navigation table. By default, the drill-through table appears in a separate browser window.
Hide drill-through links Removes the hyperlinks from the fact data in measures.
Include only selected measure
Limits the display to only the selected measure in the drill-through table.
Sort across cube hierarchy
Changes the behavior of sorting across or within dimension hierarchies. See 2.2.2, “Sort Across Hierarchy,” on page 11.
Start sorting in descending order
Toggles the sort behavior between ascending and descending.
Display only the first N rows
Limits the number of rows displayed after sorting.
Show Chart Displays a chart of the navigation table data. The following example shows a pie chart that represents the columns in these measures: Unit Sales, Store Cost, and Store Sales.
14
Working with Analysis Views
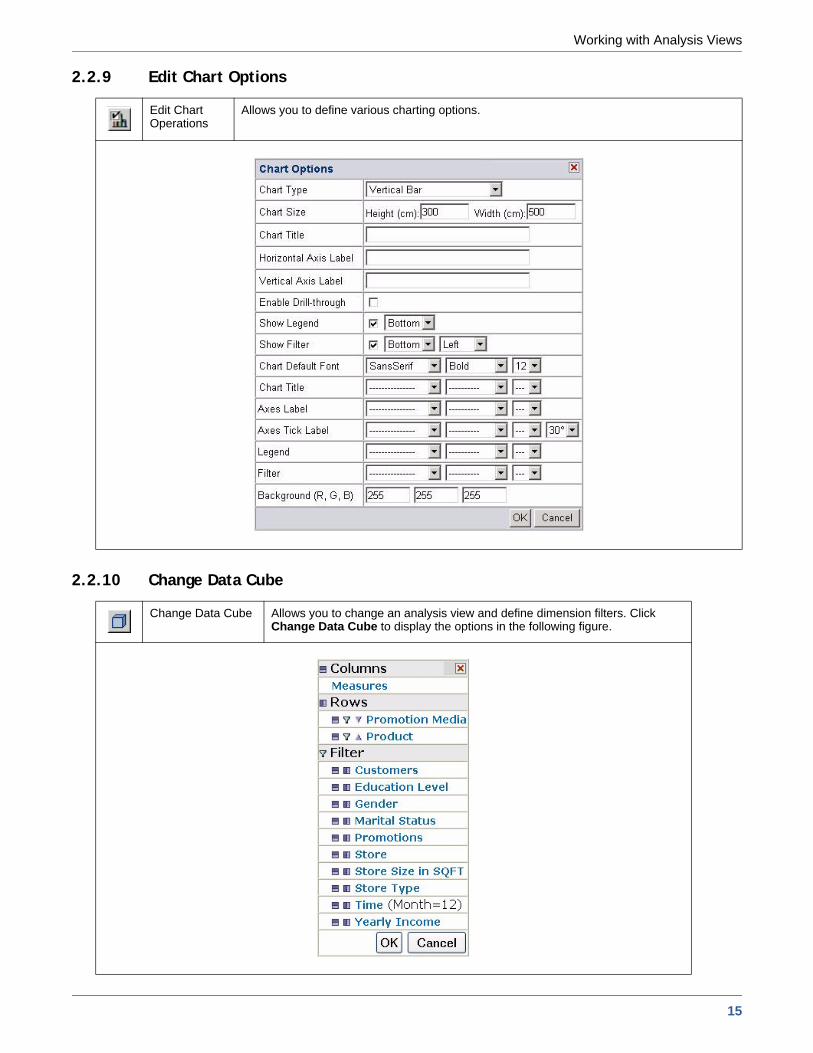
2.2.9 Edit Chart Options
2.2.10 Change Data Cube
Edit Chart Operations
Allows you to define various charting options.
Change Data Cube Allows you to change an analysis view and define dimension filters. Click Change Data Cube to display the options in the following figure.
15

Jaspersoft Style Guide and FrameMaker Template
2.2.11 Show MDX Query
2.2.12 Export to Excel
Columns Allows users to select specific measures to display.
Rows Allows users to select specific dimension members to display.
Filter Allows users to select specific dimension members that don’t appear in the navigation table. This selection determines the data displayed in the navigation table.
Show MDX Query
Allows you to change the navigation table by editing the MDX query that generates the view. This feature is intended for advanced users familiar with MDX and the data structures underlying the view.
Export to Excel
Prompts you to view or save the current navigation table in Microsoft Excel format.
16
Working with Analysis Views
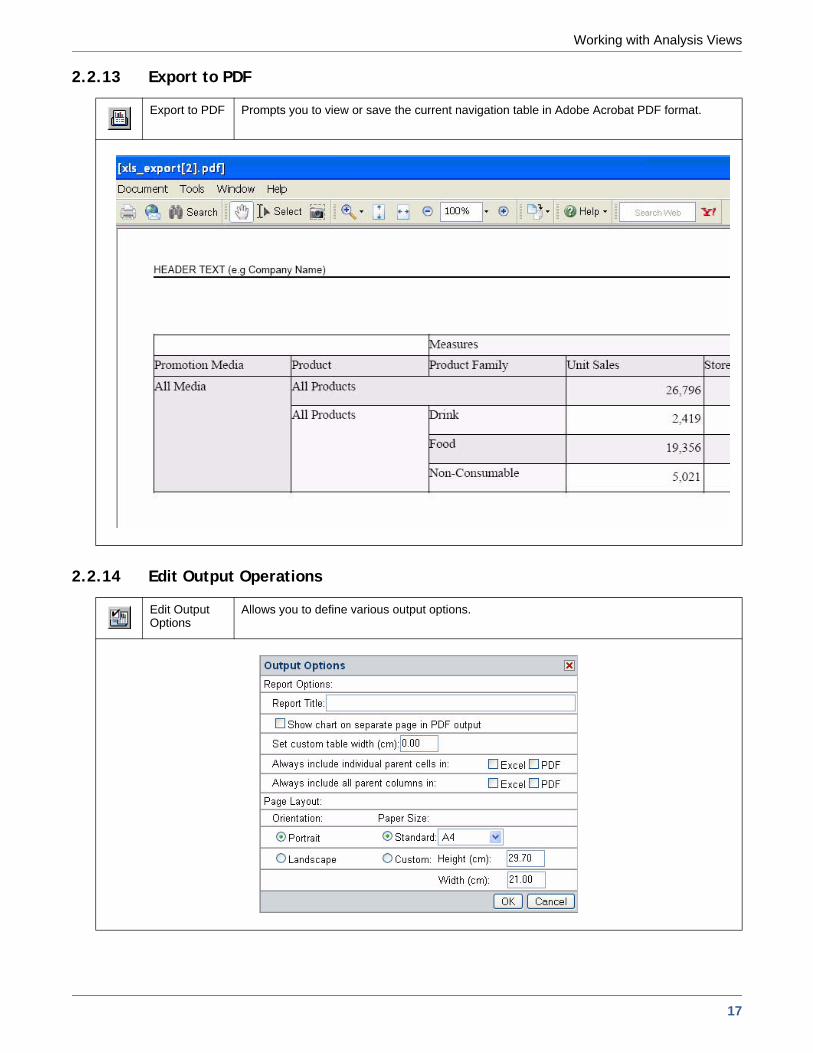
2.2.13 Export to PDF
2.2.14 Edit Output Operations
Export to PDF Prompts you to view or save the current navigation table in Adobe Acrobat PDF format.
Edit Output Options
Allows you to define various output options.
17
Jaspersoft Style Guide and FrameMaker Template
2.2.15 Save Buttons
For more information, refer to 2.5, “Saving an Analysis View,” on page 21.
2.3 Navigation TableThe navigation table appears at the top of the analysis view (Figure 2-2 on page 10). It determines the data that is displayed, both in the main view and in drill-through tables.
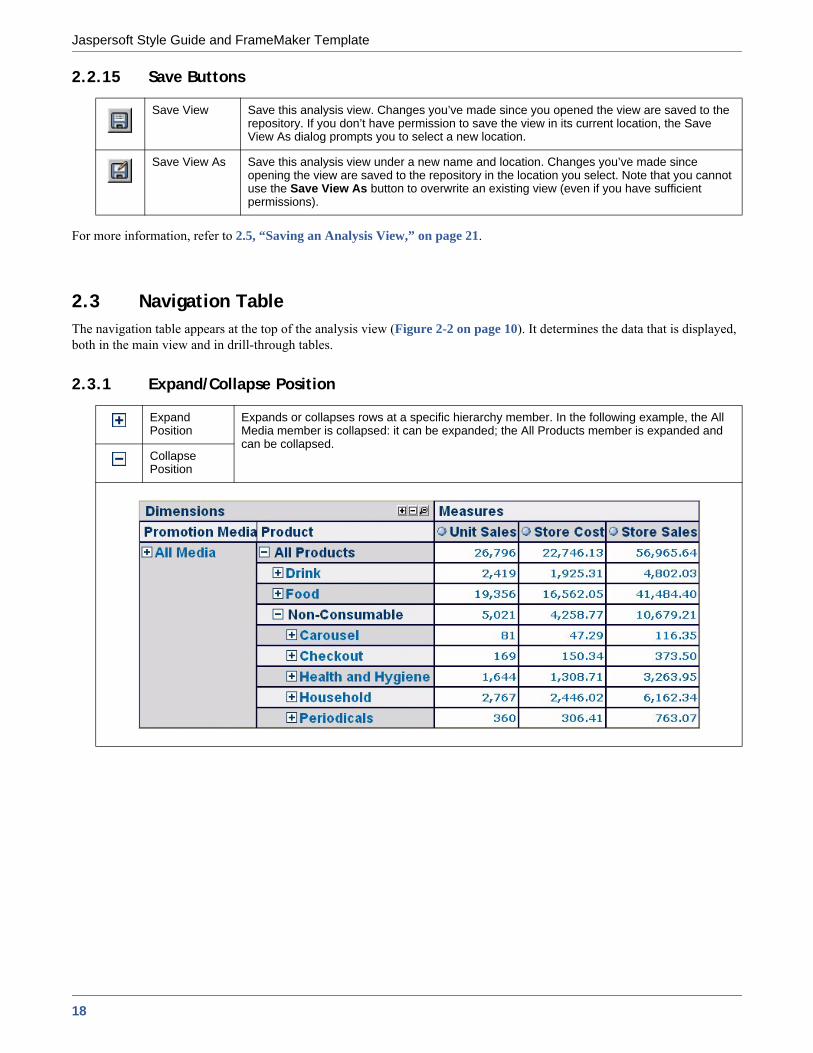
2.3.1 Expand/Collapse Position
Save View Save this analysis view. Changes you’ve made since you opened the view are saved to the repository. If you don’t have permission to save the view in its current location, the Save View As dialog prompts you to select a new location.
Save View As Save this analysis view under a new name and location. Changes you’ve made since opening the view are saved to the repository in the location you select. Note that you cannot use the Save View As button to overwrite an existing view (even if you have sufficient permissions).
Expand Position
Expands or collapses rows at a specific hierarchy member. In the following example, the All Media member is collapsed: it can be expanded; the All Products member is expanded and can be collapsed.
Collapse Position
18
Working with Analysis Views
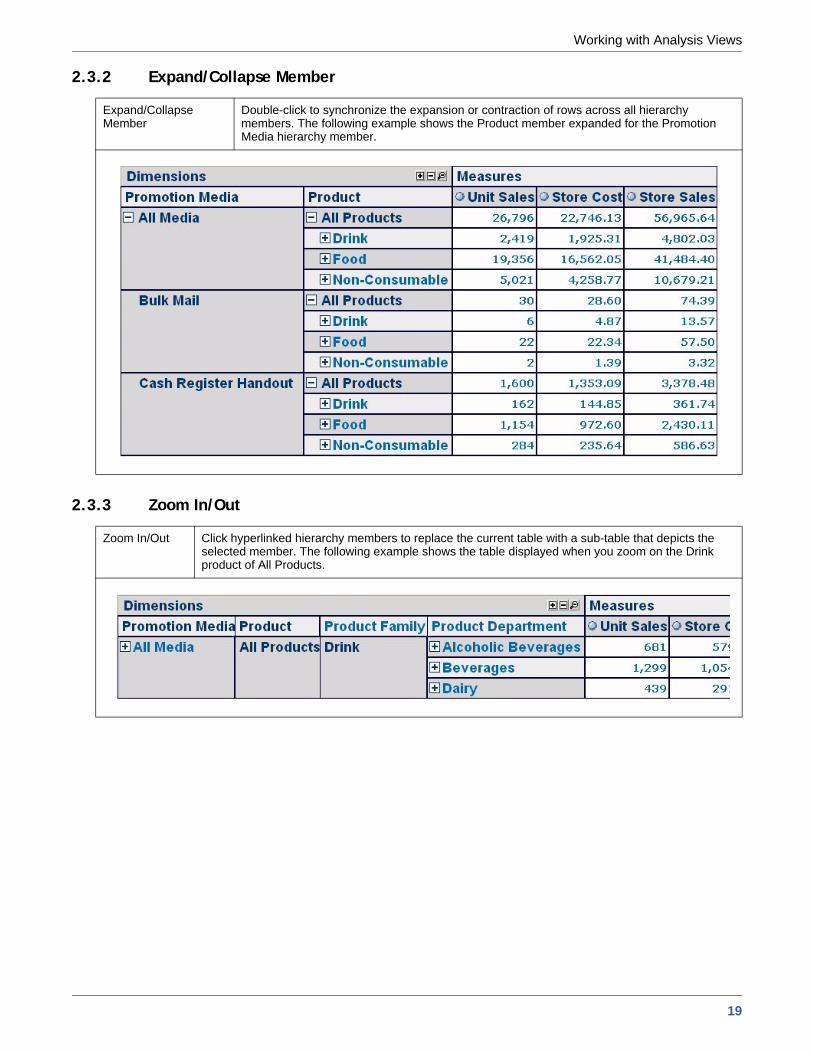
2.3.2 Expand/Collapse Member
2.3.3 Zoom In/Out
Expand/Collapse Member
Double-click to synchronize the expansion or contraction of rows across all hierarchy members. The following example shows the Product member expanded for the Promotion Media hierarchy member.
Zoom In/Out Click hyperlinked hierarchy members to replace the current table with a sub-table that depicts the selected member. The following example shows the table displayed when you zoom on the Drink product of All Products.
19
Jaspersoft Style Guide and FrameMaker Template
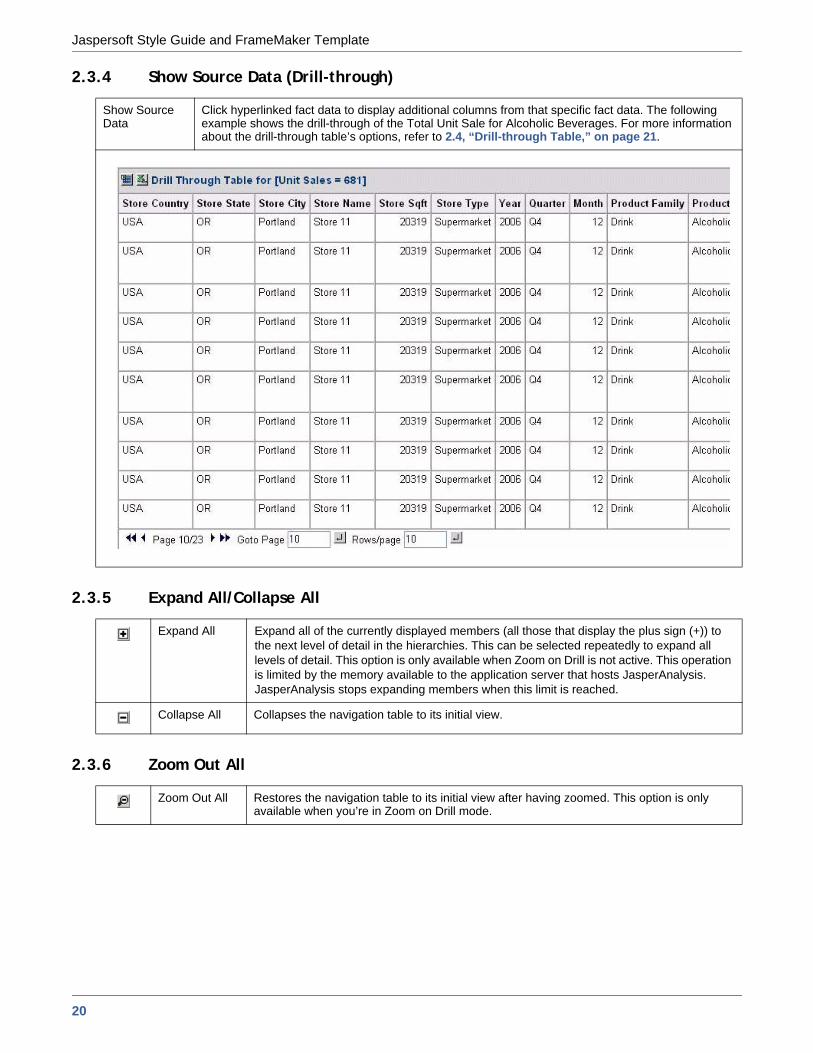
2.3.4 Show Source Data (Drill-through)
2.3.5 Expand All/Collapse All
2.3.6 Zoom Out All
Show Source Data
Click hyperlinked fact data to display additional columns from that specific fact data. The following example shows the drill-through of the Total Unit Sale for Alcoholic Beverages. For more information about the drill-through table’s options, refer to 2.4, “Drill-through Table,” on page 21.
Expand All Expand all of the currently displayed members (all those that display the plus sign (+)) to the next level of detail in the hierarchies. This can be selected repeatedly to expand all levels of detail. This option is only available when Zoom on Drill is not active. This operation is limited by the memory available to the application server that hosts JasperAnalysis. JasperAnalysis stops expanding members when this limit is reached.
Collapse All Collapses the navigation table to its initial view.
Zoom Out All Restores the navigation table to its initial view after having zoomed. This option is only available when you’re in Zoom on Drill mode.
20
Working with Analysis Views
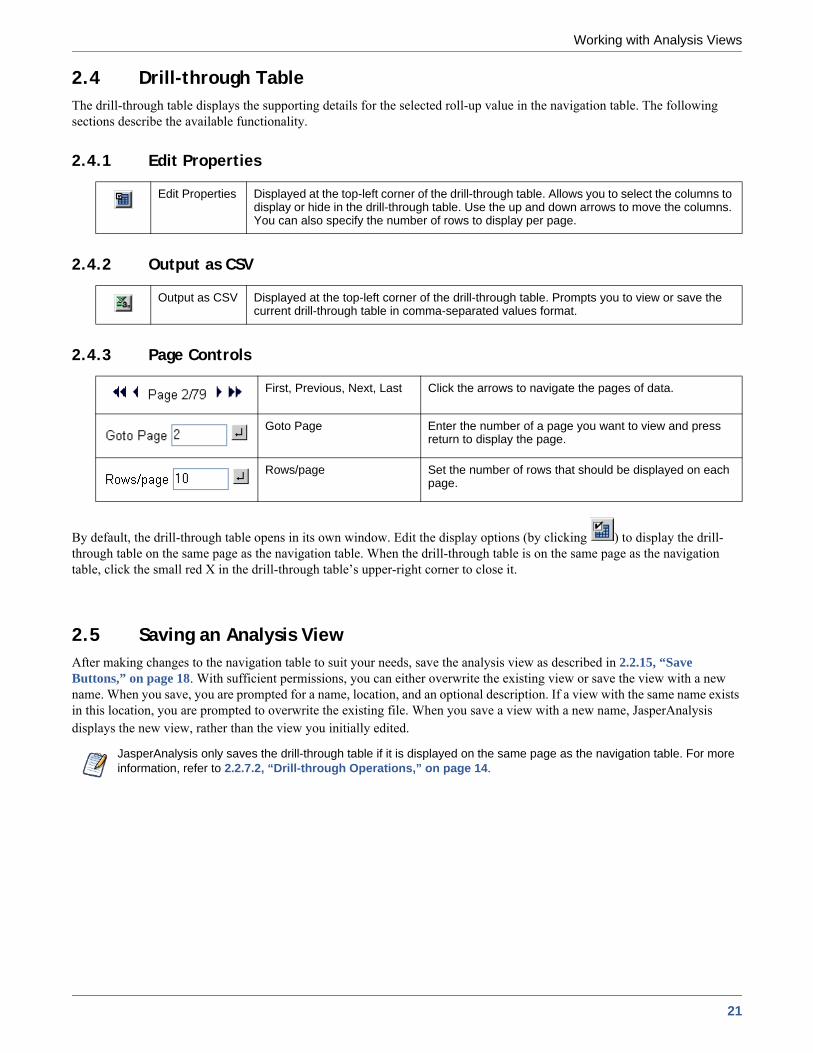
2.4 Drill-through TableThe drill-through table displays the supporting details for the selected roll-up value in the navigation table. The following sections describe the available functionality.
2.4.1 Edit Properties
2.4.2 Output as CSV
2.4.3 Page Controls
By default, the drill-through table opens in its own window. Edit the display options (by clicking ) to display the drill-through table on the same page as the navigation table. When the drill-through table is on the same page as the navigation table, click the small red X in the drill-through table’s upper-right corner to close it.
2.5 Saving an Analysis ViewAfter making changes to the navigation table to suit your needs, save the analysis view as described in 2.2.15, “Save Buttons,” on page 18. With sufficient permissions, you can either overwrite the existing view or save the view with a new name. When you save, you are prompted for a name, location, and an optional description. If a view with the same name exists in this location, you are prompted to overwrite the existing file. When you save a view with a new name, JasperAnalysis displays the new view, rather than the view you initially edited.
Edit Properties Displayed at the top-left corner of the drill-through table. Allows you to select the columns to display or hide in the drill-through table. Use the up and down arrows to move the columns. You can also specify the number of rows to display per page.
Output as CSV Displayed at the top-left corner of the drill-through table. Prompts you to view or save the current drill-through table in comma-separated values format.
First, Previous, Next, Last Click the arrows to navigate the pages of data.
Goto Page Enter the number of a page you want to view and press return to display the page.
Rows/page Set the number of rows that should be displayed on each page.
JasperAnalysis only saves the drill-through table if it is displayed on the same page as the navigation table. For more information, refer to 2.2.7.2, “Drill-through Operations,” on page 14.
21

Jaspersoft Style Guide and FrameMaker Template
22
JasperAnalysis Administration
CHAPTER 3 JASPERANALYSIS ADMINISTRATION
JasperAnalysis administration involves repository management and performance tuning. For information about more general administrative tasks, such as access control, see the JasperServer Administrator Guide.
This chapter includes:OverviewWorking with Analysis ViewsWorking with Analysis OptionsEditing a Mondrian ConnectionEditing an XML/A ConnectionEditing an Analysis SchemaEditing a Data SourceAccess Grant DefinitionsXML/A ConfigurationLoggingTechnical ConsiderationsTroubleshooting
3.1 OverviewJasperAnalysis lets you analyze data organized into a hierarchical dimensional model, which has cubes and dimensions as its primary entities. In a relational database implementation of online analytical processing (OLAP), the entities reside in relational tables. This is sometimes referred to as Relational OLAP (ROLAP).
JasperAnalysis is based on an open source ROLAP server called Mondrian. JPivot, an open source web-based OLAP user interface, enables users to display and navigate Mondrian’s results. JasperAnalysis Professional and Enterprise include an improved JPivot user interface (as compared to JPivot or JasperServer Community Edition).
The de facto standard for OLAP query languages is MDX. Many analysis applications use MDX. In a distributed computing environment, XML for Analysis (XML/A) is the standard for accessing OLAP data sources remotely. XML/A uses a web services architecture. It transmits MDX queries using the SOAP protocol.
The Manage menu, discussed in some of the following sections, only appears if you have the superuser role.
23
Jaspersoft Style Guide and FrameMaker Template
To implement and maintain JasperAnalysis:1. Store cube data in a relational database and use an OLAP schema file to define the cubes. Note that using existing
transactional databases may be inefficient with large amounts of data. To improve performance, use an extract, transform, and load (ETL) process: extract information from one or more data sources, integrate and transform the data, and load the result into the separate cube database.
2. Identify facts or measures (the values to summarize) and dimensions (divisions of the measures – for example, dividing time into weeks, months, and years) in the cube database.
3. Define a JasperAnalysis schema, mapping logical facts and dimensions onto the physical database. The JasperAnalysis OLAP engine uses the schema to interpret the database and perform OLAP queries. The JasperAnalysis Schema Workbench enables you to develop, validate, and test schemas against the database. The Mondrian Technical Guide gives details of schemas and their options.
4. Create an analysis client connection that includes your schema and a database connection. Optionally, define data level security for the cube with access grants that limit users to only the data they are allowed to see, based on their roles and user profile information. The repository stores the information you provide to define the analysis client connection.
5. Define entry points for analysis of the cube data, known as analysis views in JasperAnalysis. Analysis views enable end users to interact with cubes without having to know query languages, database connections, and other technical details. An analysis view is an MDX query that is run against the cube as a starting point for interactive analysis. Analysis views appear as options that users can select through the web-based user interface. You can use the JasperAnalysis Schema Workbench to develop and test MDX queries.
6. If you have defined access grants, test them by using the Log in As function to impersonate users with different roles.7. Plan for updates to data in the cube, usually on a regular basis (for example, nightly or weekly). After an update, flush
(empty) the JasperAnalysis data cache, which the server maintains to improve performance, so that subsequent queries get the results of new data. For more information, see 3.11, “Technical Considerations,” on page 51.
8. Tune for performance. As a database administrator, analyze the SQL queries that JasperAnalysis issues against the cube database. JasperAnalysis has built-in tools that enable you to track queries (for information, refer to 3.11, “Technical Considerations,” on page 51). Tune the cube database accordingly with tools specific to the database type (for example, indexes and data striping). With large data volumes, you can create pre-calculated tables during the data load (ETL) process to aggregate measure values. JasperAnalysis can use the aggregate tables to replace calculations and thus improve query performance.
9. Design your environment for scalability and availability. JasperAnalysis can run on a single machine. However, for large numbers of users, large data volumes, and high availability, you can use a multi-machine environment with load balancers and some machines dedicated to either OLAP user interface or OLAP server duties. You can use XML/A to distribute processing.
The detailed procedures beginning in 3.2.2, “Creating an Analysis View with a Mondrian Connection,” on page 25 step you through the process of setting up all components of an analysis view.
3.2 Working with Analysis ViewsThis section describes basic administration of analysis views, including:
Overview of an Analysis ViewCreating an Analysis View with a Mondrian ConnectionCreating an Analysis View with an XML/A ConnectionEditing an Analysis View
3.2.1 Overview of an Analysis ViewAn analysis view is a collection of multidimensional data that is based on an analysis client connection and an MDX query. It is the entry point to analysis operations, such as slice and dice, drill down, and drill through. Creating a view entails identifying the elements that allow JasperAnalysis to retrieve and secure the data.
24

JasperAnalysis Administration
3.2.2 Creating an Analysis View with a Mondrian Connection
To create an analysis view with local Mondrian connection and an MDX query: 1. Click View > Repository.
The Search page appears. 2. In the Search pane, navigate to Organization > Analysis Components > Analysis Views.3. Right-click the Analysis Views folder and and select Add Resource > Other > Analysis View from the context menu.
The Naming window appears, prompting you for basic details about the new view.
4. Enter a name, label, and description for the new view, and click Next.The Connection Type window appears, prompting you to create a local connection or a remote XML/A connection.
Figure 3-1 Elements of a Mondrian Connection
Figure 3-2 Naming the Connection
Figure 3-3 Selecting a Connection Type
Mondrian Schema *
Mondrian Connection
JNDI/JDBC Data Source Access Grants (Optional)
Mondrian Connection
JNDI/JDBC Data Source Access Grants (Optional)
* Metadata: XML file in repository
25
Jaspersoft Style Guide and FrameMaker Template
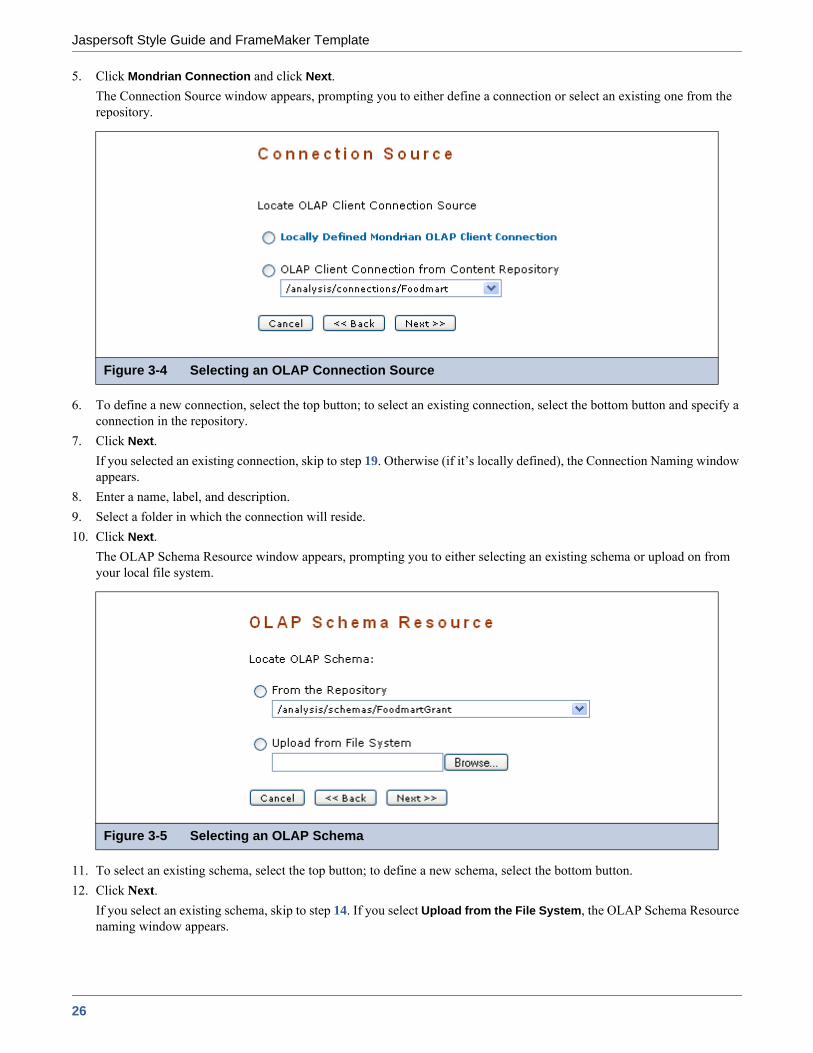
5. Click Mondrian Connection and click Next.The Connection Source window appears, prompting you to either define a connection or select an existing one from the repository.
6. To define a new connection, select the top button; to select an existing connection, select the bottom button and specify a connection in the repository.
7. Click Next.If you selected an existing connection, skip to step 19. Otherwise (if it’s locally defined), the Connection Naming window appears.
8. Enter a name, label, and description.9. Select a folder in which the connection will reside.10. Click Next.
The OLAP Schema Resource window appears, prompting you to either selecting an existing schema or upload on from your local file system.
11. To select an existing schema, select the top button; to define a new schema, select the bottom button.12. Click Next.
If you select an existing schema, skip to step 14. If you select Upload from the File System, the OLAP Schema Resource naming window appears.
Figure 3-4 Selecting an OLAP Connection Source
Figure 3-5 Selecting an OLAP Schema
26
JasperAnalysis Administration
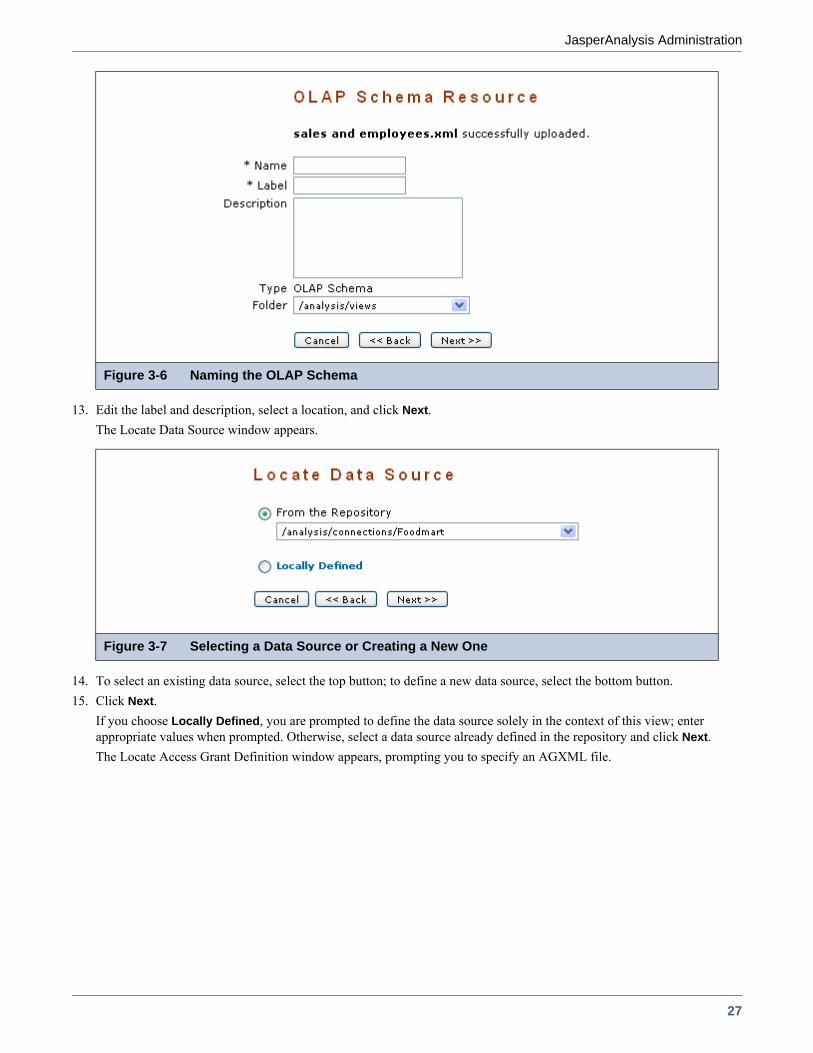
13. Edit the label and description, select a location, and click Next.The Locate Data Source window appears.
14. To select an existing data source, select the top button; to define a new data source, select the bottom button.15. Click Next.
If you choose Locally Defined, you are prompted to define the data source solely in the context of this view; enter appropriate values when prompted. Otherwise, select a data source already defined in the repository and click Next.The Locate Access Grant Definition window appears, prompting you to specify an AGXML file.
Figure 3-6 Naming the OLAP Schema
Figure 3-7 Selecting a Data Source or Creating a New One
27
Jaspersoft Style Guide and FrameMaker Template
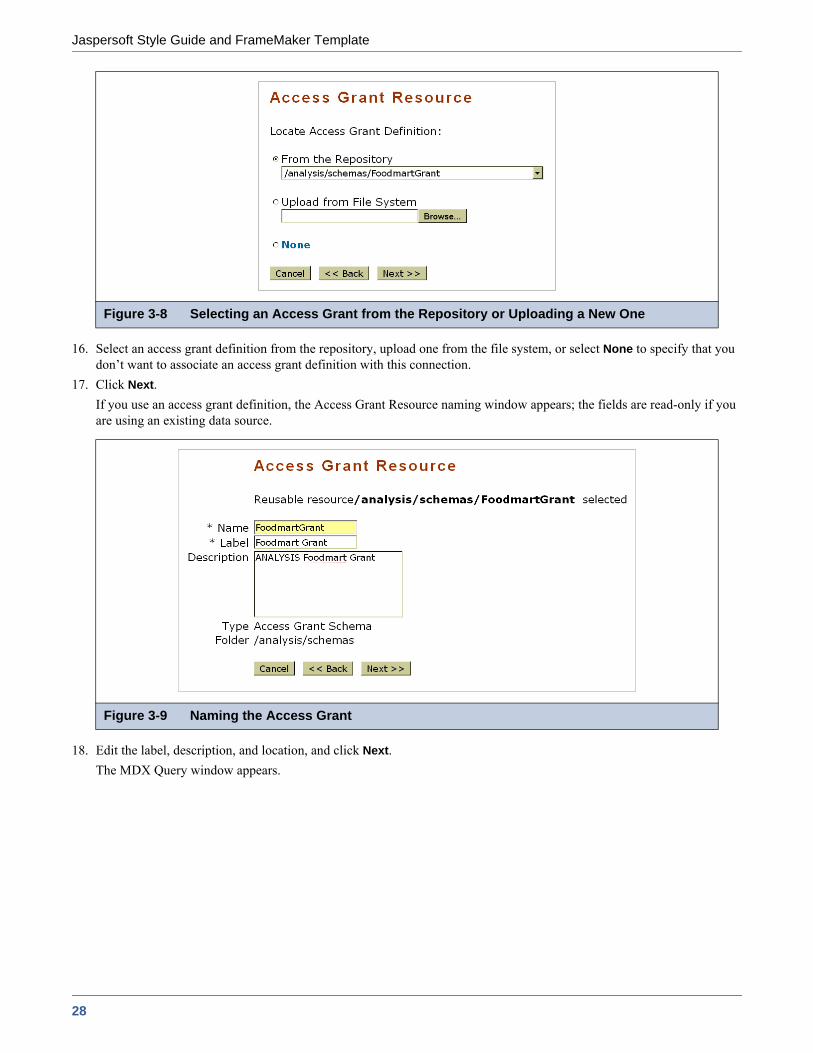
16. Select an access grant definition from the repository, upload one from the file system, or select None to specify that you don’t want to associate an access grant definition with this connection.
17. Click Next.If you use an access grant definition, the Access Grant Resource naming window appears; the fields are read-only if you are using an existing data source.
18. Edit the label, description, and location, and click Next.The MDX Query window appears.
Figure 3-8 Selecting an Access Grant from the Repository or Uploading a New One
Figure 3-9 Naming the Access Grant
28
JasperAnalysis Administration
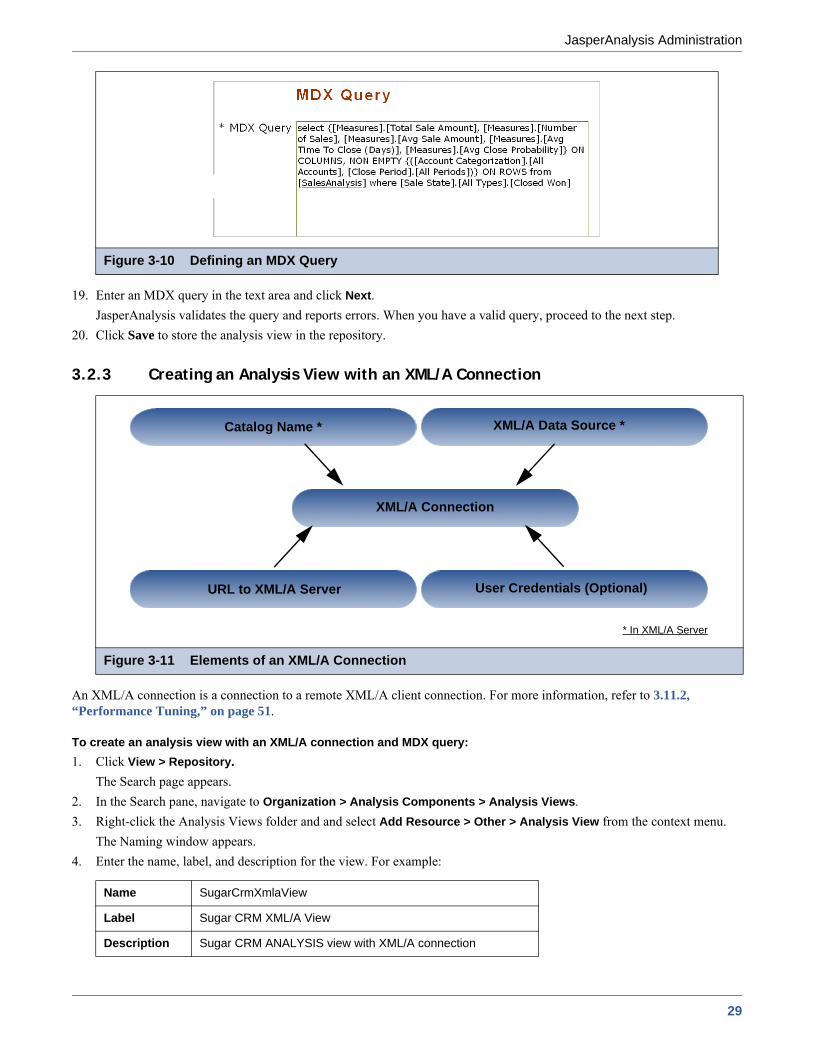
19. Enter an MDX query in the text area and click Next.JasperAnalysis validates the query and reports errors. When you have a valid query, proceed to the next step.
20. Click Save to store the analysis view in the repository.
3.2.3 Creating an Analysis View with an XML/A Connection
An XML/A connection is a connection to a remote XML/A client connection. For more information, refer to 3.11.2, “Performance Tuning,” on page 51.
To create an analysis view with an XML/A connection and MDX query:1. Click View > Repository.
The Search page appears.2. In the Search pane, navigate to Organization > Analysis Components > Analysis Views.3. Right-click the Analysis Views folder and and select Add Resource > Other > Analysis View from the context menu.
The Naming window appears.4. Enter the name, label, and description for the view. For example:
Figure 3-10 Defining an MDX Query
Figure 3-11 Elements of an XML/A Connection
Name SugarCrmXmlaView
Label Sugar CRM XML/A View
Description Sugar CRM ANALYSIS view with XML/A connection
XML/A Connection
XML/A Data Source *
* In XML/A Server
Catalog Name *
User Credentials (Optional)URL to XML/A Server
29

Jaspersoft Style Guide and FrameMaker Template
5. Click Next.The connection type window appears.
6. Click XML/A Connection and click Next.The Connection Source window appears.
7. Click Locally Defined XML/A OLAP Client Connection and click Next.The XML/A Connection window appears.
8. Define the remote connection. Your options fall into three categories:General details include the name, label, and description of the connection.Data options include the catalog, data source, and URI of the data that this connection should return. These details describe data store in your remote JasperServer instance.Credential include the name and password JasperAnalysis can pass to the remote JasperAnalysis instance to log in. If this user’s password changes, the connection will fail. You can leave the User Name and Password fields blank, so the logged in user’s credentials are passed to the remote server when the connection is accessed.
9. Select a location for the new data source.10. Click Next.
The MDX Query window appears.
Figure 3-12 Connection Source
Figure 3-13 Defining XML/A Connection Options
30
JasperAnalysis Administration
11. Enter an MDX query. For example: select {[Measures].[Unit Sales], [Measures].[Store Cost], [Measures].[StoreSales]} on columns, {([Promotion Media].[All Media], [Product].[All Products])}
ON rows from Sales where ([Time].[2006].[Q4].[12])
12. Click Next.A message appears, indicating that the connection was validated successfully.
13. Click Save to store the new view in the repository.The new analysis view resides in the repository at /analysis/views.
To work with the analysis view, click View > Analysis, and then click the view’s name (for example, SugarCrmXmlaView).
3.2.4 Editing an Analysis View
To change the naming, connection, and an MDX query in analysis view:1. In the Search field, enter the name of the view you want to edit, and click Search.
You can enter a partial name, instead.2. For example, enter sugar.
The Search page appears, displaying the repository objects that match the text you enter.3. Right-click the SugarCRM Sample Analysis View, and click Edit in the context menu.4. To rename the analysis view, change the label and/or description to reflect the changes you are making to the analysis
view.
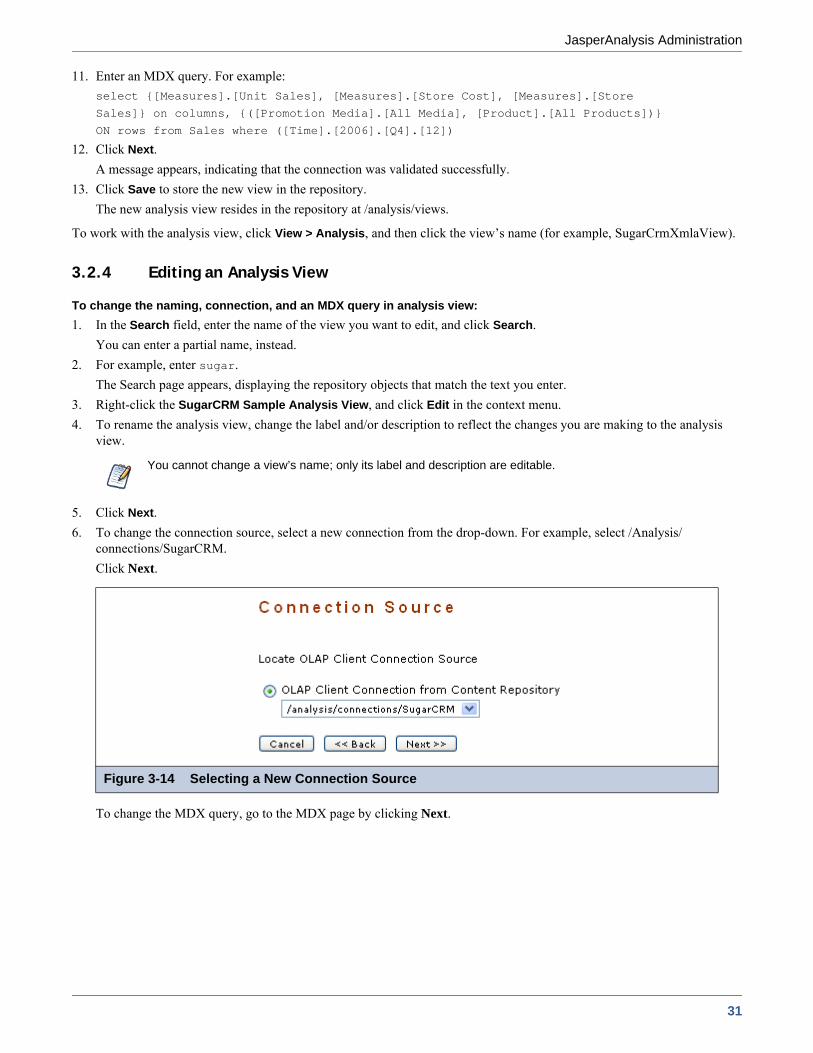
5. Click Next.6. To change the connection source, select a new connection from the drop-down. For example, select /Analysis/
connections/SugarCRM.Click Next.
To change the MDX query, go to the MDX page by clicking Next.
You cannot change a view’s name; only its label and description are editable.
Figure 3-14 Selecting a New Connection Source
31

Jaspersoft Style Guide and FrameMaker Template
7. Click Save to save the changes.A message appears, indicating that the connection was validated successfully.
3.3 Working with Analysis OptionsVarious configurable properties control the analysis engine’s behavior. In most cases, you can use the default values for these properties. However, if you want to tune performance, you may need to change them.
3.3.1 Changing Analysis Options
To change the analysis options:1. Click Manage > Analysis Options.
The Analysis Options page appears.
Figure 3-15 Defining an MDX Query
You can also edit a view’s MDX query by modifying the navigation table and saving the view.
Jaspersoft recommends that you carefully review the effects of the changes you make to the performance tuning variables, and to test such changes before using them in a production environment.
You must be logged in as a user with the ROLE_SUPERUSER role to access the Manage > Analysis Options option.
32
JasperAnalysis Administration
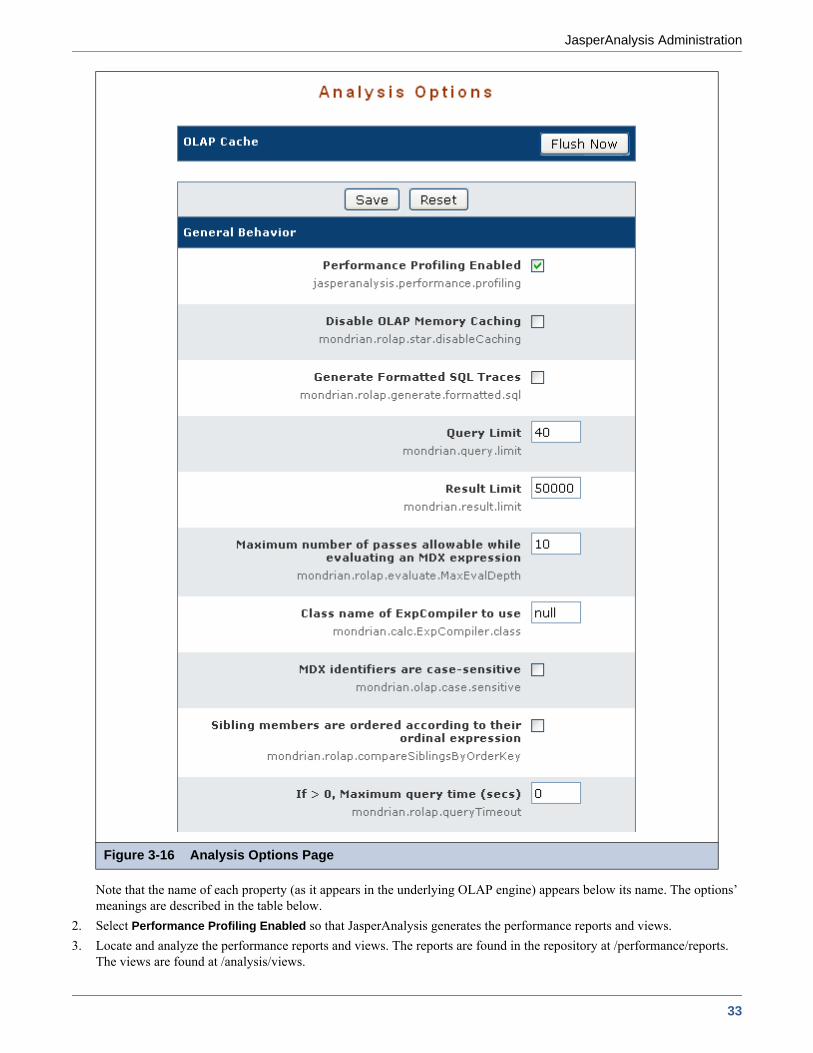
Note that the name of each property (as it appears in the underlying OLAP engine) appears below its name. The options’ meanings are described in the table below.
2. Select Performance Profiling Enabled so that JasperAnalysis generates the performance reports and views.3. Locate and analyze the performance reports and views. The reports are found in the repository at /performance/reports.
The views are found at /analysis/views.
Figure 3-16 Analysis Options Page
33
Jaspersoft Style Guide and FrameMaker Template
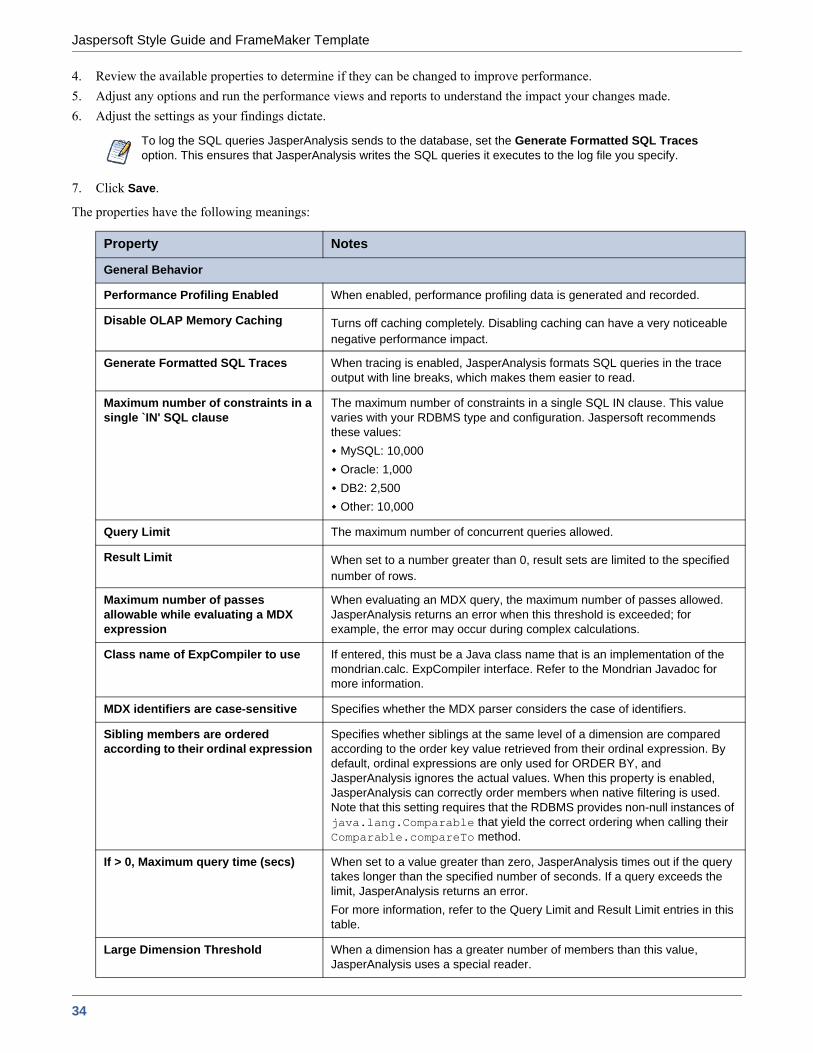
4. Review the available properties to determine if they can be changed to improve performance. 5. Adjust any options and run the performance views and reports to understand the impact your changes made.6. Adjust the settings as your findings dictate.
7. Click Save.
The properties have the following meanings:
To log the SQL queries JasperAnalysis sends to the database, set the Generate Formatted SQL Traces option. This ensures that JasperAnalysis writes the SQL queries it executes to the log file you specify.
Property Notes
General Behavior
Performance Profiling Enabled When enabled, performance profiling data is generated and recorded.
Disable OLAP Memory Caching Turns off caching completely. Disabling caching can have a very noticeable negative performance impact.
Generate Formatted SQL Traces When tracing is enabled, JasperAnalysis formats SQL queries in the trace output with line breaks, which makes them easier to read.
Maximum number of constraints in a single `IN' SQL clause
The maximum number of constraints in a single SQL IN clause. This value varies with your RDBMS type and configuration. Jaspersoft recommends these values:
MySQL: 10,000Oracle: 1,000DB2: 2,500Other: 10,000
Query Limit The maximum number of concurrent queries allowed.
Result Limit When set to a number greater than 0, result sets are limited to the specified number of rows.
Maximum number of passes allowable while evaluating a MDX expression
When evaluating an MDX query, the maximum number of passes allowed. JasperAnalysis returns an error when this threshold is exceeded; for example, the error may occur during complex calculations.
Class name of ExpCompiler to use If entered, this must be a Java class name that is an implementation of the mondrian.calc. ExpCompiler interface. Refer to the Mondrian Javadoc for more information.
MDX identifiers are case-sensitive Specifies whether the MDX parser considers the case of identifiers.
Sibling members are ordered according to their ordinal expression
Specifies whether siblings at the same level of a dimension are compared according to the order key value retrieved from their ordinal expression. By default, ordinal expressions are only used for ORDER BY, and JasperAnalysis ignores the actual values. When this property is enabled, JasperAnalysis can correctly order members when native filtering is used. Note that this setting requires that the RDBMS provides non-null instances of java.lang.Comparable that yield the correct ordering when calling their Comparable.compareTo method.
If > 0, Maximum query time (secs) When set to a value greater than zero, JasperAnalysis times out if the query takes longer than the specified number of seconds. If a query exceeds the limit, JasperAnalysis returns an error.For more information, refer to the Query Limit and Result Limit entries in this table.
Large Dimension Threshold When a dimension has a greater number of members than this value, JasperAnalysis uses a special reader.
34

JasperAnalysis Administration
Sparse Segment Density Threshold Performance tuning variable. this property only applies when SparseSegmentCountThreshold is enabled. It determines whether to use a sparse or a dense representation when collections of cell values are stored in memory.
Sparse Segment Count Threshold Performance tuning variable. this property only applies when SparseSegmentDensityThreshold is set. It determines whether a sparse or a dense representation is used when collections of cell values are stored in memory.When storing collections of cell values, JasperAnalysis can use either a sparse or a dense representation. This is determined by the possible and actual number of values: density is calculated as actual / possible.Whenever possible, JasperAnalysis uses a sparse representation - countThreshold * actual > densityThreshold.For example, for the default values (countThreshold = 1000, SparseSegmentDensityThreshold = 0.5), JasperAnalysis uses a dense representation for:♦1000 possible, 0 actual, or♦2000 possible, 500 actual, or♦3000 possible, 1000 actual)If there are fewer actual values or more possible values, JasperAnalysis uses a sparse representation.
Non empty always used When enabled, the NON EMPTY option is set implicitly for each query axis; note that, regardless of this setting, JasperAnalysis doesn’t display the empty cells).
During schema load, invalid members are ignored and will be treated as a null
When enabled, JasperAnalysis ignores invalid members during schema load; they are treated as null members if they are referenced in a later query.
During query validation, invalid members are ignored and will be treated as a null
When enabled, JasperAnalysis ignores invalid members during query validation; invalid members are ignored and are treated as null members.
Defines how a null Member is represented in the result output
Specifies how JasperAnalysis should represent a null member in the result output.
If > 0, the maximum number of iterations allowed when evaluating an aggregate
When set to a number greater than 0, the maximum number of iterations allowed when evaluating an aggregate. When set to 0, iterations are unlimited.If a query exceeds the limit, JasperAnalysis returns an error that specifies this property’s value. For more information, refer to the Query Limit and Result Limit entries in this table.
If > 0, crossjoin result limit beyond which the optimizer will be applied
When set to a number greater than 0, a threshold for a crossjoin input list's size; if it exceeds this value, and the axis has the NON EMPTY qualifier, JasperAnalysis uses the non-empty optimizer.When this property is set to 0, JasperAnalysis applies the non-empty optimizer to all crossjoin input lists. To ensure that the optimizer is never applied to crossjoin input lists, set this value to the Integer.MAX_VALUE.
If there are unrelated dimensions to a measure in context during aggregation, the measure is ignored in the evaluation context
When dimensions unrelated to a measure are detected during aggregation, the measure is ignored in the evaluation context. Note that this property can only affects measures whose CubeUsage’s IgnoreUnrelatedDimensions is false.For more information, refer to the Mondrian Technical Guide, which is available at http://www.jasperforge.org.
Property, continued Notes
35

Jaspersoft Style Guide and FrameMaker Template
Do elements of a dimension (levels, hierarchies, members) need to be prefixed with dimension name in the MDX query
Determines if elements of dimension (levels, hierarchies, and members) must be prefixed with the dimension name in MDX queries. this property determines whether certain queries succeed or fail based on the way the dimension elements are defined in the MDX query. When this property is enabled, this query fails:select {[Omaha]} on columns from custWhen this property is disabled, that same query succeeds.With the property enabled, the correct query is:select {[Nebraska].[Omaha]} on columns from custIf your schema is very large or complex, Jaspersoft recommends enabling this setting, as processing such schemas can be very resource-intensive. For more information, refer to the Mondrian Technical Guide, which is available at http://www.jasperforge.org.
Division by null or zero produces NULL
By default, when JasperAnalysis attempts to divide by zero or null, it evaluates to Infinity, which is correct for some analysis providers. When this property is enabled, JasperAnalysis instead evaluates such calculations to null, which can be helpful in certain circumstances.
Solve Order evaluation behavior Specifies how to evaluate the SOLVE_ORDER:Absolute - Any specified scope is ignored and the SOLVE_ORDER value is absolute. For example, JasperAnalysis gives precedence to a query-defined calculated member with a SOLVE_ORDER of 1 over a cube defined value of 2.Scoped. JasperAnalysis first resolves cube-calculated members, then resolves session-scoped members, and finally resolves query-defined calculations. JasperAnalysis only applies the SOLVE_ORDER value within the scope in which it was defined.
Aggregate Settings
Enable Aggregate Tables When enabled, JasperAnalysis identifies tables in the database that are aggregates, and uses those aggregate values.For more information, refer to the Mondrian Technical Guide, which is available at http://www.jasperforge.org.
Choose Aggregate Table By Volume Performance tuning variable for aggregates. This property only applies when aggregate tables are used. Consider using this property when optimizing for tables with many large columns. this property determines whether aggregate tables are ordered by volume or row count. When this property is enabled, JasperAnalysis uses the aggregate table with the smallest volume (number of rows multiplied by number of columns); when it is disabled, JasperAnalysis uses the aggregate table with the fewest rows.
Optimize predicates Determines whether JasperAnalysis optimizes predicates. When this property is enabled, JasperAnalysis optimizes certain predicates.When it is disabled, predicates are only optimized when all of a dimension’s members are included. In this case, JasperAnalysis only retrieves the data specified in the query.For more information, refer to the Mondrian Technical Guide, which is available at http://www.jasperforge.org.
Rule file for aggregate table identification
Specifies a file that defines aggregate table recognition rules. This file can either reside in the application server or the file system. Typically, you can accept the default.
AggRule element's tag value The AggRule element's tag value. Typically, you can accept the default.
Property, continued Notes
36

JasperAnalysis Administration
Print SQL to log for aggregate table creation to support MDX with aggregates
Determines whether JasperAnalysis prints the SQL code generated for aggregate tables.When this property is enabled, JasperAnalysis processes each aggregate request and prints both the lost and collapsed dimension create and insert SQL statements. When used in conduction with the CmdRunner, it lets you automatically create aggregate table generation SQL.
Factory class for determining the tables and columns of a data source
If entered, this must be a Java class name that is an implementation of the mondrian.rolap.aggmatcher.JdbcSchema.Factory interface. The default implementation is mondrian.rolap.aggmatcher.JdbcSchema.StdFactory. Refer to the Mondrian Javadoc for more information.
Cache and SQL Settings
Use a cache for the results of frequently evaluated expressions
Determines whether JasperAnalysis caches the results of frequently-evaluated expressions. Enabling this property can reduce the number of unnecessary computations when processing a large amount of data.
Cache RolapCubeMember objects Determines whether JasperAnalysis caches RolapCubeMember objects, which each associate a member of a shared hierarchy with a cube that uses it.Disable this property if you plan to use the member cache control.
Some NON EMPTY CrossJoin MDX statements will be computed in the database
When enabled, JasperAnalysis pushes down to the database processing related to some NON EMPTY CrossJoin MDX statements.
Some TopCount MDX statements will be computed in the database
When enabled, JasperAnalysis pushes down to the database processing related to some TopCount MDX statements.
Some Filter() MDX statements will be computed in the database
When enabled, JasperAnalysis pushes down to the database processing related to some Filter() MDX statements.
Some NON EMPTY MDX statements will be computed in the database
When enabled, JasperAnalysis pushes down to the database processing related to some NON EMPTY MDX set operations (Such as member.children, level.members and member.descendants).
Expand non native sub-expressions of a native expression into MemberLists
When enabled, JasperAnalysis expands non-native sub-expressions of a native expression into MemberLists.
Alerting action in case native evaluation of a function is enabled but not supported in a particular query
Specifies the error level (OFF, WARN, or ERROR) to use when a function’s native evaluation is enabled but isn’t supported in the context of a particular query's usage. Errors are only returned in the case of a NonEmptyCrossJoin.Alerts are only raised when there is a possibility that native evaluation would improve matters.
Some rollup queries will be combined using group by grouping sets if the SQL dialect allows it
When enabled, JasperAnalysis combines some rollup queries using group by grouping sets. Note that this property only applies to data stored in Oracle, DB2, or Teradata.
XML/A Settings
XML/A Maximum Drill Through Rows Limits the number of rows returned from an XML/A drill-through operation.
First row in the result of an XML/A drill-through request will be filled with the total count of rows
If this property is enabled, the first row returned for an XML/A drill-through request shows the total count of rows in the underlying database.
Property, continued Notes
37
Jaspersoft Style Guide and FrameMaker Template
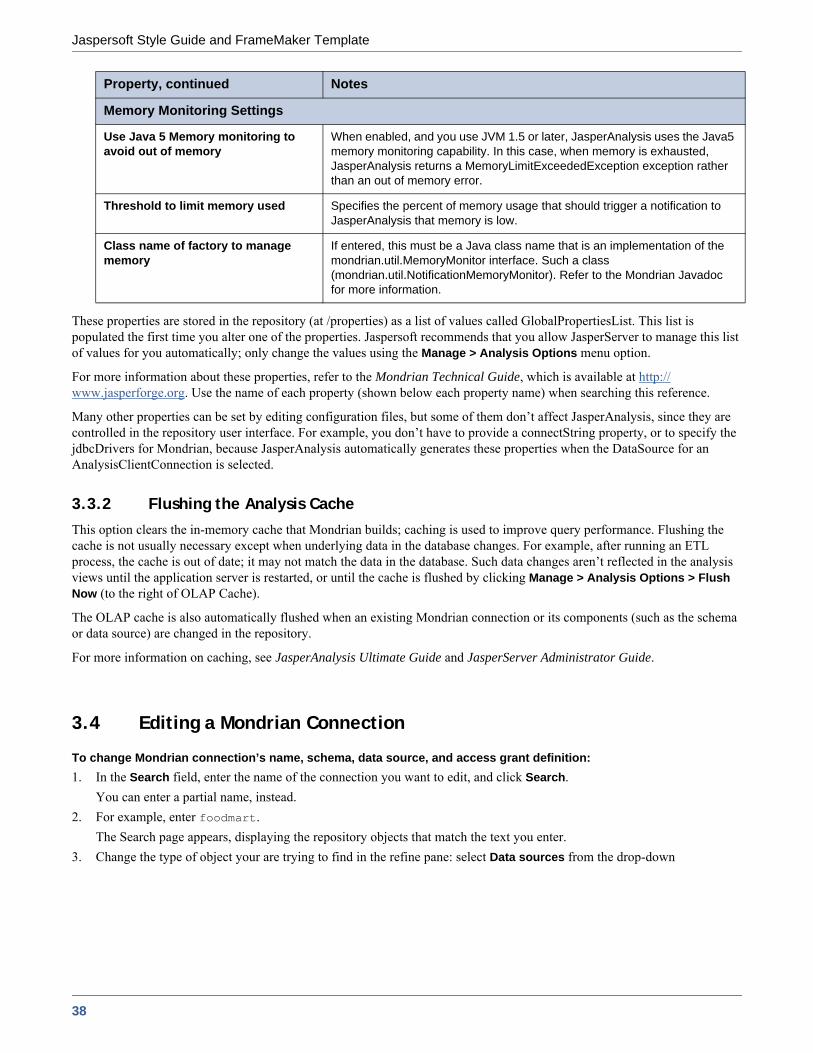
These properties are stored in the repository (at /properties) as a list of values called GlobalPropertiesList. This list is populated the first time you alter one of the properties. Jaspersoft recommends that you allow JasperServer to manage this list of values for you automatically; only change the values using the Manage > Analysis Options menu option.
For more information about these properties, refer to the Mondrian Technical Guide, which is available at http://www.jasperforge.org. Use the name of each property (shown below each property name) when searching this reference.
Many other properties can be set by editing configuration files, but some of them don’t affect JasperAnalysis, since they are controlled in the repository user interface. For example, you don’t have to provide a connectString property, or to specify the jdbcDrivers for Mondrian, because JasperAnalysis automatically generates these properties when the DataSource for an AnalysisClientConnection is selected.
3.3.2 Flushing the Analysis CacheThis option clears the in-memory cache that Mondrian builds; caching is used to improve query performance. Flushing the cache is not usually necessary except when underlying data in the database changes. For example, after running an ETL process, the cache is out of date; it may not match the data in the database. Such data changes aren’t reflected in the analysis views until the application server is restarted, or until the cache is flushed by clicking Manage > Analysis Options > Flush Now (to the right of OLAP Cache).
The OLAP cache is also automatically flushed when an existing Mondrian connection or its components (such as the schema or data source) are changed in the repository.
For more information on caching, see JasperAnalysis Ultimate Guide and JasperServer Administrator Guide.
3.4 Editing a Mondrian Connection
To change Mondrian connection’s name, schema, data source, and access grant definition:1. In the Search field, enter the name of the connection you want to edit, and click Search.
You can enter a partial name, instead.2. For example, enter foodmart.
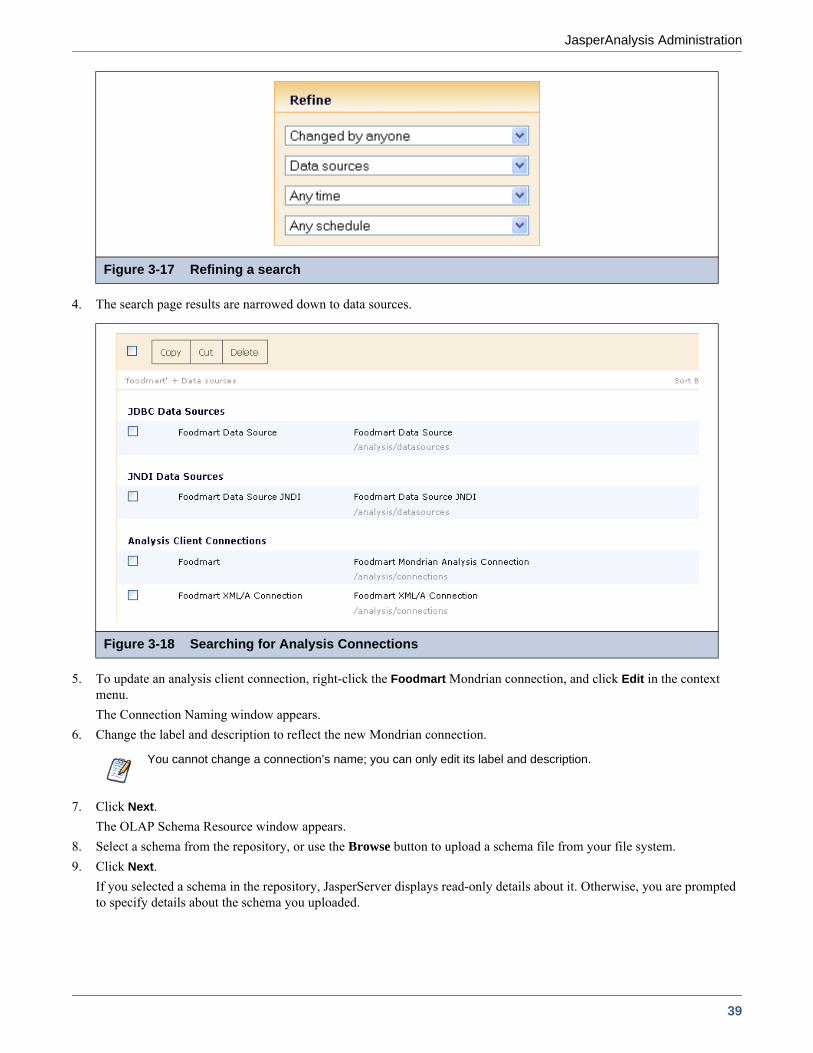
The Search page appears, displaying the repository objects that match the text you enter.3. Change the type of object your are trying to find in the refine pane: select Data sources from the drop-down
Memory Monitoring Settings
Use Java 5 Memory monitoring to avoid out of memory
When enabled, and you use JVM 1.5 or later, JasperAnalysis uses the Java5 memory monitoring capability. In this case, when memory is exhausted, JasperAnalysis returns a MemoryLimitExceededException exception rather than an out of memory error.
Threshold to limit memory used Specifies the percent of memory usage that should trigger a notification to JasperAnalysis that memory is low.
Class name of factory to manage memory
If entered, this must be a Java class name that is an implementation of the mondrian.util.MemoryMonitor interface. Such a class (mondrian.util.NotificationMemoryMonitor). Refer to the Mondrian Javadoc for more information.
Property, continued Notes
38
JasperAnalysis Administration
4. The search page results are narrowed down to data sources.
5. To update an analysis client connection, right-click the Foodmart Mondrian connection, and click Edit in the context menu.The Connection Naming window appears.
6. Change the label and description to reflect the new Mondrian connection.
7. Click Next. The OLAP Schema Resource window appears.
8. Select a schema from the repository, or use the Browse button to upload a schema file from your file system.9. Click Next.
If you selected a schema in the repository, JasperServer displays read-only details about it. Otherwise, you are prompted to specify details about the schema you uploaded.
Figure 3-17 Refining a search
Figure 3-18 Searching for Analysis Connections
You cannot change a connection’s name; you can only edit its label and description.
39

Jaspersoft Style Guide and FrameMaker Template
10. If necessary, specify details about the schema and click Next.The Locate Data Source window appears.
11. To edit the data source, locate and select one in the repository. If you select an existing data source, skip to step 14.If you select Locally Defined, proceed through a series of windows to define the data source as JDBC, Bean, or JNDI and to supply the appropriate connection information. For more information about data sources, refer to the JasperServer Administrator Guide.
12. Click Next.
Figure 3-19 Editing Mondrian Properties
Figure 3-20 Editing the Data Source
40
JasperAnalysis Administration
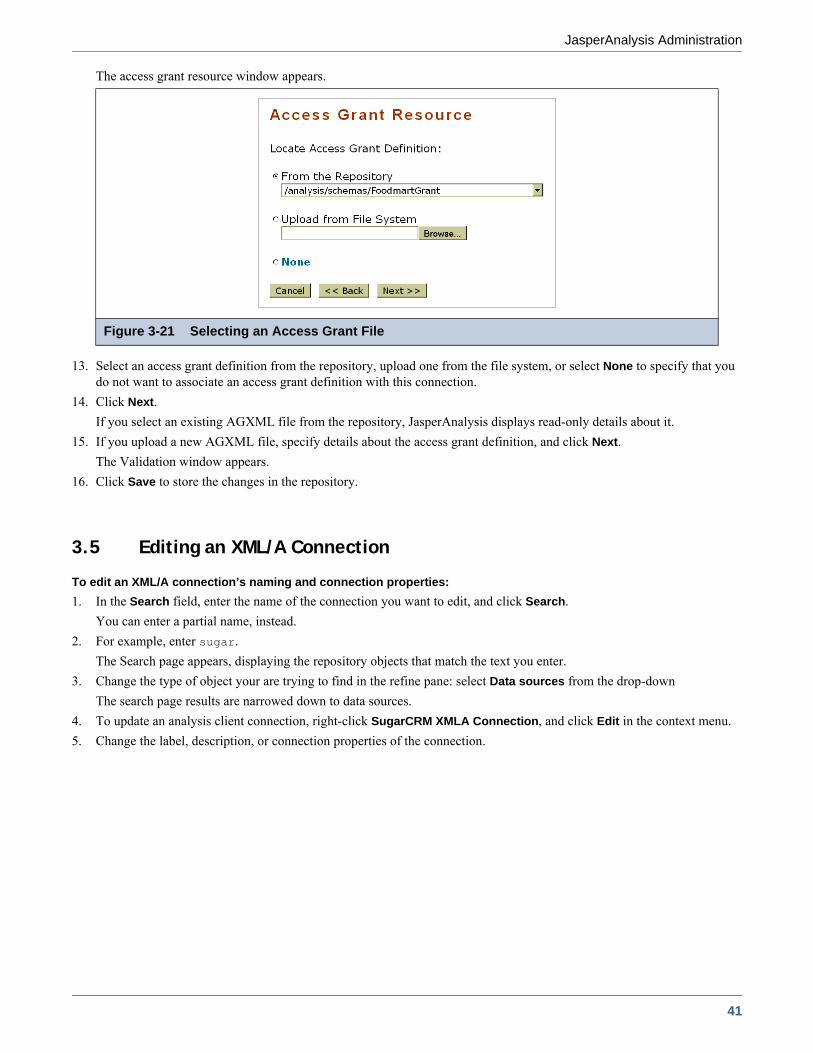
The access grant resource window appears.
13. Select an access grant definition from the repository, upload one from the file system, or select None to specify that you do not want to associate an access grant definition with this connection.
14. Click Next. If you select an existing AGXML file from the repository, JasperAnalysis displays read-only details about it.
15. If you upload a new AGXML file, specify details about the access grant definition, and click Next.The Validation window appears.
16. Click Save to store the changes in the repository.
3.5 Editing an XML/A Connection
To edit an XML/A connection’s naming and connection properties:1. In the Search field, enter the name of the connection you want to edit, and click Search.
You can enter a partial name, instead.2. For example, enter sugar.
The Search page appears, displaying the repository objects that match the text you enter.3. Change the type of object your are trying to find in the refine pane: select Data sources from the drop-down
The search page results are narrowed down to data sources.4. To update an analysis client connection, right-click SugarCRM XMLA Connection, and click Edit in the context menu.5. Change the label, description, or connection properties of the connection.
Figure 3-21 Selecting an Access Grant File
41
Jaspersoft Style Guide and FrameMaker Template
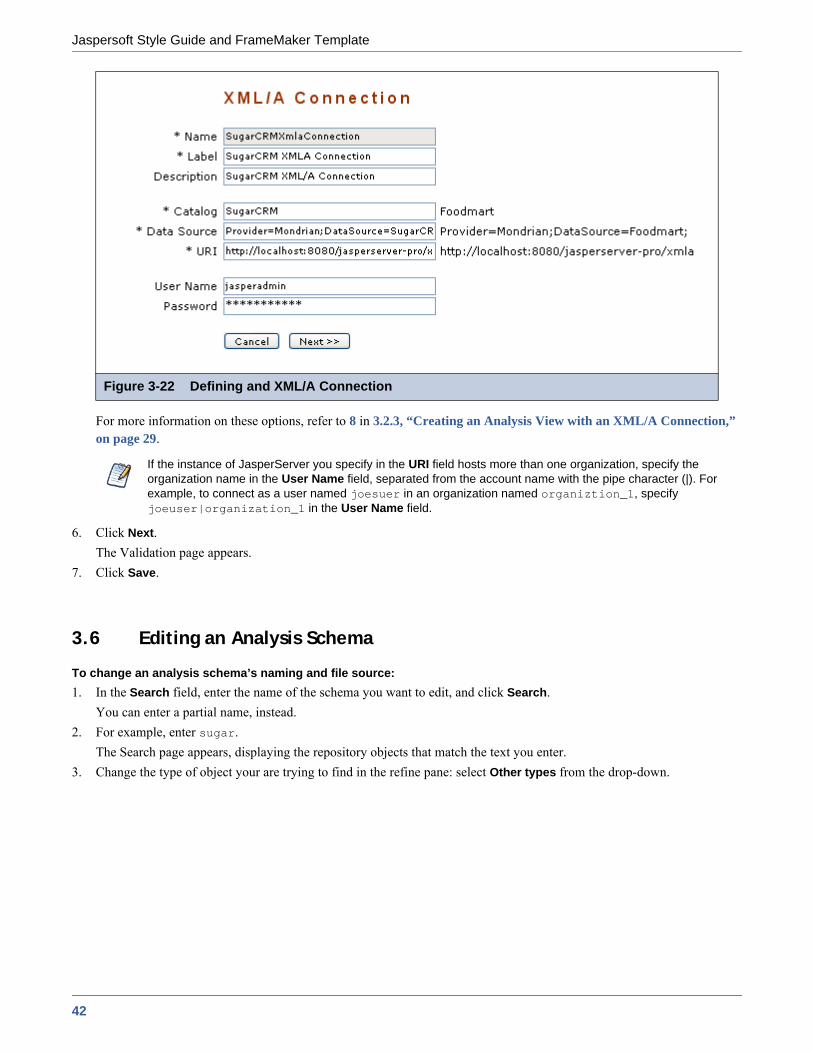
For more information on these options, refer to 8 in 3.2.3, “Creating an Analysis View with an XML/A Connection,” on page 29.
6. Click Next.The Validation page appears.
7. Click Save.
3.6 Editing an Analysis Schema
To change an analysis schema’s naming and file source:1. In the Search field, enter the name of the schema you want to edit, and click Search.
You can enter a partial name, instead.2. For example, enter sugar.
The Search page appears, displaying the repository objects that match the text you enter.3. Change the type of object your are trying to find in the refine pane: select Other types from the drop-down.
Figure 3-22 Defining and XML/A Connection
If the instance of JasperServer you specify in the URI field hosts more than one organization, specify the organization name in the User Name field, separated from the account name with the pipe character (|). For example, to connect as a user named joesuer in an organization named organiztion_1, specify joeuser|organization_1 in the User Name field.
42

JasperAnalysis Administration
The search page results are narrowed down to three items:
4. Right-click SugarCRM Schema.5. Click Browse to upload a new schema file.6. Locate and select a schema file in the file system and click Open.
Note that the schema you select must match the data defined in the SugarCRM connection.7. Click Next.8. Change the label or description of the schema.9. Click Save.
3.7 Editing a Data Source
To change a data source’s properties:1. In the Search field, enter the name of the schema you want to edit, and click Search.
You can enter a partial name, instead.2. For example, enter sugar.
The Search page appears, displaying the repository objects that match the text you enter.3. Change the type of object your are trying to find in the refine pane: select Data sources from the drop-down.
Figure 3-23 Searching for miscellaneous resources
43
Jaspersoft Style Guide and FrameMaker Template
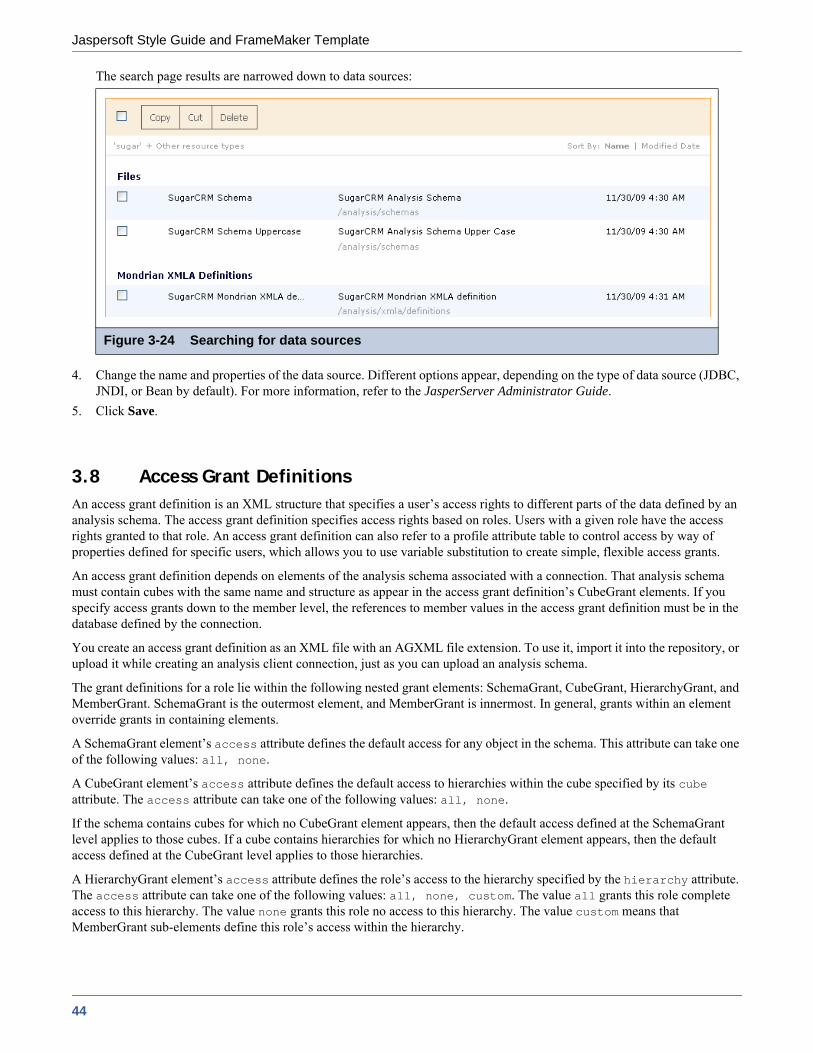
The search page results are narrowed down to data sources:
4. Change the name and properties of the data source. Different options appear, depending on the type of data source (JDBC, JNDI, or Bean by default). For more information, refer to the JasperServer Administrator Guide.
5. Click Save.
3.8 Access Grant DefinitionsAn access grant definition is an XML structure that specifies a user’s access rights to different parts of the data defined by an analysis schema. The access grant definition specifies access rights based on roles. Users with a given role have the access rights granted to that role. An access grant definition can also refer to a profile attribute table to control access by way of properties defined for specific users, which allows you to use variable substitution to create simple, flexible access grants.
An access grant definition depends on elements of the analysis schema associated with a connection. That analysis schema must contain cubes with the same name and structure as appear in the access grant definition’s CubeGrant elements. If you specify access grants down to the member level, the references to member values in the access grant definition must be in the database defined by the connection.
You create an access grant definition as an XML file with an AGXML file extension. To use it, import it into the repository, or upload it while creating an analysis client connection, just as you can upload an analysis schema.
The grant definitions for a role lie within the following nested grant elements: SchemaGrant, CubeGrant, HierarchyGrant, and MemberGrant. SchemaGrant is the outermost element, and MemberGrant is innermost. In general, grants within an element override grants in containing elements.
A SchemaGrant element’s access attribute defines the default access for any object in the schema. This attribute can take one of the following values: all, none.
A CubeGrant element’s access attribute defines the default access to hierarchies within the cube specified by its cube attribute. The access attribute can take one of the following values: all, none.
If the schema contains cubes for which no CubeGrant element appears, then the default access defined at the SchemaGrant level applies to those cubes. If a cube contains hierarchies for which no HierarchyGrant element appears, then the default access defined at the CubeGrant level applies to those hierarchies.
A HierarchyGrant element’s access attribute defines the role’s access to the hierarchy specified by the hierarchy attribute. The access attribute can take one of the following values: all, none, custom. The value all grants this role complete access to this hierarchy. The value none grants this role no access to this hierarchy. The value custom means that MemberGrant sub-elements define this role’s access within the hierarchy.
Figure 3-24 Searching for data sources
44

JasperAnalysis Administration
A HierarchyGrant element has optional topLevel and bottomLevel attributes. These define the segment of the hierarchy that users with the given role can see. They can see everything between and including the endpoints. Nothing in an enclosed MemberGrant element can override the topLevel and bottomLevel attributes.
The topLevel and bottomLevel attributes use a dot notation to specify a level in the hierarchy. In the example in 3.8.1, “Sample Access Grant Definition,” on page 46, the topLevel attribute for the Store hierarchy has the value [Store].[Store.Country]. The [Store] designates the Store hierarchy. The [Store.Country] designates the Country level of the Store hierarchy.
A MemberGrant element has member and access attributes. The member attribute specifies the top level of the hierarchy defined by the enclosing HierarchyGrant element to which the MemberGrant’s access attribute applies. For example, if the member value is [Store].[USA].[CA], the top level to which the access attribute applies is California in the Store hierarchy. The access attribute can take one of the following values: all, none. The value applies to everything including or below the level specified by the member attribute, except that it cannot grant access to anything outside the segment defined by the HierarchyGrant attributes topLevel and bottomLevel.
You can use substitution variables in the grant expressions that specify the values of the topLevel, bottomLevel, and member attributes. The example in 3.8.1, “Sample Access Grant Definition,” on page 46 includes variable substitution.
JasperAnalysis applies grants in the order that you define them. For example, if you grant access to USA and then deny access to Oregon, an affected user cannot see Oregon or any of its children (for example, Portland). But if you deny access to Oregon and then grant access to USA, the user can see Oregon and all of its children.
Granting access to a member also grants access to the levels above it, except that the grant cannot override the HierarchyGrant’s topLevel attribute. For example, if you deny access to USA and then grant access to California, an affected user can see California and USA, but no other states. If the data includes USA totals, they will be based on data from all states.
You can test access grant definitions by creating users with various roles and logging in as them. For more information on roles, users, and the Log in As feature, refer to the JasperServer Administrator Guide. The JasperAnalysis Ultimate Guide also includes a detailed implementation example.
Names of roles, users, hierarchical levels, and profile attributes are all case-sensitive in access grant definitions.
45

Jaspersoft Style Guide and FrameMaker Template
3.8.1 Sample Access Grant DefinitionThe following sample access grant definition (called Foodmart Grant and found in the repository at /analysis/schemas) is used with the Foodmart Mondrian connection, (found in the repository at /analysis/connections):
This schema defines access permissions for a role called StateManager.
In this example, the SchemaGrant element defines none as the default access for all objects in the schema. Users with the StateManager role cannot access anything, unless a lower level grant overrides the default.
The cube attribute has the value Sales, so the definition is for the Sales cube. The access attribute has the value all. This gives users with this role access to the entire Sales cube. Again, lower level grants can override this one.
HierarchyGrant elements define access to the Store, Customers, and Gender hierarchies. Users with this role cannot see any of the gender hierarchy. The other two HierarchyGrant elements define custom access to the Store and Customers hierarchies.
The member grants in this example use substitution variables like %{State} to represent substitutions from the profile attribute table. These particularize the grant to the specific user associated with the StateManager role. For example, suppose user John has StateManager as one of his roles. Also suppose that the profile attribute table has a row in which the values of the columns attribute and values are State, and CA,OR,WA. If you create a view for John, the line: <MemberGrant member="[Customers].[USA].[%{State}]" access="all"/>
in the above example is interpreted to mean: <MemberGrant member="[Customers].[USA].[CA,OR,WA]" access="all"/>
3.8.2 Working with the Profile Attribute TableThe JasperAnalysis user interface does not provide access to the profile attribute table. You must create and modify this table using the standard tools for working with your underlying relational database management system (RDBMS). This section assumes that the JasperServer repository database is hosted by MySQL.
The name of the profile attribute table in the RDBMS is jiprofileattribute. The following table defines it:
<Roles> <Role name="StateManager">
<SchemaGrant access="none">
<CubeGrant cube="Sales" access="all">
<HierarchyGrant hierarchy="[Store]" access="custom"
topLevel="[Store].[Store Country]">
<MemberGrant member="[Store].[USA].[%{State}]" access="all"/>
</HierarchyGrant>
<HierarchyGrant hierarchy="[Customers]" access="custom"
topLevel="[Customers].[State Province]"
bottomLevel="[Customers].[City]"> <MemberGrant member="[Customers].[USA].[%{State}]"
access="all"/>
</HierarchyGrant> <HierarchyGrant hierarchy="[Gender]"
access="none"/>
</CubeGrant> </SchemaGrant>
</Role>
</Roles>
46

JasperAnalysis Administration
+----------------------+--------------+------+-----+---------+----------------+
| Column z| Type | Null | Key | Default | Extra |
+----------------------+--------------+------+-----+---------+----------------+
| id | bigint(20) | NO | PRI | | auto_increment |
| attrName | varchar(255) | NO | | | |
| attrValue | varchar(255) | NO | | | |
| principalobjectclass | varchar(255) | NO | | | |
| principalobjectid | bigint(20) | NO | | | |
+----------------------+--------------+------+-----+---------+----------------
Use the following SQL query to view the current contents of the profile attribute table:select * from jiprofileattribute
The columns have the following meanings:
Here is an example of possible values for the State variable:
The value 13 represents a user with a role used in the access grant definition (for example, StateManager).
Suppose that you have created a role called StateManager and assigned it to a user called CaliforniaManager, using the JasperAnalysis user interface:
id Automatically generated primary key
attrName Attribute
attrValue Values – comma-separated list
principalobjectclass Always the following class: com.jaspersoft.jasperserver.api.metadata.user.domain.impl.hibernate.RepoUser
principalobjectid ID in the jiuser table of the user associated with the role using this attribute
id 1
attrName State
attrValue CA
principalobjectclass com.jaspersoft.jasperserver.api.metadata.user.domain.impl.hibernate.RepoUser
principalobjectid 13
Figure 3-25 StateManager Role for CalifonrniaManager User
47
Jaspersoft Style Guide and FrameMaker Template
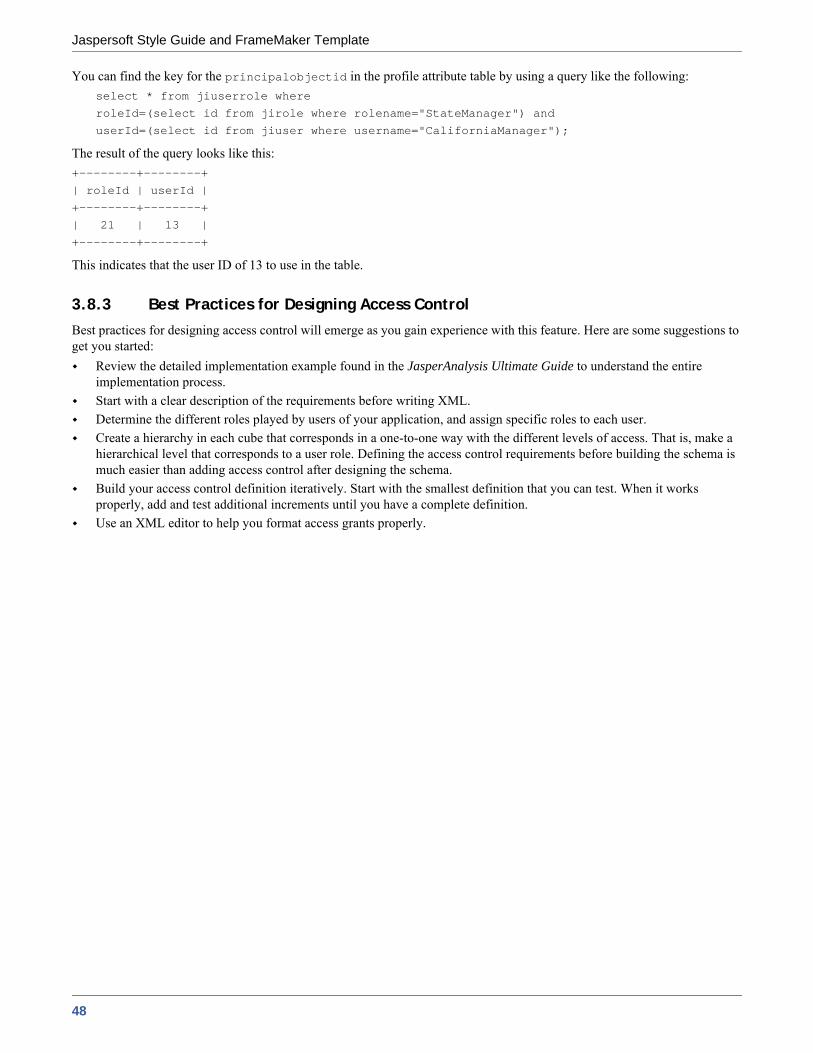
You can find the key for the principalobjectid in the profile attribute table by using a query like the following:select * from jiuserrole where roleId=(select id from jirole where rolename="StateManager") and
userId=(select id from jiuser where username="CaliforniaManager");
The result of the query looks like this:+--------+--------+
| roleId | userId |
+--------+--------+
| 21 | 13 |+--------+--------+
This indicates that the user ID of 13 to use in the table.
3.8.3 Best Practices for Designing Access ControlBest practices for designing access control will emerge as you gain experience with this feature. Here are some suggestions to get you started:
Review the detailed implementation example found in the JasperAnalysis Ultimate Guide to understand the entire implementation process.Start with a clear description of the requirements before writing XML.Determine the different roles played by users of your application, and assign specific roles to each user.Create a hierarchy in each cube that corresponds in a one-to-one way with the different levels of access. That is, make a hierarchical level that corresponds to a user role. Defining the access control requirements before building the schema is much easier than adding access control after designing the schema.Build your access control definition iteratively. Start with the smallest definition that you can test. When it works properly, add and test additional increments until you have a complete definition.Use an XML editor to help you format access grants properly.
48
JasperAnalysis Administration
3.9 XML/A ConfigurationJasperAnalysis can run as a XML/A server, allowing OLAP queries to be run from remote clients and query results returned to those clients over the XML/A web services protocol. The OLAP data for XML/A comes from Mondrian Connections.
JasperAnalysis XML/A connections, which we defined above, provide a client view to XML/A servers, including JasperAnalysis. You may want to run separate JasperAnalysis servers, splitting the JasperAnalysis XML/A clients from the XML/A servers. This client/server configuration allows load balancing, 24/7 availability and fail over in JasperAnalysis environments. Other clients that can connect to JasperAnalysis running as a XML/A server include Excel Pivot Tables with the Jaspersoft ODBO Driver.
In order to allow JasperAnalysis to run as a XML/A server, XML/A Sources need to be defined in the repository. The list of XML/A sources a given client can connect to can be controlled by repository permissions, as XML/A clients must authenticate via user name and password, and their access to the repository will be limited by permissions. In JasperAnalysis Professional and Enterprise, OLAP data level security can be used to filter OLAP query results based on the user making the XML/A requests.
3.9.1 Creating a XML/A Source
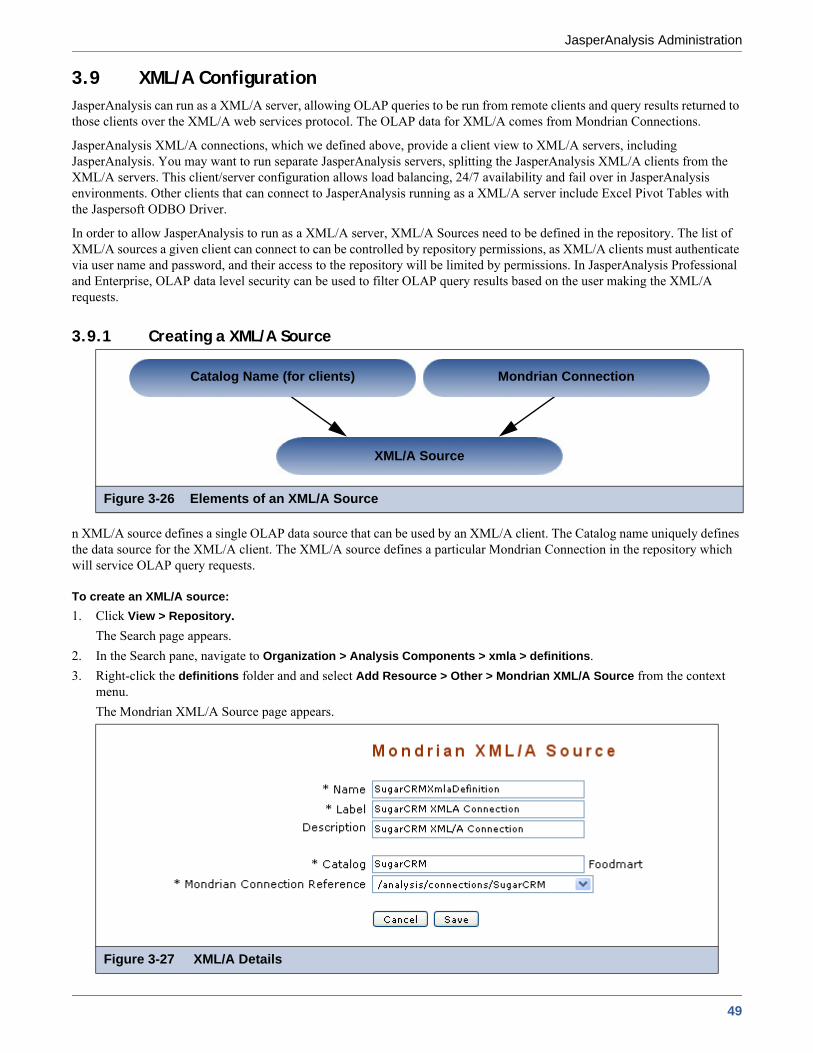
n XML/A source defines a single OLAP data source that can be used by an XML/A client. The Catalog name uniquely defines the data source for the XML/A client. The XML/A source defines a particular Mondrian Connection in the repository which will service OLAP query requests.
To create an XML/A source:1. Click View > Repository.
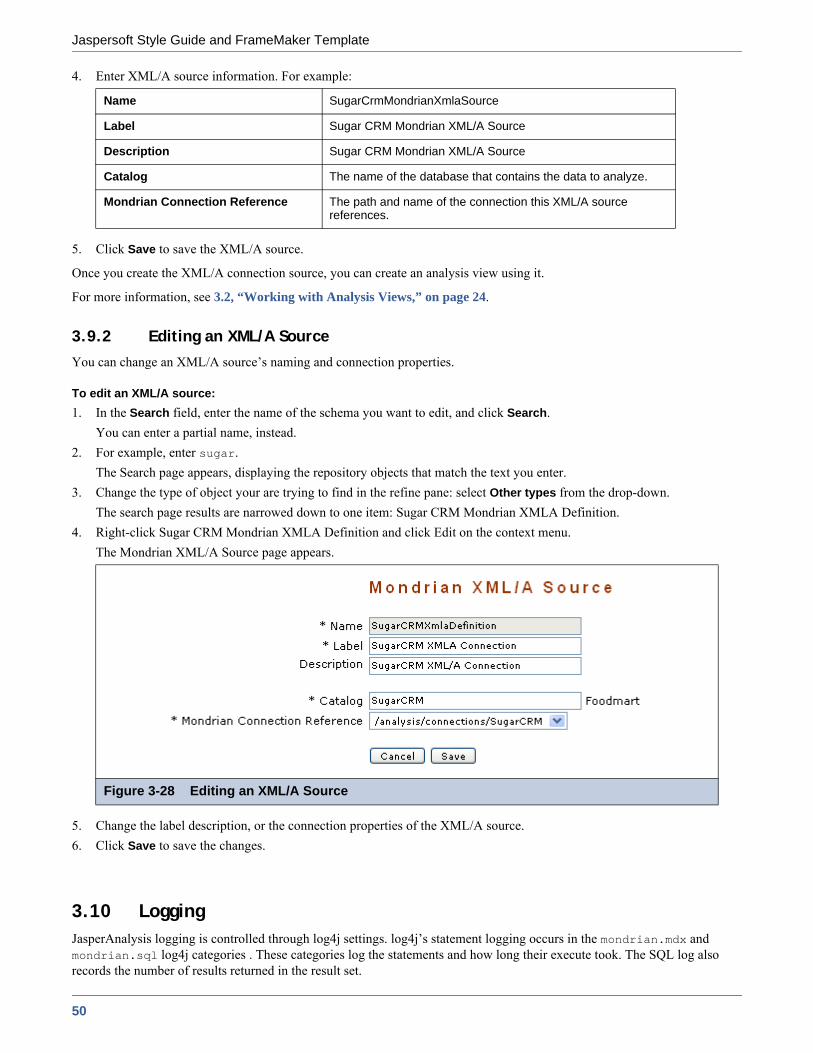
The Search page appears.2. In the Search pane, navigate to Organization > Analysis Components > xmla > definitions.3. Right-click the definitions folder and and select Add Resource > Other > Mondrian XML/A Source from the context
menu.The Mondrian XML/A Source page appears.
Figure 3-26 Elements of an XML/A Source
Figure 3-27 XML/A Details
XML/A Source
Mondrian ConnectionCatalog Name (for clients)
49
Jaspersoft Style Guide and FrameMaker Template
4. Enter XML/A source information. For example:
5. Click Save to save the XML/A source.
Once you create the XML/A connection source, you can create an analysis view using it.
For more information, see 3.2, “Working with Analysis Views,” on page 24.
3.9.2 Editing an XML/A SourceYou can change an XML/A source’s naming and connection properties.
To edit an XML/A source:1. In the Search field, enter the name of the schema you want to edit, and click Search.
You can enter a partial name, instead.2. For example, enter sugar.
The Search page appears, displaying the repository objects that match the text you enter.3. Change the type of object your are trying to find in the refine pane: select Other types from the drop-down.
The search page results are narrowed down to one item: Sugar CRM Mondrian XMLA Definition.4. Right-click Sugar CRM Mondrian XMLA Definition and click Edit on the context menu.
The Mondrian XML/A Source page appears.
5. Change the label description, or the connection properties of the XML/A source.6. Click Save to save the changes.
3.10 LoggingJasperAnalysis logging is controlled through log4j settings. log4j’s statement logging occurs in the mondrian.mdx and mondrian.sql log4j categories . These categories log the statements and how long their execute took. The SQL log also records the number of results returned in the result set.
Name SugarCrmMondrianXmlaSource
Label Sugar CRM Mondrian XML/A Source
Description Sugar CRM Mondrian XML/A Source
Catalog The name of the database that contains the data to analyze.
Mondrian Connection Reference The path and name of the connection this XML/A source references.
Figure 3-28 Editing an XML/A Source
50
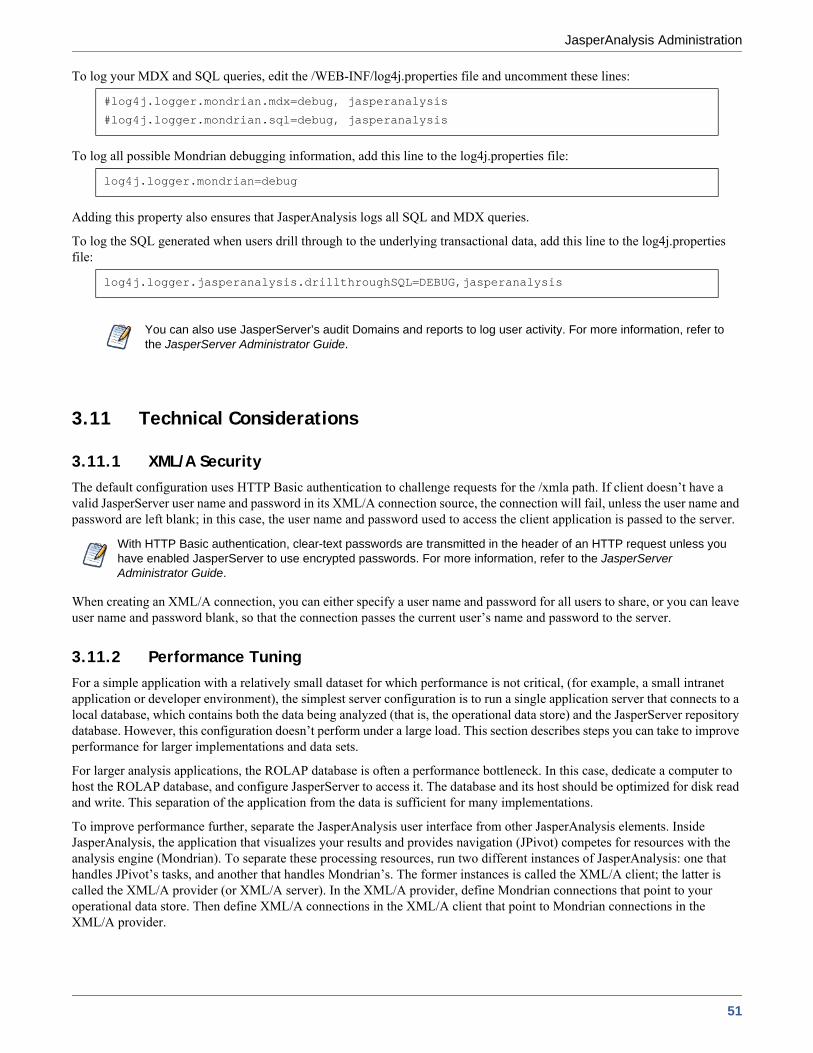
JasperAnalysis Administration
To log your MDX and SQL queries, edit the /WEB-INF/log4j.properties file and uncomment these lines:
To log all possible Mondrian debugging information, add this line to the log4j.properties file:
Adding this property also ensures that JasperAnalysis logs all SQL and MDX queries.
To log the SQL generated when users drill through to the underlying transactional data, add this line to the log4j.properties file:
3.11 Technical Considerations
3.11.1 XML/A SecurityThe default configuration uses HTTP Basic authentication to challenge requests for the /xmla path. If client doesn’t have a valid JasperServer user name and password in its XML/A connection source, the connection will fail, unless the user name and password are left blank; in this case, the user name and password used to access the client application is passed to the server.
When creating an XML/A connection, you can either specify a user name and password for all users to share, or you can leave user name and password blank, so that the connection passes the current user’s name and password to the server.
3.11.2 Performance TuningFor a simple application with a relatively small dataset for which performance is not critical, (for example, a small intranet application or developer environment), the simplest server configuration is to run a single application server that connects to a local database, which contains both the data being analyzed (that is, the operational data store) and the JasperServer repository database. However, this configuration doesn’t perform under a large load. This section describes steps you can take to improve performance for larger implementations and data sets.
For larger analysis applications, the ROLAP database is often a performance bottleneck. In this case, dedicate a computer to host the ROLAP database, and configure JasperServer to access it. The database and its host should be optimized for disk read and write. This separation of the application from the data is sufficient for many implementations.
To improve performance further, separate the JasperAnalysis user interface from other JasperAnalysis elements. Inside JasperAnalysis, the application that visualizes your results and provides navigation (JPivot) competes for resources with the analysis engine (Mondrian). To separate these processing resources, run two different instances of JasperAnalysis: one that handles JPivot’s tasks, and another that handles Mondrian’s. The former instances is called the XML/A client; the latter is called the XML/A provider (or XML/A server). In the XML/A provider, define Mondrian connections that point to your operational data store. Then define XML/A connections in the XML/A client that point to Mondrian connections in the XML/A provider.
#log4j.logger.mondrian.mdx=debug, jasperanalysis
#log4j.logger.mondrian.sql=debug, jasperanalysis
log4j.logger.mondrian=debug
log4j.logger.jasperanalysis.drillthroughSQL=DEBUG,jasperanalysis
You can also use JasperServer’s audit Domains and reports to log user activity. For more information, refer to the JasperServer Administrator Guide.
With HTTP Basic authentication, clear-text passwords are transmitted in the header of an HTTP request unless you have enabled JasperServer to use encrypted passwords. For more information, refer to the JasperServer Administrator Guide.
51
Jaspersoft Style Guide and FrameMaker Template
In this configuration, your users connect to the XML/A client, which sends XML/A requests to the XML/A provider, which in turn connects to the database (using a Mondrian connection) to retrieve the results; it returns the results to the XML/A client. The XML/A client then provides visualization and navigation for your end users.
In this configuration, Mondrian and JPivot don’t compete for resources, and performance in large implementations is improved. For more information, see 3.9, “XML/A Configuration,” on page 49.
3.12 TroubleshootingThis section describes some issues you may encounter once JasperAnalysis is installed. For troubleshooting instructions regarding installation, refer to the JasperServer Installation Guide. For troubleshooting instructions regarding JasperServer, refer to the JasperServer Administrator Guide.
3.12.1 SugarCRM Sample Analysis View Fails in WebSphereIf JasperAnalysis (running in a WebSphere application server) returns an error when you attempt to open the SugarCRM analysis view (that is installed with JasperServer's sample data), the problem may be an incorrect port number in the XML/A connection that the view relies on. You must edit the SugarCRM XML/A Connection sample XML/A connection and enter the correct port number.
To correct the port number:1. In the Search field, enter the name of the connection you want to edit, and click Search.
You can enter a partial name, instead.2. For example, enter sugar.
The Search page appears, displaying the repository objects that match the text you enter.3. Change the type of object your are trying to find in the refine pane: select Data sources from the drop-down
The search page results are narrowed down to data sources.4. Click the Sugar CRM XML/A Connection connection, and click Edit in the context menu.
The XML/A Connection page appears.5. In the URI field, update the port number to the port being used by WebSphere. WebSphere's default port is 9080.
For example, if the value in the URI field initially reads:http://127.0.0.1:8080/jasperserver-pro/xmla
Change it to:http://127.0.0.1:9080/jasperserver-pro/xmla
6. Click Next.7. JasperServer displays a message indicating that the test was successful. If the test fails, verify the settings, paying
particular attention to the port number.8. Click Save.9. Click View > Analysis, and test the Sugar CRM analysis view. If it returns data, the port is correct.
52
Glossary
GLOSSARY
Ad Hoc Editor
JasperServer’s integrated report designer. Starting from a collection of fields predefined in a Topic or selected from a Domain, the Ad Hoc Editor lets you drag and drop report elements to draft, preview, and finalize reports. Like JRXML reports, Ad Hoc reports can be run, printed, and scheduled within JasperServer. In addition, Ad Hoc reports may be reopened in the Ad Hoc Editor, further modified, and saved.
Analysis Client Connection
A definition for retrieving an analysis view. An analysis client connection is either a direct Java connection (Mondrian connection) or an XML-based API connection (XMLA connection).
Analysis Schema
A metadata definition of a multidimensional database. In JasperAnalysis, schemas are stored in the repository as XML file resources.
Analysis View
A view of multidimensional data that is based on an analysis client connection and an MDX query. It is the entry point to analysis operations, such as slice and dice, drill down, and drill through.
Audit Archiving
Determining the limit on saving audit results, such as limiting them to a range of dates or a total number of instances.
Audit Logging
Recording who used JasperServer to do what when. All Ad Hoc reports can be run with auditing enabled. A range of criteria can be audited and the results logged; the results can be used as input for other reports.
Calculated Field
In a Domain, a field whose value is calculated from a user-written formula that may include any number of fields, operators, and constants. A calculated field is defined in the Domain Designer dialog, and it becomes one of the items to which the Domain’s security file and locale bundles can apply.
CRM
Customer Relationship Management. The practice of managing every facet of a company’s interactions with its clientele. CRM applications help businesses track and support their customers.
CrossJoin
An MDX function that combines two or more dimensions into a single axis (column or row).
53

Jaspersoft Style Guide and FrameMaker Template
Cube
The basis of most analysis applications, a cube is a data structure that contains three or more dimensions that categorize the cube’s quantitative data. When you navigate the data displayed in an analysis view, you are exploring a cube.
Custom Field
In the Ad Hoc Editor, a field that is created through menu items as a simple function of one or two available fields, including other custom fields. When a custom field becomes too complex or needs to be used in many reports, it is best to define it as a calculated field in a Domain.
Dashboard
A collection of reports, input controls, graphics, labels, and web content displayed in a single, integrated view. Dashboards often present a high level view of your data, but input controls can parameterize the data to display. For example, you can narrow down the data to a specific date range. Embedded web content, such as other web-based applications or maps, make dashboards more interactive and functional.
Derived Table
In a Domain, a derived table is defined by an additional query whose result becomes another set of items available in the Domain. For example, with a JDBC data source, you can write an SQL query that includes complex functions for selecting data. You can use the items in a derived table for other operations on the Domain, such as joining tables, defining a calculated field, or filtering. The items in a derived table can also be referenced in the Domain’s security file and locale bundles.
Data Policy
In JasperServer, a setting that determines how JasperServer should process and cache data used by Ad Hoc reports. Select your data policies by clicking Manage > Ad Hoc Options.
Data Source
Defines the connection properties that JasperServer needs to access data. JasperServer transmits queries to data sources and obtains datasets in return for use in filling reports and previewing Ad Hoc reports. JasperServer supports JDBC, JNDI, and Bean data sources; custom data sources can be defined as well.
Dataset
A collection of data arranged in columns and rows. Datasets are equivalent to relational results sets and the JRDataSource type in JasperReports.
Datatype
In JasperServer, a datatype is used to characterize a value entered through an input control. A datatype must be of type text, number, date, or date-time. It can include constraints on the value of the input, for example maximum and minimum values. As such, a JasperServer datatype is more structured than a datatype in most programming languages.
Denormalize
A process for creating table joins that speeds up data retrieval at the cost of having duplicate row values between some columns.
Dice
An OLAP operation to select columns.
Dimension
A categorization of the data in a cube. For example, a cube that stores data about sales figures might include dimensions such as time, product, region, and customer’s industry.
Domain
A virtual view of a data source that presents the data in business terms, allows for localization, and provides data-level security. A Domain is not a view of the database in relational terms, but it implements the same functionality within JasperServer. The design of a Domain specifies tables in the database, join clauses, calculated fields, display names, and default properties, all of which define items and sets of items for creating Ad Hoc reports.
54

Glossary
Domain Topic
A Topic that is created from a Domain by the Choose Ad Hoc Data wizard. A Domain Topic is based on the data source and items in a Domain, but it allows further filtering, user input, and selection of items. Unlike a JRXML-based Topic, a Domain Topic can be edited in JasperServer by users with the appropriate permissions.
Drill
To click on an element of an analysis view to change the data that is displayed:Drill down. An OLAP operation that exposes more detailed information down the hierarchy levels by delving deeper into the hierarchy and updating the contents of the navigation table.Drill through. An OLAP operation that displays detailed transactional data for a given aggregate measure. Click a fact to open a new table beneath the main navigation table; the new table displays the low-level data that constitutes the data that was clicked.Drill up. An OLAP operation for returning the parent hierarchy level to view to summary information.
Eclipse
An open source Integrated Development Environment (IDE) for Java and other programming languages, such as C/C++.
ETL
Extract, Transform, Load. A process that retrieves data from transactional systems, and filters and aggregates the data to create a multidimensional database.
Fact
The specific value or aggregate value of a measure for a particular member of a dimension. Facts are typically numeric.
Field
A field is equivalent to a column in the relational database model. Fields originate in the structure of the data source, but you may define calculated fields in a Domain or custom fields in the Ad Hoc Editor. Any type of field, along with its display name and default formatting properties, is called an item and may be used in the Ad Hoc editor.
Frame
A dashboard element that displays reports or custom URLs. Frames can be mapped to input controls if their content can accept parameters.
Group
In a report, a group is a set of data rows that have an identical value in a designated field.In a table, the value appears in a header and footer around the rows of the group, while the other fields appear as columns.In a chart, the field chosen to define the group becomes the independent variable on the X axis, while the other fields of each group are used to compute the dependent value on the Y axis.
Hierarchy Level
In analysis, a member of a dimension containing a group of members.
Input Control
A button, check box, drop-down list, text field, or calendar icon that allows users to enter a value when running a report or viewing a dashboard that accepts input parameters. For JRXML reports, input controls and their associated datatypes must be defined as repository objects and explicitly associated with the report. For Domain-based reports that prompt for filter values, the input controls are defined internally. When either type of report is used in a dashboard, its input controls are available to be added as special content.
Item
When designing a Domain or creating a Topic based on a Domain, an item is the representation of a database field or a calculated field along with its display name and formatting properties defined in the Domain. Items can be grouped in sets and are available for use in the creation of Ad Hoc reports.
55

Jaspersoft Style Guide and FrameMaker Template
JavaBean
A reusable Java component that can be dropped into an application container to provide standard functionality.
JDBC
Java Database Connectivity. A standard interface that Java applications use to access databases.
JNDI
Java Naming and Directory Interface. A standard interface that Java applications use to access naming and directory services.
Join Tree
In Domains, a collection of joined tables from the actual data source. A join is the relational operation that associates the rows of one table with the rows of another table based on a common value in given field of each table. Only the fields in a same join tree or calculated from the fields in a same join tree may appear together in a report.
JPivot
An open source graphical user interface for OLAP operations. For more information, visit http://jpivot.sourceforge.net/.
MDX
Multidimensional Expression Language. A language for querying multidimensional objects, such as OLAP (On Line Analytical Processing) cubes, and returning cube data for analytical processing. An MDX query is the query that determines the data displayed in an analysis view.
Measure
Depending on the context:In a report, a formula that calculates the values displayed in a table’s columns, a crosstab’s data values, or a chart’s dependent variable (such as the slices in a pie).In an analysis view, a formula that calculates the facts that constitute the quantitative data in a cube.
Mondrian
A Java-based, open source multidimensional database application.
Mondrian Connection
An analysis client connection that consists of an analysis schema and a data source used to populate an analysis view.
Mondrian Schema Editor
An open source Eclipse plugin for creating Mondrian analysis schemas.
Mondrian XMLA Source
A server-side XMLA source definition of a remote client-side XMLA connection used to populate an analysis view using the XMLA standard.
MySQL
An open source relational database management system. For information, visit http://www.mysql.com/.
Navigation Table
The main table in an analysis view that displays measures and dimensions as columns and rows.
Object
In JasperServer, anything residing in the repository, such as an image, file, font, data source, topic, domain, report element, saved report, report output, dashboard, or analysis view. The folders that contain repository objects are also objects. Administrators set user and role-based access privileges on repository objects to establish a security policy.
OLAP
On Line Analytical Processing. Provides multidimensional views of data that help users analyze current and past performance and model future scenarios.
56

Glossary
Organization
A set of users that share resources and repository objects in JasperServer. An organization has its own user accounts, roles, and root folder in the repository to securely isolate it from other organizations that may be hosted on the same instance of JasperServer.
Organization Admin
Also called the organization administrator. A user in an organization with the privileges to manage the organization’s user accounts and roles, repository permissions, and repository content. An organization admin can also create sub-organizations and mange all of their accounts, roles, and repository objects. The default organization admin in each organization is the jasperadmin account.
Outlier
A fact that seems incongruous when compared to other member’s facts. For example, a very low sales figure or a very high number of helpdesk tickets. Such outliers may indicate a problem (or an important achievement) in your business. JasperAnalysis excels at revealing outliers.
Parameter
Named values that are passed to the engine at report-filling time to control the data returned or the appearance and formatting of the report. A report parameter is defined by its name and type. In JasperServer, parameters can be mapped to input controls that users can interact with.
Pivot
To rotate a crosstab such that its row groups become columns groups and its column groups become rows. In the Ad Hoc Editor, pivot the crosstab by clicking .
Pivot Table
A table with two physical dimensions (for example, X and Y axis) for organizing information containing more than two logical dimensions (for example, PRODUCT, CUSTOMER, TIME, and LOCATION), such that each physical dimension is capable of representing one or more logical dimensions, where the values described by the dimensions are aggregated using a function such as SUM.
Pivot tables are used in JasperAnalysis.
Properties
Settings associated with an object. The settings determine certain features of the object, such as its color and label. Properties are normally editable. In Java, properties can be set in files listing objects and their settings.
Repository
The tree structure of folders that contain all saved reports, dashboards, analysis views, and resources. Users access the repository through the JasperServer web interface or through iReport. Applications can access the repository through the web service API. Administrators use the import and export utilities to back up the repository contents.
Role
A security feature of JasperServer. Administrators create named roles, assign them to user accounts, and then set access permissions to repository objects based on those roles. JasperServer also makes certain functionality available to users based on their roles, which determines certain menu options displayed to those users.
Schema
A logical model that determines how data is stored. For example, the schema in a relational database is a description of the relationships between tables, views, and indexes. In JasperAnalysis, an OLAP schema is the logical model of the data that appears in an analysis view; they are uploaded to the repository as resources. For Domains, schemas are represented in XML design files.
57
Jaspersoft Style Guide and FrameMaker Template
Set
In Domains and Domain Topics, a named collection of items grouped together for ease of use in the Ad Hoc Editor. A set can be based on the fields in a table or entirely defined by the Domain creator, but all items in a set must originate in the same join tree. The order of items in a set is preserved.
Slice
An OLAP operation for filtering data rows.
SQL
Structured Query Language. A standard language used to access and manipulate data and schemas in a relational database.
System Admin
Also called the system administrator. A user who has unlimited access to manage all organizations, users, roles, repository permissions, and repository objects across the entire JasperServer instance. The system admin can create root-level organizations and manage all server settings. The default system admin is the superuser account.
Topic
A JRXML file created externally and uploaded to JasperServer as a basis for Ad Hoc reports. Topics are created by business analysts to specify a data source and a list of fields with which business users can create reports in the Ad Hoc Editor. Topics are stored in the Ad Hoc Components folder of the repository and displayed when a user launches the Ad Hoc Editor.
Transactional Data
Data that describe measurable aspects of an event, such as a retail transaction, relevant to your business. Transactional data are often stored in relational databases, with one row for each event and a table column or field for each measure.
User
Depending on the context:A person who interacts with JasperServer to fulfill a goal. There are generally three categories of users: administrators who install and configure JasperServer, database experts or business analysts who create data sources and Domains, and business users who create and view reports and dashboards. A user account created for a specific person or purpose. The account associates the login name with user's full name, password, and email address. Roles are assigned to user accounts to determine access to objects in the repository.
WCF
Web Component Framework. A low-level GUI component of JPivot. For more information, see http://jpivot.sourceforge.net/wcf/index.html.
Web Services
A SOAP (Simple Object Access Protocol) API that enables certain features to be managed over the web without running JasperServer. The features include repository, scheduling and user administration tasks.
XML
eXtensible Markup language. A standard for defining, transferring, and interpreting data for use across any number of XML-enabled applications.
XML/A
XML for Analysis. An XML standard that uses Simple Object Access protocol (SOAP) to access remote data sources. For more information, see http://www.xmla.org/
XML/A Connection
A type of analysis client connection that consists of Simple Object Access Protocol (SOAP) definitions used to populate an analysis view.
58

Index
INDEX
Aadministering JasperAnalysis
Home page 7security 51servers 51
Adobe Acrobat 17analysis cache 38analysis properties 32analysis schemas 32, 42analysis views
connections 25, 29, 38, 41editing 31folder 9samples 9
Bbibliography 7
Ccache. See analysis schemas.connections
editing 38, 41Mondrian 25, 38, 49, 50XML/A 29, 41, 49, 50
CSV format 21
Ddata sources 43drill-through options
Edit Properties 21Output as CSV 21Page Controls 21
Eediting
analysis properties 32analysis schemas 42analysis views 31connections 38, 41data sources 43
Mondrian XML/A source 50Excel 16, 21exporting analysis views 16, 17
Fflushing the analysis cache 38Foodmart Sample Analysis View 10further readings 7
GGlobalPropertiesList 38
HHome page 6, 7
JJasperAnalysis
logging 32prerequisites 5
JasperReports 5JasperServer 5Jaspersoft 5JPivot 23
Llocale 6logging 32, 50login 5
MMDX queries 16, 23, 25, 29Mondrian
and XML/A connections 49connections 25, 38, 49, 50XML/A sources 50
Nnavigation options
Expand All/Collapse All 20Expand/Collapse Member 19Expand/Collapse Position 18Show Source Data 20
59

Jaspersoft Style Guide and FrameMaker Template
Zoom In/Out 19Zoom Out All 20
OOLAP 5, 9output of analysis views 17, 21
PPDF 17performance 32prerequisites for JasperAnalysis 5properties. See analysis properties.
Qqueries, logging 32
RROLAP 23
Ssamples
analysis views 9Foodmart 10
saving analysis views 21schemas. See analysis schemas.SQL, logging queries 32
Ttime zone 6tool bar 10
Change Data Cube 15Cube Options 13Drill into a Dimension Member 10Drill-through Operations 14Edit Chart Options 15Edit Display Option 13Edit Output Operations 17Export to Excel 16Export to PDF 17Hierarchical Ascending and Descending 11Natural Order 11Show Chart 14Show Empty Rows & Columns 12Sort Across Hierarchy 11Sort Option 14Swap Axes 12
Vviews. See analysis views.
XXML/A
configuration 49connections 29, 41, 49, 50creating a Mondrian XML/A source 50source 49
60
Related Documents