Jason Loughrey* 1 , Thia Hennessy 2 1. Rural Economy and Development Programme, Teagasc 2. Department of Food Business and Development, Cork University Business School Email: [email protected] 166 th EAAE Seminar on Sustainability in the Agri-Food Sector August 31 st 2018 The Common Agricultural Policy and The Farm Households’ Off-farm Labour Supply

Welcome message from author
This document is posted to help you gain knowledge. Please leave a comment to let me know what you think about it! Share it to your friends and learn new things together.
Transcript

Jason Loughrey*1, Thia Hennessy2
1. Rural Economy and Development Programme, Teagasc
2. Department of Food Business and Development, Cork University Business
School
Email: [email protected]
166th EAAE Seminar on Sustainability in the Agri-Food Sector
August 31st 2018
The Common Agricultural Policy and The Farm Households’ Off-farm Labour Supply
Objectives
Identify the relationship between farm and household characteristics and off-farm employment decisions in Ireland among married couples in particular.
Which microeconomic variables are associated with off-farm employment in terms of participation and hours of work.
Methodology

Methodology
• Neo-Classical Labour Supply Model• Multinomial Logit Model • Four Off-Farm Work Strategies
1. only the farm operator works off-farm, 2. only the spouse works off-farm, 3. both work off-farm4. neither operator or spouse works off-farm.

Data

Data
� Teagasc National Farm Survey� Average sample size of 1,058 farms per year (2005-2014)� Average sample size of 775 farm households per year (2005-
2014) where a married couple are heading the household� Unbalanced panel – rate of attrition is low over ten year period� Provide Irish farm income data to the EU Commission in
Brussels (FADN)� Weights based upon system of farming and size of the farm� Provides micro-data on off-farm employment data for the farm
holder and spouse where relevant
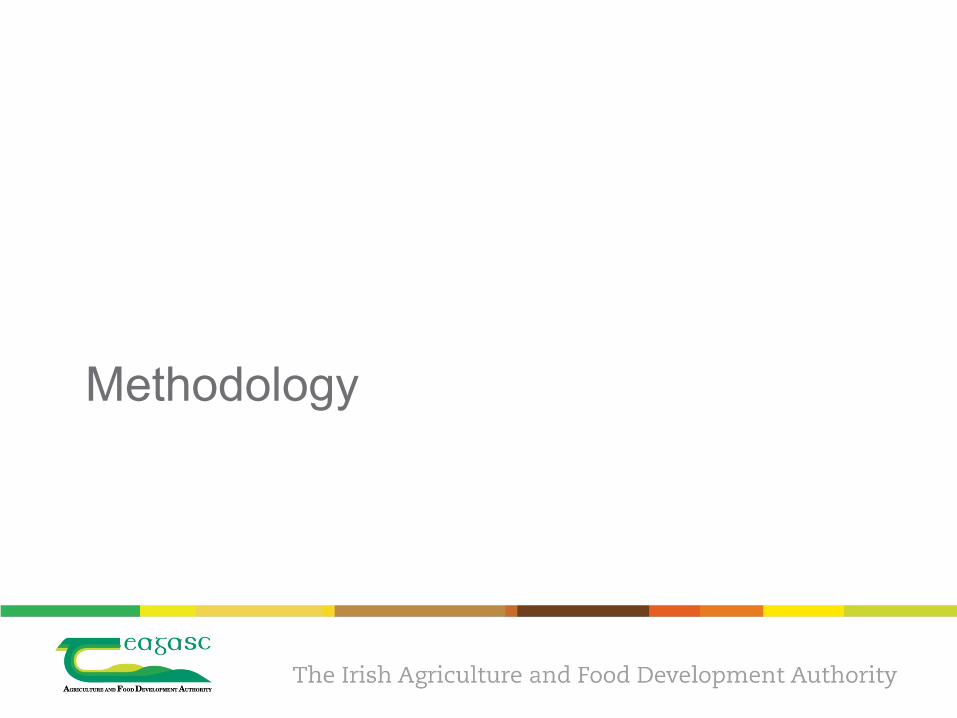
Off Farm Employment Rates in Ireland 2005-2014Teagasc National Farm Survey
202530354045505560
2005 2006 2007 2008 2009 2010 2011 2012 2013 2014
Perc
enta
ge S
hare
% of Operators with an off-farm employment% of farms where spouse has an off-farm employment% of farms where operators and/or spouse has off-farm employment
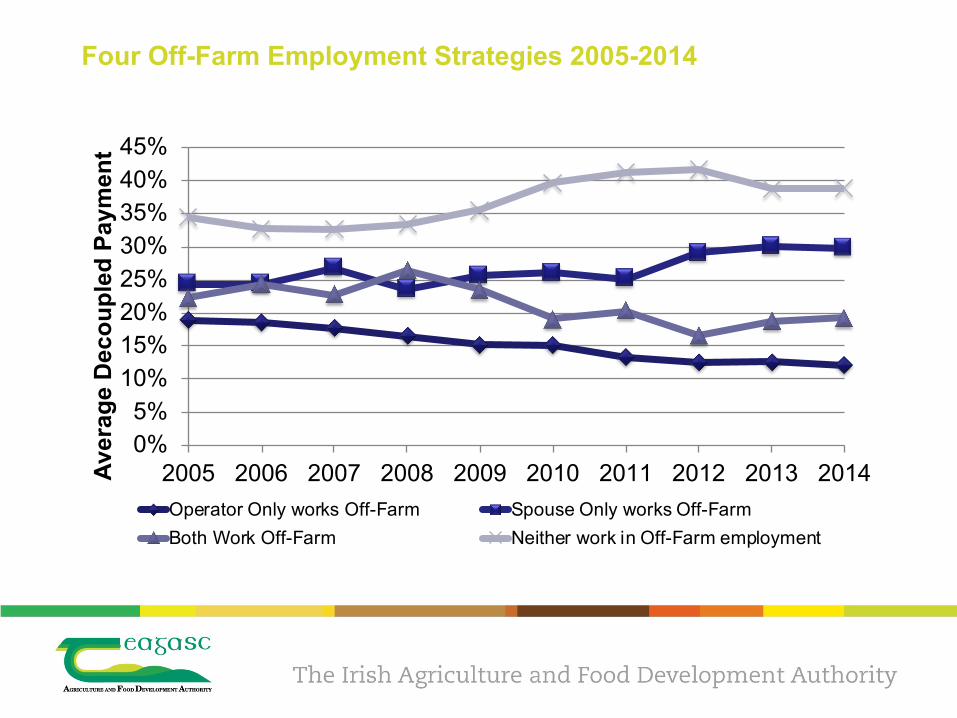
Four Off-Farm Employment Strategies 2005-2014
0%5%
10%15%20%25%30%35%40%45%
2005 2006 2007 2008 2009 2010 2011 2012 2013 2014Aver
age
Dec
oupl
ed P
aym
ent
Operator Only works Off-Farm Spouse Only works Off-FarmBoth Work Off-Farm Neither work in Off-Farm employment
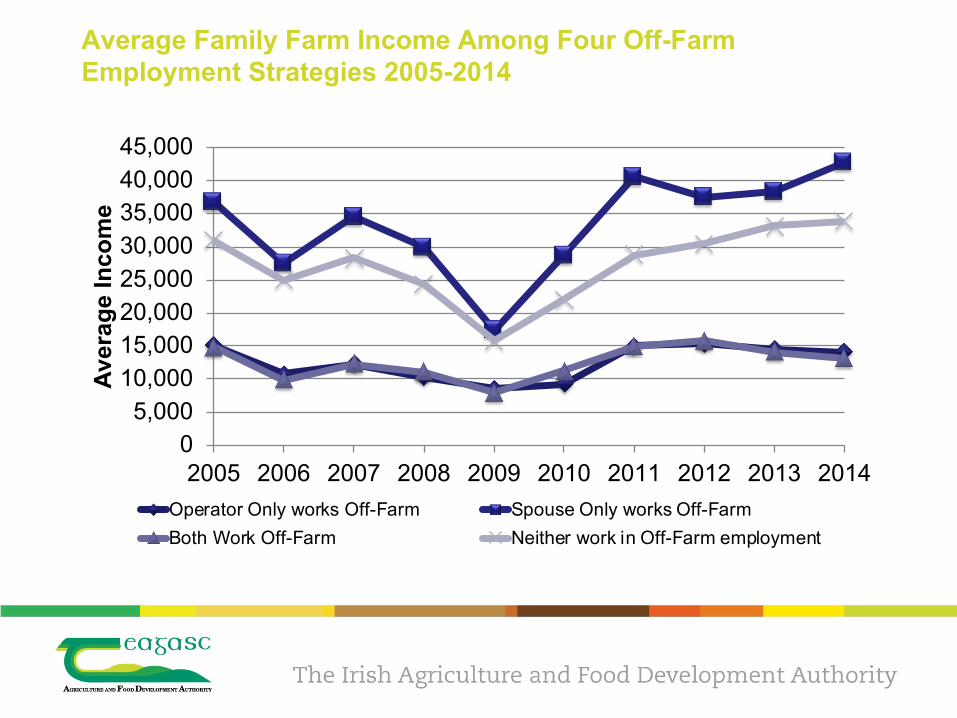
Average Family Farm Income Among Four Off-Farm Employment Strategies 2005-2014
05,000
10,00015,00020,00025,00030,00035,00040,00045,000
2005 2006 2007 2008 2009 2010 2011 2012 2013 2014
Aver
age
Inco
me
Operator Only works Off-Farm Spouse Only works Off-FarmBoth Work Off-Farm Neither work in Off-Farm employment
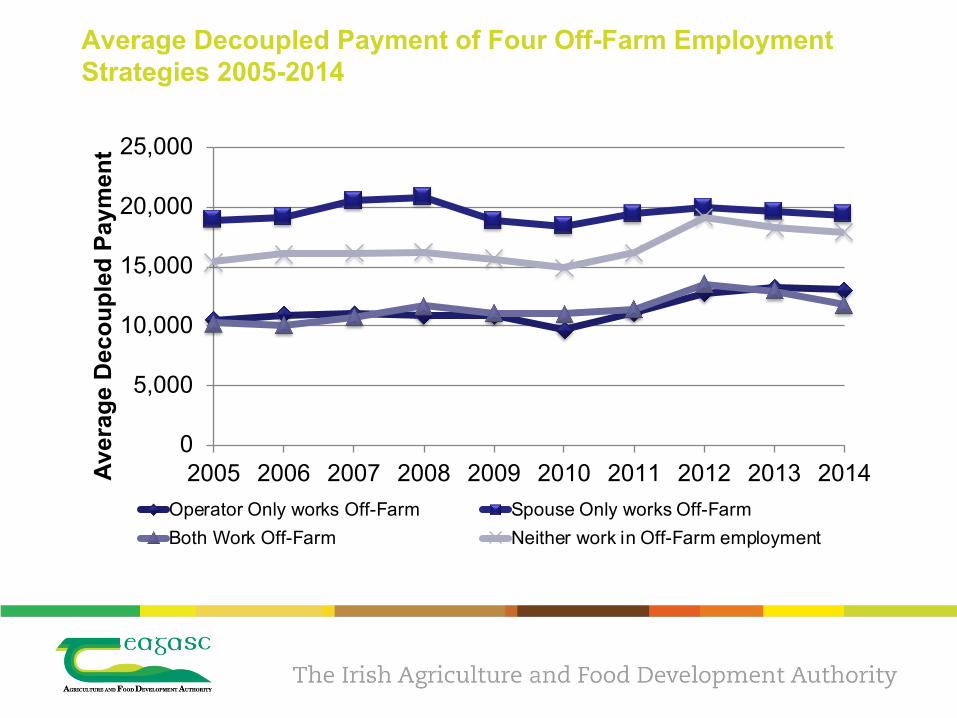
Average Decoupled Payment of Four Off-Farm Employment Strategies 2005-2014
0
5,000
10,000
15,000
20,000
25,000
2005 2006 2007 2008 2009 2010 2011 2012 2013 2014Aver
age
Dec
oupl
ed P
aym
ent
Operator Only works Off-Farm Spouse Only works Off-FarmBoth Work Off-Farm Neither work in Off-Farm employment
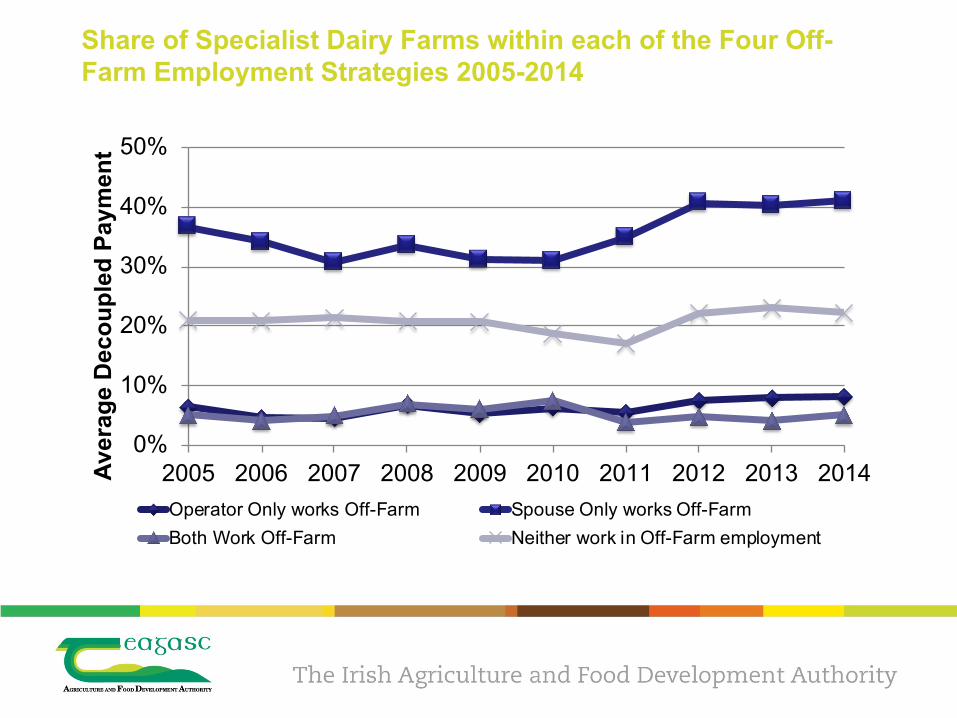
Share of Specialist Dairy Farms within each of the Four Off-Farm Employment Strategies 2005-2014
0%
10%
20%
30%
40%
50%
2005 2006 2007 2008 2009 2010 2011 2012 2013 2014Aver
age
Dec
oupl
ed P
aym
ent
Operator Only works Off-Farm Spouse Only works Off-FarmBoth Work Off-Farm Neither work in Off-Farm employment

Average Decoupled Payment of Four Off-Farm Employment Strategies 2005-2014 [Excluding Specialist Dairy Farms]
0
5,000
10,000
15,000
20,000
25,000
2005 2006 2007 2008 2009 2010 2011 2012 2013 2014Aver
age
Dec
oupl
ed P
aym
ent
Operator Only works Off-Farm Spouse Only works Off-FarmBoth Work Off-Farm Neither work in Off-Farm employment
Econometric Results
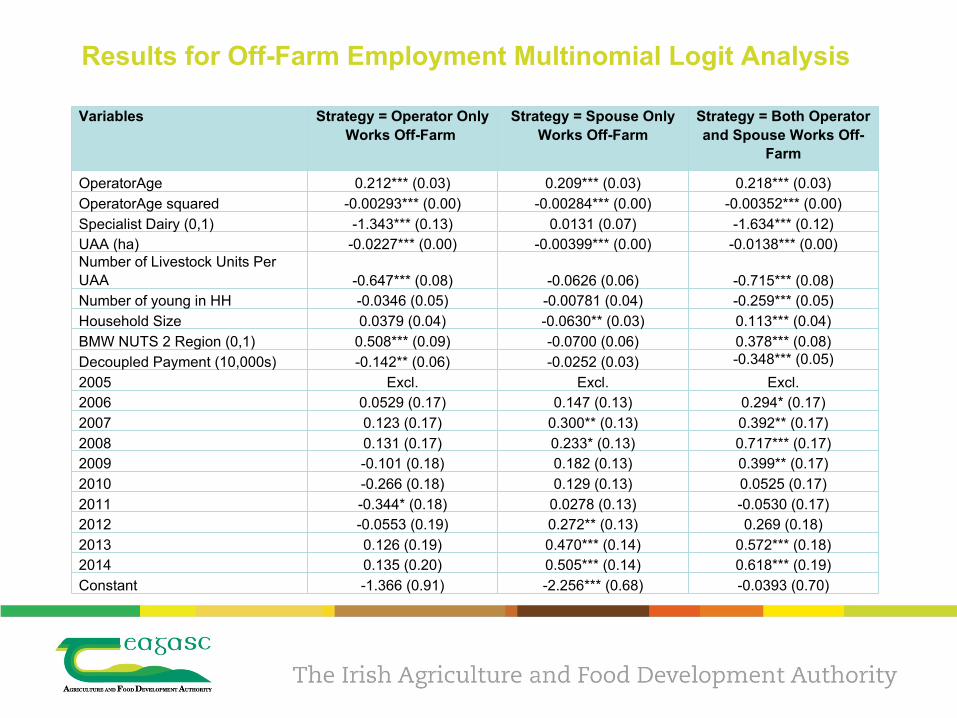
Results for Off-Farm Employment Multinomial Logit Analysis
Variables Strategy = Operator Only Works Off-Farm
Strategy = Spouse Only Works Off-Farm
Strategy = Both Operator and Spouse Works Off-
Farm
OperatorAge 0.212*** (0.03) 0.209*** (0.03) 0.218*** (0.03)OperatorAge squared -0.00293*** (0.00) -0.00284*** (0.00) -0.00352*** (0.00)Specialist Dairy (0,1) -1.343*** (0.13) 0.0131 (0.07) -1.634*** (0.12)UAA (ha) -0.0227*** (0.00) -0.00399*** (0.00) -0.0138*** (0.00)Number of Livestock Units Per UAA -0.647*** (0.08) -0.0626 (0.06) -0.715*** (0.08)Number of young in HH -0.0346 (0.05) -0.00781 (0.04) -0.259*** (0.05)Household Size 0.0379 (0.04) -0.0630** (0.03) 0.113*** (0.04)BMW NUTS 2 Region (0,1) 0.508*** (0.09) -0.0700 (0.06) 0.378*** (0.08)Decoupled Payment (10,000s) -0.142** (0.06) -0.0252 (0.03) -0.348*** (0.05)
2005 Excl. Excl. Excl.2006 0.0529 (0.17) 0.147 (0.13) 0.294* (0.17)2007 0.123 (0.17) 0.300** (0.13) 0.392** (0.17)2008 0.131 (0.17) 0.233* (0.13) 0.717*** (0.17)2009 -0.101 (0.18) 0.182 (0.13) 0.399** (0.17)2010 -0.266 (0.18) 0.129 (0.13) 0.0525 (0.17)2011 -0.344* (0.18) 0.0278 (0.13) -0.0530 (0.17)2012 -0.0553 (0.19) 0.272** (0.13) 0.269 (0.18)2013 0.126 (0.19) 0.470*** (0.14) 0.572*** (0.18)2014 0.135 (0.20) 0.505*** (0.14) 0.618*** (0.19)Constant -1.366 (0.91) -2.256*** (0.68) -0.0393 (0.70)

Results for Off-Farm Employment Multinomial Logit Analysis
Variables Strategy = Operator Only Works Off-Farm
Strategy = Spouse Only Works Off-Farm
Strategy = Both Operator and Spouse Works Off-
FarmOperator Age 0.313*** (0.04) 0.228*** (0.03) 0.306*** (0.04)
Operator Age Squared -0.00382*** (0.00) -0.00299*** (0.00) -0.00432*** (0.00)
Specialist Dairy (0,1) -1.336*** (0.13) 0.00995 (0.07) -1.621*** (0.12)
UAA (ha) -0.0225*** (0.00) -0.00391*** (0.00) -0.0137*** (0.00)
Number of young in HH 0.0246 (0.06) -0.0529 (0.06) -0.698*** (0.08)
Household Size -0.0213 (0.05) 0.0501 (0.04) -0.141*** (0.05)
Number of Livestock Units Per UAA -0.639*** (0.08) -0.143*** (0.03) -0.0506 (0.05)
BMW NUTS 2 Region (0,1) 0.525*** (0.09) -0.0590 (0.06) 0.401*** (0.08)
Decoupled Payment (10,000s) -0.143** (0.06) -0.0236 (0.03) -0.348*** (0.05)
No. of HH Members with 2nd level
education 0.0802 (0.07) 0.160*** (0.05) 0.282*** (0.06)
No. of HH Members with 3rd level
education 0.0443 (0.09) 0.103 (0.06) 0.187** (0.08)
2005 Excl. Excl. Excl.2006 0.0388 (0.17) 0.146 (0.13) 0.294* (0.17)
2007 0.125 (0.17) 0.311** (0.13) 0.399** (0.17)
2008 0.108 (0.17) 0.224* (0.13) 0.691*** (0.17)
2009 -0.114 (0.18) 0.184 (0.13) 0.388** (0.17)
2010 -0.286 (0.18) 0.122 (0.13) 0.0325 (0.17)
2011 -0.353** (0.18) 0.0298 (0.13) -0.0617 (0.17)
2012 -0.0798 (0.19) 0.266** (0.13) 0.242 (0.19)
2013 0.0887 (0.19) 0.458*** (0.14) 0.534*** (0.19)
2014 0.108 (0.20) 0.493*** (0.14) 0.575*** (0.19)
Constant -3.961*** (1.16) -2.686*** (0.78) -2.038* (1.10)
Conclusion
• Decoupled Payments are associated with reduced probability of the farm operator engaging in off-farm employment
• The relationship between decoupled payments and off-farm employment of the spouse is more complex
• Many spouses will tend to make decisions independent of decoupled payments
• Market Income or Coupled Farm Income appears to be associated with reduced probability of the spouse engaging in off-farm employment• This may be due to the contribution of the spouse towards
farm labour and requires further investigation• Interesting implications for CAP reform

Thank you for listeningComments and questions are very welcome
Related Documents