Japan's Fiscal Condition Provisional translation January 2015 Ministry of Finance

Welcome message from author
This document is posted to help you gain knowledge. Please leave a comment to let me know what you think about it! Share it to your friends and learn new things together.
Transcript

Japan's Fiscal Condition
Provisional translation
January 2015
Ministry of Finance
Table of Contents
(1) Fiscal Condition・・・・・・・・・・・・・・・・・・・・・・・・・・・・・・・・・・・・・・・・・・・・・・・・・・・・・・・・・・・・・・・・ 1
(2) Trends in General Account Tax Revenues, Total Expenditures and Government Bond Issues・・・ 2
(3) Government Bond Issues and Bond Dependency Ratio・・・・・・・・・・・・・・・・・・・・・・・・・・・・・・・・・・ 3
(4) Accumulated Government Bonds Outstanding・・・・・・・・・・・・・・・・・・・・・・・・・・・・・・・・・・・・・・・・ 4
(5) Long-Term Debt Outstanding of Central and Local Governments・・・・・・・・・・・・・・・・・・・・・・・・・ 5
(6) Trends in Interest Payments and Interest Rate・・・・・・・・・・・・・・・・・・・・・・・・・・・・・・・・・・・・・・・・・ 6
(7) Transition of Major Expenditure Items in the General Account・・・・・・・・・・・・・・・・・・・・・・・・・・・ 7
(8) General Account Revenues・・・・・・・・・・・・・・・・・・・・・・・・・・・・・・・・・・・・・・・・・・・・・・・・・・・・・・・ 8
(9) General Account Expenditures・・・・・・・・・・・・・・・・・・・・・・・・・・・・・・・・・・・・・・・・・・・・・・・・・・・・・ 9
(Reference 1) General Government Financial Balances (International Comparison)・・・・・・・・・・・・・・ 10
(Reference 2) General Government Gross Debt (International Comparison)・・・・・・・・・・・・・・・・・・・・ 11
(Reference 3) General Government Net Debt (International Comparison)・・・・・・・・・・・・・・・・・・・・・・ 12
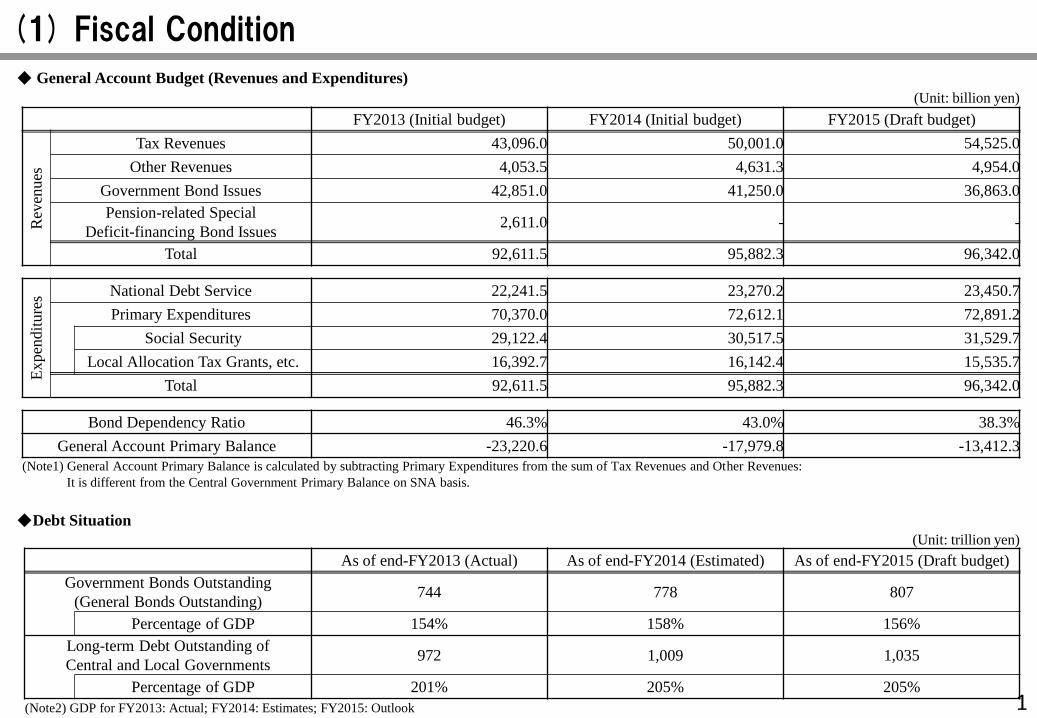
(1) Fiscal Condition
◆ General Account Budget (Revenues and Expenditures)
(Unit: billion yen)
FY2013 (Initial budget) FY2014 (Initial budget) FY2015 (Draft budget)
Rev
enues
Tax Revenues 43,096.0 50,001.0 54,525.0
Other Revenues 4,053.5 4,631.3 4,954.0
Government Bond Issues 42,851.0 41,250.0 36,863.0
Pension-related Special
Deficit-financing Bond Issues 2,611.0 - -
Total 92,611.5 95,882.3 96,342.0
Ex
pen
dit
ure
s National Debt Service 22,241.5 23,270.2 23,450.7
Primary Expenditures 70,370.0 72,612.1 72,891.2
Social Security 29,122.4 30,517.5 31,529.7
Local Allocation Tax Grants, etc. 16,392.7 16,142.4 15,535.7
Total 92,611.5 95,882.3 96,342.0
Bond Dependency Ratio 46.3% 43.0% 38.3%
General Account Primary Balance -23,220.6 -17,979.8 -13,412.3
(Note1) General Account Primary Balance is calculated by subtracting Primary Expenditures from the sum of Tax Revenues and Other Revenues:
It is different from the Central Government Primary Balance on SNA basis.
◆Debt Situation
(Unit: trillion yen)
As of end-FY2013 (Actual) As of end-FY2014 (Estimated) As of end-FY2015 (Draft budget)
Government Bonds Outstanding
(General Bonds Outstanding) 744 778 807
Percentage of GDP 154% 158% 156%
Long-term Debt Outstanding of
Central and Local Governments 972 1,009 1,035
Percentage of GDP 201% 205% 205%
(Note2) GDP for FY2013: Actual; FY2014: Estimates; FY2015: Outlook 1
2.1 3.5 4.5 4.3 6.3 7.2 5.9 7.0 6.7 6.4 6.0 5.0
2.5 1.0 0.2
0.8 2.0
9.2 8.5
16.9
24.3 21.9 20.9
25.8 28.7
26.8 23.5
21.1 19.3
26.2
36.9 34.7 34.4 36.0
33.8 33.9 30.9
3.2 3.7
5.0 6.3
7.1 7.0 7.0
7.0 6.8 6.4 6.3 6.2
6.9 6.2 6.4 6.3 6.7
9.5
16.2 12.3
16.4
10.7 9.9
17.0
13.2
11.1 9.1
9.1 6.7
8.7
7.8
6.4 6.0
7.0
15.0
7.6 8.4 11.4
7.0 6.6
6.0
13.8 15.7
17.3
21.9 23.7
26.9 29.0
30.5 32.4
34.9
38.2
41.9
46.8
50.8
54.9
60.1 59.8
54.4 54.1
51.0 51.9 52.1 53.9
49.4 47.2
50.7 47.9
43.8 43.3 45.6
49.1 49.1 51.0
44.3
38.7 41.5 42.8
43.9
47.0
51.7
54.5
20.9
24.5
29.1
34.1
38.8
43.4
46.9 47.2
50.6 51.5 53.0 53.6
57.7
61.5
65.9
69.3 70.5 70.5
75.1 73.6
75.9
78.8 78.5
84.4
89.0 89.3
84.8 83.7 82.4
84.9 85.5
81.4 81.8
84.7
101.0
95.3
100.7
97.1
100.2 99.0
96.3
5.3 7.2
9.6 10.7
13.5 14.2 12.9 14.0 13.5 12.8 12.3
11.3 9.4
7.2 6.6 6.3 6.7
9.5
16.2
13.2
18.4 19.9
18.5
34.0
37.5
33.0
30.0
35.0 35.3 35.5
31.3
27.5 25.4
33.2
52.0
42.3 42.8
47.5
40.9 40.5
36.9
0
20
40
60
80
100
120
75 76 77 78 79 80 81 82 83 84 85 86 87 88 89 90 91 92 93 94 95 96 97 98 99 00 01 02 03 04 05 06 07 08 09 10 11 12 13 14 15
(trillion yen)
(FY)
Total Expenditures
Total Revenues
Special Deficit-Financing
Bond Issues
Construction Bond Issues
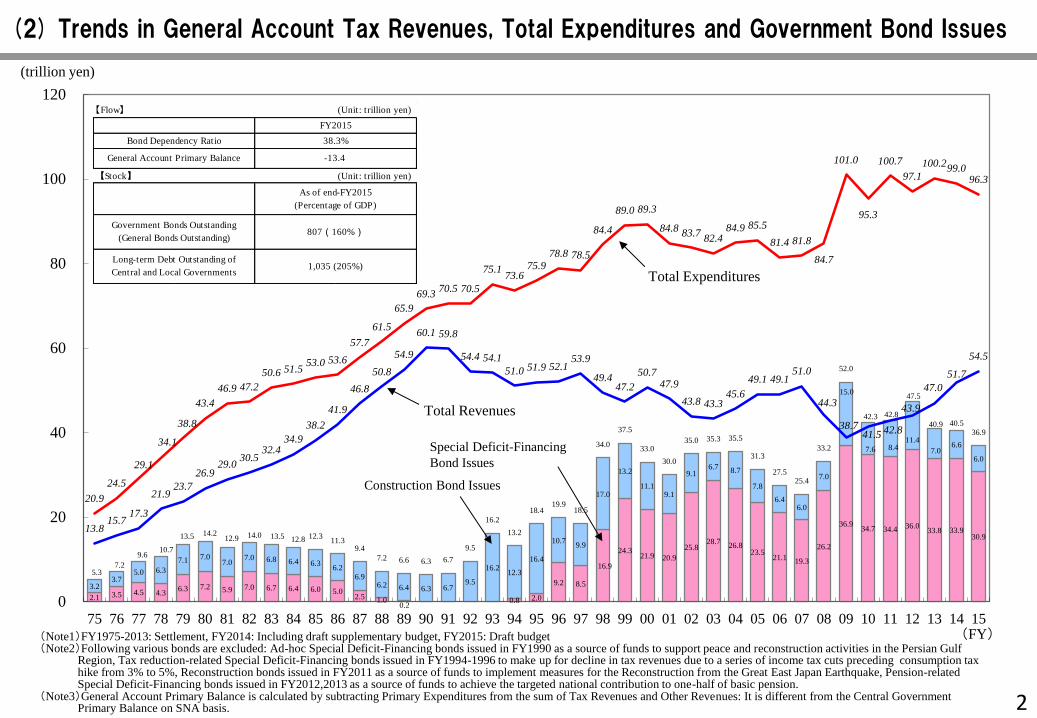
(2) Trends in General Account Tax Revenues, Total Expenditures and Government Bond Issues
(Note1)FY1975-2013: Settlement, FY2014: Including draft supplementary budget, FY2015: Draft budget (Note2)Following various bonds are excluded: Ad-hoc Special Deficit-Financing bonds issued in FY1990 as a source of funds to support peace and reconstruction activities in the Persian Gulf
Region, Tax reduction-related Special Deficit-Financing bonds issued in FY1994-1996 to make up for decline in tax revenues due to a series of income tax cuts preceding consumption tax hike from 3% to 5%, Reconstruction bonds issued in FY2011 as a source of funds to implement measures for the Reconstruction from the Great East Japan Earthquake, Pension-related Special Deficit-Financing bonds issued in FY2012,2013 as a source of funds to achieve the targeted national contribution to one-half of basic pension.
(Note3)General Account Primary Balance is calculated by subtracting Primary Expenditures from the sum of Tax Revenues and Other Revenues: It is different from the Central Government Primary Balance on SNA basis.
【Flow】 (Unit: trillion yen)
【Stock】 (Unit: trillion yen)
Government Bonds Outstanding
(General Bonds Outstanding)807(160%)
Long-term Debt Outstanding of
Central and Local Governments1,035 (205%)
FY2015
38.3%
-13.4
As of end-FY2015
(Percentage of GDP)
General Account Primary Balance
Bond Dependency Ratio
2
2.1 3.5 4.5 4.3
6.3 7.2 5.9 7.0 6.7 6.4 6.0 5.0
2.5 1.0
0.2 0.8 2.0
9.2 8.5
16.9
24.3 21.9 20.9
25.8 28.7
26.8
23.5 21.1
19.3
26.2
36.9 34.7 34.4
36.0 33.8 33.9
30.9
3.2
3.7
5.0 6.3
7.1 7.0
7.0 7.0 6.8 6.4 6.3
6.2
6.9
6.2 6.4 6.3 6.7
9.5
16.2 12.3
16.4
10.7 9.9
17.0
13.2
11.1
9.1
9.1
6.7 8.7
7.8
6.4
6.0
7.0
15.0
7.6 8.4
11.4
7.0 6.6
6.0
5.3
7.2
9.6 10.7
13.5 14.2
12.9 14.0 13.5
12.8 12.3 11.3
9.4
7.2 6.6 6.3 6.7
9.5
16.2
13.2
18.4
19.9 18.5
34.0
37.5
33.0
30.0
35.0 35.3 35.5
31.3
27.5
25.4
33.2
52.0
42.3 42.8
47.5
40.9 40.5
36.9
25.3
29.4
32.9
31.3
34.7
32.6
27.5
29.7
26.6
24.8
23.2
21.0
16.3
11.6 10.1
9.2 9.5
13.5
21.5
17.9
24.2 25.2
23.5
40.3
42.1
36.9
35.4
41.8 42.9
41.8
36.6
33.7
31.0
39.2
51.5
44.4 42.5
48.9
40.8 40.9
38.3
0
10
20
30
40
50
60
0
10
20
30
40
50
60
75 76 77 78 79 80 81 82 83 84 85 86 87 88 89 90 91 92 93 94 95 96 97 98 99 00 01 02 03 04 05 06 07 08 09 10 11 12 13 14 15
(trillion yen)
(FY)
Construction
Bond
Special Deficit-
financing Bond
Government Bond Issues (left axis)
Bond Dependency Ratio (right axis)
(%)
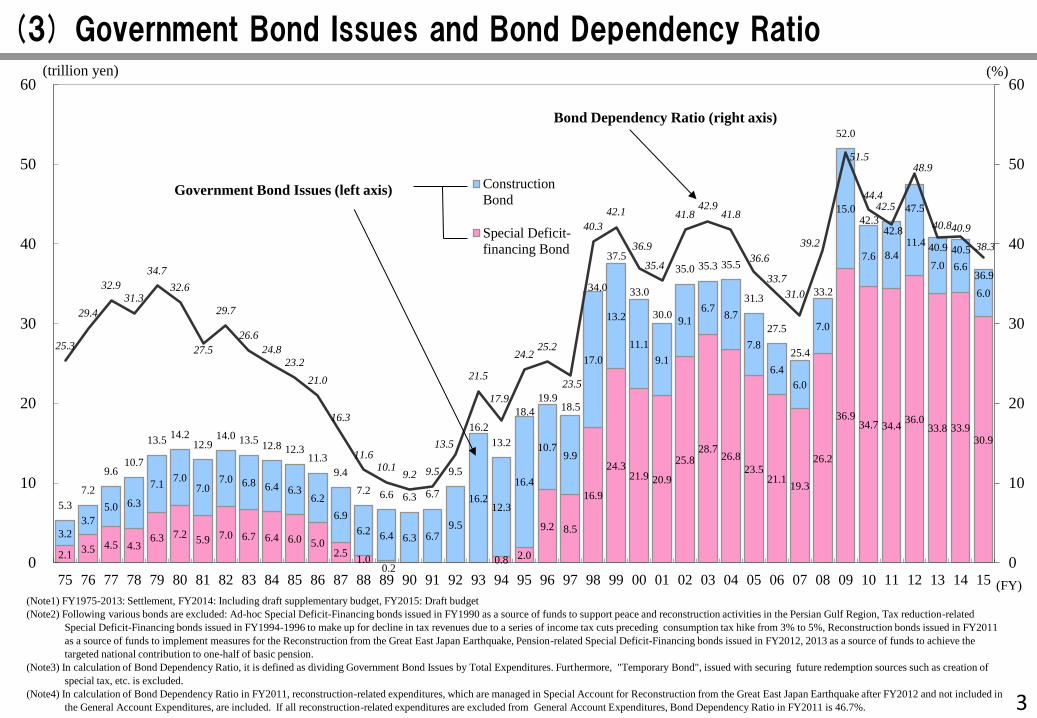
(3) Government Bond Issues and Bond Dependency Ratio
(Note1) FY1975-2013: Settlement, FY2014: Including draft supplementary budget, FY2015: Draft budget
(Note2) Following various bonds are excluded: Ad-hoc Special Deficit-Financing bonds issued in FY1990 as a source of funds to support peace and reconstruction activities in the Persian Gulf Region, Tax reduction-related
Special Deficit-Financing bonds issued in FY1994-1996 to make up for decline in tax revenues due to a series of income tax cuts preceding consumption tax hike from 3% to 5%, Reconstruction bonds issued in FY2011
as a source of funds to implement measures for the Reconstruction from the Great East Japan Earthquake, Pension-related Special Deficit-Financing bonds issued in FY2012, 2013 as a source of funds to achieve the
targeted national contribution to one-half of basic pension.
(Note3) In calculation of Bond Dependency Ratio, it is defined as dividing Government Bond Issues by Total Expenditures. Furthermore, "Temporary Bond", issued with securing future redemption sources such as creation of
special tax, etc. is excluded.
(Note4) In calculation of Bond Dependency Ratio in FY2011, reconstruction-related expenditures, which are managed in Special Account for Reconstruction from the Great East Japan Earthquake after FY2012 and not included in
the General Account Expenditures, are included. If all reconstruction-related expenditures are excluded from General Account Expenditures, Bond Dependency Ratio in FY2011 is 46.7%. 3
2 5 10 15 21 28 33
40 47 53 59 64 65 65 64 65 64 63 61 64 67 77 83
108
134
158 176
199
231
258
280 288
305 321
356
390
411
445
477
508
531
13 17 22 28
35 42
49 56
63 69
75 81 87 91 97 102 108 116
131 142
158
168 175
187
197
209
216
222
226
241
247 243 237 225
238
246
248
250
258
261
266
11
10
9
9
10
0 1 2 2 2 3 4 6 8 10 15 22 32
43 56
71 82
96 110
122 134
145 152 157 161 166 172 178 193
207
225
245 258
295
332
368
392
421
457
499
527 532 541 546
594
636
670
705
744
778
807
0
50
100
150
200
250
300
350
400
450
500
550
600
650
700
750
800
850
65 66 67 68 69 70 71 72 73 74 75 76 77 78 79 80 81 82 83 84 85 86 87 88 89 90 91 92 93 94 95 96 97 98 99 00 01 02 03 04 05 06 07 08 09 10 11 12 13 14 15
(trillion yen)
(As of the end of FY)
Construction
Bonds
Special Deficit-
Financing
Bonds
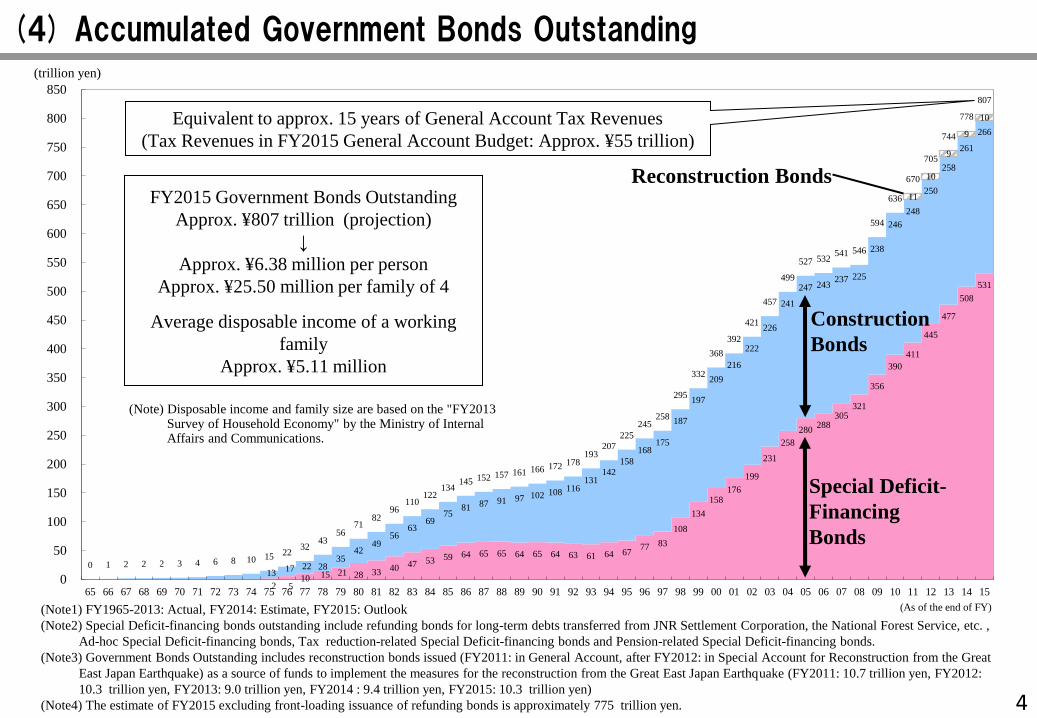
Equivalent to approx. 15 years of General Account Tax Revenues
(Tax Revenues in FY2015 General Account Budget: Approx. ¥55 trillion)
FY2015 Government Bonds Outstanding
Approx. ¥807 trillion (projection)
↓
Approx. ¥6.38 million per person
Approx. ¥25.50 million per family of 4
Average disposable income of a working
family
Approx. ¥5.11 million
Reconstruction Bonds
(4) Accumulated Government Bonds Outstanding
(Note1) FY1965-2013: Actual, FY2014: Estimate, FY2015: Outlook
(Note2) Special Deficit-financing bonds outstanding include refunding bonds for long-term debts transferred from JNR Settlement Corporation, the National Forest Service, etc. ,
Ad-hoc Special Deficit-financing bonds, Tax reduction-related Special Deficit-financing bonds and Pension-related Special Deficit-financing bonds.
(Note3) Government Bonds Outstanding includes reconstruction bonds issued (FY2011: in General Account, after FY2012: in Special Account for Reconstruction from the Great
East Japan Earthquake) as a source of funds to implement the measures for the reconstruction from the Great East Japan Earthquake (FY2011: 10.7 trillion yen, FY2012:
10.3 trillion yen, FY2013: 9.0 trillion yen, FY2014 : 9.4 trillion yen, FY2015: 10.3 trillion yen)
(Note4) The estimate of FY2015 excluding front-loading issuance of refunding bonds is approximately 775 trillion yen.
(Note) Disposable income and family size are based on the "FY2013 Survey of Household Economy" by the Ministry of Internal Affairs and Communications.
4
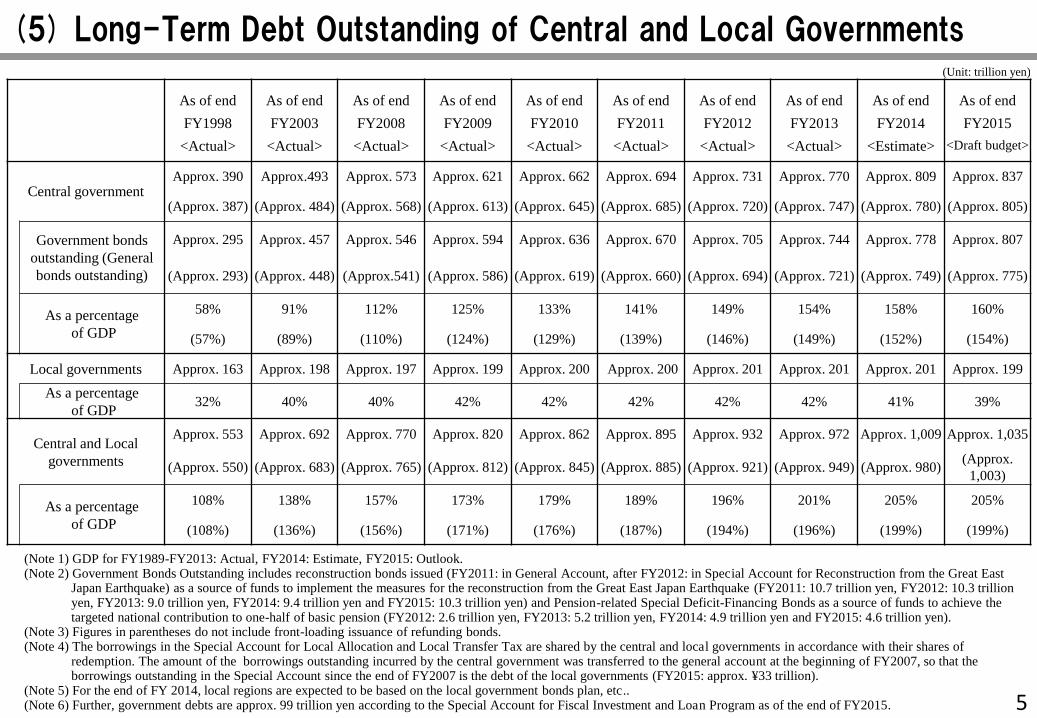
(5) Long-Term Debt Outstanding of Central and Local Governments
(Note 1) GDP for FY1989-FY2013: Actual, FY2014: Estimate, FY2015: Outlook. (Note 2) Government Bonds Outstanding includes reconstruction bonds issued (FY2011: in General Account, after FY2012: in Special Account for Reconstruction from the Great East
Japan Earthquake) as a source of funds to implement the measures for the reconstruction from the Great East Japan Earthquake (FY2011: 10.7 trillion yen, FY2012: 10.3 trillion yen, FY2013: 9.0 trillion yen, FY2014: 9.4 trillion yen and FY2015: 10.3 trillion yen) and Pension-related Special Deficit-Financing Bonds as a source of funds to achieve the targeted national contribution to one-half of basic pension (FY2012: 2.6 trillion yen, FY2013: 5.2 trillion yen, FY2014: 4.9 trillion yen and FY2015: 4.6 trillion yen).
(Note 3) Figures in parentheses do not include front-loading issuance of refunding bonds. (Note 4) The borrowings in the Special Account for Local Allocation and Local Transfer Tax are shared by the central and local governments in accordance with their shares of
redemption. The amount of the borrowings outstanding incurred by the central government was transferred to the general account at the beginning of FY2007, so that the borrowings outstanding in the Special Account since the end of FY2007 is the debt of the local governments (FY2015: approx. ¥33 trillion).
(Note 5) For the end of FY 2014, local regions are expected to be based on the local government bonds plan, etc.. (Note 6) Further, government debts are approx. 99 trillion yen according to the Special Account for Fiscal Investment and Loan Program as of the end of FY2015.
(Unit: trillion yen)
As of end As of end As of end As of end As of end As of end As of end As of end As of end As of end
FY1998 FY2003 FY2008 FY2009 FY2010 FY2011 FY2012 FY2013 FY2014 FY2015
<Actual> <Actual> <Actual> <Actual> <Actual> <Actual> <Actual> <Actual> <Estimate> <Draft budget>
Central government Approx. 390 Approx.493 Approx. 573 Approx. 621 Approx. 662 Approx. 694 Approx. 731 Approx. 770 Approx. 809 Approx. 837
(Approx. 387) (Approx. 484) (Approx. 568) (Approx. 613) (Approx. 645) (Approx. 685) (Approx. 720) (Approx. 747) (Approx. 780) (Approx. 805)
Government bonds
outstanding (General
bonds outstanding)
Approx. 295 Approx. 457 Approx. 546 Approx. 594 Approx. 636 Approx. 670 Approx. 705 Approx. 744 Approx. 778 Approx. 807
(Approx. 293) (Approx. 448) (Approx.541) (Approx. 586) (Approx. 619) (Approx. 660) (Approx. 694) (Approx. 721) (Approx. 749) (Approx. 775)
As a percentage
of GDP
58% 91% 112% 125% 133% 141% 149% 154% 158% 160%
(57%) (89%) (110%) (124%) (129%) (139%) (146%) (149%) (152%) (154%)
Local governments Approx. 163 Approx. 198 Approx. 197 Approx. 199 Approx. 200 Approx. 200 Approx. 201 Approx. 201 Approx. 201 Approx. 199
As a percentage
of GDP 32% 40% 40% 42% 42% 42% 42% 42% 41% 39%
Central and Local
governments
Approx. 553 Approx. 692 Approx. 770 Approx. 820 Approx. 862 Approx. 895 Approx. 932 Approx. 972 Approx. 1,009 Approx. 1,035
(Approx. 550) (Approx. 683) (Approx. 765) (Approx. 812) (Approx. 845) (Approx. 885) (Approx. 921) (Approx. 949) (Approx. 980) (Approx.
1,003)
As a percentage
of GDP
108% 138% 157% 173% 179% 189% 196% 201% 205% 205%
(108%) (136%) (156%) (171%) (176%) (187%) (194%) (196%) (199%) (199%)
5
15 22 32 43 56
71 82
96 110
122 134 145 152 157 161 166 172 178
193 207
225 245
258
295
332
368
392 421
457
499
527 532 541 546
594
636
670
705
744
778
807
0.8 1.3
1.9 2.6
3.3
4.4
5.6
6.6
7.7
8.7
9.7 10.2
10.4
10.5
10.6
10.8
11.0
10.8
10.6
10.7
10.7 10.7
10.6 10.8
10.5 10.0
9.4
8.6
7.8 7.3
7.0 7.0 7.4 7.6 7.7 7.9 8.1 8.0 8.1
8.6
10.1
7.4 7.6
7.4
7.1 7.2 7.4 7.5 7.6 7.5
7.4 7.2
6.8
6.5 6.3
6.2 6.1 6.1 5.8
5.4 5.1
4.6
4.3
4.0 3.5
3.1 2.7
2.3
2.0 1.7
1.5 1.4 1.4 1.4 1.4 1.4 1.3 1.2 1.2 1.2
0
100
200
300
400
500
600
700
800
900
75 76 77 78 79 80 81 82 83 84 85 86 87 88 89 90 91 92 93 94 95 96 97 98 99 00 01 02 03 04 05 06 07 08 09 10 11 12 13 14 15
(trillion yen) (trillion yen)
(FY)
10% 25
8% 20
6% 15
4% 10
2% 5
0% 0
Interest rate (left scale)
Interest payments (left scale)
Government bonds
outstanding (right scale)
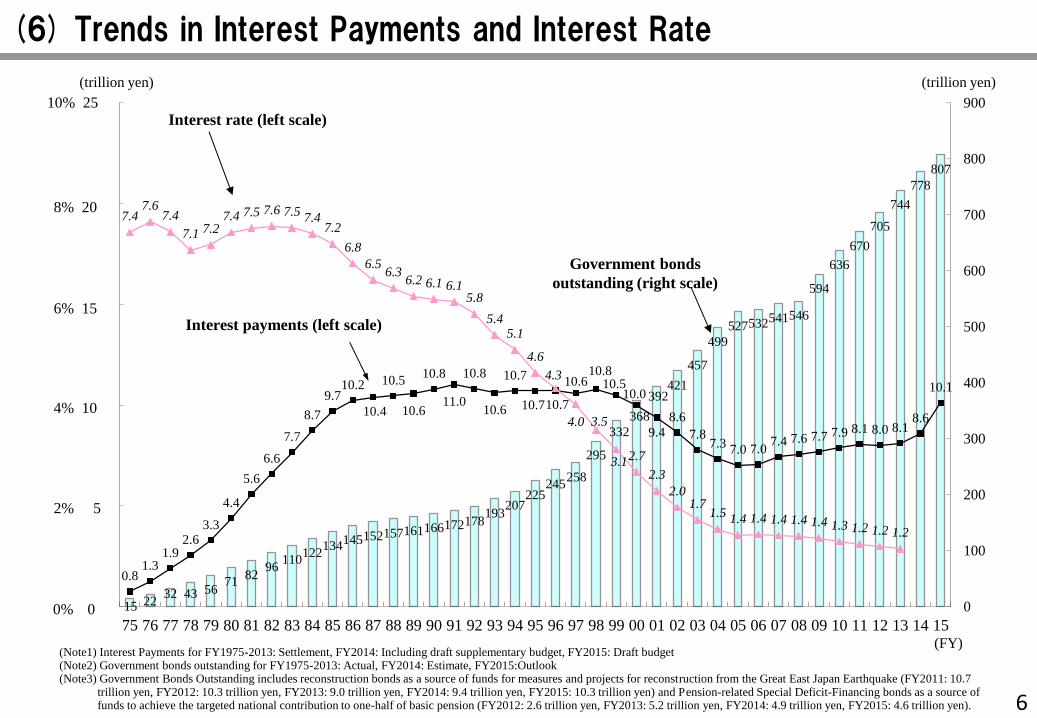
(6) Trends in Interest Payments and Interest Rate
(Note1) Interest Payments for FY1975-2013: Settlement, FY2014: Including draft supplementary budget, FY2015: Draft budget (Note2) Government bonds outstanding for FY1975-2013: Actual, FY2014: Estimate, FY2015:Outlook (Note3) Government Bonds Outstanding includes reconstruction bonds as a source of funds for measures and projects for reconstruction from the Great East Japan Earthquake (FY2011: 10.7
trillion yen, FY2012: 10.3 trillion yen, FY2013: 9.0 trillion yen, FY2014: 9.4 trillion yen, FY2015: 10.3 trillion yen) and Pension-related Special Deficit-Financing bonds as a source of funds to achieve the targeted national contribution to one-half of basic pension (FY2012: 2.6 trillion yen, FY2013: 5.2 trillion yen, FY2014: 4.9 trillion yen, FY2015: 4.6 trillion yen). 6
8.2 11.5
17.6
31.5
7.0
15.9
15.8
15.5
6.9
7.0
11.9
6.0
15.9
20.6
22.5
19.9
5.5
14.3
21.4
23.5
0
10
20
30
40
50
60
70
80
90
100
FY1960 FY1970 FY1980 FY1990 FY2000 FY2015
96.3
89.3
69.3
43.4
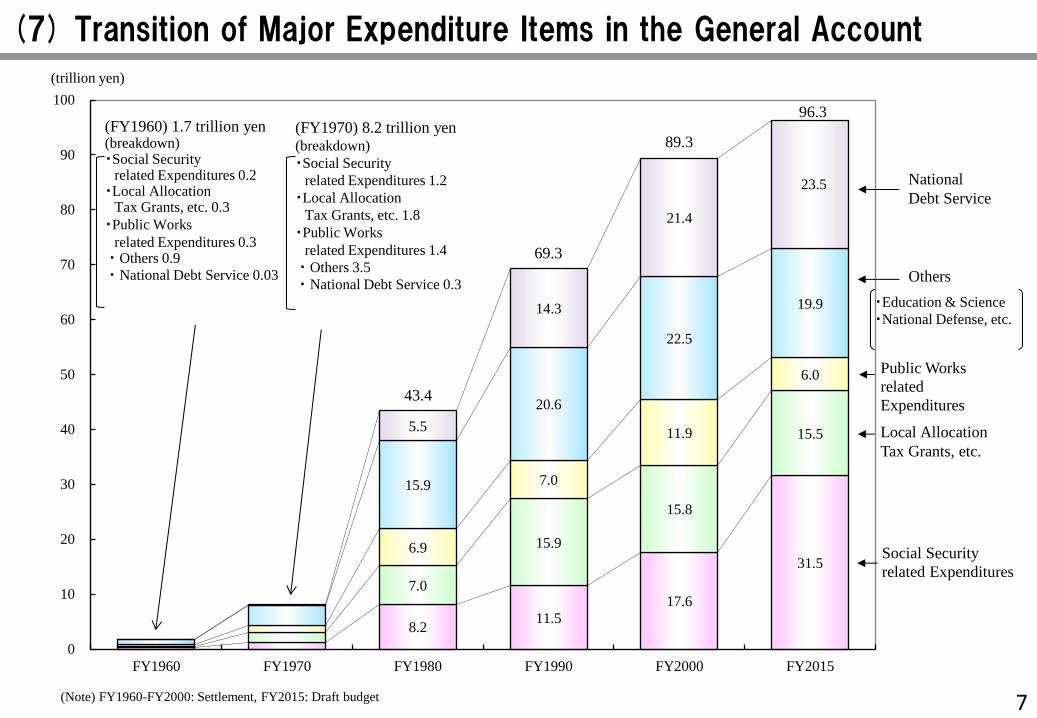
(7) Transition of Major Expenditure Items in the General Account
(FY1960) 1.7 trillion yen (breakdown) ・Social Security related Expenditures 0.2 ・Local Allocation Tax Grants, etc. 0.3
・Public Works
related Expenditures 0.3 ・Others 0.9
・National Debt Service 0.03
(FY1970) 8.2 trillion yen (breakdown)
・Social Security
related Expenditures 1.2
・Local Allocation
Tax Grants, etc. 1.8
・Public Works
related Expenditures 1.4
・Others 3.5
・National Debt Service 0.3
Public Works
related
Expenditures
Social Security
related Expenditures
Local Allocation
Tax Grants, etc.
National
Debt Service
Others
・Education & Science
・National Defense, etc.
(Note) FY1960-FY2000: Settlement, FY2015: Draft budget 7
(trillion yen)
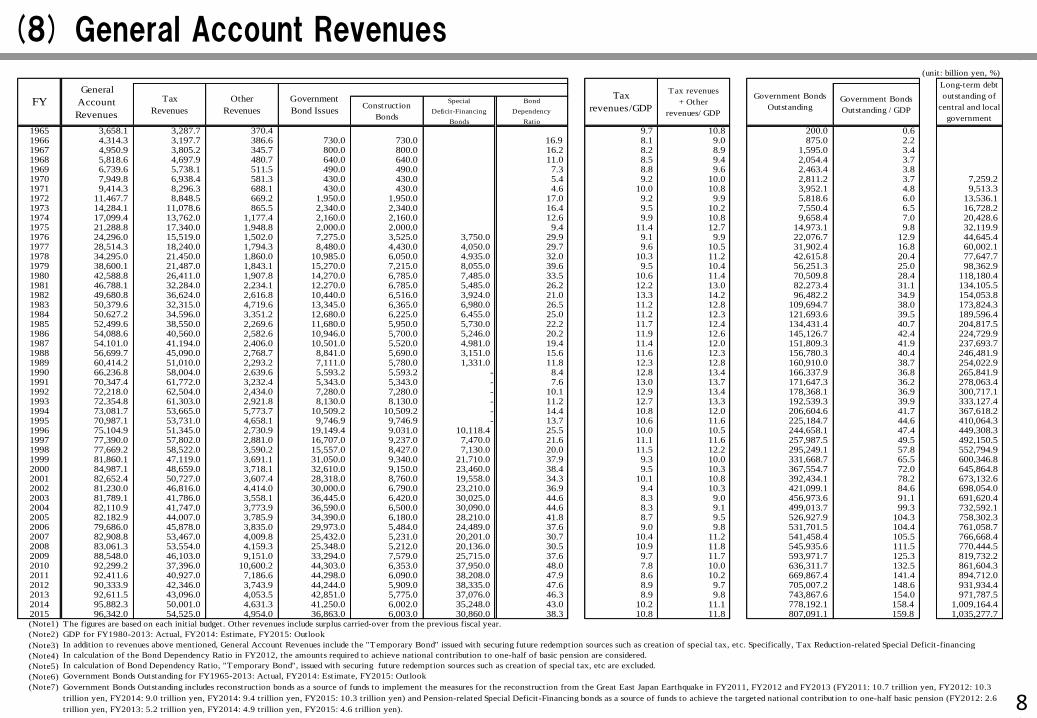
(8) General Account Revenues (unit: billion yen, %)
Construction
Bonds
Special
Deficit-Financing
Bonds
Bond
Dependency
Ratio
1965 3,658.1 3,287.7 370.4 9.7 10.8 200.0 0.61966 4,314.3 3,197.7 386.6 730.0 730.0 16.9 8.1 9.0 875.0 2.21967 4,950.9 3,805.2 345.7 800.0 800.0 16.2 8.2 8.9 1,595.0 3.41968 5,818.6 4,697.9 480.7 640.0 640.0 11.0 8.5 9.4 2,054.4 3.71969 6,739.6 5,738.1 511.5 490.0 490.0 7.3 8.8 9.6 2,463.4 3.81970 7,949.8 6,938.4 581.3 430.0 430.0 5.4 9.2 10.0 2,811.2 3.7 7,259.21971 9,414.3 8,296.3 688.1 430.0 430.0 4.6 10.0 10.8 3,952.1 4.8 9,513.31972 11,467.7 8,848.5 669.2 1,950.0 1,950.0 17.0 9.2 9.9 5,818.6 6.0 13,536.11973 14,284.1 11,078.6 865.5 2,340.0 2,340.0 16.4 9.5 10.2 7,550.4 6.5 16,728.21974 17,099.4 13,762.0 1,177.4 2,160.0 2,160.0 12.6 9.9 10.8 9,658.4 7.0 20,428.61975 21,288.8 17,340.0 1,948.8 2,000.0 2,000.0 9.4 11.4 12.7 14,973.1 9.8 32,119.91976 24,296.0 15,519.0 1,502.0 7,275.0 3,525.0 3,750.0 29.9 9.1 9.9 22,076.7 12.9 44,645.41977 28,514.3 18,240.0 1,794.3 8,480.0 4,430.0 4,050.0 29.7 9.6 10.5 31,902.4 16.8 60,002.11978 34,295.0 21,450.0 1,860.0 10,985.0 6,050.0 4,935.0 32.0 10.3 11.2 42,615.8 20.4 77,647.71979 38,600.1 21,487.0 1,843.1 15,270.0 7,215.0 8,055.0 39.6 9.5 10.4 56,251.3 25.0 98,362.91980 42,588.8 26,411.0 1,907.8 14,270.0 6,785.0 7,485.0 33.5 10.6 11.4 70,509.8 28.4 118,180.41981 46,788.1 32,284.0 2,234.1 12,270.0 6,785.0 5,485.0 26.2 12.2 13.0 82,273.4 31.1 134,105.51982 49,680.8 36,624.0 2,616.8 10,440.0 6,516.0 3,924.0 21.0 13.3 14.2 96,482.2 34.9 154,053.81983 50,379.6 32,315.0 4,719.6 13,345.0 6,365.0 6,980.0 26.5 11.2 12.8 109,694.7 38.0 173,824.31984 50,627.2 34,596.0 3,351.2 12,680.0 6,225.0 6,455.0 25.0 11.2 12.3 121,693.6 39.5 189,596.41985 52,499.6 38,550.0 2,269.6 11,680.0 5,950.0 5,730.0 22.2 11.7 12.4 134,431.4 40.7 204,817.51986 54,088.6 40,560.0 2,582.6 10,946.0 5,700.0 5,246.0 20.2 11.9 12.6 145,126.7 42.4 224,729.91987 54,101.0 41,194.0 2,406.0 10,501.0 5,520.0 4,981.0 19.4 11.4 12.0 151,809.3 41.9 237,693.71988 56,699.7 45,090.0 2,768.7 8,841.0 5,690.0 3,151.0 15.6 11.6 12.3 156,780.3 40.4 246,481.91989 60,414.2 51,010.0 2,293.2 7,111.0 5,780.0 1,331.0 11.8 12.3 12.8 160,910.0 38.7 254,022.91990 66,236.8 58,004.0 2,639.6 5,593.2 5,593.2 - 8.4 12.8 13.4 166,337.9 36.8 265,841.91991 70,347.4 61,772.0 3,232.4 5,343.0 5,343.0 - 7.6 13.0 13.7 171,647.3 36.2 278,063.41992 72,218.0 62,504.0 2,434.0 7,280.0 7,280.0 - 10.1 12.9 13.4 178,368.1 36.9 300,717.11993 72,354.8 61,303.0 2,921.8 8,130.0 8,130.0 - 11.2 12.7 13.3 192,539.3 39.9 333,127.41994 73,081.7 53,665.0 5,773.7 10,509.2 10,509.2 - 14.4 10.8 12.0 206,604.6 41.7 367,618.21995 70,987.1 53,731.0 4,658.1 9,746.9 9,746.9 - 13.7 10.6 11.6 225,184.7 44.6 410,064.31996 75,104.9 51,345.0 2,730.9 19,149.4 9,031.0 10,118.4 25.5 10.0 10.5 244,658.1 47.4 449,308.31997 77,390.0 57,802.0 2,881.0 16,707.0 9,237.0 7,470.0 21.6 11.1 11.6 257,987.5 49.5 492,150.51998 77,669.2 58,522.0 3,590.2 15,557.0 8,427.0 7,130.0 20.0 11.5 12.2 295,249.1 57.8 552,794.91999 81,860.1 47,119.0 3,691.1 31,050.0 9,340.0 21,710.0 37.9 9.3 10.0 331,668.7 65.5 600,346.82000 84,987.1 48,659.0 3,718.1 32,610.0 9,150.0 23,460.0 38.4 9.5 10.3 367,554.7 72.0 645,864.82001 82,652.4 50,727.0 3,607.4 28,318.0 8,760.0 19,558.0 34.3 10.1 10.8 392,434.1 78.2 673,132.62002 81,230.0 46,816.0 4,414.0 30,000.0 6,790.0 23,210.0 36.9 9.4 10.3 421,099.1 84.6 698,054.02003 81,789.1 41,786.0 3,558.1 36,445.0 6,420.0 30,025.0 44.6 8.3 9.0 456,973.6 91.1 691,620.42004 82,110.9 41,747.0 3,773.9 36,590.0 6,500.0 30,090.0 44.6 8.3 9.1 499,013.7 99.3 732,592.12005 82,182.9 44,007.0 3,785.9 34,390.0 6,180.0 28,210.0 41.8 8.7 9.5 526,927.9 104.3 758,302.32006 79,686.0 45,878.0 3,835.0 29,973.0 5,484.0 24,489.0 37.6 9.0 9.8 531,701.5 104.4 761,058.72007 82,908.8 53,467.0 4,009.8 25,432.0 5,231.0 20,201.0 30.7 10.4 11.2 541,458.4 105.5 766,668.42008 83,061.3 53,554.0 4,159.3 25,348.0 5,212.0 20,136.0 30.5 10.9 11.8 545,935.6 111.5 770,444.52009 88,548.0 46,103.0 9,151.0 33,294.0 7,579.0 25,715.0 37.6 9.7 11.7 593,971.7 125.3 819,732.22010 92,299.2 37,396.0 10,600.2 44,303.0 6,353.0 37,950.0 48.0 7.8 10.0 636,311.7 132.5 861,604.32011 92,411.6 40,927.0 7,186.6 44,298.0 6,090.0 38,208.0 47.9 8.6 10.2 669,867.4 141.4 894,712.02012 90,333.9 42,346.0 3,743.9 44,244.0 5,909.0 38,335.0 47.6 8.9 9.7 705,007.2 148.6 931,934.42013 92,611.5 43,096.0 4,053.5 42,851.0 5,775.0 37,076.0 46.3 8.9 9.8 743,867.6 154.0 971,787.52014 95,882.3 50,001.0 4,631.3 41,250.0 6,002.0 35,248.0 43.0 10.2 11.1 778,192.1 158.4 1,009,164.42015 96,342.0 54,525.0 4,954.0 36,863.0 6,003.0 30,860.0 38.3 10.8 11.8 807,091.1 159.8 1,035,277.7(Note1)
(Note2)
(Note3)
(Note4)
(Note5)
(Note6)
(Note7)
In addition to revenues above mentioned, General Account Revenues include the "Temporary Bond" issued with securing future redemption sources such as creation of special tax, etc. Specifically, Tax Reduction-related Special Deficit-financing
Government Bonds Outstanding includes reconstruction bonds as a source of funds to implement the measures for the reconstruction from the Great East Japan Earthquake in FY2011, FY2012 and FY2013 (FY2011: 10.7 trillion yen, FY2012: 10.3
trillion yen, FY2014: 9.0 trillion yen, FY2014: 9.4 trillion yen, FY2015: 10.3 trillion yen) and Pension-related Special Deficit-Financing bonds as a source of funds to achieve the targeted national contribution to one-half basic pension (FY2012: 2.6
trillion yen, FY2013: 5.2 trillion yen, FY2014: 4.9 trillion yen, FY2015: 4.6 trillion yen).
Tax
revenues/GDP
In calculation of Bond Dependency Ratio, "Temporary Bond", issued with securing future redemption sources such as creation of special tax, etc are excluded.
Long-term debt
outstanding of
central and local
government
Tax revenues
+ Other
revenues/ GDP
The figures are based on each initial budget. Other revenues include surplus carried-over from the previous fiscal year.
GDP for FY1980-2013: Actual, FY2014: Estimate, FY2015: Outlook
In calculation of the Bond Dependency Ratio in FY2012, the amounts required to achieve national contribution to one-half of basic pension are considered.
Government Bonds Outstanding for FY1965-2013: Actual, FY2014: Estimate, FY2015: Outlook
FYGeneral
Account
Revenues
Government Bonds
OutstandingTax
Revenues
Other
Revenues
Government
Bond Issues
Government Bonds
Outstanding / GDP
(8) General Account Revenues
8
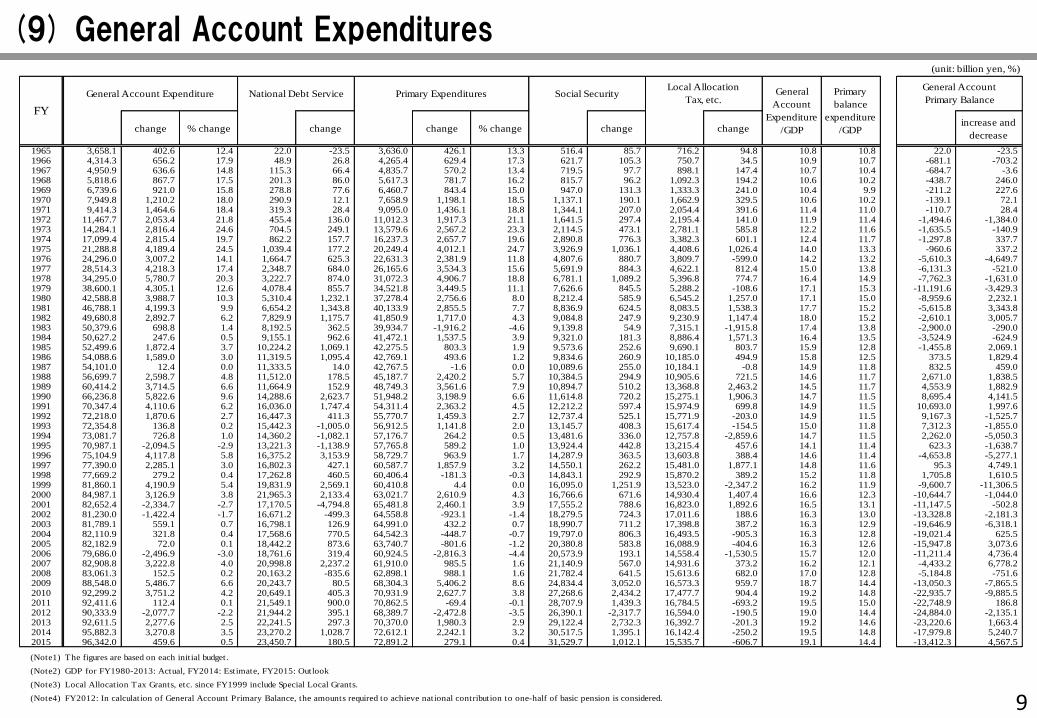
(9) General Account Expenditures (unit: billion yen, %)
change % change change change % change change changeincrease and
decrease
1965 3,658.1 402.6 12.4 22.0 -23.5 3,636.0 426.1 13.3 516.4 85.7 716.2 94.8 10.8 10.8 22.0 -23.51966 4,314.3 656.2 17.9 48.9 26.8 4,265.4 629.4 17.3 621.7 105.3 750.7 34.5 10.9 10.7 -681.1 -703.21967 4,950.9 636.6 14.8 115.3 66.4 4,835.7 570.2 13.4 719.5 97.7 898.1 147.4 10.7 10.4 -684.7 -3.61968 5,818.6 867.7 17.5 201.3 86.0 5,617.3 781.7 16.2 815.7 96.2 1,092.3 194.2 10.6 10.2 -438.7 246.01969 6,739.6 921.0 15.8 278.8 77.6 6,460.7 843.4 15.0 947.0 131.3 1,333.3 241.0 10.4 9.9 -211.2 227.61970 7,949.8 1,210.2 18.0 290.9 12.1 7,658.9 1,198.1 18.5 1,137.1 190.1 1,662.9 329.5 10.6 10.2 -139.1 72.11971 9,414.3 1,464.6 18.4 319.3 28.4 9,095.0 1,436.1 18.8 1,344.1 207.0 2,054.4 391.6 11.4 11.0 -110.7 28.41972 11,467.7 2,053.4 21.8 455.4 136.0 11,012.3 1,917.3 21.1 1,641.5 297.4 2,195.4 141.0 11.9 11.4 -1,494.6 -1,384.01973 14,284.1 2,816.4 24.6 704.5 249.1 13,579.6 2,567.2 23.3 2,114.5 473.1 2,781.1 585.8 12.2 11.6 -1,635.5 -140.91974 17,099.4 2,815.4 19.7 862.2 157.7 16,237.3 2,657.7 19.6 2,890.8 776.3 3,382.3 601.1 12.4 11.7 -1,297.8 337.71975 21,288.8 4,189.4 24.5 1,039.4 177.2 20,249.4 4,012.1 24.7 3,926.9 1,036.1 4,408.6 1,026.4 14.0 13.3 -960.6 337.21976 24,296.0 3,007.2 14.1 1,664.7 625.3 22,631.3 2,381.9 11.8 4,807.6 880.7 3,809.7 -599.0 14.2 13.2 -5,610.3 -4,649.71977 28,514.3 4,218.3 17.4 2,348.7 684.0 26,165.6 3,534.3 15.6 5,691.9 884.3 4,622.1 812.4 15.0 13.8 -6,131.3 -521.01978 34,295.0 5,780.7 20.3 3,222.7 874.0 31,072.3 4,906.7 18.8 6,781.1 1,089.2 5,396.8 774.7 16.4 14.9 -7,762.3 -1,631.01979 38,600.1 4,305.1 12.6 4,078.4 855.7 34,521.8 3,449.5 11.1 7,626.6 845.5 5,288.2 -108.6 17.1 15.3 -11,191.6 -3,429.31980 42,588.8 3,988.7 10.3 5,310.4 1,232.1 37,278.4 2,756.6 8.0 8,212.4 585.9 6,545.2 1,257.0 17.1 15.0 -8,959.6 2,232.11981 46,788.1 4,199.3 9.9 6,654.2 1,343.8 40,133.9 2,855.5 7.7 8,836.9 624.5 8,083.5 1,538.3 17.7 15.2 -5,615.8 3,343.81982 49,680.8 2,892.7 6.2 7,829.9 1,175.7 41,850.9 1,717.0 4.3 9,084.8 247.9 9,230.9 1,147.4 18.0 15.2 -2,610.1 3,005.71983 50,379.6 698.8 1.4 8,192.5 362.5 39,934.7 -1,916.2 -4.6 9,139.8 54.9 7,315.1 -1,915.8 17.4 13.8 -2,900.0 -290.01984 50,627.2 247.6 0.5 9,155.1 962.6 41,472.1 1,537.5 3.9 9,321.0 181.3 8,886.4 1,571.3 16.4 13.5 -3,524.9 -624.91985 52,499.6 1,872.4 3.7 10,224.2 1,069.1 42,275.5 803.3 1.9 9,573.6 252.6 9,690.1 803.7 15.9 12.8 -1,455.8 2,069.11986 54,088.6 1,589.0 3.0 11,319.5 1,095.4 42,769.1 493.6 1.2 9,834.6 260.9 10,185.0 494.9 15.8 12.5 373.5 1,829.41987 54,101.0 12.4 0.0 11,333.5 14.0 42,767.5 -1.6 0.0 10,089.6 255.0 10,184.1 -0.8 14.9 11.8 832.5 459.01988 56,699.7 2,598.7 4.8 11,512.0 178.5 45,187.7 2,420.2 5.7 10,384.5 294.9 10,905.6 721.5 14.6 11.7 2,671.0 1,838.51989 60,414.2 3,714.5 6.6 11,664.9 152.9 48,749.3 3,561.6 7.9 10,894.7 510.2 13,368.8 2,463.2 14.5 11.7 4,553.9 1,882.91990 66,236.8 5,822.6 9.6 14,288.6 2,623.7 51,948.2 3,198.9 6.6 11,614.8 720.2 15,275.1 1,906.3 14.7 11.5 8,695.4 4,141.51991 70,347.4 4,110.6 6.2 16,036.0 1,747.4 54,311.4 2,363.2 4.5 12,212.2 597.4 15,974.9 699.8 14.9 11.5 10,693.0 1,997.61992 72,218.0 1,870.6 2.7 16,447.3 411.3 55,770.7 1,459.3 2.7 12,737.4 525.1 15,771.9 -203.0 14.9 11.5 9,167.3 -1,525.71993 72,354.8 136.8 0.2 15,442.3 -1,005.0 56,912.5 1,141.8 2.0 13,145.7 408.3 15,617.4 -154.5 15.0 11.8 7,312.3 -1,855.01994 73,081.7 726.8 1.0 14,360.2 -1,082.1 57,176.7 264.2 0.5 13,481.6 336.0 12,757.8 -2,859.6 14.7 11.5 2,262.0 -5,050.31995 70,987.1 -2,094.5 -2.9 13,221.3 -1,138.9 57,765.8 589.2 1.0 13,924.4 442.8 13,215.4 457.6 14.1 11.4 623.3 -1,638.71996 75,104.9 4,117.8 5.8 16,375.2 3,153.9 58,729.7 963.9 1.7 14,287.9 363.5 13,603.8 388.4 14.6 11.4 -4,653.8 -5,277.11997 77,390.0 2,285.1 3.0 16,802.3 427.1 60,587.7 1,857.9 3.2 14,550.1 262.2 15,481.0 1,877.1 14.8 11.6 95.3 4,749.11998 77,669.2 279.2 0.4 17,262.8 460.5 60,406.4 -181.3 -0.3 14,843.1 292.9 15,870.2 389.2 15.2 11.8 1,705.8 1,610.51999 81,860.1 4,190.9 5.4 19,831.9 2,569.1 60,410.8 4.4 0.0 16,095.0 1,251.9 13,523.0 -2,347.2 16.2 11.9 -9,600.7 -11,306.52000 84,987.1 3,126.9 3.8 21,965.3 2,133.4 63,021.7 2,610.9 4.3 16,766.6 671.6 14,930.4 1,407.4 16.6 12.3 -10,644.7 -1,044.02001 82,652.4 -2,334.7 -2.7 17,170.5 -4,794.8 65,481.8 2,460.1 3.9 17,555.2 788.6 16,823.0 1,892.6 16.5 13.1 -11,147.5 -502.82002 81,230.0 -1,422.4 -1.7 16,671.2 -499.3 64,558.8 -923.1 -1.4 18,279.5 724.3 17,011.6 188.6 16.3 13.0 -13,328.8 -2,181.32003 81,789.1 559.1 0.7 16,798.1 126.9 64,991.0 432.2 0.7 18,990.7 711.2 17,398.8 387.2 16.3 12.9 -19,646.9 -6,318.12004 82,110.9 321.8 0.4 17,568.6 770.5 64,542.3 -448.7 -0.7 19,797.0 806.3 16,493.5 -905.3 16.3 12.8 -19,021.4 625.52005 82,182.9 72.0 0.1 18,442.2 873.6 63,740.7 -801.6 -1.2 20,380.8 583.8 16,088.9 -404.6 16.3 12.6 -15,947.8 3,073.62006 79,686.0 -2,496.9 -3.0 18,761.6 319.4 60,924.5 -2,816.3 -4.4 20,573.9 193.1 14,558.4 -1,530.5 15.7 12.0 -11,211.4 4,736.42007 82,908.8 3,222.8 4.0 20,998.8 2,237.2 61,910.0 985.5 1.6 21,140.9 567.0 14,931.6 373.2 16.2 12.1 -4,433.2 6,778.22008 83,061.3 152.5 0.2 20,163.2 -835.6 62,898.1 988.1 1.6 21,782.4 641.5 15,613.6 682.0 17.0 12.8 -5,184.8 -751.62009 88,548.0 5,486.7 6.6 20,243.7 80.5 68,304.3 5,406.2 8.6 24,834.4 3,052.0 16,573.3 959.7 18.7 14.4 -13,050.3 -7,865.52010 92,299.2 3,751.2 4.2 20,649.1 405.3 70,931.9 2,627.7 3.8 27,268.6 2,434.2 17,477.7 904.4 19.2 14.8 -22,935.7 -9,885.52011 92,411.6 112.4 0.1 21,549.1 900.0 70,862.5 -69.4 -0.1 28,707.9 1,439.3 16,784.5 -693.2 19.5 15.0 -22,748.9 186.82012 90,333.9 -2,077.7 -2.2 21,944.2 395.1 68,389.7 -2,472.8 -3.5 26,390.1 -2,317.7 16,594.0 -190.5 19.0 14.4 -24,884.0 -2,135.12013 92,611.5 2,277.6 2.5 22,241.5 297.3 70,370.0 1,980.3 2.9 29,122.4 2,732.3 16,392.7 -201.3 19.2 14.6 -23,220.6 1,663.42014 95,882.3 3,270.8 3.5 23,270.2 1,028.7 72,612.1 2,242.1 3.2 30,517.5 1,395.1 16,142.4 -250.2 19.5 14.8 -17,979.8 5,240.72015 96,342.0 459.6 0.5 23,450.7 180.5 72,891.2 279.1 0.4 31,529.7 1,012.1 15,535.7 -606.7 19.1 14.4 -13,412.3 4,567.5
(Note1) The figures are based on each initial budget.
(Note2) GDP for FY1980-2013: Actual, FY2014: Estimate, FY2015: Outlook
(Note3) Local Allocation Tax Grants, etc. since FY1999 include Special Local Grants.
(Note4) FY2012: In calculation of General Account Primary Balance, the amounts required to achieve national contribution to one-half of basic pension is considered.
General Account
Primary BalanceGeneral
Account
Expenditure
/GDP
Primary
balance
expenditure
/GDP
Local Allocation
Tax, etc.
FY
General Account Expenditure National Debt Service Primary Expenditures Social Security
9
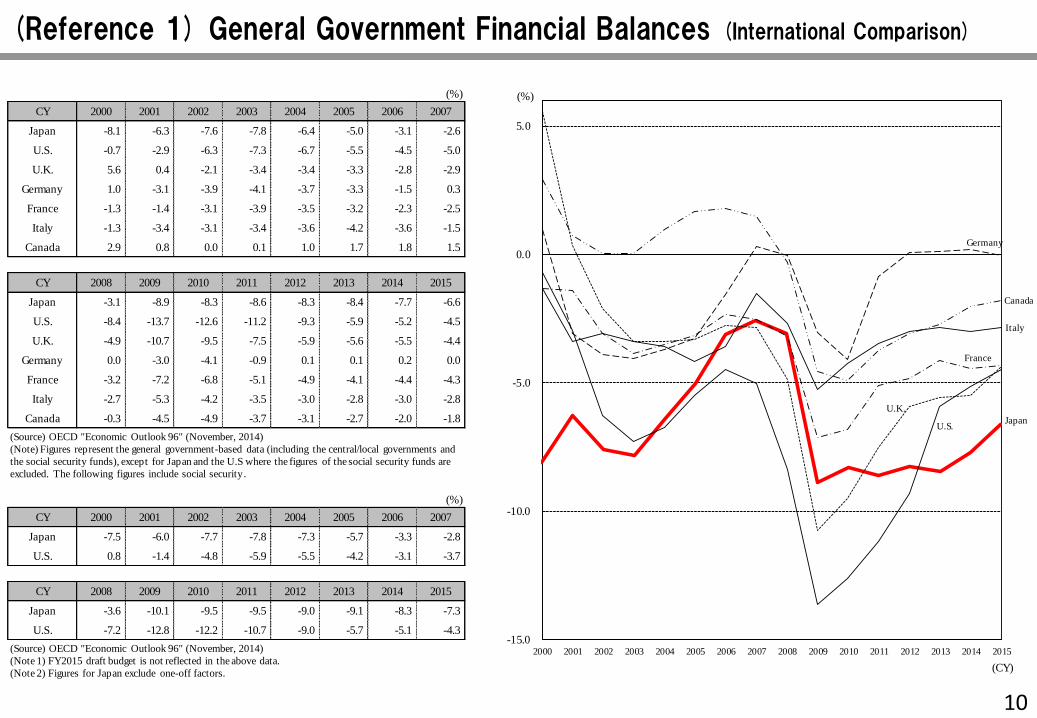
(Reference 1) General Government Financial Balances (International Comparison)
(%)
CY 2000 2001 2002 2003 2004 2005 2006 2007
Japan -8.1 -6.3 -7.6 -7.8 -6.4 -5.0 -3.1 -2.6
U.S. -0.7 -2.9 -6.3 -7.3 -6.7 -5.5 -4.5 -5.0
U.K. 5.6 0.4 -2.1 -3.4 -3.4 -3.3 -2.8 -2.9
Germany 1.0 -3.1 -3.9 -4.1 -3.7 -3.3 -1.5 0.3
France -1.3 -1.4 -3.1 -3.9 -3.5 -3.2 -2.3 -2.5
Italy -1.3 -3.4 -3.1 -3.4 -3.6 -4.2 -3.6 -1.5
Canada 2.9 0.8 0.0 0.1 1.0 1.7 1.8 1.5
CY 2008 2009 2010 2011 2012 2013 2014 2015
Japan -3.1 -8.9 -8.3 -8.6 -8.3 -8.4 -7.7 -6.6
U.S. -8.4 -13.7 -12.6 -11.2 -9.3 -5.9 -5.2 -4.5
U.K. -4.9 -10.7 -9.5 -7.5 -5.9 -5.6 -5.5 -4.4
Germany 0.0 -3.0 -4.1 -0.9 0.1 0.1 0.2 0.0
France -3.2 -7.2 -6.8 -5.1 -4.9 -4.1 -4.4 -4.3
Italy -2.7 -5.3 -4.2 -3.5 -3.0 -2.8 -3.0 -2.8
Canada -0.3 -4.5 -4.9 -3.7 -3.1 -2.7 -2.0 -1.8
(%)
CY 2000 2001 2002 2003 2004 2005 2006 2007
Japan -7.5 -6.0 -7.7 -7.8 -7.3 -5.7 -3.3 -2.8
U.S. 0.8 -1.4 -4.8 -5.9 -5.5 -4.2 -3.1 -3.7
CY 2008 2009 2010 2011 2012 2013 2014 2015
Japan -3.6 -10.1 -9.5 -9.5 -9.0 -9.1 -8.3 -7.3
U.S. -7.2 -12.8 -12.2 -10.7 -9.0 -5.7 -5.1 -4.3-15.0
-10.0
-5.0
0.0
5.0
2000 2001 2002 2003 2004 2005 2006 2007 2008 2009 2010 2011 2012 2013 2014 2015
(%)
(CY)
JapanU.S.
U.K.
France
Italy
Canada
Germany
(Source) OECD "Economic Outlook 96" (November, 2014)
(Note) Figures represent the general government-based data (including the central/local governments and
the social security funds), except for Japan and the U.S where the figures of the social security funds are
excluded. The following figures include social security.
(Source) OECD "Economic Outlook 96" (November, 2014)
(Note 1) FY2015 draft budget is not reflected in the above data.
(Note 2) Figures for Japan exclude one-off factors.
10
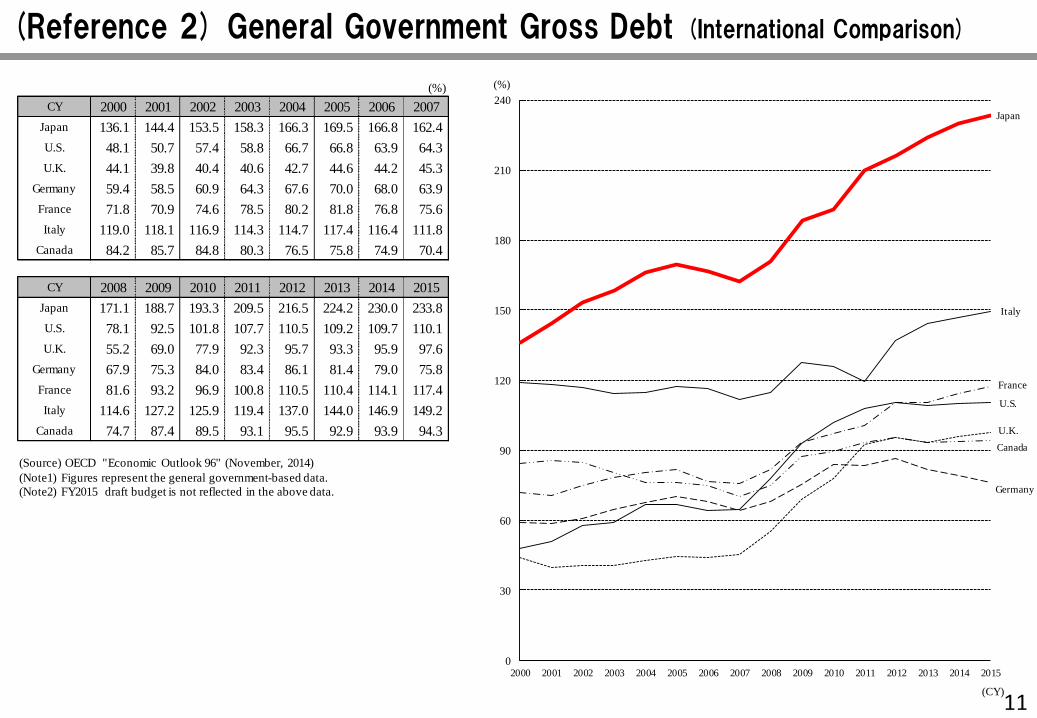
(Reference 2) General Government Gross Debt (International Comparison)
(%)
CY 2000 2001 2002 2003 2004 2005 2006 2007
Japan 136.1 144.4 153.5 158.3 166.3 169.5 166.8 162.4
U.S. 48.1 50.7 57.4 58.8 66.7 66.8 63.9 64.3
U.K. 44.1 39.8 40.4 40.6 42.7 44.6 44.2 45.3
Germany 59.4 58.5 60.9 64.3 67.6 70.0 68.0 63.9
France 71.8 70.9 74.6 78.5 80.2 81.8 76.8 75.6
Italy 119.0 118.1 116.9 114.3 114.7 117.4 116.4 111.8
Canada 84.2 85.7 84.8 80.3 76.5 75.8 74.9 70.4
CY 2008 2009 2010 2011 2012 2013 2014 2015
Japan 171.1 188.7 193.3 209.5 216.5 224.2 230.0 233.8
U.S. 78.1 92.5 101.8 107.7 110.5 109.2 109.7 110.1
U.K. 55.2 69.0 77.9 92.3 95.7 93.3 95.9 97.6
Germany 67.9 75.3 84.0 83.4 86.1 81.4 79.0 75.8
France 81.6 93.2 96.9 100.8 110.5 110.4 114.1 117.4
Italy 114.6 127.2 125.9 119.4 137.0 144.0 146.9 149.2
Canada 74.7 87.4 89.5 93.1 95.5 92.9 93.9 94.3
0
30
60
90
120
150
180
210
240
2000 2001 2002 2003 2004 2005 2006 2007 2008 2009 2010 2011 2012 2013 2014 2015
(%)
(CY)
Japan
Italy
France
U.K.
U.S.
Canada
Germany
(Source) OECD "Economic Outlook 96" (November, 2014)
(Note1) Figures represent the general government-based data.
(Note2) FY2015 draft budget is not reflected in the above data.
11
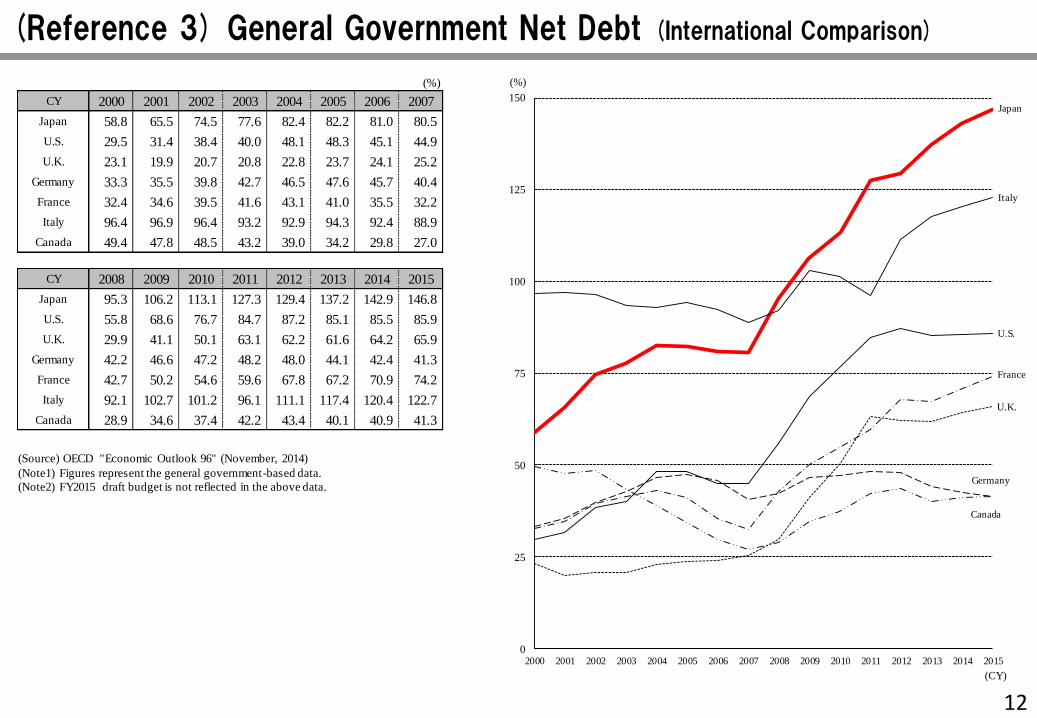
(Reference 3) General Government Net Debt (International Comparison)
(%)
CY 2000 2001 2002 2003 2004 2005 2006 2007
Japan 58.8 65.5 74.5 77.6 82.4 82.2 81.0 80.5
U.S. 29.5 31.4 38.4 40.0 48.1 48.3 45.1 44.9
U.K. 23.1 19.9 20.7 20.8 22.8 23.7 24.1 25.2
Germany 33.3 35.5 39.8 42.7 46.5 47.6 45.7 40.4
France 32.4 34.6 39.5 41.6 43.1 41.0 35.5 32.2
Italy 96.4 96.9 96.4 93.2 92.9 94.3 92.4 88.9
Canada 49.4 47.8 48.5 43.2 39.0 34.2 29.8 27.0
CY 2008 2009 2010 2011 2012 2013 2014 2015
Japan 95.3 106.2 113.1 127.3 129.4 137.2 142.9 146.8
U.S. 55.8 68.6 76.7 84.7 87.2 85.1 85.5 85.9
U.K. 29.9 41.1 50.1 63.1 62.2 61.6 64.2 65.9
Germany 42.2 46.6 47.2 48.2 48.0 44.1 42.4 41.3
France 42.7 50.2 54.6 59.6 67.8 67.2 70.9 74.2
Italy 92.1 102.7 101.2 96.1 111.1 117.4 120.4 122.7
Canada 28.9 34.6 37.4 42.2 43.4 40.1 40.9 41.3
0
25
50
75
100
125
150
2000 2001 2002 2003 2004 2005 2006 2007 2008 2009 2010 2011 2012 2013 2014 2015
(%)
(CY)
Japan
Italy
U.S.
U.K.
France
Germany
Canada
(Source) OECD "Economic Outlook 96" (November, 2014)
(Note1) Figures represent the general government-based data.
(Note2) FY2015 draft budget is not reflected in the above data.
12
* In each page, the numerical data are subject to change by examining minutely.
Related Documents
![Deficit Financing and Economic Growth in Nigeria: A Preliminary Investigation. · deficit financing on economic growth and investment? [Okoye and Akenbor (2010), Ojong et al. (2013)].](https://static.cupdf.com/doc/110x72/5e75ef4a421bda11472e443c/deficit-financing-and-economic-growth-in-nigeria-a-preliminary-deficit-financing.jpg)