THIS REPORT CONTAINS ASSESSMENTS OF COMMODITY AND TRADE ISSUES MADE BY USDA STAFF AND NOT NECESSARILY STATEMENTS OF OFFICIAL U.S. GOVERNMENT POLICY Date: GAIN Report Number: Approved By: Prepared By: Report Highlights: The total value of all retail food and beverage (F&B) sales was 52.2 trillion yen or $474.9 billion dollars. In the Japanese retail industry, supermarkets (with floor space under 1500 m 2 ) which include specialty shops and local stores, still represent the bulk of the retail food market. Food & beverage sales through drug stores as well as the internet are increasing. Ready to eat meals or take home food items represent a growth area that has helped supermarkets, convenience stores and other retail outlets throughout the food & beverage industry to increase revenue. Post: Tokyo ATO Sumio Thomas Aoki, Senior Marketing Specialist Marika Miyamoto, Intern Morgan Perkins, Director Japan Retail Foods Retail Foods Japan JA 7520 12/26/2017 Required Report - public distribution

Welcome message from author
This document is posted to help you gain knowledge. Please leave a comment to let me know what you think about it! Share it to your friends and learn new things together.
Transcript
THIS REPORT CONTAINS ASSESSMENTS OF COMMODITY AND TRADE ISSUES MADE BY
USDA STAFF AND NOT NECESSARILY STATEMENTS OF OFFICIAL U.S. GOVERNMENT
POLICY
Date:
GAIN Report Number:
Approved By:
Prepared By:
Report Highlights:
The total value of all retail food and beverage (F&B) sales was 52.2 trillion yen or $474.9 billion
dollars. In the Japanese retail industry, supermarkets (with floor space under 1500 m2) which include
specialty shops and local stores, still represent the bulk of the retail food market. Food & beverage sales
through drug stores as well as the internet are increasing. Ready to eat meals or take home food items
represent a growth area that has helped supermarkets, convenience stores and other retail outlets
throughout the food & beverage industry to increase revenue.
Post:
Tokyo ATO
Sumio Thomas Aoki, Senior Marketing Specialist
Marika Miyamoto, Intern
Morgan Perkins, Director
Japan Retail Foods
Retail Foods
Japan
JA 7520
12/26/2017
Required Report - public distribution

Table of Contents
Executive Summary
Section I. Japan Retail Food Summary
A. Structure and Overall Value
B. International Competition and Imports
C. Regional Retailer Trends Overview
D. Retailer Trends and Overview
E. Advantages and Challenges
Section II: Road Map for Market Entry
A. Entry Strategy
B. Market Structure
C. Company Profiles
Section III: Consumer Trends and Best Product
Prospects
A. Consumer Trends
Section IV: Post Contact and Further Information
Executive Summary
According to the Ministry of Internal Affairs and Communications, Japan’s GDP was US$4,383.6
billion in 2015, making it the world’s third largest economy, with a 5.9% share of the world GDP.
Japan’s economy was smaller only than the United States’ (US$18,036.6 billion, 24.2% share) and
China’s (US$11,007.7 billion, 14.8%). Nonetheless, Japan’s per capita GDP of US$ 34,522 ranked
twentieth among the OECD member countries. Latest information indicates that Japan’s GDP totaled
JPY 539.3 trillion (US$ 4,954.56 billion*) in 2016.
Tertiary industries (the service sector) represent the mainstay of the Japanese economy, accounting for
72.7% of total GDP in 2015. Secondary industries (manufacturing) followed with 26.2% and the
primary industries (agriculture, fisheries, and forestry) lagged behind at only 1.1%.
In 2016, Japan’s total exports reached JPY 70 trillion (US$643.15 billion*), down 7.4% down from the
previous year, and imports totaled JPY 66 trillion (US$606.39 billion*), down 15.8% from the previous
year, with a JPY 4 trillion (US$36.75 billion*) trade surplus, which was the first surplus in 6 years, as
Japan had recorded trade deficits each year since 2011. The major export items from Japan were
transport equipment at 24.8%, general machinery at 19.4%, and electrical machinery at 17.6% of total
exports. Food items represented less than 1% of the total exports. Major import items included mineral
fuels at 18.2% followed by electrical machinery at 16.3%, chemicals at 10.8% and food; representing
9.6% of imports. * US$1=Y108.84, the average exchange rate of 2016 was used for calculation.
(Source: Statistics Bureau, Ministry of Internal Affairs and Communications)
The total value of all retail food and beverage (F&B) sales was 52.2 trillion yen or $474.9 billion
dollars. In the Japanese retail industry, supermarkets (with floor space under 1500 m2) which include
specialty shops and local stores, still represent the bulk of the retail food market. Although most of the
attention tends to focus on large retail brands such as AEON supermarkets, Ito Yokado supermarkets,
Seven Eleven convenience stores, Lawson convenience stores, etc... traditional, smaller supermarkets
still play an important role in distribution.
Drug Stores are also increasing their food & beverage sales and are generally expected to expand their
food & beverage product lines. In the suburbs and areas outside of big cities drugstores have increased
their presence; often in towns too small to have supermarkets or convenience stores. One interesting
trend for this category is the drive to carry a larger selection of foods and beverages. Many drugstore
chains aim to develop their food and beverage section to generate 50% of total revenue.
Ready to eat meals or take home food items represent a growth area that has helped supermarkets,
convenience stores and other retail outlets throughout the food & beverage industry to increase revenue.
REM today includes sushi, pasta, sandwich, and Chinese. According to the Japan Ready-made Meal
Association, total sales in 2016 were 9.8 trillion yen. That is 18.9% of retail sales.
One other interesting trend to highlight is growing internet sales of food & beverage, which have
become a significant sales outlet. Those sales are now almost as important in the F&B sector as sales of
Department Stores and Drug Stores. Food & beverage sales via internet were 1.2 trillion yen ($11.1
billion) in 2014, 1.3 trillion yen ($10.8 billion) in 2015 and grew again in 2016 to reach 1.450 trillion
yen ($13.2 billion). In terms of the E-commerce markets in 2016, the category for foods, beverages, and
alcohol had the highest sales.
Developing relationships with importers is important for success in Japan. Also important is to have a
long term plan and manage expectations: Japanese businesses tend to take time for any decision-making.
Participating in Foodex Japan, Supermarket Trade Show or other food related trade shows is the best
method to meet importers. Sending an email or telephoning a Japanese company in English won’t get
you success.
The Japanese yen weakened in 2015, averaging 122.05 yen per US dollar, but grew steadily throughout
2016, averaging 109.84 yen per U.S. dollar. The government forecasts that the economy will continue
to recover steadily, attributing growth to the positive effects of stimulus policies, and rising income and
full employment. Also, according to the Japan National Tourism Organization (JNTO), the estimated
number of international travelers to Japan reached 2.3 million for the month of May 2017; a growth rate
of 21.2% compared to May 2016. In 2016, food & beverage sales via the retail market were estimated at
$474.9 billion.
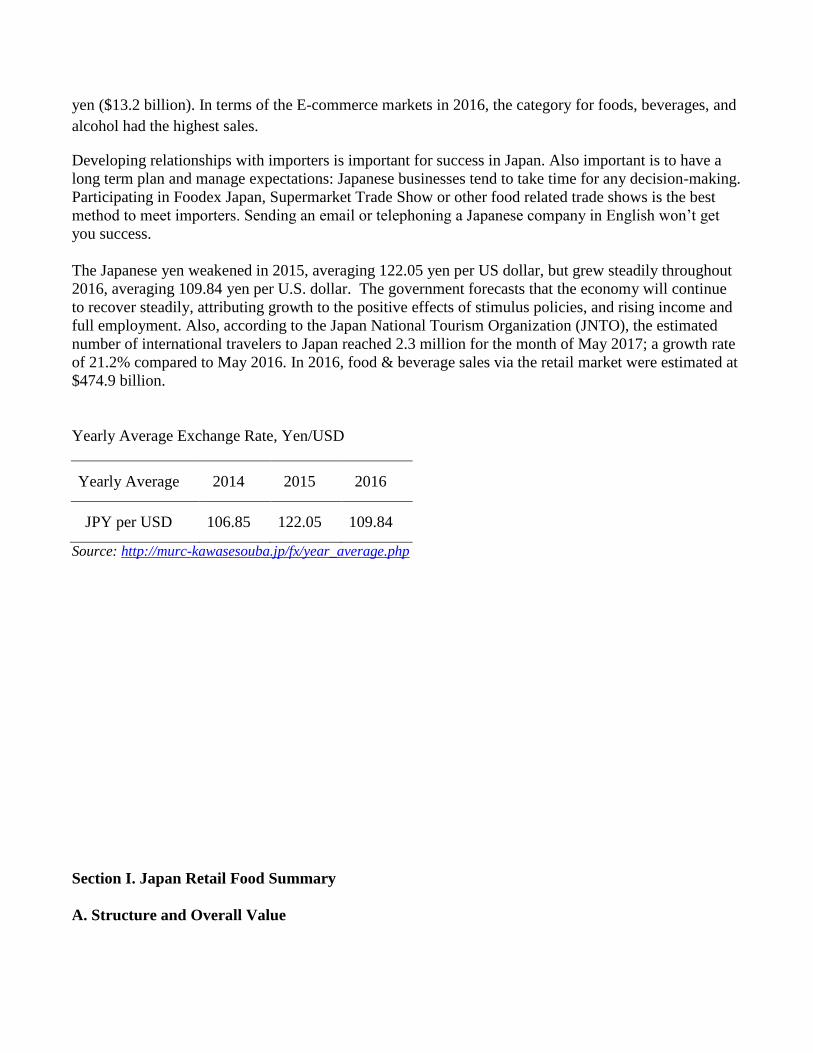
Yearly Average Exchange Rate, Yen/USD
Yearly Average 2014 2015 2016
JPY per USD 106.85 122.05 109.84
Source: http://murc-kawasesouba.jp/fx/year_average.php
Section I. Japan Retail Food Summary
A. Structure and Overall Value
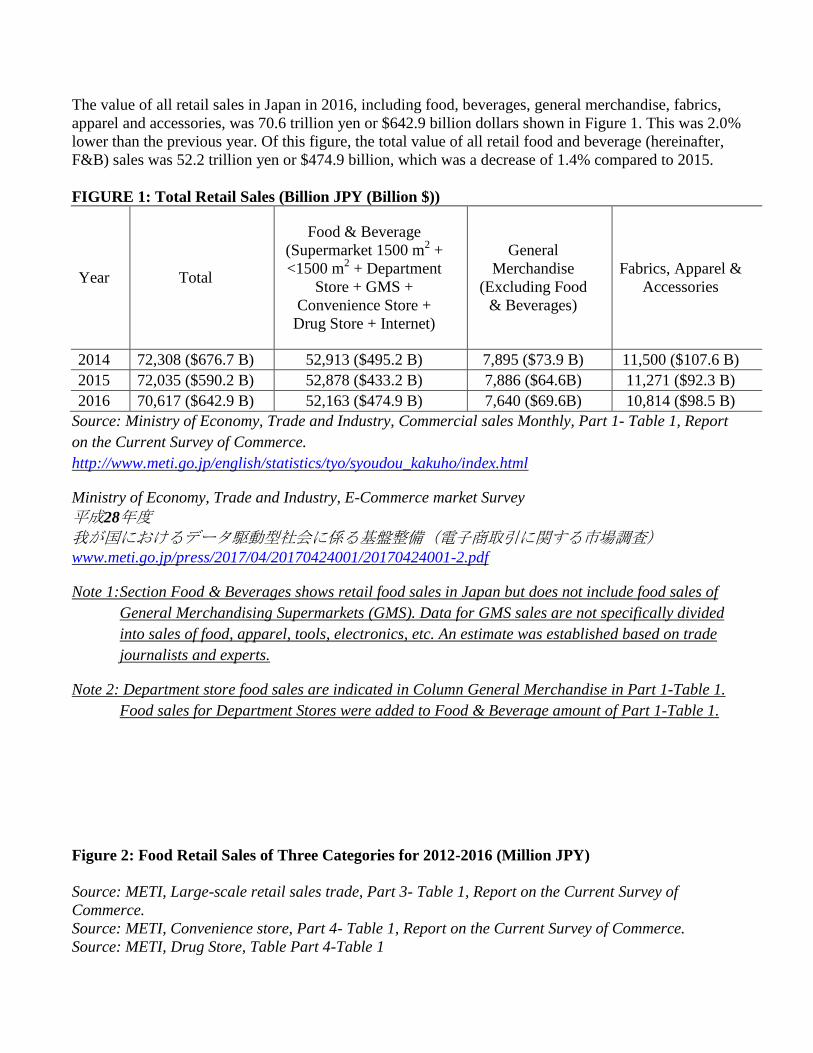
The value of all retail sales in Japan in 2016, including food, beverages, general merchandise, fabrics,
apparel and accessories, was 70.6 trillion yen or $642.9 billion dollars shown in Figure 1. This was 2.0%
lower than the previous year. Of this figure, the total value of all retail food and beverage (hereinafter,
F&B) sales was 52.2 trillion yen or $474.9 billion, which was a decrease of 1.4% compared to 2015.
FIGURE 1: Total Retail Sales (Billion JPY (Billion $))
Year Total
Food & Beverage
(Supermarket 1500 m2 +
<1500 m2 + Department
Store + GMS +
Convenience Store +
Drug Store + Internet)
General
Merchandise
(Excluding Food
& Beverages)
Fabrics, Apparel &
Accessories
2014 72,308 ($676.7 B) 52,913 ($495.2 B) 7,895 ($73.9 B) 11,500 ($107.6 B)
2015 72,035 ($590.2 B) 52,878 ($433.2 B) 7,886 ($64.6B) 11,271 ($92.3 B)
2016 70,617 ($642.9 B) 52,163 ($474.9 B) 7,640 ($69.6B) 10,814 ($98.5 B)
Source: Ministry of Economy, Trade and Industry, Commercial sales Monthly, Part 1- Table 1, Report
on the Current Survey of Commerce.
http://www.meti.go.jp/english/statistics/tyo/syoudou_kakuho/index.html
Ministry of Economy, Trade and Industry, E-Commerce market Survey
平成28年度
我が国におけるデータ駆動型社会に係る基盤整備(電子商取引に関する市場調査)
www.meti.go.jp/press/2017/04/20170424001/20170424001-2.pdf
Note 1: Section Food & Beverages shows retail food sales in Japan but does not include food sales of
General Merchandising Supermarkets (GMS). Data for GMS sales are not specifically divided
into sales of food, apparel, tools, electronics, etc. An estimate was established based on trade
journalists and experts.
Note 2: Department store food sales are indicated in Column General Merchandise in Part 1-Table 1.
Food sales for Department Stores were added to Food & Beverage amount of Part 1-Table 1.
Figure 2: Food Retail Sales of Three Categories for 2012-2016 (Million JPY)
Source: METI, Large-scale retail sales trade, Part 3- Table 1, Report on the Current Survey of
Commerce.
Source: METI, Convenience store, Part 4- Table 1, Report on the Current Survey of Commerce.
Source: METI, Drug Store, Table Part 4-Table 1

2014 2015 2016
Year
Billion
Yen
Billion
$ Share
Billion
Yen
Billion
$ Share
Billion
Yen
Billion
$ Share Trend
Supermarket 39,008.0 365.1 73.7% 38,288.0 313.7 72.4% 37,019.0 337.0 71.0% down
General
Merchandise
Store (GMS) 2,997.0 28.0 5.7% 2,986.0 24.5 5.6% 2,937.0 26.7 5.6% flat
Department
Store 1,929.0 18.1 3.6% 1,926.0 15.8 3.6% 1,895.0 17.3 3.6% flat
Convenience
Store 6,582.0 61.6 12.4% 7,023.0 57.5 13.3% 7,370.0 67.1 14.1% up
Drugstore 1,207.0 11.3 2.3% 1,339.0 11.0 2.5% 1,491.0 13.6 2.9% up
Internet 1,191.0 11.1 2.3% 1,316.0 10.8 2.5% 1,450.0 13.2 2.8% up
Total 52,914.0 495.2 100.0% 52,878.0 433.3 100.0% 52,162.0 474.9 100.0%
Retail Market Summary
The Japanese F&B retail industry includes supermarkets, general merchandise stores (GMS),
department stores, convenience stores, drugstores, and internet sales. As shown in Figure 2,
supermarkets have the highest sales volumes. Supermarkets sell food and beverages. Some may have
non-food products such as utensils, toothpicks, batteries, etc... but very little compared to F&B. They do
not sell clothing, linens, electronics or furniture.
General merchandise stores (GMS) will have products such as apparel, shoes, sporting goods, bedding,
kitchenware, etc... in addition to a supermarket. Malls with a supermarket are also considered GMS
outlets. They are not common in Japan, but GMS are represented by the two largest retailers in Japan,
AEON Co., Ltd. and Seven & I, which operates Ito-Yokado. GMS in western Japan include Uny,
Izumi, Okuwa, and Izumiya. GMS malls often carry popular brand products such as Oakley, Ray Ban,
Puma, etc... Since the appearance of GMS stores in the year 2000, department stores have lost many
customers.
Department stores in Japan are similar to the U.S. department stores; offering premium brand apparel,
shoes, beddings, electronics, jewelry, etc... Department stores also sell premium food items as gifts,
and—unlike US department stores—Japanese Department stores normally rely heavily on the sale of
ready to eat meals. However, department stores have seen those sales decrease over the past ten years.
The retail formats seeing the strongest growth in sales are convenience stores, drugstores and the
internet. Overall sales by convenience outlets are higher than GMS sales. Convenience stores in Japan
are significantly different than those in the US. Product lines are much broader. Most basic household
food items are found there. Tasty and wholesome salads, rice balls (onigiri), sandwiches, and lunch
boxes are purchased by workers on the way to work, at lunch or to take home for dinner. These take
home items are delivered multiple times to each location. There is an alcoholic beverage section, juices,
dairy, ham & sausages, eggs, bakery, and ice cream.
Consumers rely on the local drugstores to purchase over-the-counter medicine, detergents, hair care
products, cough drops, and toiletries. In recent years, drugstores are offering more and more F&B due to
strong demand in local areas where drug stores are located, but where supermarkets and convenience
stores may not be represented.
Finally, the internet is making a significant impact on retail sales of F&B. Amazon and Rakuten are the
biggest internet sellers in Japan.
Retail Market Close-up
The F&B retail market is categorized by size, concept (supermarket vs mall) and services (convenience
stores). Supermarkets may be large in size (1500 square meters (m2) and larger), but also include small
shops tucked away in the city residential areas. Upscale supermarkets are usually also part of the
supermarket category. Discount stores on whose shelves food products are growing may also form part
of the supermarket category. An attempt was made to study and break down the supermarket category
for clarity but at present satisfactory data is lacking and the industry consensus is lacking on definitions
of the various categories.
The largest market shareholder for food retail in Japan is the supermarket category. A supermarket is
defined as a store that mainly sells foods & beverages. In contrast, according to trade specialists a
General Merchandise Store (Hereinafter, GMS) will have about half of their revenue generated by F&B
sales and the other half through apparel, fashion, beddings, etc... These GMS stores hold approximately
5.8% of the food & beverage market in Japan. It should be noted that in this report GMS food and
beverage sales has been estimated by ATO staff: not all GMS companies report their food & beverage
sales separately. Based on information from government experts and retail industry journalists, half of
overall GMS sales are believed to be generated from F&B. Survey information regarding retail sales of
food as well as non-food products are consolidated by the Ministry of Economy, Trade and Industry.
Department stores usually have a small supermarket and sell a large variety of ready-to-eat, take-home
foods. Usually located on the basement floor and known as “depachika” there are abundant high-end
specialty food, gift and take-out food outlets.
The category with the most growth is Convenience Stores. Convenience Stores are beginning to carry
an expanded selection of fresh products and have developed strong ready-to-eat product lines.
The second fastest growing category for food & beverage sales is the Drug Store sector. Depending on
the store size and the location of the store (city vs suburb) a drugstore will carry up to 30 % of their
products from the F&B category. Of course, nutritional and functional foods are a focus for the Drug
Stores but they also carry snacks, confectioneries, and health foods. . The drugstore association has set a
50% product line target for foods in the next few years. It is in the suburbs and areas outside of the big
cities that the drugstores have increased their presence most. Those areas often do not have large
supermarkets so consumers demand groceries from these smaller retailers.
B. International Competition and Food Imports to Japan
Japan import statistics shows that the U.S. is their number one agricultural trading partner with
approximately $14 billion import value. The United States is Japan’s most reliable supplier of safe and
high quality food and ingredients. In 2016 overall imports were down 2.38 percent.
Figure 3: Food Exporters to Japan in 2016

Source: Global Trade Atlas: All Commodities
Figure 4: Major Food Exporters to Japan in 2016
Ranking Partner
Country
United States Dollars
(Millions) % Share
%
Change
2014 2015 2016 2014 2015 2016 2016/2015
World
55,570 50,244 49,050
100.00
100.00
100.00 - 2.38
1 United States 14,618 12,597 11,762 26.31 25.07 23.98 - 6.63
2 China 7,193 6,470 6,249 12.95 12.88 12.74 - 3.41
3 Australia 3,945 3,733 3,747 7.10 7.43 7.64 0.39
4 Thailand 3,776 3,684 3,630 6.80 7.33 7.40 - 1.46
5 Canada 3,782 3,325 3,255 6.81 6.62 6.64 - 2.11
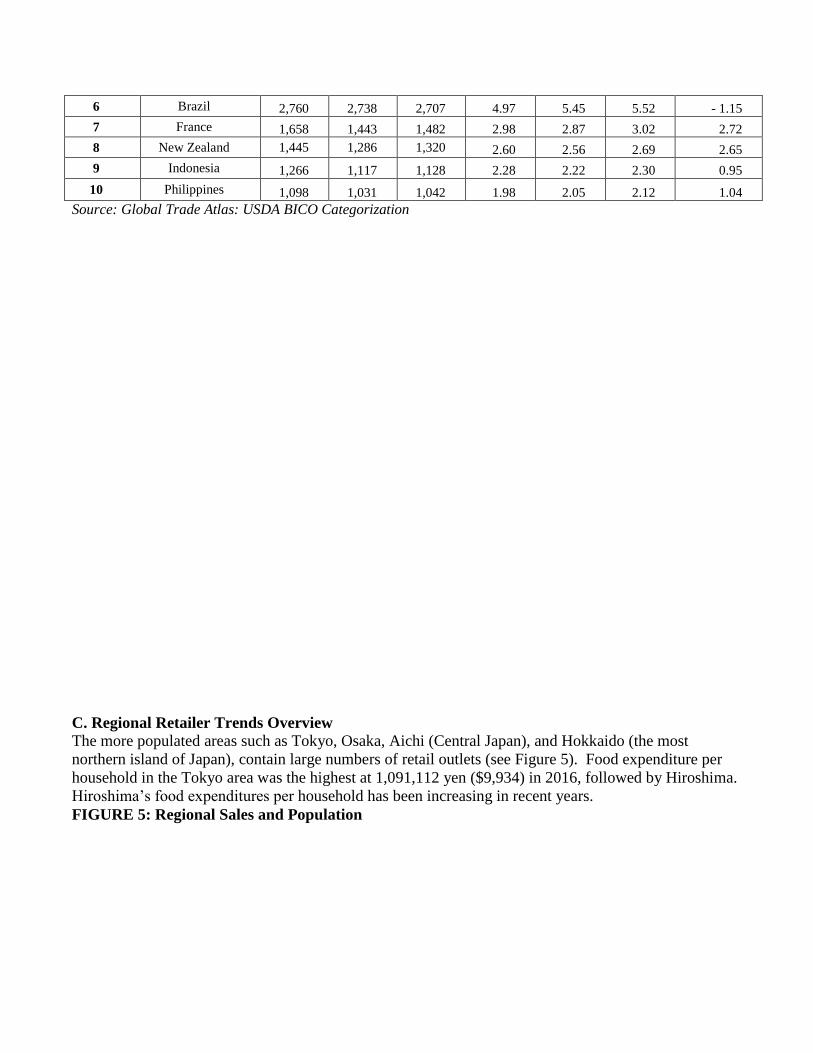
6 Brazil 2,760 2,738 2,707 4.97 5.45 5.52 - 1.15
7 France 1,658 1,443 1,482 2.98 2.87 3.02 2.72
8 New Zealand 1,445 1,286 1,320 2.60 2.56 2.69 2.65
9 Indonesia 1,266 1,117 1,128 2.28 2.22 2.30 0.95
10 Philippines 1,098 1,031 1,042 1.98 2.05 2.12 1.04
Source: Global Trade Atlas: USDA BICO Categorization
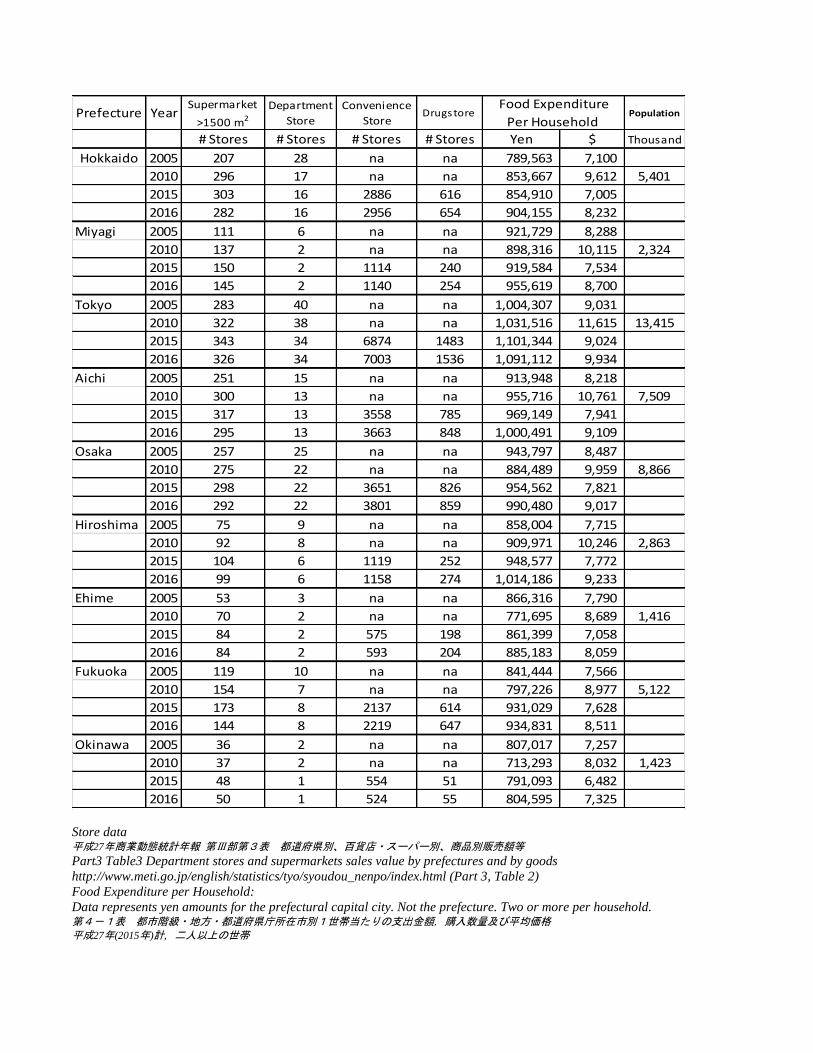
C. Regional Retailer Trends Overview
The more populated areas such as Tokyo, Osaka, Aichi (Central Japan), and Hokkaido (the most
northern island of Japan), contain large numbers of retail outlets (see Figure 5). Food expenditure per
household in the Tokyo area was the highest at 1,091,112 yen ($9,934) in 2016, followed by Hiroshima.
Hiroshima’s food expenditures per household has been increasing in recent years.
FIGURE 5: Regional Sales and Population
Prefecture YearSupermarket
>1500 m2
Department
Store
Convenience
Store Drugstore Population
# Stores # Stores # Stores # Stores Yen $ Thousand
Hokkaido 2005 207 28 na na 789,563 7,100
2010 296 17 na na 853,667 9,612 5,401
2015 303 16 2886 616 854,910 7,005
2016 282 16 2956 654 904,155 8,232
Miyagi 2005 111 6 na na 921,729 8,288
2010 137 2 na na 898,316 10,115 2,324
2015 150 2 1114 240 919,584 7,534
2016 145 2 1140 254 955,619 8,700
Tokyo 2005 283 40 na na 1,004,307 9,031
2010 322 38 na na 1,031,516 11,615 13,415
2015 343 34 6874 1483 1,101,344 9,024
2016 326 34 7003 1536 1,091,112 9,934
Aichi 2005 251 15 na na 913,948 8,218
2010 300 13 na na 955,716 10,761 7,509
2015 317 13 3558 785 969,149 7,941
2016 295 13 3663 848 1,000,491 9,109
Osaka 2005 257 25 na na 943,797 8,487
2010 275 22 na na 884,489 9,959 8,866
2015 298 22 3651 826 954,562 7,821
2016 292 22 3801 859 990,480 9,017
Hiroshima 2005 75 9 na na 858,004 7,715
2010 92 8 na na 909,971 10,246 2,863
2015 104 6 1119 252 948,577 7,772
2016 99 6 1158 274 1,014,186 9,233
Ehime 2005 53 3 na na 866,316 7,790
2010 70 2 na na 771,695 8,689 1,416
2015 84 2 575 198 861,399 7,058
2016 84 2 593 204 885,183 8,059
Fukuoka 2005 119 10 na na 841,444 7,566
2010 154 7 na na 797,226 8,977 5,122
2015 173 8 2137 614 931,029 7,628
2016 144 8 2219 647 934,831 8,511
Okinawa 2005 36 2 na na 807,017 7,257
2010 37 2 na na 713,293 8,032 1,423
2015 48 1 554 51 791,093 6,482
2016 50 1 524 55 804,595 7,325
Food Expenditure
Per Household
Store data 平成27年商業動態統計年報 第Ⅲ部第3表 都道府県別、百貨店・スーパー別、商品別販売額等
Part3 Table3 Department stores and supermarkets sales value by prefectures and by goods
http://www.meti.go.jp/english/statistics/tyo/syoudou_nenpo/index.html (Part 3, Table 2)
Food Expenditure per Household:
Data represents yen amounts for the prefectural capital city. Not the prefecture. Two or more per household. 第4-1表 都市階級・地方・都道府県庁所在市別1世帯当たりの支出金額,購入数量及び平均価格
平成27年(2015年)計, 二人以上の世帯
Population Source
MIC, 参考資料【総計】平成26年住民基本台帳人口・世帯数、 平成28年度人口動態 都道府県別 (Reference, 2016total population by
prefecture) http://www.citypopulation.de/Japan.html
D. Retailer Trends Overview
Convenience Stores
Convenience stores are constantly inventing ways to appeal to customers of all ages, with most targeting
the working class; often referred to as “salary men/women”. “Salary women”, are a growing population
as more women enter and stay in the labor force. Single portion sizes, lunch box take home entrées, and
sweets are abundant with fresh ideas constantly generated by product development teams. The
countryside is not a popular location for the supermarkets to build and distribute product efficiently.
However, convenience stores are already widespread and have the ability to position themselves in
remote areas where their services such as mail, delivery, banking, and foods are welcomed.
Drugstores
Another retail store category that is spreading in the countryside is drug stores that have the wherewithal
to provide their services in remote areas and still be profitable. The interesting trend for the drug store
category is that their present strategy is to expand food and beverage product lines. Their goal is to
develop their food and beverage section to fulfill 50% of their entire revenue.
Internet
The Internet sales of F&B are growing too. They are closing in on the F&B sales of Department Stores
and Drug Stores. According to industry contacts, supermarkets are also feeling the impact. Potential
customers visit brick-and-mortar stores to see and evaluate products and, if satisfied. order on the
internet. According to a report published by the Ministry of Economy, Trade and Industry called “E-
Commerce Market Survey for 2017;” F&B sales via internet were 1.2 trillion yen ($11.1 billion) in
2014, 1.3 trillion yen ($10.8 billion) in 2015 and grew again in 2016 to reach 1.45 trillion yen ($13.2
billion). In terms of the E-commerce market size in 2016, the category for foods, beverages, and alcohol
had the highest sales. Electronics followed in second place. Books, movies and music came in third.
Recently, internet companies have increased F&B marketing. Amazon began its F&B E-commerce,
“Amazon Fresh” on April 21, 2017. Customers can have their perishable foods delivered in 4 hours.
Right now this service is limited to six districts in Tokyo. “Net-Supermarket” promises same day
delivery to their customers.
Ready to Eat Meals
Another area of interest is the Ready-to-Eat meal market. Ready-to-Eat meals (REM) are defined as
food that was prepared by an institution outside the home and sold through a retail outlet (e.g.
Convenience Store) and taken to a different location such as the home, office, park bench, etc... and
consumed. REM is part of the marketing strategy of most retailers to increase customers and revenue.
For the traditional retailers such as Supermarkets, Department Stores and Convenience Stores, the
strongest competitors are shops that specialize in REM sales. REM today commonly includes a wide
variety of offerings, including sushi, pasta, sandwiches, and Chinese food. According to the Japan Ready-
Made Meal Association, total sales in 2016 were 9.8 trillion yen, or 18.9% of retail sales.
The Senior Population
The senior population is served more and more by locally adapted supermarkets, convenience stores and
drug stores. Locally adapted supermarkets are close to senior residences that provide them shopping
options within walking distance. These supermarkets compete against convenience stores.
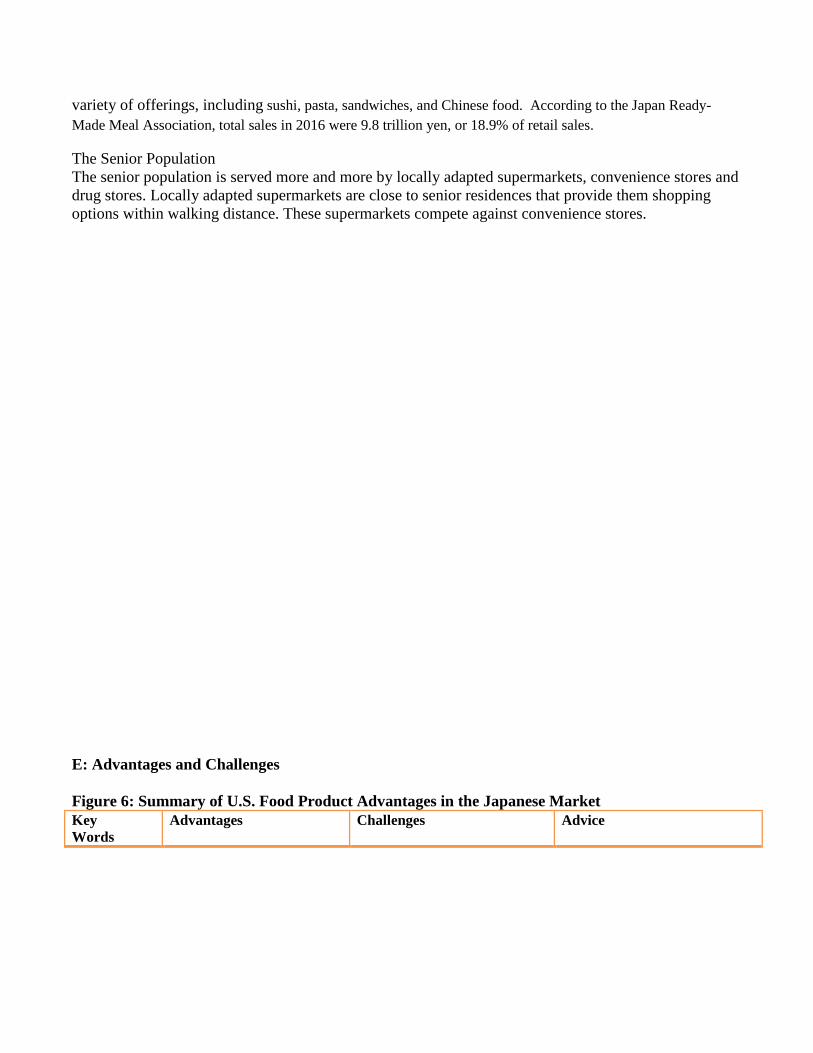
E: Advantages and Challenges
Figure 6: Summary of U.S. Food Product Advantages in the Japanese Market
Key
Words
Advantages Challenges Advice

Quality U.S. specialty food
products attract Japanese
consumers. U.S. products
often have a good story to
tell.
Image of the U.S. as a large
producer with corporate farms
Have a good story to educate
customers about the history
and quality of your product.
Also, emphasize the quality
and source of ingredients
Cultural
Influences
Japanese consumers are
strongly influenced by
U.S. food culture and
enjoy trying things seen as
cool or trendy
Many products common in
the U.S. are uncommon to
Japanese consumers
Be able to explain how your
product relates to American
culture. Also explain how you
use or prepare it.
Healthy The health related food
market in the U.S. is very
advanced, and there are
many new health products
each year
Some Japanese consumers
believe American cuisine is
unhealthy
Make sure to emphasize
health related benefits but be
careful not to make claims
unless provided approval by
the Japanese government.
Food
Safety
U.S. agriculture can
successfully differentiate
itself from Japan and other
countries with its food
safety assurances such as
HACCP, GAP, ISO, etc…
Some Japanese consumers
believe U.S. foods contain
more pesticide residues,
hormones or artificial
chemicals than domestic
products, and some
consumers do not like food
additives.
Educate customers about
safety issues in order to help
facilitate communication and
provide customers with
transferable knowledge.
Stable
Supply
The U.S. is a major
supplier of food products
all over the world,
providing a very stable
supply.
The West Coast Port closure
affected Japanese businesses
and prompted them to
diversify their supply chains.
Japan’s food self-sufficiency
rate is only 39%. It has been
declining due to the aging
farm population. Therefore,
Japan is dependent on foreign
food supply.
Section II: Road Map for Market Entry
A. Entry Strategy
1. Overall, traditional entry points via importers are diversifying. For example, even within one retail
chain organization (i.e., large-scale supermarket, regional supermarket chain, convenience store chain,
etc.), there may be several routes for procurement- including importers, wholesalers, and more.
2. Large-scale supermarkets still rely primarily on importers and wholesalers. Most are engaged to
some degree in developing and maintaining private labels which they tend to outsource to food
processors.
3. Conventional supermarkets tend to depend on wholesalers from which they usually acquire a
number of regional/local and national wholesalers who buy imported food products from trading houses
and importers. Wholesalers and big trading houses are generally interested in handling high volume
products, not niche-oriented ones.
B. Market Structure
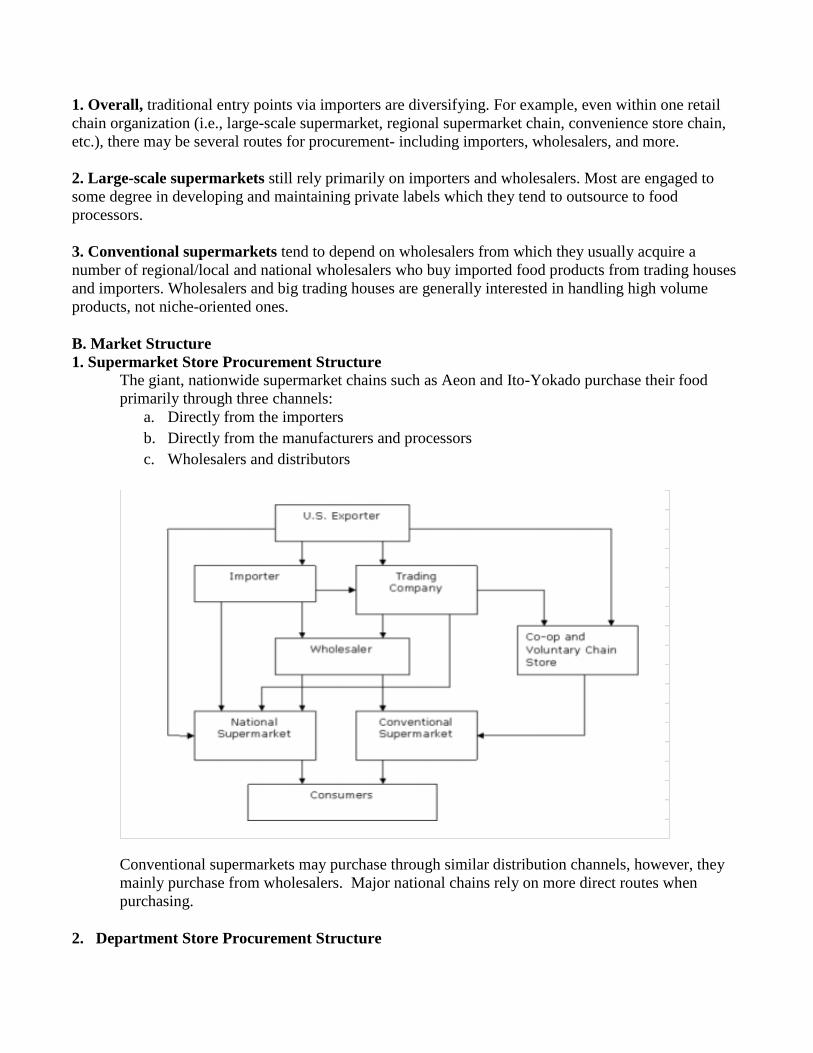
1. Supermarket Store Procurement Structure
The giant, nationwide supermarket chains such as Aeon and Ito-Yokado purchase their food
primarily through three channels:
a. Directly from the importers
b. Directly from the manufacturers and processors
c. Wholesalers and distributors
Conventional supermarkets may purchase through similar distribution channels, however, they
mainly purchase from wholesalers. Major national chains rely on more direct routes when
purchasing.
2. Department Store Procurement Structure
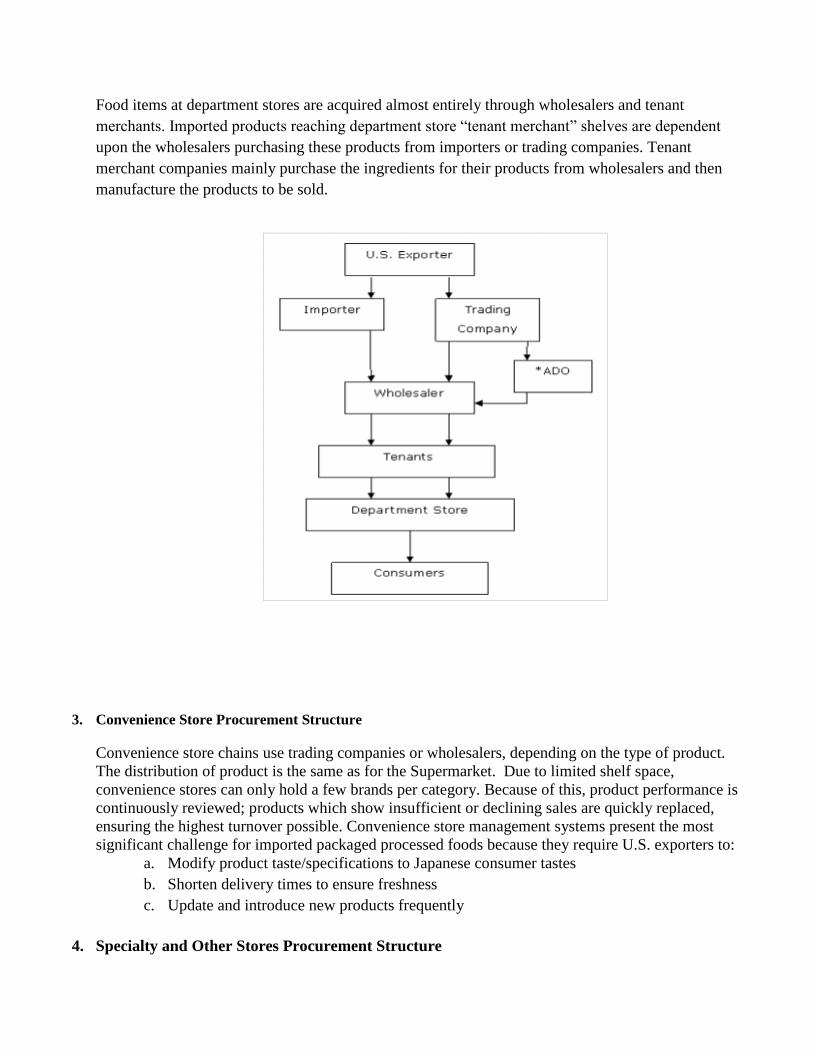
Food items at department stores are acquired almost entirely through wholesalers and tenant
merchants. Imported products reaching department store “tenant merchant” shelves are dependent
upon the wholesalers purchasing these products from importers or trading companies. Tenant
merchant companies mainly purchase the ingredients for their products from wholesalers and then
manufacture the products to be sold.
3. Convenience Store Procurement Structure
Convenience store chains use trading companies or wholesalers, depending on the type of product.
The distribution of product is the same as for the Supermarket. Due to limited shelf space,
convenience stores can only hold a few brands per category. Because of this, product performance is
continuously reviewed; products which show insufficient or declining sales are quickly replaced,
ensuring the highest turnover possible. Convenience store management systems present the most
significant challenge for imported packaged processed foods because they require U.S. exporters to:
a. Modify product taste/specifications to Japanese consumer tastes
b. Shorten delivery times to ensure freshness
c. Update and introduce new products frequently
4. Specialty and Other Stores Procurement Structure

Specialty shops (i.e. foreign foods, discount foods, etc...) also primarily depend on wholesalers.
Select coffee shop chains, discount stores and natural food specialty stores with chain operations
may present opportunities for some U.S. food exporters. The structure for these groups also follow
the supermarket model.
5. Co-ops and Voluntary Chain Procurement Structure
Co-ops and voluntary chains use a variety of sources which include: direct importing, purchase from
manufacturers, importers, and wholesalers. There are several major organizations serving voluntary
chains including CGC Japan, Nichiryu, All Japan Supermarket Association (AJS), and Consumer
Cooperatives (Co-ops). Their major role is to develop private label products and Consumers
Cooperatives (Co-ops). Most private label products are developed with Japanese food processors and
overseas sources to offer to member retailers. Some of these organizations directly import non-
branded food products that are “volume” oriented in nature.
6. Traditional Store Procurement Structure
These are mom & pop or “one category” stores that typically source from wholesalers. Penetration
of imported foods into these shops and stores is relatively low.
7. Online
Online shopping continues to grow in popularity in Japan, with mobile shopping dominating more
than half of all e-commerce transactions. The 2016 Japan e-commerce market to the majority of
online sales are non-food items, food and beverage sales are increasingly being purchased online.
Therefore, it is another possible channel in which US exporters can consider for food distribution.
C. Company Profiles:
1. Supermarkets, Clubs, Warehouse Outlets, etc... $374.7 billion, 76.6% Market Share
The largest retail outlet is AEON Co. Ltd. AEON Co. Ltd has experienced a moderate recovery in sales
since the consumption tax hike in 2014 due to the company’s initiatives to establish a price-advantage
by holding low-price sales promotions for food as well as offering over 5,000 lower-priced items
through their own private brand, TopValu. The second largest retailer in terms of overall sales value is
Ito-Yokado. Ito-Yokado is part of the Seven and I group that is has also experienced great success with
its 7-11 convenience store business.
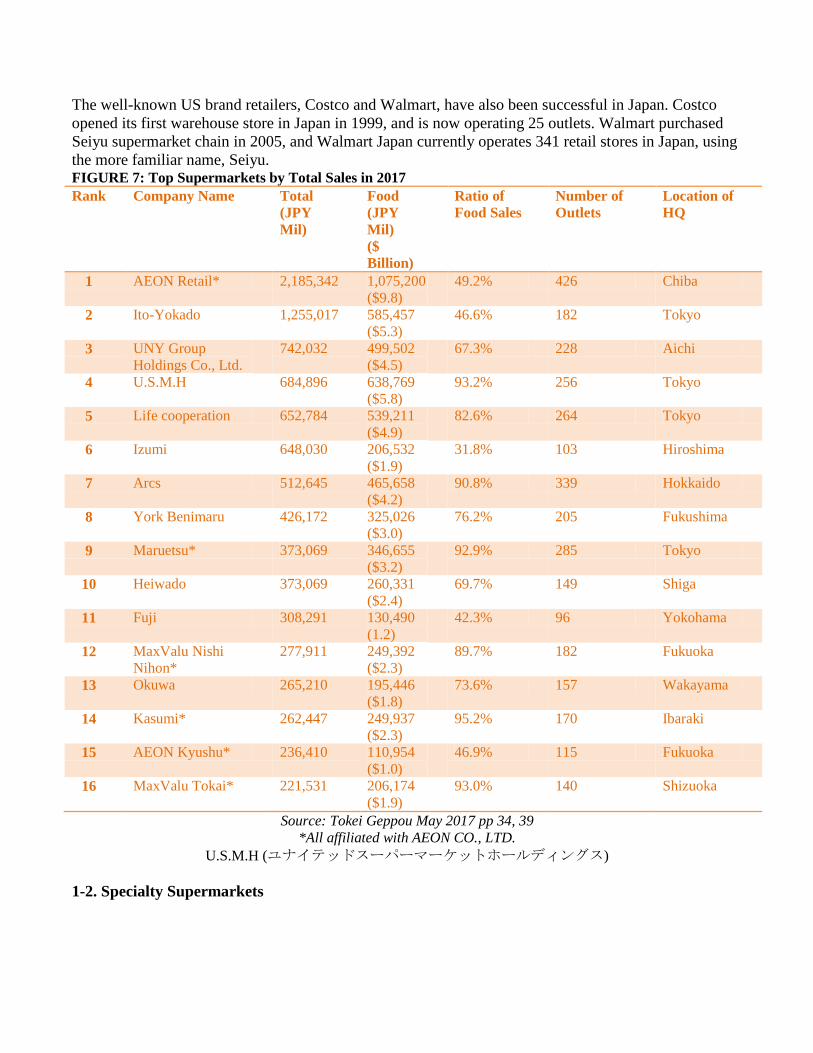
The well-known US brand retailers, Costco and Walmart, have also been successful in Japan. Costco
opened its first warehouse store in Japan in 1999, and is now operating 25 outlets. Walmart purchased
Seiyu supermarket chain in 2005, and Walmart Japan currently operates 341 retail stores in Japan, using
the more familiar name, Seiyu. FIGURE 7: Top Supermarkets by Total Sales in 2017
Rank Company Name Total
(JPY
Mil)
Food
(JPY
Mil)
($
Billion)
Ratio of
Food Sales
Number of
Outlets
Location of
HQ
1 AEON Retail* 2,185,342 1,075,200
($9.8)
49.2% 426 Chiba
2 Ito-Yokado 1,255,017 585,457
($5.3)
46.6% 182 Tokyo
3 UNY Group
Holdings Co., Ltd.
742,032 499,502
($4.5)
67.3% 228 Aichi
4 U.S.M.H 684,896 638,769
($5.8)
93.2% 256 Tokyo
5 Life cooperation 652,784 539,211
($4.9)
82.6% 264 Tokyo
6 Izumi 648,030 206,532
($1.9)
31.8% 103 Hiroshima
7 Arcs 512,645 465,658
($4.2)
90.8% 339 Hokkaido
8 York Benimaru 426,172 325,026
($3.0)
76.2% 205 Fukushima
9 Maruetsu* 373,069 346,655
($3.2)
92.9% 285 Tokyo
10 Heiwado 373,069 260,331
($2.4)
69.7% 149 Shiga
11 Fuji 308,291 130,490
(1.2)
42.3% 96 Yokohama
12 MaxValu Nishi
Nihon*
277,911 249,392
($2.3)
89.7% 182 Fukuoka
13 Okuwa 265,210 195,446
($1.8)
73.6% 157 Wakayama
14 Kasumi* 262,447 249,937
($2.3)
95.2% 170 Ibaraki
15 AEON Kyushu* 236,410 110,954
($1.0)
46.9% 115 Fukuoka
16 MaxValu Tokai* 221,531 206,174
($1.9)
93.0% 140 Shizuoka
Source: Tokei Geppou May 2017 pp 34, 39
*All affiliated with AEON CO., LTD.
U.S.M.H (ユナイテッドスーパーマーケットホールディングス)
1-2. Specialty Supermarkets
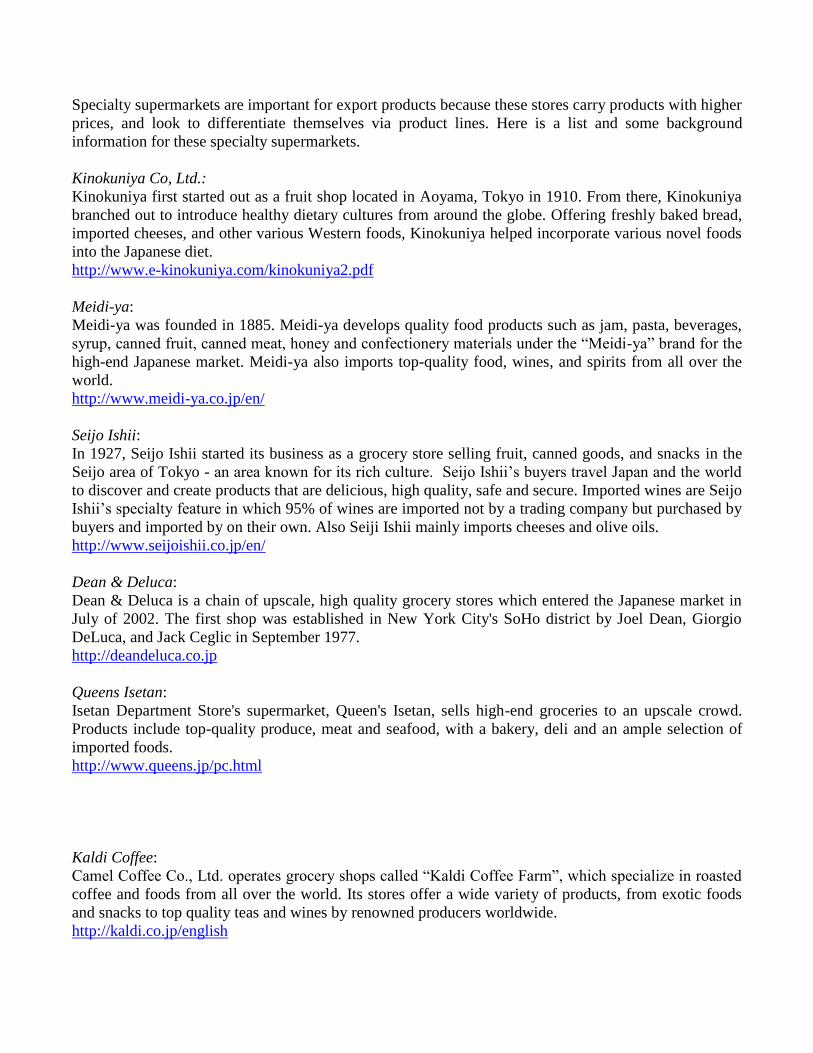
Specialty supermarkets are important for export products because these stores carry products with higher
prices, and look to differentiate themselves via product lines. Here is a list and some background
information for these specialty supermarkets.
Kinokuniya Co, Ltd.:
Kinokuniya first started out as a fruit shop located in Aoyama, Tokyo in 1910. From there, Kinokuniya
branched out to introduce healthy dietary cultures from around the globe. Offering freshly baked bread,
imported cheeses, and other various Western foods, Kinokuniya helped incorporate various novel foods
into the Japanese diet.
http://www.e-kinokuniya.com/kinokuniya2.pdf
Meidi-ya:
Meidi-ya was founded in 1885. Meidi-ya develops quality food products such as jam, pasta, beverages,
syrup, canned fruit, canned meat, honey and confectionery materials under the “Meidi-ya” brand for the
high-end Japanese market. Meidi-ya also imports top-quality food, wines, and spirits from all over the
world.
http://www.meidi-ya.co.jp/en/
Seijo Ishii:
In 1927, Seijo Ishii started its business as a grocery store selling fruit, canned goods, and snacks in the
Seijo area of Tokyo - an area known for its rich culture. Seijo Ishii’s buyers travel Japan and the world
to discover and create products that are delicious, high quality, safe and secure. Imported wines are Seijo
Ishii’s specialty feature in which 95% of wines are imported not by a trading company but purchased by
buyers and imported by on their own. Also Seiji Ishii mainly imports cheeses and olive oils.
http://www.seijoishii.co.jp/en/
Dean & Deluca:
Dean & Deluca is a chain of upscale, high quality grocery stores which entered the Japanese market in
July of 2002. The first shop was established in New York City's SoHo district by Joel Dean, Giorgio
DeLuca, and Jack Ceglic in September 1977.
http://deandeluca.co.jp
Queens Isetan:
Isetan Department Store's supermarket, Queen's Isetan, sells high-end groceries to an upscale crowd.
Products include top-quality produce, meat and seafood, with a bakery, deli and an ample selection of
imported foods.
http://www.queens.jp/pc.html
Kaldi Coffee:
Camel Coffee Co., Ltd. operates grocery shops called “Kaldi Coffee Farm”, which specialize in roasted
coffee and foods from all over the world. Its stores offer a wide variety of products, from exotic foods
and snacks to top quality teas and wines by renowned producers worldwide.
http://kaldi.co.jp/english

National:
National are supermarkets which sell imported food, wines from around the world, groceries, fruits &
vegetables, meats, fish, alcohol (beer, wine, spirits), and other miscellaneous goods. National currently
has two physical shops as well as a delivery service.
http://www.national-azabu.com/e_index2.php
Nissin World Delicatessen:
Nissin World Delicatessen is an international supermarket which specializes in imported meats,
vegetables, fruit, processed food, wines, beer, and spirits as well as health foods.
http://www.nissin-world-delicatessen.jp/
2. Convenience Stores (CVS) $67.1, 14.1% Market Share
Convenience stores continue to expand their market share due to the increase in the number of locations,
wide variety of products, and their overall convenience. Other contributing factors to the success of
convenience stores include the proximity to consumer’s homes and home-delivery services. Despite tax
hikes and inflation affecting sales at department stores and supermarkets, convenient stores remain
unaffected and their sales remain strong.
Convenient stores constantly provide new services and products; such as fresh brewed coffee, eat-in
space, mail service, etc... to appeal to consumer needs. Moreover, the top 3 convenience stores have
been dominating sales over their competitors. Seven & I Holdings holds the top sales spot among
convenience stores in Japan, and has experienced a strong increase in sales to female and senior
customers. Seven & I Holdings recently developed their own private label called Seven Premium,
selling bento boxes and other items at prices comparable to supermarkets. The company has also
focused on improving service, such as offering morning discounts for coffee and implementing goods to
target the senior population who would prefer to shop closer to home.
The sales of Lawson overtook those of Family Mart. Early in 2016, Family Mart merged with Circle K
Sunkus and expanded their market, and further merged with UNY Group Holdings in September 2016.
The following table (Figure 8) summarizes the top convenience stores in Japan 2017.
FIGURE 8: Top Convenience Stores 2017 May (Sales and Outlets)
Rank Company Name Food Sales(JPY Mil)
($ Billion)
Number of Outlets Location
1 Seven & I Holdings 3,147,376
($28.7)
19,422 Nationwide
2 Lawson 1,711,500
($15.6)
13,190 Nationwide
3 Family Mart 1,238,152 17,001 Nationwide
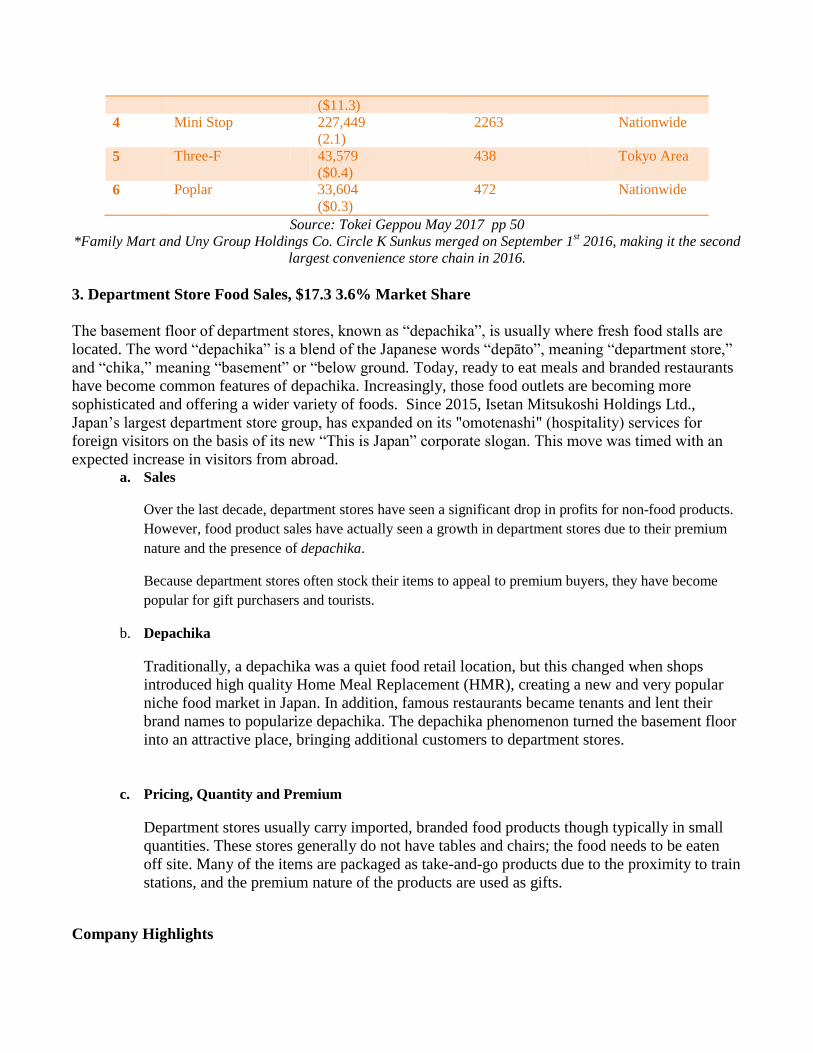
($11.3)
4 Mini Stop 227,449
(2.1)
2263 Nationwide
5 Three-F 43,579
($0.4)
438 Tokyo Area
6 Poplar 33,604
($0.3)
472 Nationwide
Source: Tokei Geppou May 2017 pp 50
*Family Mart and Uny Group Holdings Co. Circle K Sunkus merged on September 1st 2016, making it the second
largest convenience store chain in 2016.
3. Department Store Food Sales, $17.3 3.6% Market Share
The basement floor of department stores, known as “depachika”, is usually where fresh food stalls are
located. The word “depachika” is a blend of the Japanese words “depāto”, meaning “department store,”
and “chika,” meaning “basement” or “below ground. Today, ready to eat meals and branded restaurants
have become common features of depachika. Increasingly, those food outlets are becoming more
sophisticated and offering a wider variety of foods. Since 2015, Isetan Mitsukoshi Holdings Ltd.,
Japan’s largest department store group, has expanded on its "omotenashi" (hospitality) services for
foreign visitors on the basis of its new “This is Japan” corporate slogan. This move was timed with an
expected increase in visitors from abroad. a. Sales
Over the last decade, department stores have seen a significant drop in profits for non-food products.
However, food product sales have actually seen a growth in department stores due to their premium
nature and the presence of depachika.
Because department stores often stock their items to appeal to premium buyers, they have become
popular for gift purchasers and tourists.
b. Depachika
Traditionally, a depachika was a quiet food retail location, but this changed when shops
introduced high quality Home Meal Replacement (HMR), creating a new and very popular
niche food market in Japan. In addition, famous restaurants became tenants and lent their
brand names to popularize depachika. The depachika phenomenon turned the basement floor
into an attractive place, bringing additional customers to department stores.
c. Pricing, Quantity and Premium
Department stores usually carry imported, branded food products though typically in small
quantities. These stores generally do not have tables and chairs; the food needs to be eaten
off site. Many of the items are packaged as take-and-go products due to the proximity to train
stations, and the premium nature of the products are used as gifts.
Company Highlights

Listed below are the top 10 department store establishments and their total sales for Japan in 2016.
FIGURE 9: Top 10 Department Stores & Total Sales
Rank Company Name Location Total Sales (Billion Yen)
1 Mitsukoshi-Isetan Shinjuku-ku, Tokyo 12,872
2 J. Front Retailing (Daimaru) Chuo-ku, Tokyo 11,635
3 Takashimaya Co. Chuo-ku, Osaka 9,295
4 H2O Retailing (Hankyu Hanshin) Kita-ku, Osaka 9,156
5 Seven & I (Sogo Seibu) Chiyoda-ku, Tokyo 8,818
6 Tokyu Corp. Shibuya-ku, Tokyo 6,314
7 Parco Shibuya-ku, Tokyo 2,763
8 Kintetsu Abeno-ku, Osaka 2,707
9 Marui Group Nakano-ku, Tokyo 2,458
10 Odakyu Shinjuku-ku, Tokyo 2,221
Source: http://gyokai-search.com/4-dept-uriage.htm
Section III: Consumer Trends
A. Consumer Trends
Japanese consumers prefer convenience, quality, and single-serving sizes. Each day, an estimated 13.5
million people commute via a combination of train and walking, in Tokyo alone. Therefore,
convenience and accessibility are highly valued by Japanese consumers who tend to drive less than
those in many other developed country citizens.
Japanese culture places a heavy emphasis on the four distinct seasons - and this is reflected in the
changes in consumer purchasing habits and patterns of gift giving throughout the year. A quick
breakdown for reference is:
Season Month Sales, Promotions, Events & Holidays
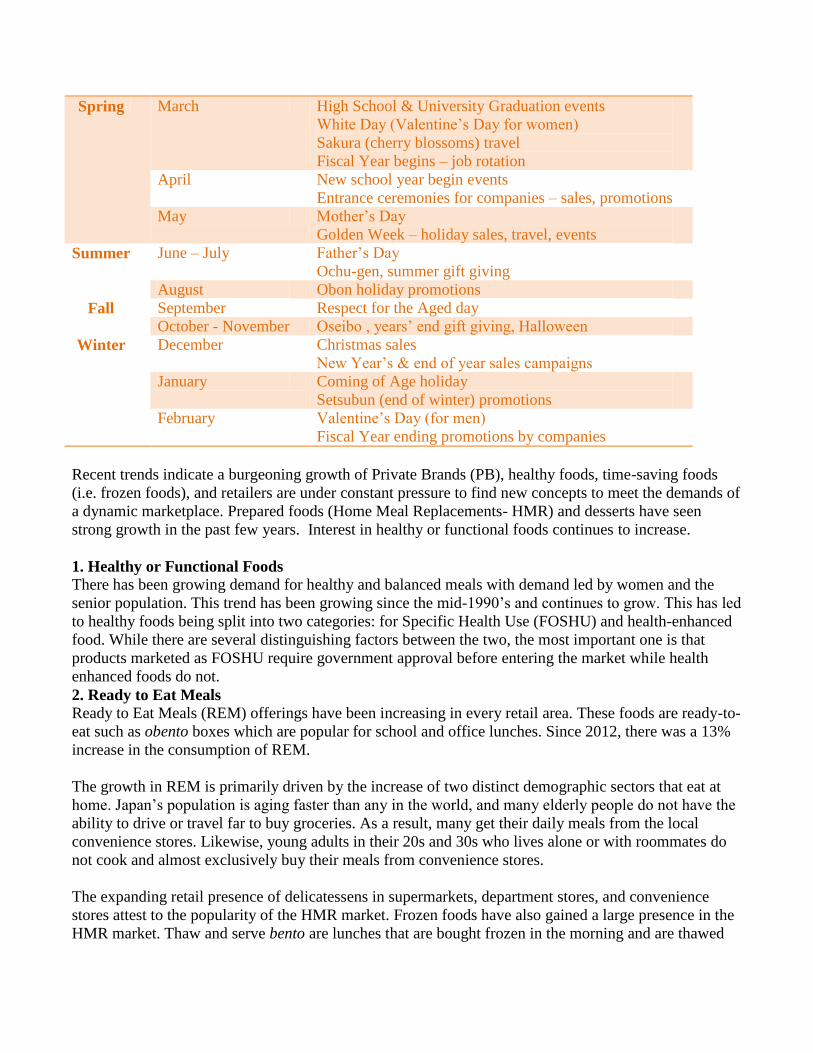
Spring March High School & University Graduation events
White Day (Valentine’s Day for women)
Sakura (cherry blossoms) travel
Fiscal Year begins – job rotation
April New school year begin events
Entrance ceremonies for companies – sales, promotions
May Mother’s Day
Golden Week – holiday sales, travel, events
Summer June – July Father’s Day
Ochu-gen, summer gift giving
August Obon holiday promotions
Fall September Respect for the Aged day
October - November Oseibo , years’ end gift giving, Halloween
Winter December Christmas sales
New Year’s & end of year sales campaigns
January Coming of Age holiday
Setsubun (end of winter) promotions
February Valentine’s Day (for men)
Fiscal Year ending promotions by companies
Recent trends indicate a burgeoning growth of Private Brands (PB), healthy foods, time-saving foods
(i.e. frozen foods), and retailers are under constant pressure to find new concepts to meet the demands of
a dynamic marketplace. Prepared foods (Home Meal Replacements- HMR) and desserts have seen
strong growth in the past few years. Interest in healthy or functional foods continues to increase.
1. Healthy or Functional Foods
There has been growing demand for healthy and balanced meals with demand led by women and the
senior population. This trend has been growing since the mid-1990’s and continues to grow. This has led
to healthy foods being split into two categories: for Specific Health Use (FOSHU) and health-enhanced
food. While there are several distinguishing factors between the two, the most important one is that
products marketed as FOSHU require government approval before entering the market while health
enhanced foods do not.
2. Ready to Eat Meals
Ready to Eat Meals (REM) offerings have been increasing in every retail area. These foods are ready-to-
eat such as obento boxes which are popular for school and office lunches. Since 2012, there was a 13%
increase in the consumption of REM.
The growth in REM is primarily driven by the increase of two distinct demographic sectors that eat at
home. Japan’s population is aging faster than any in the world, and many elderly people do not have the
ability to drive or travel far to buy groceries. As a result, many get their daily meals from the local
convenience stores. Likewise, young adults in their 20s and 30s who lives alone or with roommates do
not cook and almost exclusively buy their meals from convenience stores.
The expanding retail presence of delicatessens in supermarkets, department stores, and convenience
stores attest to the popularity of the HMR market. Frozen foods have also gained a large presence in the
HMR market. Thaw and serve bento are lunches that are bought frozen in the morning and are thawed
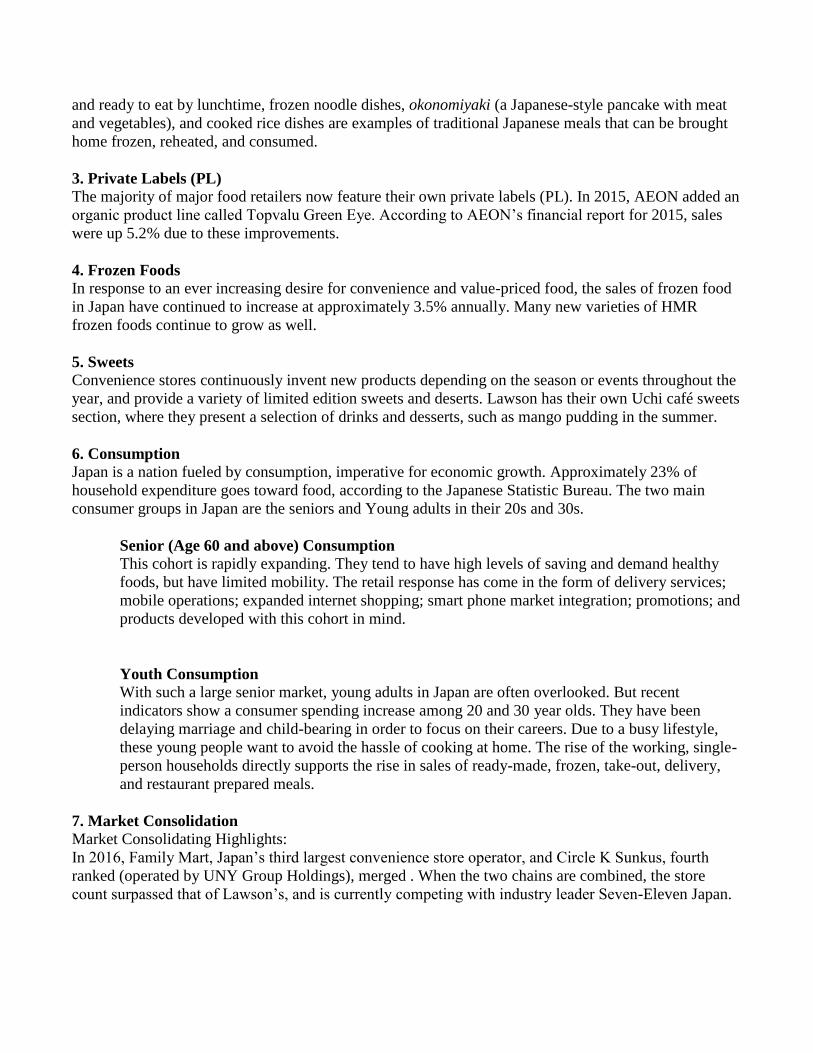
and ready to eat by lunchtime, frozen noodle dishes, okonomiyaki (a Japanese-style pancake with meat
and vegetables), and cooked rice dishes are examples of traditional Japanese meals that can be brought
home frozen, reheated, and consumed.
3. Private Labels (PL)
The majority of major food retailers now feature their own private labels (PL). In 2015, AEON added an
organic product line called Topvalu Green Eye. According to AEON’s financial report for 2015, sales
were up 5.2% due to these improvements.
4. Frozen Foods
In response to an ever increasing desire for convenience and value-priced food, the sales of frozen food
in Japan have continued to increase at approximately 3.5% annually. Many new varieties of HMR
frozen foods continue to grow as well.
5. Sweets
Convenience stores continuously invent new products depending on the season or events throughout the
year, and provide a variety of limited edition sweets and deserts. Lawson has their own Uchi café sweets
section, where they present a selection of drinks and desserts, such as mango pudding in the summer.
6. Consumption
Japan is a nation fueled by consumption, imperative for economic growth. Approximately 23% of
household expenditure goes toward food, according to the Japanese Statistic Bureau. The two main
consumer groups in Japan are the seniors and Young adults in their 20s and 30s.
Senior (Age 60 and above) Consumption
This cohort is rapidly expanding. They tend to have high levels of saving and demand healthy
foods, but have limited mobility. The retail response has come in the form of delivery services;
mobile operations; expanded internet shopping; smart phone market integration; promotions; and
products developed with this cohort in mind.
Youth Consumption
With such a large senior market, young adults in Japan are often overlooked. But recent
indicators show a consumer spending increase among 20 and 30 year olds. They have been
delaying marriage and child-bearing in order to focus on their careers. Due to a busy lifestyle,
these young people want to avoid the hassle of cooking at home. The rise of the working, single-
person households directly supports the rise in sales of ready-made, frozen, take-out, delivery,
and restaurant prepared meals.
7. Market Consolidation
Market Consolidating Highlights:
In 2016, Family Mart, Japan’s third largest convenience store operator, and Circle K Sunkus, fourth
ranked (operated by UNY Group Holdings), merged . When the two chains are combined, the store
count surpassed that of Lawson’s, and is currently competing with industry leader Seven-Eleven Japan.
SECTION IV: CONTACT AND FURTHER INFORMATION
If you have any questions or comments regarding this report or need assistance with exporting to Japan,
please contact the U.S. Agricultural Trade Offices in Tokyo or Osaka at the following addresses:
Tokyo
U.S. Agricultural Trade Office U.S. Embassy,
Tokyo 1-10-5 Akasaka, Minato-ku
Tokyo 107-8420
Tel: 81-3-3224-5115
Fax: 81-3-3582-6429
E-mail: [email protected]
Osaka U.S. Agricultural Trade Office
U.S. Consulate General, Osaka-Kobe 2-11-5,
Nishi-tenma, Kita-ku, Osaka 530-8543
Tel: 81-6-6315-5904
Fax: 81-6-6315-5906
E-mail: [email protected]
Other websites: http://www.myfood.jp
Additional Reports: Reports from Japan’s ATOs, in addition to those from the Agricultural Affairs
Office in Japan, can be found using the links provided or by searching from the FAS Japan Reports
website at: http://www.fas.usda.gov/scriptsw/attacherep/default .

Related Documents


