THIS REPORT CONTAINS ASSESSMENTS OF COMMODITY AND TRADE ISSUES MADE BY USDA STAFF AND NOT NECESSARILY STATEMENTS OF OFFICIAL U.S. GOVERNMENT POLICY Date: GAIN Report Number: Approved By: Prepared By: Report Highlights: Japanese cattle and swine numbers follow downward trajectories as aging operators continue to exit without successors. As consumption remains relatively flat, fierce competition between proteins for consumer spending and between foreign suppliers for market share should continue through 2017. As total imports of Australian beef contract on tighter supplies, U.S. shippers should reclaim significant market share through 2017. European Union pork suppliers are forecast to continue to dominate the Japanese market for frozen pork cuts, as the United States expands shipments of higher value chilled cuts. Japanese imports of U.S. chilled beef and pork are projected to rebound strongly in 2016, as U.S. year-on-year figures recover from the disruption of the 2015 West Coast ports labor slowdown. Kakuyu Obara, Agricultural Specialist Evan Mangino, Agricultural Attaché 2016 Market Situation Update and 2017 Outlook Livestock and Products Annual Japan JA6019 9/9/2016 Required Report - public distribution

Welcome message from author
This document is posted to help you gain knowledge. Please leave a comment to let me know what you think about it! Share it to your friends and learn new things together.
Transcript

THIS REPORT CONTAINS ASSESSMENTS OF COMMODITY AND TRADE ISSUES MADE BY
USDA STAFF AND NOT NECESSARILY STATEMENTS OF OFFICIAL U.S. GOVERNMENT
POLICY
Date:
GAIN Report Number:
Approved By:
Prepared By:
Report Highlights:
Japanese cattle and swine numbers follow downward trajectories as aging operators continue to exit
without successors. As consumption remains relatively flat, fierce competition between proteins for
consumer spending and between foreign suppliers for market share should continue through 2017. As
total imports of Australian beef contract on tighter supplies, U.S. shippers should reclaim significant
market share through 2017. European Union pork suppliers are forecast to continue to dominate the
Japanese market for frozen pork cuts, as the United States expands shipments of higher value chilled
cuts. Japanese imports of U.S. chilled beef and pork are projected to rebound strongly in 2016, as U.S.
year-on-year figures recover from the disruption of the 2015 West Coast ports labor slowdown.
Kakuyu Obara, Agricultural Specialist
Evan Mangino, Agricultural Attaché
2016 Market Situation Update and 2017 Outlook
Livestock and Products Annual
Japan
JA6019
9/9/2016
Required Report - public distribution

Keywords: Japan, JA6019, Livestock, Cattle, Beef, Swine, Pork
Executive Summary:
Continued declines in Japanese beef cattle and dairy cattle numbers are forecast to restrict Japanese
domestic beef supplies in 2016 and 2017. Post projects total beef imports from Australia, the largest
supplier of beef to Japan, to decline over the next 18 months as lower Australian production drives offer
prices upward, outweighing Australia’s significant tariff rate advantage over U.S. beef (currently 11
percentage points on frozen cuts, and 8 percentage points on chilled cuts). With U.S. beef production
projected to expand through 2018, the United States is poised to claw back market share ceded in 2015.
As major importers work through accumulated frozen reserves in 2016, higher chilled imports will drive
modest import and consumption growth.
Lower breeding stock numbers point to a continued contraction of the Japanese swine herd in 2016 and
2017, despite a projected uptick in 2016 pork production as Japan shakes off the worst impacts of PEDv.
Ample supplies of North American pork should maintain downward pressure on prices, driving imports
of U.S. chilled cuts higher in 2016. As the Japanese processed pork sector replenishes depleted stocks
of frozen raw material cuts, the EU share of the frozen pork market is expected to soar on continued
abundant exportable supplies of EU-origin pork. Higher imports of EU frozen cuts are forecast to
continue crowding out North American frozen products in 2016 and 2017.
Commodities:
Preface:
This report is an update to JA6003 Japan Livestock and Products Semiannual, dated March 18, 2016.
Quantities listed in the text are made on the basis of Carcass Weight Equivalent (CWE) unless specified
otherwise. Some numbers in the tables are on a product weight basis and have not been converted to
CWE.
Rates of conversion from product weight to CWE are:
Beef Cuts (Boneless) – 1.40
Pork Cuts (Boneless) – 1.30
Processed/Prepared Beef Products – 1.79
Processed/Prepared Pork Products – 1.30
All supplemental tables in the report are provided for the reader’s own analysis.
Production, Supply and Demand Data Statistics:
Cattle PS&D
Meat, Swine
Animal Numbers, Swine
Meat, Beef and Veal
Animal Numbers, Cattle

Animal Numbers, Cattle 2015 2016 2017 Market Begin Year Jan 2015 Jan 2016 Jan 2017 Japan USDA Official New Post USDA Official New Post USDA Official New Post Total Cattle Beg. Stks 3860 3860 3765 3824 0 3800 Dairy Cows Beg. Stocks 750 750 735 752 0 750 Beef Cows Beg. Stocks 585 578 575 588 0 590 Production (Calf Crop) 1185 1210 1160 1215 0 1220 Total Imports 9 9 8 5 0 0 Total Supply 5054 5079 4933 5044 0 5020 Total Exports 0 0 0 0 0 0 Cow Slaughter 516 516 510 500 0 495 Calf Slaughter 6 6 5 5 0 5 Other Slaughter 595 595 590 580 0 575 Total Slaughter 1117 1117 1105 1085 0 1075 Loss 172 138 168 159 0 145 Ending Inventories 3765 3824 3660 3800 0 3800 Total Distribution 5054 5079 4933 5044 0 5020
(1000 HEAD)
Beef and Veal PS&D Meat, Beef and Veal 2015 2016 2017 Market Begin Year Jan 2015 Jan 2016 Jan 2017 Japan USDA Official New Post USDA Official New Post USDA Official New Post Slaughter (Reference) 1117 1117 1105 1085 0 1075 Beginning Stocks 185 185 185 185 0 162 Production 481 481 475 465 0 460 Total Imports 707 708 725 715 0 730 Total Supply 1373 1374 1385 1365 0 1352 Total Exports 2 2 2 3 0 3 Human Dom. Consumption 1186 1187 1190 1200 0 1200 Other Use, Losses 0 0 0 0 0 0 Total Dom. Consumption 1186 1187 1190 1200 0 1200 Ending Stocks 185 185 193 162 0 149 Total Distribution 1373 1374 1385 1365 0 1352
(1000 HEAD) ,(1000 MT CWE)
Swine PS&D Animal Numbers, Swine 2015 2016 2017 Market Begin Year Jan 2015 Jan 2016 Jan 2017 Japan USDA Official New Post USDA Official New Post USDA Official New Post Total Beginning Stocks 9440 9440 9600 9313 0 9150 Sow Beginning Stocks 890 855 890 845 0 855 Production (Pig Crop) 17150 16500 17200 16700 0 16500 Total Imports 1 1 1 1 0 1 Total Supply 26591 25941 26801 26014 0 25651 Total Exports 0 0 0 0 0 0 Sow Slaughter 0 0 0 0 0 0 Other Slaughter 16105 16105 16300 16400 0 16250 Total Slaughter 16105 16105 16300 16400 0 16250 Loss 886 523 811 464 0 451 Ending Inventories 9600 9313 9690 9150 0 8950 Total Distribution 26591 25941 26801 26014 0 25651
(1000 HEAD)
Pork PS&D Meat, Swine 2015 2016 2017 Market Begin Year Jan 2015 Jan 2016 Jan 2017 Japan USDA Official New Post USDA Official New Post USDA Official New Post
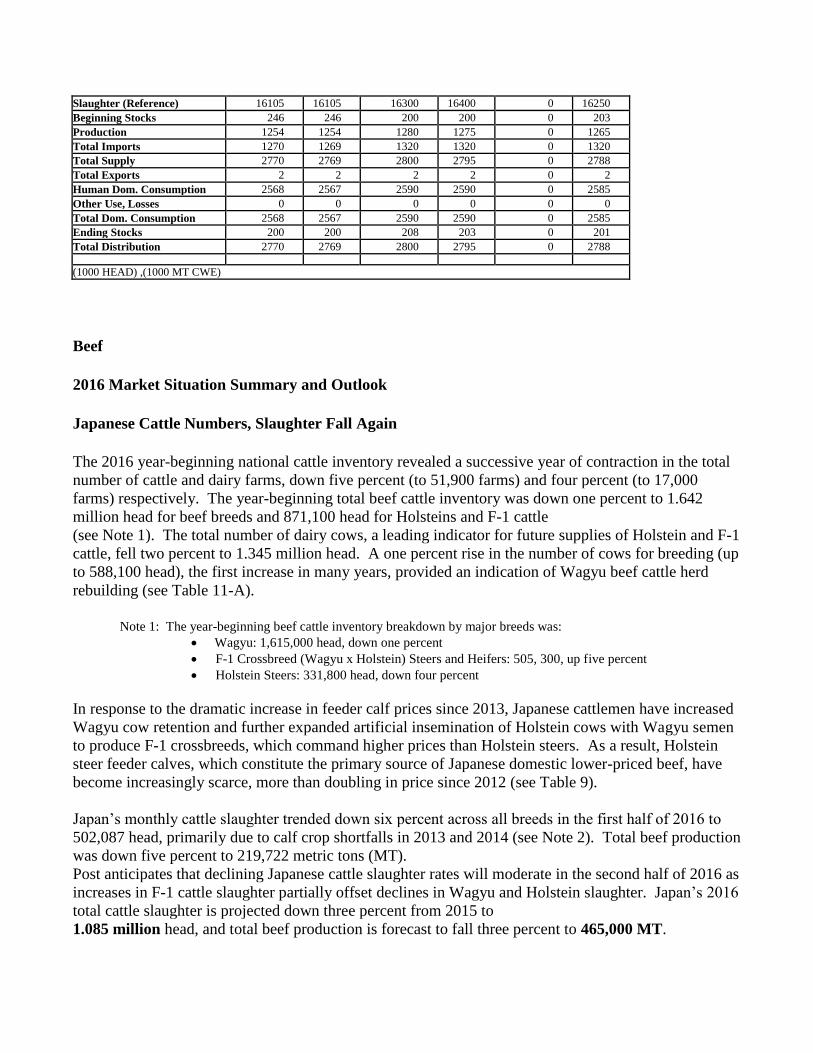
Slaughter (Reference) 16105 16105 16300 16400 0 16250 Beginning Stocks 246 246 200 200 0 203 Production 1254 1254 1280 1275 0 1265 Total Imports 1270 1269 1320 1320 0 1320 Total Supply 2770 2769 2800 2795 0 2788 Total Exports 2 2 2 2 0 2 Human Dom. Consumption 2568 2567 2590 2590 0 2585 Other Use, Losses 0 0 0 0 0 0 Total Dom. Consumption 2568 2567 2590 2590 0 2585 Ending Stocks 200 200 208 203 0 201 Total Distribution 2770 2769 2800 2795 0 2788
(1000 HEAD) ,(1000 MT CWE)
Beef
2016 Market Situation Summary and Outlook
Japanese Cattle Numbers, Slaughter Fall Again
The 2016 year-beginning national cattle inventory revealed a successive year of contraction in the total
number of cattle and dairy farms, down five percent (to 51,900 farms) and four percent (to 17,000
farms) respectively. The year-beginning total beef cattle inventory was down one percent to 1.642
million head for beef breeds and 871,100 head for Holsteins and F-1 cattle
(see Note 1). The total number of dairy cows, a leading indicator for future supplies of Holstein and F-1
cattle, fell two percent to 1.345 million head. A one percent rise in the number of cows for breeding (up
to 588,100 head), the first increase in many years, provided an indication of Wagyu beef cattle herd
rebuilding (see Table 11-A).
Note 1: The year-beginning beef cattle inventory breakdown by major breeds was:
Wagyu: 1,615,000 head, down one percent F-1 Crossbreed (Wagyu x Holstein) Steers and Heifers: 505, 300, up five percent Holstein Steers: 331,800 head, down four percent
In response to the dramatic increase in feeder calf prices since 2013, Japanese cattlemen have increased
Wagyu cow retention and further expanded artificial insemination of Holstein cows with Wagyu semen
to produce F-1 crossbreeds, which command higher prices than Holstein steers. As a result, Holstein
steer feeder calves, which constitute the primary source of Japanese domestic lower-priced beef, have
become increasingly scarce, more than doubling in price since 2012 (see Table 9).
Japan’s monthly cattle slaughter trended down six percent across all breeds in the first half of 2016 to
502,087 head, primarily due to calf crop shortfalls in 2013 and 2014 (see Note 2). Total beef production
was down five percent to 219,722 metric tons (MT).
Post anticipates that declining Japanese cattle slaughter rates will moderate in the second half of 2016 as
increases in F-1 cattle slaughter partially offset declines in Wagyu and Holstein slaughter. Japan’s 2016
total cattle slaughter is projected down three percent from 2015 to
1.085 million head, and total beef production is forecast to fall three percent to 465,000 MT.

Note 2: The slaughter breakdown by major breeds through June 2016 was: Wagyu: 207,585, down eight percent F-1: 107,271 head, down two percent Holstein Steer: 98,032 head, down five percent Holstein Cow and Heifer: 81,075 head, down four percent
Consumption Ticks Upward as U.S. Chilled Beef Rebounds
Driven by relatively solid demand for imported beef, especially U.S. chilled cuts, Post projects Japanese
total beef consumption to show positive growth in 2016, reaching approximately
1.20 million MT. However, beef will continue to face intense competition for consumer protein
spending as ample supplies of pork and poultry (both domestic and imported) limit prospects for
narrowing the price gap between imported beef and other proteins.
The steady decline of Japanese domestic beef production year-over-year continued to drive up average
wholesale carcass prices in the first half of 2016 (see Table 4-A). Mid-grade Wagyu steer carcass prices
showed the steepest increases, with relatively less marbled A-2 and A-3 average prices up 21 and 19
percent respectively over 2015 levels. Wagyu heifer, F-1 and Holstein carcass prices remained at or
near 2015 highs.
After several years of relatively higher prices for U.S. beef (on tighter U.S. supplies and a relatively
weaker Yen), sources indicate that retail outlets have increased U.S. chilled beef offerings in the first
half of 2016 as prices have moderated (due to expanded U.S. production and a relatively stronger Yen).
Industry sources confirm that while Korean-style barbecue chain restaurants remain the leading end-user
of U.S. chilled beef (primarily rib and plate cuts), the expansion of specialty steak and barbecue
restaurant outlets in urban centers is driving increased consumption of U.S. chilled cuts, including
higher value cuts (see Notes 3, 4 and 5).
Industry sources and the latest Ministry of Agriculture Forestry and Fisheries (MAFF) data point to the
unwinding of accumulated stocks of frozen cuts (including a large volume of U.S. plate cuts) and to
reduced retail demand for ground beef to explain much of the sharp decline in frozen import volumes
(see Table 1). While Western-style fast food outlets (a segment dominated by hamburger chains) appear
to be turning a corner after nearly two years of steady sales declines, sources indicate that major chains
are drawing down existing stocks through 2017 as supplies of Australian frozen trimmings remain tight.
Higher price offers for imported grass-fed frozen trimmings could create an additional challenge for
hamburger chains.
Note 3: The latest MAFF estimates of beef utilization by market segment were: households – 32 percent;
processing – 5 percent; food service and institutional – 63 percent. Note 4: The Agriculture & Livestock Industries Corporation (ALIC) data on the total volume of beef distributed in
the first half of 2016 increased two percent to 557,377 MT, as higher volumes of imported beef (up six percent to
340,389 MT) more than offset Japanese beef supplies (down four percent to
216,988 MT). Note 5: Increased retail consumption of U.S. chilled beef is reflected in a moderate rise in household beef
consumption through June 2016 (see Table 1).

Imports Up as United States Reclaims Market Share Lost in 2015
As expanding imports of U.S. beef practically cancel out reduced imports of Australian beef, total
Japanese imports should grow slightly in 2016 to 715,000 MT, with 699,000 MT of beef cuts (including
a small volume of carcasses) and 16,000 MT of prepared products. Post projects that Australia will
cede seven percentage points of market share to the United States in 2016, as the Australian share falls
to 53 percent (378,000 MT) and U.S. share rises to 39 percent
(273,000 MT). As major importers draw down existing reserves, 2016 year-ending stocks are projected
to fall by 12 percent to 162,000 MT.
Total imports1 in the first half of 2016 fell three percent to 328,107 MT, with lower imports of frozen
cuts (down 13 percent to 177,540 MT) more than offsetting an increase in chilled cut volumes (up 11
percent to 150,576 MT). U.S. chilled cut imports surged 53 percent higher in the first half of 2016,
recovering from the substantially lower 2015 levels associated with the West Coast port labor
slowdown. As imports of Australian grain-fed (both short- and long-fed) chilled cuts fell seven percent
(to 82,234 MT) and Japanese beef prices remained high on short supplies, U.S. market share through
June rose six percentage points on relatively solid demand from retail and food service segments (see
Tables 7-A, 7-B and 7-C as well as Note 6). Note 6: Reduced imports of Australian beef jibe with industry data indicating lower Australian slaughter numbers
and continued Australian herd rebuilding efforts in the first half of 2016 (see Table 2). Japan’s total imports of
Australian beef through June 2016 fell 12 percent to 124,996 MT, despite Australia’s continued tariff rate advantage
over U.S. imports (11 percentage points on frozen cuts and 8 percentage points on chilled cuts; U.S. tariff rate is
38.5 percent for both frozen and chilled cuts). Chilled grain-fed cuts were down 10 percent to 42,708 MT; chilled
grass-fed cuts were up four percent to 16,091; frozen grain-fed imports were up seven percent to 22,498 MT; and
frozen grass-fed imports were down 20 percent to 44,791 MT. Note: Data in this”Note” are provided on a shipping
weight basis.
Reflecting previously described food service consumption trends, imports of U.S. frozen plates were
down seven percent (to 54,431 MT) and Australian frozen cow trimmings were down 14 percent (to
67,721 MT) over the first half of 2016.
2017 Market Outlook
Post projects current trends to continue through 2017, with tight supplies of Japanese domestic and
imported Australian beef expanding opportunities for U.S. beef in the Japanese market. While total
beef consumption remains unchanged at 1.20 million MT, Post forecasts total imports to grow by two
percent in 2017 to 730,000 MT, as increased imports from the United States and others continue to fill
the supply gap created by shortfalls of imported Australian and Japanese domestic beef.
Japanese slaughter and production are projected to follow recent downward trends, falling to 1.075
million head (or total beef production of 460,000 MT) on slightly lower calf crops in 2014 – 2015 (see
Note 7). U.S. beef supplies are projected to continue to grow through 2017, as Australian production
1 Total imports include chilled and frozen cuts, as well as a very small volume of bone-in carcasses.

falls further from 2016 levels (see Note 8 and 9). In the face of relatively flat Japanese beef
consumption, Post projects that the United States will continue to gain market share in 2017.
On sustained solid retail and food service demand for U.S. chilled cuts and static demand for imported
frozen cuts through 2017, Post projects year-ending stocks to fall further in 2017 to 149,000 MT (down
eight percent). Note 7: Marginally higher Wagyu cow retention in the 2016 year-beginning cattle inventory and continued decline
of the Japanese dairy herd, which provides breedstock for F-1 cattle, highlight the challenges of rebuilding the
Japanese beef cattle herd amid continued declines in the number of operations as cattle farmers exit the industry
without successors.
Note 8: The latest USDA Meat PS&D forecast projects U.S. total beef production to increase five percent in 2016 to
24,945 million lbs. and an additional three percent in 2017 to 25,785 million lbs.
Note 9: Australian industry forecasts project total Australian cattle slaughter to fall 17 percent in 2016 to 8.03
million head and another five percent in 2017 to 7.625 million head, as a herd rebuilding cycle takes hold in 2017 –
2018.
Pork
2016 Market Situation Summary and Outlook
Swine Numbers Fall, but Slaughter, Production Climb as PEDv Impacts Fade
The 2016 year-beginning national swine inventory data confirms the continuing consolidation of
Japanese swine production and the downward trend in overall swine production. Between 2014 and
2016, total swine farm numbers fell by eight percent (to 4,830 farms) as small- and medium-scale
operators exited the industry without successors. Over that same period, total swine numbers fell two
percent to 9.313 million head as the average swine farm size grew seven percent, rising to 1,928 head.
While the continuing effects of porcine epidemic diarrhea virus (PEDv) were evident in lower year-
beginning breeding stock numbers (sows down five percent to 844,700 head, and breeding males down
10 percent to 42,600 head), significantly larger feeder piglet numbers (up 17 percent from 2014 to
692,500 head) indicate that the worst effects of PEDv are over and support the observed recovery of hog
slaughter in the first half of 2016.
Note 10: Japan did not collect national swine inventory data in 2015, due to the national Agricultural Census (taken
every five years). Post estimated 2015 live swine numbers (reported in the PS&D table above) on the assumption of
reduced sow beginning stocks and smaller pig crops (due to peak PEDv impacts during 2014) and continued exit of
small scale operators (see Table 10-B).
As noted in Post’s March 2016 Livestock Semi-Annual Report (see JA6003) Japan’s reported cases of
PEDv and subsequent piglet losses peaked in the fall of 2014 and have fallen significantly since then.
According to the latest MAFF data, reported cases and swine lost to PEDv continued to decline in 2016,
while sporadic cases persist. From September 2015 to
July 4, 2016, there were 105 reported cases of PEDv in 16 prefectures, in which 21,733 head of out of
89,747 total infected animals died.

Japan’s hog slaughter rose three percent to 8.142 million head (representing total production of 638,678
MT, also up three percent) in the first six months of 2016, as the effective recovery from the worst
impacts of PEDv began in the fourth quarter of 2015. Post forecasts a slight increase in hog slaughter in
the second half of 2016, as flat growth in fourth quarter year-on-year numbers counter anticipated third
quarter expansion. Post projects 2016 total hog slaughter to climb two percent to 16.4 million head (or
1.28 million MT of total production) on higher year-beginning feeder piglet numbers and continued
moderation of feed grain price pressures.
Consumption Rises Slightly as Imported Chilled Cuts Gain Ground
Post projects 2016 total pork consumption to increase slightly from 2015 to 2.59 million MT, as ample
global supplies of chilled and frozen pork suppress upward price pressures improving pork’s
competitiveness for consumer protein spending. Accordingly, year-ending stocks are forecast to remain
roughly flat at 203,000 MT.
Industry sources indicate that relatively higher domestic pork prices in the second quarter contributed to
increased handling of imported chilled cuts at retail outlets, driving household pork consumption
moderately higher in the first half of 2016 (see Note 11, and see Table 1 and Table 5-A, 5-B and 5-C).
Food service and institutional operators serving pork dishes (such as pork cutlets) are also driving
growth in imported chilled cut utilization (rather than domestic and imported frozen cuts) in 2016 (see
Note 12).
Note 11: The latest MAFF estimates of pork utilization by market segment were: households – 48 percent;
processing – 28 percent; food service and institutional – 24 percent. Note12: ALIC data indicate that the total volume of pork distributed in commerce in the first half of 2016 rose two
percent to 1.105 million MT, of which imported pork was up 8 percent to 575,444 MT and domestic pork was up
one percent to 529,314 MT.
EU Dominates Trade in Frozen Cuts, North America Recovers Chilled Market Volumes
Post projects Japan’s 2016 total pork imports to rise by five percent to 1.32 million MT, with pork cuts
(including a small volume of carcasses) at 1.079 million MT and 241,000 MT of prepared products.
Total imports2 recovered in the first half of 2016, rising up 13 percent to 557,436 MT, with chilled cuts
surging (up 20 percent to 228,120 MT) and frozen cuts rebounding smartly
(up eight percent to 329,315 MT). Trade data suggest a relatively strong demand for imported chilled
cuts, with imports of U.S. chilled cuts through June 2016 expanding 25 percent, regaining market share
lost to the effects of the West Coast port labor slowdown. Imported chilled cuts from Canada, which
made considerable inroads during the first half of 2015, increased by another 17 percent to 86,026 MT
(See Table 8-A, 8-B).
Higher imports of frozen cuts through June 2016 were largely driven by Japanese processors’ stock
replenishment efforts (following a significant drawdown in 2015), rather than strong demand for
2 Total imports include chilled and frozen cuts, as well as a very small volume of bone-in carcasses.

processed products. Imports of frozen cuts from EU suppliers surged up 31 percent to 209,670 MT,
adding an additional 10 percentage points of market share in the first half of 2016 to reach a dominant
64 percent share (see Table 8C). U.S. frozen cut exports plummeted (down 45 percent to 33,112 MT)
alongside Canadian exports (down 15 percent to 26,372 MT). Continued high production levels in
major EU pork suppliers and continued Russian bans on imports of EU pork have significantly
expanded exportable supplies of EU pork. According to trade sources, a number of Japanese processors
began expanding frozen raw material imports from EU suppliers at the expense of U.S. suppliers in
2014, following North American PEDv outbreaks and associated higher prices.
Imports of prepared pork products (including seasoned ground pork from North America and other
cooked product, such as ready-to-eat dumplings from China) fell to 12,644 MT, down slightly from a
year ago (see Table 8-D).
Note 12: Japanese industry data does not indicate increased utilization of frozen cuts in Japan’s meat processing
sector. For January – May 2016, use of imported raw material pork by meat processors fell
five percent to 112,694 MT (product weight basis), while domestic pork for processing was up five percent to
30,367 MT. Over that same period, the total volume of processed meat products (including hams, sausages, and
bacon) manufactured was up only slightly from the previous year. While a World Health Organization (WHO)
report on cancer risks associated with processed meat product consumption was widely covered by Japanese media
in summer 2015, household consumption of processed meat products has been sluggish for years.
According to trade sources, the high pace of import growth through June 2016, especially of chilled
cuts, is expected to slow down in the second half. A seasonal increase in the supply of domestic
Japanese pork in retail outlets in the third quarter will mitigate the pricing differential between Japanese
and imported cuts, reducing the flow of North American chilled cuts (see Note 13). Imports of frozen
raw material cuts should also abate in the second half of 2016, as Japanese processors conclude stock
replenishment activities following robust imports of frozen cuts from EU sources and as Japanese
consumption of processed pork products remains flat.
Note 13: Japan’s hog slaughter typically peaks in the fall and winter months following a summer production
trough.
2017 Outlook
The continued collapse of small- and medium-scale swine farms as aging operators exit the industry
without successors could mitigate prospects for production recovery in the Japanese swine industry in
2017. Even assuming slightly higher 2017 year-beginning sow stocks, year-beginning feeder piglet
inventories could effectively limit annual slaughter potential in 2017. Post projects Japan’s total hog
slaughter to fall slightly in 2017 to around 16.250 million head (or 1.265 million MT of total
production).
Assuming continued tight overall beef supplies and relatively higher beef prices as well as continued
competition from ample poultry supplies, Post predicts Japan’s total pork consumption in 2017 to
remain roughly unchanged from 2016 at 2.585 million MT. Post anticipates that market forces
affecting retail, food service, institutional, and processing market segments will remain unchanged in
2017.
Post projects Japan’s 2017 total pork imports to remain unchanged from the projected 2016 level at
1.320 million MT, with chilled cuts (almost exclusively supplied by the United States) and frozen cuts
(EU suppliers continuing to control a sizable market share) comprising similar shares as in 2016 (see
Note 14). Note 14: Recovering from the devastating impacts of PEDv in North America, U.S. pork production is forecast to
sustain a modest recovery in 2016 – 2017, which should assure a stable supply of chilled cuts to the Japanese
market. According to latest EU data, EU producers are expected to sustain high volumes of production and of
exports to the Asian region through 2017. Should Chinese domestic production recover in 2017, even greater
volumes of EU pork could be present in the Asian market, providing additional downward pressure on prices in the
Japanese market for imported frozen cuts.

Supplemental Tables:
Table 1: Average Expenditures and Quantities Purchased of Selected Commodities per Household (Two or more
persons per household)
Beef Pork Chicken
Expenditure (JP
Yen) Quantity
(Grams) Expenditure (JP
Yen) Quantity
(Grams) Expenditure (JP
Yen) Quantity
(Grams) 2011 18,597 6,782 24,740 18,989 12,802 13,705 2012 18,173 6,765 23,771 18,770 12,769 14,614
% Chg. -2% 0% -4% -1% 0% 7% 2013 19,559 6,894 24,989 19,460 13,260 15,133
% Chg. 8% 2% 5% 4% 4% 4% 2014 21,120 6,584 27,622 19,288 14,527 15,491
% Chg. 8% -4% 11% -1% 10% 2% 2015 21,125 6,208 29,713 19,869 15,307 15,691
% Chg. 0% -6% 8% 3% 5% 1%
Beef Pork Chicken
Expenditure (JP
Yen) Quantity
(Grams) Expenditure (JP
Yen) Quantity
(Grams) Expenditure (JP
Yen) Quantity
(Grams) Jan. 1,843 4% 515 -4% 2,575 6% 1,739 8% 1,336 8% 1,335 6% Feb. 1,650 11% 503 6% 2,492 5% 1,684 7% 1,292 5% 1,310 2% Mar. 1,737 8% 523 8% 2,474 -1% 1,779 7% 1,302 1% 1,433 7% Apr. 1,733 6% 527 9% 2,404 -2% 1,689 2% 1,226 -5% 1,303 -1% May 1,839 3% 517 -9% 2,425 -1% 1,651 1% 1,253 1% 1,331 5% Jun. 1,648 7% 503 3% 2,317 -6% 1,657 0% 1,154 -5% 1,326 3% 2016 YTD 10,450 3,088 14,687 10,199 7,563 8,038 % Chg. (1st Half
2016/15) 6% 2% 0% 4% 1% 4% Source: Ministry of Internal Affairs and Communication Bureau
Ground Meat Ham Sausage
Expenditure (JP
Yen) Quantity
(Grams) Expenditure (JP
Yen) Quantity
(Grams) Expenditure (JP
Yen) Quantity
(Grams) 2011 1,982 1,892 5,634 3,025 7,099 5,400 2012 1,920 1,860 5,626 3,059 7,076 5,466
% Chg. -3% -2% 0% 1% 0% 1% 2013 1,952 1,848 5,630 3,007 7,211 5,524
% Chg. -3% -2% 0% 1% 0% 1% 2014 2,256 1,912 5,833 2,891 7,467 5,371
% Chg. 16% 3% 4% -4% 4% -3% 2015 2,430 1,871 5,807 2,863 7,189 5,132
% Chg. 8% -2% 0% -1% -4% -4%
Ground Meat Ham Sausage
Expenditure (JP
Yen) Quantity
(Grams) Expenditure (JP
Yen) Quantity
(Grams) Expenditure (JP
Yen) Quantity
(Grams) Jan. 199 8% 157 3% 356 8% 177 0% 559 -2% 395 1% Feb. 205 6% 159 7% 315 -2% 156 -4% 583 0% 414 5% Mar. 218 11% 167 14% 346 -4% 185 4% 616 -3% 428 -3% Apr. 216 4% 162 -1% 361 -7% 173 -13% 620 -5% 441 -1% May 220 6% 176 11% 415 -6% 208 -5% 662 2% 464 5% Jun. 212 -1% 157 -4% 484 -1% 256 6% 595 -4% 430 -2% 2016 YTD 1,270 978 2,277 1,155 3,635 2,572 % Chg.
(1st Half 2016/15) 6% 5% -2% -2% -2% 1% Source: Ministry of Internal Affairs and Communication Bureau

Bacon Yakitori Cutlet
Expenditure (JP
Yen) Quantity
(Grams) Expenditure (JP
Yen) Quantity
(Grams) Expenditure (JP
Yen) Quantity
(Grams) 2011 2,429 1,489 1,896 1,548
2012 2,398 1,470 1,952 1,587
% Chg. -1% -1% 3% 2%
2013 2,417 1,476 1,911 1,603
% Chg. -1% -1% 3% 2%
2014 2,601 1,479 2,012 1,746
% Chg. 8% 0% 5% 9%
2015 2,655 1,481 2,157 1,870
% Chg. 6% 5% -2% -2%
Bacon Yakitori Cutlet
Expenditure (JP
Yen) Quantity
(Grams) Expenditure (JP
Yen) Quantity
(Grams) Expenditure (JP
Yen) Quantity
(Grams) Jan. 184 -6% 104 -10% 146 -1% 171 23%
Feb. 210 0% 113 -4% 156 8% 156 7%
Mar. 223 -7% 129 -1% 168 -8% 179 10%
Apr. 218 -6% 126 0% 162 -7% 177 9%
May 228 -5% 128 -1% 170 -10% 204 26%
Jun. 224 -5% 128 -5% 175 8% 154 1%
2016 YTD 1,287 728 977
1,041
% Chg. (1st Half
2016/2015) -5% -3% -2%
13% Source: Ministry of Internal Affairs and Communication Bureau
Table 2: Australian Beef Exports to Japan Unit: Metric Ton (Shipped Weight Basis)
Calendar Year 2013 2014 2015 2015 2015 2016
Jan/Dec Jan/Dec Jan/Dec % Chg. Share Jan. - Jun. Jan. - Jun. % Chg. Chilled Beef 115,766 126,987 127,633 1% 100% 63,066 58,799 -7%
Grass 39,668 37,762 32,617 -14% 26% 15,499 16,091 4% Grain fed 76,098 89,225 95,016 6% 74% 47,567 42,708 -10%
Frozen Beef 173,028 166,792 157,590 -6% 100% 78,749 66,197 -16% Grass 132,744 125,371 112,922 -10% 72% 55,800 44,791 -20%
Grain fed 40,284 41,421 44,668 8% 28% 21,406 22,948 7% TOTAL 288,795 293,779 285,223 -3% 100% 141,815 124,996 -12%
Grass 172,412 163,133 145,540 -11% 51% 71,300 60,822 -15% Grain fed 116,382 130,646 139,684 7% 49% 70,515 64,114 -9%
Source: Meat Livestock Australia (Compiled by Post)

Table 3-A: Beef Safeguard Monitor Table 1-a. Safeguard Trigger Levels for All Trade Partners for JFY 2016 and Actual Imports Year to Date
Unit: Metric Ton (Customs Clearances Basis)
Chilled Beef Trigger Levels after Adjustments per EPA with Australia Cum. Total
Actual Entry April May June I (Apr. - Jun.) 74,339 61,724 20,867 19,640 21,217
July August September
I - II (Apr. - Sept.) 152,456
October November December
II - III (Apr. - Dec.) 230,642
January February March
III - IV (Apr. - Mar.) 292,355
Frozen Beef Trigger Levels after Adjustments per EPA with Australia Cum. Total
Actual Entry April May June I (Apr. - Jun.) 100,130 76,187 31,287 26,728 18,172
July August September
I - II (Apr. - Sept.) 189,644
October November December
II - III (Apr. - Dec.) 267,962
January February March
III - IV (Apr. - Mar.) 327,195 Source: Ministry of Finance Table 1-b. Safeguard Trigger Levels for All Trade Partners for JFY 2015 and Actual Imports
Unit: Metric Ton (Customs Clearances Basis)
Chilled Beef Trigger Levels after Adjustments per EPA with Australia Cum. Total
Actual Entry April May June I (Apr. - Jun.) 74,339 53,594 20,355 15,904 17,335
July August September I - II (Apr. - Sept.) 152,456 105,275 17,909 16,730 17,042
October November December II - III (Apr. - Dec.) 230,642 161,411 18,975 18,388 18,773
January February March III - IV (Apr. - Mar.) 292,355 208,865 14,182 14,499 18,773
Frozen Beef Trigger Levels after Adjustments per EPA with Australia Cum. Total
Actual Entry April May June I (Apr. - Jun.) 87,702 85,581 37,535 26,252 21,794
July August September I - II (Apr. - Sept.) 201,317 162,088 28,498 18,974 29,035
October November December II - III (Apr. - Dec.) 279,407 229,027 22,480 26,306 18,153
January February March III - IV (Apr. - Mar.) 349,947 279,653 13,214 18,388 19,024 Source: Ministry of Finance
Table 2-a. Safeguard Trigger Levels for Trade Partners with EPA for JFY 2016 and Actual Imports Year to Date Unit: Metric Ton (Customs Clearances Basis)
Chilled Beef Trigger Level Outside SSG* per EPAs Cum. Total
Actual Entry April May June I (Apr. - Jun.) 20,743 28,221 9,074 9,043 10,104
July August September
I - II (Apr. - Sept.) 45,068 October November December
II - III (Apr. - Dec.) 70,307
January February March
III - IV (Apr. - Mar.) 93,372
Frozen Beef Trigger Level Outside SSG* per EPAs Cum. Total
Actual Entry April May June I (Apr. - Jun.) 31,952 30,314 10,929 11,411 7,974
July August September
I - II (Apr. - Sept.) 71,208
October November December
II - III (Apr. - Dec.) 102,490 January February March
III - IV (Apr. - Mar.) 129,501
Source: Ministry of Finance
Table 2-b. Safeguard Trigger Levels for Trade Partners with EPA for JFY 2015 and Actual Imports
Unit: Metric Ton (Customs Clearances Basis) Chilled Beef Trigger Level Outside SSG* per EPAs Cum. Total
Actual Entry April May June I (Apr. - Jun.) 28,554 17,737 6,648 5,527 5,562
July August September I - II (Apr. - Sept.) 58,844 38,532 7,608 6,233 6,954
October November December II - III (Apr. - Dec.) 84,558 60,105 7,733 6,587 7,253
January February March III - IV (Apr. - Mar.) 101,109 79,818 6,166 5,971 7,576
Frozen Beef Trigger Level Outside SSG* per EPAs Cum. Total
Actual Entry April May June I (Apr. - Jun.) 37,776 27,309 9,222 10,609 7,478
July August September I - II (Apr. - Sept.) 90,752 60,861 10,516 8,231 14,805
October November December II - III (Apr. - Dec.) 126,644 87,597 7,440 11,398 7,898
January February March III - IV (Apr. - Mar.) 161,592 110,684 4,262 6,993 11,832 Source: Ministry of Finance
Table 3-a: Safeguard Trigger for Australian Beef Under EPA for JFY 2016 and Actual Imports Year to Date Unit: Metric Ton (Customs Clearances Basis)
Annual SG 133,300 Cum. Total
Actual Entry April May June
33,090 11,771 10,390 10,929
July August September
October November December
January February March
Unit: Metric Ton (Customs Clearances Basis)
Annual SG 198,300
Cum. Total
Actual Entry April May June
44,795 20,355 14,833 9,607
July August September
October November December
January February March
Source: Ministry of Finance
Table 3-b: Safeguard Trigger for Australian Beef Under EPA for JFY 2015 and Actual Imports
Unit: Metric Ton (Customs Clearances Basis)
Australian Annual SG 131,700
Cum. Total Actual Entry April May June
38,460 16,747 10,226 11,487
July August September 69,023 10,191 10,373 9,999
October November December 102,998 11,058 11,612 11,305
January February March 128,673 7,718 8,459 9,498
Source: Ministry of Finance
Unit: Metric Ton (Customs Clearances Basis)
Australian Annual SG 196,700
Cum. Total Actual Entry April May June
57,496 28,315 15,353 13,828
July August September 98,097 17,007 9,966 13,628
October November December 136,608 14,224 14,392 9,895
January February March 162,708 8,374 10,880 6,846
Source: Ministry of Finance

Note: With the January 15, 2015 implementation of the Japan-Australia Economic Partnership Agreement (JAEPA), Japan
adjusted the beef safeguard trigger mechanism, such that the beef safeguard is triggered only if the following two conditions
are met:
1. When cumulative quarterly imports for chilled and for frozen beef (each calculated separately) from the world
exceed 117 percent of the previous year’s imports (Table 3-A, Table 1-a, 1-b), AND
2. When cumulative quarterly imports for chilled and for frozen beef (each calculated separately) from all non-EPA
partner countries (i.e., imports from the United States, Canada and New Zealand plus imports from EPA partner
countries in excess of EPA beef TRQ limits) exceed 117 percent of the previous year’s imports (see Table 3-A,
Table 2-a, 2-b) Exceeding the trigger level for only one of the above conditions will not trigger the beef safeguard.
In the event that the trigger levels for both conditions are exceeded, then the import duty for non-EPA trade partners would
revert to 50 percent (from the current 38.5 percent), while the import duty for EPA trade partners would climb to 38.5
percent. Prior to this adjustment, the so-called special safeguard (SSG) trigger level was calculated from imports from all
trade partners, as in Tables 1-a and 1-b. Tables 3-a and 3-b represent annual safeguard monitoring results for Australian beef under JAEPA and the table below
represents the tariff reduction and safeguard trigger levels for Australian beef under the JAEPA. Tariff reductions for
Australian chilled and frozen beef were substantially front-loaded in the first two years of the agreement, after which annual
tariff reductions will slow considerably (roughly 0.6 percent per annum for chilled beef; roughly 0.3 percent per annum for
frozen beef from years 3-12 and 0.9 percent per annum for years 13-18).
Tariff Reduction Schedule Remarks
Frozen
Beef
JFY (April -
March) JFY
2014 JFY
2015 JFY
2016 JFY
2017 5 10 11-
17 18 (50% reduction after
18 Years)
Tariff Rate 38.5%
(Bound Rate)
30.5 28.5 27.5 27.2 26.9 25.6 ~ 19.5
Safeguard
Trigger Level
(1,000 Metric Ton) 195 196.7 210
The level to be re-
negotiated after 10 years.
Chilled
Beef
JFY
(April -
March) JFY
2014 JFY
2015 JFY
2016 4 5 10 11-
14 15
Tariff Rate 38.5% (Bound
Rate) 32.5 31.5 30.5 29.9 29.3 26.4 ~ 23.5 (40% reduction after
15 years) Safeguard
Trigger Level (1,000 Metric
Ton) 130 131.7 145
The level to be re-negotiated after 10
years. Source: MAFF Meat and Egg Division

Table 3-B: Pork Safeguard Monitor Pork Safeguard Trigger Levels for JFY 2016 and Actual Imports Year to Date
Unit: Metric Ton (Customs Clearance Basis)
Trigger Level Cum. Total
Quarterly Cum. Actual Entry April May June I (Apr. - Jun.) 214,698 196,265 69,109 59,871 67,285
July August September I - II (Apr. - Sept.) 433,353 196,265
October November December I - III (Apr. - Dec.) 650,670 196,265
January February March I - IV (Apr. - Mar.) 851,582 196,265
Source: Ministry of Finance Pork Safeguard Trigger Levels for JFY 2015 and Actual Imports
Unit: Metric Ton (Customs Clearance Basis)
Trigger Level Cum. Total
Quarterly Cum. Actual Entry April May June I (Apr. - Jun.) 208,347 186,057 66,568 61,508 57,981
July August September I - II (Apr. - Sept.) 428,549 368,195 65,689 58,544 57,905
October November December I - III (Apr. - Dec.) 642,955 554,598 67,631 58,475 60,297
January February March I - IV (Apr. - Mar.) 834,987 740,952 65,049 56,757 64,548 Source: Ministry of Finance
Table 4-A: Average Wholesale Domestic Beef Carcass Prices, Tokyo Market Unit: Yen/Kg.
WAGYU STEER A-3 GRADE Year/Quarter 1st Qtr. 2nd Qtr. 3rd Qtr. 4th Qtr. Yearly Avg.
2012 1,292 1,440 1,431 1,619 1,446 2013 1,608 1,729 1,705 1,821 1,716
% Chg. 24% 20% 19% 12% 19% 2014 1,645 1,687 1,739 1,965 1,759
% Chg. 2% -2% 2% 8% 3% 2015 2,106 2,148 2,185 2,436 2,219
% Chg. 28% 27% 26% 24% 26%
2016 2,520 2,519
% Chg. 20% 17% WAGYU STEER A-2 GRADE
Year/Quarter 1st Qtr. 2nd Qtr. 3rd Qtr. 4th Qtr. Yearly Avg. 2012 1,042 1,257 1,255 1,446 1,250 2013 1,453 1,579 1,552 1,646 1,557
% Chg. 39% 26% 24% 14% 25% 2014 1,486 1,538 1,578 1,821 1,606
% Chg. 2% -3% 2% 11% 3% 2015 1,944 1,992 2,003 2,271 2,052
% Chg. 31% 29% 27% 25% 28%
2016 2,380 2,375
% Chg. 22% 19%

Unit: Yen/Kg.
WAGYU Heifer A-3 GRADE Year/Quarter 1st Qtr. 2nd Qtr. 3rd Qtr. 4th Qtr. Yearly Avg.
2012 1,250 1,390 1,445 1,618 1,426 2013 1,590 1,696 1,687 1,788 1,690
% Chg. 27% 22% 17% 11% 19% 2014 1,647 1,670 1,696 1,927 1,735
% Chg. 4% -2% 1% 8% 3% 2015 2,487 2,084 2,133 2,380 2,159
% Chg. 51% 25% 26% 24% 24%
2016 2,439 2,466
% Chg. -2% 18% Holstein Steer B-2 Grade
Year/Quarter 1st Qtr. 2nd Qtr. 3rd Qtr. 4th Qtr. Yearly Avg. 2012 380 590 591 661 555 2013 716 768 773 813 767
% Chg. 89% 30% 31% 23% 38% 2014 782 821 803 884 822
% Chg. 9% 7% 4% 9% 7% 2015 990 1,102 1,098 1,109 1,075
% Chg. 27% 34% 37% 26% 31%
2016 1,066 1,072
% Chg. 8% -3% Holstein Cow C-2 GRADE
Year/Quarter 1st Qtr. 2nd Qtr. 3rd Qtr. 4th Qtr. Yearly Avg. 2012 232 366 349 316 316 2013 378 486 538 536 484
% Chg. 63% 33% 54% 69% 53% 2014 534 604 649 650 609
% Chg. 41% 24% 21% 21% 26% 2015 687 817 788 780 768
% Chg. 29% 35% 21% 20% 26%
2016 736 751
% Chg. 7% -8% F1 Cross Breed Heifer B-3 GRADE
Year/Quarter 1st Qtr. 2nd Qtr. 3rd Qtr. 4th Qtr. Yearly Avg. 2012 847 1,043 1,050 1,129 1,017 2013 1,084 1,177 1,209 1,283 1,188
% Chg. 28% 13% 15% 14% 17% 2014 1,155 1,196 1,218 1,351 1,230
% Chg. 7% 2% 1% 5% 4% 2015 1,465 1,602 1,611 1,688 1,592
% Chg. 27% 34% 32% 25% 29%
2016 1,643 1,666
% Chg. 12% 4% F1 Cross Breed Heifer B-2 GRADE
Year/Quarter 1st Qtr. 2nd Qtr. 3rd Qtr. 4th Qtr. Yearly Avg. 2012 676 917 927 979 875 2013 970 1,081 1,090 1,176 1,079
% Chg. 43% 18% 18% 20% 23% 2014 1,027 1,066 1,088 1,230 1,103
% Chg. 6% -1% -0% 5% 2% 2015 1,485 1,508 1,469 1,525 1,466
% Chg. 45% 42% 35% 24% 33%
2016 1,486 1,518
% Chg. 0% 1%
Unit: Yen/Kg.
F1 Cross Breed Steer B-3 GRADE Year/Quarter 1st Qtr. 2nd Qtr. 3rd Qtr. 4th Qtr. Yearly Avg.
2012 931 1,068 1,089 1,157 1,061 2013 1,116 1,206 1,256 1,328 1,226
% Chg. 20% 13% 15% 15% 16% 2014 1,205 1,240 1,260 1,404 1,277
% Chg. 8% 3% 0% 6% 4% 2015 1,499 1,644 1,652 1,747 1,636
% Chg. 24% 33% 31% 24% 28%
2016 1,629 1,706
% Chg. 9% 4% F1 Cross Breed Steer B-2 GRADE
Year/Quarter 1st Qtr. 2nd Qtr. 3rd Qtr. 4th Qtr. Yearly Avg. 2012 747 960 964 1,026 924 2013 1,000 1,100 1,139 1,207 1,112
% Chg. 34% 15% 18% 18% 20% 2014 1,073 1,120 1,121 1,282 1,149
% Chg. 7% 2% -2% 6% 3% 2015 1,404 1,549 1,509 1,669 1,533
% Chg. 31% 38% 35% 30% 33%
2016 1,434 1,555
% Chg. 2% 0% Source: ALIC Monthly (Quarterly average price is compiled by Post based on ALIC Monthly)
Table 4-B: Average Wholesale Price of Imported Beef, Australia, Short Grain Fed, Chilled Cuts
Australian Beef, Short Grain Fed, Chilled Cuts Unit: JP Yen/Kg.
Full-set, Chilled, Short Fed Year/Quarter 1st Qtr. 2nd Qtr. 3rd Qtr. 4th Qtr. Yearly Avg.
2011 842 803 758 772 794 2012 797 863 813 814 822
% Chg. -5% 8% 7% 5% 4% 2013 923 956 931 962 943
% Chg. 16% 11% 14% 18% 15% 2014 985 998 1,090 1,172 1,061
% Chg. 7% 4% 17% 22% 13% 2015 1,234 1,211 1,177 1,223 1,211
% Chg. 25% 21% 8% 4% 14%
2016 1,179 1,130
% Chg. -4% -7% Chuck Roll, Chilled, Short Fed
Year/Quarter 1st Qtr. 2nd Qtr. 3rd Qtr. 4th Qtr. Yearly Avg. 2011 787 725 687 718 730 2012 713 725 711 745 724
% Chg. -5% 8% 7% 5% 4% 2013 820 859 833 894 852
% Chg. 15% 19% 17% 20% 18% 2014 904 934 1,031 1,058 982
% Chg. 10% 9% 24% 18% 15% 2015 1,186 1,204 1,200 1,227 1,204
% Chg. 31% 29% 16% 16% 23%
2016 1,188 1,223
% Chg. 0% 2%

Unit: Yen/Kg.
Point-end Brisket, Chilled, Short Fed Year/Quarter 1st Qtr. 2nd Qtr. 3rd Qtr. 4th Qtr. Yearly Avg.
2011 662 612 577 596 612 2012 586 614 584 625 602
% Chg. -5% 8% 7% 5% 4% 2013 693 709 688 740 708
% Chg. 18% 16% 18% 18% 18% 2014 800 782 858 956 849
% Chg. 15% 10% 25% 29% 20% 2015 986 982 948 961 969
% Chg. 23% 26% 10% 0% 14%
2016 892 854
% Chg. -9% -13% Navel-end Brisket, Chilled, Short Fed
Year/Quarter 1st Qtr. 2nd Qtr. 3rd Qtr. 4th Qtr. Yearly Avg. 2011 640 635 581 559 604 2012 580 707 689 635 653
% Chg. -5% 8% 7% 5% 4% 2013 676 691 697 711 694
% Chg. 17% -2% 1% 12% 6% 2014 757 792 873 963 846
% Chg. 12% 15% 25% 36% 22% 2015 989 939 854 814 899
% Chg. 31% 19% -2% -15% 6%
2016 811 754
% Chg. -18% -20% Cube Roll, Chilled, Short Fed
Year/Quarter 1st Qtr. 2nd Qtr. 3rd Qtr. 4th Qtr. Yearly Avg. 2011 1,717 1,740 1,770 1,798 1,756 2012 1,852 1,988 1,973 1,873 1,921
% Chg. -5% 8% 7% 5% 4% 2013 1,948 2,089 2,133 2,104 2,069
% Chg. 5% 5% 8% 12% 8% 2014 2,122 2,181 2,104 2,158 2,141
% Chg. 9% 4% -1% 3% 4% 2015 2,228 2,218 2,283 2,490 2,305
% Chg. 5% 2% 9% 15% 8%
2016 2,557 2,478
% Chg. 15% 12% Strip Loin, Chilled, Short Fed
Year/Quarter 1st Qtr. 2nd Qtr. 3rd Qtr. 4th Qtr. Yearly Avg. 2011 1,398 1,355 1,314 1,242 1,327 2012 1,336 1,602 1,439 1,377 1,438
% Chg. -5% 8% 7% 5% 4% 2013 1,616 1,681 1,591 1,520 1,602
% Chg. 21% 5% 11% 10% 11% 2014 1,516 1,545 1,711 1,701 1,618
% Chg. -6% -8% 8% 12% 1% 2015 1,699 1,738 1,885 1,885 1,802
% Chg. 12% 12% 10% 11% 11%
2016 1,919 1,906
% Chg. 13% 10%
Unit: Yen/Kg.
Tender Loin, Chilled, Short Fed Year/Quarter 1st Qtr. 2nd Qtr. 3rd Qtr. 4th Qtr. Yearly Avg.
2011 2,608 2,461 2,340 2,504 2,478 2012 2,661 2,899 2,803 2,752 2,779
% Chg. -5% 8% 7% 5% 4% 2013 2,971 3,151 3,147 3,136 3,101
% Chg. 12% 9% 12% 14% 12% 2014 3,124 3,069 3,056 3,239 3,122
% Chg. 5% -3% -3% 3% 1% 2015 3,284 3,283 3,395 3,673 3,409
% Chg. 5% 7% 11% 13% 9%
2016 3,719 3,635
% Chg. 13% 11% Top Side, Chilled, Short Fed
Year/Quarter 1st Qtr. 2nd Qtr. 3rd Qtr. 4th Qtr. Yearly Avg. 2011 741 644 627 638 663 2012 676 724 662 684 686
% Chg. -9% 12% 6% 7% 4% 2013 775 813 781 849 805
% Chg. 15% 12% 18% 24% 17% 2014 858 856 971 1,013 925
% Chg. 11% 5% 24% 19% 15% 2015 1,029 1,006 1,054 1,069 1,039
% Chg. 20% 17% 9% 5% 12%
2016 1,009 989
% Chg. -2% -2% Source: ALIC Monthly(Quarterly average price is compiled by Post based on ALIC Monthly)
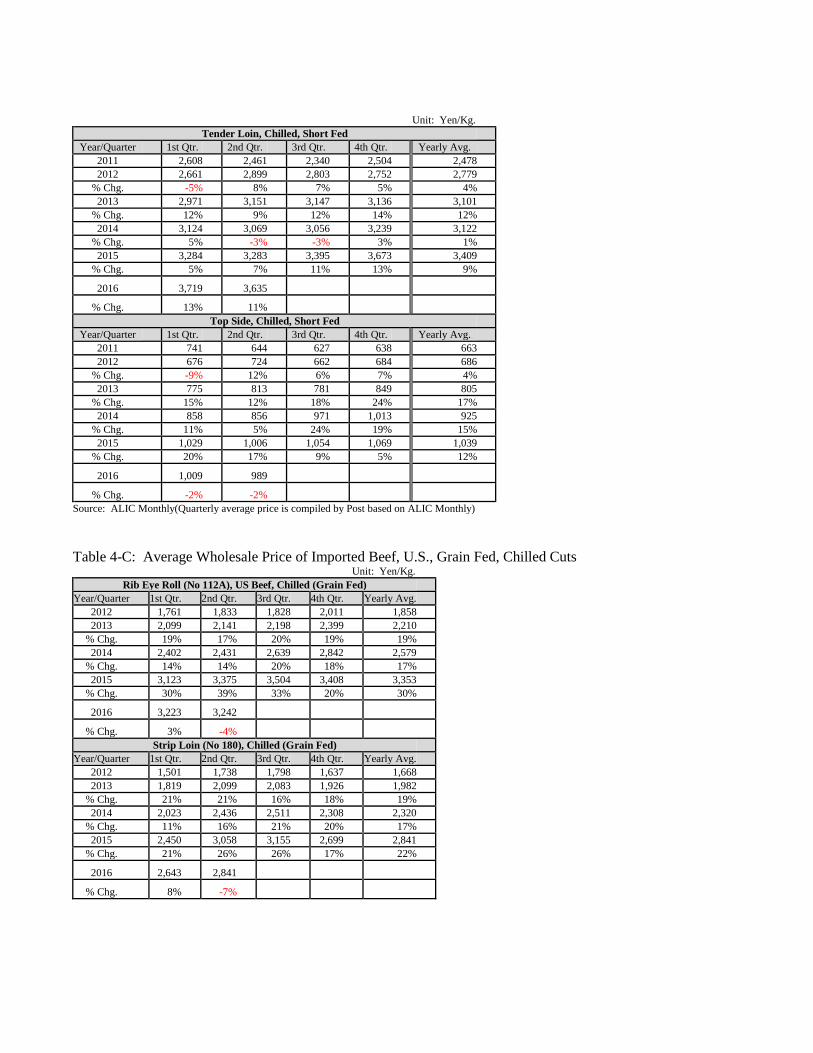
Table 4-C: Average Wholesale Price of Imported Beef, U.S., Grain Fed, Chilled Cuts Unit: Yen/Kg.
Rib Eye Roll (No 112A), US Beef, Chilled (Grain Fed) Year/Quarter 1st Qtr. 2nd Qtr. 3rd Qtr. 4th Qtr. Yearly Avg.
2012 1,761 1,833 1,828 2,011 1,858 2013 2,099 2,141 2,198 2,399 2,210
% Chg. 19% 17% 20% 19% 19% 2014 2,402 2,431 2,639 2,842 2,579
% Chg. 14% 14% 20% 18% 17% 2015 3,123 3,375 3,504 3,408 3,353
% Chg. 30% 39% 33% 20% 30%
2016 3,223 3,242
% Chg. 3% -4% Strip Loin (No 180), Chilled (Grain Fed)
Year/Quarter 1st Qtr. 2nd Qtr. 3rd Qtr. 4th Qtr. Yearly Avg. 2012 1,501 1,738 1,798 1,637 1,668 2013 1,819 2,099 2,083 1,926 1,982
% Chg. 21% 21% 16% 18% 19% 2014 2,023 2,436 2,511 2,308 2,320
% Chg. 11% 16% 21% 20% 17% 2015 2,450 3,058 3,155 2,699 2,841
% Chg. 21% 26% 26% 17% 22%
2016 2,643 2,841
% Chg. 8% -7%

Unit: Yen/Kg.
Full Tender Loin (No. 189A), Chilled (Grain Fed) Year/Quarter 1st Qtr. 2nd Qtr. 3rd Qtr. 4th Qtr. Yearly Avg.
2012 2,590 2,670 2,617 2,883 2,690 2013 3,153 3,094 3,134 3,446 3,207
% Chg. 22% 16% 20% 20% 19% 2014 3,645 3,562 3,619 4,061 3,722
% Chg. 16% 15% 15% 18% 16% 2015 4,133 4,301 4,530 4,799 4,441
% Chg. 13% 21% 25% 18% 19%
2016 4,329 4,171
% Chg. 5% -3% Boneless Short Rib, Chilled (Grain Fed)
Year/Quarter 1st Qtr. 2nd Qtr. 3rd Qtr. 4th Qtr. Yearly Avg. 2012 1,864 1,906 1,831 1,816 1,854 2013 2,172 2,474 2,543 2,677 2,467
% Chg. 17% 30% 39% 47% 33% 2014 2,826 2,939 3,199 3,412 3,094
% Chg. 30% 19% 26% 27% 25% 2015 3,703 3,510 2,643 2,444 3,075
% Chg. 31% 19% -17% -28% -1%
2016 2,698 2,615
% Chg. -27% -25% Hanging Tender, Chilled (Grain Fed)
Year/Quarter 1st Qtr. 2nd Qtr. 3rd Qtr. 4th Qtr. Yearly Avg. 2012 732 843 847 872 824 2013 894 950 963 907 928
% Chg. 22% 13% 14% 4% 13% 2014 938 972 1,095 1,269 1,069
% Chg. 5% 2% 14% 40% 15% 2015 1,359 1,401 1,434 1,389 1,396
% Chg. 45% 44% 31% 9% 31%
2016 1,358 1,365
% Chg. -0% -3% Outside Skirt, Chilled (Grain Fed)
Year/Quarter 1st Qtr. 2nd Qtr. 3rd Qtr. 4th Qtr. Yearly Avg. 2012 1,155 1,407 1,325 1,321 1,302 2013 1,391 1,414 1,333 1,299 1,360
% Chg. 20% 1% 1% -2% 4% 2014 1,341 1,542 1,727 1,808 1,604
% Chg. -4% 9% 30% 39% 18% 2015 1,913 2,022 2,189 2,046 2,042
% Chg. 43% 31% 27% 13% 27%
2016 1,997 2,058
% Chg. 4% 2% Tongue, Chilled (Grain Fed)
Year/Quarter 1st Qtr. 2nd Qtr. 3rd Qtr. 4th Qtr. Yearly Avg. 2012 1,498 1,571 1,547 1,596 1,553 2013 1,579 1,493 1,433 1,402 1,477
% Chg. 5% -5% -7% -12% -5% 2014 1,500 1,568 1,519 1,589 1,544
% Chg. -5% 5% 6% 13% 5% 2015 1,718 1,759 1,811 1,812 1,775
% Chg. 15% 12% 19% 14% 15%
2016 1,835 1,912
% Chg. 7% 9%

Unit: Yen/Kg.
Chuck Eye Role, US Beef, Chilled (Grain Fed) Year/Quarter 1st Qtr. 2nd Qtr. 3rd Qtr. 4th Qtr. Yearly Avg.
2012 788 772 747 840 786 2013 891 904 905 1,016 929
% Chg. 13% 17% 21% 21% 18% 2014 1,093 1,074 1,169 1,297 1,158
% Chg. 23% 19% 29% 28% 25% 2015 1,493 1,406 1,459 1,425 1,446
% Chg. 37% 31% 25% 10% 25%
2016 1,402 1,262
% Chg. -6% -10% Chuck Rib, US Beef, Chilled (Grain Fed)
Year/Quarter 1st Qtr. 2nd Qtr. 3rd Qtr. 4th Qtr. Yearly Avg. 2012 1,133 1,276 1,206 1,160 1,194 2013 1,389 1,596 1,626 1,725 1,584
% Chg. 23% 25% 35% 49% 33% 2014 1,743 1,813 1,899 2,012 1,867
% Chg. 26% 14% 17% 17% 18% 2015 2,319 2,122 1,684 1,549 1,919
% Chg. 33% 17% -11% -23% 3%
2016 1,806 1,823
% Chg. -22% -14% Source: ALIC Monthly(Quarterly average price is compiled by Post based on ALIC Monthly)
Table 4-D: Average Wholesale Price of Imported Beef, Australia, Grass Fed, Frozen Cuts Unit: Yen/Kg.
Navel End Brisket (Short Plate), Frozen Year/Quarter 1st Qtr. 2nd Qtr. 3rd Qtr. 4th Qtr. Yearly Avg.
2011 518 489 463 455 481 2012 480 546 544 510 520
% Chg. -7% 12% 17% 12% 8% 2013 541 590 589 606 581
% Chg. 13% 8% 8% 19% 12% 2014 636 681 827 934 770
% Chg. 18% 15% 41% 54% 32% 2015 782 690 600 581 663
% Chg. 23% 1% -27% -38% -14%
2016 562 593
% Chg. -28% -14% Clod, Frozen
Year/Quarter 1st Qtr. 2nd Qtr. 3rd Qtr. 4th Qtr. Yearly Avg. 2011 610 586 552 551 575 2012 534 543 532 541 538
% Chg. -13% -7% -4% -2% -6% 2013 625 685 639 673 655
% Chg. 17% 26% 20% 24% 22% 2014 710 747 835 917 802
% Chg. 13% 9% 31% 36% 22% 2015 910 874 873 865 881
% Chg. 28% 17% 5% -6% 10%
2016 836 802
% Chg. -8% -8%

Unit: Yen/Kg.
Silver Side, Frozen Year/Quarter 1st Qtr. 2nd Qtr. 3rd Qtr. 4th Qtr. Yearly Avg.
2011 603 586 564 565 579 2012 587 583 556 560 571
% Chg. -3% -1% -1% -1% -1% 2013 609 649 639 676 643
% Chg. 4% 11% 15% 21% 13% 2014 704 749 829 929 803
% Chg. 16% 15% 30% 37% 25% 2015 883 842 853 874 863
% Chg. 25% 12% 3% -6% 7%
2016 830 759
% Chg. -6% -10% Top Side, Frozen
Year/Quarter 1st Qtr. 2nd Qtr. 3rd Qtr. 4th Qtr. Yearly Avg. 2011 662 633 610 613 629 2012 636 642 613 608 625
% Chg. -4% 1% 1% -1% -1% 2013 672 787 753 807 755
% Chg. 6% 23% 23% 33% 21% 2014 840 839 930 955 891
% Chg. 25% 7% 24% 18% 18% 2015 944 941 936 988 952
% Chg. 12% 12% 1% 3% 7%
2016 944 875
% Chg. -0% -7% Trimming, 80 CL, Frozen
Year/Quarter 1st Qtr. 2nd Qtr. 3rd Qtr. 4th Qtr. Yearly Avg. 2011 493 478 449 440 465 2012 452 464 301 448 416
% Chg. -8% -3% -33% 2% -11% 2013 520 559 544 549 543
% Chg. 15% 20% 81% 23% 30% 2014 551 581 746 846 681
% Chg. 6% 4% 37% 54% 25% 2015 757 680 639 610 672
% Chg. 37% 17% -14% -28% -1%
2016 562 585
% Chg. -26% -14% Trimming, Cow 85 CL, Frozen
Year/Quarter 1st Qtr. 2nd Qtr. 3rd Qtr. 4th Qtr. Yearly Avg. 2011 517 505 468 461 488 2012 479 496 458 484 479
% Chg. -7% -2% -2% 5% -2% 2013 572 595 567 571 576
% Chg. 19% 20% 24% 18% 20% 2014 587 638 800 879 726
% Chg. 3% 7% 41% 54% 26% 2015 783 699 702 676 715
% Chg. 33% 10% -12% -23% -1%
2016 613 621
% Chg. -22% -11% Source: ALIC Monthly(Quarterly average price is compiled by Post based on ALIC Monthly)
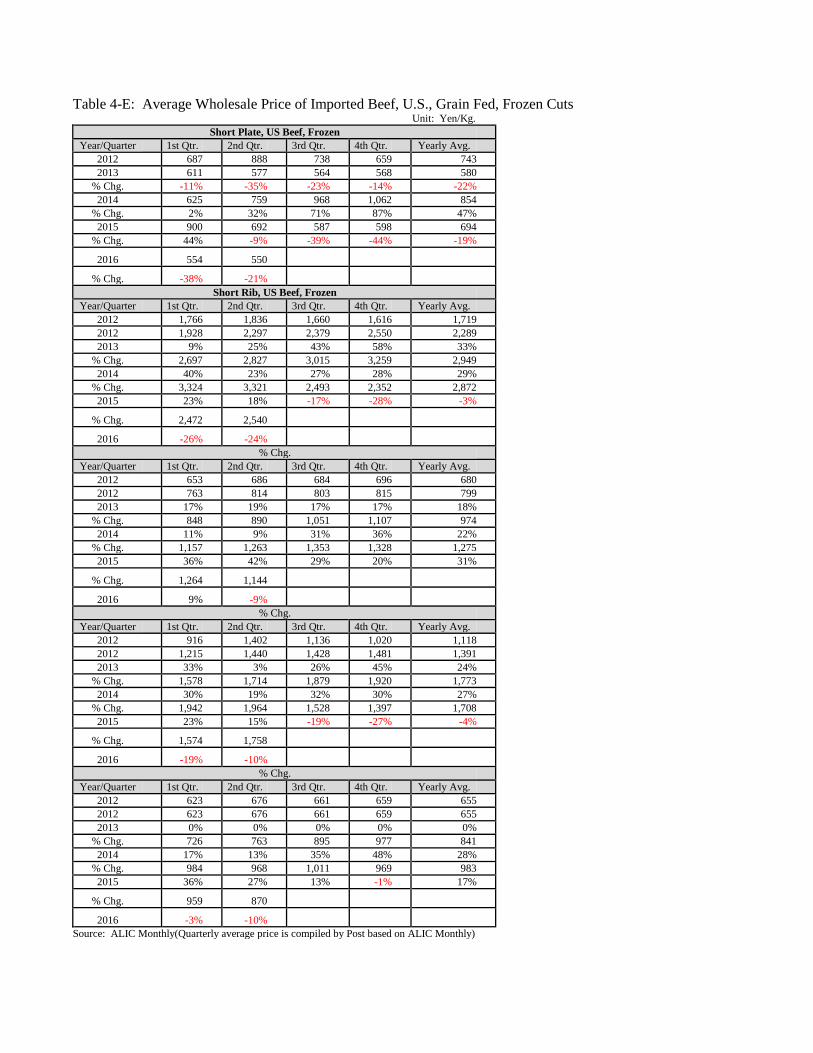
Table 4-E: Average Wholesale Price of Imported Beef, U.S., Grain Fed, Frozen Cuts Unit: Yen/Kg.
Short Plate, US Beef, Frozen Year/Quarter 1st Qtr. 2nd Qtr. 3rd Qtr. 4th Qtr. Yearly Avg.
2012 687 888 738 659 743 2013 611 577 564 568 580
% Chg. -11% -35% -23% -14% -22% 2014 625 759 968 1,062 854
% Chg. 2% 32% 71% 87% 47% 2015 900 692 587 598 694
% Chg. 44% -9% -39% -44% -19%
2016 554 550
% Chg. -38% -21% Short Rib, US Beef, Frozen
Year/Quarter 1st Qtr. 2nd Qtr. 3rd Qtr. 4th Qtr. Yearly Avg. 2012 1,766 1,836 1,660 1,616 1,719 2012 1,928 2,297 2,379 2,550 2,289 2013 9% 25% 43% 58% 33%
% Chg. 2,697 2,827 3,015 3,259 2,949 2014 40% 23% 27% 28% 29%
% Chg. 3,324 3,321 2,493 2,352 2,872 2015 23% 18% -17% -28% -3%
% Chg. 2,472 2,540
2016 -26% -24% % Chg.
Year/Quarter 1st Qtr. 2nd Qtr. 3rd Qtr. 4th Qtr. Yearly Avg. 2012 653 686 684 696 680 2012 763 814 803 815 799 2013 17% 19% 17% 17% 18%
% Chg. 848 890 1,051 1,107 974 2014 11% 9% 31% 36% 22%
% Chg. 1,157 1,263 1,353 1,328 1,275 2015 36% 42% 29% 20% 31%
% Chg. 1,264 1,144
2016 9% -9% % Chg.
Year/Quarter 1st Qtr. 2nd Qtr. 3rd Qtr. 4th Qtr. Yearly Avg. 2012 916 1,402 1,136 1,020 1,118 2012 1,215 1,440 1,428 1,481 1,391 2013 33% 3% 26% 45% 24%
% Chg. 1,578 1,714 1,879 1,920 1,773 2014 30% 19% 32% 30% 27%
% Chg. 1,942 1,964 1,528 1,397 1,708 2015 23% 15% -19% -27% -4%
% Chg. 1,574 1,758
2016 -19% -10% % Chg.
Year/Quarter 1st Qtr. 2nd Qtr. 3rd Qtr. 4th Qtr. Yearly Avg. 2012 623 676 661 659 655 2012 623 676 661 659 655 2013 0% 0% 0% 0% 0%
% Chg. 726 763 895 977 841 2014 17% 13% 35% 48% 28%
% Chg. 984 968 1,011 969 983 2015 36% 27% 13% -1% 17%
% Chg. 959 870
2016 -3% -10% Source: ALIC Monthly(Quarterly average price is compiled by Post based on ALIC Monthly)
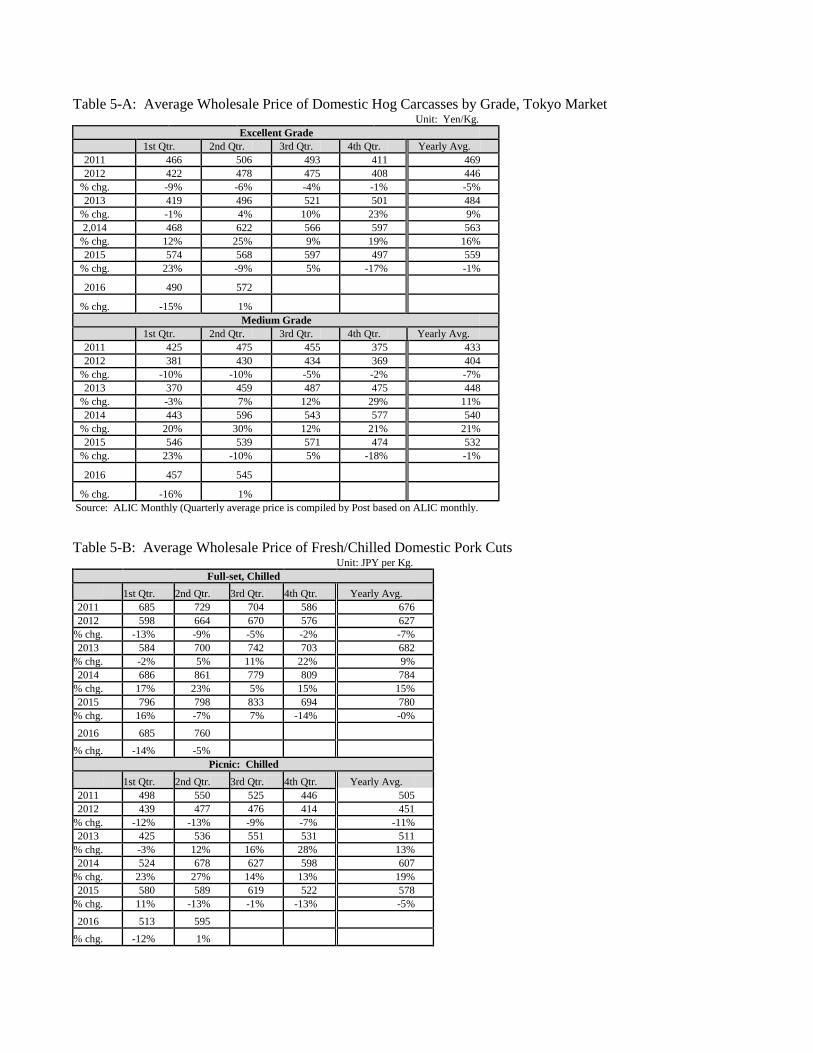
Table 5-A: Average Wholesale Price of Domestic Hog Carcasses by Grade, Tokyo Market Unit: Yen/Kg.
Excellent Grade
1st Qtr. 2nd Qtr. 3rd Qtr. 4th Qtr. Yearly Avg.
2011 466 506 493 411 469 2012 422 478 475 408 446
% chg. -9% -6% -4% -1% -5% 2013 419 496 521 501 484
% chg. -1% 4% 10% 23% 9% 2,014 468 622 566 597 563
% chg. 12% 25% 9% 19% 16% 2015 574 568 597 497 559
% chg. 23% -9% 5% -17% -1%
2016 490 572
% chg. -15% 1% Medium Grade
1st Qtr. 2nd Qtr. 3rd Qtr. 4th Qtr. Yearly Avg. 2011 425 475 455 375 433 2012 381 430 434 369 404
% chg. -10% -10% -5% -2% -7% 2013 370 459 487 475 448
% chg. -3% 7% 12% 29% 11% 2014 443 596 543 577 540
% chg. 20% 30% 12% 21% 21% 2015 546 539 571 474 532
% chg. 23% -10% 5% -18% -1%
2016 457 545
% chg. -16% 1% Source: ALIC Monthly (Quarterly average price is compiled by Post based on ALIC monthly.
Table 5-B: Average Wholesale Price of Fresh/Chilled Domestic Pork Cuts Unit: JPY per Kg.
Full-set, Chilled 1st Qtr. 2nd Qtr. 3rd Qtr. 4th Qtr. Yearly Avg. 2011 685 729 704 586 676 2012 598 664 670 576 627
% chg. -13% -9% -5% -2% -7% 2013 584 700 742 703 682
% chg. -2% 5% 11% 22% 9% 2014 686 861 779 809 784
% chg. 17% 23% 5% 15% 15% 2015 796 798 833 694 780
% chg. 16% -7% 7% -14% -0% 2016 685 760
% chg. -14% -5% Picnic: Chilled
1st Qtr. 2nd Qtr. 3rd Qtr. 4th Qtr. Yearly Avg. 2011 498 550 525 446 505 2012 439 477 476 414 451
% chg. -12% -13% -9% -7% -11% 2013 425 536 551 531 511
% chg. -3% 12% 16% 28% 13% 2014 524 678 627 598 607
% chg. 23% 27% 14% 13% 19% 2015 580 589 619 522 578
% chg. 11% -13% -1% -13% -5% 2016 513 595
% chg. -12% 1%

Unit: Yen/Kg. Shoulder Loin: Chilled
1st Qtr. 2nd Qtr. 3rd Qtr. 4th Qtr. Yearly Avg. 2011 874 875 874 779 851 2012 768 814 840 792 803
% chg. -12% -7% -4% 2% -6% 2013 775 856 959 960 887
% chg. 1% 5% 14% 21% 10% 2014 883 1,063 991 1,061 999
% chg. 14% 24% 3% 11% 13% 2015 1,022 986 1,101 969 1,019
% chg. 16% -7% 11% -9% 2%
2016 908 983
% chg. -11% -0% Loin: Chilled
1st Qtr. 2nd Qtr. 3rd Qtr. 4th Qtr. Yearly Avg. 2011 917 915 925 810 892 2012 798 853 871 805 832
% chg. -13% -7% -6% -1% -7% 2013 796 877 961 926 890
% chg. -0% 3% 10% 15% 7% 2014 888 1,089 1,027 1,071 1,019
% chg. 12% 24% 7% 16% 14% 2015 1,071 1,043 1,140 983 1,059
% chg. 21% -4% 11% -8% 4%
2016 919 952
% chg. -14% -9% Tender Loin: Chilled
1st Qtr. 2nd Qtr. 3rd Qtr. 4th Qtr. Yearly Avg. 2011 963 996 991 886 959 2012 865 926 925 860 894
% chg. -10% -7% -7% -3% -7% 2013 852 961 1,027 990 958
% chg. -1% 4% 11% 15% 7% 2014 960 1,186 1,135 1,123 1,101
% chg. 13% 23% 11% 13% 15% 2015 1,191 1,219 1,257 1,049 1,179
% chg. 24% 3% 11% -7% 7%
2016 1,041 1,189
% chg. -13% -2% Belly: Chilled
1st Qtr. 2nd Qtr. 3rd Qtr. 4th Qtr. Yearly Avg. 2011 878 868 817 754 829 2012 763 765 758 771 764
% chg. -13% -12% -7% 2% -8% 2013 763 806 851 934 839
% chg. 0% 5% 12% 21% 10% 2014 895 1,040 944 1,058 984
% chg. 17% 29% 11% 13% 17% 2015 1,014 901 929 924 942
% chg. 13% -13% -2% -13% -4%
2016 885 904
% chg. -13% 0%

Unit: Yen/Kg. Ham: Chilled
1st Qtr. 2nd Qtr. 3rd Qtr. 4th Qtr. Yearly Avg. 2011 516 569 550 467 526 2012 457 508 503 436 476
% chg. -11% -11% -8% -7% -9% 2013 451 571 583 563 542
% chg. -1% 12% 16% 29% 14% 2014 558 721 669 629 644
% chg. 24% 26% 15% 12% 19% 2015 613 625 653 552 611
% chg. 10% -13% -2% -12% -5%
2016 546 653
% chg. -11% 4% Source: ALIC Monthly (Quarterly average price is compiled by Post based on ALIC monthly.
Table 5-C: Average Wholesale Price of Imported Chilled Pork Cuts
Unit: JP Yen/Kg. Loin, US: Chilled
1st Qtr. 2nd Qtr. 3rd Qtr. 4th Qtr. Yearly Avg. 2011 601 597 596 584 595 2012 601 595 601 595 598
% chg. 0% -0% 1% 2% 1% 2013 589 589 601 596 594
% chg. -2% -1% 0% 0% -1% 2014 615 732 694 686 682
% chg. 4% 24% 15% 15% 15% 2015 666 638 655 610 643
% chg. 8% -13% -6% -11% -6% 2016 600 597
% chg. -10% -7% Loin, Canada: Chilled
1st Qtr. 2nd Qtr. 3rd Qtr. 4th Qtr. Yearly Avg. 2011 620 618 619 600 614 2012 617 611 609 602 610
% chg. -0% -1% -2% 0% -1% 2013 599 601 604 599 601
% chg. -3% -2% -1% -1% -2% 2014 627 756 725 712 705
% chg. 5% 26% 20% 19% 17% 2015 710 656 703 655 681
% chg. 13% -13% -3% -8% -3% 2016 633 633
% chg. -11% -3% Tender Loin, US: Chilled
1st Qtr. 2nd Qtr. 3rd Qtr. 4th Qtr. Yearly Avg. 2011 689 692 690 689 690 2012 687 685 686 679 684
% chg. -0% -1% -1% -1% -1% 2013 681 687 759 769 724
% chg. -1% 0% 11% 13% 6% 2014 813 927 919 936 899
% chg. 19% 35% 21% 22% 24% 2015 970 923 946 897 934
% chg. 19% -0% 3% -4% 4% 2016 884 831
% chg. -9% -10%
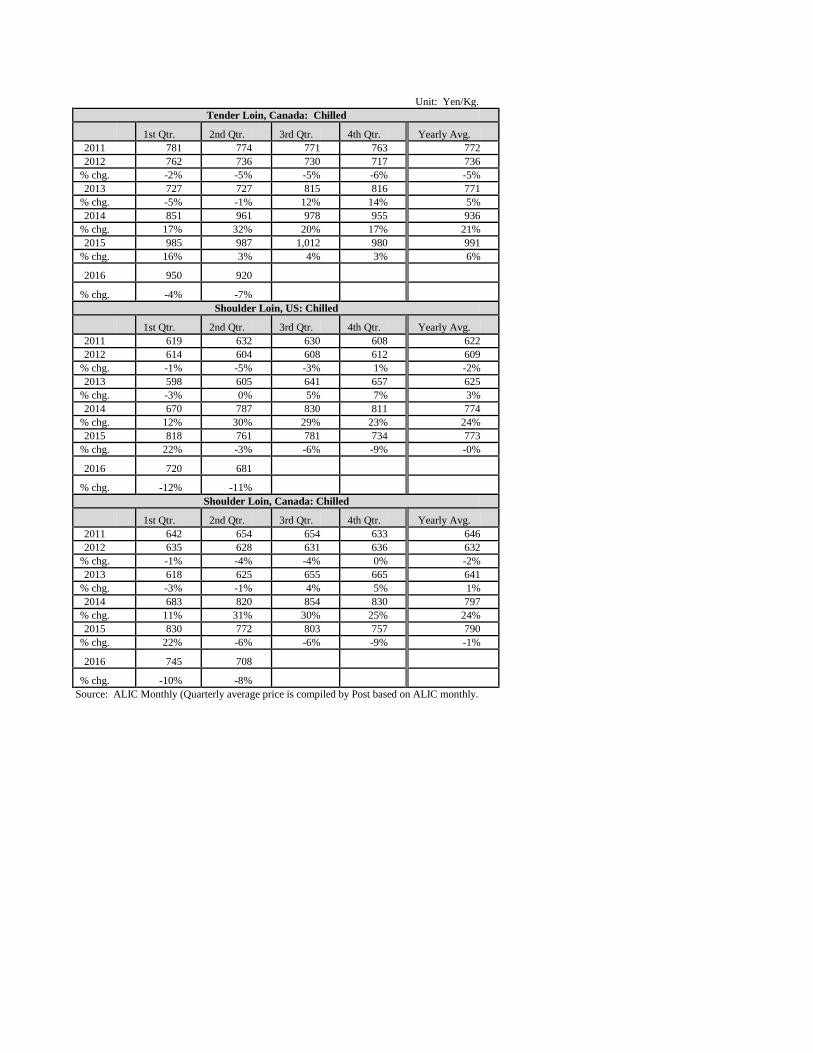
Unit: Yen/Kg. Tender Loin, Canada: Chilled
1st Qtr. 2nd Qtr. 3rd Qtr. 4th Qtr. Yearly Avg. 2011 781 774 771 763 772 2012 762 736 730 717 736
% chg. -2% -5% -5% -6% -5% 2013 727 727 815 816 771
% chg. -5% -1% 12% 14% 5% 2014 851 961 978 955 936
% chg. 17% 32% 20% 17% 21% 2015 985 987 1,012 980 991
% chg. 16% 3% 4% 3% 6%
2016 950 920
% chg. -4% -7% Shoulder Loin, US: Chilled
1st Qtr. 2nd Qtr. 3rd Qtr. 4th Qtr. Yearly Avg. 2011 619 632 630 608 622 2012 614 604 608 612 609
% chg. -1% -5% -3% 1% -2% 2013 598 605 641 657 625
% chg. -3% 0% 5% 7% 3% 2014 670 787 830 811 774
% chg. 12% 30% 29% 23% 24% 2015 818 761 781 734 773
% chg. 22% -3% -6% -9% -0%
2016 720 681
% chg. -12% -11% Shoulder Loin, Canada: Chilled
1st Qtr. 2nd Qtr. 3rd Qtr. 4th Qtr. Yearly Avg. 2011 642 654 654 633 646 2012 635 628 631 636 632
% chg. -1% -4% -4% 0% -2% 2013 618 625 655 665 641
% chg. -3% -1% 4% 5% 1% 2014 683 820 854 830 797
% chg. 11% 31% 30% 25% 24% 2015 830 772 803 757 790
% chg. 22% -6% -6% -9% -1%
2016 745 708
% chg. -10% -8% Source: ALIC Monthly (Quarterly average price is compiled by Post based on ALIC monthly.

Table 6-A: Monthly Ending Beef Stock Estimate Unit: Metric Ton (CWE converted)
2012 2013 % Chg. 2014 % Chg. 2015 % Chg. 2016 % Chg. Jan. 129,254 128,838 -0% 166,335 29% 184,775 11% 177,155 -4% Feb. 121,915 120,344 -1% 155,893 30% 176,648 13% 168,689 -5% Mar. 111,626 119,699 7% 150,046 25% 178,385 19% 162,392 -9% Apr. 107,579 117,029 9% 149,295 28% 188,873 27% 160,255 -15% May 112,944 135,064 20% 145,508 8% 196,265 35% 167,520 -15% Jun. 124,592 145,328 17% 154,976 7% 202,262 31% 171,811 -15%
Jul. 139,138 172,175 24% 161,944 -6% 202,241 25%
Aug. 148,562 187,239 26% 171,396 -8% 198,636 16%
Sept.. 154,256 182,398 18% 181,558 -0% 200,381 10%
Oct. 152,671 186,949 22% 188,727 1% 197,273 5%
Nov. 149,373 183,560 23% 191,113 4% 196,574 3%
Dec. 135,492 170,537 26% 185,395 9% 185,345 -0% Source: ALIC Monthly Statistics
Table 6-B: Monthly Ending Pork Stock Estimate Unit: Metric Ton (CWE Converted)
2012 2013 % Chg. 2014 % Chg. 2015 % Chg. 2016 % Chg. Jan. 232,219 227,915 -2% 213,346 -6% 240,042 13% 218,539 -9% Feb. 238,564 229,814 -4% 209,024 -9% 233,146 12% 218,742 -6% Mar. 237,673 226,928 -5% 210,978 -7% 232,172 10% 220,194 -5% Apr. 231,592 226,129 -2% 213,498 -6% 244,282 14% 225,502 -8% May 234,878 231,345 -2% 229,268 -1% 251,971 10% 231,754 -8% Jun. 219,436 224,888 2% 244,787 9% 245,311 0% 234,361 -4%
Jul. 222,686 219,863 -1% 266,367 21% 238,221 -11%
Aug. 228,799 217,903 -5% 274,021 26% 232,287 -15%
Sept.. 233,068 211,461 -9% 275,977 31% 220,672 -20%
Oct. 234,993 209,986 -11% 286,718 37% 213,147 -26%
Nov. 229,995 198,884 -14% 264,953 33% 207,094 -22%
Dec. 213,918 195,273 -9% 245,651 26% 200,170 -19% Source: ALIC Monthly Statistics
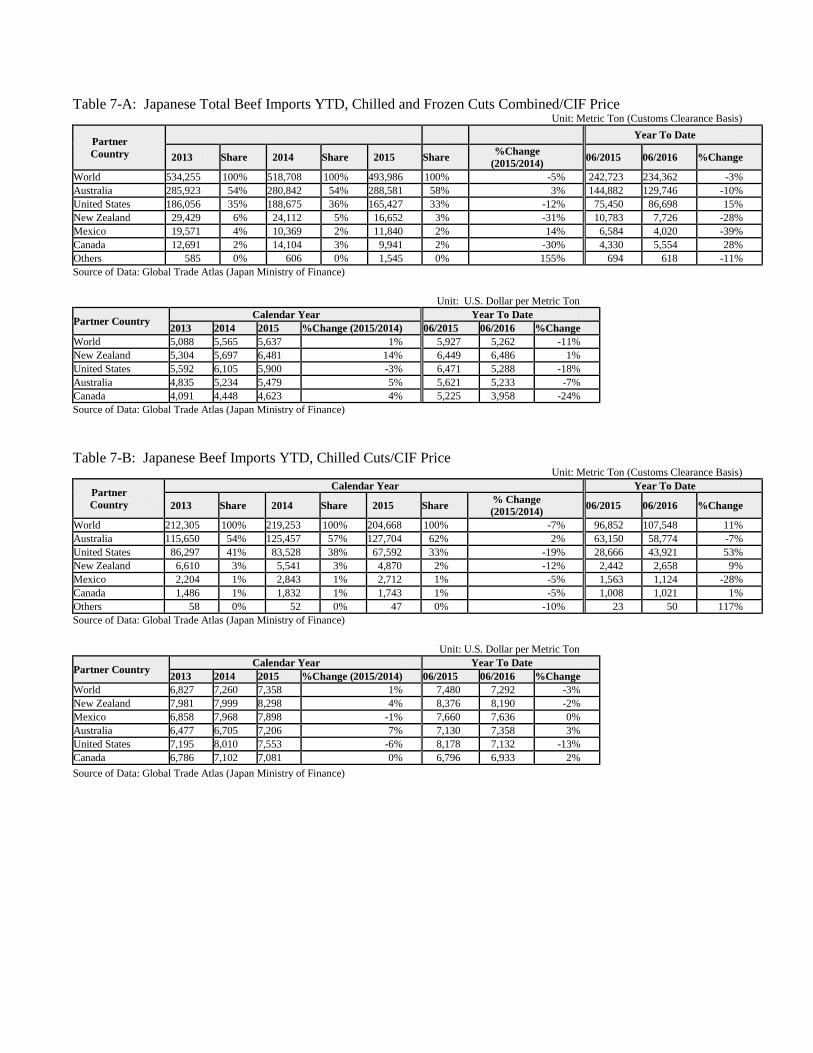
Table 7-A: Japanese Total Beef Imports YTD, Chilled and Frozen Cuts Combined/CIF Price Unit: Metric Ton (Customs Clearance Basis)
Partner
Country Year To Date
2013 Share 2014 Share 2015 Share %Change
(2015/2014) 06/2015 06/2016 %Change
World 534,255 100% 518,708 100% 493,986 100% -5% 242,723 234,362 -3% Australia 285,923 54% 280,842 54% 288,581 58% 3% 144,882 129,746 -10% United States 186,056 35% 188,675 36% 165,427 33% -12% 75,450 86,698 15% New Zealand 29,429 6% 24,112 5% 16,652 3% -31% 10,783 7,726 -28% Mexico 19,571 4% 10,369 2% 11,840 2% 14% 6,584 4,020 -39% Canada 12,691 2% 14,104 3% 9,941 2% -30% 4,330 5,554 28% Others 585 0% 606 0% 1,545 0% 155% 694 618 -11% Source of Data: Global Trade Atlas (Japan Ministry of Finance)
Unit: U.S. Dollar per Metric Ton
Partner Country Calendar Year Year To Date 2013 2014 2015 %Change (2015/2014) 06/2015 06/2016 %Change
World 5,088 5,565 5,637 1% 5,927 5,262 -11% New Zealand 5,304 5,697 6,481 14% 6,449 6,486 1% United States 5,592 6,105 5,900 -3% 6,471 5,288 -18% Australia 4,835 5,234 5,479 5% 5,621 5,233 -7% Canada 4,091 4,448 4,623 4% 5,225 3,958 -24% Source of Data: Global Trade Atlas (Japan Ministry of Finance)
Table 7-B: Japanese Beef Imports YTD, Chilled Cuts/CIF Price Unit: Metric Ton (Customs Clearance Basis)
Partner
Country
Calendar Year Year To Date
2013 Share 2014 Share 2015 Share % Change
(2015/2014) 06/2015 06/2016 %Change
World 212,305 100% 219,253 100% 204,668 100% -7% 96,852 107,548 11% Australia 115,650 54% 125,457 57% 127,704 62% 2% 63,150 58,774 -7% United States 86,297 41% 83,528 38% 67,592 33% -19% 28,666 43,921 53% New Zealand 6,610 3% 5,541 3% 4,870 2% -12% 2,442 2,658 9% Mexico 2,204 1% 2,843 1% 2,712 1% -5% 1,563 1,124 -28% Canada 1,486 1% 1,832 1% 1,743 1% -5% 1,008 1,021 1% Others 58 0% 52 0% 47 0% -10% 23 50 117% Source of Data: Global Trade Atlas (Japan Ministry of Finance)
Unit: U.S. Dollar per Metric Ton
Partner Country Calendar Year Year To Date 2013 2014 2015 %Change (2015/2014) 06/2015 06/2016 %Change
World 6,827 7,260 7,358 1% 7,480 7,292 -3% New Zealand 7,981 7,999 8,298 4% 8,376 8,190 -2% Mexico 6,858 7,968 7,898 -1% 7,660 7,636 0% Australia 6,477 6,705 7,206 7% 7,130 7,358 3% United States 7,195 8,010 7,553 -6% 8,178 7,132 -13% Canada 6,786 7,102 7,081 0% 6,796 6,933 2% Source of Data: Global Trade Atlas (Japan Ministry of Finance)

Table 7-C: Japanese Beef Imports YTD, Frozen Cuts/CIF Price Unit: Metric Ton (Customs Clearance Basis)
Partner
Country
Calendar Year Year To Date
2013 Share 2014 Share 2015 Share %Change
(2015/2014) 06/2015 06/2016 %Change
World 321,949 100% 299,456 100% 289,317 100% -3% 145,871 126,814 -13% Australia 170,273 53% 155,385 52% 160,876 56% 4% 81,732 70,972 -13% United States 99,758 31% 105,147 35% 97,835 34% -7% 46,784 42,777 -9% New Zealand 22,819 7% 18,570 6% 11,782 4% -37% 8,342 5,068 -39% Mexico 17,367 5% 7,526 3% 9,128 3% 21% 5,022 2,896 -42% Canada 11,205 3% 12,272 4% 8,198 3% -33% 3,322 4,533 36% Others 527 0% 556 0% 1,498 1% 169% 669 568 -15% Source of Data: Global Trade Atlas (Japan Ministry of Finance)
Unit: U.S. Dollars per Metric Ton
Partner Country Calendar Year Year To Date 2013 2014 2015 %Change (2015/2014) 06/2015 06/2016 %Change
World 3,942 4,324 4,420 2% 4,895 3,541 -28% New Zealand 4,528 5,010 5,730 14% 5,885 5,592 -5% Mexico 3,929 4,992 4,925 -1% 5,656 3,831 -32% Australia 3,720 4,045 4,108 2% 4,455 3,474 -22% United States 4,206 4,592 4,758 4% 5,426 3,394 -37% Canada 3,734 4,052 4,100 1% 4,748 3,288 -31% Source of Data: Global Trade Atlas (Japan Ministry of Finance)
Table 7-D: Japanese Beef Imports YTD, Prepared and Processed Products/CIF Price Unit: Metric Ton (Customs Clearance Basis)
Partner Country Calendar Year Year To Date
2013 Share 2014 Share 2015 Share %Change
(2015/2014) 06/2015 06/2016 %Change
World 6,503 100% 7,272 100% 8,551 100% 18% 4,074 3,907 -4% Australia 4,847 75% 5,279 73% 4,958 58% -6% 2,310 2,320 0% United States 0 0% 138 2% 2,006 23% 1354% 709 1,134 60% China 1,148 18% 1,066 15% 856 10% -20% 603 216 -64% Others 508 8% 789 11% 731 9% -7% 452 237 -48% Source of Data: Global Atlas (Japan Ministry of Finance)
Unit: Metric Ton (Customs Clearance Basis)
Partner Country Calendar Year Year To Date 2013 2014 2015 %Change (2015/2014) 06/2015 06/2016 %Change
World 6,719 6,785 5,462 -20% 4,895 3,541 -28% China 8,426 7,599 7,761 2% 5,885 5,592 -5% Australia 5,678 5,577 5,561 0% 5,656 3,831 -32% United States 0 2,766 2,882 4% 4,455 3,474 -22% Source of Data: Global Trade Atlas (Japan Ministry of Finance)

Table 7-E: Japanese Beef Edible Offal Imports YTD/CIF Price Unit: Metric Ton (Customs Clearance Basis)
Partner Country Calendar Year Year To Date
2013 Share 2014 Share 2015 Share %Change
(2015/2014) 06/2015 06/2016 %Change
World 59,164 100% 61,317 100% 61,187 100% 0% 29,395 32,684 11% United States 30,794 52% 32,926 54% 31,072 51% -6% 14,720 16,526 12% Australia 19,246 33% 19,554 32% 20,795 34% 6% 9,941 9,447 -5% New Zealand 3,900 7% 4,369 7% 4,733 8% 8% 2,907 2,977 2% Canada 2,469 4% 2,307 4% 2,598 4% 13% 784 2,114 170% Others 2,755 5% 2,161 4% 1,989 3% -8% 1,043 1,620 55% Source of Data: Global Trade Atlas (Japan Ministry of Finance)
Unit: U.S. Dollars per Metric Ton
Partner Country Calendar Year Year To Date 2013 2014 2015 %Change (2015/2014) 06/2015 06/2016 %Change
World 8,977 9,313 9,474 2% 9,209 10,588 15% United States 10,229 10,770 11,486 7% 11,275 12,185 8% Canada 8,445 8,979 9,432 5% 9,105 10,486 15% Australia 7,710 7,593 7,538 -1% 7,336 9,338 27% New Zealand 6,925 6,803 5,726 -16% 5,630 7,757 38% Source of Data: Global Trade Atlas (Japan Ministry of Finance)
Table 8-A: Japanese Total Pork Imports YTD, Chilled and Frozen Cuts Combined/CIF Price Unit: Metric Ton (Customs Clearance Basis)
Partner
Country
Calendar Year Year To Date
2013 Share 2014 Share 2015 Share %Change
(2015/2014) 06/2015 06/2016 %Change
World 738,451 100% 829,382 100% 790,650 100% -5% 380,195 428,797 13% United States 281,144 38% 276,033 33% 259,475 33% -6% 129,010 128,837 0% Canada 142,241 19% 148,016 18% 165,828 21% 12% 80,556 86,460 7% Denmark 113,951 15% 135,346 16% 110,055 14% -19% 49,946 56,989 14% Spain 33,986 5% 65,515 8% 73,925 9% 13% 35,118 47,089 34% Mexico 59,379 8% 63,041 8% 69,642 9% 10% 34,077 36,890 8% Chile 29,522 4% 26,847 3% 22,412 3% -17% 10,799 14,293 32% Others 78,228 11% 114,584 14% 89,313 11% -22% 40,689 58,239 43% Total EU 225,530 31% 312,318 38% 270,063 34% -14% 123,458 161,381 31% Source of Data: Global Trade Atlas (Japan Ministry of Finance)
Unit: U.S. Dollar per Metric Ton
Partner Country Calendar Year Year To Date
2013 2014 2015 06/2015 06/2016 %Change World 5,414 5,226 4,442 -15% 4,517 4,728 5% EU 5,423 5,069 4,360 -14% 4,399 4,721 7% Mexico 5,462 5,410 4,501 -17% 4,596 4,756 3% Spain 5,604 5,210 4,408 -15% 4,449 4,736 6% Canada 5,397 5,252 4,473 -15% 4,563 4,733 4% United States 5,404 5,356 4,491 -16% 4,579 4,725 3% Chile 5,418 5,173 4,427 -14% 4,553 4,721 4% Denmark 5,379 5,027 4,337 -14% 4,373 4,698 7% Source of Data: Global Trade Atlas (Japan Ministry of Finance)

Table 8-B: Japanese Pork Imports YTD, Chilled Cuts/CIF Price Unit: Metric Ton (Customs Clearance Basis)
Partner
Country
Calendar Year Year To Date
2013 Share 2014 Share 2015 Share %Change
(2015/2014) 06/2015 06/2016 %Change
World 294,043 100% 300,058 100% 322,207 100% 7% 146,631 175,477 20% United States 198,493 68% 187,709 63% 187,829 58% 0% 82,753 103,366 25% Canada 86,993 30% 101,107 34% 121,124 38% 20% 56,653 66,174 17% Mexico 8,404 3% 11,194 4% 13,167 4% 18% 7,181 5,910 -18% Others 153 0% 48 0% 87 0% 81% 44 27 -39% Source of Data: Global Trade Atlas (Japan Ministry of Finance)
Unit: U.S. Dollar per Metric Ton
Partner Country Calendar Year Year To Date 2013 2014 2015 %Change (2015/2014) 06/2015 06/2016 %Change
World 5,401 5,428 4,529 -17% 4,658 4,731 2% Mexico 5,399 5,479 4,636 -15% 4,750 4,751 0% Canada 5,389 5,377 4,518 -16% 4,641 4,737 2% United States 5,402 5,449 4,526 -17% 4,658 4,724 1% Source of Data: Global Trade Atlas (Japan Ministry of Finance)

Table 8-C: Japanese Pork Imports YTD, Frozen Cuts/CIF Price Unit: Metric Ton (Customs Clearance Basis)
Partner
Country
Calendar Year Year To Date
2013 Share 2014 Share 2015 Share %Change
(2015/2014) 06/2015 06/2016 %Change
World 444,408 100% 529,324 100% 468,443 100% -12% 233,564 253,319 8% Denmark 113,951 26% 135,344 26% 110,030 23% -19% 49,946 56,989 14% Spain 33,960 8% 65,487 12% 73,902 16% 13% 35,105 47,070 34% United States 82,651 19% 88,324 17% 71,646 15% -19% 46,258 25,471 -45% Mexico 50,975 11% 51,847 10% 56,475 12% 9% 26,896 30,980 15% Canada 55,248 12% 46,909 9% 44,705 10% -5% 23,903 20,286 -15% Chile 29,522 7% 26,847 5% 22,412 5% -17% 10,799 14,293 32% Hungary 11,329 3% 17,898 3% 21,391 5% 20% 10,338 12,784 24% Netherlands 13,082 3% 19,921 4% 19,275 4% -3% 9,401 11,988 28% Italy 2,195 0% 10,266 2% 11,150 2% 9% 4,343 6,777 56% France 7,663 2% 13,354 3% 10,741 2% -20% 4,436 6,845 54% Austria 9,645 2% 17,556 3% 9,581 2% -45% 4,744 6,619 40% Germany 4,618 1% 12,668 2% 9,011 2% -29% 3,644 6,477 78% Ireland 3,808 1% 11,083 2% 2,965 1% -73% 602 4,068 576% Others 25,761 6% 11,820 2% 5,159 1% -56% 3,149 2,672 -15% Total EU 225,480 51% 312,271 59% 269,974 58% -14% 123,414 161,354 31% Source of Data: Global Trade Atlas (Japan Ministry of Finance)
Unit: U.S. Dollar per Metric Ton
Partner Country Calendar Year Year To Date 2013 2014 2015 %Change (2015/2014) 06/2015 06/2016 %Change
World 5,423 5,112 4,382 -14% 4,429 4,726 7% Italy 5,575 5,226 4,374 -16% 4,436 4,862 10% Mexico 5,473 5,395 4,469 -17% 4,555 4,756 4% Germany 5,333 5,023 4,350 -13% 4,409 4,756 8% Austria 5,335 5,020 4,319 -14% 4,343 4,744 9% Spain 5,591 5,203 4,404 -15% 4,444 4,731 6% United States 5,409 5,158 4,400 -15% 4,437 4,730 7% France 5,423 5,028 4,330 -14% 4,355 4,727 9% Ireland 5,386 4,976 4,327 -13% 4,373 4,724 8% Canada 5,409 4,982 4,350 -13% 4,378 4,723 8% Chile 5,418 5,173 4,427 -14% 4,553 4,721 4% Netherlands 5,323 4,955 4,338 -12% 4,378 4,701 7% Denmark 5,379 5,027 4,337 -14% 4,373 4,698 7% Hungary 5,529 5,032 4,357 -13% 4,383 4,666 6% Total EU 5,420 5,067 4,358 -14% 4,397 4,719 7% Source of Data: Global Trade Atlas (Japan Ministry of Finance)

Table 8-D: Japanese Pork Imports YTD, Prepared and Processed Products/CIF Price Unit: Metric Ton (Customs Clearance Basis)
Partner
Country
Calendar Year Year To Date
2013 Share 2014 Share 2015 Share %Change
(2015/2014) 06/2015 06/2016 %Change
World 202,189 100% 195,599 100% 185,921 100% -5% 94,048 92,803 -1% United States 129,339 64% 122,525 63% 112,507 61% -8% 57,028 54,261 -5% China 25,079 12% 26,285 13% 23,115 12% -12% 11,042 11,521 4% Canada 18,344 9% 20,486 10% 17,466 9% -15% 11,080 8,356 -25% Netherlands 2,191 1% 4,535 2% 7,355 4% 62% 3,467 4,185 21% Thailand 8,386 4% 6,840 3% 7,176 4% 5% 3,587 3,217 -10% Mexico 5,419 3% 4,297 2% 4,842 3% 13% 2,219 2,002 -10% Denmark 3,941 2% 3,444 2% 4,028 2% 17% 1,941 2,556 32% Italy 2,507 1% 2,953 2% 3,053 2% 3% 1,358 1,406 4% Germany 72 0% 63 0% 2,851 2% 4425% 295 3,479 1079% Others 6,911 3% 4,171 2% 3,528 2% -15% 2,031 1,820 -10% Source of Data: Global Trade Atlas (Japan Ministry of Finance)
Unit: U.S. Dollar per Metric Ton
Partner Country Year To Date 2013 2014 2015 %Change (2015/2014) 06/2015 06/2016 %Change
World 3,857 4,279 3,758 -12% 3,803 3,454 -9% Italy 15,172 14,325 12,120 -15% 12,334 12,327 0% Thailand 8,150 8,463 8,081 -5% 8,016 8,495 6% China 4,920 4,835 4,618 -4% 4,760 4,430 -7% Denmark 3,898 3,947 3,429 -13% 3,470 3,773 9% Mexico 3,956 4,142 3,591 -13% 3,868 3,542 -8% United States 3,279 3,810 3,273 -14% 3,320 2,900 -13% Canada 2,819 3,413 2,862 -16% 3,023 2,647 -12% Germany 8,581 10,213 2,671 -74% 3,310 2,633 -20% Netherlands 2,578 3,174 2,560 -19% 2,773 2,256 -19% Source of Data: Global Trade Atlas (Japan Ministry of Finance)
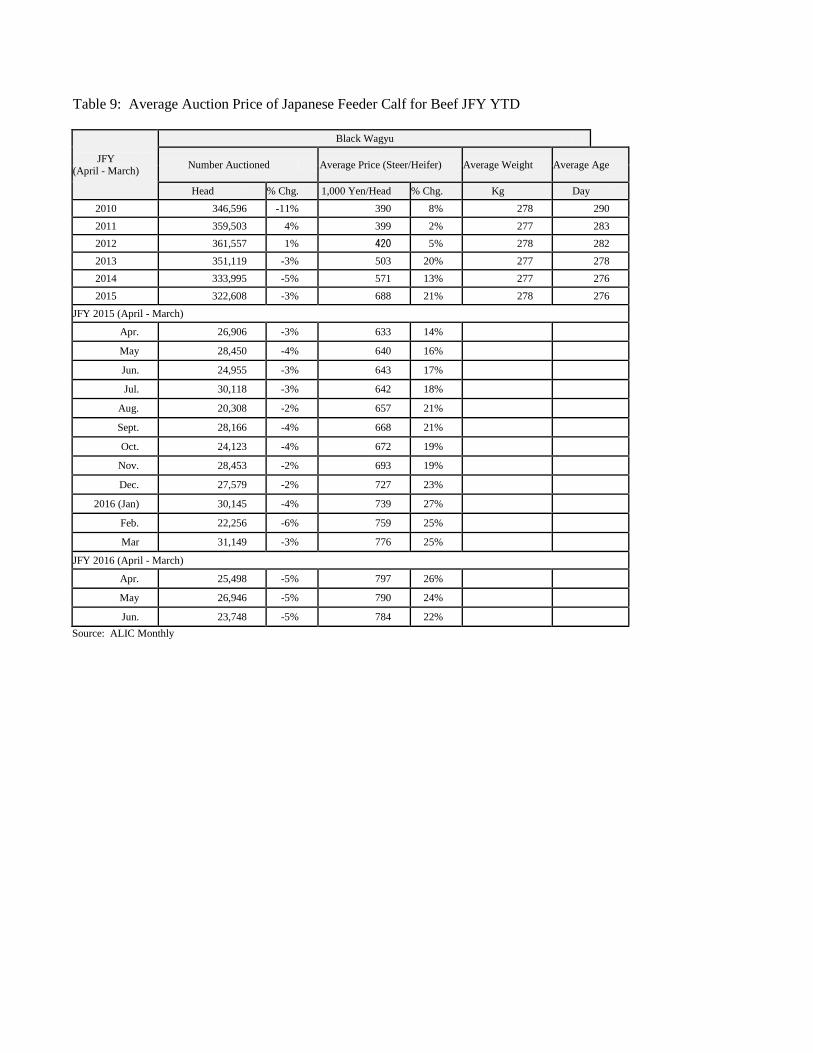
Table 9: Average Auction Price of Japanese Feeder Calf for Beef JFY YTD
JFY (April - March)
Black Wagyu
Number Auctioned Average Price (Steer/Heifer) Average Weight Average Age
Head % Chg. 1,000 Yen/Head % Chg. Kg Day
2010 346,596 -11% 390 8% 278 290 2011 359,503 4% 399 2% 277 283 2012 361,557 1% 420 5% 278 282 2013 351,119 -3% 503 20% 277 278 2014 333,995 -5% 571 13% 277 276 2015 322,608 -3% 688 21% 278 276
JFY 2015 (April - March)
Apr. 26,906 -3% 633 14%
May 28,450 -4% 640 16%
Jun. 24,955 -3% 643 17%
Jul. 30,118 -3% 642 18%
Aug. 20,308 -2% 657 21%
Sept. 28,166 -4% 668 21%
Oct. 24,123 -4% 672 19%
Nov. 28,453 -2% 693 19%
Dec. 27,579 -2% 727 23%
2016 (Jan) 30,145 -4% 739 27%
Feb. 22,256 -6% 759 25%
Mar 31,149 -3% 776 25%
JFY 2016 (April - March)
Apr. 25,498 -5% 797 26%
May 26,946 -5% 790 24%
Jun. 23,748 -5% 784 22% Source: ALIC Monthly

JFY (April - March)
F1 Cross Breed
Number Auctioned Average Price (Steer/Heifer) Average Weight Average Age
Head % Chg. 1,000 Yen/Head % Chg. Kg Day
2010 59,354 -11% 261 25% 286 247 2011 61,574 4% 237 -9% 291 248 2012 68,500 11% 226 -4% 295 249 2013 58,454 -15% 297 32% 295 247 2014 62,205 6% 325 19% 297 248 2015 65,027 5% 385 19% 300 249
JFY 2015 (April - March)
Apr. 5,877 13% 377 28%
May 5,665 10% 376 27%
Jun. 6,303 11% 374 24%
Jul. 5,793 9% 380 25%
Aug. 4,961 -6% 385 27%
Sept. 5,894 10% 379 22%
Oct. 5,302 3% 384 19%
Nov. 5,023 0% 387 10%
Dec. 5,254 4% 399 11%
2016 (Jan) 4,528 -6% 407 15%
Feb. 5,118 2% 390 14%
Mar 5,309 3% 387 6%
JFY 2016 (April - March)
Apr. 5,180 -12% 388 3%
May 5,132 -9% 397 6%
Jun. 5,486 -13% 393 5%
Source: ALIC Monthly

JFY (April - March)
Holstein
Number Auctioned Average Price (Steer only) Average Weight Average Age
Head % Chg. 1,000 Yen/Head % Chg. Kg Day
2010 11,158 2% 85 -3% 266 224 2011 8,109 -27% 93 9% 270 226 2012 7,168 -12% 95 3% 273 229 2013 8,529 19% 127 34% 274 228 2014 10,759 26% 146 15% 276 228 2015 11,924 11% 221 48% 279 226
JFY 2015 (April - March)
Apr. 1,128 13% 172 25%
May 783 -16% 189 31%
Jun. 837 -6% 202 45%
Jul. 919 1% 220 53%
Aug. 830 5% 216 64%
Sept. 927 27% 224 67%
Oct. 1,146 33% 235 71%
Nov. 1,053 53% 246 66%
Dec. 975 15% 252 59%
2016 (Jan) 907 -6% 241 49%
Feb. 1,196 22% 232 50%
Mar 1,223 5% 216 37%
JFY 2016 (April - March)
Apr. 1,115 -1% 223 29%
May 1,004 28% 218 15%
Jun. 1,174 40% 224 11%
Source: ALIC Monthly

Table 10-A: Japanese Year-Beginning Cattle Inventory Beef Cattle Inventory (Part 1)
Unit: Farm/Head
Year Beginning (As
of Feb. 1)
Total Number of
Farms
Grand Total (Beef and Dairy Breed
Combined)
Beef Breed Total
Beef Breed
Total Black Wagyu Brown Wagyu Others Cows for
Breeding (Cow Calf Rearing)
2007 82,300 2,806,000 1,742,000 1,656,000 31,600 54,600 635,900 2008 80,400 2,890,000 1,823,000 1,734,000 30,400 58,100 667,300
% Chg. -2% 3% 5% 5% -4% 6% 5% 2009 77,300 2,923,000 1,889,000 1,810,000 28,800 50,400 682,100
% Chg. -4% 1% 4% 4% -5% -13% 2% 2010 74,400 2,892,000 1,924,000 1,853,000 26,000 44,700 683,900
% Chg. -4% -1% 2% 2% -10% -11% 0% 2011 69,600 2,763,000 1,868,000 1,805,000 24,500 38,700 667,900
% Chg. -6% -4% -3% -3% -6% -13% -2% 2012 65,200 2,723,000 1,831,000 1,773,000 22,700 35,700 642,200
% Chg. -6% -1% -2% -2% -7% -8% -4% 2013 61,300 2,642,000 1,769,000 1,714,000 21,700 33,300 618,400
% Chg. -6% -3% -3% -3% -4% -7% -4% 2014 57,500 2,567,000 1,716,000 1,663,000 21,100 31,900 595,200
% Chg. -6% -3% -3% -3% -3% -4% -4% 2015 54,400 2,489,000 1,661,000 1,612,000 20,800 28,300 579,500
% Chg. -5% -3% -3% -3% -1% -11% -3% 2016 51,900 2,479,000 1,642,000 1,594,000 20,500 27,400 588,100
% Chg. -5% 0% -1% -1% -1% -3% 1% Beef Cattle Inventory (Part 2 - Continuation of Part 1)
Year
Beginning (As
of Feb. 1)
Dairy Breed Total Average
Number of Cattle Raised
per Farm
Dairy Breed
Total Holstein and
Others
F-1 Crossbreed
(Holstein x Wagyu)
% Share of F-1
Cross Breed in Total Dairy Breed
2007 1,064,000 459,800 604,000 57% 34
2008 1,067,000 431,600 635,700 60% 36
% Chg. 0% -6% 5% 5%
2009 1,033,000 411,300 622,100 60% 38
% Chg. -3% -5% -2% 5%
2010 968,300 421,000 547,300 57% 39
% Chg. -6% 2% -12% 3%
2011 894,800 411,800 483,000 54% 40
% Chg. -8% -2% -12% 2%
2012 891,700 392,500 499,100 56% 42
% Chg. 0% -5% 3% 5%
2013 873,400 375,500 497,900 57% 43
% Chg. -2% -4% 0% 3%
2014 851,400 367,500 483,900 57% 45
% Chg. -3% -2% -3% 3%
2015 827,700 345,300 482,400 58% 46
% Chg. -3% -6% 0% 3%
2016 837,100 331,800 505,300 60% 48
% Chg. 1% -4% 5% 4%
Source: MAFF Livestock Statistics

Dairy Cow Inventory
Unit: Farm/Head
Year
Beginning (As of Feb. 1)
Total
Number of Dairy Farms
Total Number
of Dairy Cows
Dairy Cows
(Over Two Years of Age)
Heifers (Less Than
Two Years of
Age)
Animals
Raised per Farm
Total Cow Heifer Sub Total Milking Dry
2007 25,400 1,592,000 1,093,000 1,011,000 871,200 140,100 81,200 499,600 63 2008 24,400 1,533,000 1,075,000 998,200 861,500 136,700 76,500 458,000 63
% Chg. 2009 23,100 1,500,000 1,055,000 985,200 848,000 137,200 69,600 445,100 65
% Chg. -5% -2% -2% -1% -2% 0% -9% -3% 3% 2010 21,900 1,484,000 1,029,000 963,800 829,700 134,100 65,600 454,900 68
% Chg. -5% -1% -2% -2% -2% -2% -6% 2% 4% 2011 21,000 1,467,000 999,600 932,900 804,700 128,200 66,700 467,800 70
% Chg. -4% -1% -3% -3% -3% -4% 2% 3% 3% 2012 20,100 1,449,000 1,012,000 942,600 812,700 129,900 69,700 436,700 72
% Chg. -4% -1% 1% 1% 1% 1% 4% -7% 3% 2013 19,400 1,423,000 992,100 923,400 798,300 125,100 68,700 431,300 73
% Chg. -3% -2% -2% -2% -2% -4% -1% -1% 2% 2014 18,600 1,395,000 957,800 893,400 772,500 121,000 64,400 436,800 75
% Chg. -4% -2% -3% -3% -3% -3% -6% 1% 2% 2015 17,700 1,371,000 934,100 869,700 750,100 119,600 64,400 437,200 78
% Chg. -5% -2% -2% -3% -3% -1% 0% 0% 3% 2016 17,000 1,345,000 936,700 871,000 751,700 119,300 65,800 408,300 79
% Chg. -4% -2% 0% 0% 0% 0% 2% -7% 2% Note: 99 percent of dairy cows raised in Japan are Holstein breed. Source: MAFF Livestock Statistics
Table 10-B: Japanese Swine Inventory National Swine Inventory Data
Year Beginning
(As of February
1)
Number of Swine Farms (Farm)
Number Raised (Head)
Average Number of
Swine Raised per Farm
Of Farms with
Breeding Sows Total
Breeding Sows
(Over 6
Months Old)
Breeding Males
(Over 6
Months Old)
Hogs Others
(feeder piglets)
2000 11,700 10,300 9,806,000 929,300 70,600 8,209,000 597,600 838.1 2001 10,800 9,450 9,788,000 921,500 67,900 8,214,000 584,900 906.3 2002 10,000 8,790 9,612,000 916,400 67,900 8,028,000 599,000 961.2 2003 9,430 8,290 9,725,000 929,300 66,000 8,057,000 673,000 1031.3 2004 8,880 7,770 9,724,000 917,500 63,000 8,052,000 690,900 1095.0 2005 Census Year 2006 7,800 6,780 9,620,000 907,100 60,000 7,943,000 710,700 1233.3 2007 7,550 6,560 9,759,000 915,000 58,000 8,119,000 667,100 1292.6 2008 7,230 6,250 9,745,000 910,100 57,400 8,117,000 660,900 1347.9 2009 6,890 5,930 9,899,000 936,700 57,100 8,220,000 685,700 1436.7 2010 Census Year 2011 6,010 5,110 9,768,000 901,800 51,800 8,186,000 628,700 1625.3 2012 5,840 4,900 9,735,000 900,000 51,900 8,145,000 638,700 1667.0
% Chg. -3% -4% 0% 0% 0% -1% 2% 3% 2013 5,570 4,620 9,685,000 899,700 49,100 8,106,000 629,500 1738.8
% Chg. -5% -6% -1% 0% -5% 0% -1% 4% 2014 5,270 4,290 9,537,000 885,300 47,500 8,020,000 583,300 1809.7 2015 Census Year 2016 4,830 3,940 9,313,000 844,700 42,600 7,743,000 682,500 1,928.2
% Chg. -8% -8% -2% -5% -10% -3% 17% 7% Source: MAFF Livestock

Statistics
Related Documents