1 © This is a licensed product of Ken Research and should not be copied

Japan Insurance Market Largely Driven By Ageing Population: Ken Research
Nov 08, 2014
According to the research report “Japan Insurance Market Outlook to 2016 - Growing Importance of Annuity Insurance with Ageing Population” by Ken Research, the direct written premium of insurance in Japan is projected to rise at a CAGR of 9.6% in the next four years with the entrance of more foreign players in the country.
The insurance market in Japan can be classified on the basis of life and non-life insurance. The life insurance is a contract between life insurer and the policyholder in which an insurer is bound to pay a defined sum of money upon the death of the insured person within a certain specified time period or on the maturity of life insurance policy. The non life insurance is also known as general insurance is used to provide coverage for business and individual from the financial loss resulting from certain events such as natural disaster, accident, fire, burglary, diseases and others.
For more information on the industry research report please refer to the below mentioned link:
http://www.kenresearch.com/banking-financial-services--insurance-bfsi-/insurance/364-93/Japan-Insurance-Market-Outlook-to-2016.html
Welcome message from author
This document is posted to help you gain knowledge. Please leave a comment to let me know what you think about it! Share it to your friends and learn new things together.
Transcript
1
© This is a licensed product of Ken Research and should not be copied
2
© This is a licensed product of Ken Research and should not be copied
TABLE OF CONTENTS
1. Asia-Pacific Insurance Industry
1.1. Industry Introduction
1.2. Asia-Pacific Insurance Market Size by Direct Written Premium, 2005-2012P
1.3. Asia-Pacific Insurance Market Segmentation
1.3.1. By Geography, 2005-2012P
1.3.2. By Life and Non Life, 2005-2012P
2. Japan Insurance Industry
2.1. Japan Insurance Market Size by Direct Written Premium, FY’2005-FY’2012
3. Japan Insurance Government Regulations
4. Japan Insurance Industry Value Chain
5. Japan Life Insurance Market
5.1. Japan Life Insurance Market Size, FY’2005-FY’2012
5.2. Life Insurance Segmentation, FY’2005-FY’2012
5.3. Market Share of Major Life Insurers in Japan, FY’2012
5.4. Japan Life Insurance Market Future Outlook and Projection, FY’ 2013-FY’2016
6. Japan Non-Life Insurance Market
6.1. Japan Non-Life Insurance Market Size, FY’2005-FY’2012
6.2. Japan Non Life Distribution Channel, FY’2010-FY’2012
7. Non-Life Insurance Segmentation, FY’2005-FY’2012
7.1. Japan Automobile Insurance Industry
7.1.1. Japan Automobile Insurance Market Size, FY’2005-FY’2012
7.1.2. Automobile Insurance Segmentation, FY’2005-FY’2012
3
© This is a licensed product of Ken Research and should not be copied
7.1.3. Market Share of Domestic and Foreign Insurers in Automobile Insurance Industry in Japan, FY’2012
7.1.4. Japan Automobile Insurance Market Future Outlook and Projection, FY’2013-FY’2016
7.2. Japan Fire Insurance Industry
7.2.1. Japan Fire Insurance Market Size and Introduction, FY’2005-FY’2012
7.3.1. Market Share of Domestic and Foreign Insurers in Fire Insurance Industry in Japan, FY’2012
7.3.2. Japan Fire Insurance Market Future Outlook and Projection, FY’2013-FY’2016
7.3. Japan Personal Accident Insurance Industry
7.3.1. Japan Personal Accident Insurance Market Size and Introduction, FY’2005-FY’2012
7.3.2. Market Share of Domestic and Foreign Insurers in Personal Accident Insurance Industry in Japan, FY’2012
7.3.3. Japan Personal Accident Insurance Market Future Outlook and Projection, FY’2013-FY’2016
7.4. Japan Marine and Inland Transit Insurance Industry
7.4.1. Japan Marine and Inland Transit Insurance Market Size and Introduction, FY’2005-FY’2012
7.4.2. Marine and Inland Transit Insurance Segmentation, FY’2005-FY’2012
7.4.3. Market Share of Domestic and Foreign Insurers in Marine and Inland Transit Insurance Industry in Japan, FY’2012
7.4.4. Japan Marine and Inland Transit Insurance Market Future Outlook and Projection, FY’2013-FY’2016
7.5. Japan Miscellaneous Casualty Insurance Industry
7.5.1. Japan Miscellaneous Casualty Insurance Market Size and Introduction, FY’2005-FY’2012
7.5.2. Miscellaneous Casualty Insurance Segmentation, FY’2005-FY’2012
7.5.3. Market Share of Domestic and Foreign Insuerers in Miscellaneous Casualty Insurance Industry in Japan, FY’2012
4
© This is a licensed product of Ken Research and should not be copied
7.5.4. Japan Miscellaneous Casualty Insurance Market Future Outlook and Projection, FY’2013-FY’2016
8. Japan Non-Life Insurance Market Future Outlook and Projection, FY’2013-FY’2016
9. Japan Insurance Industry Trends and Developments
10. Asia-Pacific Insurance Industry Future Outlook
10.1. Asia-Pacific Insurance Industry Future Projections
10.1.1. By Geography, 2013-2016
11. Japan Insurance Industry Future Outlook and Projections, FY’2013-FY’2016
11.1. Cause and Effect Relationship Between Dependent and Independent Factors Prevailing in Japan Insurance Market
12. Company Profile of Major Players in Japan Life Insurance Industry
12.1. Japan Post Insurance
12.1.1. Company Profile
12.1.2. Business Strategies
12.1.3. Financial Performance
12.2. Nippon Life Insurance
12.2.1. Company Overview
12.2.2. Business Strategies
12.2.3. Financial Performance
12.3. Meiji Yasuda Life Insurance
12.3.1. Company Overview
12.3.2. Business Strategies
12.3.3. Financial Performance
13. Company Profile of Major Players in Japan Non-Life Insurance Industry
13.1. MS&AD Insurance
5
© This is a licensed product of Ken Research and should not be copied
13.1.1. Company Overview
13.1.2. Business Strategies
13.1.3. Financial Performance
13.2. NKSJ Holdings
13.2.1. Company Overview
13.2.2. Business Strategies
13.2.3. Financial Performance
13.3. Tokio Marine and Nichido Fire
13.3.1. Company Overview
13.3.2. Business Strategies
13.3.3. Financial Performance
14. Japan Insurance Industry Macro-Economic Indicators: Historical and Projections
14.1. Japan Population, 2005-2016
14.2. GDP of Japan, 2005-2016
14.3. Healthcare Expenditure of Japan, 2005-2016
14.4. Total Vehicle in Use in Japan, 2005-2016
15. Appendix
15.1. Market Definitions
15.2. Abbreviations
15.3. Research Methodology
Data Collection Methods
Approach
Variables (Dependent and Independent)
Multi Factor Based Sensitivity Model

6
© This is a licensed product of Ken Research and should not be copied
Final Conclusion
15.4. Disclaimer
7
© This is a licensed product of Ken Research and should not be copied
LIST OF FIGURES
Figure 1: Asia-Pacific Insurance Market Size on the Basis of Direct Written Premium in USD Million, 2005-2012P
Figure 2: Asia-Pacific Insurance Market Segmentation by Life and non Life on the Basis of Direct Written Premium in Percentage, 2005-2012P
Figure 3: Japan Insurance Market Size on the Basis of Direct Written Premium in USD Million, FY’2005-FY’2012
Figure 4: Insurance Value Chain
Figure 5: Japan Life Insurance Market Size on the Basis of Direct Written Premium in USD Million, FY’2005-FY’2012
Figure 6: Japan life Insurance Market Segmentation by Individual Insurance and Annuities, Group Insurance and Annuities and Others on the Basis of Direct Written Premium in Percentage, FY’2005-FY’2012
Figure 7: Market Share of Major Life Insurers on the Basis of Direct Written Premium in Percentage, FY’2012
Figure 8: Japan Life Insurance Market Projections on the Basis of Direct Written Premium in USD Million, FY’2013-FY’2016
Figure 9: Japan Non Life Insurance Market Size on the Basis of Direct Written Premium in USD Million, FY’2005-FY’2012
Figure 10: Japan Non life Insurance Distribution Channel by Agents, Direct Sales and Broker on the Basis of Direct Written Premium in Percentage, FY’2010-FY’2012
Figure 11: Japan Non life Insurance Market Segmentation by Automobile, Fire, Personal Accident, Miscellaneous Casualty, Marine and Inland Transit on the Basis of Direct Written Premium in Percentage, 2005-2012
Figure 12: Japan Automobile Insurance Market Size on the Basis of Direct Written Premium in USD Million, FY’2005-FY’2012
Figure 13: Japan Automobile Insurance Market Size on the Basis of Net Written Premium in USD Million, FY’2005-FY’2012
8
© This is a licensed product of Ken Research and should not be copied
Figure 14: Japan Automobile Insurance Market Segmentation by Voluntary Automobile, and Compulsory Automobile Liability on the Basis of Direct Written Premium in Percentage, 2005-2012
Figure 15: Market Share of Domestic and Foreign Insurers in Automobile Insurance Industry on the Basis owithDirect Written Premium in Percentage, FY’2012
Figure 16: Japan Fire Insurance Market Size on the Basis of Direct Written Premium in USD Million, FY’2005-FY’2012
Figure 17: Japan Fire Insurance Market Size on the Basis of Net Written Premium in USD Million, 2005-2012
Figure 18: Market Share of Domestic and Foreign Insurers in Fire Insurance Industry on the Basis of Direct Written Premium in Percentage, FY’2012
Figure 19: Japan Fire Insurance Market Projections on the Basis of Direct Written Premium in USD Million, FY’2013-FY’2016
Figure 20: Japan Personal Accident Insurance Market Size on the Basis of Direct Written Premium in USD Million, FY’2005-FY’2012
Figure 21: Japan Personal Accident Insurance Market Size on the Basis of Net Written Premium in USD Million, FY’2005-FY’2012
Figure 22: Market Share of Domestic and Foreign Insurers in Personal Accident Insurance Industry on the Basis of Direct Written Premium in Percentage, FY’2012
Figure 23: Japan Personal Accident Insurance Market Projections on the Basis of Direct Written Premium in USD Million, FY’2013-FY’2016
Figure 24: Japan Marine and Inland Transit Insurance Market Size on the Basis of Direct Written Premium in USD Million, FY’2005-FY’2012
Figure 25: Japan Marine and Inland Transit Insurance Market Size on the Basis of Net Written Premium in USD Million, FY’2005-FY’2012
Figure 26: Japan Marine and Inland Transit Insurance Market Segmentation by Marine Cargo and Hull and Inland Transit Insurance on the Basis of Direct Written Premium in Percentage, FY’2005-FY’2012
Figure 27: Market Share of Domestic and Foreign Insurers in Marine and Inland Transit Insurance Industry on the Basis of Direct Written Premium in Percentage, FY’2012
9
© This is a licensed product of Ken Research and should not be copied
Figure 28: Japan Miscellaneous Casualty Insurance Market Size on the Basis of Direct Written Premium in USD Million, FY’2005-FY’2012
Figure 29: Japan Miscellaneous Casualty Insurance Market Size on the Basis of Net Written Premium in USD Million, FY’2005-FY’2012
Figure 30: Market Share of Domestic and Foreign Insurers in Miscellaneous Casualty Insurance Industry on the Basis of Direct Written Premium in Percentage, FY’201
Figure 31: Japan Miscellaneous Casualty Insurance Market Projections on the Basis of Direct Written Premium in USD Million, FY’2013-FY’2016
Figure 32: Japan Non life Insurance Market Projections on the Basis of Direct Written Premium in USD Million, FY’2013-FY’2016
Figure 33: Japan Insurance Market Projections on the Basis of Direct Written Premium in USD Million, 2013-2016
Figure 34: Japan Life Insurance Premium Income of Japan Post Insurance in USD Million, FY’2008-FY’2012
Figure 35: Japan Life Insurance Premium Income of Nippon Life Insurance in USD Million, FY’2005-FY’2012
Figure 36: Japan Life Insurance Premium Income of Meiji Yasuda Life Insurance in USD Million, FY’2005-FY’2012
Figure 37: Japan Life Insurance Net Premium Written of MS&AD Insurance in USD Million, FY’2008-FY’2012
Figure 38: Japan Life Insurance Net Written Premium of NSJK Holdings Insurance in USD Million, FY’2010-FY’2012
Figure 39: Japan Non-Life Insurance Net Written Premium of Tokio Marine and Nichido Fire Insurance in USD Million, FY’2005-FY’2012
Figure 40: Japan Population in Million, 2005-s2016
Figure 41: GDP of Japan in USD Million, 2005-2016
Figure 42: Healthcare Expenditure of Japan in USD Million, 2005-2016
Figure 43: Total Vehicle in Use in Japan in Million, 2005-2016
10
© This is a licensed product of Ken Research and should not be copied
LIST OF TABLES
Table 1: Asia-Pacific Insurance Market Segmentation by Countries on the Basis of Direct Written Premium in USD Billion, 2005-2012P
Table 2: Asia-Pacific Insurance Market Segmentation by Life and Non Life on the Basis of Direct Written Premium in USD Billion, 2005-2012P
Table 3: Japan life Insurance Market Segmentation by Individual Insurance and Annuities, Group Insurance and Annuities and Others on the Basis of Direct Written Premium in USD Million, FY’2005-FY’2012
Table 4: Market Share of Major Life Insurers on the Basis of Direct Written Premium in USD Million, FY’2012
Table 5: Japan Non life Insurance Market Segmentation by Agents, Direct Sales and Broker on the Basis of Direct Written Premium in USD Million, FY’2010-FY’2012
Table 6: Japan Automobile Insurance Market Segmentation by Voluntary Automobile, and Compulsory Automobile Liability on the Basis of Direct Written Premium in USD Million, FY’2005-FY’2012
Table 7: Market Share of Domestic and Foreign Insurers in Automobile Insurance Industry on the Basis of Direct Written Premium in USD Million, FY’2012
Table 8: Japan Automobile Insurance Market Projections on the Basis of Direct Written Premium in USD Million, 2013-2016
Table 9: Market Share of Domestic and Foreign Insurers in Fire Insurance Industry on the Basis of Direct Written Premium in USD Million, FY’2012
Table 10: Market Share of Domestic and Foreign Insurers in Personal Accident Insurance Industry on the Basis of Direct Written Premium in USD Million, FY’2012
Table 11: Japan Marine and Inland Transit Insurance Market Segmentation by Marine Cargo and Hull and Inland Transit Insurance on the Basis of Direct Written Premium in USD Million, FY’2005-FY’2012
Table 12: Market Share of Domestic and Foreign Insurers in Marine and Inland Transit Insurance Industry on the Basis of Direct Written Premium in USD Million, FY’2012
Table 13: Japan Marine and Inland Transit Insurance Market Projections on the Basis of Direct Written Premium in USD Million, FY’2013-FY’2016
11
© This is a licensed product of Ken Research and should not be copied
Table 14: Japan Miscellaneous Casualty Insurance Market Segmentation on the Basis of Direct Written Premium in Percentage, FY’2005-FY’2012
Table 15: Japan Miscellaneous Casualty Insurance Market Segmentation on the Basis of Direct Written Premium in USD Million, FY’2005-FY’2012
Table 16: Market Share of Domestic and Foreign Insurers in Miscellaneous Casualty Insurance Industry on the Basis of Direct Written Premium in USD Million, FY’2012
Table 17: Asia-Pacific Insurance Market Projections by Countries on the Basis of Direct Written Premium in USD Million, 2013-2016
Table 18: Cause and Effect Relationship Analysis between Industry Factors and Expected Industry Prospects of Japan Insurance Market
Table 19: Correlation Matrix of the Japan Insurance Industry
Table 20: Regression Coefficients Output of Japan Insurance Industry
12
© This is a licensed product of Ken Research and should not be copied
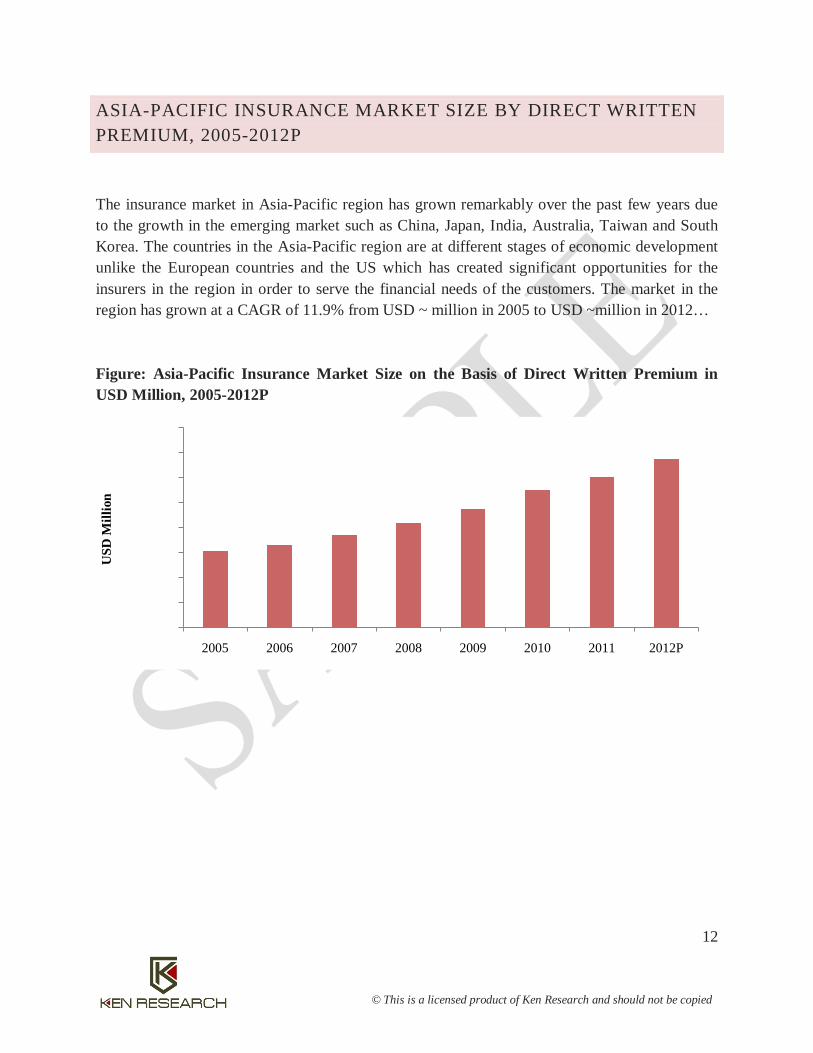
ASIA-PACIFIC INSURANCE MARKET SIZE BY DIRECT WRITTEN PREMIUM, 2005-2012P
The insurance market in Asia-Pacific region has grown remarkably over the past few years due to the growth in the emerging market such as China, Japan, India, Australia, Taiwan and South Korea. The countries in the Asia-Pacific region are at different stages of economic development unlike the European countries and the US which has created significant opportunities for the insurers in the region in order to serve the financial needs of the customers. The market in the region has grown at a CAGR of 11.9% from USD ~ million in 2005 to USD ~million in 2012…
Figure: Asia-Pacific Insurance Market Size on the Basis of Direct Written Premium in USD Million, 2005-2012P
0.0
2,00,000.0
4,00,000.0
6,00,000.0
8,00,000.0
10,00,000.0
12,00,000.0
14,00,000.0
16,00,000.0
2005 2006 2007 2008 2009 2010 2011 2012P
USD
Mill
ion
13
© This is a licensed product of Ken Research and should not be copied
China insurance industry is one of the predominant markets in the insurance industry in the Asia-Pacific region with a contribution of ~% of the direct written premium in the region in 2012.
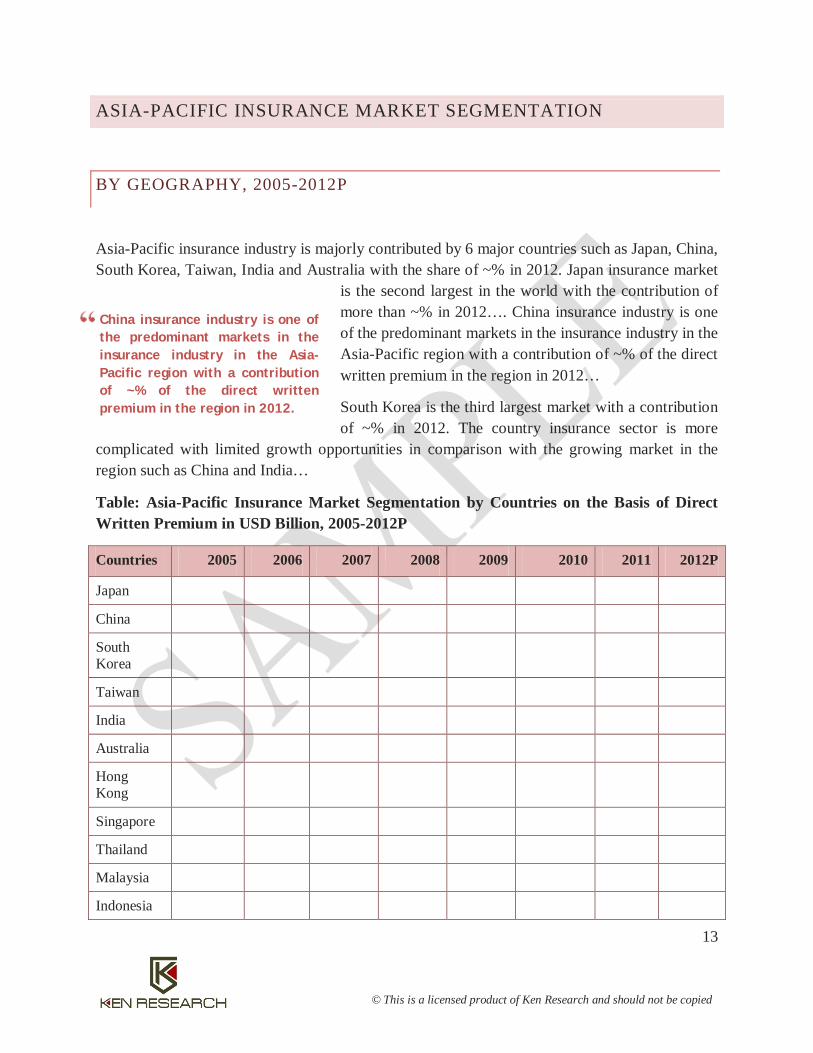
ASIA-PACIFIC INSURANCE MARKET SEGMENTATION
BY GEOGRAPHY, 2005-2012P
Asia-Pacific insurance industry is majorly contributed by 6 major countries such as Japan, China, South Korea, Taiwan, India and Australia with the share of ~% in 2012. Japan insurance market
is the second largest in the world with the contribution of more than ~% in 2012…. China insurance industry is one of the predominant markets in the insurance industry in the Asia-Pacific region with a contribution of ~% of the direct written premium in the region in 2012…
South Korea is the third largest market with a contribution of ~% in 2012. The country insurance sector is more
complicated with limited growth opportunities in comparison with the growing market in the region such as China and India…
Table: Asia-Pacific Insurance Market Segmentation by Countries on the Basis of Direct Written Premium in USD Billion, 2005-2012P
Countries 2005 2006 2007 2008 2009 2010 2011 2012P
Japan
China
South Korea
Taiwan
India
Australia
Hong Kong
Singapore
Thailand
Malaysia
Indonesia
14
© This is a licensed product of Ken Research and should not be copied
Japan insurance industry is the second largest market in the world after the US and has experienced a direct written premium of USD ~ million in FY’2012
New Zealand
Philippines
Vietnam
Pakistan
Kazakhstan
Bangladesh
Sri Lanka
Total
JAPAN INSURANCE INDUSTRY
JAPAN INSURANCE MARKET SIZE BY DIRECT WRITTEN PREMIUM, FY’2005-FY’2012
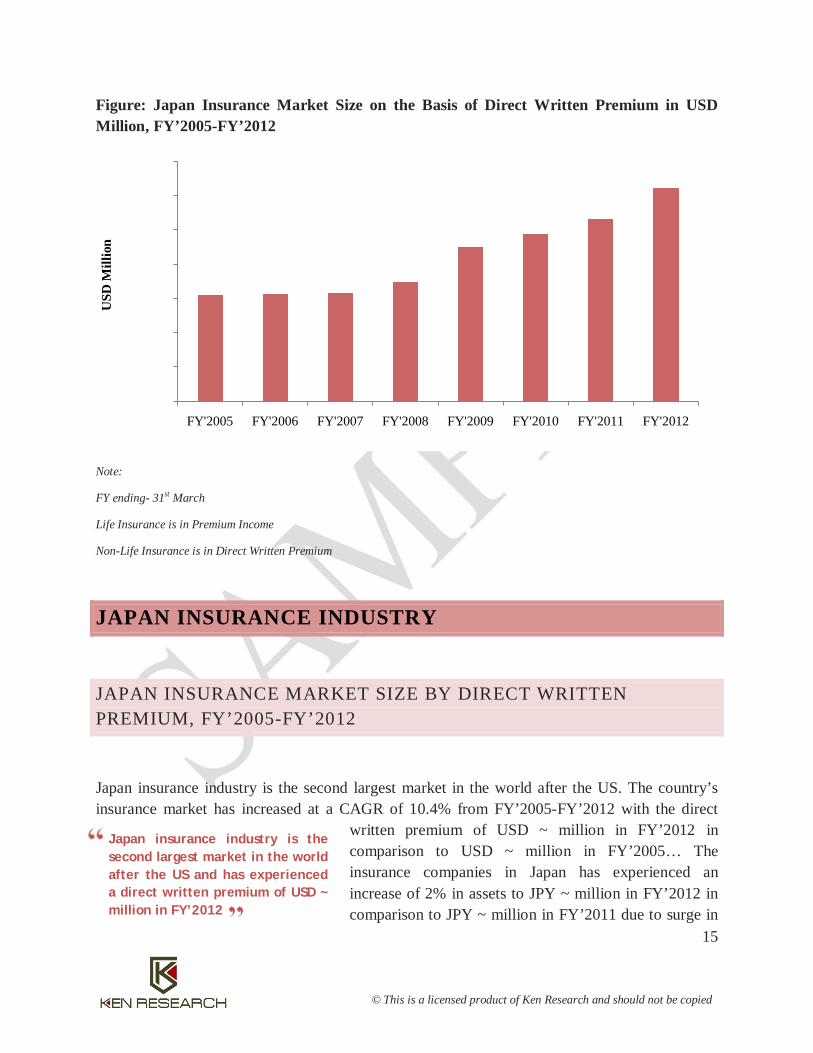
Japan insurance industry is the second largest market in the world after the US. The country’s insurance market has increased at a CAGR of 10.4% from FY’2005-FY’2012 with the direct
written premium of USD ~ million in FY’2012 in comparison to USD ~ million in FY’2005… The insurance companies in Japan has experienced an increase of 2% in assets to JPY ~ million in FY’2012 in comparison to JPY ~ million in FY’2011 due to surge in
unrealized capital gains which has inclined the value of investment assets.
…In FY’2011, the country insurance market comprised of only ~ life insurance companies in comparison to ~ life insurers in the US. The non life insurance industry of the country consisted of ~ domestic players and ~ foreign insurers offering their products in FY’2011…
15
© This is a licensed product of Ken Research and should not be copied
Japan insurance industry is the second largest market in the world after the US and has experienced a direct written premium of USD ~ million in FY’2012
Figure: Japan Insurance Market Size on the Basis of Direct Written Premium in USD Million, FY’2005-FY’2012
Note:
FY ending- 31st March
Life Insurance is in Premium Income
Non-Life Insurance is in Direct Written Premium
JAPAN INSURANCE INDUSTRY
JAPAN INSURANCE MARKET SIZE BY DIRECT WRITTEN PREMIUM, FY’2005-FY’2012
Japan insurance industry is the second largest market in the world after the US. The country’s insurance market has increased at a CAGR of 10.4% from FY’2005-FY’2012 with the direct
written premium of USD ~ million in FY’2012 in comparison to USD ~ million in FY’2005… The insurance companies in Japan has experienced an increase of 2% in assets to JPY ~ million in FY’2012 in comparison to JPY ~ million in FY’2011 due to surge in
0.0
1,00,000.0
2,00,000.0
3,00,000.0
4,00,000.0
5,00,000.0
6,00,000.0
7,00,000.0
FY'2005 FY'2006 FY'2007 FY'2008 FY'2009 FY'2010 FY'2011 FY'2012
USD
Mill
ion
16
© This is a licensed product of Ken Research and should not be copied
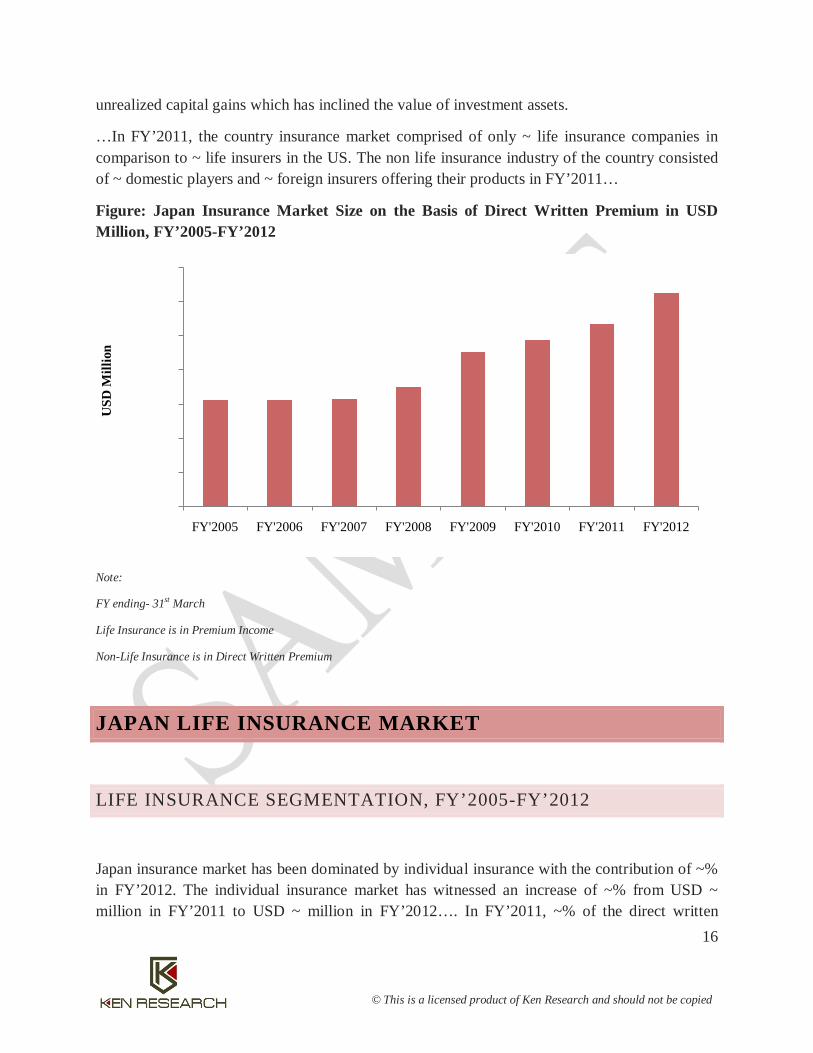
unrealized capital gains which has inclined the value of investment assets.
…In FY’2011, the country insurance market comprised of only ~ life insurance companies in comparison to ~ life insurers in the US. The non life insurance industry of the country consisted of ~ domestic players and ~ foreign insurers offering their products in FY’2011…
Figure: Japan Insurance Market Size on the Basis of Direct Written Premium in USD Million, FY’2005-FY’2012
Note:
FY ending- 31st March
Life Insurance is in Premium Income
Non-Life Insurance is in Direct Written Premium
JAPAN LIFE INSURANCE MARKET
LIFE INSURANCE SEGMENTATION, FY’2005-FY’2012
Japan insurance market has been dominated by individual insurance with the contribution of ~% in FY’2012. The individual insurance market has witnessed an increase of ~% from USD ~ million in FY’2011 to USD ~ million in FY’2012…. In FY’2011, ~% of the direct written
0.0
1,00,000.0
2,00,000.0
3,00,000.0
4,00,000.0
5,00,000.0
6,00,000.0
7,00,000.0
FY'2005 FY'2006 FY'2007 FY'2008 FY'2009 FY'2010 FY'2011 FY'2012
USD
Mill
ion
17
© This is a licensed product of Ken Research and should not be copied
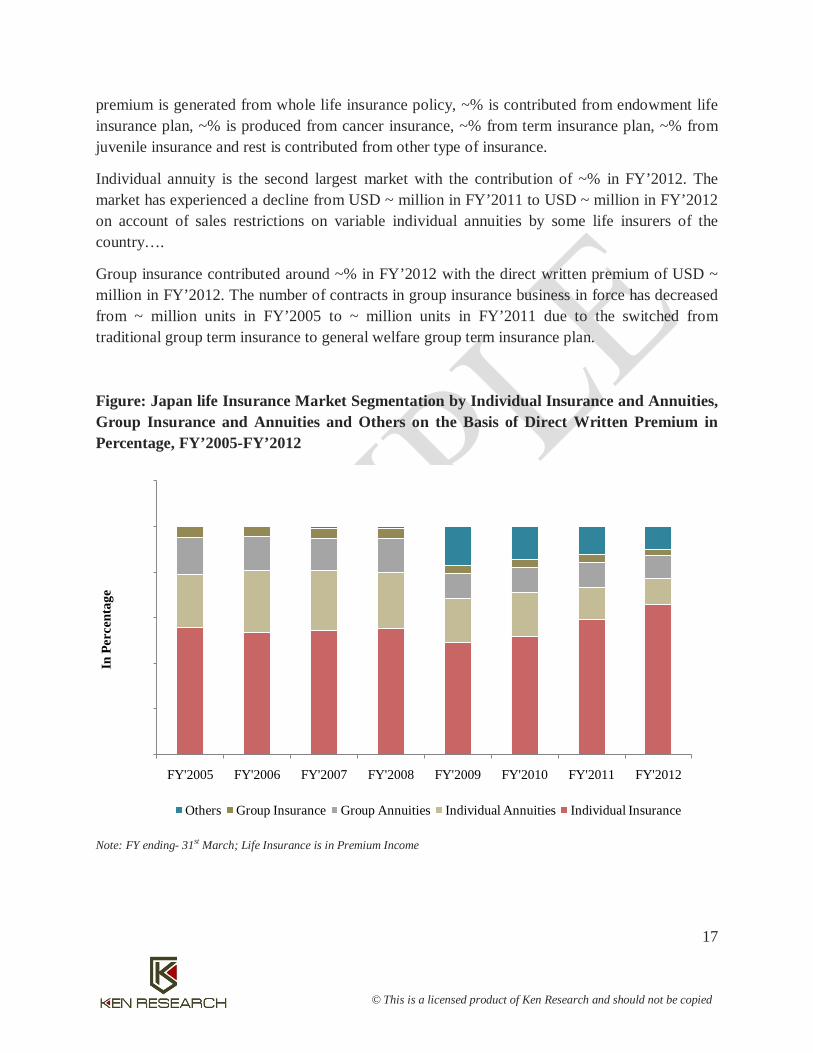
premium is generated from whole life insurance policy, ~% is contributed from endowment life insurance plan, ~% is produced from cancer insurance, ~% from term insurance plan, ~% from juvenile insurance and rest is contributed from other type of insurance.
Individual annuity is the second largest market with the contribution of ~% in FY’2012. The market has experienced a decline from USD ~ million in FY’2011 to USD ~ million in FY’2012 on account of sales restrictions on variable individual annuities by some life insurers of the country….
Group insurance contributed around ~% in FY’2012 with the direct written premium of USD ~ million in FY’2012. The number of contracts in group insurance business in force has decreased from ~ million units in FY’2005 to ~ million units in FY’2011 due to the switched from traditional group term insurance to general welfare group term insurance plan.
Figure: Japan life Insurance Market Segmentation by Individual Insurance and Annuities, Group Insurance and Annuities and Others on the Basis of Direct Written Premium in Percentage, FY’2005-FY’2012
Note: FY ending- 31st March; Life Insurance is in Premium Income
0.0
0.2
0.4
0.6
0.8
1.0
1.2
FY'2005 FY'2006 FY'2007 FY'2008 FY'2009 FY'2010 FY'2011 FY'2012
In P
erce
ntag
e
Others Group Insurance Group Annuities Individual Annuities Individual Insurance
18
© This is a licensed product of Ken Research and should not be copied
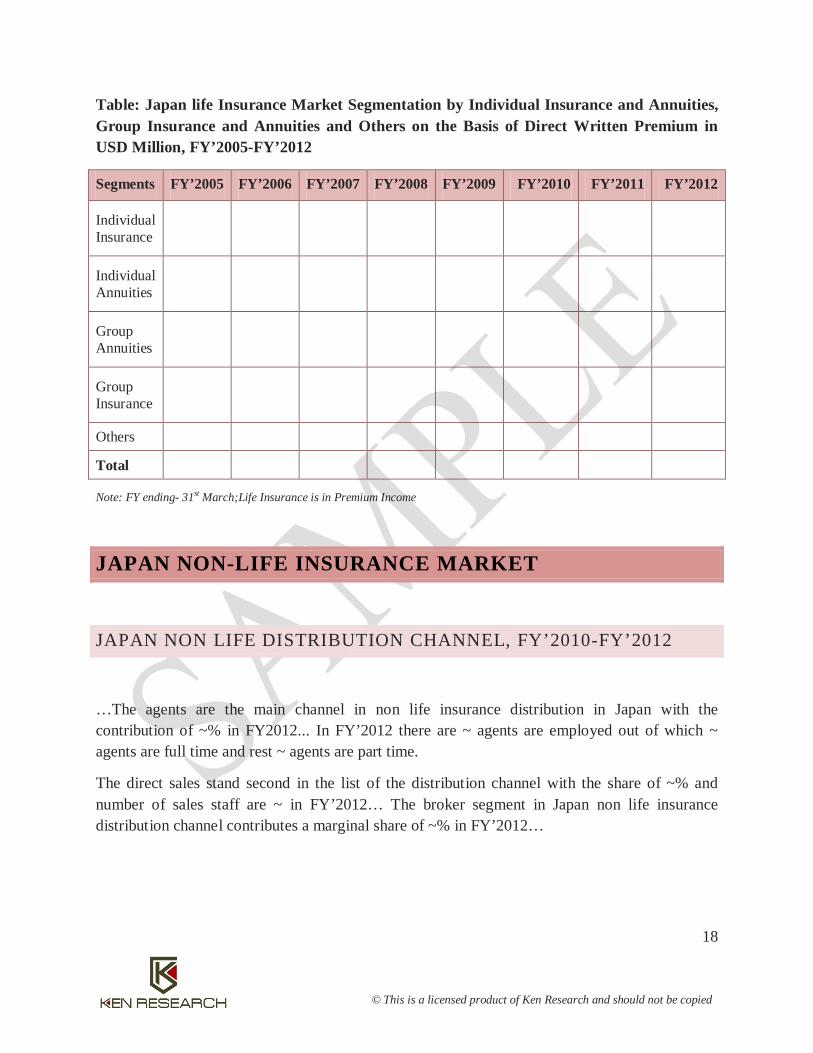
Table: Japan life Insurance Market Segmentation by Individual Insurance and Annuities, Group Insurance and Annuities and Others on the Basis of Direct Written Premium in USD Million, FY’2005-FY’2012
Segments FY’2005 FY’2006 FY’2007 FY’2008 FY’2009 FY’2010 FY’2011 FY’2012
Individual Insurance
Individual Annuities
Group Annuities
Group Insurance
Others
Total
Note: FY ending- 31st March;Life Insurance is in Premium Income
JAPAN NON-LIFE INSURANCE MARKET
JAPAN NON LIFE DISTRIBUTION CHANNEL, FY’2010-FY’2012
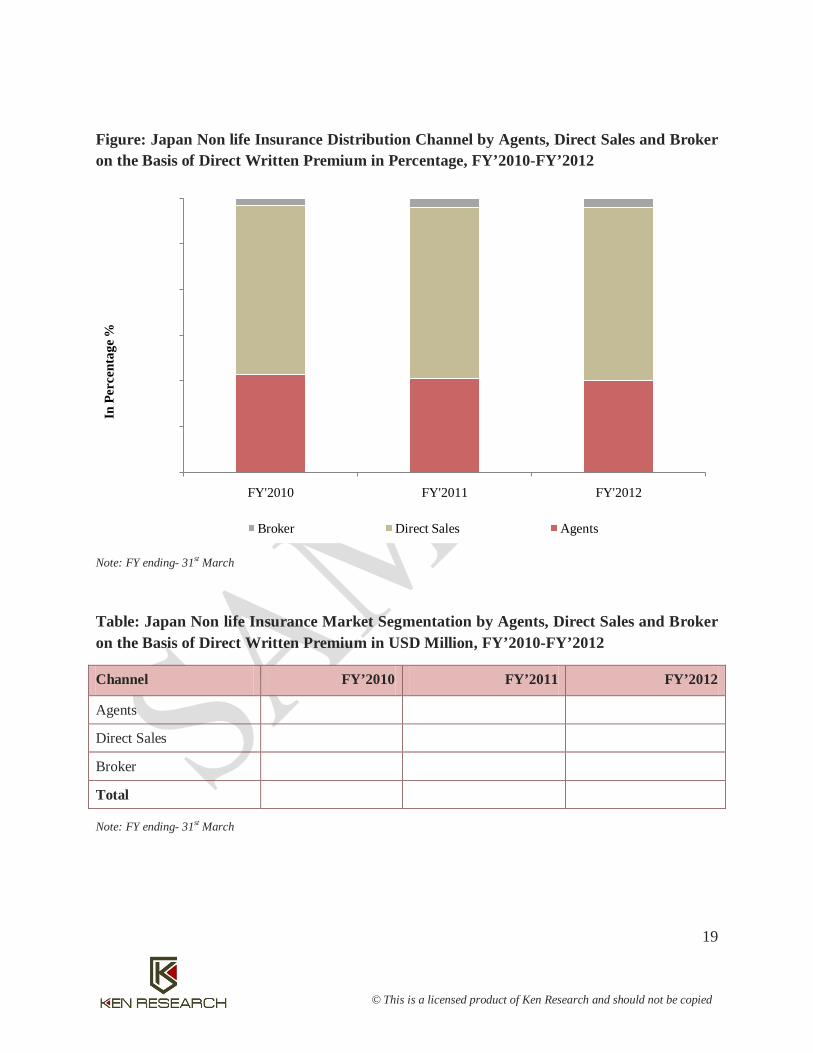
…The agents are the main channel in non life insurance distribution in Japan with the contribution of ~% in FY2012... In FY’2012 there are ~ agents are employed out of which ~ agents are full time and rest ~ agents are part time.
The direct sales stand second in the list of the distribution channel with the share of ~% and number of sales staff are ~ in FY’2012… The broker segment in Japan non life insurance distribution channel contributes a marginal share of ~% in FY’2012…
19
© This is a licensed product of Ken Research and should not be copied
Figure: Japan Non life Insurance Distribution Channel by Agents, Direct Sales and Broker on the Basis of Direct Written Premium in Percentage, FY’2010-FY’2012
Note: FY ending- 31st March
Table: Japan Non life Insurance Market Segmentation by Agents, Direct Sales and Broker on the Basis of Direct Written Premium in USD Million, FY’2010-FY’2012
Channel FY’2010 FY’2011 FY’2012
Agents
Direct Sales
Broker
Total
Note: FY ending- 31st March
88.0%
90.0%
92.0%
94.0%
96.0%
98.0%
100.0%
FY'2010 FY'2011 FY'2012
In P
erce
ntag
e %
Broker Direct Sales Agents
20
© This is a licensed product of Ken Research and should not be copied
JAPAN AUTOMOBILE INSURANCE INDUSTRY
MARKET SHARE OF DOMESTIC AND FOREIGN INSURERS IN AUTOMOBILE INSURANCE INDUSTRY IN JAPAN, FY’2012
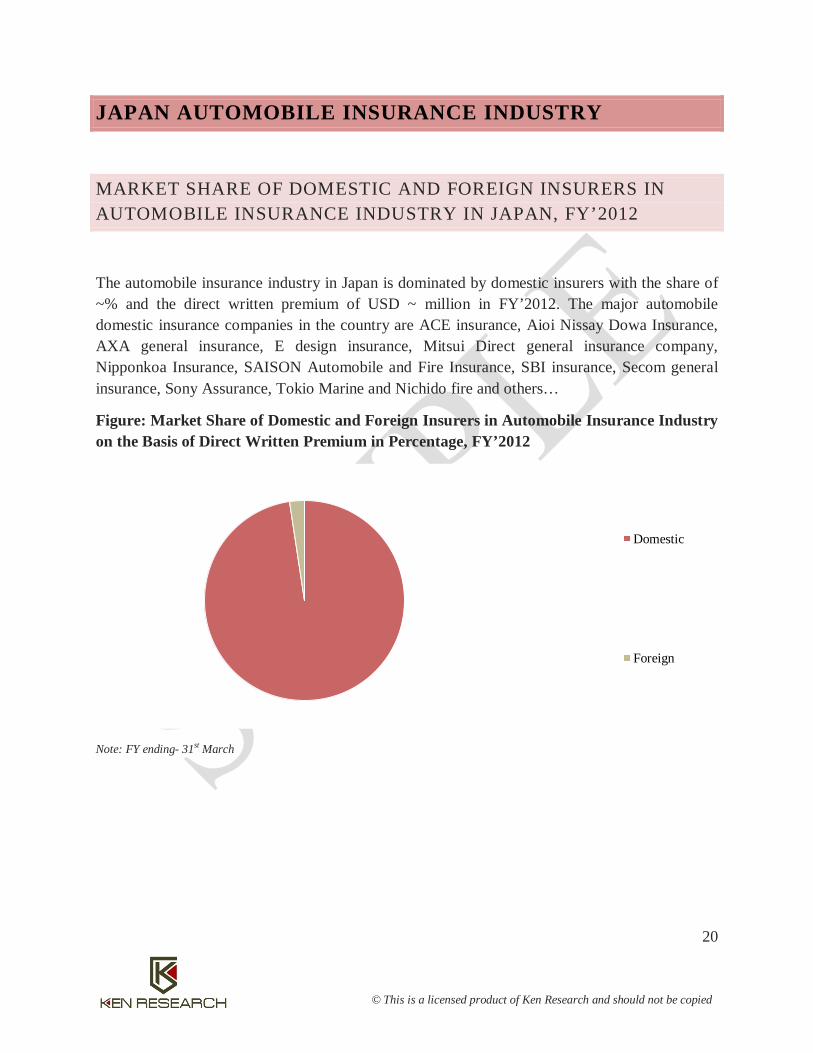
The automobile insurance industry in Japan is dominated by domestic insurers with the share of ~% and the direct written premium of USD ~ million in FY’2012. The major automobile domestic insurance companies in the country are ACE insurance, Aioi Nissay Dowa Insurance, AXA general insurance, E design insurance, Mitsui Direct general insurance company, Nipponkoa Insurance, SAISON Automobile and Fire Insurance, SBI insurance, Secom general insurance, Sony Assurance, Tokio Marine and Nichido fire and others…
Figure: Market Share of Domestic and Foreign Insurers in Automobile Insurance Industry on the Basis of Direct Written Premium in Percentage, FY’2012
Note: FY ending- 31st March
Domestic
Foreign
21
© This is a licensed product of Ken Research and should not be copied
Table: Market Share of Domestic and Foreign Insurers in Automobile Insurance Industry on the Basis of Direct Written Premium in USD Million, FY’2012
Players FY’2012
Domestic Insurers
Foreign Insurers
Total
Note: FY ending- 31st March
JAPAN PERSONAL ACCIDENT INSURANCE INDUSTRY
JAPAN PERSONAL ACCIDENT INSURANCE MARKET FUTURE OUTLOOK AND PROJECTION, FY’2013-FY’2016
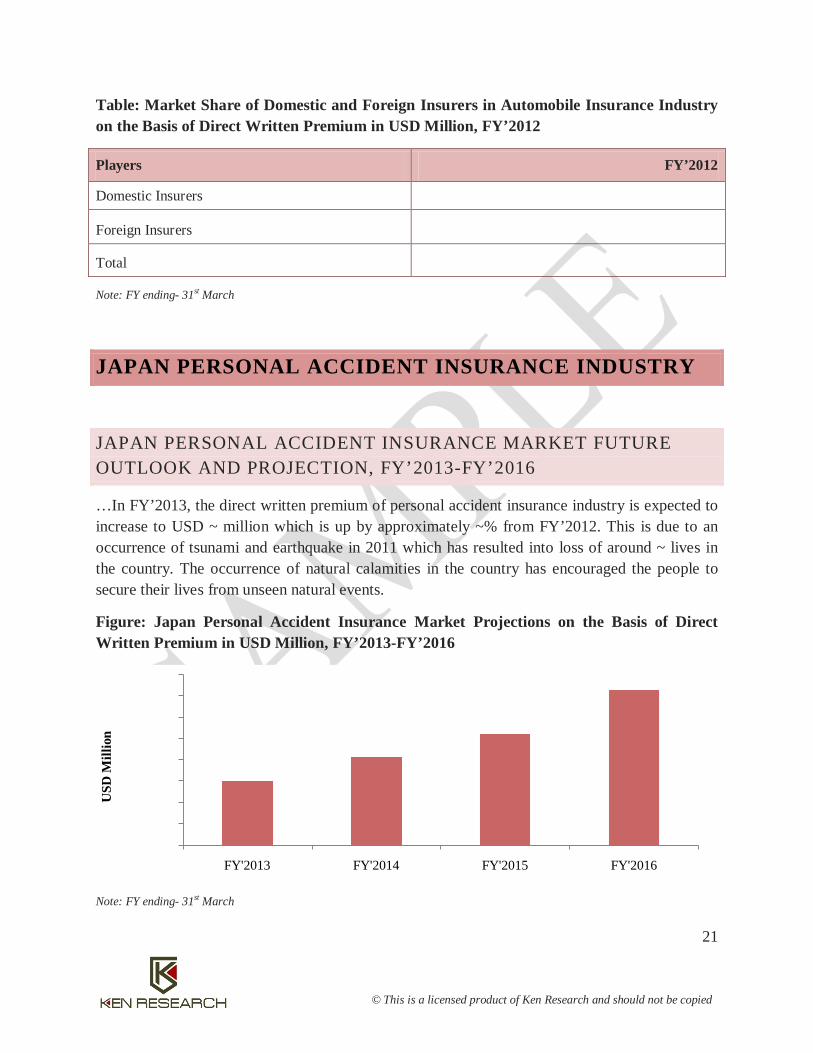
…In FY’2013, the direct written premium of personal accident insurance industry is expected to increase to USD ~ million which is up by approximately ~% from FY’2012. This is due to an occurrence of tsunami and earthquake in 2011 which has resulted into loss of around ~ lives in the country. The occurrence of natural calamities in the country has encouraged the people to secure their lives from unseen natural events.
Figure: Japan Personal Accident Insurance Market Projections on the Basis of Direct Written Premium in USD Million, FY’2013-FY’2016
Note: FY ending- 31st March
13,000.013,200.013,400.013,600.013,800.014,000.014,200.014,400.014,600.0
FY'2013 FY'2014 FY'2015 FY'2016
USD
Mill
ion
22
© This is a licensed product of Ken Research and should not be copied
JAPAN MARINE AND INLAND TRANSIT INSURANCE INDUSTRY
MARINE AND INLAND TRANSIT INSURANCE SEGMENTATION, FY’2005-FY’2012
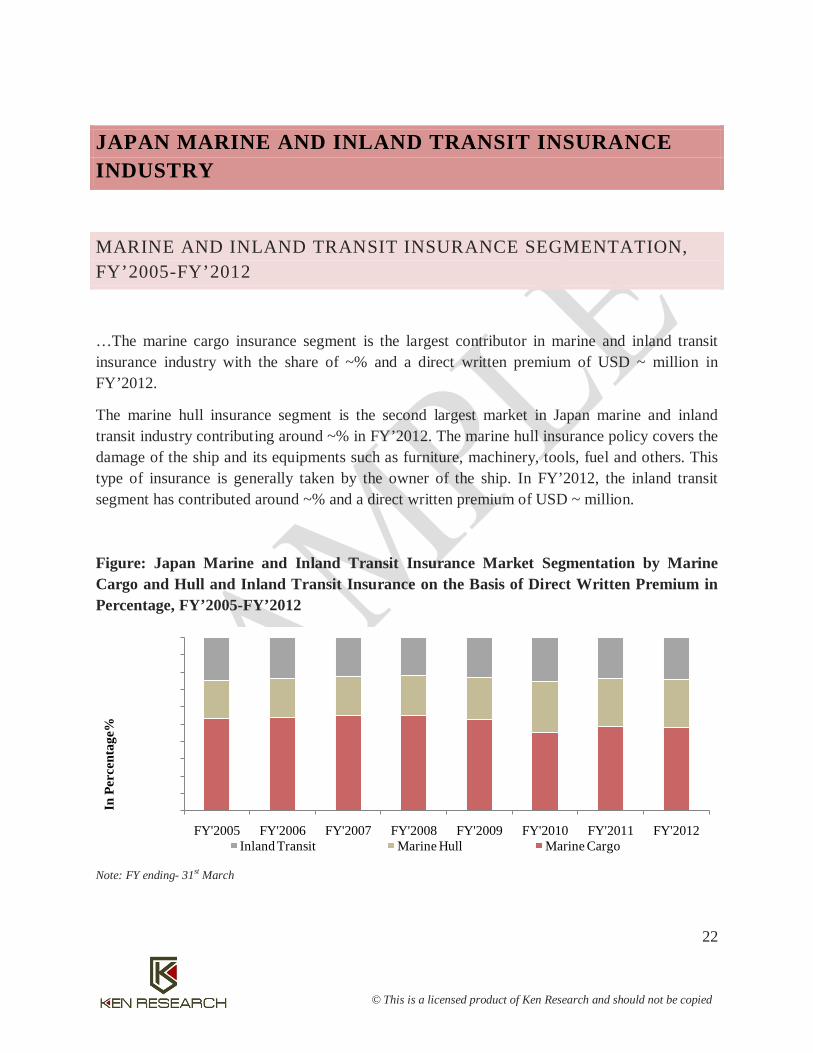
…The marine cargo insurance segment is the largest contributor in marine and inland transit insurance industry with the share of ~% and a direct written premium of USD ~ million in FY’2012.
The marine hull insurance segment is the second largest market in Japan marine and inland transit industry contributing around ~% in FY’2012. The marine hull insurance policy covers the damage of the ship and its equipments such as furniture, machinery, tools, fuel and others. This type of insurance is generally taken by the owner of the ship. In FY’2012, the inland transit segment has contributed around ~% and a direct written premium of USD ~ million.
Figure: Japan Marine and Inland Transit Insurance Market Segmentation by Marine Cargo and Hull and Inland Transit Insurance on the Basis of Direct Written Premium in Percentage, FY’2005-FY’2012
Note: FY ending- 31st March
0.0%10.0%20.0%30.0%40.0%50.0%60.0%70.0%80.0%90.0%
100.0%
FY'2005 FY'2006 FY'2007 FY'2008 FY'2009 FY'2010 FY'2011 FY'2012
In P
erce
ntag
e%
Inland Transit Marine Hull Marine Cargo
23
© This is a licensed product of Ken Research and should not be copied
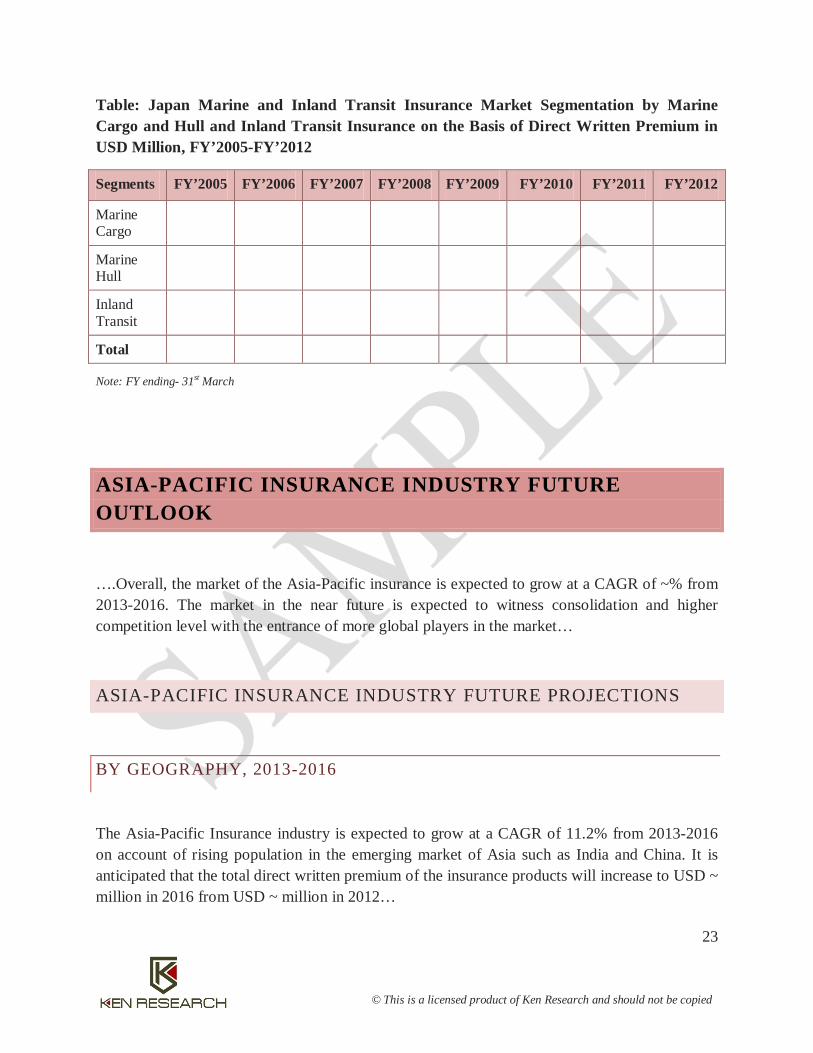
Table: Japan Marine and Inland Transit Insurance Market Segmentation by Marine Cargo and Hull and Inland Transit Insurance on the Basis of Direct Written Premium in USD Million, FY’2005-FY’2012
Segments FY’2005 FY’2006 FY’2007 FY’2008 FY’2009 FY’2010 FY’2011 FY’2012
Marine Cargo
Marine Hull
Inland Transit
Total
Note: FY ending- 31st March
ASIA-PACIFIC INSURANCE INDUSTRY FUTURE OUTLOOK
….Overall, the market of the Asia-Pacific insurance is expected to grow at a CAGR of ~% from 2013-2016. The market in the near future is expected to witness consolidation and higher competition level with the entrance of more global players in the market…
ASIA-PACIFIC INSURANCE INDUSTRY FUTURE PROJECTIONS
BY GEOGRAPHY, 2013-2016
The Asia-Pacific Insurance industry is expected to grow at a CAGR of 11.2% from 2013-2016 on account of rising population in the emerging market of Asia such as India and China. It is anticipated that the total direct written premium of the insurance products will increase to USD ~ million in 2016 from USD ~ million in 2012…
24
© This is a licensed product of Ken Research and should not be copied
Table: Asia-Pacific Insurance Market Projections by Countries on the Basis of Direct Written Premium in USD Million, 2013-2016
Countries 2013 2014 2015 2016
Japan
China
South Korea
Taiwan
India
Australia
Hong Kong
Singapore
Thailand
Malaysia
Indonesia
New Zealand
Philippines
Vietnam
Pakistan
Kazakhstan
Bangladesh
Sri Lanka
Total
25
© This is a licensed product of Ken Research and should not be copied
JAPAN INSURANCE INDUSTRY FUTURE OUTLOOK AND PROJECTIONS, FY’2013-FY’2016
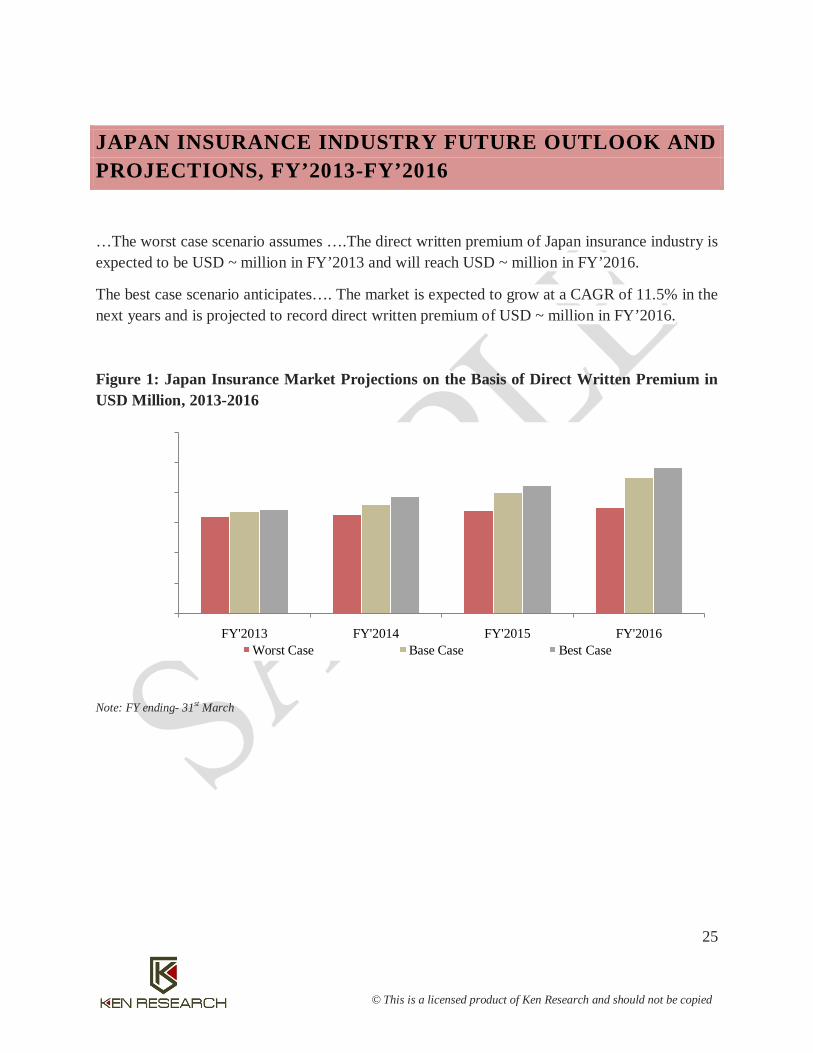
…The worst case scenario assumes ….The direct written premium of Japan insurance industry is expected to be USD ~ million in FY’2013 and will reach USD ~ million in FY’2016.
The best case scenario anticipates…. The market is expected to grow at a CAGR of 11.5% in the next years and is projected to record direct written premium of USD ~ million in FY’2016.
Figure 1: Japan Insurance Market Projections on the Basis of Direct Written Premium in USD Million, 2013-2016
Note: FY ending- 31st March
0.0
2,00,000.0
4,00,000.0
6,00,000.0
8,00,000.0
10,00,000.0
12,00,000.0
FY'2013 FY'2014 FY'2015 FY'2016Worst Case Base Case Best Case
26
© This is a licensed product of Ken Research and should not be copied
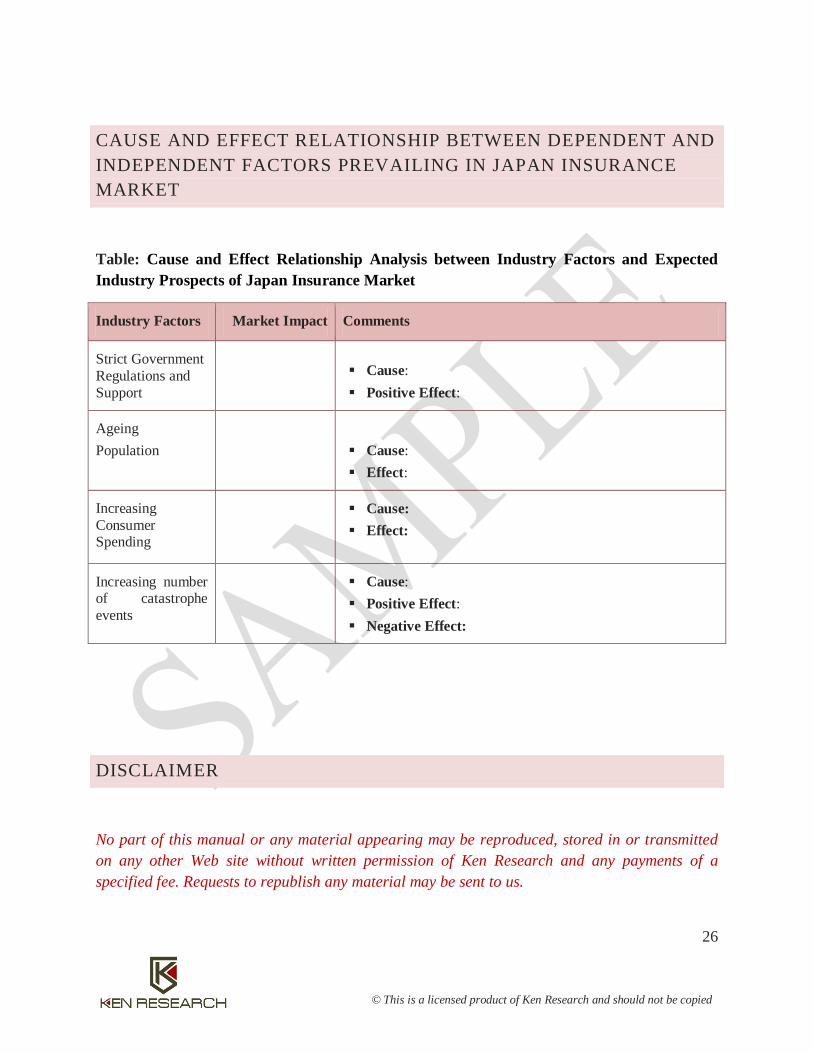
CAUSE AND EFFECT RELATIONSHIP BETWEEN DEPENDENT AND INDEPENDENT FACTORS PREVAILING IN JAPAN INSURANCE MARKET
Table: Cause and Effect Relationship Analysis between Industry Factors and Expected Industry Prospects of Japan Insurance Market
Industry Factors Market Impact Comments
Strict Government Regulations and Support
Cause: Positive Effect:
Ageing Population
Cause: Effect:
Increasing Consumer Spending
Cause: Effect:
Increasing number of catastrophe events
Cause: Positive Effect: Negative Effect:
DISCLAIMER
No part of this manual or any material appearing may be reproduced, stored in or transmitted on any other Web site without written permission of Ken Research and any payments of a specified fee. Requests to republish any material may be sent to us.
Related Documents