Japan in the 21 st Century Robert Croker Japanese Society II: Contemporary Japan Center for Japanese Studies Nanzan University

Japan in the 21st Century
Jul 14, 2015
Welcome message from author
This document is posted to help you gain knowledge. Please leave a comment to let me know what you think about it! Share it to your friends and learn new things together.
Transcript

Japan in the 21st Century
Robert Croker
Japanese Society II: Contemporary Japan
Center for Japanese Studies
Nanzan University

Contents
1. demographic change:
demography is destiny
2. economic change:
macroeconomic blues
3. socioeconomic change:
(not) sharing the pie

1. Demographic Change:
demography is destiny

Japan’s population
life expectancy at birthGINI Country Report Japan
Page 59
Figure 3.15: Life expectancy at birth by gender
Sources: Complete L
i
fe Table and Ab ridged Life Table (Statistics and Information De p artment, Minister’s
Secretariat, MHLW).
Note: People born in Okinawa prefecture are excluded from calculations before 1970.
Health is not only measured by life expectancy. Living actively is another important measure of health.
Comprehensive Survey on Living Conditions (MHLW) enquires about “self-reported state of health”
and “frequency of visits to a doctor.” The report states that about 8% of respondents had some health
problems and went to clinics or hospitals in 2010. The report also shows that the number of
unhealthy people increased between 1998 and 2007, and subsequently decreased. Considered that
Japan’s economy was in a fairly severe state between 1998 and 2001, relatively good state between
2001 and 2007, and subsequently in a little worse state, the state of health of people seems not to
move simply in accordance with economic conditions, although the increase in the number of
unhealthy people may be partly due to population aging.
Comprehensive Survey on Living Conditions also asks respondents about their health consciousness
and subjective health conditions. Figure 3.16 shows differences in subjective health between those
with different educational attainments. People with low educational levels report an unhealthy state,
60
65
70
75
80
85
90
19
61
19
62
19
63
19
64
19
65
19
66
19
67
19
68
19
69
19
70
19
71
19
72
19
73
19
74
19
75
19
76
19
77
19
78
19
79
19
80
19
81
19
82
19
83
19
84
19
85
19
86
19
87
19
88
19
89
19
90
19
91
19
92
19
93
19
94
19
95
19
96
19
97
19
98
19
99
20
00
20
01
20
02
20
03
20
04
20
05
20
06
20
07
20
08
20
09
20
10
(years)
Life expectancy at birth, female (years) Life expectancy at birth, total (years)
Life expectancy at birth, male (years)
Ohtake, F., Kohara, M., Okuyama, N, Yamada K. (2013). Growing inequalities and their impacts on Japan.

birth and death rates
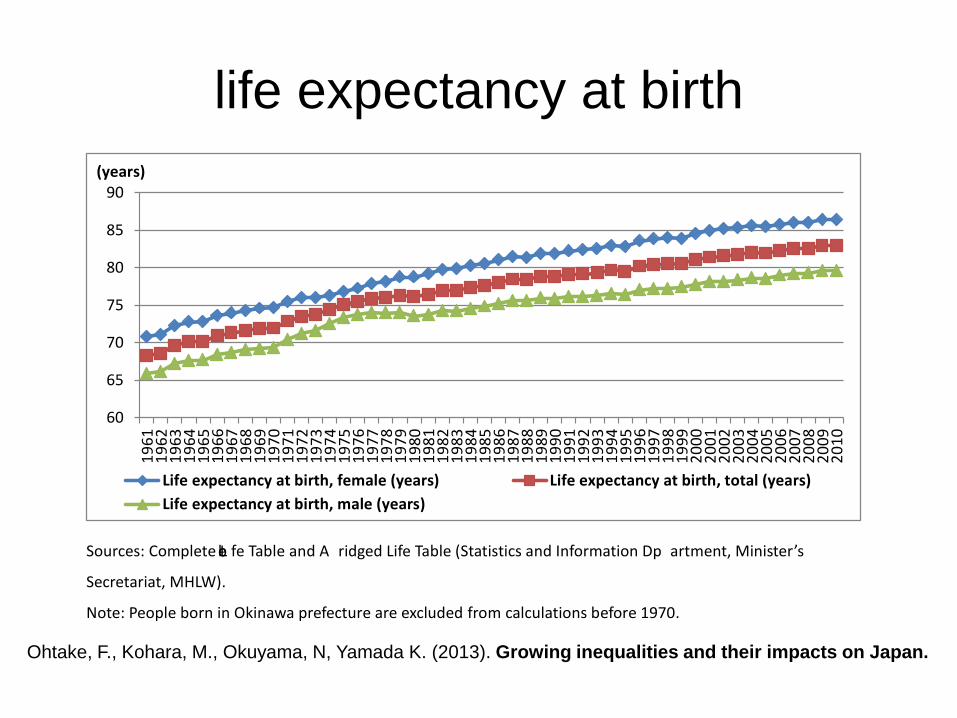
ageing Japan
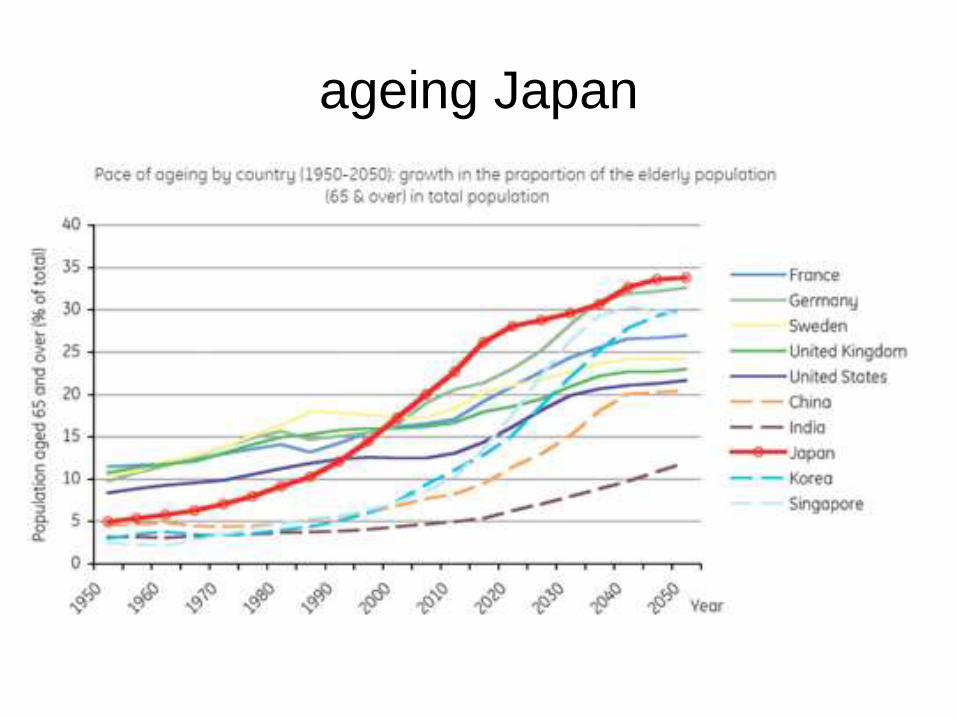
population pyramid

2. Economic Change:
macroeconomic blues

Ohtake, F., Kohara, M., Okuyama, N, Yamada K. (2013). Growing inequalities and their impacts on Japan.
nominal GDP:
North America, China, Japan

Ohtake, F., Kohara, M., Okuyama, N, Yamada K. (2013). Growing inequalities and their impacts on Japan.
inflation rate
GINI Country Report Japan
Page 84
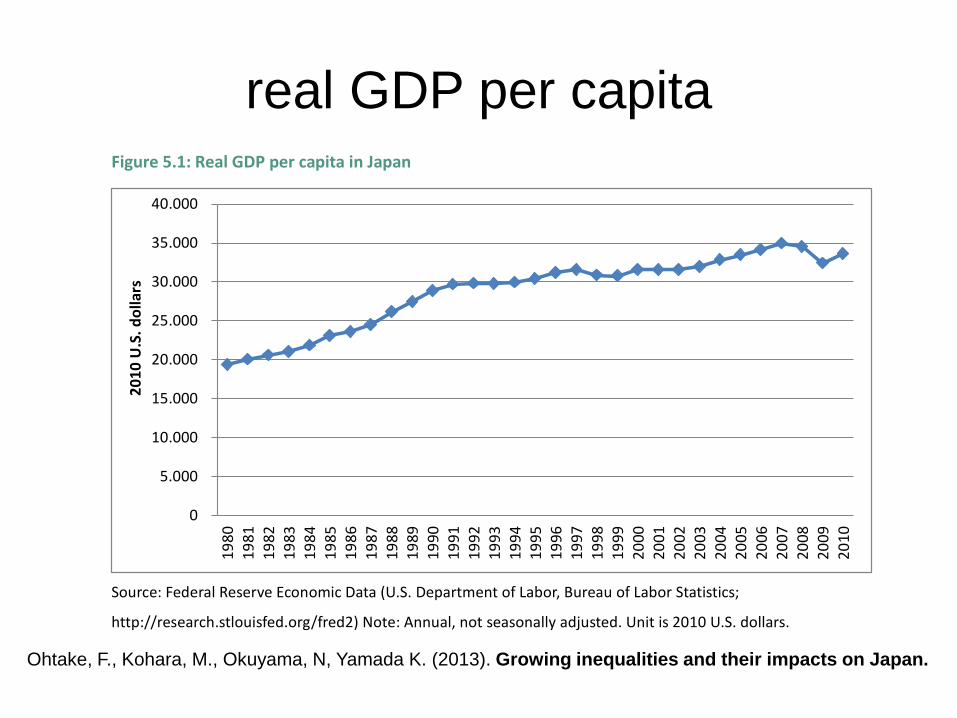
Figure 5.1: Real GDP per capita in Japan
Source: Federal Reserve Economic Data (U.S. Department of Labor, Bureau of Labor Statistics;
http://research.stlouisfed.org/fred2) Note: Annual, not seasonally adjusted. Unit is 2010 U.S. dollars.
Figure 5.2: Consumer Price Index for all items (index 2005=100)
Source: Main Economic Indicators (Organization for Economic Co-operation and Development)
0
5.000
10.000
15.000
20.000
25.000
30.000
35.000
40.000
19
80
19
81
19
82
19
83
19
84
19
85
19
86
19
87
19
88
19
89
19
90
19
91
19
92
19
93
19
94
19
95
19
96
19
97
19
98
19
99
20
00
20
01
20
02
20
03
20
04
20
05
20
06
20
07
20
08
20
09
20
10
20
10
U.S
. d
olla
rs
0
20
40
60
80
100
120
19
70
-01
-01
19
71
-08
-01
19
73
-03
-01
19
74
-10
-01
19
76
-05
-01
19
77
-12
-01
19
79
-07
-01
19
81
-02
-01
19
82
-09
-01
19
84
-04
-01
19
85
-11
-01
19
87
-06
-01
19
89
-01
-01
19
90
-08
-01
19
92
-03
-01
19
93
-10
-01
19
95
-05
-01
19
96
-12
-01
19
98
-07
-01
20
00
-02
-01
20
01
-09
-01
20
03
-04
-01
20
04
-11
-01
20
06
-06
-01
20
08
-01
-01
20
09
-08
-01
20
11
-03
-01
Ohtake, F., Kohara, M., Okuyama, N, Yamada K. (2013). Growing inequalities and their impacts on Japan.
GINI Country Report Japan
Page 84
Figure 5.1: Real GDP per capita in Japan
Source: Federal Reserve Economic Data (U.S. Department of Labor, Bureau of Labor Statistics;
http://research.stlouisfed.org/fred2) Note: Annual, not seasonally adjusted. Unit is 2010 U.S. dollars.
Figure 5.2: Consumer Price Index for all items (index 2005=100)
Source: Main Economic Indicators (Organization for Economic Co-operation and Development)
0
5.000
10.000
15.000
20.000
25.000
30.000
35.000
40.000
19
80
19
81
19
82
19
83
19
84
19
85
19
86
19
87
19
88
19
89
19
90
19
91
19
92
19
93
19
94
19
95
19
96
19
97
19
98
19
99
20
00
20
01
20
02
20
03
20
04
20
05
20
06
20
07
20
08
20
09
20
10
20
10
U.S
. d
olla
rs
0
20
40
60
80
100
120
19
70
-01
-01
19
71
-08
-01
19
73
-03
-01
19
74
-10
-01
19
76
-05
-01
19
77
-12
-01
19
79
-07
-01
19
81
-02
-01
19
82
-09
-01
19
84
-04
-01
19
85
-11
-01
19
87
-06
-01
19
89
-01
-01
19
90
-08
-01
19
92
-03
-01
19
93
-10
-01
19
95
-05
-01
19
96
-12
-01
19
98
-07
-01
20
00
-02
-01
20
01
-09
-01
20
03
-04
-01
20
04
-11
-01
20
06
-06
-01
20
08
-01
-01
20
09
-08
-01
20
11
-03
-01
real GDP per capita

Ohtake, F., Kohara, M., Okuyama, N, Yamada K. (2013). Growing inequalities and their impacts on Japan.
government debt as % of GDPGINI Country Report Japan
Page 85
Figure 5.3: Government Debt as a % of GDP
Source: World Economic Outlook (International Monetary Fund)
Note. Gross debt consists of all liabilities that require payment or payments of interest and/or principal by the
debtor to the creditor at a date or dates in the future. This includes debt liabilities in the form of Special
Drawing Rights (SDRs), currency and deposits, debt securities, loans, insurance, pensions and standardized
guarantee schemes, and other accounts payable. Debt can be valued at current market, nominal, or face values.
http://research.stlouisfed.org/fred2/series/GGGDTPJPA188N.
5.2 Minimum Wage
The following sections summarize government policies related to inequality. Figure 5.4 shows that
the minimum wage has increased since 1997, stayed at the same level from 2001 to 2005, but
increased again from 2007. However, the relative level of the minimum wage to average wage in the
country—the Kaitz index—has not changed tremendously. Figure 5.5 shows the Kaitz index for males
and females, respectively. For males, the minimum wage level unchanged during 1980s, decreased
between 1990 and 1993, and then slightly increased after that. For females, it unchanged during
1980s, decreased largely between 1990 and 1993, stayed at the same level until 2004, and increased
after that. That is, through the entire period from 1980 till 2009, the relative level of minimum wage
is rather constant. The increase in the minimum wage is thought to have only small effects on
alleviating existing levels of income inequality (Kawaguchi and Mori, 2009).
0
50
100
150
200
250
19
80
19
81
19
82
19
83
19
84
19
85
19
86
19
87
19
88
19
89
19
90
19
91
19
92
19
93
19
94
19
95
19
96
19
97
19
98
19
99
20
00
20
01
20
02
20
03
20
04
20
05
20
06
20
07
20
08
20
09
20
10
3. Socio-economic Change:
(not) sharing the pie
Ohtake, F., Kohara, M., Okuyama, N, Yamada K. (2013). Growing inequalities and their impacts on Japan.
GINI Country Report Japan
Page 26
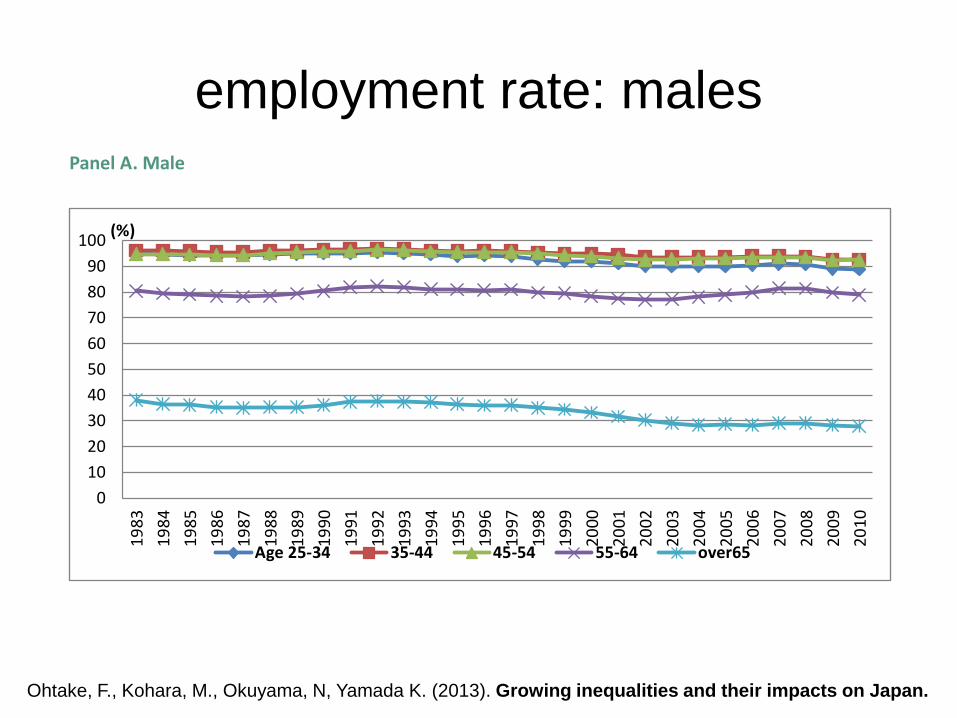
Figure 2.14: Employment rate by age group and gender
Panel A. Male
Panel B. Female
Source: Labour Force Survey (Statistics Bureau, Ministry of Internal Affairs and Communications).
Note: Employment rate = (Employed person/Population of 15 years old or more) * 100.
0
10
20
30
40
50
60
70
80
90
100
19
83
19
84
19
85
19
86
19
87
19
88
19
89
19
90
19
91
19
92
19
93
19
94
19
95
19
96
19
97
19
98
19
99
20
00
20
01
20
02
20
03
20
04
20
05
20
06
20
07
20
08
20
09
20
10
(%)
Age 25-34 35-44 45-54 55-64 over65
0
10
20
30
40
50
60
70
80
90
100
19
83
19
84
19
85
19
86
19
87
19
88
19
89
19
90
19
91
19
92
19
93
19
94
19
95
19
96
19
97
19
98
19
99
20
00
20
01
20
02
20
03
20
04
20
05
20
06
20
07
20
08
20
09
20
10
(%)
Age 25-34 35-44 45-54 55-64 over 65
employment rate: males

Ohtake, F., Kohara, M., Okuyama, N, Yamada K. (2013). Growing inequalities and their impacts on Japan.
employment rate: females
GINI Country Report Japan
Page 26
Figure 2.14: Employment rate by age group and gender
Panel A. Male
Panel B. Female
Source: Labour Force Survey (Statistics Bureau, Ministry of Internal Affairs and Communications).
Note: Employment rate = (Employed person/Population of 15 years old or more) * 100.
0
10
20
30
40
50
60
70
80
90
100
19
83
19
84
19
85
19
86
19
87
19
88
19
89
19
90
19
91
19
92
19
93
19
94
19
95
19
96
19
97
19
98
19
99
20
00
20
01
20
02
20
03
20
04
20
05
20
06
20
07
20
08
20
09
20
10
(%)
Age 25-34 35-44 45-54 55-64 over65
0
10
20
30
40
50
60
70
80
90
100
19
83
19
84
19
85
19
86
19
87
19
88
19
89
19
90
19
91
19
92
19
93
19
94
19
95
19
96
19
97
19
98
19
99
20
00
20
01
20
02
20
03
20
04
20
05
20
06
20
07
20
08
20
09
20
10
(%)
Age 25-34 35-44 45-54 55-64 over 65

Ohtake, F., Kohara, M., Okuyama, N, Yamada K. (2013). Growing inequalities and their impacts on Japan.
unemployment rate: males
GINI Country Report Japan
Page 23
Figure 2.12: Unemployment rate
Source: Labor Force Survey (Ministry of Internal Affairs and Communications (2010)).
Figure 2.13: Unemployment rate by age group and gender
Panel A. Male
0,0
1,0
2,0
3,0
4,0
5,0
6,0
19
53
19
55
19
57
19
59
19
61
19
63
19
65
19
67
19
69
19
71
19
73
19
75
19
77
19
79
19
81
19
83
19
85
19
87
19
89
19
91
19
93
19
95
19
97
19
99
20
01
20
03
20
05
20
07
20
09
20
11
(% )
Total Male Female
0
2
4
6
8
10
12
14
19
89
19
90
19
91
19
92
19
93
19
94
19
95
19
96
19
97
19
98
19
99
20
00
20
01
20
02
20
03
20
04
20
05
20
06
20
07
20
08
20
09
(%)
Age 15-24 Age 25-34 Age 35-44 Age 45-54 Age 55-64

Ohtake, F., Kohara, M., Okuyama, N, Yamada K. (2013). Growing inequalities and their impacts on Japan.
unemployment rate: females GINI Country Report Japan
Page 24
Panel B. Female
Source: Labor Force Survey (Ministry of Internal Affairs and Communications)
Note: The listed unemployment rates are based on official data for every February from 1989 to 2009.
Table 2.2 summarizes the trend of the employment rate. The total employment rate decreased by
about 1% between 1983 and 1988, and increased by about 2.5% between 1989 and 1992. It then
started decreasing steadily after the economic bubble burst: decreased by about 5% between 1993
and 2004. It has remained at around 58% since 2007.
Figure 2.14 shows the trend of the employment rate for males (Panel A) and females (Panel B)
separately by age group. The male employment rate in the working-age population decreased in the
late 1990s. Especially for those aged 25-34, it was about 95% in the early 1990s, but declined to less
than 90% in the 2000s. For females, the employment rate increased for all age groups, but it is not at
a high level yet: Japan’s employment rate for those aged 15-64 was 60.1% in 2010 (Labour market
statistics, OECD Employment and Labour Market Statistics), which is lower than in North European
countries (70-80%), the United States (62.4%), the United Kingdom (65.3%), and Germany (66.1%),
but is at the same level as France (59.7%).
0
2
4
6
8
10
12
14
19
89
19
90
19
91
19
92
19
93
19
94
19
95
19
96
19
97
19
98
19
99
20
00
20
01
20
02
20
03
20
04
20
05
20
06
20
07
20
08
20
09
(%)
Age 15-24 Age 25-34 Age 35-44 Age 45-54 Age 55-64

Ohtake, F., Kohara, M., Okuyama, N, Yamada K. (2013). Growing inequalities and their impacts on Japan.
salaries: malesGINI Country Report Japan
Page 21
Figure 2.9: Log wage differences for men between the 50th and 10th
Source: Basic Survey of Wage Structure (Ministry of Health, Labour, and Welfare).
Note: See the note to the previous figure.
Figure 2.10: Log wage differences for women between the 90th and 50th
Source: Basic Survey of Wage Structure (Ministry of Health, Labour, and Welfare).
Note: See the note to the previous figure.
0,1
0,2
0,3
0,4
0,5
0,6
0,7
0,8
19
80
19
81
19
82
19
83
19
84
19
85
19
86
19
87
19
88
19
89
19
90
19
91
19
92
19
93
19
94
19
95
19
96
19
97
19
98
19
99
20
00
20
01
20
02
20
03
20
04
20
05
20
06
20
07
20
08
20
09
20
10
20
11
All ages Age 20-24 Age 25-29 Age 30-34 Age 35-39
Age 40-44 Age 45-49 Age 50-54 Age 55-59
0,1
0,2
0,3
0,4
0,5
0,6
0,7
0,8
19
80
19
81
19
82
19
83
19
84
19
85
19
86
19
87
19
88
19
89
19
90
19
91
19
92
19
93
19
94
19
95
19
96
19
97
19
98
19
99
20
00
20
01
20
02
20
03
20
04
20
05
20
06
20
07
20
08
20
09
20
10
20
11
All ages Age 20-24 Age 25-29 Age 30-34 Age 35-39Age 40-44 Age 45-49 Age 50-54 Age 55-59
Ohtake, F., Kohara, M., Okuyama, N, Yamada K. (2013). Growing inequalities and their impacts on Japan.
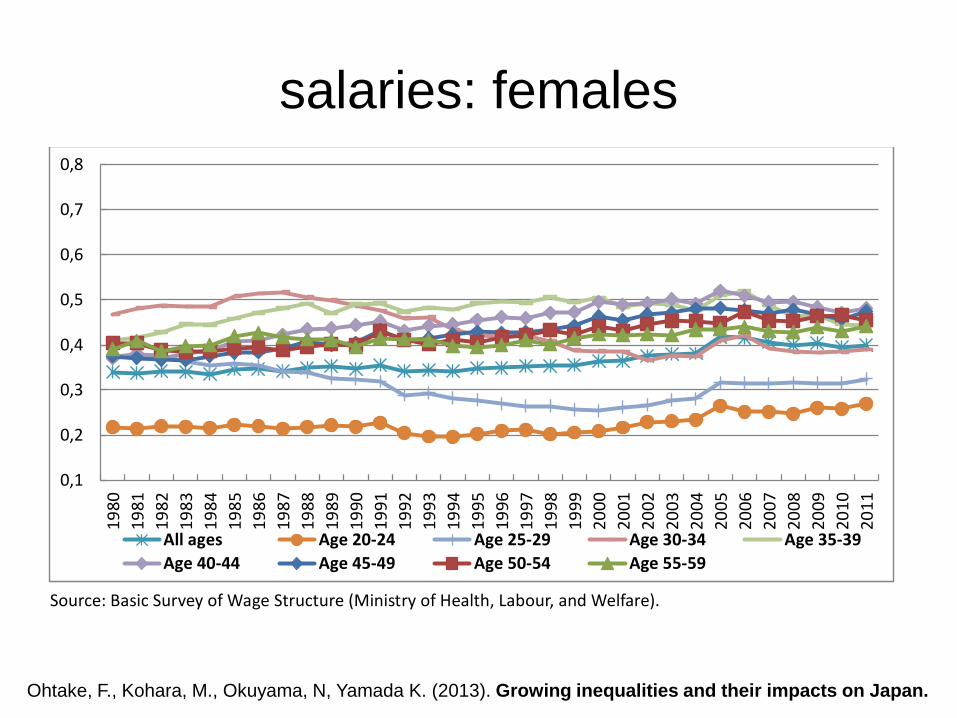
salaries: females GINI Country Report Japan
Page 22
Figure 2.11: Log wage differences for women between the 50th and 10th percentiles
Source: Basic Survey of Wage Structure (Ministry of Health, Labour, and Welfare).
Note: See the note to the previous figure.
What happened in the labor market that lies behind this increase in wage inequality among low wage
groups? First, the unemployment rate skyrocketed from the mid-1990s after the economic bubble
burst. Figure 2.12 shows this trend clearly both for males and females. Decomposing to age groups,
Figure 2.13 shows that the situation was more serious for young males. In Japan, workers are, once
employed, protected by laws imposing severe requirements on employers laying off employees and
by traditional employment schemes such as the seniority system. Therefore, young workers have
more difficulty entering the labor market or moving to different jobs.
0,1
0,2
0,3
0,4
0,5
0,6
0,7
0,8
19
80
19
81
19
82
19
83
19
84
19
85
19
86
19
87
19
88
19
89
19
90
19
91
19
92
19
93
19
94
19
95
19
96
19
97
19
98
19
99
20
00
20
01
20
02
20
03
20
04
20
05
20
06
20
07
20
08
20
09
20
10
20
11
All ages Age 20-24 Age 25-29 Age 30-34 Age 35-39
Age 40-44 Age 45-49 Age 50-54 Age 55-59

Ohtake, F., Kohara, M., Okuyama, N, Yamada K. (2013). Growing inequalities and their impacts on Japan.
minimum wages
GINI Country Report Japan
Page 86
Figure 5.4: Changes in prefectural minimum wage
Source: Table of Prefectural Minimum Wage (Ministry of Health, Labour and Welfare, 2002-2011)
Note: We calculate weighted average minimum wage for the country as a whole using prefectural minimum
wage level and weighting the prefectural population.
580
600
620
640
660
680
700
720
740
7601997
1998
1999
2000
2001
2002
2003
2004
2005
2006
2007
2008
2009
2010
2011
Yen
per
ho
ur

GINI Country Report Japan
Page 28
Figure 2.15: Proportion of non-standard workers among all employees
Source: The Special Survey of the Labour Force Survey (1984–2001), and Labour Force Survey (2002–present)
(both by Ministry of Health, Labour, and Welfare).
Note: The figure shows the ratio of non-standard workers to employees, excluding executives of companies or
corporations. Non-standard workers include part-time workers, contract employees, and casualized workers.
When discussing Japan’s labor market inequality, close attention needs to be paid to the wage gap
between part-time employees and full-time employees. Figure 2.16 shows the income inequality
between the two. During the period from 1980 to 2002, the hourly wage rate received by part-time
employees declined continually compared to that of full-time employees. In the 2000s, part-time
hourly wages appeared to increase slightly, but male (female) part-time employees are paid only half
(60%) as much as full-time employees. This slight increase has not mitigated large increases in the
share of non-standard workers either of men or women.
0
10
20
30
40
50
601
98
4
19
85
19
86
19
87
19
88
19
89
19
90
19
91
19
92
19
93
19
94
19
95
19
96
19
97
19
98
19
99
20
00
20
01
20
02
20
03
20
04
20
05
20
06
20
07
20
08
20
09
20
10
20
11
20
12
(%)
Total Male Female
number of ‘non-standard’ workers
Ohtake, F., Kohara, M., Okuyama, N, Yamada K. (2013). Growing inequalities and their impacts on Japan.
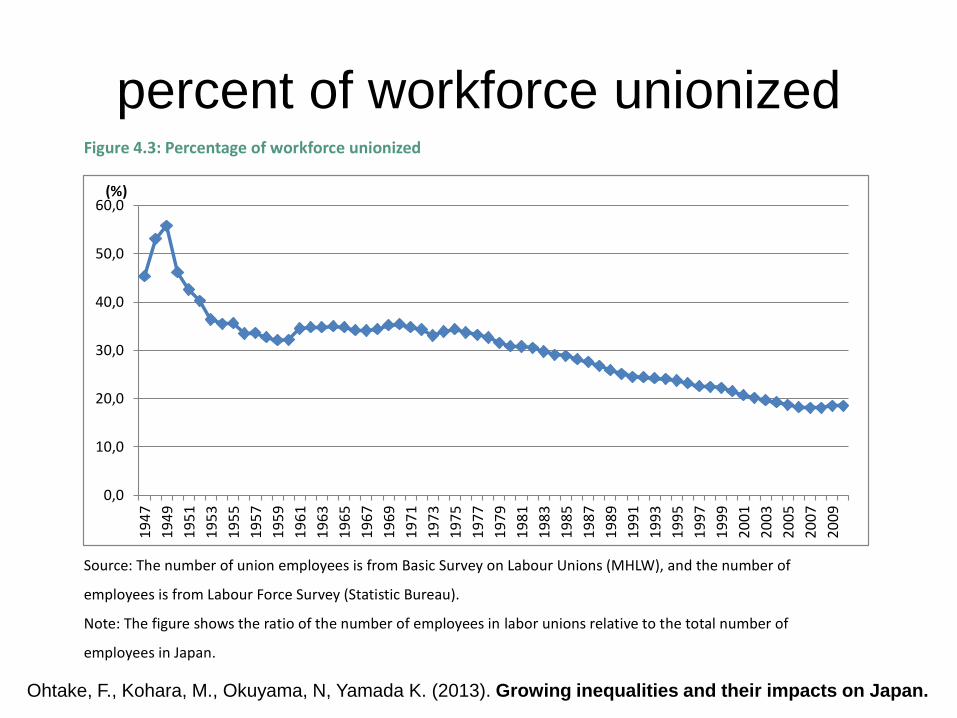
percent of workforce unionized
Ohtake, F., Kohara, M., Okuyama, N, Yamada K. (2013). Growing inequalities and their impacts on Japan.
GINI Country Report Japan
Page 72
4.3. Unionized Workforce
The labor unionization rate has declined significantly, especially since the late 1970s (Figure 4.4).
Behind this downward trend is a change in Japan’s employment conditions. As seen in Chapter 2,
regular full-time workers have decreased and non-standard part-time workers have increased since
the late 1990s.
Figure 4.3: Percentage of workforce unionized
Source: The number of union employees is from Basic Survey on Labour Unions (MHLW), and the number of
employees is from Labour Force Survey (Statistic Bureau).
Note: The figure shows the ratio of the number of employees in labor unions relative to the total number of
employees in Japan.
A decline in the rate of union participation is also observed in the following figure. Figure 4.4 shows
the kinds of voluntary organizations and activities in which Japanese people participate, and changes
in the 1990s. The big changes between 1990 and 2000 are a decrease in labor unions and an increase
in religious groups. An increase in religious groups may reflect an increase in social and economic
instability or uncertainty, which might be related to an increase in Inequality.
0,0
10,0
20,0
30,0
40,0
50,0
60,0
19
47
19
49
19
51
19
53
19
55
19
57
19
59
19
61
19
63
19
65
19
67
19
69
19
71
19
73
19
75
19
77
19
79
19
81
19
83
19
85
19
87
19
89
19
91
19
93
19
95
19
97
19
99
20
01
20
03
20
05
20
07
20
09
(%)
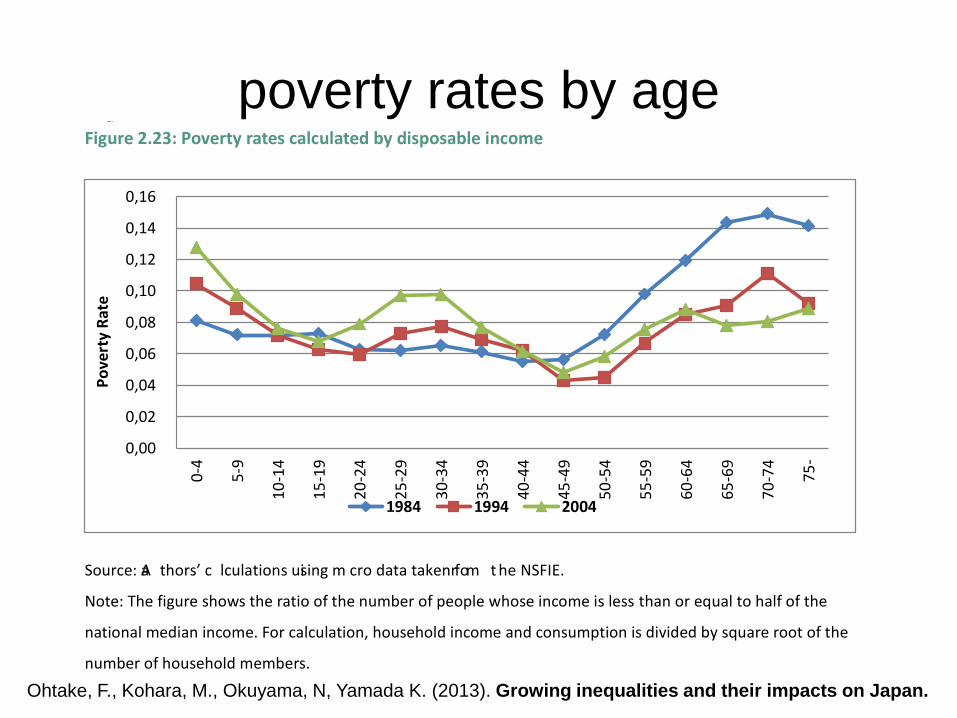
poverty rates by age
Ohtake, F., Kohara, M., Okuyama, N, Yamada K. (2013). Growing inequalities and their impacts on Japan.
GINI Country Report Japan
Page 36
Figure 2.23: Poverty rates calculated by disposable income
Source: A
u
thors’ ca lculations using mi cro data taken fr om t he NSFIE.
Note: The figure shows the ratio of the number of people whose income is less than or equal to half of the
national median income. For calculation, household income and consumption is divided by square root of the
number of household members.
0,00
0,02
0,04
0,06
0,08
0,10
0,12
0,14
0,160
-4
5-9
10
-14
15
-19
20
-24
25
-29
30
-34
35
-39
40
-44
45
-49
50
-54
55
-59
60
-64
65
-69
70
-74
75
-
Po
vert
y R
ate
1984 1994 2004

overall:
highest incomes – from Tokyo to
Osaka
lowest incomes – in the outer
regions e.g. Tohoku, Shikoku,
Kyushu
per capita income: by prefecture
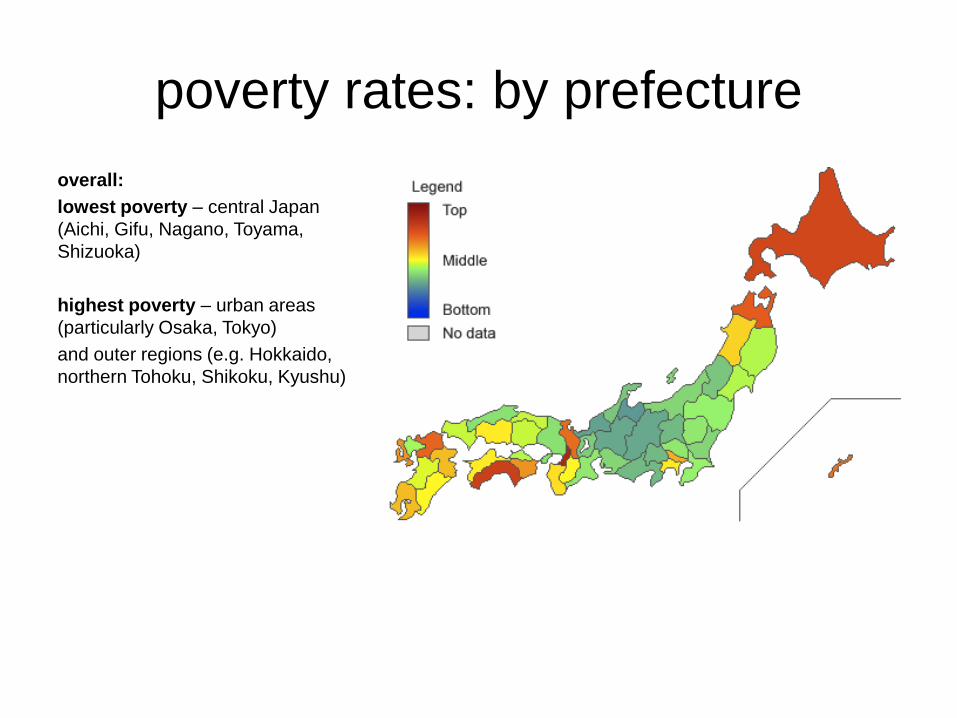
overall:
lowest poverty – central Japan
(Aichi, Gifu, Nagano, Toyama,
Shizuoka)
highest poverty – urban areas
(particularly Osaka, Tokyo)
and outer regions (e.g. Hokkaido,
northern Tohoku, Shikoku, Kyushu)
poverty rates: by prefecture

definition:
a measure of income inequality
compares area A with area B
perfect equality = 0
perfect inequality = 1
i.e. the higher the Gini coefficient,
the greater the inequality
… so a low Gini coefficient is good
the Gini coefficient

the Gini coefficient: world map
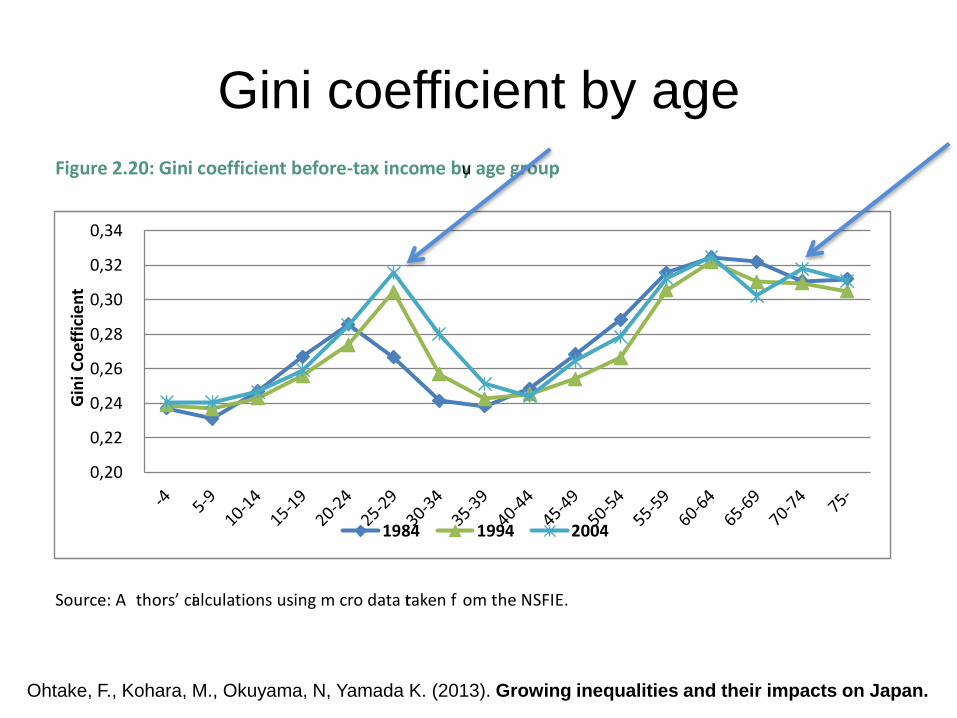
Gini coefficient by age
Ohtake, F., Kohara, M., Okuyama, N, Yamada K. (2013). Growing inequalities and their impacts on Japan.
GINI Country Report Japan
Page 33
Figure 2.20: Gini coefficient before-tax income by age group
Source: A
u
thors’ calculations using mi cro data taken fr om the NSFIE.
Note: For the calculation, household income and consumption are divided by the square root of the number of
household members.
Figure 2.21: Gini coefficient of consumption expenditure by age group
Source: A
u
thors’ calculations using mi cro data taken from the NSFIE.
Note: See the note to the previous figure.
0,20
0,22
0,24
0,26
0,28
0,30
0,32
0,34
Gin
i Co
eff
icie
nt
1984 1994 2004
0,20
0,22
0,24
0,26
0,28
0,30
0,32
0,34
Gin
i Co
eff
icie
nt
1984 1994 2004

Gini coefficient over time
housing and land: decreasing
financial assets: increasing
durable goods: increasing
income: increasing
source: Sugimoto, 2010, p. 52
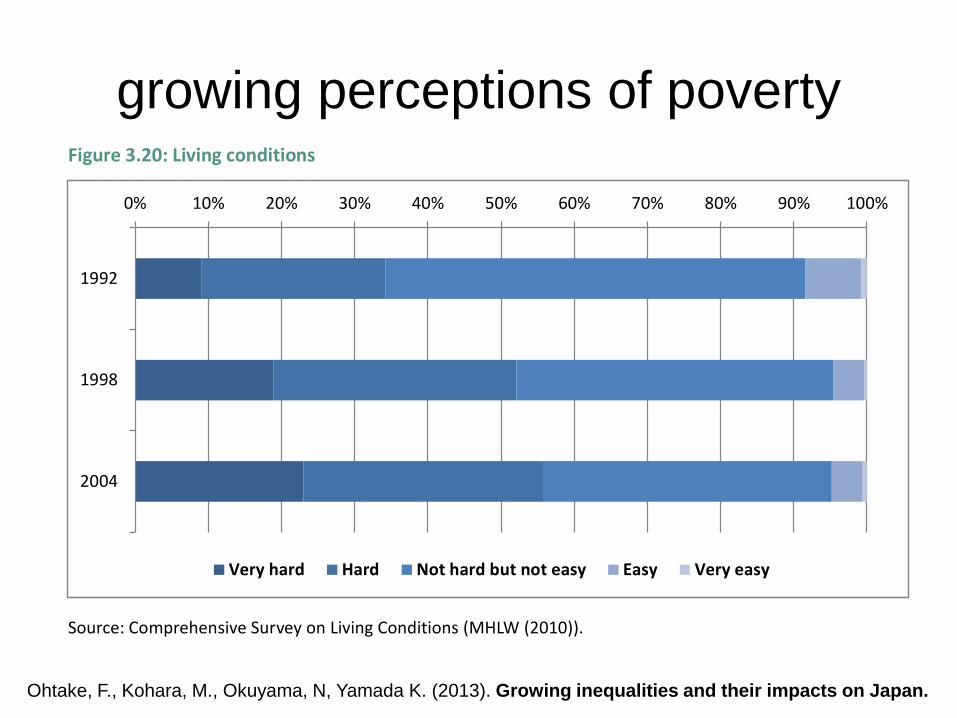
growing perceptions of poverty
Ohtake, F., Kohara, M., Okuyama, N, Yamada K. (2013). Growing inequalities and their impacts on Japan.
GINI Country Report Japan
Page 65
Figure 3.20: Living conditions
Source: Comprehensive Survey on Living Conditions (MHLW (2010)).
Figure 3.21: Living conditions by income quintiles
Source: Comprehensive Survey on Living Conditions (MHLW (2010)).
0% 10% 20% 30% 40% 50% 60% 70% 80% 90% 100%
1992
1998
2004
Very hard Hard Not hard but not easy Easy Very easy
0% 10% 20% 30% 40% 50% 60% 70% 80% 90% 100%
1992
1998
2004
1992
1998
2004
1992
1998
2004
1992
1998
2004
III
III
IV
Very hard Hard Not hard but not easy Easy Very easy
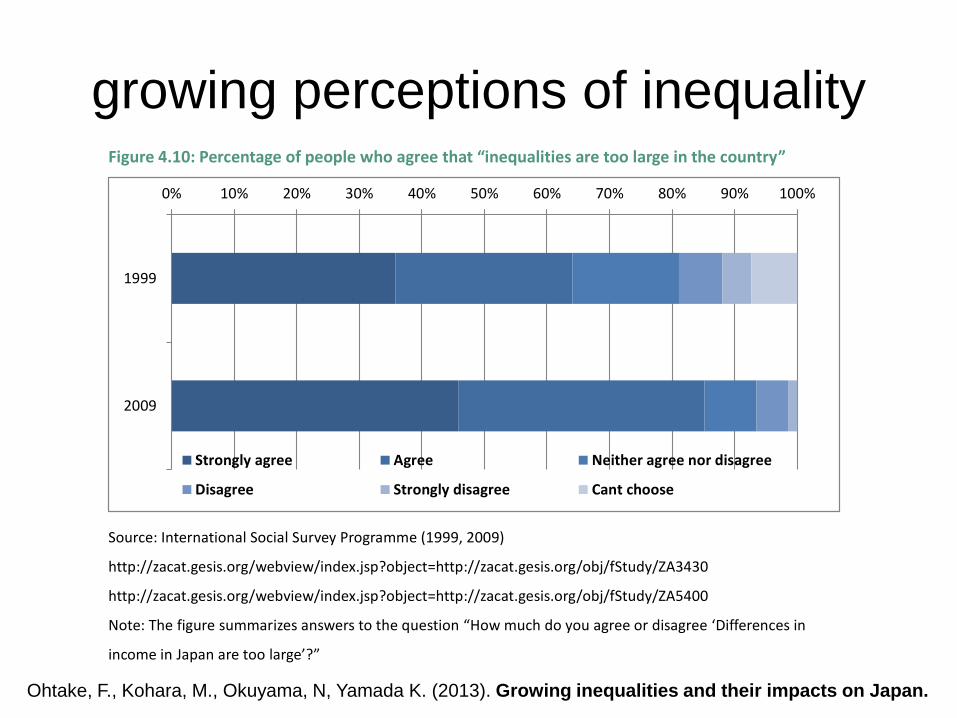
growing perceptions of inequality
Ohtake, F., Kohara, M., Okuyama, N, Yamada K. (2013). Growing inequalities and their impacts on Japan.
GINI Country Report Japan
Page 79
redistribution policies.
Figure 4.10: Percentage of people who agree that “inequalities are too large in the country”
Source: International Social Survey Programme (1999, 2009)
http://zacat.gesis.org/webview/index.jsp?object=http://zacat.gesis.org/obj/fStudy/ZA3430
http://zacat.gesis.org/webview/index.jsp?object=http://zacat.gesis.org/obj/fStudy/ZA5400
Note: The figure summarizes answers to the question “How much do you agree or disagree ‘Differences in
income in Japan are too large’?”
Figure 4.11: Percentage of people who agree that the “poor are lazy”
Source: World Values Survey (2000, 2005) Note. The figure summarizes answers to the question “Do you agree
or disagree with the following statements?: People who don’t work become lazy.”
Figure 4.12: Percentage of people who agree that the “government should redistribute
0% 10% 20% 30% 40% 50% 60% 70% 80% 90% 100%
1999
2009
Strongly agree Agree Neither agree nor disagree
Disagree Strongly disagree Cant choose
0% 10% 20% 30% 40% 50% 60% 70% 80% 90% 100%
2000
2005
Strongly agree Agree Neither agree Disagree Strongly disagree

“the government should redistribute
income”
Ohtake, F., Kohara, M., Okuyama, N, Yamada K. (2013). Growing inequalities and their impacts on Japan.
GINI Country Report Japan
Page 80
wealth/income”
Source: JGSS (2000, 2001, 2002, 2003, 2005, 2006, 2008, 2010)
Note: The figure summarizes answers to the question: “It is the responsibility of the government to reduce
differences in income between families with high incomes and those with low incomes.”
4.7. Chapter Conclusion: Appraisal of the Interdependence and the National Story
of Inequality Drivers and their Cultural and Political Impacts
In this chapter, we showed how individuals connect to society in Japan. First, we looked at voting
behavior. The voting rate is about 67% in Japan (this is also about the average among OECD countries)
and has gradually decreased over three decades. There is no difference in voting rate by educational
level, while the voting rate is significantly higher among older people than among younger people.
Second, we found that the labor unionization rate has steadily decreased over time. This reflects a
weakening of the traditional seniority system and increase in non-standard employees in Japanese
companies. Third, we found that the level of trust in others is about average in OECD countries and
increased between 1998 and 2007. Fourth, regarding political positions, about 30% of Japanese
position themselves as conservative and about 20% as progressive. The share of people with
0% 10% 20% 30% 40% 50% 60% 70% 80% 90% 100%
2000
2001
2002
2003
2005
2006
2008
2010
Agree Somewhat agree Neither agree nor disagree Somewhat disagree Disagree

definition:
poverty rates before taxes and
transfers …
and after taxes and transfers
OECD overall:
before tax – high
after tax – much lower
Japan overall:
before tax – low
after tax - higher
over time:
increasing inequality,
before tax and after tax
reducing the Gini coefficient

number of households on welfare
Ohtake, F., Kohara, M., Okuyama, N, Yamada K. (2013). Growing inequalities and their impacts on Japan.
GINI Country Report Japan
Page 17
Figure 2.6: Changes in the number of households living on welfare
Source: Care Reports of Welfare Administration (Ministry of Health, Labour and Welfare (2010)).
Note: The bars show the number of people living on welfare support, which is measured on the right axis. The
line shows their percentage (number relative to 1,000 persons), which is measured on the left axis.
2.1.5. Educational Inequality
Table 2.1 shows the average years of education for various countries. Japan is ranked in the higher
group. Figure 2.7 shows that the Gini coefficient for years of education becomes smaller as age
decreases for groups aged between 60 and 85. The Gini coefficient becomes gradually higher as age
decreases for groups aged between 35 and 39, and it becomes clearly higher as age decreases for
groups aged between 20 and 34. Because Japanese people rarely go back to school once they started
working, this trend means that the inequality in years of education fell in the 1960s, started
increasing in the early 1970s, and increased gradually for three decades, expanding further from the
early 2000s.
Table 1.1: Mean years of education
Country Mean Education Years
500 000
1 000 000
1 500 000
2 000 000
2 500 000
0
0,005
0,01
0,015
0,02
0,025
1955
1961
1963
1965
1967
1969
1971
1973
1975
1977
1979
1981
1983
1985
1987
1989
1991
1993
1995
1997
1999
2001
2003
2005
2007
2009
(people) (% )
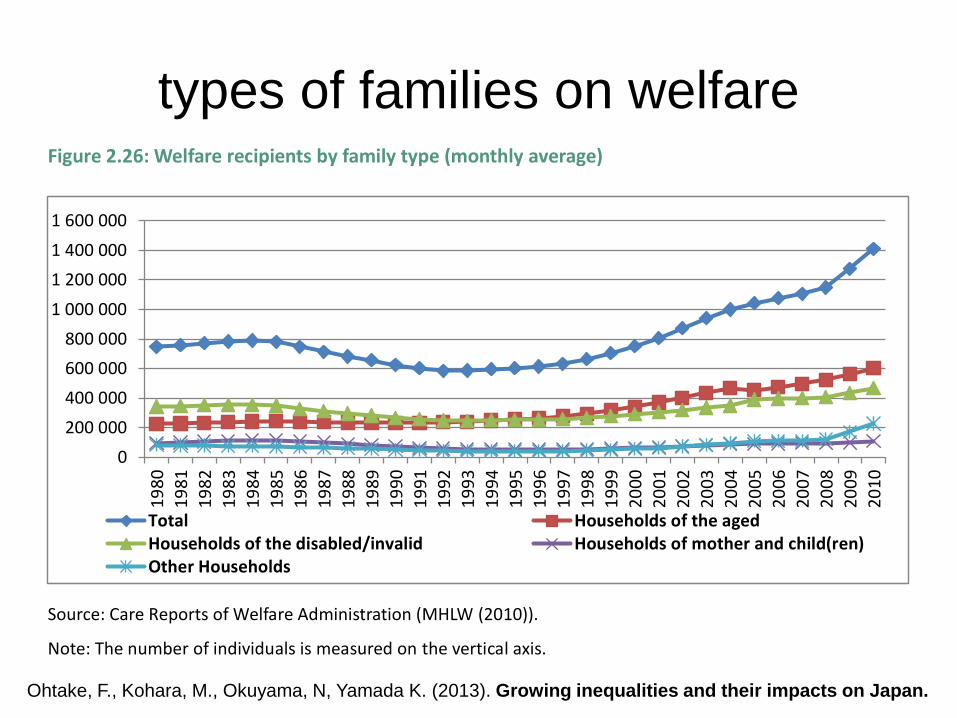
types of families on welfare
Ohtake, F., Kohara, M., Okuyama, N, Yamada K. (2013). Growing inequalities and their impacts on Japan.
GINI Country Report Japan
Page 39
Figure 2.26: Welfare recipients by family type (monthly average)
Source: Care Reports of Welfare Administration (MHLW (2010)).
Note: The number of individuals is measured on the vertical axis.
Figure 2.27: Welfare recipients by age group
Source: National Survey of Public Assistance Recipients (MHLW (2010)).
Note: The number of individuals is measured on the vertical axis.
0
200 000
400 000
600 000
800 000
1 000 000
1 200 000
1 400 000
1 600 000
19
80
19
81
19
82
19
83
19
84
19
85
19
86
19
87
19
88
19
89
19
90
19
91
19
92
19
93
19
94
19
95
19
96
19
97
19
98
19
99
20
00
20
01
20
02
20
03
20
04
20
05
20
06
20
07
20
08
20
09
20
10
Total Households of the agedHouseholds of the disabled/invalid Households of mother and child(ren)Other Households
0
200.000
400.000
600.000
800.000
1.000.000
1.200.000
1.400.000
1.600.000
1.800.000
2000 2001 2002 2003 2004 2005 2006 2007 2008 2009
0-19 20-39 40-59 60-

poverty rates by age
Ohtake, F., Kohara, M., Okuyama, N, Yamada K. (2013). Growing inequalities and their impacts on Japan.
GINI Country Report Japan
Page 36
Figure 2.23: Poverty rates calculated by disposable income
Source: A
u
thors’ ca lculations using mi cro data taken fr om t he NSFIE.
Note: The figure shows the ratio of the number of people whose income is less than or equal to half of the
national median income. For calculation, household income and consumption is divided by square root of the
number of household members.
0,00
0,02
0,04
0,06
0,08
0,10
0,12
0,14
0,160
-4
5-9
10
-14
15
-19
20
-24
25
-29
30
-34
35
-39
40
-44
45
-49
50
-54
55
-59
60
-64
65
-69
70
-74
75
-
Po
vert
y R
ate
1984 1994 2004

definition:
overview of reading, mathematical
and scientific literacy
Japan: very low – 0.4%
#1 lowest in the OECD
United States: low – 2.2%
#5 lowest in the OECD
children without employed parent

definition:
% of children living in households
with income lower than 50% of the
national median
Japan: high – 14.9%
#9 in OECD
United States: very high – 23.1%
highest in OECD
relative poverty rate - children

definition:
relative child poverty rates before
taxes and transfers and after taxes
and transfers
Canada: minus 11%
Australia: minus 18%
Belgium: minus 9%
The Netherlands: minus 6%
Denmark: minus 6%
United States: minus 2%
Japan: minus 1%
Spain: minus 2%
Italy: minus 0.5%
Greece: plus 3%
government and child poverty rates
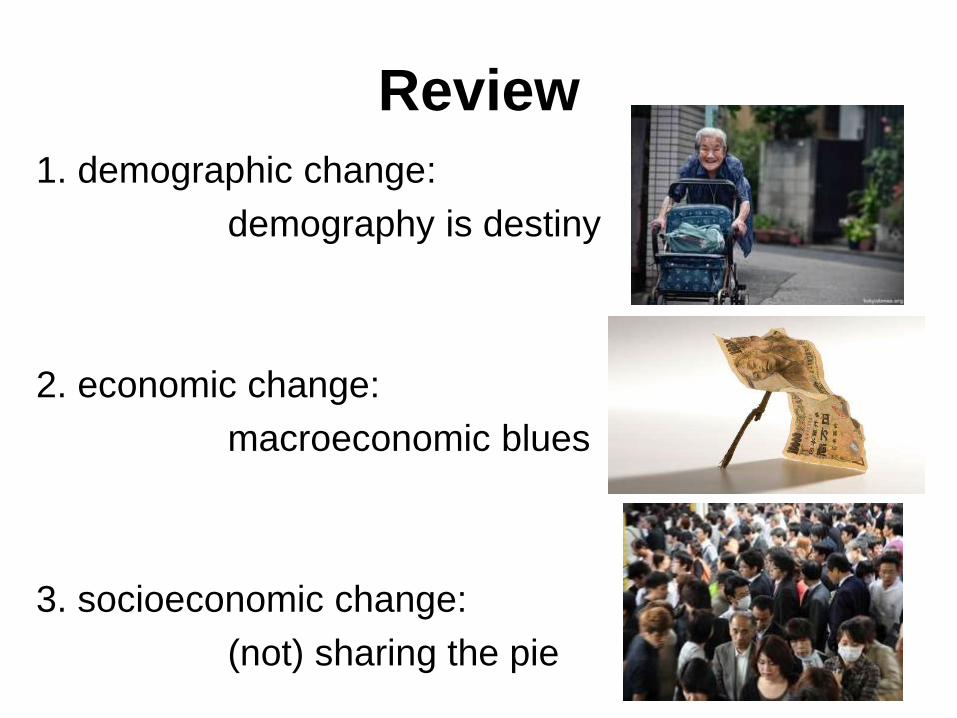
Review
1. demographic change:
demography is destiny
2. economic change:
macroeconomic blues
3. socioeconomic change:
(not) sharing the pie

Review
1. demographic change:
demography is destiny
population is falling
very low birth rate
ageing population
inverted population pyramid

Review
2. economic change:
macroeconomic blues
little real growth in the economy
long-term deflation
little growth in real wages
growing government debt – but not effectively
used to ameliorate poverty

Review
3. socioeconomic change:
(not) sharing the pie
steady employment rates for males and females
unemployment rates sometimes higher for youth
higher salaries for men than women
constant salaries for older workers
falling salaries for younger workers
increasing number of ‘non-standard’ workers

Review
3. socioeconomic change:
(not) sharing the pie
increasing poverty in 20s to mid-40s
falling poverty for older, retired workers
higher salaries and lower poverty in central Japan
growing perceptions of inequality
more people on welfare, but mostly older people
government policies do not reduce young poverty
high relative poverty for children
Related Documents