THIS REPORT CONTAINS ASSESSMENTS OF COMMODITY AND TRADE ISSUES MADE BY USDA STAFF AND NOT NECESSARILY STATEMENTS OF OFFICIAL U.S. GOVERNMENT POLICY Date: GAIN Report Number: Approved By: Prepared By: Report Highlights: Japan’s hotel, restaurant and institutional food service industry (HRI) achieved record high sales of ¥32.42 trillion ($295.2 billion) in 2016. Japan’s HRI market has experienced 5 consecutive years of growth. Growth in corporate earnings and increasing inbound tourism have contributed to the industry’s success in both 2016 and 2017. However, competition is intense and both Japanese consumers and foreign travelers demand high-quality food and beverages and unique eating experiences. This report highlights the major trends and industry changes. U.S. suppliers are well Masayuki (Alex) Otsuka, Marketing Specialist, ATO Tokyo Morgan Perkins, Director, ATO Japan Japan HRI Food Service Sector Report 2017 Food Service - Hotel Restaurant Institutional Japan JA 7519 12/22/2017 Required Report - public distribution

Welcome message from author
This document is posted to help you gain knowledge. Please leave a comment to let me know what you think about it! Share it to your friends and learn new things together.
Transcript

THIS REPORT CONTAINS ASSESSMENTS OF COMMODITY AND TRADE ISSUES MADE BY
USDA STAFF AND NOT NECESSARILY STATEMENTS OF OFFICIAL U.S. GOVERNMENT
POLICY
Date:
GAIN Report Number:
Approved By:
Prepared By:
Report Highlights:
Japan’s hotel, restaurant and institutional food service industry (HRI) achieved record high sales of
¥32.42 trillion ($295.2 billion) in 2016. Japan’s HRI market has experienced 5 consecutive years of
growth. Growth in corporate earnings and increasing inbound tourism have contributed to the
industry’s success in both 2016 and 2017. However, competition is intense and both Japanese
consumers and foreign travelers demand high-quality food and beverages and unique eating
experiences. This report highlights the major trends and industry changes. U.S. suppliers are well
Masayuki (Alex) Otsuka,
Marketing Specialist, ATO
Tokyo
Morgan Perkins, Director,
ATO Japan
Japan HRI Food Service Sector Report 2017
Food Service - Hotel Restaurant Institutional
Japan
JA 7519
12/22/2017
Required Report - public distribution

positioned to compete in many product categories, provided they are willing to adjust to market
demands.
Post:
Tokyo ATO
Executive Summary: Table of Contents
I. MARKET SUMMARY A. Market Volume and Trends B. Sectors C. Value of Total Imported Food vs. Domestic Products D. Opportunities and Challenges II. ROAD MAP FOR MARKET ENTRY A. Entry Strategy 1. Market Access 2. Competitive Analysis 3. Comparative Advantage of the Products 4. Receptivity of the Distribution Trade 5. Ability and Willingness to Meet Market Requirements B. Market Structure 1. Distribution 2. Segmentation i. Large Increase of Foreign Travelers to Japan ii. New Tastes from America
iii. Increasing Meat Consumption iv. Third Wave Coffee Shops v. Value Competition vi. Convenience Stores Gain Power as Food Service Operator vii. Premium Bento viii. Food Safety Scandals ix. Reasonably Priced Gourmet and Social Media C. Sub Sector Profiles 1. Restaurant Sector 2. General Restaurants 3. Sushi Restaurants 4. Noodle Shops 5. Other Restaurant Types i. Hamburger Chains ii. Pizza Chains iii. Fried Chicken Chains 6. Drinking Establishments i. Pub Dining ii. Coffee/Tea Shops 7. Hotel Food Service Sector 8. Institutional Food Service
Appendix: A List of Top 50 Restaurant Company Profiles
III. POST COUNTACT AND FURTHER INFORMATION A. Post Contacts

B. Agricultural Trade Office’s homepages C. Exporter Guides D. Regulations & Standards
I. MARKET SUMMARY A. Market Volume and Trends The Food Service (HRI) sector was valued at ¥32.42 trillion ($295.2 billion) in 2016, up 1.3 % from 2015. HRI sales volumes showed steady growth from the previous year. Due to growth in corporate earnings, company spending for dining-out continued to increase. On the other hand, personal spending for dining-out decreased from 2015. Meanwhile, a significant increase in the number of inbound tourists visiting Japan contributed to total sales growth of the HRI sector. Japan’s food service industry performance is closely tied to Gross Domestic Product (GDP) and reflects general economic conditions. Japan’s 2016 GDP grew due to the overall strength of major corporations and the Japanese government’s public investment program, as reflected in Chart 1. Chart 1: The Value of the Food Service Industry and Japan’s GDP
Source: Food Service Industry Research Institute (Estimate of Foodservice Market in Japan, 2012 through 2016, URL: http://anan-zaidan.or.jp/data/2017-1-2.xls), Cabinet Office, Government of Japan
Note: In Sections I and II, the statistics used are primarily expressed in yen, since year-to-year fluctuations in exchange rates could distort trends. Chart 2: Annual Average Exchange Rates
Year Average 2012 2013 2014 2015 2016
JP¥ per US$ 80.82 98.65 106.85 122.05 109.84
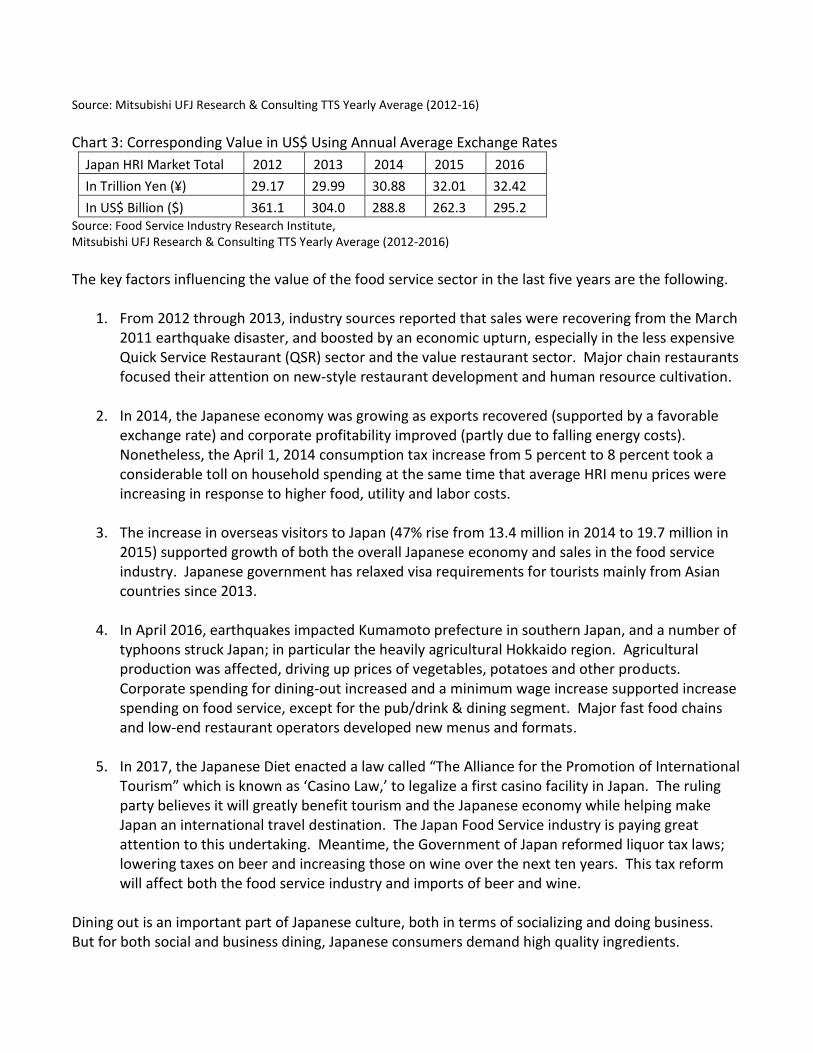
Source: Mitsubishi UFJ Research & Consulting TTS Yearly Average (2012-16)
Chart 3: Corresponding Value in US$ Using Annual Average Exchange Rates
Japan HRI Market Total 2012 2013 2014 2015 2016
In Trillion Yen (¥) 29.17 29.99 30.88 32.01 32.42
In US$ Billion ($) 361.1 304.0 288.8 262.3 295.2 Source: Food Service Industry Research Institute, Mitsubishi UFJ Research & Consulting TTS Yearly Average (2012-2016)
The key factors influencing the value of the food service sector in the last five years are the following.
1. From 2012 through 2013, industry sources reported that sales were recovering from the March 2011 earthquake disaster, and boosted by an economic upturn, especially in the less expensive Quick Service Restaurant (QSR) sector and the value restaurant sector. Major chain restaurants focused their attention on new-style restaurant development and human resource cultivation.
2. In 2014, the Japanese economy was growing as exports recovered (supported by a favorable exchange rate) and corporate profitability improved (partly due to falling energy costs). Nonetheless, the April 1, 2014 consumption tax increase from 5 percent to 8 percent took a considerable toll on household spending at the same time that average HRI menu prices were increasing in response to higher food, utility and labor costs.
3. The increase in overseas visitors to Japan (47% rise from 13.4 million in 2014 to 19.7 million in 2015) supported growth of both the overall Japanese economy and sales in the food service industry. Japanese government has relaxed visa requirements for tourists mainly from Asian countries since 2013.
4. In April 2016, earthquakes impacted Kumamoto prefecture in southern Japan, and a number of
typhoons struck Japan; in particular the heavily agricultural Hokkaido region. Agricultural production was affected, driving up prices of vegetables, potatoes and other products. Corporate spending for dining-out increased and a minimum wage increase supported increase spending on food service, except for the pub/drink & dining segment. Major fast food chains and low-end restaurant operators developed new menus and formats.
5. In 2017, the Japanese Diet enacted a law called “The Alliance for the Promotion of International
Tourism” which is known as ‘Casino Law,’ to legalize a first casino facility in Japan. The ruling party believes it will greatly benefit tourism and the Japanese economy while helping make Japan an international travel destination. The Japan Food Service industry is paying great attention to this undertaking. Meantime, the Government of Japan reformed liquor tax laws; lowering taxes on beer and increasing those on wine over the next ten years. This tax reform will affect both the food service industry and imports of beer and wine.
Dining out is an important part of Japanese culture, both in terms of socializing and doing business. But for both social and business dining, Japanese consumers demand high quality ingredients.

The food service sector has re-organized in the last 2 decades as many traditional “mom and pop” restaurants have gone out of business and have been replaced by new chain- style restaurants. According to the preliminary Census report for 2014, from 1991 to 2014, the total number of restaurant outlets decreased from 846,000 to 619,000, down 26.7 %. At the same time, sales increased from 29.84 trillion to 31.78 trillion, up 6.5 %, indicating streamlining of the industry. The need for streamlining was driven by—among other factors-- the consumption tax increase; a rise in wages, which triggered price increases in the general economy; and increasing costs of imported food associated with the weakening yen. In addition, the decades-long deflationary mindset of consumers has put continuous pressure on the industry to control menu prices. According to a most recent industry report, total sales volumes in the sector registered steady growth even after a decrease in consumer spending on overall food costs. Starting in September 2016, the sector saw a 3.3 % increase in total sales (and in the average expenditure per customer, up 1.7%) due to increases in corporate spending and the increased purchases by foreign tourists, despite adverse weather in summer 2016 negatively impacting sales. The Japan HRI industry expects sales growth to continue until at least the Tokyo Olympic Games in 2020. The quick-service restaurant (QSR) sector’s sales volume finally began to recover in 2016, after a series of food safety scandals involving a few of the large QSR chains in 2014. QSR sector sales began to rebound in the third quarter of 2015 due to major efforts to rehabilitate the sector’s food safety image and the development of new and more appealing menus. Chart 4: Sales of 187 major restaurants (with 36,077 outlets), Monthly Change Compared to the Previous Year (unit: percentage)
Month\ Type Total QSR FSR Pub Dining Dinner Coffee & Tea Shop Other
Sep 2016 1.5 4.5 -1.5 -6.6 2.7 2.5 2.3
Oct 2016 5.3 9.4 3.0 -7.4 5.3 0.4 2.8
Nov 2016 1.7 4.0 -1.3 3.4 5.2 1.2 4.8
Dec 2016 3.3 5.2 1.7 -3.2 4.6 3.1 5.1
Jan 2017 2.4 4.2 0.8 -4.7 3.5 2.5 5.0
Feb 2017 1.8 4.6 -1.4 -2.8 2.9 0.6 2.5
Mar 2017 4.5 6.6 2.4 0.4 2.9 0.6 2.5
Apr 2017 4.7 7.1 2.4 -0.2 5.2 4.0 5.5
May 2017 2.2 3.5 -0.1 1.2 3.6 3.7 5.3
Jun 2017 4.7 6.9 3.0 1.8 3.8 2.3 2.9
Jul 2017 3.0 4.4 2.1 -0.8 6.2 2.2 3.0
Aug 2017 3.5 4.9 2.1 -0.8 6.2 2.2 3.0
Sep 2017 3.3 4.1 2.6 -0.7 5.5 1.7 4.2 * QSR= Quick Service Restaurant, FSR = Family Style Restaurant, DR = Dinner Restaurant * Other: including Institutional, School Meal, Deliver Pizza and other Source: Foodservice Industry Research Institute
B. Sectors

The Japanese food service industry, broadly defined, has six major segments. In 2016, the largest sector was Restaurants (42.8 % of the market and valued at $126.3 billion), followed by Drinking Establishments (15.6 % valued at $46.1 billion), Institutional Food Service (10.5 % valued at $30.9 billion), Hotels (8.7 % and valued at $25.7 billion), and Transportation-related Food Service (0.8 % valued at $2.4 billion). A sixth category that has been growing in Japan is “Prepared Meals Sold at Retail Stores”. These foods are ready-to eat, Home Meal Replacement (HMR) type products (lunch boxes for consumption at the office are one example) such as food sold at lunch box (Obento) shops, convenience stores, supermarkets and department stores. They are considered by the Japan Food Service Association to fall within the Food Service Sector. The value of the “Prepared Meals sold at Retail Stores” sector in 2016 was $63.8 billion, accounting for 21.6 % of the total Japanese food service industry. Sales in this market segment jumped 6 % from the previous year. Chart 5: Japan Food Service Industry by Sector 2016
Source: Foodservice Industry Research Institute
From 2015 to 2106, even as the total number of food service industry customers and total food service sales increased (by 1.3%), average consumer spending on all food (including retail sales) decreased. On a sector-by-sector basis; overall sales for the restaurant sector (including family-style, fine dining and fast food), increased by 1.8%. The sales of the institutional sector increased only slightly; by 0.4 %. The hotel sector, both western style and Japanese, experienced a decline in overall sales volume of 3.9 %, while sales of restaurants in the transportation sector decreased 0.4%. The Japan Food Service Association reported increasing number of inbound tourists supported overall sales of the industry but decreasing number of domestic tourists influenced the decline of these segments. The sales of the drinking establishment sector also decreased, by 2.4% versus 2015. Sales statistics point to strong sales by budget priced restaurants, such as fast food providers. Recently, fast food restaurants have increasingly been serving alcoholic beverages paired with pub dining menus during evening hours.
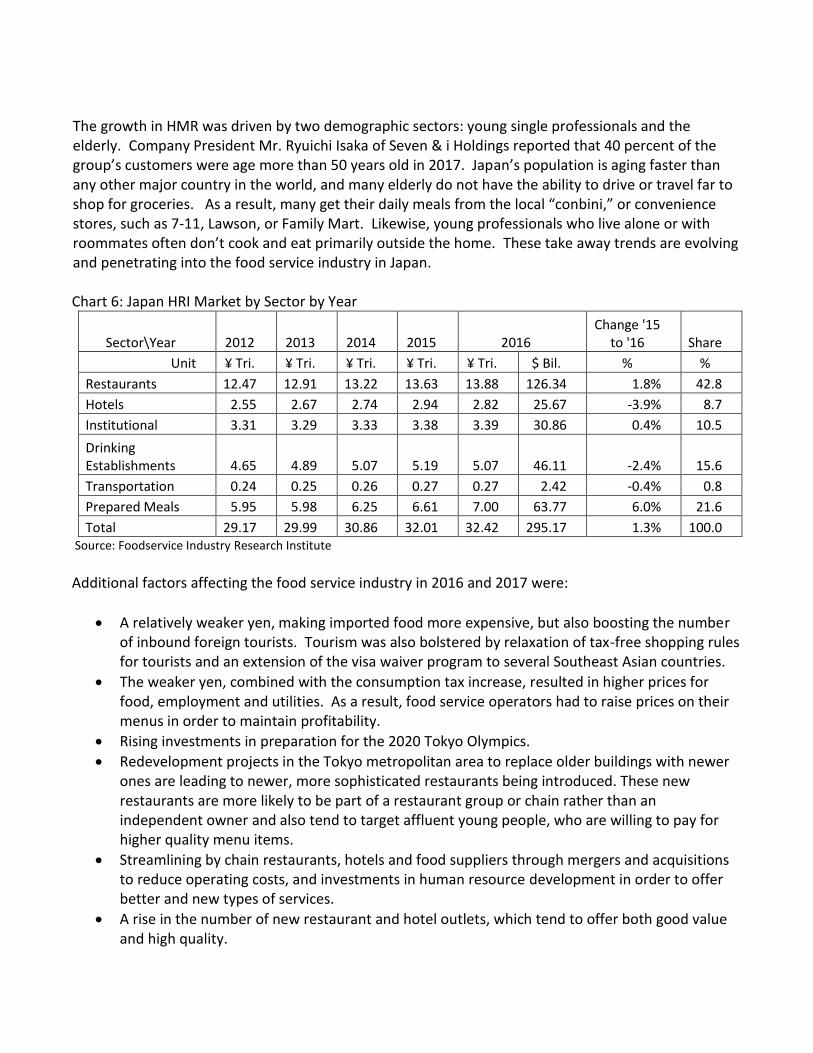
The growth in HMR was driven by two demographic sectors: young single professionals and the elderly. Company President Mr. Ryuichi Isaka of Seven & i Holdings reported that 40 percent of the group’s customers were age more than 50 years old in 2017. Japan’s population is aging faster than any other major country in the world, and many elderly do not have the ability to drive or travel far to shop for groceries. As a result, many get their daily meals from the local “conbini,” or convenience stores, such as 7-11, Lawson, or Family Mart. Likewise, young professionals who live alone or with roommates often don’t cook and eat primarily outside the home. These take away trends are evolving and penetrating into the food service industry in Japan. Chart 6: Japan HRI Market by Sector by Year
Sector\Year 2012 2013 2014 2015 2016 Change '15
to '16 Share
Unit ¥ Tri. ¥ Tri. ¥ Tri. ¥ Tri. ¥ Tri. $ Bil. % %
Restaurants 12.47 12.91 13.22 13.63 13.88 126.34 1.8% 42.8
Hotels 2.55 2.67 2.74 2.94 2.82 25.67 -3.9% 8.7
Institutional 3.31 3.29 3.33 3.38 3.39 30.86 0.4% 10.5
Drinking Establishments 4.65 4.89 5.07 5.19 5.07 46.11 -2.4% 15.6
Transportation 0.24 0.25 0.26 0.27 0.27 2.42 -0.4% 0.8
Prepared Meals 5.95 5.98 6.25 6.61 7.00 63.77 6.0% 21.6
Total 29.17 29.99 30.86 32.01 32.42 295.17 1.3% 100.0 Source: Foodservice Industry Research Institute
Additional factors affecting the food service industry in 2016 and 2017 were:
A relatively weaker yen, making imported food more expensive, but also boosting the number of inbound foreign tourists. Tourism was also bolstered by relaxation of tax-free shopping rules for tourists and an extension of the visa waiver program to several Southeast Asian countries.
The weaker yen, combined with the consumption tax increase, resulted in higher prices for food, employment and utilities. As a result, food service operators had to raise prices on their menus in order to maintain profitability.
Rising investments in preparation for the 2020 Tokyo Olympics.
Redevelopment projects in the Tokyo metropolitan area to replace older buildings with newer ones are leading to newer, more sophisticated restaurants being introduced. These new restaurants are more likely to be part of a restaurant group or chain rather than an independent owner and also tend to target affluent young people, who are willing to pay for higher quality menu items.
Streamlining by chain restaurants, hotels and food suppliers through mergers and acquisitions to reduce operating costs, and investments in human resource development in order to offer better and new types of services.
A rise in the number of new restaurant and hotel outlets, which tend to offer both good value and high quality.

The trend of the media and television programs showcasing individual restaurants, including everything from five-star restaurants to casual restaurants, in both metropolitan areas and rural regions.
“Premium Friday” is a campaign to recommend ending work at 3:00 p.m. on every last Friday of each month, when salaries have normally just been paid. Japanese business organizations and the Japanese government support the campaign to encourage consumer spending. Some of the food service operators have responded by opening restaurants earlier on these Fridays according to campaign organizers.
The Japanese food service sector has traditionally been very receptive to the use of imported food products. This is primarily because;
Imported food products are often less expensive than their domestic counterparts.
The food service industry does not require unique packaging or labeling for food, unlike the
retail industry.
The food service sector often incorporates new food concepts from abroad in order to stand out, which makes it more receptive to importing new or unfamiliar items.
C. Value of Total Imported Food vs. Domestic Products According to Japan Ministry of Agriculture, Fishery and Forest (MAFF)’s most recent statistics, in 2017 domestically produced agricultural and marine products accounted for a total of ¥10.83 trillion ($98.6 billion), equivalent to 38% of total food consumption in terms of calories and 68% in value terms of value. While it is difficult to say exactly what percentage of imported food vs. domestic food is used for the food service sector, it is estimated that over half of total food service menu items include imported food in one form or another. Imported items such as beef, pork, shrimp, salmon, wine, cheese, frozen vegetables, and frozen potatoes are heavily used by the food service sector. According to the Global Trade Atlas, Japan imported a total of $59.7 billion in agricultural and food products in 2016, 0.4% less than the previous year. The total share of food and agricultural imports from the United States by value was down slightly from 22.76% in 2015 to 21.36%. Other countries that gained market share included Thailand, Australia, Brazil, South Korea, France and Vietnam. Countries that lost market share in 2016 include China, Canada and Chile. South Korea’s increase was driven by increases of edible seaweed imports which jumped from $68.5 million to $93.6 million, and frozen tuna and bonito fillet which increased from $164.3 million to $180.4 million. Chart 7: Japan Food and Agricultural Imports by Country
Partner Country U.S. Million Dollars % Share % Change

2014 2015 2016 2014 2015 2016 ‘16/’15
World 65,957 59,956 59,713 100.00 100.00 100.00 - 0.40
United States 15,565 13,647 12,756 23.60 22.76 21.36 - 6.53
China 9,159 8,341 8,304 13.89 13.91 13.91 - 0.45
Thailand 3,985 3,986 4,008 6.04 6.65 6.71 0.54
Australia 3,879 3,699 3,737 5.88 6.17 6.26 1.02
Canada 4,152 3,661 3,622 6.30 6.11 6.07 - 1.06
Brazil 2,889 2,851 2,881 4.38 4.76 4.82 1.05
Korea South 1,805 1,546 1,615 2.74 2.58 2.70 4.41
Chile 1,933 1,618 1,608 2.93 2.70 2.69 - 0.63
France 1,775 1,537 1,598 2.69 2.56 2.68 3.98
Vietnam 1,398 1,308 1,328 2.12 2.18 2.22 1.56 Source: Global Trade Atlas (HS Code 02 through 23, except 5, 6, 13 and 14)
In 2016, total U.S. agricultural exports to Japan declined in terms of both volume and market share, affected by decreases in feed grains/hay, soybeans, seafood and dairy products. One cause was the Economic Partnership Agreement between Japan and Australia as well as price advantages of other countries. In some cases, U.S. exports have declined as new trade channels develop; such as the recent trend of exporting U.S seafood to Thailand and/or other Asian countries in order to process those raw foods for onward export, including to Japan. In response to a relatively strong dollar and increased supply in third countries, Japanese food service companies shifted some procurement; for example imports of shredded cheese shifted from U.S. suppliers to European Union countries. Some U.S. grain export share was also taken by Brazil and Argentina due to price competitiveness and diversified resources. The Japanese food service industry has been speeding up its ability to shift ingredient sourcing decisions compared to prior years. Chart 8: Japan Agricultural Imports from the U.S. by Product
Description United States Dollars % Share
% Change
2014 2015 2016 2014 2015 2016 ‘16/’15
Total U.S.A. in Value 15,565 13,647 12,756 100 100 100 -6.53
Cereals 4,677 3,817 3,228 30.05 27.97 25.31 -15.43
Meat And Edible Meat Offal 3,115 2,599 2,857 20.02 19.05 22.4 9.9
Oil Seeds Etc.; Misc Grain, Seed, Fruit, Plant Etc 1,834 1,798 1,598 11.78 13.18 12.53 -11.12
Fish, Crustaceans & Aquatic Invertebrates 1,211 1,258 1,190 7.78 9.22 9.33 -5.45
Edible Fruit & Nuts; Citrus Fruit Or Melon Peel 977 992 905 6.28 7.27 7.09 -8.79
Prep Vegetables, Fruit, Nuts Or Other Plant Parts 635 596 576 4.08 4.36 4.51 -3.35
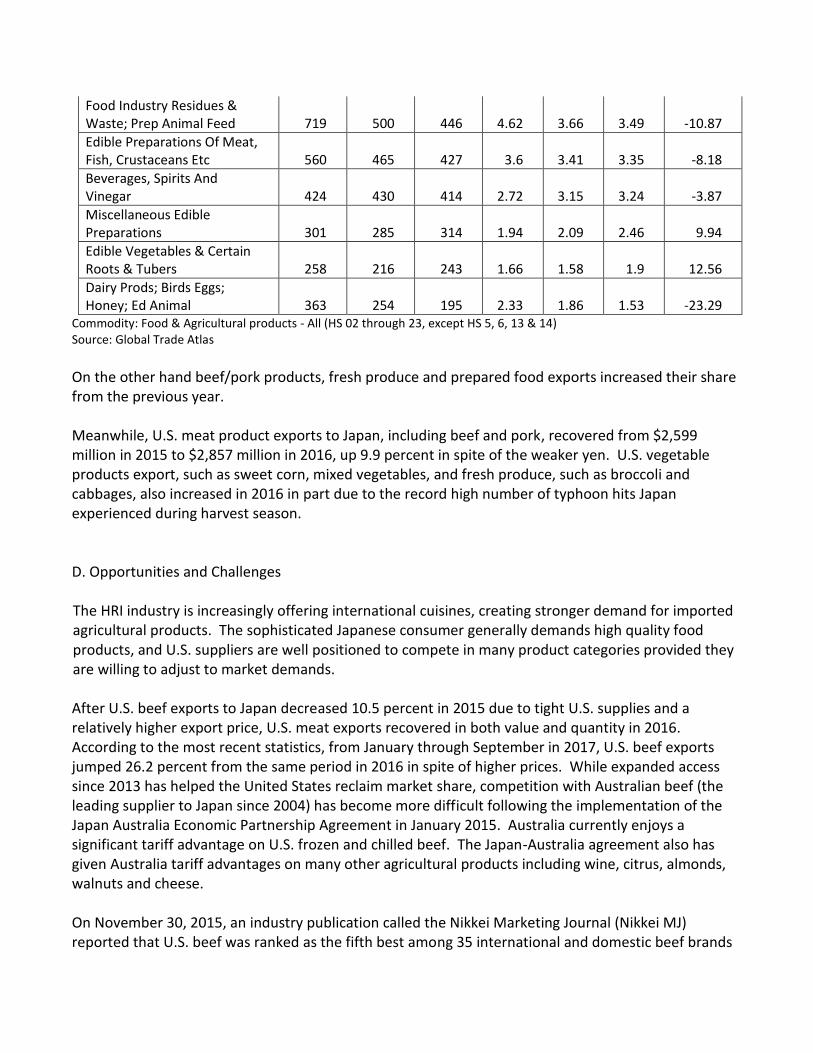
Food Industry Residues & Waste; Prep Animal Feed 719 500 446 4.62 3.66 3.49 -10.87
Edible Preparations Of Meat, Fish, Crustaceans Etc 560 465 427 3.6 3.41 3.35 -8.18
Beverages, Spirits And Vinegar 424 430 414 2.72 3.15 3.24 -3.87
Miscellaneous Edible Preparations 301 285 314 1.94 2.09 2.46 9.94
Edible Vegetables & Certain Roots & Tubers 258 216 243 1.66 1.58 1.9 12.56
Dairy Prods; Birds Eggs; Honey; Ed Animal 363 254 195 2.33 1.86 1.53 -23.29
Commodity: Food & Agricultural products - All (HS 02 through 23, except HS 5, 6, 13 & 14) Source: Global Trade Atlas
On the other hand beef/pork products, fresh produce and prepared food exports increased their share from the previous year. Meanwhile, U.S. meat product exports to Japan, including beef and pork, recovered from $2,599 million in 2015 to $2,857 million in 2016, up 9.9 percent in spite of the weaker yen. U.S. vegetable products export, such as sweet corn, mixed vegetables, and fresh produce, such as broccoli and cabbages, also increased in 2016 in part due to the record high number of typhoon hits Japan experienced during harvest season. D. Opportunities and Challenges The HRI industry is increasingly offering international cuisines, creating stronger demand for imported agricultural products. The sophisticated Japanese consumer generally demands high quality food products, and U.S. suppliers are well positioned to compete in many product categories provided they are willing to adjust to market demands. After U.S. beef exports to Japan decreased 10.5 percent in 2015 due to tight U.S. supplies and a relatively higher export price, U.S. meat exports recovered in both value and quantity in 2016. According to the most recent statistics, from January through September in 2017, U.S. beef exports jumped 26.2 percent from the same period in 2016 in spite of higher prices. While expanded access since 2013 has helped the United States reclaim market share, competition with Australian beef (the leading supplier to Japan since 2004) has become more difficult following the implementation of the Japan Australia Economic Partnership Agreement in January 2015. Australia currently enjoys a significant tariff advantage on U.S. frozen and chilled beef. The Japan-Australia agreement also has given Australia tariff advantages on many other agricultural products including wine, citrus, almonds, walnuts and cheese. On November 30, 2015, an industry publication called the Nikkei Marketing Journal (Nikkei MJ) reported that U.S. beef was ranked as the fifth best among 35 international and domestic beef brands

surveyed. The survey included 33 domestic brands plus U.S. and Australian beef. Matsuzaka beef (Mie prefecture) was ranked first, followed by Kobe beef, Miyazaki beef (Miyazaki Prefecture) and Yonezawa beef (Yamagata Prefecture). The study ranked U.S. beef as number five, scoring higher than many famous domestic beef brands such as Omi (Shiga), Maezawa (Iwate), and Saga (Saga) as well as non-branded domestic Japanese beef. Australian beef ranked tenth. The research also asked about buyers’ criteria for making decisions on beef procurement. The highest priority (78 percent) was given to quality (freshness and exterior). The second was taste (68 percent), the third was supply availability (62 percent), the fourth was high level of safety (55 percent) and the fifth was marbling (42 percent). All of those factors were shown to be more important than low price, which came in at 36 percent. A majority of Japanese buyers also indicated an interested in increasing sales of lean meat, which may suggest a marketing advantage for U.S. suppliers over traditional Japanese domestic beef. For more information see GAIN JA 5013. As a result of U.S. Meat Export Federation and FAS Japan’s marketing efforts, a greater number of major hotels and family style restaurants are currently serving U.S. beef and there have been an increasing number of American menu promotions at all kinds of restaurants in Japan. Menu fairs focusing on beef have also led to utilization of many other U.S. food products, including seafood, fruits, vegetables, nuts, condiments, wine and beer. Chart 9-a: Japan Beef Imports by Country, Annual
Partner Country
Quantity Metric Tons % Share % Change
2014 2015 2016 2014 2015 2016 2016/2015
World
587,297
563,724
578,573
100.0
100.0
100.0 2.63
Australia
305,675
314,334
295,658
52.05
55.76
51.10 - 5.94
United States
221,739
198,504
230,049
37.76
35.21
39.76 15.89
New Zealand
28,825
21,749
21,844 4.91 3.86 3.78 0.44
Canada
16,411
12,539
18,120 2.79 2.22 3.13 44.51
Mexico
12,031
13,060
9,116 2.05 2.32 1.58 - 30.20
Ireland
1
313
1,173 0.00 0.06 0.20 274.57 Source: Global Trade Atlas (HS Code 020110 through 020230, 020610 through 020629, 021020 and 160250)
Chart 9-b: Japan Beef Imports by Country, Year to date
Year To Date: January - September
Partner Country
Quantity Metric Tons % Share % Change
2015 2016 2017 2015 2016 2017 2017/2016
World
421,877
430,231
500,337
100.0
100.0
100.0 16.29
Australia
234,919 220,009
235,910
55.68
51.14
47.15 7.23
United States
147,466 170,996
215,861
34.95
39.75
43.14 26.24
Canada
8,452 12,892
18,669 2.00 3.00 3.73 44.81
New Zealand
17,830 16,472
17,322 4.23 3.83 3.46 5.16
Mexico
10,370 7,228
7,927 2.46 1.68 1.58 9.67
Poland
548 242
1,280 0.13 0.06 0.26 430.10
Ireland
268 750
913 0.06 0.17 0.18 21.78 Source: Global Trade Atlas (HS Code 020110 through 020230, 020610 through 020629, 021020 and 160250)
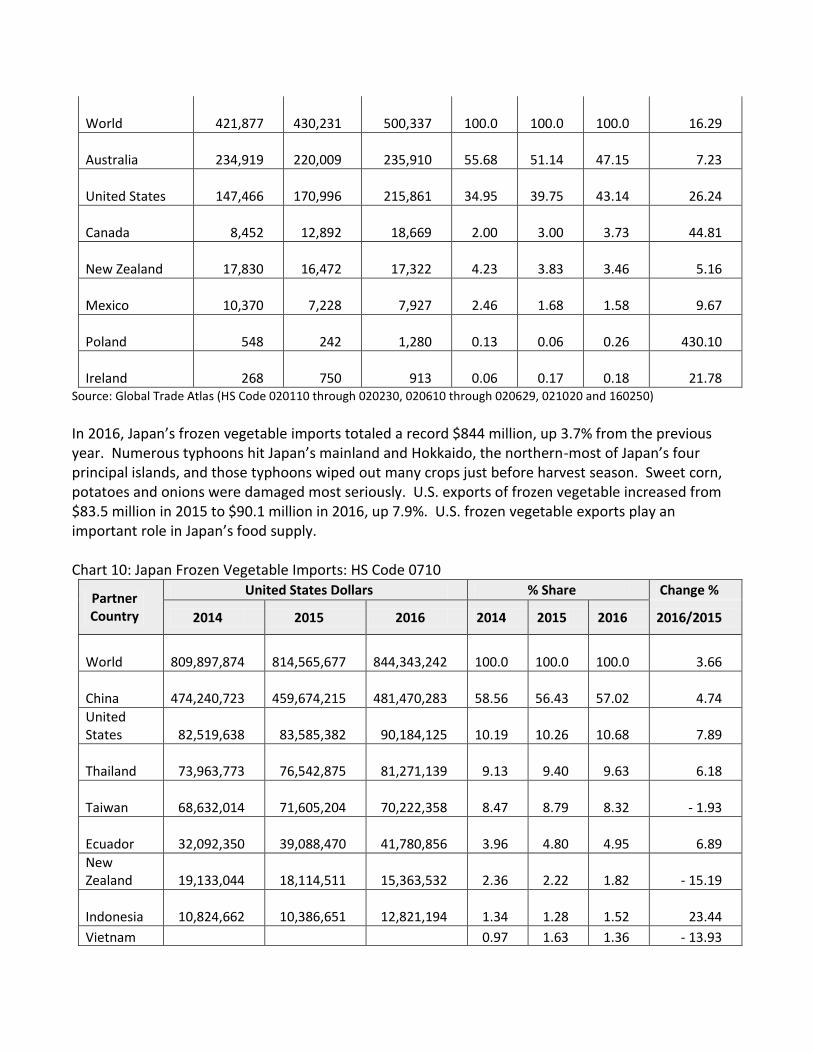
In 2016, Japan’s frozen vegetable imports totaled a record $844 million, up 3.7% from the previous year. Numerous typhoons hit Japan’s mainland and Hokkaido, the northern-most of Japan’s four principal islands, and those typhoons wiped out many crops just before harvest season. Sweet corn, potatoes and onions were damaged most seriously. U.S. exports of frozen vegetable increased from $83.5 million in 2015 to $90.1 million in 2016, up 7.9%. U.S. frozen vegetable exports play an important role in Japan’s food supply. Chart 10: Japan Frozen Vegetable Imports: HS Code 0710
Partner Country
United States Dollars % Share Change %
2014 2015 2016 2014 2015 2016 2016/2015
World
809,897,874
814,565,677
844,343,242
100.0
100.0
100.0 3.66
China
474,240,723
459,674,215
481,470,283
58.56
56.43
57.02 4.74
United States
82,519,638
83,585,382
90,184,125
10.19
10.26
10.68 7.89
Thailand
73,963,773
76,542,875
81,271,139 9.13 9.40 9.63 6.18
Taiwan
68,632,014
71,605,204
70,222,358 8.47 8.79 8.32 - 1.93
Ecuador
32,092,350
39,088,470
41,780,856 3.96 4.80 4.95 6.89
New Zealand
19,133,044
18,114,511
15,363,532 2.36 2.22 1.82 - 15.19
Indonesia
10,824,662
10,386,651
12,821,194 1.34 1.28 1.52 23.44
Vietnam 0.97 1.63 1.36 - 13.93

7,861,062 13,295,396 11,442,971
Peru
11,233,518
11,568,889
10,293,692 1.39 1.42 1.22 - 11.02
Chile
9,403,235
8,073,437
6,962,457 1.16 0.99 0.82 - 13.76 Source: Global Trade Atlas (HS Code 0710)
At the same time, Japan’s agricultural exports have been growing as the Government of Japan (GOJ) institutes plans to double its agricultural exports by 2020 in an effort to revitalize the agricultural sector. Japan’s total agricultural product exports in 2015 increased to a record ¥750 billion, or $6.15 billion, a 22 percent increase from 2014. As Japan expands exports, particularly exports of processed products, it could create more demand for Japanese imports of agricultural ingredients. Another U.S. product with significant long-term potential is rice. High domestic rice prices squeeze the profit margins of food service operators since rice is still an important staple food in the Japanese diet and its price is largely dependent on GOJ policies. By September 2017, those policies had contributed to a year-on-year price increase of eight percent for table rice, representing a substantial challenge for food service providers and home meal replacement (HMR) suppliers. Traditionally, Japanese consumers and the food service sector preferred domestic short grain rice over imported rice. However, the foodservice and HMR industries are beginning to realize that medium grain rice, or, in some cases, even long grain rice, can be better suited for specific dishes (such as fried rice, rice bowls, and paella). As a result, more and more users are accepting or becoming interested in imported rice, which may lead to expanded opportunities for U.S. rice. However, as of now, Japan continues to heavily control rice imports, limiting the volume of imports and ensuring the price of imported rice remains approximately equivalent to the price of domestic rice. The national consumption tax was scheduled to further increase from 8% to 10% in 2017, but that increase was postponed until October 2019. When the tax does increase, the lower rate of 8 percent will be applied to food and drinks sold at the retail level, but alcoholic beverages and food categorized as HRI will be subject to the 10% rate. The GOJ has announced that the higher 10% tax will apply to food sold at traditional restaurants, catered foods, meals at company/school cafeterias and hotel room service meals. However the point of demarcation between food retail and HRI is still not clear, especially for ready-to-eat meals sold at convenience stores and fast food. Sixty percent of consumers surveyed in May 2016 said they will cut down on household expenditure after the next consumption tax increase. Among areas where people said they would shy away from spending money are dining out and buying clothing. Therefore, the food service industry will likely be negatively impacted by the planned tax increase. In addition, sorting out the food exemptions in conjunction with the next tax increase will become major challenge for the industry. A brief summary of the opportunities and the challenges for U.S. food exporters targeting the Japanese food service sector are listed below: Chart 11: Advantages and Challenges

Advantages Challenges
High Japanese farming costs and decline of domestic agricultural production make imported food products vital.
Several competing countries, such as Australia, Chile and Mexico, have or are concluding trade agreements with Japan and will enjoy a tariff advantage.
The United States has a wide variety of food products, including fresh & processed.
Japanese buyers are now sourcing from all over the world rather than their more limited historic suppliers.
The successes of American style restaurants provides an avenue for introducing U.S. recipes and food ingredients into the Japanese diet.
Many consumers view American food culture as limited to quick service restaurants, giving U.S. cuisine a less healthy image than other countries.
U.S. food manufacturers have a positive reputation for food safety relative to many Asian competitors, especially among the trade.
Imported food products are viewed by many consumers as less safe than domestically produced food products.
The U.S. has a reputation and history as a reliable supplier of food (in terms of both availability and delivery) with reasonable prices.
The quality and reliability of Asian exporting countries have been growing as distribution infrastructures and quality assurance (QA) procedures have improved.
American style breakfast, brunch concepts and steak houses are catching on. These concepts help expand U.S. food product usage in the industry.
There are differences between U.S. and Japanese requirements and specifications for value-added food products.
Japan’s current cabinet strategy calls for the country to double its agricultural exports. This could increase demand food and ingredient imports.
Japanese government policies relating to food safety, such as a strict Positive List for Maximum Residue Levels, slow approvals for food additives, and stringent labeling requirements even pose impediments to trade for some products.
II. ROAD MAP FOR MARKET ENTRY A. Entry Strategy There are no magic formulas for new–to-market exporters to enter the Japanese food service market. Strategies will vary depending on the type of food product being introduced and the current competitive environment. However, there are some basic procedures that new-to-market exporters are recommended to follow when considering the Japanese food service market for the first time. 1. Market Access

One of the fundamental first steps before entering the Japanese market is to determine whether or not your products have market access. This means:
Determine if your product can currently be imported into Japan. There could be restrictions
due to phytosanitary or food safety related concerns.
Determine the import classification and tariff rate for your product. Some product categories such as those containing rice and dairy products are still highly protected by the Japanese government and face either prohibitively high tariffs or import quotas. It is important to know in advance if this is the case to prevent time and energy being dedicated to products that will not ultimately be price competitive. Freight forwarders and traders can be helpful in determining into what category your product falls.
Determine whether your product meets Japanese regulations for food ingredients, especially
with regard to food additives. If the product contains prohibited ingredients it will have to be reformulated before it can be imported into Japan. In some cases this may be difficult for U.S. exporters due to volume constraints or because the ingredient is a key element of the formulation. Freight forwarders can also be helpful in determining ingredient acceptability.
For more information, see the latest FAS Japan Food and Agricultural Import Regulations and Standards (FAIRS) report and Exporter Guide at; http://www.usdajapan.org/reports/
Japan Customs has a website for requesting an advance ruling on tariff classifications, which is available to importers and related parties. http://www.customs.go.jp/english/advance/index.htm
2. Competitive Analysis
Once it is established that the product can be imported into Japan, it is important to establish whether the product will be accepted from a competitive standpoint. This entails doing at least a preliminary analysis of the market to determine:
What is the size of the potential demand for the type of product? Who are the key customer targets for the products? What is the current pricing of similar types of products? Can the product be introduced at a competitive price? What are the key points of differentiation for the product compared to others? In what form and what kind of packaging is the competitor’s product sold? Will customers
expect the same? To do this analysis it is helpful to take some combination of the following steps:
Visit Japan to research the customers your product might be sold to and see how the product is

marketed.
Participate in one of the food related trade shows or showcases held in Japan in order to research your product potential in the market.
Utilize resources such as U.S. Foreign Agricultural Service and its local U.S. Agricultural Trade
Office (ATO) and/or your local State Regional Trade Group (SRTG) to obtain information about the market relevant to you product.
Talk with freight forwarders and Japanese importers that handle your category of products.
If possible, meet with potential customers to determine the kinds of needs they have and their
current sources for your products.
Hire a company to do some product testing among actual Japanese customers to gauge their reactions to the product taste, appearance, and texture.
3. Comparative Advantage of the Products
To succeed in entering the Japanese market, it will be important to define the comparative advantage of your product versus the competition. Potential customers in Japan will have to perceive merit in using your products. The most common merits are:
A price savings that will encourage the customer to give your product a trial.
A product or form of product that is new to the Japanese market. Every year there are newly
introduced or unique food items that become popular in Japan. Recent examples include gourmet hamburgers, craft beers, hard ciders, flavored olive oil, flavored popcorn and frozen fruits for smoothies, to name a few.
A more convenient form of the product that makes it easier for end-users or food service
operators to use. This may include a smaller package and a new technology for packaging that make the product easier to prepare or a new form of the product that offers advantages in terms of labor cost, preparation time or efficiency.
A high quality product. Food service operators are always interested in products that offer
better quality in one form or another. For example, it may be that your product has a demonstrably better track record than competitors on safety issues or the quality is more consistent. These points of difference are worth promoting.
4. Receptivity of the Distribution Trade
It is important for new-to-market exporters to understand how the distribution system works and to identify potential partners or distributors. Such partners or distributors can offer invaluable

advice on issues related to product positioning, packaging, labeling, and custom clearance procedures. There are numerous ways to identify these partners. Some suggestions include:
Ask the ATO and U.S industry associations about the market potential for your category of
products.
Attend trade shows such as FOODEX, Super Market Trade Show and Food Service Industry Show to meet potential partners and obtain leads.
If visiting Japan, discuss potential importers and distributors with experienced freight
forwarders, or if meeting any customers, enquire as to their preferred distribution channel. Many times customers will have their own preferred channels which they use for imported products.
It is important to obtain a reliable partner or importer if you expect to do long term business in Japan and you do not plan to have your own in-country office. Some things to look for include:
Does the partner/importer represent other imported products?
Do they have a favorable reputation and financial history?
Do they have the capability of communicating with you in English?
Do they have an understanding of import procedures for your type of food product?
5. Ability and Willingness to Meet Market Requirements
To be successful, it is very important for the new-to-market exporter to be willing to make changes to the product if necessary to meet market expectations in terms of service, quality, quantities, packaging, and/or price. This process could also improve your products’ quality and increase marketing competitiveness. Some things that could come up include:
Consider reformulating the product, if necessary, to meet relevant Japanese Food Sanitation
Laws and Regulations.
Adjust the product or packaging to meet Japanese taste profiles and market expectations. For example, many Japanese operators prefer smaller package sizes due to lack of storage space.
Provide samples on a timely basis, but only upon request.
Ensure that all documentation necessary to clear customs and quarantine inspection is
provided thoroughly and accurately. Japanese Customs officials always request detailed information about all food ingredients and additives and the manufacturing process (processing outline) to define the import tariff rate, compliance with food safety standards, etc.

Reply to requests for information in a timely manner, within at least 48 hours, preferably less.
Work closely with your partner or importer to prepare sales materials in Japanese.
Be patient. Most Japanese food service operators will start with only a small order to test the
potential supplier. This is especially true for new-to-market suppliers where the risk of something going wrong is the highest.
Japanese food service operators look for suppliers who can provide consistent high quality
product without defects or foreign materials, and who are reliable partners in terms of both delivery and safety issues. To help cement relations, it is strongly recommended to have face-to-face meetings at least once per year with your customers.
B. Market Structure 1. Distribution Most imported food products still pass through trading companies. The large general trading companies such as Mitsubishi, Marubeni, Mitsui and Itochu have many divisions specializing in a wide variety of imported food products, while small importers tend to specialize in a limited line of high-value items. Trading companies function as legal importers of the products and carry out a variety of functions including handling documentation, clearing customs, testing, warehousing, and financing the inventory. In the past, trading companies would normally sell the product to first-line wholesalers who in turn would sell to secondary wholesalers and even to third-line distributors before the product finally reached the food service operator. This pattern has changed in the past decade, particularly for chain food service customers who have substantial buying power. In order to reduce food costs, most large food service operators now take possession of the product or use designated distribution centers rather than wholesalers. In addition, more food service operators import products directly, even though the majority still use trading companies. Even when food service operators import products directly, they often contract supply chain operations including import procedures, inventory management and delivery. This outsourcing is done after initial purchasing in order to restaurants to streamline supply chains. The deflationary environment of the past two decades has intensified price competition among food service chains, and has accelerated the trend to eliminate middlemen. Wholesalers are also consolidating. Smaller wholesalers are either disappearing or being bought by larger ones. In order to add value, most large wholesalers own their own distribution trucks. Wholesalers now focus on carrying broad product lines that can efficiently service small food service operators or small chains with one-stop service. Some wholesalers are now also beginning to import products directly to reduce costs further. Meanwhile, a written food safety assurance is now the standard in Japan. Food venders, not

manufactures, are responsible for food safety even if they just deliver food products. Chain restaurants require their food suppliers to provide affidavit-like assurances, and food service operators often use several distributors in Japan to hedge risks against problems. Some “cash and carry” retailers, including wholesale clubs such as COSTCO and METRO, are becoming popular sources for food products among Japan’s smaller-sized food service operators in order to reduce costs. The biggest is Gyomu Super (Business Supermarket) owned by a local company Kobe Bussan, which has a total of 777 outlets throughout Japan. Additionally, regional food wholesalers have formed strategic purchasing alliances and have opened cash & carry outlets. Bulk packed meat, seafood, fresh produce, coffee, seasonings/condiments, wine, cheese, frozen vegetables and frozen baked items are hot selling food products at these outlets. Chart 12: Flow of product from the U.S. exporter to HRI end-users
U.S. Exporter
Importers Large Trading Company (including JA)
Domestic Food Manufacture
Specialty Importer (small- and middle-sized)
Large Scale/Chain Food Service
Operator
Food Manufacturer Primary Wholesaler
Regional Market
Cash & Carry Grocery Store
Secondary Distributor/Vendor
Smaller/Individual Operators
Hotel Restaurants
Chain Operators/Large Scale Operators
Shipments - Customs Clearance
Food Service Distribution Flow Chart
2. Segmentation Most segments of the HRI market showed slight increase in 2016 (except for the pub dining segment and the hotel/transportation segments). Most notably, fast food restaurant showed strong recovery in 2016. Quick service restaurants successfully attracted young generations with targeted menu development and interior renovation. Full service restaurants and tourist-related restaurants continue to grow. Key trends in the HRI industry that U.S. exporters should be aware of are:
i. Large Increase of Foreign Travelers to Japan
According to the statistics of the Japan National Tourism Organization, the number of foreign travelers visiting Japan substantially increased from 19.74 million in 2015 to 24.04 million in 2016, an increase of 21.8 %. This trend was stimulated by a weak yen and an easing of visa requirements. In 2017 the total number of foreign tourists from January through October reached a record high of 23.8 million, up 18.3 % from the same period of the previous year. Tourists from Philippine (up 29.6 %), Malaysia (up 29.1 %), China (up 27.2 %) and South Korea (up 27.2 %) showed large increases. Reports in tourism industry newspapers forecast a continued increase until at least the Olympic Games in Tokyo in 2020. Japan Tourism Agency estimated that total food and beverage spending by inbound tourists increased by 17.2 % from ¥640 billion ($5.83 billion) in 2015 to ¥750 billion ($6.83 billion) in 2016. The food service industry increasingly targets these foreign travelers, offering special menus and services. One example is offering Halal food for Muslim tourists. There are few Muslims in Japan and only a few Halal certified restaurants. However, the industry is proactively preparing certified Halal food options for travelers to Japan.
ii. New Tastes from America
The variety of menu items available in Japan continues to expand. Partly due to the large number of Japanese traveling abroad every year (17 million in 2016), foods from Europe, Asia, Australia and the Americas are becoming increasingly popular. Japanese consumers are interested in trying new cuisines and this trend results in the emergence of new types of restaurants and shops every year. Examples of this include New York based restaurant “Egg”, Los Angeles based hamburger shops, “Umami Burger” and “The Counter” and New York based “Roll Ice Cream Factory” which have successfully launched new business formats in Japan. Umami Burger and Brooklyn based Egg opened their first shops in Tokyo in 2017, offering popular U.S.
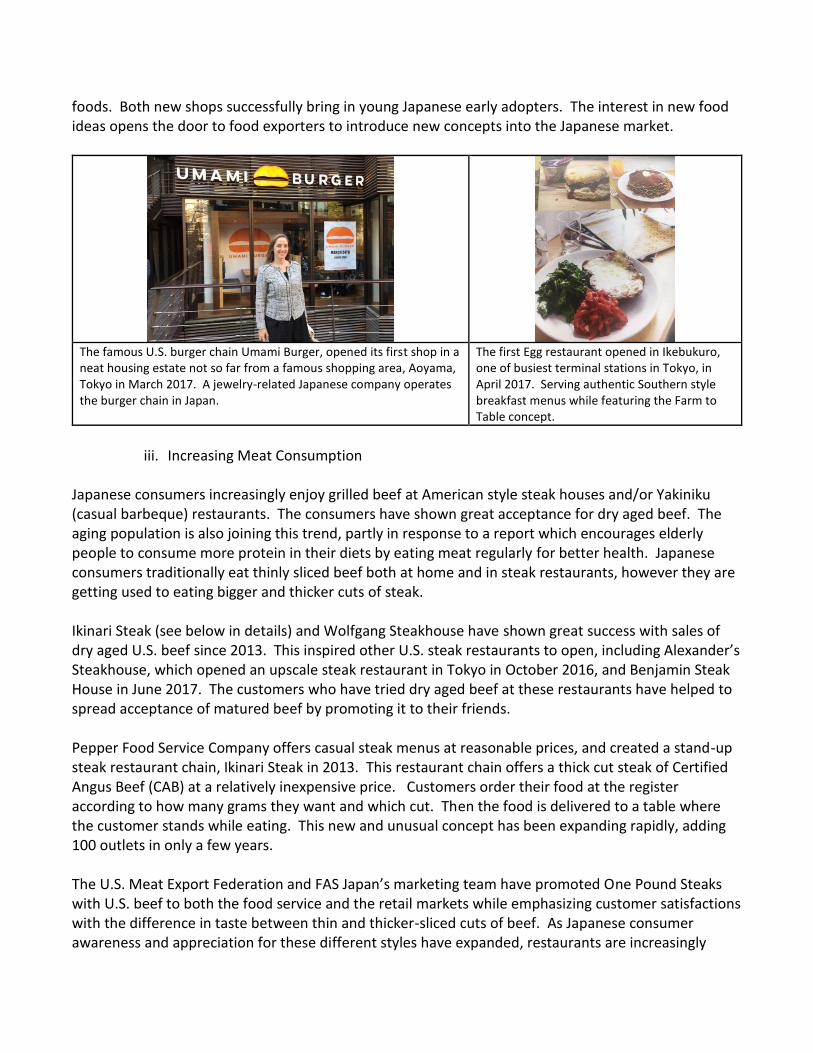
foods. Both new shops successfully bring in young Japanese early adopters. The interest in new food ideas opens the door to food exporters to introduce new concepts into the Japanese market.
The famous U.S. burger chain Umami Burger, opened its first shop in a neat housing estate not so far from a famous shopping area, Aoyama, Tokyo in March 2017. A jewelry-related Japanese company operates the burger chain in Japan.
The first Egg restaurant opened in Ikebukuro, one of busiest terminal stations in Tokyo, in April 2017. Serving authentic Southern style breakfast menus while featuring the Farm to Table concept.
iii. Increasing Meat Consumption
Japanese consumers increasingly enjoy grilled beef at American style steak houses and/or Yakiniku (casual barbeque) restaurants. The consumers have shown great acceptance for dry aged beef. The aging population is also joining this trend, partly in response to a report which encourages elderly people to consume more protein in their diets by eating meat regularly for better health. Japanese consumers traditionally eat thinly sliced beef both at home and in steak restaurants, however they are getting used to eating bigger and thicker cuts of steak. Ikinari Steak (see below in details) and Wolfgang Steakhouse have shown great success with sales of dry aged U.S. beef since 2013. This inspired other U.S. steak restaurants to open, including Alexander’s Steakhouse, which opened an upscale steak restaurant in Tokyo in October 2016, and Benjamin Steak House in June 2017. The customers who have tried dry aged beef at these restaurants have helped to spread acceptance of matured beef by promoting it to their friends. Pepper Food Service Company offers casual steak menus at reasonable prices, and created a stand-up steak restaurant chain, Ikinari Steak in 2013. This restaurant chain offers a thick cut steak of Certified Angus Beef (CAB) at a relatively inexpensive price. Customers order their food at the register according to how many grams they want and which cut. Then the food is delivered to a table where the customer stands while eating. This new and unusual concept has been expanding rapidly, adding 100 outlets in only a few years. The U.S. Meat Export Federation and FAS Japan’s marketing team have promoted One Pound Steaks with U.S. beef to both the food service and the retail markets while emphasizing customer satisfactions with the difference in taste between thin and thicker-sliced cuts of beef. As Japanese consumer awareness and appreciation for these different styles have expanded, restaurants are increasingly

cooking with dry/wet-aged beef using large cuts of meats. These promotional efforts have also created a buzz within the Japanese media, further heightening acceptance and popularity of these new products.
Benjamin Steakhouse opened a high quality restaurant in the basement floor of new building in a Tokyo’s nightlife district, Roppongi offering dry aged beef.
A fast growing steak restaurant, Ikinari Steak, offers thick cut steaks, reasonable prices, and personalized cuts by weight.
iv. Third Wave Coffee Shops
The number of “third wave” coffee shops is increasing in Japan. New gourmet coffee brands from the U.S., such as Blue Bottle, Gorilla and The Coffee Bean and Tea Leaf opened their first outlets in Tokyo in 2015. These coffee shops feature stronger relationships with coffee growers, traders, and roasters, in order to incorporate higher-quality coffee beans, fresh roasting and skilled brewers. These concepts are well received by Japanese consumers. Even though Japan has plenty of traditional coffee shops that provide quality coffee and a cozy atmosphere, the market continues to embrace new concepts from abroad that focus on serving coffee and food.
Blue bottle coffee opened its first shop in 2015. The first shop regularly had long lines, and has expanded to 6 outlets in 2016.
The Coffee Bean & Tea Leaf opened its first outlet in the center of Tokyo’s business district in May 2015, through E. A Style, a company established jointly by the retail giant, AEON, and a QSR chain company, Hotland. They have already expanded the number of outlets to 11.
v. Value Competition

Japanese consumers continue to demand high-food quality at reasonable prices. In order to compete in the market, many fast food and family restaurants offer something called “Choi-Nomi” (quick drinking) specials. It is common in Japanese culture for working professionals to stop by pubs on their way home for one or two drinks and light snacks. Choi-nomi specials, offering deals on a drink and appetizers, are designed to attract these customers, and now are being used not just by pubs but also by both fast-food and family restaurants. For example, the major beef bowl chain Yoshinoya now offers drinks and choi-nomi specials. Sixty selected Yoshinoya shops tested the Choi-Nomi service in June 2015, and reported increased sales of 20 percent. Now all locations, about 2,900 outlets, offer the same service. Other QSR chains including Kentucky Fried Chicken, Freshness Burger, Tendon Ten-ya (Tempura bowl) and a family style chain, Bamiyan (Chinese cuisine), have all followed suit.
Yoshinoya’s signs in front of the shops invite people to stop by for Choi-Nomi.
A Tenya’s special Choi-Nomi set menu of four pieces of tempura and a glass of beer for ¥580.
vi. Convenience Stores Gain Power as Food Service Operator
Convenience stores continue to expand their ready-to-eat or deli-food offerings and have begun to compete with many fast food establishments including Japan’s beef-bowl chains, coffee shops and donuts shops. Convenience stores used to heavily rely on professional, male customers. But over the years, they have succeeded in appealing to seniors and women by offering healthier, meals, smaller portions and by expanding their dessert lineups. Convenience chains are becoming a major player in the area of takeout coffee, with increasingly better quality coffee beans and machines. According to a report in the Nikkei newspaper in 2017, Seven-Eleven increased fresh-brewed coffee sales at the stores to 1 billion cups in 2017. That compares to cumulative sales of 2.4 billion cups in an almost 4-year period ending in August 2016. After Japanese convenience stores successfully started to attract coffee customers, they added fresh donuts to their inventory starting in 2015. Seven Eleven sold about 400 million donuts in 2015, which are delivered from a central kitchen to the store within 3 hours. In addition to donuts, Lawson features small gourmet Christmas cakes designed for one person.
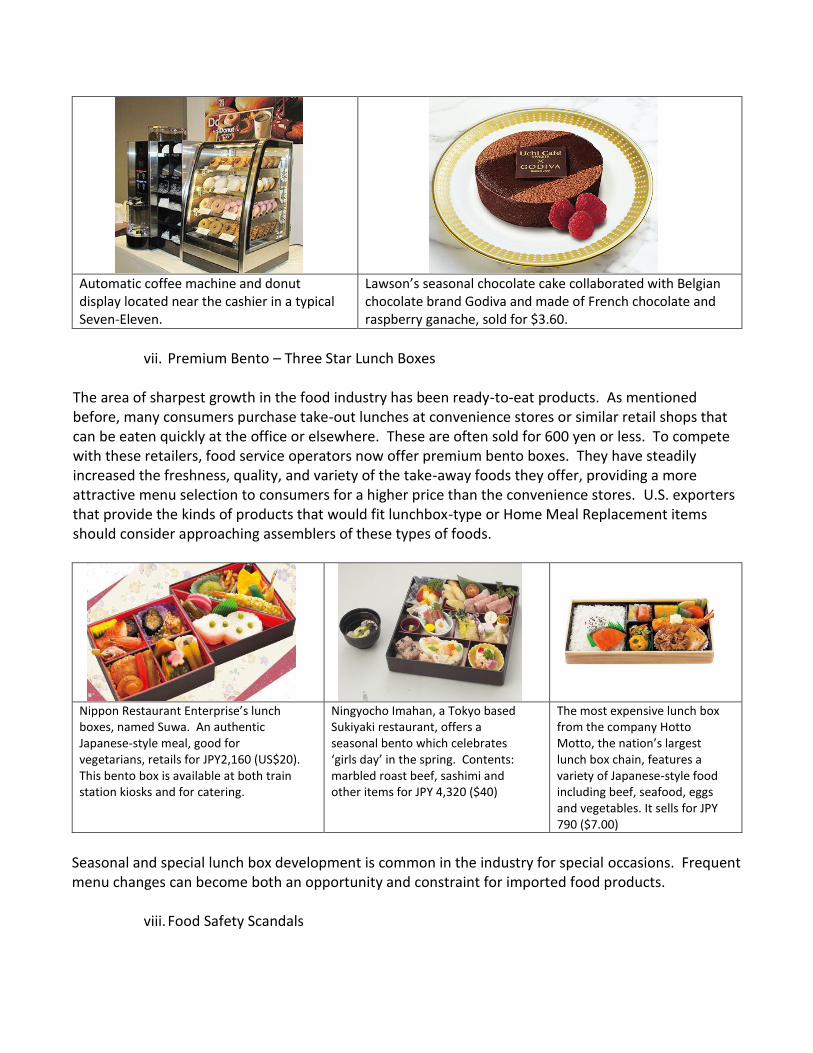
Automatic coffee machine and donut display located near the cashier in a typical Seven-Eleven.
Lawson’s seasonal chocolate cake collaborated with Belgian chocolate brand Godiva and made of French chocolate and raspberry ganache, sold for $3.60.
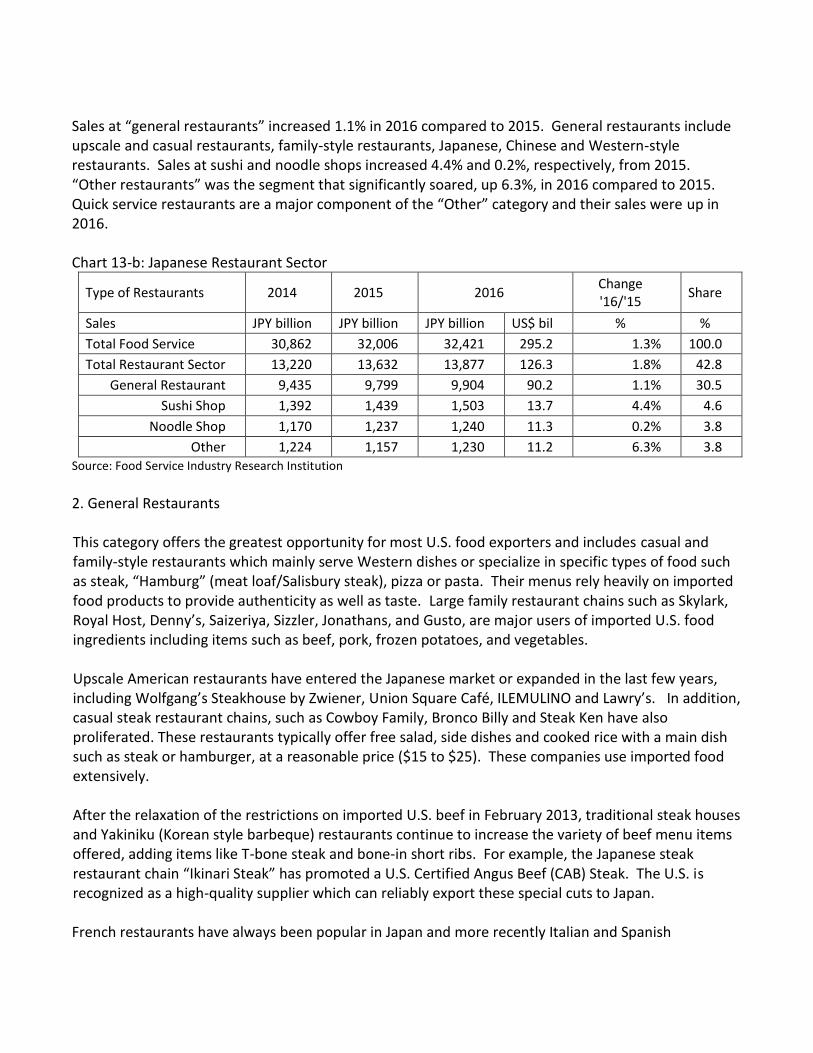
vii. Premium Bento – Three Star Lunch Boxes
The area of sharpest growth in the food industry has been ready-to-eat products. As mentioned before, many consumers purchase take-out lunches at convenience stores or similar retail shops that can be eaten quickly at the office or elsewhere. These are often sold for 600 yen or less. To compete with these retailers, food service operators now offer premium bento boxes. They have steadily increased the freshness, quality, and variety of the take-away foods they offer, providing a more attractive menu selection to consumers for a higher price than the convenience stores. U.S. exporters that provide the kinds of products that would fit lunchbox-type or Home Meal Replacement items should consider approaching assemblers of these types of foods.
Nippon Restaurant Enterprise’s lunch boxes, named Suwa. An authentic Japanese-style meal, good for vegetarians, retails for JPY2,160 (US$20). This bento box is available at both train station kiosks and for catering.
Ningyocho Imahan, a Tokyo based Sukiyaki restaurant, offers a seasonal bento which celebrates ‘girls day’ in the spring. Contents: marbled roast beef, sashimi and other items for JPY 4,320 ($40)
The most expensive lunch box from the company Hotto Motto, the nation’s largest lunch box chain, features a variety of Japanese-style food including beef, seafood, eggs and vegetables. It sells for JPY 790 ($7.00)
Seasonal and special lunch box development is common in the industry for special occasions. Frequent menu changes can become both an opportunity and constraint for imported food products.
viii. Food Safety Scandals

Many Japanese consumers are concerned about whether or not their food is safe, especially after a series of highly visible food adulteration or mislabeling incidents. In 2013, there were a spate of food-mislabeling scandals involving major Japanese hotels, department stores, and well-established restaurants. The media reported that many major hotels and 66% of department stores listed food on their menus as domestic that was actually imported. In Japan’s food culture, consumers tend to believe that domestic food is safer than imported food and are willing to pay significantly more for food produced in Japan. However, using imported food can reduce food costs and offset supply shortages. Therefore, hotel and restaurant managers often prefer to use imported food in some cases. Food safety concerns were reinforced in 2014 when TV report showed staff at a Chinese food processing company using long expired chicken meat and picking up food from the floor to add back to the mix. The resulting food safety scandal seriously damaged the sales of the largest QSR players and a large scale convenience store chain, since it was reported that they used imported chicken from China. At the same time, there were several reports of foreign materials; such as metals, plastics and organic substances; that were found in food and drinks at a major hamburger chain in 2015, greatly harming sales from that particular chain. A survey of Nikkei MJ on June 21, 2015 reported that 36.7% of Japanese consumers reduced their frequency of eating at fast food restaurants during the first half of 2015 due to a combination of food safety concerns and menu price increases. However, QSR industry sales have recovered in 2016 after no major food safety scandals occurred in the Japanese restaurant industry in 2016 and 2017.
ix. Reasonably Priced Gourmet and Social Media
Social media provides a new dynamic for the local food service industry. There are several popular search sites especially designed for finding good restaurants throughout Japan such as Tabelog, Gurunavi and Hotpepper. Social networks such as Tripadvisor and Facebook have also become a means to finding good restaurants when people travel around Japan. Yatai (food stalls) and Tachigui (stand-up-eating) restaurants have benefitted from this trend. These very casual, often temporary types of eateries have for many years offered Japanese food at a cheap price. However, like in the United States with food trucks, the quality of food offered at these types of eateries has greatly improved, and they now offer international and sometimes very high-quality food. You can now find a diverse array of upscale Tachigui restaurants, offering everything from French and Italian cuisine to Spanish food and even steak. One way that these restaurants have become so popular is through social media, where people love to share information about their food and drink experiences. In Japan, you can find many posts on Facebook and Twitter about great places to eat, including small and out-of-the way locations and yatai.

Stalls on a street in Fukuoka, which has become a very attractive dining spot for the city’s tourists. Food stalls can be found in all regions of Japan throughout the year.
Ore-no-Italian (one of a series of different ethnic restaurants using the “Ore-no” theme) features upscale and reasonable priced Italian food and live music, but because diners must stand while they eat, it has a high turnover rate each day.
C. Sub Sector Profiles Note: This report is based on statistics from the Japan Food Service Association, its affiliated Food Service Industry Research Institute—which provide Japan’s official Food Service statistics-- and the private marketing company Fuji Keizai which reflects most recent market circumstance. 1. Restaurant Sector The restaurant sector is the largest of the HRI food service segments. Restaurant sales in 2016 were ¥13.9 trillion, equivalent to $126.3 billion, up 1.8% over the previous year. This represents 42.8% of total food service industry sales. The restaurant sector includes a wide variety of operators, ranging from American-style fast food chains to more traditional family-owned, single-outlet restaurants. The restaurant sector is divided into four major sub-segments: Chart 13-a: Japanese Restaurant Sector – 2016
Restaurant Sector ¥13.9 Trill. ($126.3 Bill.)
(42.8% share of total HRI sales)
General
Restaurants (Share 71.4%)
¥9.9 Trillion ($90.2 Billion)
Sushi Shops
(10.8%) ¥1.5 Trillion ($13.7
Billion)
Noodle Shops
(8.9%) ¥1.24 Trillion ($11.3
Billion)
Other (8.9%) ¥1.23 Trillion ($11.2
Billion) Source: Food Service Industry Research Institution
Sales at “general restaurants” increased 1.1% in 2016 compared to 2015. General restaurants include upscale and casual restaurants, family-style restaurants, Japanese, Chinese and Western-style restaurants. Sales at sushi and noodle shops increased 4.4% and 0.2%, respectively, from 2015. “Other restaurants” was the segment that significantly soared, up 6.3%, in 2016 compared to 2015. Quick service restaurants are a major component of the “Other” category and their sales were up in 2016. Chart 13-b: Japanese Restaurant Sector
Type of Restaurants 2014 2015 2016 Change '16/'15
Share
Sales JPY billion JPY billion JPY billion US$ bil % %
Total Food Service 30,862 32,006 32,421 295.2 1.3% 100.0
Total Restaurant Sector 13,220 13,632 13,877 126.3 1.8% 42.8
General Restaurant 9,435 9,799 9,904 90.2 1.1% 30.5
Sushi Shop 1,392 1,439 1,503 13.7 4.4% 4.6
Noodle Shop 1,170 1,237 1,240 11.3 0.2% 3.8
Other 1,224 1,157 1,230 11.2 6.3% 3.8
Source: Food Service Industry Research Institution 2. General Restaurants This category offers the greatest opportunity for most U.S. food exporters and includes casual and family-style restaurants which mainly serve Western dishes or specialize in specific types of food such as steak, “Hamburg” (meat loaf/Salisbury steak), pizza or pasta. Their menus rely heavily on imported food products to provide authenticity as well as taste. Large family restaurant chains such as Skylark, Royal Host, Denny’s, Saizeriya, Sizzler, Jonathans, and Gusto, are major users of imported U.S. food ingredients including items such as beef, pork, frozen potatoes, and vegetables. Upscale American restaurants have entered the Japanese market or expanded in the last few years, including Wolfgang’s Steakhouse by Zwiener, Union Square Café, ILEMULINO and Lawry’s. In addition, casual steak restaurant chains, such as Cowboy Family, Bronco Billy and Steak Ken have also proliferated. These restaurants typically offer free salad, side dishes and cooked rice with a main dish such as steak or hamburger, at a reasonable price ($15 to $25). These companies use imported food extensively. After the relaxation of the restrictions on imported U.S. beef in February 2013, traditional steak houses and Yakiniku (Korean style barbeque) restaurants continue to increase the variety of beef menu items offered, adding items like T-bone steak and bone-in short ribs. For example, the Japanese steak restaurant chain “Ikinari Steak” has promoted a U.S. Certified Angus Beef (CAB) Steak. The U.S. is recognized as a high-quality supplier which can reliably export these special cuts to Japan. French restaurants have always been popular in Japan and more recently Italian and Spanish

restaurants have also grown in popularity. Mexican restaurants, which are still few in number, are slowly growing in popularity and provide opportunities for U.S. exporters of items such as tortillas, frozen guacamole, and related Tex-Mex ingredients. Food service chains that come to Japan from the U.S. are also potential customers for U.S. exporters who sell related food products. The fluctuation in number of outlets of the segment is as follows; Chart 14: General Restaurant: Number of Restaurant Outlets by Type
Type of Restaurants 2014 2015 2016 2017* 2018* Change '17/'16
Family-Style Restaurant 11,695 11,675 11,600 11,630 11,645 0.3%
Western Cuisine (American, European) 10,202 10,373 10,561 10,713 10,850 1.4%
Japanese Cuisine 105,485 104,250 103,120 102,305 101,350 -0.8%
Chinese & Korean Cuisine 38,535 38,220 37,740 37,730 37,625 -0.6%
Other Ethnic Cuisine (Mexican, Indian, SE Asian) 2,559 2,632 2,665 2,698 2,726 1.2%
Source: Fuji Keizai Co., Ltd. Food Service Industry Marketing Handbook 2016 2016* and 2017*: Estimate
Along with the improving economy, the number of full service restaurants has been growing since 2014. American and Italian restaurants were a major element of the increase in 2016. American branded restaurants have expanded and steadily gained market share, driven by an expansion of American-style breakfast outlets and the renewed availability of U.S. beef. Other new trends in this category include steakhouses and Hawaiian style restaurants. 3. Sushi Restaurants Japan is famous for sushi, which is increasingly popular around the world. Not surprisingly, Japan is the world’s largest importer of seafood products, of which a substantial portion ends up in sushi form. This includes tuna, scallops, sea urchin, salmon, salmon eggs, yellow fin, crab and shrimp. Most seafood imports pass through wholesale markets such as the Tsukiji Fish Market in Tokyo before being delivered to sushi shops throughout Japan. The U.S. is a major supplier of salmon, salmon eggs, and sea urchin used by sushi operators in Japan. The value of the sushi food service segment has been growing steadily for the past four years, and was estimated at ¥1.51 trillion in 2016, equal to $13.7 billion. A Fuji Keizai Report estimated that Japan had about 41,500 sushi restaurants in 2016, a decline of 2.4% in the number of outlets since 2012. This doesn’t mean that Japanese consumers are eating less sushi. Meantime, number of the sushi-go-round (KAITEN Zushi = on conveyer-belt) type restaurants increased from 3,830 in 2012 to 4,150 in 2016, up 8.4 %. The top five sushi chains are all Kaiten-zushi type casual foodservice business. The major sushi chains offer far cheaper prices than traditional sushi

bars, and are steadily consolidating and increasing their sales volumes and number of outlets (See chart 15). Chart 15: Major Sushi Chains
Company Sales 2016 Sales 2017* Change # of outlets Change
¥ billion ¥ billion $ million 17/16 2017 17/16
Akindo Sushiro 153.45 165.73 1,509 8.0% 500 8.0%
Kura Corporation 111.72 115.00 1,047 2.9% 410 4.6%
Hama Zushi 101.03 107.40 978 6.3% 505 7.2%
Kappa Zushi 65.40 66.50 605 1.7% 345 -0.9%
Genki Zushi 28.10 29.50 269 5.0% 155 4.7%
Source: Fuji Keizai Co., Ltd. Food Service Industry Marketing Handbook 2017 2017*: Estimate
4. Noodle Shops Noodles, served either hot or cold, are one of the most popular foods eaten both inside and outside of the home in Japan. Japanese noodles come in three main forms. Soba, which are noodles made from buckwheat; udon, noodles made from wheat; and ramen shops which are counted among the “general restaurants” in this report. In 2016, the value of the soba/udon food service segment was estimated at ¥1.24 trillion or $11.3 billion. According to Fuji Keizai research, there were an estimated 26,600 soba/udon shops in 2012. This number decreased to 24,400 in 2016, a decline of 6.2% from five years ago. Meanwhile, the market of quick service soba/udon shop has increased from ¥227.9 billion in sales and 8,020 outlets in 2012 to ¥251 billion and 8,180 outlets in 2016, up 10.1 % in sales and up 1.9% in number of outlets, in the last five years. Many of the restaurants that closed were single proprietorships, but chain operators have increased their number of outlets, typically at shopping malls and rest stops. Marukame-Seimen is the largest udon shop operator in Japan, and grew from ¥85.6 billion in sales and 778 outlets in 2016 to ¥86.4 billion (estimated) and 793 outlets (planned) in 2017.
Marukame-Seimen is a QSR udon chain operated by the Toridoll Company, featuring fresh cooked udon and tempura. The company has seen marked growth since the first udon shop opened in Kobe in 2000.
Noodles consumed outside of the home are frequently ranked as the most popular lunch item by consumers because they are quick to serve and inexpensive. A typical soba set menu will cost only ¥400 - ¥600 ($3.70 - $5.50). It is common for the Japanese working professional to eat a bowl of noodles in just a few minutes during their lunch break.

Within the soba/udon segment the number of large chains are expected to increase their market share while the number of independent shops declines rapidly. Toridoll (Marukame-Seimen’s company), the largest QSR noodle chain, has a 34.1% of share of the sub-sector. However in the category of full-service noodle shops, the majority are still individual outlets. Even the largest full service soba/udon chain, Sagami Group, has only 215 shops and a 3.9% share of the sub-sector. Opportunities for U.S. exporters lie principally in the ingredients used as toppings for noodles. This includes items such as chicken products, seasoned pork slices and sweet corn kernels. U.S. exporters wanting to enter this segment should target the major food service wholesalers that supply the shops. With regard to ramen shops, the Foodservice Industry Research Institute Report counts ramen shops in the sector of general restaurants, which is not broken down into sub-sectors. The Fuji Keizai Report estimated the value of the ramen segment as ¥440 billion in 2017, equal to $4.0 billion, up 0.7% in sales from the previous year, and estimated number of ramen shop at about 15,650 outlets in 2017, a 0.2% increase from 2016. It has noted little growth in the last five years, as an equilibrium was maintained through both the expansion of ramen chains and the closing of independent outlets. Ramen is one of most popular Japanese foods not only for Japanese consumers but also for the increasing number of inbound tourists, according to a Japanese popular search site of restaurants. A list of major Ramen shop chains in Japan in 2017: Chart 16: Major Ramen Shop Chains
Brand Company Sales 2016 Sales 2017*
Change
# of outlet
¥ million ¥
million $
millon 17/16 2017*
Korakuen Korakuen 40,400 41,000 373.3 1.5% 593
Hidaka Hidy Hidaka 36,750 38,200 347.8 3.9% 398
Rai-rai-tei Rai-Rai-tei 21,200 21,450 195.3 1.2% 235
Marugen Monogatari Corp 15,700 16,700 152.0 6.4% 127
Ichiran Ichiran 14,200 15,300 139.3 7.7% 68
Hakata Ippudo
Chikaranomoto Company 13,700 14,400 131.1 5.1% 116
Sub total (The above) 141,950 147,05
0 1,338.8 3.6% 1,537
Sub total (Other) 236,300 233,80
0 2,128.6 -1.1% 12,924
Grand Total 436,800 440,00
0 4,005.8 0.7% 15,650 Source: Fuji Keizai Co., Ltd. Food Service Industry Marketing Handbook 2017 2017*: Estimate
5. Other Restaurant Types
The Food Service Research Center categorizes a number of special food service concepts into its “All Other” category. These include:
Hamburger shops Pizza Delivery shops Fried Chicken shops Donuts and Ice Cream Shops Beef bowl Curry & Rice, Okonomiyaki (traditional Japanese food which is like a pancake with meat, vegetables
and noodles inside) A brief description of those that are of particular interest to the U.S. exporter follows:
i. Hamburger Chains
The second largest food service operator in Japan is McDonald’s Japan, which opened in 1972 and now has about 2,900 outlets nationwide. The hamburger fast food concept has been one of the most visible and successful market segments during the past 40 years. However, the value of the hamburger segment has decreased since the peak year in 2010, when it reached ¥708 billion (equal to $6.5 billion). Sales of the hamburger segment declined to ¥547 billion in 2015. So far in 2017, the segment appears to be continuing a recovery that began in 2016. Chart 17: Hamburger Market
Sales Market Total Change* # of Change*
Year ¥ Million $ Million volume outlets # outlet
2017** 621,100 5,088.9 3.4% 5,250 -0.8%
2016 600,700 4,921.8 9.9% 5,290 -4.3%
2015 546,800 4,480.1 -10.0% 5,525 -1.7%
2014 607,800 4,979.9 -8.8% 5,620 -1.7%
2013 666,100 5,457.6 -3.6% 5,720 -0.5% Source: Fuji Keizai Co., Ltd. Food Service Industry Marketing Handbook 2017 2017**: Estimate *: Change from the previous year
The major reason behind the prolonged decline in hamburger sales at fast food restaurants were the previously-mentioned food safety scandals in 2014 and 2015, as well as heavy competition from convenience stores and other QSR segments such as beef bowl, soba/udon, ramen and sushi. Even though the scandals had a serious impact on the major hamburger chains, by providing reasonably priced, fast and clean service, the hamburger chain concept managed to maintain a significant share of its young customers and families with children. And despite a dip in sales of large chain QSR burger restaurants, there has been a surge of new burger

restaurant openings. Shake Shack, Carl’s Jr. and Umami Burger have entered the market in 2015 through 2017, and have been doing well. These shops are especially popular among young professionals, and have the effect of highlighting the diversity and high-quality of American food. Because hamburger chains originated in the United States, they are ideal targets for U.S. exporters. They typically import many of their food items including frozen potatoes, pork patties, fresh tomatoes, and cut lettuce.
ii. Pizza Chains
The pizza industry has seen continued growth in Japan over the past decade. Fueled by the launch of Domino’s Pizza in 1985, pizza chains have successfully carved out a niche in the food service market in Japan with their promise of rapid delivery. According to Fujikeizai Report, the value of the delivery pizza segment is estimated at ¥126.5 billion or $1.15 billion in 2017, an increase of 0.4% from 2016. The pizza delivery industry is a highly competitive market. Top three companies combined held a nearly 80% market share. The top pizza chains include: Chart 18: Major Delivery Pizza Chains
Pizza Restaurants 2017* Change 2017/16 2017*
Company Sales Volume (¥
million) # of
Outlets sales
# of outlets
Market Share
Dominos (Dominos Japan)
38,000 510 5.6% 0.4% 30.0%
Pizza La (Four Seeds Corp.)
36,500 562 -
1.4% 0.5% 28.9%
Pizza Hut (Pizza Hut Japan)
23,100 375 -
0.9% 0.6% 18.3%
Strawberry Cones 5,800 155 -
4.9% 1.5% 4.6%
Chicago Pizza Factory 3,950 79 -
1.3% 1.0% 3.1%
Pizza 10.4 (Odin Foods) 3,500 105 -
2.8% 1.9% 2.8%
Source: Fuji Keizai Co., Ltd. Food Service Industry Marketing Handbook 2017 2017*: Estimate
Pizza delivery chains offer a wide variety of choices, many tailored specifically to Japan. In addition to traditional toppings such as pepperoni and sausage, pizzas in Japan feature toppings such as crab, shrimp, squid, scallop, prosciutto, corn, garlic, potatoes and pineapple. The pizza industry has recently shifted from the United States to the European countries for some of its shredded cheese supply due to lower prices. In addition to sourcing toppings from abroad, pizza chains also source tomato sauce, either as tomato chunks or paste, from abroad.
iii. Fried Chicken Chains
KFC Japan dominates the fried chicken market in Japan. The total market was estimated at ¥117.7

billion or $1.1 billion in 2017, with over 1,159 outlets nationwide. KFC Japan advertises use of 100% domestic Japanese chicken in order to reinforce its brand with a sense of reassurance.
6. Drinking Establishments
The drinking establishment sector had sales worth ¥5.07 trillion in 2016, equivalent to $46.1 billion. This represented 15.6% of total food service industry sales. This segment decreased by 2.4% in terms of sales in 2016 and lost a 0.6% market share from the previous year. The sector is comprised of four segments: 1) Izakaya (traditional Japanese pubs) and beer pubs 2) coffee and tea houses 3) high-end Japanese entertainment restaurants (Ryotei) and 4) bar/nightclubs. Chart 19: Japan’s Drinking Establishments Sector
Sector 2012 2013 2014 2015 2016 Change '16/'15
Unit ¥ Bil. ¥ Bil. ¥ Bil. ¥ Bil. ¥ Bil. $ Bil. %
Total 4,652 4,895 5,066 5,189 5,065 46.1 -2.4%
Pub Dining 978 1,019 1,038 1,060 1,008 9.2 -4.9%
Coffee/Tea Shops 1,020 1,061 1,092 1,129 1,118 10.2 -1.0%
Roytei 317 336 351 359 351 3.2 -2.0%
Bars/Night Clubs 2,337 2,478 2,585 2,641 2,588 23.6 -2.0% Source: Food Service Industry Research Institute
i. Pub Dining
Izakaya are Japan’s unique drinking pubs where a variety of homemade-style appetizers and meals are served with various kinds of alcoholic beverages including beer, sake, shochu (Japanese spirits), wine and cocktails. Since 2008 the number of chain izakaya operations has increased more than individually-owned businesses. This has been driven by a similar trend towards streamlining of procurement and distribution system due to harsh competition within the sector as seen among other restaurant types. Most chain restaurants use imported food products in moderation, while focusing on regional food products that are common in Japanese cooking. At pub dining restaurants, consumers order various dishes together at the same table and share with colleagues, friends and family. Chain operations are popular because of their reasonable menu pricing and wide range of food items. Izakaya chain restaurants usually have central buying systems which are always looking for new menu ideas. Pub dining operators also modify overseas recipes according to their own style and taste to create Japanese fusion items. The industry heavily uses fresh oysters, frozen vegetables, canned tomato sauce, canned olive oil, and further processed foods, such as frozen soups, and frozen seasoned pork and beef that are imported from the United States. Updated statistics in 2017 showed a decrease in sales in this sector due to increasing the number of QSR operators that started to offer Choi-Nomi (quick drink) specials. (For details see Section II-B-2-v of
this report). This is an example of how competitive the HRI market is and how one subsector added something new, convenient and reasonably priced to successfully attract new customers. A list of major pub dining chains in Japan appears below: Chart 20: Major Pub Dining Chains
Rank 2017
Company Sales* ($ Mil.)
Brand Name, # of Outlets Location Purchasing
Agents
1 Monteroza 1,037.9 Sirokiya, Uotami, Wara-wara, 1779
Nation wide
Wholesalers
2 Chimney 578.4 Hananomai/Sakanaya-dojo, Kodawariyama, 750
Eastern Japan
Trade firms, wholesalers
3 Torikizoku 452.0 Torikizoku, 600 Nation wide
Trade firms, wholesalers
4 Watami Food Service
425.8 Watami, 477 Nation wide
Trade firms, wholesalers
5 Daisho 408.5 Shoya, 630 Eastern Japan
Wholesalers
6 SPF Dining 324.8 Isomaru Suisan, 205 Eastern Japan
Trade firms, wholesalers
7 Colowide MD 252.7 Amata-ro, Hokkaido, Hiikiya, 240
Eastern Japan
Trade firms, wholesalers
8 Oizumi Foods 249.9 Wan, Sen no niwa, 265 Eastern Japan
Trade firms, wholesalers
9 G. Taste 245.2 Murasaki, Toriaezu Gohei, 300
Nation wide
Trade firms, wholesalers
10 AP Company 210.6 Tukada Nojo, Yonpachi Gyojo, 240
Nation wide
Trade firms, wholesalers
Source: Fuji Keizai Co., Ltd. Food Service Industry Marketing Handbook 2017 2017*: Estimated
ii. Coffee/Tea Shops
In 2016, the coffee/tea shop sector declined to ¥1.1 trillion in sales, a decrease of 1.0% from the previous year. This sector is very popular throughout Japan, but not as strong as it used to be. The sales volume of the sector had dropped from ¥1.7 trillion in the peak year of 1982 to a low of ¥1.1 trillion in 2014, a decline of over 37%. The sector has gone through major structural changes during this period. In 1980, Doutor Coffee Company opened the first self-service coffee shop (meaning, customers select and pay for coffee at the counter rather than ordering through wait-staff at their seats) in Tokyo and sold a cup of regular drip coffee for only 150 yen, which was one-third to one-fourth the price of most conventional style full-service coffee shops (meaning drip-style [or siphon coffee-maker] coffee shops where a waiter or waitress serves coffee to a customer’s table) at that time.

In 1996, as these self-service coffee shops came into fashion in Japan, Starbucks Coffee opened its first shop in the center of Tokyo. The new style self-service coffee/tea chains, including both Japanese and American outlets, have been expanding their business and have altered the market since then. More recently, an even newer trend is the “third wave” coffee shops offering unique types of coffee and targeting millennials, positioning themselves as “single source”, “sustainable” etc... As mentioned previously, third wave coffee shops from the U.S. hit the shore in Japan in 2016. Blue Bottle Coffee, The Coffee Bean and Tea Leaf and Gorilla Coffee are examples that have been opening in rapid succession. As a result of these new coffee shop styles, older traditional coffee shops have faced severe losses, and many are going out of business. These new U.S. coffee shops that have swept Japan’s coffee industry may provide opportunities to expand U.S. food and beverage products. Here is a list of major new style coffee/tea shop chains in Japan in 2017: Chart 21: Major Coffee/Tea Room Chains
Rank 2017
Company Name Sales ($
mil.) # Units Location Purchasing Agents
1 Starbucks Coffee Japan, Ltd.
1,444
1,295 Nation wide
Trade firms, Wholesalers,
2 Doutor Coffee Co., Ltd. 828 1,255 Nation wide
Same as above
3 Komeda Coffee 529 790 Central Japan
Same as above
4 Tully's Coffee Japan (by Ito-en)
487 680 Nation wide
Same as above
5 Saint Marc Café Holdings 267 415 Nation wide
Same as above
6 Pront Corporation (Pront) 212 280 Nation wide
Same as above
7 Nippon Restaurant System (Hoshino)
153 230 Western
Japan Same as above
8 UCC Foodservice Systems Inc. (Coffee kan)
102 300 Western
Japan Same as above
9 Pokka Create (Café de Crie) 100 200 Western
Japan Same as above
10 Chat Noir (Veloce) 93 172 Western
Japan Same as above
Source: Fuji Keizai Co., Ltd. Food Service Industry Marketing Handbook 2017 2017*: Estimated
McDonald’s Japan was a popular place to drink regular coffee when the hamburger chain launched a 100 yen ($1) coffee in 2008. Inspired by popular regular coffee sales among quick service restaurants like this, Seven-Eleven started a boom in convenience store coffee in 2013. By 2014, all major convenience stores including 7-11, FamilyMart and Lawson offered 100 – 150 yen coffee. Coffee bean
(HS code 0901) imports to Japan increased from 387,386 metric tons in 2012 to 442,648 metric tons in 2016, up 14.3%, in last 5 years. Convenience store chains were a major factor in this increase and have become a threat to the above mentioned coffee chains.
7. Hotel Food Service Sector
Food sales in the hotel sector dropped to ¥2.82 trillion in 2016, equivalent to US$25.7 billion. This was a 3.9% decrease from the previous year, and represents 8.7% of total food service industry sales. There is a sharp contrast between new style business hotels and the Japanese style small/traditional inns within the sector. After a significant decline, due to the major earthquake in 2011, the hotel food business had recovered steadily over the last five years. Major city and business hotels increased their food business while putting effort into diversifying breakfast menus in order to differentiate from competitors. However, a number of Japanese small lodging facilities, such as Ryokan, Pension and Minshuku (Japanese style small inns) have been closing or seeing declines in the number of Japanese guests due to aging of owners. Along with an increasing number of foreign travelers visiting Japan, a number of new hotels have opened since 2015 which are run by foreign-affiliated companies such as Starwood Hotels, Marriott, Park Hyatt, Conrad and InterContinental Hotels. Major Japanese hotels have also scheduled new hotels and/or renovations in order to accommodate the increase in foreign tourists and to prepare for the Olympic Games that will be held in Tokyo in 2020. Most major hotels showed an increase in sales in 2016 from the previous year. First class hotels have a large variety of banquet rooms and on-site restaurants including Western, Chinese and Japanese restaurants. Hotels are major users of almost all kinds of foods, particularly imported products. Because they usually have a large professional chef staff, hotels tend to create many dishes from scratch rather than relying on prepared or further processed foods. Decision making on what kinds of items to put on the menu is usually made by the executive chefs of each hotel. Because they cater to international travelers, many major hotels regularly feature promotions of different country’s cuisines, including American fairs. For this reason, they are historically very receptive to imported food. Halal food is one area of growing interest as the number of Muslim tourists visiting Japan has continues to increase. Chart 22: Major Hotel Chain Food and Beverage Sales in 2017
Rank Company (Hotel Brand)
Sales 2016
Sales 2017*
Change
2017/16
# of Outlets
2017
¥ million
¥ million
$ million %
2017*
1 Prince Hotels and Resorts 77,600
79,500 723.
8 2.4 44
2 Hotel Okura & Resorts
44,900
44,700 407.
0 -0.4 47
3 Hankyu Hanshin Dai-ichi Hotel Group
32,500
32,800 298.
6 0.9 48
4 Marriott International (Ritz-Carlton)
31,500 33,300 303.
2 5.7 19
5 New Otani Group 30,700 30,800 280.
4 0.3 14
6 Tokyu Hotels 28,800 29,000 264.
0 0.7 44
7 Imperial Hotel 28,900 29,000 264.
0 0.3 3
8 Resort Trust (Xiv, Sun Resort) 26,700
26,700 243.
1 0.0 43
9 Rihga Royal Hotel Group
22,700 23,000 209.
4 1.3 11
10 JR East Nippon Hotels (Metropolitan Hotels, Tokyo Station Hotel) 19,800 20,800
189.4 5.1 46
Source: Fuji Keizai – Food Service Industry Marketing Handbook 2017 2017*: Estimate
Japan has many small Ryokan or Traditional Japanese style inns, which primarily serve domestic holiday travelers. Their menus tend to be limited to traditional Japanese dishes, and therefore make them a less inviting target for U.S. exporters.
8. Institutional Food Service
The institutional food service sector in Japan includes business/office cafeterias, school lunch programs, hospital meals and childcare centers (for infant & preschool). The sector’s sales remained ¥3.39 trillion in 2016, equivalent to $30.9 billion. This represented 10.5% of total food service industry sales. Institutional food sales increased 0.4 % in 2016 from the previous year, mostly as a result of rising number of employed workers, increasing number of childcare centers and higher food prices. The institutional food service operators have invested in refurbished business and school cafeterias in order to attract more customers, and have added more healthy and delicious menus. Chart 23: Institutional Food Service Sales by Sub-Sectors
Institutional\Sales 2014 2015 2016
¥ billion $
billion Change '16/15
Share
Business/Office Cafeterias 1,721.0 1,746.3 1749.5 15.9 0.2% 5.4%
School Lunch 496.8 498.2 499.0 4.5 0.2% 1.5%
Hospitals 802.1 808.0 806.4 7.3 -0.2% 2.5%
Childcare centers (infant & preschool)
312.2 324.6 334.8 2.6 3.1% 1.0%

Total: 3,322.1 3,377.1 3,389.7 30.9 0.4% 10.5% Source: Food Service Industry Research Center
In addition to the above institutional food service market, there is a sub-sector of nursing home (for aging generation) meal services. The sub-sector has seen a marked rise of 7.8% in 2016 to reach ¥814.6 billion in sales, equivalent to $7.4 billion according to Fuji Keizai Food Service Industry Marketing Handbook 2017. Nursing home meal service sales are forecast to increase by another 4% in 2017 and to continue to grow after that as Japan’s senior population expands. Many food service companies are starting to target what is called the “silver” market, and can be expected to try to find new ways to capture sales from this growing population segment. One such avenue is via online food sales and meal delivery services for senior citizens and hospital patients being cared for at home. According to Fuji Keizai statistics, the total size of the meal/food delivery sales was ¥93.5 billion ($851.2 million) in 2016. In addition to this sales growth, new companies are entering the meal delivery market. Chart 24: Meal Delivery Service Companies for Senior Citizen
Company Brand URL (all in Japanese)
Watami Co., Ltd. Watami no Takushoku http://www.watami-takushoku.co.jp/
EN Otsuka Pharmaceutical
iEat http://www.ieat.jp/about/
Wellness Dining Corp. Wellness Dining http://wellness-dining.com/
Medical Food Service Kenko Uchi Gohan http://www.medifoods.jp
Musashino Foods Kenko Takuhai http://www.kenko-webshop.jp/
Benesse Palette Co., Ltd.
Ouchi no gohan http://www.benesse-palette.co.jp/menu/yawaraka/
Silver Life Co., Ltd. Magokoro Bento http://magokoro-bento.com/
Senior Life Create Co., Ltd.
Takuhai Cook One Two Three
http://takuhaicook123.jp/
Social Creation Inc. Niko-niko Kitchen http://nikoniko-kitchen.com/
Watami Takushoku is the top meal delivery service company for senior citizens and nursing homes. Originally a catering business for a pub dining company called Watami Food Systems, the company’s market share was 38.4 % in 2016 and 40.5 % in 2017. The popularity of online meal delivery among the aging population has encouraged newcomers. These online meal delivery companies tend to use traditional Japanese food ingredients such as, rice, seafood and fresh produce in order to the taste preferences of the senior generation.

Photos from the Watami Takushoku website offering healthy daily special menus cooked by hand and delivered in chilled containers. ¥2,900 ($25) for a set of 5 meals in a week, 1 meal per day, 5 days per week.
Reflecting this segment’s growth in general, all of the top 10 companies showed steady increases in sales volumes in 2016 from the previous year. Chart 25: Institutional Food Service Chains
Rank 2016 Company Name
Sales ($ mil.) # Units Location
Principal Purchasing Agents
1 Nissin Healthcare Food Service Co., 1,977.5 5,268 Tokyo Wholesalers
2 AIM Service 1,075.4 1,467 Tokyo Same as above
3 Green House 957.7 1,900 Tokyo Same as above
4 Seiyo Food-Compass Group, Inc. 794.4
1,070 Tokyo Same as above
6 Fuji-Sangyo Co., Ltd. 690.6
2,156 Tokyo Same as above
7 Leoc Co., Ltd. 606.2 N/A Tokyo Same as above
6 Uokuni Sohonsha 578.1 2,670 Osaka Same as above
8 MEFOSU Inc. 465.7 2,379 Tokyo Same as above
9 Nikkoku Trust Ltd. 297.5 1045 Tokyo Same as above
10 Nihon General Food 296.4 1,096 Aichi Same as above Source: Compiled from Nikkei Marketing Journal (MJ)– May 24, 2017
Conclusion The $300 billion food Service Industry in Japan is vibrant and expanding. U.S. suppliers can take advantage of this exciting market by offering quality products to the appropriate restaurants or restaurant suppliers. The top food service companies are listed in the chart below according to sales volumes. Appendix Chart 26: Top 50 Restaurant Company Profile
Rank2016 Company Sales
($ Mil.) Brand Name, Type, & # of
Outlets Location
Purchasing Agents

1 Zensho 4,089.8 Sukiya/Coco's, QSR-beef bowl & various, 4,364
Nation wide
Trade firms, wholesalers, Direct import
2 McDonald's Japan
3,992.1 McDonald's, QSR hamburger, 2911
Nation wide
Trade firms, wholesalers, Direct import
3 Skylark 3,172.1 Skylark/Gusto/ Yumean/Barmiyan, FSR, 2,974
Nation wide
Trade firms, wholesalers, Direct import
4 Colowide Group
2,929.4 Gyukaku/Amata-ro, WPJ, pub dinings, 2,733
Eastern Japan
Trade firms, wholesalers
5 Nisshin Health Food Service
1,977.5 Office/hospital meals, Institutional, 5,268
Nation wide
Trade firms, wholesalers
6 Plenus 1,642.1 Hotto Motto, take away lunch box, 2,990
Western Japan
Trade firms, wholesalers
7 Akindo Sushiro
1,332.8 Akindo Sushi-ro, QSR-Sushi, 442
Western Japan
Trade firms, wholesalers, Direct import
8 Kentucky Fried Chicken Japan
1,257.9 KFC/Pizza hut, QSR-delivery meals, 1,519
Nation wide
Trade firms, wholesalers
9 Monteroza 1,220.9 Sirokiya/Uotami/Wara-wara, pub dinning, 2,009
Nation wide
Wholesalers
◊
Reins Internationa (Colowide Group)
1,140.7 Gyukaku, casual stake house, 1,420
Nation wide
Trade firms, wholesalers, Direct import
10 AIM Service 1,075.4 Institutional, 1,467 Eastern Japan
Wholesalers
11 Saizeriya 1,027.5 Italian FSR/Saizeriya, 1,028 Nation wide
Trade firms, wholesalers, Direct import
12 Kura Corporation
1,010.1 Kura-zushi, QSR, 385 Western Japan
Trade firms, wholesalers
13 Create Restaurants
1,004.7 Hinazushi, QSR/FSR/pub dinings, 822
Eastern Japan
Trade firms, wholesalers
14 Mos Food Service
957.7 Mos Burger, QSR, 1,392 Nation wide
Trade firms, wholesalers
15 Green House 929.5 Institutional, home meal replacement, 1,900
Nation wide
Trade firms, wholesalers
16 Yoshinoya Holdings
910.6 Yoshino-ya/beef bowl, 1,207 Nation wide
Trade firms, Direct import

17 Toridoll 858.0 Marukame Seimen, QSR-noodle, 877
Nation wide
Wholesalers
18 Osho Food Service
833.0 Gyoza no Osho, Ramen shops, 717
Nation wide
Trade firms, wholesalers
◊ Doutor Coffee (Doutor & Nichi-Res)
808.0 Doutor, coffee shop, 1,349 Nation wide
Trade firms, wholesalers, Direct import
19 Seiyo Food Compass
794.4 Han/CASA/Itoguruma, pub dinning/family style/Institutional, 1,070
Eastern Japan
Trade firms, wholesalers, Direct import
20 Matsuya Foods
789.2 Matsu-ya, QSR-beef bowl, 1073
Nation wide
Trade firms, wholesalers, Direct import
21 Ichiban-ya 752.0 Ichiban-ya, QSR-curry shop, 1,282
Nation wide
Trade firms, wholesalers
22 Duskin 744.0 Mr. Donuts, QSR, 1,165 Nation wide
Trade firms, wholesalers
23 Fuji Sangyo 690.6 Institutional, 2,156 Eastern Japan
Wholesalers
24 Seven and I Foodservice
672.0 Denny's, Famil, Popo, FSR/QSR, 764
Nation wide
Trade firms, wholesalers
25 Saint Marc Holdings
663.7 Bakery café, various, 888 Western Japan
Wholesalers
26 Chimney 643.4 Hananomai/Sakanayadojo, pub dinings, 747
Eastern Japan
Trade firms, wholesalers
27 Four Seeds 608.2 Pizza La/Kua'aina, pizza delivery/QSR, 1,382
Nation wide
Trade firms, wholesalers, Direct import
28 LEOC 606.2 Institutional, (380) Eastern Japan
Trade firms, wholesalers
◊ Kappa Create (Colowide Group)
598.5 Kappa Zushi, QSR-Sushi, 351 Eastern Japan
Trade firms, wholesalers
29 Daisho 597.8 Shoya, pub dinning, 723 Eastern Japan
Wholesalers
30 Uokuni Sohonsha
578.1 Office cafeteria-Institutional, 2,670
Western Japan
Wholesalers
31 Joyful 572.5 Joyful, FSR, 782 Western Japan
Wholesalers
32 Monogatari Corporation
458.4 Yakiniku King, ramen 365 Central Japan
Trade firms, wholesalers
33 Aleph 541.2 Bikkuri Donkey, FSR, 342 Eastern Japan
Trade firms, wholesalers
34 Fujio Food Systems
515.3 Maido Okini, Japanese style rst, 801
Western Japan
Wholesalers
◊ Atom (Colowide Group)
502.0 Steak Miya/Neneya, FSR/QSR, 490
Eastern Japan
Trade firms, wholesalers
35 Mefos 554.1 Institutional, 2,379 Eastern Japan
Trade firms, wholesalers
36 Nippon Restaurant Enterprise
515.3 American Diner B&G /Ajisai-tei, multi-FS/ restaurants/bento, 349
Eastern Japan
Trade firms, wholesalers, Direct import
37 Rock Field 453.2 RF1, take out meals, 324 Central Japan
Trade firms, wholesalers
38 Watami Food Service
437.0 Watami, pub dinning, 479 Nation wide
Trade firms, wholesalers
39 Origin Toshu 415.6 Origin Bento, take out meals, 551
Eastern Japan
Trade firms, wholesalers
40 B-R Thirty-One Ice Cream
410.7 Thirty-One Ice Cream, QSR-ice cream, 1,179
Nation wide
Trade firms, wholesalers
41 Kisoji 408.9 Kisoji, Japanese style restaurants, 163
Nation wide
Trade firms, wholesalers
◊
Nippon Restaurant System (Doutor & Nichi-Res)
391.2 Yomen-ya Goemon, pasta & coffee shops, 563
Nation wide
Trade firms, wholesalers
42 Hurxley Hokka-Hokka-tei
381.3 Hokka hokka tei, take away lunch box 994
Eastern Japan
Trade firms, wholesalers
43 Koraku-en 363.7 Korakuen, noodle shops, 544 Eastern Japan
Trade firms, wholesalers
44 Torikizoku 351.9 Torikizoku, pub dining, 492 Nation wide
Trade firms, wholesalers
45 Hiday Hidaka Co., Ltd
351.5 Noodle, chinese restaurants, 399
Kanto Region
Trade firms, wholesalers
46 Royal Host 345.6 Royal Host, Cowboy Family, Shakey's, FSR, (270)
Nation wide
Trade firms, wholesalers, Direct import
◊ Nilax (Skylark Group)
337.2 Shabuna, food court, 262 Eastern Japan
Trade firms, wholesalers
47 Dynac 327.8 Hibiki/Toridori, pub dinings/restaurants, 258
Eastern Japan
Trade firms, wholesalers
48 Green House Foods
323.2 Saboten, Shahoden HMR/restaurant, 614
Nation wide
Trade firms, wholesalers
49 Ootoya 312.7 Otoya, Japanese style FSR, 349
Nation wide
Trade firms, wholesalers
◊ Colowide MD (Colowide Group)
311.1 Amataro, Irohanihoheto, pub dining, 325
Eastern Japan
Trade firms, wholesalers
50 Via Holdings Inc. 305.4 Pub dinning, various, 554
Eastern Japan
Wholesalers, Trade firms
Source: Nikkei Marketing Journal, May 25, 2016 QSR= Quick Service Restaurant, FSR = Family Style Restaurant
◊ = a subsidiary company belongs to the parent company mentioned in ()
III. POST CONTACT AND FURTHER INFORMATION Reports from USDA Japan, including the Agricultural Trade Offices and the Office of Agricultural Affairs, are frequently updated and can be found by searching the FAS Japan Reports website at: http://www.usdajapan.org/reports/ A. Post Contacts In Tokyo: Agricultural Trade Office, Tokyo 1-10-5 Akasaka Minato-ku, Tokyo 107-8420 E-mail: [email protected] Tel: 81 (3*) 3224-5115 Fax: 81 (3*) 3582-6429 In Osaka-Kobe: Agricultural Trade Office, Osaka American Consulate General 11-5, Nishitenma 2-chome Kita-ku, Osaka 530-8543 E-mail: [email protected] Tel: 81 (6*) 6315-5904 Fax: 81 (6*) 6315-5906 *Please add a zero before this number if dialing from within Japan. The following homepages and reports can provide useful information to interested exporters.

B. Agricultural Trade Office’s homepages http://www.usdajapan.org/ (FAS Japan, English) http://www.myfood.jp/ (ATO Tokyo, Japanese) C. Exporter Guide Japan Exporter Guide The Agricultural trade Office publishes an annual report on Japan’s food and agribusiness sector containing information useful to potential exporters considering the Japanese market for the first time. These reports are frequently updated and can be found using the FAS Japan Reports website at: http://www.usdajapan.org/reports/ and searching for Japan and Exporter Guide D. Regulations & Standards The USDA/FAS Report, “Japan Food and Agricultural Import Regulations and Standards (FAIRS Country Report)”, provides information about food import regulations and standards. This report can be found at the following website: http://www.usdajapan.org/reports/
Related Documents