1 January 2019 STRATEGIC EXPLORATION 2005 – 2019 In mining exploration, it is now assumed that the deposits outcropping become increasingly scarce and future discoveries are becoming increasingly complex and can only be made by hidden deposits. This reality, coupled with the need to economically optimize the various phases of exploration has led to the use of indirect methods. So ONHYM launched hyperspectral airborne and geochemical exploration, geophysical airborne who helped to identify targets for mining research several campaigns. During 2005-2019 a strategic exploration program was carried out. It includes: Three geochemical campaign (soil and heavy minerals) from 2005 to 2007, from 2009 to 2010 and 2013 to 2016 is underway in the southern provinces of Morocco; Two airborne hyperspectral campaigns from 2008 to 2009 and 2011 to 2012 in the central Anti-Atlas (Sirwa) and Western Anti-Atlas (Kerdous, Bas Draa, North Akka, Tata inliers); A geophysical airborne Campaign (AFMAG) in the western Anti-Atlas from 2011 to 2012. In addition, a recent geochemical survey (stream - sediment and Heavy minerals) is underway in the central High Atlas.

Welcome message from author
This document is posted to help you gain knowledge. Please leave a comment to let me know what you think about it! Share it to your friends and learn new things together.
Transcript

1
January 2019
STRATEGIC EXPLORATION 2005 – 2019
In mining exploration, it is now assumed that the deposits outcropping become increasingly scarce and future discoveries are becoming
increasingly complex and can only be made by hidden deposits. This reality, coupled with the need to economically optimize the various phases
of exploration has led to the use of indirect methods. So ONHYM launched hyperspectral airborne and geochemical exploration, geophysical
airborne who helped to identify targets for mining research several campaigns.
During 2005-2019 a strategic exploration program was carried out. It includes:
Three geochemical campaign (soil and heavy minerals) from 2005 to 2007, from 2009 to 2010 and 2013 to 2016 is underway in the
southern provinces of Morocco;
Two airborne hyperspectral campaigns from 2008 to 2009 and 2011 to 2012 in the central Anti-Atlas (Sirwa) and Western Anti-Atlas
(Kerdous, Bas Draa, North Akka, Tata inliers);
A geophysical airborne Campaign (AFMAG) in the western Anti-Atlas from 2011 to 2012.
In addition, a recent geochemical survey (stream - sediment and Heavy minerals) is underway in the central High Atlas.
2
1- Geochemical surveys :
a- Moroccan Southern Provinces
The works started with orientation survey to define the most representative fraction size for soil samples, which gives the best contrast between the values of geochemical background and geochemically anomalous values. The survey showed that the fraction <250 microns gives the best contrast between the geochemical background and anomalous values. For heavy mineral samples, the objective is focused on defining the mineral associations represented in the sector.
The campaigns have been conducted in Sdar, Ma’talla, Ouday Çfa, Mzayzat As- Sakkoum, Al Aggaya, Set Al Ayn Al Bayda, Lahjayra Al Bayda, Bir Gandouz, Imlily, Al Faj and Madnat Aghracha topographic sheets at a 1:100 000 scale.
Fig. 1 – Location map with general geological setting of the geochemical campaigns in Southern Provinces

3
All campaigns results are recorded in important database. The analytical data were subjected to statistical processing (basic statistics, factor analysis and correlation matrices). In addition, mono-elementary and multi-elementary soil and stream sediment geochemical maps were developed. The results of the various geochemical surveys are available in digital and paper formats and are presented in the form of explanatory notes, geochemical atlas, Access databases and ARCGIS projects.
The interpretation of the geochemical anomalies obtained in relation to the geological and tectonic context of the sector made it possible to establish a
synthesis of the results, for each of the campaigns, highlighting the different associations of elements with geochemical affinity.
Thus, various associations characterizing the different geological contexts have been defined for the soil and the Heavy mineral concentrates for each of the
campaigns. The anomalous areas highlighted have been prioritized and are targets for miner research. The table showed below, summarizes the different
associations defined for the soil.
Geochemical campaigns 2006-2007 2009-2010 2013-2016
Aim Locate geochemistry anomalous that could be exploration mining targets
Location Oued Ed-Dahab –Lagouira region
Area 5 000 km² 5 000 km² 3 100 km²
Lithologic fraction < 250 μm for soil
and < 2mm for Heavy minerals
Samples collected soil 10 004 10 000 6 200
Heavy minerals concentrate 1 019 1 000 620
Analyzed Elements for the soil (43 elements) Au, Ag, As, Ba, Be, Bi, Cd, Ce, Co, Cr, Ni, Cu, Fe, Hg, Li, Mg, Mn, Si, Ca, Na, Al, K, Mo, Nb, Ta, P, Pb, Sb, Sc, Sn, Sr, Te, Th, Ti, U, V, W, Y, Zn, Zr, Pt, Pd and Rh.
Analyzed elements for Heavy mineral (21 elements) Au, Ag, As, Ba, Be, Bi, Ce, Cu, Hg, Mo, Nb, Ta, Pb, Sn, Ti, W, Zn, Zr. Pt, Pd and Rh.
Generated maps (Soil)
Soil samples map
Mono anomalies maps
Anomalies distribution maps
Soil anomalous maps
Generated maps (Alluvial : Heavy mineral)
Stream sediment samples maps
Anomalous point maps
Mineralogical anomalous maps
Synthetic map alluvial(chemistry)
Synthetic map alluvial (mineralogy)

4
Campagne 2005-2007 Campagne 2009-2010 Campagne 2013-2016
C1-G.1 Ni, Cr, Co, Mg ± V ± Ti ± Fe ± Pt ± Pd ± Au ±
Cu
C2-G.1 U, Th, Ce, Ta, Nb, Ba ± Ag ± Sn ± W
± Pb ± As ± Pt ± K
C3-G.1 Co, Mg, Cu, Fe, V ± Cr ± Ni ± Zn
C1-G.2 Ni, Cr, Co, Cu, Pt, Pd, Rh, Mg ±Te ± Ag ± Sr ±
Fe ± Na ± Au
C2-G.2 Ni, Cr, Co, Mg ± V ± Ti ± Fe ± Pt ± Pd ± Au ±
Cu ± Ag
C3-G.2 Ni, Cr, Co ± Cu ± V ± Fe ± Mg
C1-G.3 Ni, Cr, Co, Mg, Pt, Pd, Rh, Au ± Cu
± Ti ± Sc ± U ± Te
C2-G.3 Co, Fe, Sc ± Cu ±Ag ± Ti ± V ± Mg
± K
C3-G.3 U, Th, Ce ± Ba ± Na ± K ± Be ± Y ±Sn
± Pb ± Nb ± As C1-G.4 Pb, Zn, As, ± Ag ± Cd ± Sn C2-G.4 U, Th, Y ± Ce ± Pb ± Zn C3-G.4 Pb, Zn, As ± Y ± Th ± U ± K ± Li ± Be
± Sn ± Ce ± Nb ± Cr ± Co C1-G.5 U, Th, Ce, Ta, Nb, Ba, ± Ag ± Sn ± W ± Pb ± As
± Pt ± K
C2-G.5 W, Sb, K ± Ag ± Cd ± Sn C3-G.5 Th, Ce, Nb ± Y ± Sn ± Be ± Pb ± Nb
± As ± K C1-G.6 U, Th, Zr, ± Y ± Ce ± Pb ± K C3-G.6 Cr, Co, Ce, Cu ± Sn ± Te ± Nb ± Bi ± Ba ± Sr ± W
C1-G.7 Cu, Co, Fe, V ± Ti ± Sc ± Mg ± Na
± Zn
a- Central High Atlas
A stream sediment and heavy mineral concentrates geochemistry campaign is underway in the central High Atlas. It aims to cove r 10,000 km2 and to collect
21,000 samples including 10,000 stream sediment, 10,000 alluvial and 1,000 for the mineralogical study. The planned chemical analysis are:
Elemnts planned to be analysed Number of planed Analysis
Stream sediment Au, Ag, Al, As, Ba, Be, Bi, Cd, Ca, Ce, Co, Cr, Na, Ni, Cu, Fe, Hg, Ir, Li, Mg, Mn, Si, K, Mo, Nb, Ta, Os, P, Pb, Sb, Sc, Sn, Sr, Te, Th, Ti, U, V, W, Y, Zn, Zr, Pt, Pd, Re, Rh et Ru.
470 000
Heavy mineral concentrates Ag, As, Au, Ba, Be, Bi, Cd, Ce, Co, Cr, Cu, Fe, Hg, Ir, Mg, Mn, Mo, Nb, Ni, Os, Pb, Pd, Pt, Re, Rh, Ru, Sb, Sn, Sr, Ta, Te, Th, Ti, U, V, W, Y, Zn et Zr
390 000

5
Fig. 2 – Location map with general geological setting of the geochemical campaigns in central High Atlas
The work also began with an orientation study that defined the size fraction that can give the best geochemical contrast between bottom and anomalous values for stream sediment samples.
The results of this campaign will be structured in the form of a database. The analytical data will be subject to the statistical processing required (basic statistics, factor analysis and correlation matrices) in the development of chemical element distribution maps and single and multi -element anomaly maps.
The works started with orientation survey to define the most representative fraction size for stream sediment samples, which gives the best contrast between the values of geochemical background and anomalous values.

6
The survey have been conducted in Sdar, Ma’talla, Ouday Çfa, Mzayzat As- Sakkoum, Al Aggaya, Set Al Ayn Al Bayda, Lahjayra Al Bayda, Bir Gandouz, Imlily, Al
Faj and Madnat Aghracha topographic sheets at a 1:100 000 scale.
2- Hyperspectral campaigns:
ONHYM conducted two airborne hyperspectral remote sensing campaigns in the Anti -Atlas. The first concerned the Siroua massif (Central Anti-Atlas) while the second covered the Kerdous, Bas Draa, the north of Akka and Tata Precambrian inliers. The location of these campaigns is shown in the map below.
Fig. 3 – Location map with general geological setting of the two hyperspectral campaigns
7
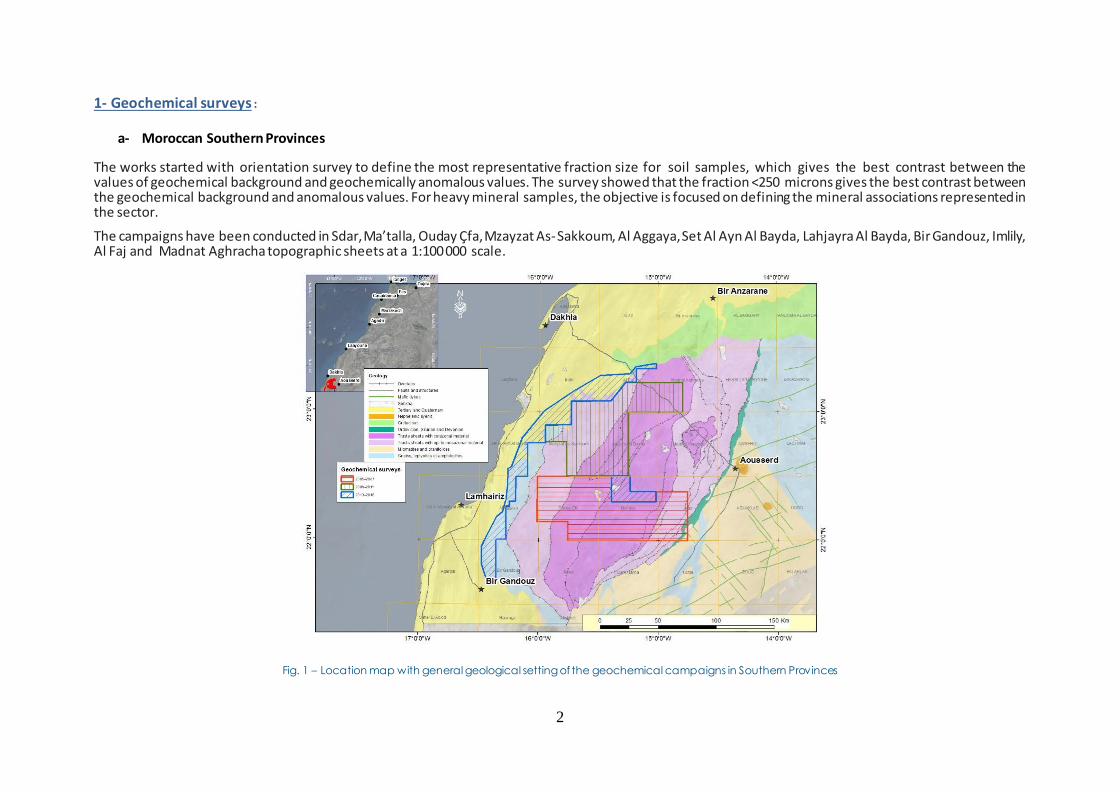
These campaigns helped to obtain a detailed map of alteration minerals that are linked to hydrothermal alteration, that are related to different types of deposit models. The characteristics of these campaigns are listed in the table below:
Campaign from 2008 to 2009 Campaign from 2011 to 2012
Goal Mineral identification and their associations: Alunite, Kaolinite, Pyrophyllite, Montmorillonite, Illite, Chlorite, Sericite, Jarosite, Hematite, Goethite, Talc, Calcite, Dolomite.
Geographical situation
Central Anti-Atlas (Sirwa) Western Anti-Atlas (Kerdous, Bas Draa, Akka Nord and Tata)
Area 10 000 km² 10 100 km²
Data acquisition
Data acquisition with SPECTIR Geometrical resolution: 05 m 350 spectral bands Geometrical correction with Differential GPS
Data acquisition with HYMAP Geometrical resolution: 05 m 128 spectral bands Geometrical correction with Differential GPS
Analysis and interpretations data
Data processing Mineral mapping, Database structuring Field control of six proprietary areas with field spectrometer, Rocks sampling and DRX analysis
Type of generated maps
1/50 000 scale maps of all mapped minerals Synthetic maps of mineral association
The obtained results helped to create a database that contain informations about 13 different targets from the first campaign, and 52 targets from the second campaign. These targets were linked to their respective metalogenic models, by using their specific mineral paragenesis.

8
Identified targets within Sirwa’s area (Campaign from 2008 to 2009)
Identified targets in the following inliers: Kerdous, Bas Draa, Akka north and Tata (Campaign from 2011 to 2012)
Type 1 target Minerals selected from the integration of data with the typical gold mineralization model (West Autralia, M. P Schwann);
Type 2 target Advanced argillic alteration: pyrophyllite, dickite, goethite;
Type 3 target Contact shear zone: illite with phengite observed in several prospects with extensions, important in shear zones with close contact zones of carbonate-phyllitic sediment;
Type 4 target Argillic alteration: paragonite, illite, phengite
Type 5 target Destruction of chlorite: chlorite replaced by felsic minerals with the sericite-carbonate mixture,
Type 6 target Goethite: its joint presence with other targeted minerals
Type 7 target Pegmatite dikes: illite-oligoclase for mapping;
Type 8 target small area of kaolinite anomaly
Priority 1
Tidili : Epithermal with Pyrophyllite, dickite, kaolinite, Al-illite
Khzama : Porphyry Halo Propyllitic, rhyolite ? porphyry with high Al illite, dickite zone
Siroua’s breccia : Epithermal hosted in alkaline rocks with Alunite, kaolinite and Al-illite
Taghdout chain : Epithermal probably (Similar to Walker Lane) with Al-illite, pyrophyllite, dickite and kaolinite
Priority 2
Tidili North, Tidili South, Tidili SE : Epithermal with possibility of porphyry in Tidili north with Pyrophyllite, dickite, kaolinite, Al -illite and zoned illites
Siroua’s volcanic complex (Siroua A-E) :Epithermal hosted in alkaline rocks with Alunite, kaolinite and Al-illite
Zgounder NE with Al-illite and kaolinite
NW alteration zone: Epithermal with Alunite, pyrophyllite, dickite, kaolinite and Al -illite
Tafrent NE with Al-illite
Priority 3
Khzama North with Al-illite and kaolinite
Taghdout South, SW, West and NW : probably Epithermal with Al-illite and kaolinite
Izazen, Izazen West: Prophyry with Al-illite and circular kaolinite
NW A, B : probably Porphyry with Al-illite and kaolinite

9
Fig. 4 – Alteration map in the area of Tidili
Fig. 5 – Example of a mineral alteration zonation in the area of Ameln Valley (Kerdous inlier)

10
Based on the model characterizing the Tazalaght copper mine in the Western Anti Atlas, a campaign conducted by the airborne geophysical ZTEM method was carried out. This campaign helped to search for hidden copper deposits and covered the area between the Precambrian inliers of Kerdous, Akka and Ighrem. The covered area is 4,000 square kilometers.
Fig. 6 – Situation map with general geological setting of the AFMAG-ZTEM airborne geophysical campaign
AFMAG is an airborne geophysical method based on inductive electromagnetism that is capable of reaching great depths of exploration. It is therefore well suited to search for hidden deposits that are deep rooted. The contrast of the resistivity characterizing the geological formations present in the area of study, made it possible to obtain maps and sections at different depth levels, with the aim of locating the basement-highs related to the copper mineralization in the zone of study. The conducted campaign is characterized by the following technical specificities:

11
ZTEM Magnetism
Number of flight lines/tie-lines 422/22
Line spacing 300m
Tie-line’s spacing 1000m
Measurement frequency 25 Hz, 37 Hz, 75 Hz, 150 Hz, 300 Hz, 600 Hz
Mobile sensor Receiving loop : 7,4m de diameter to measure vertical
component
Airborne Magnetometer
Reference station 2 vertical and orthogonal coils : 3,5 m of diameter to
measure horizontal component Fixed base magnetometer
Mean flight speed 80 km/h
Measured parameters In-phase component and quadrature of the magnetic
field induced Total magnetic field
Data acquired from this campaign were interpreted qualitatively and quantitatively:
Qualitative interpretation :
o In Phase components and in quadrature components help to obtain indications on the conductivity variation of the geological formations.
The analysis of maps elaborated from different frequencies show a good correlation between geological units and obtained valu es.
Precambrian formations areas are relatively resistant regarding to carbonates formation within the cove red area. “Serie de base” formation
which constitute the transition between the two units shows a very high resistivity contrast. This physical aspect helped to map the location
of these formations, at great depth. These results also contributed to the geological mapping in inaccessible areas and to select potential
areas for mineral exploration.
o The in phase total divergence is built from the in phase components of the X and Y directions, and helps to maps more precisely the conductive
areas like faults and alteration areas. Inversely, high resistivity represents Precambrian formations. More conductive areas coincides with “Lit
de vin” outcrops or with faults. Reduction to the magnetic pole shows magnetic structures and any perturbation affecting the Precambrian
formations.

12
Quantitative interpretation:
Anomalous ZTEM points were selected, interpreted and mapped with their respective maximal amplitude, depth and frequency:
- 2D insertion of ZTEM allows quantitative interpretation of the results. It allows the resistivity distribution underground and geological structures
identification especially basement-highs (paleoreliefs) of Precambrian formations. These structures are targets for copper mineralization ;
- 2D quantitative interpretations are in sections and resistivity maps of several levels. These data helped to describe the geo logical structures
evolution and allowed to map these basement-highs.
Therefore, airborne geophysical AFMAG campaign carried out in the western Anti Atlas has allowed to map several geological structures with mineralization
potential. It has confirmed the existence of paleoreliefs by using high resistivity contrast. Several conductors could correspond to an in depth mineralized
structures and alteration areas. These results are the bases for planning geological and ground geophysical works.
Fig. 7 – 3D modeling of resistiv ity cross sections
Related Documents