Copyright 2014 by Richmont Mines TSX - NYSE MKT: RIC 1 TSX – NYSE MKT: RIC www.richmont-mines.com JANUARY 2015

Welcome message from author
This document is posted to help you gain knowledge. Please leave a comment to let me know what you think about it! Share it to your friends and learn new things together.
Transcript

Copyright 2014 by Richmont Mines
TSX - NYSE MKT: RIC
1
TSX – NYSE MKT: RIC
ww
w.r
ich
mo
nt
-min
es
.co
m
JA
NU
AR
Y
20
15

Copyright 2014 by Richmont Mines
TSX - NYSE MKT: RIC
2 2
Safe harbor statement & cautionary note to U.S. investors concerning resource estimates
This presentation contains forward-looking statements that include risks and uncertainties. The factors that could cause actual results to differ materially from those indicated in such forward-looking statements include changes in the prevailing price of gold, the Canadian-U.S. exchange rate, grade of ore mined and unforeseen difficulties in mining operations that could affect revenue and production costs. Other factors such as uncertainties regarding government regulations could also affect the results. Other risks may be detailed from time to time in Richmont Mines Inc.’s periodic reports and annual notice.
The resource estimates in this presentation were prepared in accordance with Regulation 43-101 adopted by the Canadian Securities Administrators. The requirements of Regulation 43-101 differ significantly from the requirements of the United States Securities and Exchange Commission (the “SEC”). In this presentation, we use the terms “Measured”, “Indicated” and “Inferred” Resources. Although these terms are recognized and required in Canada, the SEC does not recognize them. The SEC permits U.S. mining companies, in their filings with the SEC, to disclose only those mineral deposits that constitute “Reserves”. Under United States standards, mineralization may not be classified as a Reserve unless the determination has been made that the mineralization could be economically and legally extracted at the time the determination is made. United States investors should not assume that all or any portion of a Measured or Indicated Resource will ever be converted into “Reserves”. Further, “Inferred Resources” have a great amount of uncertainty as to their existence and whether they can be mined economically or legally, and United States investors should not assume that “Inferred Resources” exist or can be legally or economically mined, or that they will ever be upgraded to a higher category.
U.S. Investors are urged to consider the disclosure in our annual report on Form 20-F, File No. 001-14598, which may be obtained from us or from the SEC’s web site: http://sec.gov/edgar.shtml.
TSX - NYSE MKT: RIC Copyright 2015 by Richmont Mines
Copyright 2014 by Richmont Mines
TSX - NYSE MKT: RIC
3
Corporate Overview
TSX - NYSE MKT: RIC 3
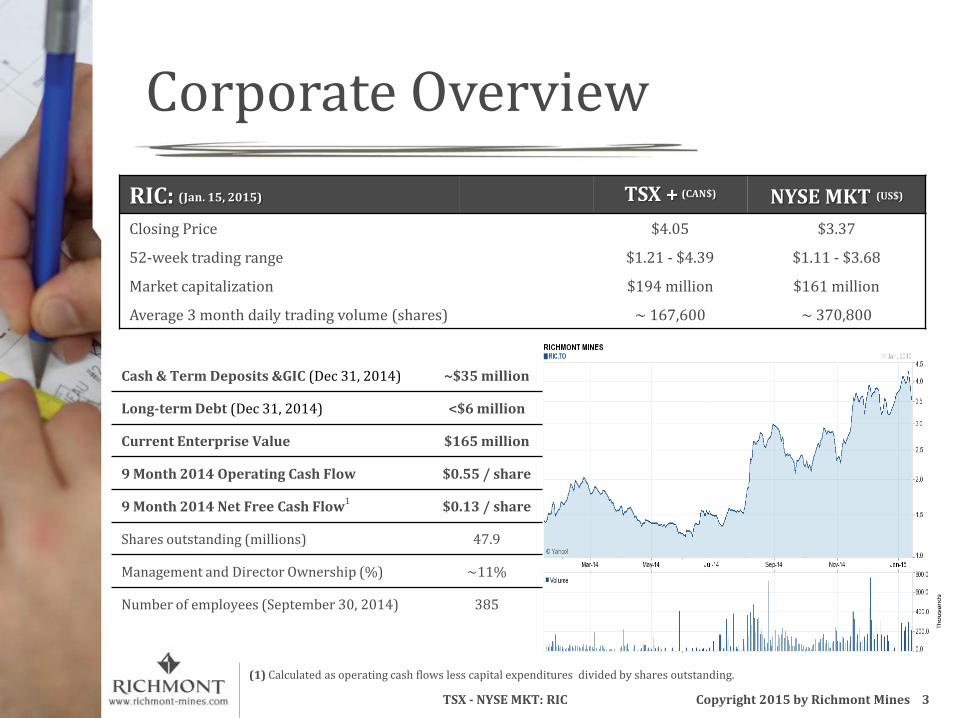
RIC: (Jan. 15, 2015) TSX + (CAN$) NYSE MKT (US$)
Closing Price $4.05 $3.37
52-week trading range $1.21 - $4.39 $1.11 - $3.68
Market capitalization $194 million $161 million
Average 3 month daily trading volume (shares) ~ 167,600 ~ 370,800
Cash & Term Deposits &GIC (Dec 31, 2014) ~$35 million
Long-term Debt (Dec 31, 2014) <$6 million
Current Enterprise Value $165 million
9 Month 2014 Operating Cash Flow $0.55 / share
9 Month 2014 Net Free Cash Flow1 $0.13 / share
Shares outstanding (millions) 47.9
Management and Director Ownership (%) ~11%
Number of employees (September 30, 2014) 385
Copyright 2015 by Richmont Mines
(1) Calculated as operating cash flows less capital expenditures divided by shares outstanding.

Copyright 2014 by Richmont Mines
TSX - NYSE MKT: RIC
4
Highlights
Transformational, Low Risk Asset Being Developed in Ontario
1.1 million ounce global resource below operating Island Gold Mine, grade of 9.6 g/t Au
Track Record of Sustainable Gold Production
1.5+ million Au ounces produced over 20+ years
2014: 94,503 Au ounces sold
2015 forecast: 78,000–88,000 Au ounces (with open-pit Monique Mine contribution lower year-over-year due to planned end of mining)
Quality Asset Base & Strong Balance Sheet
Operating mines in low-risk jurisdictions: Ontario and Quebec
~$35 million of cash & term deposits, debt < $6 million, at Dec. 31, 2014
47.9 million shares on TSX - NYSE MKT
Copyright 2015 by Richmont Mines
4 TSX - NYSE MKT: RIC
Copyright 2014 by Richmont Mines
TSX - NYSE MKT: RIC
5
2015 Guidance & Budget
Copyright 2015 by Richmont Mines
5 TSX - NYSE MKT: RIC
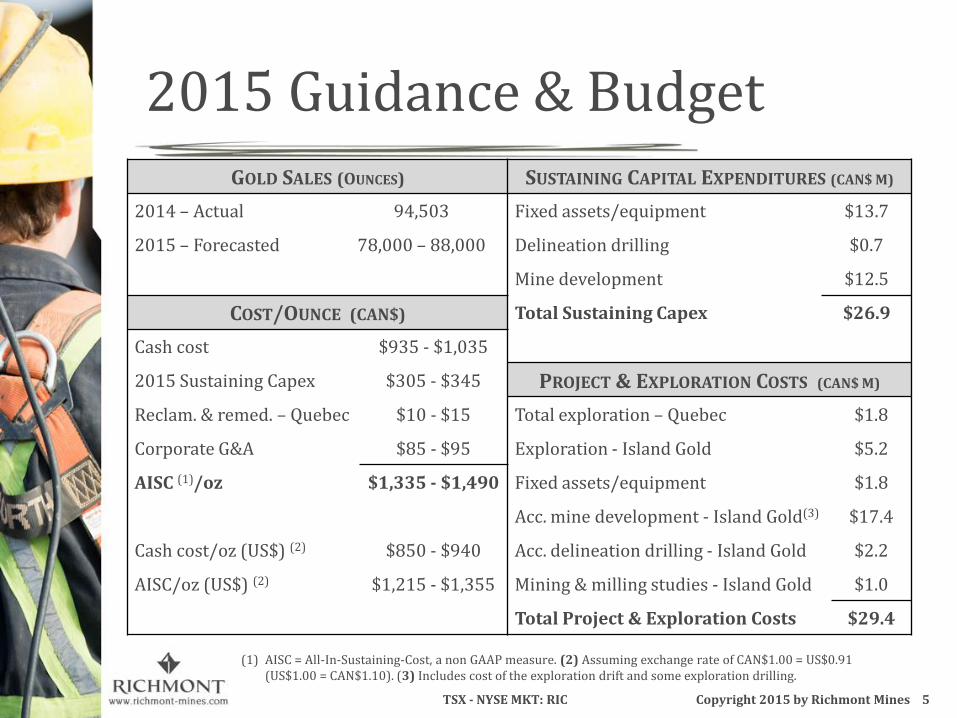
GOLD SALES (OUNCES) SUSTAINING CAPITAL EXPENDITURES (CAN$ M)
2014 – Actual 94,503 Fixed assets/equipment $13.7
2015 – Forecasted 78,000 – 88,000 Delineation drilling $0.7
Mine development $12.5
COST/OUNCE (CAN$) Total Sustaining Capex $26.9
Cash cost $935 - $1,035
2015 Sustaining Capex $305 - $345 PROJECT & EXPLORATION COSTS (CAN$ M)
Reclam. & remed. – Quebec $10 - $15 Total exploration – Quebec $1.8
Corporate G&A $85 - $95 Exploration - Island Gold $5.2
AISC (1)/oz $1,335 - $1,490 Fixed assets/equipment $1.8
Acc. mine development - Island Gold(3) $17.4
Cash cost/oz (US$) (2) $850 - $940 Acc. delineation drilling - Island Gold $2.2
AISC/oz (US$) (2) $1,215 - $1,355 Mining & milling studies - Island Gold $1.0
Total Project & Exploration Costs $29.4
(1) AISC = All-In-Sustaining-Cost, a non GAAP measure. (2) Assuming exchange rate of CAN$1.00 = US$0.91 (US$1.00 = CAN$1.10). (3) Includes cost of the exploration drift and some exploration drilling.
Copyright 2014 by Richmont Mines
TSX - NYSE MKT: RIC
6 TSX - NYSE MKT: RIC 6
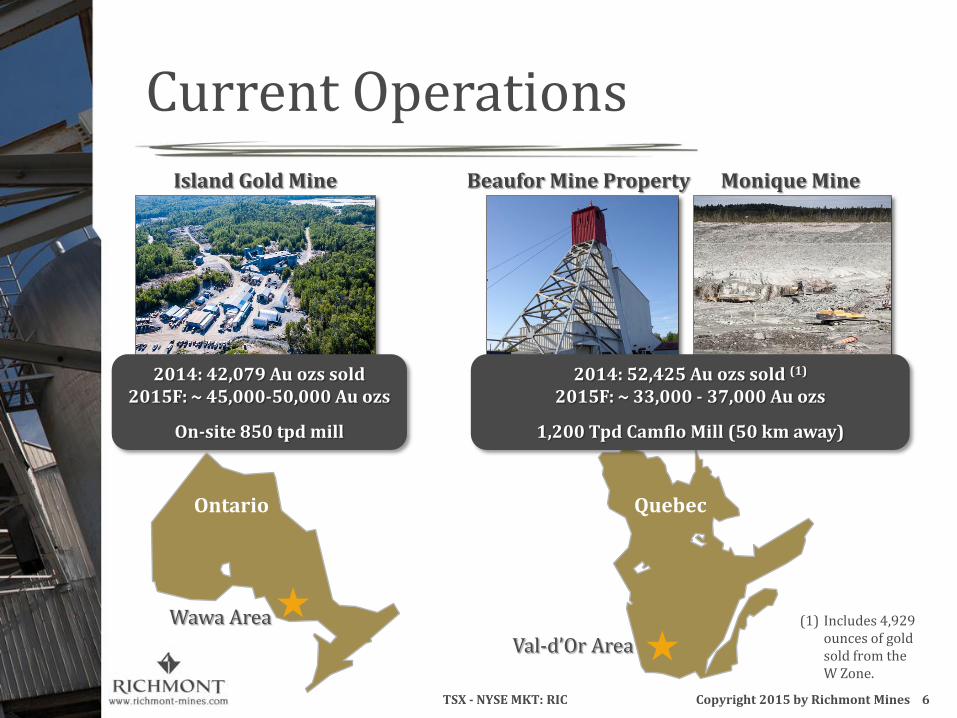
Current Operations
Island Gold Mine
2014: 42,079 Au ozs sold 2015F: ~ 45,000-50,000 Au ozs
On-site 850 tpd mill
Copyright 2015 by Richmont Mines
Wawa Area
Val-d’Or Area
Beaufor Mine Property Monique Mine
2014: 52,425 Au ozs sold (1)
2015F: ~ 33,000 - 37,000 Au ozs
1,200 Tpd Camflo Mill (50 km away)
Ontario Quebec
(1) Includes 4,929 ounces of gold sold from the W Zone.
Copyright 2014 by Richmont Mines
TSX - NYSE MKT: RIC
7
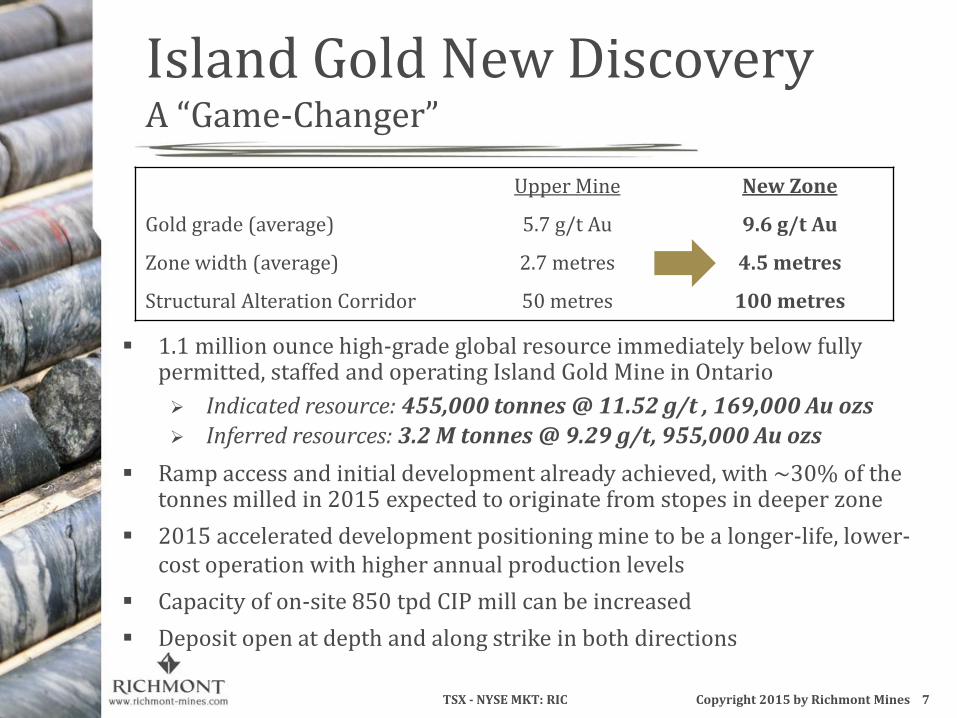
Island Gold New Discovery A “Game-Changer”
TSX - NYSE MKT: RIC 7 Copyright 2015 by Richmont Mines
Upper Mine New Zone
Gold grade (average) 5.7 g/t Au 9.6 g/t Au
Zone width (average) 2.7 metres 4.5 metres
Structural Alteration Corridor 50 metres 100 metres
1.1 million ounce high-grade global resource immediately below fully permitted, staffed and operating Island Gold Mine in Ontario
Indicated resource: 455,000 tonnes @ 11.52 g/t , 169,000 Au ozs Inferred resources: 3.2 M tonnes @ 9.29 g/t, 955,000 Au ozs
Ramp access and initial development already achieved, with ~30% of the tonnes milled in 2015 expected to originate from stopes in deeper zone
2015 accelerated development positioning mine to be a longer-life, lower-cost operation with higher annual production levels
Capacity of on-site 850 tpd CIP mill can be increased
Deposit open at depth and along strike in both directions

Copyright 2014 by Richmont Mines
TSX - NYSE MKT: RIC
8
320,000+ oz gold produced since 2007
2014 production: 42,079 Au ozs
2015F production: 45,000–50,000 Au ozs
Historical grade ~ 5.7 g/t Au
New deeper zone grade ~ 9.6 g/t Au
Cash Cost US$816/oz for 9 mos./14
Island Gold Mine Cornerstone Asset – 100% Owned
ISLAND GOLD MINE PERFORMANCE
FY 2009 12 months
ended Dec. 31
FY 2010 12 months
ended Dec. 31
FY 2011 12 months
ended Dec. 31
FY 2012 12 months
ended Dec. 31
FY 2013 12 months
ended Dec. 31
9 mos. 2014 9 months
ended June 30
Tonnes 211,773 251,237 261,731 246,743 244,631 184,827
Gold recovery (%) 94.5% 95.5% 95.9% 96.5% 96.1% 96.5%
Head grade 6.04 g/t 5.95 g/t 6.10 g/t 5.45 g/t 4.65 g/t 5.76 g/t
Gold ounces sold 38,879 45,865 49,196 41,686 35,113 33,027
Avg. cash cost/oz (US$)1
736 783 766 884 1,092 816
Avg. sales price/oz (US$) 967 1,238 1,566 1,666 1,392 1,289
TSX - NYSE MKT: RIC 8 Copyright 2015 by Richmont Mines
(1) Cash costs include royalties.

Copyright 2014 by Richmont Mines
TSX - NYSE MKT: RIC
9
2015 Island Gold Budget
Copyright 2015 by Richmont Mines
9 TSX - NYSE MKT: RIC
GOLD SOLD (OUNCES) SUSTAINING CAPITAL EXPENDITURES (CAN$M)
2014 – Actual 42,079 Fixed assets/equipment $10.7
2015 – Forecasted 45,000 – 50,000 Delineation drilling (11,125 m) $0.7
Mine Development $9.3
COST / OUNCE (CAN$) Total Sustaining Capex $20.7
Cash cost/oz $935 - $1,035 PROJECT & EXPLORATION COSTS (CAN$M)
2015 Sustaining Capex $415 - $460 Underground Exploration (41,000 m) $3.2
AISC(1)/oz $1,350 - $1,495 Surface Exploration (20,000 m) $2.0
Fixed assets/equipment $1.8
Cash cost/oz (US$) (2) $850 - $940 Accelerated Mine Development work(3) $17.4
AISC(1)/oz (US$) (2) $1, 230 - $1,360 Acc. Delineation Drilling (33,375 m) $2.2
Mining & Milling Studies $1.0
Total Project & Exploration Costs $27.6
(1) AISC = All-In-Sustaining-Cost, a non GAAP measure. (2) Assuming exchange rate of CAN$1.00 = US$0.91 (US$1.00 = CAN$1.10). (3) Includes cost of exploration drift on 620 m level of the mine, and some exploration drilling.
Copyright 2014 by Richmont Mines
TSX - NYSE MKT: RIC
10 TSX - NYSE MKT: RIC 10
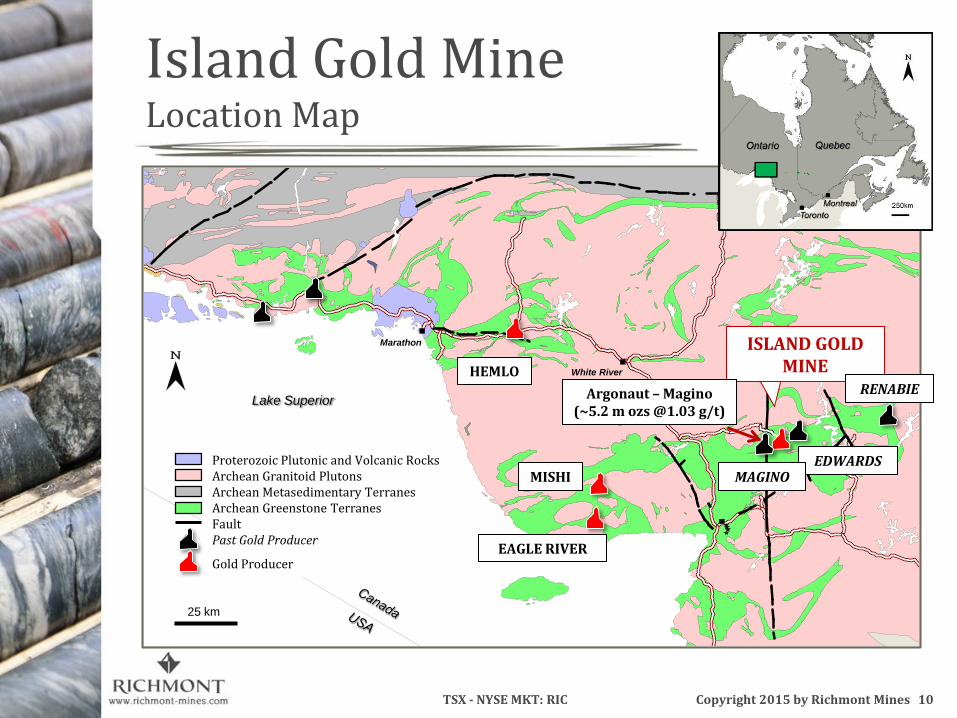
Island Gold Mine Location Map
Lake Superior
Marathon
White River
17
25 km
Proterozoic Plutonic and Volcanic Rocks Archean Granitoid Plutons Archean Metasedimentary Terranes Archean Greenstone Terranes Fault Past Gold Producer
Gold Producer
HEMLO
ISLAND GOLD MINE
RENABIE
EDWARDS
EAGLE RIVER
MISHI
Copyright 2015 by Richmont Mines
Argonaut – Magino (~5.2 m ozs @1.03 g/t)
MAGINO
Copyright 2014 by Richmont Mines
TSX - NYSE MKT: RIC
11
Stockpiles
Stora ge
Scrap
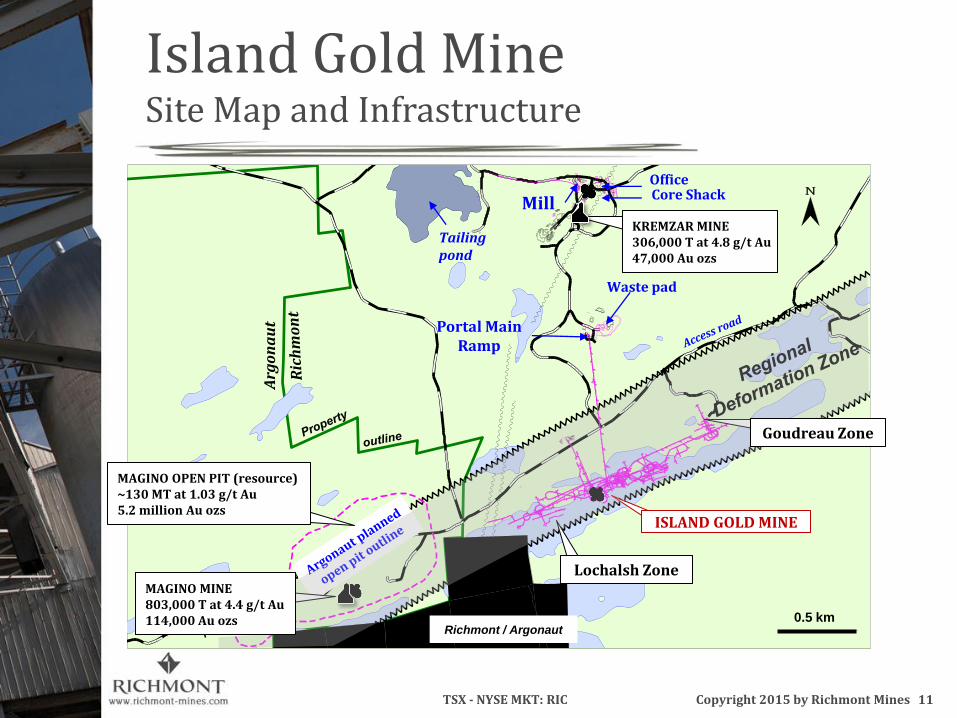
Island Gold Mine Site Map and Infrastructure
Tailing pond
Portal Main Ramp
Mill
ISLAND GOLD MINE
Lochalsh Zone
Office Core Shack
Waste pad A
rgo
na
ut
Richmont / Argonaut 0.5 km
KREMZAR MINE 306,000 T at 4.8 g/t Au 47,000 Au ozs
MAGINO OPEN PIT (resource) ~130 MT at 1.03 g/t Au 5.2 million Au ozs
TSX - NYSE MKT: RIC 11 Copyright 2015 by Richmont Mines
Goudreau Zone
MAGINO MINE 803,000 T at 4.4 g/t Au 114,000 Au ozs
Copyright 2014 by Richmont Mines
TSX - NYSE MKT: RIC
12
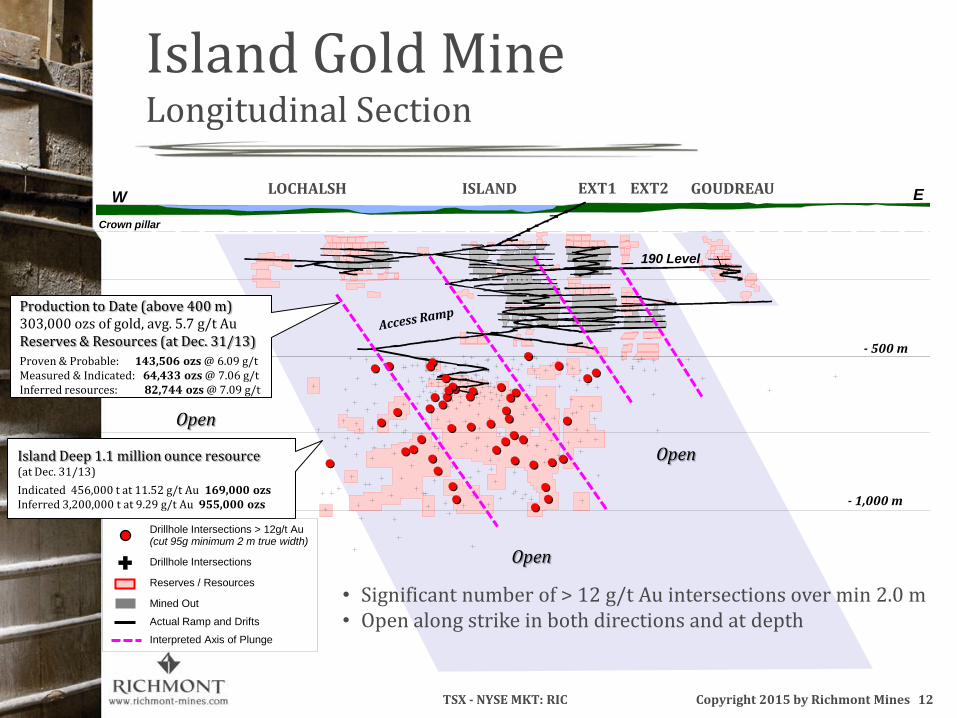
Island Gold Mine Longitudinal Section
190 Level
Crown pillar
W E
- 1,000 m
- 500 m
GOUDREAU LOCHALSH ISLAND EXT1 EXT2
Island Deep 1.1 million ounce resource (at Dec. 31/13)
Indicated 456,000 t at 11.52 g/t Au 169,000 ozs Inferred 3,200,000 t at 9.29 g/t Au 955,000 ozs
Open
Open
Production to Date (above 400 m)
303,000 ozs of gold, avg. 5.7 g/t Au Reserves & Resources (at Dec. 31/13)
Proven & Probable: 143,506 ozs @ 6.09 g/t Measured & Indicated: 64,433 ozs @ 7.06 g/t Inferred resources: 82,744 ozs @ 7.09 g/t
• Significant number of > 12 g/t Au intersections over min 2.0 m • Open along strike in both directions and at depth
Open
TSX - NYSE MKT: RIC 12 Copyright 2015 by Richmont Mines
Drillhole Intersections > 12g/t Au (cut 95g minimum 2 m true width)
Drillhole Intersections
Reserves / Resources
Mined Out
Actual Ramp and Drifts
Interpreted Axis of Plunge

Copyright 2014 by Richmont Mines
TSX - NYSE MKT: RIC
13 TSX - NYSE MKT: RIC 13 Copyright 2015 by Richmont Mines
Island Gold Mine Goals for 2015
Accelerate development & commence mining in new zone Extend main ramp to minimum 750 m depth Lengthen secondary ramp to a minimum 570 m depth Build out underground infrastructure Prepare stopes & commence mining
Upgrade inferred resources to reserves through infill drilling;
Expand resource and determine deposit size to optimize long-term mine plan through additional exploration drilling;
Continue to build up strong team at mine site to manage and deliver on development goals & production expansion;
Expand/upgrade equipment and infrastructure at mine site, as needed, to support expanded production.
Copyright 2014 by Richmont Mines
TSX - NYSE MKT: RIC
14 TSX - NYSE MKT: RIC 14
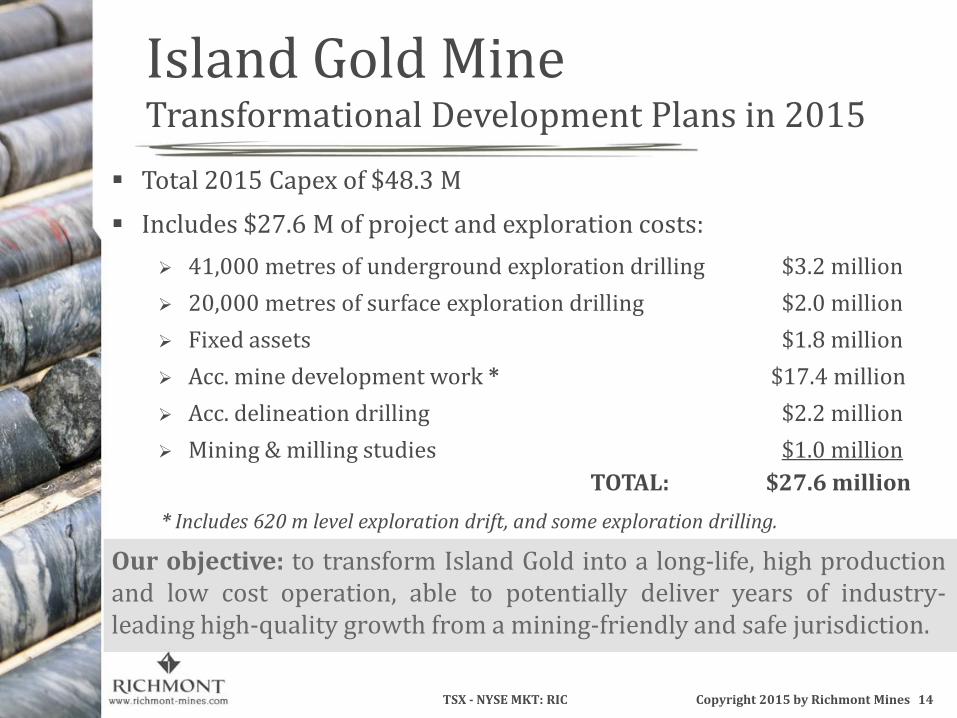
Total 2015 Capex of $48.3 M
Includes $27.6 M of project and exploration costs:
41,000 metres of underground exploration drilling $3.2 million
20,000 metres of surface exploration drilling $2.0 million
Fixed assets $1.8 million
Acc. mine development work * $17.4 million
Acc. delineation drilling $2.2 million
Mining & milling studies $1.0 million
TOTAL: $27.6 million
Our objective: to transform Island Gold into a long-life, high production and low cost operation, able to potentially deliver years of industry-leading high-quality growth from a mining-friendly and safe jurisdiction.
Copyright 2015 by Richmont Mines
Island Gold Mine Transformational Development Plans in 2015
* Includes 620 m level exploration drift, and some exploration drilling.
Copyright 2014 by Richmont Mines
TSX - NYSE MKT: RIC
15 TSX - NYSE MKT: RIC 15
Contractor hired in November 2014 to:
Extend ramp from current 650 m depth, to min. depth of 750 m in 2015
Advance secondary (east) ramp from 440 m to min. 570 m depth in 2015
Complete 600 m exploration drift to the east on 620 m level for definition, delineation & exploration drilling in the eastern portion of the resource
59,000 m definition/delineation drilling
To define and delineate resource between -500 m and -1,000 m
61,000 m of exploration drilling
41,000 m (underground drilling) to test eastern down-plunge between depths of 500 m and 1,000 m
20,000 m (surface drilling) to test areas closer to surface toward the western property boundary and to the east of the existing surface
Copyright 2015 by Richmont Mines
Island Gold Mine Focus on Accelerated Growth

Copyright 2014 by Richmont Mines
TSX - NYSE MKT: RIC
16
Island Gold Mine New Zone - Higher Grades and Widths
Crown pillar
W E
- 1,000 m
- 500 m
LOCHALSH ISLAND EXT1 EXT2
Cut off (3.75 g/t Au / 2.0 m) Interpreted Axis of Plunge
327
30
20
10
5
0
TSX - NYSE MKT: RIC 16 Copyright 2015 by Richmont Mines
Metal Factor Grade (g/t Au) x true width (metres)
Average mining grade (5.84 g/t Au / 2.4 m)
Strong positive reconciliation
in early sill sampling
1. 535 Level : 12.68 g/t Au / 2.51m along 120 m
2. 560 Level : 12.73 g/t Au / 2.92m along 92 m
3. 585 Level : 6.89 g/t Au / 2.91m along 125 m

Copyright 2014 by Richmont Mines
TSX - NYSE MKT: RIC
17
Island Gold Mine 2015 Mining Plan
190 Level
Crown pillar
W E
- 1,000 m
- 500 m
GOUDREAU LOCHALSH ISLAND EXT1 EXT2
TSX - NYSE MKT: RIC Copyright 2015 by Richmont Mines
Ramp (from 650 to 750m) 1,261 m
Ore Sill 1,495 m
620m Exploration Drift 450 m
West Dev. (-400 m) East Dev. (-400 m)
Mined out
Reserves – Resources 31/12/2013
Actual Ramp and Drifts
2015 Planned Ramp and Drift Development
Conceptual Development
2015 Planned Ore Development
2015 Stoping
Ramp (from 450 to 570m) 1,604 m
Ore Sill 1,472 m
17

Copyright 2014 by Richmont Mines
TSX - NYSE MKT: RIC
18
Island Gold Mine 2015 Planned Definition & Delineation Drilling
190 Level
Crown pillar
W E
- 1,000 m
- 500 m
GOUDREAU LOCHALSH ISLAND EXT1 EXT2
TSX - NYSE MKT: RIC Copyright 2015 by Richmont Mines
Delineation 44,500m
Definition 14,500m
2015 Planned drilling
2015 Planned Ramp and drifts Development
Conceptuel Development
2015 Planned Ore Development
2015 Stoping
Mined out
Reserves – Resources 31/12/2013
Actual Ramp and Drifts
18
Copyright 2014 by Richmont Mines
TSX - NYSE MKT: RIC
19
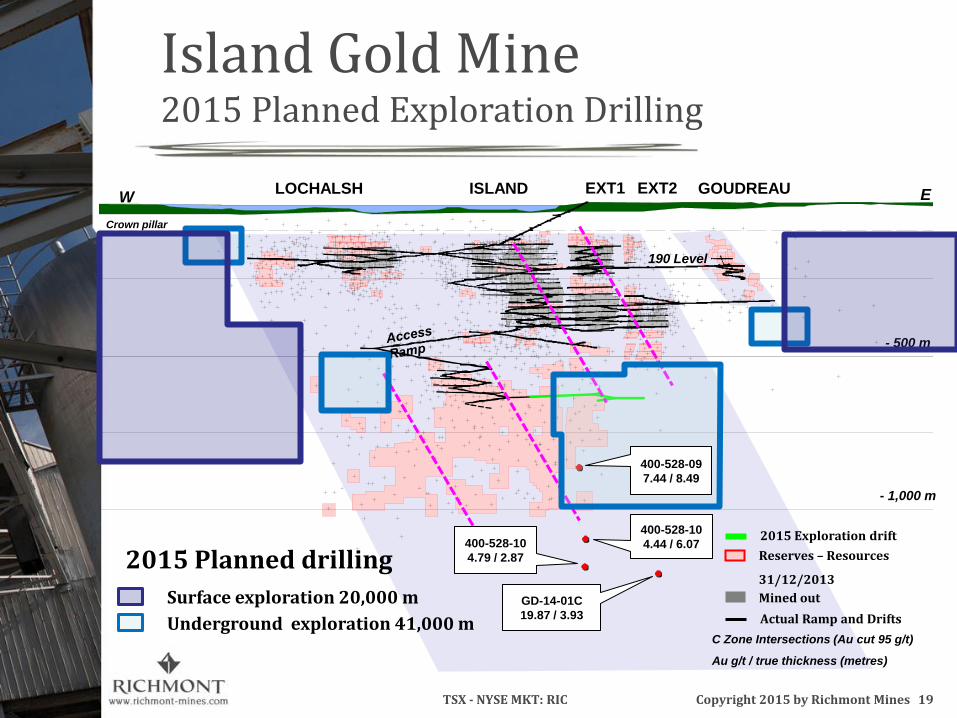
Island Gold Mine 2015 Planned Exploration Drilling
190 Level
Crown pillar
W E
- 1,000 m
- 500 m
GOUDREAU LOCHALSH ISLAND EXT1 EXT2
TSX - NYSE MKT: RIC Copyright 2015 by Richmont Mines
Underground exploration 41,000 m
Surface exploration 20,000 m
2015 Planned drilling
Mined out
Reserves – Resources
31/12/2013
Actual Ramp and Drifts
400-528-09
7.44 / 8.49
400-528-10
4.44 / 6.07 400-528-10
4.79 / 2.87
GD-14-01C
19.87 / 3.93
C Zone Intersections (Au cut 95 g/t)
Au g/t / true thickness (metres)
2015 Exploration drift
19

Copyright 2014 by Richmont Mines
TSX - NYSE MKT: RIC
20
Relative Grade Among Highest Grades in Peer Group
TSX - NYSE MKT: RIC 20 Copyright 2015 by Richmont Mines
(1) Source: Company reports
0 2 4 6 8 10 12 14 16 18 20
Holloway Mine (St. Andrew Goldfields)
Timmins West Mine (Lakeshore)
Bell Creek Mine (Lakeshore)
Casa Berardi (Hecla)
Seabee Gold (Claude)
Rice Lake Mine (San Gold)
Lapa (Agnico Eagle)
Island Gold (Richmont)
Beaufor Mine (Richmont)
Eagle River (Wesdome)
Island Deep (Richmont)*
Macassa (Kirkland Lake)
Reserve Grade1 (g/t gold)
* Indicated Resource

Copyright 2014 by Richmont Mines
TSX - NYSE MKT: RIC
21 TSX - NYSE MKT: RIC 21 Copyright 2015 by Richmont Mines
Island Gold Mine Developing for the Future
• Ramp access
• Initiated development
• New equipment purchased
• Efficiency consultant
• Lowered costs
• Increased production
2014
2015 Goals
• Extend main ramp to minimum 750 m depth
• Extend 2nd ramp to minimum 570 m depth
• Build out underground infrastructure
• Start mining in new zone
• Upgrade inferred resources (infill drilling)
• Increase resource base
L-T Objectives
• Increase R & R base
• Expand free cash flow visibility
• Create longer-life, multi-million ounce, higher production and lower cost gold mine within a mining friendly and safe jurisdiction.

Copyright 2014 by Richmont Mines
TSX - NYSE MKT: RIC
22 TSX - NYSE MKT: RIC 22 Copyright 2015 by Richmont Mines
Quebec Assets Beaufor Mine, Monique Mine & Camflo Mill
Camflo Mill
Quebec Assets: 2014 gold sales : 52,425 ounces 2015 forecasted gold sales: 33,000 – 37,000 ounces Operations strategically located near infrastructure
50 km from Camflo Mill & 25 km from Val-d’Or, QC Objective: maintain free cash flow positive status
Beaufor Mine: High-grade underground mine in production since 1996 (500,000+ Au ozs produced) First 9 months of 2014: cash cost/oz US$868
Monique Mine: Small open-pit with a planned short mine life Mining will end Feb/15, stockpile will be milled
through 2015 First 9 months of 2014: cash cost/oz US$953
Copyright 2014 by Richmont Mines
TSX - NYSE MKT: RIC
23
2015 Quebec Budget
Copyright 2015 by Richmont Mines
23 TSX - NYSE MKT: RIC
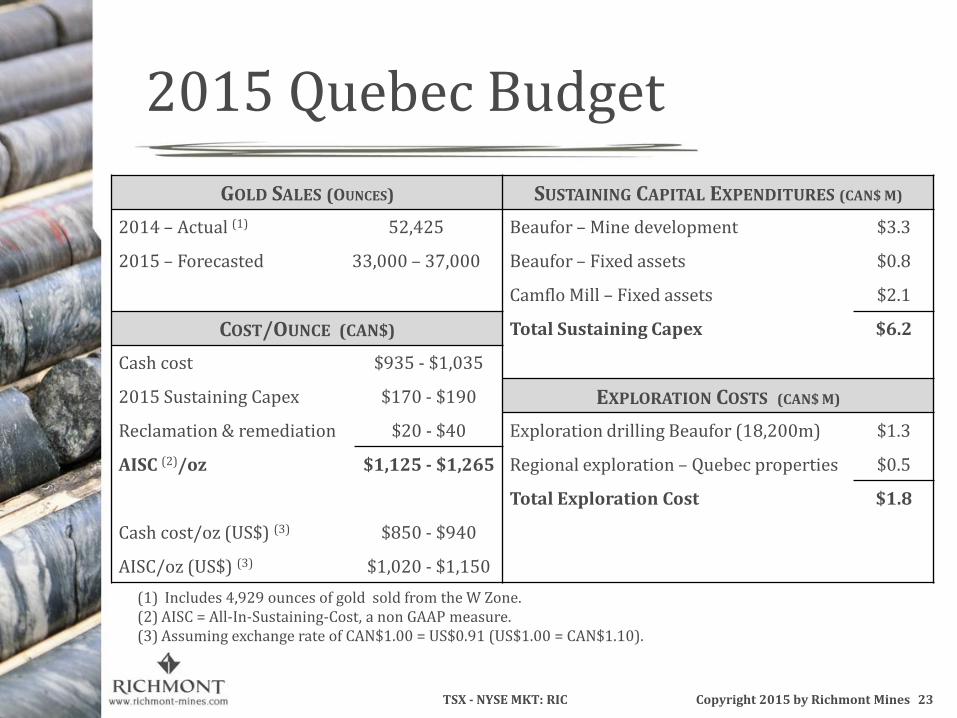
GOLD SALES (OUNCES) SUSTAINING CAPITAL EXPENDITURES (CAN$ M)
2014 – Actual (1) 52,425 Beaufor – Mine development $3.3
2015 – Forecasted 33,000 – 37,000 Beaufor – Fixed assets $0.8
Camflo Mill – Fixed assets $2.1
COST/OUNCE (CAN$) Total Sustaining Capex $6.2
Cash cost $935 - $1,035
2015 Sustaining Capex $170 - $190 EXPLORATION COSTS (CAN$ M)
Reclamation & remediation $20 - $40 Exploration drilling Beaufor (18,200m) $1.3
AISC (2)/oz $1,125 - $1,265 Regional exploration – Quebec properties $0.5
Total Exploration Cost $1.8
Cash cost/oz (US$) (3) $850 - $940
AISC/oz (US$) (3) $1,020 - $1,150
(1) Includes 4,929 ounces of gold sold from the W Zone. (2) AISC = All-In-Sustaining-Cost, a non GAAP measure. (3) Assuming exchange rate of CAN$1.00 = US$0.91 (US$1.00 = CAN$1.10).
Copyright 2014 by Richmont Mines
TSX - NYSE MKT: RIC
24
Beaufor Mine Progress Report
49,196 oz
49,196 oz 41,686 oz
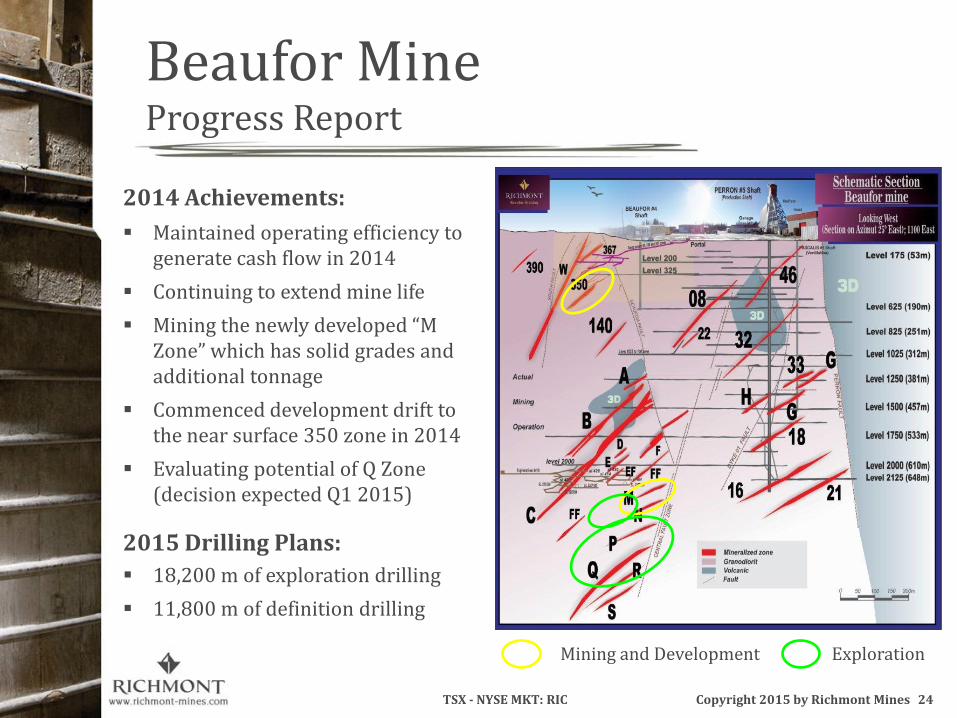
2014 Achievements:
Maintained operating efficiency to generate cash flow in 2014
Continuing to extend mine life
Mining the newly developed “M Zone” which has solid grades and additional tonnage
Commenced development drift to the near surface 350 zone in 2014
Evaluating potential of Q Zone (decision expected Q1 2015)
2015 Drilling Plans:
18,200 m of exploration drilling
11,800 m of definition drilling
TSX - NYSE MKT: RIC 24 Copyright 2015 by Richmont Mines
Mining and Development Exploration

Copyright 2014 by Richmont Mines
TSX - NYSE MKT: RIC
25
800
600
400
800
1000
200
600
1175
1350
400
RIC
HM
ON
T
Glo
be
x
Horne-Creek fault
Resources as of December 31, 2012 Cut-off: 1.5 g/t Au
Measured & Indicated Resources: 15,251,529 T at 2.86 g/t Au ; 1,402,263 ozs
Inferred Resources: 18,758,786 T at 2.66 g/t Au ; 1,605,388 ozs
Wasamac Gold Property “Untapped” 3 Million oz Resource
Near infrastructure: 15 km west of Rouyn-Noranda, Quebec
Past production of 252,923 Au ozs @ 4.16 g/t (1965-1971)
Preliminary Economic Assessment completed in March 2012
Good optionality on gold price
100% owned, no royalties
TSX - NYSE MKT: RIC 25 Copyright 2015 by Richmont Mines
Copyright 2014 by Richmont Mines
TSX - NYSE MKT: RIC
26 TSX - NYSE MKT: RIC 26
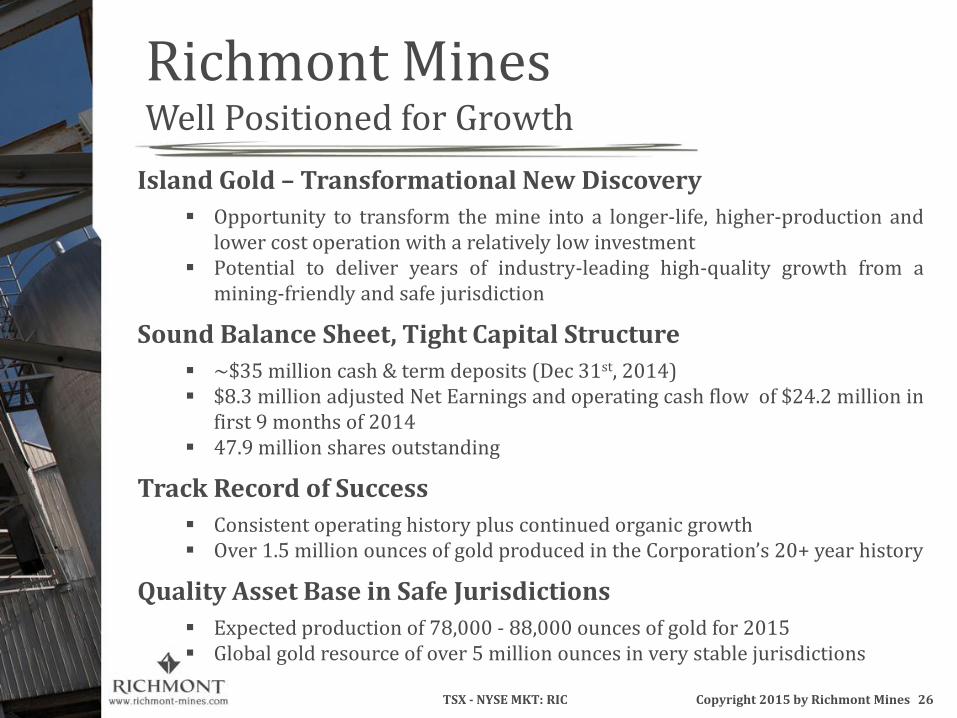
Island Gold – Transformational New Discovery
Opportunity to transform the mine into a longer-life, higher-production and lower cost operation with a relatively low investment
Potential to deliver years of industry-leading high-quality growth from a mining-friendly and safe jurisdiction
Sound Balance Sheet, Tight Capital Structure
~$35 million cash & term deposits (Dec 31st, 2014) $8.3 million adjusted Net Earnings and operating cash flow of $24.2 million in
first 9 months of 2014 47.9 million shares outstanding
Track Record of Success
Consistent operating history plus continued organic growth Over 1.5 million ounces of gold produced in the Corporation’s 20+ year history
Quality Asset Base in Safe Jurisdictions
Expected production of 78,000 - 88,000 ounces of gold for 2015 Global gold resource of over 5 million ounces in very stable jurisdictions
Richmont Mines Well Positioned for Growth
Copyright 2015 by Richmont Mines

Copyright 2014 by Richmont Mines
TSX - NYSE MKT: RIC
27 TSX - NYSE MKT: RIC 27
Renaud Adams, Eng. President & CEO [email protected] 514-397-1410 x 103 Jennifer Aitken, MBA Manager, Investor Relations [email protected] 514-397-1410 x101
Copyright 2015 by Richmont Mines
Richmont Mines Inc.
Copyright 2014 by Richmont Mines
TSX - NYSE MKT: RIC
28 TSX - NYSE MKT: RIC 28
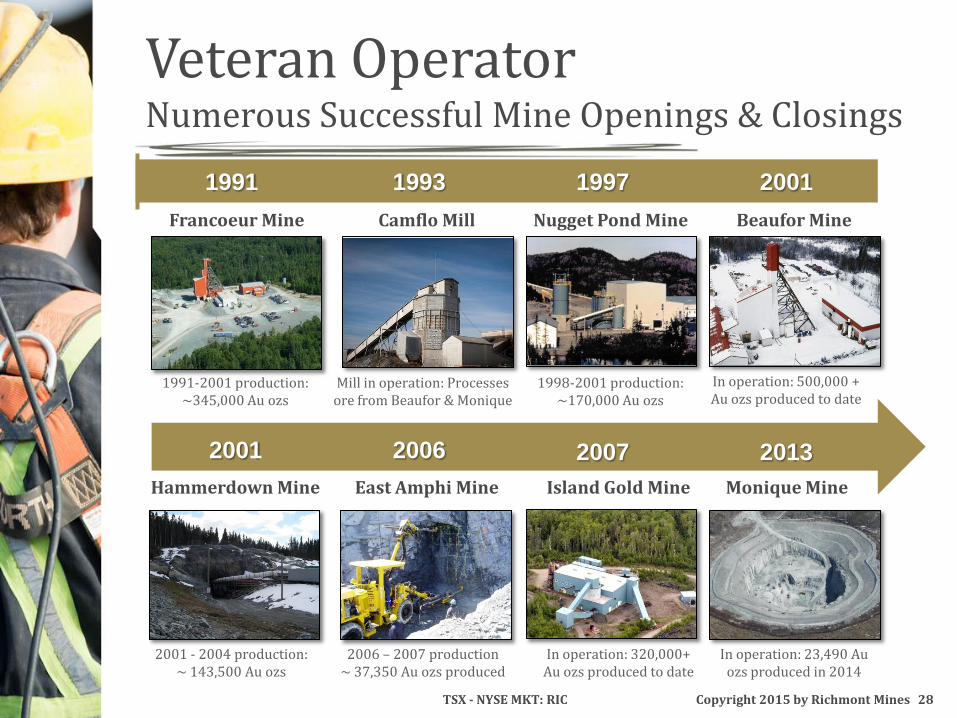
Veteran Operator Numerous Successful Mine Openings & Closings
Copyright 2015 by Richmont Mines
1991 1993 1997 2001
2007 2013
Island Gold Mine
Francoeur Mine
Monique Mine
2001
Camflo Mill Beaufor Mine Nugget Pond Mine
2006
East Amphi Mine Hammerdown Mine
2006 – 2007 production ~ 37,350 Au ozs produced
2001 - 2004 production: ~ 143,500 Au ozs
In operation: 320,000+ Au ozs produced to date
In operation: 23,490 Au ozs produced in 2014
In operation: 500,000 + Au ozs produced to date
Mill in operation: Processes ore from Beaufor & Monique
1991-2001 production: ~345,000 Au ozs
1998-2001 production: ~170,000 Au ozs

Copyright 2014 by Richmont Mines
TSX - NYSE MKT: RIC
29
BOARD OF DIRECTORS
Greg Chamandy, Exec Chairman Co-Founder and Former CEO of Gildan Activewear
Elaine Ellingham, P. Geo., MBA Previously TSX, IAMGOLD, Campbell Resources, Rio Algom,
René Marion, Eng. Former CEO AuRico Gold
Michael Pesner, CA President of Hermitage Canada Finance, previously KPMG
Renaud Adams, Eng. President & CEO
Directors and Management Senior Credentials in a Junior
TSX - NYSE MKT: RIC 29 Copyright 2015 by Richmont Mines
MANAGEMENT TEAM
Renaud Adams, Eng. President & CEO
Rosaire Émond, Eng. V. P. and COO - Experience: Placer Dome and Agnico-Eagle
Daniel Adam, Geo., PhD V. P. Exploration - Experience: Selbaie Mines
Nicole Veilleux, CPA, CA V.P. Finance - Experience: Auditor at KPMG LLP, Norbord Industries
Jean Bastien, Eng., MBA Manager, Island Gold Mine - Experience: Cambior, Agnico-Eagle, Aurizon
Marc-André Lavergne, Eng. Manager, Beaufor & Monique mines - Experience: Cambior, Agnico-
Eagle, North American Palladium

Copyright 2014 by Richmont Mines
TSX - NYSE MKT: RIC
30 TSX - NYSE MKT: RIC 30 Copyright 2015 by Richmont Mines
0
1,000,000
2,000,000
3,000,000
4,000,000
5,000,000
6,000,000
2006 2007 2008 2009 2010 2011 2012 2013
Ou
nce
s o
f G
old
Proven and Probable Au Ounces
Measured + Indicated Au Ounces
Inferred Au Ounces
Discovered over 4 million ounces of gold resources in past 4 years
Exploration on brownfield project and at operating mines
Discovery cost < $15/ounce Island Gold Deep Zone 1.1 million oz @ 9.6 g/t Wasamac 3.0 million oz @ 2.70 g/t
Additions to Board & Management
Creating Shareholder Value Two Significant Discoveries
Copyright 2014 by Richmont Mines
TSX - NYSE MKT: RIC
31
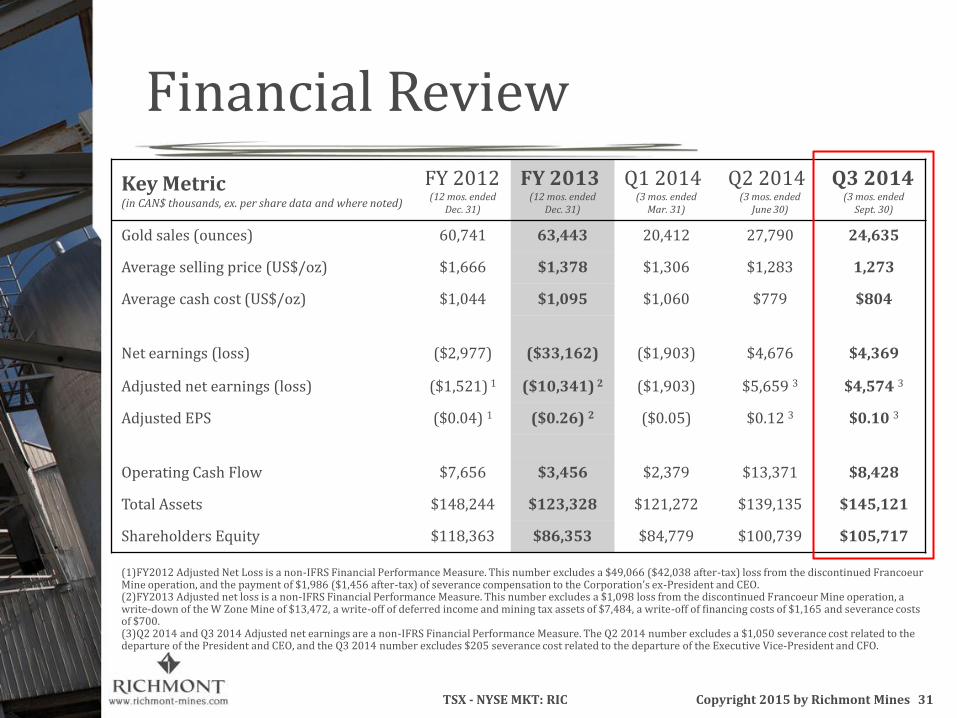
Financial Review
Key Metric (in CAN$ thousands, ex. per share data and where noted)
FY 2012 (12 mos. ended
Dec. 31)
FY 2013 (12 mos. ended
Dec. 31)
Q1 2014 (3 mos. ended
Mar. 31)
Q2 2014 (3 mos. ended
June 30)
Q3 2014 (3 mos. ended
Sept. 30)
Gold sales (ounces) 60,741 63,443 20,412 27,790 24,635
Average selling price (US$/oz) $1,666 $1,378 $1,306 $1,283 1,273
Average cash cost (US$/oz) $1,044 $1,095 $1,060 $779 $804
Net earnings (loss) ($2,977) ($33,162) ($1,903) $4,676 $4,369
Adjusted net earnings (loss) ($1,521) 1 ($10,341) 2 ($1,903) $5,659 3 $4,574 3
Adjusted EPS ($0.04) 1 ($0.26) 2 ($0.05) $0.12 3 $0.10 3
Operating Cash Flow $7,656 $3,456 $2,379 $13,371 $8,428
Total Assets $148,244 $123,328 $121,272 $139,135 $145,121
Shareholders Equity $118,363 $86,353 $84,779 $100,739 $105,717
(1)FY2012 Adjusted Net Loss is a non-IFRS Financial Performance Measure. This number excludes a $49,066 ($42,038 after-tax) loss from the discontinued Francoeur Mine operation, and the payment of $1,986 ($1,456 after-tax) of severance compensation to the Corporation’s ex-President and CEO. (2)FY2013 Adjusted net loss is a non-IFRS Financial Performance Measure. This number excludes a $1,098 loss from the discontinued Francoeur Mine operation, a write-down of the W Zone Mine of $13,472, a write-off of deferred income and mining tax assets of $7,484, a write-off of financing costs of $1,165 and severance costs of $700. (3)Q2 2014 and Q3 2014 Adjusted net earnings are a non-IFRS Financial Performance Measure. The Q2 2014 number excludes a $1,050 severance cost related to the departure of the President and CEO, and the Q3 2014 number excludes $205 severance cost related to the departure of the Executive Vice-President and CFO.
TSX - NYSE MKT: RIC 31 Copyright 2015 by Richmont Mines
Copyright 2014 by Richmont Mines
TSX - NYSE MKT: RIC
32 TSX - NYSE MKT: RIC 32
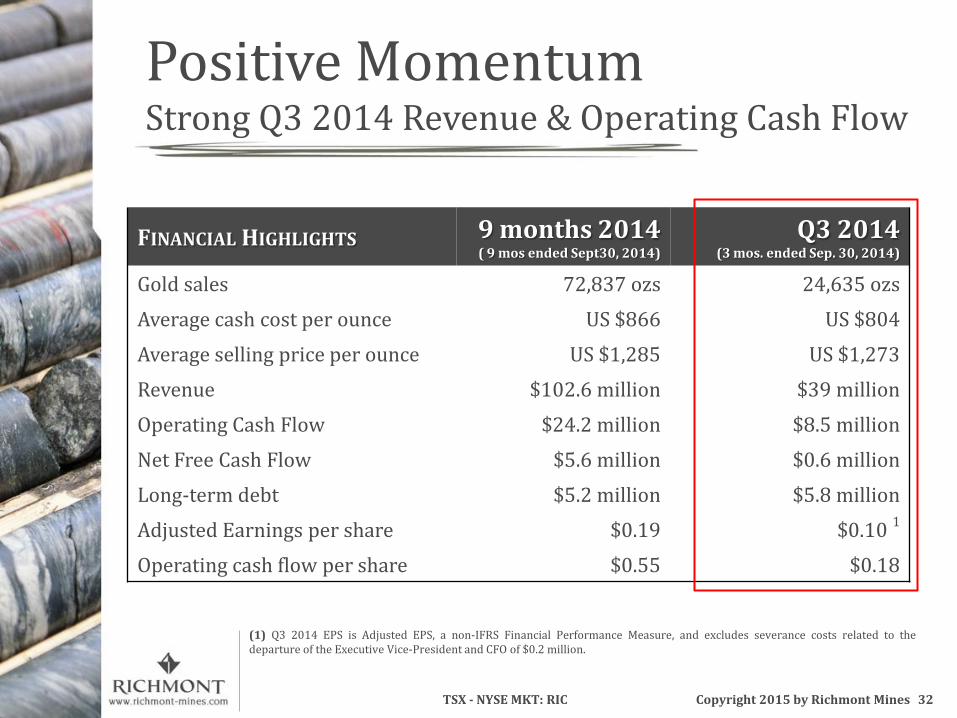
FINANCIAL HIGHLIGHTS 9 months 2014 ( 9 mos ended Sept30, 2014)
Q3 2014 (3 mos. ended Sep. 30, 2014)
Gold sales 72,837 ozs 24,635 ozs
Average cash cost per ounce US $866 US $804
Average selling price per ounce US $1,285 US $1,273
Revenue $102.6 million $39 million
Operating Cash Flow $24.2 million $8.5 million
Net Free Cash Flow $5.6 million $0.6 million
Long-term debt $5.2 million $5.8 million
Adjusted Earnings per share
$0.19 $0.10
1
Operating cash flow per share
$0.55 $0.18
(1) Q3 2014 EPS is Adjusted EPS, a non-IFRS Financial Performance Measure, and excludes severance costs related to the departure of the Executive Vice-President and CFO of $0.2 million.
Copyright 2015 by Richmont Mines
Positive Momentum Strong Q3 2014 Revenue & Operating Cash Flow

Copyright 2014 by Richmont Mines
TSX - NYSE MKT: RIC
33
49,196 oz
(1) Resources are exclusive of Reserves, and do not have demonstrated economic viability at this time. (2) Established on Dec. 31/13, using a gold price of US$1,225/oz and an exchange rate of CAN$1.06=US$1.00 in 2013 (a US$1,450/oz gold price and a 1.00 exchange rate were used in 2012). Island Gold Deep Resources established Jan. 21/14. (3) Open-pit Reserves are based on a pit design established in 2012. Indicated Resources are underground, directly beneath the open-pit. (4) Underground Resources established as of Dec. 31/12. (5) Francoeur Mine closed in November 2012.
RESERVES + RESOURCES1
AS OF DEC. 31, 2013 AS OF DEC. 31, 2012
Tonnes (metric)
Grade (g/t Au)
Au oz contained
Tonnes (metric)
Grade (g/t Au)
Au oz contained
Island Gold Mine2
P & P Reserves 733,347 6.09 143,506 785,221 5.60 141,456
M & I Resources 283,687 7.06 64,433 502,910 6.86 110,958
Inferred Resources 362,858 7.09 82,744 279,569 6.20 55,744
Island Deep2 Indicated Resources 456,013 11.52 168,897 - - -
Inferred Resources 3,196,114 9.29 954,583 1,473,658 10.73 508,142
Beaufor Mine2
P & P Reserves 142,299 6.81 31,133 196,145 6.20 39,114
M & I Resources 765,144 6.32 155,439 774,280 6.44 160,263
Inferred Resources 904,249 6.49 188,679 901,568 6.46 187,274
Monique2,3
P & P Reserves 415,860 2.30 30,702 - - -
Indicated Resources 107,531 4.88 16,858 728,164 2.35 55,112
Inferred Resources - - 11,605 0.97 362
W Zone
P & P Reserves 70,207 5.68 12,832 132,251 7.21 30,680
M & I Resources 145,931 7.04 33,051 107,511 6.76 23,377
Inferred Resources 2,186 7.55 531 5,589 7.95 1,429
Francoeur5
Proven Reserves - - - 8,439 4.52 1,226
M & I Resources 320,066 6.47 66,587 320,066 6.47 66,587
Inferred Resources 17,949 7.17 4,135 17,949 7.17 4,135
Wasamac4 M & I Resources 15,251,529 2.86 1,402,263 15,251,529 2.86 1,402,263
Inferred Resources 18,758,786 2.66 1,605,388 18,758,786 2.66 1,605,388
TOTAL GOLD
P & P Reserves 1,361,713 4.98 218,172 1,122,056 5.89 212,476
M & I Resources 17,329,901 3.42 1,907,528 17,684,460 3.20 1,818,560
Inferred Resources 23,242,142 3.80 2,836,060 21,448,724 3.43 2,362,474
33
Copyright 2014 by Richmont Mines
TSX - NYSE MKT: RIC
34
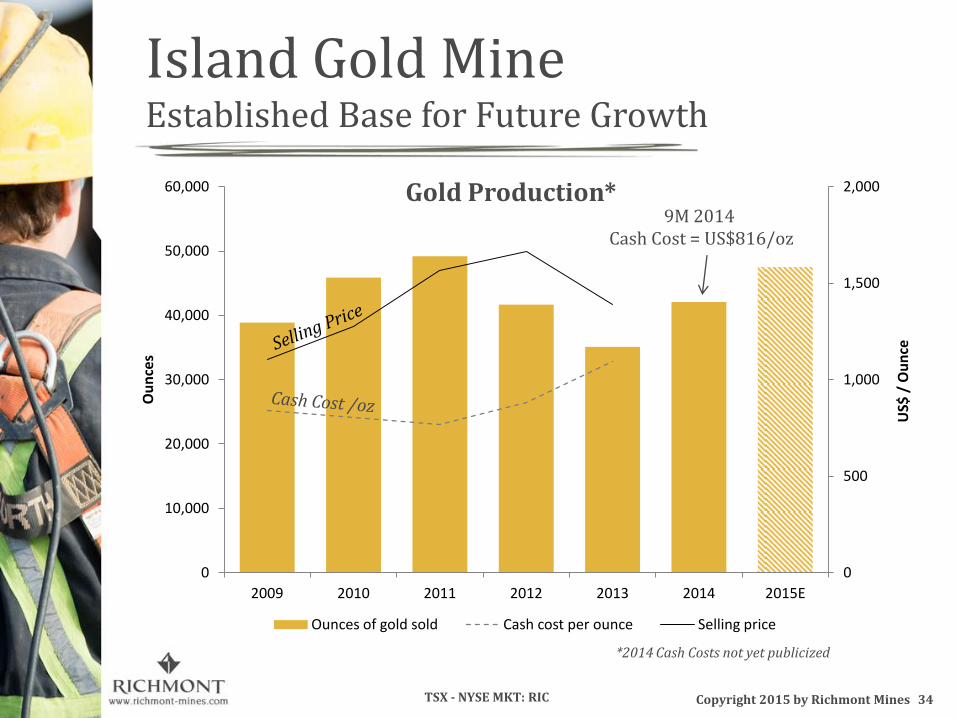
Island Gold Mine Established Base for Future Growth
TSX - NYSE MKT: RIC
49,196 oz
Gold Production*
0
500
1,000
1,500
2,000
0
10,000
20,000
30,000
40,000
50,000
60,000
2009 2010 2011 2012 2013 2014 2015E
US$
/ O
un
ce
Ou
nce
s
Ounces of gold sold Cash cost per ounce Selling price
Copyright 2015 by Richmont Mines
34
*2014 Cash Costs not yet publicized
9M 2014 Cash Cost = US$816/oz
Copyright 2014 by Richmont Mines
TSX - NYSE MKT: RIC
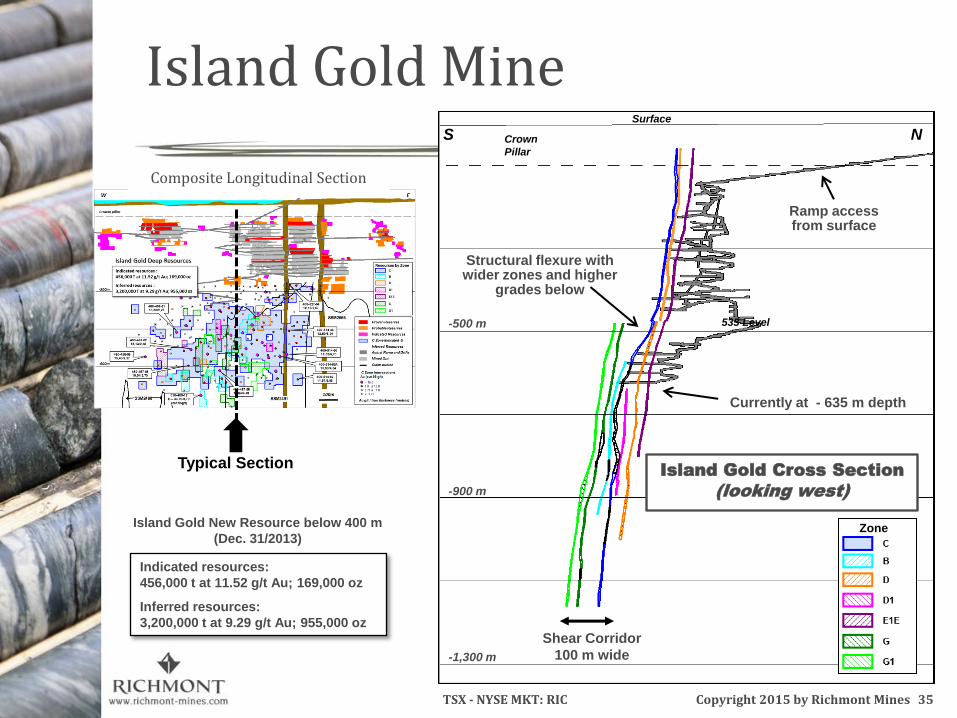
35 TSX - NYSE MKT: RIC Copyright 2015 by Richmont Mines
S N Crown
Pillar
-900 m
Shear Corridor
100 m wide
535 Level
Zone
Composite Longitudinal Section
Typical Section
-1,300 m
-500 m
Surface
Indicated resources:
456,000 t at 11.52 g/t Au; 169,000 oz
Inferred resources:
3,200,000 t at 9.29 g/t Au; 955,000 oz
Island Gold New Resource below 400 m
(Dec. 31/2013)
Island Gold Cross Section
(looking west)
Currently at - 635 m depth
35
Ramp access from surface
Island Gold Mine
Structural flexure with wider zones and higher
grades below
Related Documents