Welcome message from author
This document is posted to help you gain knowledge. Please leave a comment to let me know what you think about it! Share it to your friends and learn new things together.
Transcript


January 2013
authors
Steven Summerfelt1*Thomas Waldrop1
Christopher Good1
John Davidson1
Philip Backover1
Brian Vinci1
and Jonathan Carr2
1The Conservation Fund’s Freshwater Institute Shepherdstown, West Virginia, USA2The Atlantic Salmon Federation, St. Andrews, NB, Canada
*Corresponding author: [email protected]
Graphic Design by Flyeye Design, Photography by Kata Rishel

Letter from the DirectorMeeting challenge and adapting to change is the order of our time. We are awash daily in media stories about energy, climate, natural resource conflicts and global economic malaise. We are also living through an extraordinary period of technological innovation and social evolution. In such a dynamic environment, organizations like The Conservation Fund and our partner, the Atlantic Salmon Federation, thrive because we share values and passions and we understand that complicated problems require creative solutions. Both organizations have a long history of conservation commitment, together protecting wild salmon and salmon habitat from Bristol Bay, Alaska to the Salmon River in northern California, and working in partnership in the east from the wild rivers of Labrador to the mill-dams and federal hatchery programs on the Penobscot River in Maine. Both organizations have a deep commitment to the culture and the economy of the communities where we work. And both organizations believe in the power of science to inform and guide decisions. In that spirit, we provide this report as a first installment on a new approach to producing farmed salmon. We believe there is a better way, a more sustainable way, to meet the growing demand for seafood and still protect wild salmon resources. We hope this report starts new conversations and we look forward to hearing your thoughts.
Sincerely,
Joe HankinsVice President, The Conservation FundDirector, Freshwater Institute

Photo from iStockphoto.com
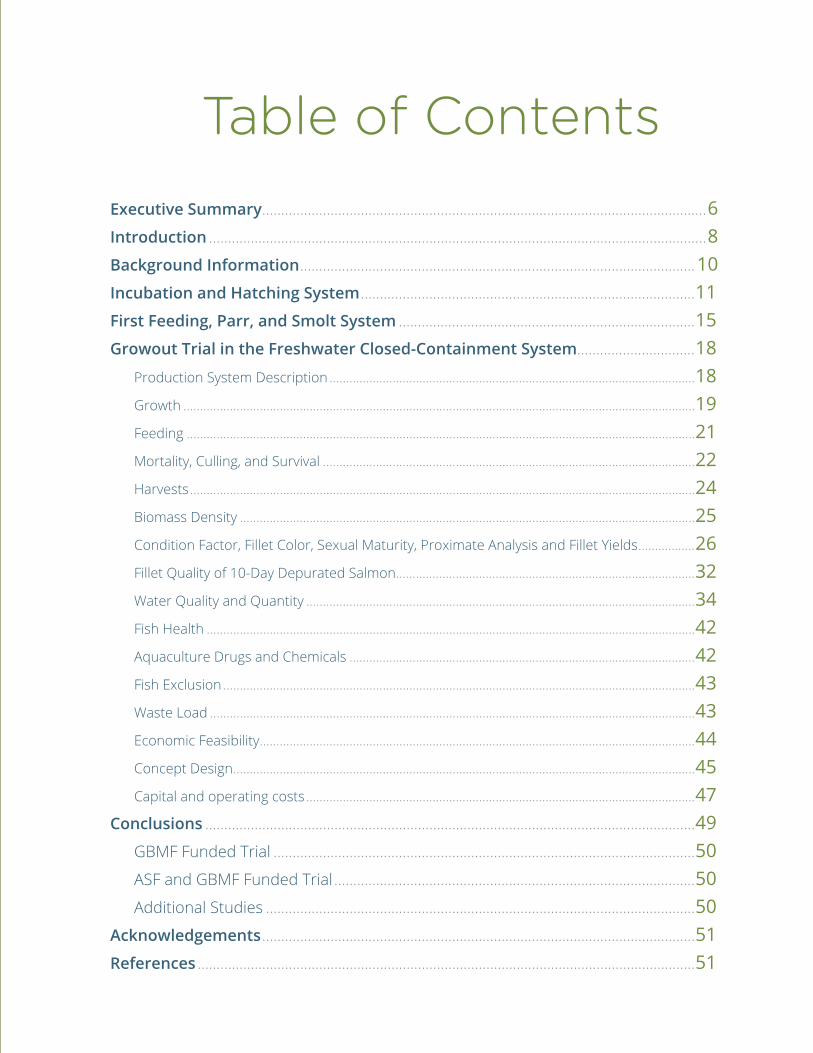
Table of ContentsExecutive Summary .....................................................................................................................6Introduction ...................................................................................................................................8Background Information ........................................................................................................10Incubation and Hatching System ........................................................................................11First Feeding, Parr, and Smolt System ..............................................................................15Growout Trial in the Freshwater Closed-Containment System...............................18
Production System Description ..............................................................................................................18Growth ..........................................................................................................................................................19Feeding .........................................................................................................................................................21Mortality, Culling, and Survival ................................................................................................................22Harvests ........................................................................................................................................................24Biomass Density .........................................................................................................................................25Condition Factor, Fillet Color, Sexual Maturity, Proximate Analysis and Fillet Yields .................26Fillet Quality of 10-Day Depurated Salmon ..........................................................................................32Water Quality and Quantity .....................................................................................................................34Fish Health ...................................................................................................................................................42Aquaculture Drugs and Chemicals ........................................................................................................42Fish Exclusion ..............................................................................................................................................43Waste Load ..................................................................................................................................................43Economic Feasibility ...................................................................................................................................44Concept Design ...........................................................................................................................................45Capital and operating costs .....................................................................................................................47
Conclusions .................................................................................................................................49GBMF Funded Trial ...............................................................................................................50ASF and GBMF Funded Trial ...............................................................................................50Additional Studies .................................................................................................................50
Acknowledgements ..................................................................................................................51References ...................................................................................................................................51

6
Executive SummaryThis growout trial employed a pre-existing salmonid closed-containment facility and technical expertise at The Conservation Fund’s Freshwater Institute (TCFFI) in Shepherdstown, WV. The project demonstrated as proof of concept that Atlantic salmon can be reared from post-smolt (~340 g) to harvest size (4-4.6 kg) within approximately 12 months in a land-based, freshwater, closed-containment system.
This project determined the following key parameters for Atlantic salmon grown to harvest size in our growout system:
• Growout cycle from post-smolt to 4.6 kg was just over 12 months.
• Total loss to mortality (3.9%), culls (5.6%), and jumpers (1.9%) accounted for 11.4% of the population.
• Fish densities were modest and only reached 35 kg/m3 just before harvest events were initiated.
• Feed conversion averaged 1.09 over the entire study.
• Male salmon grilse made up approximately 37% of the population, and were harvested early and sent to processing for hot smoking.
• No obligate pathogens, sea lice, or Kudoa were detected in the fish or the system.
• No fish were vaccinated.
• No antibiotic, pesticide, or harsh organic chemotherapeutants were used.
• No salmon escaped from the production facility.
• Biosolids backwashed from the system’s drum filter and settler were dewatered on site using gravity thickening settlers to produce a slurry of approximately 9% dry weight. Biosolids capture efficiency averaged ~92%; captured biosolids were land-applied by a contract hauler.
• The technical and economic feasibility of a commercial-scale, land-based closed containment farm for Atlantic salmon was evaluated through a concept-level design and associated costing for a 3,300 metric tonne (mt) facility. The capital cost developed for the 3,300 mt facility was $31 million (this is dependent upon many variables such as feed, electricity, processing, etc. where costs will vary per region).
• The operating cost developed was similar to that published for the net pen industry at approximately $3.90–$4.00 per kg of head-on gutted salmon.
This production trial provided the Atlantic Salmon Federation, other ENGO’s, salmon farming companies, aquacultural engineering and supply companies, and government agencies (such as Canada’s Department of Fisheries and Oceans) with actual performance data and key production costs during a salmon production trial within a commercial-scale, freshwater, closed-containment system. For example, on March 8, 2012, a Canadian Government Parliamentary Committee studying land-based closed-containment systems for salmon farming visited TCFFI to learn more about the technology.
These results will provide vital information to the North American salmon farming industry, government officials, funders, and

7
conservation advocates, in order to inform decision-making regarding land-based, freshwater, closed-containment systems for Atlantic salmon growout. In addition, this growout trial provided stakeholders with one of the first cohorts (approximately 7 mt) of Atlantic salmon raised in land-based, closed-containment systems for test marketing opportunities.
Results of this growout trial suggest that full-scale closed-containment systems have the potential to meet all five tests of sustainability put forth by the Conservation Council of New Brunswick:
• It does not degrade the environment on which it is dependent.
• It is in harmony with other economic, cultural, and social activities that use the same natural resources.
• It does not diminish the ability of future generations to use the same resources.
• It invests in local communities, and decision-making is local.
• It produces a reasonable and relatively stable net income to both producers and society by using natural resources on a long-term, renewable basis.
The successful adoption of land-based, freshwater, closed-containment systems for Atlantic salmon growout could ultimately enable the salmon farming industry to expand production to inland areas, where fish escapes and disease and/or genetic interactions between farmed and wild fish stocks would be avoided.

8
IntroductionThe Conservation Fund’s Freshwater Institute (TCFFI) has been funded by the U.S. Department of Agriculture for over two decades to develop economically viable technologies to produce healthy fish within environmentally friendly production systems. These production systems are termed “land-based closed-containment systems” because they successfully isolate the water and fish from the surrounding environment, as opposed to open systems such as coastal net-pens. This research has placed TCFFI at the forefront of water recirculation aquaculture system technology innovation, where water from rearing units is recycled through filters to be cleaned, resupplied with oxygen, and recirculated back into the culture tanks. These technologies allow fish to be grown in optimal water quality and under ideal conditions, completely separate from the marine environment and wild fish, while the majority of the wastes and nutrients are captured and reclaimed. Because they can recirculate nearly all of the water required for fish culture, land-based closed-containment systems have only minimal direct hydraulic connection with the environment. Thus, land-based closed-containment systems allow for much greater control of the rearing environment than flow-through, pond, net-pen, or floating tank systems. In fact, multiple and redundant barriers can be readily installed to prevent fish escapement from the relatively small water flows discharged from land-based closed-containment systems.
The Atlantic Salmon Federation (ASF) and TCFFI believe that land-based closed-containment systems are a cost-effective and environmentally friendly farming method, with the potential to eliminate the use of vaccines, antibiotics, pesticides, and other
harsh chemicals in salmon farming. Our goal with this technology is to provide fish farmers and entrepreneurs an opportunity to choose an innovative, alternative method to grow fish — a method which we believe is not only good for the environment, but for business as well. We hope that the myriad benefits of closed containment, water recirculation technologies will speak for themselves, and that industry will embrace these innovations following successful, commercial-scale demonstration of their feasibility.
This report summarizes the results of a commercial-scale Atlantic salmon growout trial in a freshwater closed-containment system at The Conservation Fund’s Freshwater Institute, with grant support provided by the Atlantic Salmon Federation (St. Andrews, New Brunswick, Canada). This initiative provided important, novel data on growth rate, survival, fish densities, feed conversion, primary variable costs, waste loads, fish health, pesticide/antibiotic use, and other key parameters for Atlantic salmon production to food-size over 12 months within our freshwater commercial-scale closed containment system. The findings of this study will assist future decision-making by the North American salmon farming industry, government regulators, funders, and conservation advocates, resulting in better-informed decisions as the industry continues to grow.

9

10
Background InformationPrior to the production trial commencement, a number of project milestones were developed to guide the study’s progress; these milestones are summarized in Table 1.The growout trial officially began with the stocking of 2,052 St. John River strain Atlantic salmon in the TCFFI water recirculation growout system on May 2, 2011. All fish used in the growout trial were the same cohort and age and originated from a single batch of specific pathogen-free eyed salmon eggs procured from Cooke Aquaculture (Maine, USA). The fish were stocked at a mean weight of 340 grams ± 6.27 grams.
Prior to the stocking event, approximately 6% of the salmon were culled as precocious males. These fish were removed based on observable morphometric and coloration characteristics (Figure 1). Precocious males are easily differentiated from immature salmon, as they typically are smaller, display parr marks, colorful spots, and an olive to brown coloration. In contrast, the immature salmon (i.e. non-precocious males) are larger and silver in coloration. Precocity was confirmed post-mortem via visual gonadal assessments.

11
Incubation andHatching System
Figure 1. Four precocious males removed before production trial began. Salmon at top of picture is an immature female or male.
Salmon used in this trial arrived at TCFFI as eyed eggs on January 14th, 2010. Eggs were iodine disinfected upon arrival, following facility standard operating procedures. The eggs were incubated in vertical heath style trays (Figure 2) at an average incubation water temperature of 7.5°C. The eggs hatched at approximately 414 ATU’s (accumulated thermal units) on January 22,
2010. The date of 50% hatching is a critical milestone, as it represents Day 0 in age for any given cohort. Accumulated thermal units were tracked to follow egg and fry development and to predict important milestones such as hatching and ponding. After hatch, Atlantic salmon have large yolk sacs (Figure 3) and did not require any extraneous feed until 42 days of age,

12
Figure 2. egg transfer into vertical heath tray units after disinfection.
depending on several factors such as water temperature, rearing conditions, fry activity, and species strain.
Survival percentages at hatching and ponding were 91% and 84%, respectively. Unfortunately, the small increase in mortality between these two events was due to a fungal outbreak that occurred while the alevins resided in the incubation trays. Fungal outbreaks were controlled by addition of 35% hydrogen peroxide to the incubation trays as a short duration static bath. Mortalities and eggs shells were removed on a daily basis to promote good tank hygiene (Figure 4). Water quality in the incubation system was excellent. Oxygen was maintained at atmospheric saturation, and carbon
dioxide levels were close to zero due to the combined effects of the water cascading between incubation trays and the low level of respiration due to lack of feeding (i.e., alevins are not fed while held in the incubation trays). It is important to note that the low CO2 levels and subsequent higher pH in hard water can precipitate calcium carbonate crystals from the water, which deposit on eggs and equipment. In our experience, however, this has not impacted hatching success at TCFFI. Water temperatures were maintained close to 7.5˚C during the incubation phase, and slowly increased to 12˚C over a 3-day period to acclimate fish for ponding into the nursery system.
1Alevins are a life cycle stage that refers to the time between hatching and full utilization of their endogenous yolk sac.

13
Table 1. Date and fish age when major milestones were achieved in the atlantic salmon growout trial.
Date Days Post-hatch Milestone
January 14th, 2010 n/a eyed eggs received
January 22, 2010 0 50% hatch date
March 5, 2010 42 Ponding and first feeding
October 18, 2010 269 S0 winter period begins
(12 hours dark, 12 hours light per day)
November 30, 2010 312 S0 winter period ends, fish resume
24-hour photoperiod
april 6, 2011 439 Precocious males removed from population
May 2, 2011 465 Salmon stocked into TCFFi growout system; aSF trial begins
September 30, 2011 616 1st male harvest
January 20, 2012 728 2nd male harvest
February 20, 2012 759 Harvest of premium salmon
February 28, 2012 767 Harvest of premium salmon
March 5, 2012 and other dates 773 Harvest of premium salmon for various additional research studies
March 12, 2012 780 Harvest of premium salmon
May 2, 2012 831 Final harvest of premium salmon; completion of aSF trial

14
Figure 4. removing egg shells and dead eggs from a vertical heath tray.
Figure 3. Sac fry alevins appoximately 2 days old. Note yolk sac size, which is much larger than in other salmonids such as rainbow trout and arctic charr.

15
First Feeding, Parr, and Smolt SystemThe alevins were stocked into 560 L (148 gallon) circular nursery tanks on March 5, 2010 at approximately 731 ATU’s, i.e., when all or most (90%) of the yolk sac had been consumed. These sac fry were stocked a few days early before first feeding began, as they had some remaining yolk reserves. The time for first feeding can vary based on facility, species, and water temperature; at TCFFI, fish are usually stocked and fed around 35-45 days of age using an incubation temperature of 8˚C, but timing ultimately depends on observation of yolk sac reserves.
First feeding is a critical time for alevins. If first feeding is initiated too early, fish will not feed and water quality can deteriorate leading to fish health issues. If feeding begins too late, there is a risk of fish not adapting to feed and eventually dying from malnutrition. Atlantic salmon were fed commercially available diets from Bio-Oregon (Westbrook, ME) and Zeigler Brothers (Gardner’s, PA) specifically formulated for salmonid fry and parr.
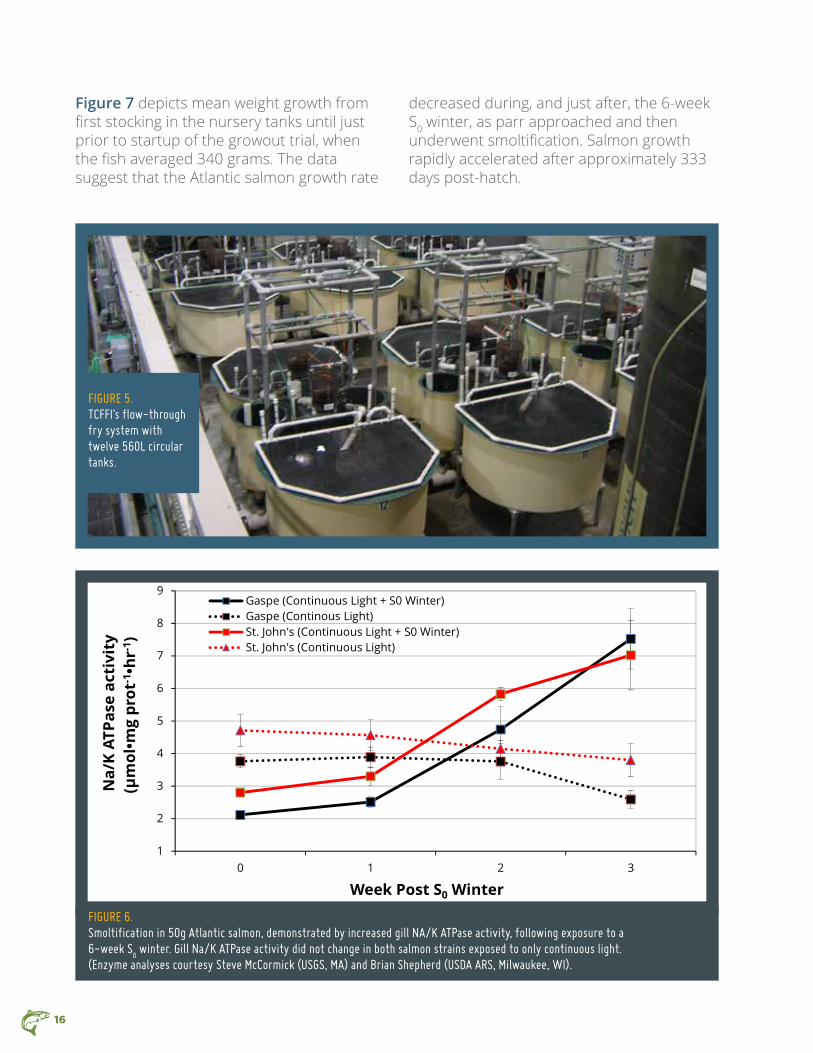
The salmon were reared in the 12-tank nursery system (Figure 5) and other similar tanks through fry, parr, and smolt stages, until May 2, 2011, when they were stocked into the growout production tank to officially begin the ASF trial. The salmon fry and parr were reared with 24-hour continuous light and feeding events at least once per hour, or every other hour, for 24 hours daily. After reaching a mean size of 50 g, while still in the nursery system the salmon parr were treated with a 6-week artificial winter photoperiod (consisting of days with 12 hours light and 12 hours dark) in
order to produce what industry refers to as an S0 smolt. An S0 smolt is a salmon that has undergone smoltification in a period within approximately six months from hatching, rather than the usual 12 or 24 months. After the end of the 6-week winter photoperiod, fish were returned to a 24-hour continuous lighting regime. The fish started to smoltify within 1-3 weeks after resuming the continuous 24-hour photoperiod. Figure 6 shows the increased gill Na/K ATPase activity indicating the smoltification process following a 6-week artificial winter photoperiod (previous data obtained at TCFFI; fish that did not undergo the S0 winter did not show the increase in Na/K ATPase activity).
Previous research at TCFFI indicates that Atlantic salmon grow faster to 4-5 kg if smoltification has been induced by a 6-week artificial winter (compared to fish that were simply exposed to continuous 24-hour lighting), despite being raised to market size in freshwater only. Thus, providing a 6-week artificial winter photoperiod to produce smoltification is now standard practice when rearing Atlantic salmon to market-size in the freshwater closed-containment system at TCFFI.
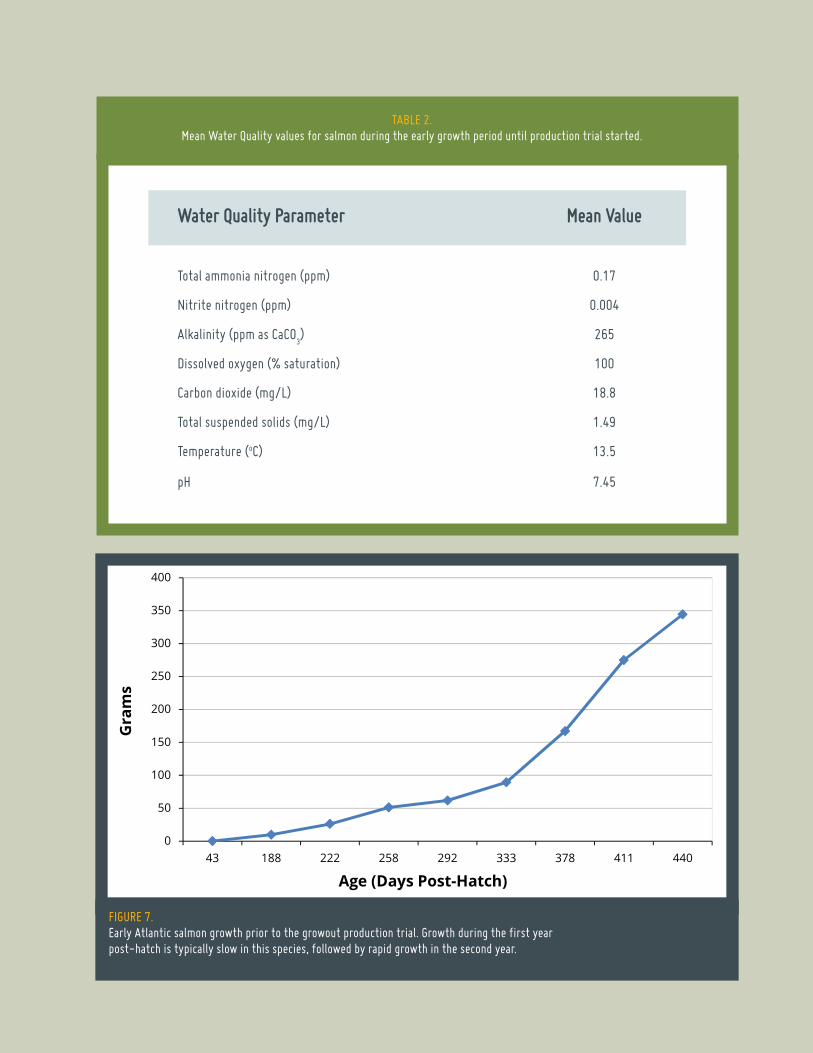
Water quality was excellent while salmon were cultured in the nursery system (Table 2). Temperature and dissolved oxygen were recorded daily, whereas carbon dioxide, hardness, alkalinity, total ammonia nitrogen, nitrite nitrogen, pH, and total suspended solids were measured once weekly.
16
Figure 5. TCFFi’s flow-through fry system with twelve 560l circular tanks.
1
2
3
4
5
6
7
8
9
0 1 2 3
Na/
K AT
Pase
act
ivit
y(μ
mol
•mg
prot
-1•h
r-1)
Week Post S0 Winter
Gaspe (Continuous Light + S0 Winter)Gaspe (Continous Light)St. John's (Continuous Light + S0 Winter)St. John's (Continuous Light)
Figure 6. Smoltification in 50g atlantic salmon, demonstrated by increased gill Na/K aTPase activity, following exposure to a 6-week S
0 winter. gill Na/K aTPase activity did not change in both salmon strains exposed to only continuous light.
(enzyme analyses courtesy Steve McCormick (uSgS, Ma) and brian Shepherd (uSDa arS, Milwaukee, Wi).
Figure 7 depicts mean weight growth from first stocking in the nursery tanks until just prior to startup of the growout trial, when the fish averaged 340 grams. The data suggest that the Atlantic salmon growth rate
decreased during, and just after, the 6-week S0 winter, as parr approached and then underwent smoltification. Salmon growth rapidly accelerated after approximately 333 days post-hatch.
17
0
50
100
150
200
250
300
350
400
43 188 222 258 292 333 378 411 440
Gra
ms
Age (Days Post-Hatch)
Figure 7. early atlantic salmon growth prior to the growout production trial. growth during the first year post-hatch is typically slow in this species, followed by rapid growth in the second year.
Table 2. Mean Water Quality values for salmon during the early growth period until production trial started.
Water Quality Parameter Mean Value
Total ammonia nitrogen (ppm) 0.17
Nitrite nitrogen (ppm) 0.004
alkalinity (ppm as CaCO3) 265
Dissolved oxygen (% saturation) 100
Carbon dioxide (mg/l) 18.8
Total suspended solids (mg/l) 1.49
Temperature (oC) 13.5
pH 7.45
18
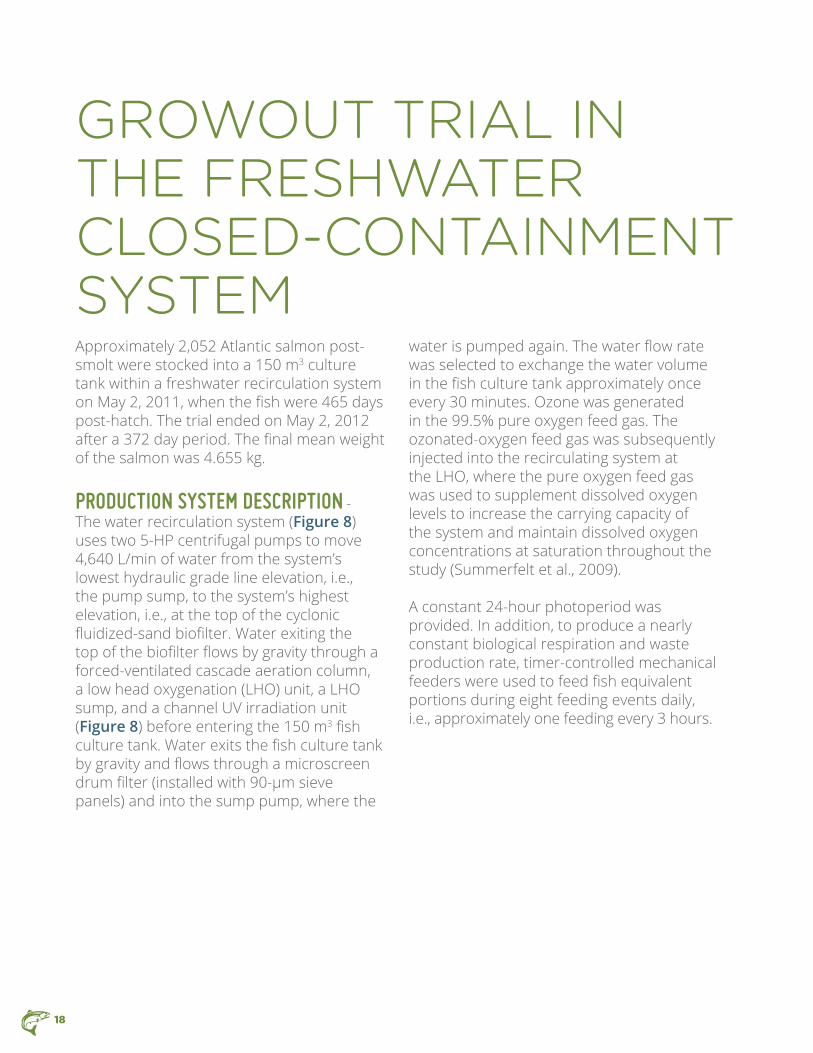
GROWOUT TRIAL IN THE FRESHWATER CLOSED-CONTAINMENT SYSTEM Approximately 2,052 Atlantic salmon post-smolt were stocked into a 150 m3 culture tank within a freshwater recirculation system on May 2, 2011, when the fish were 465 days post-hatch. The trial ended on May 2, 2012 after a 372 day period. The final mean weight of the salmon was 4.655 kg.
ProDuction systeM DescriPtion - The water recirculation system (Figure 8) uses two 5-HP centrifugal pumps to move 4,640 L/min of water from the system’s lowest hydraulic grade line elevation, i.e., the pump sump, to the system’s highest elevation, i.e., at the top of the cyclonic fluidized-sand biofilter. Water exiting the top of the biofilter flows by gravity through a forced-ventilated cascade aeration column, a low head oxygenation (LHO) unit, a LHO sump, and a channel UV irradiation unit (Figure 8) before entering the 150 m3 fish culture tank. Water exits the fish culture tank by gravity and flows through a microscreen drum filter (installed with 90-μm sieve panels) and into the sump pump, where the
water is pumped again. The water flow rate was selected to exchange the water volume in the fish culture tank approximately once every 30 minutes. Ozone was generated in the 99.5% pure oxygen feed gas. The ozonated-oxygen feed gas was subsequently injected into the recirculating system at the LHO, where the pure oxygen feed gas was used to supplement dissolved oxygen levels to increase the carrying capacity of the system and maintain dissolved oxygen concentrations at saturation throughout the study (Summerfelt et al., 2009).
A constant 24-hour photoperiod was provided. In addition, to produce a nearly constant biological respiration and waste production rate, timer-controlled mechanical feeders were used to feed fish equivalent portions during eight feeding events daily, i.e., approximately one feeding every 3 hours.

19
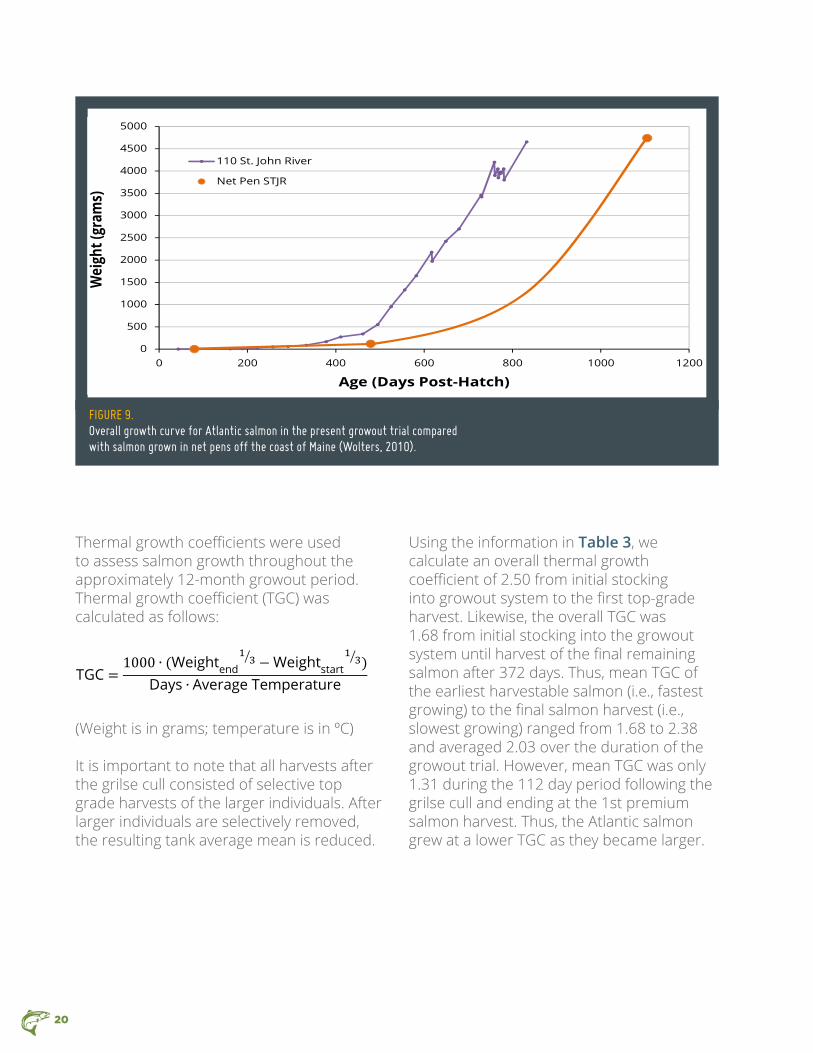
GroWth - Atlantic salmon were stocked into the growout trial tank at an average weight of 340 grams, which equated to a starting biomass of 694 kg. The first harvest of premium salmon began 294 days (~10 months) later at a mean size of approximately 4.2 kg. At the end of the 372-day (~12-month) growout trial, the salmon had reached an average weight of 4.66 kg and all harvests were complete. Figure 9 provides the entire growth curve for this St.
John River strain Atlantic salmon, comparing these data with St. John River strain salmon commercially farmed in a net pen located near Jonesport, Maine (Wolters, 2010). These data suggest that it can take considerably longer, 626 days total during growout, to culture the same strain of Atlantic salmon in an ocean net pen from a mean stocking size of 120 g to a mean size of 4.729 kg (Wolters, 2010).
Figure 8. Process flow drawing of the water recirculation salmonid growout system (Summerfelt et al., 2009).
20
Figure 9. Overall growth curve for atlantic salmon in the present growout trial compared with salmon grown in net pens off the coast of Maine (Wolters, 2010).
Thermal growth coefficients were used to assess salmon growth throughout the approximately 12-month growout period. Thermal growth coefficient (TGC) was calculated as follows:
(Weight is in grams; temperature is in ºC)
It is important to note that all harvests after the grilse cull consisted of selective top grade harvests of the larger individuals. After larger individuals are selectively removed, the resulting tank average mean is reduced.
Using the information in Table 3, we calculate an overall thermal growth coefficient of 2.50 from initial stocking into growout system to the first top-grade harvest. Likewise, the overall TGC was 1.68 from initial stocking into the growout system until harvest of the final remaining salmon after 372 days. Thus, mean TGC of the earliest harvestable salmon (i.e., fastest growing) to the final salmon harvest (i.e., slowest growing) ranged from 1.68 to 2.38 and averaged 2.03 over the duration of the growout trial. However, mean TGC was only 1.31 during the 112 day period following the grilse cull and ending at the 1st premium salmon harvest. Thus, the Atlantic salmon grew at a lower TGC as they became larger.
0
500
1000
1500
2000
2500
3000
3500
4000
4500
5000
0 200 400 600 800 1000 1200
Wei
ght (
gram
s)
Age (Days Post-Hatch)
110 St. John River
Net Pen STJR
TGC =1000 ∙ (Weightend
13� −Weightstart
13� )
Days ∙ Average Temperature
CF =100000 ∙Weight
Length3
FCR =Cumulative Feed Delivered
Fish Biomass Gain

21
Table 3. growth inputs used to determine thermal growth coefficients for each time period from
first stocking (april 27, 2011) through the first harvest (Feb 20, 2012).
Period # Days Post- Mean Water Mean Final tGcand Description stocking temp (oc) Weight (g)
initial stocking through 1st male harvest 151 15.6 ±-0.042 2,130 ±124 2.50
1st male harvest through 2nd male harvest 263 15.4 ± 0.051 3,460 ± 91.5 2.00
1st Premium Harvest 294 15.5 ± 0.087 4,200 2.01
Final Harvest/Trial Completion 372 15.6 ± 0.071 4,655 ± 131 1.68
FeeDinG - The salmon were fed commercially available diets during the production trial. The vast majority of the diet used and fed was produced by Ewos (Surrey, BC) and is sold under the Dynamic brand (Figure 10). This salmon diet contained 42% protein and 30% fat as well as 30 ppm of astaxanthin and 30 ppm of canthaxantin to promote a red fillet color. The Ewos Dynamic formulation is available in a Summer Red and Winter Blue formulations; these salmon were fed the Summer Red variant, based on the relatively constant 15-17oC water temperatures in TCFFI’s growout production tank. It should be noted that pre-trial salmon in the nursery system were fed a commercially available diet from Bio-Oregon (Westbrook, ME) that contained 47% Protein, 24% fat, and 40 ppm astaxanthin. Both diets produced good growth and feed conversion ratio (FCR).
FCRs were calculated as follows:
The overall feed conversion ratio was estimated to be 1.09 (1.09 kg feed fed produced 1 kg of weight gain) during the production trial. Feed conversion through March 12, 2012, was calculated based on 7,317 kg (16,097 lbs) feed and 6,702 kg (14,744 lbs) gain (i.e., 1.09 FCR). We had to stock a second cohort of Atlantic salmon into the growout tank on March 12, 2012, which was about 1.5 months before our final harvest. However, this next cohort was 11 months younger and much smaller than the St. John River strain salmon. We were able to selectively harvest the largest salmon from the culture tank on May 2, 2012. When we include the total feed fed to the mixed cohort after March 12, the FCR is 1.08 with 7,673 kg (16,916 lbs) feed fed to 7,115kg (15,686 lbs) gain.
TGC =1000 ∙ (Weightend
13� −Weightstart
13� )
Days ∙ Average Temperature
CF =100000 ∙Weight
Length3
FCR =Cumulative Feed Delivered
Fish Biomass Gain

22
Figure 10. Commercially available salmonid feed used during the growout trial.
Mortality, cullinG, anD surViVal - Table 4 summarizes the inventory of salmon in the growout production tank over the 12-month trial. The grow-out trial began with an initial stocking of 2,052 salmon. Overall mortality accounted for 3.9% of the fish during the growout production phase. There were a total of 82 mortalities over the 372 day period; however, 59 of these mortalities occurred within the first 10 days after the initial stocking event. The majority of these stocking mortalities were most likely fish that succumbed to stress from transportation, handling, and netting. In addition, Atlantic salmon can be susceptible to fungal infections, especially after moderate handling and stress. After the initial mortalities, a total of 23 mortalities were removed from the tank over a 357 day period, which averaged one mortality every
two weeks. Figure 11 illustrated the high initial mortality episode and the remainder of mortalities throughout the year.
In any aquaculture facility, culling and removing unthrifty fish is part of fish health and biosecurity best management practices. Unthrifty fish can be sick, malnourished, and/or exhibit very slow growth. Following standard operating procedures, these fish are removed from the population to reduce the risk of clinical disease and consequent amplification of fish pathogens in the water. During the 372-day time period described above, a total of 114 fish were removed due to fish health concerns (i.e., external fungal infections), deformities, or slow growth. The vast majority of these fish were simply slower-growing, unthrifty fish. In total, 5.6% of the salmon population was removed as culls.

23
Atlantic salmon is a naturally athletic species, and on a few occasions fish accidently jumped from the culture tank, over an approximately 3-ft tall jump screen, to the floor. A total of 41 salmon (1.9%) were lost in this manner over the entire growout period, with the majority of jumpers occurring early on in the trial.
Total loss to mortality (3.9%), culls (5.6%), and jumpers (1.9%) accounted for 11.4% of the population (Table 4).
Another 30.7% of the fish that could have gone to harvest were used for research
objectives that included:
• Approximately 130 fish removed monthly to quantify fish length and weight, condition factor, sex, fillet color, and gonad index.
• A total of 629 fish used in studies on depuration kinetics and fillet attributes before and after 10 days’ purging in flow-through tanks, maturation assessments, and pathogen screening .
• Sixty fish sampled for pathogen screening.
The remaining fish were harvested and sent to processing.
Figure 11. Mortalities during production trial
FPO0
2
4
6
8
10
12
14
16
460 510 560 610 660 710 760 810
# of
Mor
talit
ies
Age (Days Post-Hatch)

24
Table 4. Final numbers for all fish outcomes during the growout trial.
Fish outcomes # fish %
Mortalities 82 3.9
intentional culls (unthrifty fish) 114 5.6
Jumpers 41 1.9
Premium salmon harvested for fillet processing 435 21.2
Precocious males harvested 751 36.6
used for other research purposes (e.g. fillet attributes) 629 30.7
TOTal salmon in growout trial 2,052 100.0
harVests – Grilse were hand culled from the population twice: on September 30, 2011, at a mean size of 2.68 kg, and January 20, 2012, at a mean size of 3.7 kg. Almost all of the grilse were male salmon that were either sexually maturing or already sexually mature. Male salmon that are sexually maturing have a distinctive broad nose, an extended jaw, and enlarged kype (hook) at the end of the lower jaw. In addition, the silver coloration changes to a light or dark brown as the male matures. Only a few sexually mature females were encountered. These fish are darker in color, have ovipositors and are beginning to develop soft bellies. Fish that are not mature have hard bellies and silvery sides. The best indicator of a maturing female is a protruding ovipositor. Every salmon with this characteristic had enlarged ovaries and reduced fillet color. Fish with these ovipositors tend to have a swollen vent and are easily spotted. Belly firmness is not always a consistent indicator
of maturity. It is difficult to feel the eggs in the abdomen due to the thick underbellies and high fat content in the cavity. Females with fully developed ovaries had pale and nearly white flesh.
Premium salmon were harvested February 20 and 28, March 5 and 12, and May 2. In addition, premium salmon were removed on several other occasions for use during research on purging kinetics and slaughter technologies, plus fish health testing.
Premium salmon were harvested using a combination of a clam-shell crowder/grader with a sidewall drain harvest box. The frame of the aluminum clamshell crowder/grader (Emperor Aquatics Inc., Pottstown, PA) contained vertical u-channel slots to hold six removable sheets (each approximately 13 mm wide of high density polyethylene; each sheet had been machined to contain an array of vertical 76 mm wide slot openings to allow passage of salmon smaller than

25
about 4 kg). The slot openings were covered for the final harvest, when the objective was to empty the tank of all salmon. To begin each harvest event, the clam-shell grader was lowered into the water so that the majority of fish were excluded from the relatively small area enclosed by the closed clamshell’s two hinged panels. The end of one clam-shell panel was clamped to the culture tank wall. Then, approximately once every 10-15 minutes over the next 30-60 minutes, the other clamshell panel was pulled about the tank’s circumference to slowly crowd the fish, which provided the opportunity for the smaller fish to swim past the grader bars. Typically, approximately 70-90% of the smaller fish were able to self-sort by swimming past the grader bar during this procedure. Thus, the majority of the fish that remained in the growout tank following a harvest were never handled and did not have to endure the stress of an ex-situ size sorting process. Following the crowding and grading process, fish were
slid into the sidewall-drain box on the 150 m3 culture tank, which normally removes approximately 93% of total recirculating flow exiting the culture tank. Fish crowded to this location rapidly flowed with the water into the sidewall drain box when a normally vertical and perforated door through the sidewall drain is opened. A dewatering rack and an outlet channel box were used to enable rapid fish harvest through this box. The outlet channel box is located opposite the entry gate; this outlet chamber slopes more than 5% to its lower end, where it connects to a 20 cm diameter transfer hose; the transfer hose is used to slide harvested fish to another location, e.g., a palletized transfer tote in this application or a central depuration and slaughter facility at a commercial facility.
BioMass Density – The biomass density was maintained at less than 40 kg/m3 to ensure optimal growth throughout the growout trial (Figure 12). The consequence
0
5
10
15
20
25
30
35
40
400 450 500 550 600 650 700 750 800 850 900
Biom
ass
Den
sity
(kg/
m3)
Age (Days Post-Hatch)
Figure 12. biomass density within the 150 m3 culture tank during the growout trial; vertical arrows indicate harvest events.

26
of the low biomass density was a significantly reduced production capacity within the system, because it was operated at about one-third of its carrying capacity.
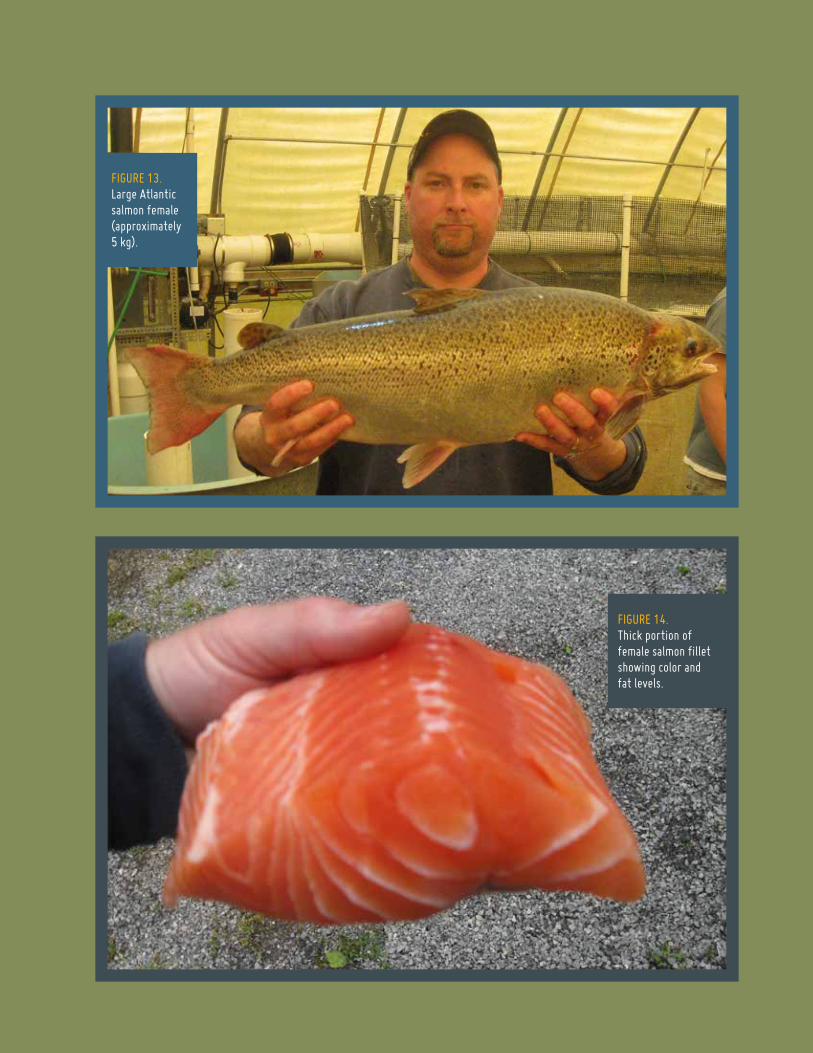
conDition Factor, Fillet color, sexual Maturity, ProxiMate analysis anD Fillet yielDs - During the growout trial, fish were periodically sampled and assessed for sexual maturity and fillet color; sexual maturity and full fillet attribute assessment (i.e., color, proximate analysis, fatty acid content, and fillet yield) was carried out during the final study sampling. Figures 13 and 14 illustrate the size, color, and fillet attributes of a large premium salmon harvested at the trial’s completion. Final salmon mean weight was 4,655 ± 131 grams.
A total of 129 fish were sampled periodically during the growout trial. These fish were sampled for total length (mm), total weight (g), fillet color, gonad weight (to determine GSI index), sex, and condition factor. Of the 129 fish sampled, 86 fish were females, the remaining fish were males. Table 5 summarizes the overall mean condition factor for the entire sample as well as broken down into males and females.
Condition factor (CF) was calculated as follows:
Where weight is in grams, length is in mm, and temperature is in oC.
Table 5. Summary of condition factors in male and female salmon during the production trial.
Parameter condition Factor
entire 129 fish Sample 1.67 ±0.025
Females, n=86 1.71 ± 0.032
Males, n=43 1.59 ±0.031
TGC =1000 ∙ (Weightend
13� −Weightstart
13� )
Days ∙ Average Temperature
CF =100000 ∙Weight
Length3
FCR =Cumulative Feed Delivered
Fish Biomass Gain
27
Figure 14. Thick portion of female salmon fillet showing color and fat levels.
Figure 13. large atlantic salmon female (approximately 5 kg).

28
Figure 16. Male (left) and female (right) fillets from trial salmon on September 30, 2011; note color variation in the male fillet.
Figure 15. Fillet portions from trial fish in early June, 2011, showing very light coloration.
Figure 17. Fillet of female salmon at final harvest.
29
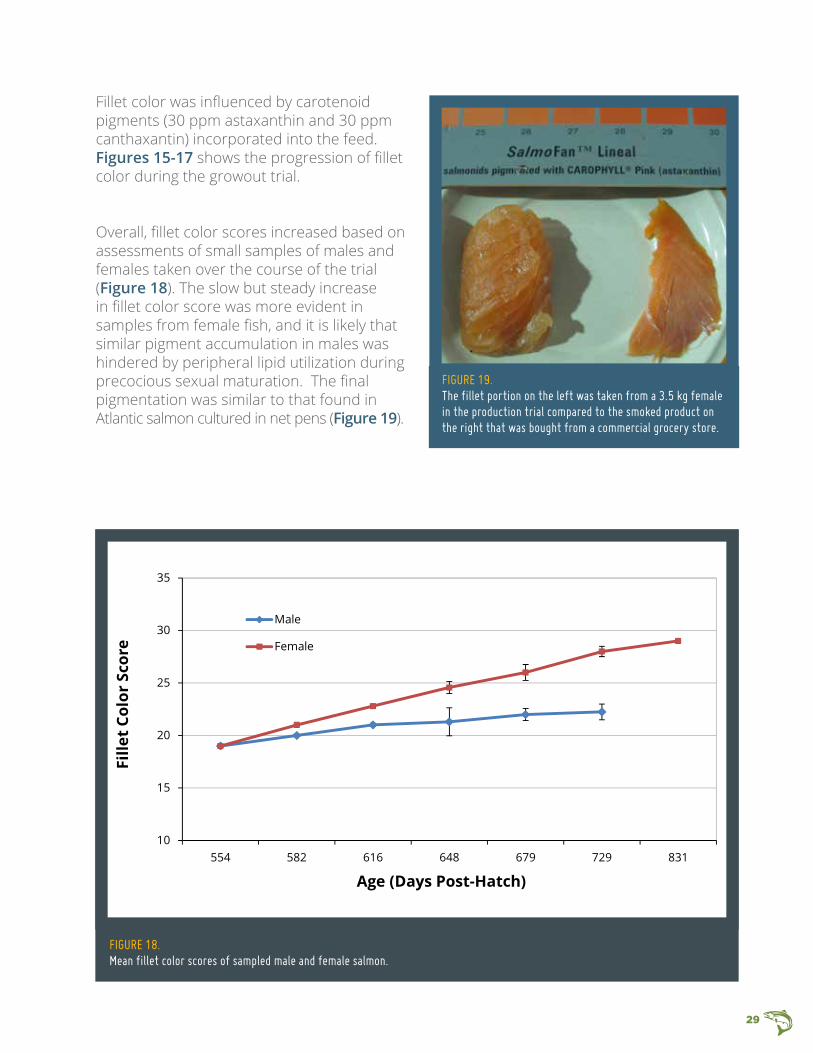
Figure 19. The fillet portion on the left was taken from a 3.5 kg female in the production trial compared to the smoked product on the right that was bought from a commercial grocery store.
Fillet color was influenced by carotenoid pigments (30 ppm astaxanthin and 30 ppm canthaxantin) incorporated into the feed. Figures 15-17 shows the progression of fillet color during the growout trial.
Overall, fillet color scores increased based on assessments of small samples of males and females taken over the course of the trial (Figure 18). The slow but steady increase in fillet color score was more evident in samples from female fish, and it is likely that similar pigment accumulation in males was hindered by peripheral lipid utilization during precocious sexual maturation. The final pigmentation was similar to that found in Atlantic salmon cultured in net pens (Figure 19).
Figure 18. Mean fillet color scores of sampled male and female salmon.
FPO
10
15
20
25
30
35
554 582 616 648 679 729 831
Fille
t Col
or S
core
Age (Days Post-Hatch)
Male
Female
30
0.0
1.0
2.0
3.0
4.0
5.0
6.0
7.0
8.0
9.0
10.0
554 582 617 648 679 729
Mal
e GS
I (%
)
Age (Days Post Hatch)
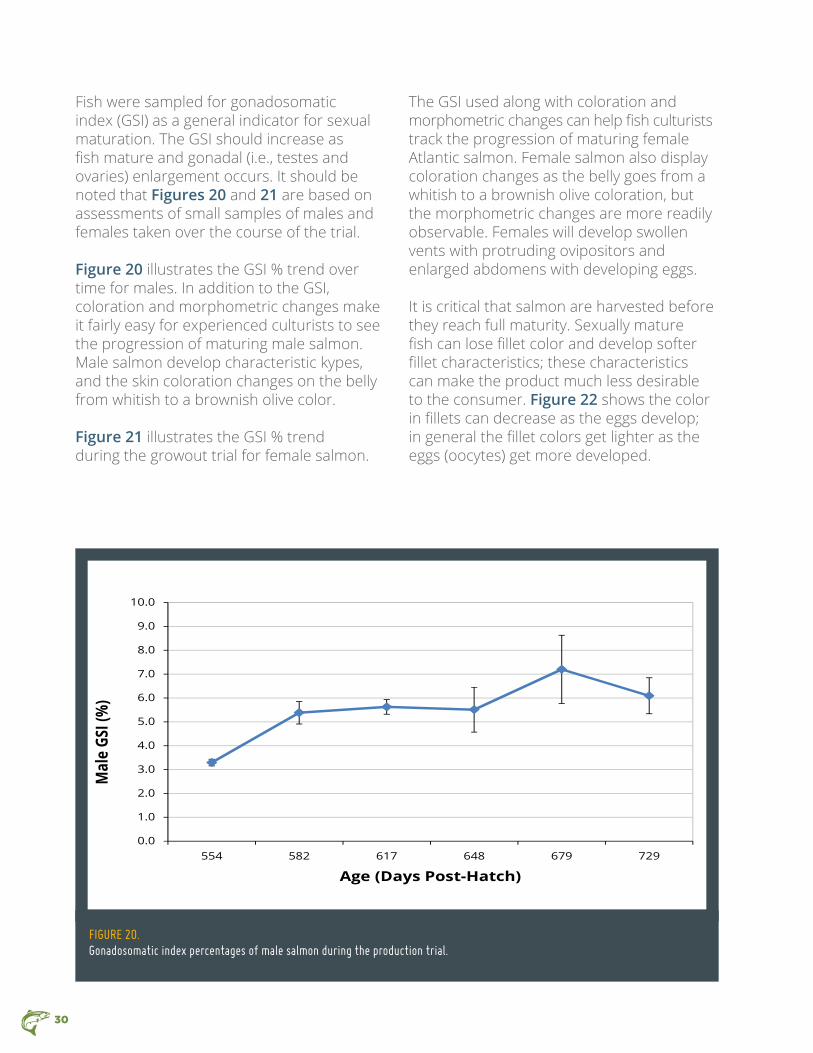
Fish were sampled for gonadosomatic index (GSI) as a general indicator for sexual maturation. The GSI should increase as fish mature and gonadal (i.e., testes and ovaries) enlargement occurs. It should be noted that Figures 20 and 21 are based on assessments of small samples of males and females taken over the course of the trial.
Figure 20 illustrates the GSI % trend over time for males. In addition to the GSI, coloration and morphometric changes make it fairly easy for experienced culturists to see the progression of maturing male salmon. Male salmon develop characteristic kypes, and the skin coloration changes on the belly from whitish to a brownish olive color.
Figure 21 illustrates the GSI % trend during the growout trial for female salmon.
The GSI used along with coloration and morphometric changes can help fish culturists track the progression of maturing female Atlantic salmon. Female salmon also display coloration changes as the belly goes from a whitish to a brownish olive coloration, but the morphometric changes are more readily observable. Females will develop swollen vents with protruding ovipositors and enlarged abdomens with developing eggs.
It is critical that salmon are harvested before they reach full maturity. Sexually mature fish can lose fillet color and develop softer fillet characteristics; these characteristics can make the product much less desirable to the consumer. Figure 22 shows the color in fillets can decrease as the eggs develop; in general the fillet colors get lighter as the eggs (oocytes) get more developed.
Figure 20. gonadosomatic index percentages of male salmon during the production trial.
0.0
1.0
2.0
3.0
4.0
5.0
6.0
7.0
8.0
9.0
10.0
554 582 617 648 679 729
Mal
e GS
I (%
)
Age (Days Post-Hatch)

31
0.0
1.0
2.0
3.0
4.0
5.0
6.0
7.0
8.0
9.0
10.0
554 582 617 648 679 729
Mal
e GS
I (%
)
Age (Days Post Hatch)
Figure 22. Fillet color can decrease as maturity progresses in female salmon.
Figure 21. gonadosomatic index percentages of female salmon during the production trial.
0.0
1.0
2.0
3.0
4.0
5.0
6.0
554 617 648 679 775 813 832
Fem
ale
GSI (
%)
Age (Days Post-Hatch)
32
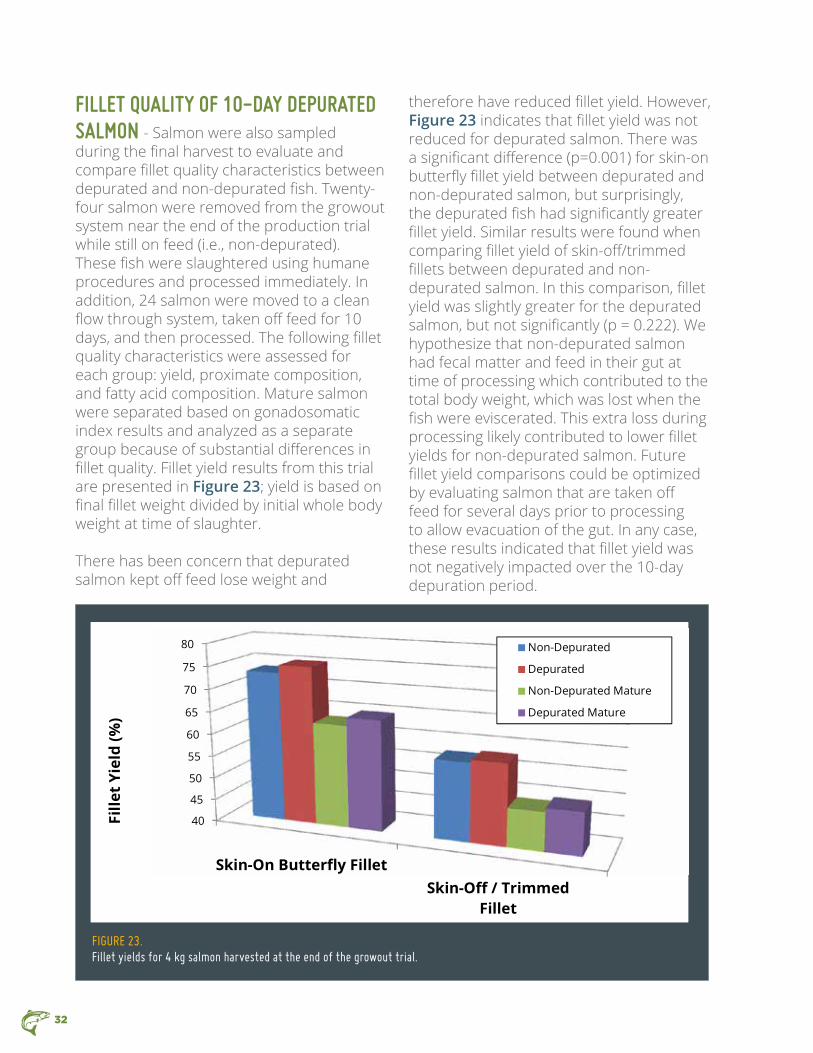
Fillet Quality oF 10-Day DePurateD salMon - Salmon were also sampled during the final harvest to evaluate and compare fillet quality characteristics between depurated and non-depurated fish. Twenty-four salmon were removed from the growout system near the end of the production trial while still on feed (i.e., non-depurated). These fish were slaughtered using humane procedures and processed immediately. In addition, 24 salmon were moved to a clean flow through system, taken off feed for 10 days, and then processed. The following fillet quality characteristics were assessed for each group: yield, proximate composition, and fatty acid composition. Mature salmon were separated based on gonadosomatic index results and analyzed as a separate group because of substantial differences in fillet quality. Fillet yield results from this trial are presented in Figure 23; yield is based on final fillet weight divided by initial whole body weight at time of slaughter.
There has been concern that depurated salmon kept off feed lose weight and
therefore have reduced fillet yield. However, Figure 23 indicates that fillet yield was not reduced for depurated salmon. There was a significant difference (p=0.001) for skin-on butterfly fillet yield between depurated and non-depurated salmon, but surprisingly, the depurated fish had significantly greater fillet yield. Similar results were found when comparing fillet yield of skin-off/trimmed fillets between depurated and non-depurated salmon. In this comparison, fillet yield was slightly greater for the depurated salmon, but not significantly (p = 0.222). We hypothesize that non-depurated salmon had fecal matter and feed in their gut at time of processing which contributed to the total body weight, which was lost when the fish were eviscerated. This extra loss during processing likely contributed to lower fillet yields for non-depurated salmon. Future fillet yield comparisons could be optimized by evaluating salmon that are taken off feed for several days prior to processing to allow evacuation of the gut. In any case, these results indicated that fillet yield was not negatively impacted over the 10-day depuration period.
40
45
50
55
60
65
70
75
80
Skin-On Butterfly FilletSkin-Off / Trimmed
Fillet
Fille
t Yi
eld
(%)
Non-Depurated
Depurated
Non-Depurated Mature
Depurated Mature
Figure 23. Fillet yields for 4 kg salmon harvested at the end of the growout trial.

33
In addition, Figure 23 illustrates a dramatic difference in fillet yield between mature vs. non-mature salmon. Non-mature salmon had significantly greater skin-on butterfly fillet yields and skin-off/trimmed fillet yields when compared to maturing salmon. For example, skin-on butterfly fillet yield for depurated salmon was 73.5 ± 0.4% for salmon that were not mature vs. 57.5 ± 0.4% for maturing salmon (p=0.002). Mature and non-mature fish were distinguished by calculating gonadosomatic indices. Note that the GSI of mature fish was 15.5 ± 2.7% and GSI of non-mature fish was 0.55 ± 0.06%. Significantly greater skin-off/trimmed fillet yield was also found for non-mature salmon compared to mature salmon (p<0.001). Therefore, Figure 23 also illustrates that fillet yield is significantly reduced when salmon mature, providing more evidence that early maturation of Atlantic salmon must be
avoided during production in land-based closed containment systems.
At the end of the growout trial, salmon were also tested for proximate composition. Table 6 above summarizes proximate composition results comparing non-depurated and depurated salmon.
Proximate composition results were similar between depurated and non-depurated salmon. There were no significant differences in percent moisture, crude fat, or crude protein. The data suggest that 10 days of depurating salmon while off-feed will not decrease fat content, thus preserving optimal quality. Communication with top chefs and salmon distributors in Seattle and Canada, as well as the results of blind taste tests indicate that a rich fatty fillet (similar to TCFFI salmon) is generally preferred.
Table 6. Proximate composition values for salmon harvested at the completion of the trial study.
Parameter % Moisture % crude Fat % crude Protein % ash
No depuration 64.0 ± 0.5 14.8 ± 0.7 20.8 ± 0.2 1.3 ± 0.1 (n=18)
10-day depuration 63.6 ± 0.6 16.1 ± 0.7 20.4 ± 0.2 1.5 ± 0.1 (n=20)
p-value 0.973 0.445 0.150 0.007
Table 7. Summary of Omega-3 fatty acid composition (mg/g) of depurated vs. non-depurated
salmon harvested at the completion of the trial.
Parameter c18:3n3 c20:3n3 c20:5n3 c22:6n3
No depuration 3.55 ± 0.20 0.279 ± 0.016 4.67 ± 0.23 8.55 ± 0.37 (n=24)
10-day depuration 3.62 ± 0.16 0.296 ± 0.016 4.81 ± 0.18 8.56 ± 0.30 (n=24)

34
A suite of 22 fatty acids were analyzed for depurated and non-depurated salmon harvested at the conclusion of the growout trial (Table 7). There were no statistical differences between depurated and non-depurated salmon for any of the 22 fatty acids analyzed. Therefore, Omega-3 fatty acids appear to be maintained during a 10-day depuration period, thus preserving the associated health benefits.
Concentrations of all fatty acids that were measured for the depurated salmon are presented in Table 8.
The results from trials comparing harvest size non-depurated salmon vs. salmon depurated for 10 days showed that salmon maintain their red/orange fillet color over the 10-day fasting period (Table 9), which is consistent with the findings of Burr et al. (2012).
Water Quality anD Quantity - Water quality monitoring was carried out daily or weekly, depending on which parameters were being tested. On a daily basis, temperature, oxidation-reduction potential (ORP), pH, make up flow rate, and dissolved oxygen concentration were recorded and monitored to ensure that these parameters stayed within safe and optimal levels for fish culture. Total ammonia nitrogen, total nitrite nitrogen, total nitrate nitrogen, carbon dioxide, alkalinity, total suspended solids, and total phosphorous concentrations were monitored weekly.
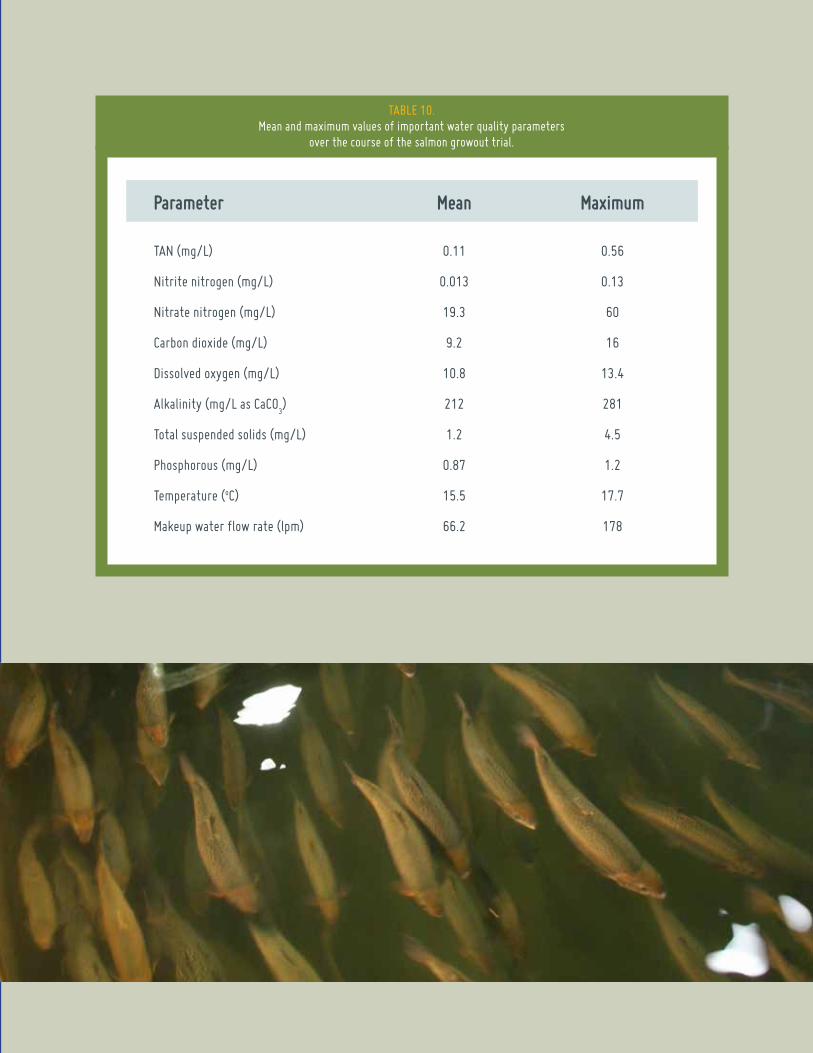
The water treatment processes in the recirculating system were sufficient to maintain excellent water quality (Figures 24-32 and summarized in Table 10). Throughout the growout trial, dissolved oxygen and carbon dioxide were maintained at an average of 10.8 mg/L (approximately at 100% saturation) and 9.2 mg/L, which
provide the opportunity for maximum fish growth (Figures 24, 25). Total ammonia nitrogen and nitrite nitrogen were also controlled at extremely low levels for a water recirculation system, averaging 0.11 mg/L and 0.013 mg/L, respectively, over the duration of the study (Figures 26, 27).
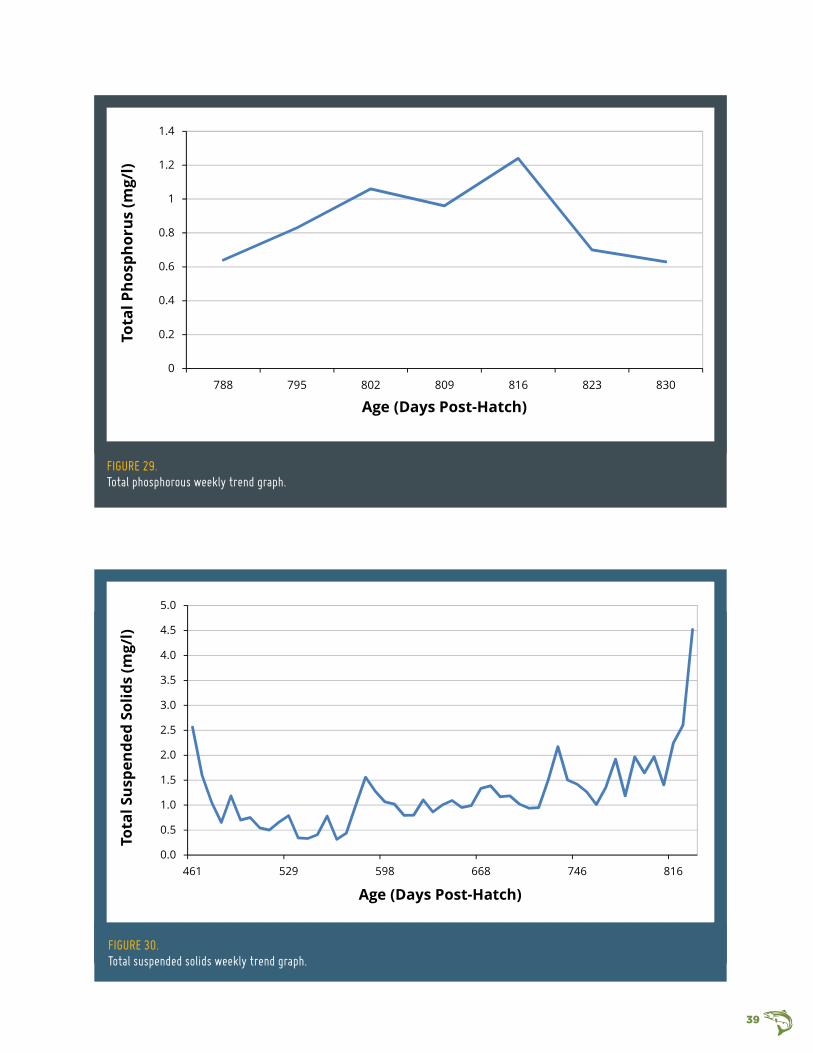
Nitrate nitrogen averaged approximately 20 mg/L, which represents the amount of ammonia and nitrite nitrogen that were produced and converted to nitrate nitrogen at the mean loading rate on the system (Figure 28). Total phosphorus in the culture tank water ranged from 0.6-1.2 mg/L (Figure 29). The combination of ozonation and microscreen filtration maintained relatively low total suspended solids concentrations, i.e., they averaged 1.2 mg/L, which is just above the concentration in our spring water source (Figure 30). Thus, this study suggests that larger commercial facilities using properly designed water recirculation systems can also maintain exceptional water quality at similar feed loading levels. In April of 2012, we stocked more than 5000 post-smolt Atlantic salmon (at approximately 600 g/fish) into the growout system to co-mingle with the remaining 4 kg St John River strain. The increased feed loading that these salmon placed on the system created the small spike in waste concentrations and increased dissolved oxygen consumption measured in the tank in April (Figures 25, 26, 27, 30). We had to co-mingle the two cohorts of salmon because the younger cohort had out-grown the nursery system just before we had finished harvesting the older cohort from the growout system. It was relatively simple to grade out the younger and considerably smaller fish when harvesting the last of the older cohort from the growout system.
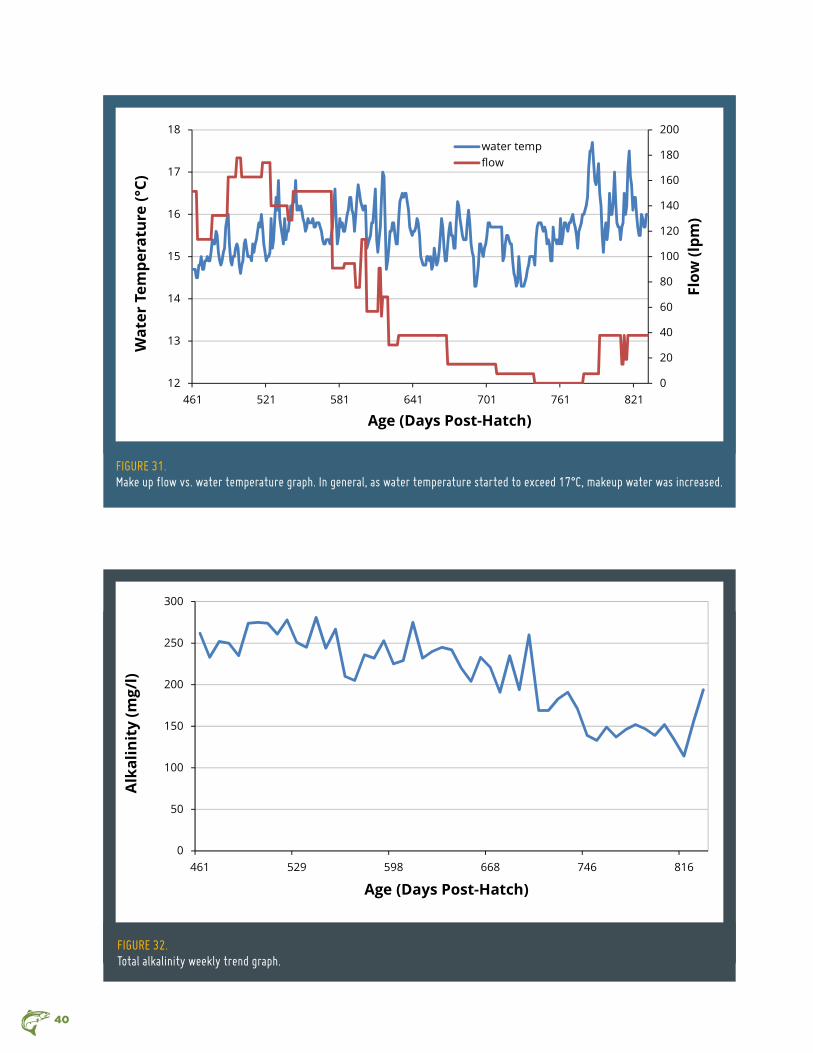
Makeup water flow to the system was increased when necessary (i.e., mostly during the summer) to prevent water temperature

35
Table 8. Fillet fatty acid concentrations for salmon harvested at the study’s completion.
Fatty acid lipid number mg/g % total mg/g % totalDodecanoic acid C12:0 0.057 0.063 0.049 0.054Tetradecanoic acid C14:0 4.88 5.40 4.29 5.28Myristoleic acid C14:1 0.06 0.067 0.055 0.061Pentadecanoic acid C15:0 0.369 0.410 0.363 0.401Hexadecanoic acid C16:0 16.5 18.4 16.6 18.3Palmitoleic acid C16:1 7.78 8.66 7.66 8.45Heptadecanoic acid C17:0 0.319 0.354 0.317 0.349Octadecanoic acid C18:0 3.72 4.14 3.86 4.26Elaidic acid • C18:1n9t 0.41 0.456 0.529 0.584Oleic acid • C18:1n9c 27.2 30.2 27.6 30.4linoleic acid ‡ C18:2n6c 9.7 10.8 9.73 10.7eicosanoic acid C20:0 0.146 0.162 0.145 0.160γ-linolenic acid ‡ C18:3n6 0.271 0.302 0.269 0.297α-linolenic acid † C18:3n3 3.55 3.95 3.62 4.00Docosanoic acid C22:0 0.11 0.112 0.112 0.123Dihomo-γ-linolenic acid ‡ C20:3n6 0.3 0.333 0.305 0.337Erucic acid • C22:1n9 0.311 0.346 0.325 0.359eicosatrienoic acid † C20:3n3 0.279 0.311 0.296 0.326arachidonic acid ‡ C20:4n6 0.646 0.719 0.659 0.727Tetracoanoic acid C24:0 0.023 0.025 0.022 0.025eicosapentaenoic acid † C20:5n3 4.67 5.20 4.81 5.31Docosahexaenoic acid † C22:6n3 8.55 9.52 8.56 9.44
† Omega-3 fatty acid ‡ Omega-6 fatty acid • Omega-9 fatty acid
Table 9. Color values of salmon fillets (non-depurated vs. 10-day depurated) measured using a Minolta colorimeter.
Note that these values are not on the same scale as the Salmo Fan TM.
treatment l (white/black) a (red) B (yellow) (0 = black; 100 = white) (increasing values = more red) (increasing values = more yellow)
No depuration 34.7 ± 0.3 8.1 ± 0.5 7.9 ± 0.4
10-day depuration 35.3 ± 0.5 8.7 ± 0.4 9.6 ±0.4
non-DePurateD 10-Day DePurateD
color Value

36
from exceeding 17˚C (Figure 31). Over the entire growout cycle, makeup water flow averaged 66 lpm (17.5 gpm), which is approximately 1.5% of the total flow recirculating through the system. Makeup water flow reached a maximum of 178 lpm (47 gpm) (about 3.9% of the recirculated flow) to cool the system during June, 2011.
However, during winter only 0-19 lpm (0-5 gpm) of makeup water flow (0-0.4%
of the recirculating flow) was used to flush the system, which allowed nitrate nitrogen concentrations to accumulate to 60 mg/L (Figure 28), when cooling wasn’t required. Likewise, alkalinity concentrations dropped as makeup water flushing was reduced (Figure 32); alkalinity that was continuously lost during nitrification was supplied by makeup water addition, i.e., the makeup water supply contained 280 mg/L of alkalinity.
0
1
2
3
4
5
6
7
8
460 510 560 610 660 710 760 810
Del
ta D
isso
lved
Oxy
gen
(mg/
l)
Age (Days Post-Hatch)
Figure 24. Delta dissolved oxygen, the difference between incoming and outgoing dissolved oxygen. The difference is due to fish respiration.

37
0.0
0.2
0.4
0.6
0.8
1.0
1.2
461 529 598 668 746 816
TAN
(mg/
l)
Age (Days Post-Hatch)
Figure 26. Delta dissolved Total ammonia nitrogen (TaN) weekly levels during the growout trial.
0
2
4
6
8
10
12
14
16
18
461 529 598 668 746 816
Dis
solv
ed C
O2
(mg/
l)
Age (Days Post-Hatch)
Figure 25. Carbon dioxide weekly trend graph.

38
0
10
20
30
40
50
60
70
461 529 598 668 746 816
NO
3_N
(mg/
l)
Age (Days Post-Hatch)
Figure 28. Nitrate nitrogen (NO
3-N) weekly levels during the growout trial.
0.00
0.02
0.04
0.06
0.08
0.10
0.12
0.14
0.16
0.18
0.20
461 529 598 668 746 816
NO
2_N
(mg/
l)
Age (Days Post-Hatch)
Figure 27. Nitrite nitrogen (NO
2-N) weekly levels during the growout trial.
39
0.0
0.5
1.0
1.5
2.0
2.5
3.0
3.5
4.0
4.5
5.0
461 529 598 668 746 816
Tota
l Sus
pend
ed S
olid
s (m
g/l)
Age (Days Post-Hatch)
Figure 30. Total suspended solids weekly trend graph.
0
0.2
0.4
0.6
0.8
1
1.2
1.4
788 795 802 809 816 823 830
Tota
l Pho
spho
rus
(mg/
l)
Age (Days Post-Hatch)
Figure 29. Total phosphorous weekly trend graph.
40
0
50
100
150
200
250
300
461 529 598 668 746 816
Alk
alin
ity
(mg/
l)
Age (Days Post-Hatch)
Figure 32. Total alkalinity weekly trend graph.
0
20
40
60
80
100
120
140
160
180
200
12
13
14
15
16
17
18
461 521 581 641 701 761 821
Flow
(lpm
)
Wat
er T
empe
ratu
re (°
C)
Age (Days Post-Hatch)
water tempflow
Figure 31. Make up flow vs. water temperature graph. in general, as water temperature started to exceed 17°C, makeup water was increased.
41
Table 10. Mean and maximum values of important water quality parameters
over the course of the salmon growout trial.
Parameter Mean Maximum
TaN (mg/l) 0.11 0.56
Nitrite nitrogen (mg/l) 0.013 0.13
Nitrate nitrogen (mg/l) 19.3 60
Carbon dioxide (mg/l) 9.2 16
Dissolved oxygen (mg/l) 10.8 13.4
alkalinity (mg/l as CaCO3) 212 281
Total suspended solids (mg/l) 1.2 4.5
Phosphorous (mg/l) 0.87 1.2
Temperature (oC) 15.5 17.7
Makeup water flow rate (lpm) 66.2 178

42
Fish health – The only fish health issue observed during the production trial was the occurrence of external fungal infections. Atlantic salmon, in general, are more susceptible to infections by ubiquitous water molds such as Saprolegnia spp., compared to other salmonids (e.g. rainbow trout and Arctic charr). There was one moderate outbreak of external fungus that occurred after the initial stocking event in the growout system. A total of 59 fish were lost in a six-day period following the initial stocking. These mortalities were likely related to harvesting stress, fungal infection, or through a combination of both factors. After this initial mortality event, only 23 mortalities occurred for the remainder of the growout trial. All subsequent occurrences of external fungus were easily controlled by the addition of salt to the production tank. Dosages of salt were added during treatments to bring the salinity in the production tank to 2.5 ppt; however, the salt would stay in the production tank longer due to the reduced makeup and longer system hydraulic retention time. A total of 6,532 kg (14,400 lbs) of salt was used to prevent and control any spread of fungus over the course of the study.
The practice of culling fish was also utilized to remove any unthrifty, sick, or lethargic fish. Culling fish may help to prevent potentially sick fish from infecting other fish, or to curtail the transition to overt clinical disease and the consequent amplification of fish pathogens in the recirculation system water. The use of extended salt treatments at low levels (2.5 ppt) coupled with culling was a major tool in helping to remove and prevent fungal infection outbreaks and mortalities. On January 25, 2012, 60 salmon from the production lot were sampled and tested, according to American Fisheries Society-Fish Health Section’s “Suggested Procedures for the Detection and Identification of
Certain Finfish and Shellfish Pathogens” (2010) protocols, by the certified fish health laboratory Kennebec River Biosciences (Maine, USA). This testing was completed to provide a 95% confidence (assuming 5% pathogen apparent prevalence) that the salmon population was not infected with the following pathogens: infectious salmon anemia virus (ISAV), infectious pancreatic necrosis virus (IPNV), infectious hematopoietic virus (IHNV), viral hemorrhagic septicemia virus (VHSV), Oncorhynchus masou virus, Spring Viremia of Carp virus, Aeromonas salmonicida (causative agent of furunculosis), Yersinia ruckeri (enteric redmouth disease), Renibacterium salmoninarum (bacterial kidney disease), Ceratomyxa shasta (ceratomyxosis), or Myxobolus cerebralis (whirling disease). In addition, 30 salmon fillets were tested on May 17, 2012 for the myxosporean parasite, Kudoa thrysites, using real time PCR. No pathogens were detected at any point, and furthermore no clinical signs resembling diseases associated with important viral or bacterial pathogens were noted during the entire study period, and no external parasites, such as Lepeophtheirus salmonis (sea lice), were observed at any point.
aQuaculture DruGs anD cheMicals - No chemicals or drugs besides sodium chloride were used to treat the salmon during the 12-month production growout trial. Sodium chloride was used to relieve stress and control fungus during the production trial. Hydrogen peroxide was used occasionally in the incubation and fry culture stages to control fungus before the trial began. No vaccines were administered, and no formalin or other harsh chemotherapeutic agents were used during any phase of the growout trial. No antibiotic- or pesticide-containing feed was administered to any of the salmon during the growout trial.

43
Fish exclusion - Fish containment is desired to protect the captive fish populations, but also to prevent fish escape and potential interbreeding with wild populations, or the exchange of pathogens between wild and farmed populations. Land-based closed-containment systems confine eggs and fish within solid-wall vessels to create optimized conditions for fish husbandry. However, these solid walled vessels must also include inlet ports, drains, and overflows to allow for water exchange. Thus, if a barrier across a drain/overflow fails, it is always possible for eggs or fish to escape out of their primary containment vessel with the water flow. Three physical barriers, each with openings sized small enough to exclude the life-stage of fish under culture, were located across the path that water must flow from the fish/egg culture vessel to the facility discharge. This approach is usually accepted as adequate redundancy to eliminate fish escapes. At TCFFI, these barriers were designed and maintained using standard operating practices to
prevent the eggs or fish from exiting with the water discharge, or failing that, to recognize and remove escaped fish if observed in front of the second or third barriers. Screens and physical filters were used for fish exclusion, because they allow for water passage if properly maintained. Problems occur if the screens become fouled or are hydraulically overwhelmed, allowing water flow to overtop or bypass the barrier. Thus, standard operating practices are used to observe for escapees and to maintain the barriers.
No Atlantic salmon from the production trial were observed to escape from the growout tank. Any fish that escaped the production tank would be trapped in the downstream fish exclusion area (Figure 33). No salmon were observed in the exclusion filter area.
Waste loaDs – The water recirculating systems had two discrete discharges, the largest discharge volume is the overflow from the grow-out system, which is equal to the makeup water added to the sump pump
Figure 33. The exclusion pit area where any system escapees would be detained. No fish were found in the fish exclusion area.
44
and averaged 66 L/min (17.5 gpm) over the entire production cycle, i.e., approximately 1.5% of the total flow recirculating through the system. The water quality in the overflow was approximately the same as the mean water quality reported in Table 10. The smaller volume discharge is the drum filter backwash flow and sediment trap flushing flow from the base of the radial flow settler (Figure 8); these flows are combined under slab in a single pipe. Reduced scale (1/12) research (Davidson et al., 2013) indicates that the combined drum filter and settler flushing flows average 0.5% of the total recirculating flow, i.e., 23 L/min (6 gpm). Approximately 22% of the feed ends up as suspended solids that are flushed from the system in the two discrete discharges (Davidson and Summerfelt, 2005), i.e., the relatively clean overtopping flow (which averages about 1.2 mg/L TSS and 0.1 kg TSS/day) and the combined backwash flow. The combined drum filter and settler flushing flows contains a mass that averaged 4.7 kg TSS/day with a concentration of 142 mg/L TSS (based on a mass balance estimate); this backwash and flushing flow was treated and dewatered on site using gravity thickening settlers described by Sharrer et al. (2010) to produce a slurry of approximately 9% dry weight. The biosolids capture efficiency averages 92% across the gravity thickening settlers (Sharrer et al., 2010). Thus, approximately 4.3 kg TSS/day (dry weight) – or 90% of the solids – were captured in the gravity thickening settlers, while approximately 0.5 kg/day – 10% of the solids – were contained in the supernatant overflowing the gravity thickening settlers and the overflow from the growout system. This combined flow was treated with other fish production system flows across a microscreen drum filter and a pair of fish exclusion barriers. The drum filter and fish exclusion barriers treat all water exiting the production facilities before discharge to the receiving water. After drum filtration, total
biosolids waste capture was estimated to have exceeded 90% over the duration of the study. The final outfall then discharges into the Rockymarsh Run watershed in Jefferson County, WV, which is a tributary to the Potomac River and flows into the Chesapeake Bay.
The biosolids captured were removed as a slurry (9% dry weight) by a contract hauler. The nitrogen and phosphorus contained in these biosolids can thus be reclaimed as a soil amendment when applied at agronomic rates to row crops or hay fields.
econoMic FeasiBility - The technical and economic feasibility of a commercial-scale, land-based closed containment farm for Atlantic salmon was evaluated through a concept-level design and associated costing for a 3,300 metric ton (mt) facility. Technical feasibility is based on the data developed by The Freshwater Institute’s growout trials of Atlantic salmon over the last three years. Thermal growth coefficient values were based on data currently being collected in a growout trial with Cascade strain Atlantic salmon (purchased as eyed-eggs from Icicle Seafoods), because the Cascade strain fish grew significantly faster in freshwater than the St John River strain fish. Growout trial data, specifically feed conversion, mortality, head-on gutted yield, and other performance indicators, were used to develop a biological plan for a 3,300 mt facility. Bioplanning includes predicting fish growth at each lifestage and determining all locations and movements of fish throughout the lifecycle.
Completion of the bioplan allowed the progression to a concept-level facility design including water recirculation system designs for each fish grouping developed in the bioplan. Concept designs for fry, smolt, pre-growout, and growout rearing areas, as well as a final purging system, were completed using water quality criteria

45
required for optimal growth and successfully demonstrated in The Freshwater Institute growout trials.
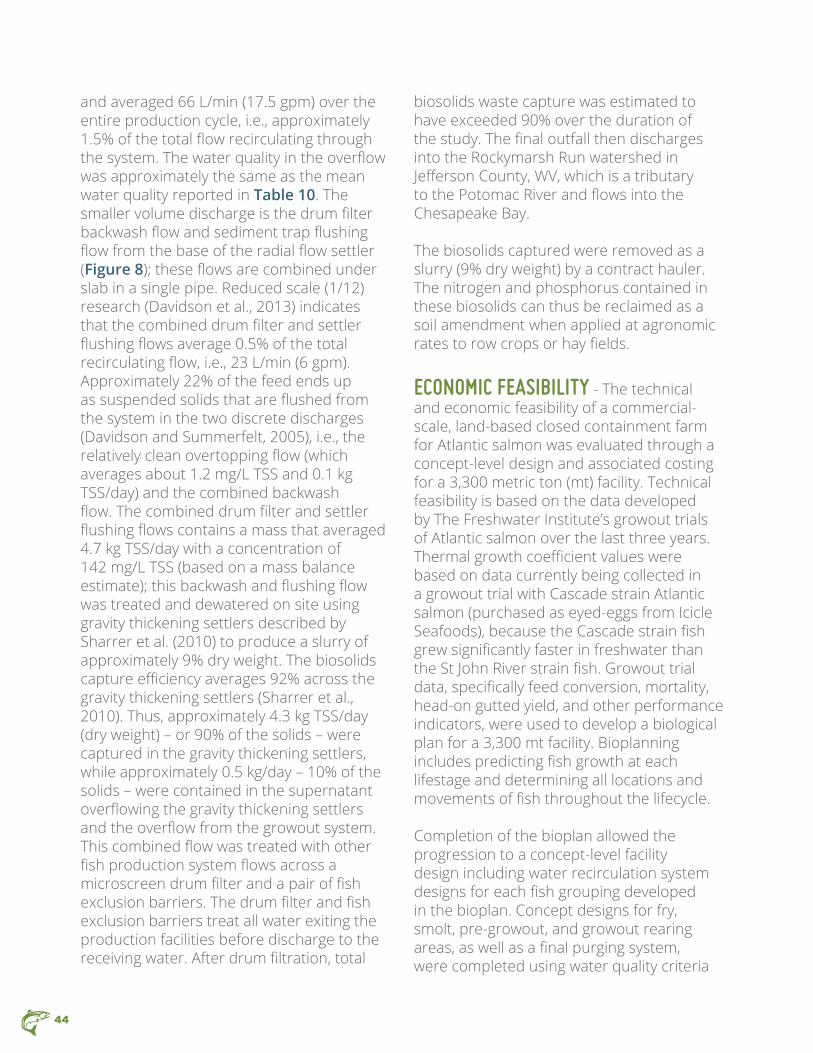
concePt DesiGn – The concept-level design developed for the 3,300 mt facility included independent designs for egg incubation, fry rearing, smolt rearing, pre-growout rearing, growout rearing and final purging (Figures 34 and 35). Each design included multiple recirculation modules to allow for staging and movement of fish throughout the facility. The following table (Table 11) summarizes the concept-level design characteristics for each rearing area:
Water supply required for the entire 3,300 mt facility was based on maintaining no more than 75 mg/L nitrate-nitrogen at maximum loading in each recirculation system, assuming no passive denitrification. The amount of water supply needed to maintain this nitrate-nitrogen level in the recirculation systems was calculated to be 7.6 m3/min, including 1.1 m3/min for purging. This water supply requirement could be reduced by reusing the 1.1 m3/min from final purging as water supply to the growout systems and by including the effect of passive denitrification found to occur in fluidized sand biofilters; the overall effect would be to reduce the water supply required by 50% to 3.8 m3/min.
Table 11. Concept-level design characteristics for each rearing area in a 3,300 mt atlantic salmon farm.
rearing area recirculation tanks per tank Diameter total rearing Module recirc Modules Module by Depth Volume Flowrate
Fry rearing 2 18 2 m by 1 m 114 m3 1.5 m3/min
Smolt rearing 2 4 9 m by 2 m 1,018 m3 11.4 m3/min
Pre-growout rearing 3 4 10 m by 3 2,827 m3 22 m3/min
growout rearing 8 5 16 m by 4.25 m 34,180 m3 94.6 m3/min
Final Purging 1 2 16 m by 4.25 m 1,709 m3 37.9 m3/min
46
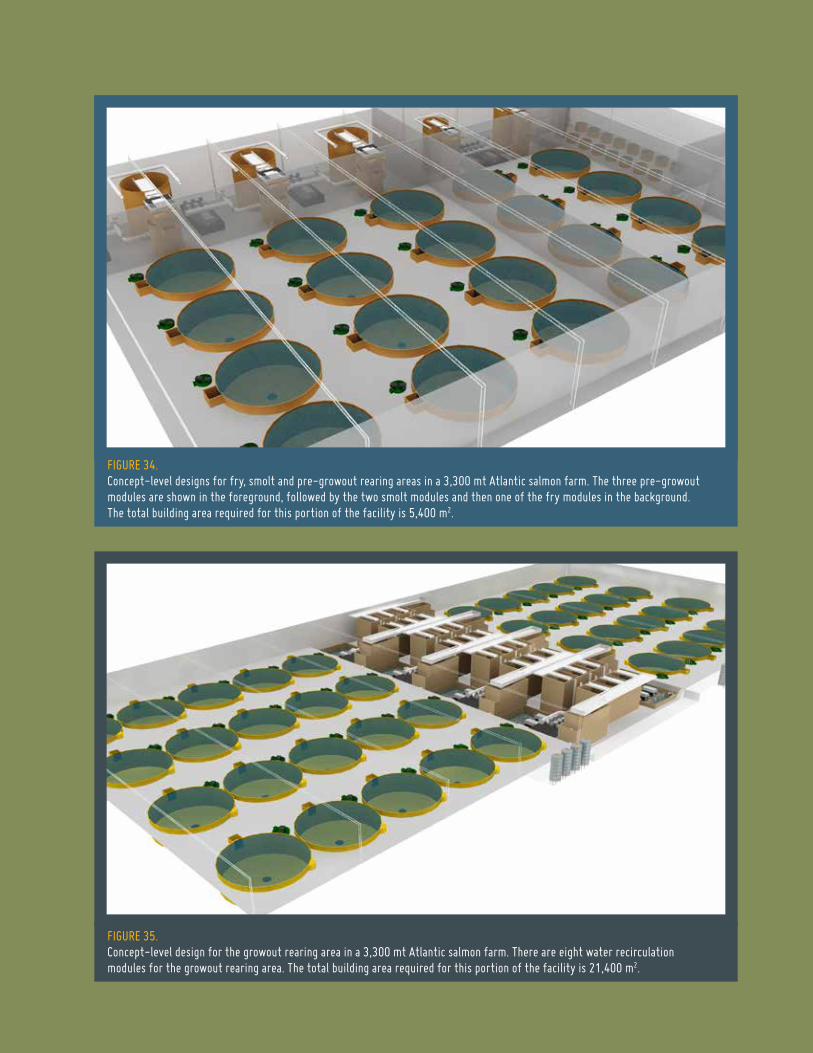
Figure 35. Concept-level design for the growout rearing area in a 3,300 mt atlantic salmon farm. There are eight water recirculation modules for the growout rearing area. The total building area required for this portion of the facility is 21,400 m2.
Figure 34. Concept-level designs for fry, smolt and pre-growout rearing areas in a 3,300 mt atlantic salmon farm. The three pre-growout modules are shown in the foreground, followed by the two smolt modules and then one of the fry modules in the background. The total building area required for this portion of the facility is 5,400 m2.
47
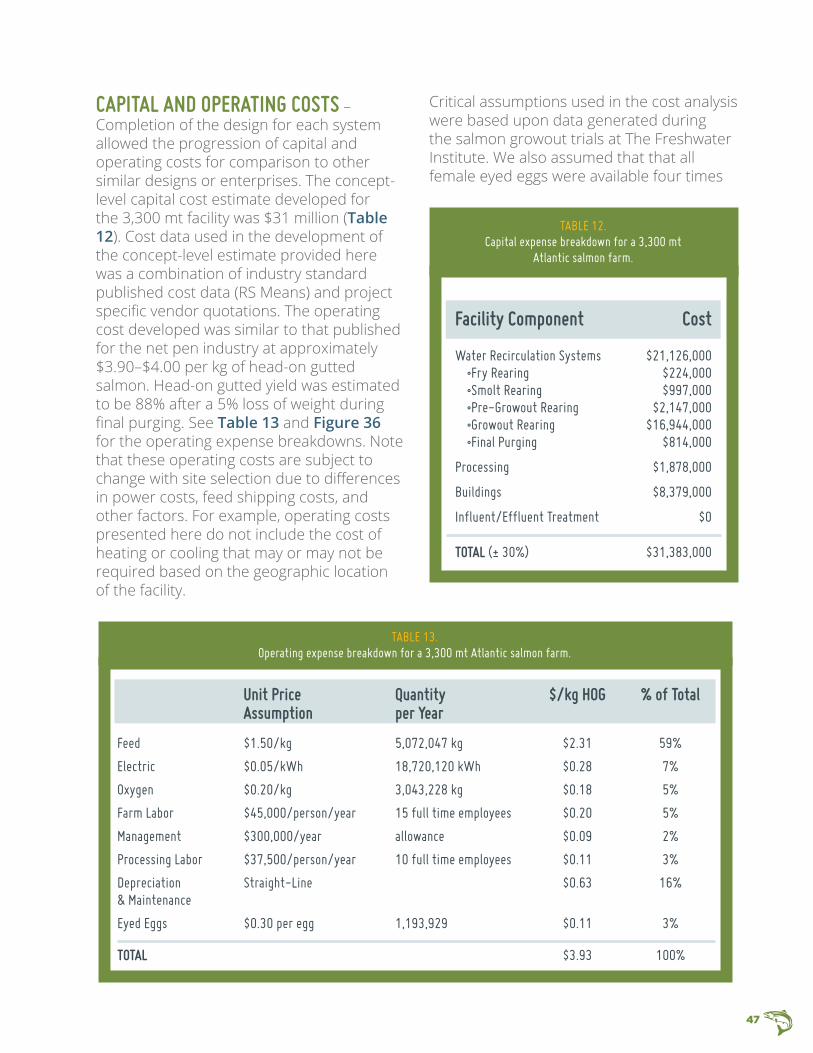
caPital anD oPeratinG costs – Completion of the design for each system allowed the progression of capital and operating costs for comparison to other similar designs or enterprises. The concept-level capital cost estimate developed for the 3,300 mt facility was $31 million (Table 12). Cost data used in the development of the concept-level estimate provided here was a combination of industry standard published cost data (RS Means) and project specific vendor quotations. The operating cost developed was similar to that published for the net pen industry at approximately $3.90–$4.00 per kg of head-on gutted salmon. Head-on gutted yield was estimated to be 88% after a 5% loss of weight during final purging. See Table 13 and Figure 36 for the operating expense breakdowns. Note that these operating costs are subject to change with site selection due to differences in power costs, feed shipping costs, and other factors. For example, operating costs presented here do not include the cost of heating or cooling that may or may not be required based on the geographic location of the facility.
Critical assumptions used in the cost analysis were based upon data generated during the salmon growout trials at The Freshwater Institute. We also assumed that that all female eyed eggs were available four times
Table 12. Capital expense breakdown for a 3,300 mt
atlantic salmon farm.
Facility component cost
Water recirculation Systems $21,126,000•Fry Rearing $224,000 •Smolt Rearing $997,000 •Pre-Growout Rearing $2,147,000 •Growout Rearing $16,944,000 •Final Purging $814,000
Processing $1,878,000
buildings $8,379,000
influent/effluent Treatment $0
total (± 30%) $31,383,000
Table 13. Operating expense breakdown for a 3,300 mt atlantic salmon farm.
unit Price Quantity $/kg hoG % of total assumption per year
Feed $1.50/kg 5,072,047 kg $2.31 59%
electric $0.05/kWh 18,720,120 kWh $0.28 7%
Oxygen $0.20/kg 3,043,228 kg $0.18 5%
Farm labor $45,000/person/year 15 full time employees $0.20 5%
Management $300,000/year allowance $0.09 2%
Processing labor $37,500/person/year 10 full time employees $0.11 3%
Depreciation Straight-line $0.63 16% & Maintenance
eyed eggs $0.30 per egg 1,193,929 $0.11 3%
total $3.93 100%
48
$0.00
$1.00
$2.00
$3.00
$4.00
$5.00
$6.00
0.90 1.10 1.30 1.50 1.70 1.90 2.10Cost
of P
rodu
ctio
n in
$ p
er k
g of
Hea
d-on
Gut
ted
Prod
uct
Feed Conversion Ratio during Growout Phase(500 g to 5000 g)
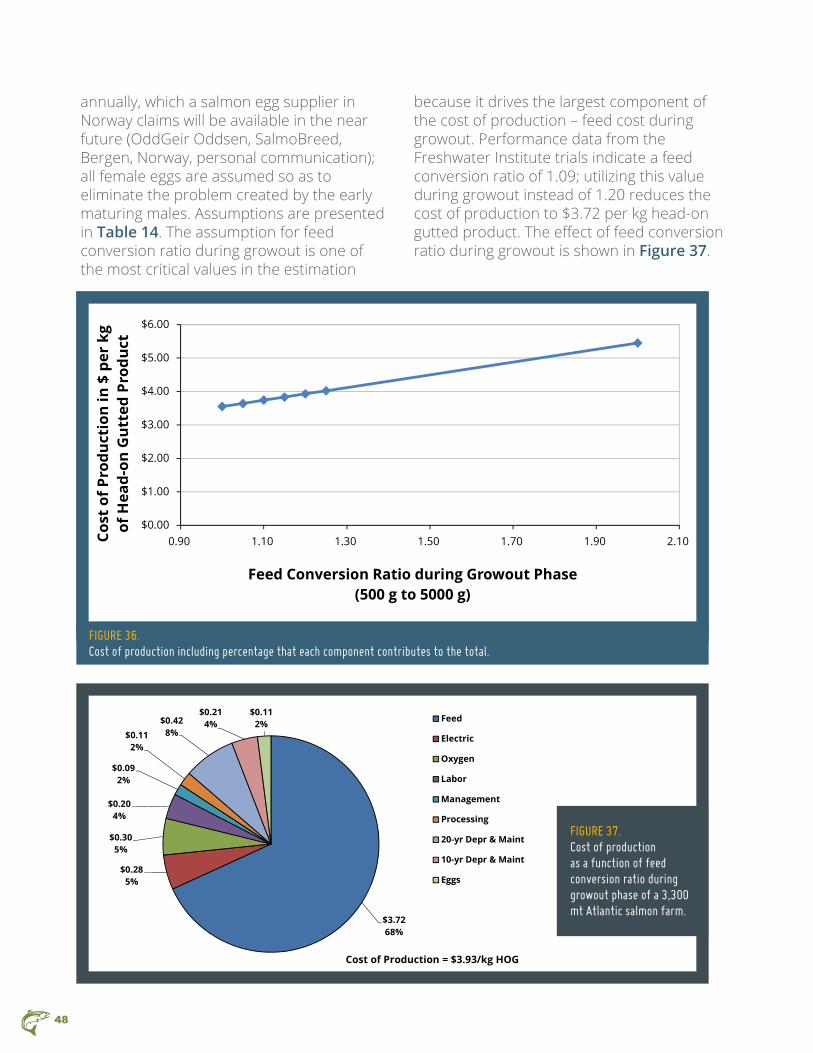
Figure 36. Cost of production including percentage that each component contributes to the total.
$3.72 68%
$0.28 5%
$0.30 5%
$0.20 4%
$0.09 2%
$0.11 2%
$0.42 8%
$0.21 4%
$0.11 2% Feed
Electric
Oxygen
Labor
Management
Processing
20-yr Depr & Maint
10-yr Depr & Maint
Eggs
Cost of Production = $3.93/kg HOG
annually, which a salmon egg supplier in Norway claims will be available in the near future (OddGeir Oddsen, SalmoBreed, Bergen, Norway, personal communication); all female eggs are assumed so as to eliminate the problem created by the early maturing males. Assumptions are presented in Table 14. The assumption for feed conversion ratio during growout is one of the most critical values in the estimation
because it drives the largest component of the cost of production – feed cost during growout. Performance data from the Freshwater Institute trials indicate a feed conversion ratio of 1.09; utilizing this value during growout instead of 1.20 reduces the cost of production to $3.72 per kg head-on gutted product. The effect of feed conversion ratio during growout is shown in Figure 37.
Figure 37. Cost of production as a function of feed conversion ratio during growout phase of a 3,300 mt atlantic salmon farm.

49
Table 14. Critical assumptions used in the analysis for a 3,300 mt atlantic salmon farm.
Parameter assumed Value
Feed Conversion ratio – Fry 0.75
Feed Conversion ratio – Smolt 0.90
Feed Conversion ratio – Pre-growout 1.10
Feed Conversation ratio – growout 1.20
Thermal growth Coefficient – Fry 1.25
Thermal growth Coefficient – Smolt 1.40
Thermal growth Coefficient – Pre-growout 2.00
Thermal growth Coefficient – growout 2.30
Purge Weight loss 5%
Head-On gutted Yield 88%
This growout trial served as a proof of concept, suggesting that it is biologically and technically feasible to culture Atlantic salmon from post-smolt (approximately 340 g) to harvest size over twelve months in a land-based, freshwater, closed-containment system, at least when at a suitable commercial scale. These fish achieved a 4.6 kg mean size by almost exactly 2 years post-hatch. Survival during the growout phase was approximately 90% and feed conversion was 1.09:1. No obligate fish pathogens or sea lice were detected and no antibiotics, pesticides, or harsh chemotherapeutics were used. The fish were also never vaccinated.
Unfortunately, the majority (approximately 80%) of male salmon were observed to reach sexual maturity within the 24-month growout trial. The maturing males were readily identifiable based on observable morphometric and coloration characteristics and were harvested early
and sent to processing as a hot smoked product. However, the fillet color and yield of maturing males are lower than for non-mature fish. This is a serious constraint to production in land-based closed-containment systems. Fortunately, previous research at The Conservation Fund Freshwater Institute indicates that an all-female strain (the Gaspe strain) can be produced to eliminate early maturing male salmon. Thus, an all-female source of Atlantic salmon will have to be developed to supply eyed eggs to land-based closed-containment systems that intend to produce food-size fish. Developing an all-female egg supply is not considered a huge barrier, as several other species are currently commercially available as all-female eyed eggs, including rainbow trout and Arctic char. In addition, the Atlantic salmon egg source should provide eyed eggs at least once every 6 months to maximize the production capacity within land-based closed-containment systems.
Conclusions
50
Growout trial data, specifically thermal growth coefficient, feed conversion, mortality, head-on gutted yield, and other performance indicators, were used to develop a biological plan, system design, and economic assessment for a 3,300 mt facility. Assuming that all female eyed eggs were available four times annually, the capital cost for this egg to plate facility was estimated to be approximately $31 million and its production cost was estimated at $3.90-$4.00 per kg of head on gutted salmon.
FolloW-uP stuDiesAt the time that this final report was prepared (September 2012), two additional Atlantic salmon growout trials were underway and a third is being planned.
GorDon anD Betty Moore FounDation (GBMF) FunDeD trial - The next Atlantic salmon growout trial was funded by the Gordon and Betty Moore Foundation (Palo Alto, CA) and investigates culturing the Cascade strain fish (purchased as eyed eggs from Icicle Seafoods) at densities up to 100 kg/m3. The growout system was stocked with extra salmon so that the population would reach 100 kg/m3 when the salmon average 2.6 kg in August of 2012. At this time, approximately 5.5 mt of maturing male salmon were harvested at a mean size of 2.6 kg, which removed 38% of the population. The remaining salmon population is being cultured up to a density of 100 kg/m3, which is expected to be reached when the fish achieve a mean size of approximately 4.2 kg in December of 2012. We expect to harvest another 15-16 mt of 4-5 kg mean size premium salmon from December 2012 through February 2013, which should bring the total harvest of Atlantic salmon to 20-22 mt from a single cohort from the 150 m3 culture tank. To date, the Cascade strain Atlantic salmon
has been the fastest growing strain that we have cultured in freshwater; it is expected to reach market size 2-3 months sooner than the St John River strain fish.
asF anD GBMF FunDeD trial - The eggs for this GBMF and ASF funded trial arrived in March of 2012 and the fish are currently undergoing a 6-week artificial winter photoperiod (consisting of days with 12 hours light and 12 hours dark). This trial is intended to test the best freshwater selected Atlantic salmon germplasm, purchased as eyed eggs, and cultured under two distinct photoperiod regimes during their first 12 months, before being cultured to food-size within a commercial-scale, freshwater, land-based, closed-containment system. The two photoperiod regimes to be tested are intended to determine if using an 18-hr photoperiod before and after an S0 winter photoperiod can reduce grilse rates in male salmon compared to the standard 24-hr continuous photoperiod. Recent research from Norway (Fjelldal et al., 2011) suggests that the proportion of male salmon maturing early after smoltification is at least partially dependent upon photoperiod. In this Norwegian study, fewer male salmon matured early when cultured under an 18hr light and 6hr dark photoperiod immediately before the winter photoperiod, when compared against fish raised with a 24-hr continuous photoperiod before and after the winter photoperiod.
aDDitional stuDies – In the fall of 2012, we gained approval from the US Fish and Wildlife Service to import certified pathogen free eggs from an egg supplier in Norway. The goal of this study would be to determine the growth and grilse rates of these selected diploid stocks when cultured in freshwater land-based closed-containment systems. We are still working to identify funding for this future research.

51
All experimental protocols and methods were in compliance with the Animal Welfare Act (9CFR) requirements and were approved by The Freshwater Institute’s Institutional Animal Care and Use Committee.
This growout trial was supported by the Atlantic Salmon Federation. Research on Gill Na/K ATPase activity was conducted earlier using support by the USDA Agricultural Research Service under Agreement No. 59-1930-5-510. Dr. Steve McCormick (USGS,
MA) provided the Gill Na/K ATPase activity analysis. Research on post-harvest fillet attributes (with and without purging) was supported by the Gordon and Betty Moore Foundation (Palo Alto, CA) under a grant titled, “Salmon Recirculating Aquaculture Systems Optimization.” Dr. P. Brett Kenney and his associates in the Food Science Department at West Virginia University provided the fillet color, yield, proximate composition, and fatty acid analysis.
References Burr, G.S., Wolters, W.R., Schrader, K.K. Summerfelt, S.T. (2012). Impact of depuration of earthy-musty off-flavors on fillet quality of Atlantic salmon, Salmo salar, cultured in a recirculating aquaculture system. Aquacultural Engineering 50, 28-36.
Davidson, J., Summerfelt, S.T. 2005. Solids removal from a coldwater recirculating system – comparison of a swirl separator and a radial-flow settler. Aquacultural Engineering 33, 47-61.
Davidson, J., Good, C., Barrows, F.T., Welsh, C., Kenney, P.B., Summerfelt, S.T. 2013. Comparing the effects of feeding a grain- or a fish meal-based diet on water quality, waste production, and rainbow trout Oncorhynchus mykiss performance within low exchange water recirculating aquaculture systems. Aquacultural Engineering 52, 45-57.
Fjelldal, P.G., Hansen, T., Huang, T.-S. 2011. Continuous light and elevated temperature can trigger maturation both during and immediately after smoltification in male Atlantic salmon (Salmo salar). Aquaculture 321, 93-100.
Sharrer, M.J., Rishel, K., Taylor, A., Vinci, B.J., Summerfelt, S.T. (2010). The cost and effectiveness of solids thickening technologies for treating backwash and recovering nutrients from intensive aquaculture systems. Bioresource Technologies 101, 6630-6641.
Summerfelt, S.T., Sharrer, M.J., Tsukuda, S.M., Gearheart, M. (2009). Process requirements for achieving full-flow disinfection of recirculating water using ozonation and UV irradiation. Aquacultural Engineering 40, 17-27.
Wolters, W.R. 2010. Sources of Phenotypic and Genetic Variation for Seawater Growthin Five North American Atlantic Salmon, Salmo salar, Stocks. Journal of The World Aquaculture Society 41 (3), 421-429.
Acknowledgements

Freshwater InstItute1098 Turner Rd
Shepherdstown, WV 25443Phone: (304) 876-2815
Fax: (304) 870-2208www.freshwaterinstitute.org
Related Documents