Welcome message from author
This document is posted to help you gain knowledge. Please leave a comment to let me know what you think about it! Share it to your friends and learn new things together.
Transcript
© 2009 International Monetary Fund January 2009 IMF Country Report No. 09/38
Burkina Faso: Third Review Under the Three-Year Arrangement Under the Poverty Reduction and Growth Facility—Staff Report; Press Release on the Executive Board Discussion In the context of the third review under the three-year arrangement under the Poverty Reduction and Growth Facility for Burkina Faso, the following documents have been released and are included in this package: • The staff report for the Third Review Under the Three-Year Arrangement Under the Poverty
Reduction and Growth Facility, prepared by a staff team of the IMF, following discussions that ended on October 1, 2008, with the officials of Burkina Faso on economic developments and policies. Based on information available at the time of these discussions, the staff report was completed on November 24, 2008. The views expressed in the staff report are those of the staff team and do not necessarily reflect the views of the Executive Board of the IMF.
• A Press Release summarizing the views of the Executive Board.
The documents listed below have been or will be separately released. Letter of Intent sent to the IMF by the authorities of Burkina Faso* Memorandum of Economic and Financial Policies by the authorities of Burkina Faso* Technical Memorandum of Understanding* *Also included in Staff Report The policy of publication of staff reports and other documents allows for the deletion of market-sensitive information.
Copies of this report are available to the public from
International Monetary Fund • Publication Services 700 19th Street, N.W. • Washington, D.C. 20431
Telephone: (202) 623-7430 • Telefax: (202) 623-7201 E-mail: [email protected] • Internet: http://www.imf.org
International Monetary Fund
Washington, D.C.
©International Monetary Fund. Not for Redistribution
This page intentionally left blank
©International Monetary Fund. Not for Redistribution
INTERNATIONAL MONETARY FUND
BURKINA FASO
Third Review Under the Three-Year Arrangement Under the Poverty Reduction and Growth Facility
Prepared by the African Department
(In consultation with other departments)
Approved by Thomas Krueger and Anthony Boote
November 24, 2008
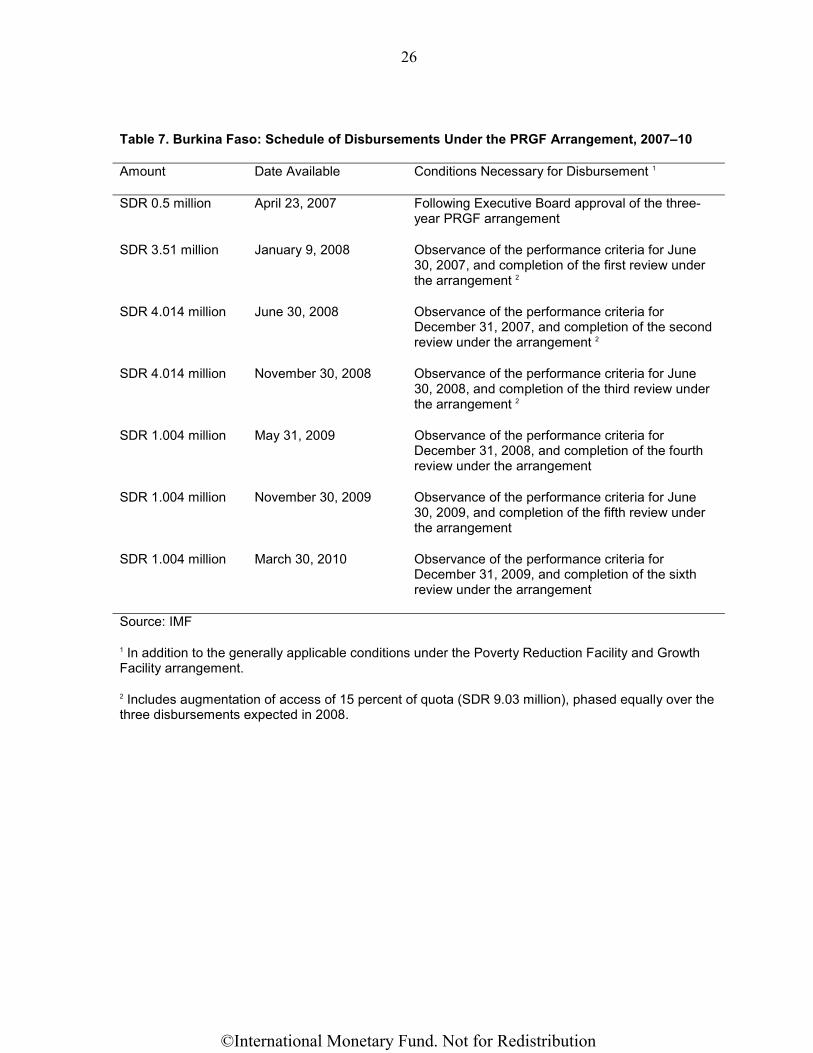
• PRGF Arrangement: The three-year PRGF arrangement was approved on April 23, 2007, with access of SDR 6.02 million. On January 9, 2008, the Executive Board approved SDR 9.03 million additional access (15 percent of quota), to help address the impact of higher world prices for oil and cotton. Outstanding loans amount to SDR 31.24 million (51.9 percent of quota).
• Program Review: This report recommends completion of the third review of the PRGF arrangement based on Burkina Faso’s performance and understandings reached on the macroeconomic and structural program.
• Mission: September 17–October 1, 2008, in Ouagadougou and Bobo Dioulasso. The mission met with Minister of Economy and Finance Lucien Noël Bembamba; Central Bank of West African States (BCEAO) National Director Bolo Sanou; other ministers and senior officials; and representatives of the private sector, labor unions, nongovernmental organizations, and development partners.
• Staff team: Mr. Funke (head), Mr. Basdevant, Mr. Yartey (all AFR), Mr. Arze del Granado (FAD), and Ms. Adenauer (resident representative). Mr. Tall (OED) attended the meetings.
©International Monetary Fund. Not for Redistribution
2
Contents Page
Executive Summary...................................................................................................................5
I. Program On Track Despite a Difficult Environment..............................................................6
II. Macroeconomic Prospects.....................................................................................................8
III. Economic and Structural Policies Through 2009 ..............................................................11 A. Macroeconomic Policy ...........................................................................................11 B. Fiscal Structural Reforms and Debt ........................................................................13 C. Other Structural Reforms ........................................................................................15
III. Program Issues and Risks ..................................................................................................17
IV. Staff Appraisal ...................................................................................................................17 Boxes 1. Short-Term Growth and Inflation Outlook ....................................................................9 2. Targeting of Temporary Food and Oil Price Measures .................................................14 Figures 1. Recent Economic Developments ...................................................................................7 2. Economic Outlook in a Regional Perspective .............................................................10 3. Structural Reform in the Financial Sector ...................................................................15 4. Structural Reform in the Cotton Sector .......................................................................16 5. Structural Reform in the Petroleum Sector..................................................................16 Tables 1. Selected Economic and Financial Indicators, 2007-11................................................19 2. Consolidated Operations of the Central Government, 2007-11...................................20 3. Monetary Survey, 2007-09 ..........................................................................................22 4. Balance of Payments, 2007-11 ....................................................................................23 5. Medium-Term Selected Economic and Financial Indicators, 2007-13 .......................24 6. Indicators of Capacity to Repay the Fund, 2006-15 ....................................................25 7. Schedule of Disbursements Under PRGF Arrangement, 2007-10 ..............................26 8. Poverty-Reducing Social Expenditures, 2001-09 ........................................................27 9. Selected Indicators on the Millennium Development Goals, 1990-2006 ....................28
©International Monetary Fund. Not for Redistribution
Underline
Underline
Underline
Underline
Underline
Underline
Underline
Underline
Underline
Underline
Underline
Underline
Underline
Underline
Underline
Underline
Underline
Underline
Underline
Underline
Underline
Underline
Underline
Underline
Underline
3
Appendix I: Letter of Intent .....................................................................................................29
Attachment I. Memorandum on Economic and Financial Policies for End-2008-09....................................................................................................31
Attachment II. Technical Memorandum of Understanding........................................44 Appendix II. Debt Sustainability Analysis .............................................................................52
©International Monetary Fund. Not for Redistribution
Underline
Underline
Underline
Underline
4
List of Acronyms BCEAO Bank of West African States CPIA Country Policy and Institutional Assessment DSA Debt Sustainability Analysis FSAP Financial Sector Assessment Program ICAC International Cotton Advisory Committee LTO Large taxpayer office MEFP Memorandum of Economic and Financial Policies MTO Medium taxpayer office NPV Net present value PC Performance criterion PFM Public financial management PRGF Poverty Reduction and Growth Facility PRSP Poverty Reduction Strategy Paper REER Real effective exchange rate SOFITEX Société Burkinabè des Fibres Textiles SONABHY Société Nationale Burkinabè d’Hydrocarbures SONABEL Société Nationale D’Électricité du Burkina SSA Sub-Saharan Africa VAT Value-added tax WAEMU West African Economic and Monetary Union WEO World Economic Outlook
©International Monetary Fund. Not for Redistribution
5
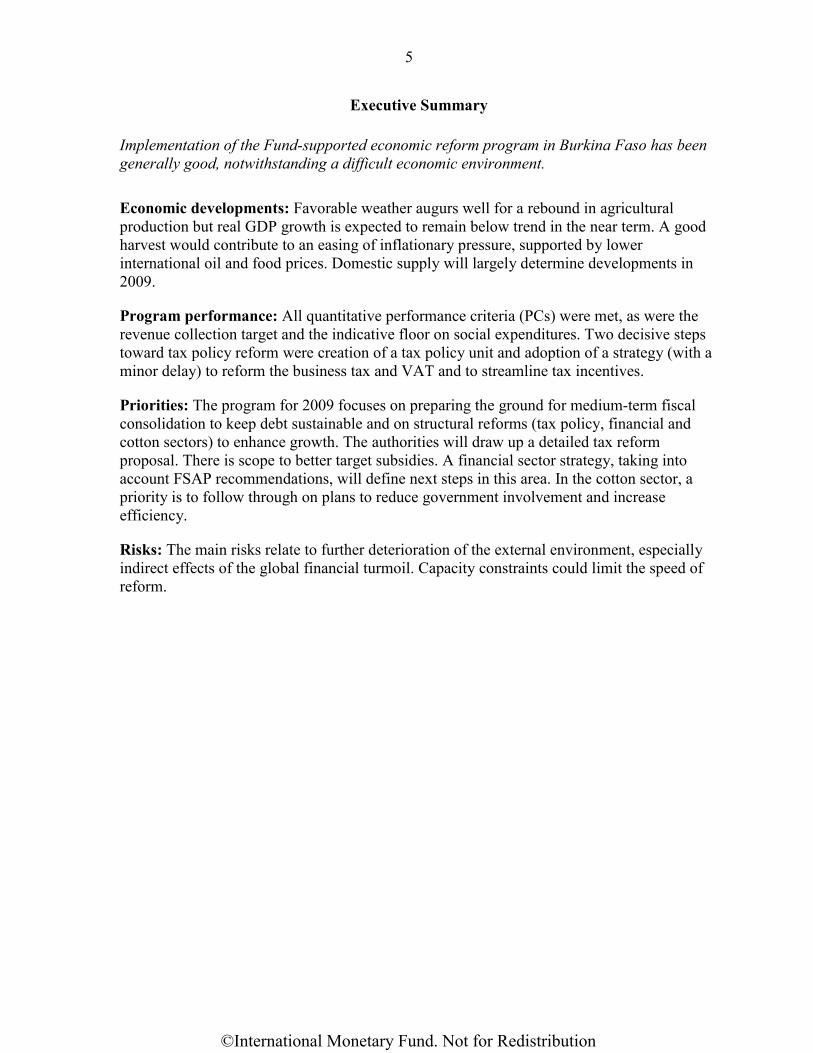
Executive Summary Implementation of the Fund-supported economic reform program in Burkina Faso has been generally good, notwithstanding a difficult economic environment. Economic developments: Favorable weather augurs well for a rebound in agricultural production but real GDP growth is expected to remain below trend in the near term. A good harvest would contribute to an easing of inflationary pressure, supported by lower international oil and food prices. Domestic supply will largely determine developments in 2009.
Program performance: All quantitative performance criteria (PCs) were met, as were the revenue collection target and the indicative floor on social expenditures. Two decisive steps toward tax policy reform were creation of a tax policy unit and adoption of a strategy (with a minor delay) to reform the business tax and VAT and to streamline tax incentives.
Priorities: The program for 2009 focuses on preparing the ground for medium-term fiscal consolidation to keep debt sustainable and on structural reforms (tax policy, financial and cotton sectors) to enhance growth. The authorities will draw up a detailed tax reform proposal. There is scope to better target subsidies. A financial sector strategy, taking into account FSAP recommendations, will define next steps in this area. In the cotton sector, a priority is to follow through on plans to reduce government involvement and increase efficiency.
Risks: The main risks relate to further deterioration of the external environment, especially indirect effects of the global financial turmoil. Capacity constraints could limit the speed of reform.
©International Monetary Fund. Not for Redistribution
6
I. PROGRAM ON TRACK DESPITE A DIFFICULT ENVIRONMENT
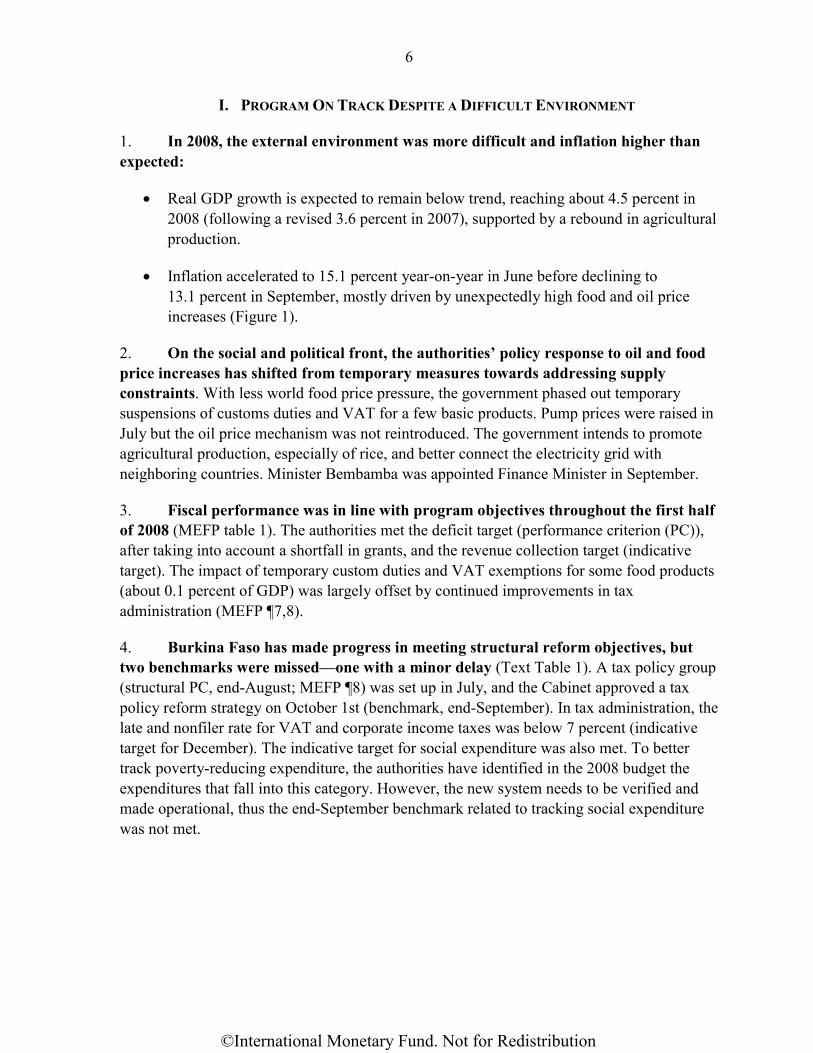
1. In 2008, the external environment was more difficult and inflation higher than expected:
• Real GDP growth is expected to remain below trend, reaching about 4.5 percent in 2008 (following a revised 3.6 percent in 2007), supported by a rebound in agricultural production.
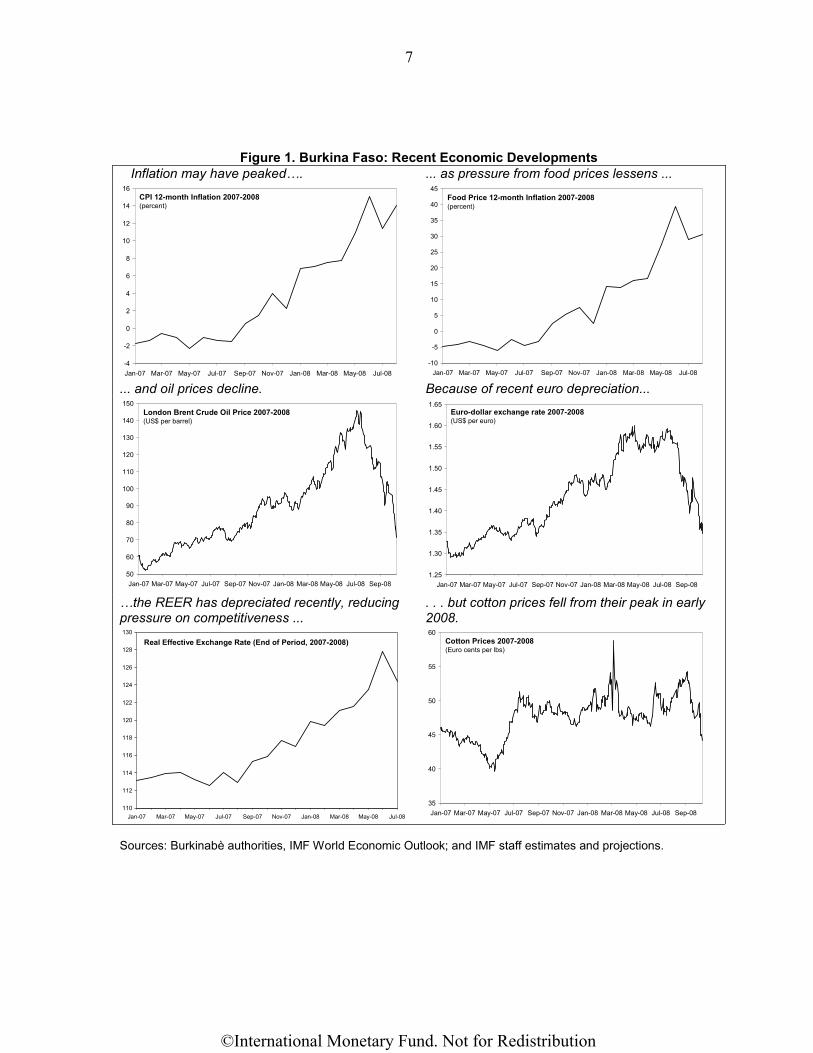
• Inflation accelerated to 15.1 percent year-on-year in June before declining to 13.1 percent in September, mostly driven by unexpectedly high food and oil price increases (Figure 1).
2. On the social and political front, the authorities’ policy response to oil and food price increases has shifted from temporary measures towards addressing supply constraints. With less world food price pressure, the government phased out temporary suspensions of customs duties and VAT for a few basic products. Pump prices were raised in July but the oil price mechanism was not reintroduced. The government intends to promote agricultural production, especially of rice, and better connect the electricity grid with neighboring countries. Minister Bembamba was appointed Finance Minister in September.
3. Fiscal performance was in line with program objectives throughout the first half of 2008 (MEFP table 1). The authorities met the deficit target (performance criterion (PC)), after taking into account a shortfall in grants, and the revenue collection target (indicative target). The impact of temporary custom duties and VAT exemptions for some food products (about 0.1 percent of GDP) was largely offset by continued improvements in tax administration (MEFP ¶7,8).
4. Burkina Faso has made progress in meeting structural reform objectives, but two benchmarks were missed—one with a minor delay (Text Table 1). A tax policy group (structural PC, end-August; MEFP ¶8) was set up in July, and the Cabinet approved a tax policy reform strategy on October 1st (benchmark, end-September). In tax administration, the late and nonfiler rate for VAT and corporate income taxes was below 7 percent (indicative target for December). The indicative target for social expenditure was also met. To better track poverty-reducing expenditure, the authorities have identified in the 2008 budget the expenditures that fall into this category. However, the new system needs to be verified and made operational, thus the end-September benchmark related to tracking social expenditure was not met.
©International Monetary Fund. Not for Redistribution
7
Figure 1. Burkina Faso: Recent Economic Developments
Inflation may have peaked…. ... as pressure from food prices lessens ...
-4
-2
0
2
4
6
8
10
12
14
16
Jan-07 Mar-07 May-07 Jul-07 Sep-07 Nov-07 Jan-08 Mar-08 May-08 Jul-08
CPI 12-month Inflation 2007-2008(percent)
-10
-5
0
5
10
15
20
25
30
35
40
45
Jan-07 Mar-07 May-07 Jul-07 Sep-07 Nov-07 Jan-08 Mar-08 May-08 Jul-08
Food Price 12-month Inflation 2007-2008(percent)
... and oil prices decline. Because of recent euro depreciation...
50
60
70
80
90
100
110
120
130
140
150
Jan-07 Mar-07 May-07 Jul-07 Sep-07 Nov-07 Jan-08 Mar-08 May-08 Jul-08 Sep-08
London Brent Crude Oil Price 2007-2008(US$ per barrel)
1.25
1.30
1.35
1.40
1.45
1.50
1.55
1.60
1.65
Jan-07 Mar-07 May-07 Jul-07 Sep-07 Nov-07 Jan-08 Mar-08 May-08 Jul-08 Sep-08
Euro-dollar exchange rate 2007-2008(US$ per euro)
…the REER has depreciated recently, reducing pressure on competitiveness ...
. . . but cotton prices fell from their peak in early 2008.
Real Effective Exchange Rate (End of Period, 2007-2008)
110
112
114
116
118
120
122
124
126
128
130
Jan-07 Mar-07 May-07 Jul-07 Sep-07 Nov-07 Jan-08 Mar-08 May-08 Jul-08 35
40
45
50
55
60
Jan-07 Mar-07 May-07 Jul-07 Sep-07 Nov-07 Jan-08 Mar-08 May-08 Jul-08 Sep-08
Cotton Prices 2007-2008(Euro cents per lbs)
Sources: Burkinabè authorities, IMF World Economic Outlook; and IMF staff estimates and projections.
©International Monetary Fund. Not for Redistribution
8
Text Table 1. Status of Structural Reforms and Conditionality August — December
2008
Measures Timing Conditionality Status
Tax policy
Set up a tax policy unit in the Ministry of Finance to formulate tax reforms and supervise their implementation.
August 31, 2008
PC (third review)
Met
Secure Cabinet approval of a comprehensive tax policy reform strategy.
September 30, 2008
Benchmark (third review)
Not met. Done on October 1st
Customs administration
During the fourth quarter of 2008, assign at least 30 percent of customs declarations to the green and blue channels and keep the percentage of declarations selected but assigned for further controls by individual inspectors to less than 10 percent.
December 31, 2008
Benchmark (fourth review)
In progress (MFEP ¶8)
Tax administration
Reduce the large taxpayer nonfiler rate to 7 percent December 31, 2008
Indicative target (fourth review)
6 percent as of June 30 (MEFP ¶8)
Public financial management and governance
Introduce a system for tracking poverty-reducing expenditures in order to track all self-financed spending except for personnel.
September 30, 2008
Benchmark (third review)
Not met, but progress has been made
Develop an action plan for improving the effectiveness of ex ante and ex post expenditure controls, including elimination of redundant procedures.
December 31, 2008
Benchmark (fourth review)
In progress (MEFP ¶23)
II. MACROECONOMIC PROSPECTS
5. The near-term outlook is mixed. While there are some signs of a near-term recovery, supported by a good harvest, external developments constraint growth prospects. Real GDP growth is expected to remain below trend. Lower international oil and food prices bode well for an easing of inflationary pressure (Box 1, Figure 2, Tables 1–4).
6. There are important downside risks, related to the impact of the global financial turmoil. The direct impact of the global financial market turmoil has so far been limited. The baseline scenario incorporates some dampening impact of slowing global growth and less
©International Monetary Fund. Not for Redistribution
9
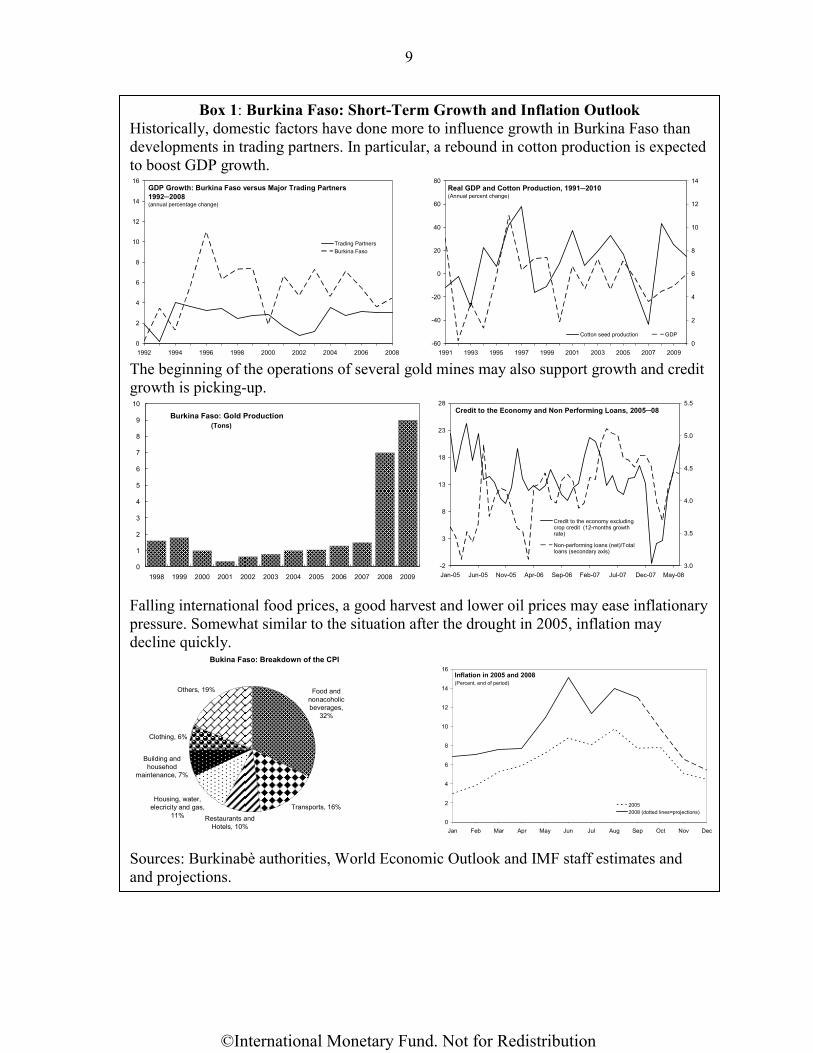
Box 1: Burkina Faso: Short-Term Growth and Inflation Outlook Historically, domestic factors have done more to influence growth in Burkina Faso than developments in trading partners. In particular, a rebound in cotton production is expected to boost GDP growth.
GDP Growth: Burkina Faso versus Major Trading Partners 1992─2008(annual percentage change)
0
2
4
6
8
10
12
14
16
1992 1994 1996 1998 2000 2002 2004 2006 2008
Trading PartnersBurkina Faso
Real GDP and Cotton Production, 1991─2010(Annual percent change)
-60
-40
-20
0
20
40
60
80
1991 1993 1995 1997 1999 2001 2003 2005 2007 20090
2
4
6
8
10
12
14
Cotton seed production GDP
The beginning of the operations of several gold mines may also support growth and credit growth is picking-up.
Burkina Faso: Gold Production (Tons)
0
1
2
3
4
5
6
7
8
9
10
1998 1999 2000 2001 2002 2003 2004 2005 2006 2007 2008 2009
Credit to the Economy and Non Performing Loans, 2005─08
-2
3
8
13
18
23
28
Jan-05 Jun-05 Nov-05 Apr-06 Sep-06 Feb-07 Jul-07 Dec-07 May-083.0
3.5
4.0
4.5
5.0
5.5
Credit to the economy excludingcrop credit (12-months growthrate)
Non-performing loans (net)/Totalloans (secondary axis)
Falling international food prices, a good harvest and lower oil prices may ease inflationary pressure. Somewhat similar to the situation after the drought in 2005, inflation may decline quickly.
Bukina Faso: Breakdown of the CPI
Food and nonacoholic beverages,
32%
Others, 19%
Clothing, 6%
Building and househod
maintenance, 7%
Housing, water, elecricity and gas,
11% Restaurants and Hotels, 10%
Transports, 16%
Inflation in 2005 and 2008(Percent, end of period)
0
2
4
6
8
10
12
14
16
Jan Feb Mar Apr May Jun Jul Aug Sep Oct Nov Dec
20052008 (dotted lines=projections)
Sources: Burkinabè authorities, World Economic Outlook and IMF staff estimates and and projections.
©International Monetary Fund. Not for Redistribution
10
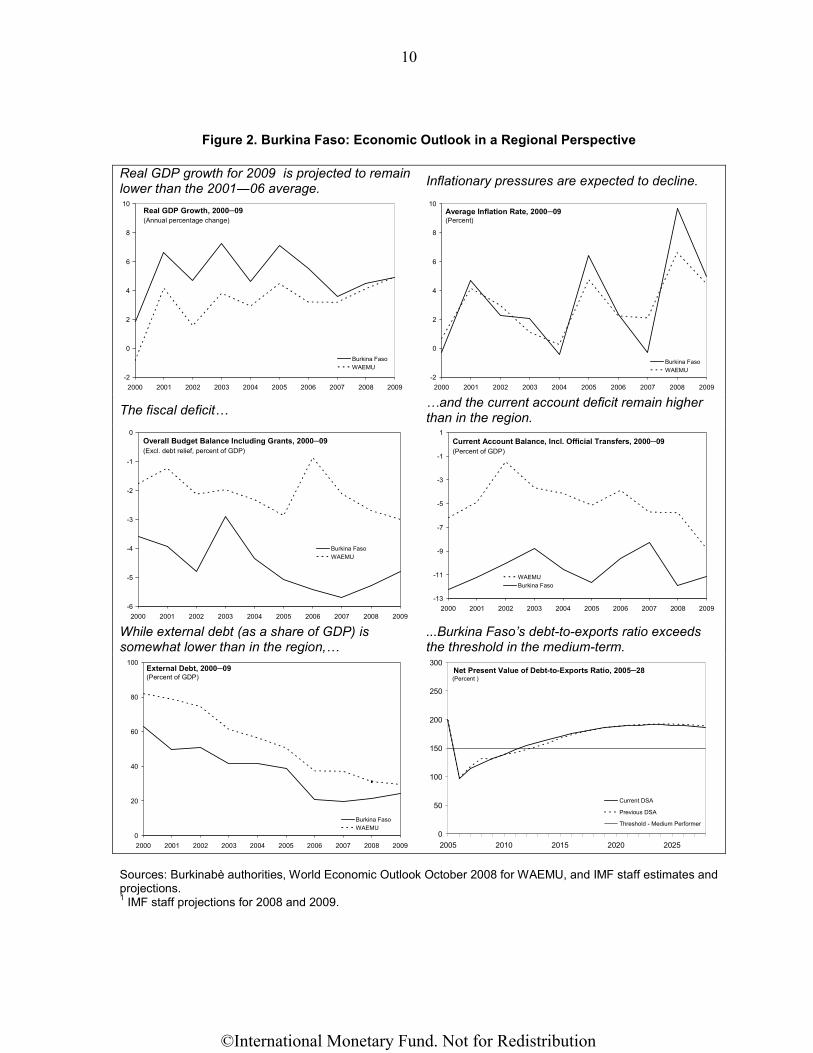
Figure 2. Burkina Faso: Economic Outlook in a Regional Perspective
Real GDP growth for 2009 is projected to remain lower than the 2001―06 average. Inflationary pressures are expected to decline.
-2
0
2
4
6
8
10
2000 2001 2002 2003 2004 2005 2006 2007 2008 2009
Burkina FasoWAEMU
Real GDP Growth, 2000─09(Annual percentage change)
-2
0
2
4
6
8
10
2000 2001 2002 2003 2004 2005 2006 2007 2008 2009
Burkina FasoWAEMU
Average Inflation Rate, 2000─09(Percent)
The fiscal deficit… …and the current account deficit remain higher
than in the region.
-6
-5
-4
-3
-2
-1
0
2000 2001 2002 2003 2004 2005 2006 2007 2008 2009
Burkina FasoWAEMU
Overall Budget Balance Including Grants, 2000─09(Excl. debt relief, percent of GDP)
-13
-11
-9
-7
-5
-3
-1
1
2000 2001 2002 2003 2004 2005 2006 2007 2008 2009
WAEMUBurkina Faso
Current Account Balance, Incl. Official Transfers, 2000─09(Percent of GDP)
While external debt (as a share of GDP) is somewhat lower than in the region,…
...Burkina Faso’s debt-to-exports ratio exceeds the threshold in the medium-term.
0
20
40
60
80
100
2000 2001 2002 2003 2004 2005 2006 2007 2008 2009
Burkina FasoWAEMU
External Debt, 2000─09(Percent of GDP)
0
50
100
150
200
250
300
2005 2010 2015 2020 2025
Current DSA
Previous DSA
Threshold - Medium Performer
Net Present Value of Debt-to-Exports Ratio, 2005─28(Percent )
Sources: Burkinabè authorities, World Economic Outlook October 2008 for WAEMU, and IMF staff estimates and projections. 1 IMF staff projections for 2008 and 2009.
©International Monetary Fund. Not for Redistribution

11
favorable prospects for FDI. Past reforms and the underdeveloped financial sector should make Burkina Faso somewhat resilient to the global financial crisis. However, several transmission mechanisms could eventually lead to significant spillovers: a more pronounced global recession would reduce demand for Burkinabè exports and reduce capital flows (including FDI, remittances, and aid). The impact of general downward pressure on commodity prices is more nuanced. While lower oil prices lead to substantial benefits, lower cotton and gold prices would hurt exporters. The appropriate policy response will depend on the type of spillover.
III. ECONOMIC AND STRUCTURAL POLICIES THROUGH 2009
7. Policy discussions focused on the need for fiscal consolidation, tax reform, and other structural changes to reduce vulnerabilities and enhance growth prospects. The authorities and staff agreed that medium-term fiscal consolidation is vital to reducing the risk of debt distress. To raise revenue and create space for poverty-reducing expenditure, moving ahead expeditiously with tax reform is imperative, but additional technical assistance is needed. Structural reforms are also necessary in the financial and cotton sectors.
A. Macroeconomic Policy
8. The supplementary budget for 2008 reallocates some expenditure while preserving the fiscal stance (MEFP ¶11). It recognizes the impact of higher inflation and responses to food and fuel price increases. It foresees additional expenditure for (i) transfers to the national oil company, SONABHY, to cover margin losses (CFAF 3 billion.); (ii) higher transfers for agricultural inputs (CFAF 5 billion.); and (iii) new education and health hiring (about CFAF 4.3 billion.). This increase in current expenditure occurs in a context of slightly higher budget support and lower capital expenditure in the second half of 2008.
9. For debt sustainability reasons, fiscal consolidation is central to the 2009 budget (MEFP ¶12). A deficit target of 4.9 percent of GDP is a first step toward reducing the deficit to 3.5 percent by 2013 and under 3 percent in the long run, which the updated Debt Sustainability Analysis (DSA) finds necessary to stabilize debt ratios in the long term. A plan to clear claims identified during the 2007 domestic debt audit will be drawn up by end-March 2009 (benchmark, MEFP ¶15). Revenue collection will increase because of (i) continued improvements in tax and customs administration, (ii) some adjustments in excise rates for tobacco, and (iii) the phasing-out of temporary tax exemptions for basic food items. But taxes on domestic goods and services will be somewhat lower than previously programmed, partly because of lower VAT stemming from lower oil prices. On the expenditure side, higher public investment will be offset by containing current expenditure (subsidies related to the surge in oil prices in 2008 would be partly phased-out in 2009).
©International Monetary Fund. Not for Redistribution
12
Text table 2: Burkina Faso — Structural Conditionality for the period October 1, 2008–December 31, 2009
Measures Macro-criticality Deadline, PC/benchmark
Tax policy and Tax administration
Submit to Cabinet detailed proposals concerning the reform of business tax, the investment code, and VAT, based on the IMF’s recommendations, the overall tax policy reform strategy, and WAEMU directives (MEFP ¶20)
Important step to raise tax revenues, which are low
April 30, 2009, structural benchmark (fourth review)
Submit to National Assembly the tax policy reform including measures on VAT, business tax, and the investment code, to take effect with the 2010 budget (MEFP Text Table 1). On the VAT incorporate into the budget the higher thresholds for small, medium, and large enterprises in January 2010, and make small enterprises liable for simplified taxation instead of VAT, in accordance with IMF recommendations and WAEMU directives (MEFP ¶20)
Tax reform is key to raise revenues and reduce the fiscal deficit to ensure debt sustainability
October 31, 2009, performance criterion (fifth review)
Customs administration
In Q4 2008, assign at least 30 percent of customs declarations to green and blue channels and keep below 10 percent the proportion of returns thus selected but assigned to inspectors for additional controls (MEFP ¶17)
Limit discretion at customs, increase revenues, and improve governance
December 28, 2008, benchmark (fourth review)
Public financial management and governance
Prepare an action plan to improve the effectiveness of ex-ante and ex-post expenditure controls, including the elimination of redundant procedures (MEFP ¶23).
Support containing expenditure, by minimizing risk of expenditure outside regular budget process
December 31, 2008, benchmark (fourth review)
Ensure the operational implementation of a general system for the tracking of poverty-reducing spending incorporating all domestically funded expenditures except for salaries (MEFP ¶14).
With limited expenditure envelope, increase efficiency and composition
February 28, 2009, new benchmark (fourth review)
Submission to Cabinet of plan to clear outstanding payments identified in the domestic debt audit. (MEFP ¶15 ).
Increase transparency and improve economic governance
March 31, 2009, new benchmark (fourth review)
Financial sector
Submission to Cabinet of financial sector action plan with timetable of reforms. The action plan, based on the FSAP recommendations, will cover the following areas: (i) facilitating cotton sector financing; (ii) reducing government ownership in the banking sector; and (iii) improving microfinance supervision (MEFP ¶24).
Reduce financial sector vulnerabilities and support growth
March 31, 2009, new performance criterion (fourth review)
Cotton sector
Conduct an audit of SOFITEX with a view to supporting transparency and privatization (MEFP, ¶26).
Increase transparency and limit budgetary risks
March 31, 2009, new benchmark (fourth review)
©International Monetary Fund. Not for Redistribution
13
B. Fiscal Structural Reforms and Debt
10. Authorities and staff discussed a work plan and a detailed timetable for tax reform in 2009 (MEFP ¶20–22). Planned reforms will revise the business tax, streamline the investment code, and strengthen the VAT. As a first step, a database will need to be set up to simulate the revenue impact of alternative tax measures.
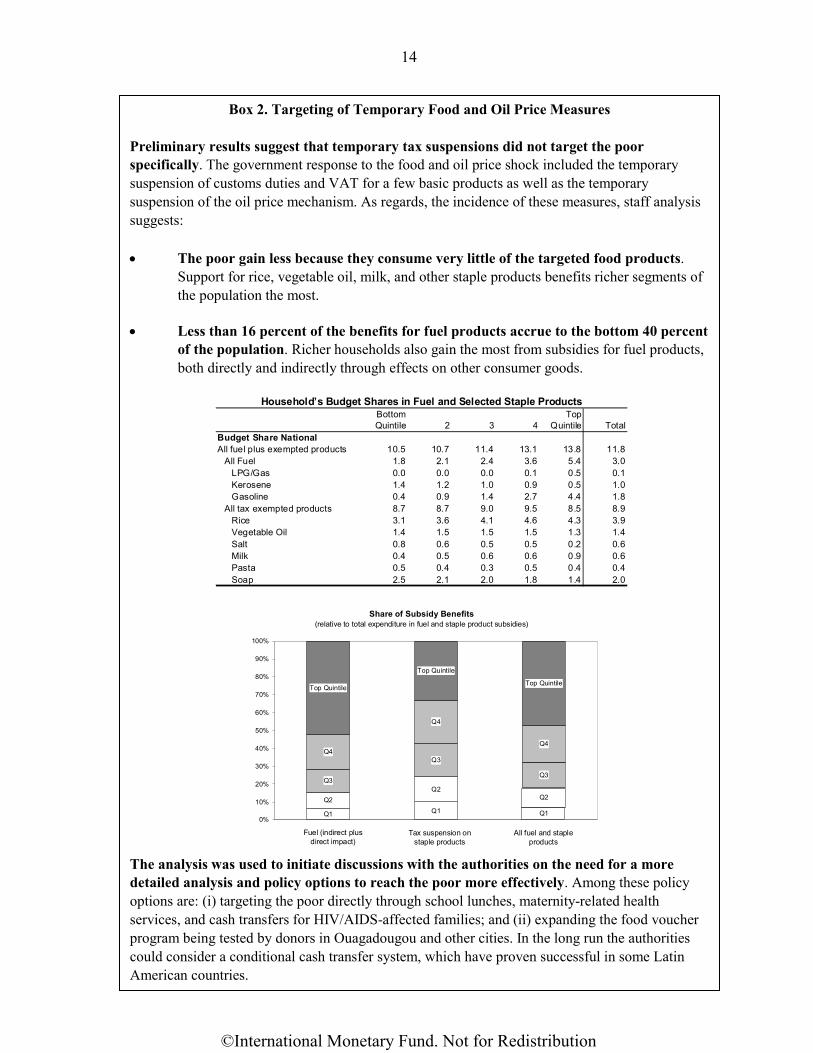
11. Subsidies need to be better targeted. Preliminary staff analysis suggests that measures to protect the poor from rising food and energy prices were not well targeted (see Box 2). The authorities indicated their intention to review the impact of subsidies and transfers more generally, with the medium-term objective of developing social safety-nets.
12. Public financial management (PFM) continues to improve. In procurement, the regulatory framework has been adjusted to reduce directly-awarded procurement contracts. This will increase transparency. The payments process is being improved (benchmark, December 2008; MEFP ¶23). The new audit institution has begun work (MEFP ¶31), and a better system to track poverty-reducing expenditure should be operational by February 2009 (new benchmark, MEFP, ¶14)
13. The authorities are moving to reduce the risk of debt distress. Burkina Faso is classified as a medium performer based on the World Bank Country Policy and Institutional Assessment (CPIA), and is at high risk of debt distress. There have been no major changes since the last joint Bank Fund DSA (see DSA update). To address the risk the authorities are working on the following (apart from their fiscal consolidation strategy):
• Implementing structural reforms (PFM, financial sector, fiscal, business climate (MEFP ¶30) that are necessary to improve the institutional environment and thus the CPIA rating and debt sustainability.
• Setting up an integrated debt data framework and training officials in debt sustainability analysis and debt management.
• Closer monitoring of public enterprises to avoid quasi-fiscal losses, such as those of the national oil company, SONABHY.
©International Monetary Fund. Not for Redistribution
14
Box 2. Targeting of Temporary Food and Oil Price Measures Preliminary results suggest that temporary tax suspensions did not target the poor specifically. The government response to the food and oil price shock included the temporary suspension of customs duties and VAT for a few basic products as well as the temporary suspension of the oil price mechanism. As regards, the incidence of these measures, staff analysis suggests: • The poor gain less because they consume very little of the targeted food products.
Support for rice, vegetable oil, milk, and other staple products benefits richer segments of the population the most.
• Less than 16 percent of the benefits for fuel products accrue to the bottom 40 percent of the population. Richer households also gain the most from subsidies for fuel products, both directly and indirectly through effects on other consumer goods.
Bottom Quintile 2 3 4
Top Quintile Total
Budget Share NationalAll fuel plus exempted products 10.5 10.7 11.4 13.1 13.8 11.8
All Fuel 1.8 2.1 2.4 3.6 5.4 3.0LPG/Gas 0.0 0.0 0.0 0.1 0.5 0.1Kerosene 1.4 1.2 1.0 0.9 0.5 1.0Gasoline 0.4 0.9 1.4 2.7 4.4 1.8
All tax exempted products 8.7 8.7 9.0 9.5 8.5 8.9Rice 3.1 3.6 4.1 4.6 4.3 3.9Vegetable Oil 1.4 1.5 1.5 1.5 1.3 1.4Salt 0.8 0.6 0.5 0.5 0.2 0.6Milk 0.4 0.5 0.6 0.6 0.9 0.6Pasta 0.5 0.4 0.3 0.5 0.4 0.4Soap 2.5 2.1 2.0 1.8 1.4 2.0
Household’s Budget Shares in Fuel and Selected Staple Products
Q1 Q1 Q1
Q2Q2
Q2
Q3
Q3
Q3
Q4
Q4
Q4
Top Quintile
Top Quintile
Top Quintile
0%
10%
20%
30%
40%
50%
60%
70%
80%
90%
100%
Fuel (indirect plus direct impact)
Tax suspension on staple products
All fuel and staple products
Share of Subsidy Benefits (relative to total expenditure in fuel and staple product subsidies)
The analysis was used to initiate discussions with the authorities on the need for a more detailed analysis and policy options to reach the poor more effectively. Among these policy options are: (i) targeting the poor directly through school lunches, maternity-related health services, and cash transfers for HIV/AIDS-affected families; and (ii) expanding the food voucher program being tested by donors in Ouagadougou and other cities. In the long run the authorities could consider a conditional cash transfer system, which have proven successful in some Latin American countries.
©International Monetary Fund. Not for Redistribution
15
C. Other Structural Reforms
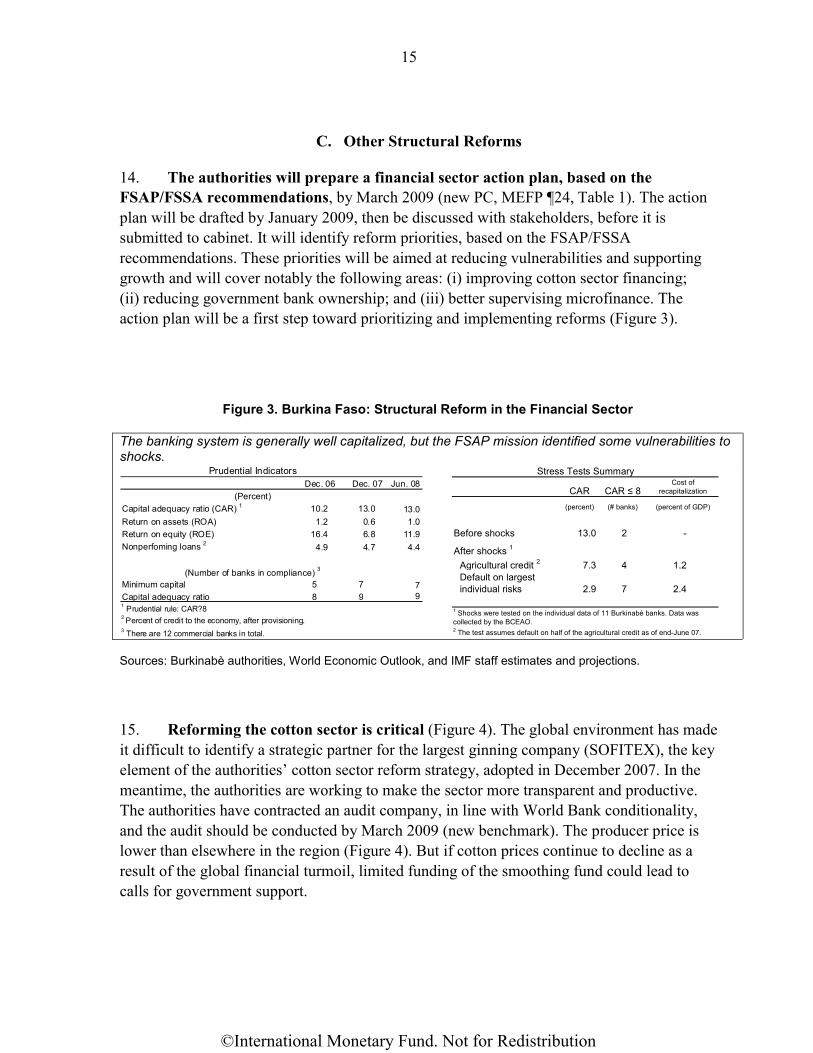
14. The authorities will prepare a financial sector action plan, based on the FSAP/FSSA recommendations, by March 2009 (new PC, MEFP ¶24, Table 1). The action plan will be drafted by January 2009, then be discussed with stakeholders, before it is submitted to cabinet. It will identify reform priorities, based on the FSAP/FSSA recommendations. These priorities will be aimed at reducing vulnerabilities and supporting growth and will cover notably the following areas: (i) improving cotton sector financing; (ii) reducing government bank ownership; and (iii) better supervising microfinance. The action plan will be a first step toward prioritizing and implementing reforms (Figure 3).
Figure 3. Burkina Faso: Structural Reform in the Financial Sector
The banking system is generally well capitalized, but the FSAP mission identified some vulnerabilities to shocks.
Dec. 06 Dec. 07 Jun. 08
Capital adequacy ratio (CAR) 1 10.2 13.0 13.0Return on assets (ROA) 1.2 0.6 1.0Return on equity (ROE) 16.4 6.8 11.9Nonperfoming loans 2 4.9 4.7 4.4
Minimum capital 5 7 7Capital adequacy ratio 8 9 9
2 Percent of credit to the economy, after provisioning.3 There are 12 commercial banks in total.
Prudential Indicators
(Percent)
(Number of banks in compliance) 3
1 Prudential rule: CAR?8
CAR CAR ≤ 8Cost of
recapitalization
(percent) (# banks) (percent of GDP)
Before shocks 13.0 2 -
After shocks 1
Agricultural credit 2 7.3 4 1.2Default on largest individual risks 2.9 7 2.4
Stress Tests Summary
1 Shocks were tested on the individual data of 11 Burkinabé banks. Data was collected by the BCEAO. 2 The test assumes default on half of the agricultural credit as of end-June 07.
Sources: Burkinabè authorities, World Economic Outlook, and IMF staff estimates and projections.
15. Reforming the cotton sector is critical (Figure 4). The global environment has made it difficult to identify a strategic partner for the largest ginning company (SOFITEX), the key element of the authorities’ cotton sector reform strategy, adopted in December 2007. In the meantime, the authorities are working to make the sector more transparent and productive. The authorities have contracted an audit company, in line with World Bank conditionality, and the audit should be conducted by March 2009 (new benchmark). The producer price is lower than elsewhere in the region (Figure 4). But if cotton prices continue to decline as a result of the global financial turmoil, limited funding of the smoothing fund could lead to calls for government support.
©International Monetary Fund. Not for Redistribution

16
Figure 4. Burkina Faso: Structural Reform in the Cotton Sector
Cotton prices have declined form the recent peaks.
140
150
160
170
180
190
200
210
220
230
240
1999/00 2001/02 2003/04 2005/06 2007/08
World Price
Producer Price
Cotton Prices, 2000─09(CFAF per kilogram)
Latest priceOctober 2008
WAEMU: COTTON PRODUCER PRICES(CFAF per kg)
COUNTRY 2006/07 2007/08 2008/09Benin 175 180 185Burkina Faso 164 155 165Côte d'Ivoire 145 150 185Mali 165 160 200Senegal 180 180 180Togo 160 160 160Sources: National authorities and IMF staff.
Sources: Burkinabè authorities, IMF World Economic Outlook, and IMF staff estimates and projections.
16. The authorities aim to close the gap between petroleum pump prices and prices mandated by the price adjustment mechanism. Incomplete pass-through led to quasi-fiscal losses (margin losses) for the national oil company of about 0.6 percent of GDP in 2008 (through September). The recent hefty decline in oil prices has closed the gap for premium gas (Figure 5). While not committing to a specific date, the authorities indicated that the automatic price adjustment mechanism will be restored as soon as possible. Staff emphasized that the mechanism should be restored at the latest during 2009 to minimize budgetary risks.
Figure 5. Burkina Faso: Structural Reform in the Petroleum Sector
Declining international oil prices led to a closing of the gap between world prices and pump prices.
60
80
100
120
140
160
180
200
220
Jan-05 Jun-05 Nov-05 Apr-06 Sep-06 Feb-07 Jul-07 Dec-07 May-08 Oct-08
Domestic super pump priceWorld oil price
International Oil Prices and Pump Prices, Jan. 2005–Nov. 2008(January 2007 = 100)
500
550
600
650
700
750
800
850
May-07 Jul-07 Sep-07 Nov-07 Jan-08 Mar-08 May-08 Jul-08 Sep-08-5
0
5
10
15
20
25
Price difference (secondary axis, percent)
Price suggested by automatic price mechanism
Pump price, super 91
Pump Prices and Automatic Price Mechanism, May 2007─Oct. 2008
Sources: Burkinabè authorities, IMF World Economic Outlook, and IMF staff estimates and projections.
©International Monetary Fund. Not for Redistribution

17
III. PROGRAM ISSUES AND RISKS
17. Staff recommends that preparation of the financial sector strategy become a PC. Reducing the vulnerability of the sector and facilitating access to finance are crucial to making the sector resilient to external shocks and reducing constraints to growth. The target for the 2009 fiscal deficit has been kept unchanged1, underlying the authorities’ strong commitment to a prudent fiscal policy.
18. The program entails risks related to stronger spillovers from financial market turmoil, public and political resistance to reform, and, more generally, delays in implementing reform. To avoid delays in tax reform, additional TA from the Fund and donors could help mitigate the risks related to limited administrative capacity. Additional donor support would also help mitigate the risks.
IV. STAFF APPRAISAL
19. Performance under the program was generally good despite a difficult environment.
• The external environment in the first half of 2008 was tougher than expected as oil and food prices surged. Fortunately, favorable weather during the current planting season is expected to support a rebound in agricultural production. A good harvest and lower oil prices augur well for an easing of inflationary pressure. However, growth prospects in 2009 are subject to downside risks from the global financial turmoil.
• All quantitative PCs and most benchmarks were met. The fiscal deficit target was met after taking into account a shortfall in donor financing. The phasing-out of temporary food price measures is laudable. Measurement of social spending deserves continued emphasis.
20. The 2009 budget is an important step toward reducing the fiscal deficit in the medium term to a level consistent with debt sustainability. The budget strikes a balance between debt sustainability concerns and social and infrastructure needs. To minimize short-term budgetary risks, it will be important to closely track the finances of the national oil company with a view to reinstating the oil price mechanism in 2009. Subsidies and transfers need to be better targeted.
21. Tax reform needs to progress as planned during 2009. Cabinet approval of the tax policy strategy was an important signal of the authorities’ commitment to reform. A broader 1 In line with staff projections, the ceiling on the overall fiscal deficit including grants is CFAF195.6 billion compared to CFAF 195.0 billion before.
©International Monetary Fund. Not for Redistribution
18
and fairer tax system will help mobilize more revenues, as is necessary to reduce the fiscal deficit while increasing the scope for development expenditure.
22. Advancing structural reform, particularly in the financial and cotton sectors, is critical to achieve medium-term growth and development objectives. To support growth, it is necessary to make the financial sector more resilient to shocks, for example through better risk management in the cotton sector, and facilitate access to finance. A financial sector strategy that takes into account FSAP recommendations should guide reform.
23. Staff recommends completion of the third PRGF review because implementation has been generally satisfactory, corrective actions have been taken to resolve delays, and new commitments have been made for the arrangement’s next phase.
©International Monetary Fund. Not for Redistribution
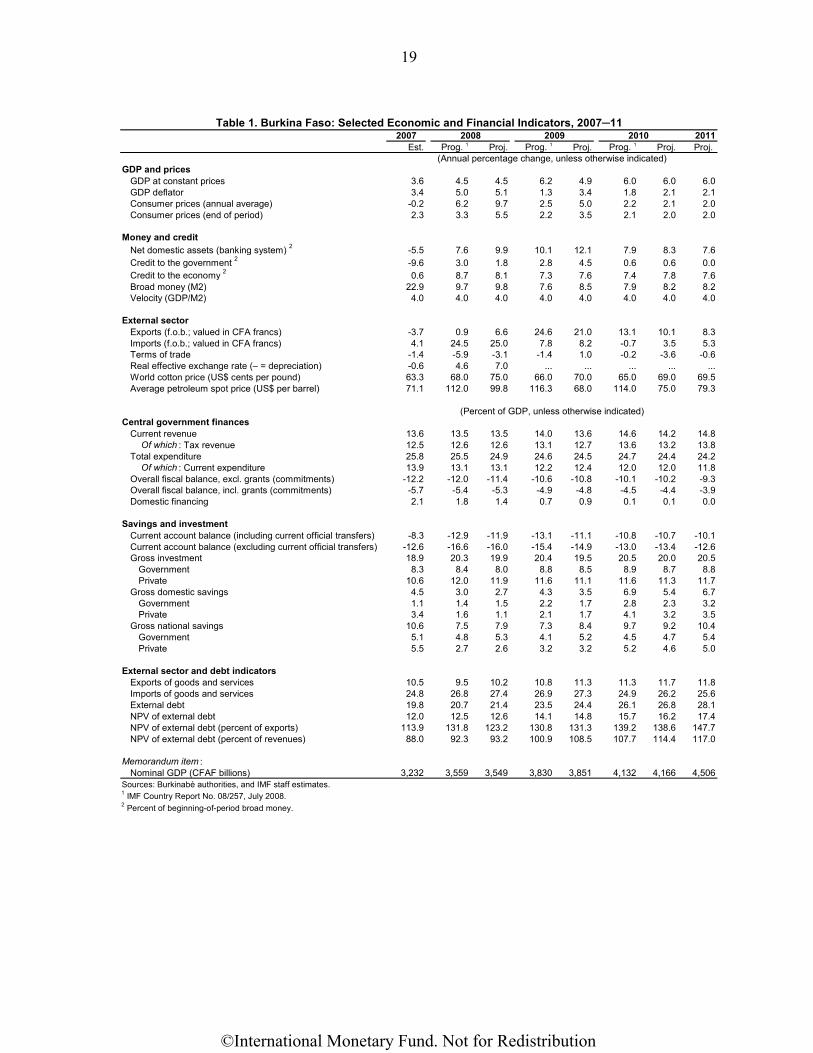
19
2011Est. Prog. 1 Proj. Prog. 1 Proj. Prog. 1 Proj. Proj.
GDP and pricesGDP at constant prices 3.6 4.5 4.5 6.2 4.9 6.0 6.0 6.0GDP deflator 3.4 5.0 5.1 1.3 3.4 1.8 2.1 2.1Consumer prices (annual average) -0.2 6.2 9.7 2.5 5.0 2.2 2.1 2.0Consumer prices (end of period) 2.3 3.3 5.5 2.2 3.5 2.1 2.0 2.0
Money and creditNet domestic assets (banking system) 2 -5.5 7.6 9.9 10.1 12.1 7.9 8.3 7.6Credit to the government 2 -9.6 3.0 1.8 2.8 4.5 0.6 0.6 0.0Credit to the economy 2 0.6 8.7 8.1 7.3 7.6 7.4 7.8 7.6Broad money (M2) 22.9 9.7 9.8 7.6 8.5 7.9 8.2 8.2Velocity (GDP/M2) 4.0 4.0 4.0 4.0 4.0 4.0 4.0 4.0
External sectorExports (f.o.b.; valued in CFA francs) -3.7 0.9 6.6 24.6 21.0 13.1 10.1 8.3Imports (f.o.b.; valued in CFA francs) 4.1 24.5 25.0 7.8 8.2 -0.7 3.5 5.3Terms of trade -1.4 -5.9 -3.1 -1.4 1.0 -0.2 -3.6 -0.6Real effective exchange rate (– = depreciation) -0.6 4.6 7.0 ... ... ... ... ...World cotton price (US$ cents per pound) 63.3 68.0 75.0 66.0 70.0 65.0 69.0 69.5Average petroleum spot price (US$ per barrel) 71.1 112.0 99.8 116.3 68.0 114.0 75.0 79.3
Central government financesCurrent revenue 13.6 13.5 13.5 14.0 13.6 14.6 14.2 14.8
Of which : Tax revenue 12.5 12.6 12.6 13.1 12.7 13.6 13.2 13.8Total expenditure 25.8 25.5 24.9 24.6 24.5 24.7 24.4 24.2
Of which : Current expenditure 13.9 13.1 13.1 12.2 12.4 12.0 12.0 11.8Overall fiscal balance, excl. grants (commitments) -12.2 -12.0 -11.4 -10.6 -10.8 -10.1 -10.2 -9.3Overall fiscal balance, incl. grants (commitments) -5.7 -5.4 -5.3 -4.9 -4.8 -4.5 -4.4 -3.9Domestic financing 2.1 1.8 1.4 0.7 0.9 0.1 0.1 0.0
Savings and investmentCurrent account balance (including current official transfers) -8.3 -12.9 -11.9 -13.1 -11.1 -10.8 -10.7 -10.1Current account balance (excluding current official transfers) -12.6 -16.6 -16.0 -15.4 -14.9 -13.0 -13.4 -12.6Gross investment 18.9 20.3 19.9 20.4 19.5 20.5 20.0 20.5
Government 8.3 8.4 8.0 8.8 8.5 8.9 8.7 8.8Private 10.6 12.0 11.9 11.6 11.1 11.6 11.3 11.7
Gross domestic savings 4.5 3.0 2.7 4.3 3.5 6.9 5.4 6.7Government 1.1 1.4 1.5 2.2 1.7 2.8 2.3 3.2Private 3.4 1.6 1.1 2.1 1.7 4.1 3.2 3.5
Gross national savings 10.6 7.5 7.9 7.3 8.4 9.7 9.2 10.4Government 5.1 4.8 5.3 4.1 5.2 4.5 4.7 5.4Private 5.5 2.7 2.6 3.2 3.2 5.2 4.6 5.0
External sector and debt indicatorsExports of goods and services 10.5 9.5 10.2 10.8 11.3 11.3 11.7 11.8Imports of goods and services 24.8 26.8 27.4 26.9 27.3 24.9 26.2 25.6External debt 19.8 20.7 21.4 23.5 24.4 26.1 26.8 28.1NPV of external debt 12.0 12.5 12.6 14.1 14.8 15.7 16.2 17.4NPV of external debt (percent of exports) 113.9 131.8 123.2 130.8 131.3 139.2 138.6 147.7NPV of external debt (percent of revenues) 88.0 92.3 93.2 100.9 108.5 107.7 114.4 117.0
Memorandum item :Nominal GDP (CFAF billions) 3,232 3,559 3,549 3,830 3,851 4,132 4,166 4,506
Sources: Burkinabè authorities, and IMF staff estimates.1 IMF Country Report No. 08/257, July 2008.2 Percent of beginning-of-period broad money.
(Annual percentage change, unless otherwise indicated)
(Percent of GDP, unless otherwise indicated)
Table 1. Burkina Faso: Selected Economic and Financial Indicators, 2007─112007 2008 2009 2010
©International Monetary Fund. Not for Redistribution
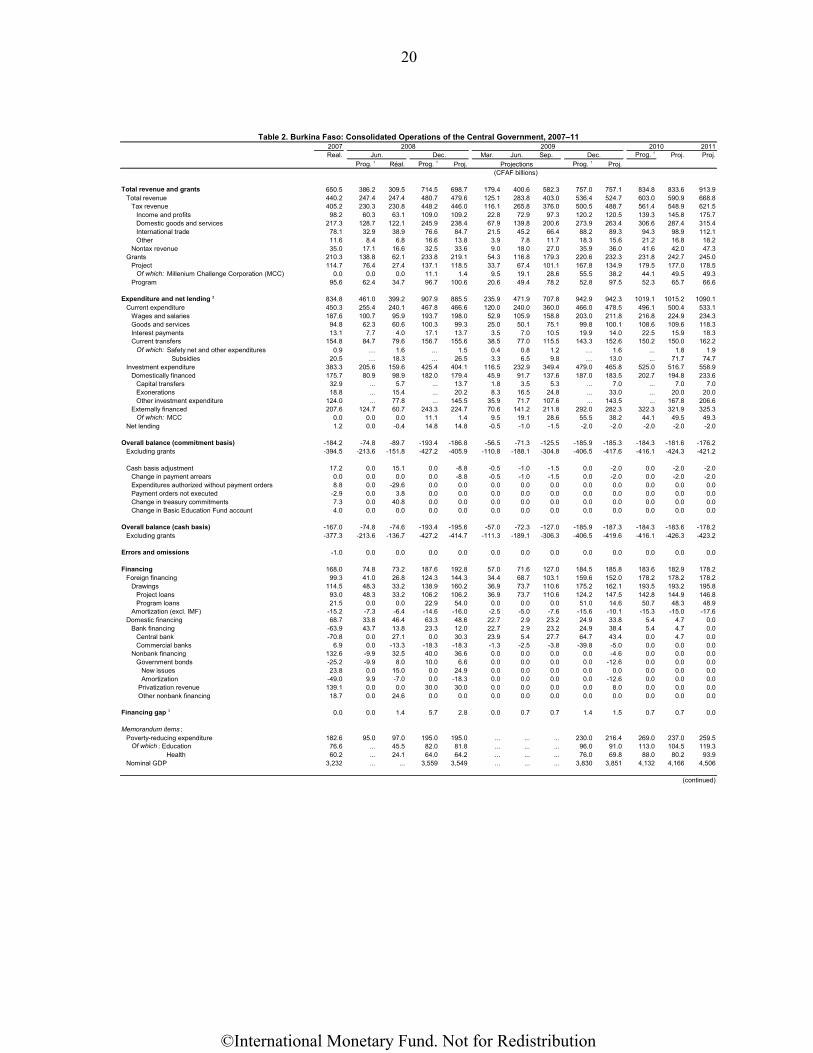
20
2011Mar. Jun. Sep. Prog. 1 Proj. Proj.
Prog. 1 Réal. Prog. 1 Proj. Prog. 1 Proj.
Total revenue and grants 650.5 386.2 309.5 714.5 698.7 179.4 400.6 582.3 757.0 757.1 834.8 833.6 913.9Total revenue 440.2 247.4 247.4 480.7 479.6 125.1 283.8 403.0 536.4 524.7 603.0 590.9 668.8
Tax revenue 405.2 230.3 230.8 448.2 446.0 116.1 265.8 376.0 500.5 488.7 561.4 548.9 621.5Income and profits 98.2 60.3 63.1 109.0 109.2 22.8 72.9 97.3 120.2 120.5 139.3 145.8 175.7Domestic goods and services 217.3 128.7 122.1 245.9 238.4 67.9 139.8 200.6 273.9 263.4 306.6 287.4 315.4International trade 78.1 32.9 38.9 76.6 84.7 21.5 45.2 66.4 88.2 89.3 94.3 98.9 112.1Other 11.6 8.4 6.8 16.6 13.8 3.9 7.8 11.7 18.3 15.6 21.2 16.8 18.2
Nontax revenue 35.0 17.1 16.6 32.5 33.6 9.0 18.0 27.0 35.9 36.0 41.6 42.0 47.3Grants 210.3 138.8 62.1 233.8 219.1 54.3 116.8 179.3 220.6 232.3 231.8 242.7 245.0
Project 114.7 76.4 27.4 137.1 118.5 33.7 67.4 101.1 167.8 134.9 179.5 177.0 178.5Of which: Millenium Challenge Corporation (MCC) 0.0 0.0 0.0 11.1 1.4 9.5 19.1 28.6 55.5 38.2 44.1 49.5 49.3
Program 95.6 62.4 34.7 96.7 100.6 20.6 49.4 78.2 52.8 97.5 52.3 65.7 66.6
Expenditure and net lending 2 834.8 461.0 399.2 907.9 885.5 235.9 471.9 707.8 942.9 942.3 1019.1 1015.2 1090.1Current expenditure 450.3 255.4 240.1 467.8 466.6 120.0 240.0 360.0 466.0 478.5 496.1 500.4 533.1
Wages and salaries 187.6 100.7 95.9 193.7 198.0 52.9 105.9 158.8 203.0 211.8 216.8 224.9 234.3Goods and services 94.8 62.3 60.6 100.3 99.3 25.0 50.1 75.1 99.8 100.1 108.6 109.6 118.3Interest payments 13.1 7.7 4.0 17.1 13.7 3.5 7.0 10.5 19.9 14.0 22.5 15.9 18.3Current transfers 154.8 84.7 79.6 156.7 155.6 38.5 77.0 115.5 143.3 152.6 150.2 150.0 162.2
Of which: Safety net and other expenditures 0.9 … 1.6 … 1.5 0.4 0.8 1.2 … 1.6 ... 1.8 1.9Subsidies 20.5 … 18.3 … 26.5 3.3 6.5 9.8 … 13.0 ... 71.7 74.7
Investment expenditure 383.3 205.6 159.6 425.4 404.1 116.5 232.9 349.4 479.0 465.8 525.0 516.7 558.9Domestically financed 175.7 80.9 98.9 182.0 179.4 45.9 91.7 137.6 187.0 183.5 202.7 194.8 233.6
Capital transfers 32.9 ... 5.7 ... 13.7 1.8 3.5 5.3 ... 7.0 ... 7.0 7.0Exonerations 18.8 ... 15.4 ... 20.2 8.3 16.5 24.8 ... 33.0 ... 20.0 20.0Other investment expenditure 124.0 ... 77.8 ... 145.5 35.9 71.7 107.6 ... 143.5 ... 167.8 206.6
Externally financed 207.6 124.7 60.7 243.3 224.7 70.6 141.2 211.8 292.0 282.3 322.3 321.9 325.3Of which: MCC 0.0 0.0 0.0 11.1 1.4 9.5 19.1 28.6 55.5 38.2 44.1 49.5 49.3
Net lending 1.2 0.0 -0.4 14.8 14.8 -0.5 -1.0 -1.5 -2.0 -2.0 -2.0 -2.0 -2.0
Overall balance (commitment basis) -184.2 -74.8 -89.7 -193.4 -186.8 -56.5 -71.3 -125.5 -185.9 -185.3 -184.3 -181.6 -176.2Excluding grants -394.5 -213.6 -151.8 -427.2 -405.9 -110.8 -188.1 -304.8 -406.5 -417.6 -416.1 -424.3 -421.2
Cash basis adjustment 17.2 0.0 15.1 0.0 -8.8 -0.5 -1.0 -1.5 0.0 -2.0 0.0 -2.0 -2.0Change in payment arrears 0.0 0.0 0.0 0.0 -8.8 -0.5 -1.0 -1.5 0.0 -2.0 0.0 -2.0 -2.0Expenditures authorized without payment orders 8.8 0.0 -29.6 0.0 0.0 0.0 0.0 0.0 0.0 0.0 0.0 0.0 0.0Payment orders not executed -2.9 0.0 3.8 0.0 0.0 0.0 0.0 0.0 0.0 0.0 0.0 0.0 0.0Change in treasury commitments 7.3 0.0 40.8 0.0 0.0 0.0 0.0 0.0 0.0 0.0 0.0 0.0 0.0Change in Basic Education Fund account 4.0 0.0 0.0 0.0 0.0 0.0 0.0 0.0 0.0 0.0 0.0 0.0 0.0
Overall balance (cash basis) -167.0 -74.8 -74.6 -193.4 -195.6 -57.0 -72.3 -127.0 -185.9 -187.3 -184.3 -183.6 -178.2Excluding grants -377.3 -213.6 -136.7 -427.2 -414.7 -111.3 -189.1 -306.3 -406.5 -419.6 -416.1 -426.3 -423.2
Errors and omissions -1.0 0.0 0.0 0.0 0.0 0.0 0.0 0.0 0.0 0.0 0.0 0.0 0.0
Financing 168.0 74.8 73.2 187.6 192.8 57.0 71.6 127.0 184.5 185.8 183.6 182.9 178.2Foreign financing 99.3 41.0 26.8 124.3 144.3 34.4 68.7 103.1 159.6 152.0 178.2 178.2 178.2
Drawings 114.5 48.3 33.2 138.9 160.2 36.9 73.7 110.6 175.2 162.1 193.5 193.2 195.8Project loans 93.0 48.3 33.2 106.2 106.2 36.9 73.7 110.6 124.2 147.5 142.8 144.9 146.8Program loans 21.5 0.0 0.0 22.9 54.0 0.0 0.0 0.0 51.0 14.6 50.7 48.3 48.9
Amortization (excl. IMF) -15.2 -7.3 -6.4 -14.6 -16.0 -2.5 -5.0 -7.6 -15.6 -10.1 -15.3 -15.0 -17.6Domestic financing 68.7 33.8 46.4 63.3 48.6 22.7 2.9 23.2 24.9 33.8 5.4 4.7 0.0
Bank financing -63.9 43.7 13.8 23.3 12.0 22.7 2.9 23.2 24.9 38.4 5.4 4.7 0.0Central bank -70.8 0.0 27.1 0.0 30.3 23.9 5.4 27.7 64.7 43.4 0.0 4.7 0.0Commercial banks 6.9 0.0 -13.3 -18.3 -18.3 -1.3 -2.5 -3.8 -39.8 -5.0 0.0 0.0 0.0
Nonbank financing 132.6 -9.9 32.5 40.0 36.6 0.0 0.0 0.0 0.0 -4.6 0.0 0.0 0.0Government bonds -25.2 -9.9 8.0 10.0 6.6 0.0 0.0 0.0 0.0 -12.6 0.0 0.0 0.0
New issues 23.8 0.0 15.0 0.0 24.9 0.0 0.0 0.0 0.0 0.0 0.0 0.0 0.0Amortization -49.0 9.9 -7.0 0.0 -18.3 0.0 0.0 0.0 0.0 -12.6 0.0 0.0 0.0
Privatization revenue 139.1 0.0 0.0 30.0 30.0 0.0 0.0 0.0 0.0 8.0 0.0 0.0 0.0 Other nonbank financing 18.7 0.0 24.6 0.0 0.0 0.0 0.0 0.0 0.0 0.0 0.0 0.0 0.0
Financing gap 3 0.0 0.0 1.4 5.7 2.8 0.0 0.7 0.7 1.4 1.5 0.7 0.7 0.0
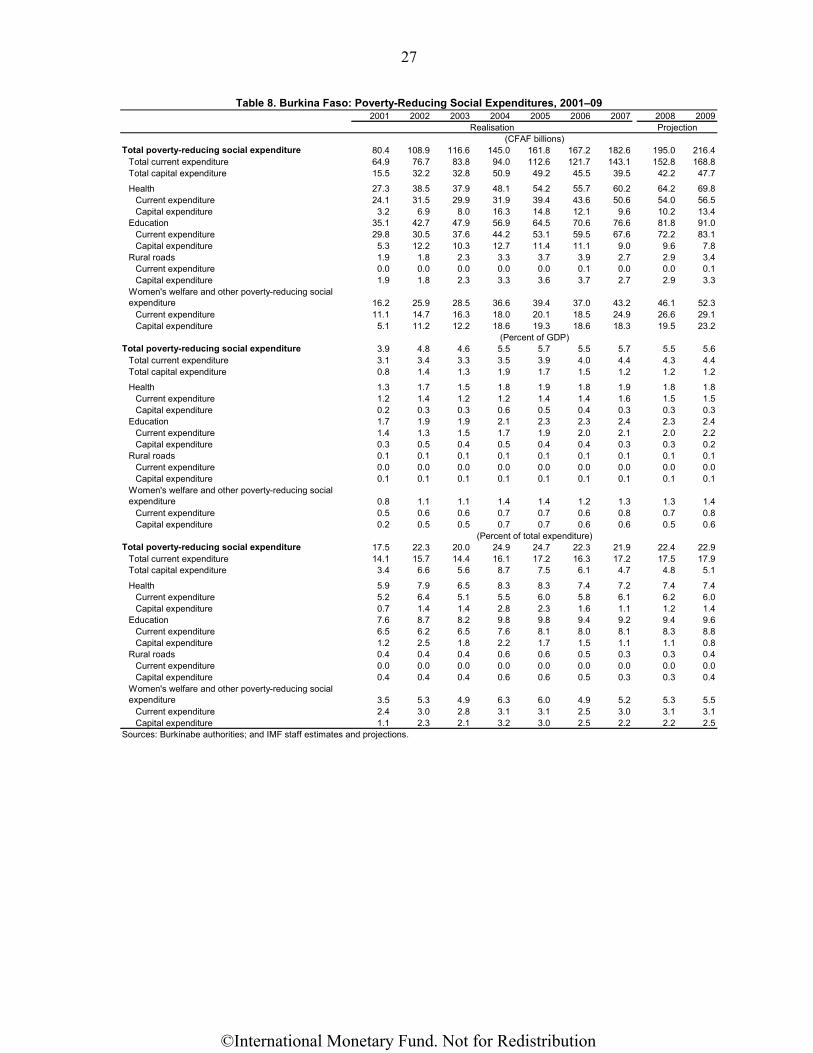
Memorandum items :Poverty-reducing expenditure 182.6 95.0 97.0 195.0 195.0 ... ... ... 230.0 216.4 269.0 237.0 259.5
Of which : Education 76.6 ... 45.5 82.0 81.8 ... ... ... 96.0 91.0 113.0 104.5 119.3Health 60.2 ... 24.1 64.0 64.2 ... ... ... 76.0 69.8 88.0 80.2 93.9
Nominal GDP 3,232 ... ... 3,559 3,549 ... ... ... 3,830 3,851 4,132 4,166 4,506
(continued)
2009Table 2. Burkina Faso: Consolidated Operations of the Central Government, 2007–11
Dec.
(CFAF billions)Projections
2007 2008Real. Jun.
2010Dec.
©International Monetary Fund. Not for Redistribution
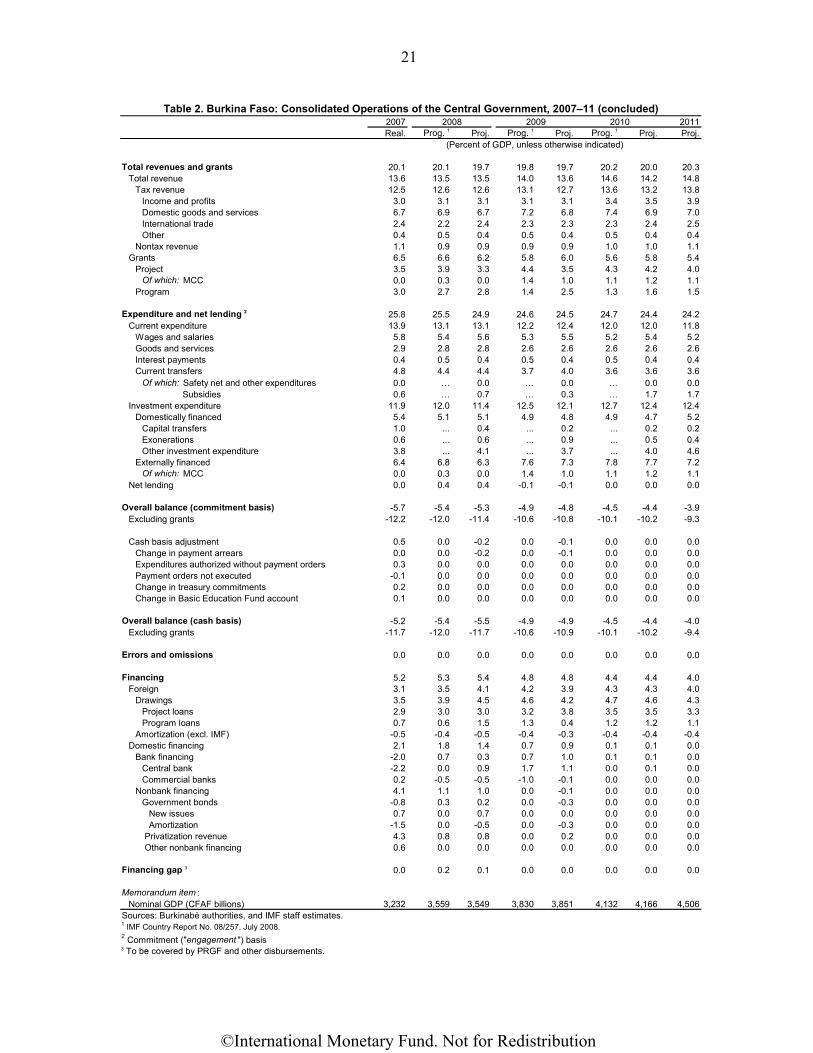
21
2011Prog. 1 Proj. Prog. 1 Proj. Prog. 1 Proj. Proj.
Total revenues and grants 20.1 20.1 19.7 19.8 19.7 20.2 20.0 20.3Total revenue 13.6 13.5 13.5 14.0 13.6 14.6 14.2 14.8
Tax revenue 12.5 12.6 12.6 13.1 12.7 13.6 13.2 13.8Income and profits 3.0 3.1 3.1 3.1 3.1 3.4 3.5 3.9Domestic goods and services 6.7 6.9 6.7 7.2 6.8 7.4 6.9 7.0International trade 2.4 2.2 2.4 2.3 2.3 2.3 2.4 2.5Other 0.4 0.5 0.4 0.5 0.4 0.5 0.4 0.4
Nontax revenue 1.1 0.9 0.9 0.9 0.9 1.0 1.0 1.1Grants 6.5 6.6 6.2 5.8 6.0 5.6 5.8 5.4
Project 3.5 3.9 3.3 4.4 3.5 4.3 4.2 4.0Of which: MCC 0.0 0.3 0.0 1.4 1.0 1.1 1.2 1.1
Program 3.0 2.7 2.8 1.4 2.5 1.3 1.6 1.5
Expenditure and net lending 2 25.8 25.5 24.9 24.6 24.5 24.7 24.4 24.2Current expenditure 13.9 13.1 13.1 12.2 12.4 12.0 12.0 11.8
Wages and salaries 5.8 5.4 5.6 5.3 5.5 5.2 5.4 5.2Goods and services 2.9 2.8 2.8 2.6 2.6 2.6 2.6 2.6Interest payments 0.4 0.5 0.4 0.5 0.4 0.5 0.4 0.4Current transfers 4.8 4.4 4.4 3.7 4.0 3.6 3.6 3.6
Of which: Safety net and other expenditures 0.0 … 0.0 … 0.0 … 0.0 0.0Subsidies 0.6 … 0.7 … 0.3 … 1.7 1.7
Investment expenditure 11.9 12.0 11.4 12.5 12.1 12.7 12.4 12.4Domestically financed 5.4 5.1 5.1 4.9 4.8 4.9 4.7 5.2
Capital transfers 1.0 ... 0.4 ... 0.2 ... 0.2 0.2Exonerations 0.6 ... 0.6 ... 0.9 ... 0.5 0.4Other investment expenditure 3.8 ... 4.1 ... 3.7 ... 4.0 4.6
Externally financed 6.4 6.8 6.3 7.6 7.3 7.8 7.7 7.2Of which: MCC 0.0 0.3 0.0 1.4 1.0 1.1 1.2 1.1
Net lending 0.0 0.4 0.4 -0.1 -0.1 0.0 0.0 0.0
Overall balance (commitment basis) -5.7 -5.4 -5.3 -4.9 -4.8 -4.5 -4.4 -3.9Excluding grants -12.2 -12.0 -11.4 -10.6 -10.8 -10.1 -10.2 -9.3
Cash basis adjustment 0.5 0.0 -0.2 0.0 -0.1 0.0 0.0 0.0Change in payment arrears 0.0 0.0 -0.2 0.0 -0.1 0.0 0.0 0.0Expenditures authorized without payment orders 0.3 0.0 0.0 0.0 0.0 0.0 0.0 0.0Payment orders not executed -0.1 0.0 0.0 0.0 0.0 0.0 0.0 0.0Change in treasury commitments 0.2 0.0 0.0 0.0 0.0 0.0 0.0 0.0Change in Basic Education Fund account 0.1 0.0 0.0 0.0 0.0 0.0 0.0 0.0
Overall balance (cash basis) -5.2 -5.4 -5.5 -4.9 -4.9 -4.5 -4.4 -4.0Excluding grants -11.7 -12.0 -11.7 -10.6 -10.9 -10.1 -10.2 -9.4
Errors and omissions 0.0 0.0 0.0 0.0 0.0 0.0 0.0 0.0
Financing 5.2 5.3 5.4 4.8 4.8 4.4 4.4 4.0Foreign 3.1 3.5 4.1 4.2 3.9 4.3 4.3 4.0
Drawings 3.5 3.9 4.5 4.6 4.2 4.7 4.6 4.3Project loans 2.9 3.0 3.0 3.2 3.8 3.5 3.5 3.3Program loans 0.7 0.6 1.5 1.3 0.4 1.2 1.2 1.1
Amortization (excl. IMF) -0.5 -0.4 -0.5 -0.4 -0.3 -0.4 -0.4 -0.4Domestic financing 2.1 1.8 1.4 0.7 0.9 0.1 0.1 0.0
Bank financing -2.0 0.7 0.3 0.7 1.0 0.1 0.1 0.0Central bank -2.2 0.0 0.9 1.7 1.1 0.0 0.1 0.0Commercial banks 0.2 -0.5 -0.5 -1.0 -0.1 0.0 0.0 0.0
Nonbank financing 4.1 1.1 1.0 0.0 -0.1 0.0 0.0 0.0Government bonds -0.8 0.3 0.2 0.0 -0.3 0.0 0.0 0.0
New issues 0.7 0.0 0.7 0.0 0.0 0.0 0.0 0.0Amortization -1.5 0.0 -0.5 0.0 -0.3 0.0 0.0 0.0
Privatization revenue 4.3 0.8 0.8 0.0 0.2 0.0 0.0 0.0 Other nonbank financing 0.6 0.0 0.0 0.0 0.0 0.0 0.0 0.0
Financing gap 3 0.0 0.2 0.1 0.0 0.0 0.0 0.0 0.0
Memorandum item :Nominal GDP (CFAF billions) 3,232 3,559 3,549 3,830 3,851 4,132 4,166 4,506
Sources: Burkinabè authorities, and IMF staff estimates.1 IMF Country Report No. 08/257, July 2008.2 Commitment ("engagement ") basis3 To be covered by PRGF and other disbursements.
(Percent of GDP, unless otherwise indicated)
Table 2. Burkina Faso: Consolidated Operations of the Central Government, 2007–11 (concluded)2009 20102007 2008
Real.
©International Monetary Fund. Not for Redistribution
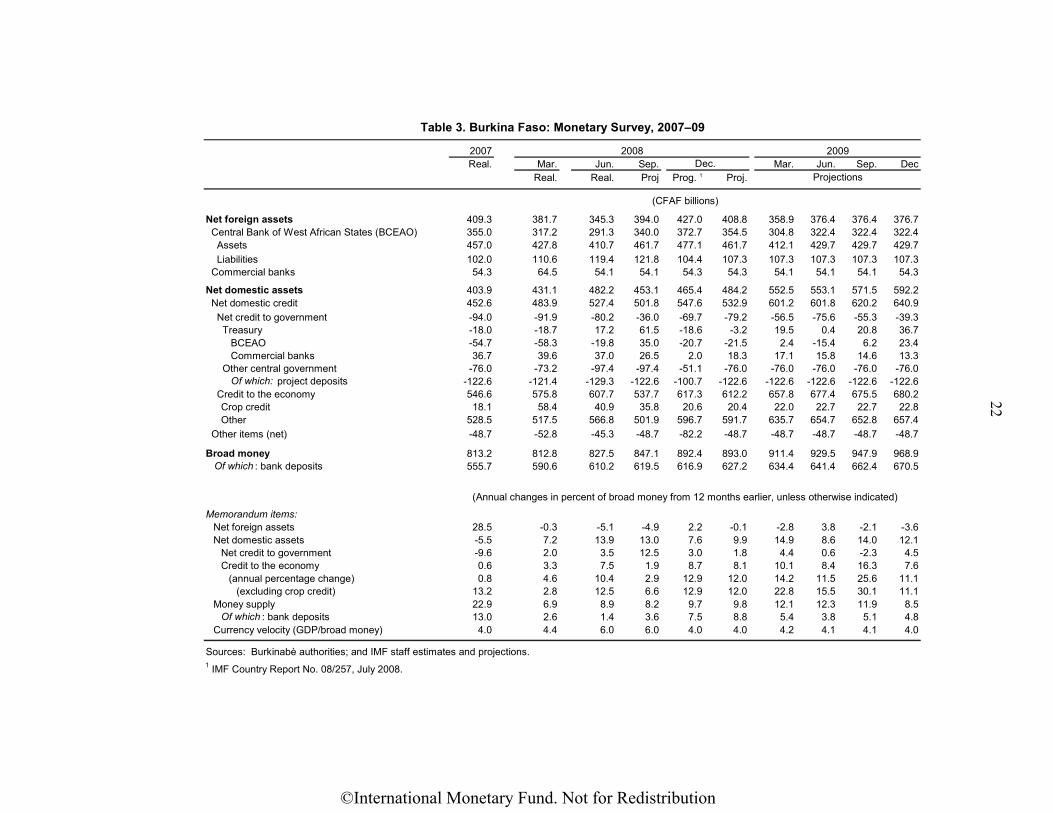
22
Real. Mar. Jun. Sep. Mar. Jun. Sep. DecReal. Real. Proj Prog. 1 Proj.
Net foreign assets 409.3 381.7 345.3 394.0 427.0 408.8 358.9 376.4 376.4 376.7 Central Bank of West African States (BCEAO) 355.0 317.2 291.3 340.0 372.7 354.5 304.8 322.4 322.4 322.4 Assets 457.0 427.8 410.7 461.7 477.1 461.7 412.1 429.7 429.7 429.7 Liabilities 102.0 110.6 119.4 121.8 104.4 107.3 107.3 107.3 107.3 107.3 Commercial banks 54.3 64.5 54.1 54.1 54.3 54.3 54.1 54.1 54.1 54.3
Net domestic assets 403.9 431.1 482.2 453.1 465.4 484.2 552.5 553.1 571.5 592.2 Net domestic credit 452.6 483.9 527.4 501.8 547.6 532.9 601.2 601.8 620.2 640.9 Net credit to government -94.0 -91.9 -80.2 -36.0 -69.7 -79.2 -56.5 -75.6 -55.3 -39.3 Treasury -18.0 -18.7 17.2 61.5 -18.6 -3.2 19.5 0.4 20.8 36.7 BCEAO -54.7 -58.3 -19.8 35.0 -20.7 -21.5 2.4 -15.4 6.2 23.4 Commercial banks 36.7 39.6 37.0 26.5 2.0 18.3 17.1 15.8 14.6 13.3 Other central government -76.0 -73.2 -97.4 -97.4 -51.1 -76.0 -76.0 -76.0 -76.0 -76.0 Of which: project deposits -122.6 -121.4 -129.3 -122.6 -100.7 -122.6 -122.6 -122.6 -122.6 -122.6 Credit to the economy 546.6 575.8 607.7 537.7 617.3 612.2 657.8 677.4 675.5 680.2
Crop credit 18.1 58.4 40.9 35.8 20.6 20.4 22.0 22.7 22.7 22.8Other 528.5 517.5 566.8 501.9 596.7 591.7 635.7 654.7 652.8 657.4
Other items (net) -48.7 -52.8 -45.3 -48.7 -82.2 -48.7 -48.7 -48.7 -48.7 -48.7
Broad money 813.2 812.8 827.5 847.1 892.4 893.0 911.4 929.5 947.9 968.9 Of which : bank deposits 555.7 590.6 610.2 619.5 616.9 627.2 634.4 641.4 662.4 670.5
Memorandum items:Net foreign assets 28.5 -0.3 -5.1 -4.9 2.2 -0.1 -2.8 3.8 -2.1 -3.6Net domestic assets -5.5 7.2 13.9 13.0 7.6 9.9 14.9 8.6 14.0 12.1
Net credit to government -9.6 2.0 3.5 12.5 3.0 1.8 4.4 0.6 -2.3 4.5Credit to the economy 0.6 3.3 7.5 1.9 8.7 8.1 10.1 8.4 16.3 7.6
(annual percentage change) 0.8 4.6 10.4 2.9 12.9 12.0 14.2 11.5 25.6 11.1(excluding crop credit) 13.2 2.8 12.5 6.6 12.9 12.0 22.8 15.5 30.1 11.1
Money supply 22.9 6.9 8.9 8.2 9.7 9.8 12.1 12.3 11.9 8.5Of which : bank deposits 13.0 2.6 1.4 3.6 7.5 8.8 5.4 3.8 5.1 4.8
Currency velocity (GDP/broad money) 4.0 4.4 6.0 6.0 4.0 4.0 4.2 4.1 4.1 4.0
Sources: Burkinabè authorities; and IMF staff estimates and projections.
2007 2008Dec.
1 IMF Country Report No. 08/257, July 2008.
Table 3. Burkina Faso: Monetary Survey, 2007–09
2009
Projections
(Annual changes in percent of broad money from 12 months earlier, unless otherwise indicated)
(CFAF billions)
©International Monetary Fund. Not for Redistribution
23
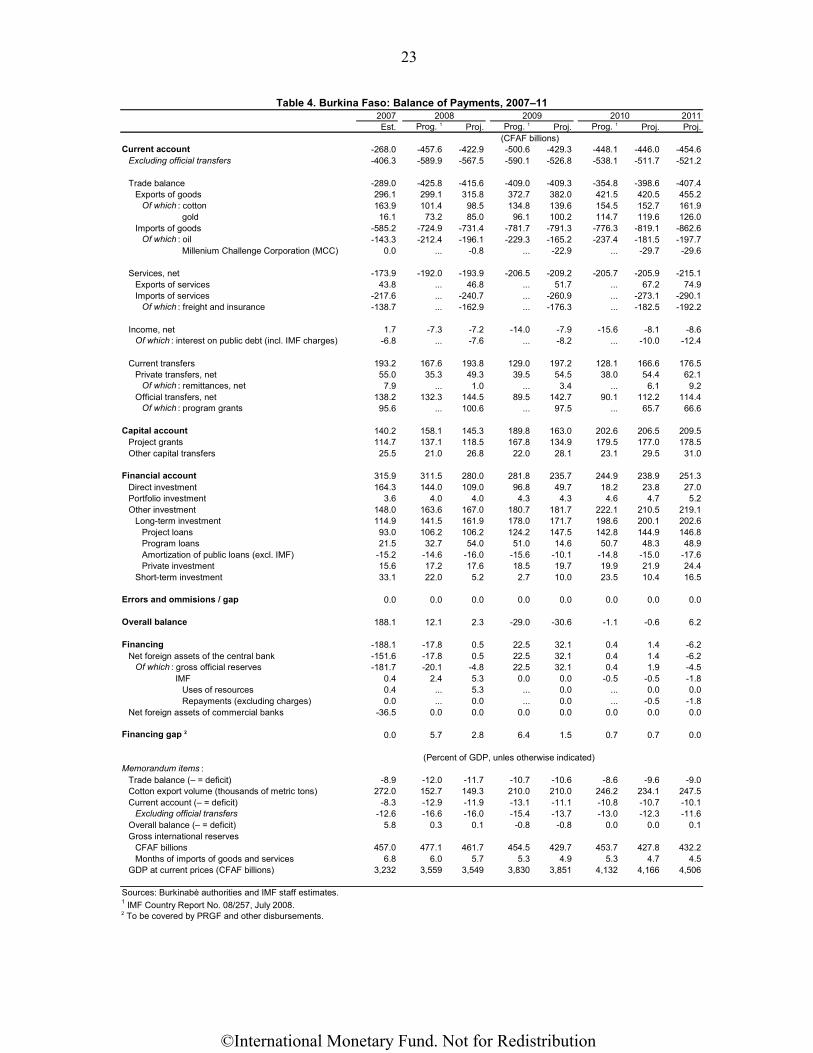
2007 2011Est. Prog. 1 Proj. Prog. 1 Proj. Prog. 1 Proj. Proj.
Current account -268.0 -457.6 -422.9 -500.6 -429.3 -448.1 -446.0 -454.6Excluding official transfers -406.3 -589.9 -567.5 -590.1 -526.8 -538.1 -511.7 -521.2
Trade balance -289.0 -425.8 -415.6 -409.0 -409.3 -354.8 -398.6 -407.4Exports of goods 296.1 299.1 315.8 372.7 382.0 421.5 420.5 455.2
Of which : cotton 163.9 101.4 98.5 134.8 139.6 154.5 152.7 161.9gold 16.1 73.2 85.0 96.1 100.2 114.7 119.6 126.0
Imports of goods -585.2 -724.9 -731.4 -781.7 -791.3 -776.3 -819.1 -862.6Of which : oil -143.3 -212.4 -196.1 -229.3 -165.2 -237.4 -181.5 -197.7
Millenium Challenge Corporation (MCC) 0.0 ... -0.8 ... -22.9 ... -29.7 -29.6
Services, net -173.9 -192.0 -193.9 -206.5 -209.2 -205.7 -205.9 -215.1Exports of services 43.8 ... 46.8 ... 51.7 ... 67.2 74.9Imports of services -217.6 ... -240.7 ... -260.9 ... -273.1 -290.1
Of which : freight and insurance -138.7 ... -162.9 ... -176.3 ... -182.5 -192.2
Income, net 1.7 -7.3 -7.2 -14.0 -7.9 -15.6 -8.1 -8.6Of which : interest on public debt (incl. IMF charges) -6.8 ... -7.6 ... -8.2 ... -10.0 -12.4
Current transfers 193.2 167.6 193.8 129.0 197.2 128.1 166.6 176.5Private transfers, net 55.0 35.3 49.3 39.5 54.5 38.0 54.4 62.1
Of which : remittances, net 7.9 ... 1.0 ... 3.4 ... 6.1 9.2Official transfers, net 138.2 132.3 144.5 89.5 142.7 90.1 112.2 114.4
Of which : program grants 95.6 ... 100.6 ... 97.5 ... 65.7 66.6
Capital account 140.2 158.1 145.3 189.8 163.0 202.6 206.5 209.5Project grants 114.7 137.1 118.5 167.8 134.9 179.5 177.0 178.5Other capital transfers 25.5 21.0 26.8 22.0 28.1 23.1 29.5 31.0
Financial account 315.9 311.5 280.0 281.8 235.7 244.9 238.9 251.3Direct investment 164.3 144.0 109.0 96.8 49.7 18.2 23.8 27.0Portfolio investment 3.6 4.0 4.0 4.3 4.3 4.6 4.7 5.2Other investment 148.0 163.6 167.0 180.7 181.7 222.1 210.5 219.1
Long-term investment 114.9 141.5 161.9 178.0 171.7 198.6 200.1 202.6Project loans 93.0 106.2 106.2 124.2 147.5 142.8 144.9 146.8Program loans 21.5 32.7 54.0 51.0 14.6 50.7 48.3 48.9Amortization of public loans (excl. IMF) -15.2 -14.6 -16.0 -15.6 -10.1 -14.8 -15.0 -17.6Private investment 15.6 17.2 17.6 18.5 19.7 19.9 21.9 24.4
Short-term investment 33.1 22.0 5.2 2.7 10.0 23.5 10.4 16.5
Errors and ommisions / gap 0.0 0.0 0.0 0.0 0.0 0.0 0.0 0.0
Overall balance 188.1 12.1 2.3 -29.0 -30.6 -1.1 -0.6 6.2
Financing -188.1 -17.8 0.5 22.5 32.1 0.4 1.4 -6.2Net foreign assets of the central bank -151.6 -17.8 0.5 22.5 32.1 0.4 1.4 -6.2
Of which : gross official reserves -181.7 -20.1 -4.8 22.5 32.1 0.4 1.9 -4.5IMF 0.4 2.4 5.3 0.0 0.0 -0.5 -0.5 -1.8
Uses of resources 0.4 ... 5.3 ... 0.0 ... 0.0 0.0Repayments (excluding charges) 0.0 ... 0.0 ... 0.0 ... -0.5 -1.8
Net foreign assets of commercial banks -36.5 0.0 0.0 0.0 0.0 0.0 0.0 0.0
Financing gap 2 0.0 5.7 2.8 6.4 1.5 0.7 0.7 0.0
Memorandum items :Trade balance (– = deficit) -8.9 -12.0 -11.7 -10.7 -10.6 -8.6 -9.6 -9.0Cotton export volume (thousands of metric tons) 272.0 152.7 149.3 210.0 210.0 246.2 234.1 247.5Current account (– = deficit) -8.3 -12.9 -11.9 -13.1 -11.1 -10.8 -10.7 -10.1
Excluding official transfers -12.6 -16.6 -16.0 -15.4 -13.7 -13.0 -12.3 -11.6Overall balance (– = deficit) 5.8 0.3 0.1 -0.8 -0.8 0.0 0.0 0.1Gross international reserves
CFAF billions 457.0 477.1 461.7 454.5 429.7 453.7 427.8 432.2Months of imports of goods and services 6.8 6.0 5.7 5.3 4.9 5.3 4.7 4.5
GDP at current prices (CFAF billions) 3,232 3,559 3,549 3,830 3,851 4,132 4,166 4,506
Sources: Burkinabè authorities and IMF staff estimates.
2 To be covered by PRGF and other disbursements.
Table 4. Burkina Faso: Balance of Payments, 2007–11
(CFAF billions)
1 IMF Country Report No. 08/257, July 2008.
2008 2009 2010
(Percent of GDP, unles otherwise indicated)
©International Monetary Fund. Not for Redistribution
24
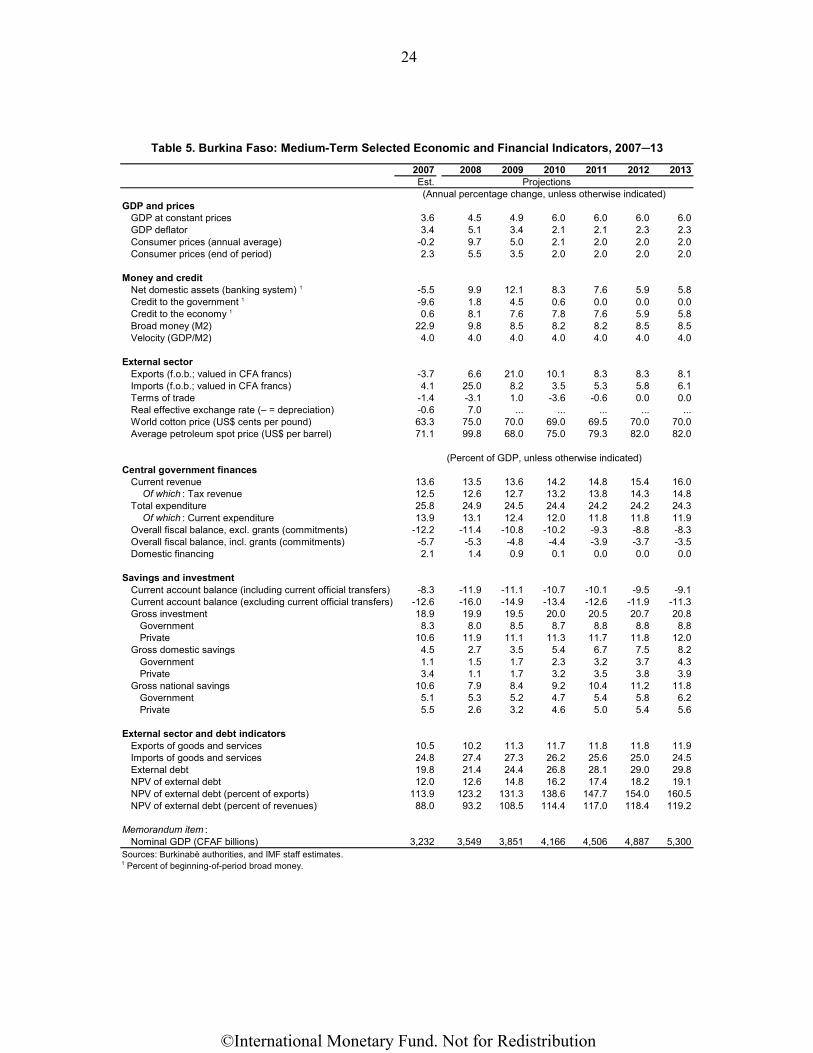
2008 2009 2010 2011 2012 2013Est.
GDP and pricesGDP at constant prices 3.6 4.5 4.9 6.0 6.0 6.0 6.0GDP deflator 3.4 5.1 3.4 2.1 2.1 2.3 2.3Consumer prices (annual average) -0.2 9.7 5.0 2.1 2.0 2.0 2.0Consumer prices (end of period) 2.3 5.5 3.5 2.0 2.0 2.0 2.0
Money and creditNet domestic assets (banking system) 1 -5.5 9.9 12.1 8.3 7.6 5.9 5.8Credit to the government 1 -9.6 1.8 4.5 0.6 0.0 0.0 0.0Credit to the economy 1 0.6 8.1 7.6 7.8 7.6 5.9 5.8Broad money (M2) 22.9 9.8 8.5 8.2 8.2 8.5 8.5Velocity (GDP/M2) 4.0 4.0 4.0 4.0 4.0 4.0 4.0
External sectorExports (f.o.b.; valued in CFA francs) -3.7 6.6 21.0 10.1 8.3 8.3 8.1Imports (f.o.b.; valued in CFA francs) 4.1 25.0 8.2 3.5 5.3 5.8 6.1Terms of trade -1.4 -3.1 1.0 -3.6 -0.6 0.0 0.0Real effective exchange rate (– = depreciation) -0.6 7.0 ... ... ... ... ...World cotton price (US$ cents per pound) 63.3 75.0 70.0 69.0 69.5 70.0 70.0Average petroleum spot price (US$ per barrel) 71.1 99.8 68.0 75.0 79.3 82.0 82.0
Central government financesCurrent revenue 13.6 13.5 13.6 14.2 14.8 15.4 16.0
Of which : Tax revenue 12.5 12.6 12.7 13.2 13.8 14.3 14.8Total expenditure 25.8 24.9 24.5 24.4 24.2 24.2 24.3
Of which : Current expenditure 13.9 13.1 12.4 12.0 11.8 11.8 11.9Overall fiscal balance, excl. grants (commitments) -12.2 -11.4 -10.8 -10.2 -9.3 -8.8 -8.3Overall fiscal balance, incl. grants (commitments) -5.7 -5.3 -4.8 -4.4 -3.9 -3.7 -3.5Domestic financing 2.1 1.4 0.9 0.1 0.0 0.0 0.0
Savings and investmentCurrent account balance (including current official transfers) -8.3 -11.9 -11.1 -10.7 -10.1 -9.5 -9.1Current account balance (excluding current official transfers) -12.6 -16.0 -14.9 -13.4 -12.6 -11.9 -11.3Gross investment 18.9 19.9 19.5 20.0 20.5 20.7 20.8
Government 8.3 8.0 8.5 8.7 8.8 8.8 8.8Private 10.6 11.9 11.1 11.3 11.7 11.8 12.0
Gross domestic savings 4.5 2.7 3.5 5.4 6.7 7.5 8.2Government 1.1 1.5 1.7 2.3 3.2 3.7 4.3Private 3.4 1.1 1.7 3.2 3.5 3.8 3.9
Gross national savings 10.6 7.9 8.4 9.2 10.4 11.2 11.8Government 5.1 5.3 5.2 4.7 5.4 5.8 6.2Private 5.5 2.6 3.2 4.6 5.0 5.4 5.6
External sector and debt indicatorsExports of goods and services 10.5 10.2 11.3 11.7 11.8 11.8 11.9Imports of goods and services 24.8 27.4 27.3 26.2 25.6 25.0 24.5External debt 19.8 21.4 24.4 26.8 28.1 29.0 29.8NPV of external debt 12.0 12.6 14.8 16.2 17.4 18.2 19.1NPV of external debt (percent of exports) 113.9 123.2 131.3 138.6 147.7 154.0 160.5NPV of external debt (percent of revenues) 88.0 93.2 108.5 114.4 117.0 118.4 119.2
Memorandum item :Nominal GDP (CFAF billions) 3,232 3,549 3,851 4,166 4,506 4,887 5,300
Sources: Burkinabè authorities, and IMF staff estimates.1 Percent of beginning-of-period broad money.
(Percent of GDP, unless otherwise indicated)
2007Projections
Table 5. Burkina Faso: Medium-Term Selected Economic and Financial Indicators, 2007─13
(Annual percentage change, unless otherwise indicated)
©International Monetary Fund. Not for Redistribution
25
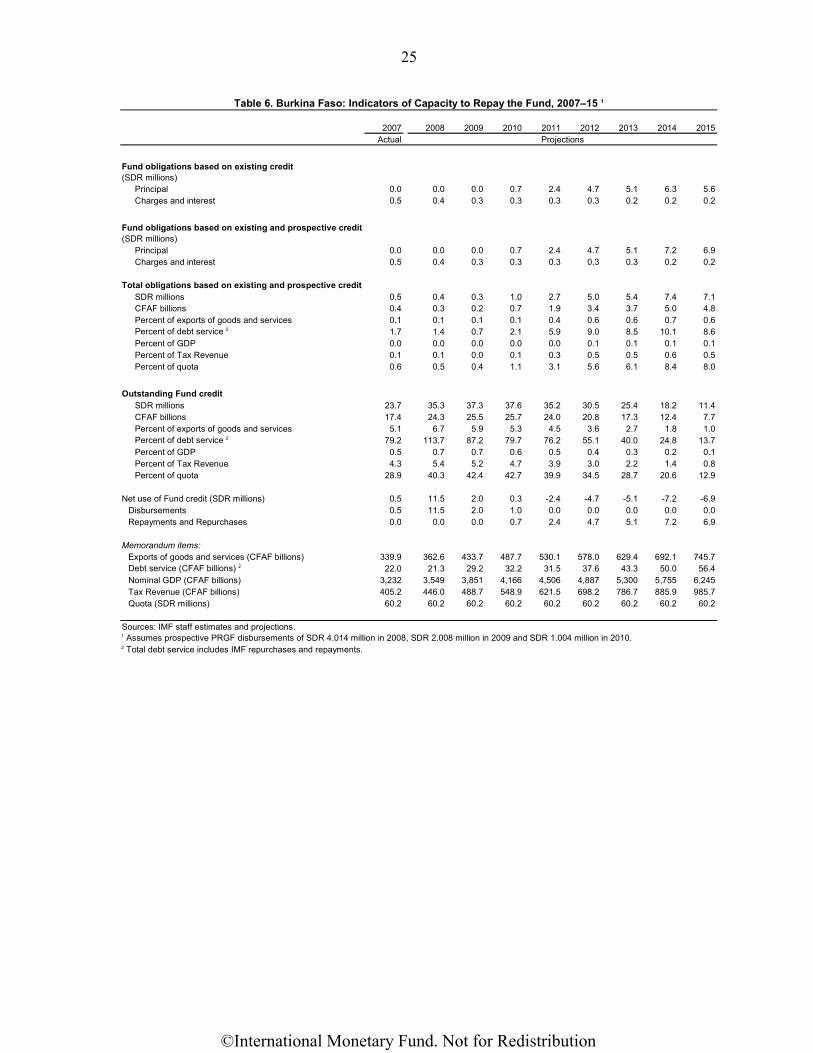
2007 2008 2009 2010 2011 2012 2013 2014 2015Actual
Principal 0.0 0.0 0.0 0.7 2.4 4.7 5.1 6.3 5.6Charges and interest 0.5 0.4 0.3 0.3 0.3 0.3 0.2 0.2 0.2
Principal 0.0 0.0 0.0 0.7 2.4 4.7 5.1 7.2 6.9Charges and interest 0.5 0.4 0.3 0.3 0.3 0.3 0.3 0.2 0.2
SDR millions 0.5 0.4 0.3 1.0 2.7 5.0 5.4 7.4 7.1CFAF billions 0.4 0.3 0.2 0.7 1.9 3.4 3.7 5.0 4.8Percent of exports of goods and services 0.1 0.1 0.1 0.1 0.4 0.6 0.6 0.7 0.6Percent of debt service 2 1.7 1.4 0.7 2.1 5.9 9.0 8.5 10.1 8.6Percent of GDP 0.0 0.0 0.0 0.0 0.0 0.1 0.1 0.1 0.1Percent of Tax Revenue 0.1 0.1 0.0 0.1 0.3 0.5 0.5 0.6 0.5Percent of quota 0.6 0.5 0.4 1.1 3.1 5.6 6.1 8.4 8.0
Outstanding Fund creditSDR millions 23.7 35.3 37.3 37.6 35.2 30.5 25.4 18.2 11.4CFAF billions 17.4 24.3 25.5 25.7 24.0 20.8 17.3 12.4 7.7Percent of exports of goods and services 5.1 6.7 5.9 5.3 4.5 3.6 2.7 1.8 1.0Percent of debt service 2 79.2 113.7 87.2 79.7 76.2 55.1 40.0 24.8 13.7Percent of GDP 0.5 0.7 0.7 0.6 0.5 0.4 0.3 0.2 0.1Percent of Tax Revenue 4.3 5.4 5.2 4.7 3.9 3.0 2.2 1.4 0.8Percent of quota 28.9 40.3 42.4 42.7 39.9 34.5 28.7 20.6 12.9
Net use of Fund credit (SDR millions) 0.5 11.5 2.0 0.3 -2.4 -4.7 -5.1 -7.2 -6.9Disbursements 0.5 11.5 2.0 1.0 0.0 0.0 0.0 0.0 0.0Repayments and Repurchases 0.0 0.0 0.0 0.7 2.4 4.7 5.1 7.2 6.9
Memorandum items:Exports of goods and services (CFAF billions) 339.9 362.6 433.7 487.7 530.1 578.0 629.4 692.1 745.7Debt service (CFAF billions) 2 22.0 21.3 29.2 32.2 31.5 37.6 43.3 50.0 56.4Nominal GDP (CFAF billions) 3,232 3,549 3,851 4,166 4,506 4,887 5,300 5,755 6,245Tax Revenue (CFAF billions) 405.2 446.0 488.7 548.9 621.5 698.2 786.7 885.9 985.7Quota (SDR millions) 60.2 60.2 60.2 60.2 60.2 60.2 60.2 60.2 60.2
Sources: IMF staff estimates and projections.
Fund obligations based on existing credit(SDR millions)
Table 6. Burkina Faso: Indicators of Capacity to Repay the Fund, 2007–15 1
1 Assumes prospective PRGF disbursements of SDR 4.014 million in 2008, SDR 2.008 million in 2009 and SDR 1.004 million in 2010.
Projections
Fund obligations based on existing and prospective credit(SDR millions)
Total obligations based on existing and prospective credit
2 Total debt service includes IMF repurchases and repayments.
©International Monetary Fund. Not for Redistribution
26
Table 7. Burkina Faso: Schedule of Disbursements Under the PRGF Arrangement, 2007–10
Amount Date Available Conditions Necessary for Disbursement 1
SDR 0.5 million April 23, 2007 Following Executive Board approval of the three-year PRGF arrangement
SDR 3.51 million January 9, 2008 Observance of the performance criteria for June 30, 2007, and completion of the first review under the arrangement 2
SDR 4.014 million June 30, 2008 Observance of the performance criteria for December 31, 2007, and completion of the second review under the arrangement 2
SDR 4.014 million November 30, 2008 Observance of the performance criteria for June 30, 2008, and completion of the third review under the arrangement 2
SDR 1.004 million May 31, 2009 Observance of the performance criteria for December 31, 2008, and completion of the fourth review under the arrangement
SDR 1.004 million November 30, 2009 Observance of the performance criteria for June 30, 2009, and completion of the fifth review under the arrangement
SDR 1.004 million March 30, 2010 Observance of the performance criteria for December 31, 2009, and completion of the sixth review under the arrangement
Source: IMF
1 In addition to the generally applicable conditions under the Poverty Reduction Facility and Growth Facility arrangement.
2 Includes augmentation of access of 15 percent of quota (SDR 9.03 million), phased equally over the three disbursements expected in 2008.
©International Monetary Fund. Not for Redistribution
27
2001 2002 2003 2004 2005 2006 2007 2008 2009
Total poverty-reducing social expenditure 80.4 108.9 116.6 145.0 161.8 167.2 182.6 195.0 216.4Total current expenditure 64.9 76.7 83.8 94.0 112.6 121.7 143.1 152.8 168.8Total capital expenditure 15.5 32.2 32.8 50.9 49.2 45.5 39.5 42.2 47.7
Health 27.3 38.5 37.9 48.1 54.2 55.7 60.2 64.2 69.8Current expenditure 24.1 31.5 29.9 31.9 39.4 43.6 50.6 54.0 56.5Capital expenditure 3.2 6.9 8.0 16.3 14.8 12.1 9.6 10.2 13.4
Education 35.1 42.7 47.9 56.9 64.5 70.6 76.6 81.8 91.0Current expenditure 29.8 30.5 37.6 44.2 53.1 59.5 67.6 72.2 83.1Capital expenditure 5.3 12.2 10.3 12.7 11.4 11.1 9.0 9.6 7.8
Rural roads 1.9 1.8 2.3 3.3 3.7 3.9 2.7 2.9 3.4Current expenditure 0.0 0.0 0.0 0.0 0.0 0.1 0.0 0.0 0.1Capital expenditure 1.9 1.8 2.3 3.3 3.6 3.7 2.7 2.9 3.3
Women's welfare and other poverty-reducing social expenditure 16.2 25.9 28.5 36.6 39.4 37.0 43.2 46.1 52.3
Current expenditure 11.1 14.7 16.3 18.0 20.1 18.5 24.9 26.6 29.1Capital expenditure 5.1 11.2 12.2 18.6 19.3 18.6 18.3 19.5 23.2
Total poverty-reducing social expenditure 3.9 4.8 4.6 5.5 5.7 5.5 5.7 5.5 5.6Total current expenditure 3.1 3.4 3.3 3.5 3.9 4.0 4.4 4.3 4.4Total capital expenditure 0.8 1.4 1.3 1.9 1.7 1.5 1.2 1.2 1.2
Health 1.3 1.7 1.5 1.8 1.9 1.8 1.9 1.8 1.8Current expenditure 1.2 1.4 1.2 1.2 1.4 1.4 1.6 1.5 1.5Capital expenditure 0.2 0.3 0.3 0.6 0.5 0.4 0.3 0.3 0.3
Education 1.7 1.9 1.9 2.1 2.3 2.3 2.4 2.3 2.4Current expenditure 1.4 1.3 1.5 1.7 1.9 2.0 2.1 2.0 2.2Capital expenditure 0.3 0.5 0.4 0.5 0.4 0.4 0.3 0.3 0.2
Rural roads 0.1 0.1 0.1 0.1 0.1 0.1 0.1 0.1 0.1Current expenditure 0.0 0.0 0.0 0.0 0.0 0.0 0.0 0.0 0.0Capital expenditure 0.1 0.1 0.1 0.1 0.1 0.1 0.1 0.1 0.1
Women's welfare and other poverty-reducing social expenditure 0.8 1.1 1.1 1.4 1.4 1.2 1.3 1.3 1.4
Current expenditure 0.5 0.6 0.6 0.7 0.7 0.6 0.8 0.7 0.8Capital expenditure 0.2 0.5 0.5 0.7 0.7 0.6 0.6 0.5 0.6
Total poverty-reducing social expenditure 17.5 22.3 20.0 24.9 24.7 22.3 21.9 22.4 22.9Total current expenditure 14.1 15.7 14.4 16.1 17.2 16.3 17.2 17.5 17.9Total capital expenditure 3.4 6.6 5.6 8.7 7.5 6.1 4.7 4.8 5.1
Health 5.9 7.9 6.5 8.3 8.3 7.4 7.2 7.4 7.4Current expenditure 5.2 6.4 5.1 5.5 6.0 5.8 6.1 6.2 6.0Capital expenditure 0.7 1.4 1.4 2.8 2.3 1.6 1.1 1.2 1.4
Education 7.6 8.7 8.2 9.8 9.8 9.4 9.2 9.4 9.6Current expenditure 6.5 6.2 6.5 7.6 8.1 8.0 8.1 8.3 8.8Capital expenditure 1.2 2.5 1.8 2.2 1.7 1.5 1.1 1.1 0.8
Rural roads 0.4 0.4 0.4 0.6 0.6 0.5 0.3 0.3 0.4Current expenditure 0.0 0.0 0.0 0.0 0.0 0.0 0.0 0.0 0.0Capital expenditure 0.4 0.4 0.4 0.6 0.6 0.5 0.3 0.3 0.4
Women's welfare and other poverty-reducing social expenditure 3.5 5.3 4.9 6.3 6.0 4.9 5.2 5.3 5.5
Current expenditure 2.4 3.0 2.8 3.1 3.1 2.5 3.0 3.1 3.1Capital expenditure 1.1 2.3 2.1 3.2 3.0 2.5 2.2 2.2 2.5
Sources: Burkinabe authorities; and IMF staff estimates and projections.
Table 8. Burkina Faso: Poverty-Reducing Social Expenditures, 2001–09
(CFAF billions)
(Percent of GDP)
(Percent of total expenditure)
ProjectionRealisation
©International Monetary Fund. Not for Redistribution
28
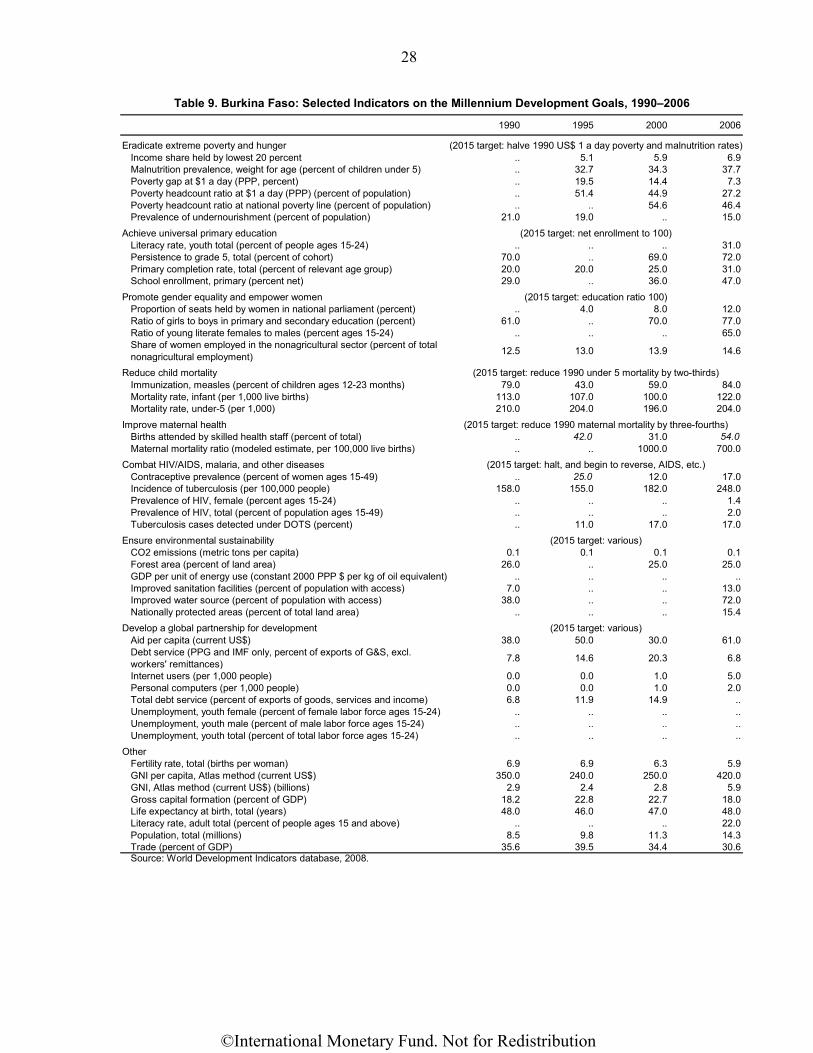
1990 1995 2000 2006
Eradicate extreme poverty and hungerIncome share held by lowest 20 percent .. 5.1 5.9 6.9Malnutrition prevalence, weight for age (percent of children under 5) .. 32.7 34.3 37.7Poverty gap at $1 a day (PPP, percent) .. 19.5 14.4 7.3Poverty headcount ratio at $1 a day (PPP) (percent of population) .. 51.4 44.9 27.2Poverty headcount ratio at national poverty line (percent of population) .. .. 54.6 46.4Prevalence of undernourishment (percent of population) 21.0 19.0 .. 15.0
Achieve universal primary educationLiteracy rate, youth total (percent of people ages 15-24) .. .. .. 31.0Persistence to grade 5, total (percent of cohort) 70.0 .. 69.0 72.0Primary completion rate, total (percent of relevant age group) 20.0 20.0 25.0 31.0School enrollment, primary (percent net) 29.0 .. 36.0 47.0
Promote gender equality and empower womenProportion of seats held by women in national parliament (percent) .. 4.0 8.0 12.0Ratio of girls to boys in primary and secondary education (percent) 61.0 .. 70.0 77.0Ratio of young literate females to males (percent ages 15-24) .. .. .. 65.0Share of women employed in the nonagricultural sector (percent of total nonagricultural employment) 12.5 13.0 13.9 14.6
Reduce child mortalityImmunization, measles (percent of children ages 12-23 months) 79.0 43.0 59.0 84.0Mortality rate, infant (per 1,000 live births) 113.0 107.0 100.0 122.0Mortality rate, under-5 (per 1,000) 210.0 204.0 196.0 204.0
Improve maternal healthBirths attended by skilled health staff (percent of total) .. 42.0 31.0 54.0Maternal mortality ratio (modeled estimate, per 100,000 live births) .. .. 1000.0 700.0
Combat HIV/AIDS, malaria, and other diseasesContraceptive prevalence (percent of women ages 15-49) .. 25.0 12.0 17.0Incidence of tuberculosis (per 100,000 people) 158.0 155.0 182.0 248.0Prevalence of HIV, female (percent ages 15-24) .. .. .. 1.4Prevalence of HIV, total (percent of population ages 15-49) .. .. .. 2.0Tuberculosis cases detected under DOTS (percent) .. 11.0 17.0 17.0
Ensure environmental sustainabilityCO2 emissions (metric tons per capita) 0.1 0.1 0.1 0.1Forest area (percent of land area) 26.0 .. 25.0 25.0GDP per unit of energy use (constant 2000 PPP $ per kg of oil equivalent) .. .. .. ..Improved sanitation facilities (percent of population with access) 7.0 .. .. 13.0Improved water source (percent of population with access) 38.0 .. .. 72.0Nationally protected areas (percent of total land area) .. .. .. 15.4
Develop a global partnership for developmentAid per capita (current US$) 38.0 50.0 30.0 61.0Debt service (PPG and IMF only, percent of exports of G&S, excl. workers' remittances) 7.8 14.6 20.3 6.8
Internet users (per 1,000 people) 0.0 0.0 1.0 5.0Personal computers (per 1,000 people) 0.0 0.0 1.0 2.0Total debt service (percent of exports of goods, services and income) 6.8 11.9 14.9 ..Unemployment, youth female (percent of female labor force ages 15-24) .. .. .. ..Unemployment, youth male (percent of male labor force ages 15-24) .. .. .. ..Unemployment, youth total (percent of total labor force ages 15-24) .. .. .. ..
OtherFertility rate, total (births per woman) 6.9 6.9 6.3 5.9GNI per capita, Atlas method (current US$) 350.0 240.0 250.0 420.0GNI, Atlas method (current US$) (billions) 2.9 2.4 2.8 5.9Gross capital formation (percent of GDP) 18.2 22.8 22.7 18.0Life expectancy at birth, total (years) 48.0 46.0 47.0 48.0Literacy rate, adult total (percent of people ages 15 and above) .. .. .. 22.0Population, total (millions) 8.5 9.8 11.3 14.3Trade (percent of GDP) 35.6 39.5 34.4 30.6Source: World Development Indicators database, 2008.
(2015 target: various)
(2015 target: reduce 1990 under 5 mortality by two-thirds)
(2015 target: reduce 1990 maternal mortality by three-fourths)
(2015 target: halt, and begin to reverse, AIDS, etc.)
(2015 target: various)
Table 9. Burkina Faso: Selected Indicators on the Millennium Development Goals, 1990–2006
(2015 target: halve 1990 US$ 1 a day poverty and malnutrition rates)
(2015 target: net enrollment to 100)
(2015 target: education ratio 100)
©International Monetary Fund. Not for Redistribution
29
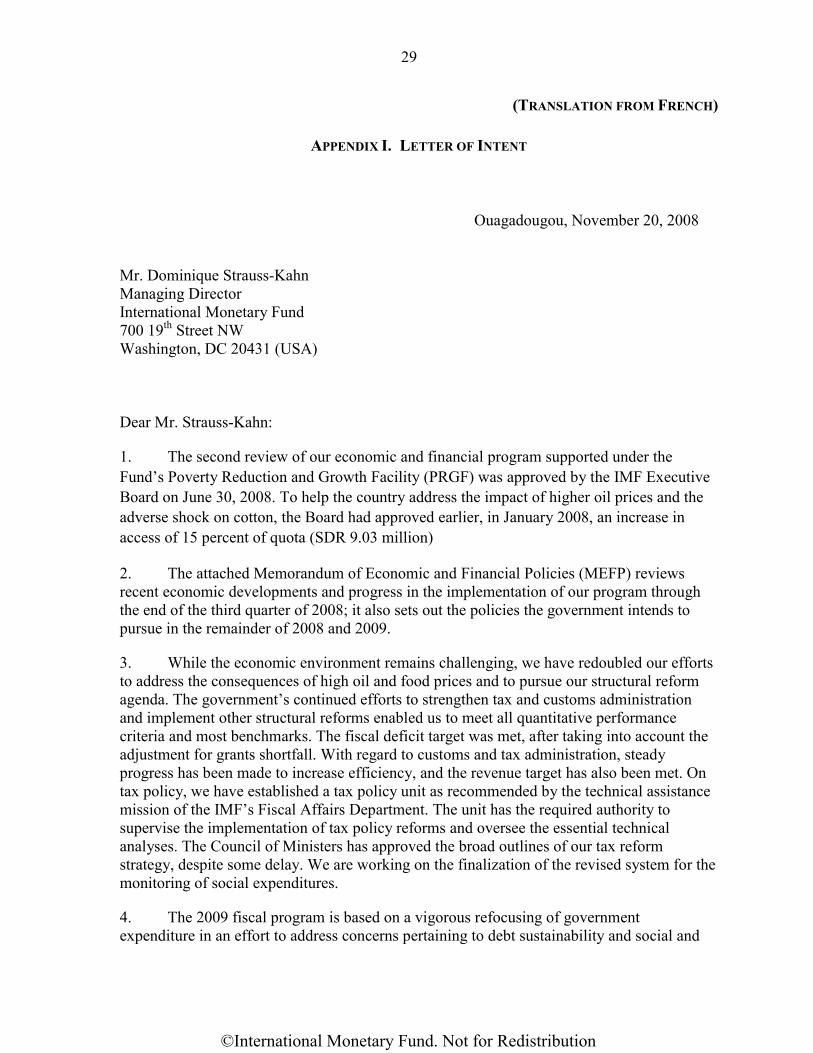
(TRANSLATION FROM FRENCH)
APPENDIX I. LETTER OF INTENT
Ouagadougou, November 20, 2008 Mr. Dominique Strauss-Kahn Managing Director International Monetary Fund 700 19th Street NW Washington, DC 20431 (USA) Dear Mr. Strauss-Kahn:
1. The second review of our economic and financial program supported under the Fund’s Poverty Reduction and Growth Facility (PRGF) was approved by the IMF Executive Board on June 30, 2008. To help the country address the impact of higher oil prices and the adverse shock on cotton, the Board had approved earlier, in January 2008, an increase in access of 15 percent of quota (SDR 9.03 million)
2. The attached Memorandum of Economic and Financial Policies (MEFP) reviews recent economic developments and progress in the implementation of our program through the end of the third quarter of 2008; it also sets out the policies the government intends to pursue in the remainder of 2008 and 2009.
3. While the economic environment remains challenging, we have redoubled our efforts to address the consequences of high oil and food prices and to pursue our structural reform agenda. The government’s continued efforts to strengthen tax and customs administration and implement other structural reforms enabled us to meet all quantitative performance criteria and most benchmarks. The fiscal deficit target was met, after taking into account the adjustment for grants shortfall. With regard to customs and tax administration, steady progress has been made to increase efficiency, and the revenue target has also been met. On tax policy, we have established a tax policy unit as recommended by the technical assistance mission of the IMF’s Fiscal Affairs Department. The unit has the required authority to supervise the implementation of tax policy reforms and oversee the essential technical analyses. The Council of Ministers has approved the broad outlines of our tax reform strategy, despite some delay. We are working on the finalization of the revised system for the monitoring of social expenditures.
4. The 2009 fiscal program is based on a vigorous refocusing of government expenditure in an effort to address concerns pertaining to debt sustainability and social and
©International Monetary Fund. Not for Redistribution
30
investment-related needs. We intend to ensure the rapid implementation of structural reforms, including in the areas of tax policy, the financial sector, and the cotton sector.
5. In support of our implementing our reform program, and on the strength of the policies set forth in the attached memorandum, we request completion of the third program review supported by the PRGF arrangement and the fourth disbursement, in the amount of SDR 4.014 million.
6. The government believes that the policies set forth in the attached MEFP will enable us to meet program objectives in a difficult external economic environment, characterized by lingering uncertainty concerning oil and food prices and global growth. The government is, nonetheless, determined to take any other measures that might become necessary to achieve that goal. Burkina Faso would consult with the Fund before revising any of the policies contained in the attached MEFP, in accordance with the Fund’s policy on such consultation. The fourth review under the PRGF arrangement is expected to be completed no later than end-July 2009 and the fifth review by end-January 2010.
7. The government intends to make the contents of this letter and the attached MEFP and Technical Memorandum of Understanding available to the public. Therefore, it authorizes the IMF to publish these documents on the IMF website once the Executive Board concludes the review.
Sincerely yours, Lucien Marie Noël BEMBAMBA Chevalier de l’Ordre National Commander of the National Order Attachments Memorandum on Economic and Financial Policies Technical Memorandum of Understanding
©International Monetary Fund. Not for Redistribution
31
ATTACHMENT I
MEMORANDUM ON ECONOMIC AND FINANCIAL POLICIES OF THE GOVERNMENT FOR END 2008-2009 (TRANSLATION FROM FRENCH)
I. INTRODUCTION
1. This memorandum updates Burkina Faso’s economic and financial program under the three-year Poverty Reduction and Growth Facility (PRGF) arrangement with the IMF. It summarizes recent economic developments, reviews performance under the PRGF-supported program, and updates the government’s strategy for pursuing its financial and economic policies. The program, which was approved by the IMF’s Executive Board on April 23, 2007, aims at consolidating macroeconomic stability and fostering conditions that can sustain high economic growth and reduce poverty.2 The second review was completed on June 30, 2008. During 2008, the government put in place several measures to address the impact of high food and oil prices, continued its efforts to strengthen tax and customs administration, and followed through on other structural reforms.
II. RECENT ECONOMIC DEVELOPMENTS AND PROGRAM IMPLEMENTATION THROUGH THE
THIRD QUARTER OF 2008
A. Recent Economic Developments
2. Recent economic performance has been subdued, largely as a result of external shocks. GDP growth in 2007 has been revised downward, from 4 percent to 3.6 percent, primarily reflecting the impact of the floods on agricultural production, including on cotton. The soaring food and oil prices, particularly in the first half of 2008, lackluster global activity, and a strong euro (which put pressure on competitiveness) held growth below trend. Inflation, which had been negative on average in 2007, attained 8.5 percent (as an annual average) in September.
3. In common with other countries in the sub-region, we had felt the need to offset the impact of the high prices of essential goods. Twice we extended these temporary measures to cushion the impact of the high prices of these products, first by three months, and then by one additional month in order to tide things over until the following harvest which is expected to have a positive effect. These measures include temporary suspensions of custom duties and/or VAT on some imported goods, notably rice, milk, salt, milk-based food products for children, as well as durum wheat semolina. The measures also include temporary VAT exemptions on locally produced goods, such as soap and cooking oil. In addition, we have monitored price developments and strengthened dialogue with importers
2 The program document was published as IMF country report (CR007/153) on the IMF website (www.imf.org).
©International Monetary Fund. Not for Redistribution
32
and wholesalers in order to protect the most vulnerable. To support the poorest people, we have also made use of our stock of food reserves, which are being replenished. The recent decrease in food prices allowed us to eliminate these temporary measures in October. We did not fully pass through international oil price increases to domestic pump prices either.
4. The impact of the general increase in prices was considerable, particularly during the first half of the year. This led to strike action by trade unions as well as to demonstrations against the higher living costs in the major urban centers in March and in April 2008. The government’s immediate announcement of temporary measures and the prospect of a better harvest served to soothe tensions.
5. In July 2008, we announced an adjustment in the prices of petroleum products. The increase ranged from 6 percent (lamp oil) to 15 percent (super 91 and diesel). To show the fiscal impact of the temporary suspension of the automatic price adjustment mechanism, we published with the latest increase actual pump prices for the various types of products together with the prices that would have been obtained with the full application of the mechanism. At current prices, the gap between pump prices and prices mandated by the oil price mechanism is closed.
6. We are in regular dialogue with our technical and financial partners. In July the Millennium Challenge Corporation approved a grant of US$480.9 million for Burkina Faso. The five-year agreement will help the country reduce poverty and stimulate economic growth through investments intended to improve indicators of primary education, agricultural productivity, land reform, and farm-to-market roads.
B. Program Implementation
7. Key program targets for the review were met. The June target for the fiscal deficit (a quantitative PC) was met, taking into account the shortfall in grants. The revenue collection target (indicative target) was also met. The effect of the temporary suspension of import duty and the VAT for certain products was offset thanks to strong tax revenues linked to trade and steady progress in the tax and customs administrations.
8. Progress has been made in meeting structural reform objectives.
• Tax administration. We have made significant progress with the computerization of the Large Taxpayer Office (LTO) and the Medium Taxpayer Office (MTO). The IT system SINTAX is fully operational at both the LTO and MTO. We continue to use the notification system for late-filers and non-filers to remind them of their obligation to file tax returns. The non-filer rate was at about 6 percent in June, in line with program objectives to keep it at less than 7 percent by end-2008 for the industrial, business, and agricultural profits tax (BIC PM), the tax on wages and benefits (IUTS), and the VAT. We have also started selective audits to reduce the high rate of large taxpayer VAT returns that have either zero liabilities or structural credit positions. We have started to check the plausibility of information from tax offices for large and medium taxpayers with customs data. This reconciliation exercise has enabled us to include a number of corporations in the LTO and MTO.
©International Monetary Fund. Not for Redistribution
33
• Customs administration: The transit module of ASYCUDA is now operational and the selectivity model is fully integrated. The transit module helps us to improve transit monitoring by providing offices at points of entry, destination, and exit with real-time information on inbound and outbound traffic and clearances. The electronic interconnection between the various border offices and the central administration was completed in November 2007. The selectivity module allows declarations to be automatically assigned to the appropriate customs channel. The selectivity module currently assigns about 20 percent of all declarations to the blue and green channels, thus we are on track to meet the end-December benchmark. A number of customs brokers (commissionnaires en douane) are already making use of ASYCUDA’s remote access capabilities, which allows them to file declarations from their own premises. We have also integrated our customs valuation database with ASYCUDA facilitating automatic verification of declared customs values. In addition, we are requiring and using pre-shipment inspection certificates for all imported goods, in accordance with the regulations.
• Tax policy: A tax policy group (cellule) was established in July. The group is made up of three technical advisers from the Ministry of Finance, the directors of the three revenue-collecting agencies, and two outside tax experts. In early October, the Council of Ministers approved a tax reform strategy, which lays out the focus of our tax reform efforts.
• Public procurement. In the context of our action plan to improve the public procurement system, following the adoption in 2007 of new regulations now covering the delegation of public services, we have initiated important reforms with the objective of increasing transparency in public procurement. Thus, we have set up an autonomous regulatory authority, which is in charge of managing litigations related to procurement contracts, and strengthening administrative capacities of the different actors of the sector. We have also initiated a process of deconcentrating the public procurement administration in the line ministries and regions, in order to foster files processing. We have also developed an integrated public procurement management software program, which is expected to help monitoring the process of awarding public contracts and therefore ensure a more rigorous application of public procurement standards. In particular, we have set ourselves the target of reducing the rate of directly-awarded procurement contracts from 13 percent to less than 10 percent by end-2008.
C. Macroeconomic Framework
9. We continue to adjust to a challenging economic outlook, related to a number of external factors. The anticipated recovery in domestic agricultural output, primarily attributable to favorable climatic conditions, should help ease inflationary pressures and support a progressive relaunching of growth. After significant floods in 2007, which led to a poor harvest, preliminary reports indicate that most farming regions have enjoyed very good rains this year. A good harvest, together with no further international price pressures, is expected to reduce price pressures. Even if the increase in oil and food prices and a strong euro—particularly in the first half of 2008—had an impact on the competitiveness of the
©International Monetary Fund. Not for Redistribution
34
economy, we believe that agricultural production will grow by about 10-15 percent. This expected recovery in agriculture—especially in cotton—and the start of the operation of three gold mines are expected to support the revival of activity. According to projections, the growth in real GDP is expected to stay in the vicinity of 4.5 percent in 2008. To the extent that entrenched inflation expectations are contained, fiscal policy, agreed during the second review, seems broadly adequate. This is predicated on a program target for the overall deficit in the amount of CFAF 195 billion in 2008, and substantial fiscal consolidation in 2009.
10. Burkina Faso was reclassified as a medium performer based on the World Bank Country Policy and Institutional Assessment (CPIA) rating in mid-2008. This reclassification changed the thresholds for debt sustainability analysis. Thus, the risk of debt distress has become high. To address the issue of high risk of debt distress, we will:
• improve our institutions and put in place structural reforms which would pave the way for a higher CPIA rating, thus raising the relevant debt thresholds. Further steps, in line with the objectives of this program, will focus on tax policy and tax administration reforms; PFM reforms (mobilizing more revenue, improving the quality of tax administration, and reducing corruption); successfully implementing FSSA recommendations to strengthen the financial sector; and improving the regulation of business, and more generally, strengthening governance in the broadest sense of the term;
• reduce significantly the budget deficit over the medium term;
• work to attract additional donor aid to limit recourse to expensive domestic financing; and
• set up an integrated domestic debt data framework and continue to train officials in debt sustainability analyses and debt management;
• strengthen the monitoring and supervision of public enterprises and the efforts to identify concessional financing.
Fiscal Policy 11. We prepared a supplementary budget (LFR) for 2008 while keeping the programmed budget deficit at its level. The LFR incorporates the impact of higher inflation and prioritizes support for agricultural production. There is also a need to compensate the national oil company SONABHY for margin losses, which derive from the limited price pass-through over an extended period. The supplementary budget allocates CFAF 8.5 bn in additional subsidies for inputs in the agricultural sector under the government food security initiative, as well as CFAF 3 billion in transfers to SONABHY.
12. Due to the above-mentioned debt sustainability considerations, fiscal consolidation is a key element of the 2009 budget. The 2009 budget seeks to strike a balance between fiscal adjustment, acute social needs, the findings of the recent debt sustainability analysis, and potential expenditure compression. We will aim for a deficit
©International Monetary Fund. Not for Redistribution
35
target of 4.9 percent of GDP as a decisive first step toward reducing the deficit over the medium to long term to below 3 percent, which, based on the recent joint IMF-World Bank DSA, is needed to stabilize debt ratios. On the revenue side, the budget incorporates some short-term tax policy measures, in particular to simplify tax administration for large enterprises. We will also eliminate for large enterprises prepayment deductions of profit taxes for payments made to service providers and for imports and purchases from wholesalers, semi-wholesalers, and producers, and we will adjust the taxation rates for tobacco. Thanks to the combined effect of the planned phasing-out of the temporary tax and customs measures to counter the impact of food price developments and continued efforts to enhance the efficiency of tax and customs administration, tax revenue as a share of GDP is expected to increase by 0.1 percent of GDP.
13. Helping the population cope with the impact of rising food and energy prices is a key priority. To achieve this goal, the government will strike a balance between safeguarding macroeconomic stability and providing immediate relief to those in need. We will examine the targeting of existing measures such as subsidies, with a view to ensuring that they truly benefit the most vulnerable members of society. In addition, working in conjunction with certain technical and financial partners, we will work to implement a system of transfers to the most disadvantaged households in the two largest cities, in order to counter the effects of food and energy price inflation. We will also follow-up with the IMF and the Bank on the ongoing analysis of further policy measures for protecting the poorest households from food and energy price inflation.
14. Tracking social expenditure more closely and making spending more efficient will help achieve the Millennium Development Goals (MDG). We have improved on our previous system of tracking social expenditures that largely focused on a classification by ministry. We are working on finalizing the revised system, which covers all categories of domestically-financed spending except personnel expenditure (benchmark for September 2008). Some delays were observed in implementation as it is necessary to identify social expenditures on the basis of carefully defined criteria and to integrate the two computer systems. We believe that this system will be functional by early 2009 (benchmark for February 2009). To include salaries and foreign-financed capital expenditure in the tracking of poverty-reducing expenditures, an interface will be built between the SIGASPE software program and the CID, in tandem with an extension of the various classifications to include external financing by means of interfaces with the software program that is currently being developed for managing these financing resources. Given the complexity of the project, notably linked to the need for numerous interfaces with other software systems, full implementation is expected in 2009 at the earliest. Furthermore, work is in progress to migrate from the functional classification in the 1986 GFSM which includes 14 classes, to the 2001 GFSM Manual which has just 10 classes.
15. Follow-up action with respect to the domestic debt audit is in progress. As at end-September 2008, over CFAF 49 billion in claims of various government suppliers had been settled. Claims in the amount of approximately CFAF 6.2 billion are still being processed. The amount outstanding is in the vicinity of CFAF 22.4 billion, including CFAF 13 billion related to claims for which there are no supporting documents. To prevent such obligations from recurring, all ministries and institutions adopted procurement plans, the implementation of which is periodically monitored by the contract officers (Personnes responsables des
©International Monetary Fund. Not for Redistribution
36
marchés (PRM)) created in the context of efforts to reform public procurement. In addition, appropriations managers produce quarterly reports on the physical and financial execution of the budget. We are committed to developing a financial plan to clear remaining claims, which will be approved by the Cabinet in March 2009 (new benchmark).
D. Fiscal Structural Reforms
Strengthening Tax and Customs Administration
16. Taxpayer compliance will continue to be a priority. We will continue to use our current notification system and send reminder letters to late-filers and non-filers without delay. This should allow us to achieve a nonfiler rate of less than 7 percent by end-2008 and 5 percent by end-2009 for VAT, the BIC PM and IUTS (indicative target). To improve tax compliance further, we also plan to use audits to reduce the high rate of large taxpayer VAT returns that have either zero liabilities or structural credit positions.
17. We will continue to make use of the ASYCUDA modules to improve customs administration. The selectivity module currently assigns about 20 percent of all declarations to the blue and green channels. We plan to gradually increase this rate to 30 percent in December (benchmark) while seeking a fair balance between improving customs procedures for importers and the risk of revenue losses resulting from fraud. In addition, we will further advance customs administration by pursuing efforts to train personnel in various priority areas, in particular in the area of tracking and utilizing the single customs declaration form, with a view to ensuring that this tool is used more effectively.
Tax Policy Reform
18. Increasing revenue is at the core of our macroeconomic stabilization policy, and requires substantial reform of the tax system. Our tax system has still a narrow base, as a result of the structure of GDP and numerous exemptions; and its structure is complex, as a result of withholdings and prepayment deductions.
19. Our tax reform strategy is designed to:
• enhance the tax revenue by broadening the tax base while promoting investment and economic growth;
• improve the consistency of taxation systems;
• simplify the tax laws;
• align the structure of tax revenues to reflect the extent to which Burkina Faso opens up to the WAEMU market and international market.
20. The new tax policy unit will play a key role in driving the reform process. Under the auspices of this unit, we will set up several working groups that will be working on different areas in parallel:
©International Monetary Fund. Not for Redistribution
37
• the introduction of a single tax on business profits to replace the current one, which comprises several schedules. Currently, tax revenues from the BIC are fairly low (about 1.6 percent of GDP). The tax is very complex and incorporates numerous exemptions.
• the review of the investment code, with the objective of its simplification and integration in the general tax code. The investment code, which was put in place in 1995 and modified in 1997 and 2000, defines six different regimes with significant investment incentives, but the positive impact of these incentives is unclear.
• VAT reform. We intend to raise the VAT thresholds within the budget in order to ensure that they are managed more efficiently. In revising the thresholds, we will follow closely developments at the WAEMU level. The WAEMU is working on defining new tax thresholds.
Text Table 1: Work Plan for Tax Policy Reform
Measures Timeline Cabinet approval of comprehensive tax policy reform strategy with outline of main pillars and indicative timetable
End-September 2008 (benchmark)
Set-up different working groups for business tax, investment code, and VAT
October 2008
Prepare overview of tax exemptions, create a statistical database, including data on profits, tax deductions etc. for last three years
November/december 2008
Develop tax simulation models to analyze alternative tax policies and trends, begin stakeholder consultation
December 2008 / January 2009
First proposal for revised business tax, investment code, and VAT, to IMF for comment
February 2009
Stakeholder consultations, public information February, March, 2009 Submit to Cabinet detailed tax reform proposals focusing on business tax, investment code, and VAT, with quantified estimates of the revenue impact of the reform measures
April 2009 (benchmark)
Preparation of legal text June/July Submit to National Assembly 2010 budget, including tax reform measures pertaining to VAT, business tax, and investment code that will take effect with the 2010 budget
October 2009 (PC)
21. The tax reform program builds on a work plan which should allow us to reach our goal of finalizing the tax reform during 2009 (text table 1). Importantly, we will need to collect data, build up a framework to assess the impact of changes in the business tax, investment code, and VAT.
©International Monetary Fund. Not for Redistribution
38
22. Once all the data are in place, the simulation of the revenue impact of the various tax measures will make it possible to guide the detailed preparation of our tax reform. We will conduct tax simulations to quantify alternative options. Also, broad stakeholder consultations will be a key aspect of the preparation. We intend to submit to the Cabinet detailed tax reform proposals by April 2009, focusing on business tax, the investment code, and VAT, which will include a quantification of the revenue impact of the reform measures (benchmark). Afterwards, the tax policy reform will be finalized and submitted to the National Assembly (Fall 2009), to take effect with the 2010 budget (PC). We shall consult the IMF throughout the reform process.
Public Financial Management
23. In January 2008, we set up six technical groups entrusted with monitoring the implementation of our new sectoral strategy (Stratégie de renforcement des finances publiques—SRFP) in an effort to strengthen public financial management. This strategy focuses on the following areas: a) budget management; b) raising and managing revenue; c) public procurement; d) supervisory systems; e) decentralization; and f) capacity-building. Progress is monitored at quarterly intervals. With regard to budget management, we are formalizing for the first time this year a midterm review of budget outturn. We have made headway in implementing an action plan for expediting the processing of payments and eliminating redundant control procedures (structural benchmark end-December 2008). The next steps to improve public financial management are as follows: starting the implementation of an action plan for the budget process, with the objective of implementing fully the budget program by 2012, disseminating the new rules regarding public procurement, delegation of public services, and strengthening the administrative capacity of other actors of the sector.
Financial Sector Development 24. An action plan, based on relevant conclusions of the FSAP, will be elaborated by March 2009 (Text Table 2, new PC). To monitor the FSAP recommendations, we will set up a working group comprising representatives of the BCEAO, the Ministry of Finance, the banking sector, and other stakeholders. The action plan will focus on measures capable of being implemented domestically (rather than measures falling within the purview of WAEMU). It will notably cover the following areas: (i) facilitating cotton sector financing; (ii) reducing government ownership in the banking sector; and (iii) improving microfinance supervision.
25. Several reforms are under way and reflect some of the FSAP recommendations. To reduce the risks associated with cotton sector financing, the national banking pool has set up a system for monitoring cotton exports and payments. We have also begun to reduce government involvement in the banking sector. After completing the sale of 37.5 percent of government shares to UBA, the authorities initiated discussions with ECOBANK in mid-2008 to sell to ECOBANK a portion of government stock in BACB. Over time, ECOBANK will hold a total stake of 90 percent, including a portion of the shares of other shareholders.
©International Monetary Fund. Not for Redistribution
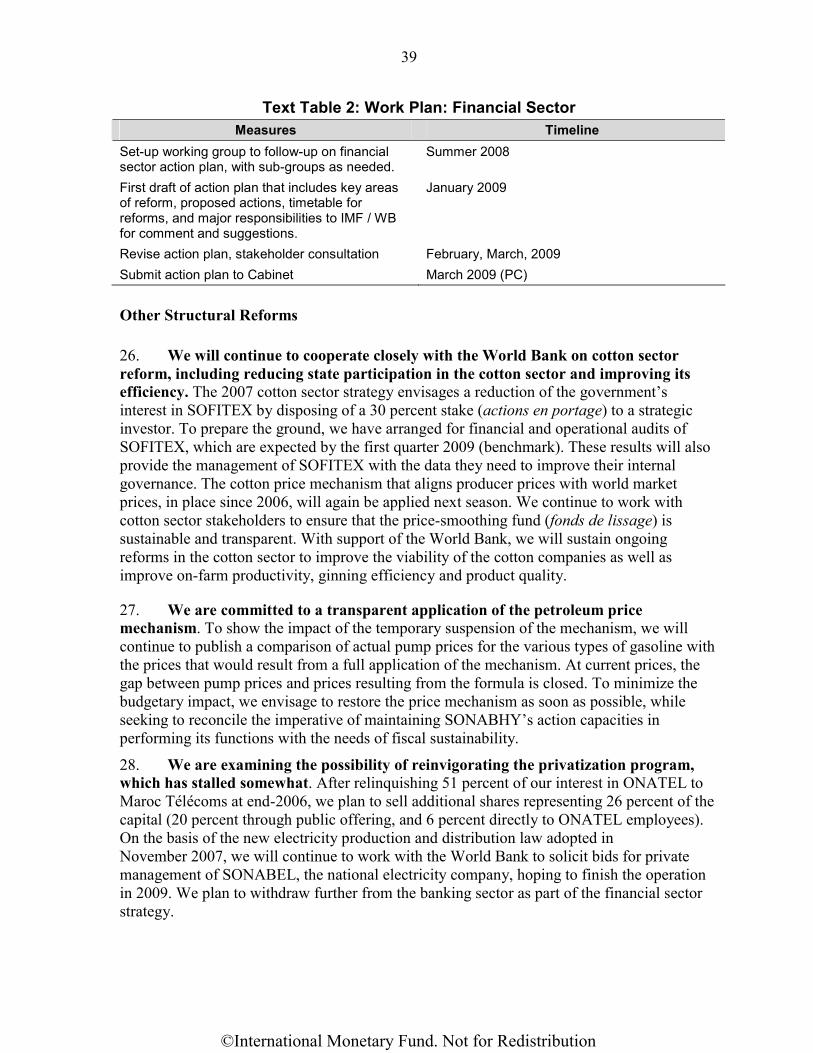
39
Text Table 2: Work Plan: Financial Sector Measures Timeline
Set-up working group to follow-up on financial sector action plan, with sub-groups as needed.
Summer 2008
First draft of action plan that includes key areas of reform, proposed actions, timetable for reforms, and major responsibilities to IMF / WB for comment and suggestions.
January 2009
Revise action plan, stakeholder consultation February, March, 2009 Submit action plan to Cabinet March 2009 (PC) Other Structural Reforms 26. We will continue to cooperate closely with the World Bank on cotton sector reform, including reducing state participation in the cotton sector and improving its efficiency. The 2007 cotton sector strategy envisages a reduction of the government’s interest in SOFITEX by disposing of a 30 percent stake (actions en portage) to a strategic investor. To prepare the ground, we have arranged for financial and operational audits of SOFITEX, which are expected by the first quarter 2009 (benchmark). These results will also provide the management of SOFITEX with the data they need to improve their internal governance. The cotton price mechanism that aligns producer prices with world market prices, in place since 2006, will again be applied next season. We continue to work with cotton sector stakeholders to ensure that the price-smoothing fund (fonds de lissage) is sustainable and transparent. With support of the World Bank, we will sustain ongoing reforms in the cotton sector to improve the viability of the cotton companies as well as improve on-farm productivity, ginning efficiency and product quality.
27. We are committed to a transparent application of the petroleum price mechanism. To show the impact of the temporary suspension of the mechanism, we will continue to publish a comparison of actual pump prices for the various types of gasoline with the prices that would result from a full application of the mechanism. At current prices, the gap between pump prices and prices resulting from the formula is closed. To minimize the budgetary impact, we envisage to restore the price mechanism as soon as possible, while seeking to reconcile the imperative of maintaining SONABHY’s action capacities in performing its functions with the needs of fiscal sustainability.
28. We are examining the possibility of reinvigorating the privatization program, which has stalled somewhat. After relinquishing 51 percent of our interest in ONATEL to Maroc Télécoms at end-2006, we plan to sell additional shares representing 26 percent of the capital (20 percent through public offering, and 6 percent directly to ONATEL employees). On the basis of the new electricity production and distribution law adopted in November 2007, we will continue to work with the World Bank to solicit bids for private management of SONABEL, the national electricity company, hoping to finish the operation in 2009. We plan to withdraw further from the banking sector as part of the financial sector strategy.
©International Monetary Fund. Not for Redistribution

40
29. We have launched a large-scale governmental initiative (supported by our development partners) to boost domestic agricultural production, employment, household income, and exports. The objective of the program is to complete by 2015 the development of market integrated agriculture and competitive agro-industrial products. More specifically, the program seeks to improve agricultural productivity through diversification and intensification of production.
30. We are continuing to improve the business climate. Burkina Faso was classified among the world’s ten leading reformers according to the World Bank’s Doing Business indicators and moved from 161st place in 2008 to 148th place in 2009. In the context of our cooperation with International Finance Corporation (IFC), we are pursuing policies to improve our business climate.
31. We will continue to take steps to improve governance. Thanks to the government’s bold efforts, Burkina Faso has improved its ranking in the Transparency International index in 2008, moving from 105th to 85th place. The new government supervisory authority (Autorité supérieure de contrôle d'État (ASCE)), created in December 2007, has been operational since July 2008. The new institution enjoys more independence and power to investigate government agencies, monitor the work of audit offices in different ministries, and take legal actions. It also keeps track of ongoing judicial proceedings. We are currently in the process of publicizing the ASCE’s services among a broader audience. We have set up a hot-line and an anonymous mailbox for those who wish to report misconduct. The ASCE is in the process of preparing a more detailed work program and will be publishing annual reports in future.
E. Program Monitoring
32. The program will continue to be monitored through the agreed quantitative financial targets (Table 1) and structural performance criteria and benchmarks (Table 2), and through program reviews. The third program review is scheduled to be completed by end-January 2009, and the fourth review by end-July 2009. For the fourth review, the quantitative financial targets for end-December 2008 are performance criteria. We have agreed on new conditionality in the areas of domestic debt audit, financial sector reforms, and cotton sector reform. Moreover, because of the high risk of debt distress, we will strengthen surveillance of borrowing by public enterprises, and we will work to enhance their access to concessional financing. Definitions of the variables used and the reporting requirements are given in the attached Technical Memorandum of Understanding (TMU).
©International Monetary Fund. Not for Redistribution
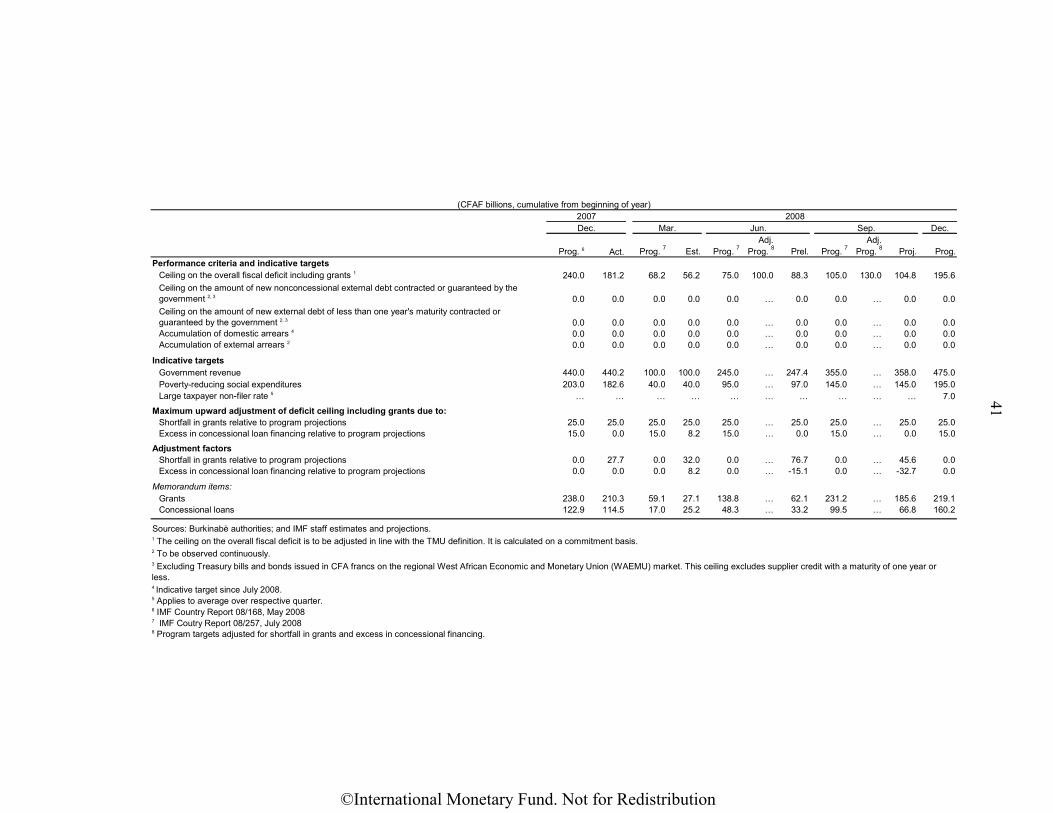
41
Adj. Adj.Prog. 6 Act. Prog. 7 Est. Prog. 7 Prog. 8 Prel. Prog. 7 Prog. 8 Proj. Prog.
Performance criteria and indicative targetsCeiling on the overall fiscal deficit including grants 1 240.0 181.2 68.2 56.2 75.0 100.0 88.3 105.0 130.0 104.8 195.6Ceiling on the amount of new nonconcessional external debt contracted or guaranteed by the government 2, 3 0.0 0.0 0.0 0.0 0.0 … 0.0 0.0 … 0.0 0.0Ceiling on the amount of new external debt of less than one year's maturity contracted or guaranteed by the government 2, 3 0.0 0.0 0.0 0.0 0.0 … 0.0 0.0 … 0.0 0.0Accumulation of domestic arrears 4 0.0 0.0 0.0 0.0 0.0 … 0.0 0.0 … 0.0 0.0Accumulation of external arrears 2 0.0 0.0 0.0 0.0 0.0 … 0.0 0.0 … 0.0 0.0
Indicative targets Government revenue 440.0 440.2 100.0 100.0 245.0 … 247.4 355.0 … 358.0 475.0Poverty-reducing social expenditures 203.0 182.6 40.0 40.0 95.0 … 97.0 145.0 … 145.0 195.0Large taxpayer non-filer rate 5 … … … … … … … … … … 7.0
Maximum upward adjustment of deficit ceiling including grants due to:Shortfall in grants relative to program projections 25.0 25.0 25.0 25.0 25.0 … 25.0 25.0 … 25.0 25.0Excess in concessional loan financing relative to program projections 15.0 0.0 15.0 8.2 15.0 … 0.0 15.0 … 0.0 15.0
Adjustment factorsShortfall in grants relative to program projections 0.0 27.7 0.0 32.0 0.0 … 76.7 0.0 … 45.6 0.0Excess in concessional loan financing relative to program projections 0.0 0.0 0.0 8.2 0.0 … -15.1 0.0 … -32.7 0.0
Memorandum items:Grants 238.0 210.3 59.1 27.1 138.8 … 62.1 231.2 … 185.6 219.1Concessional loans 122.9 114.5 17.0 25.2 48.3 … 33.2 99.5 … 66.8 160.2
Sources: Burkinabè authorities; and IMF staff estimates and projections.
8 Program targets adjusted for shortfall in grants and excess in concessional financing.
1 The ceiling on the overall fiscal deficit is to be adjusted in line with the TMU definition. It is calculated on a commitment basis.
(CFAF billions, cumulative from beginning of year)
Mar.Dec.2007
Jun. Sep. Dec.2008
2 To be observed continuously.3 Excluding Treasury bills and bonds issued in CFA francs on the regional West African Economic and Monetary Union (WAEMU) market. This ceiling excludes supplier credit with a maturity of one year or less.
7 IMF Coutry Report 08/257, July 2008
5 Applies to average over respective quarter.
4 Indicative target since July 2008.
6 IMF Country Report 08/168, May 2008
©International Monetary Fund. Not for Redistribution
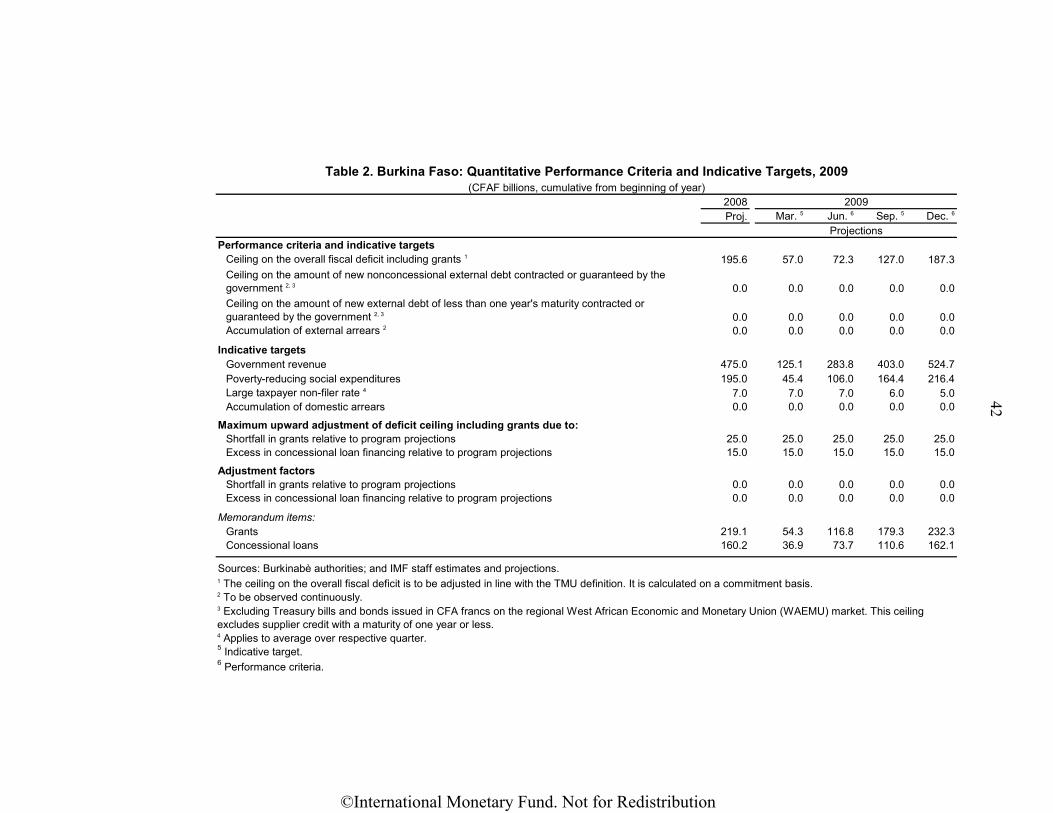
42
Mar. 5 Jun. 6 Sep. 5 Dec. 6
Performance criteria and indicative targetsCeiling on the overall fiscal deficit including grants 1 195.6 57.0 72.3 127.0 187.3Ceiling on the amount of new nonconcessional external debt contracted or guaranteed by the government 2, 3 0.0 0.0 0.0 0.0 0.0Ceiling on the amount of new external debt of less than one year's maturity contracted or guaranteed by the government 2, 3 0.0 0.0 0.0 0.0 0.0Accumulation of external arrears 2 0.0 0.0 0.0 0.0 0.0
Indicative targets Government revenue 475.0 125.1 283.8 403.0 524.7Poverty-reducing social expenditures 195.0 45.4 106.0 164.4 216.4Large taxpayer non-filer rate 4 7.0 7.0 7.0 6.0 5.0Accumulation of domestic arrears 0.0 0.0 0.0 0.0 0.0
Maximum upward adjustment of deficit ceiling including grants due to:Shortfall in grants relative to program projections 25.0 25.0 25.0 25.0 25.0Excess in concessional loan financing relative to program projections 15.0 15.0 15.0 15.0 15.0
Adjustment factorsShortfall in grants relative to program projections 0.0 0.0 0.0 0.0 0.0Excess in concessional loan financing relative to program projections 0.0 0.0 0.0 0.0 0.0
Memorandum items:Grants 219.1 54.3 116.8 179.3 232.3Concessional loans 160.2 36.9 73.7 110.6 162.1
Sources: Burkinabè authorities; and IMF staff estimates and projections.
2009
Projections
2008
Table 2. Burkina Faso: Quantitative Performance Criteria and Indicative Targets, 2009(CFAF billions, cumulative from beginning of year)
Proj.
2 To be observed continuously.3 Excluding Treasury bills and bonds issued in CFA francs on the regional West African Economic and Monetary Union (WAEMU) market. This ceiling excludes supplier credit with a maturity of one year or less.
1 The ceiling on the overall fiscal deficit is to be adjusted in line with the TMU definition. It is calculated on a commitment basis.
5 Indicative target.6 Performance criteria.
4 Applies to average over respective quarter.
©International Monetary Fund. Not for Redistribution
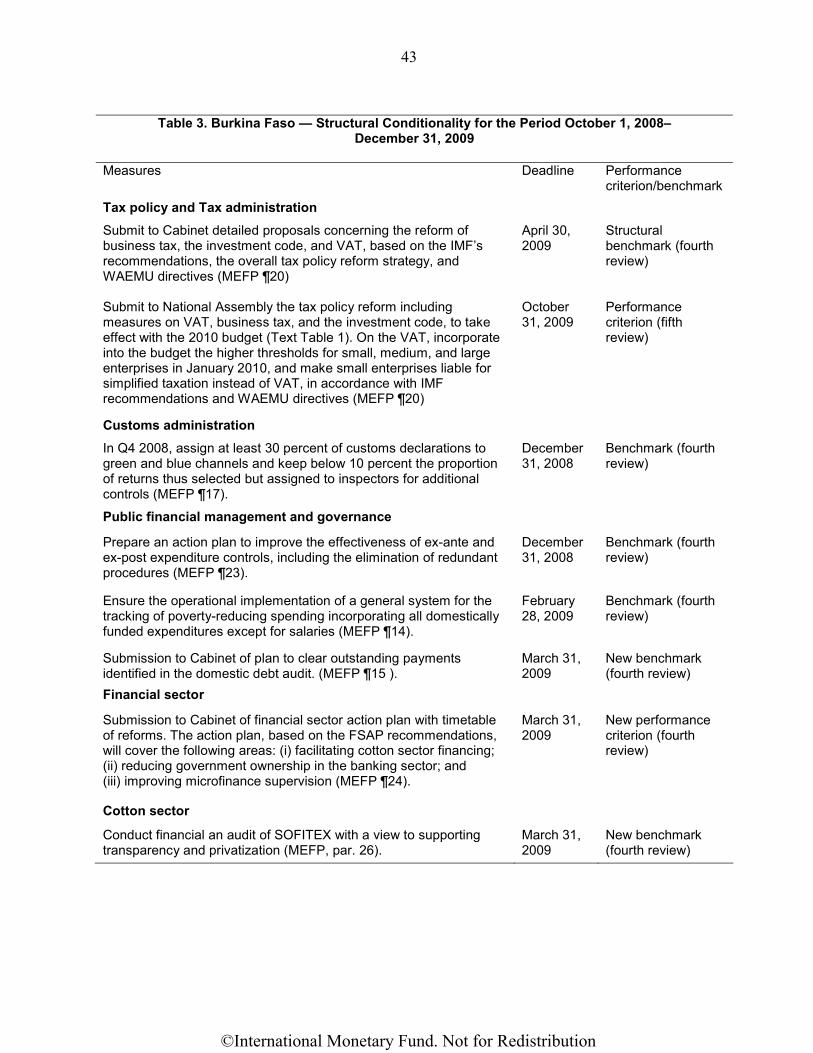
43
Table 3. Burkina Faso — Structural Conditionality for the Period October 1, 2008– December 31, 2009
Measures Deadline Performance criterion/benchmark
Tax policy and Tax administration
Submit to Cabinet detailed proposals concerning the reform of business tax, the investment code, and VAT, based on the IMF’s recommendations, the overall tax policy reform strategy, and WAEMU directives (MEFP ¶20)
April 30, 2009
Structural benchmark (fourth review)
Submit to National Assembly the tax policy reform including measures on VAT, business tax, and the investment code, to take effect with the 2010 budget (Text Table 1). On the VAT, incorporate into the budget the higher thresholds for small, medium, and large enterprises in January 2010, and make small enterprises liable for simplified taxation instead of VAT, in accordance with IMF recommendations and WAEMU directives (MEFP ¶20)
October 31, 2009
Performance criterion (fifth review)
Customs administration
In Q4 2008, assign at least 30 percent of customs declarations to green and blue channels and keep below 10 percent the proportion of returns thus selected but assigned to inspectors for additional controls (MEFP ¶17).
December 31, 2008
Benchmark (fourth review)
Public financial management and governance
Prepare an action plan to improve the effectiveness of ex-ante and ex-post expenditure controls, including the elimination of redundant procedures (MEFP ¶23).
December 31, 2008
Benchmark (fourth review)
Ensure the operational implementation of a general system for the tracking of poverty-reducing spending incorporating all domestically funded expenditures except for salaries (MEFP ¶14).
February 28, 2009
Benchmark (fourth review)
Submission to Cabinet of plan to clear outstanding payments identified in the domestic debt audit. (MEFP ¶15 ).
March 31, 2009
New benchmark (fourth review)
Financial sector
Submission to Cabinet of financial sector action plan with timetable of reforms. The action plan, based on the FSAP recommendations, will cover the following areas: (i) facilitating cotton sector financing; (ii) reducing government ownership in the banking sector; and (iii) improving microfinance supervision (MEFP ¶24).
March 31, 2009
New performance criterion (fourth review)
Cotton sector
Conduct financial an audit of SOFITEX with a view to supporting transparency and privatization (MEFP, par. 26).
March 31, 2009
New benchmark (fourth review)
©International Monetary Fund. Not for Redistribution
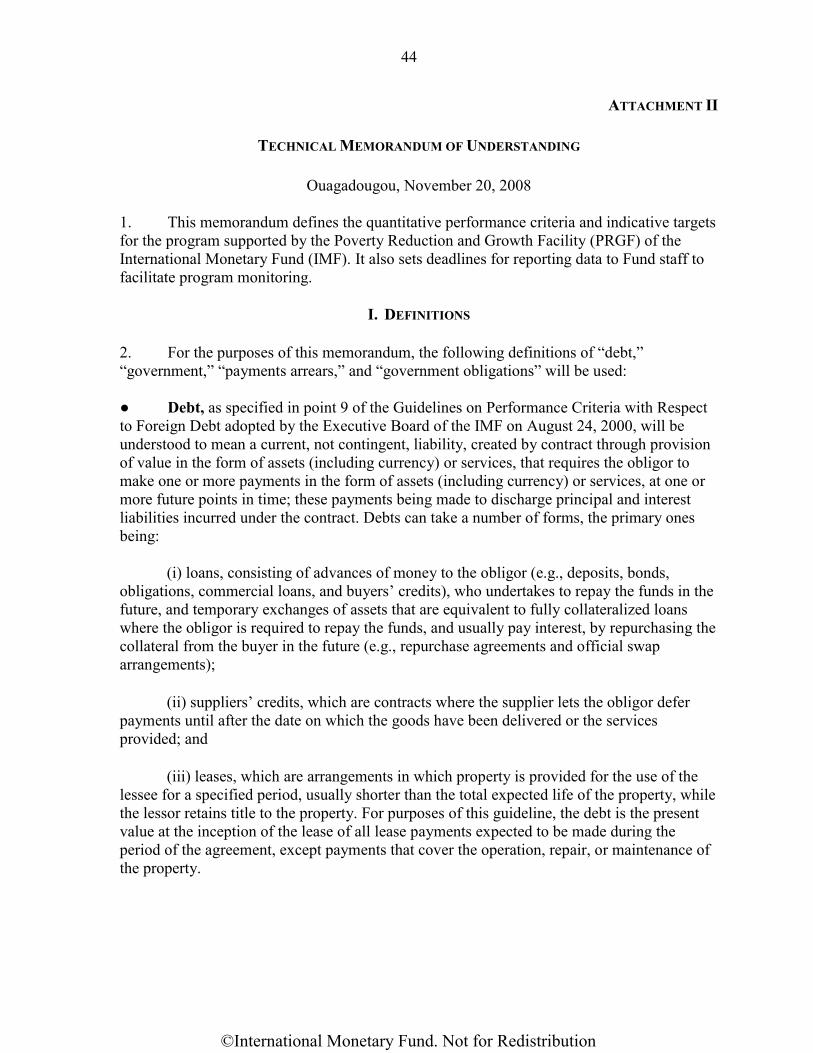
44
ATTACHMENT II
TECHNICAL MEMORANDUM OF UNDERSTANDING
Ouagadougou, November 20, 2008 1. This memorandum defines the quantitative performance criteria and indicative targets for the program supported by the Poverty Reduction and Growth Facility (PRGF) of the International Monetary Fund (IMF). It also sets deadlines for reporting data to Fund staff to facilitate program monitoring.
I. DEFINITIONS 2. For the purposes of this memorandum, the following definitions of “debt,” “government,” “payments arrears,” and “government obligations” will be used: ● Debt, as specified in point 9 of the Guidelines on Performance Criteria with Respect to Foreign Debt adopted by the Executive Board of the IMF on August 24, 2000, will be understood to mean a current, not contingent, liability, created by contract through provision of value in the form of assets (including currency) or services, that requires the obligor to make one or more payments in the form of assets (including currency) or services, at one or more future points in time; these payments being made to discharge principal and interest liabilities incurred under the contract. Debts can take a number of forms, the primary ones being:
(i) loans, consisting of advances of money to the obligor (e.g., deposits, bonds, obligations, commercial loans, and buyers’ credits), who undertakes to repay the funds in the future, and temporary exchanges of assets that are equivalent to fully collateralized loans where the obligor is required to repay the funds, and usually pay interest, by repurchasing the collateral from the buyer in the future (e.g., repurchase agreements and official swap arrangements);
(ii) suppliers’ credits, which are contracts where the supplier lets the obligor defer payments until after the date on which the goods have been delivered or the services provided; and
(iii) leases, which are arrangements in which property is provided for the use of the lessee for a specified period, usually shorter than the total expected life of the property, while the lessor retains title to the property. For purposes of this guideline, the debt is the present value at the inception of the lease of all lease payments expected to be made during the period of the agreement, except payments that cover the operation, repair, or maintenance of the property.
©International Monetary Fund. Not for Redistribution
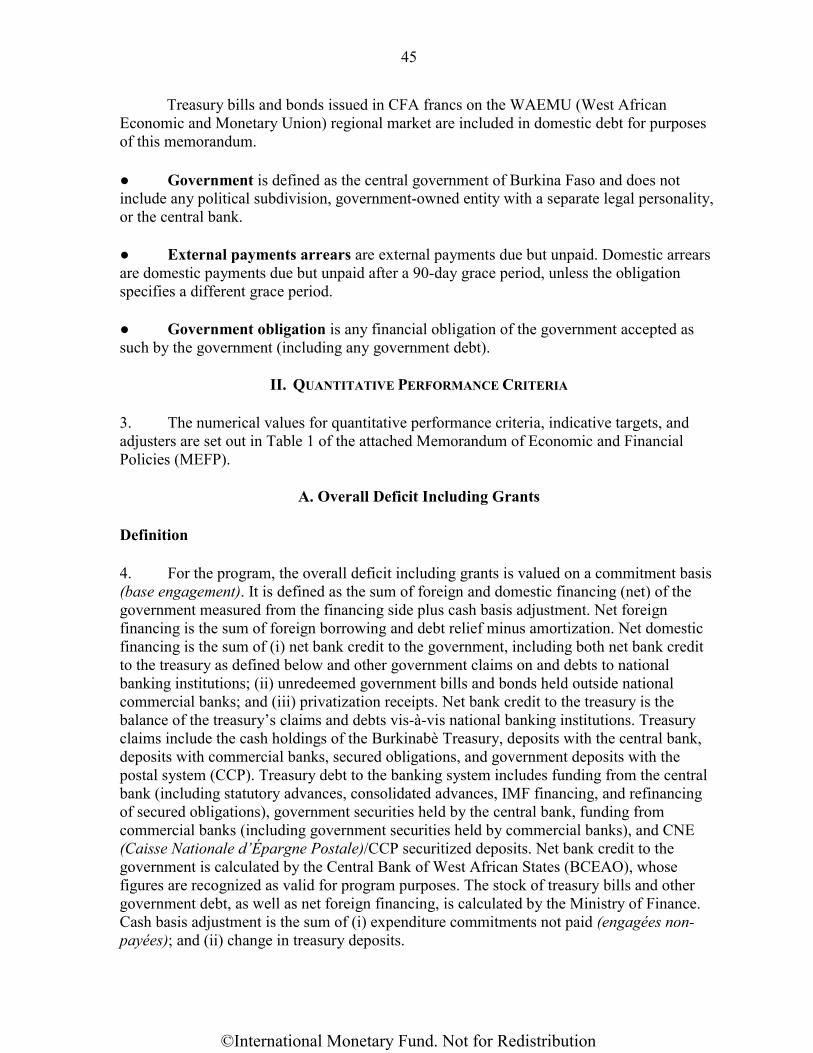
45
Treasury bills and bonds issued in CFA francs on the WAEMU (West African Economic and Monetary Union) regional market are included in domestic debt for purposes of this memorandum. ● Government is defined as the central government of Burkina Faso and does not include any political subdivision, government-owned entity with a separate legal personality, or the central bank. ● External payments arrears are external payments due but unpaid. Domestic arrears are domestic payments due but unpaid after a 90-day grace period, unless the obligation specifies a different grace period. ● Government obligation is any financial obligation of the government accepted as such by the government (including any government debt).
II. QUANTITATIVE PERFORMANCE CRITERIA
3. The numerical values for quantitative performance criteria, indicative targets, and adjusters are set out in Table 1 of the attached Memorandum of Economic and Financial Policies (MEFP).
A. Overall Deficit Including Grants
Definition 4. For the program, the overall deficit including grants is valued on a commitment basis (base engagement). It is defined as the sum of foreign and domestic financing (net) of the government measured from the financing side plus cash basis adjustment. Net foreign financing is the sum of foreign borrowing and debt relief minus amortization. Net domestic financing is the sum of (i) net bank credit to the government, including both net bank credit to the treasury as defined below and other government claims on and debts to national banking institutions; (ii) unredeemed government bills and bonds held outside national commercial banks; and (iii) privatization receipts. Net bank credit to the treasury is the balance of the treasury’s claims and debts vis-à-vis national banking institutions. Treasury claims include the cash holdings of the Burkinabè Treasury, deposits with the central bank, deposits with commercial banks, secured obligations, and government deposits with the postal system (CCP). Treasury debt to the banking system includes funding from the central bank (including statutory advances, consolidated advances, IMF financing, and refinancing of secured obligations), government securities held by the central bank, funding from commercial banks (including government securities held by commercial banks), and CNE (Caisse Nationale d’Épargne Postale)/CCP securitized deposits. Net bank credit to the government is calculated by the Central Bank of West African States (BCEAO), whose figures are recognized as valid for program purposes. The stock of treasury bills and other government debt, as well as net foreign financing, is calculated by the Ministry of Finance. Cash basis adjustment is the sum of (i) expenditure commitments not paid (engagées non-payées); and (ii) change in treasury deposits.
©International Monetary Fund. Not for Redistribution
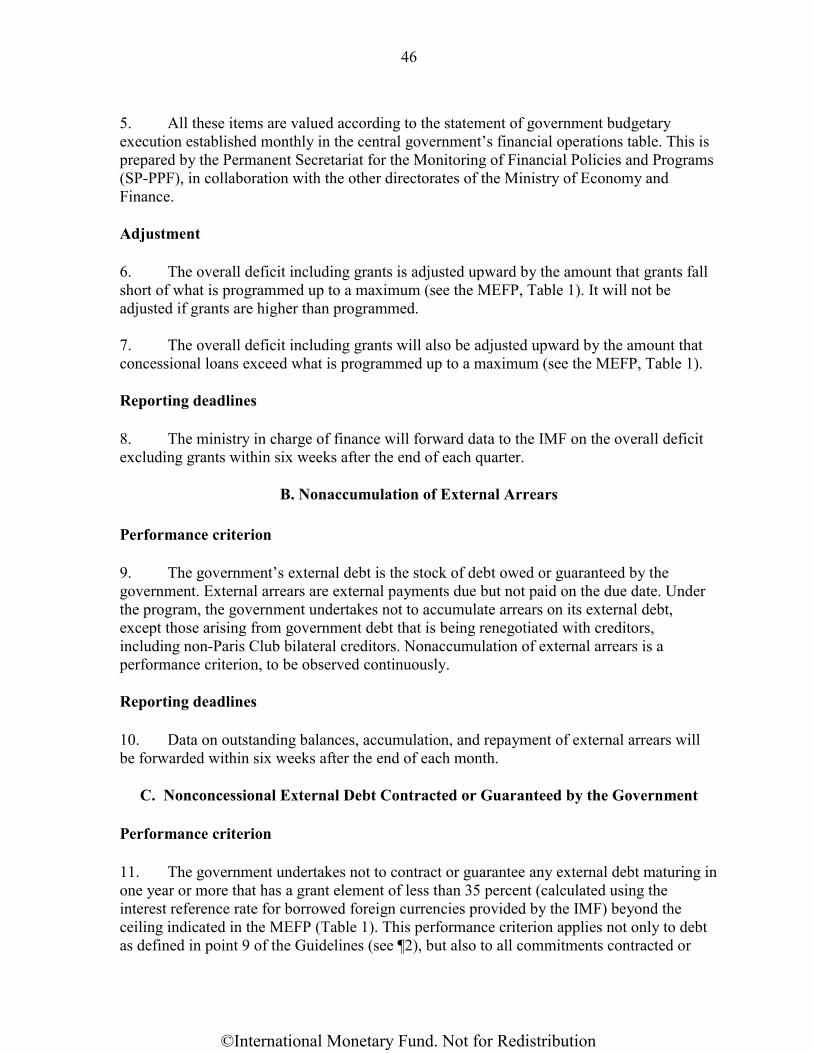
46
5. All these items are valued according to the statement of government budgetary execution established monthly in the central government’s financial operations table. This is prepared by the Permanent Secretariat for the Monitoring of Financial Policies and Programs (SP-PPF), in collaboration with the other directorates of the Ministry of Economy and Finance. Adjustment 6. The overall deficit including grants is adjusted upward by the amount that grants fall short of what is programmed up to a maximum (see the MEFP, Table 1). It will not be adjusted if grants are higher than programmed. 7. The overall deficit including grants will also be adjusted upward by the amount that concessional loans exceed what is programmed up to a maximum (see the MEFP, Table 1). Reporting deadlines 8. The ministry in charge of finance will forward data to the IMF on the overall deficit excluding grants within six weeks after the end of each quarter.
B. Nonaccumulation of External Arrears
Performance criterion 9. The government’s external debt is the stock of debt owed or guaranteed by the government. External arrears are external payments due but not paid on the due date. Under the program, the government undertakes not to accumulate arrears on its external debt, except those arising from government debt that is being renegotiated with creditors, including non-Paris Club bilateral creditors. Nonaccumulation of external arrears is a performance criterion, to be observed continuously. Reporting deadlines 10. Data on outstanding balances, accumulation, and repayment of external arrears will be forwarded within six weeks after the end of each month.
C. Nonconcessional External Debt Contracted or Guaranteed by the Government
Performance criterion 11. The government undertakes not to contract or guarantee any external debt maturing in one year or more that has a grant element of less than 35 percent (calculated using the interest reference rate for borrowed foreign currencies provided by the IMF) beyond the ceiling indicated in the MEFP (Table 1). This performance criterion applies not only to debt as defined in point 9 of the Guidelines (see ¶2), but also to all commitments contracted or
©International Monetary Fund. Not for Redistribution
47
guaranteed for which value has not been received. However, it does not apply to treasury bills and bonds issued in CFA francs on the WAEMU regional market. This performance criterion is to be observed continuously. Reporting deadlines 12. Details on any loan (terms and creditors) to the government or guaranteed by the government must be reported within four weeks of the end of each month. The same requirement applies to guarantees granted by the government.
D. Government Short-Term External Debt
13. The government undertakes not to accumulate or guarantee any new external debt with a contractual maturity of less than one year. This performance criterion applies not only to debt as defined in point 9 of the Guidelines (see ¶2), but also to commitments contracted or guaranteed for which value has not been received. Excluded from this performance criterion are import- and export-related loans and treasury bills and bonds issued in CFA francs on the WAEMU regional market and normal short-term suppliers’ credits. This performance criterion is to be observed continuously. As of April 1, 2007, the government of Burkina Faso had no short-term external debt.
III. OTHER QUANTITATIVE INDICATIVE TARGETS
14. The program also includes indicative targets on total government revenue, poverty-reducing social expenditures, nonaccumulation of domestic arrears, and large taxpayer non-filer rates.
A. Total Government Revenue
Definition 15. Total government revenue is valued on a cash basis. It includes all tax and nontax revenue collected by the Directorate General of Taxation, the Directorate General of Customs, the Burkinabè Treasury, and revenue collection units at ministries and institutions, and it also includes revenue from treasury checks. Reporting deadlines 16. Details on total revenue will be sent to IMF staff by the SP-PPF of the Ministry of Finance and Budget within six weeks after the end of each month.
B. Poverty-Reducing Social Expenditures
Definition 17. Poverty-reducing social expenditures are defined by the PRSP priority sector programs designed to accelerate the reduction of poverty. They cover all spending categories for the following ministries: Primary Education and Literacy; Health; Social Action and
©International Monetary Fund. Not for Redistribution

48
National Solidarity; Promotion of Women; Labor and Social Security; Employment and Youth; Agriculture, Water and Fishing Resources; Animal Resources; and Environment and Living Conditions. They also cover rural roads and HIPC resources (Category 5) for infrastructure spending and HIPC expenditures only for the Justice Ministry and the Ministry of Economy and Development. These expenditures are monitored directly through the budget. Reporting deadlines 18. The government will report within six weeks after the end of each month the monthly data on poverty-reducing social expenditures.
C. Nonaccumulation of Domestic Arrears
Definition 19. The government will not accumulate any arrears on domestic government obligations during the program period. This is a benchmark to be observed continuously. Reporting deadlines 20. Data on balances, accumulation, and repayment of arrears on domestic government obligations will be reported within four weeks after the end of each month.
D. Large Taxpayer Nonfiler Rate
Definition 21. The large taxpayer nonfiler rate is defined as the ratio of late and nonfilers in the Large Taxpayer Office (LTO) relative to the total number of taxpayers obligated to file in LTO. A late filer is anyone who files a tax return after the deadline. A nonfiler is anyone in the database who did not file taxes. The main tax categories are the VAT (TVA), the corporate income tax (BIC), and the tax on wage income (IUTS). Filing deadlines for the main tax categories are set in the tax code. Reporting deadlines 22. The government will report within two weeks after the end of each quarter the total number of late and nonfilers as well as the total number of taxpayers obligated to file in LTO for the main tax categories.
IV. STRUCTURAL PERFORMANCE CRITERIA
23. The program incorporates structural performance criteria (see the MEFP, Table 2).
©International Monetary Fund. Not for Redistribution
49
V. ADDITIONAL PROGRAM MONITORING INFORMATION
A. Public Finance
24. The government will report the following to Fund staff: • The monthly government flow-of-funds table (TOFE) and the customary appendix
tables, to be forwarded within six weeks after the end of each month; if data on actual investment financed by external grants and loans are not available in time, a linear implementation estimate based on the annual projections will be used.
• Complete monthly data on domestic budgetary financing (net bank credit to the government and stock of unredeemed treasury bonds and bills), to be provided within six weeks after the end of each month.
• Quarterly data on implementation of the public investment program, including details on financing sources, to be sent within six weeks after the end of each quarter.
• Quarterly data on external debt stock, external debt service, signing of external loans, and disbursements of external loans, to be sent within six weeks after the end of each quarter.
• Monthly data on prices and the taxation of petroleum products, including
(i) prices prevailing during the month; (ii) detailed calculation of the price structure, from the f.o.b.-MED price to the retail price; (iii) volumes purchased and made available for consumption by the petroleum distributor (SONABHY); and (iv) a breakdown of receipts from the taxation of petroleum products— customs duties, tax on petroleum products (TPP), and value-added tax (VAT)— and of subsidies, to be provided within four weeks after the end of each month.
• A monthly statement of the status of accounts with the treasury, classified by major
category (administrative services, state enterprises, mixed enterprises, public administrative enterprises, international organizations, private depositors, and others), to be provided within six weeks after the end of each month.
• Quarterly data for the large taxpayer office on (for TVA, BIC, IUTS) the numbers of:
registered taxpayers declarations received on time reminder letters sent to late and nonfilers.
©International Monetary Fund. Not for Redistribution

50
• These quarterly statistics are to be provided within two weeks after the end of each
quarter. Similarly, quarterly data on the following are to be sent within 2 weeks of the end of the quarter:
total number of customs declarations number of declarations selected by channel number of declarations by channel subject to non-standard treatment.
B. Monetary Sector
25. The government will provide the following information within six weeks after the end of each month: • the consolidated balance sheet of monetary institutions
• provisional data on the monetary survey provided six weeks after the end of each month (with final data provided ten weeks after the end of each month)
• borrowing and lending interest rates
• customary banking supervision indicators for bank and nonbank financial institutions, if necessary.
C. Balance of Payments 26. The government will report the following to Fund staff: • any revision of balance of payments data (including services, private transfers,
official transfers, and capital transactions), as they occur
• foreign trade statistics compiled by the National Statistics Institute, within three months after the end of the month concerned
• preliminary annual balance of payments data within nine months after the end of the year concerned.
D. Real Sector
27. The government will report the following to Fund staff: • disaggregated monthly consumer price indices, within two weeks after the end of
each month
©International Monetary Fund. Not for Redistribution
51
• provisional national accounts
• any revision of the national accounts.
E. Structural Reforms and Other Data
28. The government will also report the following: • any study or official report on Burkina Faso’s economy, within two weeks after its
publication
• any decision, order, law, decree, ordinance, or circular that has economic or financial implications as soon as it is published or at the latest when it enters into force.
©International Monetary Fund. Not for Redistribution
52
APPENDIX II. DEBT SUSTAINABILITY ANALYSIS (UPDATE)
This appendix updates the joint debt sustainability analysis (DSA) from April 2008. Overall, the debt sustainability outlook remain largely unchanged. Burkina Faso is classified as high risk of debt distress because the threshold for the NPV of debt-to-exports ratio is breached in the medium term.
I. EXTERNAL DEBT SUSTAINABILITY ANALYSIS
A. What Has Changed Since the Last DSA?
1. The medium-term economic outlook remains broadly unchanged. Projections for real GDP growth remain unchanged over the medium term. However, the surge in inflation in 2008 is expected to have a lasting impact on the price level. As a result, nominal GDP projections are somewhat higher. Export diversification and structural reforms implementation remain key to sustain growth over the medium term (Figure 1).
2. Fiscal developments are broadly in line with the previous DSA. The authorities remain committed to a prudent fiscal policy and a tax policy reform is underway. Projections for new borrowing in US dollars are lower because of the appreciation of the dollar.
Box 1. Burkina Faso—Macroeconomic Assumptions
Real GDP growth is projected to average 6 percent in the medium and long run, broadly in line with the historical average of the past ten years. Growth in 2008 and 2009 is projected to be below trend as a result of exogenous shocks (weather conditions, external environment). Over the medium and long term, growth is expected to reach 6 percent, as a result of improvements in productivity and export diversification.
Inflation is expected to decline gradually as food and oil prices pressures ease, and is expected to return to its historical average of about 2 percent over the medium term.
The overall fiscal deficit, with and without grants, is projected to decrease over time as revenue increases towards the WAEMU tax revenue target of 17 percent of GDP. The revenue increase is supported by ongoing efforts to strengthen tax and customs administration, which is a centerpiece of the current Fund-supported program, and comprehensive tax policy reforms. Expenditure is projected to remain high to meet the authorities’ PRSP objectives. External financing requirements are to be met equally by grants and loans, which is a conservative assumption based on recent experience.
The current account deficit is expected to narrow in the medium and long run as the tighter fiscal stance dampens import demand. The exports-to-GDP ratio will stabilize at about 10 percent of GDP over the medium term. Export diversification (gold, manufacturing goods, services) will be key to achieving growth objectives.
©International Monetary Fund. Not for Redistribution
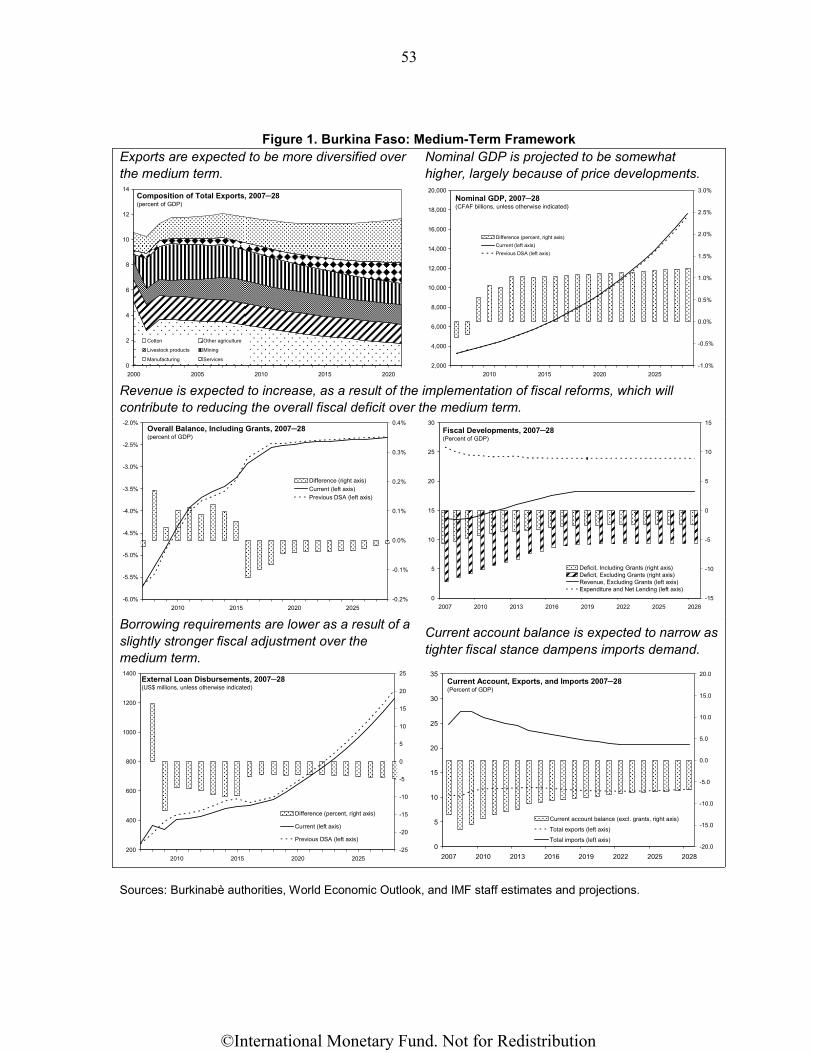
53
Figure 1. Burkina Faso: Medium-Term Framework
Exports are expected to be more diversified over the medium term.
Nominal GDP is projected to be somewhat higher, largely because of price developments.
0
2
4
6
8
10
12
14
2000 2005 2010 2015 2020
Cotton Other agriculture
Livestock products Mining
Manufacturing Services
Composition of Total Exports, 2007─28(percent of GDP)
2,000
4,000
6,000
8,000
10,000
12,000
14,000
16,000
18,000
20,000
2010 2015 2020 2025-1.0%
-0.5%
0.0%
0.5%
1.0%
1.5%
2.0%
2.5%
3.0%
Difference (percent, right axis)Current (left axis)Previous DSA (left axis)
Nominal GDP, 2007─28(CFAF billions, unless otherwise indicated)
Revenue is expected to increase, as a result of the implementation of fiscal reforms, which will contribute to reducing the overall fiscal deficit over the medium term.
-6.0%
-5.5%
-5.0%
-4.5%
-4.0%
-3.5%
-3.0%
-2.5%
-2.0%
2010 2015 2020 2025-0.2%
-0.1%
0.0%
0.1%
0.2%
0.3%
0.4%
Difference (right axis)Current (left axis)Previous DSA (left axis)
Overall Balance, Including Grants, 2007─28(percent of GDP)
0
5
10
15
20
25
30
2007 2010 2013 2016 2019 2022 2025 2028-15
-10
-5
0
5
10
15
Deficit, Including Grants (right axis)Deficit, Excluding Grants (right axis)Revenue, Excluding Grants (left axis)Expenditure and Net Lending (left axis)
Fiscal Developments, 2007─28(Percent of GDP)
Borrowing requirements are lower as a result of a slightly stronger fiscal adjustment over the medium term.
Current account balance is expected to narrow as tighter fiscal stance dampens imports demand.
200
400
600
800
1000
1200
1400
2010 2015 2020 2025-25
-20
-15
-10
-5
0
5
10
15
20
25
Difference (percent, right axis)
Current (left axis)
Previous DSA (left axis)
External Loan Disbursements, 2007─28(US$ millions, unless otherwise indicated)
0
5
10
15
20
25
30
35
2007 2010 2013 2016 2019 2022 2025 2028-20.0
-15.0
-10.0
-5.0
0.0
5.0
10.0
15.0
20.0
Current account balance (excl. grants, right axis)
Total exports (left axis)
Total imports (left axis)
Current Account, Exports, and Imports 2007─28(Percent of GDP)
Sources: Burkinabè authorities, World Economic Outlook, and IMF staff estimates and projections.
©International Monetary Fund. Not for Redistribution

54
Figure 2. Burkina Faso: Current vs. Previous DSA
The main risk remains the NPV of debt to exports ratio.
0
50
100
150
200
250
2007 2012 2017 2022 2027
NPV(Debt) / Exports
Threshold - Medium performer
Previous DSA
Baseline with previous denominator
Net present value of debt/Exports, 2007─28(percent)
NPV of debt to GDP and revenue ratios are below the indicative thresholds.
0
5
10
15
20
25
30
35
40
45
50
2007 2012 2017 2022 2027
NPV(Debt) / GDP
Threshold - Medium performer
Previous DSA
Baseline with previous denominator
Net present value of debt/GDP, 2007─28(percent)
0
50
100
150
200
250
300
2007 2012 2017 2022 2027
NPV(Debt) / Revenues
Threshold - Medium performer
Previous DSA
Baseline with previous denominator
Net present value of debt/Revenue, 2007─28(percent)
Debt service ratios are also well below thresholds.
0
5
10
15
20
25
2007 2012 2017 2022 2027
Debt service / Exports
Threshold - Medium performer
Previous DSA
Baseline with previous denominator
Debt-service/Exports, 2007─28(percent)
0
5
10
15
20
25
30
35
2007 2012 2017 2022 2027
Debt service / Revenues
Threshold - Medium performer
Previous DSA
Baseline with previous denominator
Debt-service/Revenue, 2007─28(percent)
Sources: Burkinabè authorities, World Economic Outlook, and IMF staff estimates and projections.
©International Monetary Fund. Not for Redistribution
55
B. Assessing Vulnerabilities
3. A worse-than-expected export and growth performance is a clear risk. Burkina Faso remains heavily dependent on cotton production and exports, although the projected increase in gold production should help diversify exports. A clear risk could occur in case of either a sharp fall in cotton and gold prices or disruptions in cotton production.
4. A continuous decline in the fiscal deficit throughout the projection period is important for the resilience of debt indicators to an adverse export or growth shock. This implicitly assumes that (i) structural reforms in the area of tax administration and fiscal policy would be implemented and (ii) that fiscal tightening would be adopted as a response to permanent losses of revenue.
5. There are a number of other positive factors as well as some downside risks:
Positive factors
• Burkina Faso’s government has consistently demonstrated its commitment to stay current on its external payment obligations. This includes the period before the country benefited from debt relief under the Heavily Indebted Poor Country Initiative (HIPC), when the NPV of debt-to-exports ratio was well above 200 percent.
• Additional grant financing could improve the debt sustainability outlook significantly.
• The authorities have adopted a national debt policy and received technical assistance in this area from the World Bank.
• Improvements in CPIA rating, which depends on the implementation of several key structural reforms (fiscal, financial sector, business climate), could bring Burkina Faso back to a classification as a strong performer, which would induce higher thresholds.
Downside risks
• Delayed fiscal adjustment could pose a significant downside risk. This is because without deficit reduction Burkina Faso’s debt burden could eventually become unsustainable, even when measured relative to GDP or revenue. Preventing this will require a stronger revenue effort, which in turn depends on further efforts to strengthen tax and customs administration, and to implement substantial tax policy reform.
• Adverse export shocks would mostly affect the export-based debt indicators, whereas the other indicators are relatively robust with respect to this type of shock.
©International Monetary Fund. Not for Redistribution
56
C. Risk of Debt Distress
6. The risk of debt distress is high because the threshold for the NPV of debt to exports ratio is breached. The peak ratio of about 190 percent in the baseline projection of the NPV of debt-to-exports ratio is well above the 150 percent threshold. Under DSF guidelines, such a breach warrants a classification of high risk of debt distress, although the GDP- and revenue-based DSF indicators remain well below their indicative thresholds, including some of the alternative scenarios and stress tests.
II. FISCAL DEBT SUSTAINABILITY ANALYSIS
7. The results for the fiscal DSA are broadly similar to those of the external DSA. Failure to reduce the current fiscal deficits would lead to ever-increasing debt indicators, which is clearly unsustainable. The domestic debt stock is low—gross domestic debt is estimated at approximately 3.5 percent of GDP at end-2007, and net debt at 0.6 percent of GDP. As a result, the baseline scenarios for external and total public debt are similar.
III. CONCLUSION
8. Burkina Faso’s risk of debt distress is high on account of the NPV of debt-to-exports ratio; all other debt indicators remain comfortably below their policy-dependent thresholds under the baseline scenario. This risk underlines the need for a prudent fiscal policy, external borrowing limited to concessional loans, and continued build-up in public debt management capacity.
©International Monetary Fund. Not for Redistribution
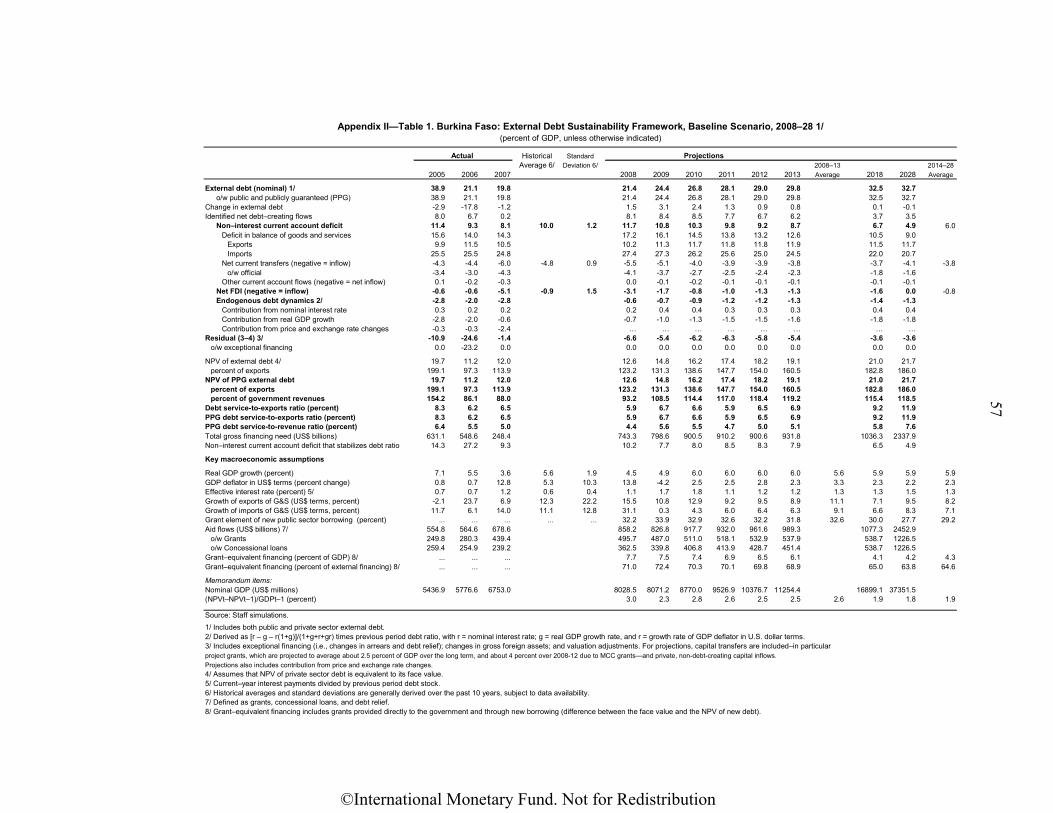
57
Historical StandardAverage 6/ Deviation 6/ 2008–13 2014–28
2005 2006 2007 2008 2009 2010 2011 2012 2013 Average 2018 2028 Average
External debt (nominal) 1/ 38.9 21.1 19.8 21.4 24.4 26.8 28.1 29.0 29.8 32.5 32.7o/w public and publicly guaranteed (PPG) 38.9 21.1 19.8 21.4 24.4 26.8 28.1 29.0 29.8 32.5 32.7
Change in external debt -2.9 -17.8 -1.2 1.5 3.1 2.4 1.3 0.9 0.8 0.1 -0.1Identified net debt–creating flows 8.0 6.7 0.2 8.1 8.4 8.5 7.7 6.7 6.2 3.7 3.5
Non–interest current account deficit 11.4 9.3 8.1 10.0 1.2 11.7 10.8 10.3 9.8 9.2 8.7 6.7 4.9 6.0Deficit in balance of goods and services 15.6 14.0 14.3 17.2 16.1 14.5 13.8 13.2 12.6 10.5 9.0
Exports 9.9 11.5 10.5 10.2 11.3 11.7 11.8 11.8 11.9 11.5 11.7Imports 25.5 25.5 24.8 27.4 27.3 26.2 25.6 25.0 24.5 22.0 20.7
Net current transfers (negative = inflow) -4.3 -4.4 -6.0 -4.8 0.9 -5.5 -5.1 -4.0 -3.9 -3.9 -3.8 -3.7 -4.1 -3.8o/w official -3.4 -3.0 -4.3 -4.1 -3.7 -2.7 -2.5 -2.4 -2.3 -1.8 -1.6
Other current account flows (negative = net inflow) 0.1 -0.2 -0.3 0.0 -0.1 -0.2 -0.1 -0.1 -0.1 -0.1 -0.1Net FDI (negative = inflow) -0.6 -0.6 -5.1 -0.9 1.5 -3.1 -1.7 -0.8 -1.0 -1.3 -1.3 -1.6 0.0 -0.8Endogenous debt dynamics 2/ -2.8 -2.0 -2.8 -0.6 -0.7 -0.9 -1.2 -1.2 -1.3 -1.4 -1.3
Contribution from nominal interest rate 0.3 0.2 0.2 0.2 0.4 0.4 0.3 0.3 0.3 0.4 0.4Contribution from real GDP growth -2.8 -2.0 -0.6 -0.7 -1.0 -1.3 -1.5 -1.5 -1.6 -1.8 -1.8Contribution from price and exchange rate changes -0.3 -0.3 -2.4 … … … … … … … …
Residual (3–4) 3/ -10.9 -24.6 -1.4 -6.6 -5.4 -6.2 -6.3 -5.8 -5.4 -3.6 -3.6o/w exceptional financing 0.0 -23.2 0.0 0.0 0.0 0.0 0.0 0.0 0.0 0.0 0.0
NPV of external debt 4/ 19.7 11.2 12.0 12.6 14.8 16.2 17.4 18.2 19.1 21.0 21.7percent of exports 199.1 97.3 113.9 123.2 131.3 138.6 147.7 154.0 160.5 182.8 186.0
NPV of PPG external debt 19.7 11.2 12.0 12.6 14.8 16.2 17.4 18.2 19.1 21.0 21.7percent of exports 199.1 97.3 113.9 123.2 131.3 138.6 147.7 154.0 160.5 182.8 186.0percent of government revenues 154.2 86.1 88.0 93.2 108.5 114.4 117.0 118.4 119.2 115.4 118.5
Debt service-to-exports ratio (percent) 8.3 6.2 6.5 5.9 6.7 6.6 5.9 6.5 6.9 9.2 11.9PPG debt service-to-exports ratio (percent) 8.3 6.2 6.5 5.9 6.7 6.6 5.9 6.5 6.9 9.2 11.9PPG debt service-to-revenue ratio (percent) 6.4 5.5 5.0 4.4 5.6 5.5 4.7 5.0 5.1 5.8 7.6Total gross financing need (US$ billions) 631.1 548.6 248.4 743.3 798.6 900.5 910.2 900.6 931.8 1036.3 2337.9Non–interest current account deficit that stabilizes debt ratio 14.3 27.2 9.3 10.2 7.7 8.0 8.5 8.3 7.9 6.5 4.9
Key macroeconomic assumptions
Real GDP growth (percent) 7.1 5.5 3.6 5.6 1.9 4.5 4.9 6.0 6.0 6.0 6.0 5.6 5.9 5.9 5.9GDP deflator in US$ terms (percent change) 0.8 0.7 12.8 5.3 10.3 13.8 -4.2 2.5 2.5 2.8 2.3 3.3 2.3 2.2 2.3Effective interest rate (percent) 5/ 0.7 0.7 1.2 0.6 0.4 1.1 1.7 1.8 1.1 1.2 1.2 1.3 1.3 1.5 1.3Growth of exports of G&S (US$ terms, percent) -2.1 23.7 6.9 12.3 22.2 15.5 10.8 12.9 9.2 9.5 8.9 11.1 7.1 9.5 8.2Growth of imports of G&S (US$ terms, percent) 11.7 6.1 14.0 11.1 12.8 31.1 0.3 4.3 6.0 6.4 6.3 9.1 6.6 8.3 7.1Grant element of new public sector borrowing (percent) ... ... ... ... ... 32.2 33.9 32.9 32.6 32.2 31.8 32.6 30.0 27.7 29.2Aid flows (US$ billions) 7/ 554.8 564.6 678.6 858.2 826.8 917.7 932.0 961.6 989.3 1077.3 2452.9
o/w Grants 249.8 280.3 439.4 495.7 487.0 511.0 518.1 532.9 537.9 538.7 1226.5o/w Concessional loans 259.4 254.9 239.2 362.5 339.8 406.8 413.9 428.7 451.4 538.7 1226.5
Grant–equivalent financing (percent of GDP) 8/ ... ... ... 7.7 7.5 7.4 6.9 6.5 6.1 4.1 4.2 4.3Grant–equivalent financing (percent of external financing) 8/ ... ... ... 71.0 72.4 70.3 70.1 69.8 68.9 65.0 63.8 64.6
Memorandum items:Nominal GDP (US$ millions) 5436.9 5776.6 6753.0 8028.5 8071.2 8770.0 9526.9 10376.7 11254.4 16899.1 37351.5(NPVt–NPVt–1)/GDPt–1 (percent) 3.0 2.3 2.8 2.6 2.5 2.5 2.6 1.9 1.8 1.9
Source: Staff simulations.1/ Includes both public and private sector external debt.2/ Derived as [r – g – r(1+g)]/(1+g+r+gr) times previous period debt ratio, with r = nominal interest rate; g = real GDP growth rate, and r = growth rate of GDP deflator in U.S. dollar terms.
project grants, which are projected to average about 2.5 percent of GDP over the long term, and about 4 percent over 2008-12 due to MCC grants—and private, non-debt-creating capital inflows.Projections also includes contribution from price and exchange rate changes.4/ Assumes that NPV of private sector debt is equivalent to its face value.5/ Current–year interest payments divided by previous period debt stock. 6/ Historical averages and standard deviations are generally derived over the past 10 years, subject to data availability. 7/ Defined as grants, concessional loans, and debt relief.8/ Grant–equivalent financing includes grants provided directly to the government and through new borrowing (difference between the face value and the NPV of new debt).
3/ Includes exceptional financing (i.e., changes in arrears and debt relief); changes in gross foreign assets; and valuation adjustments. For projections, capital transfers are included–in particular
Actual
Appendix II—Table 1. Burkina Faso: External Debt Sustainability Framework, Baseline Scenario, 2008–28 1/(percent of GDP, unless otherwise indicated)
Projections
©International Monetary Fund. Not for Redistribution

58
2008 2009 2010 2011 2012 2013 2018 2028
Baseline 13 15 16 17 18 19 21 22
A. Alternative Scenarios
A1. Key variables at their historical averages in 2008–27 1/ 13 13 14 15 16 18 27 37A2. New public sector loans on less favorable terms in 2008–27 2/ 13 16 19 21 23 24 30 34
B. Bound Tests
B1. Real GDP growth at historical average minus one standard deviation in 2008–09 13 15 17 18 19 20 22 22B2. Export value growth at historical average minus one standard deviation in 2008–09 3/ 13 16 20 21 22 23 23 22B3. US dollar GDP deflator at historical average minus one standard deviation in 2008–09 13 15 18 19 20 21 23 24B4. Net non–debt creating flows at historical average minus one standard deviation in 2008–09 4/ 13 17 19 20 21 22 23 22B5. Combination of B1–B4 using one–half standard deviation shocks 13 15 18 19 20 21 22 22B6. One–time 30 percent nominal depreciation relative to the baseline in 2008 5/ 13 22 24 25 27 28 31 32
Baseline 123 131 139 148 154 160 183 186
A. Alternative Scenarios
A1. Key variables at their historical averages in 2007–26 1/ 123 118 121 128 138 149 239 318A2. New public sector loans on less favorable terms in 2007–26 2/ 123 142 159 177 192 206 258 293
B. Bound Tests
B1. Real GDP growth at historical average minus one standard deviation in 2008–09 123 131 139 148 154 160 183 186B2. Export value growth at historical average minus one standard deviation in 2008–09 3/ 123 177 268 279 287 295 311 292B3. US dollar GDP deflator at historical average minus one standard deviation in 2008–09 123 131 139 148 154 160 183 186B4. Net non–debt creating flows at historical average minus one standard deviation in 2008–09 4/ 123 152 166 174 179 184 197 189B5. Combination of B1–B4 using one–half standard deviation shocks 123 154 192 202 209 216 236 230B6. One–time 30 percent nominal depreciation relative to the baseline in 2008 5/ 123 131 139 148 154 160 183 186
Baseline 93 108 114 117 118 119 115 119
A. Alternative Scenarios
A1. Key variables at their historical averages in 2007–26 1/ 93 98 99 101 106 111 151 202A2. New public sector loans on less favorable terms in 2007–26 2/ 93 117 131 141 148 153 163 187
B. Bound Tests
B1. Real GDP growth at historical average minus one standard deviation in 2008–09 93 110 118 121 122 123 119 123B2. Export value growth at historical average minus one standard deviation in 2008–09 3/ 93 119 143 143 143 142 127 121B3. US dollar GDP deflator at historical average minus one standard deviation in 2008–09 93 109 125 127 129 130 126 129B4. Net non–debt creating flows at historical average minus one standard deviation in 2008–09 4/ 93 125 137 138 137 137 124 120B5. Combination of B1–B4 using one–half standard deviation shocks 93 111 129 130 131 131 121 119B6. One–time 30 percent nominal depreciation relative to the baseline in 2008 5/ 93 158 167 170 172 174 168 173
NPV of debt-to-revenue ratio
continued
Appendix II―Table 2. Burkina Faso: Sensitivity Analyses for Key Indicators of Public and Publicly Guaranteed External Debt, 2008–28(Percent)
NPV of debt-to-GDP ratio
NPV of debt-to-exports ratio
Projections
©International Monetary Fund. Not for Redistribution
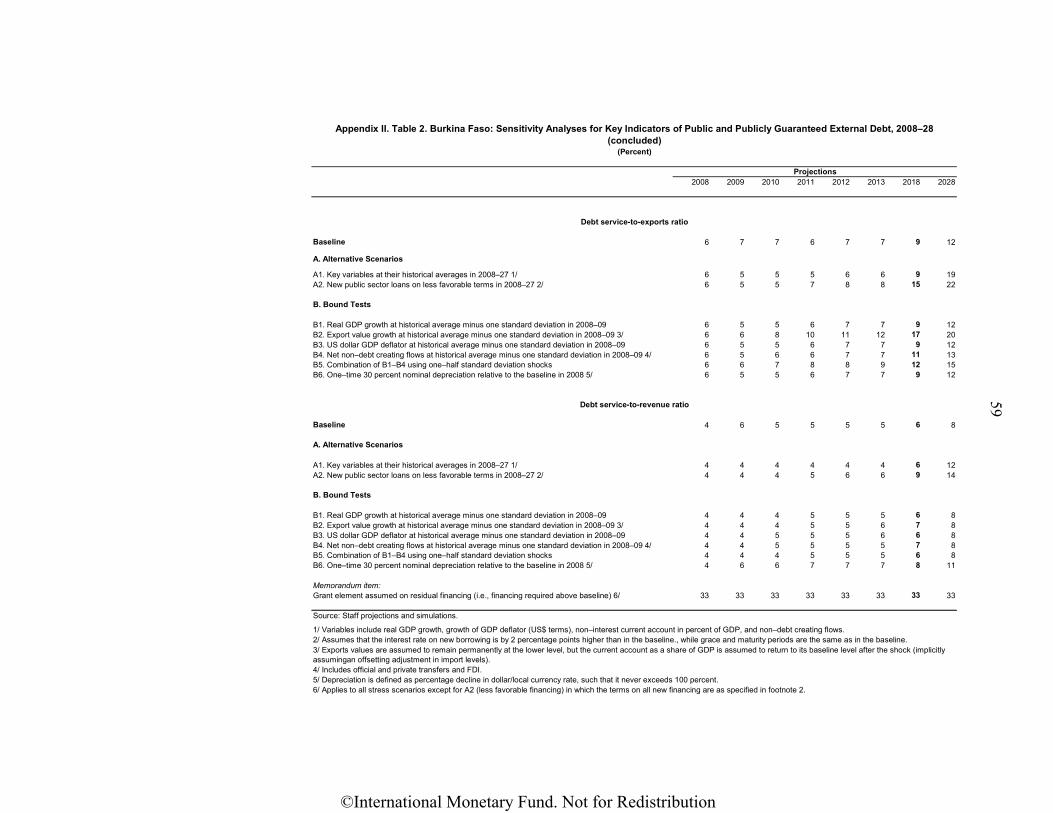
59
2008 2009 2010 2011 2012 2013 2018 2028
Baseline 6 7 7 6 7 7 9 12
A. Alternative Scenarios
A1. Key variables at their historical averages in 2008–27 1/ 6 5 5 5 6 6 9 19A2. New public sector loans on less favorable terms in 2008–27 2/ 6 5 5 7 8 8 15 22
B. Bound Tests
B1. Real GDP growth at historical average minus one standard deviation in 2008–09 6 5 5 6 7 7 9 12B2. Export value growth at historical average minus one standard deviation in 2008–09 3/ 6 6 8 10 11 12 17 20B3. US dollar GDP deflator at historical average minus one standard deviation in 2008–09 6 5 5 6 7 7 9 12B4. Net non–debt creating flows at historical average minus one standard deviation in 2008–09 4/ 6 5 6 6 7 7 11 13B5. Combination of B1–B4 using one–half standard deviation shocks 6 6 7 8 8 9 12 15B6. One–time 30 percent nominal depreciation relative to the baseline in 2008 5/ 6 5 5 6 7 7 9 12
Baseline 4 6 5 5 5 5 6 8
A. Alternative Scenarios
A1. Key variables at their historical averages in 2008–27 1/ 4 4 4 4 4 4 6 12A2. New public sector loans on less favorable terms in 2008–27 2/ 4 4 4 5 6 6 9 14
B. Bound Tests
B1. Real GDP growth at historical average minus one standard deviation in 2008–09 4 4 4 5 5 5 6 8B2. Export value growth at historical average minus one standard deviation in 2008–09 3/ 4 4 4 5 5 6 7 8B3. US dollar GDP deflator at historical average minus one standard deviation in 2008–09 4 4 5 5 5 6 6 8B4. Net non–debt creating flows at historical average minus one standard deviation in 2008–09 4/ 4 4 5 5 5 5 7 8B5. Combination of B1–B4 using one–half standard deviation shocks 4 4 4 5 5 5 6 8B6. One–time 30 percent nominal depreciation relative to the baseline in 2008 5/ 4 6 6 7 7 7 8 11
Memorandum item:Grant element assumed on residual financing (i.e., financing required above baseline) 6/ 33 33 33 33 33 33 33 33
Source: Staff projections and simulations.
1/ Variables include real GDP growth, growth of GDP deflator (US$ terms), non–interest current account in percent of GDP, and non–debt creating flows.
4/ Includes official and private transfers and FDI.5/ Depreciation is defined as percentage decline in dollar/local currency rate, such that it never exceeds 100 percent.6/ Applies to all stress scenarios except for A2 (less favorable financing) in which the terms on all new financing are as specified in footnote 2.
3/ Exports values are assumed to remain permanently at the lower level, but the current account as a share of GDP is assumed to return to its baseline level after the shock (implicitly assumingan offsetting adjustment in import levels).
2/ Assumes that the interest rate on new borrowing is by 2 percentage points higher than in the baseline., while grace and maturity periods are the same as in the baseline.
Debt service-to-revenue ratio
Debt service-to-exports ratio
Appendix II. Table 2. Burkina Faso: Sensitivity Analyses for Key Indicators of Public and Publicly Guaranteed External Debt, 2008–28 (concluded)
(Percent)
Projections
©International Monetary Fund. Not for Redistribution

60
Appendix II―Figure 1. Burkina Faso: Indicators of Public and Publicly Guaranteed External Debt Under Alternative Scenarios (in percent), 2008-28 1/
Source: Staff projections and simulations.1/ Thresholds for medium performer.
Debt Accumulation
0
1
2
3
4
5
6
7
8
9
2008 2013 2018 2023 20280
5
10
15
20
25
30
35
40
Rate of debt accumulation
Grant element (right scale)
Grant-equivalent/GDP
NPV of debt-to-GDP ratio
0
5
10
15
20
25
30
35
40
45
2008 2013 2018 2023 2028
Baseline
Threshold
Historical scenario
Most extreme shock
NPV of debt-to-exports ratio
0
50
100
150
200
250
300
350
2008 2013 2018 2023 2028
Baseline
Threshold
Historical scenario
Most extreme shock
NPV of debt-to-revenue ratio
0
50
100
150
200
250
300
2008 2013 2018 2023 2028
Baseline
Threshold
Historical scenario
Most extreme shock
Debt-service-to-exports ratio
0
5
10
15
20
25
2008 2013 2018 2023 2028
Baseline
Threshold
Historical scenario
Most extreme shock
Debt-service-to-revenue ratio
0
5
10
15
20
25
30
35
2008 2013 2018 2023 2028
Baseline
Threshold
Historical scenario
Most extreme shock
©International Monetary Fund. Not for Redistribution
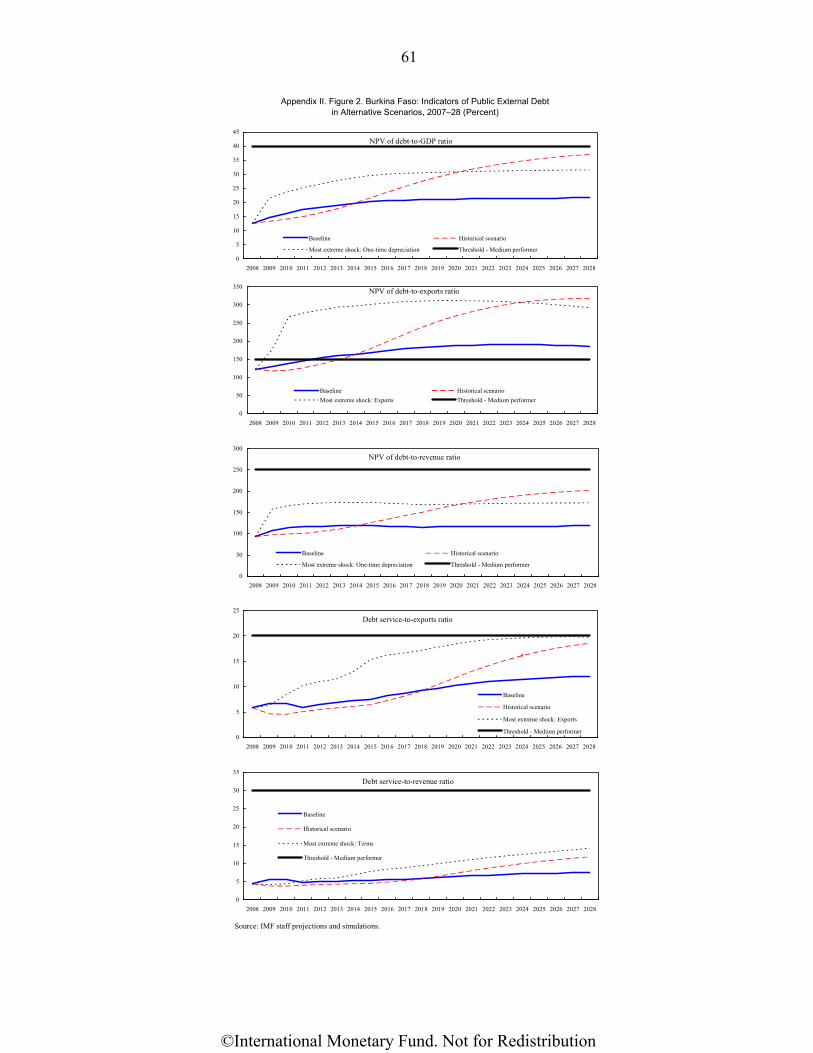
61
Appendix II. Figure 2. Burkina Faso: Indicators of Public External Debt in Alternative Scenarios, 2007–28 (Percent)
Source: IMF staff projections and simulations.
NPV of debt-to-GDP ratio
0
5
10
15
20
25
30
35
40
45
2008 2009 2010 2011 2012 2013 2014 2015 2016 2017 2018 2019 2020 2021 2022 2023 2024 2025 2026 2027 2028
Baseline Historical scenario
Most extreme shock: One-time depreciation Threshold - Medium performer
NPV of debt-to-exports ratio
0
50
100
150
200
250
300
350
2008 2009 2010 2011 2012 2013 2014 2015 2016 2017 2018 2019 2020 2021 2022 2023 2024 2025 2026 2027 2028
Baseline Historical scenarioMost extreme shock: Exports Threshold - Medium performer
Debt service-to-exports ratio
0
5
10
15
20
25
2008 2009 2010 2011 2012 2013 2014 2015 2016 2017 2018 2019 2020 2021 2022 2023 2024 2025 2026 2027 2028
Baseline
Historical scenario
Most extreme shock: Exports
Threshold - Medium performer
NPV of debt-to-revenue ratio
0
50
100
150
200
250
300
2008 2009 2010 2011 2012 2013 2014 2015 2016 2017 2018 2019 2020 2021 2022 2023 2024 2025 2026 2027 2028
Baseline Historical scenario
Most extreme shock: One-time depreciation Threshold - Medium performer
Debt service-to-revenue ratio
0
5
10
15
20
25
30
35
2008 2009 2010 2011 2012 2013 2014 2015 2016 2017 2018 2019 2020 2021 2022 2023 2024 2025 2026 2027 2028
Baseline
Historical scenario
Most extreme shock: Terms
Threshold - Medium performer
©International Monetary Fund. Not for Redistribution
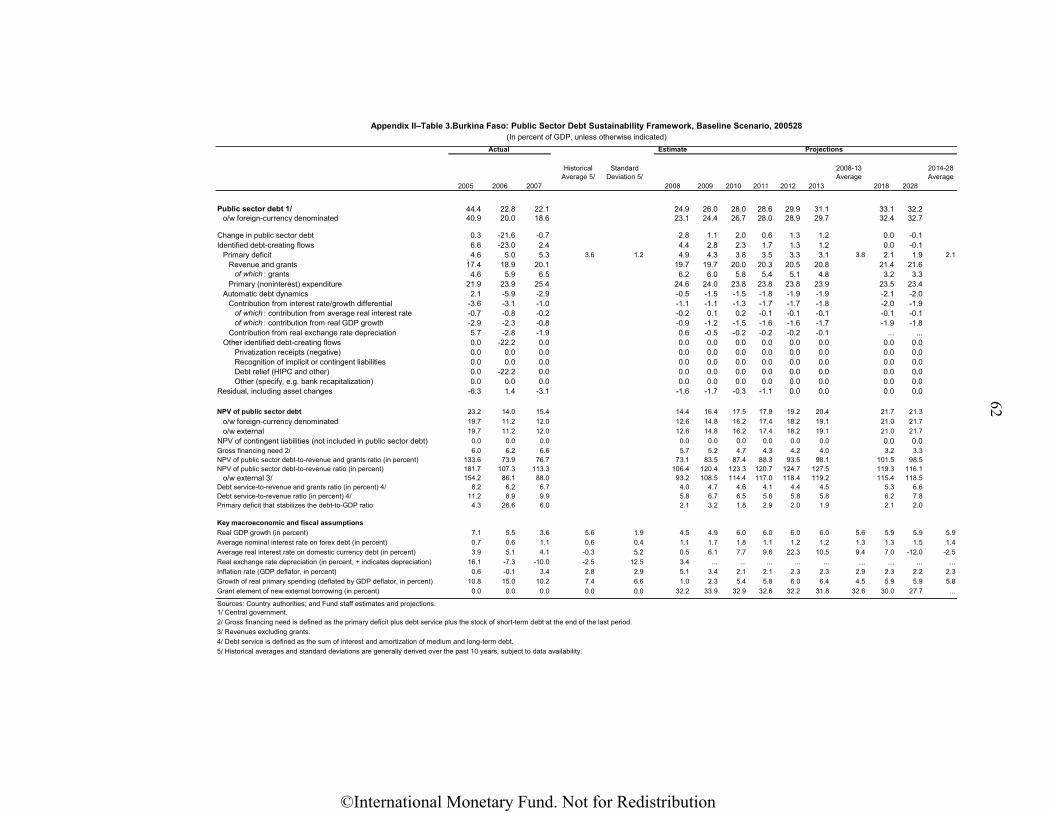
62
Estimate
2005 2006 2007
Historical Average 5/
Standard Deviation 5/
2008 2009 2010 2011 2012 2013
2008-13 Average
2018 2028
2014-28 Average
Public sector debt 1/ 44.4 22.8 22.1 24.9 26.0 28.0 28.6 29.9 31.1 33.1 32.2o/w foreign-currency denominated 40.9 20.0 18.6 23.1 24.4 26.7 28.0 28.9 29.7 32.4 32.7
Change in public sector debt 0.3 -21.6 -0.7 2.8 1.1 2.0 0.6 1.3 1.2 0.0 -0.1Identified debt-creating flows 6.6 -23.0 2.4 4.4 2.8 2.3 1.7 1.3 1.2 0.0 -0.1
Primary deficit 4.6 5.0 5.3 3.6 1.2 4.9 4.3 3.8 3.5 3.3 3.1 3.8 2.1 1.9 2.1Revenue and grants 17.4 18.9 20.1 19.7 19.7 20.0 20.3 20.5 20.8 21.4 21.6
of which : grants 4.6 5.9 6.5 6.2 6.0 5.8 5.4 5.1 4.8 3.2 3.3Primary (noninterest) expenditure 21.9 23.9 25.4 24.6 24.0 23.8 23.8 23.8 23.9 23.5 23.4
Automatic debt dynamics 2.1 -5.9 -2.9 -0.5 -1.5 -1.5 -1.8 -1.9 -1.9 -2.1 -2.0Contribution from interest rate/growth differential -3.6 -3.1 -1.0 -1.1 -1.1 -1.3 -1.7 -1.7 -1.8 -2.0 -1.9
of which : contribution from average real interest rate -0.7 -0.8 -0.2 -0.2 0.1 0.2 -0.1 -0.1 -0.1 -0.1 -0.1of which : contribution from real GDP growth -2.9 -2.3 -0.8 -0.9 -1.2 -1.5 -1.6 -1.6 -1.7 -1.9 -1.8
Contribution from real exchange rate depreciation 5.7 -2.8 -1.9 0.6 -0.5 -0.2 -0.2 -0.2 -0.1 ... ...Other identified debt-creating flows 0.0 -22.2 0.0 0.0 0.0 0.0 0.0 0.0 0.0 0.0 0.0
Privatization receipts (negative) 0.0 0.0 0.0 0.0 0.0 0.0 0.0 0.0 0.0 0.0 0.0Recognition of implicit or contingent liabilities 0.0 0.0 0.0 0.0 0.0 0.0 0.0 0.0 0.0 0.0 0.0Debt relief (HIPC and other) 0.0 -22.2 0.0 0.0 0.0 0.0 0.0 0.0 0.0 0.0 0.0Other (specify, e.g. bank recapitalization) 0.0 0.0 0.0 0.0 0.0 0.0 0.0 0.0 0.0 0.0 0.0
Residual, including asset changes -6.3 1.4 -3.1 -1.6 -1.7 -0.3 -1.1 0.0 0.0 0.0 0.0
NPV of public sector debt 23.2 14.0 15.4 14.4 16.4 17.5 17.9 19.2 20.4 21.7 21.3o/w foreign-currency denominated 19.7 11.2 12.0 12.6 14.8 16.2 17.4 18.2 19.1 21.0 21.7o/w external 19.7 11.2 12.0 12.6 14.8 16.2 17.4 18.2 19.1 21.0 21.7
NPV of contingent liabilities (not included in public sector debt) 0.0 0.0 0.0 0.0 0.0 0.0 0.0 0.0 0.0 0.0 0.0Gross financing need 2/ 6.0 6.2 6.6 5.7 5.2 4.7 4.3 4.2 4.0 3.2 3.3NPV of public sector debt-to-revenue and grants ratio (in percent) 133.6 73.9 76.7 73.1 83.5 87.4 88.3 93.5 98.1 101.5 98.5NPV of public sector debt-to-revenue ratio (in percent) 181.7 107.3 113.3 106.4 120.4 123.3 120.7 124.7 127.5 119.3 116.1
o/w external 3/ 154.2 86.1 88.0 93.2 108.5 114.4 117.0 118.4 119.2 115.4 118.5Debt service-to-revenue and grants ratio (in percent) 4/ 8.2 6.2 6.7 4.0 4.7 4.6 4.1 4.4 4.5 5.3 6.6Debt service-to-revenue ratio (in percent) 4/ 11.2 8.9 9.9 5.8 6.7 6.5 5.6 5.8 5.8 6.2 7.8Primary deficit that stabilizes the debt-to-GDP ratio 4.3 26.6 6.0 2.1 3.2 1.8 2.9 2.0 1.9 2.1 2.0
Key macroeconomic and fiscal assumptionsReal GDP growth (in percent) 7.1 5.5 3.6 5.6 1.9 4.5 4.9 6.0 6.0 6.0 6.0 5.6 5.9 5.9 5.9Average nominal interest rate on forex debt (in percent) 0.7 0.6 1.1 0.6 0.4 1.1 1.7 1.8 1.1 1.2 1.2 1.3 1.3 1.5 1.4Average real interest rate on domestic currency debt (in percent) 3.9 5.1 4.1 -0.3 5.2 0.5 6.1 7.7 9.6 22.3 10.5 9.4 7.0 -12.0 -2.5Real exchange rate depreciation (in percent, + indicates depreciation) 16.1 -7.3 -10.0 -2.5 12.5 3.4 ... ... ... ... ... ... ... ... ...Inflation rate (GDP deflator, in percent) 0.6 -0.1 3.4 2.8 2.9 5.1 3.4 2.1 2.1 2.3 2.3 2.9 2.3 2.2 2.3Growth of real primary spending (deflated by GDP deflator, in percent) 10.8 15.0 10.2 7.4 6.6 1.0 2.3 5.4 5.8 6.0 6.4 4.5 5.9 5.9 5.8Grant element of new external borrowing (in percent) 0.0 0.0 0.0 0.0 0.0 32.2 33.9 32.9 32.6 32.2 31.8 32.6 30.0 27.7 ...
Sources: Country authorities; and Fund staff estimates and projections.1/ Central government.2/ Gross financing need is defined as the primary deficit plus debt service plus the stock of short-term debt at the end of the last period. 3/ Revenues excluding grants.4/ Debt service is defined as the sum of interest and amortization of medium and long-term debt.5/ Historical averages and standard deviations are generally derived over the past 10 years, subject to data availability.
Appendix II–Table 3.Burkina Faso: Public Sector Debt Sustainability Framework, Baseline Scenario, 200528(In percent of GDP, unless otherwise indicated)
Actual Projections
©International Monetary Fund. Not for Redistribution
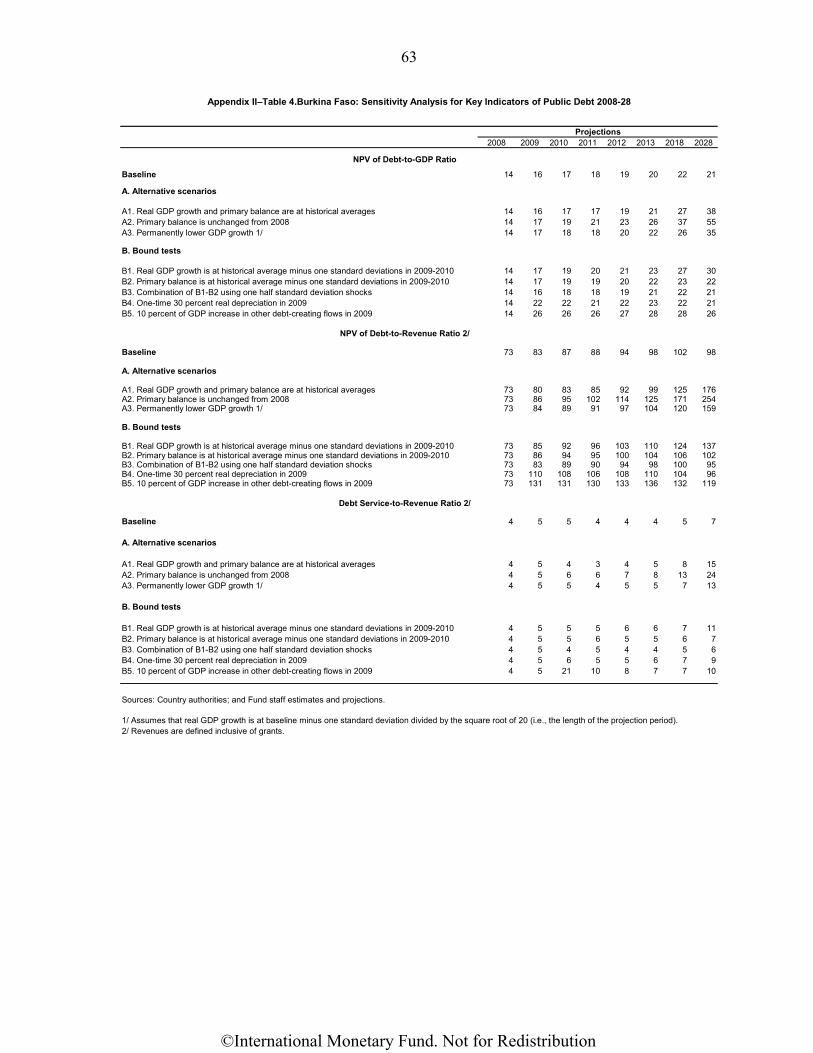
63
2008 2009 2010 2011 2012 2013 2018 2028
Baseline 14 16 17 18 19 20 22 21
A. Alternative scenarios
A1. Real GDP growth and primary balance are at historical averages 14 16 17 17 19 21 27 38A2. Primary balance is unchanged from 2008 14 17 19 21 23 26 37 55A3. Permanently lower GDP growth 1/ 14 17 18 18 20 22 26 35
B. Bound tests
B1. Real GDP growth is at historical average minus one standard deviations in 2009-2010 14 17 19 20 21 23 27 30B2. Primary balance is at historical average minus one standard deviations in 2009-2010 14 17 19 19 20 22 23 22B3. Combination of B1-B2 using one half standard deviation shocks 14 16 18 18 19 21 22 21B4. One-time 30 percent real depreciation in 2009 14 22 22 21 22 23 22 21B5. 10 percent of GDP increase in other debt-creating flows in 2009 14 26 26 26 27 28 28 26
Baseline 73 83 87 88 94 98 102 98
A. Alternative scenarios
A1. Real GDP growth and primary balance are at historical averages 73 80 83 85 92 99 125 176A2. Primary balance is unchanged from 2008 73 86 95 102 114 125 171 254A3. Permanently lower GDP growth 1/ 73 84 89 91 97 104 120 159
B. Bound tests
B1. Real GDP growth is at historical average minus one standard deviations in 2009-2010 73 85 92 96 103 110 124 137B2. Primary balance is at historical average minus one standard deviations in 2009-2010 73 86 94 95 100 104 106 102B3. Combination of B1-B2 using one half standard deviation shocks 73 83 89 90 94 98 100 95B4. One-time 30 percent real depreciation in 2009 73 110 108 106 108 110 104 96B5. 10 percent of GDP increase in other debt-creating flows in 2009 73 131 131 130 133 136 132 119
Baseline 4 5 5 4 4 4 5 7
A. Alternative scenarios
A1. Real GDP growth and primary balance are at historical averages 4 5 4 3 4 5 8 15A2. Primary balance is unchanged from 2008 4 5 6 6 7 8 13 24A3. Permanently lower GDP growth 1/ 4 5 5 4 5 5 7 13
B. Bound tests
B1. Real GDP growth is at historical average minus one standard deviations in 2009-2010 4 5 5 5 6 6 7 11B2. Primary balance is at historical average minus one standard deviations in 2009-2010 4 5 5 6 5 5 6 7B3. Combination of B1-B2 using one half standard deviation shocks 4 5 4 5 4 4 5 6B4. One-time 30 percent real depreciation in 2009 4 5 6 5 5 6 7 9B5. 10 percent of GDP increase in other debt-creating flows in 2009 4 5 21 10 8 7 7 10
Sources: Country authorities; and Fund staff estimates and projections.
2/ Revenues are defined inclusive of grants.1/ Assumes that real GDP growth is at baseline minus one standard deviation divided by the square root of 20 (i.e., the length of the projection period).
Appendix II–Table 4.Burkina Faso: Sensitivity Analysis for Key Indicators of Public Debt 2008-28
NPV of Debt-to-Revenue Ratio 2/
NPV of Debt-to-GDP Ratio
Debt Service-to-Revenue Ratio 2/
Projections
©International Monetary Fund. Not for Redistribution
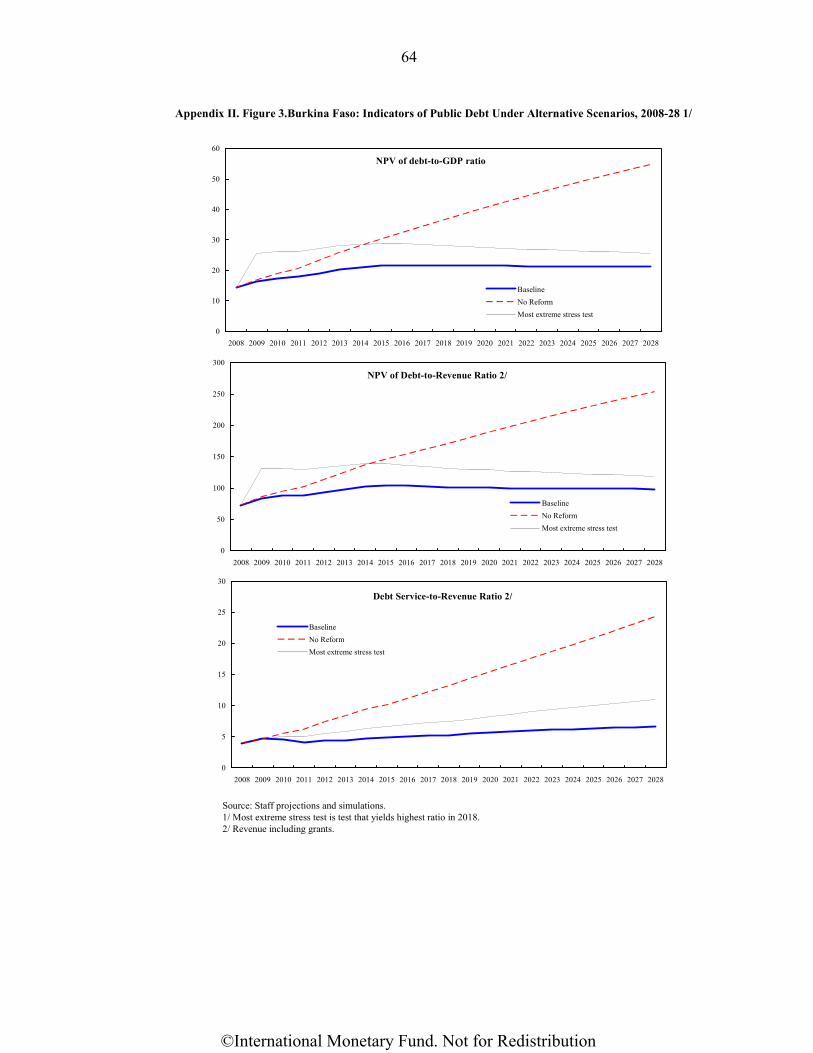
64
Appendix II. Figure 3.Burkina Faso: Indicators of Public Debt Under Alternative Scenarios, 2008-28 1/
Source: Staff projections and simulations.1/ Most extreme stress test is test that yields highest ratio in 2018.2/ Revenue including grants.
NPV of debt-to-GDP ratio
0
10
20
30
40
50
60
2008 2009 2010 2011 2012 2013 2014 2015 2016 2017 2018 2019 2020 2021 2022 2023 2024 2025 2026 2027 2028
BaselineNo ReformMost extreme stress test
NPV of Debt-to-Revenue Ratio 2/
0
50
100
150
200
250
300
2008 2009 2010 2011 2012 2013 2014 2015 2016 2017 2018 2019 2020 2021 2022 2023 2024 2025 2026 2027 2028
BaselineNo ReformMost extreme stress test
Debt Service-to-Revenue Ratio 2/
0
5
10
15
20
25
30
2008 2009 2010 2011 2012 2013 2014 2015 2016 2017 2018 2019 2020 2021 2022 2023 2024 2025 2026 2027 2028
BaselineNo ReformMost extreme stress test
©International Monetary Fund. Not for Redistribution
INTERNATIONAL MONETARY FUND
BURKINA FASO
Third Review Under the Three-Year Arrangement Under the Poverty Reduction and Growth Facility
Informational Annex
Prepared by the African Department (In collaboration with other departments)
Approved by Thomas Krueger and Anthony Boote
November 21, 2008
• Relations with the Fund. Describes financial and technical assistance
from the Fund and provides information on the safeguards assessment and exchange rate system. Outstanding purchases and loans amounted to SDR 31.24 million (51.9 percent of quota) at end-September 2008.
• JMAP Implementation. Describes Bank-Fund collaboration.
• Statistical Issues. Assesses the quality of statistical data. Weaknesses in a broad range of economic statistics are hampering the analyses of economic developments in the country.
©International Monetary Fund. Not for Redistribution
2
Contents Page
I. Relations with the Fund ...........................................................................................3 II. JMAP Implementation ...........................................................................................13 III. Statistical Issues .....................................................................................................14
©International Monetary Fund. Not for Redistribution
SIVARANJANI
Underline
SIVARANJANI
Underline
Underline
SIVARANJANI
Underline
SIVARANJANI
Underline
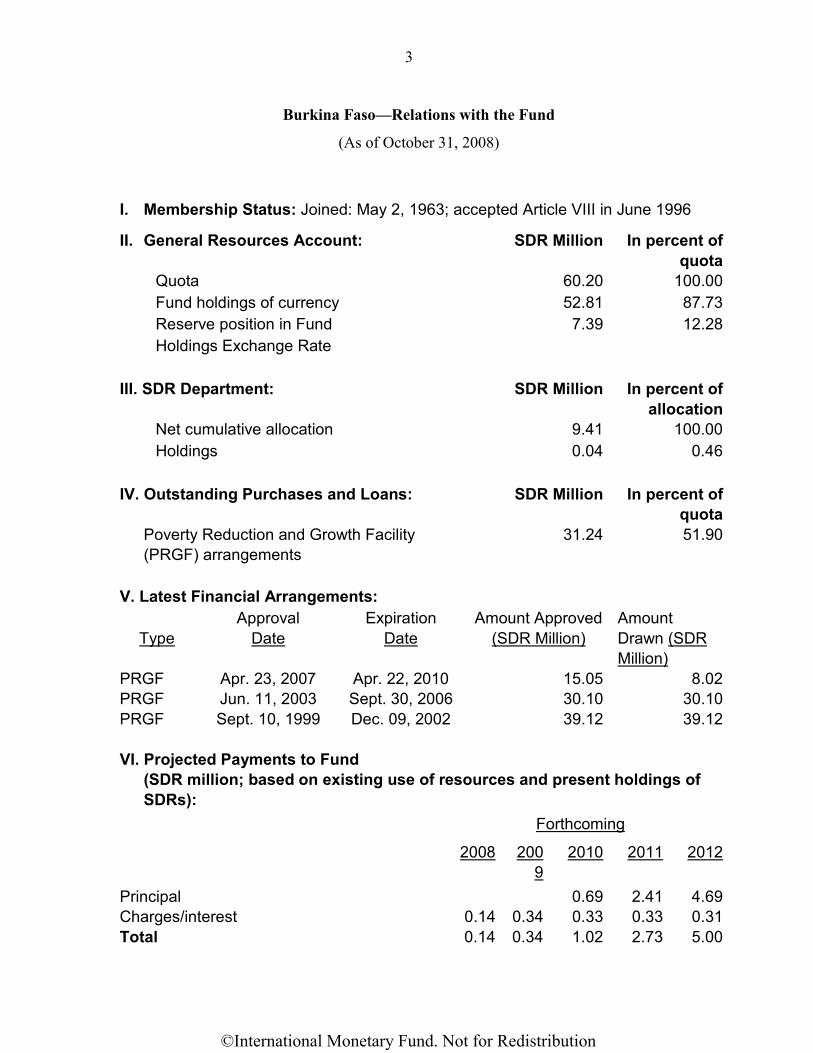
3
Burkina Faso—Relations with the Fund
(As of October 31, 2008)
I. Membership Status: Joined: May 2, 1963; accepted Article VIII in June 1996
II. General Resources Account: SDR Million In percent of quota
Quota 60.20 100.00 Fund holdings of currency 52.81 87.73 Reserve position in Fund 7.39 12.28 Holdings Exchange Rate III. SDR Department: SDR Million In percent of
allocation Net cumulative allocation 9.41 100.00 Holdings 0.04 0.46 IV. Outstanding Purchases and Loans: SDR Million In percent of
quota Poverty Reduction and Growth Facility
(PRGF) arrangements 31.24 51.90
V. Latest Financial Arrangements:
Type Approval
Date Expiration
Date Amount Approved
(SDR Million) Amount Drawn (SDR Million)
PRGF Apr. 23, 2007 Apr. 22, 2010 15.05 8.02PRGF Jun. 11, 2003 Sept. 30, 2006 30.10 30.10PRGF Sept. 10, 1999 Dec. 09, 2002 39.12 39.12 VI. Projected Payments to Fund (SDR million; based on existing use of resources and present holdings of
SDRs): Forthcoming
2008 2009
2010 2011 2012
Principal 0.69 2.41 4.69Charges/interest 0.14 0.34 0.33 0.33 0.31Total 0.14 0.34 1.02 2.73 5.00
©International Monetary Fund. Not for Redistribution
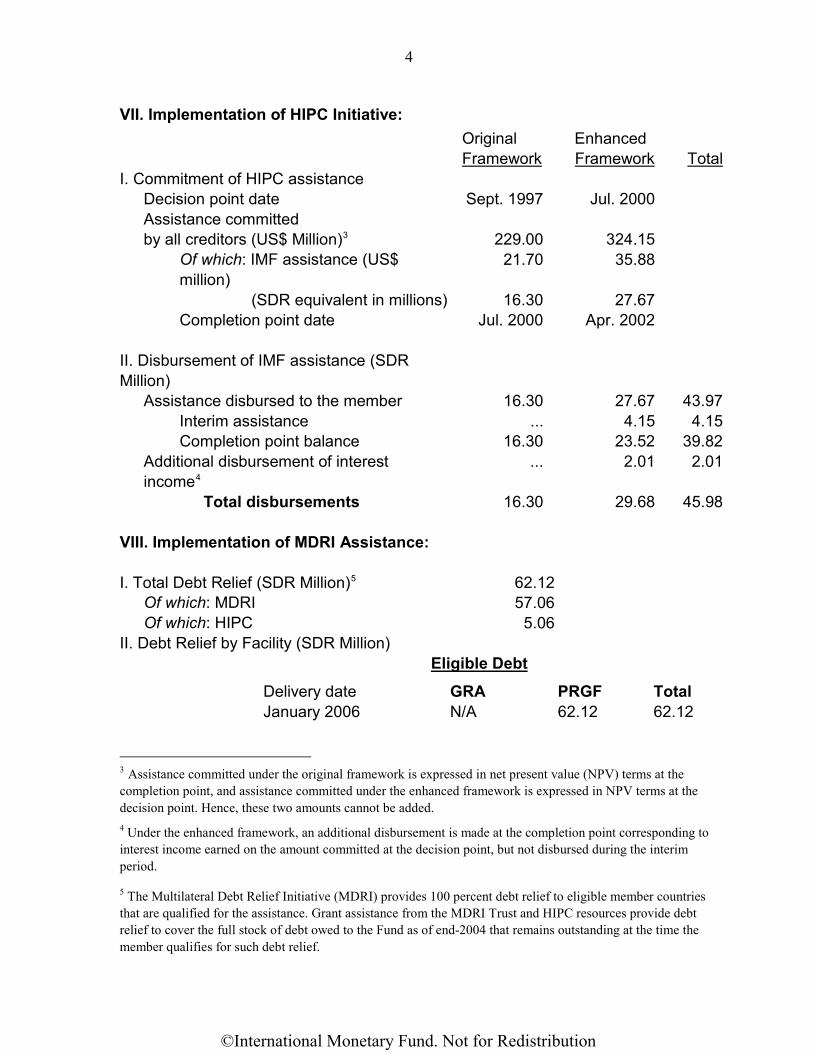
4
VII. Implementation of HIPC Initiative: Original
Framework Enhanced Framework
Total
I. Commitment of HIPC assistance Decision point date Sept. 1997 Jul. 2000 Assistance committed by all creditors (US$ Million)3 229.00 324.15 Of which: IMF assistance (US$
million) 21.70 35.88
(SDR equivalent in millions) 16.30 27.67 Completion point date Jul. 2000 Apr. 2002 II. Disbursement of IMF assistance (SDR Million)
Assistance disbursed to the member 16.30 27.67 43.97 Interim assistance ... 4.15 4.15
Completion point balance 16.30 23.52 39.82 Additional disbursement of interest
income4 ... 2.01 2.01
Total disbursements 16.30 29.68 45.98 VIII. Implementation of MDRI Assistance: I. Total Debt Relief (SDR Million)5 62.12 Of which: MDRI 57.06 Of which: HIPC 5.06 II. Debt Relief by Facility (SDR Million) Eligible Debt
Delivery date GRA PRGF Total January 2006 N/A 62.12 62.12 3 Assistance committed under the original framework is expressed in net present value (NPV) terms at the completion point, and assistance committed under the enhanced framework is expressed in NPV terms at the decision point. Hence, these two amounts cannot be added. 4 Under the enhanced framework, an additional disbursement is made at the completion point corresponding to interest income earned on the amount committed at the decision point, but not disbursed during the interim period.
5 The Multilateral Debt Relief Initiative (MDRI) provides 100 percent debt relief to eligible member countries that are qualified for the assistance. Grant assistance from the MDRI Trust and HIPC resources provide debt relief to cover the full stock of debt owed to the Fund as of end-2004 that remains outstanding at the time the member qualifies for such debt relief.
©International Monetary Fund. Not for Redistribution
5
IX. Safeguards Assessments:
The Central Bank of West African States (BCEAO) is the common central bank of the countries of the West African Economic and Monetary Union, which includes Burkina Faso. The most recent safeguards assessment of the BCEAO was completed on November 4, 2005. The assessment indicated progress has been made in strengthening the bank's safeguards framework since the 2002 assessment and identified some areas where further steps would help solidify it. The BCEAO now publishes a full set of audited financial statements and improvements have been made to move financial reporting closer to International Financial Reporting Standards (IFRS). Furthermore, an internal audit charter has been put in place, mechanisms for improving risk management have been established, and follow-up on internal and external audit recommendations has been strengthened. The results of continuous safeguards monitoring indicate that while certain vulnerabilities remain in internal control systems and legal structure, there has been some progress in other areas, including through: (i) improving the external audit process by adopting a multi-year audit program; (ii) establishing an audit committee; (iii) expanding disclosures on financial positions of WAEMU countries with the Fund in the notes to the annual financial statements; and (iv) further strengthening of the effectiveness of the internal audit function.
X. Exchange Rate Arrangement:
Burkina Faso is a member of the West African Economic and Monetary Union (WAEMU) and has no separate legal tender. The union’s common currency, the CFA franc, is pegged to the euro at a rate of CFAF 655.957 = EUR 1, consistent with the official conversions rate of the French franc to the Euro and the previous fixed rate of the CFA franc to the French franc of CFAF 100= F 1. On October 30, 2008, the rate of the CFA franc in terms of SDR was CFAF 756.57 = SDR 1.0. Effective January 1, 2007, the exchange arrangement of the WAEMU countries has been reclassified to the category of conventional pegged arrangement from the category of exchange arrangement with no separate legal tender. The new classification is based on the behavior of the common currency, whereas the previous classification was based on the lack of a separate legal tender. The new classification thus only reflects a definitional change, and is not based on a judgment that there has been a substantive change in the exchange regime or other policies of the currency union or its member. The exchange system is free of restrictions on the making of payments and transfers on current international transactions.
©International Monetary Fund. Not for Redistribution
6
XI. Article IV Consultations:
The periodicity of Burkina Faso’s Article IV consultation is set in accordance with the July 15, 2002 Executive Board Decision on consultation cycles. Discussions on the 2007 Article IV consultation and first review under the Poverty Reduction and Growth Facility (PRGF) were held during the period September 19–October 4, 2007 in Ouagadougou. The staff report and the Selected Issues and Informational Annex were considered by the Executive Board on January 9, 2008.
XII. ROSC/AAP:
An FAD mission visited Ouagadougou during May 7–18, 2001 to assist the authorities undertake a draft fiscal module of a Report on the Observance of Standards and Codes (ROSC). The final report, which was issued in July 2002, found that Burkina Faso was making good progress in a number of areas to increase the transparency and accountability of government. Additional efforts are needed to bring a number of improvements to the point of implementation, particularly with regard to expenditure tracking at the local level and external audit functions. Initial discussions indicated that the authorities broadly concurred with the mission assessment. On July 31, 2002, the authorities formally adopted an action plan based on the recommendations of the final ROSC.
An STA mission during May 8–21, 2003 assisted the authorities in preparing a data ROSC. The report was published in March 2004. The mission found that most of the methodologies used in the compilation of macroeconomic statistics are in broad conformity with internationally accepted guidelines. However, most datasets are affected by limited or impaired source data arising from irregularity in the conduct of surveys (national accounts), use of outdated weights (CPI), or low response rate to surveys (balance of payments). For CPI and government finance statistics, data dissemination meets the SDDS requirement, but for other macroeconomic datasets, timeliness falls short of GDDS recommendations. The authorities broadly concurred with the main findings of the mission as well as the recommendations made to address them.
The team, jointly with World Bank staff, also discussed a HIPC Initiative Assessment and Action Plan (AAP) with the authorities. The aim was to assess the capacity of the public expenditure management system to track poverty-reducing public expenditures under the HIPC Initiative and the need for technical assistance to enhance that capacity. The mission secured the officials’ approval of the jointly prepared preliminary assessment; identified the main needs for technical assistance on upgrading the capacity to track such expenditures; and drew up a draft outline action plan. This plan identifies the main needs for further technical assistance to improve tracking of poverty-reducing expenditures. The AAP has been endorsed by the authorities.
©International Monetary Fund. Not for Redistribution
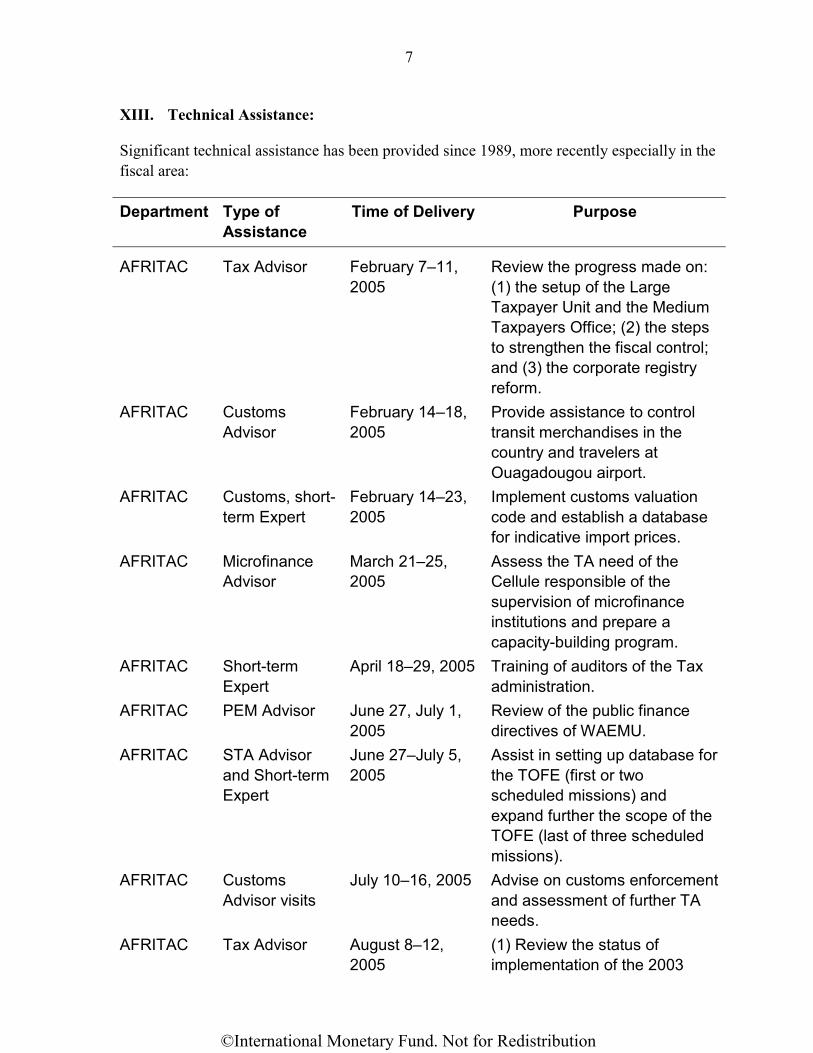
7
XIII. Technical Assistance:
Significant technical assistance has been provided since 1989, more recently especially in the fiscal area:
Department Type of Assistance
Time of Delivery Purpose
AFRITAC Tax Advisor February 7–11, 2005
Review the progress made on: (1) the setup of the Large Taxpayer Unit and the Medium Taxpayers Office; (2) the steps to strengthen the fiscal control; and (3) the corporate registry reform.
AFRITAC Customs Advisor
February 14–18, 2005
Provide assistance to control transit merchandises in the country and travelers at Ouagadougou airport.
AFRITAC
Customs, short-term Expert
February 14–23, 2005
Implement customs valuation code and establish a database for indicative import prices.
AFRITAC Microfinance Advisor
March 21–25, 2005
Assess the TA need of the Cellule responsible of the supervision of microfinance institutions and prepare a capacity-building program.
AFRITAC Short-term Expert
April 18–29, 2005 Training of auditors of the Tax administration.
AFRITAC
PEM Advisor June 27, July 1, 2005
Review of the public finance directives of WAEMU.
AFRITAC STA Advisor and Short-term Expert
June 27–July 5, 2005
Assist in setting up database for the TOFE (first or two scheduled missions) and expand further the scope of the TOFE (last of three scheduled missions).
AFRITAC Customs Advisor visits
July 10–16, 2005 Advise on customs enforcement and assessment of further TA needs.
AFRITAC Tax Advisor August 8–12, 2005
(1) Review the status of implementation of the 2003
©International Monetary Fund. Not for Redistribution
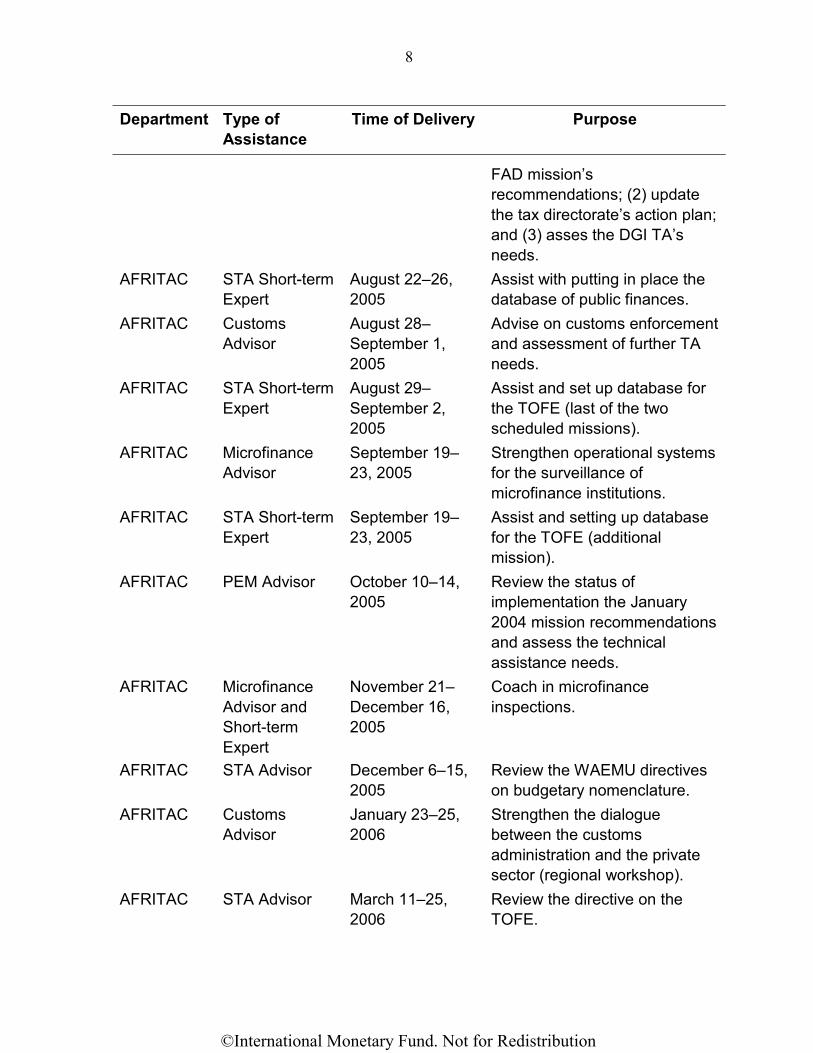
8
Department Type of Assistance
Time of Delivery Purpose
FAD mission’s recommendations; (2) update the tax directorate’s action plan; and (3) asses the DGI TA’s needs.
AFRITAC STA Short-term Expert
August 22–26, 2005
Assist with putting in place the database of public finances.
AFRITAC Customs Advisor
August 28–September 1, 2005
Advise on customs enforcement and assessment of further TA needs.
AFRITAC STA Short-term Expert
August 29–September 2, 2005
Assist and set up database for the TOFE (last of the two scheduled missions).
AFRITAC Microfinance Advisor
September 19–23, 2005
Strengthen operational systems for the surveillance of microfinance institutions.
AFRITAC STA Short-term Expert
September 19–23, 2005
Assist and setting up database for the TOFE (additional mission).
AFRITAC
PEM Advisor October 10–14, 2005
Review the status of implementation the January 2004 mission recommendations and assess the technical assistance needs.
AFRITAC Microfinance Advisor and Short-term Expert
November 21–December 16, 2005
Coach in microfinance inspections.
AFRITAC STA Advisor December 6–15, 2005
Review the WAEMU directives on budgetary nomenclature.
AFRITAC Customs Advisor
January 23–25, 2006
Strengthen the dialogue between the customs administration and the private sector (regional workshop).
AFRITAC STA Advisor March 11–25, 2006
Review the directive on the TOFE.
©International Monetary Fund. Not for Redistribution
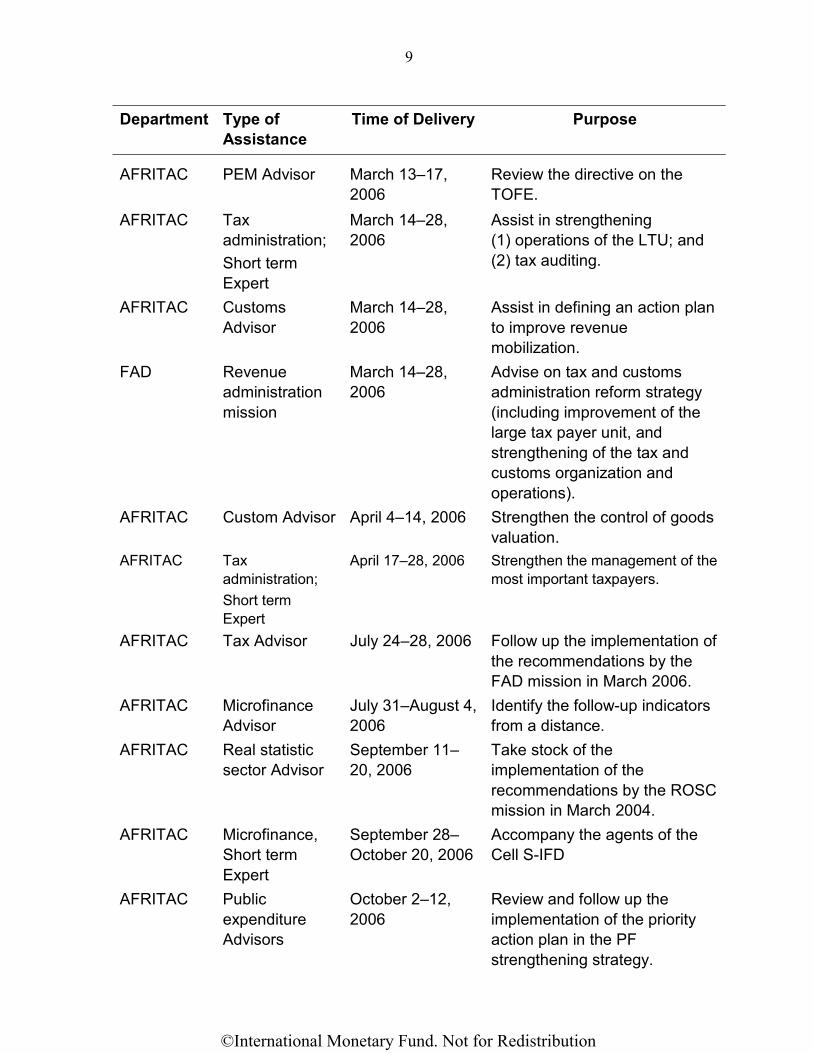
9
Department Type of Assistance
Time of Delivery Purpose
AFRITAC
PEM Advisor March 13–17, 2006
Review the directive on the TOFE.
AFRITAC Tax administration; Short term Expert
March 14–28, 2006
Assist in strengthening (1) operations of the LTU; and (2) tax auditing.
AFRITAC Customs Advisor
March 14–28, 2006
Assist in defining an action plan to improve revenue mobilization.
FAD Revenue administration mission
March 14–28, 2006
Advise on tax and customs administration reform strategy (including improvement of the large tax payer unit, and strengthening of the tax and customs organization and operations).
AFRITAC Custom Advisor April 4–14, 2006 Strengthen the control of goods valuation.
AFRITAC Tax administration; Short term Expert
April 17–28, 2006 Strengthen the management of the most important taxpayers.
AFRITAC Tax Advisor July 24–28, 2006 Follow up the implementation of the recommendations by the FAD mission in March 2006.
AFRITAC Microfinance Advisor
July 31–August 4, 2006
Identify the follow-up indicators from a distance.
AFRITAC Real statistic sector Advisor
September 11–20, 2006
Take stock of the implementation of the recommendations by the ROSC mission in March 2004.
AFRITAC Microfinance, Short term Expert
September 28–October 20, 2006
Accompany the agents of the Cell S-IFD
AFRITAC Public expenditure Advisors
October 2–12, 2006
Review and follow up the implementation of the priority action plan in the PF strengthening strategy.
©International Monetary Fund. Not for Redistribution
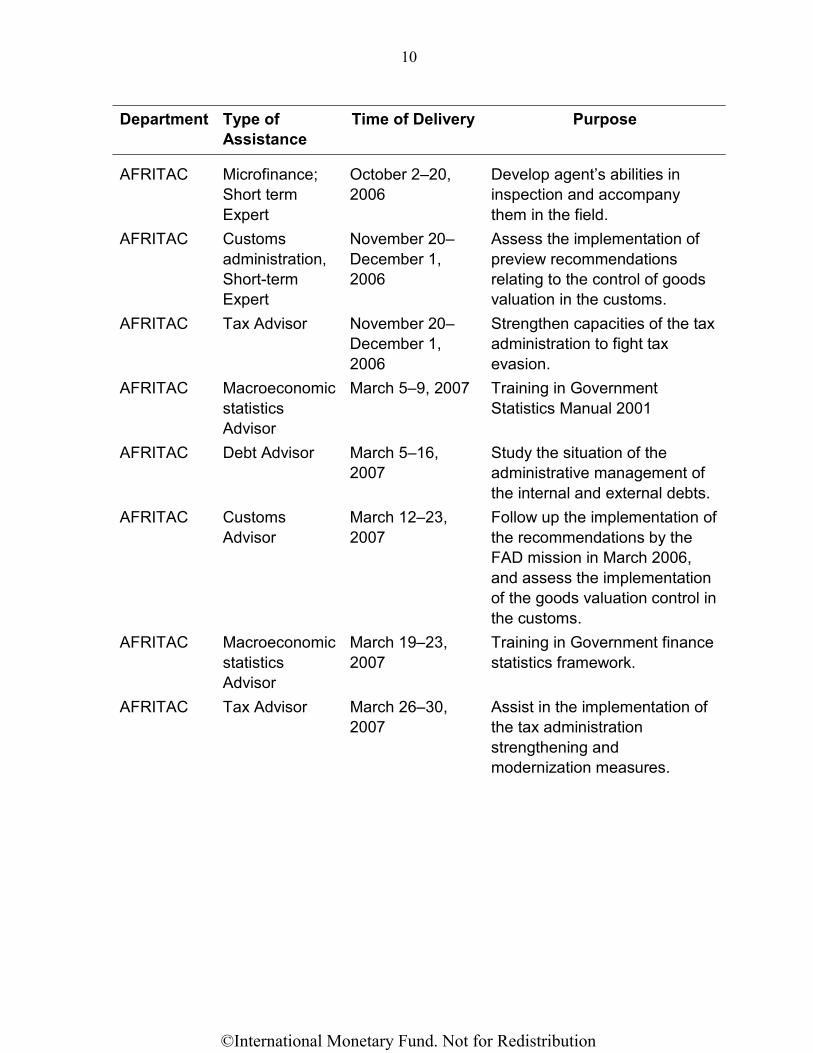
10
Department Type of Assistance
Time of Delivery Purpose
AFRITAC Microfinance; Short term Expert
October 2–20, 2006
Develop agent’s abilities in inspection and accompany them in the field.
AFRITAC Customs administration, Short-term Expert
November 20–December 1, 2006
Assess the implementation of preview recommendations relating to the control of goods valuation in the customs.
AFRITAC
Tax Advisor November 20–December 1, 2006
Strengthen capacities of the tax administration to fight tax evasion.
AFRITAC Macroeconomic statistics Advisor
March 5–9, 2007 Training in Government Statistics Manual 2001
AFRITAC Debt Advisor March 5–16, 2007
Study the situation of the administrative management of the internal and external debts.
AFRITAC Customs Advisor
March 12–23, 2007
Follow up the implementation of the recommendations by the FAD mission in March 2006, and assess the implementation of the goods valuation control in the customs.
AFRITAC Macroeconomic statistics Advisor
March 19–23, 2007
Training in Government finance statistics framework.
AFRITAC Tax Advisor March 26–30, 2007
Assist in the implementation of the tax administration strengthening and modernization measures.
©International Monetary Fund. Not for Redistribution
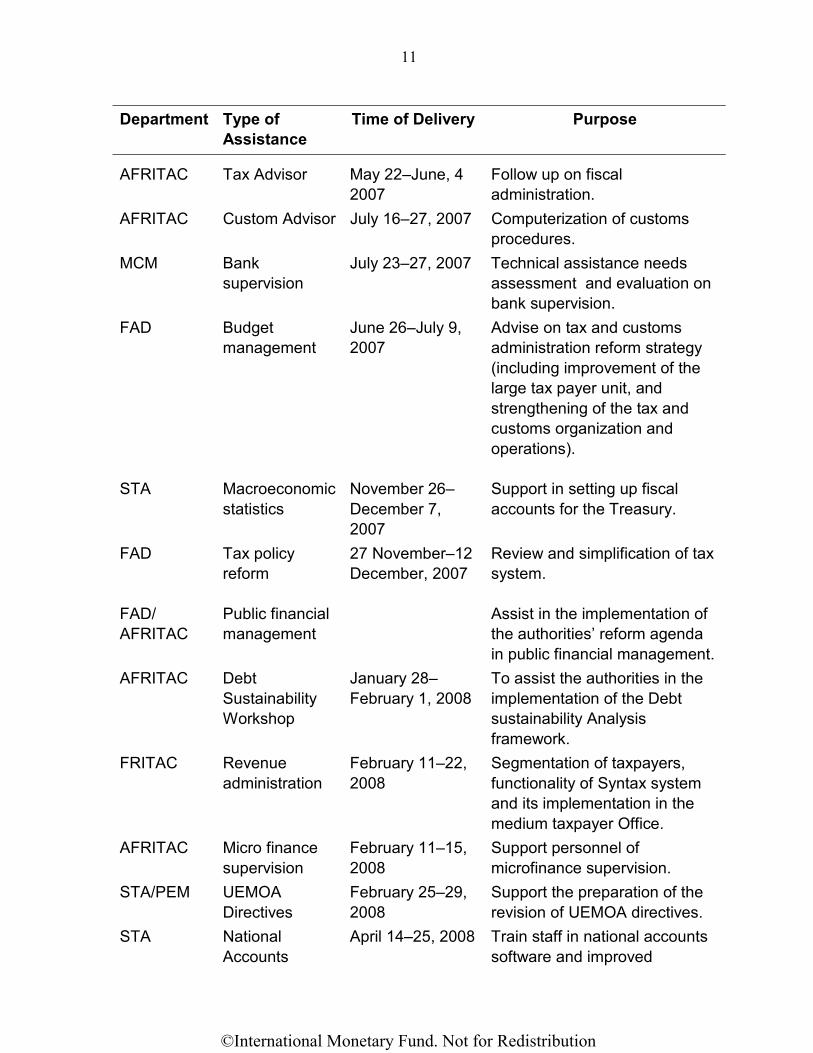
11
Department Type of Assistance
Time of Delivery Purpose
AFRITAC Tax Advisor May 22–June, 4 2007
Follow up on fiscal administration.
AFRITAC Custom Advisor July 16–27, 2007 Computerization of customs procedures.
MCM Bank supervision
July 23–27, 2007 Technical assistance needs assessment and evaluation on bank supervision.
FAD
Budget management
June 26–July 9, 2007
Advise on tax and customs administration reform strategy (including improvement of the large tax payer unit, and strengthening of the tax and customs organization and operations).
STA Macroeconomic statistics
November 26–December 7, 2007
Support in setting up fiscal accounts for the Treasury.
FAD Tax policy reform
27 November–12 December, 2007
Review and simplification of tax system.
FAD/ AFRITAC
Public financial management
Assist in the implementation of the authorities’ reform agenda in public financial management.
AFRITAC Debt Sustainability Workshop
January 28–February 1, 2008
To assist the authorities in the implementation of the Debt sustainability Analysis framework.
FRITAC Revenue administration
February 11–22, 2008
Segmentation of taxpayers, functionality of Syntax system and its implementation in the medium taxpayer Office.
AFRITAC Micro finance supervision
February 11–15, 2008
Support personnel of microfinance supervision.
STA/PEM UEMOA Directives
February 25–29, 2008
Support the preparation of the revision of UEMOA directives.
STA National Accounts
April 14–25, 2008 Train staff in national accounts software and improved
©International Monetary Fund. Not for Redistribution
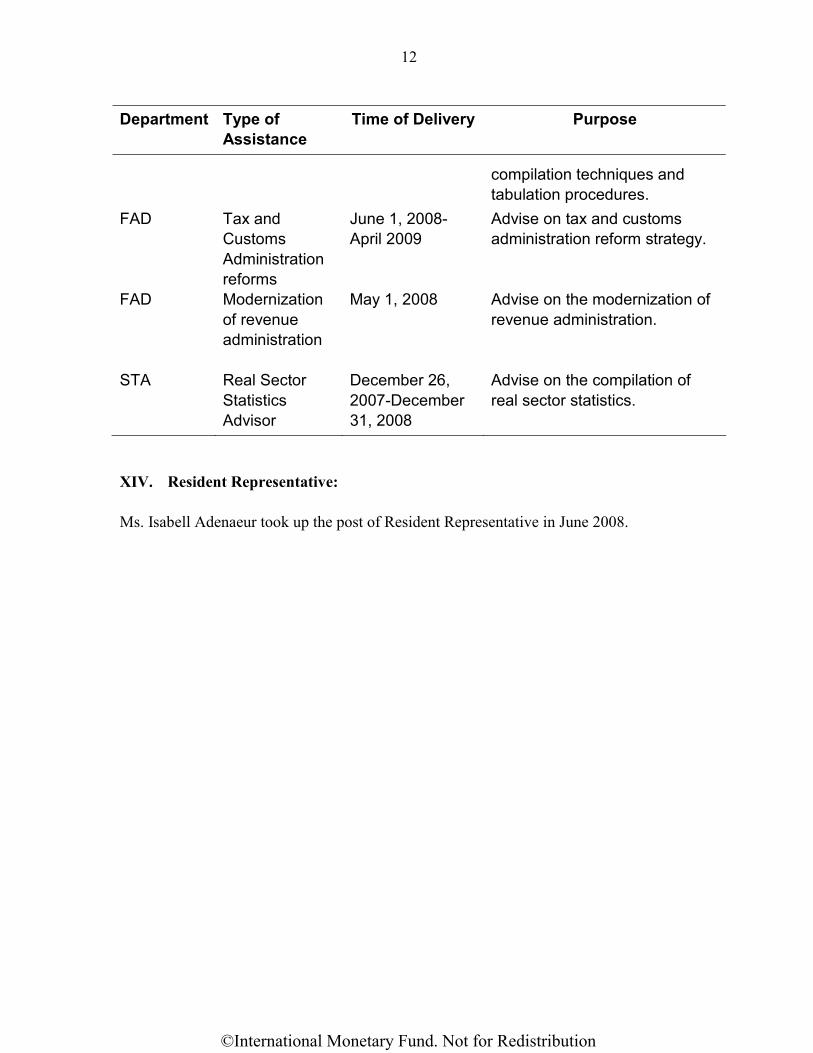
12
Department Type of Assistance
Time of Delivery Purpose
compilation techniques and tabulation procedures.
FAD Tax and Customs Administration reforms
June 1, 2008-April 2009
Advise on tax and customs administration reform strategy.
FAD Modernization of revenue administration
May 1, 2008
Advise on the modernization of revenue administration.
STA Real Sector Statistics Advisor
December 26, 2007-December 31, 2008
Advise on the compilation of real sector statistics.
XIV. Resident Representative: Ms. Isabell Adenaeur took up the post of Resident Representative in June 2008.
©International Monetary Fund. Not for Redistribution
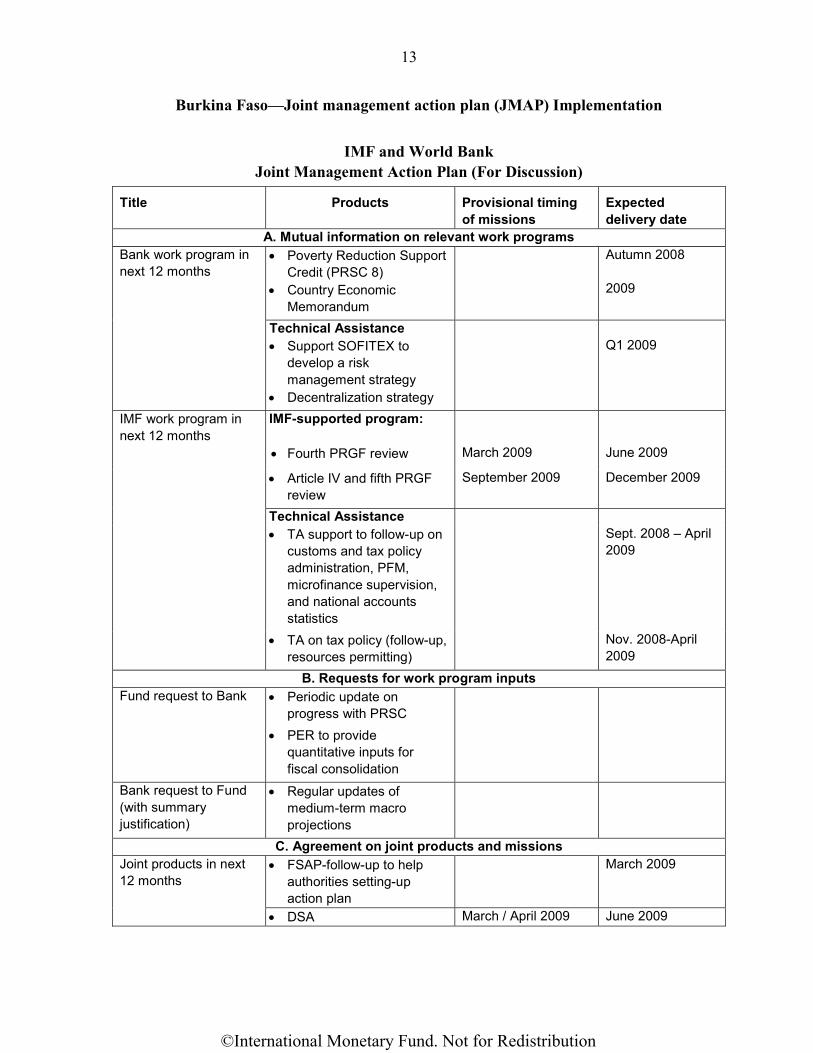
13
Burkina Faso—Joint management action plan (JMAP) Implementation
IMF and World Bank
Joint Management Action Plan (For Discussion)
Title Products Provisional timing of missions
Expected delivery date
A. Mutual information on relevant work programs Bank work program in next 12 months
• Poverty Reduction Support Credit (PRSC 8)
• Country Economic Memorandum
Autumn 2008 2009
Technical Assistance • Support SOFITEX to
develop a risk management strategy
• Decentralization strategy
Q1 2009
IMF work program in next 12 months
IMF-supported program: • Fourth PRGF review
March 2009
June 2009
• Article IV and fifth PRGF review
September 2009 December 2009
Technical Assistance • TA support to follow-up on
customs and tax policy administration, PFM, microfinance supervision, and national accounts statistics
Sept. 2008 – April 2009
• TA on tax policy (follow-up, resources permitting)
Nov. 2008-April 2009
B. Requests for work program inputs Fund request to Bank • Periodic update on
progress with PRSC • PER to provide
quantitative inputs for fiscal consolidation
Bank request to Fund (with summary justification)
• Regular updates of medium-term macro projections
C. Agreement on joint products and missions Joint products in next 12 months
• FSAP-follow-up to help authorities setting-up action plan
March 2009
• DSA March / April 2009 June 2009
©International Monetary Fund. Not for Redistribution
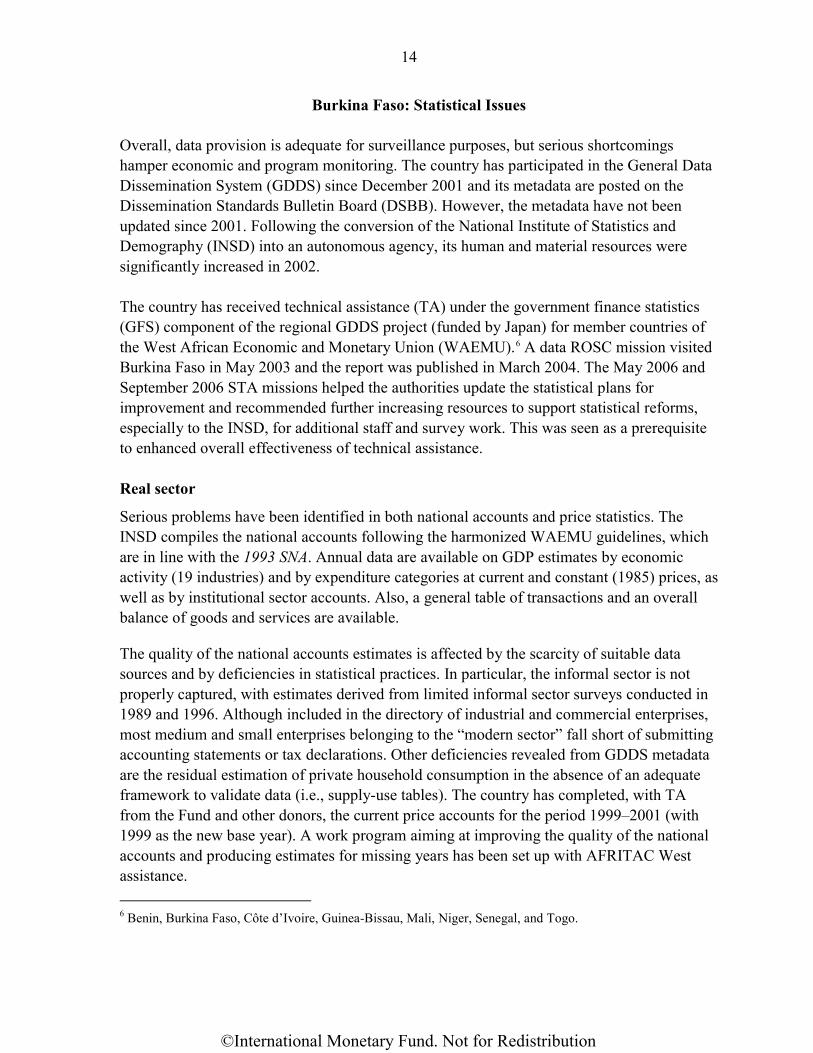
14
Burkina Faso: Statistical Issues Overall, data provision is adequate for surveillance purposes, but serious shortcomings hamper economic and program monitoring. The country has participated in the General Data Dissemination System (GDDS) since December 2001 and its metadata are posted on the Dissemination Standards Bulletin Board (DSBB). However, the metadata have not been updated since 2001. Following the conversion of the National Institute of Statistics and Demography (INSD) into an autonomous agency, its human and material resources were significantly increased in 2002. The country has received technical assistance (TA) under the government finance statistics (GFS) component of the regional GDDS project (funded by Japan) for member countries of the West African Economic and Monetary Union (WAEMU).6 A data ROSC mission visited Burkina Faso in May 2003 and the report was published in March 2004. The May 2006 and September 2006 STA missions helped the authorities update the statistical plans for improvement and recommended further increasing resources to support statistical reforms, especially to the INSD, for additional staff and survey work. This was seen as a prerequisite to enhanced overall effectiveness of technical assistance. Real sector
Serious problems have been identified in both national accounts and price statistics. The INSD compiles the national accounts following the harmonized WAEMU guidelines, which are in line with the 1993 SNA. Annual data are available on GDP estimates by economic activity (19 industries) and by expenditure categories at current and constant (1985) prices, as well as by institutional sector accounts. Also, a general table of transactions and an overall balance of goods and services are available.
The quality of the national accounts estimates is affected by the scarcity of suitable data sources and by deficiencies in statistical practices. In particular, the informal sector is not properly captured, with estimates derived from limited informal sector surveys conducted in 1989 and 1996. Although included in the directory of industrial and commercial enterprises, most medium and small enterprises belonging to the “modern sector” fall short of submitting accounting statements or tax declarations. Other deficiencies revealed from GDDS metadata are the residual estimation of private household consumption in the absence of an adequate framework to validate data (i.e., supply-use tables). The country has completed, with TA from the Fund and other donors, the current price accounts for the period 1999–2001 (with 1999 as the new base year). A work program aiming at improving the quality of the national accounts and producing estimates for missing years has been set up with AFRITAC West assistance. 6 Benin, Burkina Faso, Côte d’Ivoire, Guinea-Bissau, Mali, Niger, Senegal, and Togo.
©International Monetary Fund. Not for Redistribution

15
The consumer price index compiled by the INSD follows the methodology of the harmonized index adopted by the WAEMU member countries. The index only covers expenditures by households living in the capital. Further restrictions are the exclusion of non-African households, various types of purchased goods and services, as well as services of owner-occupied dwellings. The weight for the item “food, beverages, and tobacco” (33.9 percent of the total) is very low in comparison with neighboring countries. A possible explanation is that the survey from which the weights are taken did not cover a full year. There are plans—subject to the availability of funding—to update the weights. Currently, the base year is 1996. When a product is unavailable, its price is presumed to remain unchanged for a period of up to three months, which is in conformity with the WAEMU methodology. However, best practice would impute a price change for these items on the basis of the prices recorded for closely related products. The software package used for calculating the consumer price index needs to be improved. There do not seem to be other major problems concerning the index, whose periodicity and timeliness meet SDDS requirements. The index is published by the INSD and is also available on the Central Bank of West African States (BCEAO) and AFRISTAT websites.
The authorities do not compile a producer price index or wholesale price index. According to plans for improvement posted on the DSBB, the development of these indices is not envisaged, even for the medium term.
Government finance
In general, GFS compilation is constrained by a lack of coordination among fiscal agencies. The data ROSC identified as areas for improvement the production of functional and ministerial breakdown of expenditure, extending the coverage of the TOFE to the general government, and basing compilation on the Treasury ledger. The above-mentioned areas benefited from the June–July 2007 FAD/AFRITAC West public finance management mission. It provided a medium-term strategy to improve budget management, furthered the progress on prior STA recommendations, and strongly encouraged the authorities to adopt functional classification of expenditure and other methods consistent with GFSM 2001. Annual data are published in the International Financial Statistics (IFS) through 2005. No detailed monthly or quarterly data have been reported to STA for publication. The 2007 Government Finance Statistics Yearbook includes data for 2004, 2005 and 2006 that were for the first time reported in the format of the Government Finance Statistics Manual 2001 (GFSM 2001). The data cover budgetary operations only, but include a breakdown by function for 2004.
Monetary and financial statistics
Preliminary monetary data are prepared by the national agency of the BCEAO and released officially (including to the IMF Statistics Department (STA)) by the BCEAO headquarters. Most of the problems in the monetary statistics are not specific to Burkina Faso, but affect all member countries of the WAEMU. For example, the BCEAO has encountered difficulties in
©International Monetary Fund. Not for Redistribution
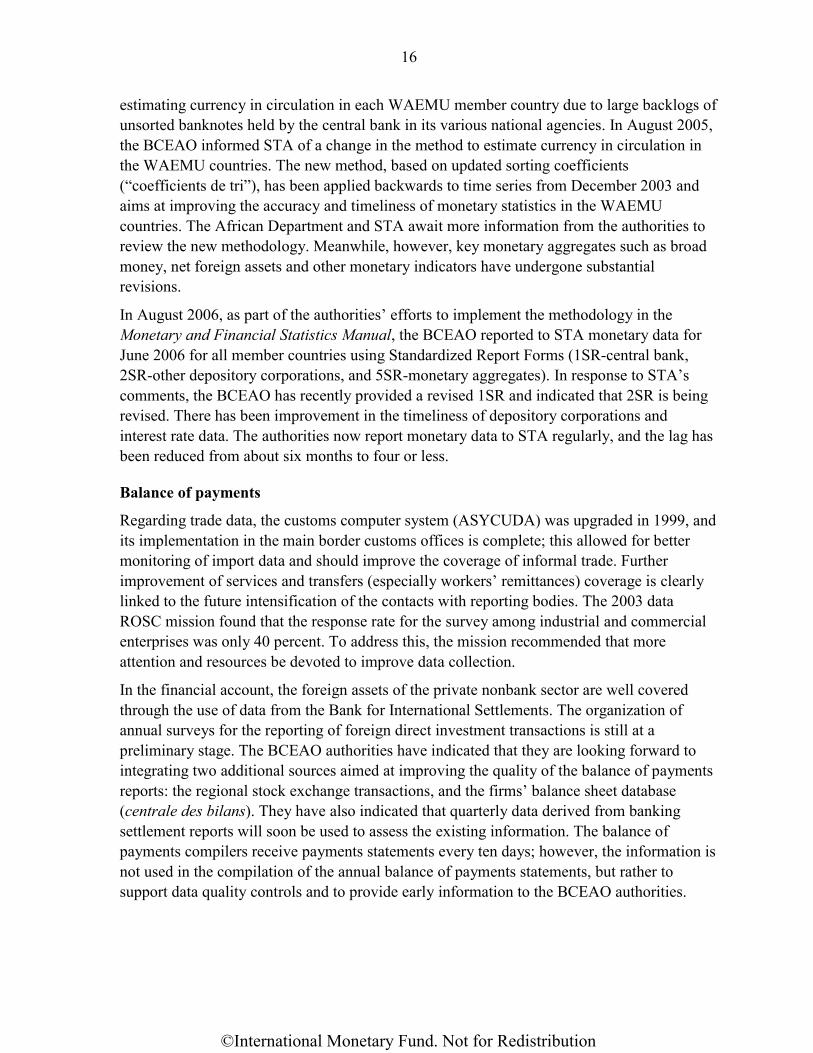
16
estimating currency in circulation in each WAEMU member country due to large backlogs of unsorted banknotes held by the central bank in its various national agencies. In August 2005, the BCEAO informed STA of a change in the method to estimate currency in circulation in the WAEMU countries. The new method, based on updated sorting coefficients (“coefficients de tri”), has been applied backwards to time series from December 2003 and aims at improving the accuracy and timeliness of monetary statistics in the WAEMU countries. The African Department and STA await more information from the authorities to review the new methodology. Meanwhile, however, key monetary aggregates such as broad money, net foreign assets and other monetary indicators have undergone substantial revisions.
In August 2006, as part of the authorities’ efforts to implement the methodology in the Monetary and Financial Statistics Manual, the BCEAO reported to STA monetary data for June 2006 for all member countries using Standardized Report Forms (1SR-central bank, 2SR-other depository corporations, and 5SR-monetary aggregates). In response to STA’s comments, the BCEAO has recently provided a revised 1SR and indicated that 2SR is being revised. There has been improvement in the timeliness of depository corporations and interest rate data. The authorities now report monetary data to STA regularly, and the lag has been reduced from about six months to four or less.
Balance of payments
Regarding trade data, the customs computer system (ASYCUDA) was upgraded in 1999, and its implementation in the main border customs offices is complete; this allowed for better monitoring of import data and should improve the coverage of informal trade. Further improvement of services and transfers (especially workers’ remittances) coverage is clearly linked to the future intensification of the contacts with reporting bodies. The 2003 data ROSC mission found that the response rate for the survey among industrial and commercial enterprises was only 40 percent. To address this, the mission recommended that more attention and resources be devoted to improve data collection.
In the financial account, the foreign assets of the private nonbank sector are well covered through the use of data from the Bank for International Settlements. The organization of annual surveys for the reporting of foreign direct investment transactions is still at a preliminary stage. The BCEAO authorities have indicated that they are looking forward to integrating two additional sources aimed at improving the quality of the balance of payments reports: the regional stock exchange transactions, and the firms’ balance sheet database (centrale des bilans). They have also indicated that quarterly data derived from banking settlement reports will soon be used to assess the existing information. The balance of payments compilers receive payments statements every ten days; however, the information is not used in the compilation of the annual balance of payments statements, but rather to support data quality controls and to provide early information to the BCEAO authorities.
©International Monetary Fund. Not for Redistribution
17
The computer debt-management system software, SYGADE, developed by the United Nations Conference on Trade and Development, was introduced in 1999 and is fully operational. Information on debt disbursement has also been fully integrated with the expenditure-monitoring system. The BCEAO national agency disseminates balance of payments statistics with a seven-month lag, in partial compliance with the recommendations of the GDDS, and annual international investment position data with an eighteen-month lag. Updates for the IFS and the BOPSY since 2001 are pending. Despite reiterated requests, BOP and IIP data have not been reported to STA for publication in IFS and the BOPSY since 2001.
©International Monetary Fund. Not for Redistribution
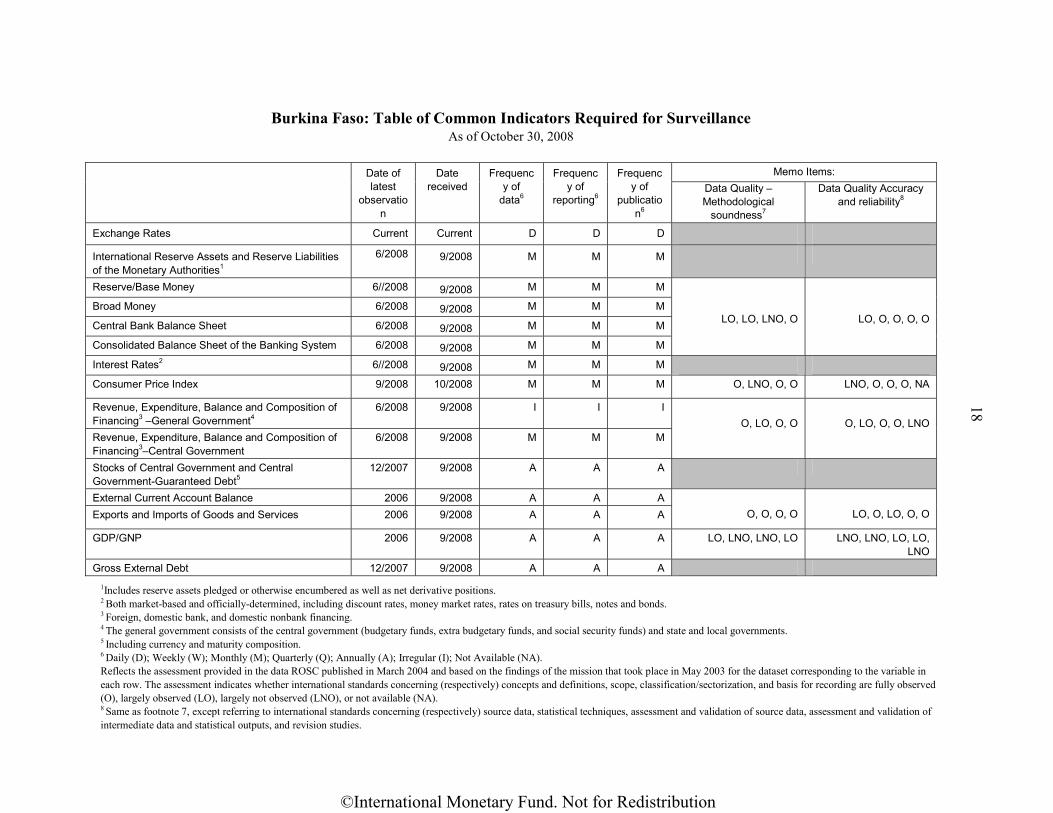
18
Burkina Faso: Table of Common Indicators Required for Surveillance As of October 30, 2008
Memo Items: Date of
latest observatio
n
Date received
Frequency of
data6
Frequency of
reporting6
Frequency of
publication6
Data Quality –Methodological
soundness7
Data Quality Accuracy and reliability8
Exchange Rates Current Current D D D
International Reserve Assets and Reserve Liabilities of the Monetary Authorities1
6/2008 9/2008 M M M
Reserve/Base Money 6//2008 9/2008 M M M
Broad Money 6/2008 9/2008 M M M
Central Bank Balance Sheet 6/2008 9/2008 M M M
Consolidated Balance Sheet of the Banking System 6/2008 9/2008 M M M
LO, LO, LNO, O
LO, O, O, O, O
Interest Rates2 6//2008 9/2008 M M M
Consumer Price Index 9/2008 10/2008 M M M O, LNO, O, O LNO, O, O, O, NA
Revenue, Expenditure, Balance and Composition of Financing3 –General Government4
6/2008 9/2008 I I I
Revenue, Expenditure, Balance and Composition of Financing3–Central Government
6/2008 9/2008 M M M
O, LO, O, O
O, LO, O, O, LNO
Stocks of Central Government and Central
Government-Guaranteed Debt5 12/2007 9/2008 A A A
External Current Account Balance 2006 9/2008 A A A Exports and Imports of Goods and Services 2006 9/2008 A A A
O, O, O, O
LO, O, LO, O, O
GDP/GNP 2006 9/2008 A A A LO, LNO, LNO, LO LNO, LNO, LO, LO, LNO
Gross External Debt 12/2007 9/2008 A A A 1Includes reserve assets pledged or otherwise encumbered as well as net derivative positions. 2 Both market-based and officially-determined, including discount rates, money market rates, rates on treasury bills, notes and bonds. 3 Foreign, domestic bank, and domestic nonbank financing. 4 The general government consists of the central government (budgetary funds, extra budgetary funds, and social security funds) and state and local governments. 5 Including currency and maturity composition. 6 Daily (D); Weekly (W); Monthly (M); Quarterly (Q); Annually (A); Irregular (I); Not Available (NA). Reflects the assessment provided in the data ROSC published in March 2004 and based on the findings of the mission that took place in May 2003 for the dataset corresponding to the variable in each row. The assessment indicates whether international standards concerning (respectively) concepts and definitions, scope, classification/sectorization, and basis for recording are fully observed (O), largely observed (LO), largely not observed (LNO), or not available (NA). 8 Same as footnote 7, except referring to international standards concerning (respectively) source data, statistical techniques, assessment and validation of source data, assessment and validation of intermediate data and statistical outputs, and revision studies.
©International Monetary Fund. Not for Redistribution
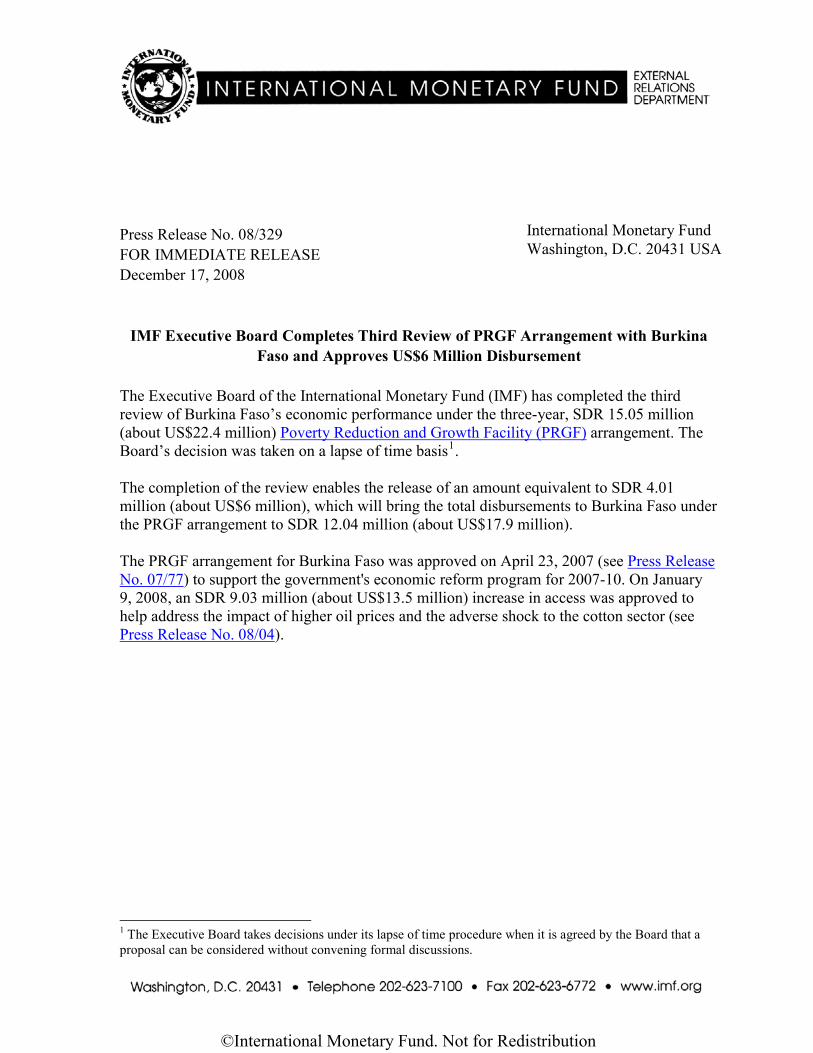
International Monetary Fund Washington, D.C. 20431 USA
Press Release No. 08/329 FOR IMMEDIATE RELEASE December 17, 2008
IMF Executive Board Completes Third Review of PRGF Arrangement with Burkina Faso and Approves US$6 Million Disbursement
The Executive Board of the International Monetary Fund (IMF) has completed the third review of Burkina Faso’s economic performance under the three-year, SDR 15.05 million (about US$22.4 million) Poverty Reduction and Growth Facility (PRGF) arrangement. The Board’s decision was taken on a lapse of time basis1. The completion of the review enables the release of an amount equivalent to SDR 4.01 million (about US$6 million), which will bring the total disbursements to Burkina Faso under the PRGF arrangement to SDR 12.04 million (about US$17.9 million). The PRGF arrangement for Burkina Faso was approved on April 23, 2007 (see Press Release No. 07/77) to support the government's economic reform program for 2007-10. On January 9, 2008, an SDR 9.03 million (about US$13.5 million) increase in access was approved to help address the impact of higher oil prices and the adverse shock to the cotton sector (see Press Release No. 08/04).
1 The Executive Board takes decisions under its lapse of time procedure when it is agreed by the Board that a proposal can be considered without convening formal discussions.
©International Monetary Fund. Not for Redistribution
Related Documents