James Scott Ford Northside ISD, San Antonio, TX [email protected] DEMOGRAPHIC FACTORS IN THE NEW TEXAS SCHOOL ACCOUNTABILITY SYSTEM: GROWTH AND ACHIEVEMENT PERFORMANCE BY RACE/ETHNICITY AND ECONOMIC STATUS

James Scott Ford Northside ISD, San Antonio, TX [email protected] DEMOGRAPHIC FACTORS IN THE NEW TEXAS SCHOOL ACCOUNTABILITY SYSTEM: GROWTH AND ACHIEVEMENT.
Dec 24, 2015
Welcome message from author
This document is posted to help you gain knowledge. Please leave a comment to let me know what you think about it! Share it to your friends and learn new things together.
Transcript

James Scott FordNorthside ISD, San Antonio, [email protected]
DEMOGRAPHIC FACTORS IN THE NEW
TEXAS SCHOOL ACCOUNTABILITY SYSTEM:
GROWTH AND ACHIEVEMENT
PERFORMANCE BY RACE/ETHNICITY AND
ECONOMIC STATUS

Texas public school accountability system underwent complete revision in School Year 2012-13
4 indices of performance to calculate campus and district ratings, the second of which measures student progress or growth on the state exams District Correlation of Index 1 (Achievement) to
Index 2 = .587 using Campus Level totals (Elem & MS only)
District Elem/MS/HS combined Correlation: .398 Statewide Elem/MS/HS combined Correlation: .391
BACKGROUND

District ES / MS Campus Level Accountability Index Results

Measures the changes in performance over a period rather than achieving a specified point
Allows for historically lower achieving students/campuses/districts to show gains rather than just pass/fail
Various methods to calculateRace to the TopCriticisms and Limitations
GROWTH MEASURES / VALUE ADDED

First growth measure in Texas for statewide accountability purposes
3-point scale (Did Not Meet Expectation, Met Expectation, and Exceeded Expectation)
Calculated for race/ethnicity student groups as well as special education students and English Language Learners
Gain Score = CY Scale Score – PY Scale Score then look up cut points on comparison chart
INDEX 2

INDEX 2
Source: Texas Education Agency, “Calculating STAAR Progress Measures”

INDEX 2
Source: Texas Education Agency, “Calculating STAAR Progress Measures”

An analysis was made of the results of the performance index on a large school district in San Antonio Reading & Math, Grades 4 – 7 Chi-Square Logistic Regression
Compared the progress results to pass rates Race/ethnicity Economic disadvantaged status
METHODOLOGY

Do the same patterns of results exist for both achievement and progress for Black and Hispanic students compared to White students
Do the same patterns of results exist for both achievement and progress for Economically Disadvantaged students compared to Non-Economically Disadvantaged students
RESEARCH QUESTIONS

State of Texas Assessments of Academic Readiness (STAAR) exams Statewide standardized accountability tests Began Spring 2012 replacing the TAKS exams Grades 3 to 8 and End-of-Course for High School Regular / Modified / Alt versions (only Regular versions
used in this analysis)
DATA

2 Subjects, 4 Grade Levels, ~ 6000 per Grade
Approx 23,600 race/ethnicity observations Black: ~ 1,400 Hispanic: ~ 17,300 White: ~ 4,900
Approx 25,000 economic status observations Economic Disadvantaged: ~ 13,000 Not Economic Disadvantaged: ~ 12,000
DATA


All sub-groups showed statistically significant differences between their pass rates in both Reading and Math at all grade levels
However, the sub-groups were no longer significantly different in their Index 2 performance in Grade 7 Math and Grades 5 and 7 Reading
RESULTS: CHI-SQUARE
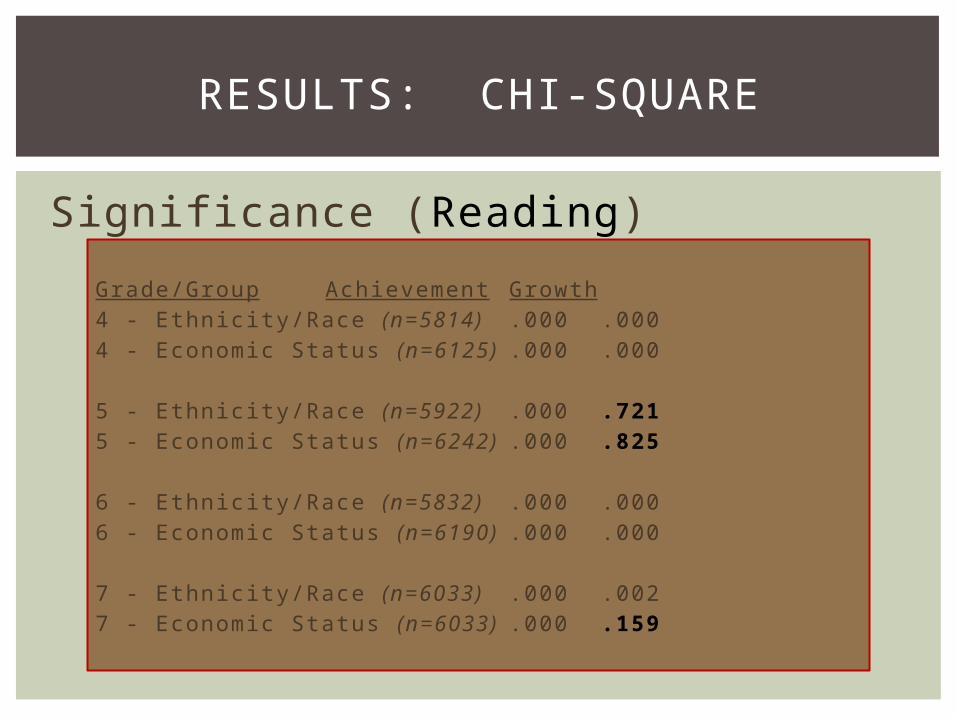
Significance (Reading)
Grade/Group Achievement Growth4 - Ethnicity/Race (n=5814) .000 .0004 - Economic Status (n=6125) .000 .000
5 - Ethnicity/Race (n=5922) .000 .7215 - Economic Status (n=6242) .000 .825
6 - Ethnicity/Race (n=5832) .000 .0006 - Economic Status (n=6190) .000 .000
7 - Ethnicity/Race (n=6033) .000 .0027 - Economic Status (n=6033) .000 .159
RESULTS: CHI-SQUARE

Significance (Math)
Grade/Group Achievement Growth4 - Ethnicity/Race (n=5845) .000 .0064 - Economic Status (n=6160) .000 .000
5 - Ethnicity/Race (n=5911) .000 .0005 - Economic Status (n=6231) .000 .825
6 - Ethnicity/Race (n=5855) .000 .0006 - Economic Status (n=6212) .000 .000
7 - Ethnicity/Race (n=6037) .000 .3757 - Economic Status (n=6388) .000 .205
RESULTS: CHI-SQUARE

Achievement: The odds of Black/Hispanic or Economically Disadvantaged students passing ranged from approximately 0.3 to 0.4 compared to White or Not Economically Disadvantaged students (i.e. they had only a 1/3 as high odds as White or Not Economically Disadvantaged students)
Growth: The odds rose to approximately 0.7-0.8 (or about 3/4 odds of meeting growth) compared to White or Not Economically Disadvantaged students
RESULTS: LOGISTIC REGRESSION
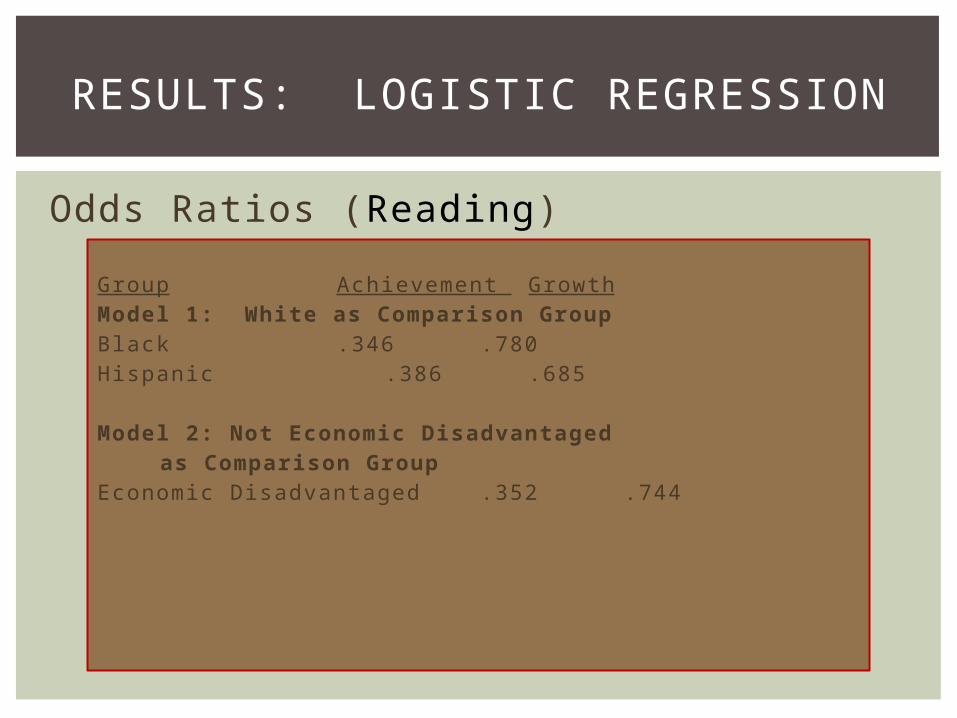
Odds Ratios (Reading)
Group Achievement GrowthModel 1: White as Comparison GroupBlack .346 .780Hispanic .386 .685
Model 2: Not Economic Disadvantaged as Comparison Group
Economic Disadvantaged .352 .744
RESULTS: LOGISTIC REGRESSION

Odds Ratios (Math)
Group Achievement GrowthModel 1: White as Comparison GroupBlack .311 .863Hispanic .420 .826
Model 2: Not Economic Disadvantaged as Comparison Group
Economic Disadvantaged .412 .822
RESULTS: LOGISTIC REGRESSION

Implications Major differences between Achievement versus Progress
measures Patterns of Results Change 1 District for 1 Year: Will differences persist?
Could shift Accountability Ratings of Campuses/Districts Traditionally high achieving Campuses/Districts may receive lower
ratings Campuses/Districts with high levels of Blacks/Hispanics or Economically
Disadvantaged may receive improved ratings
Likely to have a role in future Teacher/Principal Evaluations
Unusual method of calculation
DISCUSSION

Changes in Future Years 2014: Modified and Alt versions, Students skipping
grade levels, English Language Learner Progress Measure
2015: Writing included, Modified exams discontinued
Other Growth Measure Methods SAS EVAAS Education Resource Group (ERG) Hierarchical Linear Modeling and other prediction
models
DISCUSSION
Texas Education Agency “Calculating STAAR Progress Measures” “State of Texas Assessments of Academic Readiness (STAAR) Progress
Measure Questions and Answers”
Haertel, Edward H. “Reliability and Validity of Inferences About Teachers Based on Student Test Scores”, Educational Testing Service, (March 22, 2013) .
McCaff rey,Daniel F.; Lockwood, J. R.; Koretz, Daniel M.; and Hamilton, Laura S. "Evaluating Value-Added Models for Teacher Accountability", RAND Corporation, 2003.
Sanders, William L., et al. “A Response to Criticisms of SAS EVAAS”, SAS Institute Inc., (November 2009).
SOURCES
Related Documents