Jack Buckley Commissioner National Center for Education Statistics June 27, 2013 #NAEP

Jack Buckley Commissioner National Center for Education Statistics June 27, 2013 #NAEP.
Dec 14, 2015
Welcome message from author
This document is posted to help you gain knowledge. Please leave a comment to let me know what you think about it! Share it to your friends and learn new things together.
Transcript

Jack BuckleyCommissioner
National Center forEducation Statistics
June 27, 2013
#NAEP

National Assessment of Educational Progress
Long-Term Trend
NationalPublic & Private
9-, 13-, & 17-year-olds
Main
NationalPublic & Private Grades 4, 8, & 12
StatePublic
Grades 4 & 8
Trial Urban DistrictPublic
Grades 4 & 8
2
#NAEP

3
#NAEP

• Students assessed in reading or mathematics
• Over 26,000 public and private school students assessedin each subject
• Administered during the 2011-2012 school year
The 2012 Long-Term Trend Assessment
◊ 13-year-olds in Fall◊ 9-year-olds in Winter◊ 17-year-olds in Spring
• About 1 hour of assessment time per student
4
#NAEP

5
Changing racial/ethnic demographics
NOTE: Percentages of students are based on information collected as part of the long-term trend mathematics assessment at age 13. Detail may not sum to totals because results are not shown for students whose race/ethnicity was categorized as “other.”#NAEP

6
Changing proportions of 13-year-olds in typical grade
# Rounds to zero.NOTE: Percentages of students are based on information collected as part of the long-term trend mathematics assessment at age 13. Detail may not sum to totals because of rounding. #NAEP

#NAEP
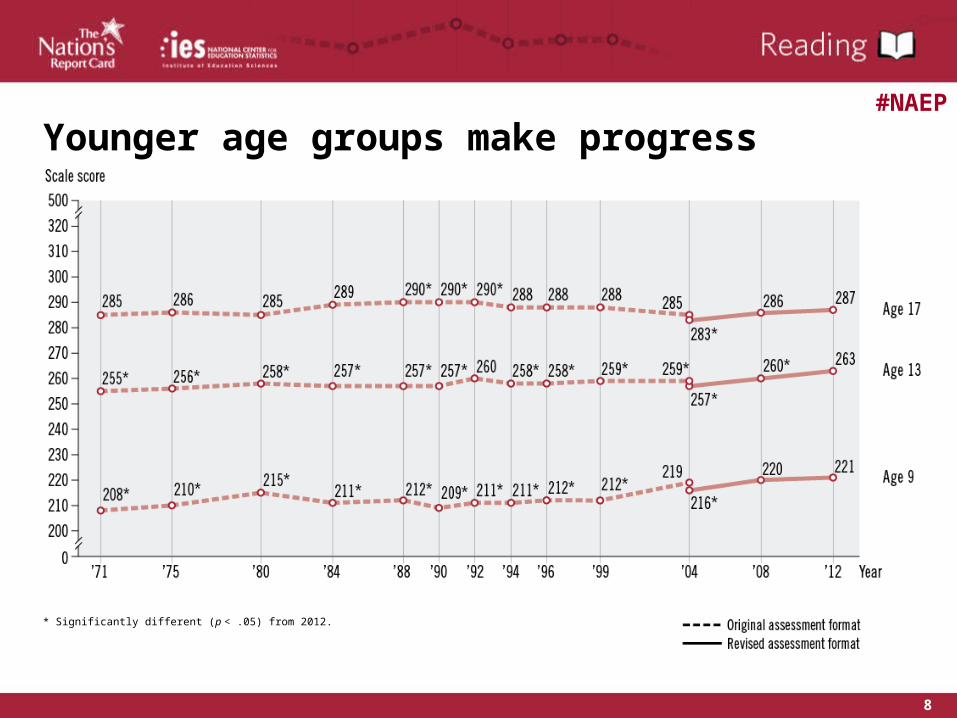
Younger age groups make progress
* Significantly different (p < .05) from 2012.
8
#NAEP

Lower, middle, and higher performing 9-year-olds make gains
* Significantly different (p < .05) from 2012.
9
#NAEP
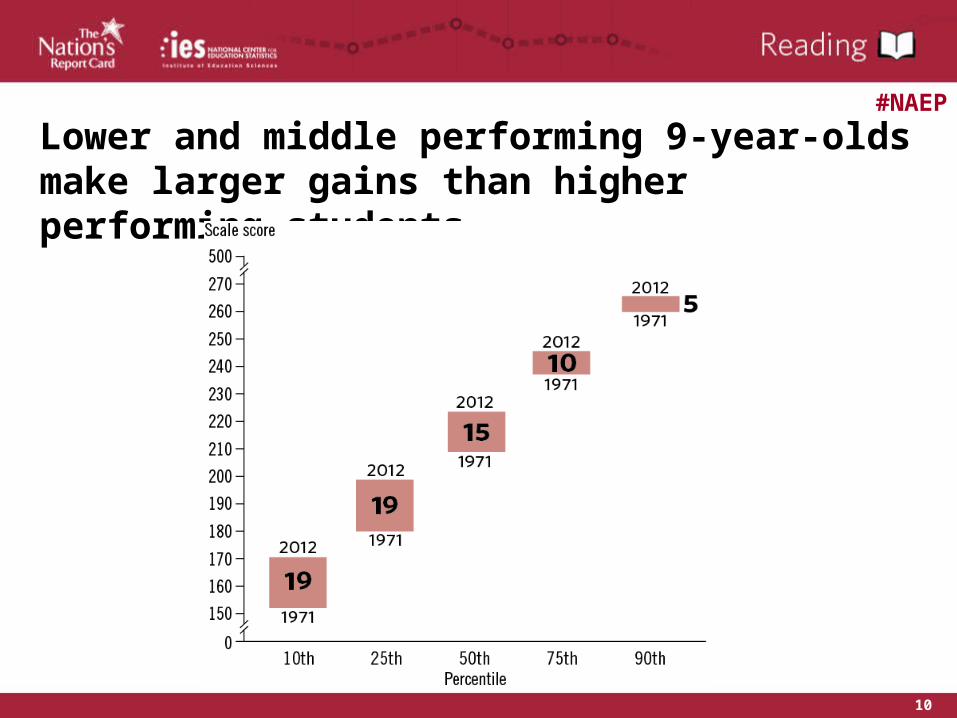
10
Lower and middle performing 9-year-olds make larger gains than higher performing students
#NAEP

11
#NAEP

Thirteen-year-olds make long- and short-term gains
* Significantly different (p < .05) from 2012.
12
#NAEP

Lower performing 17-year-olds make gains
* Significantly different (p < .05) from 2012.
13
#NAEP

14
Higher percentages of students than in 1971 were able to interrelate ideas and make generalizations about what they read
* Significantly different (p < .05) from 2012.NOTE: Results for 1971 are from the original assessment format, and results for 2008 and 2012 are from the revised assessment format.
#NAEP

* Significantly different (p < .05) from 2012.
15
Thirteen-year-old Hispanic students make long- and short-term gains
#NAEP

16
Black and Hispanic students make larger gains than White students
#NAEP

Gender gap at age 9 narrows from 1971
* Significantly different (p < .05) from 2012.
17
#NAEP

Seventeen-year-olds in 10th grade score higher than in 1971 and those in 12th grade score lower
* Significantly different (p < .05) from 2012.1 Typical grade for age group.
18
#NAEP

19
#NAEP

Thirteen-year-olds score higher than all previous assessments
* Significantly different (p < .05) from 2012.1 Extrapolated data adjusting for the limited number of questions from the 1973 mathematics assessment in common with the assessments that followed.
20
#NAEP

Lower, middle, and higher performing 9-year-olds make long-term gains
* Significantly different (p < .05) from 2012.
21
#NAEP

Higher performing 13-year-olds make short-term gains
* Significantly different (p < .05) from 2012.
22
#NAEP

23
Thirteen-year-olds making gains across the distribution
#NAEP

24
#NAEP
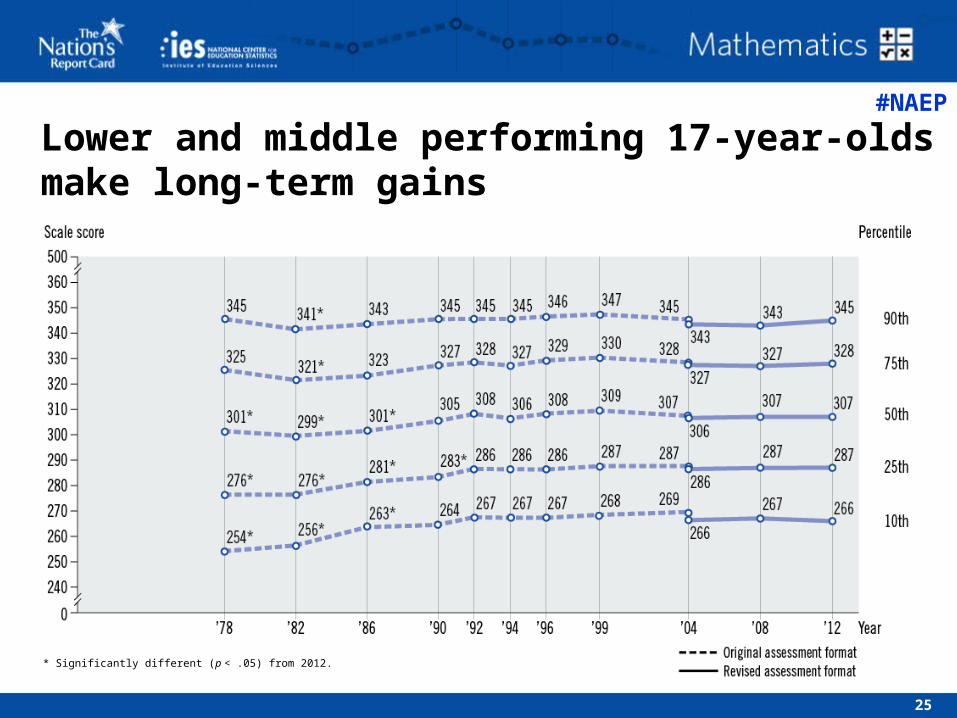
Lower and middle performing 17-year-oldsmake long-term gains
* Significantly different (p < .05) from 2012.
25
#NAEP

26
Higher percentages of students than in 1978 demonstrated a basic understanding of numerical operations and problem solving
* Significantly different (p < .05) from 2012.NOTE: Results for 1978 are from the original assessment format, and results for 2008 and 2012 are from the revised assessment format.
#NAEP

27
Black students make larger gains than White students at all three ages
#NAEP

Gender gap for 17-year-olds narrows from 1973
* Significantly different (p < .05) from 2012.1 Extrapolated data adjusting for the limited number of questions from the 1973 mathematics assessment in common with the assessments that followed.
28
#NAEP

29
#NAEP

30
#NAEP

Photo Credits: © Kidstock/Blend Images/Getty Images #142019099; © Ralf Hettler/iStockphoto #856358; © DElight/iStockphoto #11984168
http://nationsreportcard.gov
31
#NAEP
Related Documents


