MUTUAL FUND INVESTMENTS ARE SUBJECT TO MARKET RISKS, READ ALL SCHEME RELATED DOCUMENTS CAREFULLY. /LICMutual /company/LICMutual /LICMutual 1800-258-5678 Connect with us: www.licmf.com 1800-258-5678 Call Toll Free To know more, please consult your Financial Advisor OR Investors understand that their principal will be at Very High risk Low Low to Moderate Moderate Moderately High High Very High RISKOMETER HIGH LOW st *Investors should consult their financial advisors if in doubt about whether the product is suitable for them. Risk-o-meter is based on evaluation of risk level of Scheme's portfolio as on 31 May 2022 and the change in Risk-o-meter will be evaluated on a monthly basis. For more details, please visit our website www.licmf.com st 31 May 2022 This product is suitable for investors who are seeking*: • Long term capital appreciation and current income • A fund that invests both in stocks and fixed income instruments • Risk - Very High Invest In Jab Baat Ho Aapke Bacchon Ke Bhavishya Ki Toh Sarvottam Se Kam Kuch Nahi

Welcome message from author
This document is posted to help you gain knowledge. Please leave a comment to let me know what you think about it! Share it to your friends and learn new things together.
Transcript

MUTUAL FUND INVESTMENTS ARE SUBJECT TO MARKET RISKS, READ ALL SCHEME RELATED DOCUMENTS CAREFULLY.
/LICMutual /company/LICMutual/LICMutual 1800-258-5678Connect with us: www.licmf.com
1800-258-5678
Call Toll FreeTo know more, please consult your Financial Advisor
OR
Investors understand that their principalwill be at Very High risk
Low
Low toModerate
Moderate ModeratelyHigh
High
Very High
RISKOMETER HIGHLOW
st*Investors should consult their financial advisors if in doubt about whether the product is suitable for them. Risk-o-meter is based on evaluation of risk level of Scheme's portfolio as on 31 May 2022 and the change in Risk-o-meter will be evaluated on a monthly basis. For more details, please visit our website www.licmf.com
st31 May 2022
This product is suitable for investors who are
seeking*:
• Long term capital appreciation and
current income
• A fund that invests both in stocks and fixed
income instruments
• Risk - Very High
Invest In
Jab Baat Ho Aapke Bacchon Ke Bhavishya Ki
Toh Sarvottam Se Kam Kuch Nahi
Mr. Yogesh Patil
Head - Equity
2
EQUITYMarket Review
Ÿ As we were highlighting in our communication over last three months, the interest rates finally started to inch upwards. At global level, including US
Federal reserve, various other central bankers have raised the interest rate on the back of the rising inflation. In India, RBI too hiked the interest rate during
an unscheduled MPC meeting and hinted towards further rate tightening as concerns related to inflation continues to rise. Rising interest rates do have
negative impact on the market valuations which reflected in the market performance for the month. During the month, both Sensex and Nifty ended with
loss of 2.6% and 3 % respectively. Going ahead, we see inflation as the key economic risk – on both global and domestic front.
Ÿ CPI inflation surged to 7.8% in Apr'22, surpassing expectations, with this being the fourth consecutive month above the RBI upper tolerance limit and
also the highest print since June 2014. The increase was broad-based, led by food, energy and core. Food inflation (8.4% YoY; 1.6% MoM) led the April'22
spike, marking the highest print in 17 months, driven by fruits, edible oils, cereals, etc. Core inflation (ex-food, fuel and intoxicants) jumped to a near 8-year
high of 7.35% (6.59% prior, up 1.26% MoM), reflecting the impact of higher pass-through of input costs and elevated transportation costs.
Ÿ IIP grew 1.85% in Mar'22 led by healthy year-end sequential gains. Manufacturing grew 0.9% (10.9% MoM), driven by segments such as wearing
apparel, electronics and food products. Mining and electricity grew by 4.0% YoY and 6.1% YoY, respectively. Per use-based, consumer durables (-3.2%
YoY) and non-durables (-5.0% YoY) continued to contract, while growth was seen in infra (7.3%), primary goods (5.7%) and intermediate goods (0.6%),
with a sequential decline across sectors. Going ahead, rising input costs could impede the recovery both through lower corporate profits and weaker
consumption.
Ÿ Other key developments during the month—(1) RBI announced an unanticipated interest rate hike of 40 bps, (2) the United States Federal Reserve
raised its benchmark interest rate by 50 bps, minutes of May FOMC meeting signaled 50 bps rate hikes in next meetings, (3) the Indian government
unveiled a number of measures to control inflation—(a) cut excise duty on petrol by INR 8/ltr and on diesel by INR 6/ltr, (b) imposed a hefty export duty on
steel products and raw materials, also lowered import duty on key raw materials for steel production, (c) announced a curb on the export of sugar beyond
10 mn tons, (4) Moody's cut India's CY2022 GDP growth forecast to 8.8% from 9.1% earlier. 4QFY22 net income of Nifty-50 Index increased to 24% YoY
and 9% QoQ
Ÿ On the sectoral indices front, Auto (+4.9%), FMCG (+0.6%) and Bankex (-1.5%) outperformed the indices while Metals (-16%), Power (-11.5%),
Consumer durable (-10.9%), Healthcare (-7.7%), Realty (-7.1%), IT (-5.8%) and Oil & Gas (-4.6%) underperformed the key indices during the month.
Capital Flows:
Ÿ FIIs continued to be net sellers for the 8th consecutive month. Net equity selling by FIIs stood at INR 39,993Cr (USD 5.2bn) in May'22. Due to
continuous selling since last eight months, FIIs have turned net sellers to the tune of INR 1,84,534cr (USD 24.3bn) in last twelve months i.e., from June'21 –
May'22. On the other side, DIIs bought equity worth INR 2,88,939Cr (USD 38.3bn) for the same period. (As on May'22 Source: SEBI) (May'22 Avg. 1 USD =
INR 77.30).
Outlook
Ÿ The ongoing geo-political tension between Russia and Ukraine has pushed the energy prices and the base metal prices higher. In the various Central
Banker's policy notes, rising energy prices has been highlighted as the key reason for higher inflation and they expect the impact of the same will push
inflation further. To control the same, they have resorted to hike interest rates. This ends the easy rate cycle which started post covid and we believe the
rates to move back to pre-covid levels. Higher cost of capital is a negative for equity markets and we have seen the same reflecting in the continued turmoil
in the global equity indices.
Ÿ On the domestic front, GDP growth seems to be on the stable footing as the full year FY22 growth came in at 8.7% albeit lower than the earlier number
of 8.9%. All sub-sectors, barring trade, transport and communications, have crossed pre-Covid levels by end-March'22, while private consumption is
merely up 1% from pre-Covid levels. Public spending remains the major growth contributor for a second consecutive year. We believe the next leg of
growth will depend on increase in private capex and domestic consumption.
Ÿ The other key events were the Q4FY22 and full year FY22 earnings season which concluded on month end. On like-to-like basis, Nifty 50 companies
posted revenue growth of 23% and PAT growth of 21% for Q4FY22. For the full year, Nifty 50 PAT grew by approx. 35%. Going ahead we believe the
earnings to remain stable and should mirror the nominal GDP growth. However, risk of rising energy prices and inflation remains the key monitorable.
Ÿ On the valuation front, while the headline multiple looks reasonable, the same is susceptible to corporate earnings trajectory. We do see some risk to
corporate earnings due to rising energy prices, higher RM cost and weaker demand. As and when the downward revision in earnings is effected, valuation
multiple may look higher which could further impact the investor sentiment. We continue to remain cautious on market valuation and tend to focus more on
stock selection.
Ÿ Overall, despite near term concerns, over the medium to long term, the Indian equity market looks to be on strong footing as the earnings growth finally
seems to be on track after a lull of last five to seven years and the recent correction in the markets has brought down the valuations near to historical levels
in various pockets / sectors. The current ongoing geo-political events may pose a risk to equities in the near term, however, we continue to be bullish on
India's long term growth story. We prefer to focus on existing leaders who are likely to disrupt/ innovate in their respective business segments to ensure
that their leadership or moat remains strong. Value creation is imperative as our investment process is focussed on investing in companies having high
standards of governance, high capital efficiency, strong moats and sustainable growth.
MARKET REVIEW
3
DEBTŸ RBI surprised the market with off cycle rate hike highlighting members shifting their priority from Growth to Inflation as the current situation is
dynamic and fast changing. MPC members voted for a Repo rate hike by 40 bps to 4.40% along with CRR hike of 50 bps to 4.50% in continuation
with its stance of focusing on withdrawal of accommodation. Consequently, SDF rate also increased to 4.15% and MSF rate raised to 4.65%.
Higher CPI print and RBI's OMO sales in secondary market, though the amount of sale was less but it further dampened the market sentiments.
However, yields recovered later during the month post government announcing excise duty cut on fuel prices, increased food and fertilizer
subsidies and curbs on export of few commodities as these measures will tame down soaring commodity prices. 10-year G-Sec benchmark traded
in a wide range of 7.11%-7.48%. OIS has been much volatility during the month specially post surprised rate hike, with 5-year OIS hardening by 38
bps to 6.98% level with an intramonth high of 7.23% and 1-year OIS hardening by 116 bps to 6.19% level.
Ÿ System liquidity remained in surplus range with average surplus liquidity in May reduced majorly because of RBI's CRR hike to Rs. 4.39 lakh
crores vs Rs. 6.56 lakh crores in the month of April. Currency in Circulation (CIC) marginally rose to Rs. 32.19 lakh crore in May vs Rs. 32.09 lakh
crore in April end. Banks investment to deposit ratio stands at 28.94% and Credit to deposit ratio at 72.15% with a year-on-year deposit growth of
9.7% and Credit growth of 11.90%.
Ÿ CPI inflation accelerated sharply above market expectation to 7.79% in April as against 6.95% in March mainly due to surge in food and core
inflation. Core inflation rose to 7.24% in April vs 6.59% in March, food inflation also surged to 8.40% in April vs 7.68% in March indicating price
pressure across segments.
Ÿ Gross GST collection for May fell by 16% at Rs. 1.41 lakh crore vs Rs. 1.68 lakh crore collected in April. Last year also in same month 27% drop
in collection was seen.
Ÿ India has registered a GDP growth of 4.1% in last quarter of FY2022 vs a GDP growth of 5.4% in previous quarter due to unfavourable base
effect and some curbs related to spread of Omicron. Real GDP growth for FY 2022 is 8.7% vs GDP contraction of 6.6% during previous financial
year.
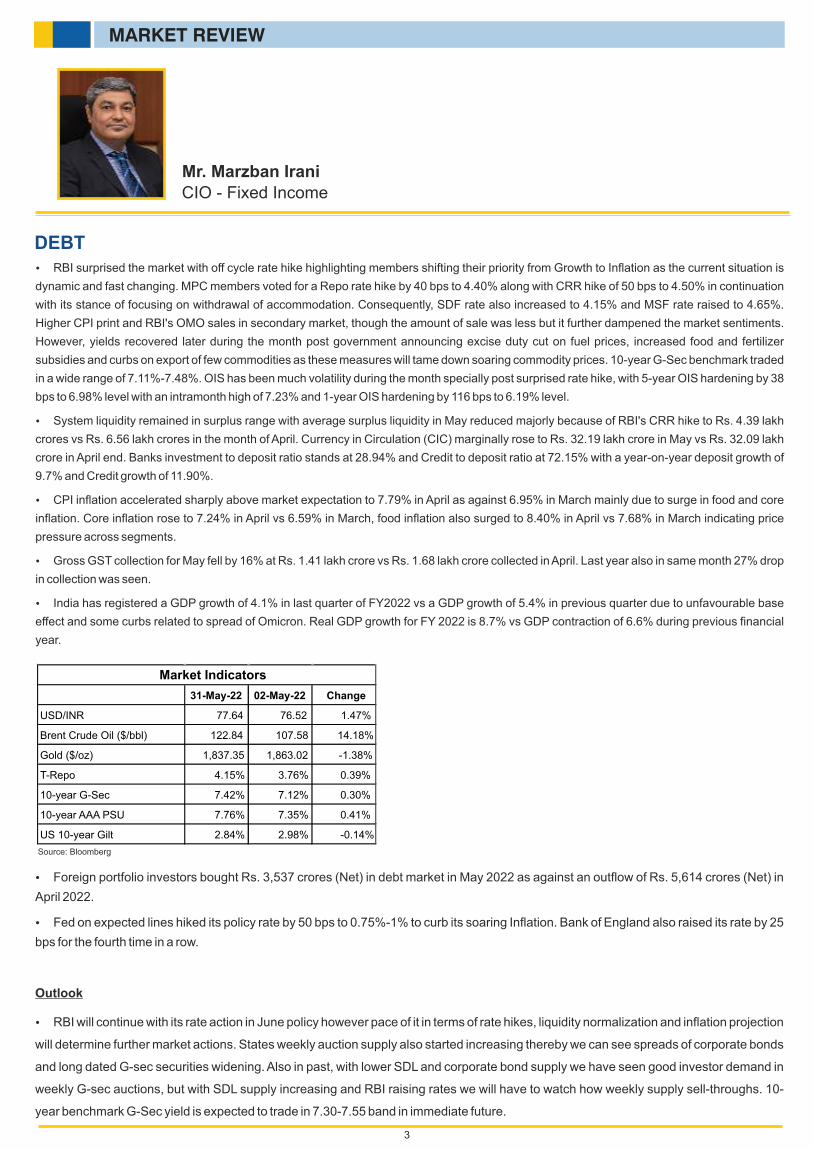
Mr. Marzban Irani
CIO - Fixed Income
Ÿ Foreign portfolio investors bought Rs. 3,537 crores (Net) in debt market in May 2022 as against an outflow of Rs. 5,614 crores (Net) in
April 2022.
Ÿ Fed on expected lines hiked its policy rate by 50 bps to 0.75%-1% to curb its soaring Inflation. Bank of England also raised its rate by 25
bps for the fourth time in a row.
Outlook
Ÿ RBI will continue with its rate action in June policy however pace of it in terms of rate hikes, liquidity normalization and inflation projection
will determine further market actions. States weekly auction supply also started increasing thereby we can see spreads of corporate bonds
and long dated G-sec securities widening. Also in past, with lower SDL and corporate bond supply we have seen good investor demand in
weekly G-sec auctions, but with SDL supply increasing and RBI raising rates we will have to watch how weekly supply sell-throughs. 10-
year benchmark G-Sec yield is expected to trade in 7.30-7.55 band in immediate future.
MARKET REVIEW
Source: Bloomberg
31-May-22 02-May-22 Change
USD/INR 77.64 76.52 1.47%
Brent Crude Oil ($/bbl) 122.84 107.58 14.18%
Gold ($/oz) 1,837.35 1,863.02 -1.38%
T-Repo 4.15% 3.76% 0.39%
10-year G-Sec 7.42% 7.12% 0.30%
10-year AAA PSU 7.76% 7.35% 0.41%
US 10-year Gilt 2.84% 2.98% -0.14%
Market Indicators
RISKOMETER
Riskometer - Scheme
LIC MF Large Cap Fund
LIC MF Flexi Cap Fund
LIC MF Large & Mid Cap Fund
LIC MF Tax Plan
LIC MF Index Fund-Sensex Plan
LIC MF Index Fund-Nifty Plan
LIC MF Exchange Traded Fund - Nifty 50
LIC MF Exchange Traded Fund - Sensex
LIC MF Exchange Traded Fund - Nifty 100
Ÿ Long Term Capital AppreciationŸ A Fund that primarily invest in
large-cap stockŸ Risk - Very High
Ÿ Long Term Capital AppreciationŸ Investing across Large, Mid & Small-cap
stocksŸ Risk - Very High
Ÿ Long Term Capital AppreciationŸ A Fund that primarily invest in large and
mid-cap stocksŸ Risk - Very High
Ÿ Long Term Capital GrowthŸ Investing in equity and equity related
securities.Ÿ Risk - Very High
Ÿ Long Term Capital GrowthŸ Investment in equity instrument of S &
P BSE Sensex index stocks subject to tracking error.
Ÿ Risk - Very High
Ÿ Long Term Capital GrowthŸ Investment in equity instrument of
respective index stocks subject to tracking error.
Ÿ Risk - Very High
Ÿ Long Term InvestmentŸ Investment in securities covered by NIFTY
50 Index, subject to tracking errors.Ÿ Risk - Very High
Ÿ Long Term InvestmentŸ Investment in securities covered by S&P
BSE SENSEX, subject to tracking errors.
Ÿ Risk - Very High
Ÿ Long Term InvestmentŸ Investment in equity and equity related
securities and portfolios replicating the composition of NIFTY 100 Index, subject to tracking errors.
Ÿ Risk - Very High
Low
Low toModerate
Moderate ModeratelyHigh
High
Very High
RISKOMETER HIGHLOW
Investors understand that their principalwill be at Very High risk
*Investors should consult their financial advisors if in doubt about whether the product is suitable for them. Risk-o-meter is based on evaluation of risk level of stScheme's portfolio as on 31 May 2022 and the change in Risk-o-meter will be evaluated on a monthly basis. For more details, please visit our website
www.licmf.com
The Product is suitable for investorswho are seeking*
Riskometer- First Tier Benchmark
Nifty 100 TRI
First Tier Benchmark Name
Low
Low toModerate
Moderate ModeratelyHigh
High
Very High
RISKOMETER HIGHLOW
Low
Low toModerate
Moderate ModeratelyHigh
High
Very High
RISKOMETER HIGHLOW
Investors understand that their principalwill be at Very High risk
Nifty 500 TRILow
Low toModerate
Moderate ModeratelyHigh
High
Very High
RISKOMETER HIGHLOW
Low
Low toModerate
Moderate ModeratelyHigh
High
Very High
RISKOMETER HIGHLOW
Investors understand that their principalwill be at Very High risk
Nifty LargeMidcap250 TRI
Low
Low toModerate
Moderate ModeratelyHigh
High
Very High
RISKOMETER HIGHLOW
Low
Low toModerate
Moderate ModeratelyHigh
High
Very High
RISKOMETER HIGHLOW
Investors understand that their principalwill be at Very High risk
Nifty 500 TRILow
Low toModerate
Moderate ModeratelyHigh
High
Very High
RISKOMETER HIGHLOW
Low
Low toModerate
Moderate ModeratelyHigh
High
Very High
RISKOMETER HIGHLOW
Investors understand that their principalwill be at Very High risk
S&P BSE Sensex TRI
Low
Low toModerate
Moderate ModeratelyHigh
High
Very High
RISKOMETER HIGHLOW
Low
Low toModerate
Moderate ModeratelyHigh
High
Very High
RISKOMETER HIGHLOW
Investors understand that their principalwill be at Very High risk
Low
Low toModerate
Moderate ModeratelyHigh
High
Very High
RISKOMETER HIGHLOW
NIFTY 50 TRI
Low
Low toModerate
Moderate ModeratelyHigh
High
Very High
RISKOMETER HIGHLOW
Investors understand that their principalwill be at Very High risk
Low
Low toModerate
Moderate ModeratelyHigh
High
Very High
RISKOMETER HIGHLOW
NIFTY 50 TRI
Low
Low toModerate
Moderate ModeratelyHigh
High
Very High
RISKOMETER HIGHLOW
Investors understand that their principalwill be at Very High risk
Low
Low toModerate
Moderate ModeratelyHigh
High
Very High
RISKOMETER HIGHLOW
S&P BSE Sensex TRI
Low
Low toModerate
Moderate ModeratelyHigh
High
Very High
RISKOMETER HIGHLOW
Investors understand that their principalwill be at Very High risk
Low
Low toModerate
Moderate ModeratelyHigh
High
Very High
RISKOMETER HIGHLOW
NIFTY 100 TRI
4
LIC MF Balanced Advantage Fund
Ÿ Capital appreciation over a long period of time
Ÿ Investments in a dynamically managed portfolio of equity and equity related instruments, debt and money market instruments.
Ÿ Risk - Moderately High
Low
Low toModerate
Moderate ModeratelyHigh
High
Very High
RISKOMETER HIGHLOW
Investors understand that their principalwill be at Moderately High risk
Nifty 50 HybridComposite
Debt 50:50 Index Low
Low toModerate
Moderate ModeratelyHigh
High
Very High
RISKOMETER HIGHLOW
RISKOMETER
Riskometer - Scheme
LIC MF Infrastructure Fund
Ÿ Capital appreciation over long termŸ Investment predominantly in a portfolio of
equity and equity related securities of companies engaged in banking and financial services.
Ÿ Risk - Very High
Ÿ Long Term Capital GrowthŸ Investment in equity and equity related
instruments of companies engaged either directly or indirectly in infrastructure sector.
Ÿ Risk - Very High
LIC MF Banking & Financial Services Fund
LIC MF Children’s Gift Fund
LIC MF Equity Hybrid Fund
LIC MF Unit Linked Insurance Scheme
Ÿ Long term capital appreciation with current income.
Ÿ A fund that invests both in stocks and fixed income instruments.
Ÿ Risk - Very High
Ÿ Long term capital appreciation and current income.
Ÿ Investment in equity and equity related securiries, fixed income securities (debt and money market securities).
Ÿ Risk - Very High
Ÿ Long term capital appreciation and current income
Ÿ A fund that invests both in stocks and fixed income instruments.
Ÿ Risk - Very High
Low
Low toModerate
Moderate ModeratelyHigh
High
Very High
RISKOMETER HIGHLOW
Investors understand that their principalwill be at Very High risk
The Product is suitable for investorswho are seeking*
Riskometer - First Tier Benchmark
Nifty FinancialServices TRI
First Tier Benchmark Name
Low
Low toModerate
Moderate ModeratelyHigh
High
Very High
RISKOMETER HIGHLOW
Low
Low toModerate
Moderate ModeratelyHigh
High
Very High
RISKOMETER HIGHLOW
Investors understand that their principalwill be at Very High risk
Nifty Infrastructure TRILow
Low toModerate
Moderate ModeratelyHigh
High
Very High
RISKOMETER HIGHLOW
Low
Low toModerate
Moderate ModeratelyHigh
High
Very High
RISKOMETER HIGHLOW
Investors understand that their principalwill be at Very High risk
CRISIL Hybrid 35+65 Aggressive Index Low
Low toModerate
Moderate ModeratelyHigh
High
Very High
RISKOMETER HIGHLOW
Low
Low toModerate
Moderate ModeratelyHigh
High
Very High
RISKOMETER HIGHLOW
Investors understand that their principalwill be at Very High risk
Low
Low toModerate
Moderate ModeratelyHigh
High
Very High
RISKOMETER HIGHLOW
Low
Low toModerate
Moderate ModeratelyHigh
High
Very High
RISKOMETER HIGHLOW
Investors understand that their principalwill be at Very High risk
Low
Low toModerate
Moderate ModeratelyHigh
High
Very High
RISKOMETER HIGHLOW
CRISIL Hybrid 35+65 Aggressive Index
CRISIL Hybrid 35+65 Aggressive Index
LIC MF Debt Hybrid Fund
Ÿ Medium term capital appreciation with current income
Ÿ A fund that invests predominantly in debt instruments with marginal equity exposure.
Ÿ Risk - Moderate
LIC MF G-Sec Long Term Exchange Traded Fund
Ÿ Medium to long term regular incomeŸ Investment in securities in line with Nifty
8-13 yr G-Sec Index to generate comparable returns subject to tracking error.
Ÿ Risk - Moderate
Low
Low toModerate
Moderate ModeratelyHigh
High
Very High
RISKOMETER HIGHLOW
Investors understand that their principalwill be at Moderate risk
Low
Low toModerate
Moderate ModeratelyHigh
High
Very High
RISKOMETER HIGHLOW
Nifty 8-13 yr G-Sec
Low
Low toModerate
Moderate ModeratelyHigh
High
Very High
RISKOMETER HIGHLOW
Investors understand that their principalwill be at Moderate risk
Low
Low toModerate
Moderate ModeratelyHigh
High
Very High
RISKOMETER HIGHLOW
CRISIL Hybrid 85+15Conservative Index
LIC MF Bond Fund
Ÿ Income over medium to long termŸ To generate income/capital appreciation
through investments in Debt and Money market instruments.
Ÿ Risk - Moderate
Low
Low toModerate
Moderate ModeratelyHigh
High
Very High
RISKOMETER HIGHLOW
Investors understand that their principalwill be at Moderate risk
Low
Low toModerate
Moderate ModeratelyHigh
High
Very High
RISKOMETER HIGHLOW
CRISIL Medium toLong Duration Fund
BIII Index
*Investors should consult their financial advisors if in doubt about whether the product is suitable for them. Risk-o-meter is based on evaluation of risk level of stScheme's portfolio as on 31 May 2022 and the change in Risk-o-meter will be evaluated on a monthly basis. For more details, please visit our website
www.licmf.com
5
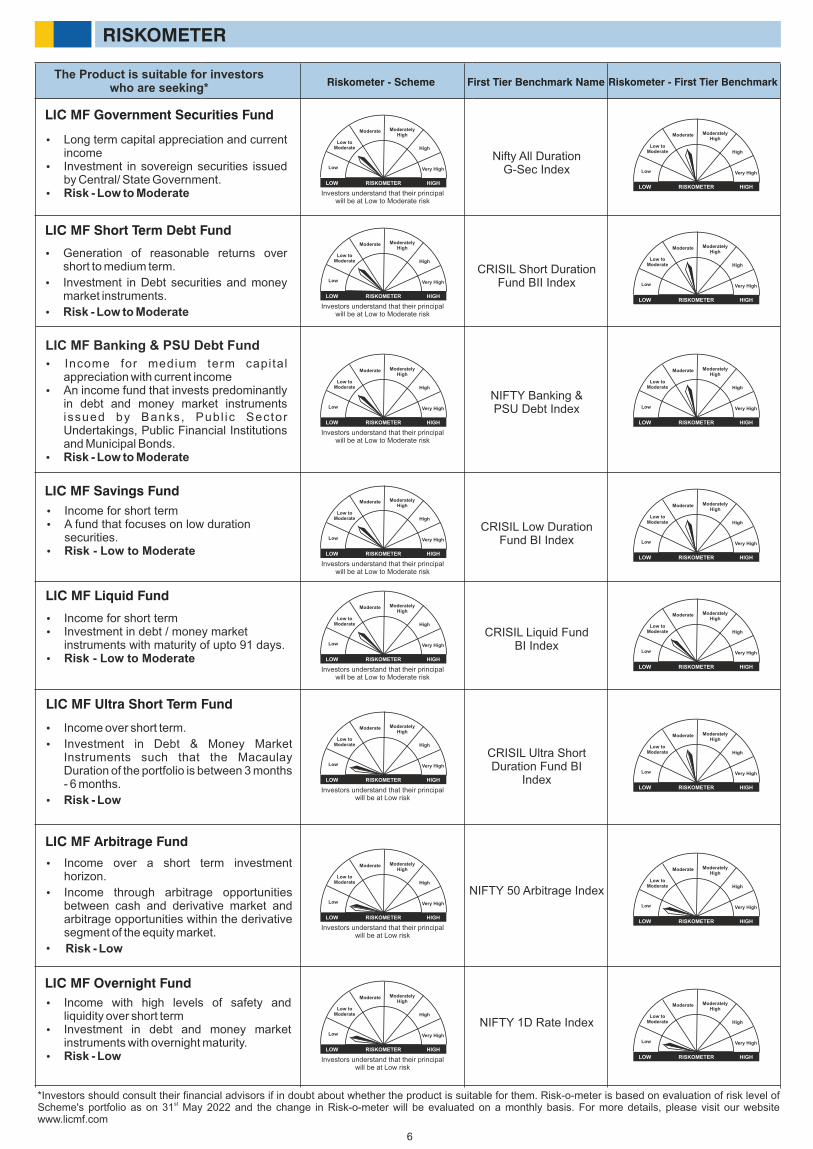
RISKOMETER
Riskometer - Scheme
Low
Low toModerate
Moderate ModeratelyHigh
High
Very High
RISKOMETER HIGHLOW
Investors understand that their principalwill be at Low to Moderate risk
The Product is suitable for investorswho are seeking*
Nifty All DurationG-Sec Index Low
Low toModerate
Moderate ModeratelyHigh
High
Very High
RISKOMETER HIGHLOW
LIC MF Government Securities Fund
Ÿ Long term capital appreciation and current income
Ÿ Investment in sovereign securities issued by Central/ State Government.
Ÿ Risk - Low to Moderate
LIC MF Short Term Debt Fund
Ÿ Generation of reasonable returns over short to medium term.
Ÿ Investment in Debt securities and money market instruments.
Ÿ Risk - Low to Moderate
Low
Low toModerate
Moderate ModeratelyHigh
High
Very High
RISKOMETER HIGHLOW
Investors understand that their principalwill be at Low to Moderate risk
CRISIL Short DurationFund BII Index Low
Low toModerate
Moderate ModeratelyHigh
High
Very High
RISKOMETER HIGHLOW
LIC MF Banking & PSU Debt Fund
LIC MF Savings Fund
Ÿ Income for medium term capital appreciation with current income
Ÿ An income fund that invests predominantly in debt and money market instruments issued by Banks, Publ ic Sector Undertakings, Public Financial Institutions and Municipal Bonds.
Ÿ Risk - Low to Moderate
Ÿ Income for short termŸ A fund that focuses on low duration
securities.Ÿ Risk - Low to Moderate
Low
Low toModerate
Moderate ModeratelyHigh
High
Very High
RISKOMETER HIGHLOW
Investors understand that their principalwill be at Low to Moderate risk
NIFTY Banking &PSU Debt Index Low
Low toModerate
Moderate ModeratelyHigh
High
Very High
RISKOMETER HIGHLOW
Low
Low toModerate
Moderate ModeratelyHigh
High
Very High
RISKOMETER HIGHLOW
Investors understand that their principalwill be at Low to Moderate risk
CRISIL Low DurationFund BI Index Low
Low toModerate
Moderate ModeratelyHigh
High
Very High
RISKOMETER HIGHLOW
LIC MF Ultra Short Term Fund
Ÿ Income over short term.
Ÿ Investment in Debt & Money Market Instruments such that the Macaulay Duration of the portfolio is between 3 months - 6 months.
Ÿ Risk - Low
LIC MF Liquid Fund
Ÿ Income for short termŸ Investment in debt / money market
instruments with maturity of upto 91 days. Ÿ Risk - Low to Moderate
Low
Low toModerate
Moderate ModeratelyHigh
High
Very High
RISKOMETER HIGHLOW
Investors understand that their principalwill be at Low to Moderate risk
CRISIL Liquid FundBI Index
Low
Low toModerate
Moderate ModeratelyHigh
High
Very High
RISKOMETER HIGHLOW
Low
Low toModerate
Moderate ModeratelyHigh
High
Very High
RISKOMETER HIGHLOW
Investors understand that their principalwill be at Low risk
CRISIL Ultra ShortDuration Fund BI
IndexLow
Low toModerate
Moderate ModeratelyHigh
High
Very High
RISKOMETER HIGHLOW
LIC MF Arbitrage Fund
Ÿ Income over a short term investment horizon.
Ÿ Income through arbitrage opportunities between cash and derivative market and arbitrage opportunities within the derivative segment of the equity market.
• Risk - Low
LIC MF Overnight Fund
Ÿ Income with high levels of safety and liquidity over short term
Ÿ Investment in debt and money market instruments with overnight maturity.
Ÿ Risk - Low
Low
Low toModerate
Moderate ModeratelyHigh
High
Very High
RISKOMETER HIGHLOW
Investors understand that their principalwill be at Low risk
NIFTY 50 Arbitrage IndexLow
Low toModerate
Moderate ModeratelyHigh
High
Very High
RISKOMETER HIGHLOW
Low
Low toModerate
Moderate ModeratelyHigh
High
Very High
RISKOMETER HIGHLOW
Investors understand that their principalwill be at Low risk
NIFTY 1D Rate Index
Low
Low toModerate
Moderate ModeratelyHigh
High
Very High
RISKOMETER HIGHLOW
*Investors should consult their financial advisors if in doubt about whether the product is suitable for them. Risk-o-meter is based on evaluation of risk level of stScheme's portfolio as on 31 May 2022 and the change in Risk-o-meter will be evaluated on a monthly basis. For more details, please visit our website
www.licmf.com
6
Riskometer - First Tier BenchmarkFirst Tier Benchmark Name
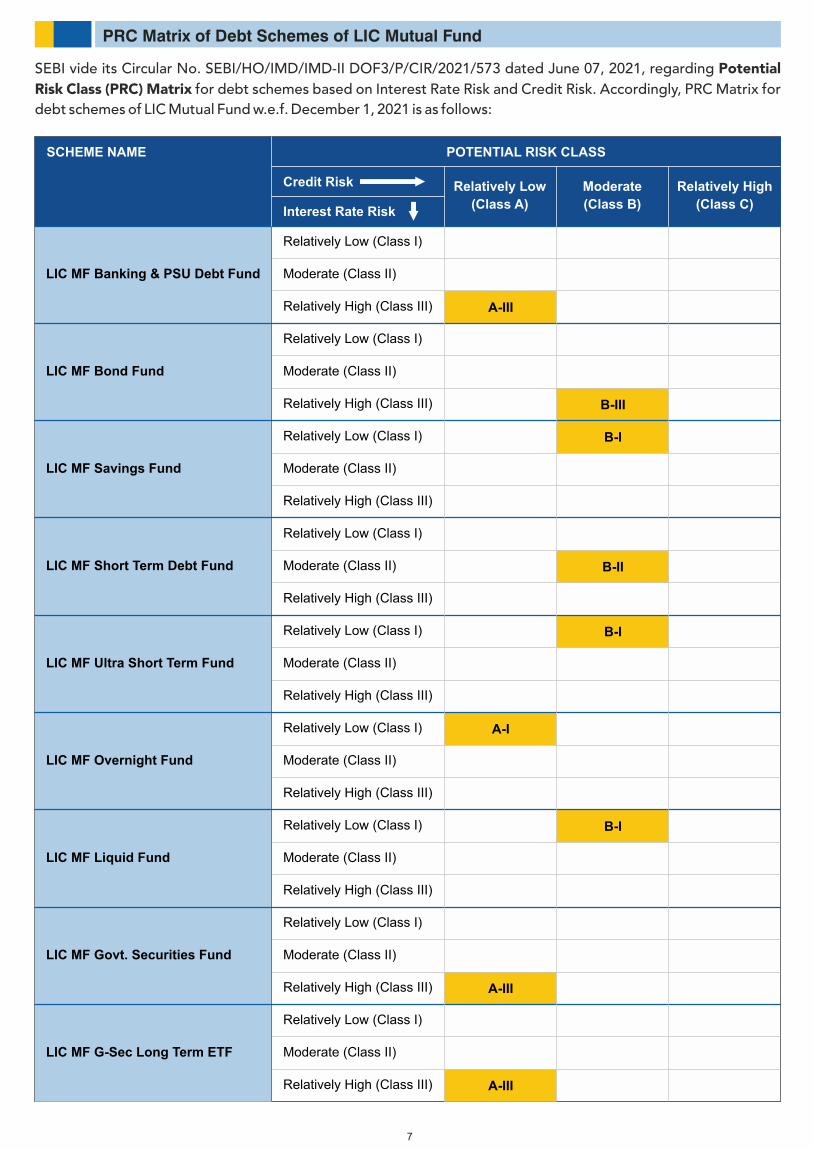
PRC Matrix of Debt Schemes of LIC Mutual Fund
SEBI vide its Circular No. SEBI/HO/IMD/IMD-II DOF3/P/CIR/2021/573 dated June 07, 2021, regarding Potential Risk Class (PRC) Matrix for debt schemes based on Interest Rate Risk and Credit Risk. Accordingly, PRC Matrix for debt schemes of LIC Mutual Fund w.e.f. December 1, 2021 is as follows:
7
POTENTIAL RISK CLASSSCHEME NAME
LIC MF Banking & PSU Debt Fund
LIC MF Bond Fund
LIC MF Savings Fund
LIC MF Short Term Debt Fund
LIC MF Ultra Short Term Fund
LIC MF Overnight Fund
LIC MF Liquid Fund
LIC MF Govt. Securities Fund
LIC MF G-Sec Long Term ETF
Relatively Low
(Class A)
Moderate
(Class B)
Relatively High
(Class C)
Credit Risk
Interest Rate Risk
Relatively Low (Class I)
Moderate (Class II)
Relatively High (Class III)
Relatively Low (Class I)
Moderate (Class II)
Relatively High (Class III)
Relatively Low (Class I)
Moderate (Class II)
Relatively High (Class III)
Relatively Low (Class I)
Moderate (Class II)
Relatively High (Class III)
Relatively Low (Class I)
Moderate (Class II)
Relatively High (Class III)
Relatively Low (Class I)
Moderate (Class II)
Relatively High (Class III)
Relatively Low (Class I)
Moderate (Class II)
Relatively High (Class III)
Relatively Low (Class I)
Moderate (Class II)
Relatively High (Class III)
Relatively Low (Class I)
Moderate (Class II)
Relatively High (Class III)
A-III
B-III
B-I
B-II
B-I
A-I
B-I
A-III
A-III
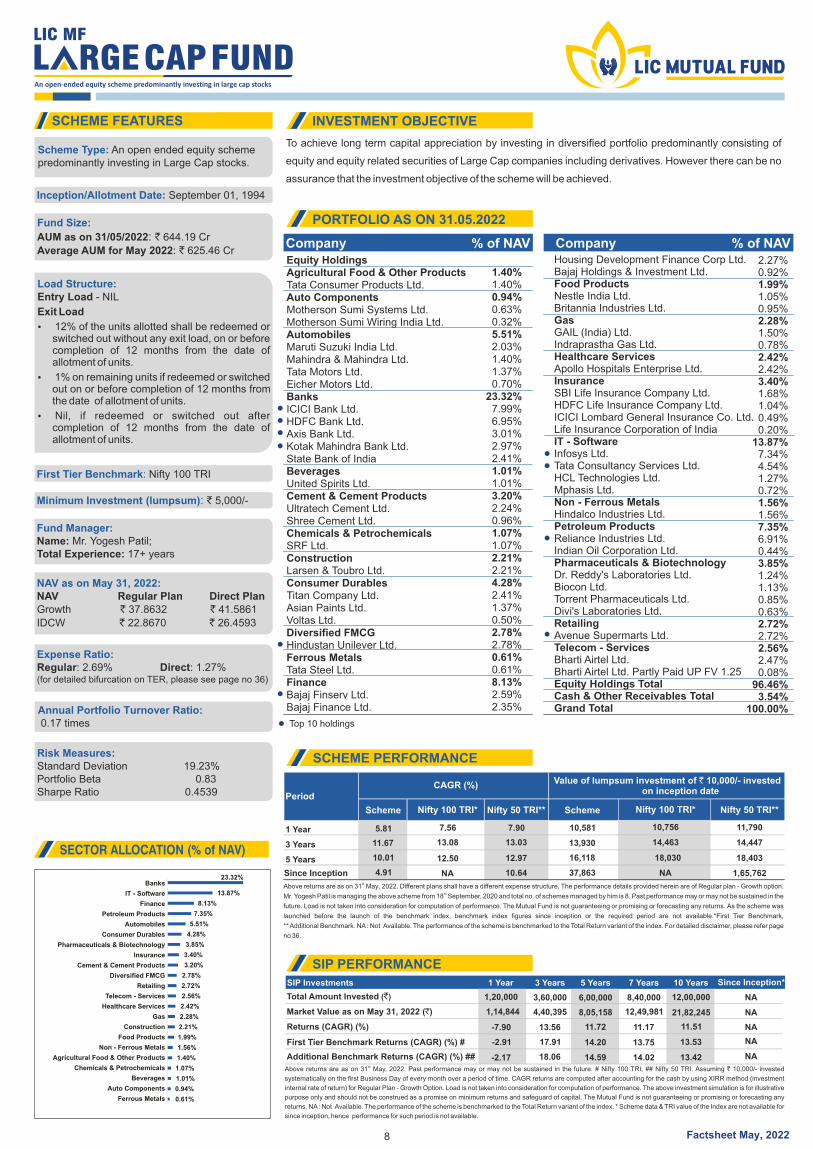
To achieve long term capital appreciation by investing in diversified portfolio predominantly consisting of
equity and equity related securities of Large Cap companies including derivatives. However there can be no
assurance that the investment objective of the scheme will be achieved.
stAbove returns are as on 31 May, 2022. Past performance may or may not be sustained in the future. # Nifty 100 TRI, ## Nifty 50 TRI. Assuming ` 10,000/- invested
systematically on the first Business Day of every month over a period of time. CAGR returns are computed after accounting for the cash by using XIRR method (investment
internal rate of return) for Regular Plan - Growth Option. Load is not taken into consideration for computation of performance. The above investment simulation is for illustrative
purpose only and should not be construed as a promise on minimum returns and safeguard of capital. The Mutual Fund is not guaranteeing or promising or forecasting any
returns. NA : Not Available. The performance of the scheme is benchmarked to the Total Return variant of the index. * Scheme data & TRI value of the Index are not available for
since inception, hence performance for such period is not available.
SCHEME PERFORMANCE
SIP PERFORMANCE
PORTFOLIO AS ON 31.05.2022
INVESTMENT OBJECTIVESCHEME FEATURES
SECTOR ALLOCATION (% of NAV)
Company % of NAV Company % of NAV
SIP Investments 1 Year 3 Years 7 Years5 Years 10 Years Since Inception*
Total Amount Invested (`) 1,20,000 3,60,000 8,40,0006,00,000 12,00,000 NA
Market Value as on May 31, 2022 (`) 1,14,844 4,40,395 8,05,158 21,82,245 NA
Returns (CAGR) (%) -7.90 13.56 11.1711.72 11.51 NA
First Tier Benchmark Returns (CAGR) (%) #
Additional Benchmark Returns (CAGR) (%) ##
-2.91
-2.17
17.91 13.75
18.06 14.02
14.20
14.59
13.53
13.42
NA
NA
Scheme Nifty 100 TRI* Nifty 100 TRI* Nifty 50 TRI** Nifty 50 TRI** Scheme
1 Year 5.81 7.56 7.90 10,581 10,756 11,790
3 Years 11.67 13.08 13.03 13,930 14,463 14,447
5 Years 10.01 12.50 12.97 16,118 18,030 18,403
Since Inception 4.91 NA 10.64 37,863 NA 1,65,762
CAGR (%)Value of lumpsum investment of ` 10,000/- invested
on inception datePeriod
stAbove returns are as on 31 May, 2022. Different plans shall have a different expense structure. The performance details provided herein are of Regular plan - Growth option.
thMr. Yogesh Patil is managing the above scheme from 18 September, 2020 and total no. of schemes managed by him is 8. Past performance may or may not be sustained in the
future. Load is not taken into consideration for computation of performance. The Mutual Fund is not guaranteeing or promising or forecasting any returns. As the scheme was
launched before the launch of the benchmark index, benchmark index figures since inception or the required period are not available.*First Tier Benchmark,
** Additional Benchmark. NA : Not Available. The performance of the scheme is benchmarked to the Total Return variant of the index. For detailed disclaimer, please refer page
no 36.
Factsheet May, 2022
Scheme Type: An open ended equity scheme predominantly investing in Large Cap stocks.
Inception/Allotment Date: September 01, 1994
Fund Size:
AUM as on 31/05/2022: ` 644.19 Cr
Average AUM for May 2022: ` 625.46 Cr
First Tier Benchmark: Nifty 100 TRI
Minimum Investment (lumpsum): ` 5,000/-
Fund Manager:Name: Mr. Yogesh Patil;Total Experience: 17+ years
NAV as on May 31, 2022:NAV Regular Plan Direct PlanGrowth ` 37.8632 ` 41.5861
IDCW ` 22.8670 ` 26.4593
Expense Ratio:Regular: 2.69% Direct: 1.27%(for detailed bifurcation on TER, please see page no 36)
Annual Portfolio Turnover Ratio: 0.17 times
Risk Measures:Standard Deviation 19.23%Portfolio Beta 0.83Sharpe Ratio 0.4539
Load Structure:Entry Load - NIL
Exit Load
Ÿ 12% of the units allotted shall be redeemed or switched out without any exit load, on or before completion of 12 months from the date of allotment of units.
Ÿ 1% on remaining units if redeemed or switched out on or before completion of 12 months from the date of allotment of units.
Ÿ Nil, if redeemed or switched out after completion of 12 months from the date of allotment of units.
12,49,981
8
23.32%
13.87%
8.13%
7.35%
5.51%
4.28%
3.85%
3.40%
3.20%
2.78%
2.72%
2.56%
2.42%
2.28%
2.21%
1.99%
1.56%
1.40%
1.07%
1.01%
0.94%
0.61%
Banks
IT - Software
Finance
Petroleum Products
Automobiles
Consumer Durables
Pharmaceuticals & Biotechnology
Insurance
Cement & Cement Products
Diversified FMCG
Retailing
Telecom - Services
Healthcare Services
Gas
Construction
Food Products
Non - Ferrous Metals
Agricultural Food & Other Products
Chemicals & Petrochemicals
Beverages
Auto Components
Ferrous Metals
Equity HoldingsAgricultural Food & Other ProductsTata Consumer Products Ltd.Auto ComponentsMotherson Sumi Systems Ltd.Motherson Sumi Wiring India Ltd.AutomobilesMaruti Suzuki India Ltd.Mahindra & Mahindra Ltd.Tata Motors Ltd.Eicher Motors Ltd.BanksICICI Bank Ltd.HDFC Bank Ltd.Axis Bank Ltd.Kotak Mahindra Bank Ltd.State Bank of IndiaBeveragesUnited Spirits Ltd.Cement & Cement ProductsUltratech Cement Ltd.Shree Cement Ltd.Chemicals & PetrochemicalsSRF Ltd.ConstructionLarsen & Toubro Ltd.Consumer DurablesTitan Company Ltd.Asian Paints Ltd.Voltas Ltd.Diversified FMCGHindustan Unilever Ltd.Ferrous MetalsTata Steel Ltd.FinanceBajaj Finserv Ltd.Bajaj Finance Ltd.
1.40%1.40%0.94%0.63%0.32%5.51%2.03%1.40%1.37%0.70%
23.32%7.99%6.95%3.01%2.97%2.41%1.01%1.01%3.20%2.24%0.96%1.07%1.07%2.21%2.21%4.28%2.41%1.37%0.50%2.78%2.78%0.61%0.61%8.13%2.59%2.35%
Housing Development Finance Corp Ltd.Bajaj Holdings & Investment Ltd.Food ProductsNestle India Ltd.Britannia Industries Ltd.GasGAIL (India) Ltd.Indraprastha Gas Ltd.Healthcare ServicesApollo Hospitals Enterprise Ltd.InsuranceSBI Life Insurance Company Ltd.HDFC Life Insurance Company Ltd.ICICI Lombard General Insurance Co. Ltd.Life Insurance Corporation of IndiaIT - SoftwareInfosys Ltd.Tata Consultancy Services Ltd.HCL Technologies Ltd.Mphasis Ltd.Non - Ferrous MetalsHindalco Industries Ltd.Petroleum ProductsReliance Industries Ltd.Indian Oil Corporation Ltd.Pharmaceuticals & BiotechnologyDr. Reddy's Laboratories Ltd.Biocon Ltd.Torrent Pharmaceuticals Ltd.Divi's Laboratories Ltd.RetailingAvenue Supermarts Ltd.Telecom - ServicesBharti Airtel Ltd.Bharti Airtel Ltd. Partly Paid UP FV 1.25Equity Holdings TotalCash & Other Receivables TotalGrand Total
2.27%0.92%1.99%1.05%0.95%2.28%1.50%0.78%2.42%2.42%3.40%1.68%1.04%0.49%0.20%
13.87%7.34%4.54%1.27%0.72%1.56%1.56%7.35%6.91%0.44%3.85%1.24%1.13%0.85%0.63%2.72%2.72%2.56%2.47%0.08%
96.46%3.54%
100.00%
Top 10 holdings
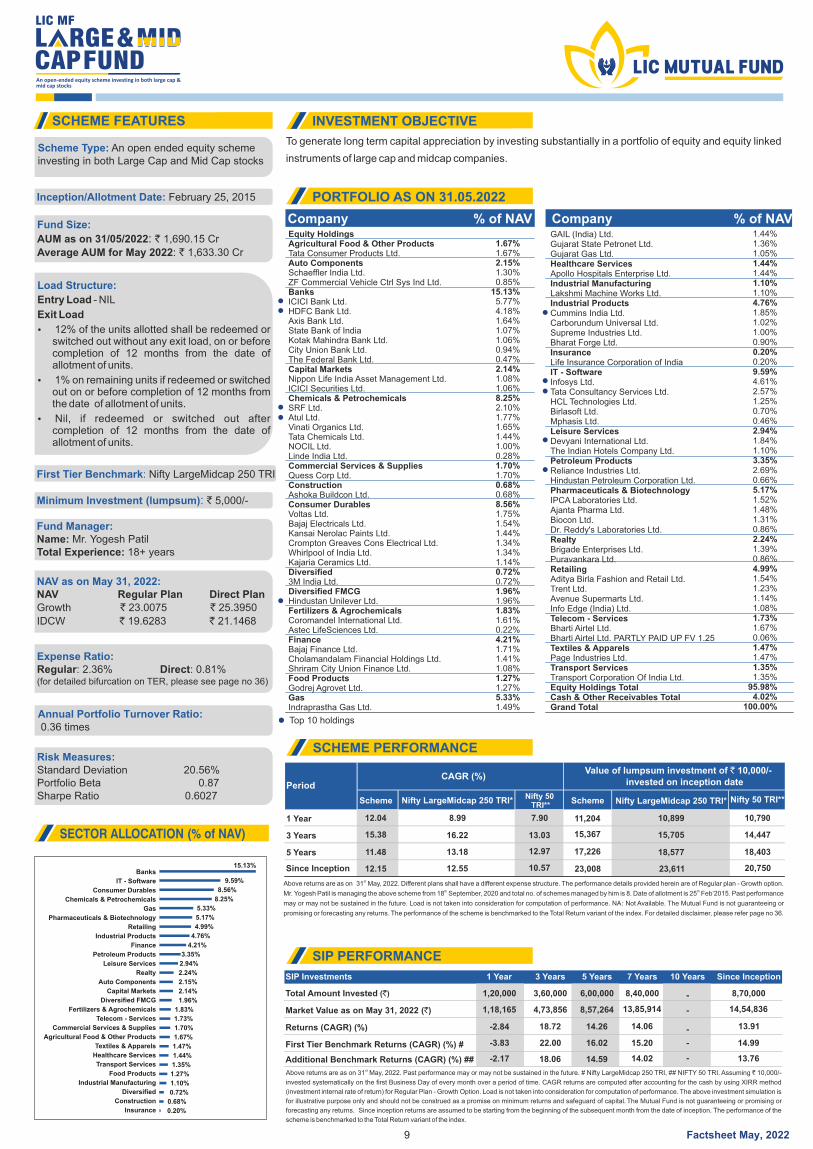
To generate long term capital appreciation by investing substantially in a portfolio of equity and equity linked
instruments of large cap and midcap companies.
stAbove returns are as on 31 May, 2022. Past performance may or may not be sustained in the future. # Nifty LargeMidcap 250 TRI, ## NIFTY 50 TRI. Assuming ` 10,000/-
invested systematically on the first Business Day of every month over a period of time. CAGR returns are computed after accounting for the cash by using XIRR method
(investment internal rate of return) for Regular Plan - Growth Option. Load is not taken into consideration for computation of performance. The above investment simulation is
for illustrative purpose only and should not be construed as a promise on minimum returns and safeguard of capital. The Mutual Fund is not guaranteeing or promising or
forecasting any returns. Since inception returns are assumed to be starting from the beginning of the subsequent month from the date of inception. The performance of the
scheme is benchmarked to the Total Return variant of the index.
SIP Investments 1 Year 3 Years 5 Years 7 Years 10 Years Since Inception
Total Amount Invested (`) 1,20,000 3,60,000 6,00,000 - 8,70,000
Market Value as on May 31, 2022 (`) 1,18,165 4,73,856 8,57,264 - 14,54,836
Returns (CAGR) (%) -2.84 18.72 14.26 - 13.91
First Tier Benchmark Returns (CAGR) (%) #
Additional Benchmark Returns (CAGR) (%) ##
-3.83 22.00 16.02
-2.17 18.06 14.59
-
-
14.99
13.76
SCHEME FEATURES INVESTMENT OBJECTIVE
PORTFOLIO AS ON 31.05.2022
SCHEME PERFORMANCE
SIP PERFORMANCE
Company % of NAV Company % of NAV
SECTOR ALLOCATION (% of NAV)
Scheme Nifty LargeMidcap 250 TRI* Nifty LargeMidcap 250 TRI*SchemeNifty 50 TRI**
Nifty 50 TRI**
1 Year 12.04 8.99 7.90 11,204 10,899 10,790
3 Years 15.38 16.22 13.03 15,367 15,705 14,447
5 Years 11.48 13.18 12.97 17,226 18,577 18,403
Since Inception 12.15 12.55 10.57 23,008 23,611 20,750
PeriodCAGR (%)
Value of lumpsum investment of ` 10,000/- invested on inception date
stAbove returns are as on 31 May, 2022. Different plans shall have a different expense structure. The performance details provided herein are of Regular plan - Growth option. th thMr. Yogesh Patil is managing the above scheme from 18 September, 2020 and total no. of schemes managed by him is 8. Date of allotment is 25 Feb’2015. Past performance
may or may not be sustained in the future. Load is not taken into consideration for computation of performance. NA : Not Available. The Mutual Fund is not guaranteeing or
promising or forecasting any returns. The performance of the scheme is benchmarked to the Total Return variant of the index. For detailed disclaimer, please refer page no 36.
Scheme Type: An open ended equity scheme investing in both Large Cap and Mid Cap stocks
Inception/Allotment Date: February 25, 2015
Fund Size:
AUM as on 31/05/2022: ` 1,690.15 Cr
: 1,633.30 CrAverage AUM for May 2022 `
First Tier Benchmark: Nifty LargeMidcap 250 TRI
Minimum Investment (lumpsum): ` 5,000/-
Fund Manager:Name: Mr. Yogesh PatilTotal Experience: 18+ years
NAV as on May 31, 2022: NAV Regular Plan Direct PlanGrowth ` 23.0075 ` 25.3950
IDCW ` 19.6283 ` 21.1468
Expense Ratio:Regular: 2.36% Direct: 0.81%(for detailed bifurcation on TER, please see page no 36)
Annual Portfolio Turnover Ratio: 0.36 times
Risk Measures:Standard Deviation 20.56%Portfolio Beta 0.87Sharpe Ratio 0.6027
Load Structure:
Entry Load - NIL
Exit Load
Ÿ 12% of the units allotted shall be redeemed or switched out without any exit load, on or before completion of 12 months from the date of allotment of units.
Ÿ 1% on remaining units if redeemed or switched out on or before completion of 12 months from the date of allotment of units.
Ÿ Nil, if redeemed or switched out after completion of 12 months from the date of allotment of units.
9
15.13%
9.59%
8.56%
8.25%
5.33%
5.17%
4.99%
4.76%
4.21%
3.35%
2.94%
2.24%
2.15%
2.14%
1.96%
1.83%
1.73%
1.70%
1.67%
1.47%
1.44%
1.35%
1.10%
0.72%
0.68%
0.20%
Banks
IT - Software
Consumer Durables
Chemicals & Petrochemicals
Gas
Pharmaceuticals & Biotechnology
Retailing
Industrial Products
Finance
Petroleum Products
Leisure Services
Realty
Auto Components
Capital Markets
Diversified FMCG
Fertilizers & Agrochemicals
Telecom - Services
Commercial Services & Supplies
Agricultural Food & Other Products
Textiles & Apparels
Healthcare Services
Transport Services
Food Products
Industrial Manufacturing
Diversified
Construction
Insurance
Equity HoldingsAgricultural Food & Other ProductsTata Consumer Products Ltd.Auto ComponentsSchaeffler India Ltd.ZF Commercial Vehicle Ctrl Sys Ind Ltd.BanksICICI Bank Ltd.HDFC Bank Ltd.Axis Bank Ltd.State Bank of IndiaKotak Mahindra Bank Ltd.City Union Bank Ltd.The Federal Bank Ltd.Capital MarketsNippon Life India Asset Management Ltd.ICICI Securities Ltd.Chemicals & PetrochemicalsSRF Ltd.Atul Ltd.Vinati Organics Ltd.Tata Chemicals Ltd.NOCIL Ltd.Linde India Ltd.Commercial Services & SuppliesQuess Corp Ltd.ConstructionAshoka Buildcon Ltd.Consumer DurablesVoltas Ltd.Bajaj Electricals Ltd.Kansai Nerolac Paints Ltd.Crompton Greaves Cons Electrical Ltd.Whirlpool of India Ltd.Kajaria Ceramics Ltd.Diversified3M India Ltd.Diversified FMCGHindustan Unilever Ltd.Fertilizers & AgrochemicalsCoromandel International Ltd.Astec LifeSciences Ltd.FinanceBajaj Finance Ltd.Cholamandalam Financial Holdings Ltd.Shriram City Union Finance Ltd.Food ProductsGodrej Agrovet Ltd.GasIndraprastha Gas Ltd.
1.67%1.67%2.15%1.30%0.85%
15.13%5.77%4.18%1.64%1.07%1.06%0.94%0.47%2.14%1.08%1.06%8.25%2.10%1.77%1.65%1.44%1.00%0.28%1.70%1.70%0.68%0.68%8.56%1.75%1.54%1.44%1.34%1.34%1.14%0.72%0.72%1.96%1.96%1.83%1.61%0.22%4.21%1.71%1.41%1.08%1.27%1.27%5.33%1.49%
GAIL (India) Ltd.Gujarat State Petronet Ltd.Gujarat Gas Ltd.Healthcare ServicesApollo Hospitals Enterprise Ltd.Industrial ManufacturingLakshmi Machine Works Ltd.Industrial ProductsCummins India Ltd.Carborundum Universal Ltd.Supreme Industries Ltd.Bharat Forge Ltd.InsuranceLife Insurance Corporation of IndiaIT - SoftwareInfosys Ltd.Tata Consultancy Services Ltd.HCL Technologies Ltd.Birlasoft Ltd.Mphasis Ltd.Leisure ServicesDevyani International Ltd.The Indian Hotels Company Ltd.Petroleum ProductsReliance Industries Ltd.Hindustan Petroleum Corporation Ltd.Pharmaceuticals & BiotechnologyIPCA Laboratories Ltd.Ajanta Pharma Ltd.Biocon Ltd.Dr. Reddy's Laboratories Ltd.RealtyBrigade Enterprises Ltd.Puravankara Ltd.RetailingAditya Birla Fashion and Retail Ltd.Trent Ltd.Avenue Supermarts Ltd.Info Edge (India) Ltd.Telecom - ServicesBharti Airtel Ltd.Bharti Airtel Ltd. PARTLY PAID UP FV 1.25Textiles & ApparelsPage Industries Ltd.Transport ServicesTransport Corporation Of India Ltd.Equity Holdings TotalCash & Other Receivables TotalGrand Total
1.44%1.36%1.05%1.44%1.44%1.10%1.10%4.76%1.85%1.02%1.00%0.90%0.20%0.20%9.59%4.61%2.57%1.25%0.70%0.46%2.94%1.84%1.10%3.35%2.69%0.66%5.17%1.52%1.48%1.31%0.86%2.24%1.39%0.86%4.99%1.54%1.23%1.14%1.08%1.73%1.67%0.06%1.47%1.47%1.35%1.35%
95.98%4.02%
100.00%
Top 10 holdings
8,40,000
13,85,914
14.06
15.20
14.02
Factsheet May, 2022
1.27%
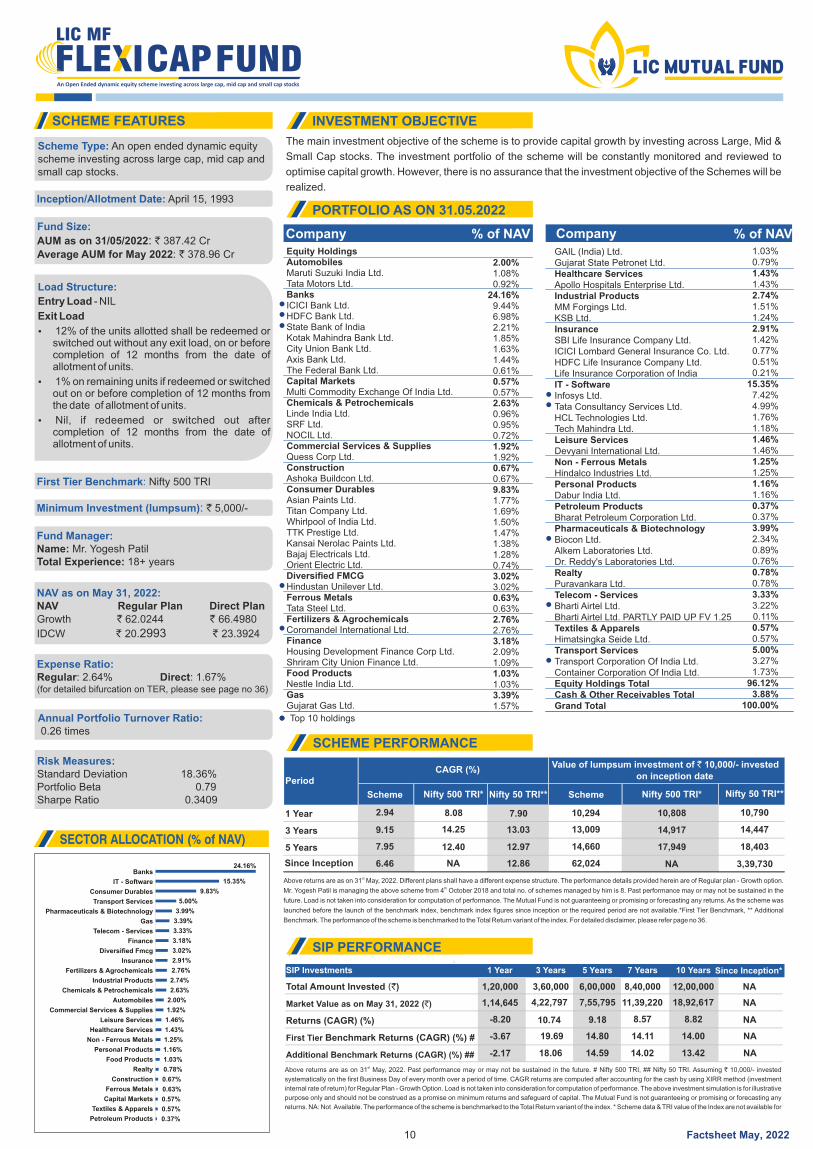
The main investment objective of the scheme is to provide capital growth by investing across Large, Mid &
Small Cap stocks. The investment portfolio of the scheme will be constantly monitored and reviewed to
optimise capital growth. However, there is no assurance that the investment objective of the Schemes will be
realized.
stAbove returns are as on 31 May, 2022. Past performance may or may not be sustained in the future. # Nifty 500 TRI, ## Nifty 50 TRI. Assuming ` 10,000/- invested
systematically on the first Business Day of every month over a period of time. CAGR returns are computed after accounting for the cash by using XIRR method (investment
internal rate of return) for Regular Plan - Growth Option. Load is not taken into consideration for computation of performance. The above investment simulation is for illustrative
purpose only and should not be construed as a promise on minimum returns and safeguard of capital. The Mutual Fund is not guaranteeing or promising or forecasting any
returns. NA: Not Available. The performance of the scheme is benchmarked to the Total Return variant of the index. * Scheme data & TRI value of the Index are not available for
SIP Investments 1 Year 3 Years 5 Years 10 Years7 Years Since Inception*
Total Amount Invested ( )` 1,20,000 3,60,000 6,00,000 12,00,0008,40,000 NA
Market Value as on May 31, 2022 (`) 1,14,645 4,22,797 7,55,795 18,92,61711,39,220 NA
Returns (CAGR) (%) -8.20 10.74 9.18 8.828.57 NA
First Tier Benchmark Returns (CAGR) (%) #
Additional Benchmark Returns (CAGR) (%) ##
-3.67
-2.17
19.69
18.06
14.80
14.59
14.0014.11
13.4214.02
NA
NA
SCHEME FEATURES INVESTMENT OBJECTIVE
PORTFOLIO AS ON 31.05.2022
SCHEME PERFORMANCE
SIP PERFORMANCE
Company % of NAV Company % of NAV
SECTOR ALLOCATION (% of NAV)
Scheme Scheme
1 Year 2.94 8.08 7.90 10,294 10,808 10,790
3 Years 9.15 14.25 13.03 13,009 14,917 14,447
5 Years 7.95 12.40 12.97 14,660 17,949 18,403
Since Inception 6.46 NA 12.86 62,024 NA 3,39,730
PeriodCAGR (%)
Value of lumpsum investment of ` 10,000/- invested on inception date
stAbove returns are as on 31 May, 2022. Different plans shall have a different expense structure. The performance details provided herein are of Regular plan - Growth option. thMr. Yogesh Patil is managing the above scheme from 4 October 2018 and total no. of schemes managed by him is 8. Past performance may or may not be sustained in the
future. Load is not taken into consideration for computation of performance. The Mutual Fund is not guaranteeing or promising or forecasting any returns. As the scheme was
launched before the launch of the benchmark index, benchmark index figures since inception or the required period are not available.*First Tier Benchmark, ** Additional
Benchmark. The performance of the scheme is benchmarked to the Total Return variant of the index. For detailed disclaimer, please refer page no 36.
Nifty 500 TRI* Nifty 500 TRI* Nifty 50 TRI** Nifty 50 TRI**
Scheme Type: An open ended dynamic equity scheme investing across large cap, mid cap andsmall cap stocks.
Inception/Allotment Date: April 15, 1993
Fund Size:
AUM as on 31/05/2022: ` 387.42 Cr
: 378.96 CrAverage AUM for May 2022 `
First Tier Benchmark: Nifty 500 TRI
Minimum Investment (lumpsum): ` 5,000/-
Fund Manager:Name: Mr. Yogesh PatilTotal Experience: years18+
NAV as on May 31, 2022:NAV Regular Plan Direct PlanGrowth ` 62.0244 ` 66.4980
IDCW ` 20.2993 ` 23.3924
Expense Ratio:Regular: 2.64% Direct: 1.67%(for detailed bifurcation on TER, please see page no 36)
Annual Portfolio Turnover Ratio: 0.26 times
Risk Measures:Standard Deviation 18.36%Portfolio Beta 0.79Sharpe Ratio 0.3409
10
Load Structure:
Entry Load - NIL
Exit Load
Ÿ 12% of the units allotted shall be redeemed or switched out without any exit load, on or before completion of 12 months from the date of allotment of units.
Ÿ 1% on remaining units if redeemed or switched out on or before completion of 12 months from the date of allotment of units.
Ÿ Nil, if redeemed or switched out after completion of 12 months from the date of allotment of units.
24.16%
15.35%
9.83%
5.00%
3.99%
3.39%
3.33%
3.18%
3.02%
2.91%
2.76%
2.74%
2.63%
2.00%
1.92%
1.46%
1.43%
1.25%
1.16%
0.78%
0.67%
0.63%
0.57%
0.57%
0.37%
Banks
IT - Software
Consumer Durables
Transport Services
Pharmaceuticals & Biotechnology
Gas
Telecom - Services
Finance
Diversified Fmcg
Insurance
Fertilizers & Agrochemicals
Industrial Products
Chemicals & Petrochemicals
Automobiles
Commercial Services & Supplies
Leisure Services
Healthcare Services
Non - Ferrous Metals
Personal Products
Food Products
Realty
Construction
Ferrous Metals
Capital Markets
Textiles & Apparels
Petroleum Products
Equity HoldingsAutomobilesMaruti Suzuki India Ltd.Tata Motors Ltd.BanksICICI Bank Ltd.HDFC Bank Ltd.State Bank of IndiaKotak Mahindra Bank Ltd.City Union Bank Ltd.Axis Bank Ltd.The Federal Bank Ltd.Capital MarketsMulti Commodity Exchange Of India Ltd.Chemicals & PetrochemicalsLinde India Ltd.SRF Ltd.NOCIL Ltd.Commercial Services & SuppliesQuess Corp Ltd.ConstructionAshoka Buildcon Ltd.Consumer DurablesAsian Paints Ltd.Titan Company Ltd.Whirlpool of India Ltd.TTK Prestige Ltd.Kansai Nerolac Paints Ltd.Bajaj Electricals Ltd.Orient Electric Ltd.Diversified FMCGHindustan Unilever Ltd.Ferrous MetalsTata Steel Ltd.Fertilizers & AgrochemicalsCoromandel International Ltd.FinanceHousing Development Finance Corp Ltd.Shriram City Union Finance Ltd.Food ProductsNestle India Ltd.GasGujarat Gas Ltd.
2.00%1.08%0.92%
24.16%9.44%6.98%2.21%1.85%1.63%1.44%0.61%0.57%0.57%2.63%0.96%0.95%0.72%1.92%1.92%0.67%0.67%9.83%1.77%1.69%1.50%1.47%1.38%1.28%0.74%3.02%3.02%0.63%0.63%2.76%2.76%3.18%2.09%1.09%1.03%1.03%3.39%1.57%
GAIL (India) Ltd.Gujarat State Petronet Ltd.Healthcare ServicesApollo Hospitals Enterprise Ltd.Industrial ProductsMM Forgings Ltd.KSB Ltd.InsuranceSBI Life Insurance Company Ltd.ICICI Lombard General Insurance Co. Ltd.HDFC Life Insurance Company Ltd.Life Insurance Corporation of IndiaIT - SoftwareInfosys Ltd.Tata Consultancy Services Ltd.HCL Technologies Ltd.Tech Mahindra Ltd.Leisure ServicesDevyani International Ltd.Non - Ferrous MetalsHindalco Industries Ltd.Personal ProductsDabur India Ltd.Petroleum ProductsBharat Petroleum Corporation Ltd.Pharmaceuticals & BiotechnologyBiocon Ltd.Alkem Laboratories Ltd.Dr. Reddy's Laboratories Ltd.RealtyPuravankara Ltd.Telecom - ServicesBharti Airtel Ltd.Bharti Airtel Ltd. PARTLY PAID UP FV 1.25Textiles & ApparelsHimatsingka Seide Ltd.Transport ServicesTransport Corporation Of India Ltd.Container Corporation Of India Ltd.Equity Holdings TotalCash & Other Receivables TotalGrand Total
1.03%0.79%1.43%1.43%2.74%1.51%1.24%2.91%1.42%0.77%0.51%0.21%
15.35%7.42%4.99%1.76%1.18%1.46%1.46%1.25%1.25%1.16%1.16%0.37%0.37%3.99%2.34%0.89%0.76%0.78%0.78%3.33%3.22%0.11%0.57%0.57%5.00%3.27%1.73%
96.12%3.88%
100.00%
Top 10 holdings
Factsheet May, 2022
1.03%
stAbove returns are as on 31 May, 2022. Past performance may or may not be sustained in the future. # Nifty 500 TRI, ## Nifty 50 TRI. Assuming ` 10,000/- invested
systematically on the first Business Day of every month over a period of time. CAGR returns are computed after accounting for the cash by using XIRR method (investment
internal rate of return) for Regular Plan - Growth Option. Load is not taken into consideration for computation of performance. The above investment simulation is for illustrative
purpose only and should not be construed as a promise on minimum returns and safeguard of capital. The Mutual Fund is not guaranteeing or promising or forecasting any
returns. NA: Not Available. The performance of the scheme is benchmarked to the Total Return variant of the index. * Scheme data & TRI value of the Index are not available for
since inception, hence performance for such period is not available.
To provide capital growth along with tax rebate and tax relief to our investors through prudent investments in
the stock markets. An open ended equity linked tax saving Scheme which offers investors the opportunity to
seek Tax rebate u/s 80C of the Income Tax Act 1961. However, there is no assurance that the investment
objective of the Schemes will be realized.
SIP Investments 1 Year 3 Years 5 Years 7 Years 10 Years Since Inception*
Total Amount Invested (`) 1,20,000 3,60,000 6,00,000 8,40,000 12,00,000 NA
NA
NA
NA
NA
Market Value as on May 31, 2022 (`) 1,16,069 4,45,347 8,00,066 12,57,687 22,65,750
Returns (CAGR) (%) -6.04 14.34 11.47 11.34 12.21
First Tier Benchmark Returns (CAGR) (%) #
Additional Benchmark Returns (CAGR) (%) ##
-3.67
-2.17
19.69
18.06
14.80 14.11
14.59 14.02
14.00
13.42
SCHEME FEATURES INVESTMENT OBJECTIVE
PORTFOLIO AS ON 31.05.2022
SCHEME PERFORMANCE
SIP PERFORMANCE
Company % of NAV Company % of NAV
SECTOR ALLOCATION (% of NAV)
Scheme Nifty 500 TRI* Nifty 500 TRI*Nifty 50 TRI** Nifty 50 TRI**Scheme
1 Year 7.87 8.08 7.90 10,787
13,778
10,808 10,790
3 Years 11.26 14.25 13.03 14,917 14,447
5 Years 10.16 12.40 12.97 16,226 17,949 18,403
Since Inception 9.27 14.91 13.33 93,218 3,31,195 2,33,899
PeriodCAGR (%)
Value of lumpsum investment of ` 10,000/- invested on inception date
stAbove returns are as on 31 May, 2022. Different plans shall have a different expense structure. The performance details provided herein are of Regular plan - Growth option. th
Mr. Yogesh Patil is managing the above scheme from 18 September 2020 and total no. of schemes managed by him is 8. Past performance may or may not be sustained in the
future. Load is not taken into consideration for computation of performance. The Mutual Fund is not guaranteeing or promising or forecasting any returns. *First Tier Benchmark,
**Additional Benchmark. The performance of the scheme is benchmarked to the Total Return variant of the index. For detailed disclaimer, please refer page no 36.
Scheme Type: An open ended equity linked
saving scheme with a statutory lock in of 3 years
and tax benefit.
Inception/Allotment Date: March 31,1997
Fund Size:
AUM as on 31/05/2022: ` 390.78 Cr
: 382.00 CrAverage AUM for May 2022 `
Load Structure:Entry Load: Nil
Exit Load: Nil (Subject to lock-in period of 3
years)
First Tier Benchmark: Nifty 500 TRI
Minimum Investment (lumpsum): ` 500/-
Fund Manager:
Name: Mr. Yogesh Patil
Total Experience: years18+
NAV as on May 31, 2022:NAV Regular Plan Direct PlanGrowth ` 93.2175 ` 102.7211
IDCW ` 20.9542 ` 24.2619
Expense Ratio:Regular: 2.54% Direct: 1.30%(for detailed bifurcation on TER, please see page no 36)
Annual Portfolio Turnover Ratio: 0.14 times
Risk Measures:Standard Deviation 20.68%Portfolio Beta 0.88Sharpe Ratio 0.4233
11
Equity HoldingsAgricultural Food & Other ProductsTata Consumer Products Ltd.AutomobilesMahindra & Mahindra Ltd.Maruti Suzuki India Ltd.BanksICICI Bank Ltd.HDFC Bank Ltd.Kotak Mahindra Bank Ltd.Axis Bank Ltd.State Bank of IndiaCity Union Bank Ltd.Capital MarketsICICI Securities Ltd.Chemicals & PetrochemicalsAtul Ltd.Tata Chemicals Ltd.Vinati Organics Ltd.SRF Ltd.Commercial Services & SuppliesQuess Corp Ltd.Consumer DurablesTitan Company Ltd.Asian Paints Ltd.Crompton Greaves Cons Electrical Ltd.Bata India Ltd.Orient Electric Ltd.Diversified FMCGHindustan Unilever Ltd.Fertilizers & AgrochemicalsCoromandel International Ltd.FinanceBajaj Finance Ltd.Housing Development Finance Corp Ltd.Food ProductsNestle India Ltd.GasGAIL (India) Ltd.Gujarat State Petronet Ltd.Healthcare ServicesApollo Hospitals Enterprise Ltd.
2.14%2.14%2.93%1.79%1.14%
23.62%9.53%6.71%2.82%1.80%1.66%1.09%0.61%0.61%5.70%1.77%1.48%1.44%1.01%1.00%1.00%5.21%1.99%1.10%0.93%0.67%0.52%1.88%1.88%1.36%1.36%3.98%3.05%0.93%0.72%0.72%1.63%0.93%0.71%1.69%1.69%
Industrial ManufacturingHonda India Power Products Ltd.Industrial ProductsBharat Forge Ltd.InsuranceSBI Life Insurance Company Ltd.ICICI Prudential Life Insurance Co Ltd.ICICI Lombard General Insurance Co. Ltd.Life Insurance Corporation of IndiaIT - SoftwareInfosys Ltd.Tata Consultancy Services Ltd.HCL Technologies Ltd.Mphasis Ltd.Leisure ServicesThe Indian Hotels Company Ltd.Petroleum ProductsReliance Industries Ltd.Hindustan Petroleum Corporation Ltd.Bharat Petroleum Corporation Ltd.Pharmaceuticals & BiotechnologyIPCA Laboratories Ltd.Biocon Ltd.Cipla Ltd.Gland Pharma Ltd.Divi's Laboratories Ltd.RealtyBrigade Enterprises Ltd.RetailingAvenue Supermarts Ltd.Aditya Birla Fashion and Retail Ltd.Trent Ltd.Info Edge (India) Ltd.Telecom - ServicesBharti Airtel Ltd.Bharti Airtel Ltd. Partly Paid UP FV 1.25Textiles & ApparelsPage Industries Ltd.Himatsingka Seide Ltd.Equity Holdings TotalCash & Other Receivables TotalGrand Total
0.61%0.61%0.29%0.29%3.16%1.20%0.98%0.77%0.21%
14.90%7.82%4.80%2.09%0.18%1.46%1.46%4.90%4.13%0.39%0.37%4.64%1.39%1.34%0.94%0.67%0.32%2.13%2.13%7.64%3.61%1.82%1.36%0.84%2.95%2.85%0.10%1.91%1.24%0.67%
97.06%2.94%
100.00%
Top 10 holdings
23.62%
14.90%
7.64%
5.70%
5.21%
4.90%
4.64%
3.98%
3.16%
2.95%
2.93%
2.14%
2.13%
1.91%
1.88%
1.69%
1.63%
1.46%
1.36%
1.00%
0.72%
0.61%
0.61%
0.29%
Banks
IT - Software
Retailing
Chemicals & Petrochemicals
Consumer Durables
Petroleum Products
Pharmaceuticals & Biotechnology
Finance
Insurance
Telecom - Services
Automobiles
Agricultural Food & Other Products
Realty
Textiles & Apparels
Diversified FMCG
Healthcare Services
Gas
Leisure Services
Fertilizers & Agrochemicals
Commercial Services & Supplies
Food Products
Industrial Manufacturing
Capital Markets
Industrial Products
Factsheet May, 2022
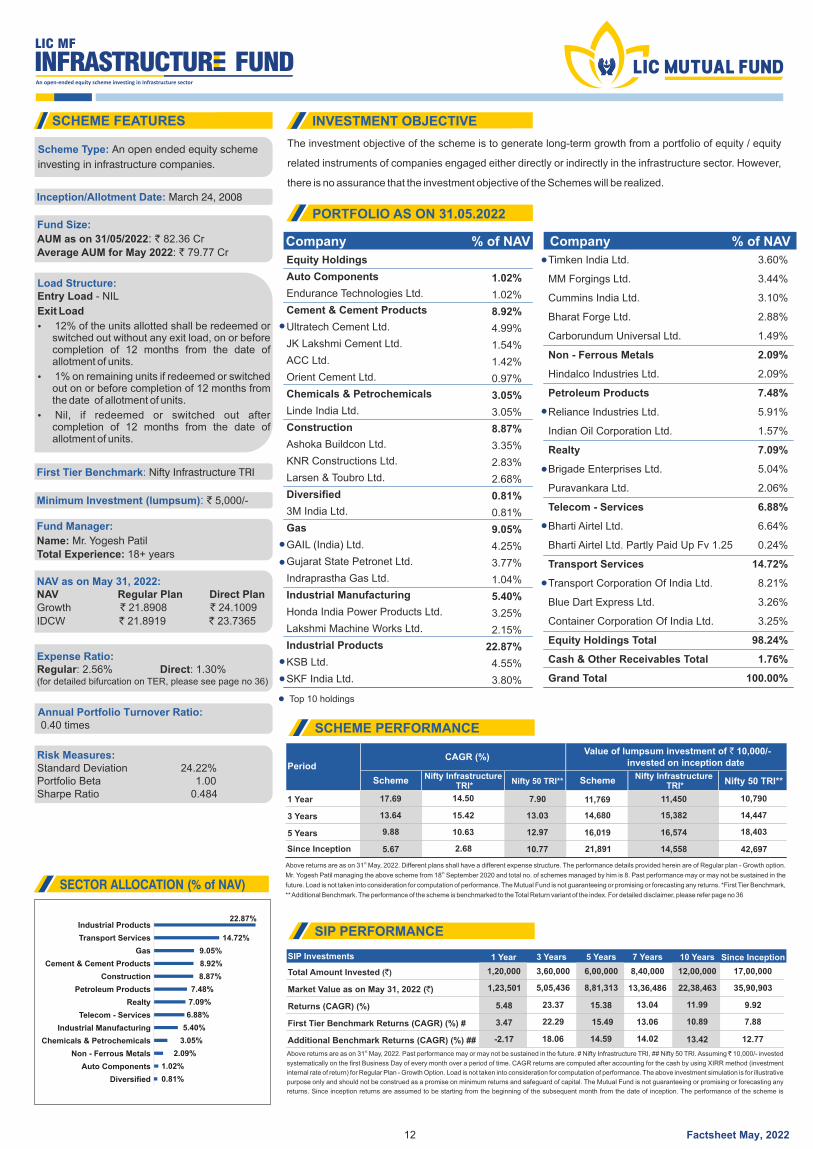
stAbove returns are as on 31 May, 2022. Past performance may or may not be sustained in the future. # Nifty Infrastructure TRI, ## Nifty 50 TRI. Assuming ̀ 10,000/- invested
systematically on the first Business Day of every month over a period of time. CAGR returns are computed after accounting for the cash by using XIRR method (investment
internal rate of return) for Regular Plan - Growth Option. Load is not taken into consideration for computation of performance. The above investment simulation is for illustrative
purpose only and should not be construed as a promise on minimum returns and safeguard of capital. The Mutual Fund is not guaranteeing or promising or forecasting any
returns. Since inception returns are assumed to be starting from the beginning of the subsequent month from the date of inception. The performance of the scheme is
The investment objective of the scheme is to generate long-term growth from a portfolio of equity / equity
related instruments of companies engaged either directly or indirectly in the infrastructure sector. However,
there is no assurance that the investment objective of the Schemes will be realized.
SIP Investments 1 Year 3 Years 5 Years 7 Years 10 Years Since Inception
Total Amount Invested ( )` 1,20,000
1,23,501
5.48
3.47
-2.17
3,60,000 6,00,000 8,40,000 17,00,00012,00,000
Market Value as on May 31, 2022 (`) 5,05,436 8,81,313 13,36,486 35,90,90322,38,463
Returns (CAGR) (%) 23.37 15.38 13.04 9.9211.99
First Tier Benchmark Returns (CAGR) (%) #
Additional Benchmark Returns (CAGR) (%) ##
22.29
18.06
15.49 13.06
14.59 14.02
7.8810.89
12.7713.42
SCHEME FEATURES INVESTMENT OBJECTIVE
PORTFOLIO AS ON 31.05.2022
SCHEME PERFORMANCE
SIP PERFORMANCE
Company % of NAV Company % of NAV
SECTOR ALLOCATION (% of NAV)
SchemeNifty Infrastructure
TRI*Nifty Infrastructure
TRI*Nifty 50 TRI** Nifty 50 TRI**Scheme
1 Year 17.69 14.50 7.90 11,769 11,450 10,790
3 Years 13.64 15.42 13.03 14,680 15,382 14,447
5 Years 9.88 10.63 12.97 16,019 16,574 18,403
Since Inception 5.67 2.68 10.77 21,891 14,558 42,697
PeriodCAGR (%)
Value of lumpsum investment of ` 10,000/- invested on inception date
stAbove returns are as on 31 May, 2022. Different plans shall have a different expense structure. The performance details provided herein are of Regular plan - Growth option.
thMr. Yogesh Patil managing the above scheme from 18 September 2020 and total no. of schemes managed by him is 8. Past performance may or may not be sustained in the
future. Load is not taken into consideration for computation of performance. The Mutual Fund is not guaranteeing or promising or forecasting any returns. *First Tier Benchmark,
** Additional Benchmark. The performance of the scheme is benchmarked to the Total Return variant of the index. For detailed disclaimer, please refer page no 36
Scheme Type: An open ended equity scheme
investing in infrastructure companies.
Inception/Allotment Date: March 24, 2008
Fund Size:
AUM as on 31/05/2022: ` 82.36 Cr
: 79.77 CrAverage AUM for May 2022 `
First Tier Benchmark: Nifty Infrastructure TRI
Minimum Investment (lumpsum): ` 5,000/-
Fund Manager:
Name: Mr. Yogesh Patil
Total Experience: years18+
NAV as on May 31, 2022:NAV Regular Plan Direct PlanGrowth ` 21.8908 ` 24.1009
IDCW ` 21.8919 ` 23.7365
Expense Ratio:Regular: 2.56% Direct: 1.30%(for detailed bifurcation on TER, please see page no 36)
Annual Portfolio Turnover Ratio: 0.40 times
Risk Measures:Standard Deviation 24.22%Portfolio Beta 1.00Sharpe Ratio 0.484
12
Load Structure:Entry Load - NIL
Exit Load
Ÿ 12% of the units allotted shall be redeemed or switched out without any exit load, on or before completion of 12 months from the date of allotment of units.
Ÿ 1% on remaining units if redeemed or switched out on or before completion of 12 months from the date of allotment of units.
Ÿ Nil, if redeemed or switched out after completion of 12 months from the date of allotment of units.
Equity Holdings
Auto Components
Endurance Technologies Ltd.
Cement & Cement Products
Ultratech Cement Ltd.
JK Lakshmi Cement Ltd.
ACC Ltd.
Orient Cement Ltd.
Chemicals & Petrochemicals
Linde India Ltd.
Construction
Ashoka Buildcon Ltd.
KNR Constructions Ltd.
Larsen & Toubro Ltd.
Diversified
3M India Ltd.
Gas
GAIL (India) Ltd.
Gujarat State Petronet Ltd.
Indraprastha Gas Ltd.
Industrial Manufacturing
Honda India Power Products Ltd.
Lakshmi Machine Works Ltd.
Industrial Products
KSB Ltd.
SKF India Ltd.
1.02%
1.02%
8.92%
4.99%
1.54%
1.42%
0.97%
3.05%
3.05%
8.87%
3.35%
2.83%
2.68%
0.81%
0.81%
9.05%
4.25%
3.77%
1.04%
5.40%
3.25%
2.15%
22.87%
4.55%
3.80%
Timken India Ltd.
MM Forgings Ltd.
Cummins India Ltd.
Bharat Forge Ltd.
Carborundum Universal Ltd.
Non - Ferrous Metals
Hindalco Industries Ltd.
Petroleum Products
Reliance Industries Ltd.
Indian Oil Corporation Ltd.
Realty
Brigade Enterprises Ltd.
Puravankara Ltd.
Telecom - Services
Bharti Airtel Ltd.
Bharti Airtel Ltd. Partly Paid Up Fv 1.25
Transport Services
Transport Corporation Of India Ltd.
Blue Dart Express Ltd.
Container Corporation Of India Ltd.
Equity Holdings Total
Cash & Other Receivables Total
Grand Total
3.60%
3.44%
3.10%
2.88%
1.49%
2.09%
2.09%
7.48%
5.91%
1.57%
7.09%
5.04%
2.06%
6.88%
6.64%
0.24%
14.72%
8.21%
3.26%
3.25%
98.24%
1.76%
100.00%
Top 10 holdings
Factsheet May, 2022
22.87%
14.72%
9.05%
8.92%
8.87%
7.48%
7.09%
6.88%
5.40%
3.05%
2.09%
1.02%
Industrial Products
Transport Services
Gas
Cement & Cement Products
Construction
Petroleum Products
Realty
Telecom - Services
Industrial Manufacturing
Chemicals & Petrochemicals
Non - Ferrous Metals
Auto Components
Diversified 0.81%
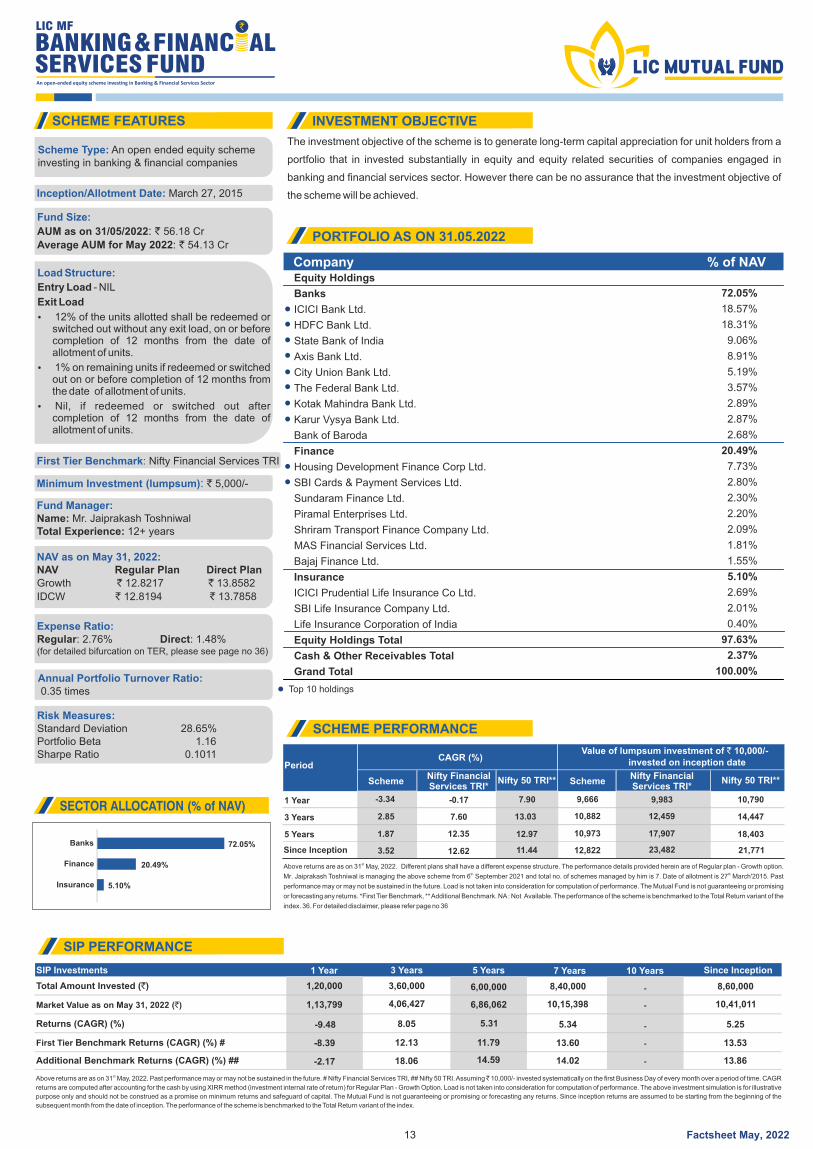
The investment objective of the scheme is to generate long-term capital appreciation for unit holders from a
portfolio that in invested substantially in equity and equity related securities of companies engaged in
banking and financial services sector. However there can be no assurance that the investment objective of
the scheme will be achieved.
SCHEME FEATURES INVESTMENT OBJECTIVE
PORTFOLIO AS ON 31.05.2022
Company % of NAV
SECTOR ALLOCATION (% of NAV)
SCHEME PERFORMANCE
SchemeNifty Financial Services TRI*
Nifty Financial Services TRI*
Nifty 50 TRI** Nifty 50 TRI**Scheme
1 Year -3.34 -0.17 7.90 9,666 9,983
23,482
10,790
21,771
3 Years 10,882 12,459 14,447
5 Years 1.87
2.85
12.35
7.60
12.97
13.03
10,973 17,907 18,403
Since Inception 3.52 12.62 11.44 12,822
PeriodCAGR (%)
Value of lumpsum investment of ` 10,000/-invested on inception date
stAbove returns are as on 31 May, 2022. Different plans shall have a different expense structure. The performance details provided herein are of Regular plan - Growth option. th thMr. Jaiprakash Toshniwal is managing the above scheme from 6 September 2021 and total no. of schemes managed by him is 7. Date of allotment is 27 March'2015. Past
performance may or may not be sustained in the future. Load is not taken into consideration for computation of performance. The Mutual Fund is not guaranteeing or promising
or forecasting any returns. *First Tier Benchmark, ** Additional Benchmark. NA : Not Available. The performance of the scheme is benchmarked to the Total Return variant of the
index. 36. For detailed disclaimer, please refer page no 36
Scheme Type: An open ended equity scheme investing in banking & financial companies
Inception/Allotment Date: March 27, 2015
Fund Size:
AUM as on 31/05/2022: ` 56.18 Cr
: 54.13 CrAverage AUM for May 2022 `
First Tier Benchmark: Nifty Financial Services TRI
Minimum Investment (lumpsum): ` 5,000/-
Fund Manager:Name: Mr. Jaiprakash Toshniwal
12+Total Experience: years
NAV May 31, 2022:as onNAV Regular Plan Direct PlanGrowth ` 12.8217 ` 13.8582
IDCW ` 12.8194 ` 13.7858
Expense Ratio:Regular: 2.76% Direct: 1.48%(for detailed bifurcation on TER, please see page no 36)
Annual Portfolio Turnover Ratio: 0.35 times
Risk Measures:Standard Deviation 28.65%Portfolio Beta 1.16Sharpe Ratio 0.1011
stAbove returns are as on 31 May, 2022. Past performance may or may not be sustained in the future. # Nifty Financial Services TRI, ## Nifty 50 TRI. Assuming ̀ 10,000/- invested systematically on the first Business Day of every month over a period of time. CAGR
returns are computed after accounting for the cash by using XIRR method (investment internal rate of return) for Regular Plan - Growth Option. Load is not taken into consideration for computation of performance. The above investment simulation is for illustrative
purpose only and should not be construed as a promise on minimum returns and safeguard of capital. The Mutual Fund is not guaranteeing or promising or forecasting any returns. Since inception returns are assumed to be starting from the beginning of the
subsequent month from the date of inception. The performance of the scheme is benchmarked to the Total Return variant of the index.
SIP Investments 1 Year 3 Years 5 Years 10 Years7 Years Since Inception
Total Amount Invested (`) 1,20,000 3,60,000
1,13,799 4,06,427
-9.48 8.05
-8.39 12.13
-2.17 18.06
6,00,000 - 8,60,000
Market Value as on May 31, 2022 (`) 6,86,062 - 10,41,011
Returns (CAGR) (%) 5.31 - 5.25
First Tier Benchmark Returns (CAGR) (%) #
Additional Benchmark Returns (CAGR) (%) ##
11.79
14.59
-
-
13.53
13.86
SIP PERFORMANCE
13
Load Structure:
Entry Load - NIL
Exit Load
Ÿ 12% of the units allotted shall be redeemed or switched out without any exit load, on or before completion of 12 months from the date of allotment of units.
Ÿ 1% on remaining units if redeemed or switched out on or before completion of 12 months from the date of allotment of units.
Ÿ Nil, if redeemed or switched out after completion of 12 months from the date of allotment of units.
72.05%
20.49%
Banks
Finance
5.10%Insurance
Equity Holdings
Banks
ICICI Bank Ltd.
HDFC Bank Ltd.
State Bank of India
Axis Bank Ltd.
City Union Bank Ltd.
The Federal Bank Ltd.
Kotak Mahindra Bank Ltd.
Karur Vysya Bank Ltd.
Bank of Baroda
Finance
Housing Development Finance Corp Ltd.
SBI Cards & Payment Services Ltd.
Sundaram Finance Ltd.
Piramal Enterprises Ltd.
Shriram Transport Finance Company Ltd.
MAS Financial Services Ltd.
Bajaj Finance Ltd.
Insurance
ICICI Prudential Life Insurance Co Ltd.
SBI Life Insurance Company Ltd.
Life Insurance Corporation of India
Equity Holdings Total
Cash & Other Receivables Total
Grand Total
72.05%
18.57%
18.31%
9.06%
8.91%
5.19%
3.57%
2.89%
2.87%
2.68%
20.49%
7.73%
2.80%
2.30%
2.20%
2.09%
1.81%
1.55%
5.10%
2.69%
2.01%
0.40%
97.63%
2.37%
100.00%
Top 10 holdings
8,40,000
10,15,398
5.34
13.60
14.02
Factsheet May, 2022
stAbove returns are as on 31 May, 2022. Past performance may or may not be sustained in the future. # NIFTY 50 TRI, ## S&P BSE SENSEX TRI. Assuming ̀ 10,000/- invested
systematically on the first Business Day of every month over a period of time. CAGR returns are computed after accounting for the cash by using XIRR method (investment
internal rate of return) for Regular Plan - Growth Option. Load is not taken into consideration for computation of performance. The above investment simulation is for illustrative
purpose only and should not be construed as a promise on minimum returns and safeguard of capital. The Mutual Fund is not guaranteeing or promising or forecasting any
returns. Since inception returns are assumed to be starting from the beginning of the subsequent month from the date of inception. The performance of the scheme is
benchmarked to the Total Return variant of the index.
The main investment objective of the fund is to generate returns commensurate with the performance of the
index Nifty based on the plans by investing in the respective index stocks subject to tracking errors. However,
there is no assurance that the investment objective of the Schemes will be realized.
SIP Investments 1 Year 3 Years 5 Years 7 Years 10 Years Since Inception
Total Amount Invested (`) 1,20,000 3,60,000 6,00,000 8,40,000 12,00,000 23,30,000
14.22
Market Value as on May 31, 2022 (`) 1,17,890 4,59,628 8,35,118 13,13,115 22,30,185 76,56,269
Returns (CAGR) (%) -3.26 16.56 13.20 12.55 11.92 11.05
First Tier Benchmark Returns (CAGR) (%) #
Additional Benchmark Returns (CAGR) (%) ##
-2.17
-1.98
18.06
17.45
14.59 14.02
14.79 14.34
13.42 13.85
13.65
SCHEME FEATURES INVESTMENT OBJECTIVE
PORTFOLIO AS ON 31.05.2022
SCHEME PERFORMANCE
SIP PERFORMANCE
Company % of NAV Company % of NAV
SECTOR ALLOCATION (% of NAV)
Scheme NIFTY 50 TRI* NIFTY 50 TRI*S&P BSE Sensex TRI** S&P BSE Sensex TRI**Scheme
1 Year 6.71 7.90 8.39 10,671 10,790 10,839
3 Years 11.74 13.03 13.22 13,956 14,447 14,518
5 Years 11.48 12.97 13.69 17,225 18,403 18,997
Since Inception 12.57 16.81 17.42 1,00,688 2,06,846 2,28,859
PeriodCAGR (%)
Value of lumpsum investment of ` 10,000/- invested on inception date
stAbove returns are as on 31 May, 2022. Different plans shall have a different expense structure. The performance details provided herein are of Regular plan - Growth option.
thMr. Jaiprakash Toshniwal is managing the above scheme from 6 September 2021 and total no. of schemes managed by him is 7. Past performance may or may not be
sustained in the future. Load is not taken into consideration for computation of performance. The Mutual Fund is not guaranteeing or promising or forecasting any returns. *First
Tier Benchmark, **Additional Benchmark. The performance of the scheme is benchmarked to the Total Return variant of the index. For detailed disclaimer, please refer page no
36.
Scheme Type: An open ended scheme replicating/tracking Nifty 50 Index
Inception/Allotment Date: December 05, 2002
Fund Size:
AUM as on 31/05/2022: ` 53.53 Cr
: 51.36 CrAverage AUM for May 2022 `
Load Structure:Entry Load: NilExit Load: • 0.25% if redeemed or switch out on or before completion of 7 Days from the date of allotment of units• Nil after 7 days
First Tier Benchmark: Nifty 50 TRI
Minimum Investment (lumpsum): ` 5,000/-
Fund Manager:Name: M . r Jaiprakash ToshniwalTotal Experience: years12+
NAV as on May 31, 2022:NAV Regular Plan Direct PlanGrowth ` 91.3805 ` 96.0573
IDCW ` 33.7098 ` 35.4006
Expense Ratio:Regular: 1.01% Direct: 0.21%(for detailed bifurcation on TER, please see page no 36)
Annual Portfolio Turnover Ratio: 0.39 times
Risk Measures:Tracking Error 0.32%
14
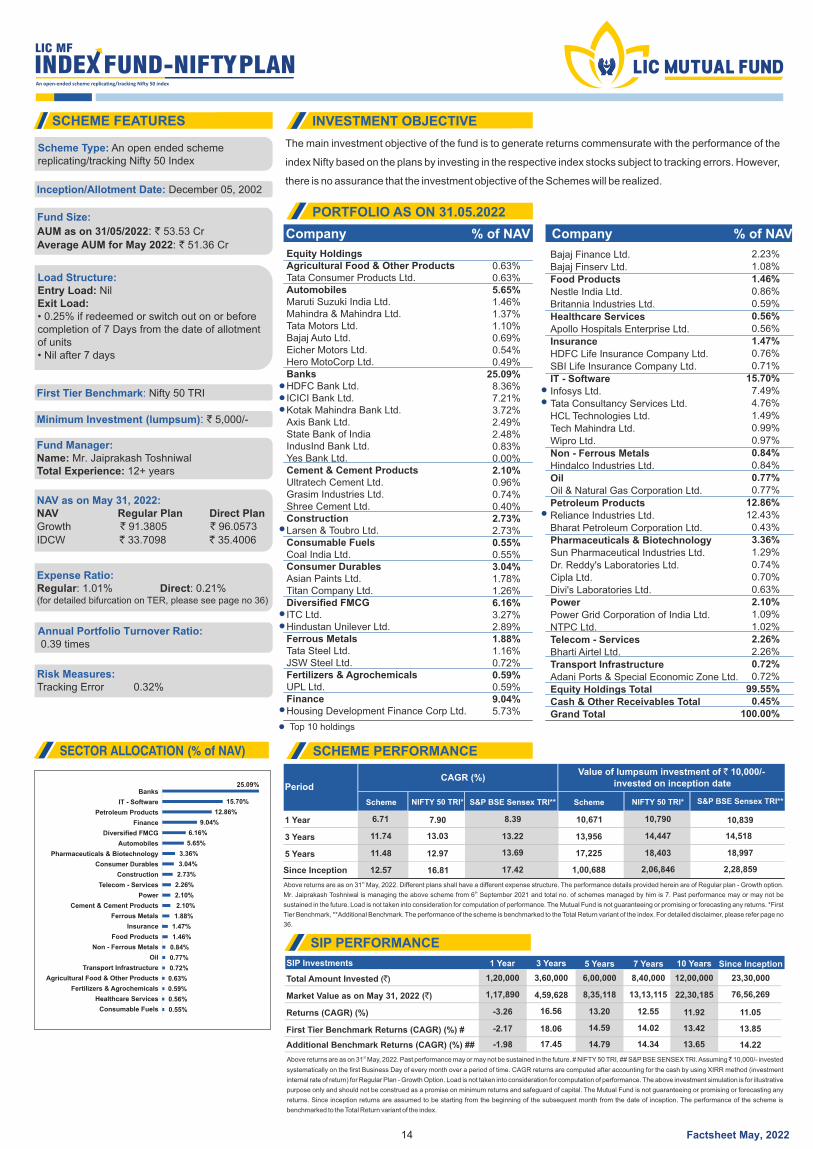
Equity HoldingsAgricultural Food & Other ProductsTata Consumer Products Ltd.AutomobilesMaruti Suzuki India Ltd.Mahindra & Mahindra Ltd.Tata Motors Ltd.Bajaj Auto Ltd.Eicher Motors Ltd.Hero MotoCorp Ltd.BanksHDFC Bank Ltd.ICICI Bank Ltd.Kotak Mahindra Bank Ltd.Axis Bank Ltd.State Bank of IndiaIndusInd Bank Ltd.Yes Bank Ltd.Cement & Cement ProductsUltratech Cement Ltd.Grasim Industries Ltd.Shree Cement Ltd.ConstructionLarsen & Toubro Ltd.Consumable FuelsCoal India Ltd.Consumer DurablesAsian Paints Ltd.Titan Company Ltd.Diversified FMCGITC Ltd.Hindustan Unilever Ltd.Ferrous MetalsTata Steel Ltd.JSW Steel Ltd.Fertilizers & AgrochemicalsUPL Ltd.FinanceHousing Development Finance Corp Ltd.
0.63%0.63%5.65%1.46%1.37%1.10%0.69%0.54%0.49%
25.09%8.36%7.21%3.72%2.49%2.48%0.83%0.00%2.10%0.96%0.74%0.40%2.73%2.73%0.55%0.55%3.04%1.78%1.26%6.16%3.27%2.89%1.88%1.16%0.72%0.59%0.59%9.04%5.73%
Bajaj Finance Ltd.Bajaj Finserv Ltd.Food ProductsNestle India Ltd.Britannia Industries Ltd.Healthcare ServicesApollo Hospitals Enterprise Ltd.InsuranceHDFC Life Insurance Company Ltd.SBI Life Insurance Company Ltd.IT - SoftwareInfosys Ltd.Tata Consultancy Services Ltd.HCL Technologies Ltd.Tech Mahindra Ltd.Wipro Ltd.Non - Ferrous MetalsHindalco Industries Ltd.OilOil & Natural Gas Corporation Ltd.Petroleum ProductsReliance Industries Ltd.Bharat Petroleum Corporation Ltd.Pharmaceuticals & BiotechnologySun Pharmaceutical Industries Ltd.Dr. Reddy's Laboratories Ltd.Cipla Ltd.Divi's Laboratories Ltd.PowerPower Grid Corporation of India Ltd.NTPC Ltd.Telecom - ServicesBharti Airtel Ltd.Transport InfrastructureAdani Ports & Special Economic Zone Ltd.Equity Holdings TotalCash & Other Receivables TotalGrand Total
2.23%1.08%1.46%0.86%0.59%0.56%0.56%1.47%0.76%0.71%
15.70%7.49%4.76%1.49%0.99%0.97%0.84%0.84%0.77%0.77%
12.86%12.43%
0.43%3.36%1.29%0.74%0.70%0.63%2.10%1.09%1.02%2.26%2.26%0.72%0.72%
99.55%0.45%
100.00%
Top 10 holdings
25.09%
15.70%
12.86%
9.04%
6.16%
5.65%
3.36%
3.04%
2.73%
2.26%
2.10%
2.10%
1.88%
1.47%
1.46%
0.84%
0.77%
0.72%
0.63%
0.59%
0.56%
0.55%
Banks
IT - Software
Petroleum Products
Finance
Diversified FMCG
Automobiles
Pharmaceuticals & Biotechnology
Consumer Durables
Construction
Telecom - Services
Power
Cement & Cement Products
Ferrous Metals
Insurance
Food Products
Non - Ferrous Metals
Oil
Transport Infrastructure
Agricultural Food & Other Products
Fertilizers & Agrochemicals
Healthcare Services
Consumable Fuels
Factsheet May, 2022
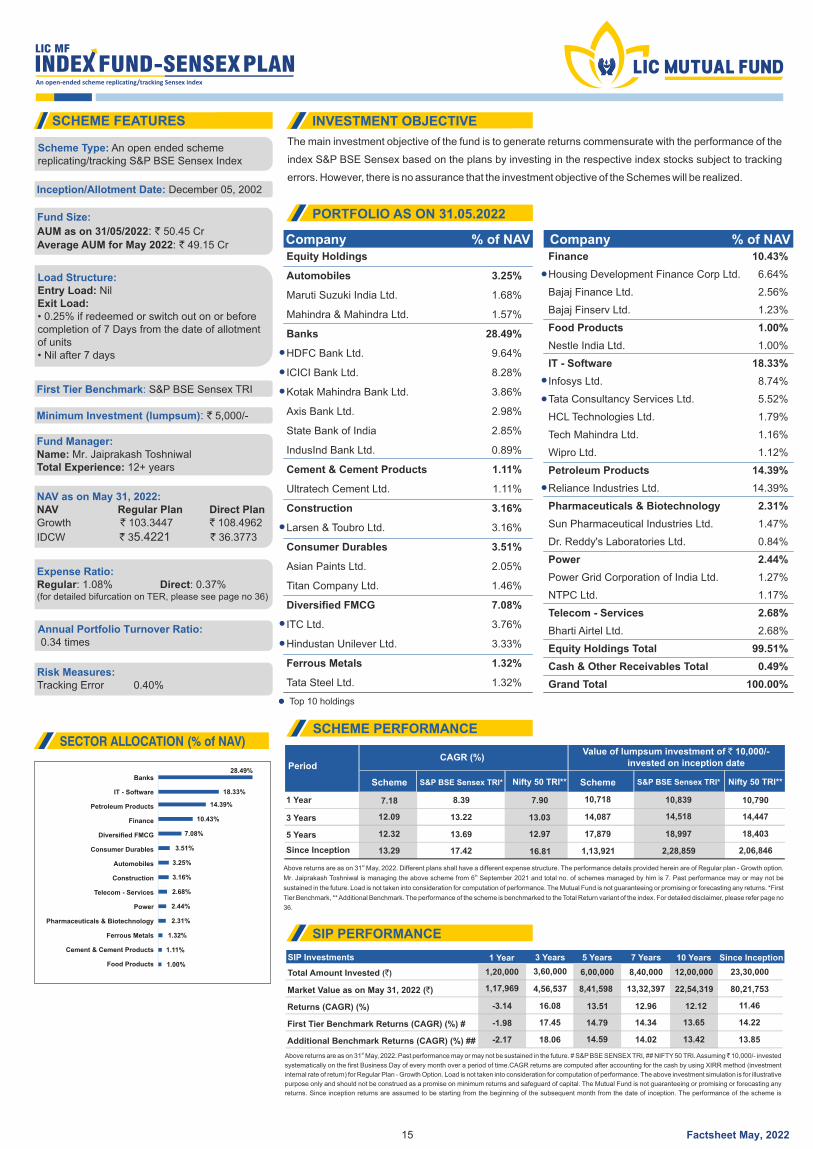
stAbove returns are as on 31 May, 2022. Past performance may or may not be sustained in the future. # S&P BSE SENSEX TRI, ## NIFTY 50 TRI. Assuming ̀ 10,000/- invested
systematically on the first Business Day of every month over a period of time.CAGR returns are computed after accounting for the cash by using XIRR method (investment
internal rate of return) for Regular Plan - Growth Option. Load is not taken into consideration for computation of performance. The above investment simulation is for illustrative
purpose only and should not be construed as a promise on minimum returns and safeguard of capital. The Mutual Fund is not guaranteeing or promising or forecasting any
returns. Since inception returns are assumed to be starting from the beginning of the subsequent month from the date of inception. The performance of the scheme is
The main investment objective of the fund is to generate returns commensurate with the performance of the
index S&P BSE Sensex based on the plans by investing in the respective index stocks subject to tracking
errors. However, there is no assurance that the investment objective of the Schemes will be realized.
SIP Investments 1 Year 3 Years 5 Years 7 Years 10 Years Since Inception
Total Amount Invested ( )` 1,20,000 3,60,000 6,00,000 8,40,000 12,00,000 23,30,000
14.22
Market Value as on May 31, 2022 (`) 1,17,969 4,56,537 8,41,598 13,32,397 22,54,319 80,21,753
Returns (CAGR) (%) -3.14 16.08 13.51 12.96 12.12 11.46
First Tier Benchmark Returns (CAGR) (%) #
Additional Benchmark Returns (CAGR) (%) ##
-1.98
-2.17
17.45
18.06
14.79 14.34
14.59 14.02
13.65
13.8513.42
SCHEME FEATURES INVESTMENT OBJECTIVE
PORTFOLIO AS ON 31.05.2022
SCHEME PERFORMANCE
SIP PERFORMANCE
Company % of NAV Company % of NAV
SECTOR ALLOCATION (% of NAV)
Scheme S&P BSE Sensex TRI* S&P BSE Sensex TRI*Nifty 50 TRI** Nifty 50 TRI**Scheme
1 Year 7.18 8.39 7.90 10,718 10,839 10,790
3 Years 12.09 13.22 13.03 14,087 14,518 14,447
5 Years
Since Inception
12.32 13.69 12.97 17,879 18,997 18,403
13.29 17.42 16.81 1,13,921 2,28,859 2,06,846
PeriodCAGR (%)
Value of lumpsum investment of ` 10,000/-invested on inception date
stAbove returns are as on 31 May, 2022. Different plans shall have a different expense structure. The performance details provided herein are of Regular plan - Growth option.
thMr. Jaiprakash Toshniwal is managing the above scheme from 6 September 2021 and total no. of schemes managed by him is 7. Past performance may or may not be
sustained in the future. Load is not taken into consideration for computation of performance. The Mutual Fund is not guaranteeing or promising or forecasting any returns. *First
Tier Benchmark, ** Additional Benchmark. The performance of the scheme is benchmarked to the Total Return variant of the index. For detailed disclaimer, please refer page no
36.
Scheme Type: An open ended scheme replicating/tracking S&P BSE Sensex Index
Inception/Allotment Date: December 05, 2002
Fund Size:
AUM as on 31/05/2022: ` 50.45 Cr
: 49.15 CrAverage AUM for May 2022 `
Load Structure:Entry Load: NilExit Load: • 0.25% if redeemed or switch out on or before completion of 7 Days from the date of allotment of units• Nil after 7 days
First Tier Benchmark: S&P BSE Sensex TRI
Minimum Investment (lumpsum): ` 5,000/-
Fund Manager:Name: M . r Jaiprakash ToshniwalTotal Experience: years12+
NAV as on May 31, 2022:NAV Regular Plan Direct PlanGrowth ` 103.3447 ` 108.4962
IDCW ` 35.4221 ` 36.3773
Expense Ratio:Regular: 1.08% Direct: 0.37%(for detailed bifurcation on TER, please see page no 36)
Annual Portfolio Turnover Ratio: 0.34 times
Risk Measures:Tracking Error 0.40%
15
28.49%
18.33%
14.39%
10.43%
7.08%
3.51%
3.25%
3.16%
2.68%
2.44%
2.31%
1.32%
1.11%
1.00%
Banks
IT - Software
Petroleum Products
Finance
Diversified FMCG
Consumer Durables
Automobiles
Construction
Telecom - Services
Power
Pharmaceuticals & Biotechnology
Ferrous Metals
Cement & Cement Products
Food Products
Equity Holdings
Automobiles
Maruti Suzuki India Ltd.
Mahindra & Mahindra Ltd.
Banks
HDFC Bank Ltd.
ICICI Bank Ltd.
Kotak Mahindra Bank Ltd.
Axis Bank Ltd.
State Bank of India
IndusInd Bank Ltd.
Cement & Cement Products
Ultratech Cement Ltd.
Construction
Larsen & Toubro Ltd.
Consumer Durables
Asian Paints Ltd.
Titan Company Ltd.
Diversified FMCG
ITC Ltd.
Hindustan Unilever Ltd.
Ferrous Metals
Tata Steel Ltd.
3.25%
1.68%
1.57%
28.49%
9.64%
8.28%
3.86%
2.98%
2.85%
0.89%
1.11%
1.11%
3.16%
3.16%
3.51%
2.05%
1.46%
7.08%
3.76%
3.33%
1.32%
1.32%
Finance
Housing Development Finance Corp Ltd.
Bajaj Finance Ltd.
Bajaj Finserv Ltd.
Food Products
Nestle India Ltd.
IT - Software
Infosys Ltd.
Tata Consultancy Services Ltd.
HCL Technologies Ltd.
Tech Mahindra Ltd.
Wipro Ltd.
Petroleum Products
Reliance Industries Ltd.
Pharmaceuticals & Biotechnology
Sun Pharmaceutical Industries Ltd.
Dr. Reddy's Laboratories Ltd.
Power
Power Grid Corporation of India Ltd.
NTPC Ltd.
Telecom - Services
Bharti Airtel Ltd.
Equity Holdings Total
Cash & Other Receivables Total
Grand Total
10.43%
6.64%
2.56%
1.23%
1.00%
1.00%
18.33%
8.74%
5.52%
1.79%
1.16%
1.12%
14.39%
14.39%
2.31%
1.47%
0.84%
2.44%
1.27%
1.17%
2.68%
2.68%
99.51%
0.49%
100.00%
Top 10 holdings
Factsheet May, 2022
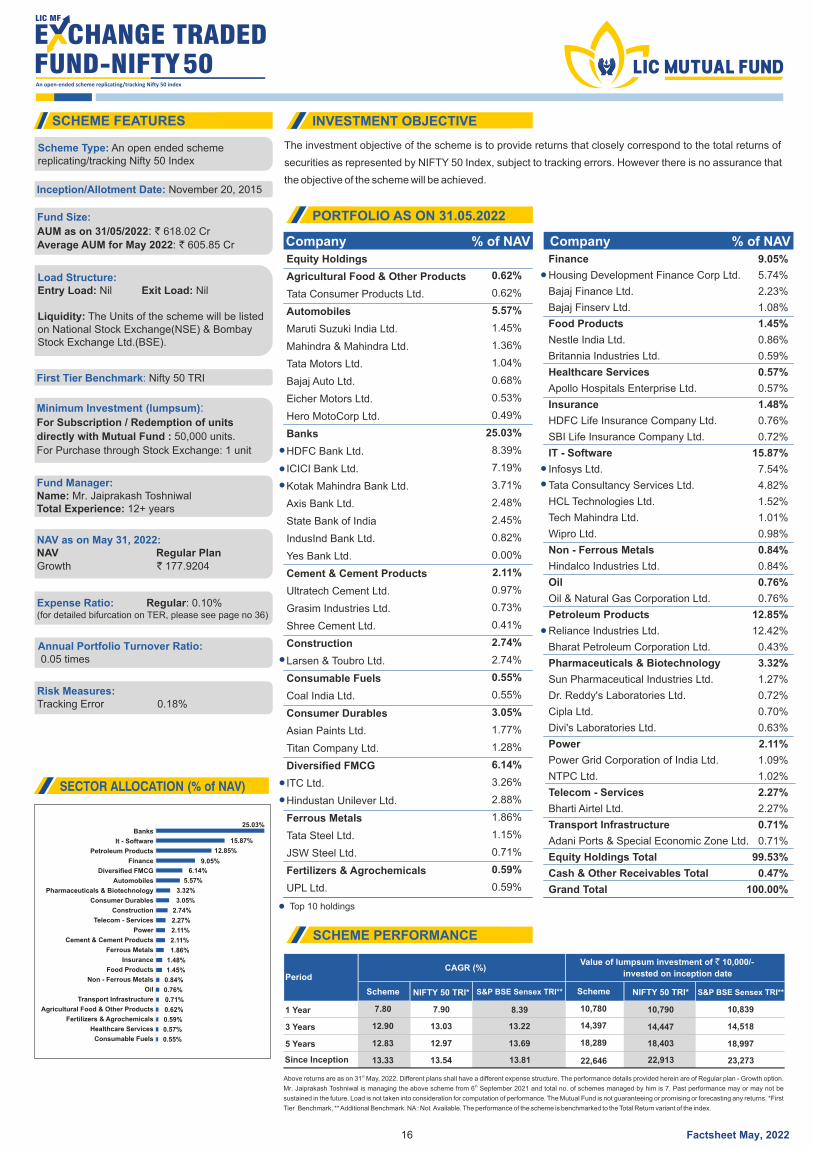
The investment objective of the scheme is to provide returns that closely correspond to the total returns of
securities as represented by NIFTY 50 Index, subject to tracking errors. However there is no assurance that
the objective of the scheme will be achieved.
SCHEME FEATURES INVESTMENT OBJECTIVE
PORTFOLIO AS ON 31.05.2022
SCHEME PERFORMANCE
Company % of NAV Company % of NAV
SECTOR ALLOCATION (% of NAV)
Scheme NIFTY 50 TRI* NIFTY 50 TRI*S&P BSE Sensex TRI** S&P BSE Sensex TRI**Scheme
1 Year 7.80
12.90
7.90
13.03
8.39
13.22
10,780
14,397
10,790
14,447
10,839
14,5183 Years
12.83 12.97 13.69 18,289 18,403 18,997 5 Years
Since Inception 13.33 13.54 13.81 22,646 22,913 23,273
PeriodCAGR (%)
Value of lumpsum investment of ` 10,000/-
invested on inception date
stAbove returns are as on 31 May, 2022. Different plans shall have a different expense structure. The performance details provided herein are of Regular plan - Growth option. thMr. Jaiprakash Toshniwal is managing the above scheme from 6 September 2021 and total no. of schemes managed by him is 7. Past performance may or may not be
sustained in the future. Load is not taken into consideration for computation of performance. The Mutual Fund is not guaranteeing or promising or forecasting any returns. *First
Tier Benchmark, ** Additional Benchmark. NA : Not Available. The performance of the scheme is benchmarked to the Total Return variant of the index.
Scheme Type: An open ended scheme replicating/tracking Nifty 50 Index
Inception/Allotment Date: November 20, 2015
Fund Size:
AUM as on 31/05/2022: ` 618.02 Cr
: 605.85 CrAverage AUM for May 2022 `
Load Structure:Entry Load: Exit Load: Nil Nil
Liquidity: The Units of the scheme will be listed on National Stock Exchange(NSE) & Bombay Stock Exchange Ltd.(BSE).
First Tier Benchmark: Nifty 50 TRI
Minimum Investment (lumpsum): For Subscription / Redemption of units
directly with Mutual Fund : 50,000 units.
For Purchase through Stock Exchange: 1 unit
Fund Manager:Name: M . r Jaiprakash ToshniwalTotal Experience: years12+
NAV as on May 31, 2022:NAV Regular Plan Growth ` 177.9204
Expense Ratio: Regular: 0.10%(for detailed bifurcation on TER, please see page no 36)
Annual Portfolio Turnover Ratio: 0.05 times
Risk Measures:Tracking Error 0.18%
16
Equity Holdings
Agricultural Food & Other Products
Tata Consumer Products Ltd.
Automobiles
Maruti Suzuki India Ltd.
Mahindra & Mahindra Ltd.
Tata Motors Ltd.
Bajaj Auto Ltd.
Eicher Motors Ltd.
Hero MotoCorp Ltd.
Banks
HDFC Bank Ltd.
ICICI Bank Ltd.
Kotak Mahindra Bank Ltd.
Axis Bank Ltd.
State Bank of India
IndusInd Bank Ltd.
Yes Bank Ltd.
Cement & Cement Products
Ultratech Cement Ltd.
Grasim Industries Ltd.
Shree Cement Ltd.
Construction
Larsen & Toubro Ltd.
Consumable Fuels
Coal India Ltd.
Consumer Durables
Asian Paints Ltd.
Titan Company Ltd.
Diversified FMCG
ITC Ltd.
Hindustan Unilever Ltd.
Ferrous Metals
Tata Steel Ltd.
JSW Steel Ltd.
Fertilizers & Agrochemicals
UPL Ltd.
0.62%
0.62%
5.57%
1.45%
1.36%
1.04%
0.68%
0.53%
0.49%
25.03%
8.39%
7.19%
3.71%
2.48%
2.45%
0.82%
0.00%
2.11%
0.97%
0.73%
0.41%
2.74%
2.74%
0.55%
0.55%
3.05%
1.77%
1.28%
6.14%
3.26%
2.88%
1.86%
1.15%
0.71%
0.59%
0.59%
Finance
Housing Development Finance Corp Ltd.
Bajaj Finance Ltd.
Bajaj Finserv Ltd.
Food Products
Nestle India Ltd.
Britannia Industries Ltd.
Healthcare Services
Apollo Hospitals Enterprise Ltd.
Insurance
HDFC Life Insurance Company Ltd.
SBI Life Insurance Company Ltd.
IT - Software
Infosys Ltd.
Tata Consultancy Services Ltd.
HCL Technologies Ltd.
Tech Mahindra Ltd.
Wipro Ltd.
Non - Ferrous Metals
Hindalco Industries Ltd.
Oil
Oil & Natural Gas Corporation Ltd.
Petroleum Products
Reliance Industries Ltd.
Bharat Petroleum Corporation Ltd.
Pharmaceuticals & Biotechnology
Sun Pharmaceutical Industries Ltd.
Dr. Reddy's Laboratories Ltd.
Cipla Ltd.
Divi's Laboratories Ltd.
Power
Power Grid Corporation of India Ltd.
NTPC Ltd.
Telecom - Services
Bharti Airtel Ltd.
Transport Infrastructure
Adani Ports & Special Economic Zone Ltd.
Equity Holdings Total
Cash & Other Receivables Total
Grand Total
9.05%
5.74%
2.23%
1.08%
1.45%
0.86%
0.59%
0.57%
0.57%
1.48%
0.76%
0.72%
15.87%
7.54%
4.82%
1.52%
1.01%
0.98%
0.84%
0.84%
0.76%
0.76%
12.85%
12.42%
0.43%
3.32%
1.27%
0.72%
0.70%
0.63%
2.11%
1.09%
1.02%
2.27%
2.27%
0.71%
0.71%
99.53%
0.47%
100.00%
Top 10 holdings
25.03%
15.87%
12.85%
9.05%
6.14%
5.57%
3.32%
3.05%
2.74%
2.27%
2.11%
2.11%
1.86%
1.48%
1.45%
0.84%
0.76%
0.71%
0.62%
0.59%
0.57%
0.55%
Banks
It - Software
Petroleum Products
Finance
Diversified FMCG
Automobiles
Pharmaceuticals & Biotechnology
Consumer Durables
Construction
Telecom - Services
Power
Cement & Cement Products
Ferrous Metals
Insurance
Food Products
Non - Ferrous Metals
Oil
Transport Infrastructure
Agricultural Food & Other Products
Fertilizers & Agrochemicals
Healthcare Services
Consumable Fuels
Factsheet May, 2022
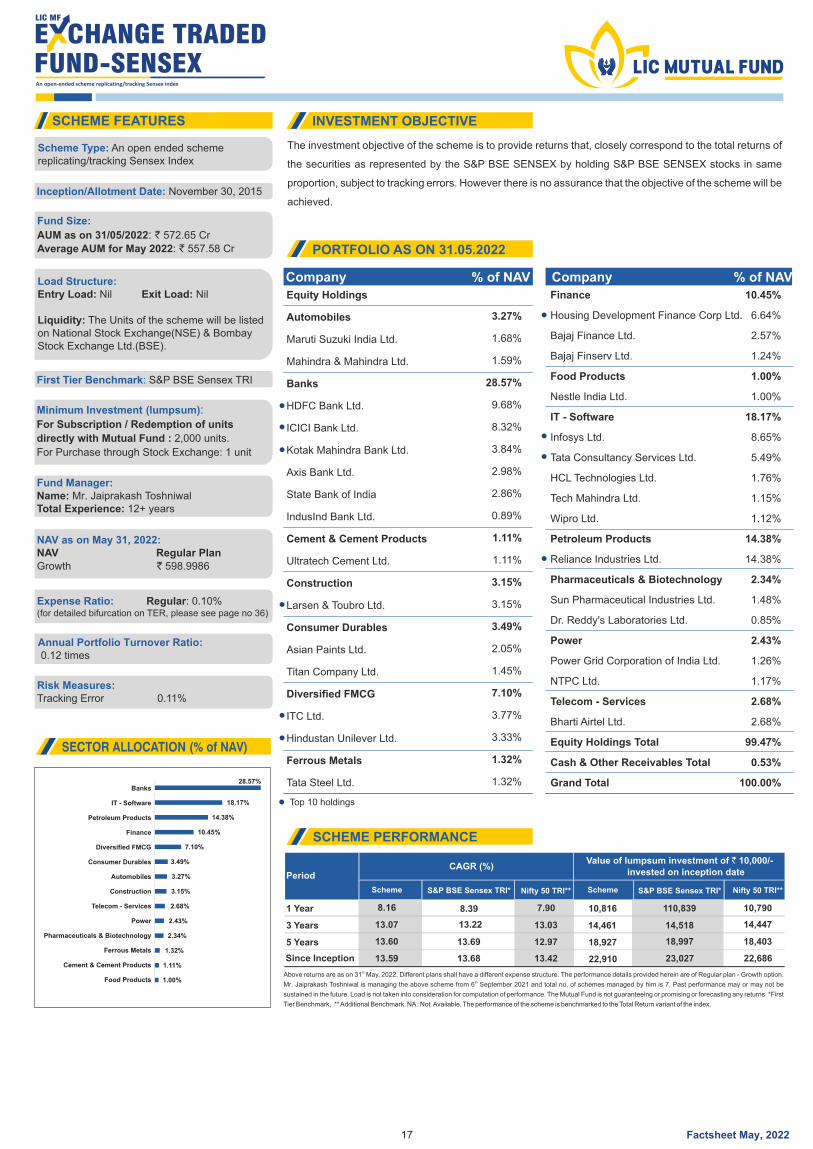
The investment objective of the scheme is to provide returns that, closely correspond to the total returns of
the securities as represented by the S&P BSE SENSEX by holding S&P BSE SENSEX stocks in same
proportion, subject to tracking errors. However there is no assurance that the objective of the scheme will be
achieved.
SCHEME FEATURES INVESTMENT OBJECTIVE
PORTFOLIO AS ON 31.05.2022
SCHEME PERFORMANCE
Company % of NAV Company % of NAV
SECTOR ALLOCATION (% of NAV)
Scheme S&P BSE Sensex TRI* S&P BSE Sensex TRI*Nifty 50 TRI** Nifty 50 TRI**Scheme
1 Year 8.16 8.39 7.90 10,816
14,461
110,839
14,518
10,790
14,4473 Years 13.07 13.22 13.03
13.60 13.69 12.97 18,927 18,997 18,403 5 Years
Since Inception 13.59 13.68 13.42 22,910 23,027 22,686
PeriodCAGR (%)
Value of lumpsum investment of ` 10,000/-invested on inception date
stAbove returns are as on 31 May, 2022. Different plans shall have a different expense structure. The performance details provided herein are of Regular plan - Growth option.
thMr. Jaiprakash Toshniwal is managing the above scheme from 6 September 2021 and total no. of schemes managed by him is 7. Past performance may or may not be
sustained in the future. Load is not taken into consideration for computation of performance. The Mutual Fund is not guaranteeing or promising or forecasting any returns. *First
Tier Benchmark, ** Additional Benchmark. NA : Not Available. The performance of the scheme is benchmarked to the Total Return variant of the index.
Scheme Type: An open ended scheme replicating/tracking Sensex Index
Inception/Allotment Date: November 30, 2015
Fund Size:
AUM as on 31/05/2022: ` 572.65 Cr
: 557.58 CrAverage AUM for May 2022 `
Load Structure:Entry Load: Exit Load: Nil Nil
Liquidity: The Units of the scheme will be listed on National Stock Exchange(NSE) & Bombay Stock Exchange Ltd.(BSE).
First Tier Benchmark: S&P BSE Sensex TRI
Minimum Investment (lumpsum): For Subscription / Redemption of units
directly with Mutual Fund : ,000 units.2
For Purchase through Stock Exchange: 1 unit
Fund Manager:Name: M . r Jaiprakash ToshniwalTotal Experience: years12+
NAV as on May 31, 2022:NAV Regular Plan Growth ` 598.9986
Expense Ratio: Regular: 0.10%(for detailed bifurcation on TER, please see page no 36)
Annual Portfolio Turnover Ratio: 0.12 times
Risk Measures:Tracking Error 0.11%
17
28.57%
18.17%
14.38%
10.45%
7.10%
3.49%
3.27%
3.15%
2.68%
2.43%
2.34%
1.32%
1.11%
1.00%
Banks
IT - Software
Petroleum Products
Finance
Diversified FMCG
Consumer Durables
Automobiles
Construction
Telecom - Services
Power
Pharmaceuticals & Biotechnology
Ferrous Metals
Cement & Cement Products
Food Products
Equity Holdings
Automobiles
Maruti Suzuki India Ltd.
Mahindra & Mahindra Ltd.
Banks
HDFC Bank Ltd.
ICICI Bank Ltd.
Kotak Mahindra Bank Ltd.
Axis Bank Ltd.
State Bank of India
IndusInd Bank Ltd.
Cement & Cement Products
Ultratech Cement Ltd.
Construction
Larsen & Toubro Ltd.
Consumer Durables
Asian Paints Ltd.
Titan Company Ltd.
Diversified FMCG
ITC Ltd.
Hindustan Unilever Ltd.
Ferrous Metals
Tata Steel Ltd.
3.27%
1.68%
1.59%
28.57%
9.68%
8.32%
3.84%
2.98%
2.86%
0.89%
1.11%
1.11%
3.15%
3.15%
3.49%
2.05%
1.45%
7.10%
3.77%
3.33%
1.32%
1.32%
Finance
Housing Development Finance Corp Ltd.
Bajaj Finance Ltd.
Bajaj Finserv Ltd.
Food Products
Nestle India Ltd.
IT - Software
Infosys Ltd.
Tata Consultancy Services Ltd.
HCL Technologies Ltd.
Tech Mahindra Ltd.
Wipro Ltd.
Petroleum Products
Reliance Industries Ltd.
Pharmaceuticals & Biotechnology
Sun Pharmaceutical Industries Ltd.
Dr. Reddy's Laboratories Ltd.
Power
Power Grid Corporation of India Ltd.
NTPC Ltd.
Telecom - Services
Bharti Airtel Ltd.
Equity Holdings Total
Cash & Other Receivables Total
Grand Total
10.45%
6.64%
2.57%
1.24%
1.00%
1.00%
18.17%
8.65%
5.49%
1.76%
1.15%
1.12%
14.38%
14.38%
2.34%
1.48%
0.85%
2.43%
1.26%
1.17%
2.68%
2.68%
99.47%
0.53%
100.00%
Top 10 holdings
Factsheet May, 2022
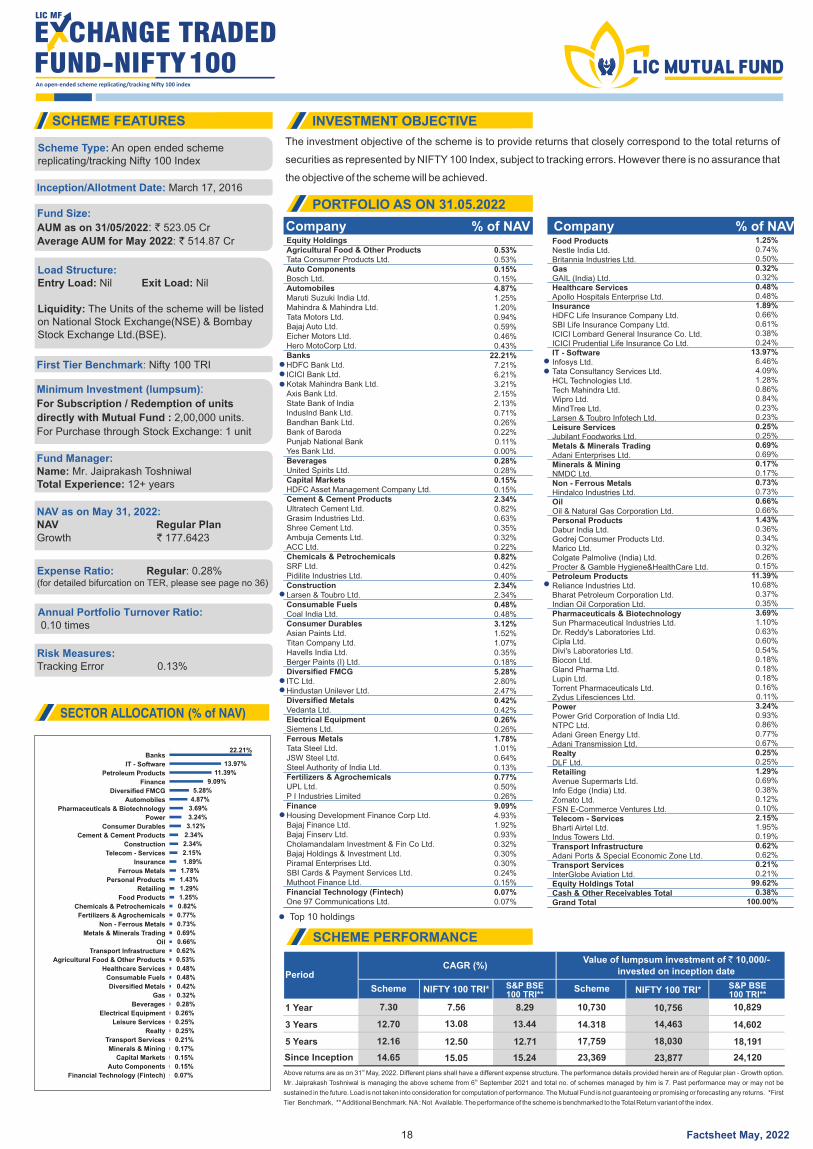
The investment objective of the scheme is to provide returns that closely correspond to the total returns of
securities as represented by NIFTY 100 Index, subject to tracking errors. However there is no assurance that
the objective of the scheme will be achieved.
SCHEME FEATURES INVESTMENT OBJECTIVE
PORTFOLIO AS ON 31.05.2022
SCHEME PERFORMANCE
Company % of NAV Company % of NAV
SECTOR ALLOCATION (% of NAV)
Scheme NIFTY 100 TRI* NIFTY 100 TRI*S&P BSE100 TRI**
Scheme
1 Year 7.30
12.70
7.56
13.08
8.29
13.44
10,730
14.318
10,756
14,463
10,829
14,6023 Years
12.16 12.50 12.71 17,759 18,030 18,191 5 Years
Since Inception 14.65 15.05 15.24 23,369 23,877 24,120
PeriodCAGR (%)
stAbove returns are as on 31 May, 2022. Different plans shall have a different expense structure. The performance details provided herein are of Regular plan - Growth option.
thMr. Jaiprakash Toshniwal is managing the above scheme from 6 September 2021 and total no. of schemes managed by him is 7. Past performance may or may not be
sustained in the future. Load is not taken into consideration for computation of performance. The Mutual Fund is not guaranteeing or promising or forecasting any returns. *First
Tier Benchmark, ** Additional Benchmark. NA : Not Available. The performance of the scheme is benchmarked to the Total Return variant of the index.
Scheme Type: An open ended scheme replicating/tracking Nifty 100 Index
Inception/Allotment Date: March 17, 2016
Fund Size:
AUM as on 31/05/2022: ` 523.05 Cr
: 514.87 CrAverage AUM for May 2022 `
Load Structure:Entry Load: Exit Load: Nil Nil
Liquidity: The Units of the scheme will be listed on National Stock Exchange(NSE) & Bombay Stock Exchange Ltd.(BSE).
First Tier Benchmark: Nifty 100 TRI
Minimum Investment (lumpsum): For Subscription / Redemption of units
directly with Mutual Fund : 0,000 units.2,0
For Purchase through Stock Exchange: 1 unit
Fund Manager:Name: M . r Jaiprakash ToshniwalTotal Experience: years12+
NAV as on May 31, 2022:NAV Regular Plan Growth ` 177.6423
Expense Ratio: Regular: 0.28%(for detailed bifurcation on TER, please see page no 36)
Annual Portfolio Turnover Ratio: 0.10 times
Risk Measures:Tracking Error 0.13%
18
S&P BSE100 TRI**
Equity HoldingsAgricultural Food & Other ProductsTata Consumer Products Ltd.Auto ComponentsBosch Ltd.AutomobilesMaruti Suzuki India Ltd.Mahindra & Mahindra Ltd.Tata Motors Ltd.Bajaj Auto Ltd.Eicher Motors Ltd.Hero MotoCorp Ltd.BanksHDFC Bank Ltd.ICICI Bank Ltd.Kotak Mahindra Bank Ltd.Axis Bank Ltd.State Bank of IndiaIndusInd Bank Ltd.Bandhan Bank Ltd.Bank of BarodaPunjab National BankYes Bank Ltd.BeveragesUnited Spirits Ltd.Capital MarketsHDFC Asset Management Company Ltd.Cement & Cement ProductsUltratech Cement Ltd.Grasim Industries Ltd.Shree Cement Ltd.Ambuja Cements Ltd.ACC Ltd.Chemicals & PetrochemicalsSRF Ltd.Pidilite Industries Ltd.ConstructionLarsen & Toubro Ltd.Consumable FuelsCoal India Ltd.Consumer DurablesAsian Paints Ltd.Titan Company Ltd.Havells India Ltd.Berger Paints (I) Ltd.Diversified FMCGITC Ltd.Hindustan Unilever Ltd.Diversified MetalsVedanta Ltd.Electrical EquipmentSiemens Ltd.Ferrous MetalsTata Steel Ltd.JSW Steel Ltd.Steel Authority of India Ltd.Fertilizers & AgrochemicalsUPL Ltd.P I Industries LimitedFinanceHousing Development Finance Corp Ltd.Bajaj Finance Ltd.Bajaj Finserv Ltd.Cholamandalam Investment & Fin Co Ltd.Bajaj Holdings & Investment Ltd.Piramal Enterprises Ltd.SBI Cards & Payment Services Ltd.Muthoot Finance Ltd.Financial Technology (Fintech)One 97 Communications Ltd.
0.53%0.53%0.15%0.15%4.87%1.25%1.20%0.94%0.59%0.46%0.43%
22.21%7.21%6.21%3.21%2.15%2.13%0.71%0.26%0.22%0.11%0.00%0.28%0.28%0.15%0.15%2.34%0.82%0.63%0.35%0.32%0.22%0.82%0.42%0.40%2.34%2.34%0.48%0.48%3.12%1.52%1.07%0.35%0.18%5.28%2.80%2.47%0.42%0.42%0.26%0.26%1.78%1.01%0.64%0.13%0.77%0.50%0.26%9.09%4.93%1.92%0.93%0.32%0.30%0.30%0.24%0.15%0.07%0.07%
Food ProductsNestle India Ltd.Britannia Industries Ltd.GasGAIL (India) Ltd.Healthcare ServicesApollo Hospitals Enterprise Ltd.InsuranceHDFC Life Insurance Company Ltd.SBI Life Insurance Company Ltd.ICICI Lombard General Insurance Co. Ltd.ICICI Prudential Life Insurance Co Ltd.IT - SoftwareInfosys Ltd.Tata Consultancy Services Ltd.HCL Technologies Ltd.Tech Mahindra Ltd.Wipro Ltd.MindTree Ltd.Larsen & Toubro Infotech Ltd.Leisure ServicesJubilant Foodworks Ltd.Metals & Minerals TradingAdani Enterprises Ltd.Minerals & MiningNMDC Ltd.Non - Ferrous MetalsHindalco Industries Ltd.OilOil & Natural Gas Corporation Ltd.Personal ProductsDabur India Ltd.Godrej Consumer Products Ltd.Marico Ltd.Colgate Palmolive (India) Ltd.Procter & Gamble Hygiene&HealthCare Ltd.Petroleum ProductsReliance Industries Ltd.Bharat Petroleum Corporation Ltd.Indian Oil Corporation Ltd.Pharmaceuticals & BiotechnologySun Pharmaceutical Industries Ltd.Dr. Reddy's Laboratories Ltd.Cipla Ltd.Divi's Laboratories Ltd.Biocon Ltd.Gland Pharma Ltd.Lupin Ltd.Torrent Pharmaceuticals Ltd.Zydus Lifesciences Ltd.PowerPower Grid Corporation of India Ltd.NTPC Ltd.Adani Green Energy Ltd.Adani Transmission Ltd.RealtyDLF Ltd.RetailingAvenue Supermarts Ltd.Info Edge (India) Ltd.Zomato Ltd.FSN E-Commerce Ventures Ltd.Telecom - ServicesBharti Airtel Ltd.Indus Towers Ltd.Transport InfrastructureAdani Ports & Special Economic Zone Ltd.Transport ServicesInterGlobe Aviation Ltd.Equity Holdings TotalCash & Other Receivables TotalGrand Total
1.25%0.74%0.50%0.32%0.32%0.48%0.48%1.89%0.66%0.61%0.38%0.24%
13.97%6.46%4.09%1.28%0.86%0.84%0.23%0.23%0.25%0.25%0.69%0.69%0.17%0.17%0.73%0.73%0.66%0.66%1.43%0.36%0.34%0.32%0.26%0.15%
11.39%10.68%
0.37%0.35%3.69%1.10%0.63%0.60%0.54%0.18%0.18%0.18%0.16%0.11%3.24%0.93%0.86%0.77%0.67%0.25%0.25%1.29%0.69%0.38%0.12%0.10%2.15%1.95%0.19%0.62%0.62%0.21%0.21%
99.62%0.38%
100.00%
Top 10 holdings
Value of lumpsum investment of ` 10,000/- invested on inception date
22.21%
13.97%
11.39%
9.09%
5.28%
4.87%
3.69%
3.24%
3.12%
2.34%
2.34%
2.15%
1.89%
1.78%
1.43%
1.29%
1.25%
0.82%
0.77%
0.73%
0.69%
0.66%
0.62%
0.53%
0.48%
0.48%
0.42%
0.32%
0.28%
0.26%
0.25%
0.25%
0.21%
0.17%
0.15%
0.15%
0.07%
Banks
IT - Software
Petroleum Products
Finance
Diversified FMCG
Automobiles
Pharmaceuticals & Biotechnology
Power
Consumer Durables
Cement & Cement Products
Construction
Telecom - Services
Insurance
Ferrous Metals
Personal Products
Retailing
Food Products
Chemicals & Petrochemicals
Fertilizers & Agrochemicals
Non - Ferrous Metals
Metals & Minerals Trading
Oil
Transport Infrastructure
Agricultural Food & Other Products
Healthcare Services
Consumable Fuels
Diversified Metals
Gas
Beverages
Electrical Equipment
Leisure Services
Realty
Transport Services
Minerals & Mining
Capital Markets
Auto Components
Financial Technology (Fintech)
Factsheet May, 2022
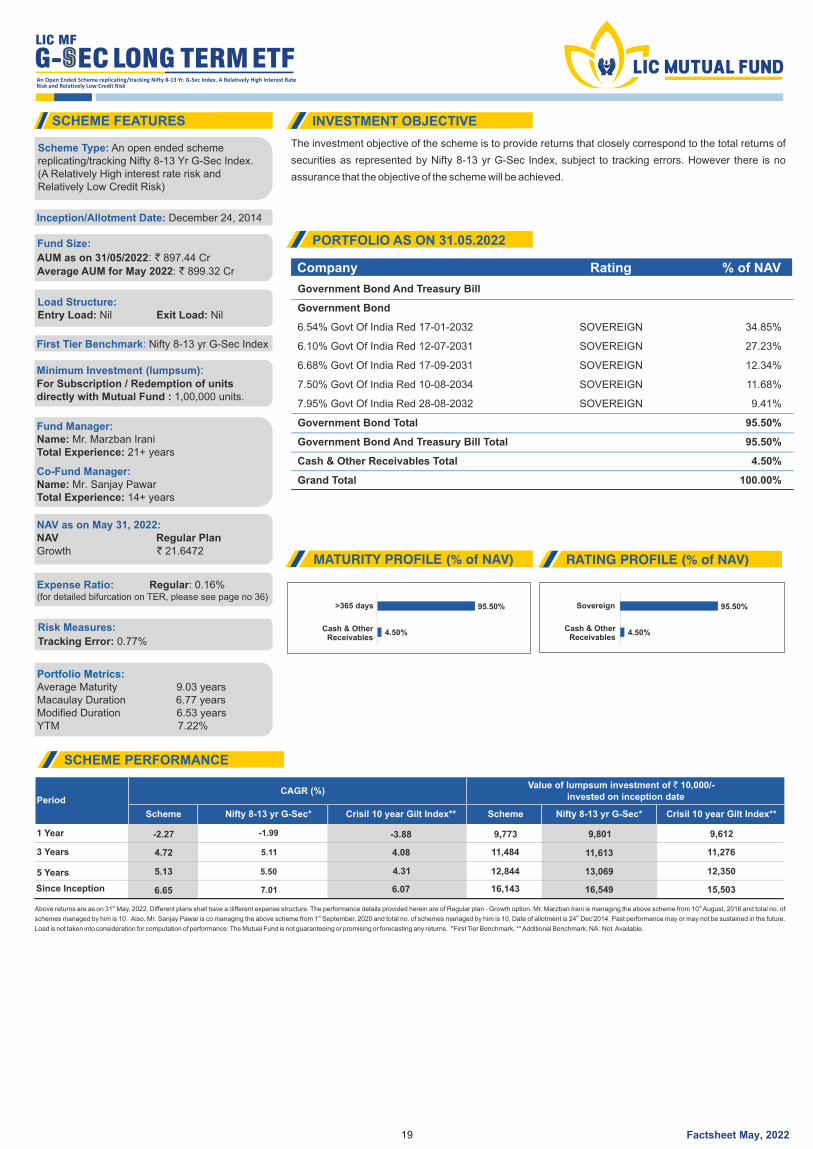
The investment objective of the scheme is to provide returns that closely correspond to the total returns of
securities as represented by Nifty 8-13 yr G-Sec Index, subject to tracking errors. However there is no
assurance that the objective of the scheme will be achieved.
Company Rating % of NAV
95.50%
4.50%
>365 days
Cash & OtherReceivables
SCHEME FEATURES INVESTMENT OBJECTIVE
PORTFOLIO AS ON 31.05.2022
SCHEME PERFORMANCE
MATURITY PROFILE (% of NAV) RATING PROFILE (% of NAV)
Scheme Nifty 8-13 yr G-Sec* Crisil 10 year Gilt Index** Crisil 10 year Gilt Index**Scheme Nifty 8-13 yr G-Sec*
1 Year -2.27 -1.99 -3.88 9,773 9,801 9,612
3 Years 4.72 5.11 4.08 11,484 11,613 11,276
5.13 5.50 4.31 12,844 13,069 12,350 5 Years
Since Inception 6.65 7.01 6.07 16,143 16,549 15,503
PeriodCAGR (%)
Value of lumpsum investment of ` 10,000/- invested on inception date
st thAbove returns are as on 31 May, 2022. Different plans shall have a different expense structure. The performance details provided herein are of Regular plan - Growth option. Mr. Marzban Irani is managing the above scheme from 10 August, 2016 and total no. of
st thschemes managed by him is 10. Also, Mr. Sanjay Pawar is co managing the above scheme from 1 September, 2020 and total no. of schemes managed by him is 10. Date of allotment is 24 Dec'2014. Past performance may or may not be sustained in the future.
Load is not taken into consideration for computation of performance. The Mutual Fund is not guaranteeing or promising or forecasting any returns. *First Tier Benchmark, ** Additional Benchmark. NA : Not Available.
Scheme Type: An open ended scheme replicating/tracking Nifty 8-13 Yr G-Sec Index. (A Relatively High interest rate risk and Relatively Low Credit Risk)
Inception/Allotment Date: December 24, 2014
Fund Size:
AUM as on 31/05/2022: ` 897.44 Cr
: 899.32 CrAverage AUM for May 2022 `
Load Structure:Entry Load: Exit Load: Nil Nil
First Tier Benchmark: Nifty 8-13 yr G-Sec Index
Minimum Investment (lumpsum):For Subscription / Redemption of units directly with Mutual Fund : 1,00,000 units.
Fund Manager:Name: Mr. Marzban IraniTotal Experience: years21+
NAV as on May 31, 2022:NAV Regular Plan Growth ` 21.6472
Expense Ratio: Regular: 0.16%(for detailed bifurcation on TER, please see page no 36)
Risk Measures:
Tracking Error: 0.77%
Portfolio Metrics:Average Maturity 9.03 yearsMacaulay Duration 6.77 yearsModified Duration 6.53 yearsYTM 7.22%
19
Co-Fund Manager:Name: Mr. Sanjay PawarTotal Experience: 14+ years
Sovereign
Cash & OtherReceivables
An Open Ended Scheme replicating/tracking Nifty 8-13 Yr. G-Sec Index. A Relatively High Interest Rate Risk and Relatively Low Credit Risk
Government Bond And Treasury Bill
Government Bond
6.54% Govt Of India Red 17-01-2032
6.10% Govt Of India Red 12-07-2031
6.68% Govt Of India Red 17-09-2031
7.50% Govt Of India Red 10-08-2034
7.95% Govt Of India Red 28-08-2032
Government Bond Total
Government Bond And Treasury Bill Total
Cash & Other Receivables Total
Grand Total
SOVEREIGN
SOVEREIGN
SOVEREIGN
SOVEREIGN
SOVEREIGN
34.85%
27.23%
12.34%
11.68%
9.41%
95.50%
95.50%
4.50%
100.00%
95.50%
4.50%
Factsheet May, 2022
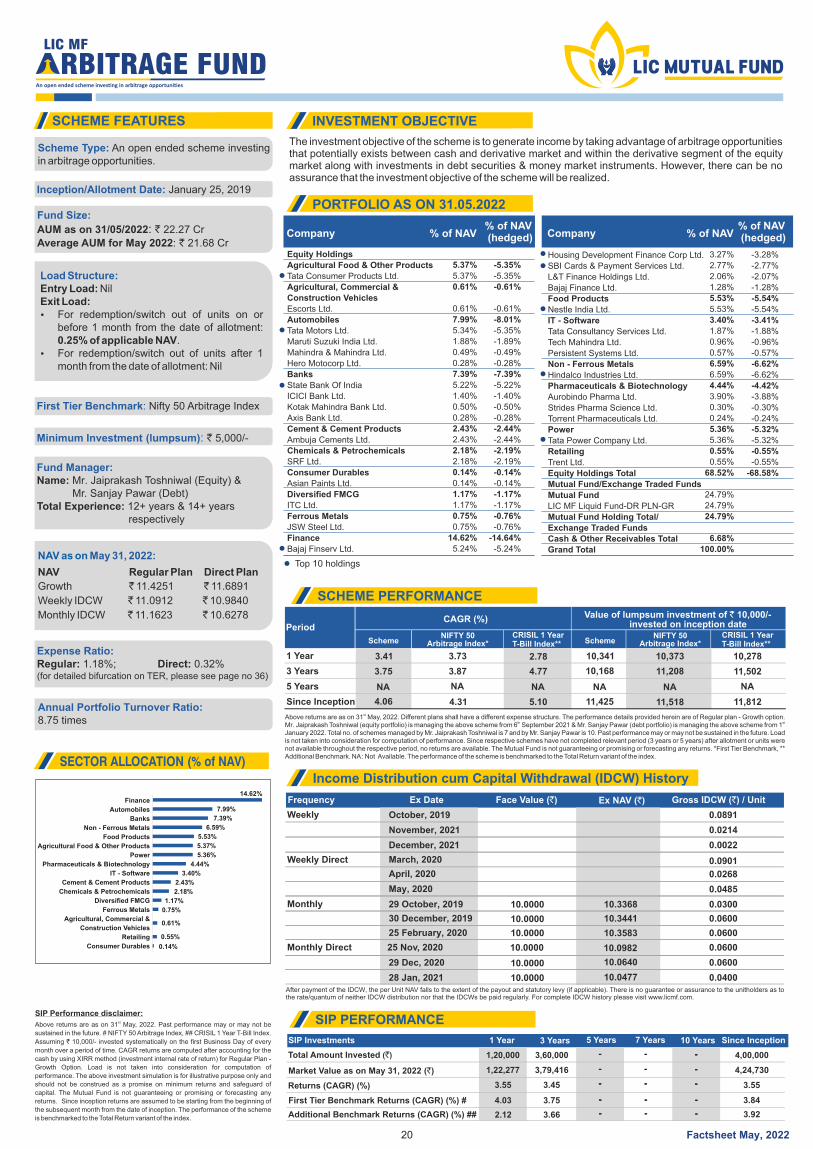
The investment objective of the scheme is to generate income by taking advantage of arbitrage opportunities that potentially exists between cash and derivative market and within the derivative segment of the equity market along with investments in debt securities & money market instruments. However, there can be no assurance that the investment objective of the scheme will be realized.
SCHEME FEATURES INVESTMENT OBJECTIVE
PORTFOLIO AS ON 31.05.2022
SECTOR ALLOCATION (% of NAV)
Scheme Type: An open ended scheme investing in arbitrage opportunities.
Inception/Allotment Date: January 25, 2019
Fund Size:
AUM as on 31/05/2022: ` 22.27 Cr
: 21.68 CrAverage AUM for May 2022 `
First Tier Benchmark: Nifty 50 Arbitrage Index
Minimum Investment (lumpsum): ` 5,000/-
Fund Manager:Name: M . (Equity) &r Jaiprakash Toshniwal Mr. (Debt)Sanjay PawarTotal Experience: years & years 12+ 14+ respectively
Expense Ratio: Regular: 1.18%; Direct: 0.32%
(for detailed bifurcation on TER, please see page no 36)
Annual Portfolio Turnover Ratio:8.75 times
20
LIC MF
An open ended scheme investing in arbitrage opportunities
RBITRAGE FUND
NAV as on May 31, 2022:
NAV Regular Plan Direct Plan
Growth ̀ 11.4251 ̀ 11.6891
Weekly IDCW ̀ 11.0912 ̀ 10.9840
Monthly IDCW ̀ 11.1623 ̀ 10.6278
Company Company% of NAV % of NAV% of NAV (hedged)
% of NAV (hedged)
Frequency Ex Date Face Value ( )` Ex NAV ( )` Gross IDCW ( ) / Unit`
Weekly
Weekly Direct
Monthly
Monthly Direct
May, 2020
December, 2021
28 Jan, 2021
29 October, 2019
25 February, 2020
30 December, 2019
0.0022
0.0485
0.0400
0.0300
0.0600
0.0600
10.0477
10.3368
10.3583
10.3441
10.0000
10.0000
10.0000
10.0000
10.0000
10.0000
After payment of the IDCW, the per Unit NAV falls to the extent of the payout and statutory levy (if applicable). There is no guarantee or assurance to the unitholders as to the rate/quantum of neither IDCW distribution nor that the IDCWs be paid regularly. For complete IDCW history please visit www.licmf.com.
SCHEME PERFORMANCE
SchemeNIFTY 50
Arbitrage Index*NIFTY 50
Arbitrage Index*SchemeCRISIL 1 YearT-Bill Index**
1 Year 3.41 3.73 2.78 10,341 10,373 10,278
3 Years 3.75 3.87 4.77 10,168 11,208 11,502
5 Years NA NA NA NA NA NA
Since Inception 4.06 4.31 5.10 11,425 11,518 11,812
PeriodCAGR (%) Value of lumpsum investment of 10,000/- `
invested on inception date
stAbove returns are as on 31 May, 2022. Different plans shall have a different expense structure. The performance details provided herein are of Regular plan - Growth option.
th stMr. Jaiprakash Toshniwal (equity portfolio) is managing the above scheme from 6 September 2021 & Mr. Sanjay Pawar (debt portfolio) is managing the above scheme from 1 January 2022. Total no. of schemes managed by Mr. Jaiprakash Toshniwal is 7 and by Mr. Sanjay Pawar is 10. Past performance may or may not be sustained in the future. Load is not taken into consideration for computation of performance. Since respective schemes have not completed relevant period (3 years or 5 years) after allotment or units were not available throughout the respective period, no returns are available. The Mutual Fund is not guaranteeing or promising or forecasting any returns. *First Tier Benchmark, ** Additional Benchmark. NA : Not Available. The performance of the scheme is benchmarked to the Total Return variant of the index.
stAbove returns are as on 31 May, 2022. Past performance may or may not be
sustained in the future. # NIFTY 50 Arbitrage Index, ## CRISIL 1 Year T-Bill Index.
Assuming ` 10,000/- invested systematically on the first Business Day of every
month over a period of time. CAGR returns are computed after accounting for the
cash by using XIRR method (investment internal rate of return) for Regular Plan -
Growth Option. Load is not taken into consideration for computation of
performance. The above investment simulation is for illustrative purpose only and
should not be construed as a promise on minimum returns and safeguard of
capital. The Mutual Fund is not guaranteeing or promising or forecasting any
returns. Since inception returns are assumed to be starting from the beginning of
the subsequent month from the date of inception. The performance of the scheme
is benchmarked to the Total Return variant of the index.
SIP Investments 1 Year 3 Years 5 Years 7 Years 10 Years Since Inception
Total Amount Invested (`) 1,20,000 3,60,000 4,00,000
Market Value as on May 31, 2022 (`) 1,22,277 4,24,730
Returns (CAGR) (%) 3.55 3.55
First Tier Benchmark Returns (CAGR) (%) #
Additional Benchmark Returns (CAGR) (%) ##
4.03
2.12
3.84
3.92
SIP PERFORMANCE
3,79,416
3.45
3.75
3.66
-
-
-
-
-
-
-
-
-
-
-
-
-
-
-
-
-
-
-
-
-
-
-
-
-
-
-
-
-
-
SIP Performance disclaimer:
March, 2020 0.0901
April, 2020 0.0268
0.0600
0.0600
25 Nov, 2020 10.0982
29 Dec, 2020 10.0640
CRISIL 1 YearT-Bill Index**
Income Distribution cum Capital Withdrawal (IDCW) History
Load Structure:Entry Load: NilExit Load: Ÿ For redemption/switch out of units on or
before 1 month from the date of allotment: 0.25% of applicable NAV.
Ÿ For redemption/switch out of units after 1 month from the date of allotment: Nil
October, 2019 0.0891
November, 2021 0.0214
14.62%
7.99%
7.39%
6.59%
5.53%
5.37%
5.36%
4.44%
3.40%
2.43%
2.18%
1.17%
0.75%
0.61%
0.55%
0.14%
Finance
Automobiles
Banks
Non - Ferrous Metals
Food Products
Agricultural Food & Other Products
Power
Pharmaceuticals & Biotechnology
IT - Software
Cement & Cement Products
Chemicals & Petrochemicals
Diversified FMCG
Ferrous Metals
Agricultural, Commercial &
Construction Vehicles
Retailing
Consumer Durables
Equity Holdings
Agricultural Food & Other Products
Tata Consumer Products Ltd.
Agricultural, Commercial &
Construction Vehicles
Escorts Ltd.
Automobiles
Tata Motors Ltd.
Maruti Suzuki India Ltd.
Mahindra & Mahindra Ltd.
Hero Motocorp Ltd.
Banks
State Bank Of India
ICICI Bank Ltd.
Kotak Mahindra Bank Ltd.
Axis Bank Ltd.
Cement & Cement Products
Ambuja Cements Ltd.
Chemicals & Petrochemicals
SRF Ltd.
Consumer Durables
Asian Paints Ltd.
Diversified FMCG
ITC Ltd.
Ferrous Metals
JSW Steel Ltd.
Finance
Bajaj Finserv Ltd.
Housing Development Finance Corp Ltd.
SBI Cards & Payment Services Ltd.
L&T Finance Holdings Ltd.
Bajaj Finance Ltd.
Food Products
Nestle India Ltd.
IT - Software
Tata Consultancy Services Ltd.
Tech Mahindra Ltd.
Persistent Systems Ltd.
Non - Ferrous Metals
Hindalco Industries Ltd.
Pharmaceuticals & Biotechnology
Aurobindo Pharma Ltd.
Strides Pharma Science Ltd.
Torrent Pharmaceuticals Ltd.
Power
Tata Power Company Ltd.
Retailing
Trent Ltd.
Equity Holdings Total
Mutual Fund/Exchange Traded Funds
Mutual Fund
LIC MF Liquid Fund-DR PLN-GR
Mutual Fund Holding Total/
Exchange Traded Funds
Cash & Other Receivables Total
Grand Total
3.27%
2.77%
2.06%
1.28%
5.53%
5.53%
3.40%
1.87%
0.96%
0.57%
6.59%
6.59%
4.44%
3.90%
0.30%
0.24%
5.36%
5.36%
0.55%
0.55%
68.52%
24.79%
24.79%
24.79%
6.68%
100.00%
-3.28%
-2.77%
-2.07%
-1.28%
-5.54%
-5.54%
-3.41%
-1.88%
-0.96%
-0.57%
-6.62%
-6.62%
-4.42%
-3.88%
-0.30%
-0.24%
-5.32%
-5.32%
-0.55%
-0.55%
-68.58%
5.37%
5.37%
0.61%
0.61%
7.99%
5.34%
1.88%
0.49%
0.28%
7.39%
5.22%
1.40%
0.50%
0.28%
2.43%
2.43%
2.18%
2.18%
0.14%
0.14%
1.17%
1.17%
0.75%
0.75%
14.62%
5.24%
-5.35%
-5.35%
-0.61%
-0.61%
-8.01%
-5.35%
-1.89%
-0.49%
-0.28%
-7.39%
-5.22%
-1.40%
-0.50%
-0.28%
-2.44%
-2.44%
-2.19%
-2.19%
-0.14%
-0.14%
-1.17%
-1.17%
-0.76%
-0.76%
-14.64%
-5.24%
Top 10 holdings
Factsheet May, 2022
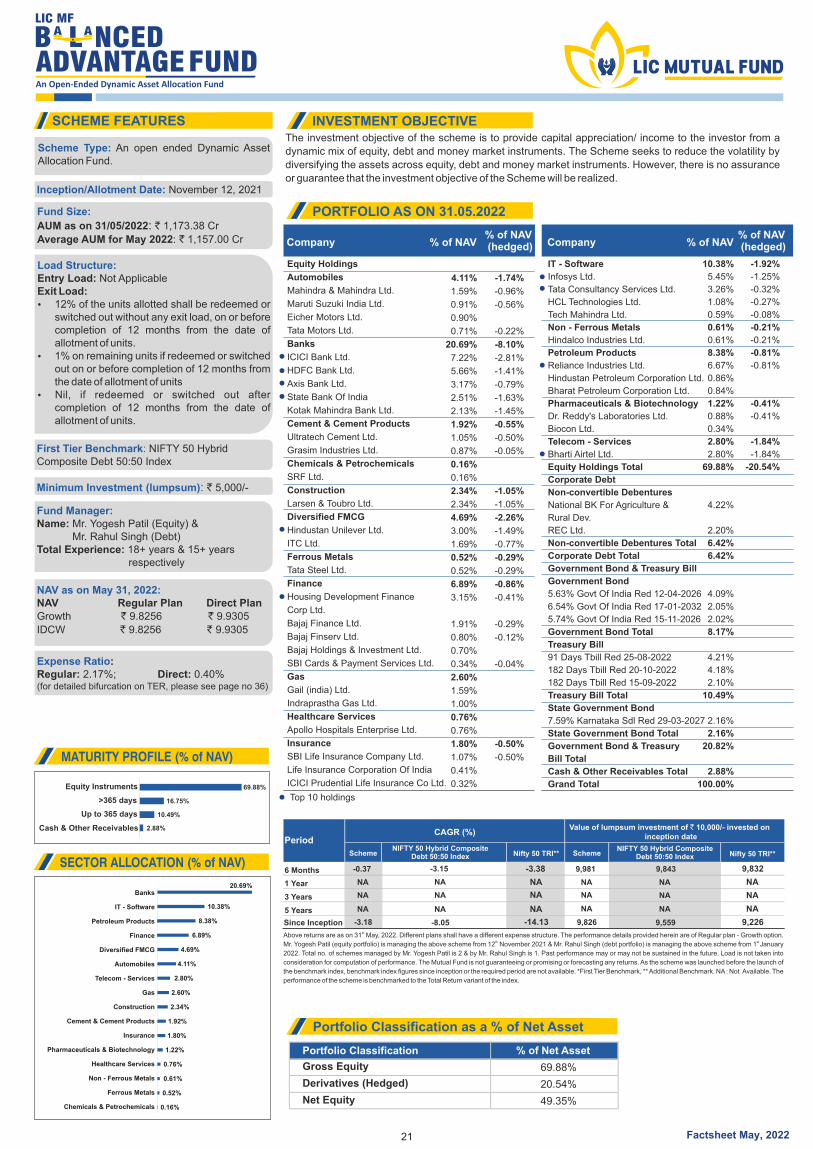
The investment objective of the scheme is to provide capital appreciation/ income to the investor from a
dynamic mix of equity, debt and money market instruments. The Scheme seeks to reduce the volatility by
diversifying the assets across equity, debt and money market instruments. However, there is no assurance
or guarantee that the investment objective of the Scheme will be realized.
16.75%
2.88%
10.49%
69.88%
Cash & Other Receivables
Up to 365 days
Equity Instruments
>365 days
SCHEME FEATURES INVESTMENT OBJECTIVE
MATURITY PROFILE (% of NAV)
SECTOR ALLOCATION (% of NAV)
Scheme Type: An open ended Dynamic Asset Allocation Fund.
Inception/Allotment Date: November 12, 2021
Fund Size:
AUM as on 31/05/2022: ` 1,173.38 Cr
: 1,157.00 CrAverage AUM for May 2022 `
First Tier Benchmark: NIFTY 50 Hybrid Composite Debt 50:50 Index
Minimum Investment (lumpsum): ` 5,000/-
Fund Manager:Name: Mr. (Equity) &Yogesh Patil Mr. (Debt)Rahul SinghTotal Experience: years & years 18+ 15+ respectively
NAV as on May 31, 2022:NAV Regular Plan Direct PlanGrowth 9.8256 9.9305` `
IDCW 9.8256 9.9305` `
Expense Ratio: Regular: 2.17%; Direct: 0.40%
(for detailed bifurcation on TER, please see page no 36)
21
Load Structure:Entry Load: Not Applicable Exit Load: Ÿ 12% of the units allotted shall be redeemed or
switched out without any exit load, on or before completion of 12 months from the date of allotment of units.
Ÿ 1% on remaining units if redeemed or switched out on or before completion of 12 months from the date of allotment of units
Ÿ Nil, if redeemed or switched out after completion of 12 months from the date of allotment of units.
Portfolio Classification as a % of Net Asset
Portfolio Classification
% of Net Asset
Gross Equity
69.88%
Derivatives (Hedged) 20.54%
Net Equity 49.35%
20.69%
10.38%
8.38%
6.89%
4.69%
4.11%
2.80%
2.60%
2.34%
1.92%
1.80%
1.22%
0.76%
0.61%
0.52%
0.16%
Banks
IT - Software
Petroleum Products
Finance
Diversified FMCG
Automobiles
Telecom - Services
Gas
Construction
Cement & Cement Products
Insurance
Pharmaceuticals & Biotechnology
Healthcare Services
Non - Ferrous Metals
Ferrous Metals
Chemicals & Petrochemicals
Factsheet May, 2022
PORTFOLIO AS ON 31.05.2022
Company Company% of NAV % of NAV% of NAV (hedged)
% of NAV (hedged)
IT - Software
Infosys Ltd.
Tata Consultancy Services Ltd.
HCL Technologies Ltd.
Tech Mahindra Ltd.
Non - Ferrous Metals
Hindalco Industries Ltd.
Petroleum Products
Reliance Industries Ltd.
Hindustan Petroleum Corporation Ltd.
Bharat Petroleum Corporation Ltd.
Pharmaceuticals & Biotechnology
Dr. Reddy's Laboratories Ltd.
Biocon Ltd.
Telecom - Services
Bharti Airtel Ltd.
Equity Holdings Total
Corporate Debt
Non-convertible Debentures
National BK For Agriculture &
Rural Dev.
REC Ltd.
Non-convertible Debentures Total
Corporate Debt Total
Government Bond & Treasury Bill
Government Bond
5.63% Govt Of India Red 12-04-2026
6.54% Govt Of India Red 17-01-2032
5.74% Govt Of India Red 15-11-2026
Government Bond Total
Treasury Bill
91 Days Tbill Red 25-08-2022
182 Days Tbill Red 20-10-2022
182 Days Tbill Red 15-09-2022
Treasury Bill Total
State Government Bond
7.59% Karnataka Sdl Red 29-03-2027
State Government Bond Total
Government Bond & Treasury
Bill Total
Cash & Other Receivables Total
Grand Total
Equity Holdings
Automobiles
Mahindra & Mahindra Ltd.
Maruti Suzuki India Ltd.
Eicher Motors Ltd.
Tata Motors Ltd.
Banks
ICICI Bank Ltd.
HDFC Bank Ltd.
Axis Bank Ltd.
State Bank Of India
Kotak Mahindra Bank Ltd.
Cement & Cement Products
Ultratech Cement Ltd.
Grasim Industries Ltd.
Chemicals & Petrochemicals
SRF Ltd.
Construction
Larsen & Toubro Ltd.
Diversified FMCG
Hindustan Unilever Ltd.
ITC Ltd.
Ferrous Metals
Tata Steel Ltd.
Finance
Housing Development Finance
Corp Ltd.
Bajaj Finance Ltd.
Bajaj Finserv Ltd.
Bajaj Holdings & Investment Ltd.
SBI Cards & Payment Services Ltd.
Gas
Gail (india) Ltd.
Indraprastha Gas Ltd.
Healthcare Services
Apollo Hospitals Enterprise Ltd.
Insurance
SBI Life Insurance Company Ltd.
Life Insurance Corporation Of India
ICICI Prudential Life Insurance Co Ltd.
4.11%
1.59%
0.91%
0.90%
0.71%
20.69%
7.22%
5.66%
3.17%
2.51%
2.13%
1.92%
1.05%
0.87%
0.16%
0.16%
2.34%
2.34%
4.69%
3.00%
1.69%
0.52%
0.52%
6.89%
3.15%
1.91%
0.80%
0.70%
0.34%
2.60%
1.59%
1.00%
0.76%
0.76%
1.80%
1.07%
0.41%
0.32%
-1.74%
-0.96%
-0.56%
-0.22%
-8.10%
-2.81%
-1.41%
-0.79%
-1.63%
-1.45%
-0.55%
-0.50%
-0.05%
-1.05%
-1.05%
-2.26%
-1.49%
-0.77%
-0.29%
-0.29%
-0.86%
-0.41%
-0.29%
-0.12%
-0.04%
-0.50%
-0.50%
10.38%
5.45%
3.26%
1.08%
0.59%
0.61%
0.61%
8.38%
6.67%
0.86%
0.84%
1.22%
0.88%
0.34%
2.80%
2.80%
69.88%
4.22%
2.20%
6.42%
6.42%
4.09%
2.05%
2.02%
8.17%
4.21%
4.18%
2.10%
10.49%
2.16%
2.16%
20.82%
2.88%
100.00%
-1.92%
-1.25%
-0.32%
-0.27%
-0.08%
-0.21%
-0.21%
-0.81%
-0.81%
-0.41%
-0.41%
-1.84%
-1.84%
-20.54%
Top 10 holdings
SchemeNIFTY 50 Hybrid Composite
Debt 50:50 IndexNIFTY 50 Hybrid Composite
Debt 50:50 IndexSchemeNifty 50 TRI** Nifty 50 TRI**
1 Year NA NA NA NA NA NA
3 Years NA NA NA NA NA NA
5 Years NA NA NA NA NA NA
Since Inception -3.18 -8.05 -14.13 9,826 9,559 9,226
PeriodCAGR (%)
Value of lumpsum investment of 10,000/- invested on `inception date
stAbove returns are as on 31 May, 2022. Different plans shall have a different expense structure. The performance details provided herein are of Regular plan - Growth option. th st Mr. Yogesh Patil (equity portfolio) is managing the above scheme from 12 November 2021 & Mr. Rahul Singh (debt portfolio) is managing the above scheme from 1 January
2022. Total no. of schemes managed by Mr. Yogesh Patil is 2 & by Mr. Rahul Singh is 1. Past performance may or may not be sustained in the future. Load is not taken into
consideration for computation of performance. The Mutual Fund is not guaranteeing or promising or forecasting any returns. As the scheme was launched before the launch of
the benchmark index, benchmark index figures since inception or the required period are not available. *First Tier Benchmark, ** Additional Benchmark. NA : Not Available. The
performance of the scheme is benchmarked to the Total Return variant of the index.
6 Months -0.37 -3.15 -3.38 9,981 9,843 9,832
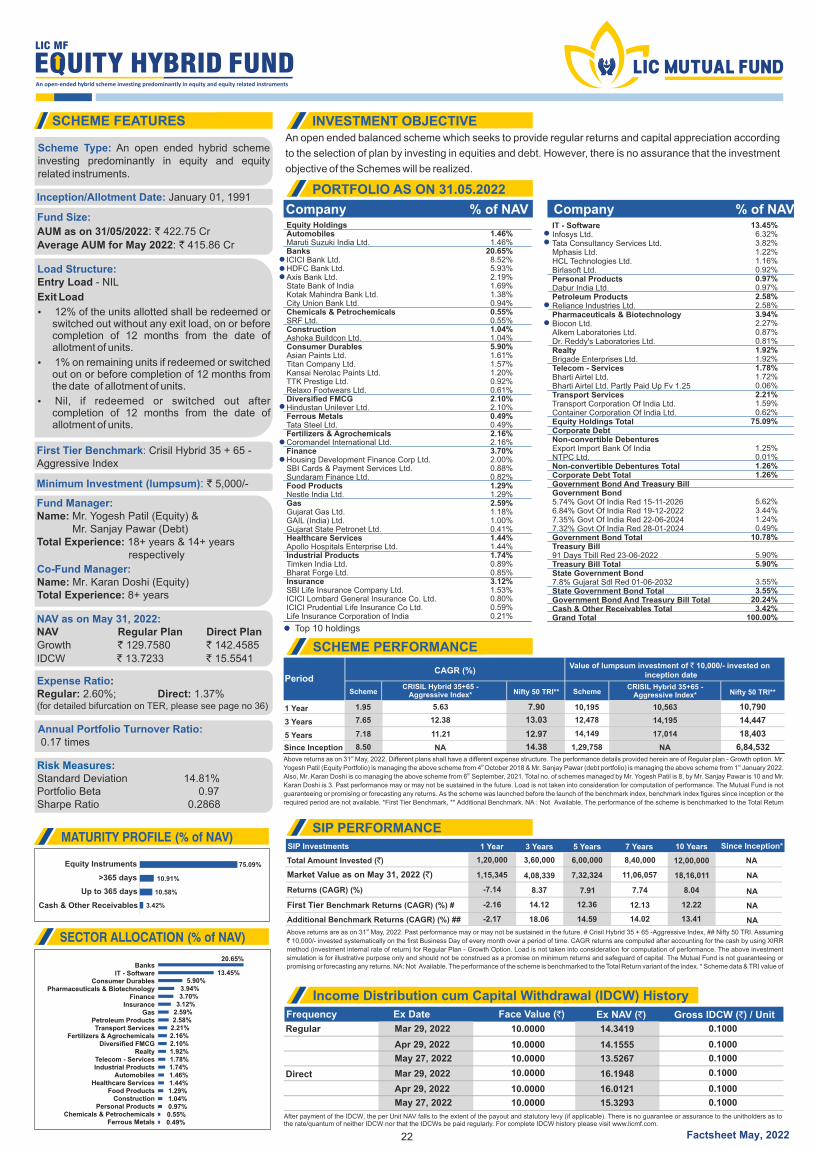
An open ended balanced scheme which seeks to provide regular returns and capital appreciation according
to the selection of plan by investing in equities and debt. However, there is no assurance that the investment
objective of the Schemes will be realized.
stAbove returns are as on 31 May, 2022. Past performance may or may not be sustained in the future. # Crisil Hybrid 35 + 65 -Aggressive Index, ## Nifty 50 TRI. Assuming
` 10,000/- invested systematically on the first Business Day of every month over a period of time. CAGR returns are computed after accounting for the cash by using XIRR
method (investment internal rate of return) for Regular Plan - Growth Option. Load is not taken into consideration for computation of performance. The above investment
simulation is for illustrative purpose only and should not be construed as a promise on minimum returns and safeguard of capital. The Mutual Fund is not guaranteeing or
promising or forecasting any returns. NA: Not Available. The performance of the scheme is benchmarked to the Total Return variant of the index. * Scheme data & TRI value of
Frequency Ex Date Face Value ( )` Ex NAV ( )` Gross IDCW ( ) / Unit`
Regular
Direct
10.91%
3.42%
10.58%
75.09%
Cash & Other Receivables
Up to 365 days
Equity Instruments
>365 days
SIP Investments 1 Year 3 Years 5 Years 7 Years 10 Years Since Inception*
Total Amount Invested (`) 1,20,000 3,60,000 6,00,000 8,40,000 12,00,000 NA
NA
NA
NA
NA
Market Value as on May 31, 2022 (`) 1,15,345 4,08,339 7,32,324 11,06,057 18,16,011
Returns (CAGR) (%) -7.14 8.37 7.91 7.74 8.04
First Tier Benchmark Returns (CAGR) (%) #
Additional Benchmark Returns (CAGR) (%) ##
-2.16
-2.17
14.12
18.06
12.36 12.13
14.59 14.02
12.22
13.41
SCHEME FEATURES INVESTMENT OBJECTIVE
PORTFOLIO AS ON 31.05.2022
SCHEME PERFORMANCE
SIP PERFORMANCEMATURITY PROFILE (% of NAV)
Income Distribution cum Capital Withdrawal (IDCW) History
Company % of NAV Company % of NAV
SchemeCRISIL Hybrid 35+65 -
Aggressive Index*CRISIL Hybrid 35+65 -
Aggressive Index*SchemeNifty 50 TRI** Nifty 50 TRI**
1 Year 1.95 5.63 7.90 10,195 10,563 10,790
3 Years 7.65 12.38 13.03 12,478 14,195 14,447
5 Years 7.18 11.21 12.97 14,149 17,014 18,403
Since Inception 8.50 NA 14.38 1,29,758 NA 6,84,532
PeriodCAGR (%)
Value of lumpsum investment of 10,000/- invested on `inception date
stAbove returns as on 31 May, 2022. Different plans shall have a different expense structure. The performance details provided herein are of Regular plan - Growth option. Mr. th st
Yogesh Patil (Equity Portfolio) is managing the above scheme from 4 October 2018 & Mr. Sanjay Pawar (debt portfolio) is managing the above scheme from 1 January 2022. th
Also, Mr. Karan Doshi is co managing the above scheme from 6 September, 2021. Total no. of schemes managed by Mr. Yogesh Patil is 8, by Mr. Sanjay Pawar is 10 and Mr.
Karan Doshi is 3. Past performance may or may not be sustained in the future. Load is not taken into consideration for computation of performance. The Mutual Fund is not
guaranteeing or promising or forecasting any returns. As the scheme was launched before the launch of the benchmark index, benchmark index figures since inception or the
required period are not available. *First Tier Benchmark, ** Additional Benchmark. NA : Not Available. The performance of the scheme is benchmarked to the Total Return
After payment of the IDCW, the per Unit NAV falls to the extent of the payout and statutory levy (if applicable). There is no guarantee or assurance to the unitholders as to the rate/quantum of neither IDCW nor that the IDCWs be paid regularly. For complete IDCW history please visit www.licmf.com.
Scheme Type: An open ended hybrid scheme investing predominantly in equity and equity related instruments.
Inception/Allotment Date: January 01, 1991
Fund Size:
AUM as on 31/05/2022: ` 422.75 Cr
: 415.86 CrAverage AUM for May 2022 `
First Tier Benchmark: Crisil Hybrid 35 + 65 - Aggressive Index
Minimum Investment (lumpsum): ` 5,000/-
Fund Manager:Name: Mr. (Equity) &Yogesh Patil Mr. (Debt)Sanjay PawarTotal Experience: years & years 18+ 14+ respectively
NAV as on May 31, 2022:NAV Regular Plan Direct PlanGrowth 129.7580 142.4585` `
IDCW 13.7233 15.5541 ` `
Expense Ratio: Regular: 2.60%; Direct: 1.37%
(for detailed bifurcation on TER, please see page no 36)
Annual Portfolio Turnover Ratio: 0.17 times
Risk Measures:Standard Deviation 14.81%Portfolio Beta 0.97 Sharpe Ratio 0.2868
22
Load Structure:Entry Load - NIL
Exit Load
Ÿ 12% of the units allotted shall be redeemed or switched out without any exit load, on or before completion of 12 months from the date of allotment of units.
Ÿ 1% on remaining units if redeemed or switched out on or before completion of 12 months from the date of allotment of units.
Ÿ Nil, if redeemed or switched out after completion of 12 months from the date of allotment of units.
Co-Fund Manager:Name: Mr. Karan Doshi (Equity)Total Experience: 8+ years
May 27, 2022 10.0000 15.3293 0.1000
May 27, 2022 10.0000 13.5267 0.1000
Equity HoldingsAutomobilesMaruti Suzuki India Ltd.BanksICICI Bank Ltd.HDFC Bank Ltd.Axis Bank Ltd.State Bank of IndiaKotak Mahindra Bank Ltd.City Union Bank Ltd.Chemicals & PetrochemicalsSRF Ltd.ConstructionAshoka Buildcon Ltd.Consumer DurablesAsian Paints Ltd.Titan Company Ltd.Kansai Nerolac Paints Ltd.TTK Prestige Ltd.Relaxo Footwears Ltd.Diversified FMCGHindustan Unilever Ltd.Ferrous MetalsTata Steel Ltd.Fertilizers & AgrochemicalsCoromandel International Ltd.FinanceHousing Development Finance Corp Ltd.SBI Cards & Payment Services Ltd.Sundaram Finance Ltd.Food ProductsNestle India Ltd.GasGujarat Gas Ltd.GAIL (India) Ltd.Gujarat State Petronet Ltd.Healthcare ServicesApollo Hospitals Enterprise Ltd.Industrial ProductsTimken India Ltd.Bharat Forge Ltd.InsuranceSBI Life Insurance Company Ltd.ICICI Lombard General Insurance Co. Ltd.ICICI Prudential Life Insurance Co Ltd.Life Insurance Corporation of India
1.46%1.46%
20.65%8.52%5.93%2.19%1.69%1.38%0.94%0.55%0.55%1.04%1.04%5.90%1.61%1.57%1.20%0.92%0.61%2.10%2.10%0.49%0.49%2.16%2.16%3.70%2.00%0.88%0.82%1.29%1.29%2.59%1.18%1.00%0.41%1.44%1.44%1.74%0.89%0.85%3.12%1.53%0.80%0.59%0.21%
IT - SoftwareInfosys Ltd.Tata Consultancy Services Ltd.Mphasis Ltd.HCL Technologies Ltd.Birlasoft Ltd.Personal ProductsDabur India Ltd.Petroleum ProductsReliance Industries Ltd.Pharmaceuticals & BiotechnologyBiocon Ltd.Alkem Laboratories Ltd.Dr. Reddy's Laboratories Ltd.RealtyBrigade Enterprises Ltd.Telecom - ServicesBharti Airtel Ltd.Bharti Airtel Ltd. Partly Paid Up Fv 1.25Transport ServicesTransport Corporation Of India Ltd.Container Corporation Of India Ltd.Equity Holdings TotalCorporate DebtNon-convertible DebenturesExport Import Bank Of IndiaNTPC Ltd.Non-convertible Debentures TotalCorporate Debt TotalGovernment Bond And Treasury BillGovernment Bond5.74% Govt Of India Red 15-11-20266.84% Govt Of India Red 19-12-20227.35% Govt Of India Red 22-06-20247.32% Govt Of India Red 28-01-2024Government Bond TotalTreasury Bill91 Days Tbill Red 23-06-2022Treasury Bill TotalState Government Bond7.8% Gujarat Sdl Red 01-06-2032State Government Bond TotalGovernment Bond And Treasury Bill TotalCash & Other Receivables TotalGrand Total
Top 10 holdings
13.45%6.32%3.82%1.22%1.16%0.92%0.97%0.97%2.58%2.58%3.94%2.27%0.87%0.81%1.92%1.92%1.78%1.72%0.06%2.21%1.59%0.62%
75.09%
1.25%0.01%1.26%1.26%
5.62%3.44%1.24%0.49%
10.78%
5.90%5.90%
3.55%3.55%
20.24%3.42%
100.00%
10.0000 0.1000Mar 29, 2022 16.1948
Apr 29, 2022 10.0000 16.0121 0.1000
10.0000 0.1000Mar 29, 2022 14.3419
Apr 29, 2022 10.0000 14.1555 0.1000
Factsheet May, 2022
SECTOR ALLOCATION (% of NAV)
20.65%
13.45%5.90%
3.94%3.70%
3.12%2.59%2.58%
2.21%2.16%2.10%1.92%1.78%1.74%1.46%1.44%1.29%
0.97%0.55%0.49%
BanksIT - Software
Consumer DurablesPharmaceuticals & Biotechnology
FinanceInsurance
GasPetroleum ProductsTransport Services
Fertilizers & AgrochemicalsDiversified FMCG
RealtyTelecom - ServicesIndustrial Products
AutomobilesHealthcare Services
Food ProductsConstruction
Personal ProductsChemicals & Petrochemicals
Ferrous Metals
1.04%
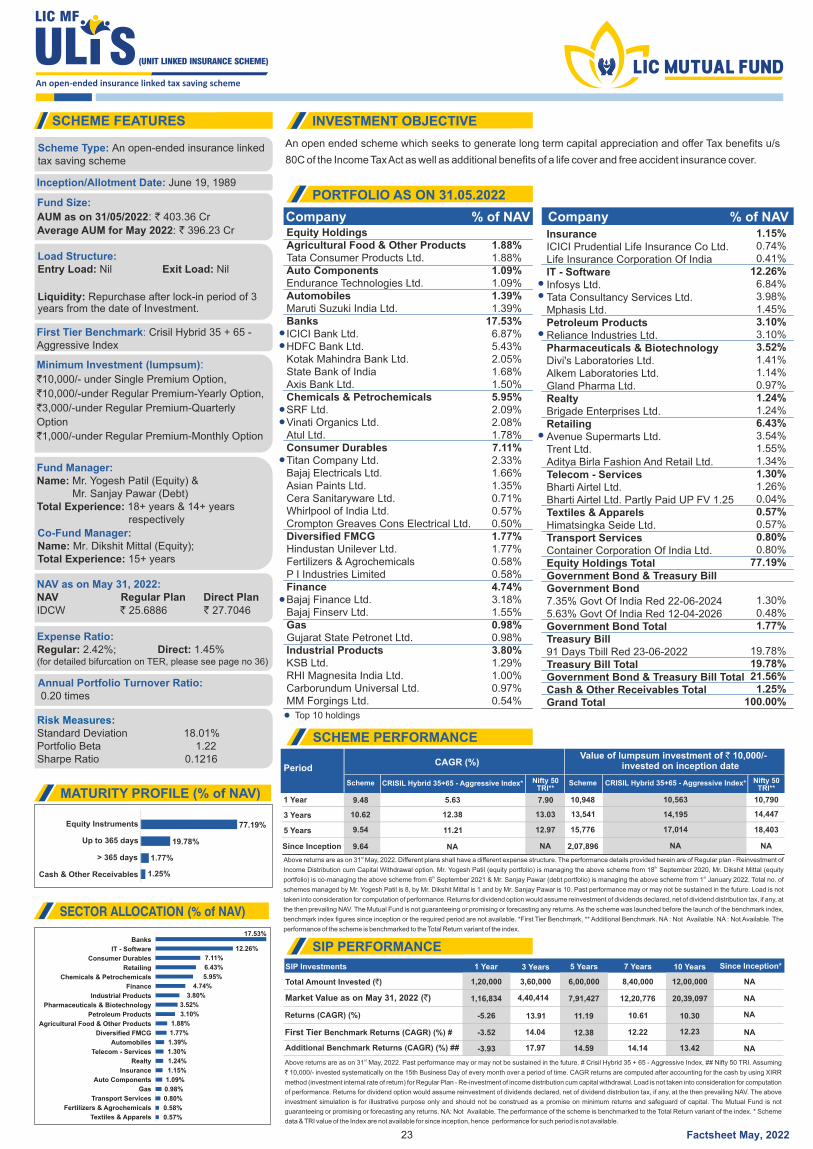
An open ended scheme which seeks to generate long term capital appreciation and offer Tax benefits u/s
80C of the Income Tax Act as well as additional benefits of a life cover and free accident insurance cover.
stAbove returns are as on 31 May, 2022. Past performance may or may not be sustained in the future. # Crisil Hybrid 35 + 65 - Aggressive Index, ## Nifty 50 TRI. Assuming
` 10,000/- invested systematically on the 15th Business Day of every month over a period of time. CAGR returns are computed after accounting for the cash by using XIRR
method (investment internal rate of return) for Regular Plan - Re-investment of income distribution cum capital withdrawal. Load is not taken into consideration for computation
of performance. Returns for dividend option would assume reinvestment of dividends declared, net of dividend distribution tax, if any, at the then prevailing NAV. The above
investment simulation is for illustrative purpose only and should not be construed as a promise on minimum returns and safeguard of capital. The Mutual Fund is not
guaranteeing or promising or forecasting any returns. NA: Not Available. The performance of the scheme is benchmarked to the Total Return variant of the index. * Scheme
data & TRI value of the Index are not available for since inception, hence performance for such period is not available.
77.19%
1.25%
19.78%Up to 365 days
Equity Instruments
Cash & Other Receivables
SIP Investments 1 Year 3 Years 5 Years 7 Years 10 Years Since Inception*
Total Amount Invested ( )` 1,20,000 3,60,000 6,00,000 8,40,000 12,00,000 NA
NA
NA
NA
NA
Market Value as on May 31, 2022 (`) 1,16,834 4,40,414 7,91,427 12,20,776 20,39,097
Returns (CAGR) (%) -5.26 13.91 11.19 10.61 10.30
First Tier Benchmark Returns (CAGR) (%) #
Additional Benchmark Returns (CAGR) (%) ##
-3.52
-3.93
14.04
17.97
12.38 12.22
14.59 14.14
12.23
13.42
SCHEME FEATURES INVESTMENT OBJECTIVE
PORTFOLIO AS ON 31.05.2022
SCHEME PERFORMANCE
SIP PERFORMANCE
MATURITY PROFILE (% of NAV)
Company % of NAV Company % of NAV
SECTOR ALLOCATION (% of NAV)
Scheme CRISIL Hybrid 35+65 - Aggressive Index* CRISIL Hybrid 35+65 - Aggressive Index*SchemeNifty 50TRI**
Nifty 50 TRI**
1 Year 9.48 5.63 7.90 10,948 10,563 10,790
3 Years 10.62 12.38 13.03 13,541 14,195 14,447
5 Years 9.54 11.21 12.97 15,776 17,014 18,403
Since Inception 9.64 NA NA 2,07,896 NA NA
PeriodCAGR (%)
Value of lumpsum investment of 10,000/- `invested on inception date
stAbove returns are as on 31 May, 2022. Different plans shall have a different expense structure. The performance details provided herein are of Regular plan - Reinvestment of
thIncome Distribution cum Capital Withdrawal option. Mr. Yogesh Patil (equity portfolio) is managing the above scheme from 18 September 2020, Mr. Dikshit Mittal (equity
th stportfolio) is co-managing the above scheme from 6 September 2021 & Mr. Sanjay Pawar (debt portfolio) is managing the above scheme from 1 January 2022. Total no. of
schemes managed by Mr. Yogesh Patil is 8, by Mr. Dikshit Mittal is 1 and by Mr. Sanjay Pawar is 10. Past performance may or may not be sustained in the future. Load is not
taken into consideration for computation of performance. Returns for dividend option would assume reinvestment of dividends declared, net of dividend distribution tax, if any, at
the then prevailing NAV. The Mutual Fund is not guaranteeing or promising or forecasting any returns. As the scheme was launched before the launch of the benchmark index,
benchmark index figures since inception or the required period are not available. *First Tier Benchmark, ** Additional Benchmark. NA : Not Available. NA : Not Available. The
performance of the scheme is benchmarked to the Total Return variant of the index.
Scheme Type: An open-ended insurance linked tax saving scheme
Inception/Allotment Date: June 19, 1989
Fund Size:
AUM as on 31/05/2022: ` 403.36 Cr
: 396.23 CrAverage AUM for May 2022 `
Load Structure:Entry Load: Exit Load: Nil Nil
Liquidity: Repurchase after lock-in period of 3 years from the date of Investment.
First Tier Benchmark: Crisil Hybrid 35 + 65 - Aggressive Index
Minimum Investment (lumpsum): `10,000/- under Single Premium Option,
`10,000/-under Regular Premium-Yearly Option,
`3,000/-under Regular Premium-Quarterly
Option
`1,000/-under Regular Premium-Monthly Option
Fund Manager:Name: Mr. (Equity) &Yogesh Patil Mr. (Debt)Sanjay PawarTotal Experience: years & years 18+ 14+ respectively
NAV as on May 31, 2022:NAV Regular Plan Direct PlanIDCW 25.6886 27.7046 ` `
Expense Ratio: Regular: 2.42%; Direct: 1.45%
(for detailed bifurcation on TER, please see page no 36)
Annual Portfolio Turnover Ratio: 0.20 times
Risk Measures:Standard Deviation 18.01%Portfolio Beta 1.22Sharpe Ratio 0.1216
23
Co-Fund Manager:Name: Mr. Dikshit Mittal (Equity);Total Experience: 15+ years
1.77%> 365 days
Equity HoldingsAgricultural Food & Other ProductsTata Consumer Products Ltd.Auto ComponentsEndurance Technologies Ltd.AutomobilesMaruti Suzuki India Ltd.BanksICICI Bank Ltd.HDFC Bank Ltd.Kotak Mahindra Bank Ltd.State Bank of IndiaAxis Bank Ltd.Chemicals & PetrochemicalsSRF Ltd.Vinati Organics Ltd.Atul Ltd.Consumer DurablesTitan Company Ltd.Bajaj Electricals Ltd.Asian Paints Ltd.Cera Sanitaryware Ltd.Whirlpool of India Ltd.Crompton Greaves Cons Electrical Ltd.Diversified FMCGHindustan Unilever Ltd.Fertilizers & AgrochemicalsP I Industries LimitedFinanceBajaj Finance Ltd.Bajaj Finserv Ltd.GasGujarat State Petronet Ltd.Industrial ProductsKSB Ltd.RHI Magnesita India Ltd.Carborundum Universal Ltd.MM Forgings Ltd.
1.88%1.88%1.09%1.09%1.39%1.39%
17.53%6.87%5.43%2.05%1.68%1.50%5.95%2.09%2.08%1.78%7.11%2.33%1.66%1.35%0.71%0.57%0.50%1.77%1.77%0.58%0.58%4.74%3.18%1.55%0.98%0.98%3.80%1.29%1.00%0.97%0.54%
InsuranceICICI Prudential Life Insurance Co Ltd.Life Insurance Corporation Of IndiaIT - SoftwareInfosys Ltd.Tata Consultancy Services Ltd.Mphasis Ltd.Petroleum ProductsReliance Industries Ltd.Pharmaceuticals & BiotechnologyDivi's Laboratories Ltd.Alkem Laboratories Ltd.Gland Pharma Ltd.RealtyBrigade Enterprises Ltd.RetailingAvenue Supermarts Ltd.Trent Ltd.Aditya Birla Fashion And Retail Ltd.Telecom - ServicesBharti Airtel Ltd.Bharti Airtel Ltd. Partly Paid UP FV 1.25Textiles & ApparelsHimatsingka Seide Ltd.Transport ServicesContainer Corporation Of India Ltd.Equity Holdings TotalGovernment Bond & Treasury BillGovernment Bond7.35% Govt Of India Red 22-06-20245.63% Govt Of India Red 12-04-2026Government Bond TotalTreasury Bill91 Days Tbill Red 23-06-2022Treasury Bill TotalGovernment Bond & Treasury Bill TotalCash & Other Receivables TotalGrand Total
1.15%0.74%0.41%
12.26%6.84%3.98%1.45%3.10%3.10%3.52%1.41%1.14%0.97%1.24%1.24%6.43%3.54%1.55%1.34%1.30%1.26%0.04%0.57%0.57%0.80%0.80%
77.19%
1.30%0.48%1.77%
19.78%19.78%21.56%
1.25%100.00%
Top 10 holdings
17.53%
12.26%
7.11%
6.43%
5.95%
4.74%
3.80%
3.52%
3.10%
1.88%
1.77%
1.39%
1.30%
1.24%
1.15%
1.09%
0.98%
0.80%
0.57%
Banks
IT - Software
Consumer Durables
Retailing
Chemicals & Petrochemicals
Finance
Industrial Products
Pharmaceuticals & Biotechnology
Petroleum Products
Agricultural Food & Other Products
Diversified FMCG
Automobiles
Telecom - Services
Realty
Insurance
Auto Components
Gas
Transport Services
Fertilizers & Agrochemicals
Textiles & Apparels
Factsheet May, 2022
0.58%
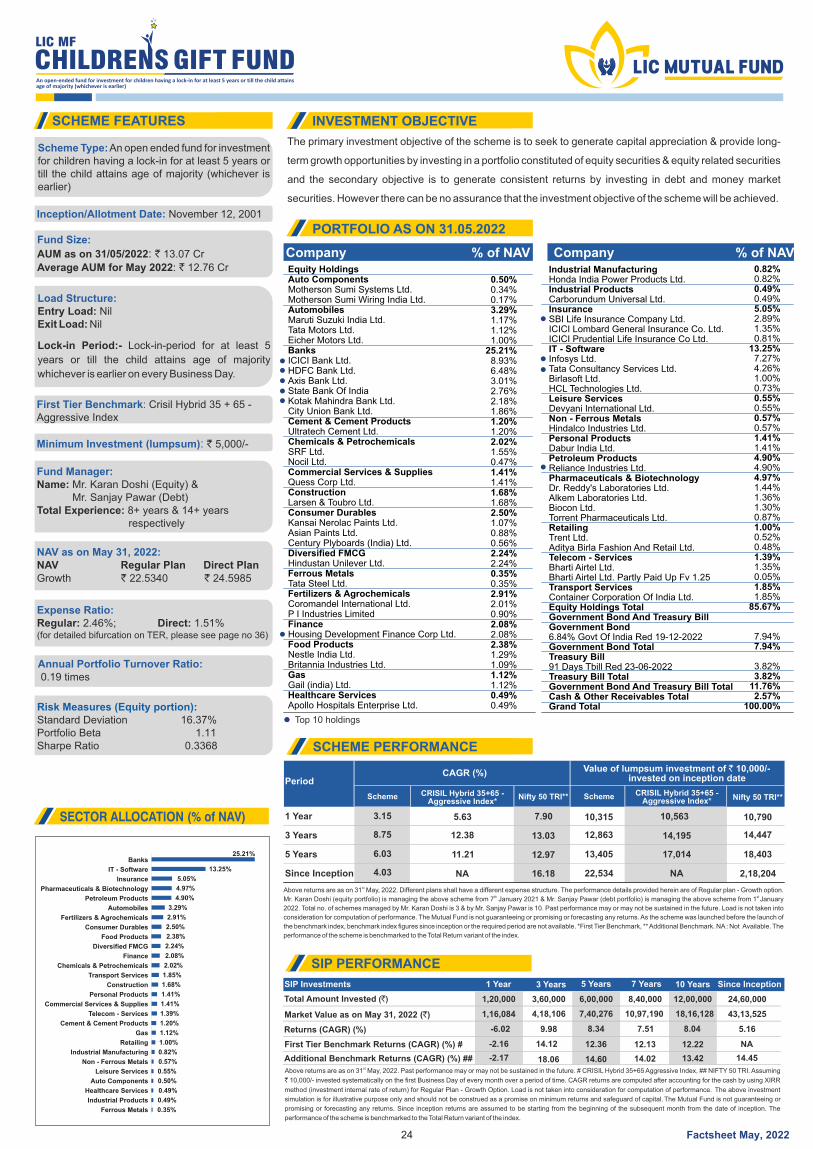
The primary investment objective of the scheme is to seek to generate capital appreciation & provide long-
term growth opportunities by investing in a portfolio constituted of equity securities & equity related securities
and the secondary objective is to generate consistent returns by investing in debt and money market
securities. However there can be no assurance that the investment objective of the scheme will be achieved.
SCHEME FEATURES INVESTMENT OBJECTIVE
PORTFOLIO AS ON 31.05.2022
SCHEME PERFORMANCE
SECTOR ALLOCATION (% of NAV)
Scheme CRISIL Hybrid 35+65 - Aggressive Index*
CRISIL Hybrid 35+65 - Aggressive Index*
SchemeNifty 50 TRI** Nifty 50 TRI**
1 Year 3.15 5.63 7.90 10,315 10,563 10,790
3 Years 8.75 12.38 13.03 12,863 14,195 14,447
5 Years 6.03 11.21 12.97 13,405 17,014 18,403
Since Inception 4.03 NA 16.18 22,534 NA 2,18,204
PeriodCAGR (%) Value of lumpsum investment of 10,000/- `
invested on inception date
stAbove returns are as on 31 May, 2022. Different plans shall have a different expense structure. The performance details provided herein are of Regular plan - Growth option. th st
Mr. Karan Doshi (equity portfolio) is managing the above scheme from 7 January 2021 & Mr. Sanjay Pawar (debt portfolio) is managing the above scheme from 1 January
2022. Total no. of schemes managed by Mr. Karan Doshi is 3 & by Mr. Sanjay Pawar is 10. Past performance may or may not be sustained in the future. Load is not taken into
consideration for computation of performance. The Mutual Fund is not guaranteeing or promising or forecasting any returns. As the scheme was launched before the launch of
the benchmark index, benchmark index figures since inception or the required period are not available. *First Tier Benchmark, ** Additional Benchmark. NA : Not Available. The
performance of the scheme is benchmarked to the Total Return variant of the index.
Scheme Type: An open ended fund for investment for children having a lock-in for at least 5 years or till the child attains age of majority (whichever is earlier)
Inception/Allotment Date: November 12, 2001
Fund Size:
AUM as on 31/05/2022: ` 13.07 Cr
: 12.76 CrAverage AUM for May 2022 `
Load Structure:Entry Load: NilExit Load: Nil
Lock-in Period:- Lock-in-period for at least 5
years or till the child attains age of majority
whichever is earlier on every Business Day.
First Tier Benchmark: Crisil Hybrid 35 + 65 - Aggressive Index
Minimum Investment (lumpsum): ` 5,000/-
Fund Manager:Name: Mr. (Equity) &Karan Doshi Mr. (Debt)Sanjay PawarTotal Experience: years & years 8+ 14+ respectively
NAV as on May 31, 2022:NAV Regular Plan Direct PlanGrowth 22.5340 24.5985 ` `
Expense Ratio: Regular: 2.46%; Direct: 1.51%
(for detailed bifurcation on TER, please see page no 36)
Annual Portfolio Turnover Ratio: 0.19 times
Risk Measures (Equity portion):Standard Deviation 16.37%
1 1Portfolio Beta . 1Sharpe Ratio 0.3368
Company % of NAV Company % of NAV
24
stAbove returns are as on 31 May, 2022. Past performance may or may not be sustained in the future. # CRISIL Hybrid 35+65 Aggressive Index, ## NIFTY 50 TRI. Assuming
` 10,000/- invested systematically on the first Business Day of every month over a period of time. CAGR returns are computed after accounting for the cash by using XIRR
method (investment internal rate of return) for Regular Plan - Growth Option. Load is not taken into consideration for computation of performance. The above investment
simulation is for illustrative purpose only and should not be construed as a promise on minimum returns and safeguard of capital. The Mutual Fund is not guaranteeing or
promising or forecasting any returns. Since inception returns are assumed to be starting from the beginning of the subsequent month from the date of inception. The
performance of the scheme is benchmarked to the Total Return variant of the index.
SIP Investments 1 Year 3 Years 5 Years 7 Years 10 Years Since Inception
Total Amount Invested (`) 1,20,000 3,60,000 6,00,000 8,40,000 12,00,000 24,60,000
Market Value as on May 31, 2022 (`) 1,16,084 4,18,106 7,40,276 10,97,190 18,16,128 43,13,525
Returns (CAGR) (%) -6.02 9.98 8.34 7.51 8.04 5.16
First Tier Benchmark Returns (CAGR) (%) #
Additional Benchmark Returns (CAGR) (%) ##
-2.16 14.12 12.36 12.13 12.22
-2.17 18.06 14.60 14.02 13.42
NA
14.45
SIP PERFORMANCE
25.21%
13.25%
5.05%
4.97%
4.90%
3.29%
2.91%
2.50%
2.38%
2.08%
2.02%
1.85%
1.68%
1.41%
1.41%
1.39%
1.20%
1.12%
1.00%
0.57%
0.55%
0.50%
0.49%
0.49%
0.35%
Banks
IT - Software
Insurance
Pharmaceuticals & Biotechnology
Petroleum Products
Automobiles
Fertilizers & Agrochemicals
Consumer Durables
Food Products
Diversified FMCG
Finance
Chemicals & Petrochemicals
Transport Services
Construction
Personal Products
Commercial Services & Supplies
Telecom - Services
Cement & Cement Products
Gas
Retailing
Industrial Manufacturing
Non - Ferrous Metals
Leisure Services
Auto Components
Healthcare Services
Industrial Products
Ferrous Metals
Top 10 holdings
Equity HoldingsAuto ComponentsMotherson Sumi Systems Ltd.Motherson Sumi Wiring India Ltd.AutomobilesMaruti Suzuki India Ltd.Tata Motors Ltd.Eicher Motors Ltd.BanksICICI Bank Ltd.HDFC Bank Ltd.Axis Bank Ltd.State Bank Of IndiaKotak Mahindra Bank Ltd.City Union Bank Ltd.Cement & Cement ProductsUltratech Cement Ltd.Chemicals & PetrochemicalsSRF Ltd.Nocil Ltd.Commercial Services & SuppliesQuess Corp Ltd.ConstructionLarsen & Toubro Ltd.Consumer DurablesKansai Nerolac Paints Ltd.Asian Paints Ltd.Century Plyboards (India) Ltd.Diversified FMCGHindustan Unilever Ltd.Ferrous MetalsTata Steel Ltd.Fertilizers & AgrochemicalsCoromandel International Ltd.P I Industries LimitedFinanceHousing Development Finance Corp Ltd.Food ProductsNestle India Ltd.Britannia Industries Ltd.GasGail (india) Ltd.Healthcare ServicesApollo Hospitals Enterprise Ltd.
0.50%0.34%0.17%3.29%1.17%1.12%1.00%
25.21%8.93%6.48%3.01%2.76%2.18%1.86%1.20%1.20%2.02%1.55%0.47%1.41%1.41%1.68%1.68%2.50%1.07%0.88%0.56%2.24%2.24%0.35%0.35%2.91%2.01%0.90%2.08%2.08%2.38%1.29%1.09%1.12%1.12%0.49%0.49%
Industrial ManufacturingHonda India Power Products Ltd.Industrial ProductsCarborundum Universal Ltd.InsuranceSBI Life Insurance Company Ltd.ICICI Lombard General Insurance Co. Ltd.ICICI Prudential Life Insurance Co Ltd.IT - SoftwareInfosys Ltd.Tata Consultancy Services Ltd.Birlasoft Ltd.HCL Technologies Ltd.Leisure ServicesDevyani International Ltd.Non - Ferrous MetalsHindalco Industries Ltd.Personal ProductsDabur India Ltd.Petroleum ProductsReliance Industries Ltd.Pharmaceuticals & BiotechnologyDr. Reddy's Laboratories Ltd.Alkem Laboratories Ltd.Biocon Ltd.Torrent Pharmaceuticals Ltd.RetailingTrent Ltd.Aditya Birla Fashion And Retail Ltd.Telecom - ServicesBharti Airtel Ltd.Bharti Airtel Ltd. Partly Paid Up Fv 1.25Transport ServicesContainer Corporation Of India Ltd.Equity Holdings TotalGovernment Bond And Treasury BillGovernment Bond6.84% Govt Of India Red 19-12-2022Government Bond TotalTreasury Bill91 Days Tbill Red 23-06-2022Treasury Bill TotalGovernment Bond And Treasury Bill TotalCash & Other Receivables TotalGrand Total
0.82%0.82%0.49%0.49%5.05%2.89%1.35%0.81%
13.25%7.27%4.26%1.00%0.73%0.55%0.55%0.57%0.57%1.41%1.41%4.90%4.90%4.97%1.44%1.36%1.30%0.87%1.00%0.52%0.48%1.39%1.35%0.05%1.85%1.85%
85.67%
7.94%7.94%
3.82%3.82%
11.76%2.57%
100.00%
Factsheet May, 2022
2.24%
0.82%
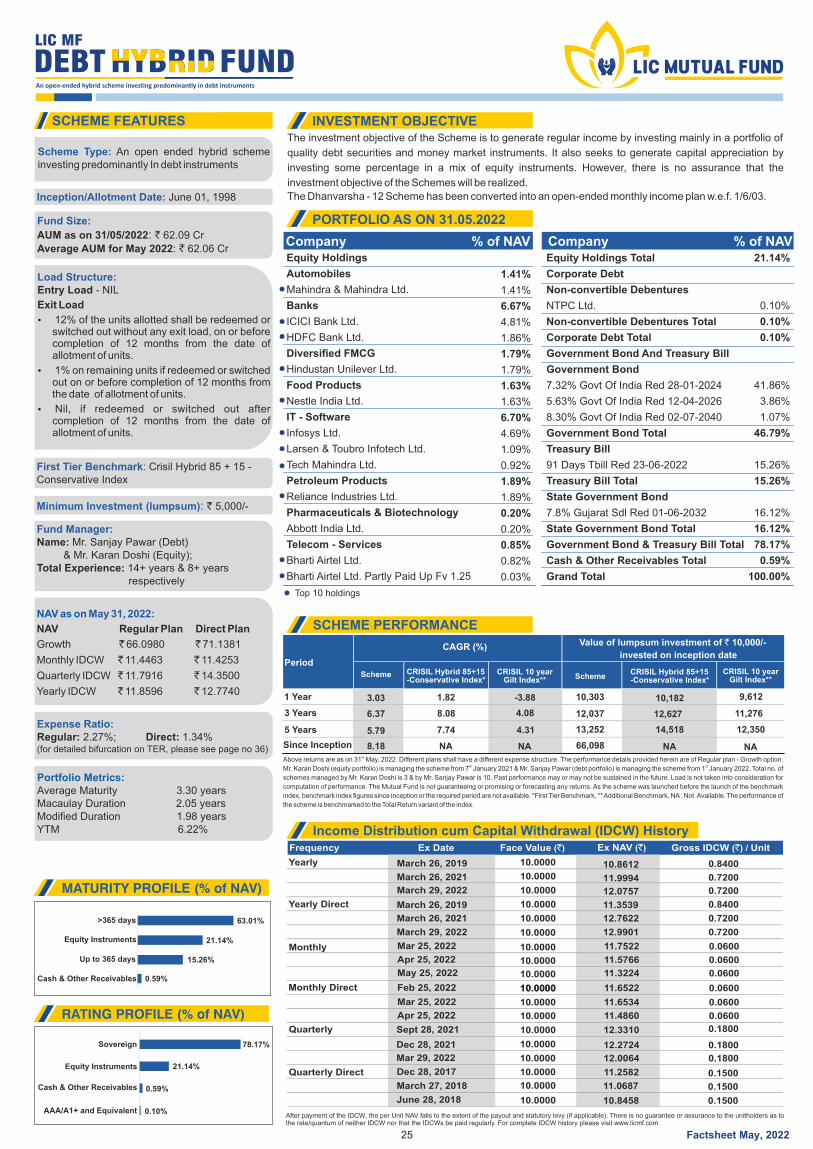
The investment objective of the Scheme is to generate regular income by investing mainly in a portfolio of
quality debt securities and money market instruments. It also seeks to generate capital appreciation by
investing some percentage in a mix of equity instruments. However, there is no assurance that the
investment objective of the Schemes will be realized.
The Dhanvarsha - 12 Scheme has been converted into an open-ended monthly income plan w.e.f. 1/6/03.
Frequency Ex Date Face Value ( )` Ex NAV ( )` Gross IDCW ( ) / Unit`
Yearly 10.0000
10.0000
March 29, 2022 10.0000 12.0757 0.7200
Yearly Direct 10.0000
10.0000
March 29, 2022 10.0000 12.9901 0.7200
Monthly 10.0000
Monthly Direct 10.000010.0000
Quarterly 10.0000
Mar 29, 2022 10.0000
10.0000
12.0064 0.1800
0.1800
Quarterly Direct 10.0000
June 28, 2018
March 27, 2018
Dec 28, 2017
10.0000
10.0000
10.8458
11.0687
11.2582
0.1500
0.1500
0.1500
63.01%
21.14%
15.26%
>365 days
Up to 365 days
Equity Instruments
SCHEME FEATURES INVESTMENT OBJECTIVE
PORTFOLIO AS ON 31.05.2022
SCHEME PERFORMANCE
MATURITY PROFILE (% of NAV)
RATING PROFILE (% of NAV)
Company % of NAV Company % of NAV
Scheme CRISIL Hybrid 85+15-Conservative Index*
CRISIL Hybrid 85+15-Conservative Index*
CRISIL 10 year Gilt Index**
CRISIL 10 year Gilt Index**Scheme
1 Year 3.03 1.82 -3.88 10,303 10,182 9,612
3 Years 6.37 8.08 4.08 12,037 12,627 11,276
5 Years 5.79 7.74 4.31 13,252 14,518 12,350
Since Inception 8.18 NA NA 66,098 NA NA
Period
CAGR (%) Value of lumpsum investment of 10,000/- `
invested on inception date
stAbove returns are as on 31 May, 2022. Different plans shall have a different expense structure. The performance details provided herein are of Regular plan - Growth option. th st
Mr. Karan Doshi (equity portfolio) is managing the scheme from 7 January 2021 & Mr. Sanjay Pawar (debt portfolio) is managing the scheme from 1 January 2022. Total no. of
schemes managed by Mr. Karan Doshi is 3 & by Mr. Sanjay Pawar is 10. Past performance may or may not be sustained in the future. Load is not taken into consideration for
computation of performance. The Mutual Fund is not guaranteeing or promising or forecasting any returns. As the scheme was launched before the launch of the benchmark
index, benchmark index figures since inception or the required period are not available. *First Tier Benchmark, ** Additional Benchmark. NA : Not Available. The performance of
the scheme is benchmarked to the Total Return variant of the index.
78.17%
21.14%
0.59%
0.10%AAA/A1+ and Equivalent
Sovereign
Equity Instruments
Cash & Other Receivables
After payment of the IDCW, the per Unit NAV falls to the extent of the payout and statutory levy (if applicable). There is no guarantee or assurance to the unitholders as to the rate/quantum of neither IDCW nor that the IDCWs be paid regularly. For complete IDCW history please visit www.licmf.com.
Scheme Type: An open ended hybrid scheme investing predominantly In debt instruments
Inception/Allotment Date: June 01, 1998
Fund Size:
AUM as on 31/05/2022: ` 62.09 Cr
: 62.06 CrAverage AUM for May 2022 `
First Tier Benchmark: Crisil Hybrid 85 + 15 - Conservative Index
Minimum Investment (lumpsum): ` 5,000/-
Fund Manager:Name: Mr. Sanjay Pawar (Debt) & Mr. Karan Doshi (Equity);
Experience: 14+ years & 8+ years Total respectively
Expense Ratio:Regular: 2.27%; Direct: 1.34%(for detailed bifurcation on TER, please see page no 36)
Portfolio Metrics:Average Maturity 3.30 yearsMacaulay Duration 2.05 yearsModified Duration 1.98 yearsYTM 6.22%
25
Load Structure:Entry Load - NIL
Exit Load
Ÿ 12% of the units allotted shall be redeemed or switched out without any exit load, on or before completion of 12 months from the date of allotment of units.
Ÿ 1% on remaining units if redeemed or switched out on or before completion of 12 months from the date of allotment of units.
Ÿ Nil, if redeemed or switched out after completion of 12 months from the date of allotment of units.
0.59%Cash & Other Receivables
March 26, 2019 11.3539 0.8400
March 26, 2019 10.8612 0.8400
Income Distribution cum Capital Withdrawal (IDCW) History
Sept 28, 2021 12.3310
10.0000Apr 25, 2022 11.4860 0.0600
10.0000May 25, 2022 11.3224 0.0600
NAV as on May 31, 2022:
NAV Regular Plan Direct Plan
Growth ` 66.0980 ` 71.1381
Monthly IDCW ` 11.4463 ` 11.4253
Quarterly IDCW ` 11.7916 ` 14.3500
Yearly IDCW ` 11.8596 ` 12.7740
Equity Holdings
Automobiles
Mahindra & Mahindra Ltd.
Banks
ICICI Bank Ltd.
HDFC Bank Ltd.
Diversified FMCG
Hindustan Unilever Ltd.
Food Products
Nestle India Ltd.
IT - Software
Infosys Ltd.
Larsen & Toubro Infotech Ltd.
Tech Mahindra Ltd.
Petroleum Products
Reliance Industries Ltd.
Pharmaceuticals & Biotechnology
Abbott India Ltd.
Telecom - Services
Bharti Airtel Ltd.
Bharti Airtel Ltd. Partly Paid Up Fv 1.25
Equity Holdings Total
Corporate Debt
Non-convertible Debentures
NTPC Ltd.
Non-convertible Debentures Total
Corporate Debt Total
Government Bond And Treasury Bill
Government Bond
7.32% Govt Of India Red 28-01-2024
5.63% Govt Of India Red 12-04-2026
8.30% Govt Of India Red 02-07-2040
Government Bond Total
Treasury Bill
91 Days Tbill Red 23-06-2022
Treasury Bill Total
State Government Bond
7.8% Gujarat Sdl Red 01-06-2032
State Government Bond Total
Government Bond & Treasury Bill Total
Cash & Other Receivables Total
Grand Total
1.41%
1.41%
6.67%
4.81%
1.86%
1.79%
1.79%
1.63%
1.63%
6.70%
4.69%
1.09%
0.92%
1.89%
1.89%
0.20%
0.20%
0.85%
0.82%
0.03%
21.14%
0.10%
0.10%
0.10%
41.86%
3.86%
1.07%
46.79%
15.26%
15.26%
16.12%
16.12%
78.17%
0.59%
100.00%
Top 10 holdings
Mar 25, 2022 11.7522 0.0600
March 26, 2021 12.7622 0.7200
Feb 25, 2022 11.6522 0.0600
Dec 28, 2021 12.2724 0.1800
March 26, 2021 11.9994 0.7200
10.0000Mar 25, 2022 11.6534 0.0600
10.0000Apr 25, 2022 11.5766 0.0600
Factsheet May, 2022
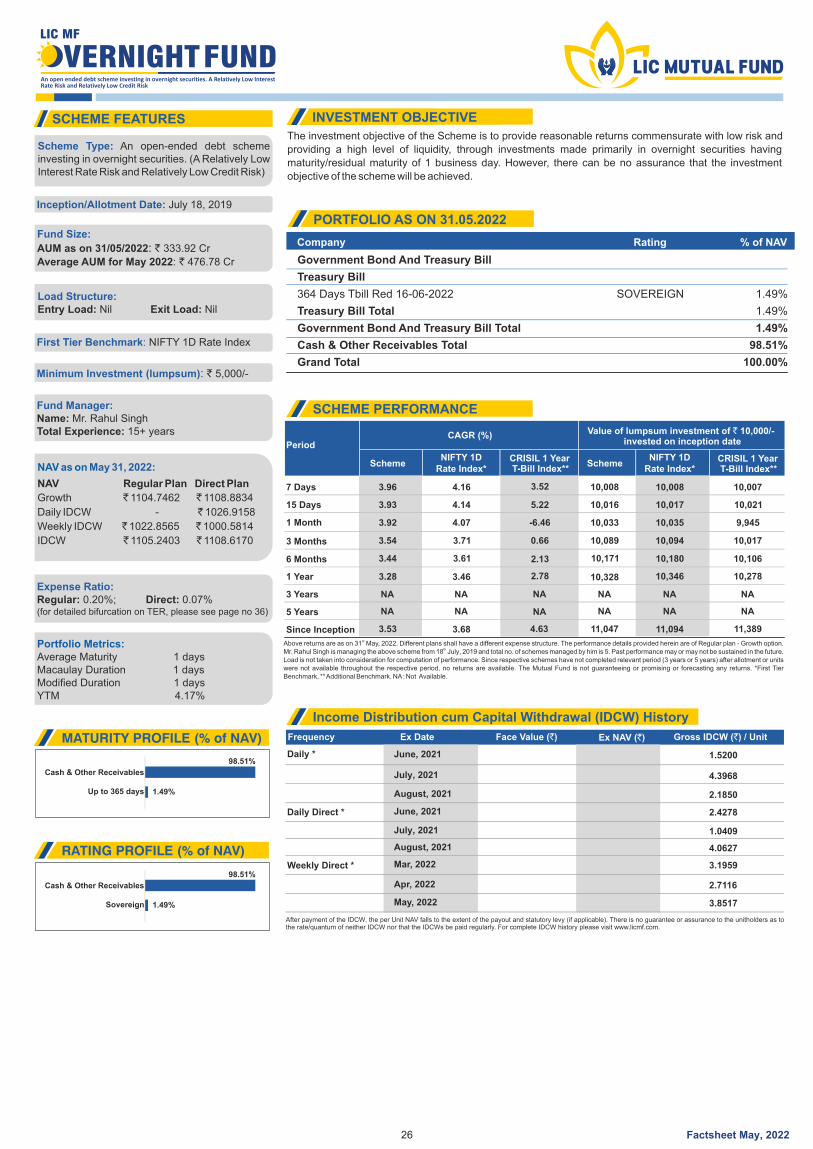
The investment objective of the Scheme is to provide reasonable returns commensurate with low risk and
providing a high level of liquidity, through investments made primarily in overnight securities having
maturity/residual maturity of 1 business day. However, there can be no assurance that the investment
objective of the scheme will be achieved.
SCHEME FEATURES INVESTMENT OBJECTIVE
Scheme Type: An open-ended debt scheme investing in overnight securities. (A Relatively Low Interest Rate Risk and Relatively Low Credit Risk)
Inception/Allotment Date: July 18, 2019
Fund Size:
AUM as on 31/05/2022: ` 333.92 Cr
: 476.78 CrAverage AUM for May 2022 `
Load Structure:Entry Load: Exit Load: Nil Nil
First Tier Benchmark: NIFTY 1D Rate Index
Minimum Investment (lumpsum): ` 5,000/-
Fund Manager:Name: Mr. Rahul Singh
15+ yearsTotal Experience:
Expense Ratio:Regular: 0.20%; Direct: 0.07%(for detailed bifurcation on TER, please see page no 36)
Portfolio Metrics:Average Maturity 1 daysMacaulay Duration 1 daysModified Duration 1 daysYTM 4.17%
26
NAV as on May 31, 2022:
NAV Regular Plan Direct Plan
Growth ̀ 1104.7462 ̀ 1108.8834
Daily IDCW - ̀ 1026.9158
Weekly IDCW ̀ 1022.8565 ̀ 1000.5814
IDCW ̀ 1105.2403 ̀ 1108.6170
SCHEME PERFORMANCE
SchemeNIFTY 1D
Rate Index*NIFTY 1D
Rate Index*CRISIL 1 Year T-Bill Index**
CRISIL 1 Year T-Bill Index**
Scheme
1 Year
7 Days 3.96 4.16 3.52 10,008 10,008 10,007
3 Years
15 Days 3.93 10,016
10,033
10,089
10,328
NA
10,171
NA
3.92
3.54
3.28
NA
3.44
NA
4.14 10,017
10,035
10,094
10,346
NA
10,180
NA
4.07
3.71
3.46
NA
3.61
NA
5.22 10,021
9,945
10,017
10,278
NA
10,106
NA
-6.46
0.66
2.78
NA
2.13
NA5 Years
1 Month
3 Months
6 Months
Since Inception 3.53 3.68 4.63 11,047 11,094 11,389
PeriodCAGR (%)
invested on inception date
stAbove returns are as on 31 May, 2022. Different plans shall have a different expense structure. The performance details provided herein are of Regular plan - Growth option.
thMr. Rahul Singh is managing the above scheme from 18 July, 2019 and total no. of schemes managed by him is 5. Past performance may or may not be sustained in the future. Load is not taken into consideration for computation of performance. Since respective schemes have not completed relevant period (3 years or 5 years) after allotment or units were not available throughout the respective period, no returns are available. The Mutual Fund is not guaranteeing or promising or forecasting any returns. *First Tier Benchmark, ** Additional Benchmark. NA : Not Available.
Value of lumpsum investment of 10,000/- `
An open ended debt scheme investing in overnight securities. A Relatively Low Interest Rate Risk and Relatively Low Credit Risk
LIC MF
FUNDVERNIGHT
98.51%
1.49%Up to 365 days
Cash & Other Receivables
MATURITY PROFILE (% of NAV) Frequency Ex Date Face Value ( )` Ex NAV ( )` Gross IDCW ( ) / Unit`
Daily *
Daily Direct *
Weekly Direct *
August, 2021
Mar, 2022
August, 2021
2.1850
3.1959
4.0627
After payment of the IDCW, the per Unit NAV falls to the extent of the payout and statutory levy (if applicable). There is no guarantee or assurance to the unitholders as to the rate/quantum of neither IDCW nor that the IDCWs be paid regularly. For complete IDCW history please visit www.licmf.com.
Income Distribution cum Capital Withdrawal (IDCW) History
June, 2021 2.4278
June, 2021 1.5200
July, 2021 1.0409
July, 2021 4.3968
May, 2022 3.8517
Apr, 2022 2.7116
PORTFOLIO AS ON 31.05.2022
Company Rating % of NAV
Government Bond And Treasury Bill
Treasury Bill
364 Days Tbill Red 16-06-2022
Treasury Bill Total
Government Bond And Treasury Bill Total
Cash & Other Receivables Total
Grand Total
SOVEREIGN 1.49%
1.49%
1.49%
98.51%
100.00%
Factsheet May, 2022
RATING PROFILE (% of NAV)
98.51%
1.49%Sovereign
Cash & Other Receivables
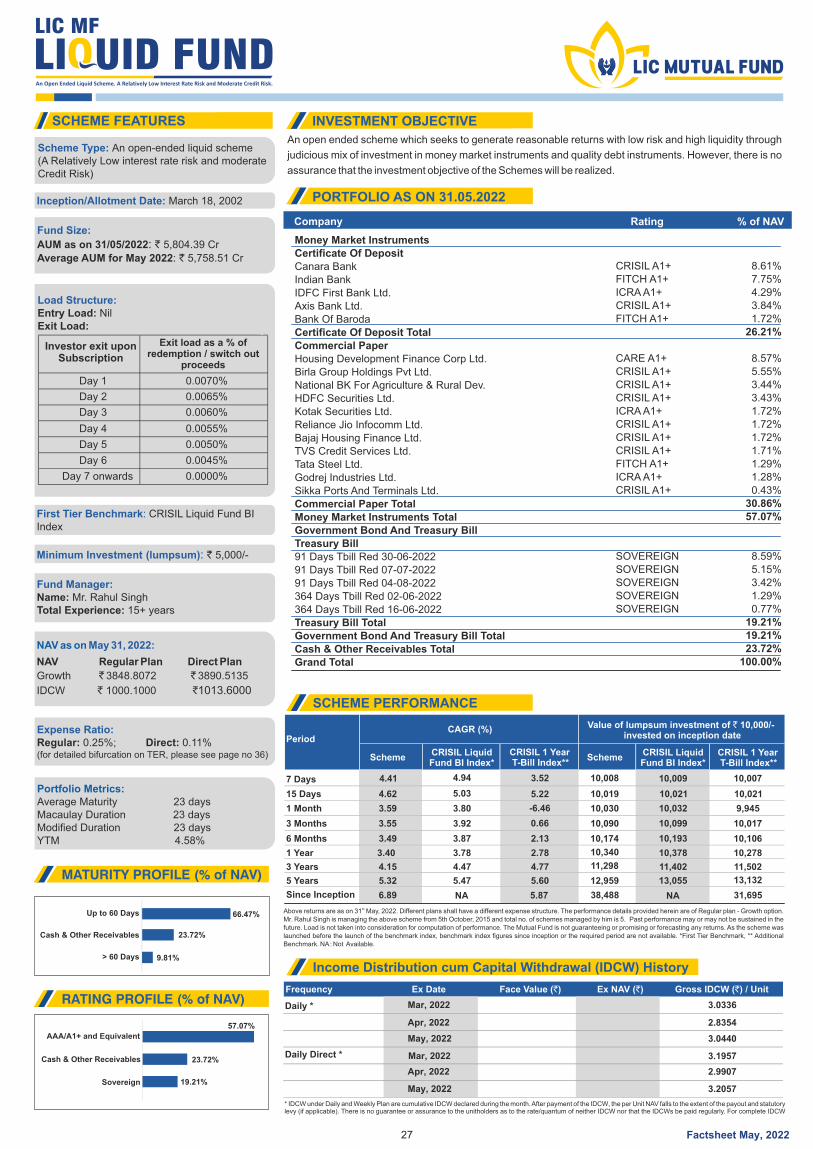
An open ended scheme which seeks to generate reasonable returns with low risk and high liquidity through
judicious mix of investment in money market instruments and quality debt instruments. However, there is no
assurance that the investment objective of the Schemes will be realized.
Frequency Ex Date Face Value ( )` Ex NAV ( )` Gross IDCW ( ) / Unit`
Daily *
Daily Direct * Mar, 2022 3.1957
66.47%
23.72%
Up to 60 Days
Cash & Other Receivables
SCHEME FEATURES INVESTMENT OBJECTIVE
PORTFOLIO AS ON 31.05.2022
SCHEME PERFORMANCE
MATURITY PROFILE (% of NAV)
RATING PROFILE (% of NAV)
57.07%
23.72%
AAA/A1+ and Equivalent
Sovereign
Cash & Other Receivables
19.21%
SchemeCRISIL LiquidFund BI Index*
CRISIL 1 Year T-Bill Index**
CRISIL 1 Year T-Bill Index**
Scheme
1 Year
7 Days
3.40
4.41
3.78
4.94
2.78
3.52
10,340
10,008
10,378
10,009
10,278
10,007
3 Years
15 Days
4.15
4.62
4.47
5.03
4.77
5.22
11,298
10,019
11,402
10,021
11,502
10,021
5 Years
1 Month
3 Months
6 Months
5.32
3.59
3.55
3.49
5.47
3.80
3.92
3.87
5.60
-6.46
0.66
2.13
12,959
10,030
10,090
10,174
13,055
10,032
10,099
10,193
13,132
9,945
10,017
10,106
Since Inception 6.89 NA 5.87 38,488 NA 31,695
PeriodCAGR (%)
invested on inception date
stAbove returns are as on 31 May, 2022. Different plans shall have a different expense structure. The performance details provided herein are of Regular plan - Growth option. Mr. Rahul Singh is managing the above scheme from 5th October, 2015 and total no. of schemes managed by him is 5. Past performance may or may not be sustained in the future. Load is not taken into consideration for computation of performance. The Mutual Fund is not guaranteeing or promising or forecasting any returns. As the scheme was launched before the launch of the benchmark index, benchmark index figures since inception or the required period are not available. *First Tier Benchmark, ** Additional Benchmark. NA : Not Available.
* IDCW under Daily and Weekly Plan are cumulative IDCW declared during the month. After payment of the IDCW, the per Unit NAV falls to the extent of the payout and statutory levy (if applicable). There is no guarantee or assurance to the unitholders as to the rate/quantum of neither IDCW nor that the IDCWs be paid regularly. For complete IDCW
Scheme Type: An open-ended liquid scheme(A Relatively Low interest rate risk and moderate Credit Risk)
Inception/Allotment Date: March 18, 2002
Fund Size:
AUM as on 31/05/2022: ` 5,804.39 Cr
: 5,758.51 CrAverage AUM for May 2022 `
Load Structure:Entry Load: Nil Exit Load:
First Tier Benchmark: CRISIL Liquid Fund BI Index
Minimum Investment (lumpsum): ` 5,000/-
Fund Manager:Name: Mr. Rahul Singh
15+ yearsTotal Experience:
Expense Ratio:Regular: 0.25%; Direct: 0.11%(for detailed bifurcation on TER, please see page no 36)
Portfolio Metrics:Average Maturity 23 daysMacaulay Duration 23 daysModified Duration 23 daysYTM 4.58%
27
Company Rating % of NAV
Value of lumpsum investment of 10,000/- `
Investor exit uponSubscription
Exit load as a % ofredemption / switch out
proceeds
Day 1 0.0070%
Day 2 0.0065%
Day 3 0.0060%
Day 4 0.0055%
Day 5 0.0050%
Day 6 0.0045%
Day 7 onwards 0.0000%
9.81%> 60 Days
Income Distribution cum Capital Withdrawal (IDCW) History
An Open Ended Liquid Scheme. A Relatively Low Interest Rate Risk and Moderate Credit Risk.
May, 2022 3.2057
May, 2022 3.0440
NAV as on May 31, 2022:
NAV Regular Plan Direct Plan
Growth ̀ 3848.8072 ̀ 3890.5135
IDCW ` 1000.1000 `1013.6000
Money Market InstrumentsCertificate Of DepositCanara BankIndian BankIDFC First Bank Ltd.Axis Bank Ltd.Bank Of BarodaCertificate Of Deposit TotalCommercial PaperHousing Development Finance Corp Ltd.Birla Group Holdings Pvt Ltd.National BK For Agriculture & Rural Dev.HDFC Securities Ltd.Kotak Securities Ltd.Reliance Jio Infocomm Ltd.Bajaj Housing Finance Ltd.TVS Credit Services Ltd.Tata Steel Ltd.Godrej Industries Ltd.Sikka Ports And Terminals Ltd.Commercial Paper TotalMoney Market Instruments TotalGovernment Bond And Treasury BillTreasury Bill91 Days Tbill Red 30-06-202291 Days Tbill Red 07-07-202291 Days Tbill Red 04-08-2022364 Days Tbill Red 02-06-2022364 Days Tbill Red 16-06-2022Treasury Bill TotalGovernment Bond And Treasury Bill TotalCash & Other Receivables TotalGrand Total
CRISIL A1+FITCH A1+ICRA A1+CRISIL A1+FITCH A1+
CARE A1+CRISIL A1+CRISIL A1+CRISIL A1+ICRA A1+CRISIL A1+CRISIL A1+CRISIL A1+FITCH A1+ICRA A1+CRISIL A1+
SOVEREIGNSOVEREIGNSOVEREIGNSOVEREIGNSOVEREIGN
8.61%7.75%4.29%3.84%1.72%
26.21%
8.57%5.55%3.44%3.43%1.72%1.72%1.72%1.71%1.29%1.28%0.43%
30.86%57.07%
8.59%5.15%3.42%1.29%0.77%
19.21%19.21%23.72%
100.00%
Apr, 2022 2.9907
Mar, 2022 3.0336
Apr, 2022 2.8354
CRISIL LiquidFund BI Index*
Factsheet May, 2022
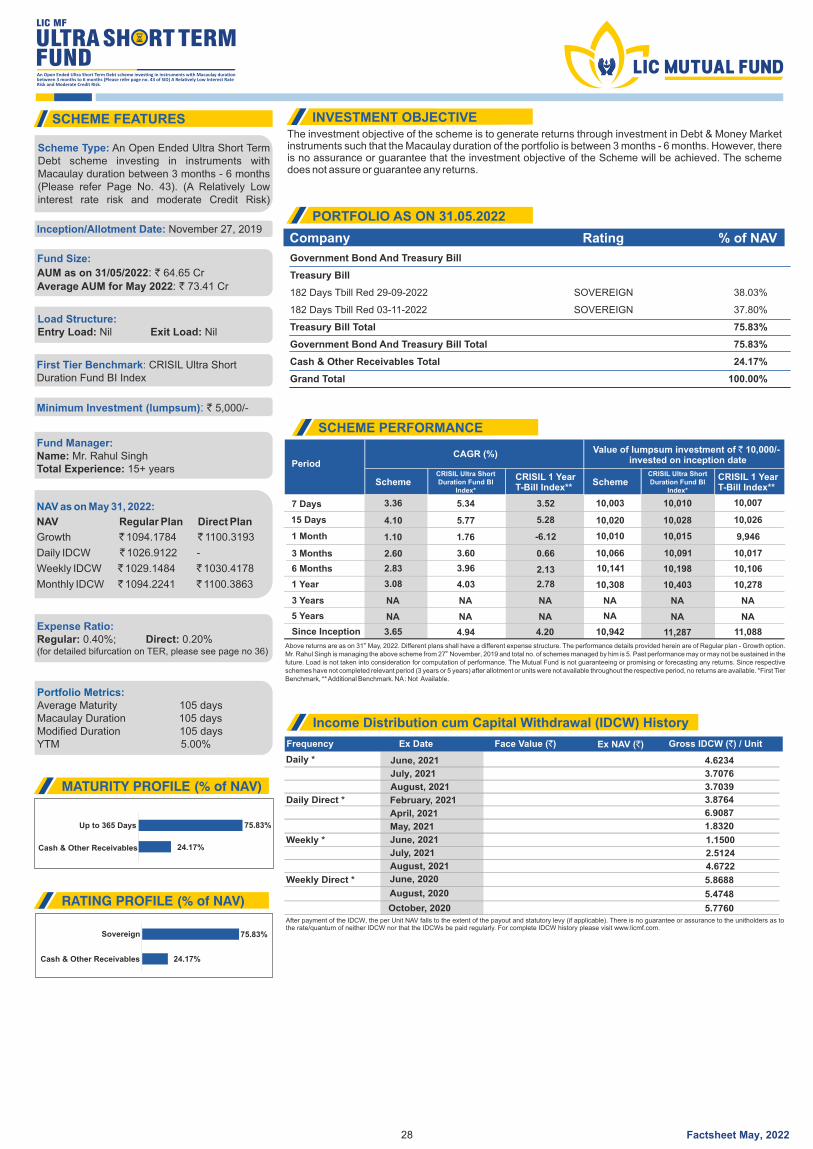
The investment objective of the scheme is to generate returns through investment in Debt & Money Market instruments such that the Macaulay duration of the portfolio is between 3 months - 6 months. However, there is no assurance or guarantee that the investment objective of the Scheme will be achieved. The scheme does not assure or guarantee any returns.
75.83%
24.17%Cash & Other Receivables
Up to 365 Days
SCHEME FEATURES INVESTMENT OBJECTIVE
MATURITY PROFILE (% of NAV)
RATING PROFILE (% of NAV)
Scheme Type: An Open Ended Ultra Short Term Debt scheme investing in instruments with Macaulay duration between 3 months - 6 months (Please refer Page No. 43). (A Relatively Low interest rate risk and moderate Credit Risk)
Inception/Allotment Date: November 27, 2019
Fund Size:
AUM as on 31/05/2022: ` 64.65 Cr
: 73.41 CrAverage AUM for May 2022 `
Load Structure:Entry Load: Exit Load: Nil Nil
First Tier Benchmark: CRISIL Ultra Short Duration Fund BI Index
Minimum Investment (lumpsum): ` 5,000/-
Fund Manager:Name: Mr. Rahul Singh
Experience: 15+ yearsTotal
Expense Ratio:Regular: 0.40%; Direct: 0.20%(for detailed bifurcation on TER, please see page no 36)
Portfolio Metrics:Average Maturity 105 daysMacaulay Duration 105 daysModified Duration 105 daysYTM 5.00%
28
75.83%Sovereign
Cash & Other Receivables
Frequency Ex Date Face Value ( )` Ex NAV ( )` Gross IDCW ( ) / Unit`
After payment of the IDCW, the per Unit NAV falls to the extent of the payout and statutory levy (if applicable). There is no guarantee or assurance to the unitholders as to the rate/quantum of neither IDCW nor that the IDCWs be paid regularly. For complete IDCW history please visit www.licmf.com.
Daily *
August, 2021 3.7039
Daily Direct *
May, 2021
October, 2020
1.8320
5.7760
Weekly *
Weekly Direct *
August, 2021 4.6722
June, 2020 5.8688
August, 2020 5.4748
February, 2021 3.8764
Income Distribution cum Capital Withdrawal (IDCW) History
April, 2021 6.9087
June, 2021 4.6234
June, 2021 1.1500
July, 2021 3.7076
July, 2021 2.5124
NAV as on May 31, 2022:
NAV Regular Plan Direct Plan
Growth ` 1094.1784 ` 1100.3193
Daily IDCW ̀ 1026.9122 -
Weekly IDCW ` 1029.1484 ` 1030.4178
Monthly IDCW ` 1094.2241 ` 1100.3863
An Open Ended Ultra Short Term Debt scheme investing in instruments with Macaulay duration between 3 months to 6 months (Please refer page no. 43 of SID) A Relatively Low Interest Rate Risk and Moderate Credit Risk.
SCHEME PERFORMANCE
SchemeCRISIL Ultra ShortDuration Fund BI
Index*
CRISIL 1 Year T-Bill Index**
CRISIL 1 Year T-Bill Index**
Scheme
1 Year
7 Days
3 Years
15 Days
10,308
NA
10,141
10,003
10,020
10,010
10,066
NA
3.08
NA
2.83
3.36
4.10
1.10
2.60
NA
10,403
NA
10,198
10,010
10,028
10,015
10,091
NA
4.03
NA
3.96
5.34
5.77
1.76
3.60
NA
10,278
NA
10,106
10,007
10,026
9,946
10,017
NA
2.78
NA
2.13
3.52
5.28
-6.12
0.66
NA5 Years
1 Month
3 Months
6 Months
Since Inception 3.65 4.94 4.20 10,942 11,287 11,088
PeriodCAGR (%)
invested on inception date
stAbove returns are as on 31 May, 2022. Different plans shall have a different expense structure. The performance details provided herein are of Regular plan - Growth option. thMr. Rahul Singh is managing the above scheme from 27 November, 2019 and total no. of schemes managed by him is 5. Past performance may or may not be sustained in the
future. Load is not taken into consideration for computation of performance. The Mutual Fund is not guaranteeing or promising or forecasting any returns. Since respective schemes have not completed relevant period (3 years or 5 years) after allotment or units were not available throughout the respective period, no returns are available. *First Tier Benchmark, ** Additional Benchmark. NA : Not Available.
Value of lumpsum investment of 10,000/- `
CRISIL Ultra ShortDuration Fund BI
Index*
Factsheet May, 2022
24.17%
PORTFOLIO AS ON 31.05.2022
Company Rating % of NAV
Government Bond And Treasury Bill
Treasury Bill
182 Days Tbill Red 29-09-2022
182 Days Tbill Red 03-11-2022
Treasury Bill Total
Government Bond And Treasury Bill Total
Cash & Other Receivables Total
Grand Total
SOVEREIGN
SOVEREIGN
38.03%
37.80%
75.83%
75.83%
24.17%
100.00%
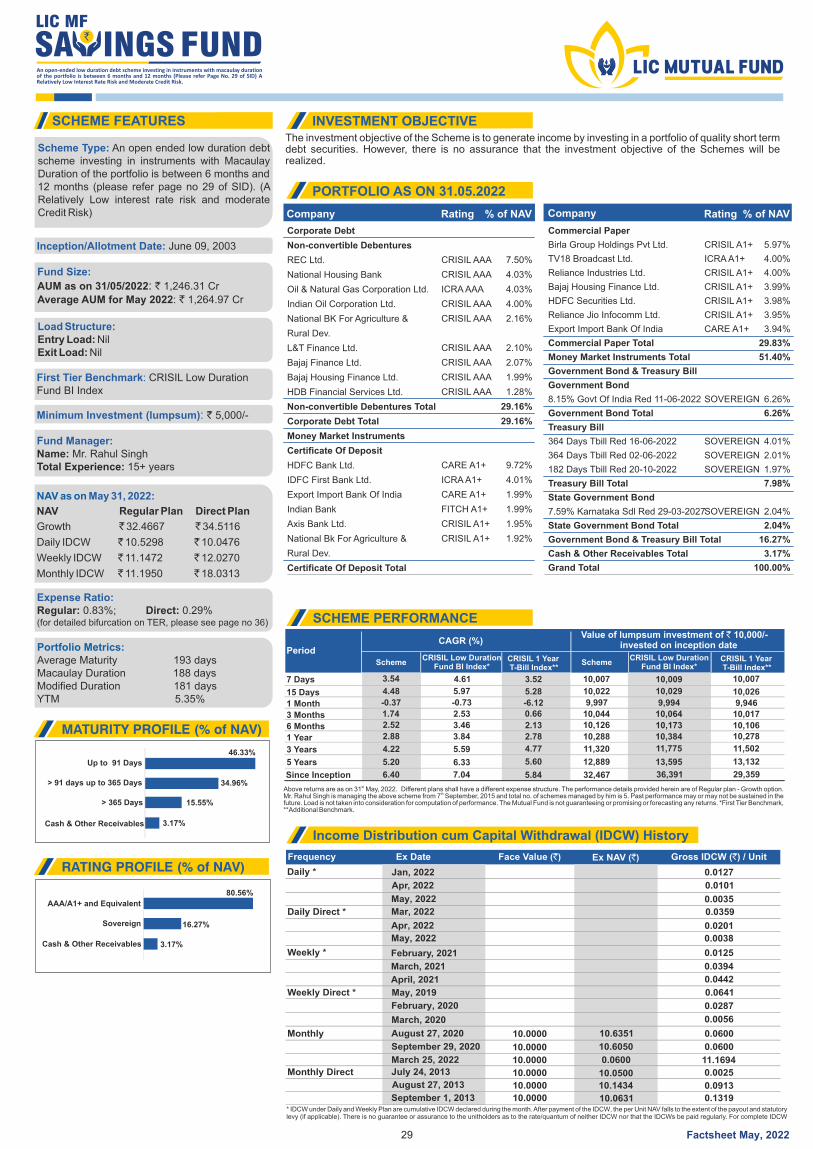
The investment objective of the Scheme is to generate income by investing in a portfolio of quality short term debt securities. However, there is no assurance that the investment objective of the Schemes will be realized.
Frequency Ex Date Face Value ( )` Ex NAV ( )` Gross IDCW ( ) / Unit`
Daily *
Daily Direct * Mar, 2022
May, 2022
0.0359
0.0035
Weekly *
April, 2021 0.0442
Weekly Direct *
March, 2020
May, 2019
0.0056
0.0641
Monthly 10.0000
March 25, 2022 10.0000
10.0000
0.0600 11.1694
Monthly Direct July 24, 2013 10.0000 10.0500 0.0025
August 27, 2013 10.0000 10.1434 0.0913
September 1, 2013 10.0000 10.0631 0.1319
46.33%
34.96%
15.55%
3.17%
Up to 91 Days
> 365 Days
> 91 days up to 365 Days
Cash & Other Receivables
SCHEME FEATURES INVESTMENT OBJECTIVE
PORTFOLIO AS ON 31.05.2022
SCHEME PERFORMANCE
MATURITY PROFILE (% of NAV)
RATING PROFILE (% of NAV)
80.56%
16.27%
3.17%
AAA/A1+ and Equivalent
Sovereign
Cash & Other Receivables
SchemeCRISIL Low Duration
Fund BI Index*CRISIL 1 Year T-Bill Index**
CRISIL 1 Year T-Bill Index**
Scheme
1 Year
6 Months
3 Months
1 Month
15 Days
7 Days
2.88
2.52
1.74
-0.37
4.48
3.54
3.84
3.46
2.53
-0.73
5.97
4.61
2.78
2.13
0.66 -6.12
5.28
3.52
10,288
10,126
10,044
9,997
10,022
10,007
10,384
10,173
10,064
9,994
10,029
10,009
10,278 10,106
10,017
9,946
10,026
10,007
3 Years 4.22 5.59 4.77 11,320 11,775 11,502
5 Years 5.20 6.33 5.60 12,889 13,595 13,132
Since Inception 6.40 7.04 5.84 32,467 36,391 29,359
PeriodCAGR (%)
Value of lumpsum investment of 10,000/- `invested on inception date
stAbove returns are as on 31 May, 2022. Different plans shall have a different expense structure. The performance details provided herein are of Regular plan - Growth option. th
Mr. Rahul Singh is managing the above scheme from 7 September, 2015 and total no. of schemes managed by him is 5. Past performance may or may not be sustained in the future. Load is not taken into consideration for computation of performance. The Mutual Fund is not guaranteeing or promising or forecasting any returns. *First Tier Benchmark, **Additional Benchmark.
* IDCW under Daily and Weekly Plan are cumulative IDCW declared during the month. After payment of the IDCW, the per Unit NAV falls to the extent of the payout and statutory levy (if applicable). There is no guarantee or assurance to the unitholders as to the rate/quantum of neither IDCW nor that the IDCWs be paid regularly. For complete IDCW
Scheme Type: An open ended low duration debt scheme investing in instruments with Macaulay Duration of the portfolio is between 6 months and 12 months (please refer page no 29 of SID). (A Relatively Low interest rate risk and moderate Credit Risk)
Inception/Allotment Date: June 09, 2003
Fund Size:
AUM as on 31/05/2022: ` 1,246.31 Cr
: 1,264.97 CrAverage AUM for May 2022 `
Load Structure:Entry Load: Nil Exit Load: Nil
First Tier Benchmark: CRISIL Low Duration Fund BI Index
Minimum Investment (lumpsum): ` 5,000/-
Fund Manager:Name: Mr. Rahul Singh
15+ yearsTotal Experience:
Expense Ratio:Regular: 0.83%; Direct: 0.29%(for detailed bifurcation on TER, please see page no 36)
Portfolio Metrics:Average Maturity 193 daysMacaulay Duration 188 daysModified Duration 181 daysYTM 5.35%
29
February, 2020 0.0287
Apr, 2022 0.0101
Company Rating % of NAV
0.060010.6351August 27, 2020
February, 2021 0.0125
March, 2021 0.0394
Income Distribution cum Capital Withdrawal (IDCW) History
An open-ended low duration debt scheme investing in instruments with macaulay duration of the portfolio is between 6 months and 12 months (Please refer Page No. 29 of SID) A Relatively Low Interest Rate Risk and Moderate Credit Risk.
Jan, 2022 0.0127
May, 2022 0.0038
NAV as on May 31, 2022:
NAV Regular Plan Direct Plan
Growth ` 32.4667 ` 34.5116
Daily IDCW ` 10.5298 ` 10.0476
Weekly IDCW ` 11.1472 ` 12.0270
Monthly IDCW ` 11.1950 ` 18.0313
Corporate Debt
Non-convertible Debentures
REC Ltd.
National Housing Bank
Oil & Natural Gas Corporation Ltd.
Indian Oil Corporation Ltd.
National BK For Agriculture &
Rural Dev.
L&T Finance Ltd.
Bajaj Finance Ltd.
Bajaj Housing Finance Ltd.
HDB Financial Services Ltd.
Non-convertible Debentures Total
Corporate Debt Total
Money Market Instruments
Certificate Of Deposit
HDFC Bank Ltd.
IDFC First Bank Ltd.
Export Import Bank Of India
Indian Bank
Axis Bank Ltd.
National Bk For Agriculture &
Rural Dev.
Certificate Of Deposit Total
CRISIL AAA
CRISIL AAA
ICRA AAA
CRISIL AAA
CRISIL AAA
CRISIL AAA
CRISIL AAA
CRISIL AAA
CRISIL AAA
CARE A1+
ICRA A1+
CARE A1+
FITCH A1+
CRISIL A1+
CRISIL A1+
7.50%
4.03%
4.03%
4.00%
2.16%
2.10%
2.07%
1.99%
1.28%
29.16%
29.16%
9.72%
4.01%
1.99%
1.99%
1.95%
1.92%
Company Rating % of NAV
Commercial Paper
Birla Group Holdings Pvt Ltd.
TV18 Broadcast Ltd.
Reliance Industries Ltd.
Bajaj Housing Finance Ltd.
HDFC Securities Ltd.
Reliance Jio Infocomm Ltd.
Export Import Bank Of India
Commercial Paper Total
Money Market Instruments Total
Government Bond & Treasury Bill
Government Bond
8.15% Govt Of India Red 11-06-2022
Government Bond Total
Treasury Bill
364 Days Tbill Red 16-06-2022
364 Days Tbill Red 02-06-2022
182 Days Tbill Red 20-10-2022
Treasury Bill Total
State Government Bond
7.59% Karnataka Sdl Red 29-03-2027
State Government Bond Total
Government Bond & Treasury Bill Total
Cash & Other Receivables Total
Grand Total
CRISIL A1+
ICRA A1+
CRISIL A1+
CRISIL A1+
CRISIL A1+
CRISIL A1+
CARE A1+
SOVEREIGN
SOVEREIGN
SOVEREIGN
SOVEREIGN
SOVEREIGN
5.97%
4.00%
4.00%
3.99%
3.98%
3.95%
3.94%
29.83%
51.40%
6.26%
6.26%
4.01%
2.01%
1.97%
7.98%
2.04%
2.04%
16.27%
3.17%
100.00%
Apr, 2022 0.0201
September 29, 2020 10.6050 0.0600
CRISIL Low DurationFund BI Index*
Factsheet May, 2022
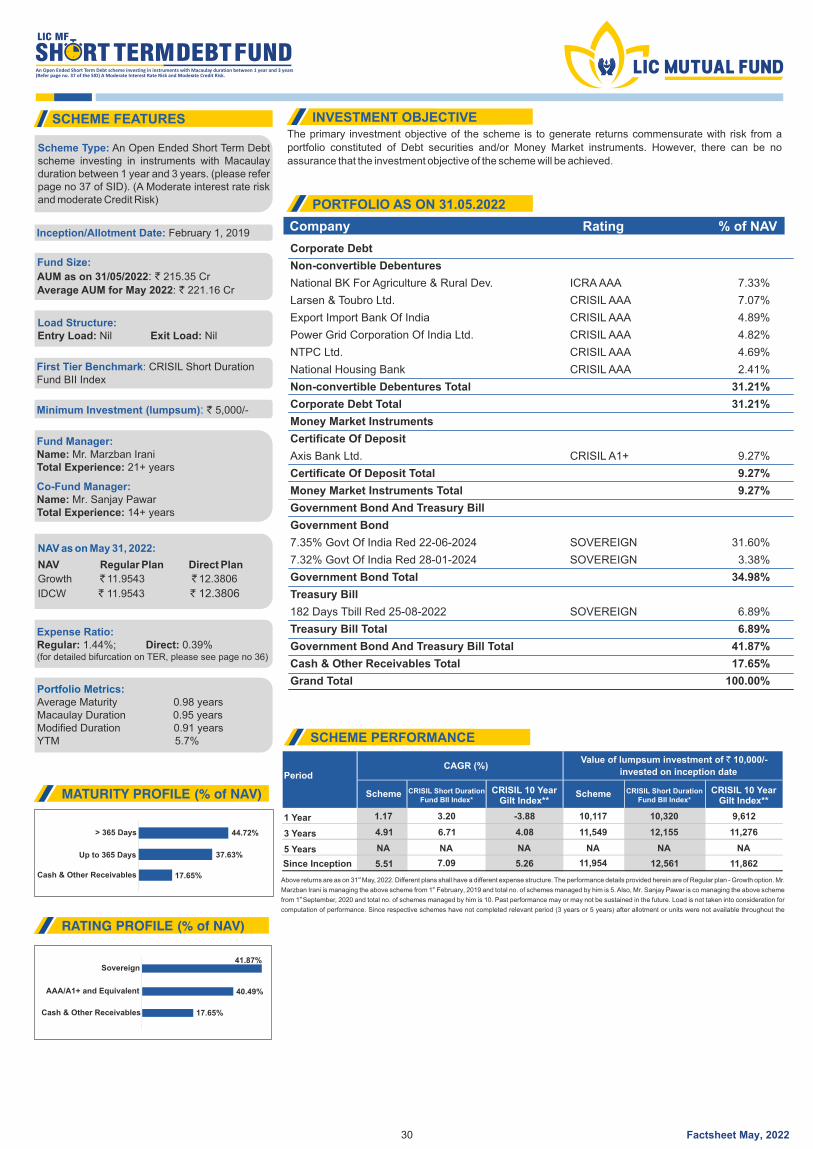
The primary investment objective of the scheme is to generate returns commensurate with risk from a
portfolio constituted of Debt securities and/or Money Market instruments. However, there can be no
assurance that the investment objective of the scheme will be achieved.
44.72%
37.63%
17.65%Cash & Other Receivables
> 365 Days
Up to 365 Days
SCHEME FEATURES INVESTMENT OBJECTIVE
PORTFOLIO AS ON 31.05.2022
MATURITY PROFILE (% of NAV)
RATING PROFILE (% of NAV)
Company Rating % of NAV
Scheme Type: An Open Ended Short Term Debt scheme investing in instruments with Macaulay duration between 1 year and 3 years. (please refer page no 37 of SID). (A Moderate interest rate risk and moderate Credit Risk)
Inception/Allotment Date: February 1, 2019
Fund Size:
AUM as on 31/05/2022: ` 215.35 Cr
: 221.16 CrAverage AUM for May 2022 `
Load Structure:Entry Load: Exit Load: Nil Nil
First Tier Benchmark: CRISIL Short Duration Fund BII Index
Minimum Investment (lumpsum): ` 5,000/-
Fund Manager:Name: Mr. Marzban Irani
Experience: 21+ yearsTotal
Expense Ratio:Regular: 1.44%; Direct: 0.39%(for detailed bifurcation on TER, please see page no 36)
Portfolio Metrics:Average Maturity 0.98 yearsMacaulay Duration 0.95 yearsModified Duration 0.91 yearsYTM 5.7%
NAV as on May 31, 2022:
NAV Regular Plan Direct Plan
Growth ̀ 11.9543 ̀ 12.3806
IDCW ` 11.9543 ` 12.3806
30
41.87%
40.49%
17.65%
AAA/A1+ and Equivalent
Cash & Other Receivables
Sovereign
SCHEME PERFORMANCE
Scheme CRISIL Short DurationFund BII Index*
CRISIL 10 YearGilt Index**
Scheme
1 Year 1.17 3.20 -3.88 10,117 10,320 9,612
3 Years 4.91 11,549
NA NA
6.71 12,155
NA NA
4.08 11,276
NA NA5 Years
Since Inception 5.51 7.09 5.26 11,954 12,561 11,862
PeriodCAGR (%)
Value of lumpsum investment of 10,000/- `
invested on inception date
stAbove returns are as on 31 May, 2022. Different plans shall have a different expense structure. The performance details provided herein are of Regular plan - Growth option. Mr. stMarzban Irani is managing the above scheme from 1 February, 2019 and total no. of schemes managed by him is 5. Also, Mr. Sanjay Pawar is co managing the above scheme
st from 1 September, 2020 and total no. of schemes managed by him is 10. Past performance may or may not be sustained in the future. Load is not taken into consideration for
computation of performance. Since respective schemes have not completed relevant period (3 years or 5 years) after allotment or units were not available throughout the
Co-Fund Manager:Name: Mr. Sanjay PawarTotal Experience: 14+ years
CRISIL 10 YearGilt Index**
An Open Ended Short Term Debt scheme investing in instruments with Macaulay duration between 1 year and 3 years (Refer page no. 37 of the SID) A Moderate Interest Rate Risk and Moderate Credit Risk.
Corporate Debt
Non-convertible Debentures
National BK For Agriculture & Rural Dev.
Larsen & Toubro Ltd.
Export Import Bank Of India
Power Grid Corporation Of India Ltd.
NTPC Ltd.
National Housing Bank
Non-convertible Debentures Total
Corporate Debt Total
Money Market Instruments
Certificate Of Deposit
Axis Bank Ltd.
Certificate Of Deposit Total
Money Market Instruments Total
Government Bond And Treasury Bill
Government Bond
7.35% Govt Of India Red 22-06-2024
7.32% Govt Of India Red 28-01-2024
Government Bond Total
Treasury Bill
182 Days Tbill Red 25-08-2022
Treasury Bill Total
Government Bond And Treasury Bill Total
Cash & Other Receivables Total
Grand Total
ICRA AAA
CRISIL AAA
CRISIL AAA
CRISIL AAA
CRISIL AAA
CRISIL AAA
CRISIL A1+
SOVEREIGN
SOVEREIGN
SOVEREIGN
7.33%
7.07%
4.89%
4.82%
4.69%
2.41%
31.21%
31.21%
9.27%
9.27%
9.27%
31.60%
3.38%
34.98%
6.89%
6.89%
41.87%
17.65%
100.00%
CRISIL Short DurationFund BII Index*
Factsheet May, 2022
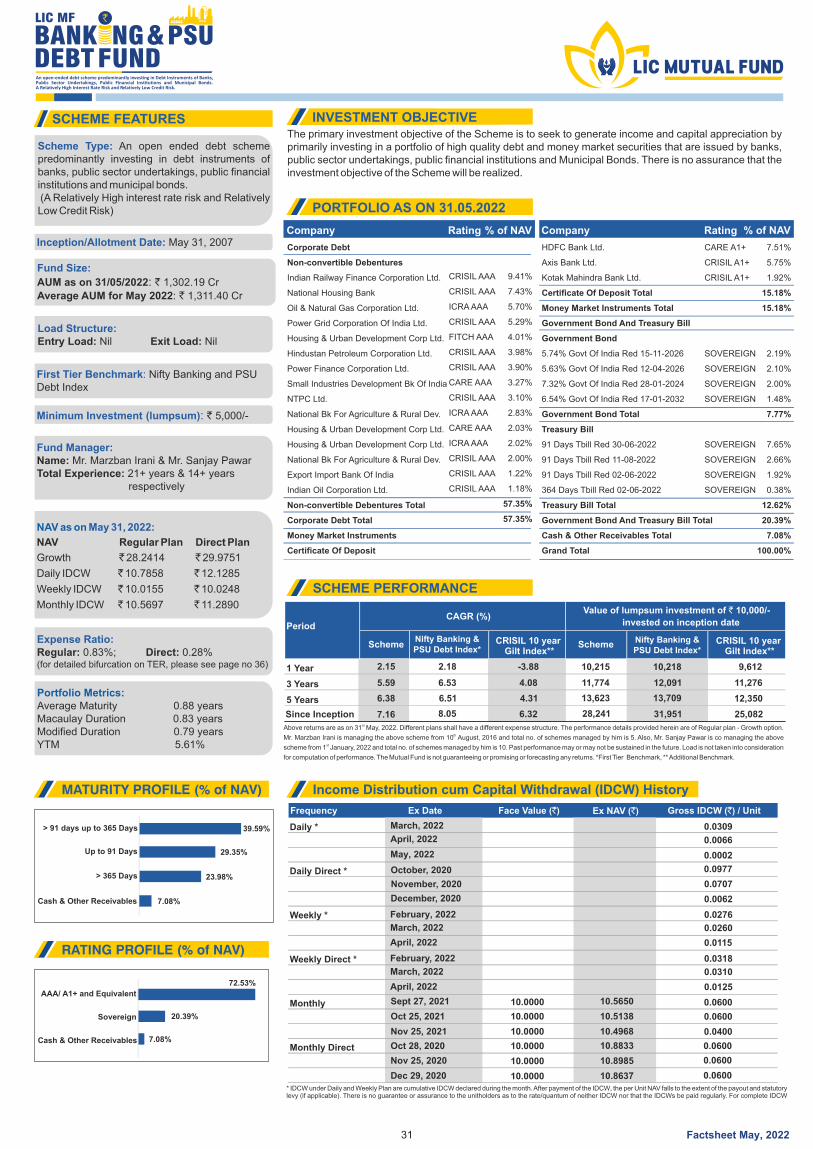
The primary investment objective of the Scheme is to seek to generate income and capital appreciation by primarily investing in a portfolio of high quality debt and money market securities that are issued by banks, public sector undertakings, public financial institutions and Municipal Bonds. There is no assurance that the investment objective of the Scheme will be realized.
39.59%
29.35%
23.98%
Up to 91 Days
Cash & Other Receivables
> 365 Days
72.53%
20.39%
7.08%
AAA/ A1+ and Equivalent
Sovereign
Cash & Other Receivables
SCHEME FEATURES INVESTMENT OBJECTIVE
MATURITY PROFILE (% of NAV)
RATING PROFILE (% of NAV)
Scheme Type: An open ended debt scheme predominantly investing in debt instruments of banks, public sector undertakings, public financial institutions and municipal bonds. (A Relatively High interest rate risk and Relatively Low Credit Risk)
Inception/Allotment Date: May 31, 2007
Fund Size:
AUM as on 31/05/2022: ` 1,302.19 Cr
: 1,311.40 CrAverage AUM for May 2022 `
Load Structure:Entry Load: Exit Load: Nil Nil
First Tier Benchmark: Nifty Banking and PSU Debt Index
Minimum Investment (lumpsum): ` 5,000/-
Expense Ratio:Regular: 0.83%; Direct: 0.28%(for detailed bifurcation on TER, please see page no 36)
Portfolio Metrics:Average Maturity 0.88 yearsMacaulay Duration 0.83 yearsModified Duration 0.79 yearsYTM 5.61%
31
7.08%
> 91 days up to 365 Days
SCHEME PERFORMANCE
SchemeNifty Banking & PSU Debt Index*
Nifty Banking & PSU Debt Index*
CRISIL 10 year Gilt Index**
Scheme
1 Year 2.15 2.18 -3.88 10,215 10,218 9,612
3 Years 5.59 6.53 4.08 11,774 12,091 11,276
5 Years 6.38 6.51 4.31 13,623 13,709 12,350
Since Inception 7.16 8.05 6.32 28,241 31,951 25,082
PeriodCAGR (%)
Value of lumpsum investment of 10,000/- `
invested on inception date
stAbove returns are as on 31 May, 2022. Different plans shall have a different expense structure. The performance details provided herein are of Regular plan - Growth option.
thMr. Marzban Irani is managing the above scheme from 10 August, 2016 and total no. of schemes managed by him is 5. Also, Mr. Sanjay Pawar is co managing the above stscheme from 1 January, 2022 and total no. of schemes managed by him is 10. Past performance may or may not be sustained in the future. Load is not taken into consideration
for computation of performance. The Mutual Fund is not guaranteeing or promising or forecasting any returns. *First Tier Benchmark, ** Additional Benchmark.
CRISIL 10 year Gilt Index**
An open-ended debt scheme predominantly investing in Debt Instruments of Banks, Public Sector Undertakings, Public Financial Institutions and Municipal Bonds.A Relatively High Interest Rate Risk and Relatively Low Credit Risk.
Fund Manager:Name: Mr. Marzban Irani & Mr. Sanjay Pawar
Experience: 21+ years & 14+ years Total respectively
NAV as on May 31, 2022:
NAV Regular Plan Direct Plan
Growth ` ` 28.2414 29.9751
Daily IDCW ` 10.7858 ` 12.1285
Weekly IDCW ` 10.0155 ` 10.0248
Monthly IDCW ` 10.5697 ` 11.2890
Frequency Ex Date Face Value ( )` Ex NAV ( )` Gross IDCW ( ) / Unit`
Daily *
Daily Direct *
December, 2020 0.0062
Weekly *
Weekly Direct *
April, 2022
April, 2022
0.0125
0.0115
Monthly
Nov 25, 2021 10.0000
10.0000
10.4968 0.0400
Monthly Direct
Dec 29, 2020 10.0000
10.0000
10.0000
10.8637 0.0600
0.0600
* IDCW under Daily and Weekly Plan are cumulative IDCW declared during the month. After payment of the IDCW, the per Unit NAV falls to the extent of the payout and statutory levy (if applicable). There is no guarantee or assurance to the unitholders as to the rate/quantum of neither IDCW nor that the IDCWs be paid regularly. For complete IDCW
0.0600
October, 2020 0.0977
Oct 28, 2020 10.8833
November, 2020 0.0707
Nov 25, 2020 10.8985
10.0000
0.0600
0.0600
Income Distribution cum Capital Withdrawal (IDCW) History
Sept 27, 2021 10.5650
Oct 25, 2021 10.5138
0.0002May, 2022
February, 2022 0.0276
February, 2022 0.0318
March, 2022 0.0310
0.0309March, 2022
0.0066April, 2022
March, 2022 0.0260
Factsheet May, 2022
PORTFOLIO AS ON 31.05.2022
Company CompanyRating Rating% of NAV % of NAV
HDFC Bank Ltd.
Axis Bank Ltd.
Kotak Mahindra Bank Ltd.
Certificate Of Deposit Total
Money Market Instruments Total
Government Bond And Treasury Bill
Government Bond
5.74% Govt Of India Red 15-11-2026
5.63% Govt Of India Red 12-04-2026
7.32% Govt Of India Red 28-01-2024
6.54% Govt Of India Red 17-01-2032
Government Bond Total
Treasury Bill
91 Days Tbill Red 30-06-2022
91 Days Tbill Red 11-08-2022
91 Days Tbill Red 02-06-2022
364 Days Tbill Red 02-06-2022
Treasury Bill Total
Government Bond And Treasury Bill Total
Cash & Other Receivables Total
Grand Total
CARE A1+
CRISIL A1+
CRISIL A1+
SOVEREIGN
SOVEREIGN
SOVEREIGN
SOVEREIGN
SOVEREIGN
SOVEREIGN
SOVEREIGN
SOVEREIGN
7.51%
5.75%
1.92%
15.18%
15.18%
2.19%
2.10%
2.00%
1.48%
7.77%
7.65%
2.66%
1.92%
0.38%
12.62%
20.39%
7.08%
100.00%
Corporate Debt
Non-convertible Debentures
Indian Railway Finance Corporation Ltd.
National Housing Bank
Oil & Natural Gas Corporation Ltd.
Power Grid Corporation Of India Ltd.
Housing & Urban Development Corp Ltd.
Hindustan Petroleum Corporation Ltd.
Power Finance Corporation Ltd.
Small Industries Development Bk Of India
NTPC Ltd.
National Bk For Agriculture & Rural Dev.
Housing & Urban Development Corp Ltd.
Housing & Urban Development Corp Ltd.
National Bk For Agriculture & Rural Dev.
Export Import Bank Of India
Indian Oil Corporation Ltd.
Non-convertible Debentures Total
Corporate Debt Total
Money Market Instruments
Certificate Of Deposit
CRISIL AAA
CRISIL AAA
ICRA AAA
CRISIL AAA
FITCH AAA
CRISIL AAA
CRISIL AAA
CARE AAA
CRISIL AAA
ICRA AAA
CARE AAA
ICRA AAA
CRISIL AAA
CRISIL AAA
CRISIL AAA
9.41%
7.43%
5.70%
5.29%
4.01%
3.98%
3.90%
3.27%
3.10%
2.83%
2.03%
2.02%
2.00%
1.22%
1.18%
57.35%
57.35%
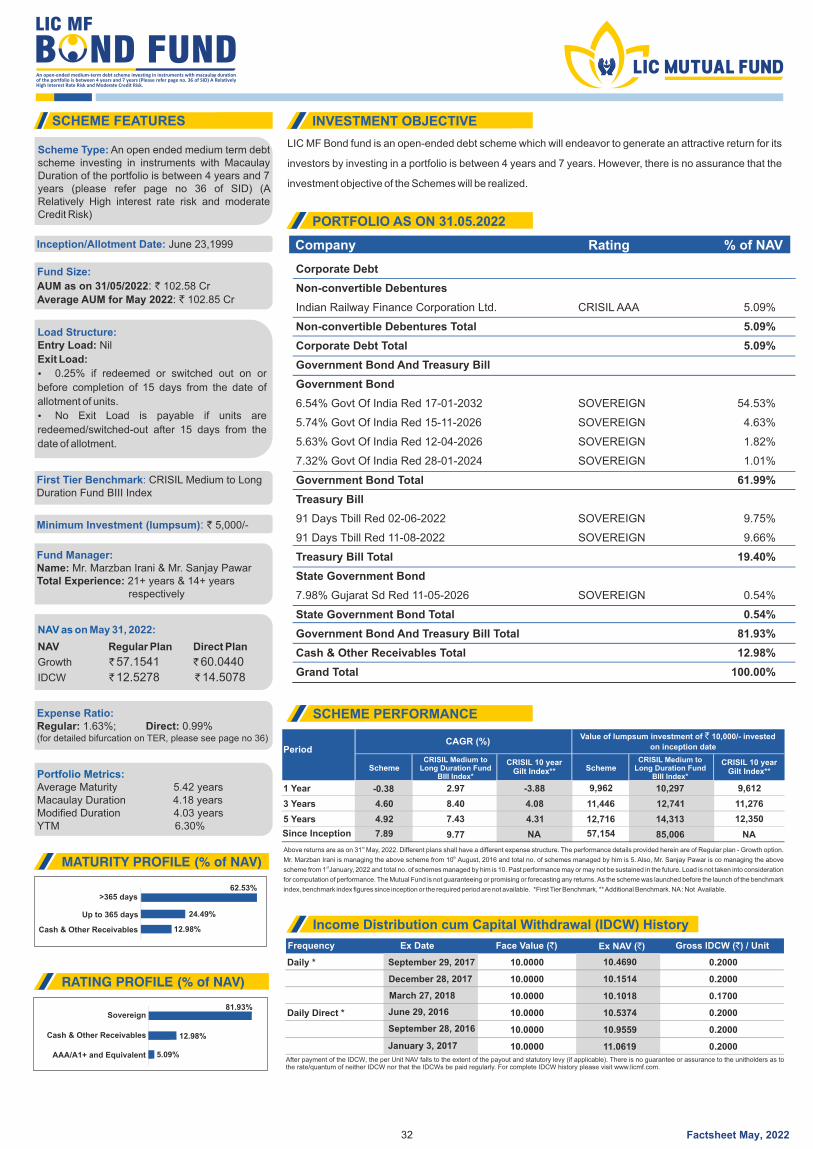
LIC MF Bond fund is an open-ended debt scheme which will endeavor to generate an attractive return for its
investors by investing in a portfolio is between 4 years and 7 years. However, there is no assurance that the
investment objective of the Schemes will be realized.
SCHEME FEATURES INVESTMENT OBJECTIVE
Scheme Type: An open ended medium term debt scheme investing in instruments with Macaulay Duration of the portfolio is between 4 years and 7 years (please refer page no 36 of SID) (A Relatively High interest rate risk and moderate Credit Risk)
Inception/Allotment Date: June 23,1999
Fund Size:
AUM as on 31/05/2022: ` 102.58 Cr
: 102.85 CrAverage AUM for May 2022 `
Load Structure:Entry Load: Nil
Exit Load:
Ÿ 0.25% if redeemed or switched out on or
before completion of 15 days from the date of
allotment of units.
Ÿ No Exit Load is payable if units are
redeemed/switched-out after 15 days from the
date of allotment.
First Tier Benchmark: CRISIL Medium to Long Duration Fund BIII Index
Minimum Investment (lumpsum): ` 5,000/-
Expense Ratio:Regular: 1.63%; Direct: 0.99%(for detailed bifurcation on TER, please see page no 36)
Portfolio Metrics:Average Maturity 5.42 yearsMacaulay Duration 4.18 yearsModified Duration 4.03 yearsYTM 6.30%
NAV as on May 31, 2022:
NAV Regular Plan Direct Plan
Growth ̀ 57.1541 ̀ 60.0440
IDCW ̀ 12.5278 ̀ 14.5078
32
Frequency Ex Date Face Value ( )` Ex NAV ( )` Gross IDCW ( ) / Unit`
Daily * 10.0000 0.2000
10.0000 0.2000
March 27, 2018
December 28, 2017
September 29, 2017
10.0000 10.1018
10.1514
10.4690
0.1700
Daily Direct * June 29, 2016 10.0000 10.5374 0.2000
September 28, 2016 10.0000 10.9559 0.2000
January 3, 2017 10.0000 11.0619 0.2000
After payment of the IDCW, the per Unit NAV falls to the extent of the payout and statutory levy (if applicable). There is no guarantee or assurance to the unitholders as to the rate/quantum of neither IDCW nor that the IDCWs be paid regularly. For complete IDCW history please visit www.licmf.com.
Income Distribution cum Capital Withdrawal (IDCW) History
81.93%Sovereign
Cash & Other Receivables
RATING PROFILE (% of NAV)
12.98%
AAA/A1+ and Equivalent 5.09%
Fund Manager:Name: Mr. Marzban Irani & Mr. Sanjay Pawar
Experience: 21+ years & 14+ years Total respectively
>365 days
MATURITY PROFILE (% of NAV)
Cash & Other Receivables
Up to 365 days
62.53%
12.98%
24.49%
Company Rating % of NAV
PORTFOLIO AS ON 31.05.2022
Corporate Debt
Non-convertible Debentures
Indian Railway Finance Corporation Ltd.
Non-convertible Debentures Total
Corporate Debt Total
Government Bond And Treasury Bill
Government Bond
6.54% Govt Of India Red 17-01-2032
5.74% Govt Of India Red 15-11-2026
5.63% Govt Of India Red 12-04-2026
7.32% Govt Of India Red 28-01-2024
Government Bond Total
Treasury Bill
91 Days Tbill Red 02-06-2022
91 Days Tbill Red 11-08-2022
Treasury Bill Total
State Government Bond
7.98% Gujarat Sd Red 11-05-2026
State Government Bond Total
Government Bond And Treasury Bill Total
Cash & Other Receivables Total
Grand Total
CRISIL AAA
SOVEREIGN
SOVEREIGN
SOVEREIGN
SOVEREIGN
SOVEREIGN
SOVEREIGN
SOVEREIGN
5.09%
5.09%
5.09%
54.53%
4.63%
1.82%
1.01%
61.99%
9.75%
9.66%
19.40%
0.54%
0.54%
81.93%
12.98%
100.00%
An open-ended medium-term debt scheme investing in instruments with macaulay duration of the portfolio is between 4 years and 7 years (Please refer page no. 36 of SID) A Relatively High Interest Rate Risk and Moderate Credit Risk.
SCHEME PERFORMANCE
SchemeCRISIL Medium to
Long Duration FundBIII Index*
CRISIL 10 year Gilt Index**
CRISIL 10 year Gilt Index**Scheme
1 Year -0.38 2.97 -3.88 9,962 10,297 9,612
3 Years 4.60 8.40 4.08 11,446 12,741 11,276
5 Years 4.92 7.43 4.31 12,716 14,313 12,350
Since Inception 7.89 9.77 NA 57,154 85,006 NA
PeriodCAGR (%)
Value of lumpsum investment of 10,000/- invested `on inception date
stAbove returns are as on 31 May, 2022. Different plans shall have a different expense structure. The performance details provided herein are of Regular plan - Growth option. thMr. Marzban Irani is managing the above scheme from 10 August, 2016 and total no. of schemes managed by him is 5. Also, Mr. Sanjay Pawar is co managing the above
st scheme from 1 January, 2022 and total no. of schemes managed by him is 10. Past performance may or may not be sustained in the future. Load is not taken into consideration
for computation of performance. The Mutual Fund is not guaranteeing or promising or forecasting any returns. As the scheme was launched before the launch of the benchmark
index, benchmark index figures since inception or the required period are not available. *First Tier Benchmark, ** Additional Benchmark. NA : Not Available.
CRISIL Medium toLong Duration Fund
BIII Index*
Factsheet May, 2022
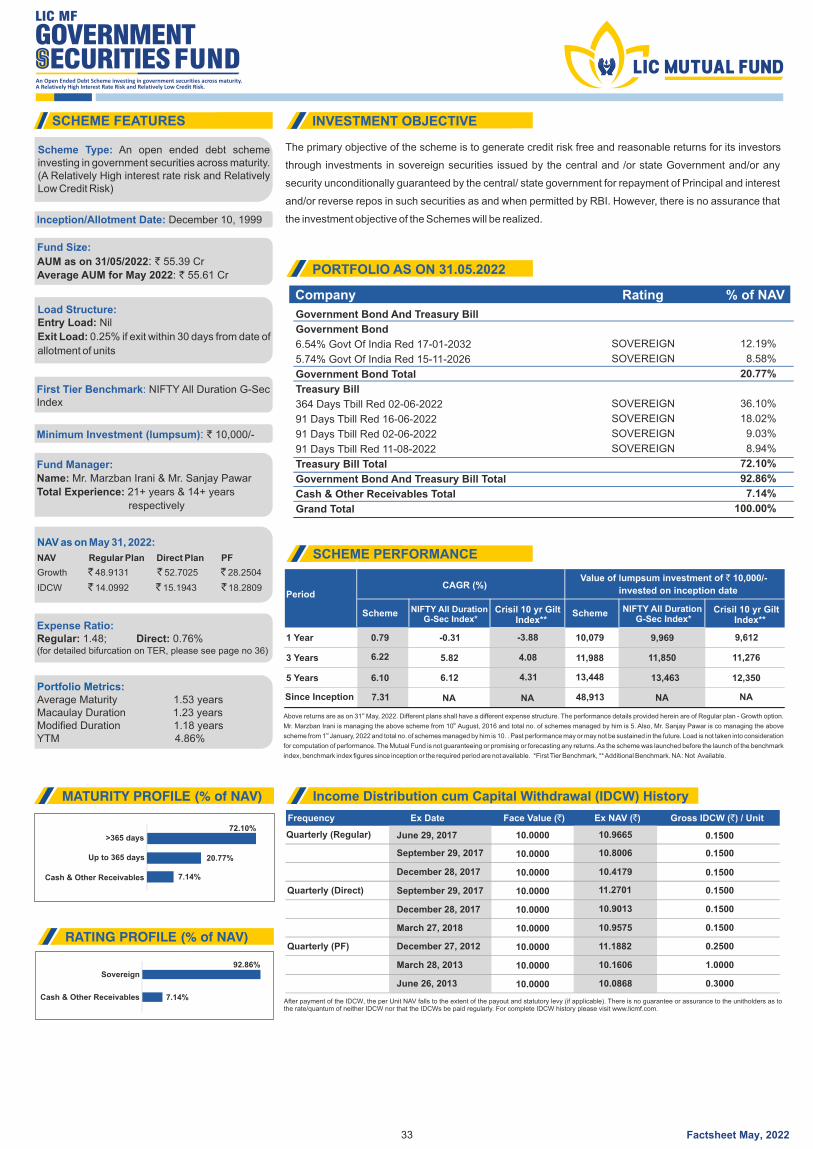
The primary objective of the scheme is to generate credit risk free and reasonable returns for its investors
through investments in sovereign securities issued by the central and /or state Government and/or any
security unconditionally guaranteed by the central/ state government for repayment of Principal and interest
and/or reverse repos in such securities as and when permitted by RBI. However, there is no assurance that
the investment objective of the Schemes will be realized.
SCHEME FEATURES INVESTMENT OBJECTIVE
92.86%
7.14%
Sovereign
Cash & Other Receivables
RATING PROFILE (% of NAV)
Scheme Type: An open ended debt scheme investing in government securities across maturity. (A Relatively High interest rate risk and Relatively Low Credit Risk)
Inception/Allotment Date: December 10, 1999
Fund Size:
AUM as on 31/05/2022: ` 55.39 Cr
: 55.61 CrAverage AUM for May 2022 `
Load Structure:Entry Load: Nil
Exit Load: 0.25% if exit within 30 days from date of
allotment of units
First Tier Benchmark: NIFTY All Duration G-Sec Index
Minimum Investment (lumpsum): ` 10,000/-
Expense Ratio:Regular: 1.48; Direct: 0.76%(for detailed bifurcation on TER, please see page no 36)
Portfolio Metrics:Average Maturity 1.53 yearsMacaulay Duration 1.23 yearsModified Duration 1.18 yearsYTM 4.86%
NAV as on May 31, 2022:
NAV Regular Plan Direct Plan PF
Growth ̀ 48.9131 ̀ 52.7025 ̀ 28.2504
IDCW ̀ 14.0992 ̀ 15.1943 ̀ 18.2809
33
Frequency Ex Date Face Value ( )` Ex NAV ( )` Gross IDCW ( ) / Unit`
Quarterly (Regular) 10.0000 0.1500
10.0000 0.1500
December 28, 2017
September 29, 2017
June 29, 2017
March 27, 2018
December 28, 2017
September 29, 2017
10.0000 10.4179
10.8006
10.9665
0.1500
Quarterly (Direct) 10.0000 0.1500
10.0000 0.1500
10.0000 10.9575
10.9013
11.2701
0.1500
Quarterly (PF) December 27, 2012 10.0000 11.1882 0.2500
March 28, 2013 10.0000 10.1606 1.0000
June 26, 2013 10.0000 10.0868 0.3000
After payment of the IDCW, the per Unit NAV falls to the extent of the payout and statutory levy (if applicable). There is no guarantee or assurance to the unitholders as to the rate/quantum of neither IDCW nor that the IDCWs be paid regularly. For complete IDCW history please visit www.licmf.com.
Income Distribution cum Capital Withdrawal (IDCW) History
72.10%>365 days
MATURITY PROFILE (% of NAV)
7.14%Cash & Other Receivables
20.77%Up to 365 days
SCHEME PERFORMANCE
Scheme NIFTY All Duration G-Sec Index*
Crisil 10 yr Gilt Index**
Crisil 10 yr Gilt Index**
Scheme
1 Year 0.79 -3.88 10,079 9,612
3 Years 6.22 4.08 11,988 11,276
5 Years 6.10 4.31 13,448 12,350
Since Inception 7.31 NA
6.12
5.82
-0.31
NA 48,913 NA
13,463
11,850
9,969
NA
PeriodCAGR (%)
Value of lumpsum investment of 10,000/- `
invested on inception date
stAbove returns are as on 31 May, 2022. Different plans shall have a different expense structure. The performance details provided herein are of Regular plan - Growth option. th
Mr. Marzban Irani is managing the above scheme from 10 August, 2016 and total no. of schemes managed by him is 5. Also, Mr. Sanjay Pawar is co managing the above st
scheme from 1 January, 2022 and total no. of schemes managed by him is 10. . Past performance may or may not be sustained in the future. Load is not taken into consideration
for computation of performance. The Mutual Fund is not guaranteeing or promising or forecasting any returns. As the scheme was launched before the launch of the benchmark
index, benchmark index figures since inception or the required period are not available. *First Tier Benchmark, ** Additional Benchmark. NA : Not Available.
NIFTY All Duration G-Sec Index*
An Open Ended Debt Scheme investing in government securities across maturity. A Relatively High Interest Rate Risk and Relatively Low Credit Risk.
Fund Manager:
Name: Mr. Marzban Irani & Mr. Sanjay Pawar
Experience: 21+ years & 14+ years Total
respectively
Company Rating % of NAV
PORTFOLIO AS ON 31.05.2022
Government Bond And Treasury Bill
Government Bond
6.54% Govt Of India Red 17-01-2032
5.74% Govt Of India Red 15-11-2026
Government Bond Total
Treasury Bill
364 Days Tbill Red 02-06-2022
91 Days Tbill Red 16-06-2022
91 Days Tbill Red 02-06-2022
91 Days Tbill Red 11-08-2022
Treasury Bill Total
Government Bond And Treasury Bill Total
Cash & Other Receivables Total
Grand Total
SOVEREIGN
SOVEREIGN
SOVEREIGN
SOVEREIGN
SOVEREIGN
SOVEREIGN
12.19%
8.58%
20.77%
36.10%
18.02%
9.03%
8.94%
72.10%
92.86%
7.14%
100.00%
Factsheet May, 2022
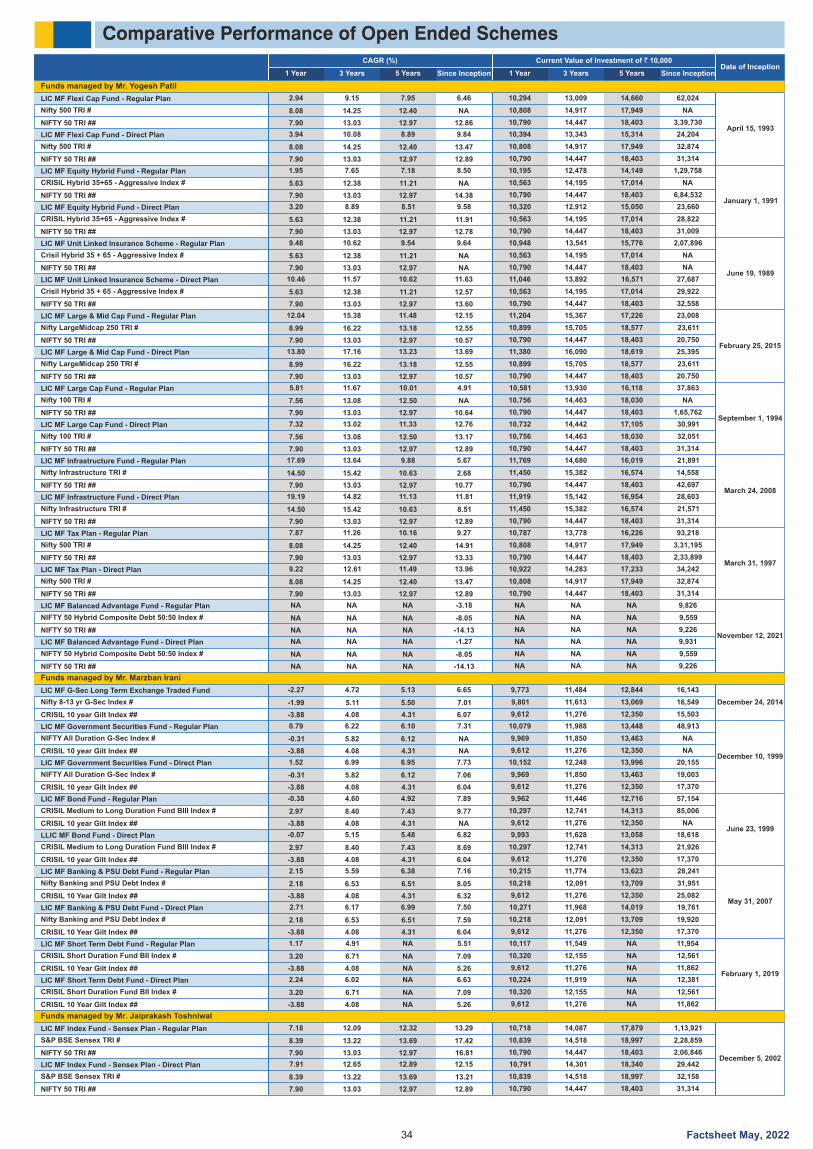
Comparative Performance of Open Ended Schemes
7.95 14,660 2.94 10,294 9.15 13,0096.46 62,024
CAGR (%)Date of Inception
5 Years 5 Years1 Year 1 Year3 Years 3 YearsSince Inception Since Inception
Current Value of Investment of ` 10,000
April 15, 1993
LIC MF Flexi Cap Fund - Regular Plan
Funds managed by Mr. Yogesh Patil
Nifty 500 TRI #
NIFTY 50 TRI ##
12.40 17,9498.08 10,808 14.25 14,917 NA NA
12.97 18,403 7.90 10,790 13.03 14,44712.86 3,39,730
8.89 15,314 3.94 10,394 10.08 13,3439.84 24,204LIC MF Flexi Cap Fund - Direct Plan
Nifty 500 TRI #
NIFTY 50 TRI ##
12.40 17,9498.08 10,808 14.25 14,917 13.47 32,874
12.97 18,403 7.90 10,790 13.03 14,44712.89 31,314
7.18 14,149 1.95 10,195 7.65 12,4788.50 1,29,758
January 1, 1991
LIC MF Equity Hybrid Fund - Regular Plan
CRISIL Hybrid 35+65 - Aggressive Index #
NIFTY 50 TRI ##
11.21 17,0145.63 10,563 12.38 14,195 NA NA
12.97 18,403 7.90 10,790 13.03 14,447 14.38 6,84,532
8.51 15,050 3.20 10,320 8.89 12,9129.58 23,660LIC MF Equity Hybrid Fund - Direct Plan
CRISIL Hybrid 35+65 - Aggressive Index #
NIFTY 50 TRI ##
11.21 17,0145.63 10,563 12.38 14,195 11.91 28,822
12.97 18,403 7.90 10,790 13.03 14,44712.78 31,009
9.54 15,776 9.48 10,948 10.62 13,5419.64 2,07,896
June 19, 1989
LIC MF Unit Linked Insurance Scheme - Regular Plan
Crisil Hybrid 35 + 65 - Aggressive Index #
NIFTY 50 TRI ##
11.21 17,0145.63 10,563 12.38 14,195 NA NA
12.97 18,403 7.90 10,790 13.03 14,447NA NA
10.62 16,571 10.46 11,046 11.57 13,89211.63 27,687LIC MF Unit Linked Insurance Scheme - Direct Plan
Crisil Hybrid 35 + 65 - Aggressive Index #
NIFTY 50 TRI ##
11.21 17,0145.63 10,563 12.38 14,195 12.57 29,922
12.97 18,403 7.90 10,790 13.03 14,44713.60 32,558
11.48 17,226 12.04 11,20415.38 15,367 12.15 23,008
February 25, 2015
LIC MF Large & Mid Cap Fund - Regular Plan
Nifty LargeMidcap 250 TRI #
NIFTY 50 TRI ##
13.18 18,577 8.99 10,899 16.22 15,70512.55 23,611
12.97 18,403 7.90 10,790 13.03 14,447 10.57 20,750
13.23 18,619 13.80 11,380 17.16 16,09013.69 25,395LIC MF Large & Mid Cap Fund - Direct Plan
Nifty LargeMidcap 250 TRI #
NIFTY 50 TRI ##
13.18 18,5778.99 10,899 16.22 15,705 12.55 23,611
12.97 18,403 7.90 10,790 13.03 14,44710.57 20,750
10.01 16,118 5.81 10,581 11.67 13,9304.91 37,863
September 1, 1994
LIC MF Large Cap Fund - Regular Plan
Nifty 100 TRI #
NIFTY 50 TRI ##
12.50 18,0307.56 10,756 13.08 14,463 NA NA
12.97 18,403 7.90 10,790 13.03 14,447 10.64 1,65,762
11.33 17,105 7.32 10,732 13.02 14,44212.76 30,991LIC MF Large Cap Fund - Direct Plan
Nifty 100 TRI #
NIFTY 50 TRI ##
12.50 18,0307.56 10,756 13.08 14,463 13.17 32,051
12.97 18,403 7.90 10,790 13.03 14,44712.89 31,314
9.88 16,019 17.69 11,769 13.64 14,6805.67 21,891
March 24, 2008
LIC MF Infrastructure Fund - Regular Plan
Nifty Infrastructure TRI #
NIFTY 50 TRI ##
10.63 16,57414.50 11,450 15.42 15,382 2.68 14,558
12.97 18,403 7.90 10,790 13.03 14,44710.77 42,697
11.13 16,954 19.19 11,919 14.82 15,14211.81 28,603 LIC MF Infrastructure Fund - Direct Plan
Nifty Infrastructure TRI #
NIFTY 50 TRI ##
10.63 16,574 14.50 11,450 15.42 15,382 8.51 21,571
12.97 18,403 7.90 10,790 13.03 14,44712.89 31,314
10.16 16,226 7.87 10,787 11.26 13,7789.27 93,218
March 31, 1997
LIC MF Tax Plan - Regular Plan
Nifty 500 TRI #
NIFTY 50 TRI ##
12.40 17,9498.08 10,808 14.25 14,917 14.91 3,31,195
12.97 18,403 7.90 10,790 13.03 14,44713.33 2,33,899
11.49 17,233 9.22 10,922 12.61 14,28313.96 34,242LIC MF Tax Plan - Direct Plan
Nifty 500 TRI #
NIFTY 50 TRI ##
12.40 17,9498.08 10,808 14.25 14,917 13.47 32,874
12.97 18,403 7.90 10,790 13.03 14,44712.89 31,314
5.13 12,844 -2.27 9,773 4.72 11,4846.65 16,143
December 24, 2014
LIC MF G-Sec Long Term Exchange Traded Fund
Nifty 8-13 yr G-Sec Index #
CRISIL 10 year Gilt Index ##
5.50 13,069-1.99 9,801 5.11 11,613 7.01 16,549
4.31 12,350 -3.88 9,612 4.08 11,2766.07 15,503
6.10 13,448 0.79 10,079 6.22 11,9887.31 48,913LIC MF Government Securities Fund - Regular Plan
NIFTY All Duration G-Sec Index #
CRISIL 10 year Gilt Index ##
6.12 13,463-0.31 9,969 5.82 11,850 NA NA
4.31 12,350 -3.88 9,612 4.08 11,276NA NA
6.95 13,996 1.52 10,152 6.99 12,2487.73 20,155December 10, 1999
LIC MF Government Securities Fund - Direct Plan
NIFTY All Duration G-Sec Index #
CRISIL 10 year Gilt Index ##
6.12 13,463-0.31 9,969 5.82 11,850 7.06 19,003
4.31 12,350 -3.88 9,612 4.08 11,2766.04 17,370
4.92 12,716 -0.38 9,962 4.60 11,4467.89 57,154LIC MF Bond Fund - Regular Plan
CRISIL Medium to Long Duration Fund BIII Index #
CRISIL 10 year Gilt Index ##
7.43 14,3132.97 10,297 8.40 12,741 9.77 85,006
4.31 12,350 -3.88 9,612 4.08 11,276NA NA
5.48 13,058 -0.07 9,993 5.15 11,6286.82 18,618June 23, 1999
LLIC MF Bond Fund - Direct Plan
CRISIL Medium to Long Duration Fund BIII Index #
CRISIL 10 year Gilt Index ##
7.43 14,3132.97 10,297 8.40 12,741 8.69 21,926
4.31 12,350 -3.88 9,612 4.08 11,2766.04 17,370
6.38 13,623 2.15 10,215 5.59 11,7747.16 28,241LIC MF Banking & PSU Debt Fund - Regular Plan
Nifty Banking and PSU Debt Index #
CRISIL 10 Year Gilt Index ##
6.51 13,7092.18 10,218 6.53 12,091 8.05 31,951
4.31 12,350 -3.88 9,612 4.08 11,2766.32 25,082
6.99 14,019 2.71 10,271 6.17 11,9687.50 19,761May 31, 2007
LIC MF Banking & PSU Debt Fund - Direct Plan
Nifty Banking and PSU Debt Index #
CRISIL 10 Year Gilt Index ##
6.51 13,7092.18 10,218 6.53 12,091 7.59 19,920
4.31 12,350 -3.88 9,612 4.08 11,2766.04 17,370
NA NA 1.17 10,117 4.91 11,549 5.51 11,954 LIC MF Short Term Debt Fund - Regular Plan
CRISIL Short Duration Fund BII Index #
CRISIL 10 Year Gilt Index ##
NA NA3.20 10,320 6.71 12,155 7.09 12,561
NA NA -3.88 9,612 4.08 11,276 5.26 11,862
NA NA 2.24 10,224 6.02 11,919 6.63 12,381 February 1, 2019
LIC MF Short Term Debt Fund - Direct Plan
CRISIL Short Duration Fund BII Index #
CRISIL 10 Year Gilt Index ##
NA NA3.20 10,320 6.71 12,155 7.09 12,561
NA NA -3.88 9,612 4.08 11,276 5.26 11,862
7.96 14,67413.06 11,302 11.05 13,696 6.58 63,625
12.32 17,879 7.18 10,718 12.09 14,08713.29 1,13,921
December 5, 2002
LIC MF Index Fund - Sensex Plan - Regular Plan
S&P BSE Sensex TRI #
NIFTY 50 TRI ##
13.69 18,9978.39 10,839 13.22 14,518 17.42 2,28,859
12.97 18,403 7.90 10,790 13.03 14,44716.81 2,06,846
12.89 18,340 7.91 10,791 12.65 14,30112.15 29,442LIC MF Index Fund - Sensex Plan - Direct Plan
S&P BSE Sensex TRI #
NIFTY 50 TRI ##
13.69 18,9978.39 10,839 13.22 14,518 13.21 32,158
12.97 18,403 7.90 10,790 13.03 14,44712.89 31,314
Funds managed by Mr. Marzban Irani
Funds managed by Mr. Jaiprakash Toshniwal
34 Factsheet May, 2022
NA NANA NANA NA -3.18 9,826
November 12, 2021
LIC MF Balanced Advantage Fund - Regular Plan
NIFTY 50 Hybrid Composite Debt 50:50 Index #
NIFTY 50 TRI ##
NA NANA NANA NA -8.05 9,559
NA NANA NANA NA-14.13 9,226
NA NANA NANA NA -1.27 9,931 LIC MF Balanced Advantage Fund - Direct Plan
NIFTY 50 Hybrid Composite Debt 50:50 Index #
NIFTY 50 TRI ##
NA NANA NANA NA -8.05 9,559
NA NANA NANA NA-14.13 9,226
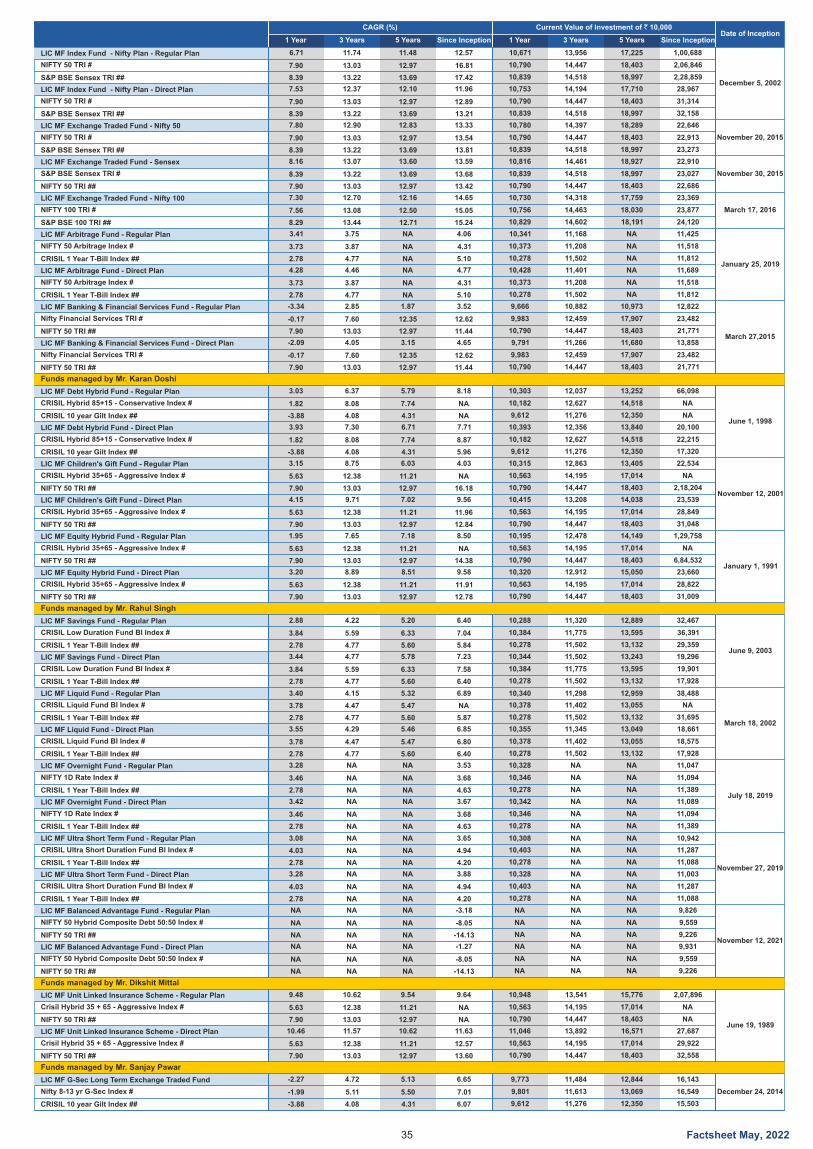
12.83 18,289 7.80 10,780 12.90 14,39713.33 22,646
CAGR (%)Date of Inception
5 Years 5 Years1 Year 1 Year3 Years 3 YearsSince Inception Since Inception
Current Value of Investment of ` 10,000
November 20, 2015
LIC MF Exchange Traded Fund - Nifty 50
NIFTY 50 TRI #
S&P BSE Sensex TRI ##
12.97 18,4037.90 10,790 13.03 14,447 13.54 22,913
13.69 18,997 8.39 10,839 13.22 14,51813.81 23,273
13.60 18,927 8.16 10,816 13.07 14,46113.59 22,910LIC MF Exchange Traded Fund - Sensex
S&P BSE Sensex TRI #
NIFTY 50 TRI ##
13.69 18,9978.39 10,839 13.22 14,518 13.68 23,027
12.97 18,403 7.90 10,790 13.03 14,44713.42 22,686
12.16 17,759 7.30 10,730 12.70 14,31814.65 23,369LIC MF Exchange Traded Fund - Nifty 100
NIFTY 100 TRI #
S&P BSE 100 TRI ##
12.50 18,0307.56 10,756 13.08 14,463 15.05 23,877
12.71 18,191 8.29 10,829 13.44 14,60215.24 24,120
NA NA 3.41 10,3413.75 11,168 4.06 11,425
January 25, 2019
LIC MF Arbitrage Fund - Regular Plan
NIFTY 50 Arbitrage Index #
CRISIL 1 Year T-Bill Index ##
NA NA3.73 10,373 3.87 11,2084.31 11,518
NA NA 2.78 10,2784.77 11,502 5.10 11,812
NA NA 4.28 10,4284.46 11,401 4.77 11,689 LIC MF Arbitrage Fund - Direct Plan
NIFTY 50 Arbitrage Index #
CRISIL 1 Year T-Bill Index ##
NA NA3.73 10,373 3.87 11,2084.31 11,518
NA NA 2.78 10,2784.77 11,502 5.10 11,812
1.87 10,973 -3.34 9,666 2.85 10,8823.52 12,822
March 27,2015
LIC MF Banking & Financial Services Fund - Regular Plan
Nifty Financial Services TRI #
NIFTY 50 TRI ##
12.35 17,907-0.17 9,983 7.60 12,459 12.62 23,482
12.97 18,403 7.90 10,790 13.03 14,44711.44 21,771
3.15 11,680 -2.09 9,791 4.05 11,2664.65 13,858LIC MF Banking & Financial Services Fund - Direct Plan
Nifty Financial Services TRI #
NIFTY 50 TRI ##
12.35 17,907-0.17 9,983 7.60 12,459 12.62 23,482
12.97 18,403 7.90 10,790 13.03 14,44711.44 21,771
5.79 13,252 3.03 10,303 6.37 12,0378.18 66,098
June 1, 1998
LIC MF Debt Hybrid Fund - Regular Plan
CRISIL Hybrid 85+15 - Conservative Index #
CRISIL 10 year Gilt Index ##
7.74 14,5181.82 10,182 8.08 12,627 NA NA
4.31 12,350 -3.88 9,612 4.08 11,276NA NA
6.71 13,840 3.93 10,393 7.30 12,3567.71 20,100LIC MF Debt Hybrid Fund - Direct Plan
CRISIL Hybrid 85+15 - Conservative Index #
CRISIL 10 year Gilt Index ##
7.74 14,5181.82 10,182 8.08 12,627 8.87 22,215
4.31 12,350 -3.88 9,612 4.08 11,2765.96 17,320
6.03 13,405 3.15 10,315 8.75 12,8634.03 22,534
November 12, 2001
LIC MF Children's Gift Fund - Regular Plan
CRISIL Hybrid 35+65 - Aggressive Index #
NIFTY 50 TRI ##
11.21 17,0145.63 10,563 12.38 14,195 NA NA
12.97 18,403 7.90 10,790 13.03 14,447 16.18 2,18,204
7.02 14,038 4.15 10,415 9.71 13,2089.56 23,539LIC MF Children's Gift Fund - Direct Plan
CRISIL Hybrid 35+65 - Aggressive Index #
NIFTY 50 TRI ##
11.21 17,0145.63 10,563 12.38 14,195 11.96 28,849
12.97 18,403 7.90 10,790 13.03 14,44712.84 31,048
November 30, 2015
March 17, 2016
January 1, 1991
5.20 12,889 2.88 10,288 4.22 11,3206.40 32,467
June 9, 2003
LIC MF Savings Fund - Regular Plan
CRISIL Low Duration Fund BI Index #
CRISIL 1 Year T-Bill Index ##
6.33 13,5953.84 10,384 5.59 11,775 7.04 36,391
5.60 13,132 2.78 10,278 4.77 11,5025.84 29,359
5.78 13,243 3.44 10,344 4.77 11,5027.23 19,296LIC MF Savings Fund - Direct Plan
CRISIL Low Duration Fund BI Index #
CRISIL 1 Year T-Bill Index ##
6.33 13,5953.84 10,384 5.59 11,775 7.58 19,901
5.60 13,132 2.78 10,278 4.77 11,5026.40 17,928
March 18, 2002
LIC MF Liquid Fund - Regular Plan
CRISIL Liquid Fund BI Index #
CRISIL 1 Year T-Bill Index ##
5.47 13,0553.78 10,378 4.47 11,402 NA NA
5.60 13,132 2.78 10,278 4.77 11,5025.87 31,695
5.46 13,049 3.55 10,355 4.29 11,3456.85 18,661LIC MF Liquid Fund - Direct Plan
CRISIL Liquid Fund BI Index #
CRISIL 1 Year T-Bill Index ##
5.47 13,0553.78 10,378 4.47 11,402 6.80 18,575
5.60 13,132 2.78 10,278 4.77 11,5026.40 17,928
NA NA 3.28 10,328NA NA 3.53 11,047
July 18, 2019
LIC MF Overnight Fund - Regular Plan
NIFTY 1D Rate Index #
CRISIL 1 Year T-Bill Index ##
NA NA3.46 10,346 NA NA3.68 11,094
NA NA 2.78 10,278NA NA 4.63 11,389
NA NA 3.42 10,342 NA NA 3.67 11,089LIC MF Overnight Fund - Direct Plan
NIFTY 1D Rate Index #
CRISIL 1 Year T-Bill Index ##
NA NA3.46 10,346NA NA3.68 11,094
NA NA 2.78 10,278 NA NA 4.63 11,389
November 27, 2019
LIC MF Ultra Short Term Fund - Regular Plan
CRISIL Ultra Short Duration Fund BI Index #
CRISIL 1 Year T-Bill Index ##
NA NA4.03 10,403 NA NA4.94 11,287
NA NA 2.78 10,278NA NA 4.20 11,088
NA NA 3.28 10,328NA NA 3.88 11,003LIC MF Ultra Short Term Fund - Direct Plan
CRISIL Ultra Short Duration Fund BI Index #
CRISIL 1 Year T-Bill Index ##
NA NA4.03 10,403 NA NA4.94 11,287
NA NA 2.78 10,278 NA NA 4.20 11,088
June 19, 1989
NA NA 3.08 10,308NA NA 3.65 10,942
5.32 12,959 3.40 10,340 4.15 11,298 6.89 38,488
December 24, 2014
Funds managed by Mr. Sanjay Pawar
Funds managed by Mr. Dikshit Mittal
Funds managed by Mr. Rahul Singh
Funds managed by Mr. Karan Doshi
35
7.18 14,149 1.95 10,195 7.65 12,4788.50 1,29,758 LIC MF Equity Hybrid Fund - Regular Plan
CRISIL Hybrid 35+65 - Aggressive Index #
NIFTY 50 TRI ##
11.21 17,0145.63 10,563 12.38 14,195 NA NA
12.97 18,403 7.90 10,790 13.03 14,447 14.38 6,84,532
8.51 15,050 3.20 10,320 8.89 12,9129.58 23,660LIC MF Equity Hybrid Fund - Direct Plan
CRISIL Hybrid 35+65 - Aggressive Index #
NIFTY 50 TRI ##
11.21 17,0145.63 10,563 12.38 14,195 11.91 28,822
12.97 18,403 7.90 10,790 13.03 14,44712.78 31,009
9.54 15,776 9.48 10,948 10.62 13,5419.64 2,07,896 LIC MF Unit Linked Insurance Scheme - Regular Plan
Crisil Hybrid 35 + 65 - Aggressive Index #
NIFTY 50 TRI ##
11.21 17,0145.63 10,563 12.38 14,195 NA NA
12.97 18,403 7.90 10,790 13.03 14,447NA NA
10.62 16,571 10.46 11,046 11.57 13,89211.63 27,687LIC MF Unit Linked Insurance Scheme - Direct Plan
Crisil Hybrid 35 + 65 - Aggressive Index #
NIFTY 50 TRI ##
11.21 17,0145.63 10,563 12.38 14,195 12.57 29,922
12.97 18,403 7.90 10,790 13.03 14,44713.60 32,558
5.13 12,844 -2.27 9,773 4.72 11,4846.65 16,143LIC MF G-Sec Long Term Exchange Traded Fund
Nifty 8-13 yr G-Sec Index #
CRISIL 10 year Gilt Index ##
5.50 13,069-1.99 9,801 5.11 11,613 7.01 16,549
4.31 12,350 -3.88 9,612 4.08 11,2766.07 15,503
Factsheet May, 2022
NA NANA NANA NA -3.18 9,826
November 12, 2021
LIC MF Balanced Advantage Fund - Regular Plan
NIFTY 50 Hybrid Composite Debt 50:50 Index #
NIFTY 50 TRI ##
NA NANA NANA NA -8.05 9,559
NA NANA NANA NA-14.13 9,226
NA NANA NANA NA -1.27 9,931 LIC MF Balanced Advantage Fund - Direct Plan
NIFTY 50 Hybrid Composite Debt 50:50 Index #
NIFTY 50 TRI ##
NA NANA NANA NA -8.05 9,559
NA NANA NANA NA-14.13 9,226
11.48 17,225 6.71 10,671 11.74 13,95612.57 1,00,688
December 5, 2002
LIC MF Index Fund - Nifty Plan - Regular Plan
NIFTY 50 TRI #
S&P BSE Sensex TRI ##
12.97 18,4037.90 10,790 13.03 14,447 16.81 2,06,846
13.69 18,997 8.39 10,839 13.22 14,51817.42 2,28,859
12.10 17,710 7.53 10,753 12.37 14,19411.96 28,967LIC MF Index Fund - Nifty Plan - Direct Plan
NIFTY 50 TRI #
S&P BSE Sensex TRI ##
12.97 18,4037.90 10,790 13.03 14,447 12.89 31,314
13.69 18,997 8.39 10,839 13.22 14,51813.21 32,158
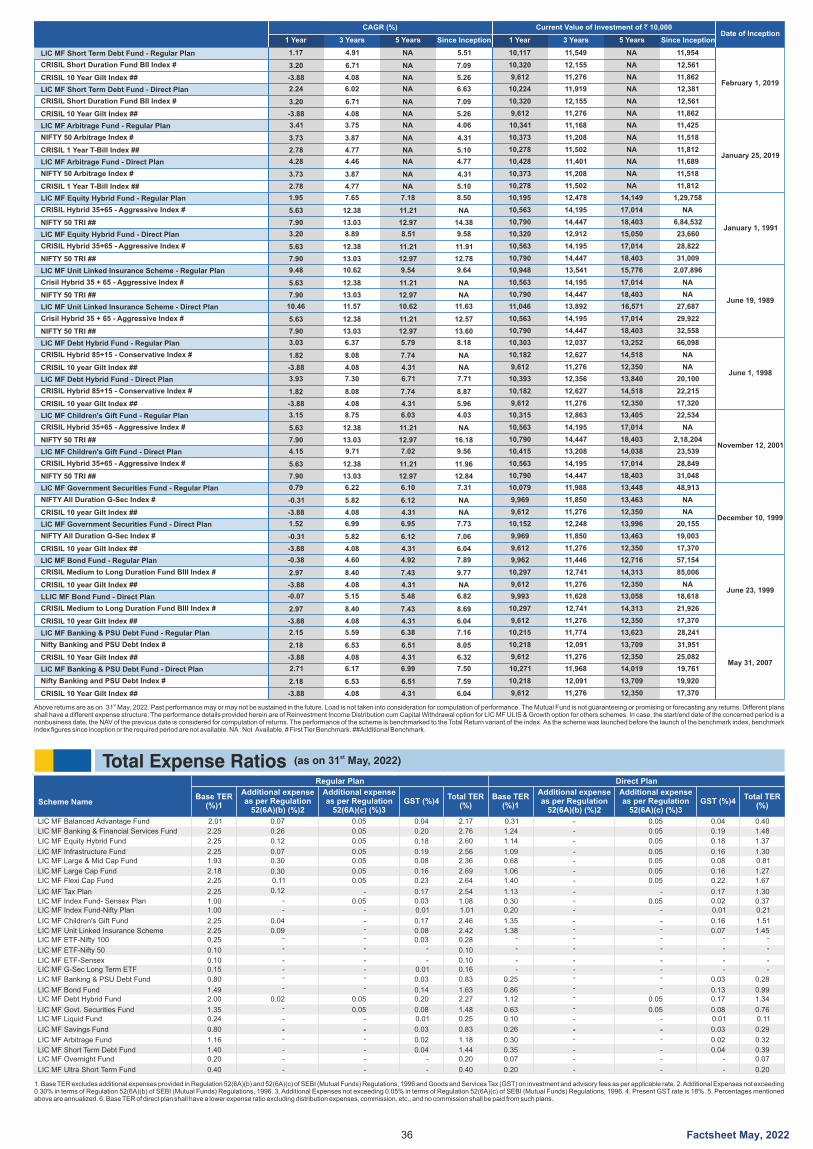
CAGR (%)Date of Inception
5 Years 5 Years1 Year 1 Year3 Years 3 YearsSince Inception Since Inception
Current Value of Investment of ` 10,000
January 1, 1991
June 19, 1989
June 1, 1998
stAbove returns are as on 31 May 2 Past performance may or may not be sustained in the future. Load is not taken into consideration for computation of performance. The Mutual Fund is not guaranteeing or promising or forecasting any returns. Different plans , 202 . shall have a different expense structure. The performance details provided herein are of option . In case, the start/end date of the concerned period is a Reinvestment Income Distribution cum Capital Withdrawal for LIC MF ULIS & Growth option for others schemes nonbusiness date, the NAV of the previous date is considered for computation of returns As the scheme was launched before the launch of the benchmark index, benchmark . The performance of the scheme is benchmarked to the Total Return variant of the index. index figures since inception or the required period are not available. NA : Not Available. # First Tier Benchmark. ## Benchmark. Additional
November 12, 2001
December 10, 1999
June 23, 1999
May 31, 2007
36
9.54 15,776 9.48 10,948 10.62 13,5419.64 2,07,896 LIC MF Unit Linked Insurance Scheme - Regular Plan
Crisil Hybrid 35 + 65 - Aggressive Index #
NIFTY 50 TRI ##
11.21 17,0145.63 10,563 12.38 14,195 NA NA
12.97 18,403 7.90 10,790 13.03 14,447NA NA
10.62 16,571 10.46 11,046 11.57 13,89211.63 27,687LIC MF Unit Linked Insurance Scheme - Direct Plan
Crisil Hybrid 35 + 65 - Aggressive Index #
NIFTY 50 TRI ##
11.21 17,0145.63 10,563 12.38 14,195 12.57 29,922
12.97 18,403 7.90 10,790 13.03 14,44713.60 32,558
6.10 13,448 0.79 10,079 6.22 11,9887.31 48,913LIC MF Government Securities Fund - Regular Plan
NIFTY All Duration G-Sec Index #
CRISIL 10 year Gilt Index ##
6.12 13,463-0.31 9,969 5.82 11,850 NA NA
4.31 12,350 -3.88 9,612 4.08 11,276NA NA
6.95 13,996 1.52 10,152 6.99 12,2487.73 20,155LIC MF Government Securities Fund - Direct Plan
NIFTY All Duration G-Sec Index #
CRISIL 10 year Gilt Index ##
6.12 13,463-0.31 9,969 5.82 11,850 7.06 19,003
4.31 12,350 -3.88 9,612 4.08 11,2766.04 17,370
4.92 12,716 -0.38 9,962 4.60 11,4467.89 57,154LIC MF Bond Fund - Regular Plan
CRISIL Medium to Long Duration Fund BIII Index #
CRISIL 10 year Gilt Index ##
7.43 14,3132.97 10,297 8.40 12,741 9.77 85,006
4.31 12,350 -3.88 9,612 4.08 11,276NA NA
5.48 13,058 -0.07 9,993 5.15 11,6286.82 18,618LLIC MF Bond Fund - Direct Plan
CRISIL Medium to Long Duration Fund BIII Index #
CRISIL 10 year Gilt Index ##
7.43 14,3132.97 10,297 8.40 12,741 8.69 21,926
4.31 12,350 -3.88 9,612 4.08 11,2766.04 17,370
6.38 13,623 2.15 10,215 5.59 11,7747.16 28,241LIC MF Banking & PSU Debt Fund - Regular Plan
Nifty Banking and PSU Debt Index #
CRISIL 10 Year Gilt Index ##
6.51 13,7092.18 10,218 6.53 12,091 8.05 31,951
4.31 12,350 -3.88 9,612 4.08 11,2766.32 25,082
6.99 14,019 2.71 10,271 6.17 11,9687.50 19,761LIC MF Banking & PSU Debt Fund - Direct Plan
Nifty Banking and PSU Debt Index #
CRISIL 10 Year Gilt Index ##
6.51 13,7092.18 10,218 6.53 12,091 7.59 19,920
4.31 12,350 -3.88 9,612 4.08 11,2766.04 17,370
5.79 13,252 3.03 10,303 6.37 12,0378.18 66,098LIC MF Debt Hybrid Fund - Regular Plan
CRISIL Hybrid 85+15 - Conservative Index #
CRISIL 10 year Gilt Index ##
7.74 14,5181.82 10,182 8.08 12,627 NA NA
4.31 12,350 -3.88 9,612 4.08 11,276NA NA
6.71 13,840 3.93 10,393 7.30 12,3567.71 20,100LIC MF Debt Hybrid Fund - Direct Plan
CRISIL Hybrid 85+15 - Conservative Index #
CRISIL 10 year Gilt Index ##
7.74 14,5181.82 10,182 8.08 12,627 8.87 22,215
4.31 12,350 -3.88 9,612 4.08 11,2765.96 17,320
6.03 13,405 3.15 10,315 8.75 12,8634.03 22,534LIC MF Children's Gift Fund - Regular Plan
CRISIL Hybrid 35+65 - Aggressive Index #
NIFTY 50 TRI ##
11.21 17,0145.63 10,563 12.38 14,195 NA NA
12.97 18,403 7.90 10,790 13.03 14,447 16.18 2,18,204
7.02 14,038 4.15 10,415 9.71 13,2089.56 23,539LIC MF Children's Gift Fund - Direct Plan
CRISIL Hybrid 35+65 - Aggressive Index #
NIFTY 50 TRI ##
11.21 17,0145.63 10,563 12.38 14,195 11.96 28,849
12.97 18,403 7.90 10,790 13.03 14,44712.84 31,048
7.18 14,149 1.95 10,195 7.65 12,4788.50 1,29,758 LIC MF Equity Hybrid Fund - Regular Plan
CRISIL Hybrid 35+65 - Aggressive Index #
NIFTY 50 TRI ##
11.21 17,0145.63 10,563 12.38 14,195 NA NA
12.97 18,403 7.90 10,790 13.03 14,447 14.38 6,84,532
8.51 15,050 3.20 10,320 8.89 12,9129.58 23,660LIC MF Equity Hybrid Fund - Direct Plan
CRISIL Hybrid 35+65 - Aggressive Index #
NIFTY 50 TRI ##
11.21 17,0145.63 10,563 12.38 14,195 11.91 28,822
12.97 18,403 7.90 10,790 13.03 14,44712.78 31,009
Factsheet May, 2022
February 1, 2019
January 25, 2019
NA NA 1.17 10,117 4.91 11,549 5.51 11,954 LIC MF Short Term Debt Fund - Regular Plan
CRISIL Short Duration Fund BII Index #
CRISIL 10 Year Gilt Index ##
NA NA3.20 10,320 6.71 12,155 7.09 12,561
NA NA -3.88 9,612 4.08 11,276 5.26 11,862
NA NA 2.24 10,224 6.02 11,919 6.63 12,381 LIC MF Short Term Debt Fund - Direct Plan
CRISIL Short Duration Fund BII Index #
CRISIL 10 Year Gilt Index ##
NA NA3.20 10,320 6.71 12,155 7.09 12,561
NA NA -3.88 9,612 4.08 11,276 5.26 11,862
NA NA 3.41 10,3413.75 11,168 4.06 11,425LIC MF Arbitrage Fund - Regular Plan
NIFTY 50 Arbitrage Index #
CRISIL 1 Year T-Bill Index ##
NA NA3.73 10,373 3.87 11,2084.31 11,518
NA NA 2.78 10,2784.77 11,502 5.10 11,812
NA NA 4.28 10,4284.46 11,401 4.77 11,689 LIC MF Arbitrage Fund - Direct Plan
NIFTY 50 Arbitrage Index #
CRISIL 1 Year T-Bill Index ##
NA NA3.73 10,373 3.87 11,2084.31 11,518
NA NA 2.78 10,2784.77 11,502 5.10 11,812
1. Base TER excludes additional expenses provided in Regulation 52(6A)(b) and 52(6A)(c) of SEBI (Mutual Funds) Regulations, 1996 and Goods and Services Tax (GST) on investment and advisory fees as per applicable rate. 2. Additional Expenses not exceeding 0.30% in terms of Regulation 52(6A)(b) of SEBI (Mutual Funds) Regulations, 1996. 3. Additional Expenses not exceeding 0.05% in terms of Regulation 52(6A)(c) of SEBI (Mutual Funds) Regulations, 1996. 4. Present GST rate is 18%. 5. Percentages mentioned above are annualized. 6. Base TER of direct plan shall have a lower expense ratio excluding distribution expenses, commission, etc., and no commission shall be paid from such plans.
Total Expense Ratios st(as on 31 May, 2022)
Scheme Name
Regular Plan Direct Plan
Base TER(%)1
Additional expense as per Regulation
52(6A)(b) (%)2
Additional expense as per Regulation
52(6A)(c) (%)3 GST (%)4
Total TER(%)
Base TER(%)1
Additional expense as per Regulation
52(6A)(b) (%)2
Additional expense as per Regulation
52(6A)(c) (%)3 GST (%)4
Total TER(%)
LIC MF Banking & Financial Services Fund -
LIC MF Equity Hybrid Fund -
LIC MF Infrastructure Fund -LIC MF Large & Mid Cap Fund -
LIC MF Large Cap Fund -
LIC MF Flexi Cap Fund -
LIC MF Tax Plan -
LIC MF Index Fund- Sensex Plan -
LIC MF Index Fund-Nifty Plan -
LIC MF Children's Gift Fund -
LIC MF Unit Linked Insurance Scheme -
LIC MF ETF-Nifty 100 -
LIC MF ETF-Nifty 50 -
LIC MF ETF-Sensex -LIC MF G-Sec Long Term ETF -
LIC MF Banking & PSU Debt Fund -
LIC MF Bond Fund -
LIC MF Debt Hybrid Fund -
LIC MF Govt. Securities Fund -
LIC MF Liquid Fund -
LIC MF Savings Fund --
LIC MF Arbitrage Fund -
LIC MF Short Term Debt Fund -
LIC MF Overnight Fund -
LIC MF Ultra Short Term Fund -
LIC MF Balanced Advantage Fund
2.25
2.25
2.251.93
2.18
2.25
2.25
1.001.00
2.25
2.250.25
0.10
0.100.15
0.80
1.492.00
1.350.24
0.80
1.16
1.400.20
0.40
2.01
0.26
0.12
0.070.30
0.30
0.11
0.12
-
-
0.04
0.09-
-
---
-
0.02-
-
--
-
--
-
0.07
0.05
0.05
0.050.05
0.05
0.05
- 0.05
-
- -
-
-
--
-
-
0.05 0.05
- -- -
- - -
0.05
0.20
0.18
0.190.08
0.16
0.23
0.17 0.03
0.01
0.17 0.08
0.03 -
-0.01
0.03
0.140.20
0.080.01 0.03 0.02 0.04
- -
0.04
2.76
2.60
2.562.36
2.69
2.64
2.54 1.08
1.01
2.46 2.42
0.28 0.10
0.100.16
0.83
1.632.27
1.480.25 0.83 1.18 1.44 0.20 0.40
2.17
1.24
1.14
1.090.68
1.06
1.40
1.13 0.30
0.20
1.35 1.38
-
-
--
0.25
0.861.12
0.630.10 0.26 0.30 0.35 0.07 0.20
0.31 -
0.05
0.05
0.050.05
0.05
0.05
- 0.05
-
- -
-
-
--
-
-
0.05 0.05
- -- -
- - -
0.05
0.19
0.18
0.160.08
0.16
0.22
0.17 0.02
0.01
0.16 0.07
-
-
--
0.03
0.130.17
0.080.01 0.03 0.02 0.04
- -
0.04
1.48
1.37
1.300.81
1.27
1.67
1.30 0.37
0.21
1.51 1.45
-
-
--
0.28
0.991.34
0.760.11 0.29 0.32 0.39 0.07 0.20
0.40
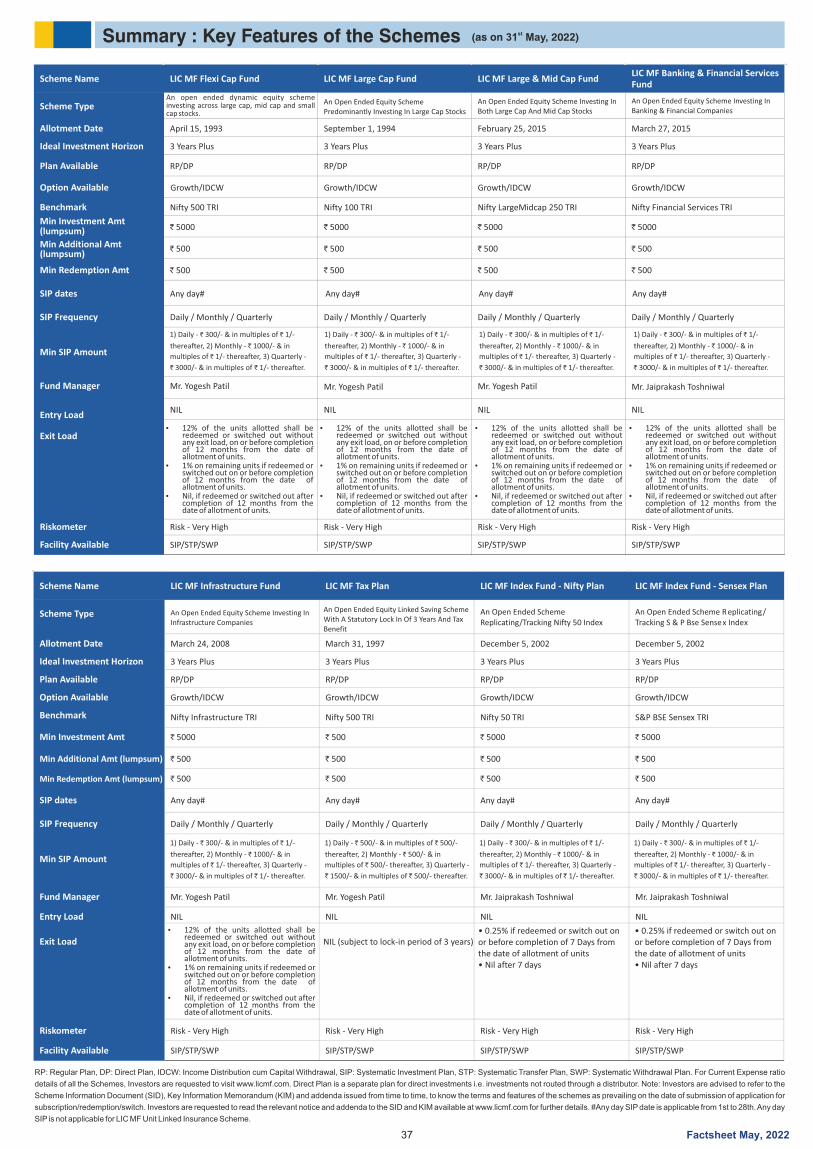
Summary : Key Features of the Schemes st(as on 31 May, 2022)
RP: Regular Plan, DP: Direct Plan, , SIP: Systematic Investment Plan, STP: Systematic Transfer Plan, SWP: Systematic Withdrawal Plan. For Current Expense ratio IDCW: Income Distribution cum Capital Withdrawal
details of all the Schemes, Investors are requested to visit www.licmf.com. Direct Plan is a separate plan for direct investments i.e. investments not routed through a distributor. Note: Investors are advised to refer to the
Scheme Information Document (SID), Key Information Memorandum (KIM) and addenda issued from time to time, to know the terms and features of the schemes as prevailing on the date of submission of application for
subscription/redemption/switch. Investors are requested to read the relevant notice and addenda to the SID and KIM available at www.licmf.com for further details. #Any day SIP date is applicable from 1st to 28th. Any day
SIP is not applicable for LIC MF Unit Linked Insurance Scheme.
Scheme Name LIC MF Flexi Cap Fund LIC MF Large Cap Fund LIC MF Large & Mid Cap FundLIC MF Banking & Financial ServicesFund
Scheme TypeAn open ended dynamic equity scheme investing across large cap, mid cap and small cap stocks.
An Open Ended Equity Scheme Predominantly Investing In Large Cap Stocks
An Open Ended Equity Scheme Investing In Both Large Cap And Mid Cap Stocks
An Open Ended Equity Scheme Investing In Banking & Financial Companies
Allotment Date April 15, 1993 September 1, 1994 February 25, 2015 March 27, 2015
Ideal Investment Horizon 3 Years Plus 3 Years Plus 3 Years Plus 3 Years Plus
Plan Available RP/DP RP/DP RP/DP RP/DP
Option Available Growth/IDCW Growth/IDCW Growth/IDCW
Benchmark Nifty 500 TRI Nifty 100 TRI Nifty LargeMidcap 250 TRI Nifty Financial Services TRI
Min Investment Amt(lumpsum) ` 5000 ` 5000 ` 5000 ` 5000
Min Additional Amt(lumpsum)
` 500 ` 500 ` 500 ` 500
Min Redemption Amt ` 500 ` 500 ` 500 ` 500
SIP dates Any day# Any day# Any day# Any day#
SIP Frequency Daily / Monthly / Quarterly Daily / Monthly / Quarterly Daily / Monthly / Quarterly Daily / Monthly / Quarterly
Min SIP Amountthereafter, 2) Monthly - ` 1000/- & in
1) Daily - ` 300/- & in multiples of ` 1/-
multiples of ` 1/- thereafter, 3) Quarterly -
` 3000/- & in multiples of ` 1/- thereafter.
thereafter, 2) Monthly - ` 1000/- & in
1) Daily - ` 300/- & in multiples of ` 1/-
multiples of ` 1/- thereafter, 3) Quarterly -
` 3000/- & in multiples of ` 1/- thereafter.
thereafter, 2) Monthly - ` 1000/- & in
1) Daily - ` 300/- & in multiples of ` 1/-
multiples of ` 1/- thereafter, 3) Quarterly -
` 3000/- & in multiples of ` 1/- thereafter.
thereafter, 2) Monthly - ` 1000/- & in
1) Daily - ` 300/- & in multiples of ` 1/-
multiples of ` 1/- thereafter, 3) Quarterly -
` 3000/- & in multiples of ` 1/- thereafter.
Fund Manager Mr. Yogesh Patil Mr. Yogesh Patil Mr. Yogesh Patil Mr. Jaiprakash Toshniwal
Entry LoadNIL NIL NIL NIL
Exit Load
• 0.25% if redeemed or switch out onor before completion of 7 Days fromthe date of allotment of units• Nil after 7 days
Riskometer Risk - Very High Risk - Very High Risk - Very High Risk - Very High
Facility Available SIP/STP/SWP SIP/STP/SWP SIP/STP/SWP SIP/STP/SWP
Scheme Name LIC MF Infrastructure Fund LIC MF Tax Plan LIC MF Index Fund - Nifty Plan LIC MF Index Fund - Sensex Plan
Scheme Type An Open Ended Equity Scheme Investing In Infrastructure Companies
An Open Ended Equity Linked Saving Scheme With A Statutory Lock In Of 3 Years And Tax Benefit
An Open Ended Scheme Replicating/Tracking Nifty 50 Index
An Open Ended Scheme Replicating/ Tracking S & P Bse Sensex Index
Allotment Date March 24, 2008 March 31, 1997 December 5, 2002 December 5, 2002
Ideal Investment Horizon 3 Years Plus 3 Years Plus 3 Years Plus 3 Years Plus
Plan Available RP/DP RP/DP RP/DP RP/DP
Option Available Growth/IDCW Growth/IDCW Growth/IDCW Growth/IDCW
Benchmark Nifty Infrastructure TRI Nifty 500 TRI Nifty 50 TRI S&P BSE Sensex TRI
Min Investment Amt ` 5000 ` 500 ` 5000 ` 5000
Min Additional Amt (lumpsum) ` 500 ` 500 ` 500 ` 500
Min Redemption Amt (lumpsum) ` 500 ` 500 ` 500 ` 500
SIP dates Any day# Any day# Any day# Any day#
SIP Frequency Daily / Monthly / Quarterly Daily / Monthly / Quarterly Daily / Monthly / Quarterly Daily / Monthly / Quarterly
Min SIP Amount
Fund Manager Mr. Yogesh Patil Mr. Yogesh Patil Mr. Jaiprakash Toshniwal Mr. Jaiprakash Toshniwal
Entry Load NIL NIL NIL NIL
Exit Load NIL (subject to lock-in period of 3 years)
Riskometer Risk - Very High Risk - Very High Risk - Very High Risk - Very High
Facility Available SIP/STP/SWP SIP/STP/SWP SIP/STP/SWP SIP/STP/SWP
thereafter, 2) Monthly - ` 1000/- & in
1) Daily - ` 300/- & in multiples of ` 1/-
multiples of ` 1/- thereafter, 3) Quarterly -
` 3000/- & in multiples of ` 1/- thereafter.
thereafter, 2) Monthly - ` 500/- & in
1) Daily - ` 500/- & in multiples of ` 500/-
multiples of ` 500/- thereafter, 3) Quarterly -
` 1500/- & in multiples of ` 500/- thereafter.
thereafter, 2) Monthly - ` 1000/- & in
1) Daily - ` 300/- & in multiples of ` 1/-
multiples of ` 1/- thereafter, 3) Quarterly -
` 3000/- & in multiples of ` 1/- thereafter.
thereafter, 2) Monthly - ` 1000/- & in
1) Daily - ` 300/- & in multiples of ` 1/-
multiples of ` 1/- thereafter, 3) Quarterly -
` 3000/- & in multiples of ` 1/- thereafter.
37
Ÿ 12% of the units allotted shall be redeemed or switched out without any exit load, on or before completion of 12 months from the date of allotment of units.
Ÿ 1% on remaining units if redeemed or switched out on or before completion of 12 months from the date of allotment of units.
Ÿ Nil, if redeemed or switched out after completion of 12 months from the date of allotment of units.
• 0.25% if redeemed or switch out onor before completion of 7 Days fromthe date of allotment of units• Nil after 7 days
Growth/IDCW
Factsheet May, 2022
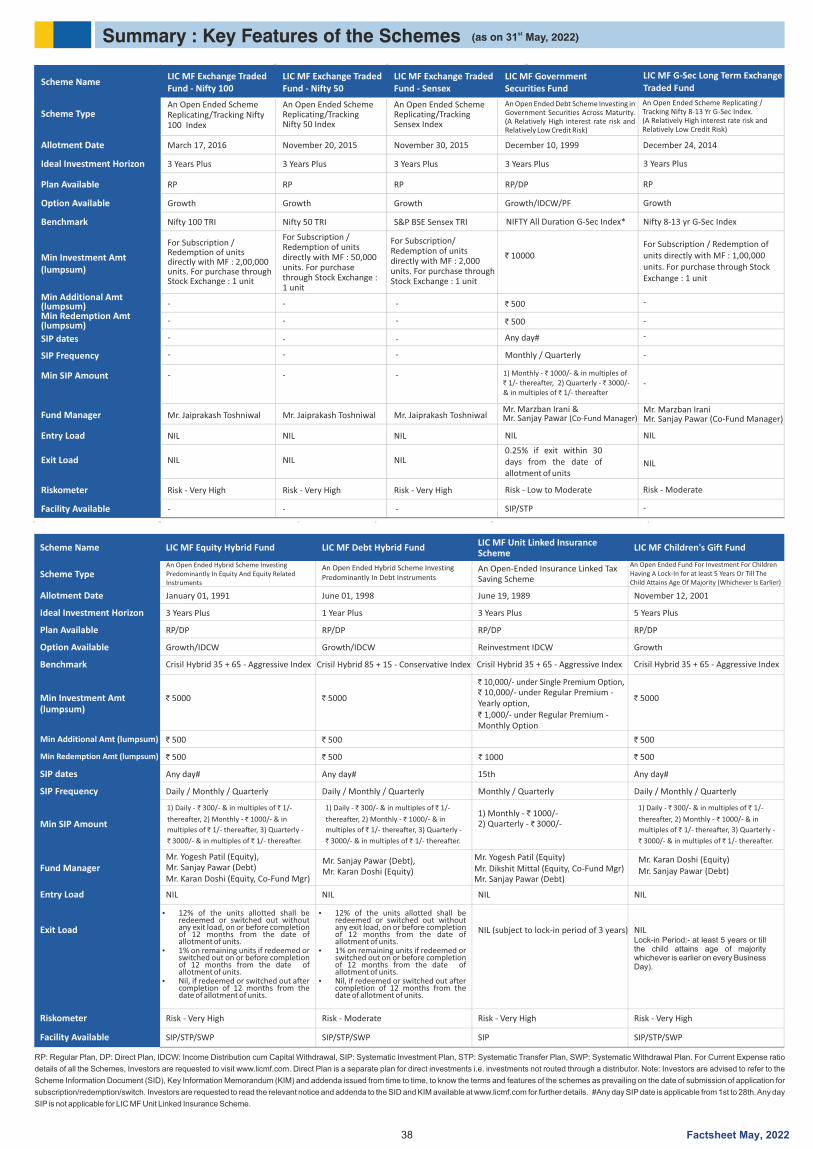
Summary : Key Features of the Schemes st(as on 31 May, 2022)
RP: Regular Plan, DP: Direct Plan, SIP: Systematic Investment Plan, STP: Systematic Transfer Plan, SWP: Systematic Withdrawal Plan. For Current Expense ratio IDCW: Income Distribution cum Capital Withdrawal,
details of all the Schemes, Investors are requested to visit www.licmf.com. Direct Plan is a separate plan for direct investments i.e. investments not routed through a distributor. Note: Investors are advised to refer to the
Scheme Information Document (SID), Key Information Memorandum (KIM) and addenda issued from time to time, to know the terms and features of the schemes as prevailing on the date of submission of application for
subscription/redemption/switch. Investors are requested to read the relevant notice and addenda to the SID and KIM available at www.licmf.com for further details. #Any day SIP date is applicable from 1st to 28th. Any day
SIP is not applicable for LIC MF Unit Linked Insurance Scheme.
Scheme NameLIC MF Exchange Traded Fund - Nifty 100
LIC MF Exchange Traded Fund - Nifty 50
LIC MF Exchange Traded Fund - Sensex
Scheme TypeAn Open Ended Scheme Replicating/Tracking Nifty 100 Index
An Open Ended Scheme Replicating/Tracking Nifty 50 Index
An Open Ended Scheme Replicating/Tracking Sensex Index
Allotment Date March 17, 2016 November 20, 2015 November 30, 2015
Ideal Investment Horizon 3 Years Plus 3 Years Plus 3 Years Plus
Plan Available RP RP RP
Option Available Growth Growth Growth
Benchmark Nifty 100 TRI Nifty 50 TRI S&P BSE Sensex TRI
Min Investment Amt(lumpsum)
For Subscription / Redemption of units directly with MF : 2,00,000 units. For purchase through Stock Exchange : 1 unit
For Subscription / Redemption of units directly with MF : 50,000 units. For purchase through Stock Exchange : 1 unit
For Subscription/ Redemption of units directly with MF : 2,000 units. For purchase through Stock Exchange : 1 unit
Min Additional Amt(lumpsum)Min Redemption Amt(lumpsum)
SIP dates
SIP Frequency
Min SIP Amount
Fund Manager Mr. Jaiprakash Toshniwal Mr. Jaiprakash Toshniwal Mr. Jaiprakash Toshniwal
Entry Load NIL
- - -
-
-
- - -
- -
- -
-
-
-
-
-
-
NIL NIL
Exit Load NIL NIL NIL
Riskometer Risk - Very High Risk - Very High Risk - Very High
Facility Available
Scheme Name LIC MF Equity Hybrid Fund LIC MF Debt Hybrid FundLIC MF Unit Linked InsuranceScheme
LIC MF Children's Gift Fund
Scheme TypeAn Open Ended Hybrid Scheme Investing Predominantly In Equity And Equity Related Instruments
An Open Ended Hybrid Scheme Investing Predominantly In Debt Instruments
An Open-Ended Insurance Linked Tax Saving Scheme
An Open Ended Fund For Investment For Children Having A Lock-In for at least 5 Years Or Till The Child Attains Age Of Majority (Whichever Is Earlier)
Allotment Date January 01, 1991 June 01, 1998 June 19, 1989 November 12, 2001
Ideal Investment Horizon 3 Years Plus 1 Year Plus 3 Years Plus 5 Years Plus
Plan Available RP/DP RP/DP RP/DP RP/DP
Option Available Growth/IDCW Growth/IDCW Reinvestment IDCW Growth
Benchmark Crisil Hybrid 35 + 65 - Aggressive Index Crisil Hybrid 35 + 65 - Aggressive Index Crisil Hybrid 35 + 65 - Aggressive IndexCrisil Hybrid 85 + 15 - Conservative Index
Min Investment Amt(lumpsum)
` 5000 ` 5000
` 10,000/- under Single Premium Option, ` 10,000/- under Regular Premium - Yearly option, 1,000/- under Regular Premium - `
Monthly Option
` 5000
Min Additional Amt (lumpsum) ` 500 ` 500 ` 500
Min Redemption Amt (lumpsum) ` 500 ` 500 ` 1000 ` 500
SIP dates Any day# Any day# 15th Any day#
SIP Frequency Daily / Monthly / Quarterly Daily / Monthly / Quarterly Monthly / Quarterly Daily / Monthly / Quarterly
Min SIP Amount1) Monthly - ` 1000/- 2) Quarterly - ` 3000/-
Fund ManagerMr. Yogesh Patil (Equity), Mr. Sanjay Pawar (Debt)Mr. Karan Doshi (Equity, Co-Fund Mgr)
Mr. Sanjay Pawar (Debt), Mr. Karan Doshi (Equity)
Mr. Yogesh Patil (Equity)Mr. Dikshit Mittal (Equity, Co-Fund Mgr)Mr. Sanjay Pawar (Debt)
Mr. Sanjay Pawar (Debt) Mr. Karan Doshi (Equity)
Entry Load NIL NIL NIL NIL
Exit Load NIL (subject to lock-in period of 3 years) NILLock-in Period:- at least 5 years or till the child attains age of majority whichever is earlier on every Business Day).
Riskometer Risk - Very High Risk - Moderate Risk - Very High Risk - Very High
Facility Available SIP/STP/SWP SIP/STP/SWP SIP SIP/STP/SWP
thereafter, 2) Monthly - ` 1000/- & in
1) Daily - ` 300/- & in multiples of ` 1/-
multiples of ` 1/- thereafter, 3) Quarterly -
` 3000/- & in multiples of ` 1/- thereafter.
thereafter, 2) Monthly - ` 1000/- & in
1) Daily - ` 300/- & in multiples of ` 1/-
multiples of ` 1/- thereafter, 3) Quarterly -
` 3000/- & in multiples of ` 1/- thereafter.
thereafter, 2) Monthly - ` 1000/- & in
1) Daily - ` 300/- & in multiples of ` 1/-
multiples of ` 1/- thereafter, 3) Quarterly -
` 3000/- & in multiples of ` 1/- thereafter.
LIC MF Government Securities Fund
An Open Ended Debt Scheme Investing in Government Securities Across Maturity. (A Relatively High interest rate risk and Relatively Low Credit Risk)
December 10, 1999
3 Years Plus
RP/DP
Growth/IDCW/PF
NIFTY All Duration G-Sec Index*
` 10000
` 500
` 500
Any day#
Monthly / Quarterly
1) Monthly - 1000/- & in multiples of `
` ` 1/- thereafter, 2) Quarterly - 3000/- & in multiples of 1/- thereafter `
Mr. Marzban Irani &Mr. Sanjay Pawar (Co-Fund Manager)
NIL
0.25% if exit within 30 days from the date of allotment of units
Risk - Low to Moderate
SIP/STP
LIC MF G-Sec Long Term Exchange
Traded Fund
An Open Ended Scheme Replicating / Tracking Nifty 8-13 Yr G-Sec Index. (A Relatively High interest rate risk and Relatively Low Credit Risk)
December 24, 2014
3 Years Plus
RP
-
-
-
-
-
-
Growth
Nifty 8-13 yr G-Sec Index
For Subscription / Redemption of units directly with MF : 1,00,000 units. For purchase through Stock Exchange : 1 unit
Mr. Marzban Irani
NIL
NIL
Risk - Moderate
38
Ÿ 12% of the units allotted shall be redeemed or switched out without any exit load, on or before completion of 12 months from the date of allotment of units.
Ÿ 1% on remaining units if redeemed or switched out on or before completion of 12 months from the date of allotment of units.
Ÿ Nil, if redeemed or switched out after completion of 12 months from the date of allotment of units.
Mr. Sanjay Pawar (Co-Fund Manager)
Factsheet May, 2022
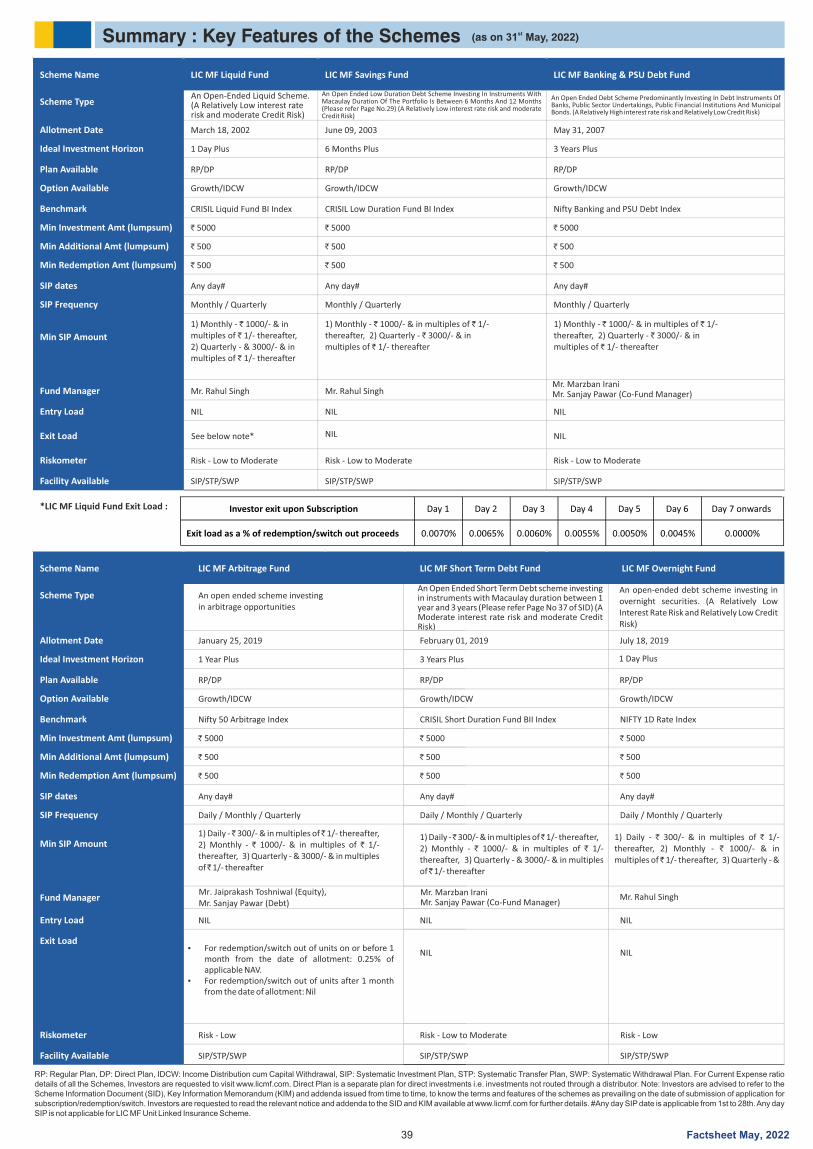
Summary : Key Features of the Schemes
RP: Regular Plan, DP: Direct Plan, SIP: Systematic Investment Plan, STP: Systematic Transfer Plan, SWP: Systematic Withdrawal Plan. For Current Expense ratio IDCW: Income Distribution cum Capital Withdrawal,details of all the Schemes, Investors are requested to visit www.licmf.com. Direct Plan is a separate plan for direct investments i.e. investments not routed through a distributor. Note: Investors are advised to refer to the Scheme Information Document (SID), Key Information Memorandum (KIM) and addenda issued from time to time, to know the terms and features of the schemes as prevailing on the date of submission of application for subscription/redemption/switch. Investors are requested to read the relevant notice and addenda to the SID and KIM available at www.licmf.com for further details. #Any day SIP date is applicable from 1st to 28th. Any day SIP is not applicable for LIC MF Unit Linked Insurance Scheme.
Scheme Name
Scheme Name
LIC MF Liquid Fund
LIC MF Arbitrage Fund LIC MF Short Term Debt Fund LIC MF Overnight Fund
LIC MF Savings Fund LIC MF Banking & PSU Debt Fund
Scheme Type
Scheme Type
An Open-Ended Liquid Scheme. (A Relatively Low interest rate risk and moderate Credit Risk)
An open ended scheme investing in arbitrage opportunities
An Open Ended Short Term Debt scheme investing in instruments with Macaulay duration between 1 year and 3 years (Please refer Page No 37 of SID) (A Moderate interest rate risk and moderate Credit Risk)
An open-ended debt scheme investing in overnight securities. (A Relatively Low Interest Rate Risk and Relatively Low Credit Risk)
An Open Ended Low Duration Debt Scheme Investing In Instruments With Macaulay Duration Of The Portfolio Is Between 6 Months And 12 Months (Please refer Page No.29) (A Relatively Low interest rate risk and moderate Credit Risk)
An Open Ended Debt Scheme Predominantly Investing In Debt Instruments Of Banks, Public Sector Undertakings, Public Financial Institutions And Municipal Bonds. (A Relatively High interest rate risk and Relatively Low Credit Risk)
Allotment Date
Allotment Date
March 18, 2002
January 25, 2019 February 01, 2019 July 18, 2019
June 09, 2003 May 31, 2007
Ideal Investment Horizon
Ideal Investment Horizon
1 Day Plus
1 Day Plus1 Year Plus 3 Years Plus
6 Months Plus 3 Years Plus
Plan Available
Plan Available
RP/DP
RP/DP RP/DP RP/DP
RP/DP RP/DP
Option Available
Option Available
Growth/IDCW
Growth/IDCW Growth/IDCW Growth/IDCW
Growth/IDCW Growth/IDCW
Benchmark
Benchmark
CRISIL Liquid Fund BI Index
Nifty 50 Arbitrage Index CRISIL Short Duration Fund BII Index NIFTY 1D Rate Index
CRISIL Low Duration Fund BI Index Nifty Banking and PSU Debt Index
Min Investment Amt (lumpsum)
Min Investment Amt (lumpsum)
` 5000
` 5000 ` 5000 ` 5000
` 5000 ` 5000
Min Additional Amt (lumpsum)
Min Additional Amt (lumpsum)
` 500
` 500 ` 500 ` 500
` 500 ` 500
Min Redemption Amt (lumpsum)
Min Redemption Amt (lumpsum)
` 500
` 500 ` 500 ` 500
` 500 ` 500
SIP dates
SIP dates
Any day#
Any day# Any day# Any day#
Any day# Any day#
SIP Frequency
SIP Frequency
Monthly / Quarterly
Daily / Monthly / Quarterly Daily / Monthly / Quarterly Daily / Monthly / Quarterly
Monthly / Quarterly Monthly / Quarterly
Min SIP Amount
Min SIP Amount
1) Monthly - ` 1000/- & in multiples of ` 1/- thereafter, 2) Quarterly - & 3000/- & in multiples of ` 1/- thereafter
1) Daily - ̀ 300/- & in multiples of ̀ 1/- thereafter, 2) Monthly - ` 1000/- & in multiples of ` 1/- thereafter, 3) Quarterly - & 3000/- & in multiples of ̀ 1/- thereafter
1) Daily - ̀ 300/- & in multiples of ̀ 1/- thereafter,2) Monthly - ` 1000/- & in multiples of ` 1/- thereafter, 3) Quarterly - & 3000/- & in multiples of ̀ 1/- thereafter
1) Daily - ` 300/- & in multiples of ` 1/- thereafter, 2) Monthly - ` 1000/- & in multiples of ̀ 1/- thereafter, 3) Quarterly - &
1) Monthly - ` 1000/- & in multiples of ` 1/- thereafter, 2) Quarterly - ` 3000/- & in multiples of ` 1/- thereafter
1) Monthly - ` 1000/- & in multiples of ` 1/- thereafter, 2) Quarterly - ` 3000/- & in multiples of ` 1/- thereafter
Fund Manager
Fund Manager
Mr. Rahul Singh Mr. Rahul Singh
Entry Load
Entry Load
NIL
NIL NIL NIL
NIL NIL
NIL
NIL
NIL
Exit Load
Exit Load
See below note* NIL
Riskometer
Riskometer
Risk - Low to Moderate
Risk - Low Risk - Low to Moderate Risk - Low
Risk - Low to Moderate Risk - Low to Moderate
Facility Available
*LIC MF Liquid Fund Exit Load :
Facility Available
SIP/STP/SWP
SIP/STP/SWP SIP/STP/SWP SIP/STP/SWP
SIP/STP/SWP SIP/STP/SWP
39
Mr. Jaiprakash Toshniwal (Equity),Mr. Sanjay Pawar (Debt)
Mr. Marzban IraniMr. Sanjay Pawar (Co-Fund Manager)
Mr. Rahul Singh
st(as on 31 May, 2022)
Investor exit upon Subscription Day 1 Day 2 Day 3 Day 4 Day 5 Day 6 Day 7 onwards
Exit load as a % of redemption/switch out proceeds 0.0070% 0.0065% 0.0060% 0.0055% 0.0050% 0.0045% 0.0000%
Ÿ For redemption/switch out of units on or before 1 month from the date of allotment: 0.25% of applicable NAV.
Ÿ For redemption/switch out of units after 1 month from the date of allotment: Nil
Mr. Marzban IraniMr. Sanjay Pawar (Co-Fund Manager)
Factsheet May, 2022
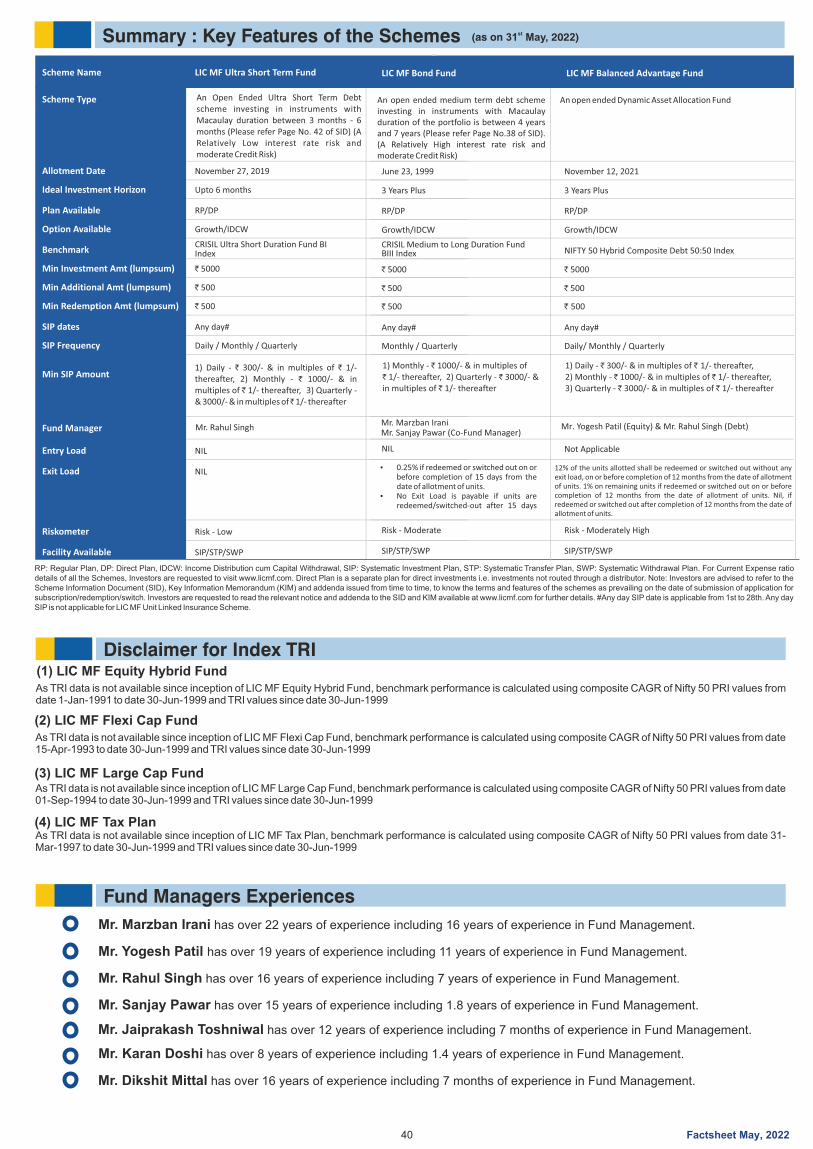
Summary : Key Features of the Schemes
RP: Regular Plan, DP: Direct Plan, SIP: Systematic Investment Plan, STP: Systematic Transfer Plan, SWP: Systematic Withdrawal Plan. For Current Expense ratio IDCW: Income Distribution cum Capital Withdrawal,details of all the Schemes, Investors are requested to visit www.licmf.com. Direct Plan is a separate plan for direct investments i.e. investments not routed through a distributor. Note: Investors are advised to refer to the Scheme Information Document (SID), Key Information Memorandum (KIM) and addenda issued from time to time, to know the terms and features of the schemes as prevailing on the date of submission of application for subscription/redemption/switch. Investors are requested to read the relevant notice and addenda to the SID and KIM available at www.licmf.com for further details. #Any day SIP date is applicable from 1st to 28th. Any day SIP is not applicable for LIC MF Unit Linked Insurance Scheme.
Scheme Name LIC MF Ultra Short Term Fund
Scheme Type An Open Ended Ultra Short Term Debt scheme investing in instruments with Macaulay duration between 3 months - 6 months (Please refer Page No. 42 of SID) (A Relatively Low interest rate risk and moderate Credit Risk)
Allotment Date November 27, 2019
Ideal Investment Horizon Upto 6 months
Plan Available RP/DP
Option Available Growth/IDCW
BenchmarkCRISIL Ultra Short Duration Fund BIIndex
Min Investment Amt (lumpsum) ` 5000
Min Additional Amt (lumpsum) ` 500
Min Redemption Amt (lumpsum) ` 500
SIP dates Any day#
SIP Frequency Daily / Monthly / Quarterly
Min SIP Amount1) Daily - ` 300/- & in multiples of ` 1/- thereafter, 2) Monthly - ` 1000/- & in multiples of ` 1/- thereafter, 3) Quarterly - & 3000/- & in multiples of ̀ 1/- thereafter
Fund Manager
Entry Load NIL
Exit Load
Riskometer Risk - Low
Facility Available SIP/STP/SWP
40
Mr. Rahul Singh
st(as on 31 May, 2022)
NIL
1) Monthly - ` 1000/- & in multiples of ` 1/- thereafter, 2) Quarterly - ` 3000/- & in multiples of ` 1/- thereafter
LIC MF Bond Fund
An open ended medium term debt scheme investing in instruments with Macaulay duration of the portfolio is between 4 years and 7 years (Please refer Page No.38 of SID). (A Relatively High interest rate risk and moderate Credit Risk)
June 23, 1999
3 Years Plus
RP/DP
Growth/IDCW
CRISIL Medium to Long Duration FundBIII Index
` 5000
` 500
` 500
Any day#
Monthly / Quarterly
NIL
Risk - Moderate
SIP/STP/SWP
Ÿ 0.25% if redeemed or switched out on or before completion of 15 days from the date of allotment of units.
Ÿ No Exit Load is payable if units are redeemed/switched-out after 15 days
Disclaimer for Index TRI
As TRI data is not available since inception of LIC MF Equity Hybrid Fund, benchmark performance is calculated using composite CAGR of Nifty 50 PRI values from date 1-Jan-1991 to date 30-Jun-1999 and TRI values since date 30-Jun-1999
(1) LIC MF Equity Hybrid Fund
(2) LIC MF Flexi Cap Fund
(3) LIC MF Large Cap Fund
(4) LIC MF Tax Plan
As TRI data is not available since inception of LIC MF Flexi Cap Fund, benchmark performance is calculated using composite CAGR of Nifty 50 PRI values from date 15-Apr-1993 to date 30-Jun-1999 and TRI values since date 30-Jun-1999
As TRI data is not available since inception of LIC MF Large Cap Fund, benchmark performance is calculated using composite CAGR of Nifty 50 PRI values from date 01-Sep-1994 to date 30-Jun-1999 and TRI values since date 30-Jun-1999
As TRI data is not available since inception of LIC MF Tax Plan, benchmark performance is calculated using composite CAGR of Nifty 50 PRI values from date 31-Mar-1997 to date 30-Jun-1999 and TRI values since date 30-Jun-1999
Mr. Marzban Irani has over 22 years of experience including 16 years of experience in Fund Management.
Fund Managers Experiences
Mr. Yogesh Patil has over 19 years of experience including 11 years of experience in Fund Management.
Mr. Rahul Singh has over 16 years of experience including 7 years of experience in Fund Management.
Mr. Sanjay Pawar has over 15 years of experience including 1.8 years of experience in Fund Management.
Mr. Karan Doshi has over 8 years of experience including 1.4 years of experience in Fund Management.
Mr. Jaiprakash Toshniwal has over 12 years of experience including 7 months of experience in Fund Management.
Mr. Dikshit Mittal has over 16 years of experience including 7 months of experience in Fund Management.
1) Daily - ` 300/- & in multiples of ` 1/- thereafter,2) Monthly - ` 1000/- & in multiples of ` 1/- thereafter, 3) Quarterly - ` 3000/- & in multiples of ` 1/- thereafter
An open ended Dynamic Asset Allocation Fund
November 12, 2021
3 Years Plus
RP/DP
Growth/IDCW
NIFTY 50 Hybrid Composite Debt 50:50 Index
` 5000
` 500
` 500
Any day#
Daily/ Monthly / Quarterly
Mr. Yogesh Patil (Equity) & Mr. Rahul Singh (Debt)
Not Applicable
Risk - Moderately High
SIP/STP/SWP
LIC MF Balanced Advantage Fund
12% of the units allotted shall be redeemed or switched out without any exit load, on or before completion of 12 months from the date of allotment of units. 1% on remaining units if redeemed or switched out on or before completion of 12 months from the date of allotment of units. Nil, if redeemed or switched out after completion of 12 months from the date of allotment of units.
Mr. Marzban IraniMr. Sanjay Pawar (Co-Fund Manager)
Factsheet May, 2022
41
GLOSSARY OF TERMSApplication Amount for Fresh Subscription: This is the minimum investment amount for a new investor in a mutual fund scheme
Asset allocation: Investment of certain proportions of a portfolio in different assets classes like Equity, Debt, Gold etc..
Asset allocation for Equity: The allocation is based on industry classification and not any separate sector classification.
AUM: AUM or assets under management refers to the recent / updated cumulative market value of investments managed by a mutual fund or any investment firm.
Benchmark: A group of securities, usually a market index, whose performance is used as a standard or benchmark to measure investment performance of mutual funds, among other investments. Some typical benchmarks include the Nifty, Sensex, BSE200, BSE500, 10-year Gsec.
Beta: Beta is a measure of an investment’s volatility vis-a-vis the market. Beta of less than 1 means that the security will be less volatile than the market. A beta of greater than 1 implies that the security’s price will be more volatile than the market.
Entry Load: A mutual fund may have a sales charge or load at the time of entry and/or exit to compensate the distributor/agent. Entry Load is charged at the time an investor purchases the units of a mutual fund. The entry load is added to the prevailing NAV at the time of investment. For instance, if the NAV is Rs 100 and the entry load is 1%, the investor will enter the fund at Rs 101.
Exit Load: Exit load is charged at the time an investor redeems the units of a mutual fund. The exit load is reduced from the prevailing NAV at the time of redemption. The investor will receive redemption proceed at net value of NAV less Exit Load. For instance if the NAV is Rs 100 and the exit load is 1%, the investor will receive Rs 99.
Expense ratio: The expense ratio is the annual fee that funds or ETFs charge their unit holders. It expresses the percentage of assets deducted each fiscal year for fund expenses.
Fund Manager: An Employee of the asset management company such as a mutual fund or life insurer, who manages investments of the scheme. He is usually part of a larger team of fund managers and research analysts.
Maturity profile: Maturity is a term defined with respect to Debt Instruments which have fixed maturities after which they cease to exist on payment of the principal and the stipulated interest. A fund's profile consisting of the allocation of the value of assets in terms of percentage and their time left to maturity respectively is called a maturity profile. It gives a summary of the breakup of the value of assets with different specified maturities.
Holdings: The holdings or the portfolio is a mutual fund’s latest or updated report statement of investments/securities. These are usually displayed in terms of percentage to net assets or the rupee value or both. The objective is to give investors an idea of where their money is being invested by the fund manager.
Minimum Additional Amount: This is the minimum investment amount for an existing investor in a mutual fund scheme.
Macaulay Duration: Macaulay Duration is the weighted average term to maturity of the cash flows from a bond. The weight of each cash flow is determined by dividing the present value of the cash flow by the price.
Nature of Scheme: The investment objective and underlying investments determine the nature of the mutual fund scheme. For instance, a mutual fund that aims at generating capital appreciation by investing in stock markets is an equity fund or growth fund. Likewise, a mutual fund that aims at capital preservation by investing in debt markets is a debt fund or income fund. Each of these categories may have subcategories.
NAV: The NAV or the net asset value is the total asset value per unit of the mutual fund after deducting all related and permissible expenses. The NAV is calculated at the end of every business day. It is the value at which the investor enters or exits the mutual fund.
Portfolio turnover ratio: Portfolio turnover is a measure of how frequently assets within a fund are bought and sold by the managers. This ratio measures the fund's trading activity, which is computed by taking the lesser of purchases or sales and dividing by average monthly net assets.
Portfolio Yield: Disclosure only required for Debt Funds.
Rating Profile: Mutual funds invest in securities after evaluating their creditworthiness as disclosed by the ratings. A depiction of the mutual fund in various investments based on their ratings becomes the rating profile of the fund. Typically, this is a feature of debt funds.
Risk Free Returns: MIBOR rate for 1 day. To be sourced from FIMMDA (http://www.fimmda.org) for last day of the month.
Sector allocation: Sector allocation may be defined as an allocation of funds in a certain percentage of the portfolio in different sectors of the economy.
Sharpe Ratio: The Sharpe Ratio, names after its founder, the Nobel Laureate William Sharpe, is a measure of risk-adjusted returns. It is calculated using standard deviation and excess return to determine reward per unit of risk.
SIP: SIP or systematic investment plan works on the principle of making periodic investments of a fixed sum. Its works similar to a recurring bank deposit. For instance, an investor may opt for an SIP that the invests Rs 500 every 15 of the month in an equity fund for a period of three years.
SIP Return: The SIP return calculation should be based on Rs. 10,000 invested every month. Returns would be 1 year, 3 year, 5 year, 7 year etc.
Standard Deviation: Standard deviation is a statistical measure of the range of an investment’s performance. When a mutual fund has a high standard deviation, its means its range of performance is wide, implying greater volatility.
Tracking error: Tracking error is the difference between a portfolio's returns and the benchmark or index it was meant to mimic or beat. Tracking error is sometimes called active risk.
Yield to Maturity: The Yield to Maturity or the YTM is the rate of return anticipated on a bond if held until maturity. YTM is expressed as an annual rate. The YTM factors in the bond’s current market price, par value, coupon interest rate and time to maturity.
BRANCH OFFICES Ahmedabad: Jeevan Sadan, 3rd Flr, LIC Bldg, Opp. Capital Commercial Center, Ahmedabad 380006. Tel.: 079-26588301/40380568. Bangalore: No.4, Canara Mutual Building (Opp. Cash
Pharmacy), 2nd Floor, Residency Rd, Bangalore 560025. Tel.: 080-22118478/22295598. Bhubaneswar: Plot no-2B&2C, Ground floor, Behind Ram Mandir, Unit-3, Kharavel Nagar,
Bhubaneswar 751001, Odisha. Tel.: 9439455522. Borivali: Shop No.3, Raghuviir Tower, SVP Road, Chamunda Circle, Borivali West, Mumbai-400092. Chandigarh: S.C.O.-20-30, Jeevan
Prakash Building, Ground Floor, LIC Divisional Office, Sector-17B, Chandigarh 160017. Tel.: 0172-4622030. Chennai: 15, Anna Salai, Next to V.G.P. Bldg., Chennai 600002. Tel.: 044-
28411984/28555883. Coimbatore: 'India Life Building', LIC Divisional Office, No:1543/44,Trichy Road, Coimbatore-641018. Tel.: 0422-4393014 Ernakulam: 11th Floor, Jeevan Prakash,
M.G. Road, Ernakulam, Kochi 682011. Tel.: 0484-2367643. Goa: Jeevan Vishwas Building, Edc Complex, Plot No. 2, Patto, Panaji, Goa - 403001. Tel.: 0832-2988100 Gurugram: Unit No -
208, 2nd floor, Building Vipul agora, Near Sahara Mall, MG Road, Gurugram, Haryana -122002. Guwahati: LIC Mutual Fund Asset Management Limited, Jeevan Prakash Building, Ground Floor,
S. S. Road, Fancy Bazar, Guwahati - 781 001. Hyderabad: House No. 5-9-57, 4th Floor, Jeevan Jyoti Building, Basheerbagh, Hyderabad 500029. Tel.: 040-23244445/23210572. Indore: U.V.
House, 1st Floor, Snehil 9/1-A South Tukoganj, Indore 452001. Tel.: 0731-2520262. Jaipur: LIC Divisional Office-1 Campus, Ground Floor, Jeevan Nidhi-II (Investment Building), Bhawani
Singh Road, Ambedkar Circle, Jaipur 302005. Tel.: 0141-2743620. Kanpur: Jeevan Vikas, Ground Floor, 16/98, M.G. Road, Kanpur 208001. Tel.: 0512-2360240/3244949. Kolkata: Ground
Floor, Hindustan Building Annexe, 4, Chittaranjan Avenue, Kolkata 700072. Tel.: 033-22129455. Lucknow: Jeevan Prakash, Ground Floor, Main & Annexe Building, 30, Hazratganj, Lucknow
226001. Tel.: 0522-2231186. Mangalore: LIC Mutual Fund Asset Management Limited, No. 6, Ground Floor, Popular Building, K S Rao Road, Mangalore - 575 001. Tel. No.: 0824-2411482.
Mumbai: Gr. Floor, Industrial Assurance Bldg., Opp. Churchgate Station, Mumbai 400020. Tel.: 022-22885971/22817163. Thane: 2nd Floor, Jeevan Chintamani, Near R.T.O., Eastern Express
Highway, Thane - 400 604. Tel.: 022-25804738. Nagpur: Jeevan Seva Bldg., Mount Road, Sadar, Nagpur 440001. Tel.: 0712-2542497. Nashik: Shop No.2, Ground Floor, Rajvee Enclave, New
Pandit Colony, Nashik 422002. Tel.: 0253-2579507. New Delhi: 7th Floor, Jeevan Prakash, 25 K.G. Marg, New Delhi 110001. Tel.: 011-23359190/23314396. Patna: LIC Mutual Fund Asset
Management Limited, Office No. 212, Adison Arcade, Fraser Rod, Near Maurya Hotel, Dist. Patna - 800001. Pune: LIC of India, Pune D.O.-I, 6/7, Shivaji Nagar, University Road, Pune 411005.
Tel.: 020-25537301. Raipur: 1st Floor, Phase 1, Investment Building, LIC of India, Jeevan Bima Marg, Pandri, Raipur, Chhattisgarh - 492004. Phone No.: 0771 - 2236780. Rajkot: LIC of India
Bldg., Jeevan Prakash, Tagore Marg, Rajkot 360002. Tel.: 0281- 2461522. Ranchi: 2nd Floor, Narasaria Tower, Opposite Lalpur Police Station, Ranchi-834001. Tel.: 0651-2206372 Surat:
Office No. 122/B, International Trade Centre (ITC), Majuragate Crossing, Ring Road, Surat – 395002. Tel.: 0261-4862626. Varanasi: CBO 4, LIC of India Divisional Office, Bhelupur Gauriganj,
Varanasi U.P.: 221 001Landline No.: 0542 - 2450 015
Factsheet May, 2022
42
Agartala: Ols Rms Chowmuhani, Mantri Bari Road,1St Floor, Near Traffic Point, Tripura West, Agartala, Tripura, 799001 / 0381-2317519; Agra: House No. 17/2/4, 2Nd Floor, Deepak Wasan Plaza, Behind Hotel Holiday
Inn, Sanjay Place, In The City Of Agra, Agra, Uttar Pradesh, 282002 / 7518801801; Ahmedabad: 201/202 Shail Complex, Opp: Madhusudan House, B/H Girish Cold Drink, Off C G Road, Navrangpura, Ahmedabad,
Gujarat, 380006 / 9081903021; Ajmer: 302, 3Rd Floor, Ajmer Auto Building, Opposite City Power House, Jaipur Road; Ajmer, Rajasthan, 305001 / 0145-5120725; Akola: Yamuna Tarang Complex, Shop No 30, Ground
Floor, N.H. No- 06, Murtizapur Road, Opp Radhakrishna Talkies, Akola, Maharashthra, 444004 / 0724-2451874; Aligarh: Sebti Complex Centre Point, In The City Of Aligarh, Aligarh, Uttar Pradesh, 202001 / 7518801802;
Allahabad: Meena Bazar" 2Nd Floor, 10, S. P. Marg, Civil Lines, Subhash Chauraha, In The City Of Allahabad, Allahabad, Uttar Pradesh, 211001 / 7518801803; Alleppy: 1St Floor, Jp Towers, Mullackal, Ksrtc Bus Stand,
Alleppy, Kerala, 688011 / 0477 2263055; Alwar: Office Number 137, First Floor, Jai Complex Road No – 2, Alwar, Rajasthan, 301001 / 0144-2335550 / 0144-2335551; Amaravathi: Shop No. 21, 2Nd Floor, Gulshan
Tower, Near Panchsheel Talkies, Jaistambh Square, Amaravathi, Maharashthra, 444601 / 0721 2569198; Ambala: 6349,2Nd Floor, Nicholson Road, Adjacent Kos Hospitalambala Cant, Ambala, Haryana, 133001 /
7518801804; Amritsar: 72-A, Taylor'S Road, Opp Aga Heritage Club, Amritsar, Punjab, 143001 / 0183-5053802; Anand: B-42 Vaibhav Commercial Center, Nr Tvs Down Town Shrow Room, Grid Char Rasta, Anand,
Gujarat, 380001 / 9081903038; Ananthapur: Plot No: 12-313, Balaji Towers, Srinagar, Ananthapur Village, Anantapur, Andhra Pradesh, 515001 / 8554244449; Asansol: 114/71 G T Road, Bhanga Panchil Near Nokia
Care, Asansol, West Bengal, 713303 / 0341-2220077; Aurangabad: Shop No B 38, Motiwala Trade Centre, Nirala Bazar, Aurangabad, Maharashthra, 431005 / 0240-2343414; Azamgarh: House No. 290, Ground Floor,
Civil Lines, Near Sahara Office, In The City Of Azamgarh, Azamgarh, Uttar Pradesh, 276001 / 7518801805; Balasore: 1-B. 1St Floor, Kalinga Hotel Lane, Baleshwa, Baleshwar Sadar, Balasore, Orissa, 756001 / 06782-
260503; Bangalore: 59, Skanda Puttanna Road, Basavanagudi, Bangalore, Karnataka, 560004 / 080-26602852; Bankura: Plot Nos- 80/1/A,Natunchati Mahalla, 3Rd Floor,, Ward No-24, Opposite P.C Chandra,
Bankura Town, Bankura, West Bengal, 722101 / 9434480586; Bareilly: 54-Civil Lines, Ayub Khan Chauraha, Civil Lines Road, In The City Of Deoria, , Bareilly, Uttar Pradesh, 243001 / 7518801806; Barhampore (Wb):
Thakur Market Complex, Gorabazar, Post Berhampore Dist Murshidabad, 72 No Nayasarak Road, Barhampore (Wb), West Bengal, 742101 / 0348- 2274494; Baroda: 203, Corner Point, Jetalpur Road, Baroda, Gujarat,
Baroda, Gujarat, 390007 / 0265-2353506; Begusarai: C/O Dr Hazari Prasad Sahu, Ward No 13, Behind Alka Cinema, Begusarai (Bihar), Begusarai, Bihar, 851117 / 7518801807; Belgaum: Cts No 3939/ A2 A1, Above
Raymonds Show Room |Beside Harsha Appliances, Club Road, Belgaum, Karnataka, 590001 / 0831 2402544; Bellary: Shree Gayathri Towers, #4, 1St Floor, K.H.B.Colony, Gopalaswamy Mudaliar Road,, Gandhi
Nagar-Bellary, Karnataka, 583103 / 08392 – 254750; Berhampur (Or): Opp Divya Nandan Kalyan Mandap, 3Rd Lane Dharam Nagar, Near Lohiya Motor, Berhampur (Or), Orissa, 760001 / 0680-2228106; Betul:
107,1St Floor, Hotel Utkarsh, J. H. College Road, Betul, Madhya Pradesh, 460001 / 07141 - 231301; Bhagalpur: 2Nd Floor, Chandralok Complex, Near Ghanta Ghar, In The City Of Bhagalpur, Bihar, Bhagalpur, Bihar,
812001 / 7518801808; Bharuch: 123 Nexus Business Hub, Near Gangotri Hotel, B/S Rajeshwari Petroleum, Makampur Road, Bharuch, Gujarat, 392001 / 9081903042; Bhatinda: Second Floor, Mcb -2-3-01043
Goniana Road, Opp: Nippon India Mf Gt Rode, Near Hanuman Chowk Bhatinda, Bhatinda, Punjab, 161001 / 0164- 5006725; Bhavnagar: 303, Sterling Point, Waghawadi Road, Bhavnagar, Gujarat, 364001 / 278-
3003149; Bhilai: Shop No -1, First Floor Plot No -1, Commercial Complex Nehru Nagar - East, Bhilai, Chatisgarh, 490020 / 0788-2289499 / 2295332; Bhilwara: Shop No. 27-28, 1St Floor, Heera Panna Market, Pur
Road, Bhilwara, Rajasthan, 311001 / 01482-246362 / 246364; Bhopal: Gurukripa Plaza, Plot No. 48A, Opposite City, Hospital, Zone-2, M P Nagar, Bhopal, Madhya Pradesh, Bhopal, Madhya Pradesh, 462011 / 0755-
4092712,0755-4092715; Bhubaneswar: A/181, Saheed Nagar, Janardan House, Room #: 07; 3Rd Floor, Bhubaneswar, Orissa, 751007 / 0674-2548981; Bikaner: 70-71, 2Nd Floor | Dr.Chahar Building, Panchsati
Circle, Sadul Ganj, Bikaner, Rajasthan, 334003 / 0151-2200014; Bilaspur: Shop No -225,226 & 227,2Nd Floor, Narayan Plaza, Link Road, Bilaspur, Chatisgarh, 495001 / 07752-470070; Bokaro: City Centre, Plot No.
He-07, Sector-Iv; Bokaro Steel City, Bokaro, Jharkhand, 827004 / 7542979444; Borivali: Gomati Smuti,Ground Floor, Jambli Gully, Near Railway Station, Borivali, Mumbai, Maharashtra, 400 092 / 022- 28916319;
Burdwan: Anima Bhavan, 1St Floor, Holding No.-42, Sreepally, G. T. Road, West Bengal, Burdwan, West Bengal, 713103 / 0342-2665140; Calicut: Second Floor, Manimuriyil Centre, Bank Road, Kasaba Village,
Calicut, Kerala, 673001 / 0495-4022480; Chandigarh: Sco- 2423-2424, Above Mirchi Restaurent, New Aroma Hotel, First Floor, Sector 22-C, Chandigarh, Union Territory, 160022 / 0172-5101342; Chandrapur: Shop
No-6 Office No-2, 1St Floor Rauts Raghuvanshi Complex, Beside Azad Garden Main Road, Chandrapur, Maharashthra, 442402 / 07172-270262; Chembur: Shop No 4, Ground Floor, Shram Saflya Bldg, N G Acharya
Marg, Chembur, Mumbai, Maharashtra, , 022-662215536; Chennai: F-11, Akshaya Plaza, 1St Floor, 108, Adhithanar Salai, Egmore, Opp To Chief Metropolitan Court, Chennai, Tamil Nadu, 600002 / 044-42028512;
Chinsura: 96, Doctors Lane; Po: Chinsurah; Dt: Hooghly, , Chinsurah, West Bengal, 712101 / 033-26810164; Cochin: Ali Arcade, 1St Floor,Kizhavana Road, Panampilly Nagar, Near Atlantis Junction, Ernakualm,
Kerala, 682036 / 0484 - 4025059; Coimbatore: 3Rd Floor, Jaya Enclave, 1057 Avinashi Road, , Coimbatore, Tamil Nadu, 641018 / 0422 - 4388011; Cuttack: Shop No-45,2Nd Floor, Netaji Subas Bose Arcade, (Big Bazar
Building), Adjacent To Reliance Trends, Dargha Bazar, Cuttack, Orissa, 753001 / 8658691094; Darbhanga: Jaya Complex,2Nd Floor, Above Furniture Planet,Donar, Chowk, Darbhanga, Bihar, 846003 / 7518801809;
Davangere: D.No 162/6 , 1St Floor, 3Rd Main, P J Extension, Davangere Taluk,, Davangere Mandal,Davangere, Davangere, Karnataka, 577002 / 0819-2258714; Dehradun: Kaulagarh Road, Near Sirmaur Margabove,
Reliance Webworld, Dehradun, Uttaranchal, 248001 / 7518801810; Deoria: K. K. Plaza, Above Apurwa Sweets, Deoria, Uttar pradesh, 274001 / 7518801811; Dewas: 27 Rmo House, Station Road, Above Maa
Chamunda Gaes Agency, Dewas, Madhya Pradesh, 455001 / 07272-426010; Dhanbad: 208 New Market 2Nd Floor, Bank More, Dhanbad, Jharkhand, 826001 / 9264445981; Dharwad: 307/9-A 1St Floor, Nagarkar
Colony, Elite Business Center, Nagarkar Colony,P B Road, Dharwad, Karnataka, 580001 / 0836- 2744207; Dhule: Ground Floor Ideal Laundry, Lane No 4, Khol Galli, Near Muthoot Finance, Opp Bhavasar General Store,
Dhule, Maharashthra, 424001 / 02562-282823; Dindigul: No 59B New Pensioner Street, Opp Gomathi Lodge, Palani Road, Dindigul, Dindigul, Tamil Nadu, 624001 / 0451- 2436177; Durgapur: Mwav-16 Bengal
Ambuja, 2Nd Floor City Centre, Distt. Burdwan, Durgapur-16, Durgapur, West Bengal, 713216 / 0343-6512111; Eluru: House No 22B-12-1/1, Ground Floor, Gade Vari Street, Power Peta, Eluru 2, Eluru-West Godavari,
Eluru, Andhra Pradesh, 534002 / 08812-227851 / 52 / 53 / 54; Erode: No: 4, Veerappan Traders Complex, Address No 38/1, Sathy Road, (Vctv Main Road),, Sorna Krishna Complex,Ground Floor, Erode, Tamil Nadu,
638003 / 0424-4021212; Faridabad: A-2B 2Nd Floor, Neelam Bata Road Peerki Mazar, Nehru Ground Nit, Faridabad, Haryana, 121001 / 7518801812; Ferozpur: The Mall Road, Chawla Bulding, Ist Floor, Opp. Centrail
Jail, Near Hanuman Mandir, Ferozepur, Punjab, 152002 / 01632-241814; Gandhidham: Shop # 12, Shree Ambica Arcade, Plot # 300, Ward 12. Opp. Cg High School, Near Hdfc Bank, Gandhidham, Gujarat, 370201 /
9081903027; Gandhinagar: 123, First Floor, Megh Malhar Complex, Opp. Vijay Petrol Pump, Sector - 11, Gandhinagar, Gujarat, 382011 / 079 23244955; Gaya: 54 Lal Kothi Compound, Shree Krishna Road, 2Nd Floor,
North Side, Near Royal Surya Hotel, Gaya, Bihar, 823001 / 0631-2220065; Ghaziabad: Ff - 31, Konark Building, Rajnagar, Lohia Nagar, Ghaziabad, Uttar Pradesh, 201003 / 7518801813; Ghazipur: House No. 148/19,
Mahua Bagh, In The City Of Ghazipur, Ghazipur, Uttar Pradesh, 233001 / 7518801814; Gonda: Shri Market, Sahabgunj, Station Road, Gonda, Uttar Pradesh, 271001 / 7518801815; Gorakhpur: Above V.I.P. House
Ajdacent, A.D. Girls College, Bank Road, Gorakpur, Uttar Pradesh, 273001 / 7518801816; Gulbarga: H No 2-231, Krishna Complex, 2Nd Floor Opp. Municipal Corporation Office, Jagat, Station Main Road, Kalaburagi,
Gulbarga, Karnataka, 585105 / 8088934338; Guntur: 2Nd Shatter, 1St Floor. Hno. 6-14-48, 14/2 Lane, Arundal Pet, Guntur, Andhra Pradesh, 522002 / 0863-2339094; Gurgaon: 2Nd Floor, Vipul Agora, M. G. Road, In
The City Of Gurgaon, Gurgaon, Haryana, 122001 / 7518801817; Guwahati: 1St Floor, Bajrangbali Building, Near Bora Service Station, Gs Road, Guwahati, Assam, 781007 / 8811036746; Gwalior: City Centre, Near
Axis Bank, In The City Of Gwalior, Madhya Pradesh, Gwalior, Madhya Pradesh, 474009 / 7518801818; Haldwani: Above Kapilaz, Sweet House, Opp Lic Building, Pilikothi, Kaladhungi Road, Haldwani, Uttaranchal,
263139 / 7518801819; Haridwar: Shop No. - 17, Bhatia Complex, Near Jamuna Palace, Haridwar (Uttarakhand.), Haridwar, Uttaranchal, 249410 / 7518801820; Hassan: Sas No-212, Ground Floor, Sampige Road 1St
Cross, Near Hotel Souther Star, K R Puram, Hassan, Karnataka, 573201 / 08172 262065; Hissar: Shop No. 20, Ground Floor, R D City Centre, Railway Road, In The City Of Hissar, Hissar, Haryana, 125001 /
7518801821; Hoshiarpur: 1St Floor, The Mall Tower, Opp Kapila Hospital, Sutheri Road, Hoshiarpur, Punjab, 146001 / 01882-500143; Hubli: Ctc No.483/A1/A2, Ground Floor, Shri Ram Palza, Behind Kotak Mahindra
Bank, Club Road, Hubli, Karnataka, 580029 / 0836-2252444; Hyderabad: 303, Vamsee Estates, Opp Bigbazaar, Ameerpet, Hyderabad-16, Telangana-, Hyderabad, Telangana, 500034 / 040-44857874 / 75 / 76; Indore:
101, Diamond Trade Centre, Indore, Madhya Pradesh - Indore, Nearcurewell Hospital, Janjeerwala Square Indore, Indore, Madhya Pradesh, 452001 / 0731-4266828/4218902; Jabalpur: 3Rd Floor, R.R. Tower.5,
Lajpatkunj, Near Tayabali Petrol Pump, Jabalpur, Madhya Pradesh, 482001 / 0761-4923301; Jaipur: Office Number 101, 1St Floor, Okay Plus Tower, Next To Kalyan Jewellers, Government Hostel Circle, Ajmer Road,
Jaipur, Rajasthan, 302001 / 01414167715/17; Jalandhar: 1St Floor,Shanti Towers, Sco No. 37, Puda Complex,, Opposite Tehsil Complex, Jalandhar, Punjab, 144001 / 0181-5094410; Jalgaon: 3Rd Floor, 22
Yashodhan Ring Road, Jalgaon, Jalgaon, Maharashthra, 425001 / 9421521406; Jalpaiguri: D B C Road Opp Nirala Hotel, Opp Nirala Hotel, Opp Nirala Hotel, Jalpaiguri, West Bengal, 735101 / 03561-222136; Jammu:
Gupta'S Tower, 2Nd Floor, Cb-12, Rail Head Complex, Jammu, Jammu & Kashmir, 180012 / 0191-2458820 / 2458818; Jamnagar: 136-137-138 Madhav Palaza, Opp Sbi Bank, Nr Lal Bunglow, Jamnagar, Gujarat,
361001 / 0288 3065810; Jamshedpur: 2Nd Floor, R R Square, Sb Shop Area,Near Reliance Foot Print & Hotel- Bs Park Plaza, Main Road, Bistupur, Jamshedpur, Jharkhand, 831001 / 0657-6655003/ 6655004/
6655005/ 6655006/ 6655007; Jaunpur: R. N. Complex, Opposite Pathak Honda, Above Oriental Bank Of Commerce, In The City Of Jaunpur, Jaunpur, Uttar Pradesh, 222002 / 7518801822; Jhansi: 1St Floor, Puja
Tower, Near 48 Chambers, In The City Of Jhansi, Jhansi, Uttar Pradesh, 284001 / 7518801823; Jodhpur: Shop No. 6, Ground Floor, Gang Tower, Opposite Arora Moter Service Centre, Near Bombay Moter Circle,
Jodhpur, Jodhpur, Rajasthan, 342001 / 7737014590; Junagadh: 124-125 Punit Shopping Center, M.G Road, Ranavav Chowk, Junagadh, Gujarat, 362001 / 0285-2652220; Kannur: 2 Nd Floor, Prabhath Complex, Fort
Road, Nr.Icici Bank, Kannur, Kerala, 670001 / 0497-2764190; Kanpur: 15/46, B, Ground Floor, Opp : Muir Mills, Civil Lines, Kanpur, Uttar Pradesh, 208001 / 7518801824; Karimnagar: D.No: 2-10-1298,2Nd Floor,
Rathnam Arcade, Jyothi Nagar, Karimnagar, Telangana, 505001 / 0878-2244773; Karnal: 18/369, Char Chaman, Kunjpura Road, Behind Miglani Hospital, Karnal, Haryana, 132001 / 0184-2252524; Karur: No 88/11 B B
Plaza, Nrmp Street, K S Mess Back Side, Karur, Tamil Nadu, 639002 / 04324-241755; Khammam: 11-4-3/3, Shop No. S-9, Srivenkata Sairam Arcade, Old Cpi Office, Near Priyadarshini College,Nehru Nagar,,
Khammam, Telangana, 507002 / 8008865802; Kharagpur: Sbi Building, Malancha Road, Po: Kharagpur, Ps: Kharagpur, Holding No 254/220, Ward No.16, Dist: Paschim Medinipur, Kharagpur, West Bengal, 721304 /
03222-253380; Kolhapur: 605/1/4 E Ward, Shahupuri 2Nd Lane, Laxmi Niwas, Near Sultane Chambers, Kolhapur, Maharashthra, 416001 / 0231 2653656; Kolkata: Apeejay House (Beside Park Hotel), C Block,3Rd
Floor, 15 Park Street, Kolkata, West Bengal, 700016 / 033 66285900; Kollam: Ground Floor,A Narayanan Shopping Complex, Kausthubhsree Block, Kadapakada, Kollam, Kerala, 691008 / 474-2747055; Korba: Nidhi
Biz Complex, Plot No 5, Near Patidar Bhawan, T. P. Nagar, In The City Of Korba, Korba, Chatisgarh, 495677 / 7518801826; Kota: D-8, Shri Ram Complex, Opposite Multi, Purpose School, Gumanpura, Kota, Kota,
Rajasthan, 324007 / 0744-5100964; Kottayam: 1St Floor Csiascension Square, Railway Station Road, Collectorate P O, Kottayam, Kerala, 686002 / 0481-2300868/2302420; Kurnool: Shop No:47, 2Nd Floor, S Komda
Shoping Mall, Kurnool, Andhra Pradesh, 518004 / 08518-228550; Lucknow: Ist Floor, A. A. Complex, 5 Park Road, Hazratganj, Thaper House, Lucknow, Uttar Pradesh, 226001 / 7518801830; Ludhiana: Sco - 136, 1St
Floor Above Airtel Showroom, Feroze Gandhi Market, Ludhiana, Punjab, 141001 / 0161-4648747; Madurai: Rakesh Towers, 30-C, Ist Floor, Bye Pass Road, Opp Nagappa Motors, Madurai, Tamil Nadu, 625010 / 0452-
2605856; Malappuram: First Floor, Peekays Arcade, Down Hill, Malappuram, Kerala, 676505 / 0483-2731480; Malda: Ram Krishna Pally, No.1 Govt Colony, Ground Floor, English Bazar; Malda, West Bengal, 732101 /
03512-223763; Mandi: House No. 99/11, 3Rd Floor, Opposite Gss Boy School, School Bazar, In The City Of Mandi, Mandi, Uttar Pradesh, 175001 / 7518801833; Mangalore: Mahendra Arcade Opp Court Road,
Fin Technologies Limited OfficesK
Factsheet May, 2022
Investment Manager:LIC MUTUAL FUND ASSET MANAGEMENT LIMITED
Fax : +91 22 2283 5606 E-mail: [email protected] Floor, Industrial Assurance Bldg., Opp. Churchgate Station, Mumbai 400 020. Board : +91 22 6601 6000
MUTUAL FUND INVESTMENTS ARE SUBJECT TO MARKET RISKS, READ ALL SCHEME RELATED DOCUMENTS CAREFULLY.
/LICMutual /company/LICMutual/LICMutual 1800-258-5678Connect with us: www.licmf.com
Karangal Padi, , Mangalore, Karnataka, 575003 / 0824-2496289; Margao: 2Nd Floor, Dalal Commercial Complex, Pajifond, Margao, Goa, 403601 / 0832-2731823; Mathura: Shop No. 9, Ground Floor, Vihari Lal Plaza,
Opposite Brijwasi Centrum, Near New Bus Stand, In The City Of Mathura, Mathura, Uttar Pradesh, 281001 / 7518801834; Meerut: H No 5, Purva Eran, Opp Syndicate Bank, Hapur Road, Meerut, Meerut, Uttar Pradesh,
250002 / 7518801835; Mehsana: Ff-21 Someshwar Shopping Mall, Modhera Char Rasta, Mehsana, Gujarat, 384002 / 02762-242950; Mirzapur: House No. 404, Ward No. 8, Dankeenganj, Mirzapur, , Mirzapur, Uttar
Pradesh, 231001 / 7518801836;Moga: 1St Floor,Dutt Road, Mandir Wali Gali, Civil Lines, Barat Ghar, Moga, Punjab, 142001 / 01636 - 230792; Moradabad: Chadha Complex, G. M. D. Road, Near Tadi Khana, Chowk, In
The City Of Moradabad, Moradabad, Uttar Pradesh, 244001 / 7518801837; Morena: House No. Hig 959, Near Court, Front Of Dr. Lal Lab, Old Housing Board Colony, Morena, Madhya Pradesh, 476001 / 7518801838;
Mumbai: 24/B, Raja Bahadur Compound, Ambalal Doshi Marg, Behind Bse Bldg, Fort, Maharashthra, 400001 / 022-66235353; Muzaffarpur: First Floor Saroj Complex, Diwam Road, Near Kalyani Chowk, Muzaffarpur,
Muzaffarpur, Bihar, 842001 / 7518801839; Mysore: L-350, Silver Tower, Ashoka Road, Opp.Clock Tower, Mysore, Karnataka, 570001 / 0821-2438006; Nadiad: 311-3Rd Floor City Center, Near Paras Circle, Nadiad,
Gujarat, 387001 / 0268-2563245; Nagerkoil: Hno 45,1St Floor, East Car Street, Nagercoil, Tamil Nadu, 629001 / 04652 - 233552; Nagpur: Plot No. 2, Survey No. 1032 And 1033 Of Gagdakhare Town, Dharampeth,, ,
Nagpur, Maharashthra, 440010 / 0712-2533040; Nanded: Shop No.4, Santakripa Market, G G Road, Opp.Bank Of India, Nanded, Maharashthra, 431601 / 02462-237885; Nashik: S-9, Second Floor, Suyojit Sankul,
Sharanpur Road, Nasik, Maharashthra, 422002 / 0253-6608999; Navsari: 103, 1St Floore Landmark Mall, Near Sayaji Library, Navsari Gujarat, Navsari, Gujarat, 396445 / 9081903040; Nellore: D No:16-5-66 Ramarao
Complex No:2Shop No:305, 3Rd Floor Nagula Mitta Rode, Opp Bank Of Baroda. Nellore, Nellore, Andhra Pradesh, 524001 / 0861 2349940; New Delhi: 305 New Delhi House, 27 Barakhamba Road, New Delhi, New
Delhi, 110001 / 011- 43681700; Nizamabad: H No:5-6-430, Above Bank Of Baroda First Floor, Beside Hdfc Bank,Hyderabad Road, Nizamabad, Telangana, 503003 / 08462-224366; Noida: F - 21, Sector - 18, In The City
Of Noida, , Noida, Uttar Pradesh, 201301 / 7518801840; Palghat: No: 20 & 21, Metro Complex H.P.O.Road Palakkad, H.P.O.Road, Palakkad, Kerala, 678001 / 9895968533; Panipat: 3Rd Floor Preet Tower, Behind
Akash Institute, Gt Road-Panipat, Panipat, Haryana, 132103 / 7518801841; Panjim: Flat No.1-A, H. No. 13/70, Timotio Bldg, Heliodoro Salgado Road, Next To Navhind Bhavan (Market Area), Panjim, Goa, 403001 /
0832-2426874; Pathankot: 2Nd Floor, Sahni Arcade Complex, Adj.Indra Colony Gate Railway Road, Pathankot, Pathankot, Punjab, 145001 / 0186-5080188; Patiala: Sco 27 D, Chotti Baradari, Near Car Bazaar, Patiala,
Punjab, 147001 / 0175-5004349; Patna: 3A, 3Rd Floor Anand Tower, Exhibition Road, Opp Icici Bank, Patna, Bihar, 800001 / 0612-4323066; Pollachi: 1St Floor, Mkg Complex, Opp To Gowri Shankar Hotel, Pollachi,
Tamil Nadu, 642002 / 04259- 235111; Pondicherry: Building No:7, 1St Floor, Thiayagaraja Street, Pondicherry, Pondicherry, 605001 / 0413-45490253; Proddatur: D.No: 4/625, Bhairavi Complex, Bhairavi Complex,
Upstairs Karur Vysya Bank, Gandhi Road, Proddatur, Andhra Pradesh, 516360 / 08564 - 242898; Pune: Office No 207-210, 2Nd Floor, Kamla Arcade, Jangli Maharaj Road, Opposite Balgandharva, Shivaji Nagar, Pune,
Maharashthra, 411005 / 020 -66210449; Raipur: Office No S-13, Second Floor, Reheja Tower, Fafadih Chowk, Jail Road, Raipur, Chatisgarh, 492001 / 0771-4912611; Rajahmundry: D.No.6-1-4, Rangachary Street,
T.Nagar, Near Axis Bank Street, Rajahmundry, Andhra Pradesh, 533101 / 0883-2434468/70; Rajkot: 302, Metro Plaza, Near Moti Tanki Chowk, Rajkot, Rajkot, Gujarat, 360001 / 9081903025; Ranchi: Room No 307 3Rd
Floor, Commerce Tower, Beside Mahabir Tower, Ranchi, Jharkhand, 834001 / 0651-2331320; Ratlam: 1 Nagpal Bhawan Free Ganj Road, Do Batti, Near Nokia Care, Ratlam, Madhya Pradesh, 457001 / 07412-320398;
Renukoot: C/O Mallick Medical Store, Bangali Katra, Main Road, Renukoot, (Dist. Sonebhadra ), Renukoot, Uttar Pradesh, 231217 / 7518801842; Rewa: In Front Of Teerth Memorial Hospital, In The City Of Reewa, ,
Rewa, Madhya Pradesh, 486001 / 7518801843; Rohtak: Shop No 14, Ground Floor, Ashoka Plaza,Delhi Road, , Rohtak, Haryana, 124001 / 7518801844; Roorkee: Shree Ashadeep Complex 16, Tyagi Dairy Road, Civil
Lines,Near Income Tax Office, , Roorkee, Uttaranchal, 247667 / 7518801845; Rourkela: 2Nd Floor, Main Road, Udit Nagar, Rourkela, Sundargarh, Rourekla, Orissa, 769012 / 0661-2500005; Sagar: Ii Floor, Above Shiva
Kanch Mandir., 5 Civil Lines, Sagar, Sagar, Madhya Pradesh, 470002 / 07582-402404; Saharanpur: 18 Mission Market, Court Road, Saharanpur, Uttar Pradesh, 247001 / 7518801846; Salem: No 3/250, Brindavan
Road, 6Th Cross,Perumal Kovil Back Side, Fairland'S, Salem, Tamil Nadu, 636016 / 0427-4020300; Sambalpur: Sahej Plaza; First Floor, Shop No. 219; Golebazar, Sambalpur, Sambalpur, Orissa, 768001 / 0663-
2533437; Satna: Jainam Market, Purana Power House Chauraha, Panni Lal Chowk, In The City Of Satna, Rewa Road, Satna, Madhya Pradesh, 485001 / 7518801847; Shillong: Annex Mani Bhawan, Lower Thana
Road, Near R K M Lp School, Shillong, Meghalaya, 793001 / 0364 - 2506106; Shimla: Triveni Building, By Pas Chowkkhallini, Shimla, Himachal Pradesh, 171002 / 7518801849; Shimoga: Sri Matra Naika Complex, 1St
Floor, Above Shimoga Diagnostic Centre, Llr Road, Durgigudi, Shimoga, Karnataka, 577201 / 08182-228799; Shivpuri: Near Hotel Vanasthali, In Front Of Sawarkar Park, A. B. Road, In The City Of Shivpuri, Shivpuri,
Madhya Pradesh, 473551 / 7518801850; Sikar: First Floor, Super Tower, Behind Ram Mandir Near Taparya Bagichi, Sikar, Rajasthan, 332001 / 01572-250398; Silchar: N.N. Dutta Road, Chowchakra Complex,
Premtala, Silchar, Assam, 788001 / 3842261714; Siliguri: Nanak Complex, Sevoke Road, Siliguri, West Bengal, 734001 / 0353-2522579; Sitapur: 12/12, Surya Complex, Station Road, Sitapur, Sitapur, Uttar Pradesh,
261001 / 7518801851; Solan: Disha Complex, 1St Floor, Above Axis Bank, Rajgarh Road, In The City Of Solan, Solan, Himachal Pradesh, 173212 / 7518801852; Solapur: Block No 06, Vaman Nagar, Opp D-Mart, Jule
Solapur, Solapur, Maharashthra, 413004 / 0217-2300021 / 2300318; Sonepat: 2Nd Floor, Dp Tower, Model Town, Near Subhash Chowk, Sonepat, Haryana, 131001 / 7518801853; Sri Ganganagar: Address Shop No. 5,
Opposite Bihani Petrol Pump, Near Baba Ramdev Mandir Nh - 15, Sri Ganganagar, Rajasthan, 335001 / 0154-2470177; Srikakulam: D No 4-4-97, First Floor, Behind Sri Vijayaganapathi Temple, Pedda Relli Veedhi,
Palakonda Road, Srikakulam, Andhra Pradesh, 532001 / 8942229925; Sultanpur: 1077/3, Civil Lines Opp Bus Stand, Civil Lines, Sultanpur, Uttar Pradesh, 228001 / 7518801854; Surat: Office No: -516, 5Th Floor,
Empire State Building, Near Udhna Darwaja, Ring Road, Surat, Gujarat, 395002 / 9081903041; T Nagar: No 23, Cathedral Garden Road Nungambakkam, Chennai, Tamilnadu, 600 017 / 044 - 28151034; Thanjavur: No
1, Underground,Nallaiyah Complex,, Srinivasam Pillai Road,, , Tanjore, Tamil Nadu, 613001 / 04362-275415; Tirunelveli: 55/18, Jeney Building, S N Road, Near Aravind Eye Hospital, Tirunelveli, Tamil Nadu, 627001 /
0462-4001416; Tirupathi: H.No:10-13-425, 1St Floor , Tilak Road,, Opp: Sridevi Complex ,, Tirupathi, Andhra Pradesh, 517501 / 9885995544 / 0877-2255797; Tirupur: No 669A,Kamaraj Road, Near Old Collector
Office, , Tirupur, Tamil Nadu, 641604 / 0421-4202780; Tiruvalla: 2Nd Floor,Erinjery Complex, Ramanchira, Opp Axis Bank, Thiruvalla, Kerala, 689107 / 04862-211209; Trichur: 2Nd Floor,Brothers Complex, Naikkanal
Junction,Shornur Road, Near Dhanalakshmi Bank H O, Thrissur, Kerala, 680001 / 0487- 6999987; Trichy: No 23C/1 E V R Road, Near Vekkaliamman Kalyana Mandapam, Putthur, Trichy, Tamil Nadu, 620017 / 0431-
4020227; Trivandrum: 2Nd Floor, Akshaya Tower, Sasthamangalam, Trivandrum, Kerala, 695010 / 0471 - 2725728; Tuticorin: 4B/A-10Mani Nagar, Mangal Mall,, Palayamkottai Road, Tuticorin, Tamil Nadu, 628003 /
0461-2334603; Udaipur: Shop No. 202, 2Nd Floor Business Centre, 1C Madhuvan, Udaipur, Udaipur, Rajasthan, 313001 / 0294 2429370; Ujjain: Heritage Shop No. 227, 87 Vishvavidhyalaya Marg, Station Road, Near
Icici Bank Above Vishal Megha Mart, Ujjain, Madhya Pradesh, 456010 / 0734-4250007 / 08; Valsad: 406 Dreamland Arcade, Opp Jade Blue, Tithal Road, Tithal Road, Valsad, Gujarat, 396001 / 02632-258481; Vapi: A-8,
First Floor, Solitaire Business Centre, Opp Dcb Bank, Gidc Char Rasta, Silvassa Road, Vapi, Gujarat, 396191 / 9081903028; Varanasi: D-64/132, 2Nd Floor, Ka, Mauza, Shivpurwa, Settlement Plot No 478, Pargana :
Dehat Amanat, Mohalla Sigra, Varanasi, Uttar Pradesh, 221010 / 7518801855; Vashi: C, Wing Flat NO. 324, 1st Floor, Vashi Plaza, Sector 17 Vashi, Navi Mumbai, Maharashtra, 400 703 / 22-27802684; Vellore: No. 6,
Nexus Towers, 2Nd Floor, Officer'S Line, Above Peter England & Bata Showroom Opp. To Voorhees School, Vellore, Tamil Nadu, 632001 / 0416-41603806; Vijayanagaram: D No : 20-20-29, 1St Floor, Surya Nagar,
Kalavapuvvu Meda, Near Ayodhya Stadium, Dharmapuri Road, Vizianagaram, Vizianagaram, Andhra Pradesh, 535002 / 08922-236965; Vijayawada: Address-1Stfloor, Hno26-23-,
Sundarammastreet,Gandhinagar,Vijayawada,Krishna Ap, Labbipet, Vijayawada, Andhra Pradesh, 520010 / 0866-6604032/39/40; Vile Parle: Shop No.1 Ground Floor, Dipti Jyothi Co-operative Housing Society, Near
MTNL office P M Road, Vile Parle East, Mumbai, Maharashtra / 022 26100967; Visakhapatnam: Ground Floor, 48-10-40, Sri Nagar Colony, Visakhapatnam, Andhra Pradesh, 530016 / 0891-2714125; Warangal: Shop
No22, Ground Floor Warangal, City Center,15-1-237, Mulugu Road Junction, Warangal, Telangana, 506001 / 0870-2441513; Yamuna Nagar: B-V, 185/A, 2Nd Floor, Jagadri Road, Near Dav Girls College, (Uco Bank
Building) Pyara Chowk, Yamuna Nagar, Haryana, 135001 / 7518801857;

Invest in
MUTUAL FUND INVESTMENTS ARE SUBJECT TO MARKET RISKS, READ ALL SCHEME RELATED DOCUMENTS CAREFULLY.
/LICMutual /company/LICMutual/LICMutual 1800-258-5678Connect with us: www.licmf.com
Life filled with
Happiness & togetherness
1800-258-5678
Call Toll FreeTo know more, please consult your Financial Advisor
OR
This product is suitable for investors who are seeking*:
• Regular income for medium-term capital
appreciation with current income.
• An income fund that invests predominantly in debt and money market instruments issued by Banks, PSU's, PFIs and Municipal Bonds.
• Risk - Low to ModerateInvestors understand that their principalwill be at Low to Moderate risk
Low
Low toModerate
Moderate ModeratelyHigh
High
Very High
RISKOMETER HIGHLOW
*Investors should consult their financial advisors if in doubt about whether the product is suitable for them. Risk-o-meter is based on evaluation of risk level of Scheme's portfolio as on 31st May 2022 and the change in Risk-o-meter will be evaluated on a monthly basis. For more details, please visit our website www.licmf.com
Related Documents