Formulation, in vitro release and transdermal diffusion of atropine by implementation of the delivery gap principle J van der Westhuizen 21690782 Dissertation submitted in fulfilment of the requirements for the degree Magister Scientiae in Pharmaceutics at the Potchefstroom Campus of the North-West University Supervisor: Prof JL du Preez Co-Supervisor: Prof J du Plessis Assistant Supervisor: Dr M Gerber November 2014

Welcome message from author
This document is posted to help you gain knowledge. Please leave a comment to let me know what you think about it! Share it to your friends and learn new things together.
Transcript

Formulation, in vitro release and transdermal diffusion of atropine by implementation of the delivery gap
principle
J van der Westhuizen
21690782
Dissertation submitted in fulfilment of the requirements for the degree Magister Scientiae in Pharmaceutics at the
Potchefstroom Campus of the North-West University
Supervisor: Prof JL du Preez
Co-Supervisor: Prof J du Plessis
Assistant Supervisor: Dr M Gerber
November 2014

i
Table of contents
List of figures .................................................................................................................... xiii
List of tables ...................................................................................................................... xvi
Acknowledgments ............................................................................................................. xviii
Abstract ............................................................................................................................. xix
References ......................................................................................................................... xxii
Uittreksel ............................................................................................................................ xxiv
References ......................................................................................................................... xxvii
Chapter 1: Introduction and problem statement
1.1 Introduction ................................................................................................... 1
1.2 Aims and objectives ..................................................................................... 4
References ......................................................................................................................... 5
Chapter 2: Transdermal delivery of atropine by implementation of the Delivery Gap
principle and the Formulating for Efficacy software
2.1 Introduction ................................................................................................... 7
2.2 Transdermal drug delivery ........................................................................... 7
2.2.1 Advantages and disadvantages ................................................................... 8
2.2.1.1 Advantages ..................................................................................................... 8
2.2.1.2 Disadvantages ................................................................................................ 8
2.2.2 Skin permeation .............................................................................................. 9
2.2.2.1 Diffusion through the appendages (shunt route) ............................................. 10
2.2.2.2 Diffusion through the intercellular lipid lamellae .............................................. 10
ii
2.2.2.3 Transcellular diffusion through the corneocytes and the lipid lamellae ............ 10
2.2.3 Physicochemical factors influencing permeation ...................................... 11
2.2.3.1 Skin hydration ................................................................................................. 11
2.2.3.2 Temperature ................................................................................................... 11
2.2.3.3 pH, pKa and unionised/ionised forms .............................................................. 11
2.2.3.4 Diffusion coefficient (D) ................................................................................... 12
2.2.3.5 Molecular shape and size ............................................................................... 13
2.2.3.6 Drug concentration.......................................................................................... 13
2.2.3.7 Partition coefficient (log Poctanol/water) ................................................................. 14
2.3 Optimisation of transdermal delivery systems ........................................... 15
2.3.1 Theoretical considerations .......................................................................... 15
2.3.2 Skin delivery gap .......................................................................................... 16
2.3.3 Relative polarity index .................................................................................. 16
2.3.3.1 Polarity of API equal to the polarity of stratum corneum .................................. 17
2.3.3.2 Polarity of API larger than the polarity of stratum corneum .............................. 17
2.3.3.3 Polarity of API smaller than the polarity of stratum corneum ........................... 18
2.3.4 Application of the RPI ................................................................................... 18
2.3.5 Limitations of the RPI scale ......................................................................... 19
2.4 Optimising skin delivery using an integrated approach ............................ 19
2.4.1 Ideal solubility ............................................................................................... 19
2.4.2 Solubility and partitioning ............................................................................ 20
2.4.2.1 General dispersion interactions ....................................................................... 20
2.4.2.2 Polar cohesion energy .................................................................................... 21

iii
2.4.2.3 Hydrogen bonding........................................................................................... 21
2.4.2.4 Hansen solubility parameter and skin delivery ................................................ 21
2.4.3 Transdermal diffusion .................................................................................. 22
2.4.4 Multi-ingredient formulations ....................................................................... 22
2.4.5 Finite dose delivery ...................................................................................... 22
2.6 Summary ....................................................................................................... 22
References ......................................................................................................................... 24
Chapter 3: Article for publication in: International Journal of Pharmaceutics
Graphical abstract ............................................................................................................. 29
Abstract ............................................................................................................................. 30
1 Introduction ................................................................................................... 31
2 Materials and Methods ................................................................................. 33
2.1 Materials ........................................................................................................ 33
2.2 HPLC analysis .............................................................................................. 33
2.3 Phosphate buffer solution (PBS, pH 7.4) preparation ................................ 33
2.4 Formulation of gels ....................................................................................... 33
2.5 Viscosity ........................................................................................................ 34
2.6 Physicochemical properties ........................................................................ 34
2.6.1 Solubility of atropine .................................................................................... 34
2.6.2 n-octanol/PBS distribution coefficient ........................................................ 34
2.7 Skin preparation............................................................................................ 34
2.8 Diffusion studies ........................................................................................... 35
2.8.1 Membrane release ........................................................................................ 35
iv
2.8.2 Skin diffusion ................................................................................................ 35
2.8.3 Tape stripping ............................................................................................... 36
2.9 Data analysis ................................................................................................. 36
2.10 Statistical analysis ........................................................................................ 36
3 Results and discussion ................................................................................ 37
3.1 Formulation of gels ....................................................................................... 37
3.2 Formulation characteristics ......................................................................... 37
3.2.1 HSP profile .................................................................................................... 37
3.2.2 Viscosity ........................................................................................................ 38
3.3 Physicochemical properties ........................................................................ 38
3.3.1 Solubility ....................................................................................................... 38
3.3.2 n-octanol/PBS distribution coefficient ........................................................ 38
3.4 Diffusion studies ........................................................................................... 39
3.4.1 Membrane release studies ........................................................................... 39
3.4.2 Skin diffusion studies ................................................................................... 40
3.3.3 Tape stripping ............................................................................................... 41
3.4 Statistical analysis ........................................................................................ 42
3.4.1 Membrane release studies ........................................................................... 42
3.4.2 Skin diffusion studies ................................................................................... 42
3.4.3 Tape stripping ............................................................................................... 43
4 Conclusions .................................................................................................. 44
5 Acknowledgements ...................................................................................... 45

v
References ......................................................................................................................... 46
Figure legends ................................................................................................................... 48
Chapter 4: Final conclusion and future prospects
4.1 Final conclusion............................................................................................ 53
4.2 Future prospects........................................................................................... 55
References ......................................................................................................................... 56
Appendix A: Method validation for the high performance liquid chromatography assay of
atropine
A.1 Introduction ................................................................................................... 57
A.2 Chromatographic conditions ....................................................................... 57
A.3 Sample preparation ...................................................................................... 58
A.4 Standard preparation .................................................................................... 58
A.5 Calculations .................................................................................................. 58
A.6 Validation test procedures and acceptance criteria ................................... 58
A.6.1 Specificity ...................................................................................................... 58
A.6.1.1 Acceptance criteria ......................................................................................... 59
A.6.2 Linearity ......................................................................................................... 59
A.6.2.1 Acceptance criteria ......................................................................................... 59
A.6.3 Accuracy ....................................................................................................... 59
A.6.3.1 Acceptance criteria ......................................................................................... 60
A.6.4 Precision ....................................................................................................... 60
A.6.4.1 Intra-day precision (repeatability) .................................................................... 60
A.6.4.2 Inter-day precision .......................................................................................... 60

vi
A.6.4.3 Acceptance criteria ......................................................................................... 60
A.6.5 Limit of detection and lower limit of quantification .................................... 60
A.6.5.1 Acceptance criteria ......................................................................................... 61
A.6.6 Ruggedness .................................................................................................. 61
A.6.6.1 Stability of sample solutions ............................................................................ 61
A.6.6.1.1 Acceptance criteria ......................................................................................... 61
A.6.6.2 System repeatability ........................................................................................ 61
A.6.6.2.1 Acceptance criteria ......................................................................................... 61
A.6.7 Robustness ................................................................................................... 61
A.6.8 System and method performance characteristics (system suitability) ..... 61
A.6.8.1 Acceptance criteria ......................................................................................... 62
A.6.9 Uncertainty of measurement ........................................................................ 62
A.7 Validation results .......................................................................................... 62
A.7.1 Specificity ...................................................................................................... 62
A.7.1.1 Peak purity ...................................................................................................... 65
A.7.2 Linearity and range ....................................................................................... 67
A.7.3 Accuracy ....................................................................................................... 69
A.7.4 Precision ....................................................................................................... 69
A.7.4.1 Intra-day precision (repeatability) and inter-day precision (reproducibility) ...... 69
A.7.5 Limit of detection and lower limit of quantification .................................... 70
A.7.6 Ruggedness .................................................................................................. 70
A.7.6.1 Stability of sample solutions ............................................................................ 70
A.7.6.2 System repeatability ........................................................................................ 72
vii
A.7.7 Robustness ................................................................................................... 72
A.8 Chromatographic performance parameters ................................................ 73
A.9 System suitability parameters ..................................................................... 73
A.9.1 System suitability criteria ............................................................................. 73
A.10 Uncertainty measurements .......................................................................... 74
A.11 Conclusion .................................................................................................... 74
References ......................................................................................................................... 75
Appendix B: Formulation of a gel containing atropine using the Formulating for
Efficacy™ software
B.1 Introduction ................................................................................................... 76
B.2 Preformulation and formulation ................................................................... 76
B.3 Developing a product using the “Formulating for Efficacy” software ...... 76
B.4 Semi-solid formulations: gel and emulgel .................................................. 78
B.5 Skin delivery gap .......................................................................................... 78
B.6 Formulation of an optimised gel, hydrophilic gel and lipophilic emulgel for
both atropine and atropine sulphate ........................................................... 78
B.6.1 Formulation of an optimised gel containing atropine/atropine sulphate .. 79
B.6.1.1 Preparation of the atropine optimised gel ........................................................ 79
B.6.1.2 Preparation of the atropine sulphate optimised gel.......................................... 80
B.6.1.3 Outcome ......................................................................................................... 80
B.6.2 Formulation of a hydrophilic gel containing atropine/atropine sulphate .. 80
B.6.2.1 Preparation of the atropine hydrophilic gel ...................................................... 80
B.6.2.2 Preparation of the atropine sulphate hydrophilic gel ........................................ 80
B.6.2.3 Outcome ......................................................................................................... 81

viii
B.6.3 Formulation of a lipophilic emulgel containing atropine/atropine
sulphate ......................................................................................................... 81
B.6.3.1 Preparation of the atropine lipophilic emulgel .................................................. 81
B.6.3.2 Preparation of the atropine sulphate lipophilic emulgel ................................... 81
B.6.3.3 Outcome ......................................................................................................... 81
B.7 Formulation characteristics ......................................................................... 82
B.7.1 HSP values .................................................................................................... 82
B.7.2 Viscosity and pH ........................................................................................... 86
B.7.3 Particle size ................................................................................................... 87
B.8 Summary ....................................................................................................... 88
References ......................................................................................................................... 90
Appendix C: Franz cell diffusion studies
C.1 Introduction ................................................................................................... 91
C.2 Methods ......................................................................................................... 91
C.2.1 Formulations preparation ............................................................................. 91
C.2.2 Phosphate buffer solution (pH 7.4) preparation ......................................... 92
C.2.3 High performance liquid chromatography analysis ................................... 92
C.2.4 Solubility of atropine .................................................................................... 92
C.2.5 n-Octanol/PBS distribution coefficient and n-octanol/water partition
coefficient ...................................................................................................... 92
C.2.6 Skin preparation............................................................................................ 93
C.2.7 Diffusion studies ........................................................................................... 93
C.2.7.1 Membrane release .......................................................................................... 94
C.2.7.2 Skin diffusion .................................................................................................. 94
ix
C.2.7.3 Tape stripping ................................................................................................. 94
C.2.7 Release and diffusion data analysis ............................................................ 94
C.3 Results and discussion ................................................................................ 95
C.3.1 Physicochemical properties ........................................................................ 95
C.3.1.1 Aqueous solubility ........................................................................................... 95
C.3.1.2 n-Octanol/PBS distribution coefficient and n-octanol/water partition
coefficient ....................................................................................................... 96
C.3.2 Membrane release studies ........................................................................... 97
C.3.3 Skin diffusion studies ................................................................................... 98
C.3.4 Tape stripping ............................................................................................... 104
C.4 Statistical analysis ........................................................................................ 106
C.4.1 Membrane release studies ........................................................................... 106
C.4.2 Skin diffusion studies ................................................................................... 107
C.4.3 Tape stripping ............................................................................................... 107
C.5 Conclusion .................................................................................................... 107
References ......................................................................................................................... 110
Appendix D: Author guidelines: International Journal of Pharmaceutics
D.1 Introduction ................................................................................................... 112
D.2 Types of paper .............................................................................................. 112
D.2.1 Full length manuscripts ................................................................................ 112
D.2.2 Rapid communications................................................................................. 112
D.2.3 Notes.............................................................................................................. 112
D.2.4 Reviews and mini-reviews ............................................................................ 113
D.3 Before you begin........................................................................................... 113

x
D.3.1 Ethics in publishing ...................................................................................... 113
D.3.2 Human and animal rights ............................................................................. 113
D.3.3 Conflict of interest ........................................................................................ 113
D.3.4 Submission declaration and verification..................................................... 113
D.3.5 Contributors .................................................................................................. 114
D.3.6 Authorship..................................................................................................... 114
D.3.7 Changes to authorship ................................................................................. 114
D.3.8 Article transfer service ................................................................................. 115
D.3.9 Copyright ....................................................................................................... 115
D.3.9.1 For subscription articles .............................................................................. 115
D.3.9.2 For open access articles .............................................................................. 116
D.3.9.2.1 Retained author rights ..................................................................................... 115
D.3.10 Role of the funding source ........................................................................... 116
D.3.11 Funding body agreements and policies ...................................................... 116
D.3.12 Open access .................................................................................................. 116
D.3.12.1 Open access ................................................................................................... 116
D.3.12.2 Subscription .................................................................................................... 116
D.3.13 Language (usage and editing services) ...................................................... 117
D.3.14 Submission ................................................................................................... 117
D.3.15 Referees ........................................................................................................ 118
D.4 Preparation .................................................................................................... 118
D.4.1 Use of word processing software ................................................................ 118
D.4.2 Article structure ............................................................................................ 119

xi
D.4.2.1 Subdivision - numbered sections .................................................................... 119
D.4.2.2 Introduction ..................................................................................................... 119
D.4.2.3 Material and methods ..................................................................................... 119
D.4.2.4 Results ............................................................................................................ 119
D.4.2.5 Discussion ...................................................................................................... 119
D.4.2.6 Conclusions .................................................................................................... 119
D.4.2.7 Appendices ..................................................................................................... 119
D.4.3 Essential title page information ................................................................... 120
D.4.4 Abstract ......................................................................................................... 120
D.4.5 Graphical abstract ........................................................................................ 120
D.4.6 Keywords ...................................................................................................... 121
D.4.7 Chemical compounds ................................................................................... 121
D.4.8 Abbreviations ................................................................................................ 121
D.4.9 Acknowledgements ...................................................................................... 121
D.4.10 Units............................................................................................................... 122
D.4.11 Database linking ........................................................................................... 122
D.4.12 Math formulae ............................................................................................... 122
D.4.13 Footnotes ...................................................................................................... 122
D.4.13.1 Table footnotes ............................................................................................... 122
D.4.13.2 Image manipulation ......................................................................................... 122
D.4.13.3 Electronic artwork ........................................................................................... 123
D.4.13.3.1 General points ................................................................................................ 123
D.4.13.3.2 Formats .......................................................................................................... 123
xii
D.4.13.3.3 Color artwork .................................................................................................. 124
D.4.13.3.4 Figure captions ............................................................................................... 124
D.4.14 Tables ............................................................................................................ 124
D.4.15 References .................................................................................................... 125
D.4.15.1 Citation in text ................................................................................................. 125
D.4.15.2 Reference links ............................................................................................... 125
D.4.15.3 Web references .............................................................................................. 125
D.4.15.4 References in a special issue ......................................................................... 125
D.4.15.5 Reference management software ................................................................... 125
D.4.15.6 Reference formatting ...................................................................................... 126
D.4.15.6.1 Reference style ............................................................................................... 126
D.4.15.6.1.1 Text ................................................................................................................ 126
D.4.15.6.1.2 List .................................................................................................................. 126
D.4.15.7 Journal abbreviations source .......................................................................... 127
D.4.16 Video data ..................................................................................................... 127
D.4.17 AudioSlides ................................................................................................... 128
D.4.18 Supplementary data ...................................................................................... 128
D.4.18.1 Submission checklist ....................................................................................... 128
D.5 After acceptance ........................................................................................... 129
D.5.1 Use of the Digital Object Identifier ............................................................... 129
D.5.2 Online proof correction ................................................................................ 130
D.5.3 Offprints ........................................................................................................ 130
D.6 Author inquiries ............................................................................................ 130

xiii
List of figures
Chapter 1
Figure 1.1: A schematic representation of the optimal polarity of the formulation
(adapted from Wiechers et al., 2004:177). .................................................... 3
Chapter 2
Figure 2.1: Permeation pathways across the skin (adapted from Morrow et al.,
2007:38). ...................................................................................................... 9
Figure 2.3: The feedback system seen with a solvent that swells the skin (adapted from
Abbott, 2012:219). ........................................................................................ 13
Figure 2.2: A schematic representation of the optimal polarity of the formulation (adapted
from Wiechers et al., 2004:177). ................................................................... 17
Chapter 3
Figure 1: Flux (µg/cm2.h) of atropine and atropine sulphate from the different formulations
in the membrane release studies after 6 h. The average and median
concentration values are indicated by the lines and squares, respectively (AS-0: n
= 10; A-O, A-L, AS-L: n = 9; A-H, AS-H n = 8). ............................................. 49
Figure 2: Amount per area (µg/cm2) of atropine and atropine sulphate which diffused
through the skin from the different formulations. The average and median
concentration values are indicated by the lines and squares, respectively (AS-0: n
= 10; A-O, A-L, AS-L: n = 9; A-H, AS-H n = 8). ............................................. 50
Figure 3: Concentration (µg/ml) of atropine and atropine sulphate in the stratum corneum-
epidermis for the different formulations after tape stripping. The average and
median concentration values are indicated by the lines and squares, respectively
(AS-0: n = 10; A-O, A-L, AS-L: n = 9; A-H, AS-H n = 8). ............................... 51
Figure 4: Concentration (µg/ml) of atropine and atropine sulphate in the epidermis-dermis
for the different formulations after tape stripping. The average and median
concentration values are indicated by the lines and squares, respectively (AS-0: n
= 10; A-O, A-L, AS-L: n = 9; A-H, AS-H n = 8). ............................................. 52

xiv
Appendix A
Figure A.1: HPLC chromatogram of a standard solution of atropine ................................ 62
Figure A.2: HPLC chromatogram of a placebo (*Atropine elutes here)............................ 63
Figure A.3: HPLC chromatogram of a sample solution stressed in water ........................ 63
Figure A.4: HPLC chromatogram of a sample solution stressed in 0.1 M HCl ................. 64
Figure A.5: Chromatogram of a sample solution stressed in 0.1 M NaOH ....................... 64
Figure A.6: HPLC chromatogram of a sample solution stressed in 10% H2O2 ................. 65
Figure A.7: Purity testing of chromatogram of a sample solution stressed in 0.1 M
NaOH ........................................................................................................... 65
Figure A.8: Overlaid UV spectra of atropine peak ........................................................... 66
Figure A.9: Graph of purity profile of atropine peak ......................................................... 66
Figure A.10: Linear regression graph for atropine ............................................................. 68
Appendix B
Figure B.1: General method for developing a formulation using FFE™ software (Adapted
from JW Solutions, 2014). ............................................................................ 77
Figure B.2: 3D HSP of atropine optimised gel (D = general dispersion interactions; P = polar
cohesion energy and H = hydrogen bonding) ............................................... 84
Figure B.3: 3D HSP of atropine hydrophilic gel (D = general dispersion interactions; P = polar
cohesion energy and H = hydrogen bonding) ............................................... 84
Figure B.4: 3D HSP of atropine lipophilic emulgel (D = general dispersion interactions;
P = polar cohesion energy and H = hydrogen bonding) ................................ 85
Figure B.5: Micrographs of (A) atropine lipophilic emulgel and (B) atropine sulphate lipophilic
emulgel using a Nikon Optiphot light microscope equipped with a Motic Images
Advanced 3.2 camera system ....................................................................... 87

xv
Appendix C
Figure C.1: Flux (µg/cm2.h) of atropine and atropine sulphate from the different formulations
in the membrane release studies after 6 h. The average and median
concentration values are indicated by the lines and squares, respectively (AS-O:
n = 10; A-O, A-L, AS-L: n = 9; A-H, AS-H: n = 8). ......................................... 97
Figure C.2: The amount of atropine per area (µg/cm2) for A-O gel which diffused through the
skin after 12 h (n = 9) .................................................................................... 99
Figure C.3: The amount of atropine per area (µg/cm2) for A-H gel which diffused through the
skin after 12 h (n = 8) .................................................................................... 100
Figure C.4: The amount of atropine per area (µg/cm2) for A-L gel which diffused through the
skin after 12 h (n = 9) .................................................................................... 100
Figure C.5: The amount of atropine per area (µg/cm2) for AS-O gel which diffused through
the skin after 12 h (n = 10) ............................................................................ 101
Figure C.6: The amount of atropine per area (µg/cm2) for AS-H gel which diffused through the
skin after 12 h (n = 8) .................................................................................... 101
Figure C.7: The amount of atropine per area (µg/cm2) for AS-L gel which diffused through the
skin after 12 h (n = 9) .................................................................................... 102
Figure C.8: Amount per area (µg/cm2) of atropine and atropine sulphate which diffused
through the skin from the different formulations. The average and median
concentration values are indicated by the lines and squares, respectively (AS-O:
n = 10; A-O, A-L, AS-L: n = 9; A-H, AS-H: n = 8). ......................................... 102
Figure C.9: Concentration (µg/ml) of atropine and atropine sulphate in the SCE for the
different formulations after tape stripping. The average and median
concentration values are indicated by the lines and squares, respectively (AS-O:
n = 10; A-O, A-L, AS-L: n = 9; A-H, AS-H: n = 8). ......................................... 105
Figure C.10: Concentration (µg/ml) of atropine and atropine sulphate in the ED for the different
formulations after tape stripping. The average and median concentration values
are indicated by the lines and squares, respectively (AS-O: n = 10; A-O, A-L, AS-
L: n = 9; A-H, AS-H: n = 8). ........................................................................... 106

xvi
List of tables
Appendix A
Table A.1: A summary of the results obtained from the validation tests for atropine....... 57
Table A.2: Linearity results for atropine .......................................................................... 67
Table A.3: Range for atropine ........................................................................................ 68
Table A.4: Accuracy parameters of atropine .................................................................. 69
Table A.5: Intra- and Inter-day precision parameters of atropine.................................... 69
Table A.6: Limit of detection and lower limit of quantification of atropine ........................ 70
Table A.7: Sample stability parameters of atropine ........................................................ 71
Table A.8: System repeatability for the peak area and retention time of atropine ........... 72
Appendix B
Table B.1: Ingredients used in the formulations together with the suppliers and batch
numbers ....................................................................................................... 79
Table B.2: Formula of atropine/atropine sulphate optimised gel ..................................... 79
Table B.3: Formula of atropine/atropine sulphate hydrophilic gel ................................... 80
Table B.4: Formula of atropine/atropine sulphate lipophilic emulgel ............................... 81
Table B.5: HSP characteristics of atropine and the ingredients in the formulations ........ 82
Table B.6: HSP characteristics of the different atropine formulations ............................. 83
Table B.7: Average viscosities and pH values of the different formulations of atropine and
atropine sulphate .......................................................................................... 86
Table B.8: Particle size (µm) of the lipophilic emulgels for both atropine and atropine
sulphate ........................................................................................................ 87
xvii
Appendix C
Table C.1: Solubility results of atropine .......................................................................... 95
Table C.2: Log D and log P of atropine and atropine sulphate ....................................... 96
Table C.3: The average and median flux (µg/cm2.h), as well as average and median
percentage atropine and atropine sulphate released from the formulations with
different polarities through membranes after 6 h ........................................... 97
Table C.4: Data obtained from skin diffusion studies ...................................................... 99
Table C5: Data obtained from tape stripping ................................................................. 104

xviii
Acknowledgements
I give praise to the Lord for without His grace, support and strength the completion of this study
would not have been possible. I thank Him for the people He blessed me with to support me
throughout this study.
I realise that the completion of this study would not have been possible without the wisdom,
help and support from the following people:
Ivan, thank you for your unfailing support, love and motivation. Thank you for always
believing in me and encouraging me to do my best. You have made this journey so
much easier. I love you with my whole heart.
Mom and Dad thank you for all your prayers and support. Thank you for all the
opportunities you gave me and for supporting me in everything I do. Thank you for
always having faith in me and encouraging me to do more. I love you very much. My
sisters, Linmarie and Elmien, thank you for your love, friendship and support. I love you
and I am truly blessed to have you as my family
My colleagues and friends thank you for your support and your friendship. Anina thank
you for all the chats, laugh and support. You are a true friend. Johann and Lizelle thank
you for always being friendly and willing to help. Candice thank you for your friendliness
and help during my study.
Prof Jan du Preez my supervisor, thank you for your wisdom, guidance and support.
Thank you for all your help during my study and for your friendliness. Prof made a huge
contribution to the success of my study.
Prof Jeanetta du Plessis thank you for your help and guidance and the opportunity to
undertake the study.
Dr Minja Gerber thank you for all your help during my study, especially with the
formatting.
Prof Faans Steyn thank you for the statistical analysis and helping me to interpret my
results.
Prof Jan Steenekamp thank you for your help with the Mastersizer and your support.
Mark Chandler, Prof Steven Abbott and Dr Charles Hansen for your correspondence and
help to understand the software and HSP.
Thank you to the National Research Foundation (NRF) of South Africa and the Centre of
Excellence for Pharmaceutical Sciences (Pharmacen), North-West University,
Potchefstroom Campus, South Africa, for funding this study
xix
Abstract
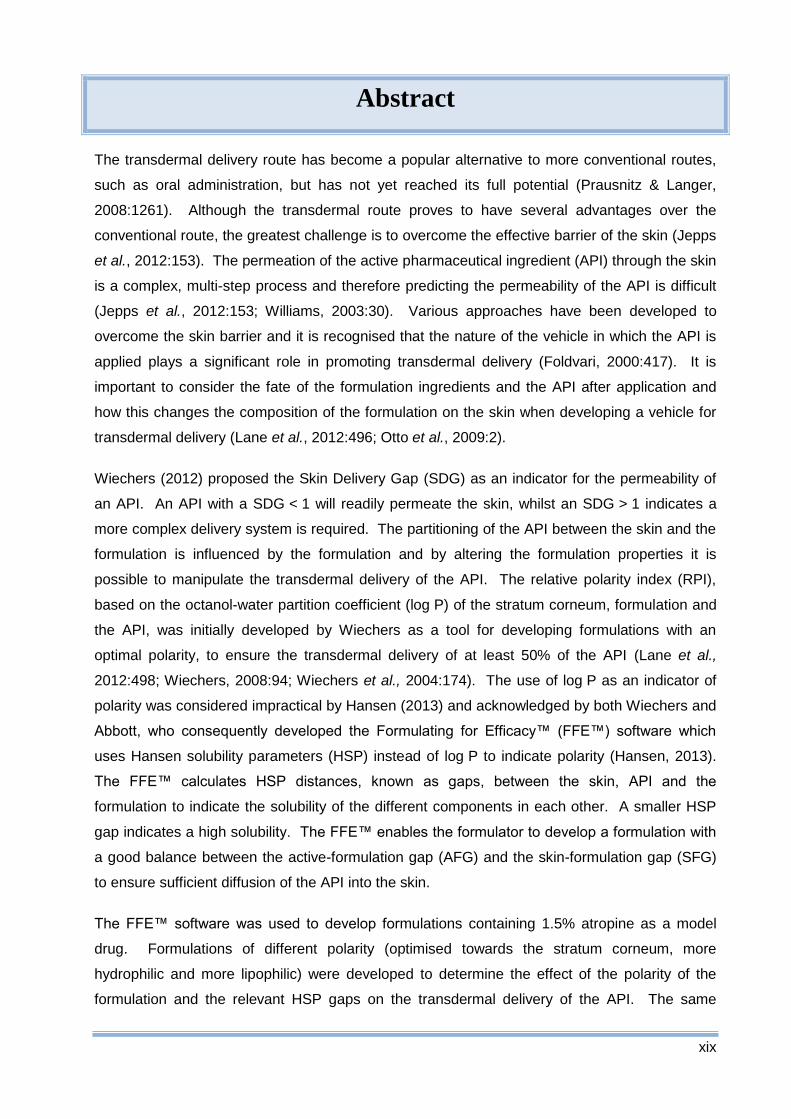
The transdermal delivery route has become a popular alternative to more conventional routes,
such as oral administration, but has not yet reached its full potential (Prausnitz & Langer,
2008:1261). Although the transdermal route proves to have several advantages over the
conventional route, the greatest challenge is to overcome the effective barrier of the skin (Jepps
et al., 2012:153). The permeation of the active pharmaceutical ingredient (API) through the skin
is a complex, multi-step process and therefore predicting the permeability of the API is difficult
(Jepps et al., 2012:153; Williams, 2003:30). Various approaches have been developed to
overcome the skin barrier and it is recognised that the nature of the vehicle in which the API is
applied plays a significant role in promoting transdermal delivery (Foldvari, 2000:417). It is
important to consider the fate of the formulation ingredients and the API after application and
how this changes the composition of the formulation on the skin when developing a vehicle for
transdermal delivery (Lane et al., 2012:496; Otto et al., 2009:2).
Wiechers (2012) proposed the Skin Delivery Gap (SDG) as an indicator for the permeability of
an API. An API with a SDG < 1 will readily permeate the skin, whilst an SDG > 1 indicates a
more complex delivery system is required. The partitioning of the API between the skin and the
formulation is influenced by the formulation and by altering the formulation properties it is
possible to manipulate the transdermal delivery of the API. The relative polarity index (RPI),
based on the octanol-water partition coefficient (log P) of the stratum corneum, formulation and
the API, was initially developed by Wiechers as a tool for developing formulations with an
optimal polarity, to ensure the transdermal delivery of at least 50% of the API (Lane et al.,
2012:498; Wiechers, 2008:94; Wiechers et al., 2004:174). The use of log P as an indicator of
polarity was considered impractical by Hansen (2013) and acknowledged by both Wiechers and
Abbott, who consequently developed the Formulating for Efficacy™ (FFE™) software which
uses Hansen solubility parameters (HSP) instead of log P to indicate polarity (Hansen, 2013).
The FFE™ calculates HSP distances, known as gaps, between the skin, API and the
formulation to indicate the solubility of the different components in each other. A smaller HSP
gap indicates a high solubility. The FFE™ enables the formulator to develop a formulation with
a good balance between the active-formulation gap (AFG) and the skin-formulation gap (SFG)
to ensure sufficient diffusion of the API into the skin.
The FFE™ software was used to develop formulations containing 1.5% atropine as a model
drug. Formulations of different polarity (optimised towards the stratum corneum, more
hydrophilic and more lipophilic) were developed to determine the effect of the polarity of the
formulation and the relevant HSP gaps on the transdermal delivery of the API. The same

xx
formulations were utilised for atropine sulphate to determine the effect the salt form has on the
transdermal delivery of the API compared to the base compound.
The log P and octanol-buffer partition coefficient (log D) of both atropine and atropine sulphate
were determined. Log D is a more reliable indicator of distribution compared to log P, since, it
considers the degree of ionisation of the API (Ashford, 2007:294). The log P and log D of
atropine (0.22 and -1.26) and atropine sulphate (-1.32 and -1.23) both predicted poor skin
penetration (Brown et al., 2005:177). The aqueous solubility of atropine (0.9 mg/ml) also
predicted limited transdermal delivery, while the solubility of atropine in phosphate buffer
solution (PBS pH 7.4) (5.8 mg/ml) indicated favourable permeation (Naik et al., 2000:321). The
high degree of ionisation of the API (99.68 %), at pH 7.4, predicts only a small amount will
penetrate the skin (Barry, 2007:576).
The membrane release study confirmed the API was released from the different formulations
and subsequently skin diffusion studies were conducted, followed by tape stripping after 12 h, to
determine which formulation resulted in the highest transdermal delivery of the API. The
atropine hydrophilic formulation released the highest percentage of API after 6 h (13.930%).
This was explained by the low affinity the lipophilic atropine has towards the hydrophilic
formulation (Otto et al., 2009:9). The highest percentage transdermal delivery (0.065%) was
observed with the lipophilic formulation containing atropine. The higher SFG compared to the
AFG of the lipophilic formulation initially predicted poor transdermal delivery, but when
considering the HSP profile and molar volume of the different ingredients, it was observed the
dimethyl isosorbide (DMI) penetrated and provided a desirable environment for the API in the
skin. The residual formulation (containing less DMI and more polyethylene glycol 400 (PEG 8)
and liquid paraffin) was less desirable for the API and was therefore forced out of the
formulation (Abbott, 2012:219). Both these factors contributed to the high transdermal delivery
of atropine from the lipophilic formulation. The atropine sulphate hydrophilic formulation had the
highest percentage in the stratum corneum-epidermis (0.29 µg/ml) and the hydrophilic
formulation of both atropine and atropine sulphate had the highest concentration in the
epidermis-dermis (both 0.55 µg/ml). The hydrophilic formulations had the lowest driving force
provided by the AFG and the only driving force for the API to leave the formulation was the
concentration gradient. These formulations had the lowest transdermal delivery which indicates
the API had not fully traversed through the skin after 12 h.
According to Wiechers, a minimised SFG would indicate the formulation is optimised towards
the stratum corneum and should essentially deliver the highest percentage of API through the
skin. The results obtained are contrary to this belief and it is concluded that the total HSP
profile and the molar volume of the formulation and the API should be considered when
developing a formulation with optimal transdermal delivery rather than just the SFG.

xxi
Keywords: Transdermal delivery, Formulation, Hansen Solubility Parameters
xxii
References
Abbott, S. 2012. An integrated approach to optimizing skin delivery of cosmetic and
pharmaceutical actives. International journal of cosmetic science, 34:217-222.
Ashford, M. 2007. Bioavailability-physicochemical and dosage form factors. (in Aulton, M.E.,
ed. Pharmaceutics: the design and manufacture of medicines. 3rd ed. London: Churchill
Livingstone Elsevier. p. 286-303.
Barry, B.W. 2007. Transdermal drug delivery. (in Aulton, M.E., ed. Pharmaceutics: the design
and manufacture of medicines. 3rd ed. London: Churchill Livingstone Elsevier. p. 565-597.
Brown, M.B., Martin, G.P., Jones, S.A. & Akomeah, F.K. 2005. Dermal and transdermal drug
delivery systems: Current and Future Prospects. Drug Delivery, 13:175-187.
Foldvari, M. 2000. Non-invasive administration of drugs through the skin: challenges in delivery
system design. Pharmaceutical science & technology today: PSTT, 3(12):417-425.
Hansen, C.M. 2013. HSP examples: skin permeation. http://hansen-solubility.com/Skin.html
Date of access: 15 Sep. 2014.
Jepps, O.G., Dancik, Y., Anissimov, Y.G. & Roberts, M.S. 2012. Modelling the human skin
barrier towards a better understanding of dermal absorption. Advanced Drug Delivery Reviews,
65:152-168.
Lane, M.E., Hadgraft, J., Oliviera, G., Vieira, R., Mohammed, D. & Hirata, K. 2012. Rational
formulation design. International journal of cosmetic science, 34:496-501.
Naik, A., Kalia, Y.N., Guy, R.H. 2000. Transdermal drug delivery: overcoming the skin's barrier
function. Pharmaceutical science technology today, 3(9):318-325.
Otto, A., Du Plessis, J. & Wiechers, J.W. 2009. Formulation effects of topical emulsions on
transdermal and dermal delivery. International journal of cosmetic science, 31:1-19
Prausnitz, M.R. & Langer, R. 2008. Transdermal drug delivery. Nature biotechnology,
26(11):1261-1268.
Wiechers, J.W. 2008. The influence of emollients on skin penetration from emulsions. (In
Wiechers, J.W. Science and application of skin delivery systems. Illinois: Allured Publishing
Corporation. p. 91-108).
xxiii
Wiechers, J.W. 2012. Explaining the importance of the Skin Delivery Gap.
http://www.jwsolutions.com/page/explaining-importance-skin-delivery-gap Date of access: 20
Feb. 2013.
Wiechers, J.W., Kelly, C.L., Blease, T.G. & Dederen, J.C. 2004. Formulating for Efficacy.
International journal of cosmetic science, 26:173-182.
Williams, A.C. 2003. Transdermal and topical drug delivery. London: Pharmaceutical Press.
p. 27-49

xxiv
Uittreksel
Die transdermale roete het ʼn populêre alternatief geword vir konvensionele roetes soos orale
toediening, maar het nog nie die volle potensiaal bereik nie (Prausnitz & Langer, 2008:1261).
Alhoewel die transdermale roete verskeie voordele bo die konvensionele roetes inhou, is die
grootste uitdaging om die effektiewe skans van die vel te oorkom (Jepps et al., 2012:153). Die
penetrasie van die aktiewe farmaseutiese bestanddeel (AFB) deur die vel is ʼn komplekse, multi-
stapproses en dus is dit moeilik om die penetrasie van die AFB te voorspel (Jepps et al.,
2012:153; Williams, 2003:30). Verskeie benaderings is al ontwikkel om die velskans te oorkom
en dit is erken dat die aard van die medium waarin die AFB aangewend word ʼn betekenisvolle
bydra maak in die bevordering van die AFB se transdermale aflewering (Foldvari, 2000:417).
Tydens die ontwikkeling van ʼn medium vir transdermale aflewering is dit belangrik om die lot
van die verskillende formuleringsbestanddele, die AFB na aanwending en hoe dit die
samestelling van die formulering op die vel verander, in ag te neem (Lane et al., 2012:496; Otto
et al., 2009:2).
Wiechers (2012) het die velafleweringsgaping (VAG) voorgestel om die penetrasie vermoë van
ʼn AFB aan te dui. ʼn AFB met ʼn VAG < 1 sal maklik die vel penetreer, terwyl ʼn VAG > 1 aandui
dat ʼn meer komplekse afleweringsisteem benodig word om die AFB effektief af te lewer. Die
verdeling van die AFB tussen die vel en die formulering word beïnvloed deur die formulering en
deur die eienskappe van die formulering te verander is dit moontlik om die transdermale
aflewering van die AFB te manipuleer. Die relatiewe polariteit indeks (RPI), gebaseer op die
oktanol-water verdelingskoëffisiënt (log P) van die stratum corneum, die formulering en die AFB,
was aanvanklik ontwikkel deur Wiechers as ʼn hulpmiddel om formulerings te ontwikkel met ʼn
optimale polariteit wat die transdermale aflewering van ten minste 50% van die AFB sal
verseker (Lane et al., 2012:498; Wiechers, 2008:94; Wiechers et al., 2004:174). Die gebruik
van log P om polariteit aan te dui is as onprakties geag deur Hansen (2013). Hierdie feit was
erken deur beide Wiechers en Abbott en hul het die “Formulating for Efficacy™(FFE™)”
sagteware ontwikkel wat gebruik maak van Hansen oplosbaarheid parameters (HOP) in plaas
van log P om polariteit aan te dui (Hansen, 2013). Die FFE™ bereken die HOP afstand,
bekend as gapings, tussen die vel, AFB en die formulering; om die oplosbaarheid van die
verskillende komponente in mekaar aan te dui. ʼn Kleiner HOP afstand dui goeie oplosbaarheid
aan. Die FFE™ stel die formuleerder in staat om ʼn formulering te ontwikkel met ʼn goeie balans
tussen die aktief-formuleringsgaping (AFG) en die vel-formuleringsgaping (VFG) om voldoende
diffusie van die AFB in die vel in te verseker.

xxv
Die FFE™ sagteware is gebruik om formulerings wat 1.5% atropien as ʼn modelgeneesmiddel
bevat te ontwikkel. Formulerings met verskillende polariteite (geoptimaliseer tot die stratum
corneum, meer hidrofiel en meer lipofiel as die stratum corneum), is ontwikkel om die effek van
die polariteit van die formulering en die relevante HOP gapings op die transdermale aflewering
van die AFB te bepaal. Dieselfde formulerings is gebruik vir atropiensulfaat om die effek van
die sout vorm op die transdermale aflewering van die AFB te vergelyk met die basisverbinding.
Die log P en oktanol-buffer verdelingskoëffisiënt (log D) van beide atropien en atropiensulfaat
was bepaal. Log D is ʼn meer betroubare aanduiding van verdeling in plaas van log P,
aangesien dit die graad van ionisasie van die AFB in ag neem (Ashford, 2007:294). Die log P
en log D van beide atropien (0.22 en -1.26) en atropiensulfaat (-1.32 en -1.23) voorspel swak
velpenetrasie (Brown et al., 2005:177). Die wateroplosbaarheid van atropien (0.9 mg/ml) het
ook beperkte transdermale aflewering voorspel, terwyl die oplosbaarheid van atropien in ʼn
fosfaatbuffer-oplossing (FBO pH 7.4) (5.8 mg/ml) gunstige penetrasie aandui (Naik et al.,
2000:321). Die hoë mate van ionisasie van die AFB (99.68 %) by pH 7.4 voorspel dat slegs ʼn
klein hoeveelheid die vel sal penetreer (Barry, 2007:576).
Die membraanvrystellingsstudie het bevestig dat die AFB vrygestel word vanuit die verskillende
formulerings waarna veldiffusiestudies uitgevoer is gevolg deur die kleefbandafstropingsstudie
na 12 h om te bepaal watter formulering die hoogste transdermale aflewering van die AFB tot
gevolg gehad het. Die atropien hidrofiele formule het die hoogste persentasie van die AFB
vrygestel na 6 h (13.93%). Die verduideliking hiervoor was die lae affiniteit wat die lipofiele
atropien het vir die hidrofiele formulering (Otto et al., 2009:9). Die hoogste persentasie
transdermale aflewering (0.065%) is waargeneem met die lipofiele formulering wat atropien
bevat. Die hoër VFG in vergelyking met die AFG van die lipofiele formulering het aanvanklik
swak transdermale aflewering voorspel, maar nadat die HOP profiel en die molêre volume van
die verskillende bestanddele in ag geneem is, is daar bevind dat die dimetielisosorbied (DMI)
die vel gepenetreer het en ʼn gunstige omgewing vir die AFB in die vel veroorsaak het. Die
oorblywende formulering (wat minder DMI en meer poliëtileenglikool 400 (PEG 8) en vloeibare
paraffien bevat) was minder gunstig vir die AFB en daarom was dit uit die formulering geforseer
(Abbott, 2012:219). Beide hierdie twee faktore het bygedra tot die hoë transdermale aflewering
van atropien uit die lipofiele formulering. Die atropiensulfaat hidrofiele formulering het die
hoogste konsentrasie in die stratum corneum-epidermis (0.29 µg/ml) gehad en die hidrofiele
formulering van beide atropien en atropiensulfaat het die hoogste konsentrasie in die epidermis-
dermis (beide 0.55 µg/ml) gehad. Die hidrofiele formulering het die laagste dryfkrag as gevolg
van die AFG gehad en die enigste dryfkrag vir die AFB om die formulering te verlaat was die
konsentrasie gradiënt. Hierdie formulerings het die laagste transdermale aflewering getoon wat
aandui dat die AFB nog nie die vel ten volle gekruis het na 12 h nie.

xxvi
Volgens Wiechers sal ʼn verkleinde VFG aandui dat ʼn formulering geoptimaliseer is tot die
stratum corneum en moet daarom die hoogste persentasie van die AFB deur die vel aflewer.
Die resultate verkry is in teenstelling hiermee en die gevolgtrekking is gemaak dat die totale
HOP profiel en die molêre volume van die formulering en die AFB in ag geneem moet word
wanneer ʼn formulering met optimale transdermale aflewering ontwikkel word in plaas van net
die VFG.
Sleutel woorde: Transdermale aflewering, Formulering, Hansen oplosbaarheid parameters
xxvii
Verwysings
Abbott, S. 2012. An integrated approach to optimizing skin delivery of cosmetic and
pharmaceutical actives. International journal of cosmetic science, 34:217-222.
Ashford, M. 2007. Bioavailability-physicochemical and dosage form factors. (in Aulton, M.E.,
ed. Pharmaceutics: the design and manufacture of medicines. 3rd ed. London: Churchill
Livingstone Elsevier. p. 286-303.
Barry, B.W. 2007. Transdermal drug delivery. (in Aulton, M.E., ed. Pharmaceutics: the design
and manufacture of medicines. 3rd ed. London: Churchill Livingstone Elsevier. p. 565-597.
Brown, M.B., Martin, G.P., Jones, S.A. & Akomeah, F.K. 2005. Dermal and transdermal drug
delivery systems: Current and Future Prospects. Drug Delivery, 13:175-187.
Foldvari, M. 2000. Non-invasive administration of drugs through the skin: challenges in delivery
system design. Pharmaceutical science & technology today: PSTT, 3(12):417-425.
Hansen, C.M. 2013. HSP examples: skin permeation. http://hansen-solubility.com/Skin.html
Date of access: 15 Sep. 2014.
Jepps, O.G., Dancik, Y., Anissimov, Y.G. & Roberts, M.S. 2012. Modelling the human skin
barrier- Towards a better understanding of dermal absorption. Advanced Drug Delivery
Reviews, 65:152-168.
Lane, M.E., Hadgraft, J., Oliviera, G., Vieira, R., Mohammed, D. & Hirata, K. 2012. Rational
formulation design. International journal of cosmetic science, 34:496-501.
Naik, A., Kalia, Y.N., Guy, R.H. 2000. Transdermal drug delivery: overcoming the skin's barrier
function. Pharmaceutical science technology today, 3(9):318-325.
Otto, A., Du Plessis, J. & Wiechers, J.W. 2009. Formulation effects of topical emulsions on
transdermal and dermal delivery. International journal of cosmetic science, 31:1-19
Prausnitz, M.R. & Langer, R. 2008. Transdermal drug delivery. Nature biotechnology,
26(11):1261-1268.
Wiechers, J.W. 2008. The influence of emollients on skin penetration from emulsions. (In
Wiechers, J.W. Science and application of skin delivery systems. Illinois: Allured publishing
corporation. p. 91-108).

xxviii
Wiechers, J.W. 2012. Explaining the importance of the skin delivery gap.
http://www.jwsolutions.com/page/explaining-importance-skin-delivery-gap Date of access: 20
Feb. 2013.
Wiechers, J.W., Kelly, C.L., Blease, T.G. & Dederen, J.C. 2004. Formulating for efficacy.
International journal of cosmetic science, 26:173-182.
Williams, A.C. 2003. Transdermal and topical drug delivery. London: Pharmaceutical Press.
p. 27-49.
1
Chapter 1
Introduction and problem statement
1.1 Introduction
The transdermal route of administration is an attractive alternative to the standard oral route and
possibly to hypodermic injection (Prausnitz & Langer, 2008:1261). Compared to the oral route,
transdermal delivery has several advantages, such as eliminating the first-pass metabolism of
drugs and the effects of the gastrointestinal-tract on the active pharmaceutical ingredient (API)
(Kornick et al., 2003:953; Walters & Roberts, 2002:4). Due to the reduction of metabolism and
loss of API via the transdermal route, lower doses may be administered which may reduce the
occurrence of adverse effects (Kornick et al., 2003:953). In the event of an adverse effect, the
transdermal therapy can be terminated immediately by removing the formulation (Delgado-
Charro & Guy, 2001:216). Since transdermal delivery avoids possible infection and pain from
injections, the patient‟s acceptance and compliance are higher (Delgado-Charro & Guy,
2001:216; Jepps et al., 2012:153).
The human skin is the largest organ in the human body with multiple possible application sites
for transdermal delivery. Although the skin is easily accessible, it has a highly efficient barrier
function preventing the entry and loss of molecules through the skin (Jepps et al., 2012:153;
Williams, 2003:1). The barrier function is primarily caused by the 10 to15 µm thick stratum
corneum and needs to be overcome when delivering an API transdermally (Prausnitz, 1999:62).
APIs follow a complex process consisting of multiple steps when permeating the skin
(Williams, 2003:30); essentially via three different pathways known as the transappendageal,
the transcellular and intercellular route (Williams, 2003:31). Predicting the permeability of an
API is difficult because of the complexity of the mechanism and structure of these pathways
(Jepps et al., 2012:153). Most API‟s will penetrate the skin via a combination of the different
pathways depending on the physicochemical properties of the API (Williams, 2003:31), with only
a few being compliant for delivery via the transdermal route (Prausnitz & Langer, 2008:1261).
According to Yano (cited by Brown et al., 2005:177), a molecule should have a log P of 1 to 3 to
ensure sufficient aqueous and lipid solubility for skin diffusion. The transdermal route is limited
to molecules having a molecular weight less than 500 Da (Bos & Meinardi, 2000:169).
Although the transdermal delivery of APIs have made a substantial contribution to medical
practice, it has not yet achieved its full potential as an alternative for oral or hypodermic delivery
(Prausnitz & Langer, 2008:1261). In the transdermal delivery of an API, the vehicle in which the
API is applied has a unique effect on its delivery (Otto et al., 2009:2). It is important to

2
understand the fate of the different formulation components and the API after application on the
skin (Lane et al., 2012:496). After application onto the skin, the composition of the formulation
will change as some ingredients permeate the skin, some evaporate and some components are
extracted from the skin (Otto et al., 2009:2). When developing an optimised formulation for
transdermal delivery it is important to follow an integrated approach considering five principles.
These principles include the fact that all APIs have a maximum ideal solubility in a solvent that
cannot be exceeded and that the API and the different ingredients will partition into the skin
based on the partition coefficient. The diffusion of the API is determined by the concentration
gradient and the diffusion coefficient which are influenced by the molecular shape and size and
the concentration of the solvent in the skin. It is important to consider the fact that most
formulations contain multiple ingredients and the formulation will be delivered as a finite dose
(Abbott, 2012:217).
According to Wiechers (2012), the Skin Delivery Gap (SDG) can be used to compare different
molecules based on their intrinsic activity and deliverability. A SDG < 1 indicates that an API
will permeate the skin, whilst an API with an SDG > 1 may need a more complex delivery
system. For transdermal delivery to be possible, the API needs to partition from the formulation
into the skin. The formulation influences the stratum corneum/formulation partition coefficient of
an API and by altering the properties of the formulation, it is possible to manipulate the
transdermal delivery of the API. Wiechers proposed the Relative Polarity Index (RPI) as a tool
to obtain the optimal polarity of the formulation to ensure that at least 50 % of the API would be
delivered to the skin (Lane et al., 2012:498; Wiechers, 2008:94; Wiechers et al., 2004:174).
The RPI uses the polarities (octanol-water partition coefficient (log P)) of the stratum corneum,
the formulation and the API to measure the differences in behaviour between the different
entities. A small RPI will indicate a small difference and thus better compatibility. The optimal
polarity of the formulation is calculated using the following equations and is illustrated in
Figure 1.1 (Wiechers et al., 2004:176, 177):
Polarity of formulation > polarity of penetrant + penetrant polarity gap Equation 1.1
Polarity of formulation < polarity of penetrant – penetrant polarity gap Equation 1.2
The penetrant polarity gap (PPG) is the difference in polarity between the API and the stratum
corneum and can be calculated as follows:
Penetrant polarity gap = |polarity API – polarity stratum corneum| Equation 1.3

3
Figure 1.1: A schematic representation of the optimal polarity of the formulation (adapted
from Wiechers et al., 2004:177).
The RPI scale has some limitations regarding the use of the log P values of the different entities
to describe the polarities. Hansen (2013) states the log P is an impractical indication of
polarities, since it is a ratio of the solubility of a compound in something extraordinary (water)
and something tedious (octanol). Since it is a ratio, a molecule having a 5:1 ratio and one with
a 0.005:0.001 ratio, will have the same log P values and therefore the log P does not fully
represent the polarity of the compound. Wiechers and Abbott acknowledged this fact and
developed the Formulating for Efficacy™ (FFE™) software using Hansen Solubility Parameters
(HSP) as an indicator of polarity (Hansen, 2013). HSP includes general dispersion interaction
(ED), polar cohesion energy (EP) and hydrogen bonding (EH) (Hansen, 2007a:4). The
combination of these three parameters provides a numerical way to describe the polarity of a
molecule (Abbott, 2012:218). The human skin is assumed to be a polymeric barrier with HSP
values of [δD, δP, δH; 17, 8, 8] (Abbott, 2012:219). By calculating the HSP distance between
the skin, API and formulation using Equation 1.4, it is possible to determine the solubility of the
different components in each other.
Distance = Equation 1.4
The smaller the HSP distance, the more soluble the different compounds are in each other. A
small distance between the API and the formulation (API-formulation gap (AFG)) indicates that
a high concentration of the API can be dissolved in the formulation to provide a high
concentration gradient. The smaller the HSP distance is between the formulation and the skin
(skin-formulation gap (SFG)), the more likely the ingredients are to penetrate the skin. The
penetration of the formulation into the skin will cause swelling of the skin and a more welcome
environment for the API is created within the skin. A good balance between the AFG and SFG
Solubility of penetrant
Optimal polarities of formulation
Driving force penetrant
More hydrophilic
More lipophilic
Polarity of API
- PPG + PPG

4
will ensure the diffusion of the API into the skin by providing a substantial driving force and
additional solubility of the API in the skin caused by the formulation (Abbott, 2012:218).
1.2 Aims and objectives
This study forms part of a larger research project on the optimisation of transdermal API
delivery. The transdermal delivery of atropine and atropine sulphate will be investigated by
using the FFE™ software and implementing the Delivery Gap principle. The aim of the study is
to obtain significant insight on the optimisation of transdermal API delivery by using current
science and the understanding of percutaneous absorption, the mechanisms thereof and the
most recent developments in strategies for transdermal formulation.
Formulations containing atropine as a model drug for transdermal delivery will be optimised and
the in vitro skin permeation of the different formulations will be compared. The same
formulations will be used for atropine sulphate in order to determine the effect of the salt form
on the transdermal delivery.
The objectives of the study are to:
Develop and validate a high performance liquid chromatography (HPLC) method for
atropine.
Determine the aqueous solubility of atropine.
Determine the log P and octanol-buffer distribution coefficient (log D) of atropine and
atropine sulphate.
Develop a gel optimised towards the stratum corneum, a more hydrophilic gel and a
more lipophilic emulgel containing atropine using the FFE™ software.
Compound the atropine formulations.
Use the formulations developed for atropine to compound the atropine sulphate
formulations.
Perform membrane diffusion studies to determine API release from the formulation.
Perform transdermal diffusion studies followed by tape-stripping to determine and
compare the transdermal and topical delivery respectively, of the API from the
formulations.

5
References
Abbott, S. 2012. An integrated approach to optimizing skin delivery of cosmetic and
pharmaceutical actives. International journal of cosmetic science, 34:217-222.
Bos, J.D. & Mainardi, M.M.H.M. 2000. The 500 Dalton rule for the skin penetration of chemical
compounds and drugs. Experimental Dermatology, 9:165-169.
Brown, M.B., Martin, G.P., Jones, S.A. & Akomeah, F.K. 2005. Dermal and transdermal drug
delivery systems: Current and Future Prospects. Drug Delivery, 13:175-187.
Delgado-Charro, M.B. & Guy, R.H. 2001. Transdermal drug delivery (In Hillery, A.M., Lloyd,
A.W. & Swarbrick, J. ed. Drug delivery and targeting for pharmacists and pharmaceutical
scientists. London: Taylor & Francis. p. 189-214).
Hansen, C.M. 2013. HSP examples: skin permeation. http://hansen-solubility.com/Skin.html
Date of access: 15 Sep. 2014.
Jepps, O.G., Dancik, Y., Anissimov, Y.G. & Roberts, M.S. 2012. Modelling the human skin
barrier- Towards a better understanding of dermal absorption. Advanced Drug Delivery
Reviews, 65:152-168.
Kornick, C.A., Santiago-Palma, J., Moryk, N., Payne, R. & Obbens, E.A.M.T. 2003. Benefit-Risk
Assessment of Transdermal Fentanyl for the Treatment of Chronic Pain. Drug safety,
26(13):951-973.
Lane, M.E., Hadgraft, J., Oliviera, G., Vieira, R., Mohammed, D. & Hirata, K. 2012. Rational
formulation design. International journal of cosmetic science, 34:496-501.
Otto, A., Du Plessis, J. Wiechers, J.W. 2009. Formulation effects of topical emulsions on
transdermal and dermal delivery. International journal of cosmetic science, 31:1-19.
Prausnitz, M.R. 1999. A practical assessment of transdermal drug delivery by skin
electroporation. Advanced drug delivery, 35:61-76.
Prausnitz, M.R. & Langer, R. 2008. Transdermal drug delivery. Nature biotechnology,
26(11):1261-1268.
Walters, K.A. & Roberts, M.S. 2002. The structure and function of skin (in Walters, K.A. ed.
Dermatological and transdermal formulations. New York: Marcel Dekker. p. 1-39.
6
Wiechers, J.W. 2008. The influence of emollients on skin penetration from emulsions. (In
Wiechers, J.W. Science and application of skin delivery systems. Illinois: Allured publishing
corporation. p. 91-108).
Wiechers, J.W. 2012. Explaining the importance of the skin delivery gap.
http://www.jwsolutions.com/page/explaining-importance-skin-delivery-gap Date of access: 20
Feb. 2013.
Wiechers, J.W., Kelly, C.L., Blease, T.G. & Dederen, J.C. 2004. Formulating for efficacy.
International journal of cosmetic science, 26:173-182.
Williams, A.C. 2003. Transdermal and topical drug delivery. London: Pharmaceutical Press.
p. 27-49.
7
Chapter 2
Transdermal delivery of atropine by implementing the Delivery Gap
principle and the Formulating for Efficacy software
2.1 Introduction
Prior to the 1980‟s, only a small amount of compounds formulated in relatively simple gels and
ointments was delivered via the transdermal route (Wiedersberg & Guy, 2014:150). Although
the transdermal delivery of APIs has made a significant contribution to the practice of medicine,
it has not yet reached its full potential as an alternative delivery route. Transdermal drug
delivery, although having its own limitations, has several advantages over conventional routes
of delivery. The greatest challenge for transdermal delivery is that only a limited number of APIs
can be administered via this route (Prausnitz & Langer, 2008:1261). Significant efforts have
been made to develop various approaches to overcome the skin barrier. The nature of the
transdermal delivery vehicle plays a significant role in the promotion of API delivery over the
skin (Foldvari, 2000:417).
Prof. J.W. Wiechers established the RPI as a basis to obtain the optimised polarity of the
formulation to ensure that at least 50% of the API is delivered (Wiechers et al., 2004:176). This
initial theory was further developed by J.W. Wiechers and S. Abbott to provide an integrated
approach for the optimisation of the transdermal delivery of cosmetic and pharmaceutical
actives using (HSP) (Abbott, 2012:217). This approach focuses on the use of HSP as an
indication for solubility rather than the log P.
This chapter focuses on the transdermal delivery of APIs for a systemic effect, factors
influencing the delivery and the optimisation of the transdermal formulations.
2.2 Transdermal drug delivery
The topical application of medicaments to the skin dates back over thousands of years when
the ancient Greeks made a moisturising balm consisting of water, olive oil and lead oxide which
was applied to the skin. The skin was considered as an impermeable barrier until Bourgat and
his co-workers proved that topical salicylic acid could be used for the treatment of acute
rheumatoid arthritis in 1893 (as cited by Morrow et al., 2007:36). Since their discovery, topical
preparations were only prescribed for the treatment of skin diseases. After World War II, nitro-
glycerine ointment was produced to manage angina attacks after employees working with this
ingredient showed less frequent angina attacks. Since then many other topical preparations

8
were developed to yield a systemic effect (Morrow et al., 2007:36). Most topically applied
preparations are relatively simple semi-solids including gels, creams and ointments (Förster et
al., 2009:309) or a more complex transdermal patch (Thomas & Finn, 2004:697). According to
Barry (2002:500) the aim in dermatological pharmaceutics is ultimately to design active
drugs/pro-drugs and to incorporate them into vehicles or devices for delivery to the active site in
the bio-phase at a controlled rate. The transdermal delivery of an API does however have
some advantages and disadvantages.
2.2.1 Advantages and disadvantages
As with many alternative routes of administration, transdermal delivery has some advantages
and disadvantages in comparison to the oral route.
2.2.1.1 Advantages
The following are some of the advantages of the transdermal drug delivery (TDD):
TDD eliminates first-pass metabolism and gastrointestinal absorption (Kornick et al.,
2003:953).
Lower dosages may be administered in comparison to oral administration, which may
lead to a reduction in adverse effects (Kornick et al., 2003:953).
TDD provides improved patient acceptance and compliance (Delgado-Charro & Guy,
2001:216).
Drug therapy can be terminated in the event of adverse effects by removing the
formulation from the skin (Delgado-Charro & Guy, 2001:216).
TDD avoids pain and possible infections associated with injections (Jepps et al.,
2012:153).
TDD provides an alternative route in patients who are unable to take oral dosage forms
(Kornick et al., 2003:967).
2.2.1.2 Disadvantages
The following are some of the disadvantages of the TDD:
The skin is an effective barrier that limits drug delivery (Jepps et al., 2012:153).
It is difficult to predict the permeability of a compound because of the complex structure
and mechanisms of the delivery pathway (Jepps et al., 2012:153).
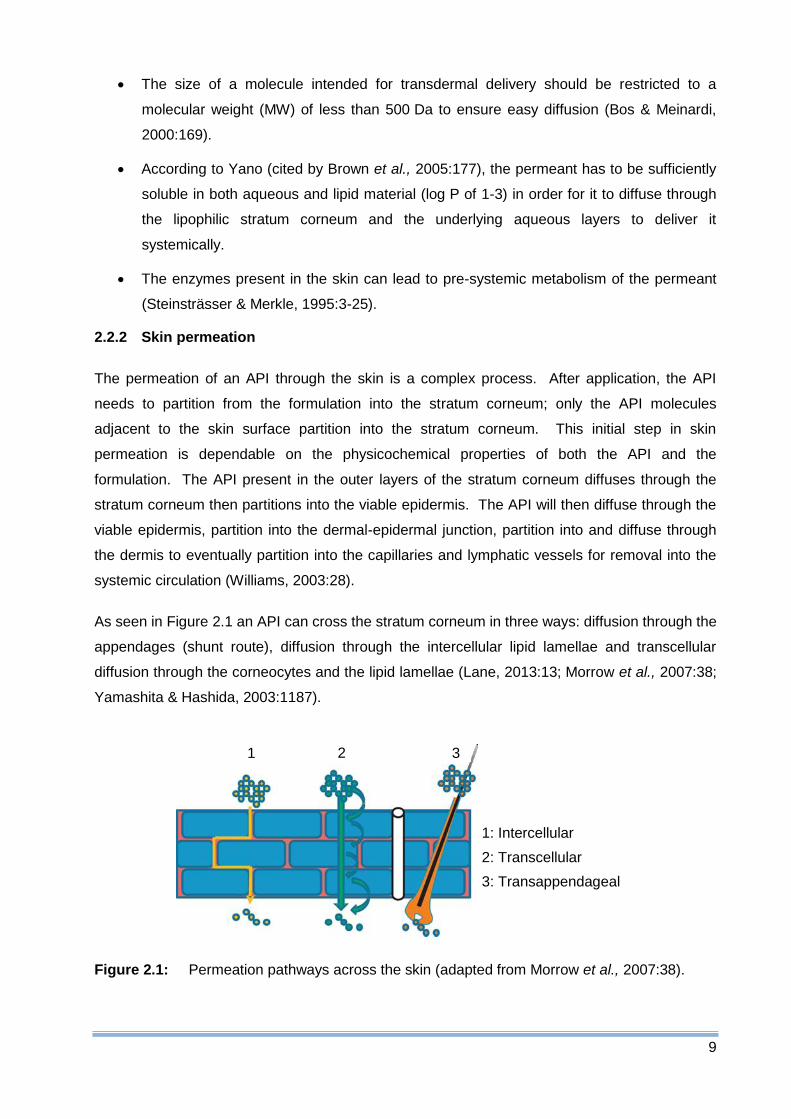
9
The size of a molecule intended for transdermal delivery should be restricted to a
molecular weight (MW) of less than 500 Da to ensure easy diffusion (Bos & Meinardi,
2000:169).
According to Yano (cited by Brown et al., 2005:177), the permeant has to be sufficiently
soluble in both aqueous and lipid material (log P of 1-3) in order for it to diffuse through
the lipophilic stratum corneum and the underlying aqueous layers to deliver it
systemically.
The enzymes present in the skin can lead to pre-systemic metabolism of the permeant
(Steinsträsser & Merkle, 1995:3-25).
2.2.2 Skin permeation
The permeation of an API through the skin is a complex process. After application, the API
needs to partition from the formulation into the stratum corneum; only the API molecules
adjacent to the skin surface partition into the stratum corneum. This initial step in skin
permeation is dependable on the physicochemical properties of both the API and the
formulation. The API present in the outer layers of the stratum corneum diffuses through the
stratum corneum then partitions into the viable epidermis. The API will then diffuse through the
viable epidermis, partition into the dermal-epidermal junction, partition into and diffuse through
the dermis to eventually partition into the capillaries and lymphatic vessels for removal into the
systemic circulation (Williams, 2003:28).
As seen in Figure 2.1 an API can cross the stratum corneum in three ways: diffusion through the
appendages (shunt route), diffusion through the intercellular lipid lamellae and transcellular
diffusion through the corneocytes and the lipid lamellae (Lane, 2013:13; Morrow et al., 2007:38;
Yamashita & Hashida, 2003:1187).
Figure 2.1: Permeation pathways across the skin (adapted from Morrow et al., 2007:38).
1: Intercellular
2: Transcellular
3: Transappendageal
1 2 3
10
2.2.2.1 Diffusion through the appendages (shunt route)
The transappendageal route bypasses the barrier of the stratum corneum by providing a direct
channel across the stratum corneum (Morrow et al., 2007:38; Lane, 2013:13). Sweat glands
and hair follicles only occupy approximately 1% of the total surface area of the skin and
therefore a limited surface area is available for contact with the formulation. Although the
transappendageal route provides a small surface area, it is considered as the dominant
pathway in the initial phase of skin transport and plays an important role in the delivery of ions
and polar compounds as well as compounds such as nanoparticles which have a very high
molecular weight (Morrow et al., 2007:38; Lane, 2013:13; Yamashita & Hashida, 2003:1187).
The sweat ducts provide an aqueous pathway for drugs across the skin, which can be desirable
for many drugs, but in an active secreting sweat duct the aqueous salt solution is moving
against the permeant‟s diffusion pathway which may limit permeation. The sebaceous glands
contain sebum which is rich in lipids and this lipophilic sebum can cause a barrier for the
permeation of hydrophilic drugs (Morrow et al., 2007:38).
2.2.2.2 Diffusion through the intercellular lipid lamellae
In intercellular diffusion, the permeants follow a tortuous route through the lipid matrix
surrounding the corneocytes. The intercellular pathway can be an obstacle for the permeation
of substances since the permeants repeatedly diffuse through and partition into aqueous and
lipid material (Morrow et al., 2007:38). The path length of the intercellular route is greater than
the thickness of the stratum corneum and can range from 150 to 500 µm (Williams, 2003:35).
This route is the predominant permeation pathway for small uncharged molecules (Morrow et
al., 2007:38).
2.2.2.3 Transcellular diffusion through the corneocytes and the lipid lamellae
Drugs that permeate the skin via the transcellular route diffuse through the keratin containing
corneocytes. The highly hydrated keratin provides hydrophilic drugs with an aqueous pathway
through which it can diffuse. A lipid envelope surrounds the corneocytes and connects it to the
interstitial lipids. Keratinised skin cells are separated by multiple lipid bilayers. The API
following the transcellular route will therefore follow a series of diffusion and partitioning steps.
The API will partition into and diffuse through the corneocytes after which it will partition into the
lipid envelope and finally into the multiple lipid bilayers. During steady-state flux the
transcellular route is the major permeation pathway for hydrophilic APIs (Morrow et al.,
2007:38).

11
2.2.3 Physicochemical factors influencing permeation
Some of the physicochemical factors which can influence the permeation of an API through the
skin are skin hydration, temperature, pH, pKa and unionised and ionised forms, diffusion
coefficient, drug concentration and molecular size (Barry, 2007:576).
2.2.3.1 Skin hydration
The permeability of skin is significantly increased when skin is saturated with water because the
tissue swells, softens and wrinkles. Skin hydration can be a result of water diffusion from the
underlying epidermal layers or the accumulation of perspiration after the application of a
dressing or occlusive vehicle. According to Barry (2002:511), stratum corneum hydration is an
important factor that can increase the penetration rate of most substances that permeate the
skin.
2.2.3.2 Temperature
Temperature variations can cause changes in the penetration of an API through human skin. A
decrease in temperature leads to a decreased diffusion coefficient. Fluctuations in temperature
and penetration are usually prevented in humans by adequate clothing on the majority of the
body (Barry, 2002:511).
2.2.3.3 pH, pKa and unionised/ionised forms
Only unionised molecules can readily cross the lipid membranes according to the simple form of
the pH-partition hypothesis (Aulton, 2007:37; Barry, 2007:576). The degree of dissociation of
weak acids and bases is determined by the pH and their pKa and pKb values. The ratio of
unionised/ionised forms of the API can be calculated using the Henderson-Hasselbalch
equation. For a weak base the equation is as follows (Aulton, 2007:37):
Equation 2.1
Where:
= of the API
= partition coefficient
The effective membrane gradient is determined by the fraction of unionised API in the applied
formula. A limited amount of the ionised form of the API does however penetrate the skin
(Barry, 2007:576). These molecules may make a substantial contribution to the total flux since
their aqueous solubility is usually higher than that of the unionised species in saturated or near-
12
saturated solutions. The stratum corneum is remarkably resistant to alterations in the pH and
can tolerate a pH range of 3-9 (Barry, 2002:511). The pKa value for atropine is 9.9 (Moffat et al.,
2011:933). At pH 7.4, atropine and atropine sulphate will be almost completely ionised (99 %),
which means atropine is highly soluble in the solution but will pose problems in the transdermal
delivery.
Aqueous solubility is directly linked to the degree of ionisation (Aulton, 2007:37). An aqueous
solubility of > 1 mg/ml is necessary for transdermal delivery (Naik et al., 2000:319). Atropine
has an aqueous solubility of 2.19 mg/ml which is sufficient for transdermal delivery (Moffat et al.,
2011:933).
2.2.3.4 Diffusion coefficient (D)
The diffusion coefficient (D) is the penetration rate of a molecule under specified conditions. A
molecule‟s diffusional speed is dependable on the state of matter of the medium through which
it is diffusing. The diffusion coefficient of a molecule in air and gases is large because the void
space available to the molecules is great in comparison to its size and the mean free path is
large between molecular collisions. The diffusion coefficient in liquids is decreased because of
a decreased free volume and a decreased mean free path. The diffusivities in skin
progressively decreases and the lowest values are reached in the compacted stratum corneum
matrix. If a constant temperature is maintained, the diffusion coefficient of a drug in the skin or
in a topical vehicle is determined by the properties of both the drug and the medium and the
interaction between them (Barry, 2002:512). Relative diffusion coefficients can be estimated
using the molar volume; the diffusion coefficient depends on (molar volume)x. Skin has a
dependence on molar volume with x~2 (Abbott, 2012:219). Atropine has a molar volume of
240.2 cm3/mol (Vafai et al., 1993:126). In solvent blends molecules with smaller molar volumes
will enter the skin faster than those with higher molar volumes. If the resulting mixture of
solvents produces a less favourable environment for the API, a resulting driving force will be
provided to force the API into the skin. If this blend is too unfavourable for the API, the API may
precipitate out of the solution and will not be delivered into the skin (Abbott, 2012:219).
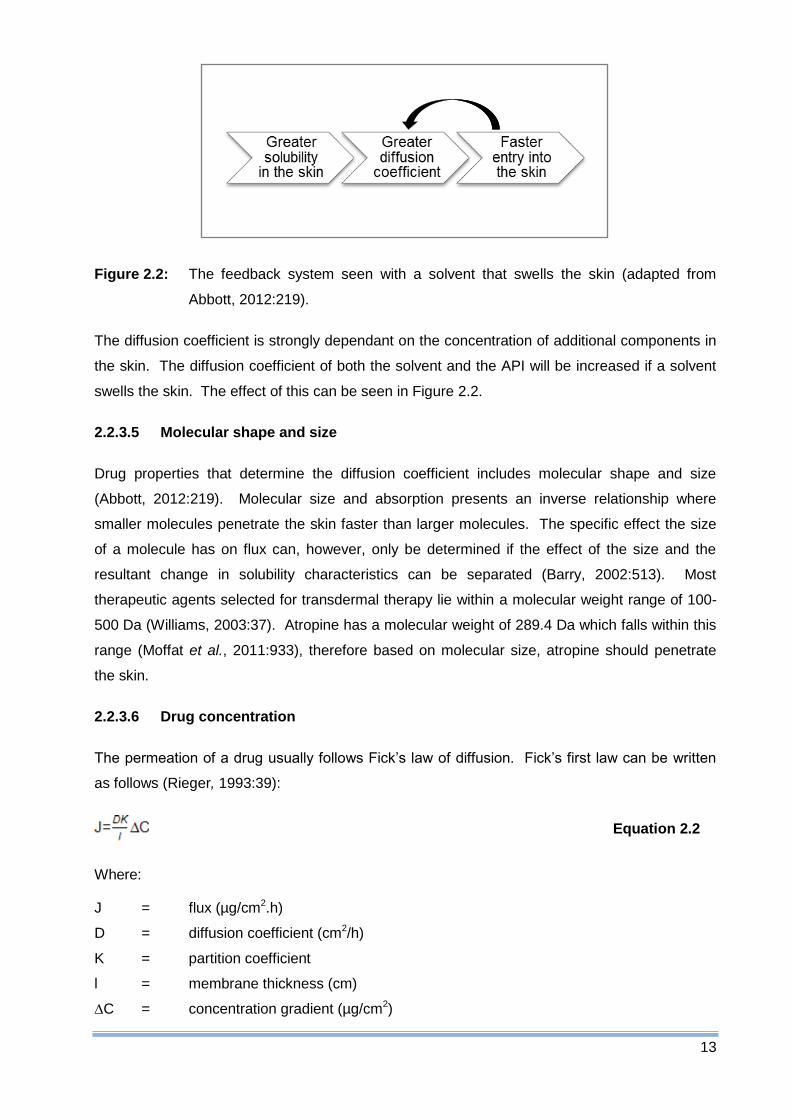
13
Figure 2.2: The feedback system seen with a solvent that swells the skin (adapted from
Abbott, 2012:219).
The diffusion coefficient is strongly dependant on the concentration of additional components in
the skin. The diffusion coefficient of both the solvent and the API will be increased if a solvent
swells the skin. The effect of this can be seen in Figure 2.2.
2.2.3.5 Molecular shape and size
Drug properties that determine the diffusion coefficient includes molecular shape and size
(Abbott, 2012:219). Molecular size and absorption presents an inverse relationship where
smaller molecules penetrate the skin faster than larger molecules. The specific effect the size
of a molecule has on flux can, however, only be determined if the effect of the size and the
resultant change in solubility characteristics can be separated (Barry, 2002:513). Most
therapeutic agents selected for transdermal therapy lie within a molecular weight range of 100-
500 Da (Williams, 2003:37). Atropine has a molecular weight of 289.4 Da which falls within this
range (Moffat et al., 2011:933), therefore based on molecular size, atropine should penetrate
the skin.
2.2.3.6 Drug concentration
The permeation of a drug usually follows Fick‟s law of diffusion. Fick‟s first law can be written
as follows (Rieger, 1993:39):
Equation 2.2
Where:
J = flux (µg/cm2.h)
D = diffusion coefficient (cm2/h)
K = partition coefficient
l = membrane thickness (cm)
∆C = concentration gradient (µg/cm2)

14
According to Fick‟s law, the flux of a drug across the skin is proportional to the concentration
gradient across the entire barrier phase (Barry, 2002:512). For fast diffusion, a high
concentration of API is needed in the outer nanometre of the stratum corneum (Abbott,
2012:219). The solubility of a drug can be optimised by altering the composition of the solvent
in the vehicle (Barry, 2002:512). This means the HSP distance should be as small as possible
between the HSP of the skin and the permeating species (Abbott, 2012:219).
2.2.3.7 Partition coefficient (log Poctanol/water)
The partition coefficient of an API is an indication of how the compound will distribute between
two phases. A partition coefficient between octanol and water is often used in transdermal
studies and is an indication for how well the API will distribute between the lipids and water in
the stratum corneum. The partition coefficient of an API is usually the principal factor that
determines the pathway it will follow through the skin. Atropine has a log P of 1.8 (Moffat et al.,
2011:933). It is expected that the dominant route of permeation for hydrophilic compounds will
be the intracellular pathway and for lipophilic compounds the intercellular pathway. According
to Flyn and Yalkowski (as cited by Williams, 2003:35) an increase in the lipophilicity of an API
will increase flux. The bilayered lipids are rate limiting in the flux of lipophilic permeants,
indicating that permeation via the intercellular route is allowed by the partition coefficient. The
lipid bilayers contain polar areas and hydrophilic compounds may partition into these polar
areas and therefore it can cross the skin via the intercellular route as well as the intracellular
route. According to Roberts et al. (as cited by Williams, 2003:36), this has led to the mixed
permeation model proposal which indicates that most drugs permeate the skin via the
continuous intercellular domains. The micro-routes of permeation are provided by both the lipid
and polar regions in the lipid bilayer and are dependable on the partition coefficient. Molecules
such as atropine, with an intermediate partition coefficient (log P 1-3), will predominately follow
the intercellular route. More hydrophilic compounds (log P <1) will permeate via the
transcellular route, but there are still lipid bilayers between keratinocytes which need to be
crossed. The transappendageal route may become significant for highly hydrophilic and polar
molecules. Highly lipophilic compounds (log P >3) will almost exclusively traverse the stratum
corneum via the intercellular pathway, but the permeant has to partition into the essentially
aqueous viable epidermis which can cause restrictions for transdermal delivery (Williams,
2003:36).

15
2.3 Optimisation of transdermal delivery systems
2.3.1 Theoretical considerations
The first step in the transdermal delivery of an API is the partitioning from the formulation into
the stratum corneum. This partitioning is indicated by the stratum corneum/formulation partition
coefficient (Ksc/formulation) of the penetrating molecule and can be defined as:
Equation 2.3
Where:
Ksc/formulation = Stratum corneum/formulation partition coefficient
Cpenetrant = Solubility of the API in the stratum corneum relative to the formulation
To increase the partitioning of an API from the formulation into the skin, the solubility of the API
in the formulation can be decreased, or the solubility in the stratum corneum increased.
Conversely, the Cpenetrant needs to be large in the formulation in order to increase the flux of the
API over the stratum corneum, according to Equation 2.3 (Wiechers et al., 2004:174).
Changing the parameters of Equation 2.3 can influence the penetration of an API into the skin.
The only parameter that can easily be altered by the formulator without having to repeat efficacy
studies is the stratum corneum/formulation partition coefficient (KSC/formulation), since it depends on
the formulation. The formulation determines how much API is dissolved in it and is available for
penetration into the skin. A higher concentration of the API in the formulation will mean more of
the API will penetrate before saturation is reached. To achieve this, it is required that the API
should be highly soluble in the formulation. Another parameter influenced by the formulation is
the polarity of the formulation relative to the polarity of the stratum corneum. If an API is better
dissolved in the stratum corneum than in the formulation, the API will prefer to penetrate the
skin rather than to stay in the formulation. It is therefore required that the API be more soluble
in the stratum corneum relative to the formulation. These two requirements cannot be fully
adhered to at the same time, but the optimal polarity for the formulation can be obtained by
using the novel concept RPI (Lane et al., 2012:498; Wiechers, 2008:94; Wiechers et al.,
2004:174) described below. By using the RPI, a formulation can be developed with the best
balance between having the highest possible concentration of API in the formulation and
ensuring the best driving force for the partitioning of the API into the skin. The optimal polarity
of a formulation determined by the RPI will allow the penetration of 50% of the API into the skin
(Wiechers, 2008:94).
16
2.3.2 Skin delivery gap
The SDG, as described by Wiechers (2012), is calculated as the ratio between the minimum
effective concentration (MEC) and the local tissue concentration (LTC). An API with a SDG < 1
will be readily delivered to the skin, whilst a higher SDG (> 1) will require a more complex
system to deliver an effective concentration of the API at the action site. The LTC can be
predicted by utilising a chain of calculations based on the molecular modelling of the skin and
pharmacokinetic assumptions. By using the SDG, active molecules can be compared on both
their intrinsic activity and their deliverability (Wiechers, 2012).
2.3.3 Relative polarity index
The RPI is a new method in which the polarity of an API can be compared to that of the stratum
corneum and the emollients found in the formulations. This unique method can be visualised as
a vertical line with a logarithmic scale. The highest polarity is at the top and the highest
lipophilicity at the bottom and the log P of the different components is used to express the
polarity. The use of this concept requires the following three polarities (on log10 scale): the
polarity of the stratum corneum, the API and the formulation. These three polarities are placed
on the RPI scale (Wiechers et al., 2004:176). The RPI measures the difference in behaviour
between two molecules; a small RPI will indicate a small difference and a large RPI will indicate
a large difference (Wiechers. 2008: 95).
To obtain a higher concentration of the API in the stratum corneum than in the formulation, the
following equations can be used to determine the required polarity of the formulation (Wiechers
et al., 2004:176):
Polarity of formulation > polarity of penetrant + penetrant polarity gap Equation 2.4
Polarity of formulation < polarity of penetrant – penetrant polarity gap Equation 2.5
The PPG is the difference in polarity between the API and the stratum corneum and can be
calculated as follows:
Penetrant polarity gap = |polarity API – polarity stratum corneum| Equation 2.6
Figure 2.3 illustrates the optimal polarity of a formulation which will provide the penetration of at
least 50% of the API into the stratum corneum.

17
Figure 2.3: A schematic representation of the optimal polarity of the formulation (adapted
from Wiechers et al., 2004:177).
Three scenarios can be defined using the RPI scale:
1) the polarity of the API is equal to that of the stratum corneum,
2) the polarity of the API is larger than that of the stratum corneum,
3) the polarity of the API is smaller than that of the stratum corneum (Wiechers et al.,
2004:176).
2.3.3.1 Polarity of API equal to the polarity of stratum corneum
When using an API with a polarity equal to that of the stratum corneum in a formulation with the
same polarity, the solubility of the API will be the same in both the stratum corneum and the
formulation. The only driving force for the API to leave the formulation and enter the stratum
corneum is the initial concentration difference upon application. The API will leave the
formulation until equilibrium is reached and the concentration of the API in the formulation is
equal to the concentration in the stratum corneum. The absolute amount of the API in the two
layers will depend on the volumes. The penetration of the API into the stratum corneum will still
be significant although the polarity difference is absent. In reality this situation is highly unlikely
since most API‟s have a polarity different to that of the stratum corneum (Wiechers et al.,
2004:176).
2.3.3.2 Polarity of API larger than the polarity of stratum corneum
In a situation where the polarity of the API is higher (more hydrophilic) than the polarity of the
stratum corneum, the PPG needs to be calculated using Equation 2.6. The PPG is always
positive since an absolute difference is used. The polarity of the phase in which the API is
dissolved should be either greater than the polarity of the API plus the PPG or less than the
Driving force penetrant
Optimal polarities of formulation
Solubility of penetrant
More hydrophilic
More lipophilic
Polarity of API
- PPG + PPG

18
polarity of the API minus the PPG. The larger the polarity difference between the API and the
formulation, the greater the driving force will be for the partitioning of the API into the stratum
corneum. The negative impact of a large polarity difference between the formulation and the
API is a reduction in the solubility of the API in the formulation. The optimal polarity of the
formulation can be determined with Equations 2.4 and 2.5, to ensure there will be penetration of
at least 50% of the API into the stratum corneum (Wiechers et al., 2004:176).
2.3.3.3 Polarity of API smaller than the polarity of stratum corneum
For an API that is more lipophilic than the stratum corneum, the PPG also needs to be
calculated. Again the polarity of the formulation should be more than the polarity of the API plus
the PPG, or less than the polarity of the API minus the PPG. In a formulation that is more
hydrophilic than the stratum corneum, the API will prefer to penetrate the stratum corneum since
its solubility is higher in the stratum corneum than in the formulation. As stated above, a more
extreme difference in polarities between the API and the formulation will provide a bigger driving
force for the API to penetrate the stratum corneum, but the solubility of the API in the
formulation will decrease with an increase of the polarity difference. Equations 2.4 & 2.5 are
used to determine the optimal polarity of the formulation (Wiechers et al., 2004:176).
2.3.4 Application of the RPI
To obtain the optimal polarity of the formulation the solubility of the API in the formulation should
be optimised (step 1) as well as the driving force (step 2). After determining the log P of the
API, the PPG should be calculated. With the PPG known, the two polarities of the formulation
can be calculated using Equations 2.4 and 2.5, which will give an indication of whether the API
will be dissolved in a hydrophilic or lipophilic phase. A primary emollient or water-miscible
solvent should be identified in which the API is dissolved. The RPI-value of this primary
emollient or solvent should be identical or close to that of the API (Wiechers et al., 2004:178-
179).
The driving force for the penetration of the API into the skin is increased by reducing its
solubility in the primary emollient or solvent. To achieve this, a secondary emollient or solvent is
incorporated into the formulation. The API should be less soluble in the secondary emollient or
solvent, but this secondary emollient or solvent should still be miscible with the primary
emollient or solvent. The addition of increasing amounts of the secondary emollient or solvent
will decrease the solubility of the API and consequently the amount of dissolved API relative to
the amount that could be dissolved increases. When a value of 90% is reached for the fraction
of maximum solubility in the solvent mixture, sufficient secondary emollient has been added.
This value will allow for temperature changes during transport or storage and will avoid the
crystallisation of the API in decreased temperatures (Wiechers et al., 2004:179).

19
The optimal polarity of the formulation can alternatively be obtained by selecting a single
emollient with the correct RPI-value however, this does not allow the combination of different
emollients in order to obtain the preferred skin sensory characteristics (Wiechers et al.,
2004:179). More than one emollient can be used in fixed ratios as well. An emulsifier should
be selected for this to obtain optimised delivery of the API (Wiechers. 2008:98).
2.3.5 Limitations of the RPI scale
The term „polar‟ is generally misused in literature since it is possible for a molecule to be mainly
polar but insoluble in water (Hansen, 2007c:5). According to Hansen (2013), log P is
impractical for many applications including the prediction of skin permeation. Hansen‟s first
objection is the fact that log P is the solubility ratio of a compound in something extraordinary
(water) and something tedious (octanol). Secondly, since log P is a ratio, a molecule with a 5:1
ratio will have the same log P as a compound with a ratio of 0.005:0.001. From this it is clear
that log P does not fully represent the polarity of the compound. The last objection was the fact
that log P primarily depends on the molar volume of a compound. Both Wiechers and Abbott,
the creators of the FFE™ software, acknowledged the fact that log P is not a rational indicator
for skin permeation and that HSP should rather be used (Hansen, 2013).
2.4 Optimising skin delivery using an integrated approach
To overcome the limitations stated above, Abbott (2012:217) suggests an integrated approach
when optimising the skin delivery of pharmaceutical and cosmetic actives. This approach takes
the following five key principles into account:
1) All actives have a maximum „ideal solubility‟.
2) The activity coefficients of actives and solvents will determine their partitioning into the
skin.
3) Transdermal diffusion can be modelled on a concentration gradients and diffusion
coefficients basis and depends on the shape/size of the molecule and the solvent
concentration at each point in the skin.
4) All ingredients have an effect on the system behaviour.
5) Many cosmetic/pharmaceutical formulations are delivered as a finite dose rather than an
infinite dose.
2.4.1 Ideal solubility
Thermodynamically, a perfect solvent will have an activity coefficient of one. A high activity
coefficient indicates a bad solvent and the API will therefore be insoluble in it (Abbott,

20
2012:217). Several factors determine the ideal solubility of any compound. These factors
include the physicochemical properties of the compound as well as its physical state of matter
and environmental factors such as temperature and pressure (Yalkowsky & Wu, 2010:1100).
The solubility of an active in an ideal solute can be determined by the crystal-liquid fugacity ratio
(CLFR) also known as the ideal mole fractional solubility (Xideal). The CLFR depends on the
melting point of the solute, its entropy of melting and differential heat capacity of melting of the
solute. According to Yalkowsky & Wu (2012:1105) the estimated ideal solubility can be
determined using only the melting point, unless full data are available, using the following
equation:
log (CLFR) = -0.01(MP – 25) Equation 2.7
This equation is only used when full data about the above mentioned factors are unavailable.
From the equation, it is clear a higher melting point (MP) indicates lower solubility (Yalkowsky &
Wu, 2010:1105). This estimated solubility can be used to determine if the solvent will
sufficiently dissolve at least the minimum effective dose of the API (Abbott, 2012:218).
2.4.2 Solubility and partitioning
Human skin is assumed to be a polymeric barrier (Hansen, 2007a:250). Some of the aspects of
human skin and formulations can be characterised using HSP (Hansen, 2007b:316). HSP can
be used to predict the solubility of formulation components and how it will partition into the skin.
If the HSP is similar for materials, they will have a high affinity for each other. HSP includes
three parameters general dispersion interactions (ED), polar cohesion energy (EP) and hydrogen
bonding (EH). According to Hansen (2007a:4), the total cohesion energy, E, is the sum of the
three individual energies (Equation 2.6).
E = ED + EP + EH Equation 2.8
All three components combined provides a numerical way in which a molecule can be described
and is more informative than using the term „polar‟ (Abbott, 2012:218).
2.4.2.1 General dispersion interactions
Nonpolar interactions are the most general type of interactions in common organic materials.
All molecules contain dispersion interactions that are derived from atomic forces since all
molecules contain atoms. For saturated aliphatic hydrocarbons the only cohesion interaction is
dispersion interactions and therefore the energy of vaporisation is assumed to be equal to the
dispersion cohesion energy. The first step for calculating the HSP of a molecule is to find the
dispersion cohesion energy, as the homomorph or hydrocarbon counterpart‟s cohesion energy
(Hansen, 2007c:5). Since the dispersion interaction parameter is based on atomic forces, the

21
atom size plays an important role. For atoms larger than carbon a correction factor is needed
when calculating the dispersion energy (Hansen, 2007c:15).
2.4.2.2 Polar cohesion energy
Polar cohesion energy is molecular interactions that most molecules contain. The polar
cohesion energy is caused by the permanent dipole-permanent dipole interactions of a
molecule. The polar cohesion energy is primarily calculated from the dipole moment (Hansen,
2007c:5).
2.4.2.3 Hydrogen bonding
Hydrogen bonding is also known as the electron exchange parameter and resembles the polar
interactions of molecules. This parameter is based on the attraction of molecules caused by
hydrogen bonds. The EH are used to collect the energies not included in the ED and EP (Hansen,
2007c:5).
2.4.2.4 Hansen solubility parameter and skin delivery
The oldest solubility rule is that like dissolves like. HSP is used as a measure of how alike
components are. The HSP distance between two compounds can be calculated with the
following equation:
Distance = Equation 2.8
A smaller HSP distance indicates the molecules are more alike and will therefore have a higher
solubility. The HSP values of the skin are assumed to be close to [δD, δP, δH; 17, 8, 8] (Abbott,
2012:219). With the HSP of the skin known, a formulation can be developed with either a good
match for the API or for the skin. A small HSP distance between the API and the formulation
will indicate high solubility and a high concentration of the API can be incorporated in the
formulation increasing the concentration gradient driving force. If there is a small HSP distance
between the formulation and the skin, the solvent will easily enter the skin and swell it. This will
create a desirable environment for the API in the skin. As more of the solvent enters the skin,
less solvent will be available on the skin and the API will thus be encouraged to enter the skin.
It is important to obtain a good balance between the AFG and the SFG to ensure there is a
substantial driving force and that the API will be encouraged to diffuse into the skin by the
additional solubility provided by the solvent in the skin (Abbott, 2012:218).

22
2.4.3 Transdermal diffusion
The permeation of a topically applied API through the skin is usually facilitated by unidirectional
diffusion due to the concentration gradient (Williams, 2003:41). Passive diffusion is the
movement of matter from one region to another following random molecular movement.
According to Barry (2002:506), Fick‟s first law of diffusion states that the rate of transfer of
diffusing substances per unit area of a section is proportional to the concentration gradient
measured normal to the section.
2.4.4 Multi-ingredient formulations
Formulations usually contain several ingredients fulfilling different functions. Most ingredients
used in skin formulations have poor solubility profiles. In a solvent mixture, the volume-
weighted average of each solvent is used to determine the HSP. Since there are few good
solvents for skin delivery, this enables the formulator to create a solvent mixture from poor
solvents to obtain a formulation with the correct HSP for skin delivery (Abbott, 2012:219).
2.4.5 Finite dose delivery
Formulations are delivered as a finite dose in practice and therefore it is important to conduct
transdermal experiments using a finite dose (Abbott, 2012:220). In contrast with infinite-dosing,
the exact starting concentration is known when using a finite dose. As absorption takes place,
the drug concentration on the skin surface decreases and the flux falls during the experiment.
Using the finite-dose technique mimics in vivo situations in a realistic manner (Surber & Davis,
2002:451).
2.6 Summary
Conventional routes of drug delivery have several limitations for many APIs and the transdermal
route of administration provides a possible alternative delivery route. Although TDD has many
advantages over conventional routes, it also has several limitations, the biggest being the
barrier function of the skin. The stratum corneum provides an effective barrier for the skin,
which prevents the penetration of many unwanted substances. It is possible however for some
compounds to penetrate the skin via the intercellular, transcellular or the transappendageal
route. Many different approaches have been developed to overcome the barrier function of the
skin. Wiechers developed the RPI to determine the optimised polarity to deliver at least 50% of
the API. This theory was further developed by Wiechers and Abbott to an integrated approach
that takes five key principles into account when optimising transdermal formulations. These
principles include the fact that each API has a maximum ideal solubility, that an API will diffuse
and partition into different parts of a system based on the activity coefficient, that most

23
transdermal formulations consist of multiple ingredients and that a finite dose delivery regime
will be followed. This approach uses HSP distance as an indication of how alike different
compounds are to indicate solubility and to determine the optimised polarity, rather than the
log P scale. The main HSP distances used in this theory are the AFG and the SFG. According
to the theory, the AFG should be bigger than the SFG to ensure the optimal delivery of the API.
It is important therefore to obtain a suitable balance between the AFG and AFG to ensure
optimal delivery and stability.

24
References
Abbott, S. 2012. An integrated approach to optimizing skin delivery of cosmetic and
pharmaceutical actives. International journal of cosmetic science, 34:217-222.
Aulton, M.E. 2007. Properties of solutions. (In Aulton, M.E. ed. Pharmaceutics: the design
and manufacture of medicines. 3rd ed. London: Churchill Livingstone Elsevier. p. 33-41).
Barry, B. 2002. Transdermal drug delivery. (In Aulton, M.E., ed. Pharmaceutics: The science
of dosage form design. 2nd
ed. London: Churchill Livingstone Elsevier. p. 499-533).
Barry, B.W. 2007. Transdermal drug delivery. (in Aulton, M.E., ed. Pharmaceutics: the design
and manufacture of medicines. 3rd ed. London: Churchill Livingstone Elsevier. p. 565-597.
Bos, J.D. & Mainardi, M.M.H.M. 2000. The 500 Dalton rule for the skin penetration of chemical
compounds and drugs. Experimental Dermatology, 9:165-169.
Brown, M.B., Martin, G.P., Jones, S.A. & Akomeah, F.K. 2005. Dermal and transdermal drug
delivery systems: Current and Future Prospects. Drug Delivery, 13:175-187.
Delgado-Charro, M.B. & Guy, R.H. 2001. Transdermal drug delivery (In Hillery, A.M., Lloyd,
A.W. & Swarbrick, J. ed. Drug delivery and targeting for pharmacists and pharmaceutical
scientists. London: Taylor & Francis. p. 189-214).
Foldvari, M. 2000. Non-invasive administration of drugs through the skin: challenges in delivery
system design. Pharmaceutical science & technology today: PSTT, 3(12):417-425.
Förster, M., Bolzinger, M., Fessi, H. & Briançon, S. 2009. Topical delivery of cosmetics and
drugs. molecular aspects of percutaneous absorption and delivery. European journal of
dermatology, 19(4):309-323.
Hansen, C.M. 2013. HSP examples: skin permeation. http://hansen-solubility.com/Skin.html
Date of access: 15 Sep. 2014.
Hansen, C.M. 2007a. Applications – Barrier polymers. (In Hansen, C.M. Hansen solubility
parameters – a users handbook. 2nd ed. Boca Raton: CRC Press. p. 243-258).
Hansen, C.M. 2007b. Applications – Safety and environment. (In Hansen, C.M. Hansen
solubility parameters – a users handbook. 2nd ed. Boca Raton: CRC Press. p. 311-319).
Hansen, C.M. 2007c. Solubility parameters – an introduction. (In Hansen, C.M. Hansen
25
solubility parameters – a users handbook. 2nd ed. Boca Raton: CRC Press. p. 1-26).
Jepps, O.G., Dancik, Y., Anissimov, Y.G. & Roberts, M.S. 2012. Modelling the human skin
barrier- Towards a better understanding of dermal absorption. Advanced Drug Delivery
Reviews, 65:152-168.
Kornick, C.A., Santiago-Palma, J., Moryk, N., Payne, R. & Obbens, E.A.M.T. 2003. Benefit-Risk
Assessment of Transdermal Fentanyl for the Treatment of Chronic Pain. Drug safety,
26(13):951-973.
Lane, M.E. 2013. Skin penetration enhancers. International journal of Pharmaceutics,
447:12-21.
Lane, M.E., Hadgraft, J., Oliviera, G., Vieira, R., Mohammed, D. & Hirata, K. 2012. Rational
formulation design. International journal of cosmetic science, 34:496-501.
Moffat, A.C., Osselton, M.D. & Widdop, B. eds. 2011. Clarke‟s analysis of drugs and poisons in
pharmaceuticals, body fluids and post-mortem material. 4th ed. London: Pharmaceutical Press.
Morrow, D.I.J., McCarron, P.A., Woolfson, A.D. & Donnely, R.F. 2007. Innovative strategies for
enhancing topical and transdermal drug delivery. The open drug journal, 1:36-59.
Naik, A., Kalia, Y.N., Guy, R.H. 2000. Transdermal drug delivery: overcoming the skin's barrier
function. Pharmaceutical science technology today, 3(9):318-325.
Prausnitz, M.R. & Langer, R. 2008. Transdermal drug delivery. Nature biotechnology,
26(11):1261-1268.
Rieger. M.M. 1993. Factors affecting sorption of topically applied substances. (in Zatz, L.J.
ed. Skin permeation fundamentals and application. Illinois: Allured publishing. p. 33-71.
Steinsträsser, I. & Merkle, H.P. 1995. Dermal metabolism of topically applied drugs: Pathways
and models reconstructed. Pharmaceutica acta helvetica, 70:3-24.
Surber, C. & Davis, A.F. 2002. Bioavailability and bioequivalence of dermatological
formulations (In Walters, K.A. ed. Dermatological and transdermal formulations. New York:
Marcel Dekker. p. 401-498.
Thomas, B.J. & Finn, B.C. 2004. The transdermal revolution. Drug discovery today,
9(16):697-703.
Vafai, S., Drake, B.D. & Smith jr, R.L. 1993. Solid molar volumes of interest to supercritical

26
extraction at 298 K: atropine, berberine hydrochlodire hydrate, brucine dehydrate, capsaicin,
ergotamine tartrate dehydrate, naphthalene, penicillin v, piperidine, quinine, strychnine,
theobromine, theophylline and yohimbine hydrochloride. Journal of chemical & engineering
data. 38:125-127.
Wiechers, J.W. 2008. The influence of emollients on skin penetration from emulsions. (In
Wiechers, J.W. Science and application of skin delivery systems. Illinois: Allured publishing
corporation. p. 91-108).
Wiechers, J.W. 2012. Explaining the importance of the skin delivery gap.
http://www.jwsolutions.com/page/explaining-importance-skin-delivery-gap Date of access: 20
Feb. 2013.
Wiechers, J.W., Kelly, C.L., Blease, T.G. & Dederen, J.C. 2004. Formulating for efficacy.
International journal of cosmetic science, 26:173-182.
Wiedersberg, S. & Guy, R.H. 2014. Transdermal drug delivery: 30+ years of war and still
fighting. Journal of controlled release, 190:180-156.
Williams, A.C. 2003. Transdermal and topical drug delivery. London: Pharmaceutical Press.
p. 27-49.
Yalkowsky, S.H. & Wu, M. 2010. Estimation of the ideal solubility (Crystal-Liquid Fugacity
Ratio) of organic compounds. Journal of pharmaceutical sciences, 99(3):1100-1106.
Yamashita, F. & Hashida, M. 2003. Mechanistic and empirical modelling of skin permeation of
drugs. Advanced drug delivery reviews, 55:1185-1199.

27
Chapter 3
Article for publication in:
International Journal of Pharmaceutics
Chapter 3 is written in article format for publication in the International Journal of
Pharmaceutics. The complete author guidelines for this journal are in Appendix D. The
alignment of the paragraph is justified to ease reading.

28
Influence of formulation polarity on the transdermal delivery
of atropine by implementation of the delivery gap principle
Jani van der Westhuizen, Jan L du Preez*, Minja Gerber and Jeanetta du Plessis
Centre of Excellence for Pharmaceutical Sciences, North-West University, Private Bag X6001,
Potchefstroom 2520, South Africa
* Corresponding author. Tel.: +2718 299 2236; Fax: +2787 231 5432. E-mail address:
[email protected] (JL du Preez)

29
Graphical abstract
30
Abstract
The study was conducted to determine the effect of formulation polarity on the transdermal
delivery of atropine and how the sulphate salt form of atropine influences its delivery. The
Formulating for Efficacy™ (FFE™) software was employed to develop a gel optimised towards
the stratum corneum, a more hydrophilic and a more lipophilic formulation for atropine. The
same formulations were used for atropine sulphate. The Skin Delivery Gap (SDG) and the
Hansen solubility parameter (HSP) profile of the active pharmaceutical ingredient (API),
ingredients and the formulations were determined using the FFE™ software. Membrane
release studies were performed over a period of 6 h to confirm the release of the API from the
formulations and subsequently transdermal diffusion studies were performed, each over a
period of 12 h, followed by tape-stripping. The results indicated the transdermal delivery of an
API is influenced by the polarity and the HSP profile of the formulation. The atropine
formulations had a higher transdermal diffusion compared to atropine sulphate. The highest
transdermal diffusion was obtained from the more lipophilic formulations.
Keywords: Formulation polarity, Hansen solubility parameter, Transdermal delivery
31
1 Introduction
The transdermal delivery route is an attractive alternative to the conventional oral route
(Prausnitz & Langer, 2008). In comparison to the oral route, transdermal delivery has the
advantage of eliminating the first-pass metabolism of the active pharmaceutical ingredient (API)
as well as the gastrointestinal-tract effects on the API and because of this, lower doses are
needed and the occurrence of adverse effects are reduced (Kornick et al., 2003; Walters &
Roberts, 2002). If such adverse reactions occur, the treatment can be terminated immediately
by removing the formulation (Delgado-Charro & Guy, 2001). The patient acceptance and
compliance is higher with transdermal delivery, since it avoids pain and possible infections
associated with injections (Delgado-Charro & Guy, 2001; Jepps et al., 2012).
The skin is the largest organ in the human body with many possible application sites for
transdermal delivery, but its highly efficient barrier function prevents the penetration of
molecules through the skin (Jepps et al., 2012; Williams, 2003). The stratum corneum is
primarily responsible for the barrier and needs to be overcome for transdermal delivery to be
possible (Prausnitz, 1999). The permeation of an API through the skin is a complex, multi-step
process following three possible pathways known as the transappendageal, the transcellular
and the intercellular route (Williams, 2003). The permeability of an API is not easily predicted
due to the complexity of the mechanisms and the structure of these pathways and an API
usually follows a combination of the different pathways, determined primarily by the
physicochemical properties of the API (Jepps et al., 2012; Williams, 2003). Only a few APIs are
compliant for transdermal delivery, since they should have a log P between 1 and 3 and the
molecular weight should not exceed 500 Da (Bos & Meinardi, 2000; Brown et al., 2005;
Prausnitz & Langer, 2008).
The Skin Delivery Gap (SDG) was proposed by Wiechers (2012) as an indicator for the
permeability of an API. An SDG < 1 indicates sufficient permeability, while an API with an SDG
> 1 requires a more complex delivery system. The transdermal delivery of an API is influenced
by the properties of the formulation in which it is applied and by altering the properties of the
formulation it is possible to manipulate the delivery. Wiechers initially developed the Relative
Polarity Index (RPI) as a tool for developing a formulation with an optimal polarity to ensure the
delivery of at least 50% of the API. The RPI uses the log P of the stratum corneum, the
formulation and the API as an indication of polarity. Hansen (2013) was opposed to the use of
log P, regarding it as an impractical indication of polarity and developed the Hansen solubility
parameters (HSP) to predict the solubility of two components in each other. Wiechers and
Abbott both acknowledged this fact and developed the Formulating for Efficacy™ (FFE™)
software which utilises HSP to indicate polarity (Hansen, 2013). HSP uses a combination of

32
three parameters (general dispersion interaction (ED), polar cohesion energy (EP) and hydrogen
bonding (EH)) to provide a numerical way to describe the polarity of a compound (Hansen,
2007a; Abbott, 2012). The HSP profile of the human skin is assumed to be [δD:17, δP:8, δH:8]
(Abbott, 2012). To indicate the solubility of one component in another, the HSP distance is
calculated using Equation 1.
Distance = Equation 1
A smaller HSP distance will indicate a higher solubility. It is generally accepted that a desirable
HSP gap, in terms of solubility and compatibility, is < 4 and that a HSP gap > 8 indicates
insolubility and incompatibility (Abbott, 2012). The relevant distances used in the FFE™
software is the ingredient-skin gap (ISG), ingredient-API gap (IAG), API-formulation gap (AFG)
and the skin-formulation gap (SFG). HSP is used to characterise many biological materials
(Hansen & Poulsen, 2007). Once the HSP profile of the human skin [17.0, 8.0, 8.0], the API
[18.1, 4.7, 8.5] and the formulations are identified, the HSP distance/gaps can be used to
predict the solubility of the API in the formulation and the skin diffusion (HSP, 2013). The IAG
indicates how close the ingredient and the API are in terms of HSP distance and the ISG
indicates the HSP distance between the ingredient and the skin. The AFG is an indication of
how soluble the API is in the formulation. A smaller AFG will indicate better solubility. The SFG
is an indication of how alike the formulation is to the skin. A smaller AFG shows the formulation
and the skin are mutually soluble in terms of HSP distance. Wiechers stated that a formulation
optimised to the stratum corneum, should have a small SFG to ensure the transdermal delivery
of at least 50% of the API, which essentially means two similar layers are applied on each other
and the API will be evenly distributed between the formulation and the skin.
In this study, three formulations of different polarities were developed for a model drug
(atropine) using the FFE™ software, one optimised towards the stratum corneum, one more
hydrophilic than the stratum corneum and one more lipophilic than the stratum corneum. The
transdermal delivery of the API from the different formulations was compared to determine the
effect of the relevant delivery gaps. To evaluate the effect of the salt form on the delivery the
studies were repeated with atropine sulphate instead of atropine in the same formulations.

33
2 Materials and Methods
2.1 Materials
Atropine and atropine sulphate were obtained from Sigma-Aldrich (Kempton Park, South Africa).
Other ingredients used in the formulations include: Carbopol® Ultrez 10 polymer (Lubrizol
Advanced Materials, Brussels, Belgium), dimethyl isosorbide (DMI) (Sigma-Aldrich, Kempton
Park, South Africa), polyethylene glycol 400 (PEG-8), Tween® 80 (PEG-20 sorbitan
monooleate), Span® 60 (sorbitan monostearate) and paraffin liquid (all from Merck Chemicals,
Halfway House, South Africa) and ethanol (ACE Chemicals, Johannesburg, South Africa). For
the phosphate buffer solution (PBS) potassium dihydrogen orthophosphate and sodium
hydroxide (both obtained from Merck Chemicals, Halfway House, South Africa) was used.
Merck Chemicals (Halfway House, South Africa) also supplied the 1-octane sulphonic acid
sodium salt and HPLC (high performance liquid chromatography) grade methanol. Deionised
water was prepared with a Milli-Q® water purification system (Millipore, Milford, USA).
2.2 HPLC analysis
The HPLC method for atropine was developed and validated in the Analytical Technology
Laboratory at the North-West University, South Africa. An Agilent HP1100 series HPLC with a
pump, autosampler, UV detector and Chemstation Rev. A.10.02 data acquisition and analysis
software was used (Agilent Technologies, Palo Alto, CA). A Luna C18-2 column (150 x 4.6 mm,
5 µm, Phenomenex, Torrance, CA) was used. The mobile phase consisted of methanol and
0.005 M 1-octane sulphonic acid-Na in water (pH adjusted to 3.5 with diluted phosphoric acid) in
a ratio of 58:42. The flow rate was 1.0 ml/min with a default injection volume of 50 µl. The UV
detector was set at 210 nm for atropine. The retention time of atropine was ± 5.1 min and the
stop time was set at 8.0 min.
2.3 Phosphate buffer solution (pH 7.4) preparation
Potassium dihydrogen phosphate (6.805 g/250.0 ml water) and sodium hydroxide (1.574
g/393.4 ml water) were mixed and the pH adjusted to 7.4 with sodium hydroxide and phosphoric
acid (BP, 2014).
2.4 Formulation of gels
All the formulations were prepared following the same method. The Carbopol® was sprinkled
over the water and left for ± 2 min to ensure wetting, after which it was heated to 40 °C, followed
by homogenisation at 800 rpm. All the ingredients of the oil phase were mixed and atropine
was added. Both phases were separately heated to 50 °C, after which the oil phase was slowly

34
added to the water phase during homogenisation at 1800 rpm. The mixture was homogenised
until a temperature of 40 °C was reached, after which it was stirred with a glass rod until it
cooled down to 25 °C. The pH was adjusted to 7.4 using sodium hydroxide.
For the preparation of the atropine sulphate formulations, the atropine was substituted with the
atropine sulphate and this was added to the water phase instead of the oil phase due to its
hydrophilicity.
2.5 Viscosity
The viscosity of the formulations was measured using a Brookfield DV2T Viscometer
(Stoughton, Massachusetts, USA). After heating the formulation to 25 °C in a water bath it was
placed in a small sample adapter. Viscosity measurements were made every 10 sec for 2 min
using a SC4-25 spindle turning at a speed of 0.70 rpm.
2.6 Physicochemical properties
2.6.1 Solubility of atropine
Triplicate saturated solutions of atropine in PBS (pH 7.4), water and n-octanol were prepared
and shaken in a water bath for 24 h at 32 °C. Excessive amounts of atropine were used to
ensure the solution remained saturated. After 24 h the solutions were centrifuged, diluted and
analysed using HPLC.
2.6.2 n-Octanol/PBS distribution coefficient
Equal amounts of PBS (pH 7.4) and n-octanol were mixed and left to separate to produce n-
octanol pre-saturated with PBS and vice versa. Atropine (10.84 mg) was dissolved in the pre-
saturated n-octanol and equal volumes (3 ml) of this and pre-saturated PBS was inserted into a
test tube. The test tube was shaken in a water bath at 32 °C for 24 h after which it was
centrifuged at 4500 rpm for 10 min. The n-octanol phase (2 ml) was diluted to 10 ml using
methanol and both solutions were analysed using HPLC. The logarithmic ratio of the atropine
concentration in the n-octanol and the PBS (pH 7.4) were used to calculate the log D (n-
octanol/PBS). The experiment was performed in triplicate and the aforementioned method was
used to determine the log D for atropine sulphate as well.
2.7 Skin preparation
During this study, Caucasian abdominal skin obtained after abdominoplastic surgery was used.
The donors gave informed consent and ethical approval was obtained from the Ethics
Committee of the North-West University, Potchefstroom (Ethics number: NWU-00114-11-A5).

35
Split thickness skin (400 µm) containing stratum corneum, viable epidermis and upper dermis
was removed using an electric dermatome (Zimmer Inc.) and placed on Whatman® filter paper
with the stratum corneum facing upwards, wrapped in aluminium foil and frozen at -20 °C until
use. The skin samples were thawed and cut into circles with a diameter of ± 2 mm prior to the
skin diffusion study.
2.8 Diffusion studies
Vertical Franz type diffusion cells with a 1.075 cm2 diffusion area and a ± 2 ml receptor capacity
were used during this study. Ten cells, with a magnetic stirring bar inserted in the receptor
compartment of each to ensure stirring during the experiment, were used. The Franz cells were
assembled with the membrane/skin samples (stratum corneum facing upwards) mounted
between the donor and receptor compartment and sealed and secured using Dow Corning®
high vacuum grease and horseshoe clamps. The receptor phase (2 ml), pre-heated to 37 °C,
was injected into the receptor compartment whilst preventing air bubble formation and 1 ml of
the semi-solid formulation (pre-heated to 32 °C, temperature of the skin when diffusion is
performed at 37 °C) was inserted in the donor compartment and covered with Parafilm®. The
entire study was performed in a water bath (37 ± 1 °C to compare with the human body
temperature) with a magnetic stirrer. The entire receptor phase content was extracted and
replaced with fresh receptor phase on predetermined time after which the extracted receptor
phase was injected into HPLC vials for analysis.
2.8.1 Membrane release
Membrane release studies were performed to determine release of atropine and atropine
sulphate from the formulations following the method discussed in Section 2.8. Hydrophilic
polyvinylidene fluoride (PVDF) membrane filters (Pall® Life Sciences, Michigan, USA) were
used and the receptor phase (PBS pH 7.4) content was extracted and replaced hourly for 6 h.
2.8.2 Skin diffusion
Skin diffusion studies were performed following the method discussed in Section 2.8. During
initial studies the receptor phase (PBS pH 7.4 and methanol (1:1, v/v)) were extracted and
replaced hourly, but the concentration atropine in the receptor phase was below the limit of
detection. It was then decided to change the sampling times to one single sampling time, in
order to be able to measure the total amount diffused during that time period. The receptor
phase was therefore only extracted after 12 h and tape-stripping commenced immediately
afterwards.

36
2.8.3 Tape-stripping
The Franz cells were disassembled after 12 h and the skin samples were pinned to a solid
surface followed by removal of the semi-solid formulation by light dabbing with tissue paper.
Sixteen strips of 3M Scotch® Magic™ tape (discarding the first strip) were used to remove the
stratum corneum-epidermis (SCE). The remainder of the skin (epidermis-dermis (ED)) was cut
into small pieces; thereafter the strips (SCE) and the skin (ED) were placed in separate polytop
glass vials filled with 5 ml receptor phase, capped and kept overnight at 4 °C.
2.9 Data analysis
The cumulative concentration of the API that permeated the membrane was plotted against time
for the membrane release studies. The average flux was obtained by the slope of the straight
line between 2 and 6 h. For the diffusion studies the percentage yield after 12 h was
determined.
2.10 Statistical analysis
Statistica (StatSoft, 2014) was utilised for the statistical analysis using both descriptive and
inferential statistics. Both parametric and non-parametric statistical analyses were performed
since the data was not distributed normally. A two-way analysis of variance (ANOVA) followed
by Tukey‟s HSD (honestly significant difference) were performed on the membrane data, whilst
a univariate test of significance was performed for the skin diffusion studies. For the tape-
stripping data, a three-way ANOVA and t-test was performed.
Non-parametric statistical analyses of the membrane and skin diffusion studies were performed
using the Kruskal-Wallis test and the Mann-Whitney U test for the tape-stripping data. A p-value
< 5 indicated statistical significance.

37
3 Results and discussion
3.1 Formulation of gels
The FFE™ software was used to develop a formulation optimised towards the stratum corneum
(A-O), a more hydrophilic (A-H) and a more lipophilic (A-L) formulation containing 1.5%
atropine. The formulations developed for atropine were used for atropine sulphate as well (AS-
O, AS-H and AS-L). The formulations of different polarities were obtained by adapting the
optimised formulation. For the more hydrophilic formulation, 10% ethanol was added to the
water phase and for the more lipophilic formulation, 10% liquid paraffin was added to the oil
phase.
In total six formulations were prepared, all of which applied easily. All the formulations had a
uniform appearance; the optimised and lipophilic formulations had an acceptable skin feel,
whilst the hydrophilic formulations were a bit tacky. The optimised and hydrophilic formulations
were opaque, whilst the lipophilic formulations were white.
The FFE™ software was used to determine a hypothetical SDG (0.001) for atropine based on a
plasma concentration of 2 ng/ml obtained from literature (Kradjan et al., 1985). According to the
Delivery Gap principle, atropine should readily penetrate the skin (Wiechers, 2012).
3.2 Formulation characteristics
3.2.1 HSP profile
The smallest IAG was observed with DMI (3.09) indicating the best solubility, whilst the IAG of
ethanol (13.14) and liquid paraffin (47.62) indicated insolubility. The IAG of PEG-8 (4.81)
indicates solubility but not within the preferred range. DMI will readily permeate the skin based
on the small ISG (1.96). The ISG values of PEG-8 (7.16) and ethanol (7.1) indicates the
ingredient is partly soluble in the skin but the solubility is undesirable. Liquid paraffin is highly
unlikely to penetrate the skin based on its ISG (47.62).
For the optimised formulation the AFG (3.5) was bigger than the SFG (1.9), indicating sufficient
solubility of the API in the formulation and good penetration of the formulation into the skin. As
the formulation penetrates, the skin swells and a more welcome environment for the API is
created (Abbott, 2012). The penetration of the formulation results in less solvent left on the skin
for the API and the composition of the residual formulation is different. Based on the mVol
(158.9 mol/ml and 320.0 mol/ml, respectively) and ISG of DMI it will penetrate the skin faster
than PEG-8 indicating that more PEG-8 is left in the residual formulation and the SFG will
therefore be higher. The more favourable environment for the API (caused by a decreased

38
AFG) indicates a decrease in the permeation of the API.
For the hydrophilic formulation, the AFG (5.3) and SFG (5.7) are almost the same and the
AFG/SFG close to one (0.9). Both distances are > 4 indicating the formulation may have
solubility and compatibility problems. The low solubility of the API in the hydrophilic formulation
indicates the API may precipitate out of the formulation.
The API is sufficiently soluble and compatible in the more lipophilic formulation based on the
AFG (3.8). The high SFG (9.5) indicates the formulation is insoluble and incompatible with the
skin which predicts poor delivery, but individual ingredients with desirable ISG‟s, such as DMI,
might still penetrate the skin leaving a formulation with a less desirable composition on the skin.
This will provide a high driving force for the API to leave the formulation and enter the skin.
3.2.2 Viscosity
A much higher viscosity was observed with the atropine formulations compared to the atropine
sulphate formulations. The highest viscosity was measured with A-H (288.80 ± 0.97 P, pH
7.67), followed by the A-L (264.91 ± 0.99 P, pH 7.57) and lastly, the A-O (242.46 ± 1.99 P, pH
7.47). AS-L (92.32 ± 0.45 P, pH 7.49) had the highest viscosity, followed by AS-H (71.30 ± 0.00
P, pH 7.5) and AS-O (67.30 ± 0.40 P, pH 7.48). A higher viscosity resists the diffusion of the
API through the formulation and therefore a high viscosity may reduce the permeation of the
API (Cross et al., 2001). The higher viscosity of the atropine formulations compared to the
atropine sulphate formulations predicts that the API will reach the skin surface faster from the
sulphate formulations and penetration can commence faster.
3.3 Physicochemical properties
3.3.1 Solubility
Naik et al. (2000) state an aqueous solubility > 1 mg/ml is required to ensure effective
transdermal delivery of an API. The aqueous solubility of atropine (0.9 mg/ml) therefore
predicted limited transdermal delivery. Atropine had a much higher solubility in PBS (pH 7.4)
(5.8 mg/ml) because of the high degree of ionisation and the formation of ion-pairs with the
phosphate salt.
3.3.2 n-octanol/PBS distribution coefficient
Log D is a more reliable indication of distribution compared to the octanol/water partition
coefficient (log P), since it takes the degree of ionisation of the API into account. For both
atropine and atropine sulphate, the log D (-1.26 and -1.23, respectively) predicted that

39
transdermal delivery may be suboptimal (Brown et al., 2005).
3.4 Diffusion studies
3.4.1 Membrane release studies
During the membrane release studies, formulations containing 0.5% API were used and the
results confirmed the release of API from all formulations. The data contained outliers and
therefore the median values are used to describe the data. Compared to the average, the
median is a more reliable representation of data as it is more resistant to outliers (Smith, 2012).
The highest median flux for the atropine formulations were observed with A-H (155.06
µg/cm2.h), followed by A-O (136.74 µg/cm2.h) and A-L (129.91 µg/cm2.h). For atropine sulphate
the highest median flux was observed with AS-O (150.29 µg/cm2.h), followed by AS-H (117.76
µg/cm2.h) and AS-L (115.99 µg/cm2.h) (see Figure 1).
Figure 1: Flux (µg/cm2.h) of atropine and atropine sulphate from the different formulations in
the membrane release studies after 6 h. The average and median concentration values are
indicated by the lines and squares, respectively (AS-0: n = 10; A-O, A-L, AS-L: n = 9; A-H, AS-H
n = 8).
The highest median percentage released was observed with A-H (13.93%), whilst AS-H
resulted in the lowest median percentage released (11.05%). The low affinity of the lipophilic
atropine for the hydrophilic formulation causes a driving force for the API to leave the
undesirable formulation, resulting in the high release, while the more hydrophilic atropine
sulphate has a high solubility in the hydrophilic formulation and therefore low release is
observed (Otto et al., 2009). The atropine formulations only had slight differences in the
percentage released after 6 h (A-H: 13.93%, A-O: 13.16% and A-L: 12.58%). Atropine has a
high affinity towards the lipophilic formulation which resulted in low release; the atropine
sulphate formulations indicated more variation in the percentage released compared to the
atropine formulations. The highest median percentage released was obtained with the AS-O
(13.12%), followed by AS-L (11.07%) and AS-H (11.05%).
From the results it was observed that atropine resulted in a higher release compared to atropine
sulphate from formulations with the same polarity. This indicates that the salt form of the API
reduces its release from the formulations due to the higher HSP of the salt and therefore a high
affinity for the water content of the formulations (Hansen, 2007b).

40
3.4.2 Skin diffusion studies
The diffusion studies were initially performed with formulations containing 0.5% API, but either
very low concentrations or no API at all was delivered transdermally. The explanation for this
was because of an insignificant concentration gradient which existed between the donor and the
receptor and therefore it was decided that the concentration of the API in the formulation had to
be increased to 1.5%.
Figure 2: Amount per area (µg/cm2) of atropine and atropine sulphate that diffused through the
skin from the different formulations. The average and median concentration values are
indicated by the lines and squares, respectively (AS-0: n = 10; A-O, A-L, AS-L: n = 9; A-H, AS-H
n = 8).
For both A and AS the highest median amount/area was observed from the L-formulations
followed by the O- and H-formulations. A-O (10.40 µg/cm2.h) and AS-O (6.66 µg/cm2.h)
resulted in nearly double the median amount/area diffused of A-H (4.50 µg/cm2.h) and AS-H
(2.78 µg/cm2.h), respectively. For A-L (18.04 µg/cm2.h) the median amount/area diffused was
almost twice that of A-O, whilst the median amount/area diffused for AS-L (17.6 µg/cm2.h) was
almost three times that of AS-O.
When comparing the diffusion from the formulations of different polarities the highest median
percentage diffused was observed with the L-formulation for both A and AS (0.065% and
0.063%) followed by the O-formulation (0.037% and 0.024%) and the H-formulation (0.015%
and 0.010%). For AS-L the median percentage diffused was almost three times that of AS-O,
whilst A-O was almost half that of A-L. A-O and AS-O resulted in nearly double the median
percentage diffused of A-H and AS-H, respectively.
The differences in the diffusion can be explained by considering the IAG, ISG, AFG and SFG of
the different formulations. Although the SFG of the lipophilic formulation indicates poor
penetration into the skin, it resulted in the highest transdermal delivery of the API. It is
hypothesised that the DMI penetrated the skin to create a more welcome environment for the
API in the skin while the PEG-8 and liquid paraffin was left on the skin. The residual formulation
was an undesirable environment for the API based on the IAG values of PEG-8 and liquid
paraffin. The combination of the more welcome environment in the skin and the less desirable
residual formulation provided a driving force for the API to leave the formulation and enter the
skin (Abbott, 2012). For the optimised formulation both the AFG and SFG indicated desirable
solubility and the formulation should easily penetrate the skin (Abbott, 2012). A more desirable

41
environment for the API in the skin was created by the penetrating formulation and the API
distributed almost evenly between the formulation and the skin because of their similarity
(Abbott, 2000). The only driving force for the API to leave the formulation was the concentration
gradient and therefore lower transdermal delivery was observed with the optimised formulation
compared to the more lipophilic formulation. The lowest transdermal delivery was observed
from the hydrophilic formulations, since both the AFG (5.3) and SFG (5.7) indicate undesirable
solubility and thus low skin penetration (Abbott, 2012).
A comparison between the diffusion of A and AS from formulations of similar polarity indicated
that A resulted in higher transdermal delivery than AS. A-H (0.015%) and A-O (0.370%)
resulted in almost twice the median amount/area diffused of AS-H (0.100%) and AS-O
(0.240%). No significant difference was observed between A-L (0.065%) and AS-L (0.063%).
These results can be explained by considering the log P values of both A and AS. A gel
typically is a polar formulation (H and O) and the more hydrophilic AS would therefore prefer to
reside in the formulation (Barry, 2007). The gel formulations are an undesirable environment for
the lipophilic atropine and it would prefer to leave the formulation. The higher transdermal
delivery of A, compared to AS, can be explained by the higher release from the formulations
observed with A, which indicates more of A is on the skin surface and available for penetration.
3.3.3 Tape-stripping
Figure 3: Concentration (µg/ml) of atropine and atropine sulphate in the stratum corneum-
epidermis for the different formulations after tape stripping. The average and median
concentration values are indicated by the lines and squares, respectively (AS-0: n = 10; A-O, A-
L, AS-L: n = 9; A-H, AS-H n = 8).
Figure 4: Concentration (µg/ml) of atropine and atropine sulphate in the epidermis-dermis for
the different formulations after tape-stripping. The average and median concentration values
are indicated by the lines and squares, respectively (AS-0: n = 10; A-O, A-L, AS-L: n = 9; A-H,
AS-H n = 8).
A higher median concentration of the API was observed in the ED compared to the SCE, except
with A-O and AS-O which had no API in the SCE or ED and A-L and AS-L for which no
concentration of API was found in the SCE. The highest concentration in both the SCE and the
ED was observed with the A-H (0.21 µg/ml and 0.55 µg/ml) and AS-H (0.29 µg/ml and 0.55
µg/ml), followed by the lipophilic formulations in the ED (A-L: 0.48 µg/ml and AS-L: 0.52 µg/ml)
42
(see Figure 3 & 4). Due to the absence of a driving force for the API to leave the formulation
and enter the skin, based on the HSP profile of the H-formulation, the penetration of the API
was only driven by the concentration gradient. The API penetrated the skin much slower
compared to the O- and L-formulation and after 12 h the API had not yet fully traversed the skin
resulting in high concentrations in the skin and poor transdermal delivery. This indicates the
added driving force provided by the HSP profile (as seen with the O- and L-formulations)
increases the penetration of the API through the skin. A slightly higher median concentration in
the SCE was observed with AS-H compared to A-H, while being the same in the ED. The
higher concentration of the API in the ED than in the SCE is opposite to what was expected,
since the lipophilic atropine has a higher affinity towards the more lipophilic stratum corneum.
High concentrations of the API were expected from the formulations optimised towards the
stratum corneum. An explanation for the low concentration of API in the skin from the optimised
formulations may be a fast initial penetration and a decrease in the concentration gradient over
time reduced the driving force and the amount of API in the skin was below the limit of detection
of the analytical method. The highest driving force for the API to enter the skin was observed
with the lipophilic formulations and the high percentage diffused compared to the skin
concentration indicates that the API had fully crossed the skin.
The lipophilic formulations had the highest driving force to leave the formulation and permeate
the skin based on the HSP profile. The high driving force pushed the API into the SC where it
diffused to the ED. The high transdermal delivery from the L-formulations indicates most of the
API fully traversed through the SC into and through the ED.
3.4 Statistical analysis
3.4.1 Membrane release studies
A one-way ANOVA followed by Tukey‟s studentised range HSD (honestly significant difference)
tests were used to analyse the data of H, L and O for both A and AS. Due to the non-normality
of the data, non-parametric analysis was performed using the Kruskal-Wallis test followed by
multiple comparisons between H, L and O. Significant differences were indicated between A-H
and A-L (p = 0.039), AS-O and AS-H (p = 0.018), as well as between AS-O and AS-L (p <
0.001).
3.4.2 Skin diffusion studies
Both the amount/area diffused and the log amount/area diffused was analysed using the
univariate ANOVA test. Both indicated non-normality of the data and subsequently non-
parametric statistical analyses was performed using the Kruskal-Wallis test, followed by multiple

43
comparisons. Significant differences were indicated between A-O and A-H (p = 0.032) and AS-
H and AS-L (p = 0.005).
3.4.3 Tape- stripping
The tape-stripping data was analysed using the Mann-Whitney U test which indicated a
significant difference between A-O and AS-O in the SCE (p = 0.0256), but the significance was
disregarded due to the absence of the API in the skin. The test indicated no significant
difference between A-H and AS-H in both the SCE (p = 0.1035) and ED (p = 0.9581) and for A-
L and AS-L in the ED (p = 0.2703).

44
4 Conclusion
The highest transdermal delivery of both atropine and atropine sulphate was obtained from the
more lipophilic formulations when compared to the optimised and more hydrophilic formulation.
The results of the study indicated that atropine provides better transdermal delivery compared to
the sulphate salt.
The results obtained in the study supported the Delivery Gap Principle developed by Wiechers
(2012), which indicates that an API with an SDG < 1 will be readily delivered to the skin. It is
concluded that the HSP profile and the polarity of a formulation plays a significant role in the
transdermal delivery of an API. It is believed that a formulation with a small SFG is optimised
towards the stratum corneum and should result in the highest transdermal delivery. According
to Abbott (2012), a good balance between the SFG and AFG will provide a driving force for the
API to leave the formulation and generate a more desirable environment in the skin resulting in
sufficient penetration of the API. The results indicated higher transdermal delivery is observed
from a formulation with an SFG > AFG. From the results it can be concluded that not only the
HSP profile of the formulation, but also the HSP profile of the different ingredients and their
molar volumes should be taken into account when developing a formulation optimised for
transdermal delivery. Different ingredients in the formulation will penetrate at different rates and
this will change the composition of the residual formulation. If the residual formulation is less
desirable for the API it will be forced out of the formulation, increasing transdermal delivery. If
the penetrating ingredients have a small IAG it will create a welcome environment for the API in
the skin which will also contribute to a higher transdermal delivery.
The study proves the FFE™ software, developed by Wiechers, is valuable when developing
formulations optimised for the transdermal delivery of an API. It can be concluded that the base
API (atropine) will result in a higher transdermal delivery compared to the sulphate salt form
(atropine sulphate) due to the higher HSP of the salt, which indicates a higher aqueous
solubility and low solubility in polymers such as the human skin (Hansen, 2007b)

45
Acknowledgements
The authors would like to thank the National Research Foundation (NRF) of South Africa and
the Centre of Excellence for Pharmaceutical Sciences (Pharmacen), North-West University,
Potchefstroom Campus, South Africa, for funding this study.
We would like to thank Prof F Steyn for the statistical analysis.
Any opinions, findings, conclusions, or recommendations expressed in this material are those of
the author(s) and are not necessarily attributed to the NRF.

46
References
Abbott, S. 2012. An integrated approach to optimizing skin delivery of cosmetic and
pharmaceutical actives. Int J Cosmet Sci, 34:217-222.
Barry, B.W. 2007. Transdermal drug delivery. (in Aulton, M.E., ed. Pharmaceutics: the design
and manufacture of medicines. 3rd ed. London: Churchill Livingstone Elsevier. p. 565-597.
Bos, J.D. & Mainardi, M.M.H.M. 2000. The 500 Dalton rule for the skin penetration of chemical
compounds and drugs. Exp Dermatol, 9:165-169.
BP (British Pharmacopoeia). 2014. Phosphate buffer solution pH 7.4. London: The stationary
office.
Brown, M.B., Martin, G.P., Jones, S.A. & Akomeah, F.K. 2005. Dermal and transdermal drug
delivery systems: Current and Future Prospects. Drug Deliv, 13:175-187.
Cross, S.E., Jiang, R., Benson, H.A.E. & Roberts, M.S. 2001. Can increasing the viscosity of
formulations be used to reduce the human skin penetration of sunscreen oxybenzone? J Invest
Dermatol, 2001(117):147-150.
Delgado-Charro, M.B. & Guy, R.H. 2001. Transdermal drug delivery (In Hillery, A.M., Lloyd,
A.W. & Swarbrick, J. ed. Drug delivery and targeting for pharmacists and pharmaceutical
scientists. London: Taylor & Francis. p. 189-214).
Hansen, C.M. 2007b. The future. (In Hansen, C.M. Hansen solubility parameters – a users
handbook. 2nd ed. Boca Raton: CRC Press. p. 321-346).
Hansen, C.M. 2013. HSP examples: skin permeation. http://hansen-solubility.com/Skin.html
Date of access: 15 Sep. 2014.
Hansen, C.M. & Poulsen, T.S. 2007. Hansen Solubility Parameters- biological materials. (In
Hansen, C.M. Hansen solubility parameters – a users handbook. 2nd ed. Boca Raton: CRC
Press. p. 269-292).
Hansen, C.M. 2007a. Applications – Barrier polymers. (In Hansen, C.M. Hansen solubility
parameters – a users handbook. 2nd ed. Boca Raton: CRC Press. p. 243-258).
Jepps, O.G., Dancik, Y., Anissimov, Y.G. & Roberts, M.S. 2012. Modelling the human skin
barrier - Towards a better understanding of dermal absorption. Adv. Drug Delivery Rev.,
65:152-168.

47
Kornick, C.A., Santiago-Palma, J., Moryk, N., Payne, R. & Obbens, E.A.M.T. 2003. Benefit-Risk
Assessment of Transdermal Fentanyl for the Treatment of Chronic Pain. Drug safety,
26(13):951-973.
Otto, A., Du Plessis, J. & Wiechers, J.W. 2009. Formulation effects of topical emulsions on
transdermal and dermal delivery. Int J Cosmet Sci, 31:1-19.
Prausnitz, M.R. & Langer, R. 2008. Transdermal drug delivery. Nat biotechnol, 26(11):1261-
1268.
Wiechers, J.W. 2012. Explaining the importance of the skin delivery gap.
http://www.jwsolutions.com/page/explaining-importance-skin-delivery-gap Date of access: 20
Feb. 2013.
Williams, A.C. 2003. Transdermal and topical drug delivery. London: Pharmaceutical Press.
p. 27-49.

48
Figure legends:
Figure 1: Flux (µg/cm2.h) of atropine and atropine sulphate from the different formulations in
the membrane release studies after 6 h. The average and median concentration values are
indicated by the lines and squares, respectively (AS-0: n = 10; A-O, A-L, AS-L: n = 9; A-H, AS-H
n = 8).
Figure 2: Amount per area (µg/cm2) of atropine and atropine sulphate which diffused through
the skin from the different formulations. The average and median concentration values are
indicated by the lines and squares, respectively (AS-0: n = 10; A-O, A-L, AS-L: n = 9; A-H, AS-H
n = 8).
Figure 3: Concentration (µg/ml) of atropine and atropine sulphate in the stratum corneum-
epidermis for the different formulations after tape-stripping. The average and median
concentration values are indicated by the lines and squares, respectively (AS-0: n = 10; A-O, A-
L, AS-L: n = 9; A-H, AS-H n = 8).
Figure 4: Concentration (µg/ml) of atropine and atropine sulphate in the epidermis-dermis for
the different formulations after tape-stripping. The average and median concentration values
are indicated by the lines and squares, respectively (AS-0: n = 10; A-O, A-L, AS-L: n = 9; A-H,
AS-H n = 8).
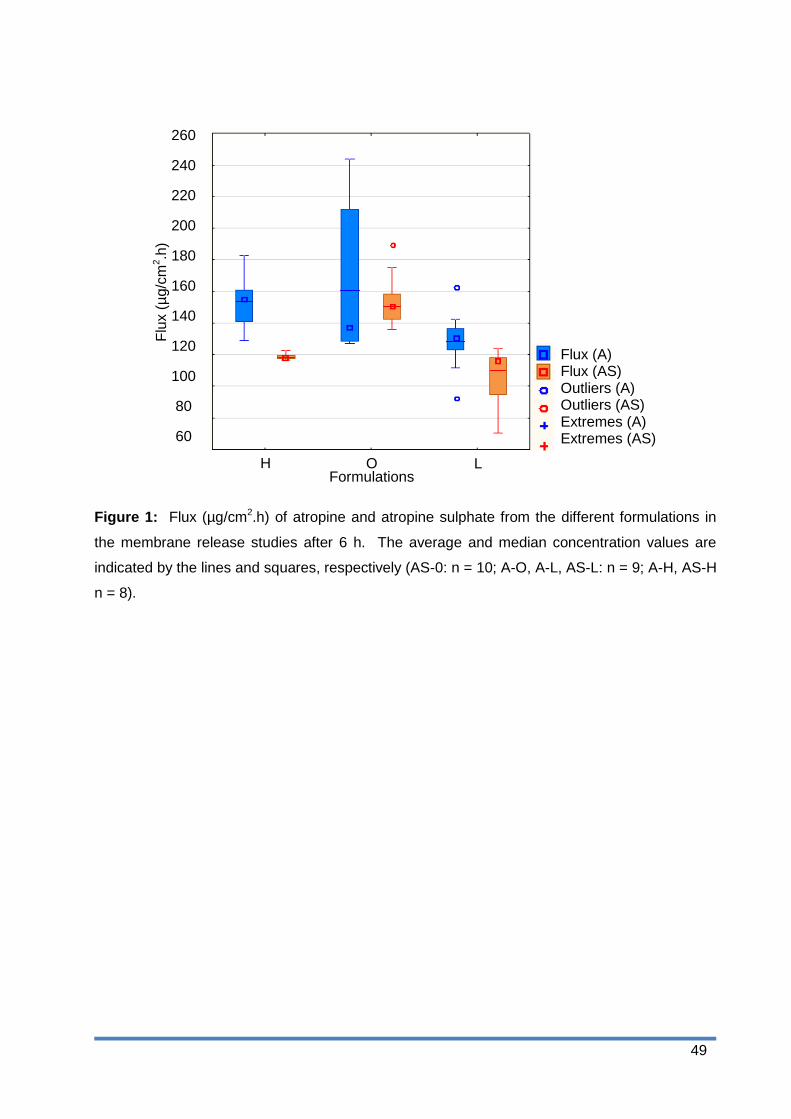
49
Flux (A) Flux (AS) Outliers (A) Outliers (AS) Extremes (A) Extremes (AS)
260
240
220
200
180
160
140
120
100
80
60
Flu
x (
µg/c
m2.h
)
H Formulations
O L
Figure 1: Flux (µg/cm2.h) of atropine and atropine sulphate from the different formulations in
the membrane release studies after 6 h. The average and median concentration values are
indicated by the lines and squares, respectively (AS-0: n = 10; A-O, A-L, AS-L: n = 9; A-H, AS-H
n = 8).
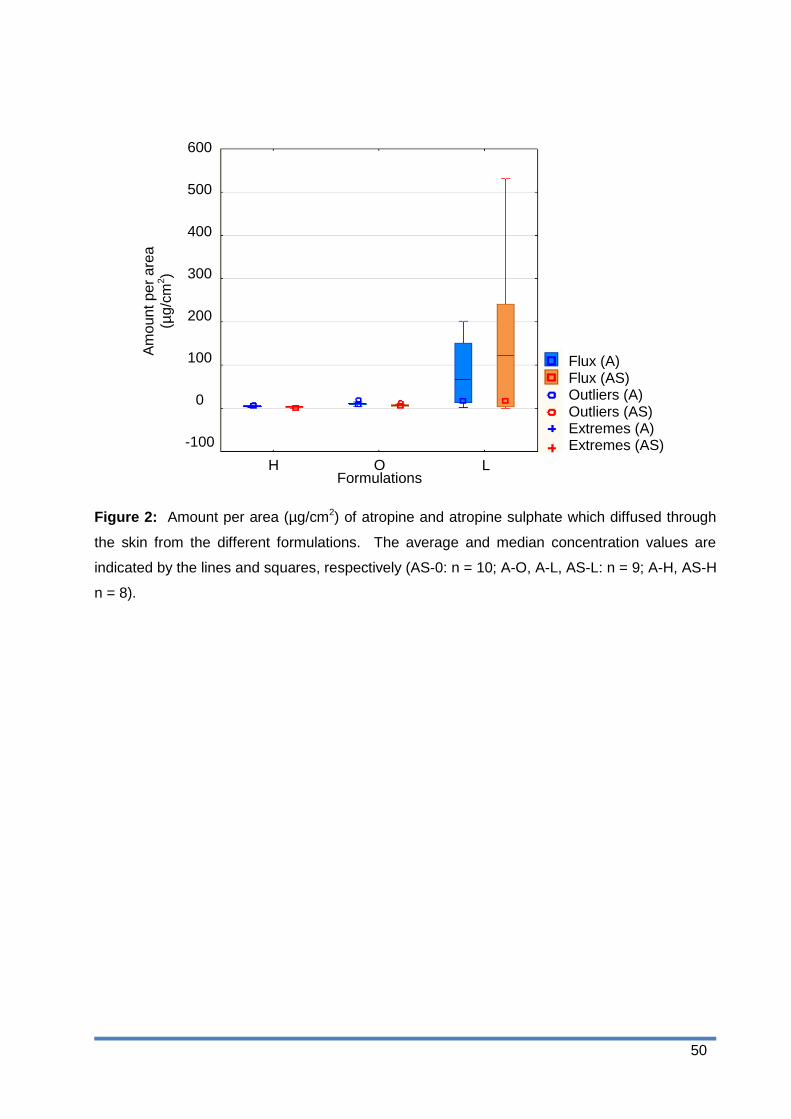
50
Flux (A) Flux (AS) Outliers (A) Outliers (AS) Extremes (A) Extremes (AS)
260
240
220
200
180
160
140
120
100
80
60
H Formulations
O L
Am
oun
t p
er
are
a
(µg
/cm
2)
600
500
400
300
200
100
0
-100
Figure 2: Amount per area (µg/cm2) of atropine and atropine sulphate which diffused through
the skin from the different formulations. The average and median concentration values are
indicated by the lines and squares, respectively (AS-0: n = 10; A-O, A-L, AS-L: n = 9; A-H, AS-H
n = 8).

51
Flux (A) Flux (AS) Outliers Outliers Extremes Extremes
260
240
220
200
180
160
140
120
100
80
60
Co
nce
ntr
atio
n (
µg/c
m3)
H Formulations
O L
600
500
400
300
200
100
0
-100
Concentration (A) Concentration (AS) Outliers (A) Outliers (AS) Extremes (A) Extremes (AS)
1.8
1.6
1.4
1.2
1.0
0.8
0.6
0.4
0.2
0.0
-0.2
Figure 3: Concentration (µg/ml) of atropine and atropine sulphate in the stratum corneum-
epidermis for the different formulations after tape-stripping. The average and median
concentration values are indicated by the lines and squares, respectively (AS-0: n = 10; A-O, A-
L, AS-L: n = 9; A-H, AS-H n = 8).
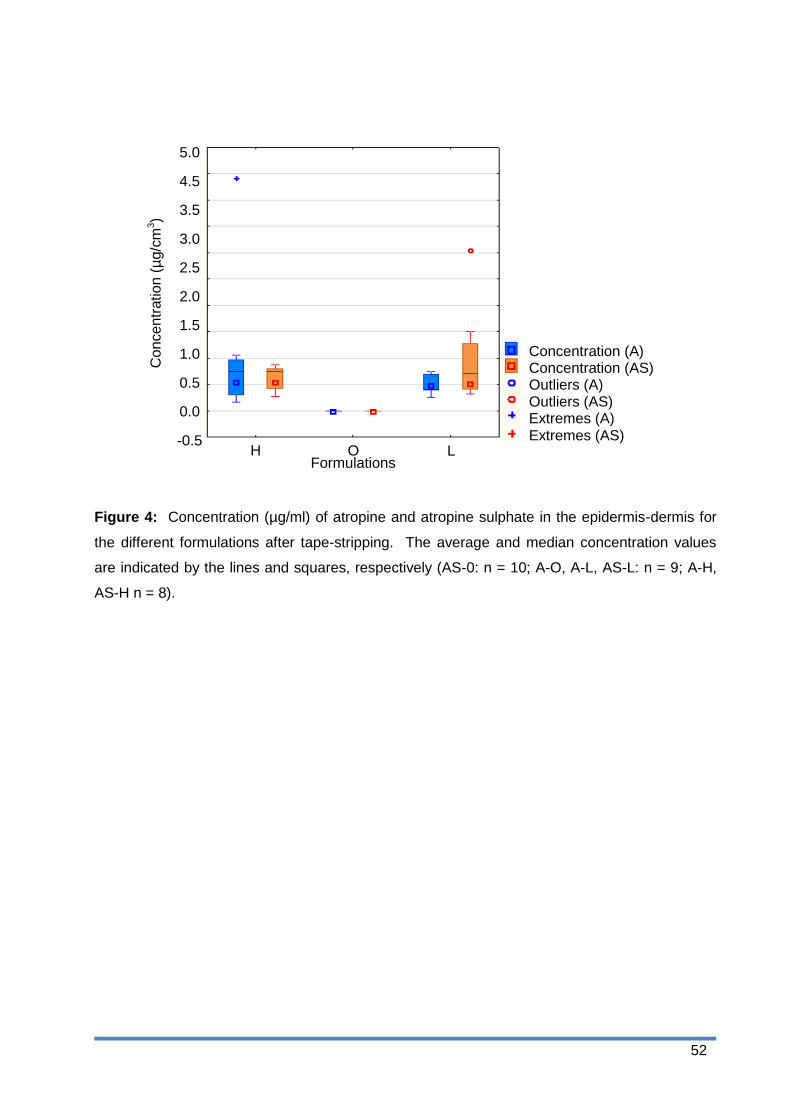
52
Flux (A) Flux (AS) Outliers Outliers Extremes Extremes
260
240
220
200
180
160
140
120
100
80
60
Co
nce
ntr
atio
n (
µg/c
m3)
H Formulations
O L
600
500
400
300
200
100
0
-100
Concentration (A) Concentration (AS) Outliers (A) Outliers (AS) Extremes (A) Extremes (AS)
5.0
4.5
4.0
3.5
3.0
2.5
2.0
1.5
1.0
0.5
0.0
-0.5
5.0
4.5
3.5
3.0
2.5
2.0
1.5
1.0
0.5
0.0
-0.5
Figure 4: Concentration (µg/ml) of atropine and atropine sulphate in the epidermis-dermis for
the different formulations after tape-stripping. The average and median concentration values
are indicated by the lines and squares, respectively (AS-0: n = 10; A-O, A-L, AS-L: n = 9; A-H,
AS-H n = 8).
53
Chapter 4
Final conclusion and future prospects
4.1 Final conclusion
The FFE™ software was designed by Wiechers and Abbott to assist the development of
formulations optimised for transdermal delivery. The software utilises HSP as an indication of
solubility and can also to determine the SDG. According to Wiechers (2012), an SDG < 1 will
indicate sufficient permeability of the API, whilst an API with a SDG > 1 will need a more
complex delivery system. It is believed that a formulation with a small SFG would optimally
deliver the API, since you effectively apply two similar layers on each other and the API will
distribute evenly between the formulation and the skin.
The aim of this study was to determine the effect of formulation polarity on the transdermal
delivery of a model drug, atropine and how the sulphate salt influences the transdermal delivery
of atropine. The objectives of this study were as follows:
Develop and validate an HPLC method for atropine.
Determine the aqueous solubility of atropine.
Determine the log P and log D of atropine and atropine sulphate.
Develop a gel optimised towards the stratum corneum, a more hydrophilic gel and a
more lipophilic emulgel containing atropine using the FFE™ software.
Compound the atropine formulations.
Use the formulations developed for atropine to compound the atropine sulphate
formulations.
Perform membrane diffusion studies to determine API release from the formulation.
Perform transdermal diffusion studies followed by tape-stripping to determine and
compare the transdermal and topical delivery, respectively of the API from the
formulations.
The HPLC method was developed and validated and performed well and was used for the
analysis of experimental data.
The solubility of atropine in water, PBS (pH 7.4) and n-octanol were determined to be

54
0.9 mg/ml, 5.8 mg/ml and 3.2 mg/ml, respectively. According to Naik et al. (2000:319), a
compound should have an aqueous solubility > 1 mg/ml to be transdermally delivered. The
aqueous solubility of atropine indicated transdermal delivery may be limited. The high solubility
of atropine in the PBS (pH 7.4) was explained by the high degree of ionisation (99.68%) and the
formation of ion-pairs with the phosphate salt. The log D of both atropine and atropine sulphate
predicted suboptimal transdermal delivery (Brown et al., 2005:177).
Atropine and atropine sulphate were both formulated in a gel with a polarity optimised towards
the stratum corneum, a more hydrophilic gel and a lipophilic emulgel. The formulations for
atropine were developed using the FFE™ software and those formulations were used for
atropine sulphate. The atropine formulations had a higher viscosity compared to the atropine
sulphate formulations. The optimised and lipophilic formulations applied easily and had an
acceptable skin feel, whilst the hydrophilic formulation was a little tacky. The optimised and
hydrophilic formulations had a uniform and opaque appearance, whilst the lipophilic
formulations were white.
The membrane release studies confirmed the API was released from all formulations. The
highest percentage released after 6 h was observed with the more hydrophilic formulation
containing atropine. The lipophilic atropine has a low affinity for the hydrophilic formulation and
this caused a driving force for the atropine to leave the formulation, resulting in the high release
(Otto et al., 2009:9).
Transdermal diffusion studies were performed over a period of 12 h to determine the
transdermal delivery of the API. The lipophilic formulations for both atropine and atropine
sulphate resulted in the highest percentage transdermal delivery (0.65% and 0.63%,
respectively). The lipophilic formulations had a higher SFG compared to the AFG, which initially
predicted poor transdermal delivery. The individual ingredients might however still penetrate the
skin resulting in a change in the residual formulation on the skin. The dimethyl isosorbide (DMI)
penetrated the skin faster than the other ingredients and resulted in a less desirable residual
formulation, which resulted in a driving force for the atropine and the atropine sulphate to leave
the formulation. The penetrated DMI provided a more welcome environment for the API in the
skin which also contributed to the high delivery (Abbott, 2012:219).
Tape-stripping was employed after the transdermal diffusion experiments to determine the
distribution of the API between the stratum corneum-epidermis (SCE) and the epidermis-dermis
(ED). The hydrophilic formulations of both atropine and atropine sulphate resulted in the
highest concentration in the SCE and ED. This was explained by the lack of driving force
caused by the HSP profile and the only driving force for the API to leave the hydrophilic
formulation was the concentration gradient. After 12 h, the API had not fully traversed the skin
55
and therefore low transdermal results were obtained compared to the highest concentration in
the skin.
The results obtained in this study support the Delivery Gap Principle of Wiechers, since effective
transdermal delivery was obtained with an API with a SDG < 1 (Wiechers, 2012). The results
also confirmed that the polarity of the formulation has a definite effect on the transdermal
delivery of an API. Wiechers stated that a formulation with a small SFG (optimised towards the
stratum corneum) should result in a transdermal delivery of at least 50% of the API. The results
from this study contradict this, since the more lipophilic formulation had the highest transdermal
delivery. According to Abbott (2012:218), a good balance between the AFG and SFG is needed
to ensure sufficient penetration of the API through the skin by generating a driving force and by
increasing the solubility of the API in the skin as the formulation penetrates. From the results it
was observed that the lipophilic formulation with a higher SFG, compared to AFG, resulted in
the highest transdermal delivery. The AFG and SFG initially predicted poor delivery but the
composition change of the formulation, as some ingredients penetrated, resulted in a less
desirable environment for the API causing a driving force for it to leave the formulation. The
penetrated ingredients generated a more welcome environment for the API in the skin and also
contributed to the higher delivery. It can be concluded that the polarity of the formulation affects
the transdermal delivery of an API, but it is important to consider the total HSP profile and molar
volume of the API and the ingredients to predict the transdermal delivery of an API rather than
just the SFG or AFG. The results indicated that the sulphate salt of the API reduced the
transdermal delivery of it and it is therefore better to use the API base instead of the salt form
due to. The HSP of a salt is generally higher compared to the base compound and therefore a
higher affinity towards water and a low solubility in the skin is observed (Hansen, 2007:337)
4.2 Future prospects
Future prospects for further investigation of this study include:
1) Determine the stability of the atropine lipophilic formulation.
2) Formulate atropine in different semi-solid formulations like a cream or ointment.
3) Evaluate a different API in a gel formulation.
4) Extend the investigation of the FFE™ theory by employing other APIs and formulation
types.
56
References
Abbott, S. 2012. An integrated approach to optimizing skin delivery of cosmetic and
pharmaceutical actives. International journal of cosmetic science, 34:217-222.
Brown, M.B., Martin, G.P., Jones, S.A. & Akomeah, F.K. 2005. Dermal and transdermal drug
delivery systems: Current and Future Prospects. Drug Delivery, 13:175-187.
Hansen, C.M. 2007. The future. (In Hansen, C.M. Hansen solubility parameters – a users
handbook. 2nd ed. Boca Raton: CRC Press. p. 321-346).
Otto, A., Du Plessis, J. & Wiechers, J.W. 2009. Formulation effects of topical emulsions on
transdermal and dermal delivery. International journal of cosmetic science, 31:1-19.
Wiechers, J.W. 2012. Explaining the importance of the skin delivery gap.
http://www.jwsolutions.com/page/explaining-importance-skin-delivery-gap Date of access: 20
Feb. 2013.

57
Appendix A
Method validation for the high performance liquid chromatography
assay of atropine
A.1 Introduction
The purpose of the validation process is to confirm that the analytical method used to determine
the amount of API in the samples is both sensitive and reliable. The APIs used during this
study were atropine and atropine sulphate.
Table A.1: A summary of the results obtained from the validation tests for atropine
Test Results
Specificity Complies
Range 0.03-300.00 µg/ml
Linearity r2 = 0.99917
Accuracy 102.6%
Precision RSD* = 1.62%
*Relative standard deviation
This method was developed and validated primarily for use in transdermal and membrane
diffusion studies as well as for the determination of aqueous solubility, log P and log D.
A.2 Chromatographic conditions
The chromatographic conditions were as follows:
Analytical instrument: HP1100 series HPLC equipped with a pump, autosampler, UV
detector and ChemStation Rev. A.10.03 data acquisition and analysis
software or equivalent (Agilent Technologies, Palo Alto, CA)
Column: Column L1, USP 24, 2000, p 1925 (Luna C18-2 column,
150 x 4.6 mm, 5 µm, 100 Å pores, 17.8% carbon load, endcapped,
Phenomenex, Torrance, CA, and Venusil XBP C18(2), 150 x 4.6 mm,
5 µm, Agela Technologies, Newark, DE)
Mobile phase: Methanol/0.005 M 1-octane sulphonic acid sodium in water, pH
adjusted to 3.5 with dilute phosphoric acid 58:42

58
Flow rate: 1.0 ml/min
Injection volume: 50 µl
Detection: UV at 210 nm
Retention time: ± 5.1 min
Stop time: 8 min
Solvent: PBS pH 7.4
A.3 Sample preparation
Samples are prepared/collected and transferred into autosampler vials without any further
processing and analysed.
A.4 Standard preparation
The standard solution was prepared using the following method:
1. Weigh approximately 30 mg of atropine accurately in a 100 ml volumetric flask.
2. Dissolve in about 50 ml of methanol; fill to volume with PBS (pH 7.4) (Standard 1).
3. Dilute 5 ml of this solution to 50 ml with PBS (pH 7.4) (Standard 2).
4. Further dilute 5 ml of this solution to 50 ml with PBS (pH 7.4) (Standard 3).
5. Further dilute 5 ml of this solution to 50 ml with PBS (pH 7.4) (Standard 4).
6. Transfer the standards into autosampler vials and analyse.
A.5 Calculations
The concentrations of standard solutions are entered into an Excel worksheet with the peak
areas of the standards and samples. A standard curve is calculated by means of linear
regression. The slope and y-intercept are used to calculate the concentration of the samples
from the peak areas.
A.6 Validation test procedures and acceptance criteria
A.6.1 Specificity
The specificity of the method was validated using the following method:
1. Prepare a placebo by filling a vial with PBS (pH 7.4).
2. Inject in duplicate.
59
3. Dilute a standard solution by adding 100 µl of water, 2.0 M hydrochloric acid (HCl), 2.0 M
sodium hydroxide (NaOH) and 10% hydrogen peroxide (H2O2) to 1 ml of standard and
mix by vortexing.
4. Store these solutions overnight in closed test tubes at room temperature to degrade.
5. Inject the samples in the chromatograph with a run time of 10 min.
6. Examine the chromatograms to determine whether any additional peaks were formed.
A.6.1.1 Acceptance criteria
The degraded samples should not contain any peaks that will interfere with the determination of
atropine. The placebo should not interfere with the atropine.
A.6.2 Linearity
The linearity of the method was validated by the following method:
1. Prepare a standard as described in Section A.4.
2. Inject 5, 10, 20, 30, 40 and 50 µl of each standard solution (Standards 1-4) in duplicate
into the HPLC.
A.6.2.1 Acceptance criteria
Linear regression analysis should yield a regression coefficient (r2) of 0.99. The range is
determined as the lowest and highest concentrations between which the response remains
linear and/or where acceptable precision is obtained.
A.6.3 Accuracy
The following method was used for the validation of the accuracy:
1. Since the method does not involve any sample preparation, accuracy and precision can
only be done by preparing a set of standards and analysing them against another set of
standard solutions.
2. Weigh approximately 25 mg of atropine in a 100 ml volumetric flask. Dissolve in
approximately 50 ml of methanol and fill to volume with PBS (pH 7.4). Transfer 10 ml of
this solution into a 20 ml volumetric flask and fill up to volume with PBS (pH 7.4).
Transfer 5 ml of the latter solution into a 50 ml volumetric flask and fill to volume with
PBS (pH 7.4). This will yield solutions containing approximately 12.5, 125.0 and
250.0 µg/ml of atropine. Transfer these solutions into autosampler vials and analyse for
accuracy experiment against a standard solution prepared as described in Section A.4.

60
A.6.3.1 Acceptance criteria
According to the Food and Drug Association (FDA, 2001), the mean value determined for
accuracy should be within 15% of the true value. For the purpose of our experiments, we set a
limit of between 95 to 105%.
A.6.4 Precision
A.6.4.1 Intra-day precision (repeatability)
The intra-day precision was validated using the following method:
1. Prepare three samples each of low, medium and high concentration (n = 9).
2. Prepare a set of standards as described in Section A.4.
3. Inject into the chromatograph in duplicate.
A.6.4.2 Inter-day precision
Analyse three samples of the middle concentration as described under intra-day precision
(Section A.6.4.1) on two more days to determine the between-day variability of the method. If
possible, a different analyst should perform the analysis, preferably using different equipment.
A.6.4.3 Acceptance criteria
Limits set for precision of bioanalytical methods are 15% of the coefficient of variation, except
for the lower limit of quantification (LLOQ), where it should not exceed 20% (FDA, 2001).
For the purposes of our study, we set the limits as follows:
Intra-day repeatability must be better than 5% (n = 9).
Inter- day precision must be better than 10% (n = 9).
A.6.5 Limit of detection and lower limit of quantification
The limit of detection (LOD) is defined as the lowest amount of analyte which can be detected
(discerned from baseline noise), but not quantified. The LLOQ is the lowest amount of an
analyte that can be determined with suitable accuracy and precision (ICH, 1995). The LLOQ
should be chosen to suit the purpose for which the method is to be used.
61
A.6.5.1 Acceptance criteria
For the purpose of this study, the LOD will be the lowest concentration that yields an RSD of
approximately 15%, whereas the LLOQ will be the lowest concentration that yields an RSD of
less than 5% (n = 6).
A.6.6 Ruggedness
A.6.6.1 Stability of sample solutions
The stability of the samples was validated using the following method:
1. Prepare a standard solution as described in Section A.4.
2. Inject the sample into the chromatograph.
3. Leave the sample in the autosampler tray and reanalyse at hourly intervals up to 24 h in
order to determine the stability of the sample.
4. Programme the pump to reduce the flow rate to 0.1 ml/min after elution of the peak and
reset the flow rate to 1 ml/min 5 min before injecting the next sample.
A.6.6.1.1 Acceptance criteria
Sample solutions should not be used for a period longer than it takes to degrade by 2% and in
this case, special precautions should be followed to compensate for the degradation.
A.6.6.2 System repeatability
Inject a sample or standard six times consecutively in order to test the repeatability of the peak
area as well as the retention time.
A.6.6.2.1 Acceptance criteria
The peak area and retention times should have an RSD of 2% or less.
A.6.7 Robustness
Make deliberate changes to the flow rate, injection volume, wavelength and mobile phase
composition. Determine the influence of these changes on the chromatographic results.
A.6.8 System and method performance characteristics (system suitability)
Generate an extended performance report on the standard solution, taking care that only the
relevant peaks are integrated.

62
A.6.8.1 Acceptance criteria
Examine the performance results obtained. Set realistic performance characteristics that must
be complied to, in order to do the analysis successfully.
A.6.9 Uncertainty of measurement
The uncertainty of measurement was determined empirically as well as from validation data.
The calculated uncertainty of measurement was obtained by combining the uncertainties of
each step in the analysis process and is expressed as a contribution factor. Set a value for
uncertainty of measurement to include on reports done with this method.
A.7 Validation results
A.7.1 Specificity
Figure A.1: HPLC chromatogram of a standard solution of atropine
Min
mA
U
0 1 2 3 4 5
300
250
200
150
100
50
0
5.24
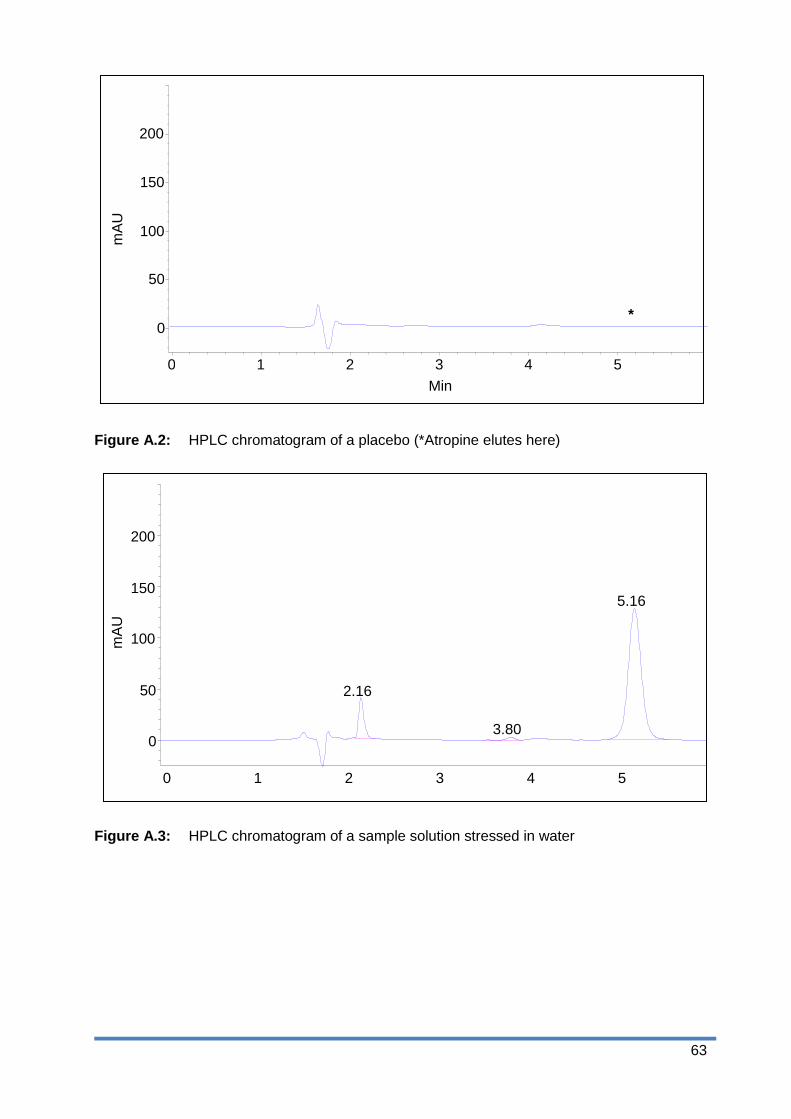
63
Figure A.2: HPLC chromatogram of a placebo (*Atropine elutes here)
Figure A.3: HPLC chromatogram of a sample solution stressed in water
mA
U
0 1 2 3 4 5
3.80
2.16
5.16
200
150
100
50
0
Min
mA
U
0 1 2 3 4 5
*
200
150
100
50
0

64
Figure A.4: HPLC chromatogram of a sample solution stressed in 0.1 M HCl
Figure A.5: Chromatogram of a sample solution stressed in 0.1 M NaOH
Min 0 1 2 3 4 5
5.17
mA
U
200
150
100
50
0
0 1 2 4 5 3
4.41
5.43
mA
U
200
150
100
50
0 3.582
Min

65
Figure A.6: HPLC chromatogram of a sample solution stressed in 10% H2O2
A.7.1.1 Peak purity
The remainder of the atropine peaks in the above stressed samples were examined by means
of diode array peak purity analysis to ascertain whether any interference from degradation were
present and co-eluted with the atropine peak.
Figure A.7: Purity testing of chromatogram of a sample solution stressed in 0.1 M NaOH
0 1 2 3 4 5
Min
mA
U
200
150
100
50
0
5.17
mA
U
0 1 2 3 4 5
200
150
100
50
0
Min
5.21

66
Figure A.8: Overlaid UV spectra of atropine peak
Figure A.9: Graph of purity profile of atropine peak
None of the ingredients in the placebo interfered with the analyte peak. Extra peaks formed
during forced degradation did not interfere with the remainder of the atropine peak. Peak purity
testing of the remaining peaks, after forced degradation in all forced degradation samples,
indicated the peak was still pure (> 99.98%), thus proving the method is stability-indicating.
5 5.2 5.4
Calculated
| | | | ' ' ' ' '
+ + + + + + + + + + + + + + + + + + + + + + + + + + + + + + + + + + + + + + +
Min
200 220 240 260 280 300 320 340 360 380 nm
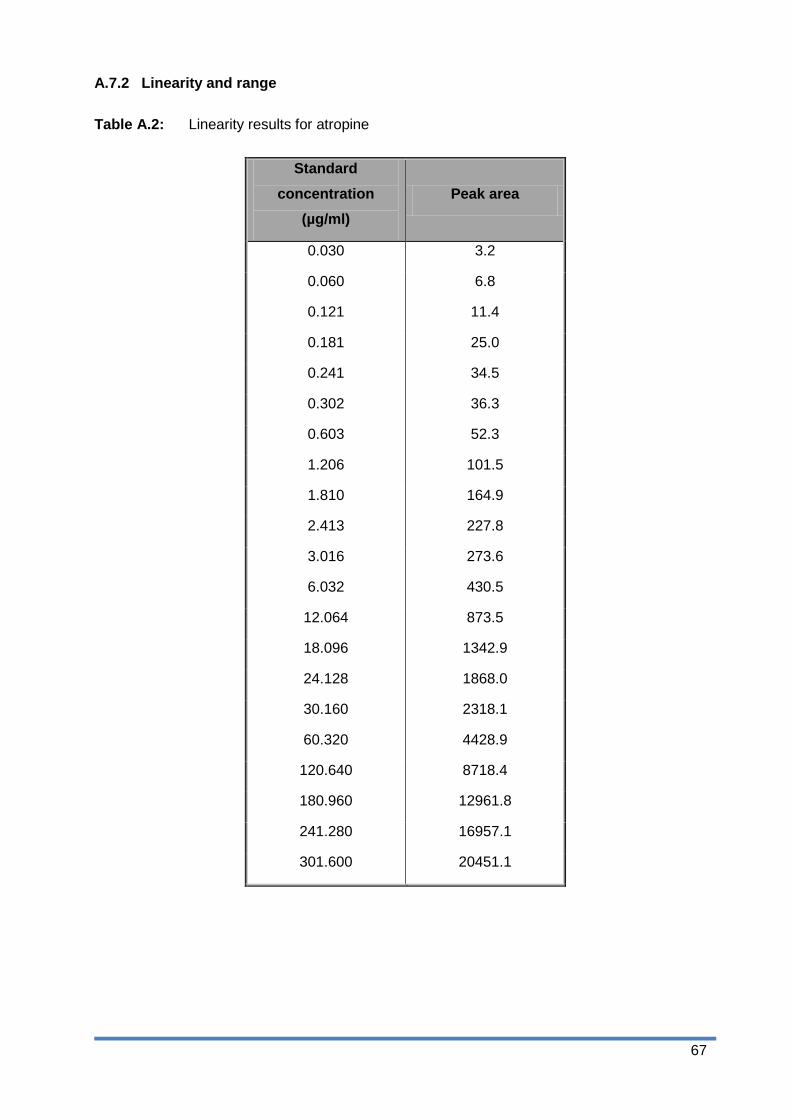
67
A.7.2 Linearity and range
Table A.2: Linearity results for atropine
Standard
concentration
(µg/ml)
Peak area
0.030 3.2
0.060 6.8
0.121 11.4
0.181 25.0
0.241 34.5
0.302 36.3
0.603 52.3
1.206 101.5
1.810 164.9
2.413 227.8
3.016 273.6
6.032 430.5
12.064 873.5
18.096 1342.9
24.128 1868.0
30.160 2318.1
60.320 4428.9
120.640 8718.4
180.960 12961.8
241.280 16957.1
301.600 20451.1

68
Table A.3: Range for atropine
R Squared 0.999 Lower 95% Upper 95%
Intercept 79.667
Slope 69.250 69.294 70.206
Figure A.10: Linear regression graph for atropine
The method is linear over the concentration range 0.03-301.60 µg/ml.

69
A.7.3 Accuracy
Table A.4: Accuracy parameters of atropine
Concentration
spiked (µg/ml)
Peak area 1 Peak area 2 Mean peak
area
Recovery
(µg/ml)
Recovery
(%)
9.95 742.6 692.7 717.7 9.89 99.40
10.08 721.1 729.5 725.3 10.00 99.20
9.88 745.7 730.3 738.0 10.18 103.03
99.52 7551.9 7362.9 7457.4 103.50 104.00
100.80 7598.4 7618.0 7608.2 105.60 104.76
98.76 7346.4 7388.0 7367.2 102.25 103.54
248.80 18456.9 18223.2 18340.1 254.66 102.36
252.00 19020.3 18720.7 18870.5 262.03 103.98
246.90 18380.7 18293.6 18337.2 254.62 103.13
Mean 102.60
SD 1.88
%RSD 1.83
Over the range of 10 to 250 µg/ml, the method yielded a mean recovery of 102.60%. Precision
was satisfactory with an RSD of 1.83% (see Section A.6.3).
A.7.4 Precision
A.7.4.1 Intra-day precision (repeatability) and inter-day precision (reproducibility)
Table A.5: Intra- and Inter-day precision parameters of atropine
Day 1 Day 2 Day 3 Between days
104.03 99.21 102.78
104.79 100.62 99.02
103.57 98.91 101.25
Mean 104.13 99.58 101.02 101.58
SD 0.50 0.75 1.54 2.61
%RSD 0.48 0.75 1.53 2.13
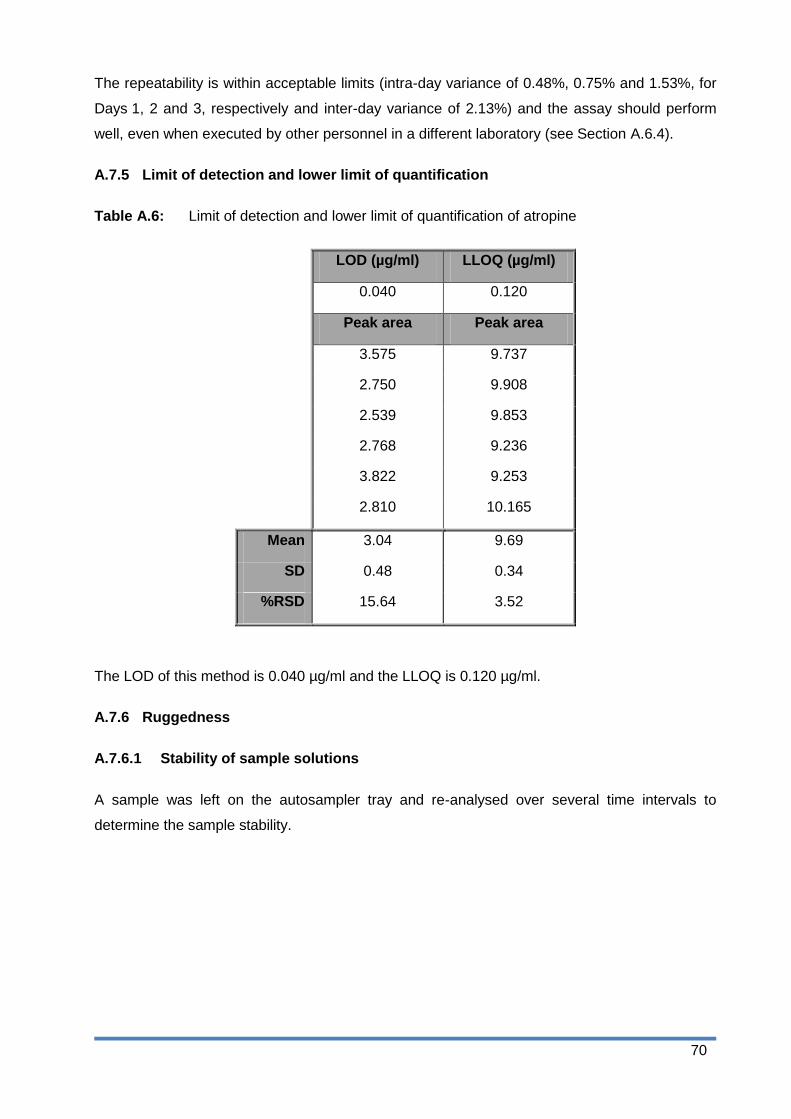
70
The repeatability is within acceptable limits (intra-day variance of 0.48%, 0.75% and 1.53%, for
Days 1, 2 and 3, respectively and inter-day variance of 2.13%) and the assay should perform
well, even when executed by other personnel in a different laboratory (see Section A.6.4).
A.7.5 Limit of detection and lower limit of quantification
Table A.6: Limit of detection and lower limit of quantification of atropine
LOD (µg/ml) LLOQ (µg/ml)
0.040 0.120
Peak area Peak area
3.575 9.737
2.750 9.908
2.539 9.853
2.768 9.236
3.822 9.253
2.810 10.165
Mean 3.04 9.69
SD 0.48 0.34
%RSD 15.64 3.52
The LOD of this method is 0.040 µg/ml and the LLOQ is 0.120 µg/ml.
A.7.6 Ruggedness
A.7.6.1 Stability of sample solutions
A sample was left on the autosampler tray and re-analysed over several time intervals to
determine the sample stability.

71
Table A.7: Sample stability parameters of atropine
Time (h) Peak Area %Remaining
0 2080.07 100.0
1 2092.50 100.6
2 2064.45 99.2
3 2051.82 98.6
4 2053.02 98.7
5 2051.43 98.6
6 2039.45 98.0
7 2040.79 98.1
8 2053.41 98.7
9 2009.65 96.6
10 2035.69 97.9
11 2042.49 98.2
12 2044.11 98.3
13 2035.59 97.9
14 2039.45 98.0
15 2036.64 97.9
16 2030.15 97.6
17 2026.27 97.4
18 2026.57 97.4
19 2033.57 97.8
20 2040.50 98.1
21 2025.89 97.4
22 2029.77 97.6
23 2026.96 97.4
24 2034.12 97.8
Mean 2041.8 98.2
SD 17.33 0.83
%RSD 0.85 0.85
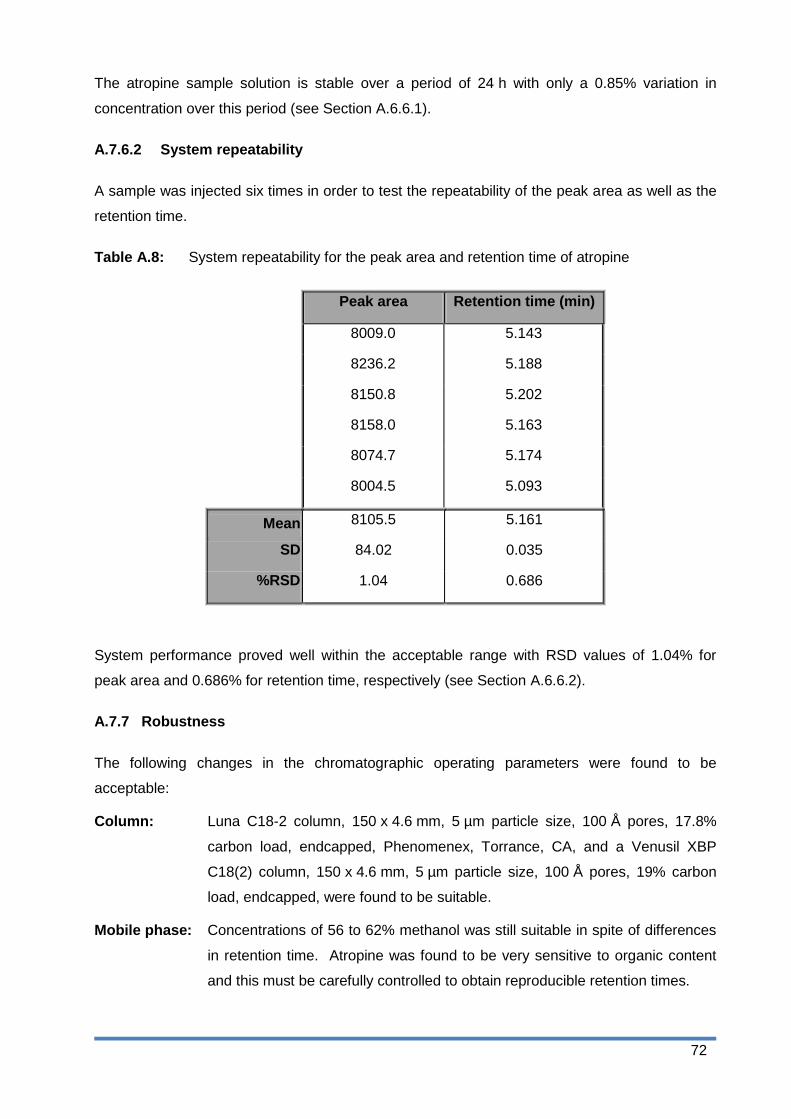
72
The atropine sample solution is stable over a period of 24 h with only a 0.85% variation in
concentration over this period (see Section A.6.6.1).
A.7.6.2 System repeatability
A sample was injected six times in order to test the repeatability of the peak area as well as the
retention time.
Table A.8: System repeatability for the peak area and retention time of atropine
Peak area Retention time (min)
8009.0 5.143
8236.2 5.188
8150.8 5.202
8158.0 5.163
8074.7 5.174
8004.5 5.093
Mean 8105.5 5.161
SD 84.02 0.035
%RSD 1.04 0.686
System performance proved well within the acceptable range with RSD values of 1.04% for
peak area and 0.686% for retention time, respectively (see Section A.6.6.2).
A.7.7 Robustness
The following changes in the chromatographic operating parameters were found to be
acceptable:
Column: Luna C18-2 column, 150 x 4.6 mm, 5 µm particle size, 100 Å pores, 17.8%
carbon load, endcapped, Phenomenex, Torrance, CA, and a Venusil XBP
C18(2) column, 150 x 4.6 mm, 5 µm particle size, 100 Å pores, 19% carbon
load, endcapped, were found to be suitable.
Mobile phase: Concentrations of 56 to 62% methanol was still suitable in spite of differences
in retention time. Atropine was found to be very sensitive to organic content
and this must be carefully controlled to obtain reproducible retention times.

73
Flow rate: 0.8-1.2 ml/min
Wavelength: The wavelength can be altered by ± 3 nm without any ill effect.
Environment: The analysis was performed by two different analysts on Days 2 and 3 of the
inter-day precision experiment, on two different instruments (Agilent 1100
series with diode array detection and Agilent 1200 series with variable
wavelength UV detection). The intra-day variation was only 2.13%
(see Section A.6.4).
The method was able to tolerate small changes in the chromatographic conditions and should
perform well under normal use.
A.8 Chromatographic performance parameters
Reference (USP, 2005)
Retention time (min): 5.206
Number of theoretical plates (N) plates/column (tangent method): 5950
USP tailing factor (T): 1.138
Capacity factor (k‟): 2.34
A.9 System suitability parameters
The system suitability parameters were determined using the following method:
Inject a standard solution in triplicate.
Calculate the relative standard deviation of the peak areas obtained.
Calculate the number of theoretical plates for the atropine peak.
Use the tangent method to calculate the parameters.
A.9.1 System suitability criteria
The system is suitable to perform the analysis if the following criteria are met:
RSD < 2% for 3 injections
The column must have more than 4460 theoretical plates for atropine (75% of validation
value).

74
A.10 Uncertainty measurements
Empirical calculation:
Weighing of standard: 0.01 mg/25.00 mg x 100 = 0.04%
100 ml flask: 0.08 ml/100.00 ml x 100 = 0.08%
5 ml pipette: 0.015 ml/5.000 ml x 100 (3 x diluted) = 0.90%
50 ml volumetric flask: 0.05 ml/50.00 ml x 100 x 3 = 0.30%
Injection inaccuracy (repeatability) = 1.04%
Total uncertainty: 2.36%
From validation data:
Recovery: 102.6%, thus 100.00 – 102.6 = 2.6%
Intra-day and inter-day precision (1.83 + 1.62)/2 = 1.72%
Total uncertainty: (2.6 + 1.72) = 4.33%
A.11 Conclusion
The method performed well and should be suitable to analyse atropine in membrane and
diffusion study samples and for the determination of aqueous solubility, log P and log D.
Measurement uncertainty is well within the limits for assays in biological matrices. No
interference was encountered from stressed samples or known related substances, thus the
method can be regarded as being stability-indicating.
75
References
FDA see Food and drug administration
Food and Drug Administration. 2001. Guidance for Industry: Bio analytical method Validation.
http://www.fda.gov/downloads/drugs/guidancecomplianceregulatoryinformation/guidances/ucm0
70107.pdf Date of access: 21 Oct. 2014.
ICH see International Conference on Harmonisation of technical requirements for registration of
pharmaceuticals for human use.
International Conference on Harmonisation of technical requirements for registration of
pharmaceuticals for human use. 2005. ICH harmonised tripartite guidelines. Validation of
analytical procedures: text and methodology Q2(R1).
http://www.ich.org/products/guidelines/quality/quality-single/article/validation-of-analytical-
procedures-text-and-methodology.html Date of access: 25 Jun. 2013
USP (United States Pharmacopoeia). 2005. Chromatography.
https://mc.usp.org/sites/default/files/documents/GeneralChapterPDFs/621Chromatography.pdf
Date of access: 10 Nov. 2014
76
Appendix B
Formulation of a gel containing atropine using the Formulating for
Efficacy™ software
B.1 Introduction
The objective of the study was to develop formulations of different polarities for both atropine
and atropine sulphate using the FFE™ software. Atropine was chosen as a model drug in this
study and atropine sulphate was used to determine the effect of the salt form on the delivery of
the API from the same formulations. The FFE™ software allows the formulator to optimise the
formulation to the API, the stratum corneum or the target concentration (JW solutions, 2014). In
this study, the formulation was optimised towards the skin to ensure optimal transdermal
delivery of the API. Two additional formulations were developed which were more hydrophilic
and more lipophilic than the optimised formulation. The six formulations were prepared and
membrane release and skin diffusion studies were conducted to determine the release and
transdermal delivery of the API, respectively.
B.2 Preformulation and formulation
Preformulation studies are done before the initiation of formulation development to ensure the
rational development of formulations that are stable, safe and efficient. Preformulation is mainly
concerned with the physicochemical properties of the API (Walters & Brian, 2002:321). There
are eight chronological phases in preformulation studies and include the general description of
the API, calorimetry, polymorphism, hygroscopicity, analytical development, intrinsic stability,
solubility and partitioning and drug delivery characteristics (Walters & Brian, 2002:322).
During this study the FFE™ software was used for formulation development as it uses the
simplified molecular-input line-entry system (SMILES) string of the API to determine certain
physicochemical properties of the API. This simplifies formulation development and eliminates
the preformulation phase. The aqueous solubility, log P and the log D of the API was
determined and described in Appendix C.
B.3 Developing a product using the “Formulating for Efficacy” software
The general method for developing a formulation using the FFE™ software is illustrated in
Figure B.1.

77
Figure B.1: General method for developing a formulation using FFE™ software (Adapted
from JW Solutions, 2014).
The first step in developing a formulation is to identify and to select the emollients in which the
API is soluble. The API is then added to the active list using the SMILES string. The software
uses the SMILES string to calculate the HSP, molar volume and melting point. After the
intended API is selected, the percentage oil phase in the formulation and the overall percentage
required API is entered.
The formulation can then be either optimised towards the API, the stratum corneum or the target
concentration. To optimise the formulation towards the API, the amount of API must reach a
maximum. The aforementioned is used especially for APIs that have a very low solubility in
most ingredients. This ensures that an adequate concentration gradient is obtained to ensure
clinical efficacy. Optimising the formulation towards the stratum corneum ensures that the API
penetrates the stratum corneum in sufficient amounts, thus penetrating deeper into the skin.
When the formulation is optimised towards the target concentration, the selected API
concentration is close to the maximum limit of solubility to ensure a maximum driving force for
the API to leave the formulation and penetrate the skin (JW Solutions, 2014).
The selected ingredient list can be optimised using the programme and the optimal ratio of
these will be calculated. The programme can also be used to find the best extra ingredient to
create the optimised formulation. If no emollients are selected, the programme can be used to

78
find the best two or three ingredients and will generate the best combination of all the
ingredients listed to obtain the optimised formulation (JW Solutions, 2014).
The formulation obtained using the FFE™ software should in theory provide a good transdermal
delivery of the API. The formulation can be finalised by adding different additives to provide the
needed viscosity, preservation, skin feel, etc. (JW Solutions, 2014).
B.4 Semi-solid formulations: gel and emulgel
A gel is a liquid rich, semi-solid formulation. The gel consists of an external solvent phase that
is immobilised in a three-dimensional matrix. A gel usually contains a gelling agent such as a
carbomer or natural gum that is dispersed in water. The gelling agent swells to form the three-
dimensional polymer network (Barry, 2007:593; Rehman & Zulfakar, 2014:433).
An emulgel is a combination between an emulsion and a gel. A gelling agent is incorporated
into the water phase of the emulsion. The emulgel can be a water-in-oil (w/o) or an oil-in-water
(o/w) emulsion based gel (Rehman & Zulfakar, 2014:433).
B.5 Skin delivery gap
Atropine was used as a model drug during this study and therefore the minimum effective
concentration (MEC) is not of interest. A hypothetical SDG was however determined from the
serum levels obtained from literature. The serum concentration of atropine was 2 ng/ml after an
intravenous injection of 0.32 mg atropine (Kradjan et al., 1985). This serum level was used as
the MEC to determine the SDG using the FFE™ software. The SDG of atropine was calculated
to be 0.001 (SDG < 1) and it should therefore readily penetrate the skin. An SDG > 1 would
have indicated that a more complex delivery system was needed to ensure effective
transdermal delivery of the API (Wiechers, 2012).
B.6 Formulation of an optimised gel, hydrophilic gel and lipophilic emulgel for both
atropine and atropine sulphate
The FFE™ software was used to develop an optimised formulation of atropine. DMI was
chosen as the primary emollient and the software was used to find the best extra ingredient.
The API concentration of 1.5% was used and an oil phase percentage of 25.0% was chosen;
the formulation was then optimised towards the skin.
Table B1 provides a list of the ingredients used to make the different formulations as well as the
suppliers and batch numbers.

79
Table B.1: Ingredients used in the formulations together with the suppliers and batch
numbers
Ingredient Supplier Batch number
Atropine
Atropine sulphate
Carbopol® Ultrez 10 polymer
DMI
Polyethylene glycol 400 (PEG-8)
Tween® 80 (PEG-20 sorbitan monooleate)
Span® 60 (sorbitan monostearate)
Liquid paraffin
Ethanol
Sigma-Aldrich
Sigma-Aldrich
Lubrizol Advanced Materials
Sigma-Aldrich
Merck Chemicals
Merck Chemicals
Merck Chemicals
Merck Chemicals
ACE Chemicals
070M1206V
BCBH 8339V
0100922762
STBD7240V
1040534
1042689
S5361721 034
1034378
6676
The concentration ratio of the DMI:PEG-8 was kept the same for all the formulations to eliminate
the possible penetration enhancement effect of the DMI. For the more hydrophilic gel, 10%
ethanol was added and for the more lipophilic emulgel, 10% liquid paraffin was added. The
formulations were kept the same for the atropine sulphate formulations.
B.6.1 Formulation of an optimised gel containing atropine/atropine sulphate
An optimised formulation of atropine was developed using the FFE™ software. The same
formulation was used for atropine sulphate.
Table B.2: Formula of atropine/atropine sulphate optimised gel
Phase Ingredients %m/m Activity
A Water
Carbopol®
To 100.0
0.6
Solvent
Thickening/gelling agent
B
DMI
PEG-8
Tween® 80
Span® 60
Atropine*
15.3
8.2
4.5
0.5
1.5
Primary emollient
Secondary emollient
Surface active agent
Emulsifier
API
* The atropine sulphate was added to Phase A
B.6.1.1 Preparation of the atropine optimised gel
Carbopol® was sprinkled over the water and left for ± 2 min for wetting to occur. Phase A was
then heated to 40 °C after which it was homogenised at 800 rpm. All the ingredients of Phase B
were mixed and both Phases A and B were heated to 50 °C. Phase B was slowly added to
Phase A whilst homogenising at 1800 rpm, until a temperature of 40 °C was reached. The final
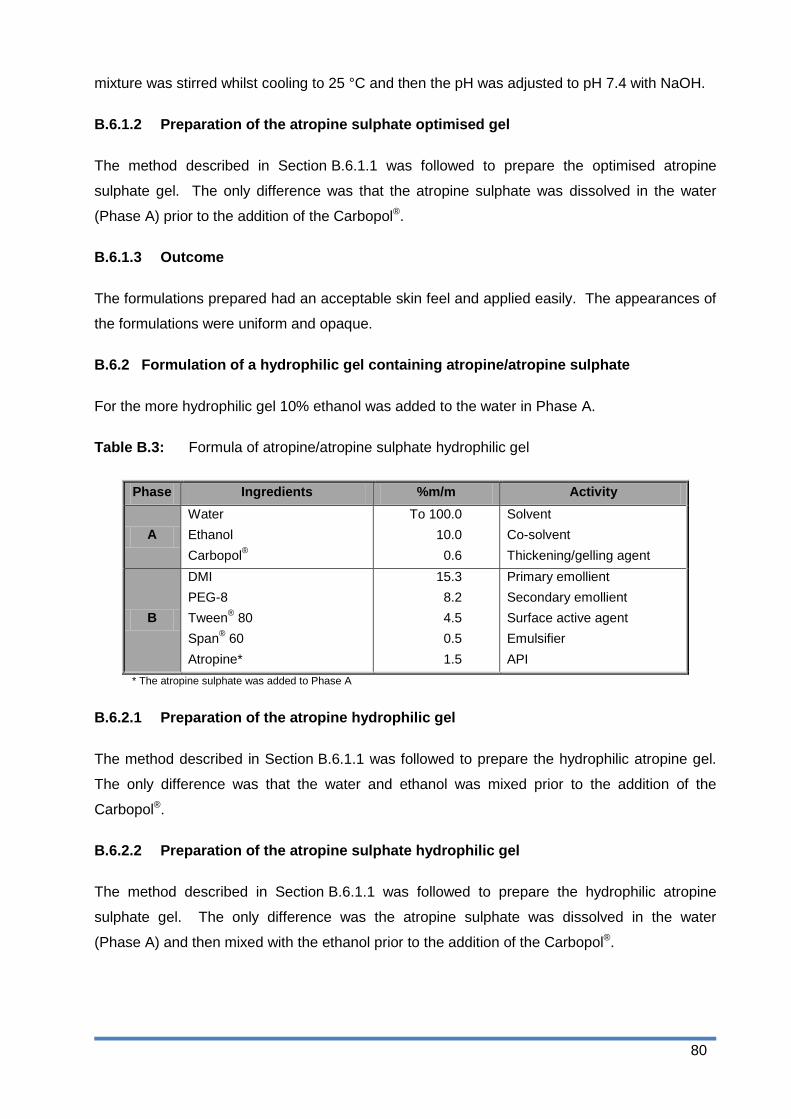
80
mixture was stirred whilst cooling to 25 °C and then the pH was adjusted to pH 7.4 with NaOH.
B.6.1.2 Preparation of the atropine sulphate optimised gel
The method described in Section B.6.1.1 was followed to prepare the optimised atropine
sulphate gel. The only difference was that the atropine sulphate was dissolved in the water
(Phase A) prior to the addition of the Carbopol®.
B.6.1.3 Outcome
The formulations prepared had an acceptable skin feel and applied easily. The appearances of
the formulations were uniform and opaque.
B.6.2 Formulation of a hydrophilic gel containing atropine/atropine sulphate
For the more hydrophilic gel 10% ethanol was added to the water in Phase A.
Table B.3: Formula of atropine/atropine sulphate hydrophilic gel
Phase Ingredients %m/m Activity
A
Water
Ethanol
Carbopol®
To 100.0
10.0
0.6
Solvent
Co-solvent
Thickening/gelling agent
B
DMI
PEG-8
Tween® 80
Span® 60
Atropine*
15.3
8.2
4.5
0.5
1.5
Primary emollient
Secondary emollient
Surface active agent
Emulsifier
API
* The atropine sulphate was added to Phase A
B.6.2.1 Preparation of the atropine hydrophilic gel
The method described in Section B.6.1.1 was followed to prepare the hydrophilic atropine gel.
The only difference was that the water and ethanol was mixed prior to the addition of the
Carbopol®.
B.6.2.2 Preparation of the atropine sulphate hydrophilic gel
The method described in Section B.6.1.1 was followed to prepare the hydrophilic atropine
sulphate gel. The only difference was the atropine sulphate was dissolved in the water
(Phase A) and then mixed with the ethanol prior to the addition of the Carbopol®.

81
B.6.2.3 Outcome
The formulations had a uniform, opaque appearance with a good consistency. The formulation
applied easily, but was a bit tacky.
B.6.3 Formulation of a lipophilic emulgel containing atropine/atropine sulphate
For the more lipophilic emulgel 10% liquid paraffin was added. The oil phase percentage was
increased to 35%.
Table B.4: Formula of atropine/atropine sulphate lipophilic emulgel
Phase Ingredients %m/m Activity
A Water
Carbopol®
To 100.0
0.6
Solvent
Thickening/gelling agent
B
DMI
PEG-8
Tween® 80
Span® 60
Liquid paraffin
Atropine*
15.3
8.2
4.5
0.5
10.0
1.5
Primary emollient
Secondary emollient
Surface active agent
Emulsifier
Lipophilic solvent
API
* The atropine sulphate was added to Phase A
B.6.3.1 Preparation of the atropine lipophilic emulgel
The method described in Section B.6.1.1 was followed to prepare the lipophilic atropine
emulgel. The only difference was the addition of the liquid paraffin to Phase B.
B.6.3.2 Preparation of the atropine sulphate lipophilic emulgel
The method described in Section B.6.1.1 was followed to prepare the lipophilic atropine
sulphate emulgel. The only difference was the addition of the liquid paraffin to Phase B and the
atropine sulphate was dissolved in the water (Phase A) prior to the addition of the Carbopol®.
B.6.3.3 Outcome
The appearance of the formulations was uniform white. The formulations had an acceptable
skin feel and were easily applied.

82
B.7 Formulation characteristics
B.7.1 HSP values
Many biological materials are characterised by HSP (Hansen, 2007:270). With the HSP values
of the human skin [17.0, 8.0, 8.0], the API [18.1, 4.7, 8.5] and the formulations (see Table B.6)
known, it is possible to predict adequate solubility in the formulation and skin diffusion using the
HSP distance/gap (Hansen, 2013). Table B.5 summarises the HSP characteristics of the
different ingredients and the API. The ingredient-active-gap (IAG) is an indication of how close
the ingredient and the API are in terms of HSP distance and the ingredient-skin-gap (ISG)
indicates the HSP distance between the ingredient and the skin. Tables B.5 and B.6
respectively, give a summary of the HSP characteristics of the different ingredients and the HSP
characteristics of the formulations containing atropine as provided by the FFE™ software. The
AFG is an indication of how soluble the API is in the formulation. A smaller AFG will indicate
better solubility. The SFG is an indication of how alike the formulation is to the skin. A smaller
AFG shows that the formulation and the skin are mutually soluble in terms of HSP distance. It is
generally accepted that a HSP gap > 8 indicates insolubility. A desirable HSP gap in terms of
solubility and compatibility is < 4 (Abbott, 2012:221).
Table B.5: HSP characteristics of atropine and the ingredients in the formulations
Ingredients δD δP δH Mvol
(mol/ml) IAG ISG
Atropine 18.1 4.7 5.8 253.2
DMI 17.5 7.4 7.6 158.9 3.09 1.96
PEG-8 16.0 17.0 8.0 320.0 4.81 7.16
Ethanol 15.4 9.2 19.6 58.7 13.14 7.10
Liquid paraffin 15.7 1.3 3.0 543.9 8.05 47.62
Ingredients with lower molar volumes (mVol) will penetrate the skin faster than those with higher
molar volumes (Abbott, 2012:219). When excluding the API; ethanol has the lowest mVol
followed by DMI, PEG-8 and liquid paraffin. This indicates, studying only mVol, that ethanol will
penetrate the skin the fastest and liquid paraffin the slowest.
The smaller the IAG, the more soluble the API is in the different ingredients. From Table B.5 it
is observed that the API is most soluble in the DMI with an IAG of 3.09. The IAG of PEG-8
indicates the API is soluble to some extent in the solvent, but it is not in the preferable HSP
distance range for solubility and compatibility. The IAG of ethanol and liquid paraffin indicates
that the API is insoluble (HSP gap > 8) in both solvents.

83
DMI has the smallest ISG indicating that the DMI will readily permeate the skin. PEG-8 and
ethanol have an ISG of 7.16 and 7.1, respectively. Although these values are below eight and
indicate the ingredient is partly soluble in the skin, it does not provide a desirable solubility.
Liquid paraffin has an ISG of 47.62 which indicates it is highly unlikely to penetrate the skin.
From Table B.5 it is clear the single ingredients, except DMI, will not provide sufficient solubility
of the API and will not penetrate the skin. For this reason multiple ingredients are combined to
obtain the desired solubility.
Table B.6 gives a summary of the HSP characteristics of the different formulations.
Figures D.2, D.3 and D.4 are visual 3D representations of the HSP space. This indicates the
Hansen distance between the API, formulation, skin and the different ingredients. The further
the distance, the less soluble the different components are in each other (Abbott, 2012:218).
Table B.6: HSP characteristics of the different atropine formulations
δD δP δH
Mvol (mol/ml)
AFG SFG AFG/ SFG
Atropine optimised gel
Ingredients 17.0 7.3 7.7 215
Ingredients + API 17.0 7.1 7.8 208 3.5 1.9 1.8
Atropine hydrophilic gel
Ingredients 16.5 7.8 11.3 169
Ingredients + API 16.6 7.7 11.2 172 5.3 5.7 0.9
Atropine lipophilic emulgel
Ingredients 16.6 5.5 6.3 314
Ingredients + API 16.7 5.5 6.4 311 3.8 9.5 0.4

84
Figure B.2: 3D HSP of atropine optimised gel (D = general dispersion interactions; P = polar
cohesion energy and H = hydrogen bonding)
Figure B.3: 3D HSP of atropine hydrophilic gel (D = general dispersion interactions; P = polar
cohesion energy and H = hydrogen bonding)
Skin
Formulation
API
Ingredients
Skin
Formulation
API111
Ingredients222
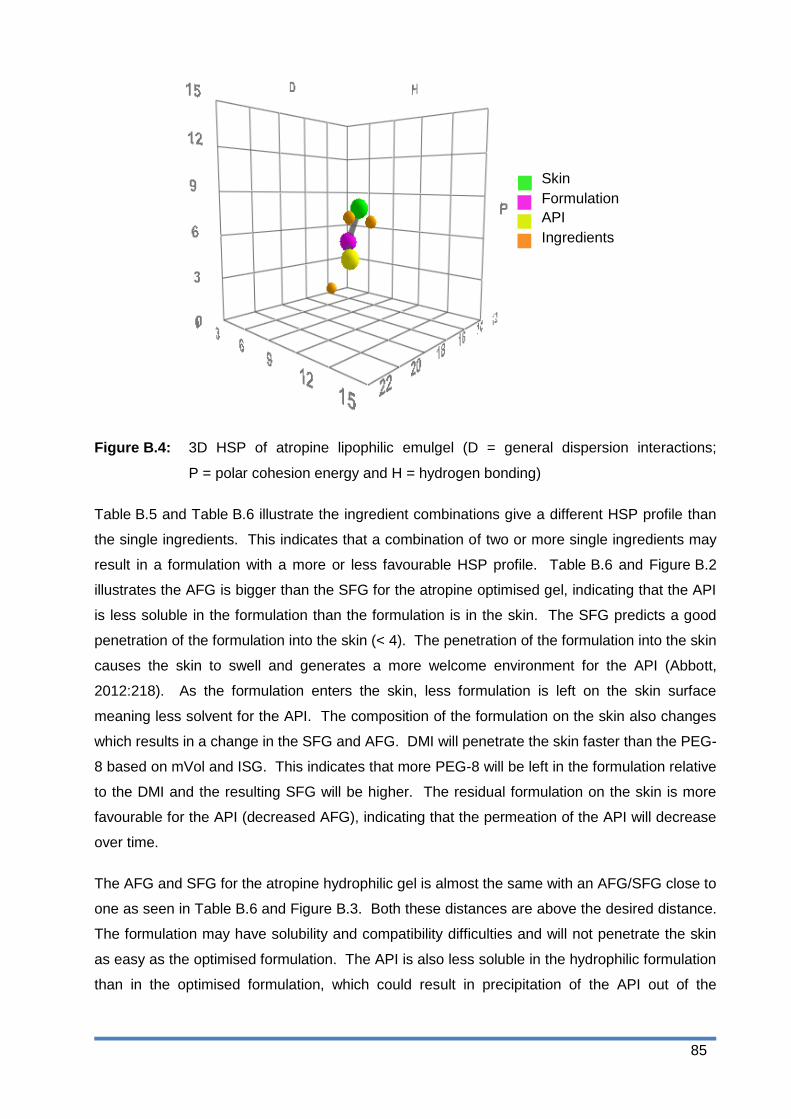
85
Figure B.4: 3D HSP of atropine lipophilic emulgel (D = general dispersion interactions;
P = polar cohesion energy and H = hydrogen bonding)
Table B.5 and Table B.6 illustrate the ingredient combinations give a different HSP profile than
the single ingredients. This indicates that a combination of two or more single ingredients may
result in a formulation with a more or less favourable HSP profile. Table B.6 and Figure B.2
illustrates the AFG is bigger than the SFG for the atropine optimised gel, indicating that the API
is less soluble in the formulation than the formulation is in the skin. The SFG predicts a good
penetration of the formulation into the skin (< 4). The penetration of the formulation into the skin
causes the skin to swell and generates a more welcome environment for the API (Abbott,
2012:218). As the formulation enters the skin, less formulation is left on the skin surface
meaning less solvent for the API. The composition of the formulation on the skin also changes
which results in a change in the SFG and AFG. DMI will penetrate the skin faster than the PEG-
8 based on mVol and ISG. This indicates that more PEG-8 will be left in the formulation relative
to the DMI and the resulting SFG will be higher. The residual formulation on the skin is more
favourable for the API (decreased AFG), indicating that the permeation of the API will decrease
over time.
The AFG and SFG for the atropine hydrophilic gel is almost the same with an AFG/SFG close to
one as seen in Table B.6 and Figure B.3. Both these distances are above the desired distance.
The formulation may have solubility and compatibility difficulties and will not penetrate the skin
as easy as the optimised formulation. The API is also less soluble in the hydrophilic formulation
than in the optimised formulation, which could result in precipitation of the API out of the
Skin
Formulation
API
Ingredients
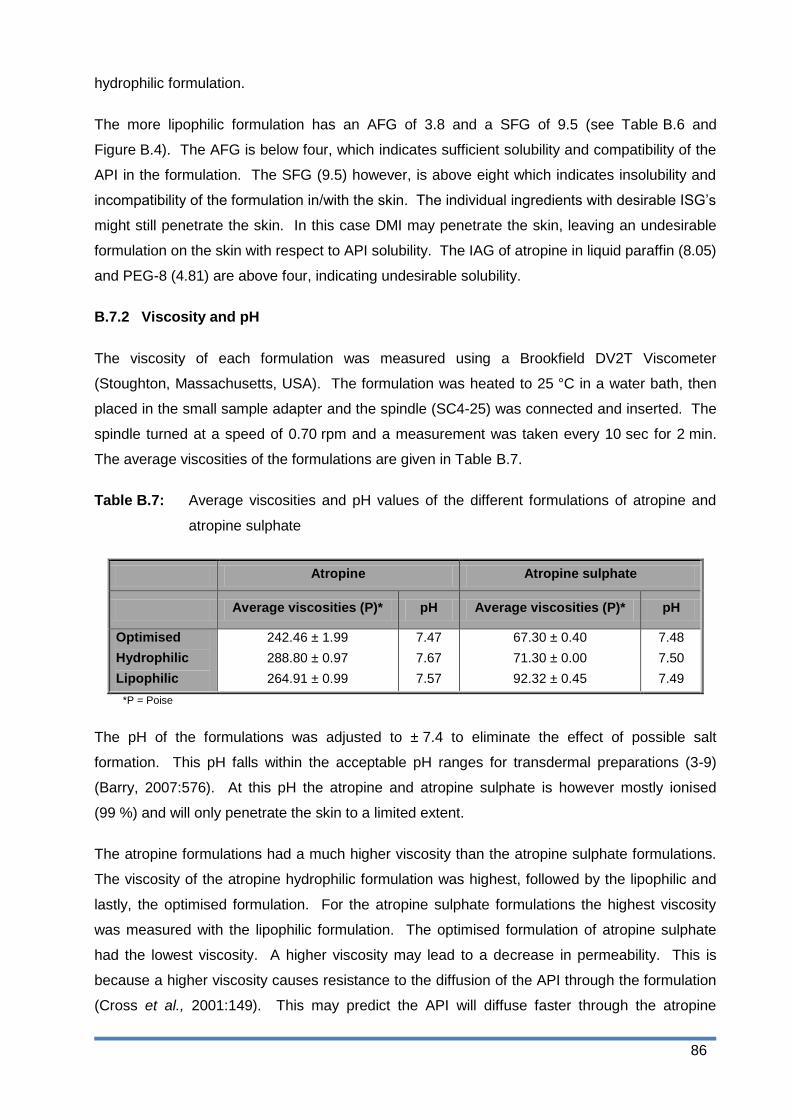
86
hydrophilic formulation.
The more lipophilic formulation has an AFG of 3.8 and a SFG of 9.5 (see Table B.6 and
Figure B.4). The AFG is below four, which indicates sufficient solubility and compatibility of the
API in the formulation. The SFG (9.5) however, is above eight which indicates insolubility and
incompatibility of the formulation in/with the skin. The individual ingredients with desirable ISG‟s
might still penetrate the skin. In this case DMI may penetrate the skin, leaving an undesirable
formulation on the skin with respect to API solubility. The IAG of atropine in liquid paraffin (8.05)
and PEG-8 (4.81) are above four, indicating undesirable solubility.
B.7.2 Viscosity and pH
The viscosity of each formulation was measured using a Brookfield DV2T Viscometer
(Stoughton, Massachusetts, USA). The formulation was heated to 25 °C in a water bath, then
placed in the small sample adapter and the spindle (SC4-25) was connected and inserted. The
spindle turned at a speed of 0.70 rpm and a measurement was taken every 10 sec for 2 min.
The average viscosities of the formulations are given in Table B.7.
Table B.7: Average viscosities and pH values of the different formulations of atropine and
atropine sulphate
Atropine Atropine sulphate
Average viscosities (P)* pH Average viscosities (P)* pH
Optimised
Hydrophilic
Lipophilic
242.46 ± 1.99
288.80 ± 0.97
264.91 ± 0.99
7.47
7.67
7.57
67.30 ± 0.40
71.30 ± 0.00
92.32 ± 0.45
7.48
7.50
7.49
*P = Poise
The pH of the formulations was adjusted to ± 7.4 to eliminate the effect of possible salt
formation. This pH falls within the acceptable pH ranges for transdermal preparations (3-9)
(Barry, 2007:576). At this pH the atropine and atropine sulphate is however mostly ionised
(99 %) and will only penetrate the skin to a limited extent.
The atropine formulations had a much higher viscosity than the atropine sulphate formulations.
The viscosity of the atropine hydrophilic formulation was highest, followed by the lipophilic and
lastly, the optimised formulation. For the atropine sulphate formulations the highest viscosity
was measured with the lipophilic formulation. The optimised formulation of atropine sulphate
had the lowest viscosity. A higher viscosity may lead to a decrease in permeability. This is
because a higher viscosity causes resistance to the diffusion of the API through the formulation
(Cross et al., 2001:149). This may predict the API will diffuse faster through the atropine

87
sulphate formulations than through the atropine formulations, which means the API will reach
the skin surface faster from the atropine sulphate formulations and skin permeation can take
place sooner.
B.7.3 Particle size
A gel consists of a continuous structure and therefore no particle size was determined for the
optimised and hydrophilic gels (Barry, 2007:593). The particle size of the two lipophilic
emulgels was determined using the Malvern Mastersizer 2000 equipped with Hydro 2000SM
wet cell dispersion unit (Malvern Instruments, Worcestershire, UK). The emulgel was dispersed
in deionised water and added to the dispersion unit until an obscuration value between 5 to 10%
was obtained. Two freshly prepared samples per formulation were used and three
measurements were taken from each sample.
Table B.8: Particle size (µm) of the lipophilic emulgels for both atropine and atropine
sulphate
Formulations d(0.1) (µm) d(0.5) (µm) d(0.9) (µm)
Atropine lipophilic 0.51 ± 0.19 1.18 ± 0.07 11.90 ± 1.05
Atropine sulphate lipophilic 3.51 ± 0.00 7.26 ± 0.37 24.38 ± 4.32
Figure B.5: Micrographs of (A) atropine lipophilic emulgel and (B) atropine sulphate lipophilic
emulgel using a Nikon Optiphot light microscope equipped with a Motic Images
Advanced 3.2 camera system
As seen in Table B.8 and Figure B.5 the atropine sulphate emulgel had larger particles than the
atropine emulgel. For the atropine emulgel, 90% of the particles were smaller than
11.90 ± 1.05 µm and 50% of the particles were smaller than 1.18 ± 0.07 µm compared to
24.38 ± 4.32 µm and 7.26 ± 0.37 µm, respectively for the atropine sulphate formulation.
Although the atropine sulphate is more hydrophilic than the atropine base, the IAG indicates
that both the sulphate salt and the base will be dissolved in the gel matrix rather than the
A B

88
droplets (consisting mainly of liquid paraffin). In a study performed by Izquierdo et al. (as cited
by Otto et al., 2009:15) no correlation between the droplet size and dermal/transdermal delivery
was observed.
B.8 Summary
Atropine has a theoretical SDG of 0.001 which indicates it should easily penetrate the skin
(Wiechers, 2012). Three formulations of different polarities were developed using the FFE™
software. A gel optimised towards the skin was developed for atropine. For the more
hydrophilic formulation 10% ethanol and for the more lipophilic formulation 10% liquid paraffin
was added to the optimised formulation. The same formulations for atropine were used to
prepare the atropine sulphate formulations and all the formulations had an acceptable
appearance, viscosity and applied easily.
The formulation characteristics determined were the HSP values and -distances, pH, viscosity,
particle size and zeta-potential. The IAG and ISG of the different ingredients indicated DMI was
the most compatible single ingredient for API solubility and skin permeation and liquid paraffin
was determined to be the least compatible ingredient for skin permeation. Transdermal
formulations however, always consist of multiple ingredients (Abbott, 2012:217). The
combination of different ingredients may yield a formulation with more desirable HSP values and
-distances than the single ingredients (Abbott, 2012:218). The AFG and SFG of the different
formulations indicated the optimised formulations should provide the best transdermal delivery
of the API. The more lipophilic formulation had the highest SFG which indicates the formulation
will permeate the skin to a limited extent. The AFG of the lipophilic formulation indicates the API
will prefer to stay in the formulation rather than penetrate the skin. Both the AFG and the SFG
of the hydrophilic formulation indicated there may be solubility and compatibility problems for the
API in the formulation and the permeation of the formulation into the skin.
To eliminate the salt formation possibility of atropine, the formulation pH was adjusted to ± 7.4.
The atropine formulations had a much higher viscosity than the atropine sulphate formulations.
The higher viscosity may lead to a decrease in the permeation of the API into the skin since
there is a higher resistance to the diffusion of the API through the formulation (Cross et al.,
2001:149). The lower viscosity of the atropine sulphate formulations provides less resistance to
diffusion of the API through the formulation and therefore the permeation from the formulation
may be higher than for the atropine formulation.
The particle size of the atropine lipophilic emulgel was significantly smaller that of atropine
sulphate. There is however no correlation between the droplet size of an emulgel and the
dermal/transdermal delivery of an API (Otto et al., 2009:15). According to the formulation

89
characteristics, the optimised formulations should provide the best transdermal delivery.

90
References
Abbott, S. 2012. An integrated approach to optimizing skin delivery of cosmetic and
pharmaceutical actives. International journal of cosmetic science, 34:217-222.
Barry, B.W. 2007. Transdermal drug delivery (in Aulton, M.E., ed. Pharmaceutics: The design
and manufacture of medicines. 3rd
ed. London: Churchill Livingston, p. 565-597).
Cross, S.E., Jiang, R., Benson, H.A.E. & Roberts, M.S. 2001. Can increasing the viscosity of
formulations be used to reduce the human skin penetration of sunscreen oxybenzone? Journal
of investigative dermatology, 2001(117):147-150.
Hansen, C.M. 2013. HSP examples: skin permeation. http://hansen-solubility.com/Skin.html
Date of access: 15 Sep. 2014.
Hansen, C.M. 2007. Hansen solubility parameters – Biological materials. (In Hansen, C.M.
Hansen solubility parameters – a users handbook. 2nd ed. Boca Raton: CRC Press. P. 269-292.
JW Solutions. 2014. http://www.jwsolutionssoftware.com/content/ffe-in-depth Date of access:
14 Sep. 2014
Kradjan, W.A., Smallridge, R.C., Davis, R. and Verma, P. 1985. Atropine serum concentrations
after multiple inhaled doses of atropine sulphate. Clinical pharmacology & therapeutics,
38:12-14.
Otto, A., Du Plessis, J. & Wiechers, J.W. 2009. Formulation effects of topical emulsions on
transdermal and dermal delivery. International journal of cosmetic science, 31:1-19.
Rehman, K. & Zulfakar, M.H. 2014. Recent advances in gel technologies for topical and
transdermal drug delivery. Drug development and industrial pharmacy, 40(4):433-440.
Walters, K.A. & Brian, K.R. 2002. Dermatological formulation and transdermal
systems. (In Swarbrick, J. ed. Dermatological and transdermal formulations.
New York: Marcel Dekker. p. 319-399).
Wiechers, J.W. 2012. Explaining the importance of the skin delivery gap.
http://www.jwsolutions.com/page/explaining-importance-skin-delivery-gap Date of access: 20
Feb. 2013.

91
Appendix C
Franz cell diffusion studies
C.1 Introduction
The use of Franz diffusion cells is the most common technique for the assessment of skin
permeability (Bartosova & Bajgar, 2012:4673; Ng et al., 2010:210). The skin sample is
mounted between the two compartments of the cell, known as the donor and receptor
compartment. The formulation containing the API is applied in the donor compartment onto the
skin surface (Bartosova & Bajgar, 2012:4673). The receptor phase should have a sufficient
solubilising capacity for the API and should remain in contact with the skin at all times
(Bartosova & Bajgar, 2012:4673). The pH of the receptor phase requires adjustment to
7.4 ± 0.1, which is close to the pH of human skin and the temperature should be kept at
37.0 ± 1 °C, throughout the study (Shah et al., 2013:29).
During this study, three formulations of different polarities were prepared for both atropine and
atropine sulphate. Membrane release studies were performed to determine the release of the
API from these formulations. Subsequent skin diffusion studies were to determine the
transdermal delivery of the API, followed by tape stripping to determine the topical delivery of
the API. The results obtained were compared in order to determine the effect of the formulation
polarity and HSP profile on the transdermal delivery of the API. According to Wiechers‟ theory
the optimised formulation should result in the highest transdermal delivery since the SFG is the
smallest.
C.2 Methods
C.2.1 Formulations preparation
Three formulations of different polarities containing 1.5% API were prepared for both atropine
(A) and atropine sulphate (AS). The FFE™ software was utilised to develop a formulation for
atropine optimised towards the stratum corneum (A-O), a more hydrophilic gel (A-H) and a more
lipophilic emulgel (A-L). The same formulations were used for atropine sulphate (AS-O, AS-H
and AS-L). The optimised formulation was adapted to develop formulations of different
polarities. The more hydrophilic formulation was obtained by adding 10% ethanol to the water
phase of the optimised formulation, whilst 10% liquid paraffin was added to the oil phase to
produce the more lipophilic formulation.
92
Six formulations were prepared (see Appendix B) and all applied easily and had an acceptable
skin feel, except for the hydrophilic formulations which were a little tacky. The optimised and
hydrophilic gels had a uniform and opaque appearance, whilst the lipophilic emulgels were
uniformly white.
A hypothetical SDG was determined using the FFE™ software for atropine, using a serum
concentration of 2 ng/ml obtained from literature (Kradjan et al., 1985). The SDG (0.001)
indicated the API should readily penetrate the skin (Wiechers, 2012).
C.2.2 Phosphate buffer solution (pH 7.4) preparation
Potassium dihydrogen phosphate (6.805 g) and sodium hydroxide (1.5736 g) were weighed and
dissolved in 250 ml and 393.4 ml water, respectively. The solutions were mixed and the pH was
adjusted to 7.4 using NaOH and phosphoric acid (H3PO4) (BP, 2014).
C.2.3 High performance liquid chromatography analysis
The HPLC method for atropine was developed and validated in conjunction with Prof JL du
Preez, from the Analytical Technology Laboratory at the North-West University, Potchefstroom
Campus (see Appendix A). An Agilent HP1100 series HPLC with a pump, autosampler, UV
detector and Chemstation Rev. A.10.03 data acquisition and analysis software were used
(Agilent Technologies, Palo Alto, CA), as well as a Luna C18-2 column (150 x 4.6 mm, 5 µm,
100 Å pores, 17.8% carbon load, end-capped from Phenomenex, Torrance, CA). The mobile
phase consisted of methanol and 0.005 M 1-octane sulphonic acid sodium salt in water (pH was
adjusted to 3.5 with diluted phosphoric acid) in a 58:42 ratio. The flow rate was 1.0 ml/min with
a default injection volume of 50 µl. The UV detector was set at 210 nm for atropine. The
retention time of atropine was ± 5.1 min and the stop time was set at 8.0 min.
C.2.4 Solubility of atropine
Saturated solutions of atropine in PBS (pH 7.4), water and n-octanol, respectively, were
prepared in triplicate by shaking them in a water bath at 32 °C for 24 h. An excessive amount of
atropine was added to ensure the solution remained saturated at all times. The solutions were
then centrifuged, diluted and analysed using HPLC.
C.2.5 n-Octanol/PBS distribution coefficient and n-octanol/water partition coefficient
The log P does not take the degree of ionisation of the API into account, therefore log D is a
more reliable indication of distribution compared to log P (Ashford, 2007:294). PBS (pH 7.4)
and n-octanol were saturated by shaking equal amounts of each and leaving to separate.

93
Atropine (10.84 mg) was dissolved in pre-saturated n-octanol. Equal volumes (3 ml) of both the
atropine/pre-saturated n-octanol and the pre-saturated PBS (pH 7.4) were inserted into a test-
tube and shaken in a water bath for 24 h at 32 °C. The solutions were centrifuged for 10 min at
4500 rpm. The n-octanol phase (2 ml) was diluted with methanol to 10 ml and both solutions
were analysed using HPLC. The log D was calculated using the logarithmic ratio of the atropine
concentration in the n-octanol and the PBS (pH 7.4). The experiment was performed in
triplicate.
The above method was followed to determine the log D for atropine sulphate and also the log P
of both atropine and atropine sulphate (using water instead of PBS (pH 7.4)).
C.2.6 Skin preparation
Caucasian abdominal skin was obtained after abdominoplastic surgery, with informed consent
of the donors. Ethical approval was obtained from the Ethics Committee of the North-West
University, Potchefstroom (Ethics number: NWU-00114-11-A5). An electric dermatome
(Zimmer Inc.) was used to remove split thickness skin (400 µm) containing stratum corneum,
viable epidermis and upper dermis. The dermatomed skin sample was placed on Whatman®
filter paper with the stratum corneum facing upwards and wrapped in aluminium foil. The skin
samples were frozen at -20 °C until used. Prior to the skin diffusion study, the skin samples
were thawed and cut into circles with a diameter of approximately 12 mm.
C.2.7 Diffusion studies
Ten vertical Franz type diffusion cells, with a receptor capacity of ± 2 ml and a diffusion area of
1.075 cm2 were used for each study. A small magnetic stirring bar was placed in the receptor
compartment of the cell to maintain stirring throughout the experiment. The membrane/skin
samples (stratum corneum facing upwards) were mounted between the donor and receptor
compartments. The cells were sealed using Dow Corning® high vacuum grease and secured
with a horseshoe clamp. The receptor compartment was filled with 2 ml of the receptor phase
(PBS (pH 7.4) and methanol (1:1, v/v)) pre-heated to 37 °C, whilst ensuring no air bubbles were
formed. The donor compartment was filled with 1 ml of the semi-solid formulation (pre-heated
to 32 °C) and covered with Parafilm® to prevent evaporation. The study was performed on a
magnetic stirrer in a water bath kept at 37 ± 1 °C. The entire receptor phase content was
extracted on predetermined time intervals and replaced with 2 ml fresh receptor phase pre-
heated to 37 °C. The extracted receptor phase was then injected in the HPLC vials and placed
in the HPLC for analysis.
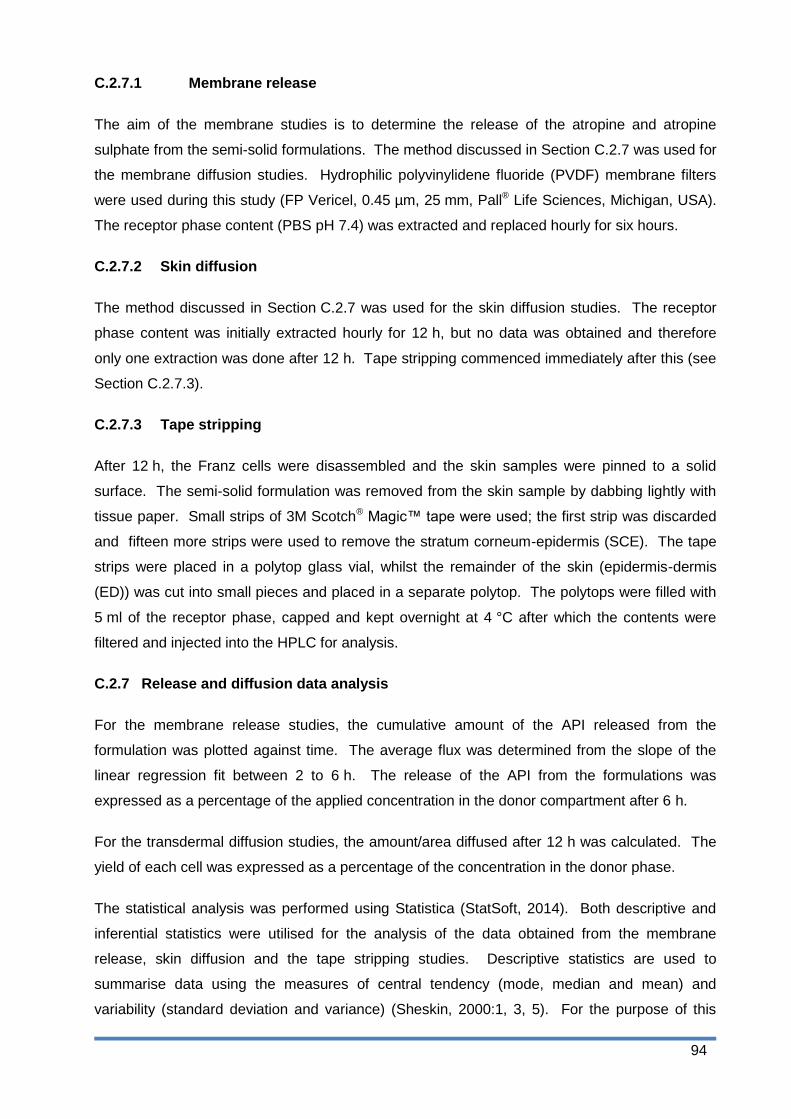
94
C.2.7.1 Membrane release
The aim of the membrane studies is to determine the release of the atropine and atropine
sulphate from the semi-solid formulations. The method discussed in Section C.2.7 was used for
the membrane diffusion studies. Hydrophilic polyvinylidene fluoride (PVDF) membrane filters
were used during this study (FP Vericel, 0.45 µm, 25 mm, Pall® Life Sciences, Michigan, USA).
The receptor phase content (PBS pH 7.4) was extracted and replaced hourly for six hours.
C.2.7.2 Skin diffusion
The method discussed in Section C.2.7 was used for the skin diffusion studies. The receptor
phase content was initially extracted hourly for 12 h, but no data was obtained and therefore
only one extraction was done after 12 h. Tape stripping commenced immediately after this (see
Section C.2.7.3).
C.2.7.3 Tape stripping
After 12 h, the Franz cells were disassembled and the skin samples were pinned to a solid
surface. The semi-solid formulation was removed from the skin sample by dabbing lightly with
tissue paper. Small strips of 3M Scotch® Magic™ tape were used; the first strip was discarded
and fifteen more strips were used to remove the stratum corneum-epidermis (SCE). The tape
strips were placed in a polytop glass vial, whilst the remainder of the skin (epidermis-dermis
(ED)) was cut into small pieces and placed in a separate polytop. The polytops were filled with
5 ml of the receptor phase, capped and kept overnight at 4 °C after which the contents were
filtered and injected into the HPLC for analysis.
C.2.7 Release and diffusion data analysis
For the membrane release studies, the cumulative amount of the API released from the
formulation was plotted against time. The average flux was determined from the slope of the
linear regression fit between 2 to 6 h. The release of the API from the formulations was
expressed as a percentage of the applied concentration in the donor compartment after 6 h.
For the transdermal diffusion studies, the amount/area diffused after 12 h was calculated. The
yield of each cell was expressed as a percentage of the concentration in the donor phase.
The statistical analysis was performed using Statistica (StatSoft, 2014). Both descriptive and
inferential statistics were utilised for the analysis of the data obtained from the membrane
release, skin diffusion and the tape stripping studies. Descriptive statistics are used to
summarise data using the measures of central tendency (mode, median and mean) and
variability (standard deviation and variance) (Sheskin, 2000:1, 3, 5). For the purpose of this
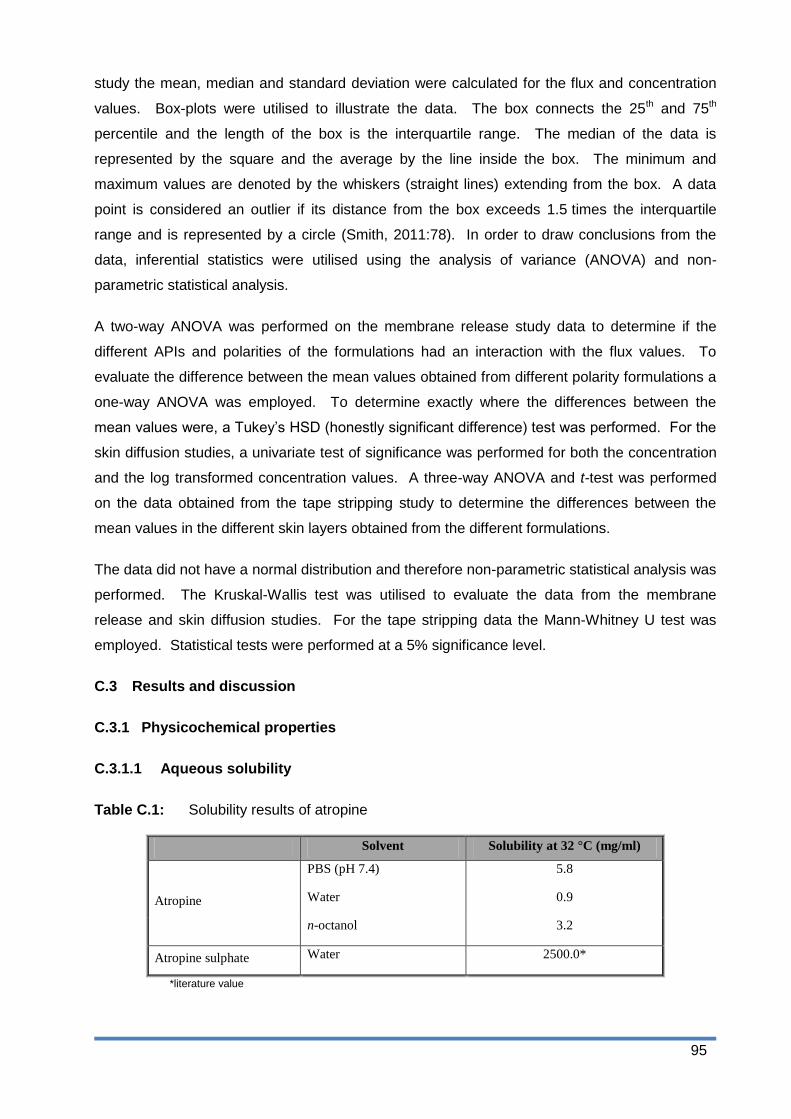
95
study the mean, median and standard deviation were calculated for the flux and concentration
values. Box-plots were utilised to illustrate the data. The box connects the 25th and 75th
percentile and the length of the box is the interquartile range. The median of the data is
represented by the square and the average by the line inside the box. The minimum and
maximum values are denoted by the whiskers (straight lines) extending from the box. A data
point is considered an outlier if its distance from the box exceeds 1.5 times the interquartile
range and is represented by a circle (Smith, 2011:78). In order to draw conclusions from the
data, inferential statistics were utilised using the analysis of variance (ANOVA) and non-
parametric statistical analysis.
A two-way ANOVA was performed on the membrane release study data to determine if the
different APIs and polarities of the formulations had an interaction with the flux values. To
evaluate the difference between the mean values obtained from different polarity formulations a
one-way ANOVA was employed. To determine exactly where the differences between the
mean values were, a Tukey‟s HSD (honestly significant difference) test was performed. For the
skin diffusion studies, a univariate test of significance was performed for both the concentration
and the log transformed concentration values. A three-way ANOVA and t-test was performed
on the data obtained from the tape stripping study to determine the differences between the
mean values in the different skin layers obtained from the different formulations.
The data did not have a normal distribution and therefore non-parametric statistical analysis was
performed. The Kruskal-Wallis test was utilised to evaluate the data from the membrane
release and skin diffusion studies. For the tape stripping data the Mann-Whitney U test was
employed. Statistical tests were performed at a 5% significance level.
C.3 Results and discussion
C.3.1 Physicochemical properties
C.3.1.1 Aqueous solubility
Table C.1: Solubility results of atropine
Solvent Solubility at 32 °C (mg/ml)
Atropine
PBS (pH 7.4) 5.8
Water 0.9
n-octanol 3.2
Atropine sulphate Water 2500.0*
*literature value
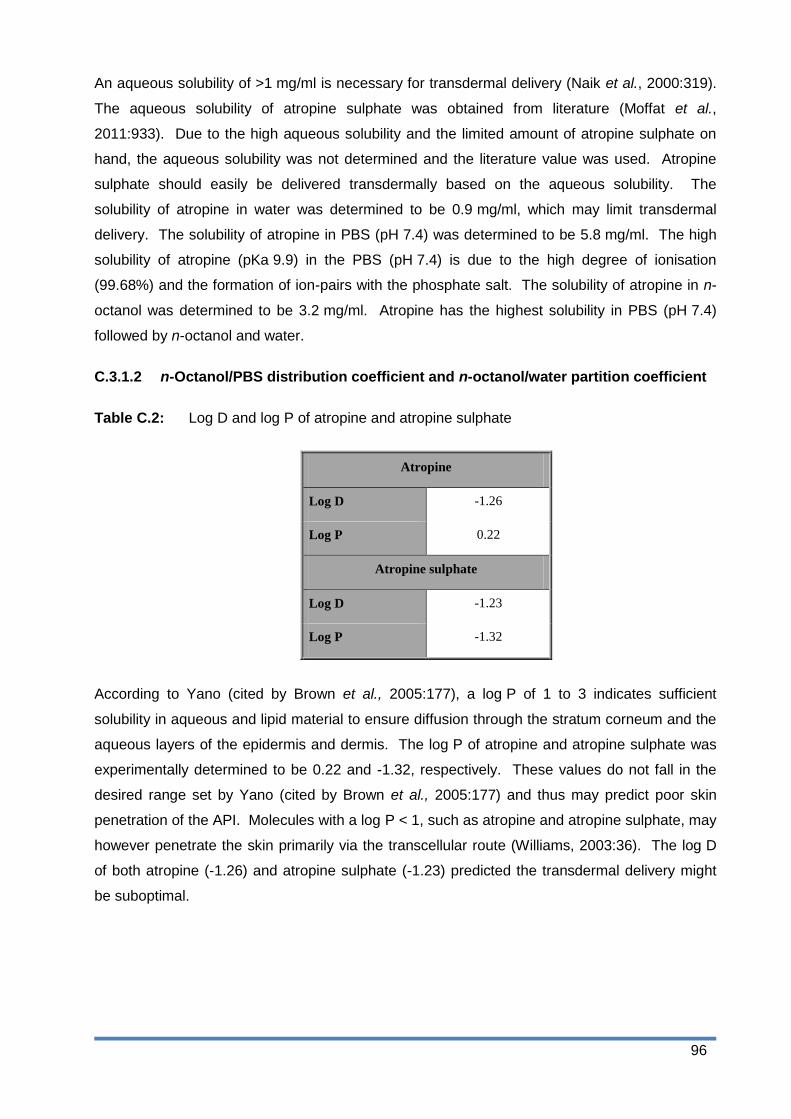
96
An aqueous solubility of >1 mg/ml is necessary for transdermal delivery (Naik et al., 2000:319).
The aqueous solubility of atropine sulphate was obtained from literature (Moffat et al.,
2011:933). Due to the high aqueous solubility and the limited amount of atropine sulphate on
hand, the aqueous solubility was not determined and the literature value was used. Atropine
sulphate should easily be delivered transdermally based on the aqueous solubility. The
solubility of atropine in water was determined to be 0.9 mg/ml, which may limit transdermal
delivery. The solubility of atropine in PBS (pH 7.4) was determined to be 5.8 mg/ml. The high
solubility of atropine (pKa 9.9) in the PBS (pH 7.4) is due to the high degree of ionisation
(99.68%) and the formation of ion-pairs with the phosphate salt. The solubility of atropine in n-
octanol was determined to be 3.2 mg/ml. Atropine has the highest solubility in PBS (pH 7.4)
followed by n-octanol and water.
C.3.1.2 n-Octanol/PBS distribution coefficient and n-octanol/water partition coefficient
Table C.2: Log D and log P of atropine and atropine sulphate
Atropine
Log D -1.26
Log P 0.22
Atropine sulphate
Log D -1.23
Log P -1.32
According to Yano (cited by Brown et al., 2005:177), a log P of 1 to 3 indicates sufficient
solubility in aqueous and lipid material to ensure diffusion through the stratum corneum and the
aqueous layers of the epidermis and dermis. The log P of atropine and atropine sulphate was
experimentally determined to be 0.22 and -1.32, respectively. These values do not fall in the
desired range set by Yano (cited by Brown et al., 2005:177) and thus may predict poor skin
penetration of the API. Molecules with a log P < 1, such as atropine and atropine sulphate, may
however penetrate the skin primarily via the transcellular route (Williams, 2003:36). The log D
of both atropine (-1.26) and atropine sulphate (-1.23) predicted the transdermal delivery might
be suboptimal.

97
C.3.2 Membrane release studies
Formulations containing 0.5% API were used during the membrane release studies, with the
results illustrated in Table C.3.
Table C.3: The average and median flux (µg/cm2.h), as well as average and median
percentage atropine and atropine sulphate released from the formulations with
different polarities through membranes after 6 h
Formulations Average flux
(µg/cm².h) Median flux (µg/cm².h)
Average percentage released (%)
Median percentage released (%)
A-H 153.60 ± 16.77 155.06 13.77 ± 1.33 13.93
A-O 160.94 ± 45.00 136.74 13.58 ± 1.84 13.16
A-L 128.87 ± 18.85 129.91 12.31 ± 1.25 12.58
AS-H 118.76 ± 2.21 117.76 9.48 ± 0.47 11.05
AS-O 154.63 ± 17.88 150.29 13.06 ± 0.64 13.12
AS-L 106.90 ± 17.38 115.99 10.56 ± 1.40 11.07
Figure C.1: Flux (µg/cm2.h) of atropine and atropine sulphate from the different formulations
in the membrane release studies after 6 h. The average and median
concentration values are indicated by the lines and squares, respectively (AS-O:
n = 10; A-O, A-L, AS-L: n = 9; A-H, AS-H: n = 8).
Flux (A) Flux (AS) Outliers (A) Outliers (AS) Extremes (A) Extremes (AS)
260
240
220
200
180
160
140
120
100
80
60
Flu
x (
µg/c
m2.h
)
H Formulations
O L

98
The results confirmed the API was released from the semi-solid formulations sufficiently enough
to be available for transdermal delivery. A comparison of the release of the API from the
formulation between the different formulations of A and AS, showed no pattern. The mean or
average is calculated by adding all the data values and dividing it by the number of observations
(Smith, 2012:73). The median is the middle value of a set of data arranged from highest to
lowest or vice versa. The median indicates that half of the observations are bigger or smaller
than that specific value (Smith, 2012:75). The median is more resistant to outliers than the
average and thus a more reliable representation of data (Smith, 2012:76). Outliers were
observed in the data and therefore the median is used to describe the data. The biggest
differences between the average and median flux values were observed with A-O and AS-L.
For the atropine formulations, A-H had the highest median flux (155.06 µg/cm2.h) followed by
A-O (136.74 µg/cm2.h) and A-L (129.91 µg/cm2.h). The highest median flux for the atropine
sulphate formulations was observed with AS-O (150.29 µg/cm2.h) followed by AS-H
(117.76 µg/cm2.h) and AS-L (115.99 µg/cm2.h).
A-H had the highest (13.93%) and AS-H the lowest (11.05%) median percentage released of all
six formulations. The reduced solubility of the lipophilic atropine in the hydrophilic formulation
provides a driving force for atropine to leave the formulation, whilst being a desirable
environment for the hydrophilic atropine sulphate (Otto et al., 2009:9). The three formulations
containing atropine only had minor differences in the median percentage released after 6 h with
A-H having the highest median percentage (13.93%) followed by A-O (13.16%). A-L had the
lowest median percentage released (12.58%) after 6 h. The lipophilic atropine has a high
affinity for the lipophilic emulgel and would therefore prefer to stay in the formulation, resulting in
poor release. For the atropine sulphate formulations there were more variation than for the
atropine formulations. The highest median percentage released was obtained with the AS-O
(13.12%), followed by AS-L (11.07%) and AS-H (11.05%). The median percentage release for
AS-H and AS-L did not differ significantly. AS-L is an emulgel consisting of lipophilic droplets
dispersed in a hydrophilic continuous phase. The hydrophilic atropine sulphate has a high
affinity for the continuous phase and it will therefore prefer to stay in the formulation.
When comparing the atropine and the atropine sulphate formulations of the same polarity, a
higher median percentage release was observed from the atropine formulations than from the
atropine sulphate formulations. This indicates the API base has a higher release than the API
sulphate salt form.
C.3.3 Skin diffusion studies
Diffusion studies were done with formulations containing 0.5% API. The transdermal delivery
was very poor and in some cases no data was obtained. The explanation for the results was an

99
insignificant concentration gradient to provide a driving force. The API concentration was
increased to 1.5% and the diffusion studies repeated. Table C.4 presents the results obtained
from the diffusion study.
Table C.4: Data obtained from skin diffusion studies
Formulations Average amount per area diffused
(µg/cm²)
Median amount per
area diffused (µg/cm²)
Average percentage diffused (%)
Median percentage
diffused (%)
A-H 4.500 ± 2.450 4.50 0.018 ± 0.010 0.015
A-O 10.886 ± 4.436 10.40 0.039 ± 0.020 0.037
A-L 65.695 ± 81.723 18.04 0.236 ± 0.290 0.065
AS-H 2.982 ± 1.906 2.78 0.011 ± 0.010 0.010
AS-O 7.722 ± 2.972 6.66 0.028 ± 0.010 0.024
AS-L 122.800 ± 181.698 17.60 0.440 ± 0.650 0.063
Figure C.2: The amount of atropine per area (µg/cm2) for A-O gel which diffused through the
skin after 12 h (n = 9)

100
Figure C.3: The amount of atropine per area (µg/cm2) for A-H gel which diffused through the
skin after 12 h (n = 8)
Figure C.4: The amount of atropine per area (µg/cm2) for A-L gel which diffused through the
skin after 12 h (n = 9)
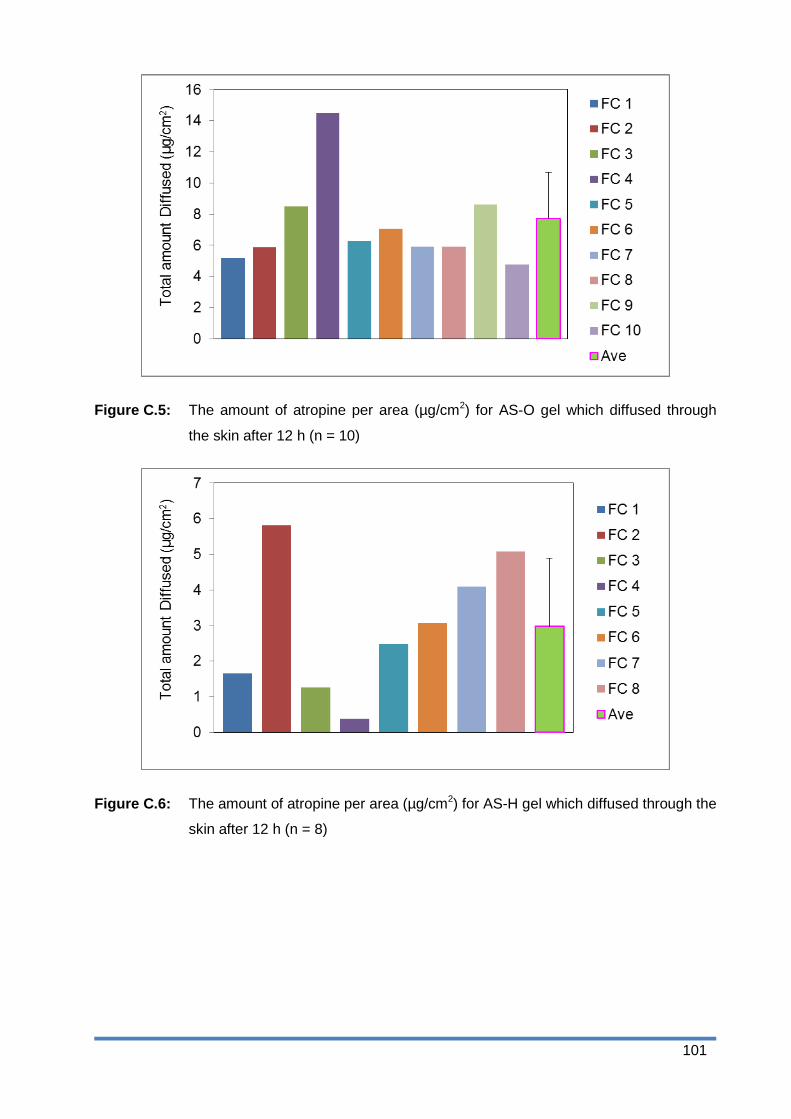
101
Figure C.5: The amount of atropine per area (µg/cm2) for AS-O gel which diffused through
the skin after 12 h (n = 10)
Figure C.6: The amount of atropine per area (µg/cm2) for AS-H gel which diffused through the
skin after 12 h (n = 8)

102
Figure C.7: The amount of atropine per area (µg/cm2) for AS-L gel which diffused through the
skin after 12 h (n = 9)
Figure C.8: Amount per area (µg/cm2) of atropine and atropine sulphate which diffused
through the skin from the different formulations. The average and median
concentration values are indicated by the lines and squares, respectively (AS-O:
n = 10; A-O, A-L, AS-L: n = 9; A-H, AS-H: n = 8).
Flux (A) Flux (AS) Outliers (A) Outliers (AS) Extremes (A) Extremes (AS)
260
240
220
200
180
160
140
120
100
80
60
H Formulations
O L
Am
oun
t p
er
are
a
(µg
/cm
2)
600
500
400
300
200
100
0
-100
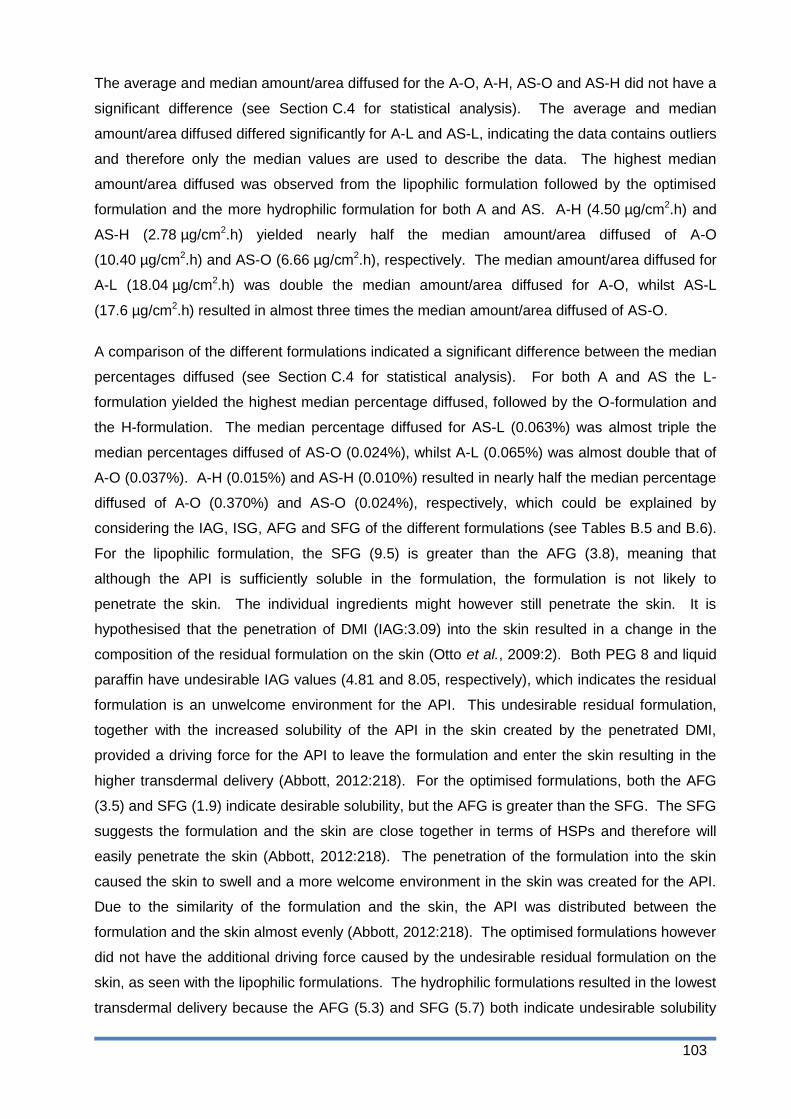
103
The average and median amount/area diffused for the A-O, A-H, AS-O and AS-H did not have a
significant difference (see Section C.4 for statistical analysis). The average and median
amount/area diffused differed significantly for A-L and AS-L, indicating the data contains outliers
and therefore only the median values are used to describe the data. The highest median
amount/area diffused was observed from the lipophilic formulation followed by the optimised
formulation and the more hydrophilic formulation for both A and AS. A-H (4.50 µg/cm2.h) and
AS-H (2.78 µg/cm2.h) yielded nearly half the median amount/area diffused of A-O
(10.40 µg/cm2.h) and AS-O (6.66 µg/cm2.h), respectively. The median amount/area diffused for
A-L (18.04 µg/cm2.h) was double the median amount/area diffused for A-O, whilst AS-L
(17.6 µg/cm2.h) resulted in almost three times the median amount/area diffused of AS-O.
A comparison of the different formulations indicated a significant difference between the median
percentages diffused (see Section C.4 for statistical analysis). For both A and AS the L-
formulation yielded the highest median percentage diffused, followed by the O-formulation and
the H-formulation. The median percentage diffused for AS-L (0.063%) was almost triple the
median percentages diffused of AS-O (0.024%), whilst A-L (0.065%) was almost double that of
A-O (0.037%). A-H (0.015%) and AS-H (0.010%) resulted in nearly half the median percentage
diffused of A-O (0.370%) and AS-O (0.024%), respectively, which could be explained by
considering the IAG, ISG, AFG and SFG of the different formulations (see Tables B.5 and B.6).
For the lipophilic formulation, the SFG (9.5) is greater than the AFG (3.8), meaning that
although the API is sufficiently soluble in the formulation, the formulation is not likely to
penetrate the skin. The individual ingredients might however still penetrate the skin. It is
hypothesised that the penetration of DMI (IAG:3.09) into the skin resulted in a change in the
composition of the residual formulation on the skin (Otto et al., 2009:2). Both PEG 8 and liquid
paraffin have undesirable IAG values (4.81 and 8.05, respectively), which indicates the residual
formulation is an unwelcome environment for the API. This undesirable residual formulation,
together with the increased solubility of the API in the skin created by the penetrated DMI,
provided a driving force for the API to leave the formulation and enter the skin resulting in the
higher transdermal delivery (Abbott, 2012:218). For the optimised formulations, both the AFG
(3.5) and SFG (1.9) indicate desirable solubility, but the AFG is greater than the SFG. The SFG
suggests the formulation and the skin are close together in terms of HSPs and therefore will
easily penetrate the skin (Abbott, 2012:218). The penetration of the formulation into the skin
caused the skin to swell and a more welcome environment in the skin was created for the API.
Due to the similarity of the formulation and the skin, the API was distributed between the
formulation and the skin almost evenly (Abbott, 2012:218). The optimised formulations however
did not have the additional driving force caused by the undesirable residual formulation on the
skin, as seen with the lipophilic formulations. The hydrophilic formulations resulted in the lowest
transdermal delivery because the AFG (5.3) and SFG (5.7) both indicate undesirable solubility

104
(AFG > 4 and SFG > 4) and consequently low skin permeation (Abbott, 2012:221).
When comparing the formulations of A and AS with each other, A yielded a higher median
amount/area diffused and median percentage diffused than AS for all three formulations. The
biggest difference in the median amount/area diffused between A and AS was observed with
the H and O formulations. A-H (0.015%) and A-O (0.370%) yielded almost double the median
amount/area diffused of AS-H (0.100%) and AS-O (0.240%), respectively, whilst the values for
A-L (0.065%) and AS-L (0.063%) were practically the same. This observation can be explained
by the log P values of A and AS. A gel is typically a polar formulation (H and O) and therefore
the more hydrophilic AS (log P = -1.31) would prefer to stay in the formulation, whilst the more
lipophilic A (log P = 0.22) would prefer to leave the formulation (Barry, 2007:593).
C.3.4 Tape stripping
Table C5: Data obtained from tape stripping
Formulations Average
concentration in SCE (µg/ml)
Median concentration in SCE (µg/ml)
Average concentration in ED (µg/ml)
Median concentration in ED (µg/ml)
A-H 0.23 ± 0.06 0.21 1.03 ± 1.40 0.55
A-O 0.39 ± 0.63 0.00 0.00 ± 0.00 0.00
A-L 0.00 ± 0.00 0.00 0.51 ± 0.17 0.48
AS-H 0.29 ± 0.10 0.29 0.59 ± 0.22 0.55
AS-O 0.00 ± 0.00 0.00 0.00 ± 0.00 0.00
AS-L 0.00 ± 0.00 0.00 0.97 ± 0.84 0.52
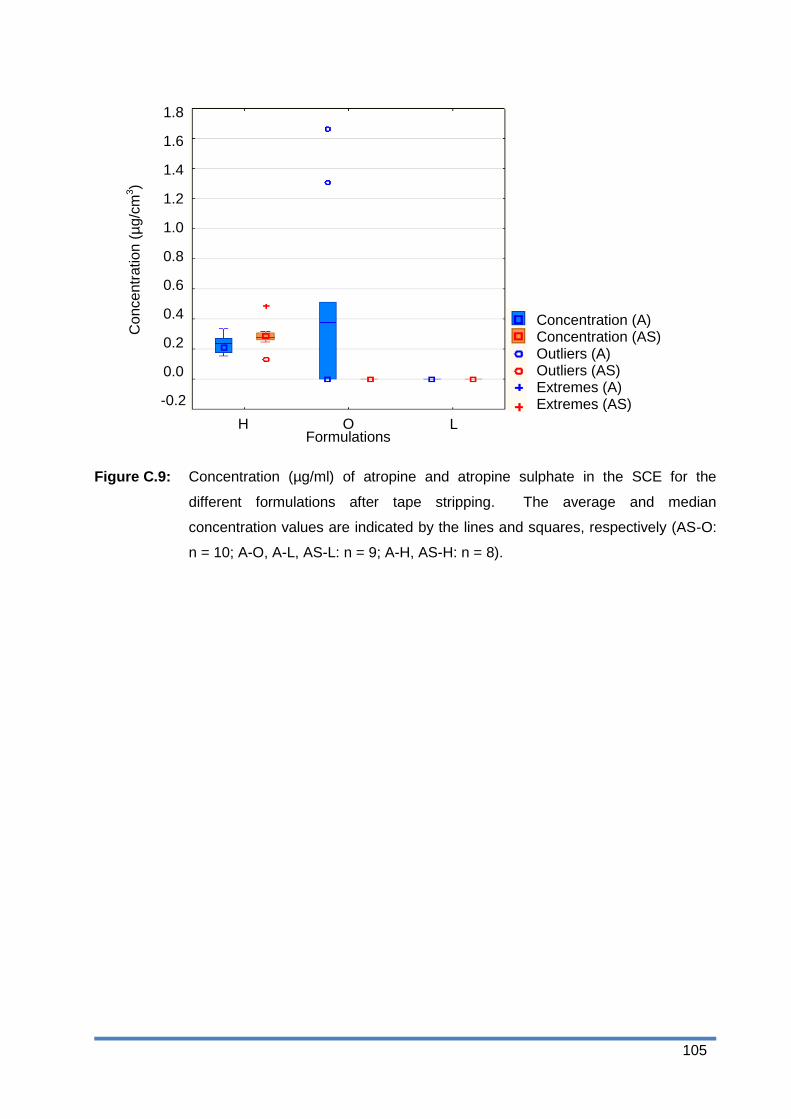
105
Figure C.9: Concentration (µg/ml) of atropine and atropine sulphate in the SCE for the
different formulations after tape stripping. The average and median
concentration values are indicated by the lines and squares, respectively (AS-O:
n = 10; A-O, A-L, AS-L: n = 9; A-H, AS-H: n = 8).
Flux (A) Flux (AS) Outliers Outliers Extremes Extremes
260
240
220
200
180
160
140
120
100
80
60
Co
nce
ntr
atio
n (
µg/c
m3)
H Formulations
O L
600
500
400
300
200
100
0
-100
Concentration (A) Concentration (AS) Outliers (A) Outliers (AS) Extremes (A) Extremes (AS)
1.8
1.6
1.4
1.2
1.0
0.8
0.6
0.4
0.2
0.0
-0.2

106
Figure C.10: Boxplots illustrating the concentration (µg/ml) of atropine and atropine sulphate in
the ED for the different formulations after tape stripping. The average and
median concentration values are indicated by the lines and squares,
respectively(AS-O: n = 10; A-O, A-L, AS-L: n = 9; A-H, AS-H: n = 8).
The differences in the average and median values indicated there were outliers in the data and
therefore only the median values will be discussed. The median concentration of the API was
higher in the ED than in the SCE, except for A-O and AS-O, for which no API was observed in
the SCE or ED. No amount of API was observed in the SCE from the lipophilic formulations.
The hydrophilic formulations had the highest concentration in both the SCE (A-H: 0.21 µg/ml
and AS-H: 0.29 µg/ml) and the ED (A-H: 0.55 µg/ml and AS-H: 0.55 µg/ml), followed by the
lipophilic formulations in the ED (A-L: 0.48 µg/ml and AS-L: 0.52 µg/ml). AS-H yielded a slightly
higher median concentration in the SCE compared to A-H. The highest median concentration in
the ED was obtained from A-H and AS-H, followed by AS-L and A-L. More API is obtained in
the ED compared to the SCE, which is contrary to what was expected since the ED is
essentially aqueous and atropine would therefore rather stay in the more lipophilic SC.
C.4 Statistical analysis
C.4.1 Membrane release studies
The data for A and AS were separately analysed by means of one-way analyses of variance
(ANOVA) to compare H, L and O, followed by Tukey‟s studentised range HSD (honestly
Flux (A) Flux (AS) Outliers Outliers Extremes Extremes
260
240
220
200
180
160
140
120
100
80
60
Co
nce
ntr
atio
n (
µg/c
m3)
H Formulations
O L
600
500
400
300
200
100
0
-100
Concentration (A) Concentration (AS) Outliers (A) Outliers (AS) Extremes (A) Extremes (AS)
5.0
4.5
4.0
3.5
3.0
2.5
2.0
1.5
1.0
0.5
0.0
-0.5
5.0
4.5
3.5
3.0
2.5
2.0
1.5
1.0
0.5
0.0
-0.5
107
significant difference) tests. Significant differences were observed, but due to the non-normality
of the data subsequently non-parametric analyses were done using Kruskal-Wallis tests,
followed by multiple comparisons between H, L and O. The test indicated there was a
significant difference between A-H and A-L (p = 0.039), between AS-O and AS-H (p = 0.018),
as well as between AS-O and AS-L (p < 0.001).
C.4.2 Skin diffusion studies
The univariate ANOVA test was used to analyse the amount/area diffused and the
log amount/area diffused. Since, non-normality was encountered for both, it was decided to
resort to non-parametric statistics using the Kruskal-Wallis test, followed by multiple
comparisons. These analyses indicated significant differences between A-O and A-H
(p = 0.032), as well as between AS-H and AS-L (p = 0.005).
C.4.3 Tape stripping
The Mann-Whitney U test indicated a significant difference (p = 0.0256) between A-O and AS-O
in the SCE, but since there was no value for AS-O in the SCE it is regarded as insignificant. No
significant difference was observed between A-H and AS-H in both the SCE (p = 0.1035) and
the ED (p = 0.9581,) or between A-L and AS-L in the ED (p = 0.2703). The p-value for A-O and
AS-O in the ED and A-L and AS-l in the SCE could not be calculated since no concentration of
the API in respective skin layers was observed.
C.5 Conclusion
The aqueous solubility of atropine (0.9 mg/ml) and the log D of atropine and atropine sulphate
(-1.26 and -1.23, respectively) indicated transdermal delivery may be suboptimal (Brown et al.,
2005:177; Naik et al., 2000:319). The high degree of ionisation (99.68%) of the API also
predicted poor delivery.
The release of the API from the formulation was confirmed during the membrane release
studies. The highest median percentage released was observed from A-H, while AS-H had the
lowest median percentage released after 6 h. The H-formulation provides a desirable
environment for the AS and it would therefore prefer to stay in the formulation. The more
lipophilic A has a low affinity for the H-formulation resulting in a higher driving force and
consequently a high release (Otto et al., 2009:9). When comparing the median percentage
released from the atropine formulations (A-H (13.93%), A-O (13.16%) and A-L (12.58%)) to the
atropine sulphate formulations (AS-H (11.05%), AS-O (13.12%) and AS-L (11.07%)), the
indication was that the API base provides a better release than the sulphate salt.

108
The skin diffusion studies indicated that, for both atropine and atropine sulphate respectively,
the lipophilic formulations (0.063% and 0.065%) had the highest percentage transdermal
delivery followed by the optimised (0.037% and 0.023%) and the hydrophilic (0.015% and
0.010%) formulations. The SFG of the lipophilic formulation is higher than the AFG, which
indicates the API is sufficiently soluble in the formulation, but the formulation is not likely to
penetrate the skin (Abbott, 2012:218). Some of the ingredients in the lipophilic formulation
penetrated the skin faster than others (like DMI) and resulted in a change in the composition of
the formulation over time (Abbott, 2012:221; Otto et al., 2009:2). The undesirable residual
formulation provided a driving force for the API to enter the skin and a more desirable
environment in the skin, created by the penetrating DMI, resulted in a high transdermal delivery.
The atropine formulations resulted in a higher median percentage diffused compared to the
atropine sulphate formulations of the same polarity. This indicated a higher release from the
formulations resulted in a higher transdermal delivery, since more API is on the skin surface and
available for penetration.
The highest concentration in the skin was observed with A-H and AS-H. A-H and AS-H had the
lowest driving force for the API to leave the formulation based on the HSP profile and the
penetration of the API was only driven by the concentration gradient over the skin, indicating the
API penetrated the skin slower from the H-formulations compared to the O- and L-formulations.
After 12 h, the API had not fully traversed through the skin and high concentrations were
observed in the skin compared to the poor transdermal delivery, indicating the added driving
force provided by the HSP profile (as seen with the O- and L-formulations) increases the
penetration of the API through the skin.
The O-formulations were optimised towards the skin and it was expected that high
concentrations of the API would be obtained in the skin from these formulations, but no API was
observed. The reason for this may be due to fast initial penetration of the API and as the
concentration gradient decreases so does the skin penetration. After 12 h the concentration
gradient may be too low to provide a driving force for penetration and the amount of API in the
skin may be below the LOD of the analytical method. The lipophilic formulations had the
highest driving force to leave the formulation and permeate the skin based on the HSP profile.
The high driving force forced the API into the SC where it diffused to the ED. The high
transdermal delivery from the L-formulations indicates that most of the API fully traversed
through the SC, into and through the ED.
For both A-H and AS-H, the concentration in the ED (0.55 µg/ml for both) was higher than in the
SCE (0.21 µg/ml and 0.29 µg/ml, respectively). A-L and AS-L also had a higher concentration
in the ED (0.48 µg/ml and 0.52 µg/ml) than in the SCE (no concentration for both). This

109
indicates the API penetrated the skin deeper than the superficial layers of the skin and will be
available for systemic absorption. The amount of API which diffused through the skin was
considerably higher than the concentrations in the skin for A-O, AS-O, A-L and AS-L, which
indicates deeper penetration and essentially systemic delivery.
In conclusion, the HSP profile of a formulation has a definite effect on the delivery of the API.
Wiechers states that a formulation optimised towards the SC with a small SFG should result in
the highest transdermal delivery of an API. According to Abbott (2012:218), a good balance is
needed between the AFG and SFG to ensure sufficient penetration of the API through the skin
by generating a driving force and by increasing the solubility of the API in the skin as the
formulation penetrates. It was observed that a higher SFG, compared to AFG, resulted in a
higher transdermal delivery of the API. It is important to note that the HSP profile of the
formulation changes as some ingredients penetrate the skin faster than others and therefore
one cannot only use the HSP profile of the formulation when predicting the transdermal delivery
of an API. The HSP profile of individual ingredients and the API should also be considered
when developing a formulation optimised for transdermal delivery; smaller ingredients with a
small ISG will penetrate faster than ingredients with a larger ISG and mVol, and it is therefore
important to consider the composition change and resulting change in the HSP profile when
developing a formulation. When the smaller ingredient also has a small IAG (such as DMI), the
penetration of the ingredient into the skin will generate a welcome environment for the API and
it will be encouraged to enter the skin. If the remaining ingredients have larger IAGs, there will
be an additional driving force for the API to leave the formulation caused by the insolubility of
the API in the residual formulation. The lipophilic formulation resulted in the highest transdermal
delivery compared to the optimised and more hydrophilic formulations. When comparing the
transdermal delivery of the atropine with the atropine sulphate, it can be concluded that the
base API provides better transdermal delivery than the salt form.
It can therefore be concluded that the polarity of the formulation affects the transdermal delivery
of an API, but it is important to consider the total HSP profile and molar volume of the API and
the ingredients to predict the transdermal delivery of an API, rather than just the SFG or AFG.
The results indicated the sulphate salt of API reduced the transdermal delivery of the API,
therefore it is better to use the API base instead of the salt form. The salt form of an organic
compound has a higher HSP indicating it is more soluble in water and less soluble in polymers
like the human skin and therefore poor transdermal results are obtained from the atropine
sulphate formulations. The results obtained in this study supported the Delivery Gap Principle
of Wiechers, since effective transdermal delivery was obtained with an API with a SDG < 1
(Wiechers, 2012).
110
References
Ashford, M. 2007. Bioavailability-physicochemical and dosage form factors. (in Aulton, M.E.,
ed. Pharmaceutics: the design and manufacture of medicines. 3rd ed. London: Churchill
Livingstone Elsevier. p. 286-303.
Barry, B.W. 2007. Transdermal drug delivery. (in Aulton, M.E., ed. Pharmaceutics: the design
and manufacture of medicines. 3rd ed. London: Churchill Livingstone Elsevier. p. 565-597.
Bartsova, L. & Bajgar, J. 2012. Transdermal drug delivery in vitro using diffusion cells. Current
medicinal chemistry, 19:4671-4677.
BP (British Pharmacopoeia). 2014. Phosphate buffer solution pH 7.4. London: The stationary
office.
http://www.pharmacopoeia.co.uk.nwulib.nwu.ac.za/bp2014updated/ixbin/bp.cgi?a=query&title=
%22Phosphate%20Buffer%20Solution%20pH%207.4%22&tab=a-z%20index&l=P&xh=1 Date
of access: 30 Sep. 2014
Hansen, C.M. 2007. The future. (In Hansen, C.M. Hansen solubility parameters – a users
handbook. 2nd ed. Boca Raton: CRC Press. p. 321-346).
Ng, S., Rouse, J., Sanderson, D. & Eccleston, G. 2010. A comparative study of
transmembrane diffusion and permeation of ibuprofen across synthetic membranes using Franz
diffusion cells. Pharmaceutics, 2:209-223.
Otto, A., Du Plessis, J. & Wiechers, J.W. 2009. Formulation effects of topical emulsions on
transdermal and dermal delivery. International journal of cosmetic science, 31:1-19
Shah, S.N.H., Tahir, M.A., Safdar, A., Riaz, R., Shahzad, Y., Rabbani, M. & Karim, S. 2013.
Effect of permeation enhancers on the release behaviour and permeation kinetics of novel
tramadol lotion. Tropical journal of pharmaceutical research, 12(1)27-32
Sheskin, D.J. 2000. Handbook of parametric and nonparametric statistical procedures. 2nd ed.
Boca Raton: Chapman & Hall/CRC. 982p.
Smith, G. 2012. Essential statistics, regression, and ergonomics. Amsterdam:Academic
Press.
StatSoft, Inc. (2014). STATISTICA (data analysis software system), version 12.
www.statsoft.com.

111
Moffat, A.C., Osselton, M.D. & Widdop, B. eds. 2011. Clarke‟s analysis of drugs and poisons in
pharmaceuticals, body fluids and post-mortem material. 4th ed. London: Pharmaceutical Press

112
Appendix D
International Journal of Pharmaceutics:
Author Guidelines
D.1 Introduction
The International Journal of Pharmaceutics publishes innovative papers, reviews, mini-reviews,
rapid communications and notes dealing with physical, chemical, biological, microbiological and
engineering studies related to the conception, design, production, characterization and
evaluation of drug delivery systems in vitro and in vivo. "Drug" is defined as any therapeutic or
diagnostic entity, including oligonucleotides, gene constructs and radiopharmaceuticals. Areas
of particular interest include: pharmaceutical nanotechnology; physical pharmacy; polymer
chemistry and physical chemistry as applied to pharmaceutics; excipient function and
characterization; biopharmaceutics; absorption mechanisms; membrane function and transport;
novel routes and modes of delivery; responsive delivery systems, feedback and control
mechanisms including biosensors; applications of cell and molecular biology to drug delivery;
prodrug design; bioadhesion (carrier-ligand interactions); and biotechnology (protein and
peptide formulation and delivery).
D.2 Types of paper
D.2.1 Full length manuscripts
D.2.2 Rapid communications
a) These articles should not exceed 1500 words or equivalent space.
b) Figures should not be included otherwise delay in publication will be incurred.
c) Do not subdivide the text into sections. An Abstract should be included as well as a full
reference list.
D.2.3 Notes
Should be prepared as described for full length manuscripts, except for the following:
a) The maximum length should be 1500 words, including figures and tables.
b) Do not subdivide the text into sections. An Abstract and reference list should be
included.

113
D.2.4 Reviews and mini-reviews
Suggestions for review articles will be considered by the Review-Editor. "Mini-reviews" of a
topic are specially welcome.
D.3 Before you begin
D.3.1 Ethics in publishing
For information on Ethics in publishing and Ethical guidelines for journal publication see
http://www.elsevier.com/publishingethics and http://www.elsevier.com/journal-authors/ethics.
D.3.2 Human and animal rights
If the work involves the use of animal or human subjects, the author should ensure that the work
described has been carried out in accordance with The Code of Ethics of the World Medical
Association (Declaration of Helsinki) for experiments involving humans
http://www.wma.net/en/30publications/10policies/b3/index.html; EU Directive 2010/63/EU for
animal experiments http://ec.europa.eu/environment/chemicals/lab_animals/legislation_en.htm;
Uniform Requirements for manuscripts submitted to Biomedical journals http://www.icmje.org.
Authors should include a statement in the manuscript that informed consent was obtained for
experimentation with human subjects. The privacy rights of human subjects must always be
observed.
D.3.3 Conflict of interest
All authors are requested to disclose any actual or potential conflict of interest including any
financial, personal or other relationships with other people or organizations within three years of
beginning the submitted work that could inappropriately influence, or be perceived to influence,
their work. See also http://www.elsevier.com/conflictsofinterest. Further information and an
example of a Conflict of Interest form can be found at:
http://help.elsevier.com/app/answers/detail/a_id/286/p/7923. Examples of potential conflicts of
interest include employment, consultancies, stock ownership, honoraria, paid expert testimony,
patent applications/registrations, and grants or other funding.
D.3.4 Submission declaration and verification
Submission of an article implies that the work described has not been published previously
(except in the form of an abstract or as part of a published lecture or academic thesis or as an
electronic preprint, see http://www.elsevier.com/postingpolicy), that it is not under consideration
for publication elsewhere, that its publication is approved by all authors and tacitly or explicitly
114
by the responsible authorities where the work was carried out, and that, if accepted, it will not be
published elsewhere in the same form, in English or in any other language, including
electronically without the written consent of the copyright-holder. To verify originality, your
article may be checked by the originality detection service CrossCheck
http://www.elsevier.com/editors/plagdetect.
D.3.5 Contributors
Each author is required to declare his or her individual contribution to the article: all authors
must have materially participated in the research and/or article preparation, so roles for all
authors should be described. The statement that all authors have approved the final article
should be true and included in the disclosure.
D.3.6 Authorship
All authors should have made substantial contributions to all of the following:
a) the conception and design of the study, or acquisition of data, or analysis and
interpretation of data,
b) drafting the article or revising it critically for important intellectual content, and
c) final approval of the version to be submitted.
D.3.7 Changes to authorship
This policy concerns the addition, deletion, or rearrangement of author names in the authorship
of accepted manuscripts: Before the accepted manuscript is published in an online issue:
Requests to add or remove an author, or to rearrange the author names, must be sent to the
Journal Manager from the corresponding author of the accepted manuscript and must include:
(a) the reason the name should be added or removed, or the author names rearranged and (b)
written confirmation (e-mail, fax, letter) from all authors that they agree with the addition,
removal or rearrangement. In the case of addition or removal of authors, this includes
confirmation from the author being added or removed. Requests that are not sent by the
corresponding author will be forwarded by the Journal Manager to the corresponding author,
who must follow the procedure as described above. Note that: (1) Journal Managers will inform
the Journal Editors of any such requests and (2) publication of the accepted manuscript in an
online issue is suspended until authorship has been agreed. After the accepted manuscript is
published in an online issue: Any requests to add, delete, or rearrange author names in an
article published in an online issue will follow the same policies as noted above and result in a
corrigendum.

115
D.3.8 Article transfer service
This journal is part of our Article Transfer Service. This means that if the Editor feels your article
is more suitable in one of our other participating journals, then you may be asked to consider
transferring the article to one of those. If you agree, your article will be transferred automatically
on your behalf with no need to reformat. More information about this can be found here:
http://www.elsevier.com/authors/article-transfer-service.
D.3.9 Copyright
This journal offers authors a choice in publishing their research: Open access and Subscription.
D.3.9.1 For subscription articles
Upon acceptance of an article, authors will be asked to complete a 'Journal Publishing
Agreement' (for more information on this and copyright, see http://www.elsevier.com/copyright).
An e-mail will be sent to the corresponding author confirming receipt of the manuscript together
with a 'Journal Publishing Agreement' form or a link to the online version of this agreement.
Subscribers may reproduce tables of contents or prepare lists of articles including abstracts for
internal circulation within their institutions. Permission of the Publisher is required for resale or
distribution outside the institution and for all other derivative works, including compilations and
translations (please consult http://www.elsevier.com/permissions). If excerpts from other
copyrighted works are included, the author(s) must obtain written permission from the copyright
owners and credit the source(s) in the article. Elsevier has preprinted forms for use by authors
in these cases: please consult http://www.elsevier.com/permissions.
D.3.9.2 For open access articles
Upon acceptance of an article, authors will be asked to complete an 'Exclusive License
Agreement' (for more information see http://www.elsevier.com/OAauthoragreement). Permitted
reuse of open access articles is determined by the author's choice of user license (see
http://www.elsevier.com/openaccesslicenses).
D.3.9.2.1 Retained author rights
As an author you (or your employer or institution) retain certain rights. For more information on
author rights for: Subscription articles please see http://www.elsevier.com/journal-
authors/author-rights-and-responsibilities. Open access articles please see
http://www.elsevier.com/OAauthoragreement.
116
D.3.10 Role of the funding source
You are requested to identify who provided financial support for the conduct of the research
and/or preparation of the article and to briefly describe the role of the sponsor(s), if any, in study
design; in the collection, analysis and interpretation of data; in the writing of the report; and in
the decision to submit the article for publication. If the funding source(s) had no such
involvement then this should be stated.
D.3.11 Funding body agreements and policies
Elsevier has established agreements and developed policies to allow authors whose articles
appear in journals published by Elsevier, to comply with potential manuscript archiving
requirements as specified as conditions of their grant awards. To learn more about existing
agreements and policies please visit http://www.elsevier.com/fundingbodies.
D.3.12 Open access
This journal offers authors a choice in publishing their research:
D.3.12.1 Open access
Articles are freely available to both subscribers and the wider public with permitted reuse
An open access publication fee is payable by authors or their research funder
D.3.12.2 Subscription
Articles are made available to subscribers as well as developing countries and patient
groups through our access programs (http://www.elsevier.com/access)
No open access publication fee
All articles published open access will be immediately and permanently free for everyone to
read and download. Permitted reuse is defined by your choice of one of the following Creative
Commons user licenses:
a) Creative Commons Attribution (CC BY): lets others distribute and copy the article, to
create extracts, abstracts, and other revised versions, adaptations or derivative works of
or from an article (such as a translation), to include in a collective work (such as an
anthology), to text or data mine the article, even for commercial purposes, as long as
they credit the author(s), do not represent the author as endorsing their adaptation of the
article, and do not modify the article in such a way as to damage the author's honor or
reputation.

117
b) Creative Commons Attribution-NonCommercial-ShareAlike (CC BY-NC-SA): for
noncommercial purposes, lets others distribute and copy the article, to create extracts,
abstracts and other revised versions, adaptations or derivative works of or from an
article (such as a translation), to include in a collective work (such as an anthology), to
text and data mine the article, as long as they credit the author(s), do not represent the
author as endorsing their adaptation of the article, do not modify the article in such a way
as to damage the author's honor or reputation, and license their new adaptations or
creations under identical terms (CC BY-NC-SA).
c) Creative Commons Attribution-NonCommercial-NoDerivs (CC BY-NC-ND): for
noncommercial purposes, lets others distribute and copy the article, and to include in a
collective work (such as an anthology), as long as they credit the author(s) and provided
they do not alter or modify the article. To provide open access, this journal has a
publication fee which needs to be met by the authors or their research funders for each
article published open access. Your publication choice will have no effect on the peer
review process or acceptance of submitted articles. The open access publication fee for
this journal is $3000, excluding taxes. Learn more about Elsevier's pricing policy:
http://www.elsevier.com/openaccesspricing.
D.3.13 Language (usage and editing services)
Please write your text in good English (American or British usage is accepted, but not a mixture
of these). Authors who feel their English language manuscript may require editing to eliminate
possible grammatical or spelling errors and to conform to correct scientific English may wish to
use the English Language Editing service available from Elsevier's WebShop
(http://webshop.elsevier.com/languageediting/) or visit our customer support site
(http://support.elsevier.com) for more information.
D.3.14 Submission
Submission to this journal proceeds totally online and you will be guided stepwise through the
creation and uploading of your files. The system automatically converts source files to a single
PDF file of the article, which is used in the peer-review process. Please note that even though
manuscript source files are converted to PDF files at submission for the review process, these
source files are needed for further processing after acceptance. All correspondence, including
notification of the Editor's decision and requests for revision, takes place by e-mail removing the
need for a paper trail.
Authors must state in a covering letter when submitting papers for publication the

118
novelty embodied in their work or in the approach taken in their research. Routine
bioequivalence studies are unlikely to find favour. No paper will be published which does not
disclose fully the nature of the formulation used or details of materials which are key to the
performance of a product, drug or excipient. Work which is predictable in outcome, for example
the inclusion of another drug in a cyclodextrin to yield enhanced dissolution, will not be
published unless it provides new insight into fundamental principles.
Note: The choice of general classifications such as "drug delivery" or "formulation" are rarely
helpful when not used together with a more specific classification.
D.3.15 Referees
Please submit, with the manuscript, the names, addresses and e-mail addresses of at least four
potential reviewers. Good suggestions lead to faster processing of your paper. Please note:
Reviewers who do not have an institutional e-mail address will only be considered if their
affiliations are given and can be verified. Please ensure that the e-mail addresses are current.
International reviewers who have recently published in the appropriate field should be
nominated, and their areas of expertise must be stated clearly. Note that the editor retains the
sole right to decide whether or not the suggested reviewers are contacted. To aid the editorial
process when suggested reviewers are not chosen or decline to review, ensure that the
classifications chosen as the field of your paper are as detailed as possible. It is not sufficient to
state "drug delivery" or "nanotechnology" etc.
D.4 Preparation
D.4.1 Use of word processing software
It is important that the file be saved in the native format of the word processor used. The text
should be in single-column format. Keep the layout of the text as simple as possible. Most
formatting codes will be removed and replaced on processing the article. In particular, do not
use the word processor's options to justify text or to hyphenate words. However, do use bold
face, italics, subscripts, superscripts etc. When preparing tables, if you are using a table grid,
use only one grid for each individual table and not a grid for each row. If no grid is used, use
tabs, not spaces, to align columns. The electronic text should be prepared in a way very similar
to that of conventional manuscripts (see also the Guide to Publishing with Elsevier:
http://www.elsevier.com/guidepublication). Note that source files of figures, tables and text
graphics will be required whether or not you embed your figures in the text. See also the
section on Electronic artwork. To avoid unnecessary errors you are strongly advised to use the
'spell-check' and 'grammar-check' functions of your word processor.

119
D.4.2 Article structure
D.4.2.1 Subdivision - numbered sections
Divide your article into clearly defined and numbered sections. Subsections should be
numbered 1.1 (then 1.1.1, 1.1.2), 1.2, etc. (the abstract is not included in section numbering).
Use this numbering also for internal cross-referencing: do not just refer to 'the text'. Any
subsection may be given a brief heading. Each heading should appear on its own separate
line.
D.4.2.2 Introduction
State the objectives of the work and provide an adequate background, avoiding a detailed
literature survey or a summary of the results.
D.4.2.3 Material and methods
Provide sufficient detail to allow the work to be reproduced. Methods already published should
be indicated by a reference: only relevant modifications should be described.
D.4.2.4 Results
Results should be clear and concise.
D.4.2.5 Discussion
This should explore the significance of the results of the work, not repeat them. A combined
Results and Discussion section is often appropriate. Avoid extensive citations and discussion of
published literature.
D.4.2.6 Conclusions
The main conclusions of the study may be presented in a short Conclusions section, which may
stand alone or form a subsection of a Discussion or Results and Discussion section.
D.4.2.7 Appendices
If there is more than one appendix, they should be identified as A, B, etc. Formulae and
equations in appendices should be given separate numbering: Eq. (A.1), Eq. (A.2), etc.; in a
subsequent appendix, Eq. (B.1) and so on. Similarly for tables and figures: Table A.1; Fig. A.1,
etc.

120
D.4.3 Essential title page information
Title. Concise and informative. Titles are often used in information-retrieval systems.
Avoid abbreviations and formulae where possible.
Author names and affiliations. Where the family name may be ambiguous (e.g., a
double name), please indicate this clearly. Present the authors' affiliation addresses
(where the actual work was done) below the names. Indicate all affiliations with a lower-
case superscript letter immediately after the author's name and in front of the
appropriate address. Provide the full postal address of each affiliation, including the
country name and, if available, the e-mail address of each author.
Corresponding author. Clearly indicate who will handle correspondence at all stages
of refereeing and publication, also post-publication. Ensure that phone numbers (with
country and area code) are provided in addition to the e-mail address and the
complete postal address. Contact details must be kept up to date by the
corresponding author.
Present/permanent address. If an author has moved since the work described in the
article was done, or was visiting at the time, a 'Present address' (or 'Permanent
address') may be indicated as a footnote to that author's name. The address at which
the author actually did the work must be retained as the main, affiliation address.
Superscript Arabic numerals are used for such footnotes.
D.4.4 Abstract
A concise and factual abstract is required. The abstract should state briefly the purpose of the
research, the principal results and major conclusions. An abstract is often presented separately
from the article, so it must be able to stand alone. For this reason, References should be
avoided, but if essential, then cite the author(s) and year(s). Also, non-standard or uncommon
abbreviations should be avoided, but if essential they must be defined at their first mention in
the abstract itself. The abstract must not exceed 200 words.
D.4.5 Graphical abstract
A Graphical abstract is mandatory for this journal. It should summarize the contents of the
article in a concise, pictorial form designed to capture the attention of a wide readership online.
Authors must provide images that clearly represent the work described in the article. Graphical
abstracts should be submitted as a separate file in the online submission system. Image size:
please provide an image with a minimum of 531 × 1328 pixels (h × w) or proportionally more,
121
but should be readable on screen at a size of 200 × 500 pixels (at 96 dpi this corresponds to
5 × 13 cm). Bear in mind readability after reduction, especially if using one of the figures from
the article itself. Preferred file types: TIFF, EPS, PDF or MS Office files. See
http://www.elsevier.com/graphicalabstracts for examples.
D.4.6 Keywords
Immediately after the abstract, provide a maximum of 6 keywords, using American spelling and
avoiding general and plural terms and multiple concepts (avoid, for example, 'and', 'of'). Be
sparing with abbreviations: only abbreviations firmly established in the field may be eligible.
These keywords will be used for indexing purposes.
D.4.7 Chemical compounds
You can enrich your article by providing a list of chemical compounds studied in the article. The
list of compounds will be used to extract relevant information from the NCBI PubChem
Compound database and display it next to the online version of the article on ScienceDirect.
You can include up to 10 names of chemical compounds in the article. For each compound,
please provide the PubChem CID of the most relevant record as in the following example:
Glutamic acid (PubChem CID:611). The PubChem CIDs can be found via
http://www.ncbi.nlm.nih.gov/pccompound. Please position the list of compounds immediately
below the 'Keywords' section. It is strongly recommended to follow the exact text formatting as
in the example below: Chemical compounds studied in this article Ethylene glycol (PubChem
CID: 174); Plitidepsin (PubChem CID: 44152164); Benzalkonium chloride (PubChem CID:
15865). More information is available at: http://www.elsevier.com/PubChem.
D.4.8 Abbreviations
Define abbreviations that are not standard in this field in a footnote to be placed on the first
page of the article. Such abbreviations that are unavoidable in the abstract must be defined at
their first mention there, as well as in the footnote. Ensure consistency of abbreviations
throughout the article.
D.4.9 Acknowledgements
Collate acknowledgements in a separate section at the end of the article before the references
and do not, therefore, include them on the title page, as a footnote to the title or otherwise. List
here those individuals who provided help during the research (e.g., providing language help,
writing assistance or proof reading the article, etc.).

122
D.4.10 Units
Follow internationally accepted rules and conventions: use the international system of units (SI).
If other units are mentioned, please give their equivalent in SI.
D.4.11 Database linking
Elsevier encourages authors to connect articles with external databases, giving their readers
oneclick access to relevant databases that help to build a better understanding of the described
research. Please refer to relevant database identifiers using the following format in your article:
Database: xxxx (e.g., TAIR: AT1G01020; CCDC: 734053; PDB: 1XFN). See
http://www.elsevier.com/databaselinking for more information and a full list of supported
databases.
D.4.12 Math formulae
Present simple formulae in the line of normal text where possible and use the solidus (/) instead
of a horizontal line for small fractional terms, e.g., X/Y. In principle, variables are to be
presented in italics. Powers of e are often more conveniently denoted by exp. Number
consecutively any equations that have to be displayed separately from the text (if referred to
explicitly in the text).
D.4.13 Footnotes
Footnotes should be used sparingly. Number them consecutively throughout the article, using
superscript Arabic numbers. Many wordprocessors build footnotes into the text, and this feature
may be used. Should this not be the case, indicate the position of footnotes in the text and
present the footnotes themselves separately at the end of the article. Do not include footnotes
in the Reference list.
D.4.13.1 Table footnotes
Indicate each footnote in a table with a superscript lowercase letter.
D.4.13.2 Image manipulation
Whilst it is accepted that authors sometimes need to manipulate images for clarity, manipulation
for purposes of deception or fraud will be seen as scientific ethical abuse and will be dealt with
accordingly. For graphical images, this journal is applying the following policy: no specific
feature within an image may be enhanced, obscured, moved, removed, or introduced.
Adjustments of brightness, contrast, or color balance are acceptable if and as long as they do

123
not obscure or eliminate any information present in the original. Nonlinear adjustments (e.g.
changes to gamma settings) must be disclosed in the figure legend.
D.4.13.3 Electronic artwork
D.4.13.3.1 General points
Make sure you use uniform lettering and sizing of your original artwork.
Embed the used fonts if the application provides that option.
Aim to use the following fonts in your illustrations: Arial, Courier, Times New Roman,
Symbol, or use fonts that look similar.
Number the illustrations according to their sequence in the text.
Use a logical naming convention for your artwork files.
Provide captions to illustrations separately.
Size the illustrations close to the desired dimensions of the printed version.
Submit each illustration as a separate file.
A detailed guide on electronic artwork is available on our website:
http://www.elsevier.com/artworkinstructions
You are urged to visit this site; some excerpts from the detailed information are given
here.
D.4.13.3.2 Formats
If your electronic artwork is created in a Microsoft Office application (Word, PowerPoint, Excel)
then please supply 'as is' in the native document format. Regardless of the application used
other than Microsoft Office, when your electronic artwork is finalized, please 'Save as' or convert
the images to one of the following formats (note the resolution requirements for line drawings,
halftones, and line/halftone combinations given below):
EPS (or PDF): Vector drawings, embed all used fonts.
TIFF (or JPEG): Color or grayscale photographs (halftones), keep to a minimum of
300 dpi.
TIFF (or JPEG): Bitmapped (pure black & white pixels) line drawings, keep to a minimum
of 1000 dpi.
TIFF (or JPEG): Combinations bitmapped line/half-tone (color or grayscale), keep to a

124
minimum of 500 dpi.
Please do not:
Supply files that are optimized for screen use (e.g., GIF, BMP, PICT, WPG); these
typically have a low number of pixels and limited set of colors;
Supply files that are too low in resolution;
Submit graphics that are disproportionately large for the content.
D.4.13.3.3 Color artwork
Please make sure that artwork files are in an acceptable format (TIFF (or JPEG), EPS (or PDF),
or MS Office files) and with the correct resolution. If, together with your accepted article, you
submit usable color figures then Elsevier will ensure, at no additional charge that these figures
will appear in color on the Web (e.g., ScienceDirect and other sites) regardless of whether or
not these illustrations are reproduced in color in the printed version. For color reproduction in
print, you will receive information regarding the costs from Elsevier after receipt of your
accepted article. Please indicate your preference for color: in print or on the Web only. For
further information on the preparation of electronic artwork, please see
http://www.elsevier.com/artworkinstructions. Please note: Because of technical complications
which can arise by converting color figures to 'gray scale' (for the printed version should you not
opt for color in print) please submit in addition usable black and white versions of all the color
illustrations.
D.4.13.3.4 Figure captions
Ensure that each illustration has a caption. Supply captions separately, not attached to the
figure. A caption should comprise a brief title (not on the figure itself) and a description of the
illustration. Keep text in the illustrations themselves to a minimum but explain all symbols and
abbreviations used.
D.4.14 Tables
Number tables consecutively in accordance with their appearance in the text. Place footnotes
to tables below the table body and indicate them with superscript lowercase letters. Avoid
vertical rules. Be sparing in the use of tables and ensure that the data presented in tables do
not duplicate results described elsewhere in the article.

125
D.4.15 References
D.4.15.1 Citation in text
Please ensure that every reference cited in the text is also present in the reference list (and vice
versa). Any references cited in the abstract must be given in full. Unpublished results and
personal communications are not recommended in the reference list, but may be mentioned in
the text. If these references are included in the reference list they should follow the standard
reference style of the journal and should include a substitution of the publication date with either
'Unpublished results' or 'Personal communication'. Citation of a reference as 'in press' implies
that the item has been accepted for publication and a copy of the title page of the relevant
article must be submitted.
D.4.15.2 Reference links
Increased discoverability of research and high quality peer review are ensured by online links to
the sources cited. In order to allow us to create links to abstracting and indexing services, such
as Scopus, CrossRef and PubMed, please ensure that data provided in the references are
correct. Please note that incorrect surnames, journal/book titles, publication year and
pagination may prevent link creation. When copying references, please be careful as they may
already contain errors. Use of the DOI is encouraged.
D.4.15.3 Web references
As a minimum, the full URL should be given and the date when the reference was last
accessed. Any further information, if known (DOI, author names, dates, reference to a source
publication, etc.), should also be given. Web references can be listed separately (e.g., after the
reference list) under a different heading if desired, or can be included in the reference list.
D.4.15.4 References in a special issue
Please ensure that the words 'this issue' are added to any references in the list (and any
citations in the text) to other articles in the same Special Issue.
D.4.15.5 Reference management software
This journal has standard templates available in key reference management packages EndNote
(http://www.endnote.com/support/enstyles.asp) and Reference Manager
(http://refman.com/support/rmstyles.asp). Using plug-ins to wordprocessing packages, authors
only need to select the appropriate journal template when preparing their article and the list of
references and citations to these will be formatted according to the journal style which is

126
described below.
D.4.15.6 Reference formatting
There are no strict requirements on reference formatting at submission. References can be in
any style or format as long as the style is consistent. Where applicable, author(s) name(s),
journal title/book title, chapter title/article title, year of publication, volume number/book chapter
and the pagination must be present. Use of DOI is highly encouraged. The reference style
used by the journal will be applied to the accepted article by Elsevier at the proof stage. Note
that missing data will be highlighted at proof stage for the author to correct. If you do wish to
format the references yourself they should be arranged according to the following examples:
D.4.15.6.1 Reference style
D.4.15.6.1.1 Text
All citations in the text should refer to:
1) Single author: the author's name (without initials, unless there is ambiguity) and the year
of publication;
2) Two authors: both authors' names and the year of publication;
3) Three or more authors: first author's name followed by 'et al.' and the year of publication.
Citations may be made directly (or parenthetically). Groups of references should be listed first
alphabetically, then chronologically. Examples: 'as demonstrated (Allan, 2000a, 2000b, 1999;
Allan and Jones, 1999). Kramer et al. (2010) have recently shown .'
D.4.15.6.1.2 List
References should be arranged first alphabetically and then further sorted chronologically if
necessary. More than one reference from the same author(s) in the same year must be
identified by the letters 'a', 'b', 'c', etc., placed after the year of publication. Examples:
Reference to a journal publication:
Van der Geer, J., Hanraads, J.A.J., Lupton, R.A., 2010. The art of writing a scientific article. J.
Sci. Commun. 163, 51–59.
Reference to a book:
Strunk Jr., W., White, E.B., 2000. The Elements of Style, fourth ed. Longman, New York.

127
Reference to a chapter in an edited book:
Mettam, G.R., Adams, L.B., 2009. How to prepare an electronic version of your article, in:
Jones, B.S., Smith , R.Z. (Eds.), Introduction to the Electronic Age. E-Publishing Inc., New York,
pp. 281–304.
D.4.15.7 Journal abbreviations source
Journal names should be abbreviated according to the List of Title Word Abbreviations:
http://www.issn.org/services/online-services/access-to-the-ltwa/.
D.4.16 Video data
Elsevier accepts video material and animation sequences to support and enhance your
scientific research. Authors who have video or animation files that they wish to submit with their
article are strongly encouraged to include links to these within the body of the article. This can
be done in the same way as a figure or table by referring to the video or animation content and
noting in the body text where it should be placed. All submitted files should be properly labeled
so that they directly relate to the video file's content. In order to ensure that your video or
animation material is directly usable, please provide the files in one of our recommended file
formats with a preferred maximum size of 50 MB. Video and animation files supplied will be
published online in the electronic version of your article in Elsevier Web products, including
ScienceDirect: http://www.sciencedirect.com. Please supply 'stills' with your files: you can
choose any frame from the video or animation or make a separate image. These will be used
instead of standard icons and will personalize the link to your video data. For more detailed
instructions please visit our video instruction pages at
http://www.elsevier.com/artworkinstructions. Note: since video and animation cannot be
embedded in the print version of the journal, please provide text for both the electronic and the
print version for the portions of the article that refer to this content.
D.4.17 AudioSlides
The journal encourages authors to create an AudioSlides presentation with their published
article. AudioSlides are brief, webinar-style presentations that are shown next to the online
article on ScienceDirect. This gives authors the opportunity to summarize their research in their
own words and to help readers understand what the paper is about. More information and
examples are available at http://www.elsevier.com/audioslides. Authors of this journal will
automatically receive an invitation e-mail to create an AudioSlides presentation after
acceptance of their paper.

128
D.4.18 Supplementary data
Elsevier accepts electronic supplementary material to support and enhance your scientific
research. Supplementary files offer the author additional possibilities to publish supporting
applications, high resolution images, background datasets, sound clips and more.
Supplementary files supplied will be published online alongside the electronic version of your
article in Elsevier Web products, including ScienceDirect: http://www.sciencedirect.com. In
order to ensure that your submitted material is directly usable, please provide the data in one of
our recommended file formats. Authors should submit the material in electronic format together
with the article and supply a concise and descriptive caption for each file. For more detailed
instructions please visit our artwork instruction pages at
http://www.elsevier.com/artworkinstructions.
D.4.18.1 Submission checklist
It is hoped that this list will be useful during the final checking of an article prior to sending it to
the journal's Editor for review. Please consult this Guide for Authors for further details of any
item.
Ensure that the following items are present:
One Author designated as corresponding Author:
E-mail address
Full postal address
Telephone and fax numbers
All necessary files have been uploaded
Keywords
All figure captions
All tables (including title, description, footnotes)
Further considerations:
Use continuous line numbering (every 5 lines) to facilitate reviewing of the manuscript
Manuscript has been "spellchecked" and "grammar-checked"
References are in the correct format for this journal
All references mentioned in the Reference list are cited in the text, and vice versa

129
Permission has been obtained for use of copyrighted material from other sources
(including the Web)
Color figures are clearly marked as being intended for color reproduction on the Web
(free of charge) and in print or to be reproduced in color on the Web (free of charge) and
in black-and-white in print
If only color on the Web is required, black and white versions of the figures are also
supplied for printing purposes
For any further information please visit our customer support site at http://support.elsevier.com.
D.5 After acceptance
D.5.1 Use of the Digital Object Identifier
The Digital Object Identifier (DOI) may be used to cite and link to electronic documents. The
DOI consists of a unique alpha-numeric character string which is assigned to a document by the
publisher upon the initial electronic publication. The assigned DOI never changes. Therefore, it
is an ideal medium for citing a document, particularly 'Articles in press' because they have not
yet received their full bibliographic information. Example of a correctly given DOI (in URL
format; here an article in the journal Physics Letters B):
http://dx.doi.org/10.1016/j.physletb.2010.09.059. When you use a DOI to create links to
documents on the web, the DOIs are guaranteed never to change.
D.5.2 Online proof correction
Corresponding authors will receive an e-mail with a link to our online proofing system, allowing
annotation and correction of proofs online. The environment is similar to MS Word: in addition
to editing text, you can also comment on figures/tables and answer questions from the Copy
Editor. Web-based proofing provides a faster and less error-prone process by allowing you to
directly type your corrections, eliminating the potential introduction of errors. If preferred, you
can still choose to annotate and upload your edits on the PDF version. All instructions for
proofing will be given in the e-mail we send to authors, including alternative methods to the
online version and PDF. We will do everything possible to get your article published quickly and
accurately - please upload all of your corrections within 48 hours. It is important to ensure that
all corrections are sent back to us in one communication. Please check carefully before
replying, as inclusion of any subsequent corrections cannot be guaranteed. Proofreading is
solely your responsibility. Note that Elsevier may proceed with the publication of your article if
no response is received.

130
D.5.3 Offprints
The corresponding author, at no cost, will be provided with a personalized link providing
50 days free access to the final published version of the article on ScienceDirect. This link can
also be used for sharing via email and social networks. For an extra charge, paper offprints can
be ordered via the offprint order form which is sent once the article is accepted for publication.
Both corresponding and co-authors may order offprints at any time via Elsevier's WebShop
(http://webshop.elsevier.com/myarticleservices/offprints). Authors requiring printed copies of
multiple articles may use Elsevier WebShop's 'Create Your Own Book' service to collate
multiple articles within a single cover (http://webshop.elsevier.com/myarticleservices/booklets).
D.6 Author inquiries
You can track your submitted article at
(http://help.elsevier.com/app/answers/detail/a_id/89/p/8045/). You can track your accepted
article at http://www.elsevier.com/trackarticle. You are also welcome to contact Customer
Support via http://support.elsevier.com.
Related Documents