Long-Range Transportation Plan 2035 ADOPTED MAY 29, 2012 CITY OF transpor ation Plan in Fremont Nebraska Long-Range 2035 ., , . ", ' 1' ' . :C' '. 'I ,., ,',' "" ... 'j' , .. 'I' , .. ,., .... ". "t-f" .. , .. ' j' .. ,·t· . '1 . • ,! •.•• 'j' , .. "1' , . . . '. , , 'f" ... ,' .. : ' .. ',7-: 'r" :.:,.::. :'::" ';:':,:::::::::: :l::· :1·::::::::,::::::::::::::: l :+1:::::: :::::: ',: J:::: :jfH:::::::: 1" "J' :..J. ...... . .. , 1'" c' •• 1,. " , , ••• , .. , ',"'" ,I, .,', ...• ', , .. ,., , .,,' " ,,','.' ' , .. , . ".,'" ,', " 'r:' ., ""."' .. ' '" """ , ...... " t'a:II...-: - ..... - --. - - - ........ .... --.- :: .! j !J >. : : r: :, : r a : -4: : .: I L .:: : : : :! : : : : i: :. :: : : : : : .!: : : : : \: : : : : : : : : . : : : (: : : : . - : : I: . : : . : " ,- . : . : : : : : : : : . . : : : : : : ( 1' , ',! . ,. , '" - '. I"" '/' , .• 'I' . " J"" ,'" i'··' ,', , .. '1' ' , . , " 'I:'" '," . ·1, , , ." , •• ,I. , . , . , , '. .. ,.".".,',. :. : ; : i-J / : . : .-1 :: :+. : : : : :t:;.:c¥-+ -0-t: : :0 l: : : l;: :.>1-::-: : :l: : : : :l::, ::: .. j'; :::':::c:::l':" :.: '.:: ::: '1:: "r::: ::: :::1: : : : : t : .. ,!.. . .! :. l::' I: ::. :l. .:: C::;:::: (7" :,,:.:1:, .: 'r': --:-:-:r =-*,: -:: :--,f,-,-:: :: '-..,r'-: :+-:::: :-: :-: '4:-:-:-+:-:.'; l : c_: __ , J._, ,-:-:l::-:-:' , " . .1',' ,'" , , , , , .. " , .. i "j'" , ,',.. ,. • . , ' ';" .• ,I .,.," . '\' , " I· .. 'I" "'" , , . '1' .. 1, , , : :1: : . , " .,' , ., " 'l ' ., ,. 'I • ,., "',, , • .' ,I , .' I'··' ." .1., , .. , , , , , ., I'" . , , , . " " ,-, . 'I' . , . '!' ,. l' 'i ., 1 ,.,' '-' . , . I ' ,.. ,.J ,. 'I ' .. , . 'I' , , . 'I" . , . ,I, "J" 'I···' ',' " ". "I' ",. . :' ... 'I' , .... , , "''''''_''-- ' ,I, • ',. " • , , , . , .', . , , , . , , ... , ,. ,. -, .,.. . . , E. • , ,.1 ... ,",.,' .

Welcome message from author
This document is posted to help you gain knowledge. Please leave a comment to let me know what you think about it! Share it to your friends and learn new things together.
Transcript

Long-Range Transportation Plan 2035
ADOPTED MAY 29, 2012
C I T Y O F
transpor ationPl an i n Fr emont N e b r a s k a
Lon g - R an ge2035
., , . ", '1' ' . :C' '. 'I ,., ,',' "" ... 'j' , .. 'I' , .. ,., .... ". "t-f" .. , .. 'j' .. ,·t· . '1 . • ,! •.•• 'j' , .. "1' , . . . '. , , 'f" ... ,' .. : ' .• J;.~" .. ~:;. ',7-: t~,~:~ 'r" :.:,.::. ~.: .~~ :'::" ';:':,:::::::::: :l::· :1·::::::::,::::::::::::::: l :+1:::::: :::::: ',: :~:: J:::: :jfH:::::::: 1" " J ' :..J. ...... . .. , 1'" c' •• 1,. " , , ••• , .. , ',"'" ,I, .,', ...• ', , .. ,., , .,,' " ,,','.' ' , .. , . ".,'" ,', " 'r:' ., ""."' .. ' '" """ , 't'!"' ''''''' l~'''''''''''' ~ ...... " t'a:II...-: - ..... - ~ ~~. --. - - ~ -........ ....--.-
:: .! ~'! j!J ~ >. : ~ : r: :, ~ : r a : -4: : .: I L .:: ~: : : : :! ~ : : : : i: :. :: ~ : ~ : ~. : : : .!: : : : : \: : : : : : : : : :~: . : : : (: : : : . ~: ~ - : : I: . : : . : " ,- . : . : : : : : : : : . . : ~ : ~ : : : : t · ,~· (1' , ',! . ,. , '" - '. I"" '/' , .• 'I' . " J"" ,'" i'··' ,', , .. '1' ' , . , " 'I:'" '," . ·1, , , ." , •• ,I. , . , . , , '. .. ,.".".,',.
~:.:;~~: :. : ; :!~: : i-J / : . ~: : .-1 : : ~:-~~ ~t:~: :+. : ~ : : : :~:-7:-: :t:;.:c¥-+ -0-t: : ~: ::.~: :-~+.;.~: :~ :;f.-;~ -~P+: :0 :~ l : : : l;: :.>1-::-: : :l: : : : :l::, ::: .. j'; :::':::c:::l':" :.: '.:: ::: '1:: "r::: ::: :::1: : : : : t : .. ,!.. . .! :. l::' I: : : . :l. .:: C::;:::: (7":,,:.:1:, f-':I ~ .: 'r': ,·t-:-~.! --:-:-:r ~+:-~. -~, =-*,: -:: :--,f,-,-:: ~-: :: '-..,r'-: :+-:::: :-: :-: '4:-:-:-+:-:.'; l : +';'~1: c_: __ , J._, ~:-: ,-:-:l::-:-:' , " . .1',' ,'" , , , , , .. " , .. i "j'" , ,',.. ,. • . , ' ';" .• ,I .,.," . '\' , " I· .. 'I" "'" , , . '1' .. 1, , , : :1: : . , " .,' , ., " 'l ' ., ,. 'I • ,., "',, , • .' ,I , .' I'··' ." .1., , .. , , , , , ., I'" . , , , . " " ,-, . 'I' . , . '!' , . l' 'i ., 1 ,.,' '-' . , . I ' ,.. ,.J ,. 'I ' .. , . 'I' , , . 'I" . , . ,I, "J" 'I···' ',' " ". "I' ",. . :' ... 'I' , .... , , "''''''_''-- ' ,I, • ',. " • , , , . , .', . , , , . , , ... , ,. ,. -, .,.. . . , E. • , ,.1 ... ,",.,' .
City CouncilScott Getzschman, MayorJennifer Bixby, PresidentJohn AndersonKevin EairleywineSean GittTodd HoppeLarry JohnsonSteve NavarretteMark Stange
Planning CommissionDev Sookram, ChairmanAmber BartonMike Emanuel Brad FookenKari Ridder Mitch Sawyer Terry Synovec Brian Wiese Tom Winter
Steering CommitteeJennifer BixbyRyan FialaPaul Gifford
Jennifer Greunke Todd HansenDian Hillis Kim Koski Vincent LaboyTom Nielsen Russ PetersonSandi ProskovecKari RidderRonnie L. SchultzTimothy SchulzTom Shaw Maggie Zarate
City StaffDale Shotkoski, City AdministratorPaul Payne, City AttorneyJody Sanders, Finance DirectorDerril Marshall, Department of Utilities General ManagerClark Boschult, Director of Public WorksRian Harkins, Director of PlanningJohn Schmitz, Director of Parks and RecreationKim Volk, City ClerkTimothy Mullen, Police ChiefJanet Davenport, Library Director
C I T Y O F
Bret C. Keast, AICPGreg Flisram, AICPLiz Probst, AICPSusan Watkins
Lonnie Burklund, P.E., PTOECharles Thomas, E.I.
Mark Lutjeharms, P.E., PTOESteve Kathol, P.E.
Acknowledgements
Long Range Transportation Plan 2035City of Fremont, Nebraska FREM~NT
FREM~NT NEBRASKA PATHFINDERS
ARCHITECTS I ENGINEERS I PLANNERS
KENDIG KEAST COLLAIORATIVE
ITERIS' 4

May 2012
Prepared byThe Schemmer Associates Inc.
In Association withIteris, Inc.
Kendig Keast Collaborative
transpor ationPl an i n Fr emont N e b r a s k a
Lon g - R an ge2035
Long Range Transportation Plan 2035Long Range Transportation Plan 2035
.----
---\ ---
~~?t::~.........-- --- "'\ \ \ \ \ .... .... ....
FREM~NT

Long Range Transportation Plan 2035
Table of ContentsINTRODUCTION.......................................................................................................................................................................................1
Planning Process ....................................................................................................................................................................................... 3
EXISTING.TRANSPORTATION.CONDITIONS......................................................................................................................................3Existing Transportation System ................................................................................................................................................................. 3 Rural Principal Arterial System ............................................................................................................................................................ 3 Rural Minor Arterial Road System ....................................................................................................................................................... 5 Rural Collector Road System ............................................................................................................................................................... 5 Rural Local Road System ..................................................................................................................................................................... 5 Urban Principal Arterial System ........................................................................................................................................................... 5 Urban Minor Arterial Street System ..................................................................................................................................................... 6 Urban Collector Street System ............................................................................................................................................................. 7 Urban Local Street System ................................................................................................................................................................... 7Field Review & Data Collection Summary ............................................................................................................................................... 7Traffic Safety & Operations Evaluation ..................................................................................................................................................... 7Alternative Transportation Modes ............................................................................................................................................................. 9 Transit .................................................................................................................................................................................................. 9 Multi-Use Trails .................................................................................................................................................................................. 11 Aviation - Fremont Municipal Airport ................................................................................................................................................ 11
PUBLIC.INPUT.........................................................................................................................................................................................12Priorities ................................................................................................................................................................................................. 12Issues ...................................................................................................................................................................................................... 12Solutions ................................................................................................................................................................................................ 13
TRAVEL.DEMAND.FORECASTING........................................................................................................................................................16Model Development ............................................................................................................................................................................... 16Alternative Analysis for 2035 Network ................................................................................................................................................... 18
Long Range Transportation Plan 2035 F"REM~NT

City of Fremont, Nebraska
Transportation Alternatives Evaluation ................................................................................................................................................... 23 Fremont Southeast Beltway ................................................................................................................................................................ 23 U.S. Highway 30 (west)...................................................................................................................................................................... 23
PLANNING.FOR.THE.TRANSPORTATION.NEEDS.OF.2035..............................................................................................................27Pedestrian & Bicycle Needs .................................................................................................................................................................... 27Transit Needs .......................................................................................................................................................................................... 27Airport Needs ......................................................................................................................................................................................... 27Streets and Roads Needs - Programs ....................................................................................................................................................... 28 System Management & Operations ................................................................................................................................................... 28 Roadway Rehabilitation Program ...................................................................................................................................................... 28 Congestion Management ................................................................................................................................................................... 28 Access Management ........................................................................................................................................................................... 29Street and Roads Needs - Projects ........................................................................................................................................................... 29 Developer Commitments ................................................................................................................................................................... 29 Federal & State Improvements............................................................................................................................................................ 29 Future Roadway Projects .................................................................................................................................................................... 29 Additional Project Needs .................................................................................................................................................................... 31
PROJECT.PRIORITIZATION.&.IMPLEMENTATION..........................................................................................................................31Recommendations .................................................................................................................................................................................. 31Amendments & Reviews ........................................................................................................................................................................ 31
APPENDICESAppendix 1: Existing Transportation ConditionsAppendix 2: TransCAD Travel Demand Forecast Model Validation & Alternative Analysis
Table of Contents
City of Fremont, NebraskaF"REM~NT

Long Range Transportation Plan 2035
List of FiguresFigure 1: Study Area .............................................................................................................................................................................................. 2Figure 2: National Functional Classification .......................................................................................................................................................... 4Figure 3: Fremont Transit Lines Bus Route .......................................................................................................................................................... 10Figure 4: Fremont Model Traffic Analysis Zones .................................................................................................................................................. 17Figure 5: Planned (Committed) Improvements ................................................................................................................................................... 19Figure 6: 2035 Future Base Model Volumes ........................................................................................................................................................ 20Figure 7: 2010 Base Model Volumes .................................................................................................................................................................... 21Figure 8: 2035 Committed Model Peak Hour V/C ............................................................................................................................................. 22Figure 9: 2035 SE Beltway Model Volumes ......................................................................................................................................................... 24Figure 10: 2035 U.S. 30 S-Route Model Volumes ............................................................................................................................................... 25Figure 11: 2035 Combined Model Volumes ........................................................................................................................................................ 26
Long Range Transportation Plan 2035 F"REM~NT
City of Fremont, Nebraska
Lists of TablesTable 1: Hierarchy of Functional Systems .............................................................................................................................................................. 3Table 2: Intersection Crash Rates .......................................................................................................................................................................... 8Table 3: Summary of Intersection Analysis - Existing (2010) Conditions .............................................................................................................. 9Table 4: System-wide Model Measures ................................................................................................................................................................ 18Table 5: NDOR Planned Improvements ............................................................................................................................................................. 30Table 6: City of Fremont Future Roadway Projects.............................................................................................................................................. 30Table 7: Projects for Consideration ..................................................................................................................................................................... 31Table 8: Short-, Mid-, & Long-term Roadway Improvements ............................................................................................................................. 31
City of Fremont, NebraskaF"REM~NT

Long Range Transportation Plan 2035 1
IntroductionFremont’s transportation system is vital to the community and the surrounding region in supporting economic development and recreational activities. The regional transportation network conveniently connects Fremont to larger metropolitan areas, including Omaha and Lincoln, and to other surrounding communities via Nebraska’s growing expressway system. Locally, Fremont possesses a well-balanced street system consisting of arterial, collector and local streets which provide for safe and efficient travel throughout the community.
This document, entitled Long Range Transportation Plan 2035 (LRTP), presents the results of a study and planning process conducted to update the long-range transportation-planning element of Fremont’s comprehensive plan, entitled Blueprint for Tomorrow. The LRTP serves as a tool in planning for the community’s transportation system over the next 20-plus years and identifies transportation system needs to support the future, efficient movement of people and goods.
The Long Range Transportation Plan 2035 and Blueprint for Tomorrow were prepared by The Schemmer Associates, in association with Kendig Keast Collaborative and Iteris, Inc. Funding for the project was provided, in part, through the Nebraska Department of Roads’ Comprehensive Plan Assistance Program.
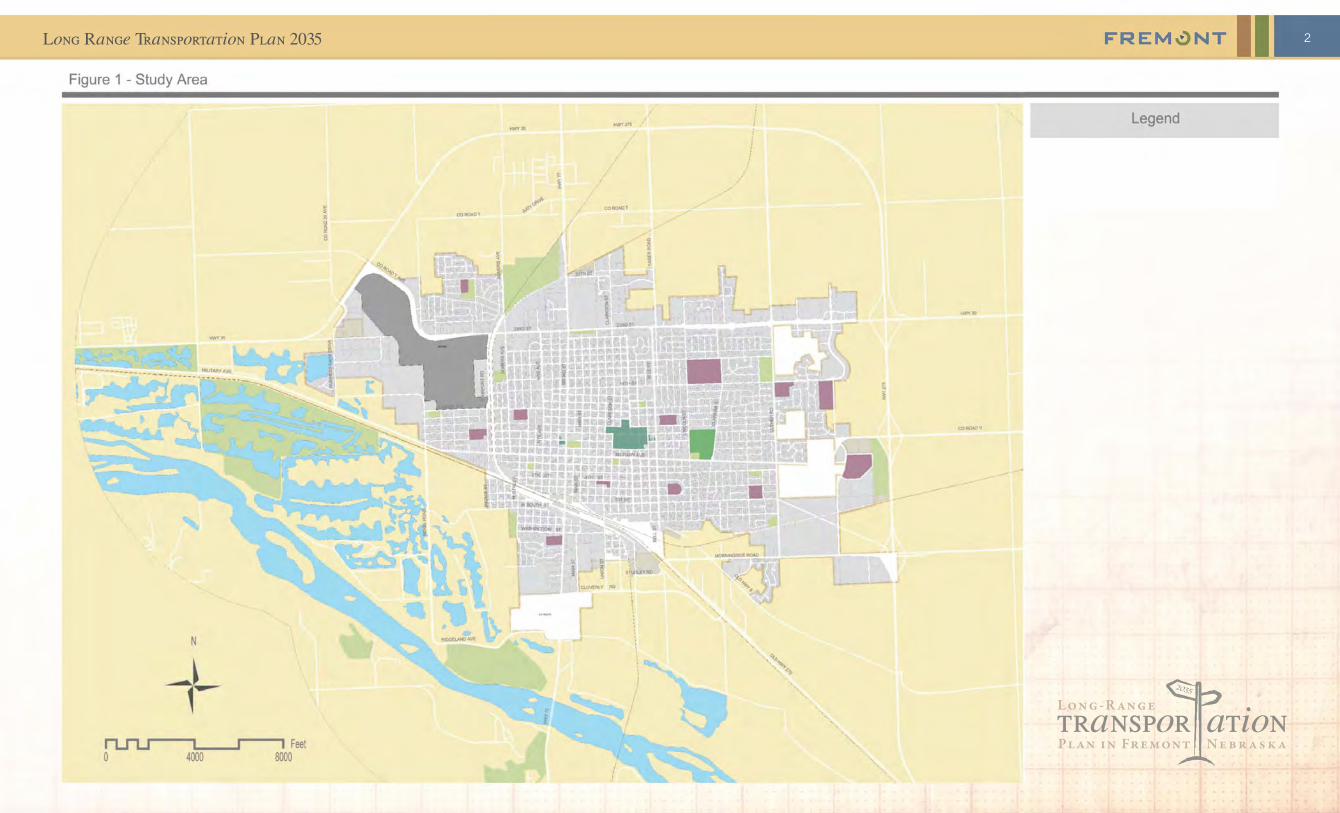
Fremont is located in Dodge County in eastern Nebraska. The 2010 population of Fremont, based on the U.S. Census Bureau, is 26,397. The study area is depicted in Figure 1.
F"REM~NT
BLue NT FOR TOMORROW FREMOr;T. NEBRASKA
Long Range Transportation Plan 2035
transpor ationPl an i n Fr emont N e b r a s k a
Lon g - R an ge2035
2FREM \!l NT
Figure 1 - Study Area
-- _VI Legend
• i
~ ",.,;
• "".",,, 00_'"
~ 8
.~ i Feet orunu~--'-~r--' 4000 8000

Long Range Transportation Plan 2035 3
The primary functional categories for rural and urbanized areas are summarized in Table 1.
Since there is a wide variation in the characteristics and magnitude of service provided by each of these basic functional systems, further stratification of route in these systems is necessary to insure greater adaptability to the specific types of roadways. In rural areas, routes on the principal arterial system are sub-classified as Interstate and other principal arterials; and routes on the collector road system are sub-classified as major collector roads and minor collector roads. In urbanized areas, the routes on the principal arterial system are sub-classified as Interstate, other freeways and expressways and other principal arterials. Each of the systems identified in Table 1 are described below as per Federal classification definitions.
Rural Principal Arterial System
The Rural Principal Arterial System consists of a connected rural network of continuous routes having the following characteristics:
• Serve corridor movements having trip length and travel density characteristics indicative of substantial statewide or interstate travel.
• Serve all, or virtually all, urban areas of 50,000 and over population and a large majority of those with population of 25,000 and over.
Existing Transportation ConditionsThis section summarizes the City of Fremont’s existing transportation conditions. This task was performed so that current data was available to prepare and calibrate the associated travel demand forecasting model. Also, by gathering existing data, existing deficiencies with the transportation network could be identified.
In addition to the gathering of public comment regarding current transportation concerns in Fremont, extensive inventories of existing field conditions were performed. Historical crash data was also reviewed to identify safety deficiencies that could potentially be addressed through transportation improvements included in the transportation plan.
EXISTING TRANSPORTATION SYSTEM
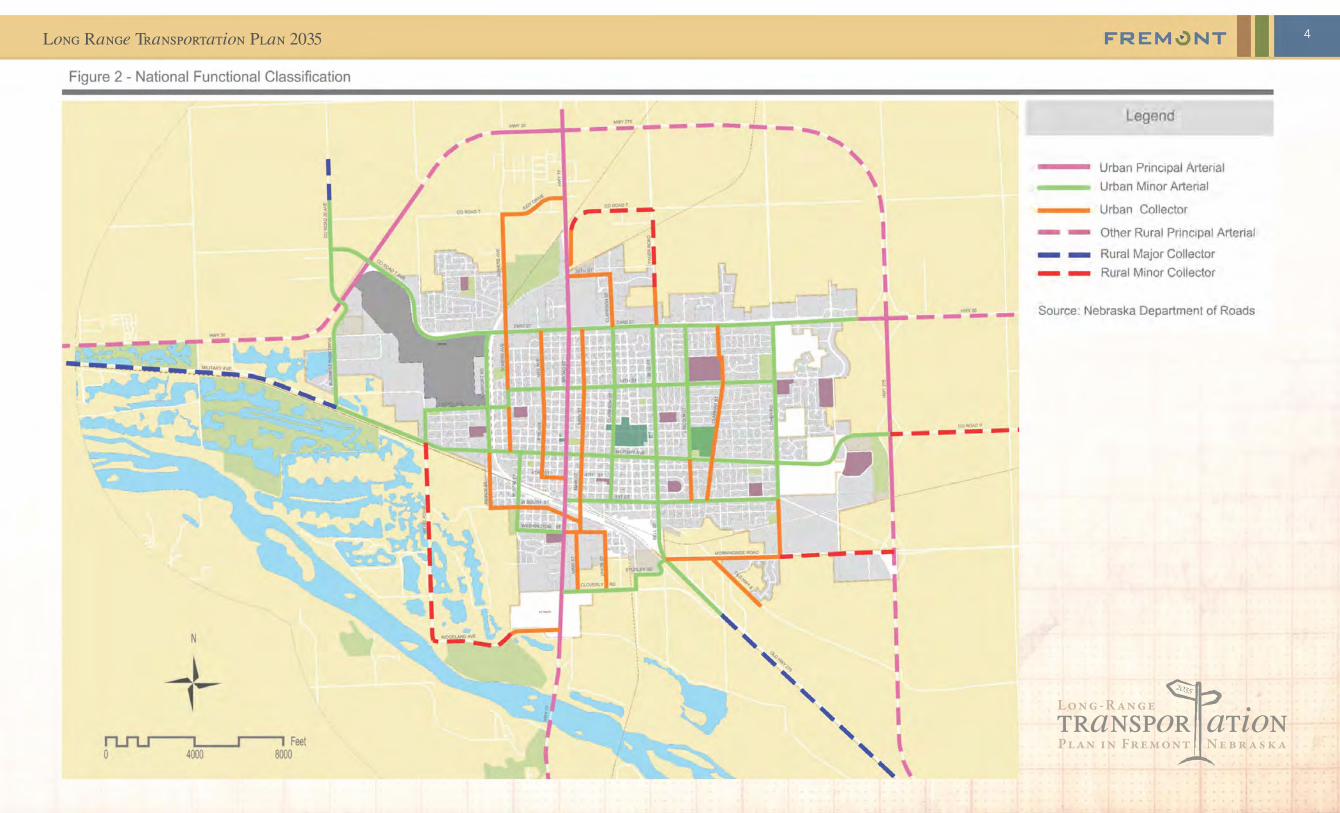
Figure 2 illustrates the existing street network and National functional classification system for Fremont. Roadway functional classification describes how a particular roadway is intended to function with respect to capacity, speed, mobility and level of access provided. Higher functional classifications provide greater capacity, higher speeds, and limited access while lower functional classifications provide lower capacity, lower speeds, and high levels of access to adjacent properties.
PLANNING PROCESS
The vision for transportation in Fremont is a safe, efficient and sustainable transportation system that enhances the quality of life, livability, and economic vitality of the community.
The planning process for Long Range Transportation Plan 2035 was a joint process with Blueprint for Tomorrow. This process involved Fremont city staff, elected officials, and citizens to define the future of its transportation system. The process involved a multi-phase planning program, designed to (1) assess the City’s current conditions; (2) identify future transportation system needs and deficiencies; and (3) consider an action program necessary to address these needs and deficiencies.
Members of the community were invited to participate in the planning process through a city-wide public meeting (Community Symposium) and a project website. Community representatives also served as members of a project steering committee. Details of the process used to gather input from the general public are described later in this document.
Specific to the LRTP process, a travel demand forecasting model was developed to serve as a tool in examining Fremont’s roadway system, predict deficiencies and test alternative solutions, or future projects. This tool is also described in this document.
Table 1 – Hierarchy of Functional Systems
Rural Areas Urbanized Areas
Principal Arterials Principal Arterials
Minor Arterial Roads Minor Arterial Streets
Collector Roads Collector Streets
Local Roads Local Streets
F"REM~NT
Long Range Transportation Plan 2035
transpor ationPl an i n Fr emont N e b r a s k a
Lon g - R an ge2035
4
Figure 2 - National Functional Classification
-
N
n.ru--"]'b-_I-"""'Ji. Feet o 4000 8000
..... m
-,;;;; ..... -"-~I- - - - - - -! - ...... , , \
~~. \ --I I I
FREM \!l NT
Legend
Urban Principal Arterial
Urban Minor Arterial
Urban Collector
- - Other Rural Principal Arterial
_ _ Rural Major Collector
- - Rural Minor Collector
~~'=::~1~~~h.r~~~~b4~T~-:T-f;-::1i~"11 - - ..... ~ - Source Nebraska Department of Roads
I
I
I I
, I ~, I ,
, I , I
" \
"

Long Range Transportation Plan 2035 5
Minor collector roads--These routes should: (1) Be spaced at intervals, consistent with population density, to collect traffic from local roads and bring all developed areas within a reasonable distance of a collector road; (2) provide service to the remaining smaller communities; and (3) link the locally important traffic generators with the surrounding rural area.
Rural Local Road System
The rural local road system should have the following characteristics: (1) Serve primarily to provide access to adjacent land; and (2) provide service to travel over relatively short distances as compared to collectors or other higher systems. Local roads will, of course, constitute the rural mileage not classified as part of the principal arterial, minor arterial, or collector systems.
Urban Principal Arterial System
In every urban environment there exists a system of streets and highways which can be identified as unusually significant to the area in which it lies in terms of the nature and composition of travel it serves. In smaller urban areas (under 50,000 population) these facilities may be very limited in number and extent and their importance may be primarily derived from the service provided to travel passing through
systems. Minor arterials therefore constitute routes whose design should be expected to provide for relatively high overall travel speeds, with minimum interference to-through movement.
Rural Collector Road System
The rural collector routes generally serve travel of primarily intracounty rather than statewide importance and constitute those routes on which (regardless of traffic volume) predominant travel distances are shorter than on arterial routes. Consequently, more moderate speeds may be typical, on the average.
In order to define more clearly the characteristics of rural collectors, this system should be sub-classified according to the following criteria:
Major collector roads--These routes should: (1) Provide service to any county seat not on an arterial route, to the larger towns not directly served by the higher systems, and to other traffic generators of equivalent intracounty importance, such as consolidated schools, shipping points, county parks, important mining and agricultural areas, etc. ; (2) link these places with nearby larger towns or cities, or with routes of higher classification; and (3) serve the more important intracounty travel corridors.
In the Fremont area, the principal arterial system includes all existing rural freeways/expressways.
The principal arterial system is stratified into the interstate system and the other principal arterials system. The interstate system consists of all presently designated routes of the Interstate system while the other principal arterial system consists of all non-Interstate principal arterials.
Rural Minor Arterial Road System
The Rural Minor Arterial Road System should, in conjunction with the principal arterial system, form a rural network having the following characteristics:
• Link cities and larger towns (and other traffic generators, such as major resort areas, that are capable of attracting travel over similarly long distances) and form an integrated network providing interstate and intercounty service.
• Be spaced at such intervals, consistent with population density, so that all developed areas of the State are within a reasonable distance of an arterial highway.
• Provide (because of the two characteristics defined immediately above) service to corridors with trip lengths and travel density greater than those predominantly served by rural collector or local
U.S. Highway 275
F"REM~NT

City of Fremont, Nebraska6
Urban Minor Arterial Street System
The minor arterial street system should interconnect with and augment the urban principal arterial system and provide service to trips of moderate length at a somewhat lower level of travel mobility than principal arterials. This system also distributes travel to geographic areas smaller than those identified with the higher system.
The minor arterial street system includes all arterials not classified as a principal and contains facilities that place more emphasis on land access than the higher system, and offer a lower level of traffic mobility. Such facilities may carry local bus routes and provide intra-community continuity, but ideally should not penetrate identifiable neighborhoods. This system should include urban connections to rural collector roads where such connections have not been classified as urban principal arterials.
The spacing of minor arterial streets may vary from 1/8 - 1/2 mile in the central business district to 2 - 3 miles in the suburban fringes, but should normally be not more than 1 mile in fully developed areas.
the area. In larger urban areas, their importance also derives from service to rural oriented traffic, but equally or even more important, from service for major movements within these urbanized areas.
This system of streets and highways is the urban principal arterial system and should serve the major centers of activity of a metropolitan area, the highest traffic volume corridors, and the longest trip desires; and should carry a high proportion of the total urban area travel on a minimum of mileage. The system should be integrated, both internally and between major rural connections.
The principal arterial system should carry the major portion of trips entering and leaving the urban area, as well as the majority of through movements desiring to bypass the central city. In addition, significant intra-area travel, such as between central business districts and outlying residential areas, between major inner city communities, or between major suburban centers should be served by this system. Frequently the principal arterial system will carry important intra-urban as well as intercity bus routes. Finally, this system in small urban and urbanized areas should provide continuity for all rural arterials which intercept the urban boundary.
Because of the nature of the travel served by the principal arterial system, almost all fully and partially controlled access facilities will be part of this functional system. However, this system is not restricted to controlled access routes. In order to preserve the identification of controlled access facilities, the principal arterial system is stratified as follows: (1) Interstate, (2) other freeways and expressways, and (3) other principal arterials (with no control of access).
The spacing of urban principal arterials will be closely related to the trip-end density characteristics of particular portions of the urban areas. while no firm spacing rule can be established which will apply in all, or even most circumstances, the spacing of principal arterials (in larger urban areas) may vary from less than one mile in the highly developed central business areas to five miles or more in the sparsely developed urban fringes.
For principal arterials, the concept of service to abutting land should be subordinate to the provision of travel service to major traffic movements. It should be noted that only facilities within the “other principal arterial” system are capable of providing any direct access to adjacent land, and such service should be purely incidental to the primary functional responsibility of this system.
Somers Avenue
F"REM~NT

Long Range Transportation Plan 2035 7
transportation plan. Based on statewide crash rate statistics, an intersection crash rate of approximately 0.70 crashes/million entering vehicles (crash/MEV) could be considered typical (average) for most intersections in Fremont. A review of intersection crash data indicated that 18 intersections had crash rates higher than this threshold. Table 2 provides a summary of the crash rate information for these intersections for the three-year period beginning in November 2007 and ending October 2010.
A detailed summary of this information can be found in the Existing Transportation Conditions Technical Memorandum included in Appendix 1 of this document.
model, key traffic and roadway characteristics were inventoried and documented. These characteristics include:
• Number of lanes• Intersection lane configurations• Speed limits• Location of signalized traffic control devices
These characteristics are important in establishing the model roadway network and assigning roadway capacities that reflect field conditions. The number of lanes on each roadway within the modeled network, along with existing posted speed limits and existing signalized traffic control devices are illustrated in figures provided in Appendix 1.
TRAFFIC SAFETY AND OPERATIONS EVALUATION
Although this is a planning study, traffic safety and operational analyses for specific locations throughout the city were performed as part of the existing conditions analysis.
Reported crashes in Fremont over the most recent three years of available data was reviewed for intersections citywide to identify potential safety deficiencies that should be addressed as part of the
Urban Collector Street System
The collector street system provides both land access service and traffic circulation within residential neighborhoods, commercial and industrial areas. It differs from the arterial system in that facilities on the collector system may penetrate residential neighborhoods, distributing trips from the arterials through the area to the ultimate destination. Conversely, the collector street also collects traffic from local streets in residential neighborhoods and channels it into the arterial system. In the central business district, and in other areas of like development and traffic density, the collector system may include the street grid which forms a logical entity for traffic circulation.
Urban Local Street System
The local street system comprises all facilities not on one of the higher systems. It serves primarily to provide direct access to abutting land and access to the higher order systems. It offers the lowest level of mobility and usually contains no bus routes. Service to through, traffic movement usually is deliberately discouraged.
FIELD REVIEW AND DATA COLLECTION SUMMARY
To fully understand the existing transportation system and to provide inputs to the transportation
Bell Street & 23rd Street
F"REM~NT

City of Fremont, Nebraska8
Traffic operations at key intersections throughout the city were reviewed to identify potential operational deficiencies that should be addressed as part of the transportation plan.
The performance of a street is determined by using “level of service” or LOS, which examines factors such as speed, travel time, maneuverability, interruptions, and safety. The various LOS levels are described below.
• LOS A: This describes free-flowing operation. Vehicles face few impediments in maneuvering. The driver has a high level of physical and psychological comfort. Minor accidents or breakdowns cause little interruption in the traffic stream. Control delay at signalized and unsignalized intersections is minimal.
• LOS B: This condition is a reasonably free-flowing operation. Maneuvering ability is slightly restricted, but ease of movement remains high.
• LOS C: This level provides stable operation. Traffic flows approach the range in which increases in traffic will degrade service. Minor incidents can be absorbed, but a local slowdown of traffic will result. In large urban settings, LOS C is a good level of service to work toward.
• LOS D: This level borders on an unstable traffic flow. Small traffic increases produce substantial
Table 2 – Intersection Crash Rates
Intersections No. of Crashes (3-years) Daily Traffic Volume1 Crash Rate2
(crash/MEV)
1st Street & Bell Street 17 13,400 1.16
1st Street & Lincoln Avenue 5 4,300 1.06
10th Street & Clarkson Street 6 7,750 0.71
16th Street & Clarkson Street 10 10,800 0.85
16th Street & Clarmar Avenue 5 5,150 0.88
16th Street & Lincoln Avenue 9 8,050 1.02
16th Street & Nye Avenue 9 5,700 1.45
23rd Street & Clarkson Street 29 27,750 0.95
23rd Street & Lincoln Avenue 26 21,800 1.09
23rd Street & Milton Road 13 15,150 0.78
23rd Street & Somers Avenue 14 11,750 1.09
23rd Street & Broad Street 29 28,650 0.93
Bell Street & Military Avenue 20 22,950 0.80
Military Avenue & Clarkson Street 16 17,550 0.83
Military Avenue & Howard Street 8 6,750 1.09
Military Avenue & Johnson Road 5 6,300 0.72
Military Avenue & Luther Road 6 7,950 0.69
Military Avenue & Ridge Road 8 3,900 1.88
1 Daily volume data was not available at all locations. Where necessary, volumes were assumed based on roadway characteristics and volumes along other roadways with similar characteristics.
2 Crashes per million entering vehicles (MEV).
Broad Street (U.S. Highway 77)
F"REM~NT

Long Range Transportation Plan 2035 9
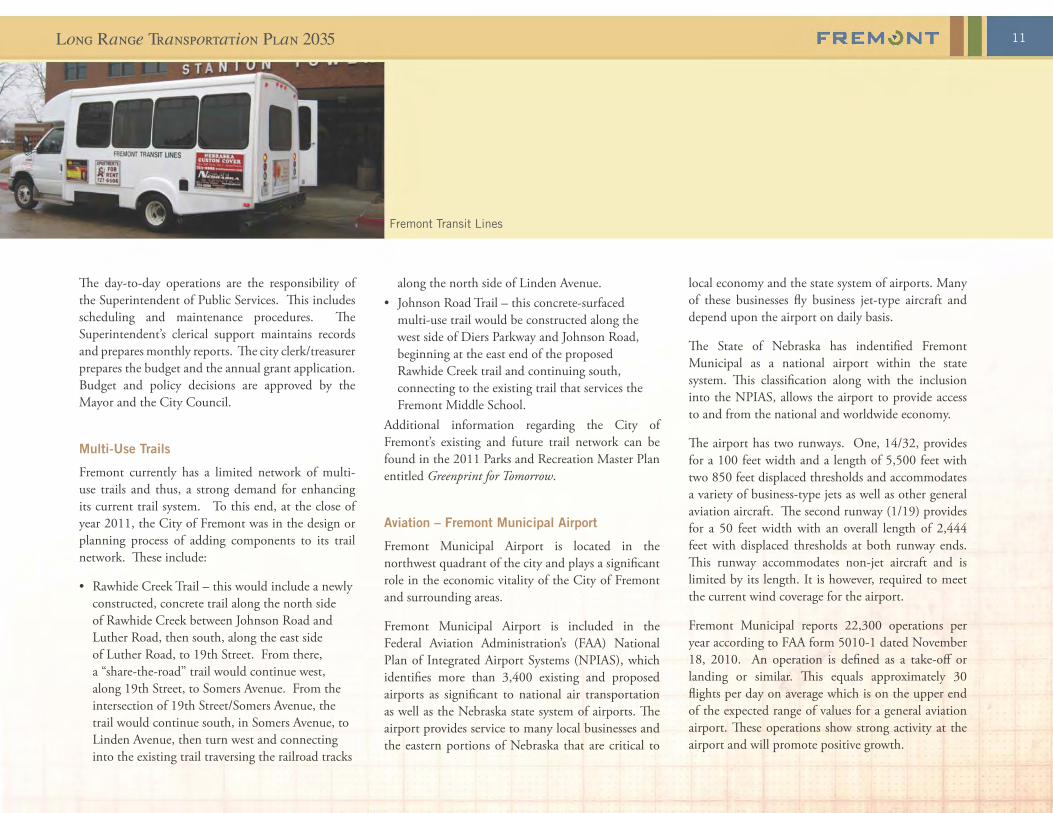
• Seniors (60+ years) $0.75• Disabled $0.75• Riders (ages 6-59) $1.50• Riders (ages 5 and under) FreeFremont Transit Lines maintains a fleet of two vans, both of which are lift-equipped to accommodate riders with special needs. Each van has the capacity to carry 12 passengers with additional space for up to two passengers in a wheelchair. The 2010-2011 operating budget was approximately $89,000. During the last three years, transit ridership averaged slightly more than 2,900 riders per year.
Marketing and promotion of Fremont Transit Lines includes the dissemination of bus schedules to various local organizations. Schedules are also posted at Fremont Towers, Arbor Manor, HyVee, Fremont Friendship Center, Salvation Army, Nye Point Health & Rehab Center, Fremont Area Medical Center, Keene Memorial Library and the City of Fremont Municipal Building.
ALTERNATIVE TRANSPORTATION MODESTransit
The City of Fremont, with assistance from Federal and State sources, funds the Fremont Transit Lines which provides a fixed-route system that services the needs of the elderly, disabled and general public. Presently, two routes, both of which originate from 6th & Main Streets, are included in the fixed-route system and are illustrated in Figure 3. Deviations are made from these routes by special arrangements. The service area includes the area within the corporate limits of Fremont and the contiguous Village of Inglewood.
Presently, the east route operates from 8:45 a.m. to approximately 4:30 p.m. and the west route operates from 10:15 a.m. to approximately 2:50 p.m. Both routes operate Monday through Saturday, except for legal holidays. The current (2011) fare structure is as follows:
service deterioration. Maneuverability is limited and comfort levels are reduced. LOS D is frequently used as a compromise standard in dense urban settings.
• LOS E: This level represents typical operation at full design capacity of a street. Operations are extremely unstable, because there is little margin for error in the traffic stream.
• LOS F: This condition is a breakdown in the system. Such conditions exist when queues form behind a breakdown or congestion point. This occurs when traffic exceeds the design capacity of the street.
Average vehicle delay was calculated for four locations that have been identified historically as experiencing some level of traffic congestion. The results of these calculations are summarized in Table 3. A detailed summary of this information can also be found in the Existing Transportation Conditions Technical Memorandum included in Appendix 1 of this document.
Table 3: Summary of Intersection Analysis – Existing (2010) Conditions
Intersection Time PeriodLevel of Service
Intersection NB SB EB WB
Signalized Intersections
Broad Street (U.S.-77) & 23rd StreetAM Peak C B B C C
PM Peak C B B C C
Broad Street (U.S.-77) & Military AvenueAM Peak C C B C C
PM Peak C C B C C
23rd Street & Bell StreetAM Peak C B D C C
PM Peak C C C C C
Unsignalized Intersection
Military Avenue & Luther RoadAM Peak - D D E E
PM Peak - C C D DNote: Capacity analysis methodology does not report level-of-service (LOS) for entire intersection.
F"REM~NT
-----

City of Fremont, Nebraska10
Figure 3 - Fremont Transit Lines Bus Route 2010
F"REM~NT
~- "'- / -.= -~ / i I ~ FREMONT TRANSIT LINES ~ ~ 111
" 1.1, ;-l / d .:~::: " ' p~US ROUTE i ~; Ii;"" ! / ... ~ 1: . ~~~ • i ~: 2010 i : -- z/ k " 7: J I h/~' l
• I I I · -~ /I I~ ~ HOSPfT~ --~. i 1.(I •• n W ...... T.c: I .. ~
J If heSt. n "'..... I:: . 'I"'" ~_ ./1\ _ •• - _ •• - -"1'!.~" -..;; - ~ ~ ~ \1 J,-----
'.--_-1-' ... u..... I, :I If I
Long Range Transportation Plan 2035 11
local economy and the state system of airports. Many of these businesses fly business jet-type aircraft and depend upon the airport on daily basis.
The State of Nebraska has indentified Fremont Municipal as a national airport within the state system. This classification along with the inclusion into the NPIAS, allows the airport to provide access to and from the national and worldwide economy.
The airport has two runways. One, 14/32, provides for a 100 feet width and a length of 5,500 feet with two 850 feet displaced thresholds and accommodates a variety of business-type jets as well as other general aviation aircraft. The second runway (1/19) provides for a 50 feet width with an overall length of 2,444 feet with displaced thresholds at both runway ends. This runway accommodates non-jet aircraft and is limited by its length. It is however, required to meet the current wind coverage for the airport.
Fremont Municipal reports 22,300 operations per year according to FAA form 5010-1 dated November 18, 2010. An operation is defined as a take-off or landing or similar. This equals approximately 30 flights per day on average which is on the upper end of the expected range of values for a general aviation airport. These operations show strong activity at the airport and will promote positive growth.
along the north side of Linden Avenue.• Johnson Road Trail – this concrete-surfaced
multi-use trail would be constructed along the west side of Diers Parkway and Johnson Road, beginning at the east end of the proposed Rawhide Creek trail and continuing south, connecting to the existing trail that services the Fremont Middle School.
Additional information regarding the City of Fremont’s existing and future trail network can be found in the 2011 Parks and Recreation Master Plan entitled Greenprint for Tomorrow.
Aviation – Fremont Municipal Airport
Fremont Municipal Airport is located in the northwest quadrant of the city and plays a significant role in the economic vitality of the City of Fremont and surrounding areas.
Fremont Municipal Airport is included in the Federal Aviation Administration’s (FAA) National Plan of Integrated Airport Systems (NPIAS), which identifies more than 3,400 existing and proposed airports as significant to national air transportation as well as the Nebraska state system of airports. The airport provides service to many local businesses and the eastern portions of Nebraska that are critical to
The day-to-day operations are the responsibility of the Superintendent of Public Services. This includes scheduling and maintenance procedures. The Superintendent’s clerical support maintains records and prepares monthly reports. The city clerk/treasurer prepares the budget and the annual grant application. Budget and policy decisions are approved by the Mayor and the City Council.
Multi-Use Trails
Fremont currently has a limited network of multi-use trails and thus, a strong demand for enhancing its current trail system. To this end, at the close of year 2011, the City of Fremont was in the design or planning process of adding components to its trail network. These include:
• Rawhide Creek Trail – this would include a newly constructed, concrete trail along the north side of Rawhide Creek between Johnson Road and Luther Road, then south, along the east side of Luther Road, to 19th Street. From there, a “share-the-road” trail would continue west, along 19th Street, to Somers Avenue. From the intersection of 19th Street/Somers Avenue, the trail would continue south, in Somers Avenue, to Linden Avenue, then turn west and connecting into the existing trail traversing the railroad tracks
Fremont Transit Lines
F"REM~NT

City of Fremont, Nebraska12
• Lack of trail connectivity/system and sidewalks (e.g. Ridge Road to State Lakes)
• Lack of public transit/school busing/general transit services
• Truck traffic (e.g. to/from grain elevator traveling through Downtown)
• West Military Avenue; vehicle and pedestrian safety
• Downtown one-way streets• Lack of traffic control (stop signs? South of
Military, East/West vs. North/South flow. What is the priority?)
• General congestion/safety of arterial and collector streets
• Sidewalks (particularly in the eastern part of town)• Drainage on roadways, flooding issues• Cloverly improved aesthetics of streets• Limited access/routes to/from East Fremont• Poor geometrics at Morningside Road/Old Hwy 8
“Y” intersection• Congestion, safety deficiencies on West Military
Avenue• Lack of gateway signage at the community
entryways• General school congestion (e.g. Middle School),
adjacent roadway congestion
issues and solutions with respect to each topic. The list of priorities, issues and solutions for the topic of “transportation” is provided below.
PRIORITIES
• Southeast Beltway• West Military Avenue• Middle School / 5th & 6th Grade School – traffic
concerns• Trails and sidewalks• U.S. Highway 30
ISSUES
• Getting across town is difficult due to changing speed limits, poorly timed traffic signals, and poor circulation and the congestion near the Middle School
• Military Avenue / Johnson Road: school area traffic safety/congestion
• U.S. Highway 77 / Ridge Road – location of Southeast Beltway is a question
• Service roads along U.S. Highway 275 • Importance of Southeast Bypass to ease other
traffic issues• Improve roadway alignment (north/south) at 23rd
Street and Yager Road
The airport has 55 based aircraft housed in tee or open bay-type t-hangars with a hanger space waiting list for approximately 12 aircraft. Fifty based aircraft is considered on the upper end of the expected ranges of values for a general aviation airport. Types of based aircraft range from large twin turbo prop business aircraft to piston driven single-engine.
Public InputThe process of updating Fremont’s LRTP included public involvement and coordination with City officials, staff and community leaders. These efforts included technical interviews, a project steering committee and a community symposium.
More than 200 community residents, business owners, and other stakeholders participated in the Fremont Community Symposium, held at the Fremont Middle School on January 17, 2011. This symposium served as a public input session to help guide the development of the City’s Comprehensive Plan (Blueprint for Tomorrow), Parks and Recreation Plan (Greenprint for Tomorrow)and the Long-Range Transportation Plan. In an informal, open-house atmosphere, participants rotated between topical discussion groups, one of which was “transportation.” The results of these discussion groups enabled the project team to develop a list of community priorities,
Project Steering Committee
F"REM~NT

Long Range Transportation Plan 2035 13
• Provide future East / West street connections• Identify locations of ADA compliance issues and
implement solutions• Open 1st Street using traffic signals for control
Symposium attendees were also afforded the opportunity to provide handwritten comments submitted through a drop box. A listing of these comments is provided below.
• Hwy 77 entry into town from South is unattractive
• Viaduct over railroad is too close Johnson Road, 1st Street, and Luther
• What is the time range as to likely completion of the 23rd St. viaduct?
• Military Avenue – 30mph (US Bell at 35 mph)• Broad and Military – congestion on Broad• Johnson Road and Military – traffic is terrible
during school hours. A solution would be a round about similar to Blair.
• Broad Street still hard to get on from side streets with huge trees blocking view
• Is there a plan to put a road from Yager to Lincoln Street?
• Is there a plan to put a road east to west form Yager railroad to Luther Road? Needs to be a north route east and west
• Hard to get on from the west going North on Yager, ties up one lane at 23rd Street intersection
• Nobody stops at “don’t block intersections” at Yager Road
• Fremont builds new schools and issues bonds for upgrades but doesn’t require homeowners to install sidewalks, huge safety issues for kids walking to and from school. Bell Field students walk in the street.
• No right turn light sign at 23rd Street at the mall – coming out of mall
provide busses to Middle School and 5th and 6th Grade campus)
• West Military Avenue - improve geometrics, better accommodate pedestrians and bicycles
• Evaluate travel patterns south of Military Avenue• Widen and improve pedestrian safety routes• Build more sidewalks• Create better street design standards to include
landscaping• Construct railroad viaduct along Johnson Road• Construct Morningside Road / Old Hwy 8
intersection improvements• Construct West 23rd Street viaduct, fill-in
ditches, and widen to three lanes• Implement entryway enhancements at key
locations• Fill-in gaps in the current street system with street
extensions, particularly to address access to the schools
• Provide more roundabouts, traffic calming improvements, 1st Street improvements, and the Johnson to Morningside viaduct
• Public transit needs more service and more routes and bus stops, plus additional federal/state funding
• Expand U.S. Highway 30 (west) to four lanes• Widen Broad Street to four lanes• Improve street lighting throughout the city• Convert downtown streets to two-way streets• Don’t close the Linden railroad crossing• Implement the Southeast Beltway to remove
trucks from downtown (i.e., identify alternate truck route)
• Construct new trails adjacent to roadways or on existing (filled-in) ditches; trail funding to build and connect trails (e.g. to State Lakes)
• Provide a better connection between Yager Road and Luther Road
• Northwest access, Hwy 30 improvements needed• Poor North / South traffic flow• New railroad spurs/lines?• Dark roadways/streets• Closure of the Linden railroad crossing as part of
W. 23rd Street viaduct project• Lack of school buses or transit• Trucks on West Military Avenue• More bike trails, school access?• Yager Road to Luther Road connector• Sidewalk snow removal issues west side of town• Drainage way maintenance is needed• South and West side levees, Corps Certification?• Washington Height inaccessibility (Northwest
area near golf course)• What is the future of the airport? Expansion of
airport?• YMCA area, not only trails, better roads, bike
lanes, etc• General ADA compliance issues (i.e., ramps, etc.)• Development of future frontage roads• Congestion along 23rd Street, particularly around
the mall, e.g. vehicle queuing• West Hwy 30 - interest in future connectivity,
access to industrial area, etc.SOLUTIONS
• Military Avenue / Johnson Road consideration of traffic signal, bus access and routing, use of a geometric s-curve or a roundabout, etc.
• Hwy 77 bridge location? Bypass?• Build the Southeast Bypass• Development policy regarding 23rd Street and
Yager Road• Provide public transit (at least minimal) and
school busing• Better public and school transportation (e.g.
F"REM~NT

City of Fremont, Nebraska14
• 1st Street connection between Luther and Johnson Roads is essential – the future is nearly here with the opening of the 5th and 6th grade school. The project has the support of the schools, utilities and, as I understand it, the city & railroad is supportive. It needs to be a priority.
• Buses transporting all children to the Middle School & future 5th and 6th grade school may be a “nice idea” but it is totally cost prohibitive without a substantial increase in taxes. With a nearly stagnant level of valuation, less than 1%, major expenditures on busses, drivers, and infrastructure is not realistic.
• Reconsider the closing of the Linden Avenue railroad crossing
• Can we close the ditches on 5th Street and also on Clarmar? They attract bugs and snakes.
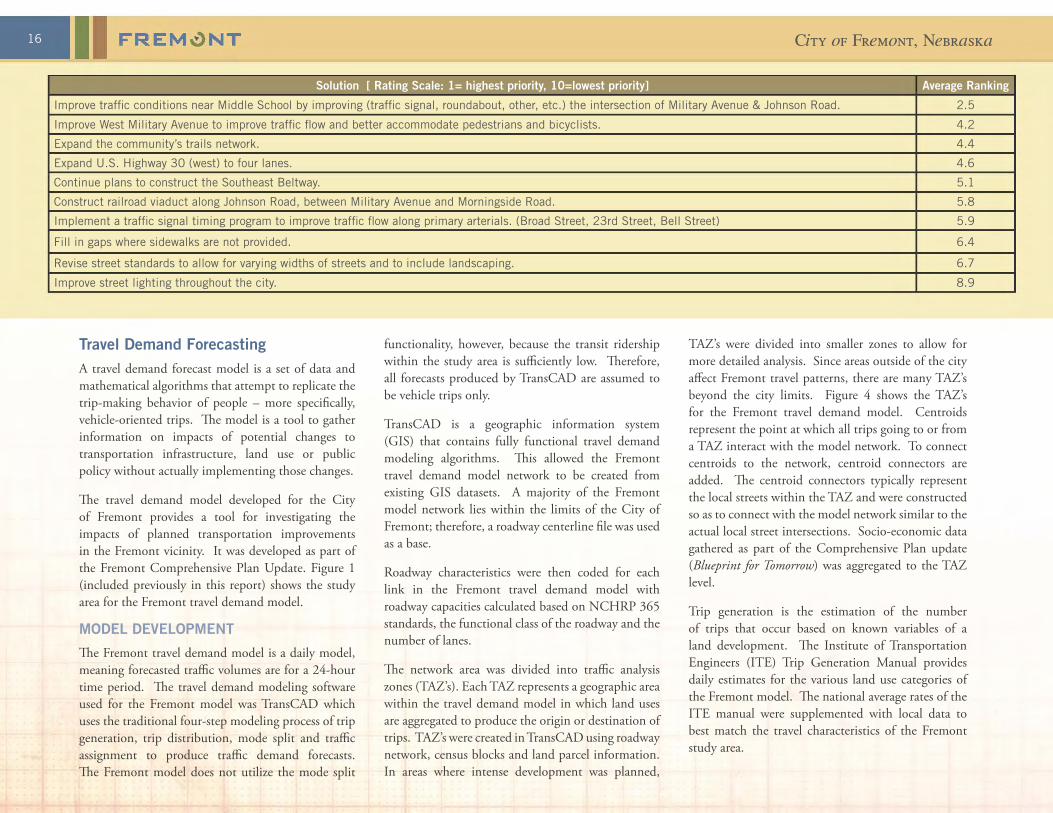
From these lists, members of the project steering committee where then asked to rate the level of importance of these issues that were identified at the symposium and to develop a priority list of transportation solutions. The results of these two activities are summarized on the next page.
Omaha, NE• Need to enable trucks from West Hwy 30 and
Hwy 77 to access downtown and Southeast processing plants from Southeast bypass
• It is imperative to re-route the trucks that travel through the heart of our city
• We would love to see a Southeast Bypass sooner than later, Hwy 77 – southeast bypass
• Traffic flow – keep heavy truck traffic moving through town but also offering services 77, 30, 275, move trucks and cars separately as each have their own needs.
• Extend 1st Street east to Johnson Road. Viaduct on Johnson Road south and train tracks allows alternate flow east to expressway
• West Military from Pierce to the lakes for widening and including trails
• City bus service – suggestion – Deerfield community is part of city but has no bus service
• Pay-as-you-go transportation would have to be privatized and not school run. Income from riders would be an accountable receipt under current state aid formula. As such, state aid would be reduced dollar for dollar. Net result would be an increase in operational costs of district hence property taxes would have to increase.
• Why are there yellow lines on 19th Street making it look like a through street? Make 19th a through street or take off yellow lines
• Traffic moves slow through town – Hwy 30/23rd St. at late morning – through lunch hour this town is hopping; looks like Omaha traffic during rush hour on 23rd/Hwy 30
• Tie in Yager Road with 23rd and Bell at the mall• Build more hangars at airport• Airport expansion• Getting stop lights to change at same time (e.g.
synchronizing signals) • Safe passage for kids/bikes from east to west to
schools• Turn arrow signals – at the following intersections
» 16th and Broad » 23rd & Lincoln with a right turn lane to go
right only » Clarkson and Military » Lincoln and Military
• New stop lights at Luther and Military (schools)• New stop lights at Cloverly Road and South
Broad• New stop lights at 16th and Lincoln (schools)• Beautification of entrances to city through tree
plantings, boulevards, etc, i.e. Abbott Drive in
Community Symposium Breakout Group (Source: Fremont Tribune)
F"REM~NT
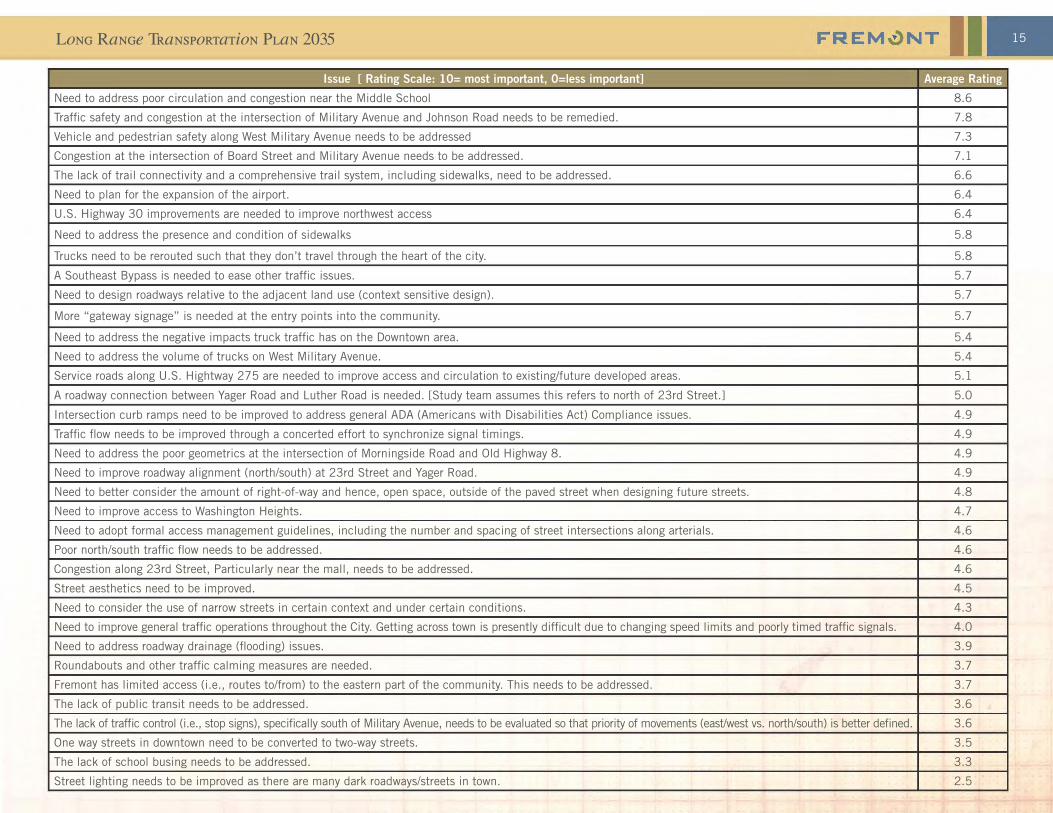
Long Range Transportation Plan 2035 15
Issue [ Rating Scale: 10= most important, 0=less important] Average Rating
Need to address poor circulation and congestion near the Middle School 8.6
Traffic safety and congestion at the intersection of Military Avenue and Johnson Road needs to be remedied. 7.8
Vehicle and pedestrian safety along West Military Avenue needs to be addressed 7.3
Congestion at the intersection of Board Street and Military Avenue needs to be addressed. 7.1
The lack of trail connectivity and a comprehensive trail system, including sidewalks, need to be addressed. 6.6
Need to plan for the expansion of the airport. 6.4
U.S. Highway 30 improvements are needed to improve northwest access 6.4
Need to address the presence and condition of sidewalks 5.8
Trucks need to be rerouted such that they don’t travel through the heart of the city. 5.8
A Southeast Bypass is needed to ease other traffic issues. 5.7
Need to design roadways relative to the adjacent land use (context sensitive design). 5.7
More “gateway signage” is needed at the entry points into the community. 5.7
Need to address the negative impacts truck traffic has on the Downtown area. 5.4
Need to address the volume of trucks on West Military Avenue. 5.4
Service roads along U.S. Hightway 275 are needed to improve access and circulation to existing/future developed areas. 5.1
A roadway connection between Yager Road and Luther Road is needed. [Study team assumes this refers to north of 23rd Street.] 5.0
Intersection curb ramps need to be improved to address general ADA (Americans with Disabilities Act) Compliance issues. 4.9
Traffic flow needs to be improved through a concerted effort to synchronize signal timings. 4.9
Need to address the poor geometrics at the intersection of Morningside Road and Old Highway 8. 4.9
Need to improve roadway alignment (north/south) at 23rd Street and Yager Road. 4.9
Need to better consider the amount of right-of-way and hence, open space, outside of the paved street when designing future streets. 4.8
Need to improve access to Washington Heights. 4.7
Need to adopt formal access management guidelines, including the number and spacing of street intersections along arterials. 4.6
Poor north/south traffic flow needs to be addressed. 4.6
Congestion along 23rd Street, Particularly near the mall, needs to be addressed. 4.6
Street aesthetics need to be improved. 4.5
Need to consider the use of narrow streets in certain context and under certain conditions. 4.3
Need to improve general traffic operations throughout the City. Getting across town is presently difficult due to changing speed limits and poorly timed traffic signals. 4.0
Need to address roadway drainage (flooding) issues. 3.9
Roundabouts and other traffic calming measures are needed. 3.7
Fremont has limited access (i.e., routes to/from) to the eastern part of the community. This needs to be addressed. 3.7
The lack of public transit needs to be addressed. 3.6
The lack of traffic control (i.e., stop signs), specifically south of Military Avenue, needs to be evaluated so that priority of movements (east/west vs. north/south) is better defined. 3.6
One way streets in downtown need to be converted to two-way streets. 3.5
The lack of school busing needs to be addressed. 3.3
Street lighting needs to be improved as there are many dark roadways/streets in town. 2.5
F"REM~NT
City of Fremont, Nebraska16
TAZ’s were divided into smaller zones to allow for more detailed analysis. Since areas outside of the city affect Fremont travel patterns, there are many TAZ’s beyond the city limits. Figure 4 shows the TAZ’s for the Fremont travel demand model. Centroids represent the point at which all trips going to or from a TAZ interact with the model network. To connect centroids to the network, centroid connectors are added. The centroid connectors typically represent the local streets within the TAZ and were constructed so as to connect with the model network similar to the actual local street intersections. Socio-economic data gathered as part of the Comprehensive Plan update (Blueprint for Tomorrow) was aggregated to the TAZ level.
Trip generation is the estimation of the number of trips that occur based on known variables of a land development. The Institute of Transportation Engineers (ITE) Trip Generation Manual provides daily estimates for the various land use categories of the Fremont model. The national average rates of the ITE manual were supplemented with local data to best match the travel characteristics of the Fremont study area.
functionality, however, because the transit ridership within the study area is sufficiently low. Therefore, all forecasts produced by TransCAD are assumed to be vehicle trips only.
TransCAD is a geographic information system (GIS) that contains fully functional travel demand modeling algorithms. This allowed the Fremont travel demand model network to be created from existing GIS datasets. A majority of the Fremont model network lies within the limits of the City of Fremont; therefore, a roadway centerline file was used as a base.
Roadway characteristics were then coded for each link in the Fremont travel demand model with roadway capacities calculated based on NCHRP 365 standards, the functional class of the roadway and the number of lanes.
The network area was divided into traffic analysis zones (TAZ’s). Each TAZ represents a geographic area within the travel demand model in which land uses are aggregated to produce the origin or destination of trips. TAZ’s were created in TransCAD using roadway network, census blocks and land parcel information. In areas where intense development was planned,
Travel Demand ForecastingA travel demand forecast model is a set of data and mathematical algorithms that attempt to replicate the trip-making behavior of people – more specifically, vehicle-oriented trips. The model is a tool to gather information on impacts of potential changes to transportation infrastructure, land use or public policy without actually implementing those changes.
The travel demand model developed for the City of Fremont provides a tool for investigating the impacts of planned transportation improvements in the Fremont vicinity. It was developed as part of the Fremont Comprehensive Plan Update. Figure 1 (included previously in this report) shows the study area for the Fremont travel demand model.
MODEL DEVELOPMENT
The Fremont travel demand model is a daily model, meaning forecasted traffic volumes are for a 24-hour time period. The travel demand modeling software used for the Fremont model was TransCAD which uses the traditional four-step modeling process of trip generation, trip distribution, mode split and traffic assignment to produce traffic demand forecasts. The Fremont model does not utilize the mode split
Solution [ Rating Scale: 1= highest priority, 10=lowest priority] Average Ranking
Improve traffic conditions near Middle School by improving (traffic signal, roundabout, other, etc.) the intersection of Military Avenue & Johnson Road. 2.5
Improve West Military Avenue to improve traffic flow and better accommodate pedestrians and bicyclists. 4.2
Expand the community’s trails network. 4.4
Expand U.S. Highway 30 (west) to four lanes. 4.6
Continue plans to construct the Southeast Beltway. 5.1
Construct railroad viaduct along Johnson Road, between Military Avenue and Morningside Road. 5.8
Implement a traffic signal timing program to improve traffic flow along primary arterials. (Broad Street, 23rd Street, Bell Street) 5.9
Fill in gaps where sidewalks are not provided. 6.4
Revise street standards to allow for varying widths of streets and to include landscaping. 6.7
Improve street lighting throughout the city. 8.9
F"REM~NT

Long Range Transportation Plan 2035 17
Figure 4 - Fremont Model Traffic Analysis Zones
I , I I , , • I •
US-JI
\ \ \
\ •
• I I
lit ..... to.. • rn ~
I
•
.--.
I I
---l \
\ \
,
F"REM~NT
- ..
I , , • 1 I
--. • I , \ ,
- -- e 2 • I •
• • I •
on I r-. • • rn ~
- --.
,.-
'.
City of Fremont, Nebraska18
Street to Yager Road• 32nd Street road addition from Yager Road to
Luther Road• 1st Street road addition from Luther Road to
Johnson Road; closure of 1st Street railroad crossing
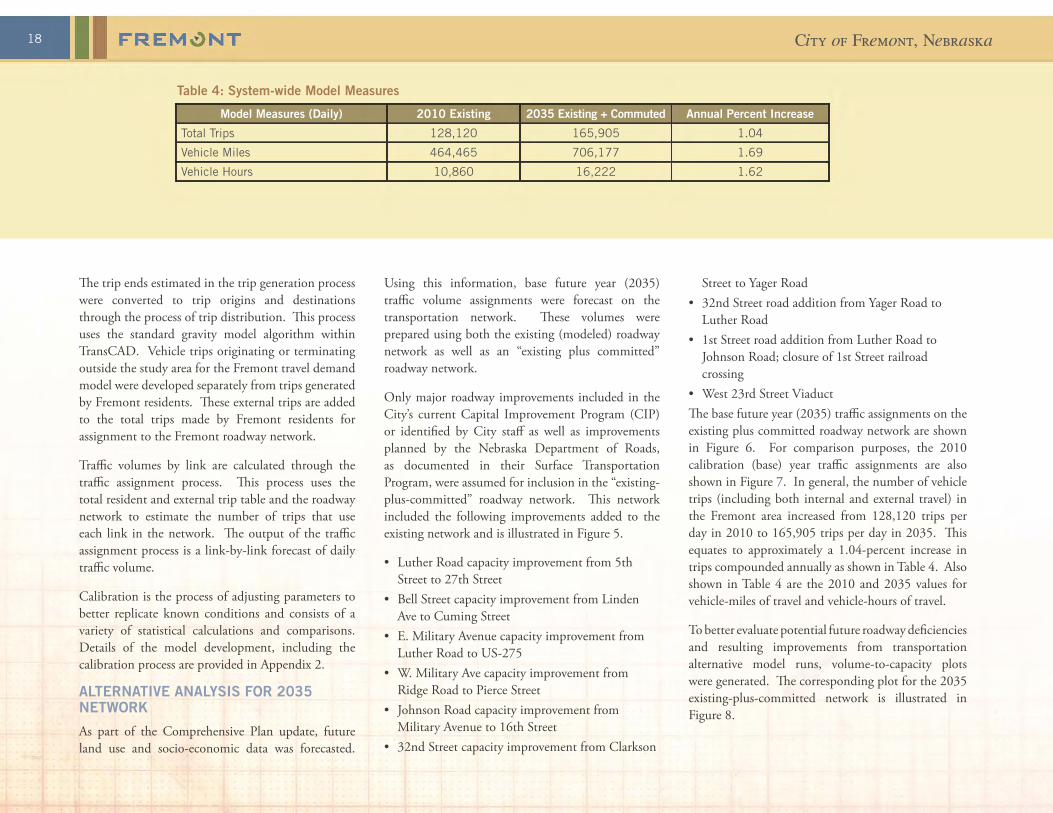
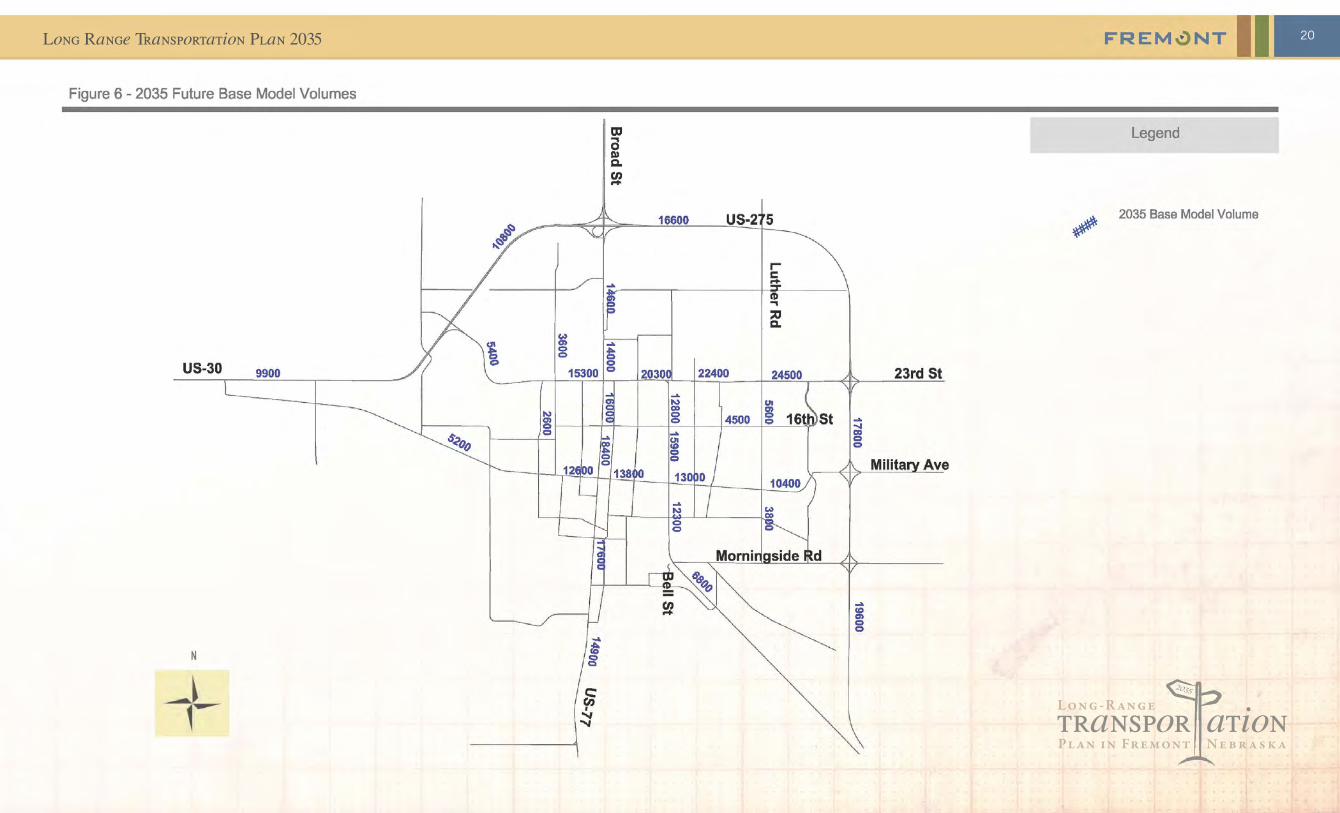
• West 23rd Street ViaductThe base future year (2035) traffic assignments on the existing plus committed roadway network are shown in Figure 6. For comparison purposes, the 2010 calibration (base) year traffic assignments are also shown in Figure 7. In general, the number of vehicle trips (including both internal and external travel) in the Fremont area increased from 128,120 trips per day in 2010 to 165,905 trips per day in 2035. This equates to approximately a 1.04-percent increase in trips compounded annually as shown in Table 4. Also shown in Table 4 are the 2010 and 2035 values for vehicle-miles of travel and vehicle-hours of travel.
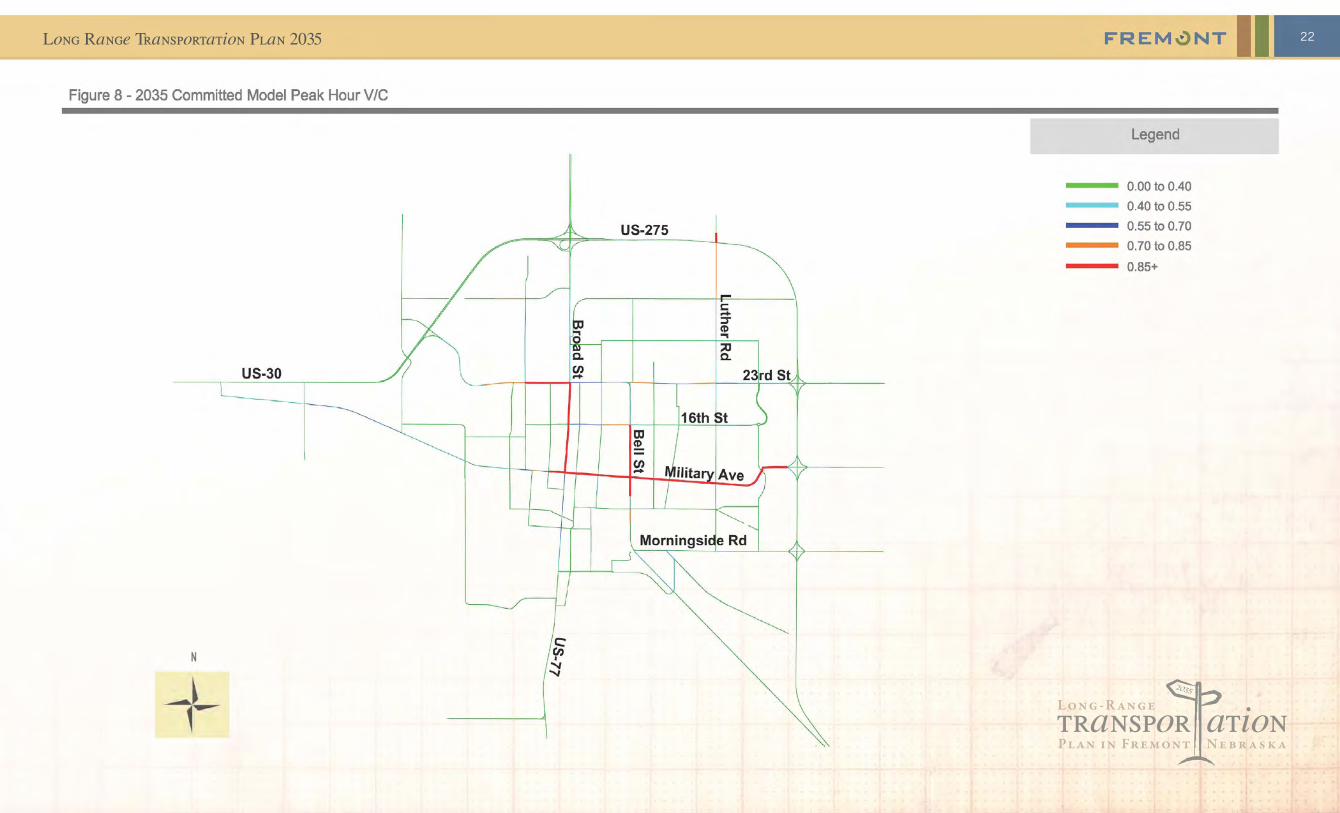
To better evaluate potential future roadway deficiencies and resulting improvements from transportation alternative model runs, volume-to-capacity plots were generated. The corresponding plot for the 2035 existing-plus-committed network is illustrated in Figure 8.
Using this information, base future year (2035) traffic volume assignments were forecast on the transportation network. These volumes were prepared using both the existing (modeled) roadway network as well as an “existing plus committed” roadway network.
Only major roadway improvements included in the City’s current Capital Improvement Program (CIP) or identified by City staff as well as improvements planned by the Nebraska Department of Roads, as documented in their Surface Transportation Program, were assumed for inclusion in the “existing-plus-committed” roadway network. This network included the following improvements added to the existing network and is illustrated in Figure 5.
• Luther Road capacity improvement from 5th Street to 27th Street
• Bell Street capacity improvement from Linden Ave to Cuming Street
• E. Military Avenue capacity improvement from Luther Road to US-275
• W. Military Ave capacity improvement from Ridge Road to Pierce Street
• Johnson Road capacity improvement from Military Avenue to 16th Street
• 32nd Street capacity improvement from Clarkson
The trip ends estimated in the trip generation process were converted to trip origins and destinations through the process of trip distribution. This process uses the standard gravity model algorithm within TransCAD. Vehicle trips originating or terminating outside the study area for the Fremont travel demand model were developed separately from trips generated by Fremont residents. These external trips are added to the total trips made by Fremont residents for assignment to the Fremont roadway network.
Traffic volumes by link are calculated through the traffic assignment process. This process uses the total resident and external trip table and the roadway network to estimate the number of trips that use each link in the network. The output of the traffic assignment process is a link-by-link forecast of daily traffic volume.
Calibration is the process of adjusting parameters to better replicate known conditions and consists of a variety of statistical calculations and comparisons. Details of the model development, including the calibration process are provided in Appendix 2.
ALTERNATIVE ANALYSIS FOR 2035 NETWORK
As part of the Comprehensive Plan update, future land use and socio-economic data was forecasted.
Table 4: System-wide Model Measures
Model Measures (Daily) 2010 Existing 2035 Existing + Commuted Annual Percent Increase
Total Trips 128,120 165,905 1.04
Vehicle Miles 464,465 706,177 1.69
Vehicle Hours 10,860 16,222 1.62
F"REM~NT

Long Range Transportation Plan 2035
transpor ationPl an i n Fr emont N e b r a s k a
Lon g - R an ge2035
19
Figure 5 - Planned (Committed) Improvements
• ~
~ "".#'
i "'.,,""
8 ,{
N
n..rur~~_..r-"JI Feet o 4000 8000
""""
0''''''''''
""'''
OORO'"
FREM \!l NT
Legend
New Road 2 Lane to 3 Lane
3 Lane to 4 Lane with Left-turn Lanes at Intersections
• RRViaduct
)( At-Grade Crossing Closure
Note: The railroad viaduct project on 23rd Street also includes the closure of the at-grading crossing on Somers Avenue and the realignment of Somers Avenue to connect to 23rd Street.
Long Range Transportation Plan 2035
transpor ationPl an i n Fr emont N e b r a s k a
Lon g - R an ge2035
20FREM \!l NT
Figure 6 - 2035 Future Base Model Volumes
OJ a Legend I» c. CIJ -
16600 US-2 5 2035 Base Model Volume
r-c -CD ., :::tI c.
US-30 9900 2030 22400 23rd St .... ..., UI 00 CI) ..., 0 4500 0 en 0 0 ....
0 .....
$<'00 0 .... 00
UI 0 CQ 0 0 0
Ave
.... w ..., 00
0 0 0
N

Long Range Transportation Plan 2035
transpor ationPl an i n Fr emont N e b r a s k a
Lon g - R an ge2035
21
Figure 7 - 2010 Base Model Volumes
US-30 8580 8600
N
+
III a III Q.
~
10120 8990
US-27
r c :::r CD ... ;:u Q.
..., ...,
~ ~ I--t--+-+-I--'='-l'"'----+--I~~~'------'-=¥ ClI O ...... ......
0 '" .... ... W CD ", 0
... ... ~ ...,
...... "'" 0 0
Milita Ave
FREM \!l NT
Legend
Existing Model Volume
ADT Count
Long Range Transportation Plan 2035
transpor ationPl an i n Fr emont N e b r a s k a
Lon g - R an ge2035
22
Figure 8 - 2035 Committed Model Peak Hour VIC
US-275
US-30
N
I: -:T CD ....
FREM \!l NT
Legend
--- 0.00 to 0.40
--- 0.40 to 0.55
--- 0.55 to 0.70
--- 0.70 to 0.85
--- 0.85+

Long Range Transportation Plan 2035 23
been under study for many years. With plans to improve US-30 to a four-lane expressway, multiple alignment alternatives have been considered, ranging from widening along the existing alignment to relocating the US-30 alignment to, or near, County Road “S.” Because the preferred concept of the City of Fremont and the Dodge County Board is the concept that follows the Road “S” alignment, it was used in the modeling of future transportation alternatives. With this concept, the existing US-30 roadway would remain in place, but be relinquished to Dodge County and the City of Fremont.
Model Results: Assigned traffic volumes for the U.S. Highway 30 (west) alternative are illustrated in Figure 10. This improved roadway would provide for greater capacity and higher speed travel to/from communities west of Fremont (e.g., North Bend, Schuyler). The model results reveal that this alternative route would result in traffic volume reductions primarily along Military Avenue.
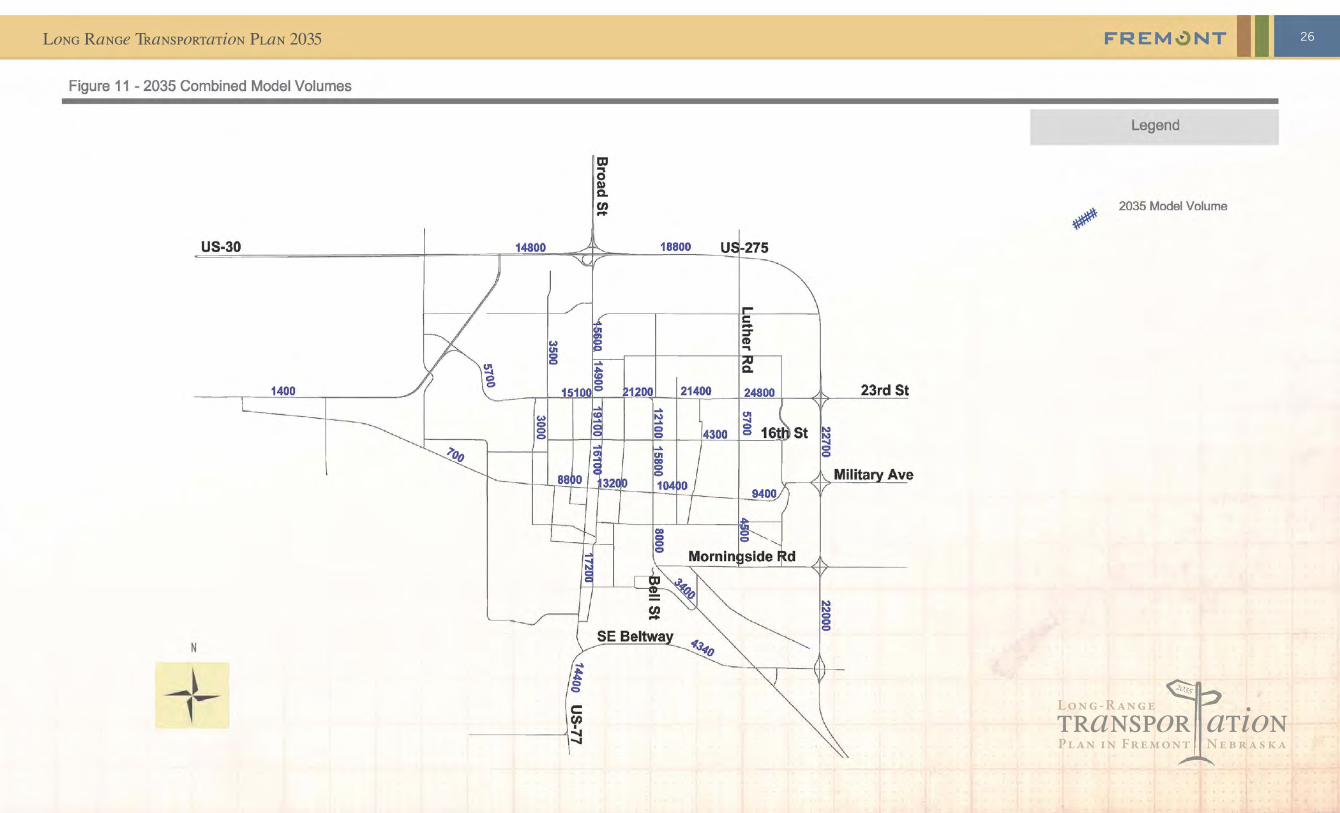
The combined results of the Fremont Southeast Beltway and U.S. Highway 30 (west) alternatives are illustrated in Figure 11. These results indicate that several “internal” city streets would experience reduced traffic volumes and have the potential of differing long-term (i.e., beyond 2035) projects that may otherwise be needed.
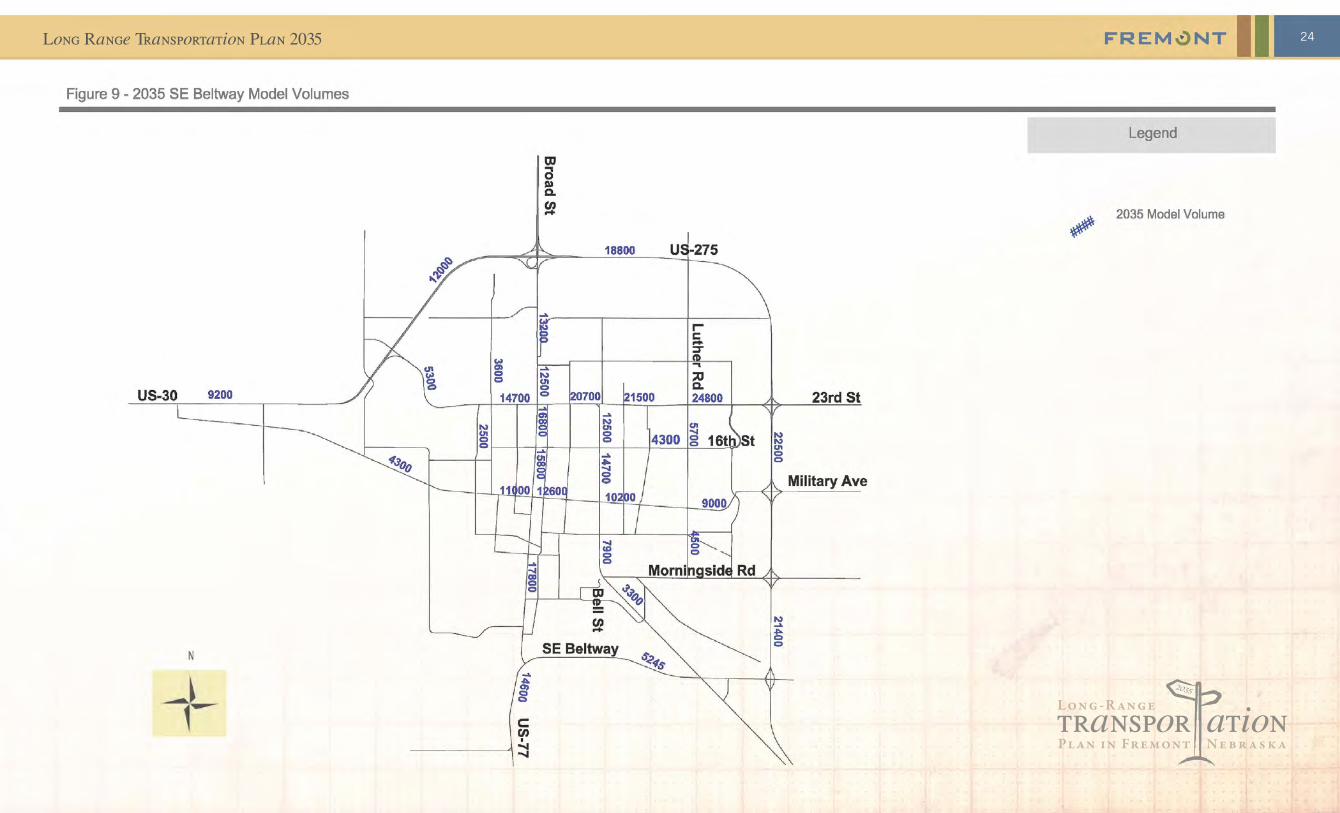
south City limits and the Platte River, connecting U.S. Highways 77 and 275, south of the existing Morningside Road interchange. The purpose of the project is to improve traffic flow and safety on US-77 via a high-speed beltway around the southeast side of Fremont. The beltway would improve continuity of US-77 and improve the regional connectivity between US-77, US-275, and US-30. The length of the proposed alternative is approximately 3.2 miles. A location study and environmental assessment is presently being performed for this alternative by the Nebraska Department of Roads as an alternative to widening U.S. Highway 77 between Military Avenue and 23rd Street.
Model Results: Assigned traffic volumes for the Fremont Southeast Beltway alternative are illustrated in Figure 9. This new roadway would provide for a high-speed connection between two principal transportation facilities in the Fremont area, U.S. Highways 77 and 275, resulting in less travel demand on the internal street network. The demand model shows those vehicles traveling on the Southeast Beltway to be, on average, 5,245 vehicles per day. The addition of the Southeast Beltway diverts traffic that would otherwise use “internal” city streets such as Broad Street, Bell Street, Military Avenue and 23rd Street.
U.S. Highway 30 (west)
Description: As part of the NDOR’s expressway program, U.S. Highway 30, west of Fremont, has
TRANSPORTATION ALTERNATIVES EVALUATION
To address existing and future (2035) capacity deficiencies, multiple potential transportation alternatives were evaluated for the Fremont area. Alternatives were developed based on the existing conditions analysis, existing or projected transportation model results, and discussion and input from City staff, elected officials and public survey. Transportation alternatives were generally identified to address one or more of the following:
• Undesirable traffic operations of roadway segments• Circulation and network continuity• Improved service to growth areas• Economic development potential• Major transportation improvements (e.g., bypass)
The transportation alternatives evaluated as part of the modeling effort were generated as part of other, recent planning activities in the area and include the following alternatives. The discussion that follows includes a description of the improvement as well as a brief discussion regarding the modeled results associated with each alternative. Traffic volume-to-capacity figures for each alternative package are included in Appendix 2.
Fremont Southeast Beltway
Description: This alternative includes the construction of a new, four-lane roadway between the existing
Fremont Southeast Beltway
F"REM~NT
Long Range Transportation Plan 2035
transpor ationPl an i n Fr emont N e b r a s k a
Lon g - R an ge2035
24
Figure 9 - 2035 SE Beltway Model Volumes
US-30 9200
N
,L
m a III c.. ~
18800 U -275
rr::: -::::T .., ::a c.. 24800
N UI
g~-+~~~ __ -+ __ +-~4~3~O~O~~~~
....
..... co co co
en -SE Beltway
"'<if", .... .,.. g c en I ......
......
FREM \!l NT
Legend
2035 Model Volume
23rd St
t
Military Ave
N .... t co

Long Range Transportation Plan 2035
transpor ationPl an i n Fr emont N e b r a s k a
Lon g - R an ge2035
25
Figure 10 - 2035 US-30 S-Route Model Volumes
US-30
1400
N
+
13900
C::J a III c. en -
16800
21900 22400
5-275
r--:::r (J) ., c.
25100
.... co o o o
.... CD g o
FREM \!l NT
Legend
2035 Model Volume
23rd st
Ave
Long Range Transportation Plan 2035
transpor ationPl an i n Fr emont N e b r a s k a
Lon g - R an ge2035
26
Figure 11 - 2035 Combined Model Volumes
US-30
1400
N
14800
Co>
OJ a D) Q.
en ....
1200
18800
21400
U -275
c: .... :::r CI) .., Q.
24800
8 f--+-++--+---F--+- +=""----+------'--=;v St ~ r---r~ g
... i c: en • -------""I:j
FREM \!l NT
Legend
2035 Model Volume
23rd st
Milita Ave
Long Range Transportation Plan 2035 27
TRANSIT NEEDS
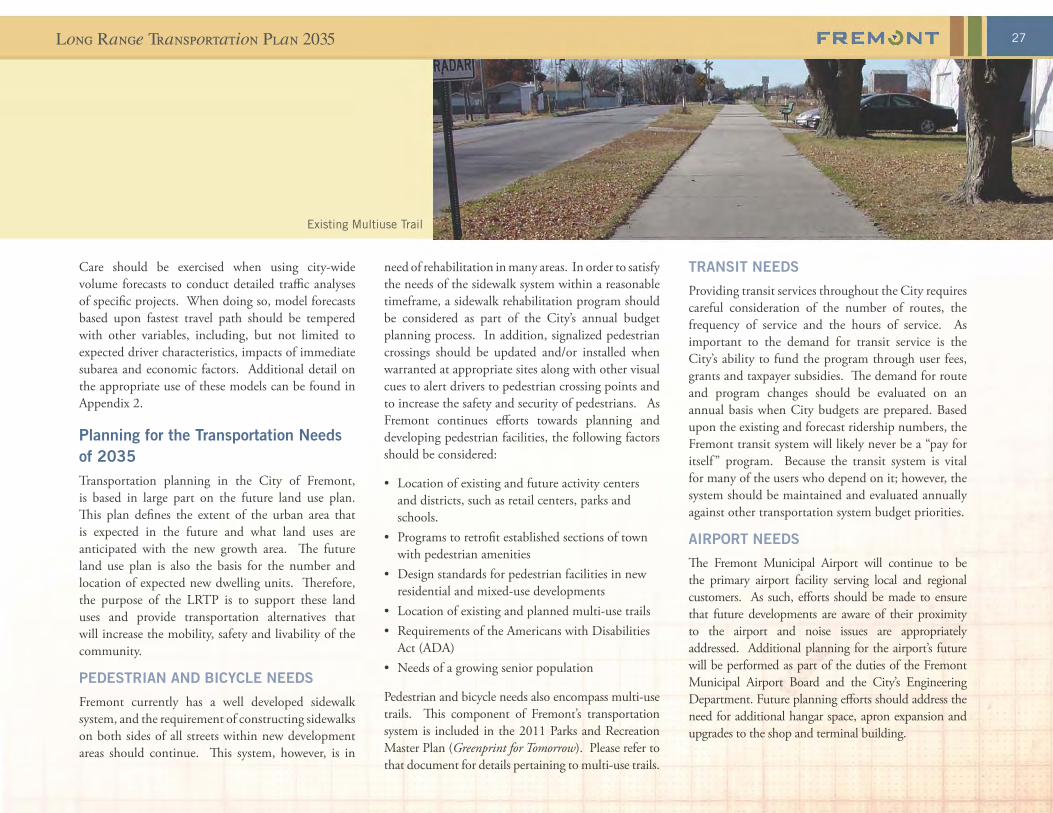
Providing transit services throughout the City requires careful consideration of the number of routes, the frequency of service and the hours of service. As important to the demand for transit service is the City’s ability to fund the program through user fees, grants and taxpayer subsidies. The demand for route and program changes should be evaluated on an annual basis when City budgets are prepared. Based upon the existing and forecast ridership numbers, the Fremont transit system will likely never be a “pay for itself ” program. Because the transit system is vital for many of the users who depend on it; however, the system should be maintained and evaluated annually against other transportation system budget priorities.
AIRPORT NEEDS
The Fremont Municipal Airport will continue to be the primary airport facility serving local and regional customers. As such, efforts should be made to ensure that future developments are aware of their proximity to the airport and noise issues are appropriately addressed. Additional planning for the airport’s future will be performed as part of the duties of the Fremont Municipal Airport Board and the City’s Engineering Department. Future planning efforts should address the need for additional hangar space, apron expansion and upgrades to the shop and terminal building.
need of rehabilitation in many areas. In order to satisfy the needs of the sidewalk system within a reasonable timeframe, a sidewalk rehabilitation program should be considered as part of the City’s annual budget planning process. In addition, signalized pedestrian crossings should be updated and/or installed when warranted at appropriate sites along with other visual cues to alert drivers to pedestrian crossing points and to increase the safety and security of pedestrians. As Fremont continues efforts towards planning and developing pedestrian facilities, the following factors should be considered:
• Location of existing and future activity centers and districts, such as retail centers, parks and schools.
• Programs to retrofit established sections of town with pedestrian amenities
• Design standards for pedestrian facilities in new residential and mixed-use developments
• Location of existing and planned multi-use trails• Requirements of the Americans with Disabilities
Act (ADA)• Needs of a growing senior population
Pedestrian and bicycle needs also encompass multi-use trails. This component of Fremont’s transportation system is included in the 2011 Parks and Recreation Master Plan (Greenprint for Tomorrow). Please refer to that document for details pertaining to multi-use trails.
Care should be exercised when using city-wide volume forecasts to conduct detailed traffic analyses of specific projects. When doing so, model forecasts based upon fastest travel path should be tempered with other variables, including, but not limited to expected driver characteristics, impacts of immediate subarea and economic factors. Additional detail on the appropriate use of these models can be found in Appendix 2.
Planning for the Transportation Needs of 2035Transportation planning in the City of Fremont, is based in large part on the future land use plan. This plan defines the extent of the urban area that is expected in the future and what land uses are anticipated with the new growth area. The future land use plan is also the basis for the number and location of expected new dwelling units. Therefore, the purpose of the LRTP is to support these land uses and provide transportation alternatives that will increase the mobility, safety and livability of the community.
PEDESTRIAN AND BICYCLE NEEDS
Fremont currently has a well developed sidewalk system, and the requirement of constructing sidewalks on both sides of all streets within new development areas should continue. This system, however, is in
Existing Multiuse Trail
F"REM~NT

City of Fremont, Nebraska28
Obviously, a program such as this is easier said than done as recent revenues, across all levels of government, have not kept pace with the inflation of project costs and typically, the need for roadway improvements exceed the available budget. Regardless, the City of Fremont should strive to protect its existing transportation infrastructure, including streets and traffic signals, with annual budgets targeted specifically to this program.
Congestion Management
As needed, the City of Fremont should develop strategies to manage and mitigate traffic congestion challenges. Although typical congestion issues can be dealt with by the Department of Public Works, more pressing matters may require a more formal study process. These studies can help to identify specific congestion mitigation strategies that are most feasible for a particular location. Potential mitigation measures include, but are not limited to:
Traffic signal timing modifications: For each of the signalized intersections in Fremont, signal timing parameters should be evaluated, and updated (as necessary) on a regular basis. Specific attention should be given to corridors where the synchronization (coordination) of closely-spaced traffic signals will result in travel time savings to the motoring public. These corridors include Broad Street, 23rd Street, Military Avenue and Bell Street.
studies to identify future alignments and intersection design and the retiming of traffic signals are components that should not be forgotten.
To fulfill these needs of the street and road system, system management and operations should incorporated into the City’s annual Capital Improvement Program.
Roadway Rehabilitation Program
Roadway rehabilitation is needed when the condition of the roadway requires attention beyond the routine maintenance provided through system management and operations. Varying levels of rehabilitation are available to maintain roadways in serviceable condition and range from pavement overlays to complete reconstruction of the roadway. In general, the former is less expensive and can delay the need for the latter. By maintaining a program that includes routine sealing and minor repair, fewer roads will require major repairs and thus, a higher level of performance of the entire street network. If regular maintenance is not conducted, however, roadway condition can fall from good to poor in the matter of a few years. Therefore, an investment in roadway rehabilitation, while roads are still in good condition, can mean significant savings as compared to the investment that would be required if the street network were allowed to reach poor conditions.
STREETS AND ROADS NEEDS - PROGRAMS
Passenger cars and trucks have been and will continue to be the primary mode of travel for Fremont residents throughout and beyond the planning period of the LRTP. To accommodate safe and efficient mobility throughout the community, the expansion and continued maintenance of the street and road network is of great importance.
The operation and maintenance of the existing and future street and roadway network is a primary role of the Long Range Transportation Plan. Without regular maintenance, monitoring the functionality of the existing system, and implementation of lower cost improvements designed to alleviate congestion, the addition of new roads would provide only localized improvements to the overall functionality of the system.
System Management and Operations
System management and operations refer to the day-to-day demands of the roadway system and includes such activities as street sweeping, pavement striping, traffic signal maintenance, and snow removal. Also included in this category of need are routine maintenance activities such as crack sealing, pothole repairs and sign replacement. Monitoring the performance of the system is an important part of operations and system management. Engineering
19th Street & Johnson Road Roundabout
F"REM~NT

Long Range Transportation Plan 2035 29
Developer Commitments
As Fremont grows, additional transportation infrastructure must be constructed to meet the development needs. In some cases, new development is proposed that requires infrastructure not planned for at the time is was requested. In certain cases, special agreements have been entered into that commit the City to repay developers within a time period for funding the construction of road improvements. Currently, no agreements for street improvements, in association with proposed developments are in place.
Federal and State Improvements
During the planning period of the long range transportation plan, improvements are planned for many of the existing U.S. and State highways in or adjacent to Fremont. These improvements consist of pavement rehabilitation, roadway widening and potential new alignments or new roadways all-together. A summary of these projects is provided in Table 5.
Future Roadway Projects
Future roadway projects include both funded and unfunded projects planned for construction or currently under study. These projects, all of which the City of Fremont is serving or will serve as the lead agency, are summarized in Table 6 on the next page.
principal arterials. Other arterials roadways should be planned to allow for spacing of signalized intersections at no less than one-quarter mile.
• Provide full median break access only at signalized intersections and at one-quarter mile spacing along principal arterials and one-eighth mile spacing along other arterial roadways.
• Eliminate, consolidate and/or improve existing driveway separation along all arterial roadways.
• Prohibit direct driveway access onto future principal roadways.
• Space driveway access no closer than 300 feet from major intersections on arterial and collector roadways.
STREETS AND ROADS NEEDS - PROJECTS
The long range program for improving the urban area street system involves numerous projects and studies taking many years and costing millions of dollars to complete. Close planning and coordination among various Federal, State and local government agencies and departments will be needed to successfully implement these projects. The planned future urban area street system consists of the following elements:
• Developer Commitments• Federal and State Improvements• Committed Roadway Projects• Urban Capital Roadway Projects
Intersection capacity improvements: Specific intersections in Fremont are known for peak-hour traffic congestion and as a result, hotbeds for citizen complaints. Whether the mitigation measures are signal timing modifications, modification of traffic control devices, adding of lanes, or other capacity enhancement, the following intersections are likely candidates for future attention:
• Broad Street & Military Avenue• 23rd Street & Broad Street• 23rd Street & Bell Street• Military Avenue & Luther Road• Military Avenue & Johnson Road
Intelligent Transportation System (ITS) improvements: The use of transportation technology is a growing strategy to increase safety and mobility while preserving the environment. ITS technologies are cost effective and relatively quick to deploy. Examples include, but are not limited to, traffic monitoring cameras, dynamic message signs, vehicle detection, adaptive traffic signal control technology, and communication infrastructure.
Access Management
To maximize the safety and operations of major arterial roadways, appropriate access management strategies should be adopted and enforced. These strategies include:
• Traffic signal spacing at half-mile intervals on
F"REM~NT

City of Fremont, Nebraska30
Table 5 – NDOR Planned Improvements
Project Type Funded Notes Fremont Participation
U.S. 30 North Bend - Fremont Resurfacing Yes $0
U.S. 30 Fremont - U.S. 275 Resurfacing Yes $50,000 (est.)
U.S. 77 5th Street - 10th Street Capacity Improvement Yes $80,0001
U.S. Hwy. 30 Rogers - Fremont Widen to four-lane expressway Yes Highway realignment also being considered $0
Fremont SE Beltway Construct new, four-lane roadway between U.S. 77 & U.S. 275 No Includes new interchange at U.S. 275 unknown 1 From City of Fremont Capital Improvements Projects – 5 Year – 2012 to 2016 (4/1/11)
Table 6 – City of Fremont Future Roadway Projects
Roadway Limits Scope of Improvements Estimated Cost (2011 $)
Military Avenue/Johnson Road Intersection Capacity and Safety Improvements $250,000
23rd Street Viaduct Includes closing of the at-grade RR crossing at Linden Avenue
Construct grade-separated crossing and associated roadway modifications
$2,650,0003
1st Street Luther Road to Johnson Road Realign 1st Street and close at-grade RR crossing along existing, 1st Street diagonal alignment
$1,566,6003
Luther Road 23rd Street to 27th Street Construct three-lane, urban street $1,150,0001
Luther Road 5th Street to 23rd Street Widen from two to three lanes $5,080,0001
Bell Street Linden Avenue to Cuming Street Widen from three to four lanes $2,410,0002
Military Avenue Luther Road to US-275 Widen from two to three lanes $4,320,0001
Military Avenue Ridge Road to Pierce Street Widen from two to three lanes $2,260,0001
Johnson Road Military Avenue to 16th Street Construct urban, three-lane street $2,340,0001
32nd Street Yager Road to Luther Road Construct three-lane, urban street $4,050,0001
Johnson Road Morningside Road to 1st Street Construct paved, two lane rural road $450,0001
Diers Parkway 27th Street to 32nd Street Construct paved, three-lane urban street $840,0001
32nd Street Clarkson Street to Yager Road Construct, three-lane urban street $1,570,0001
32nd Street Luther Road to Diers Parkway Construct, three-lane urban street $2,100,0001
Luther Road 27th Street to US-275 Construct paved, two lane rural road $2,500,0001
1 Includes design engineering, right-of-way, NEPA and construction engineering costs.2 Includes construction engineering.3 From City of Fremont Capital Improvements Projects – 5 Year – 2012 to 2016 (April 1, 2011)
F"REM~NT

Long Range Transportation Plan 2035 31
Table 7 – Projects for Consideration
Project Scope of Improvements / Study Estimated Cost (2011 $)
US-77/275 & Luther Road Evaluate traffic signal warrants and study need for grade-separated interchange
$150,000
Johnson Road Viaduct (Military Avenue – Morningside Road)
Conduct railroad viaduct feasibility study $125,000
23rd Street/Bell Street Intersection and Yager Road, north of 23rd Street
Road (re)alignment study $100,000
Note: Project costs do not include NEPA activities nor design activity beyond conceptual design.
Additional Project Needs
In addition to the projects that have already been identified, as summarized in Table 6, additional projects need to be considered because of either results from the travel demand forecasting task of the long range transportation plan project, previously identified deficiencies or numerous comments from the public input process. These projects are summarized in Table 7.
Project Prioritization of Implementation Based on input from City Council members during their annual retreat held on January 14, 2012, the projects listed in Table 6, with the exception of those that are already funded and scheduled for construction, were prioritized into short-, mid- and long-term road way projects. These projects, including the scope of improvements and planning level cost estimates, are summarized in Table 8.
RECOMMENDATIONS
The City should remain in constant communication with their NDOR District Engineer to ensure all funding sources have been reviewed prior to the implementation of any of the actions listed within this plan. In addition, the City should conduct at least an annual review of the transportation projects proposed by this plan and the funding options available to adequately implement the improvements needed to keep up with the transportation needs of the City.
AMENDMENTS & REVIEWS
Fremont’s Long Range Transportation Plan is meant to be under constant review and consideration when undertaking transportation decision-making in the Fremont planning area. The plan should be a continuously evolving document that suits the needs of the City and its citizenry. The Planning Commission should initiate plan reviews on an annual basis, with full updates every five years. Public involvement should be incorporated into the review process as well.
Table 8: Short-, Mid-, and Long-Term Roadway Improvements
Roadway Limits Scope of Improvements Estimated Cost (2011$s)1
Short-term projects (2010-2016)
Luther Road 5th Street to 23rd Street widen from two to three lanes $5,080,0001
Military Avenue Ridge Road to Pierce Street widen from two to three lanes $2,260,0001
Military Avenue Luther Road to US-275 widen from two to three lanes $4,320,0001
Mid-term projects (2017-2021)
Johnson Road Military Avenue to 16th Street construct three-lane urban street $2,300,0001
Bell Street & Yager Road at 23rd Street roadway realignment cost to be determined by study
Johnson Road Morningside Road to 1st Street construct paved, two-lane rural street
$450,0001
Johnson Road Viaduct Military Avenue to Morningside Road construct RR viaduct cost to be determined by study
Luther Road 23rd Street to 27th Street construct three-lane urban street $1,150,0001
32nd Street Yager Road to Luther Road construct three-lane urban street $4,050,0001
Long-term projects (2022-2035)
US-77/275 & Luther Road Intersection construct grade-separated interchange
cost to be determined by study
32nd Street Clarkson Street to Yager Road construct three-lane urban street $1,570,0001
Luther Road 27th Street to US-275 construct paved, two-lane rural street
$2,500,0001
Diers Parkway 27th Street to 32nd Street construct three-lane urban street $840,0001
32nd Street Luther Road to Diers Parkway construct three-lane urban street $2,100,0001
1 Includes design engineering, right-of-way, NEPA and construction engineering costs.2 Includes construction engineering.3 From City of Fremont Capital Improvements Projects – 5 Year – 2012 to 2016 (April 1, 2011)
F"REM~NT

Long Range Transportation Plan 2035
Existing Transportation Conditions
1Appendix
Long Range Transportation Plan 2035
,." '-.'"'"--, , . . -
"-L _l •• , -~.
:l:. _I.-
~ I
t
t J-
H-· - -
I
..
I
I f
F"REM~NT
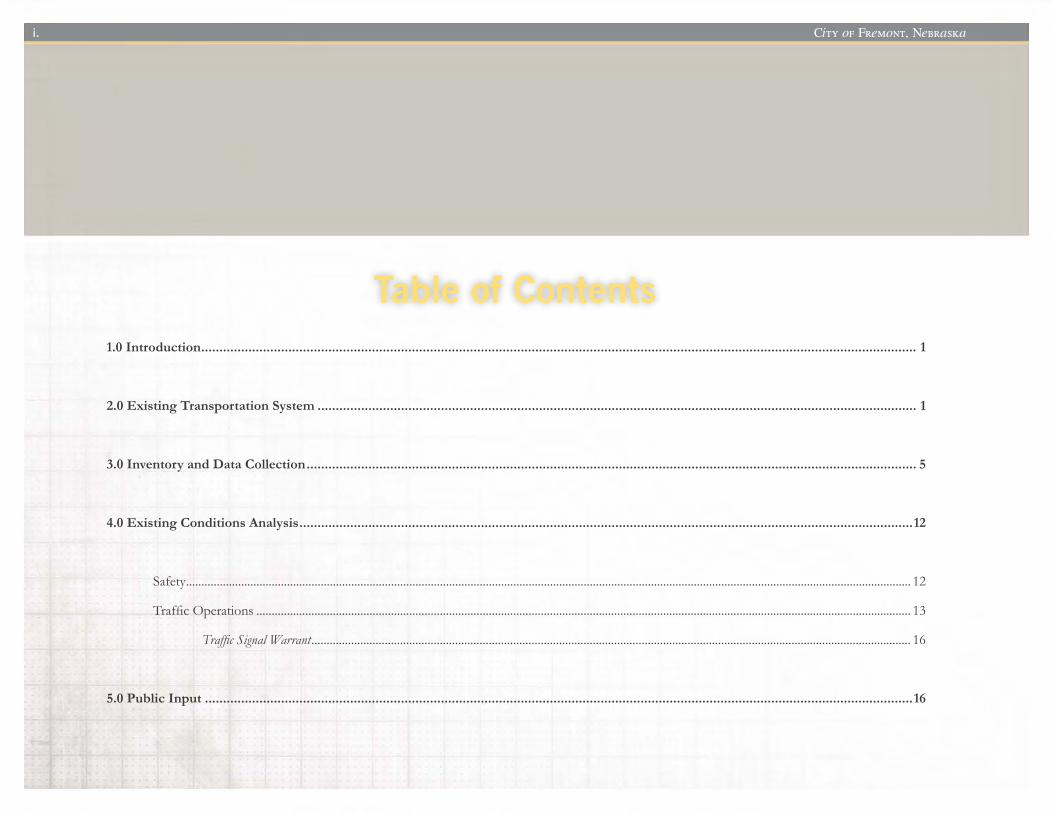
City of Fremont, NebraskaCity of Fremont, Nebraskai.
Table of Contents1.0 Introduction ..................................................................................................................................................................................................... 1
2.0 Existing Transportation System ..................................................................................................................................................................... 1
3.0 Inventory and Data Collection ........................................................................................................................................................................ 5
4.0 Existing Conditions Analysis .........................................................................................................................................................................12
Safety.............................................................................................................................................................................................................................................. 12
Traffic.Operations....................................................................................................................................................................................................................... 13
Traffic Signal Warrant..................................................................................................................................................................................................... 16
5.0 Public Input ...................................................................................................................................................................................................16

City of Fremont, Nebraska Existing Transportation ConditionsCity of Fremont, Nebraska ii
Figure.2.1:.....National.Functional.Classification......................................................................................................................................................................................2
Figure.3.1:.....Number.of .Lanes..................................................................................................................................................................................................................6
Figure.3.2:.....Posted.Speed.Limits..............................................................................................................................................................................................................7
Figure.3.3:.....Traffic.Control.Devices........................................................................................................................................................................................................8
Figure.3.4:.....Daily.Traffic.Volumes...........................................................................................................................................................................................................9
Figure.3.5:..Intersection.Lane.Configurations........................................................................................................................................................................................ 10
Figure.3.6:..Peak.Hour.Traffic.Volumes.................................................................................................................................................................................................. 11
Figure.4.1:..Intersection.Level-of-Service............................................................................................................................................................................................... 15
Table.2.1:....National.Functional.Classification.....................................................................................................................................................................................3-4
Table.4.1:....Intersection.Crash.Rates...................................................................................................................................................................................................... 12
Table.4.2:....Level.of .Service.Criteria...................................................................................................................................................................................................... 14
List of Maps / Figures
List of Tables

1.0 IntroductionIn. support. of . the. Comprehensive. Plan. and.Long. Range. Transportation. Plan. (LRTP). update.project,. this. technical. memorandum. summarizes.existing. transportation. conditions. within. the. City.of . Fremont,. Nebraska.. Elements. included. in. this.existing. conditions. document. will. not. only. serve.as. a. baseline. for. comparing. future. conditions,. but.also. in. developing. the. travel. demand. forecasting.model.. Both. of . these. tasks. will. aid. in. identifying.transportation. improvements. that. will. be. included.in. the. LRTP.. In. addition. to. inventorying. and.documenting. a. variety. of . existing. transportation.characteristics,.this.analysis.of .existing.transportation.conditions.includes.a.safety.analysis,.based.on.review.of . recent. crash.data. and. traffic.operations. analysis.for. selected. intersections.. A. summary. of . these.analyses.is.included.in.this.memorandum.
Transportation. issues. identified. as. part. of . the.Community. Symposium,. conducted. on. January.17,. 2011. are. also. summarized. in. this. document..Further. dialogue. will. take. place. with. the. Project.Steering. Committee. regarding. these. issues. along.with. study. recommendations. that. are.developed. as.the. transportation. model. development. process. is.completed.
2.0 Existing Transportation SystemThe.functional.classification.of .a.roadway.describes.how.that.particular.street.or.highway.is.intended.to.function. with. respect. to. capacity,. speed,. mobility.and. levels. of . access. provided.. Higher. functional.classifications. provide. greater. capacity,. higher.speeds,.and. less.access. (i.e.,.U.S..Highway.275,.U.S..Highway.77.and.U.S..Highway.30)..Lower.functional.classifications.provide. lower.capacity,. lower. speeds,.and. higher. levels. of . direct. access. to. adjacent.properties.(i.e.,.residential.streets).
Figure.2.1.illustrates.Fremont’s.existing.street.network.and.National. functional. classification. system.. The. existing,.National.functional.classification.map.for.Fremont.was.developed.from.information.provided.by.the.Nebraska.Department.of .Roads.(NDOR)..The.National.functional.classification.is. illustrated,.as.opposed.to.the.State.or.a.locally-based.classification,.because.this.project.is.funded,.in.part,.by.Federal.dollars..Furthermore,. the.associated.LRTP.that.will.be.generated.as.part.of .this.project.will.likely.identify.future.roadway.projects.for.which.Federal.funds.will.be.pursued..
In. addition. to. Figure. 2.1,. the. National. functional.classification.of .Fremont’. streets. is. summarized. in.Table.2.1..
City of Fremont, NebraskaCity of Fremont, Nebraska1.1 City of Fremont, Nebraska

Figure 2.1 National Functional Classification
I
- -+-
~ ·.iI
N
--L ~
n.ru I I Feet 0 4000 8000
HWV"
I
HWY275
--,----~-
, '~
:"'>-'<> .~
...... , ,
, ., "
\
"
\ I I I
I
1 I I I I I , "
HWY30 ----
CORCWlV -----
------
Legend
Urban Principal Arterial
Urban Minor Arterial
Urban Collector
Other Rural Principal Arterial
Rural Major Collector
Rural Minor Collector
Source: Nebraska Department of Roads
LONG-RANGE • TRaNSPOR
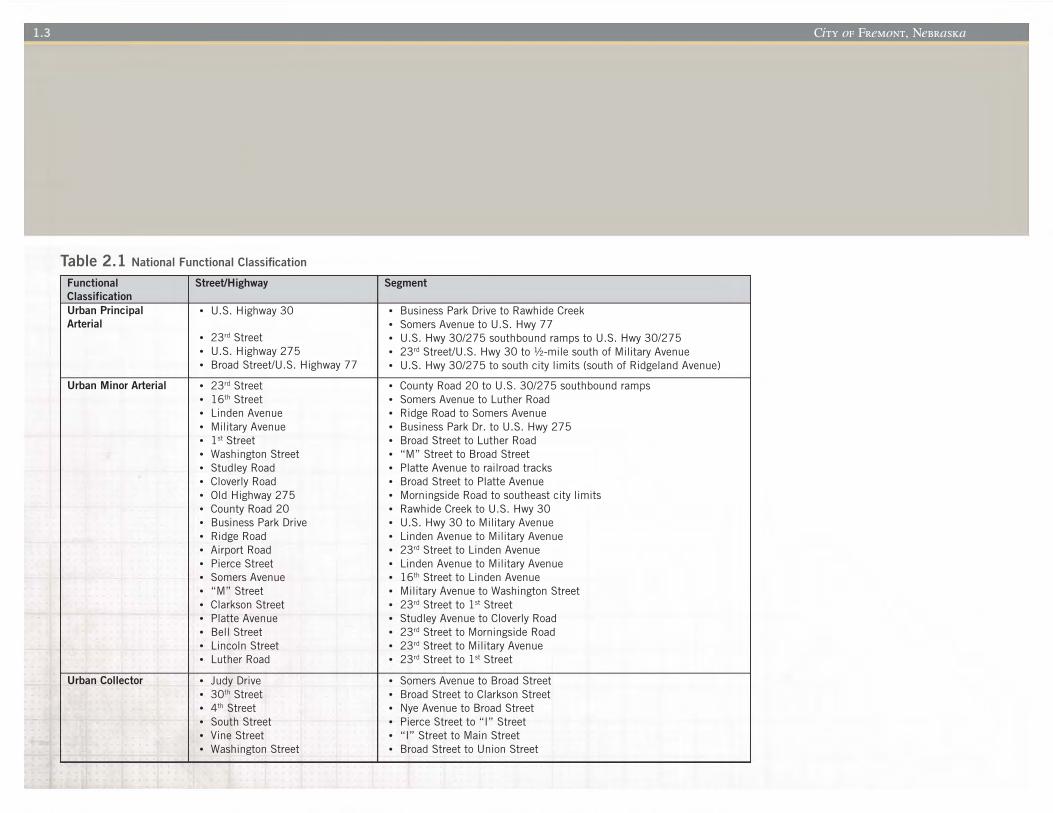
Functional Classification
Street/Highway Segment
Urban Principal Arterial
• U.S. Highway 30 • 23rd Street • U.S. Highway 275 • Broad Street/U.S. Highway 77
• Business Park Drive to Rawhide Creek • Somers Avenue to U.S. Hwy 77 • U.S. Hwy 30/275 southbound ramps to U.S. Hwy 30/275 • 23rd Street/U.S. Hwy 30 to ½-mile south of Military Avenue • U.S. Hwy 30/275 to south city limits (south of Ridgeland Avenue)
Urban Minor Arterial • 23rd Street • 16th Street • Linden Avenue • Military Avenue • 1st Street • Washington Street • Studley Road • Cloverly Road • Old Highway 275 • County Road 20 • Business Park Drive • Ridge Road • Airport Road • Pierce Street • Somers Avenue • “M” Street • Clarkson Street • Platte Avenue • Bell Street • Lincoln Street • Luther Road
• County Road 20 to U.S. 30/275 southbound ramps • Somers Avenue to Luther Road • Ridge Road to Somers Avenue • Business Park Dr. to U.S. Hwy 275 • Broad Street to Luther Road • “M” Street to Broad Street • Platte Avenue to railroad tracks • Broad Street to Platte Avenue • Morningside Road to southeast city limits • Rawhide Creek to U.S. Hwy 30 • U.S. Hwy 30 to Military Avenue • Linden Avenue to Military Avenue • 23rd Street to Linden Avenue • Linden Avenue to Military Avenue • 16th Street to Linden Avenue • Military Avenue to Washington Street • 23rd Street to 1st Street • Studley Avenue to Cloverly Road • 23rd Street to Morningside Road • 23rd Street to Military Avenue • 23rd Street to 1st Street
Urban Collector • Judy Drive • 30th Street • 4th Street • South Street • Vine Street • Washington Street
• Somers Avenue to Broad Street • Broad Street to Clarkson Street • Nye Avenue to Broad Street • Pierce Street to “I” Street • “I” Street to Main Street • Broad Street to Union Street
City of Fremont, NebraskaCity of Fremont, Nebraska
Table 2.1 National Functional Classification
1.3
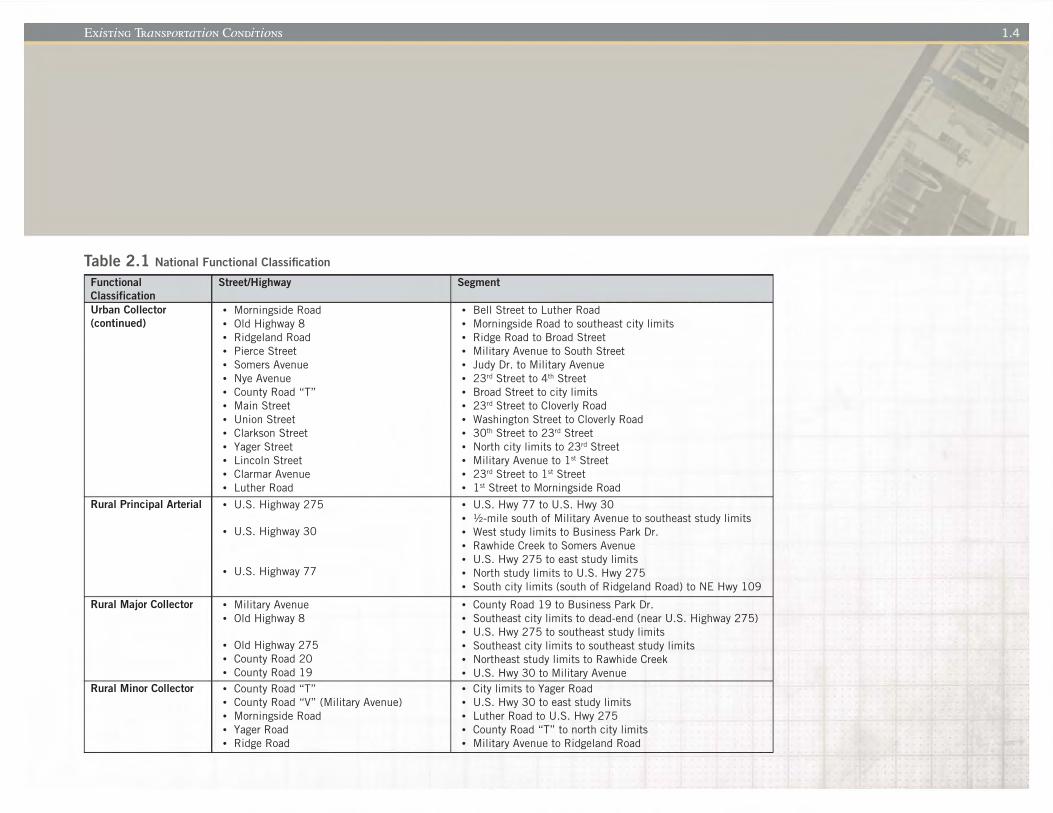
Functional Classification
Street/Highway Segment
Urban Collector (continued)
• Morningside Road • Old Highway 8 • Ridgeland Road • Pierce Street • Somers Avenue • Nye Avenue • County Road “T” • Main Street • Union Street • Clarkson Street • Yager Street • Lincoln Street • Clarmar Avenue • Luther Road
• Bell Street to Luther Road • Morningside Road to southeast city limits • Ridge Road to Broad Street • Military Avenue to South Street • Judy Dr. to Military Avenue • 23rd Street to 4th Street • Broad Street to city limits • 23rd Street to Cloverly Road • Washington Street to Cloverly Road • 30th Street to 23rd Street • North city limits to 23rd Street • Military Avenue to 1st Street • 23rd Street to 1st Street • 1st Street to Morningside Road
Rural Principal Arterial • U.S. Highway 275
• U.S. Highway 30
• U.S. Highway 77
• U.S. Hwy 77 to U.S. Hwy 30 • ½-mile south of Military Avenue to southeast study limits • West study limits to Business Park Dr. • Rawhide Creek to Somers Avenue • U.S. Hwy 275 to east study limits • North study limits to U.S. Hwy 275 • South city limits (south of Ridgeland Road) to NE Hwy 109
Rural Major Collector • Military Avenue • Old Highway 8
• Old Highway 275 • County Road 20 • County Road 19
• County Road 19 to Business Park Dr. • Southeast city limits to dead-end (near U.S. Highway 275) • U.S. Hwy 275 to southeast study limits • Southeast city limits to southeast study limits • Northeast study limits to Rawhide Creek • U.S. Hwy 30 to Military Avenue
Rural Minor Collector • County Road “T” • County Road “V” (Military Avenue) • Morningside Road • Yager Road • Ridge Road
• City limits to Yager Road • U.S. Hwy 30 to east study limits • Luther Road to U.S. Hwy 275 • County Road “T” to north city limits • Military Avenue to Ridgeland Road
City of Fremont, Nebraska Existing Transportation ConditionsCity of Fremont, Nebraska 1.4
Table 2.1 National Functional Classification
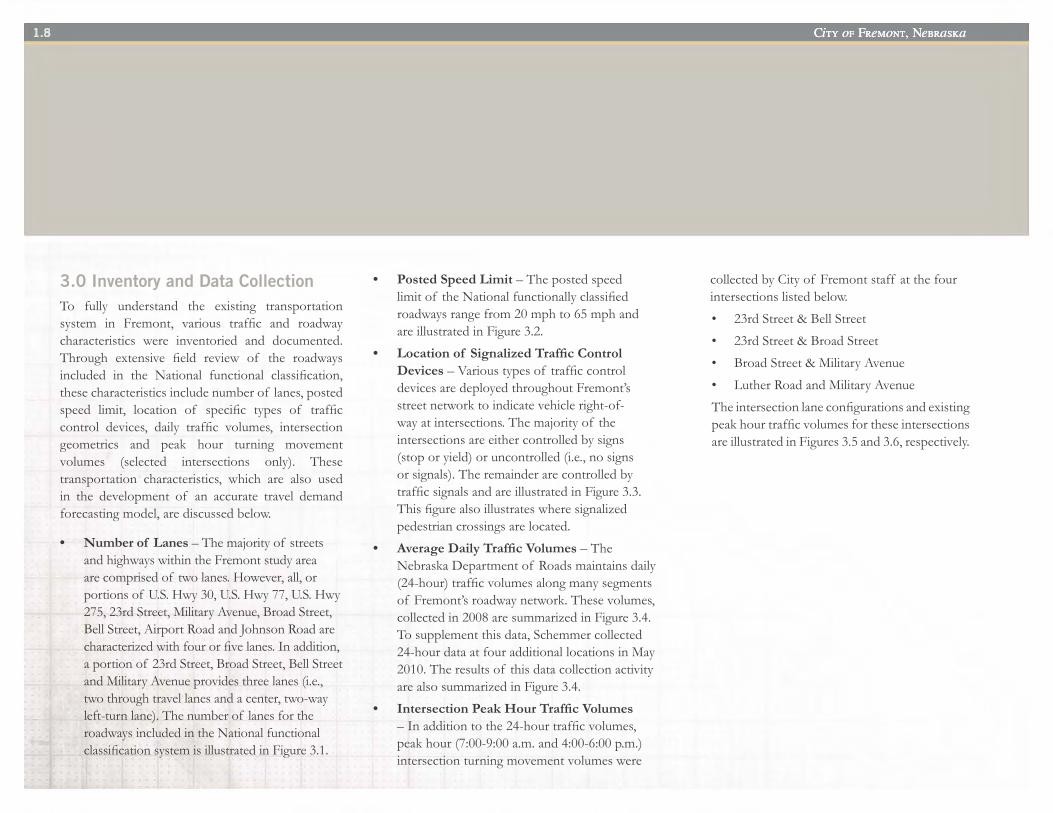
3.0 Inventory and Data CollectionTo. fully. understand. the. existing. transportation.system. in. Fremont,. various. traffic. and. roadway.characteristics. were. inventoried. and. documented..Through. extensive. field. review. of . the. roadways.included. in. the. National. functional. classification,.these.characteristics.include.number.of .lanes,.posted.speed. limit,. location. of . specific. types. of . traffic.control. devices,. daily. traffic. volumes,. intersection.geometrics. and. peak. hour. turning. movement.volumes. (selected. intersections. only).. These.transportation. characteristics,. which. are. also. used.in. the. development. of . an. accurate. travel. demand.forecasting.model,.are.discussed.below.
• Number of Lanes.–.The.majority.of .streets.and.highways.within.the.Fremont.study.area.are.comprised.of .two.lanes..However,.all,.or.portions.of .U.S..Hwy.30,.U.S..Hwy.77,.U.S..Hwy.275,.23rd.Street,.Military.Avenue,.Broad.Street,.Bell.Street,.Airport.Road.and.Johnson.Road.are.characterized.with.four.or.five.lanes..In.addition,.a.portion.of .23rd.Street,.Broad.Street,.Bell.Street.and.Military.Avenue.provides.three.lanes.(i.e.,.two.through.travel.lanes.and.a.center,.two-way.left-turn.lane)..The.number.of .lanes.for.the.roadways.included.in.the.National.functional.classification.system.is.illustrated.in.Figure.3.1.
• Posted Speed Limit.–.The.posted.speed.limit.of .the.National.functionally.classified.roadways.range.from.20.mph.to.65.mph.and.are.illustrated.in.Figure.3.2.
• Location of Signalized Traffic Control Devices –.Various.types.of .traffic.control.devices.are.deployed.throughout.Fremont’s.street.network.to.indicate.vehicle.right-of-way.at.intersections..The.majority.of .the.intersections.are.either.controlled.by.signs.(stop.or.yield).or.uncontrolled.(i.e.,.no.signs.or.signals)..The.remainder.are.controlled.by.traffic.signals.and.are.illustrated.in.Figure.3.3..This.figure.also.illustrates.where.signalized.pedestrian.crossings.are.located.
• Average Daily Traffic Volumes.–.The.Nebraska.Department.of .Roads.maintains.daily.(24-hour).traffic.volumes.along.many.segments.of .Fremont’s.roadway.network..These.volumes,.collected.in.2008.are.summarized.in.Figure.3.4..To.supplement.this.data,.Schemmer.collected.24-hour.data.at.four.additional.locations.in.May.2010..The.results.of .this.data.collection.activity.are.also.summarized.in.Figure.3.4.
• Intersection Peak Hour Traffic Volumes.–.In.addition.to.the.24-hour.traffic.volumes,.peak.hour.(7:00-9:00.a.m..and.4:00-6:00.p.m.).intersection.turning.movement.volumes.were.
collected.by.City.of .Fremont.staff .at.the.four.intersections.listed.below.
•. 23rd.Street.&.Bell.Street
•. 23rd.Street.&.Broad.Street
•. Broad.Street.&.Military.Avenue
•. Luther.Road.and.Military.Avenue.
The.intersection.lane.configurations.and.existing.peak.hour.traffic.volumes.for.these.intersections.are.illustrated.in.Figures.3.5.and.3.6,.respectively...
City of Fremont, Nebraska1.8 City of Fremont, Nebraska1.5 City of Fremont, Nebraska

Figure 3.1 Number of Lanes
N
-L ~
n.rur-~II....._..r---'1 Feet o 4000 8000
HWV" HWV275
HWY30
CORCWlV
Legend
2 Lanes
3 Lanes
4 Lanes
5 Lanes
LONG-RANGE
TRaNSPOR •

Figure 3.2 Posted Speed Limits
N
-L ~
n.rur-~II....._..r---'1 Feet o 4000 8000
HWV" HWV275
CORCWlV
Legend
20 mph
25 mph
30 mph
35 mph
40 mph
45 mph
50 mph
55 mph
60 mph
65 mph
LONG-RANGE
TRaNSPOR •

Figure 3.3 Traffic Control Devices
HWV" HWV275 Legend
~ • Flashing Beacon
#./" Pedestrian Signal
~ co ROAD T Traffic Signal ~ COROADT • •
~ • 4 Way Stop 8 ~ iii ~
HWY30
I , • ~----:c-----::;- •
CORCWlV
... ~ ... . .
N
-L ~ LONG-RANGE •
n.ru I I Feet TRaNSPOR 0 4000 8000

Figure 3.4 Daily Traffic Volumes
COROADT
N
-L ~
n.ru I I Feet 0 4000 8000
HWV" HWV275
co ROAD T
HWY30
CORCWlV
... ~ ... . .
Legend
2008 Daily Traffic Volume (NDOR)
2010 Daily Traffic Volume (Schemmer)
LONG-RANGE • TRaNSPOR
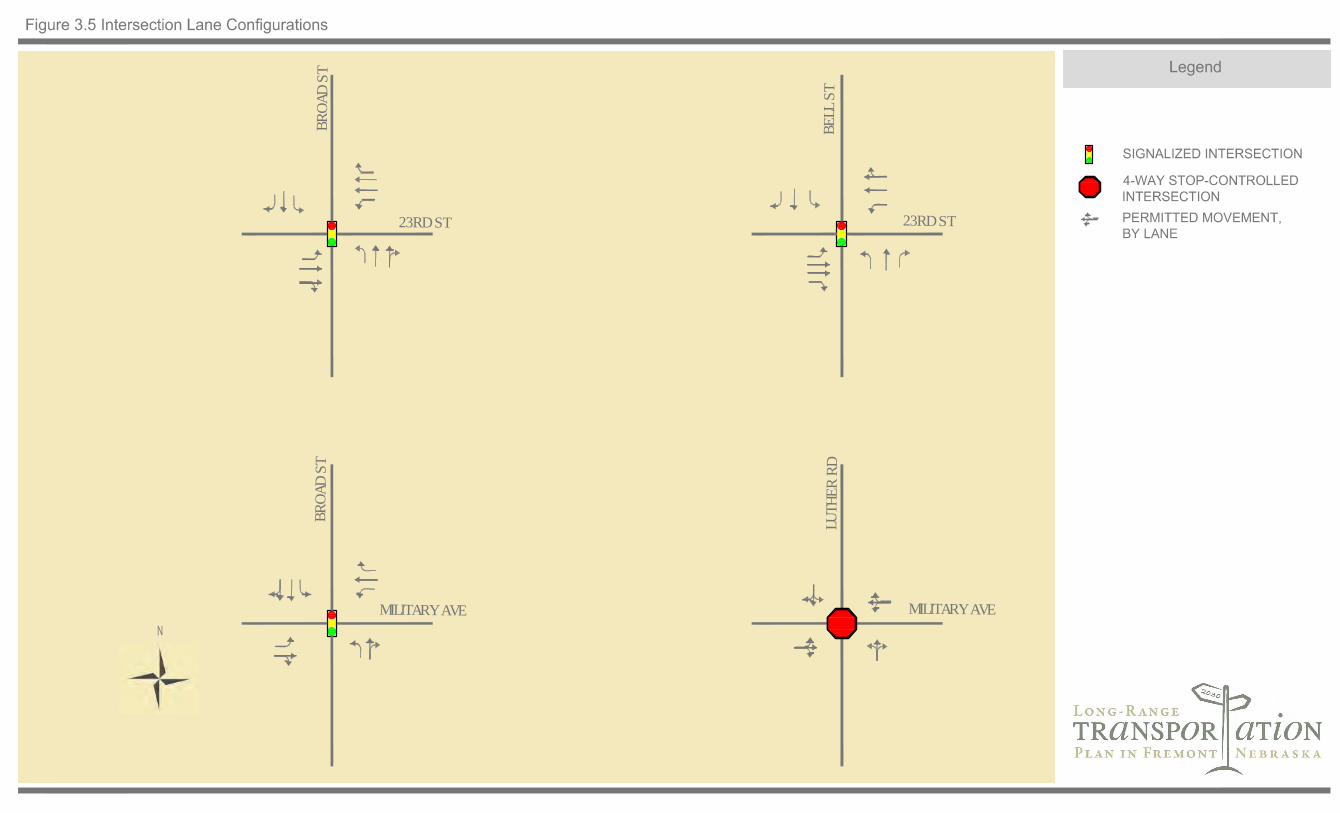
23RD ST
BROA
D ST
MILITARY AVE
BROA
D ST
23RD ST
BELL
ST
MILITARY AVE
LUTH
ER R
D

23RD ST
BROA
D ST
MILITARY AVE
BROA
D ST
23RD ST
BELL
ST
MILITARY AVE
LUTH
ER R
D
152 (
159)
181 (
189)
94 (180)289 (540)85 (192)
48 (5
6)
(195
) 118
(146
) 159
(116
) 82
(59) 43(551) 473
(69) 9625
0 (33
5)12
6 (11
1)
92 (163)148 (310)128 (170)
23 (4
7)
(325
) 238
(99)
127
(176
) 78
(74) 26(279) 268
(70) 56
21 (1
51)
37 (1
38)
11 (46)506 (704)59 (152)
9 (28
)
(71)
53(1
64) 9
0
(261
) 261
(30) 11(703) 509(306) 216
62 (1
88)
99 (1
4)
18 (26)261 (260)34 (17)
46 (6
0)
(80)
109
(71)
80
(74)
20
(83) 43(219) 237
(14) 12

4.0 Existing Conditions AnalysisThe. following. sections. document. the. results. of .the. safety. analyses. and. traffic. operations. analyses.conducted. as. part. of . the. existing. transportation.conditions.evaluation.
SAFETY
Reported.crashes. in.Fremont.over. the.most. recent.three. years. of . available. data. was. reviewed. for.intersections. citywide. to. identify. potential. safety.deficiencies.that.should.be.addressed.as.part.of .the.transportation. plan.. Based. on. statewide. crash. rate.statistics,.an.intersection.crash.rate.of .approximately.0.70.crashes/million.entering.vehicles.(crash/MEV).could. be. considered. typical. (average). for. most.intersections. in. Fremont..A. review. of . intersection.crash.data. indicated.that.18. intersections.had.crash.rates.higher. than.this. threshold..Table.4.1.provides.a.summary.of . the.crash.rate. information.for. these.intersections.for. the. three-year.period.beginning. in.November.2007.and.ending.October.2010..
Intersection No. of Crashes (3-year)
Daily Crash Rate Traffic Volume (crash / MEV)
1st Street & Bell Street 17 13,400 1.16 1st Street & Lincoln Avenue 5 4,300 1.06
10th Street & Clarkson Street 6 7,750 0.71 16th Street & Clarkson Street 10 10,800 0.85 16th Street & Clarmar Avenue 5 5,150 0.88 16th Street & Lincoln Avenue 9 8,050 1.02
16th Street & Nye Avenue 9 5,700 1.45 23rd Street & Clarkson Street 29 27,750 0.95 23rd Street & Lincoln Avenue 26 21,800 1.09
23rd Street & Milton Road 13 15,150 0.78 23rd Street & Somers Avenue 14 11,750 1.09
23rd Street & Broad Street 29 28,650 0.93 Bell Street & Military Avenue 20 22,950 0.80
Military Avenue & Clarkson Street 16 17,550 0.83 Military Avenue & Howard Street 8 6,750 1.09 Military Avenue & Johnson Road 5 6,300 0.72 Military Avenue & Luther Road 6 7,950 0.69 Military Avenue & Ridge Road 8 3,900 1.88
Existing Transportation Conditions 1.151.12Existing Transportation Conditions
Table 4.1 Intersection Crash Rates
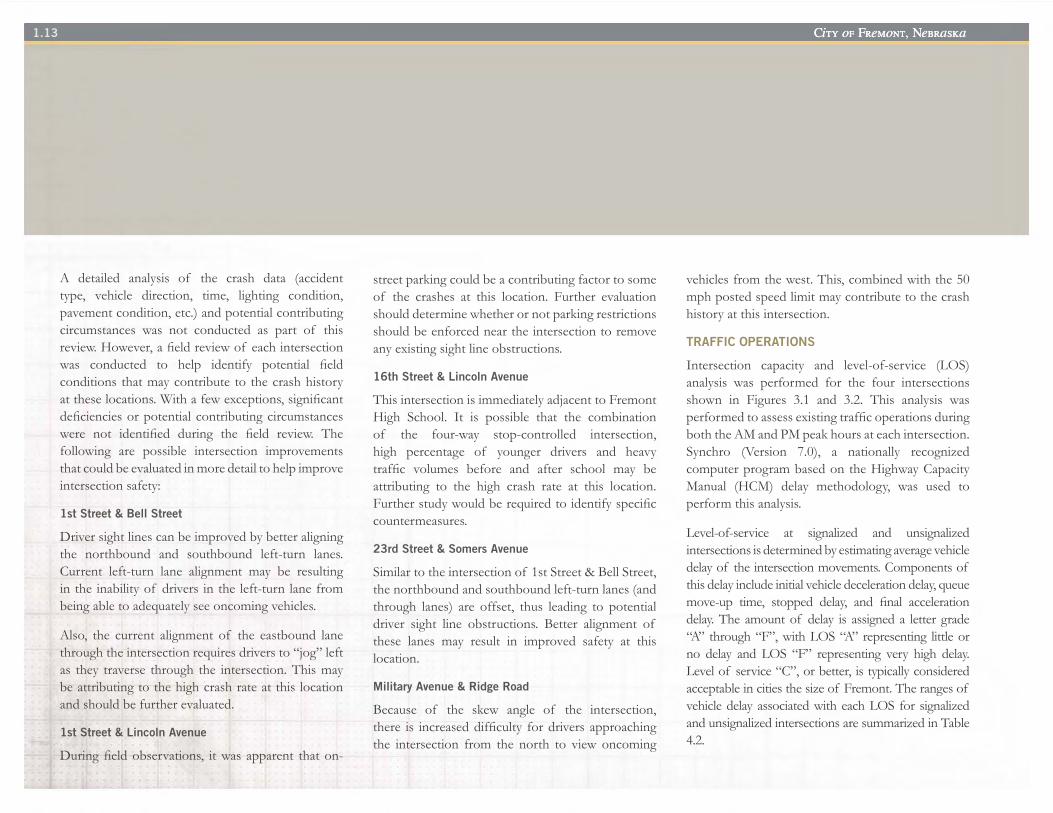
A. detailed. analysis. of . the. crash. data. (accident.type,. vehicle. direction,. time,. lighting. condition,.pavement.condition,.etc.).and.potential.contributing.circumstances. was. not. conducted. as. part. of . this.review..However,.a.field.review.of .each.intersection.was. conducted. to. help. identify. potential. field.conditions.that.may.contribute.to.the.crash.history.at.these.locations..With.a.few.exceptions,.significant.deficiencies.or.potential.contributing.circumstances.were. not. identified. during. the. field. review.. The.following. are. possible. intersection. improvements.that.could.be.evaluated.in.more.detail.to.help.improve.intersection.safety:
1st Street & Bell Street
Driver.sight.lines.can.be.improved.by.better.aligning.the. northbound. and. southbound. left-turn. lanes..Current. left-turn. lane. alignment. may. be. resulting.in.the. inability.of .drivers. in.the. left-turn. lane.from.being.able.to.adequately.see.oncoming.vehicles.
Also,. the. current. alignment. of . the. eastbound. lane.through.the.intersection.requires.drivers.to.“jog”.left.as. they. traverse. through. the. intersection..This.may.be.attributing.to.the.high.crash.rate.at.this.location.and.should.be.further.evaluated.
1st Street & Lincoln Avenue
During.field.observations,. it.was. apparent. that.on-
street.parking.could.be.a.contributing.factor.to.some.of . the. crashes. at. this. location.. Further. evaluation.should.determine.whether.or.not.parking.restrictions.should.be.enforced.near.the.intersection.to.remove.any.existing.sight.line.obstructions.
16th Street & Lincoln Avenue
This.intersection.is.immediately.adjacent.to.Fremont.High. School.. It. is. possible. that. the. combination.of . the. four-way. stop-controlled. intersection,.high. percentage. of . younger. drivers. and. heavy.traffic. volumes. before. and. after. school. may. be.attributing. to. the. high. crash. rate. at. this. location..Further.study.would.be.required.to.identify.specific.countermeasures.
23rd Street & Somers Avenue
Similar.to.the.intersection.of .1st.Street.&.Bell.Street,.the.northbound.and.southbound.left-turn.lanes.(and.through. lanes). are. offset,. thus. leading. to. potential.driver. sight. line. obstructions.. Better. alignment. of .these. lanes. may. result. in. improved. safety. at. this.location.
Military Avenue & Ridge Road
Because. of . the. skew. angle. of . the. intersection,.there. is. increased.difficulty. for.drivers.approaching.the. intersection. from. the. north. to. view. oncoming.
vehicles.from.the.west..This,.combined.with.the.50.mph.posted.speed.limit.may.contribute.to.the.crash.history.at.this.intersection.
TRAFFIC OPERATIONS
Intersection. capacity. and. level-of-service. (LOS).analysis. was. performed. for. the. four. intersections.shown. in. Figures. 3.1. and. 3.2.. This. analysis. was.performed.to.assess.existing.traffic.operations.during.both.the.AM.and.PM.peak.hours.at.each.intersection..Synchro. (Version. 7.0),. a. nationally. recognized.computer.program.based.on.the.Highway.Capacity.Manual. (HCM). delay. methodology,. was. used. to.perform.this.analysis.
Level-of-service. at. signalized. and. unsignalized.intersections.is.determined.by.estimating.average.vehicle.delay.of .the.intersection.movements..Components.of .this.delay.include.initial.vehicle.deceleration.delay,.queue.move-up. time,. stopped. delay,. and. final. acceleration.delay..The.amount.of .delay. is. assigned.a. letter.grade.“A”. through.“F”,.with.LOS.“A”.representing. little.or.no. delay. and. LOS. “F”. representing. very. high. delay..Level.of .service.“C”,.or.better,.is.typically.considered.acceptable.in.cities.the.size.of .Fremont..The.ranges.of .vehicle.delay.associated.with.each.LOS.for.signalized.and.unsignalized.intersections.are.summarized.in.Table.4.2.
City of Fremont, NebraskaCity of Fremont, Nebraska1.13 City of Fremont, Nebraska
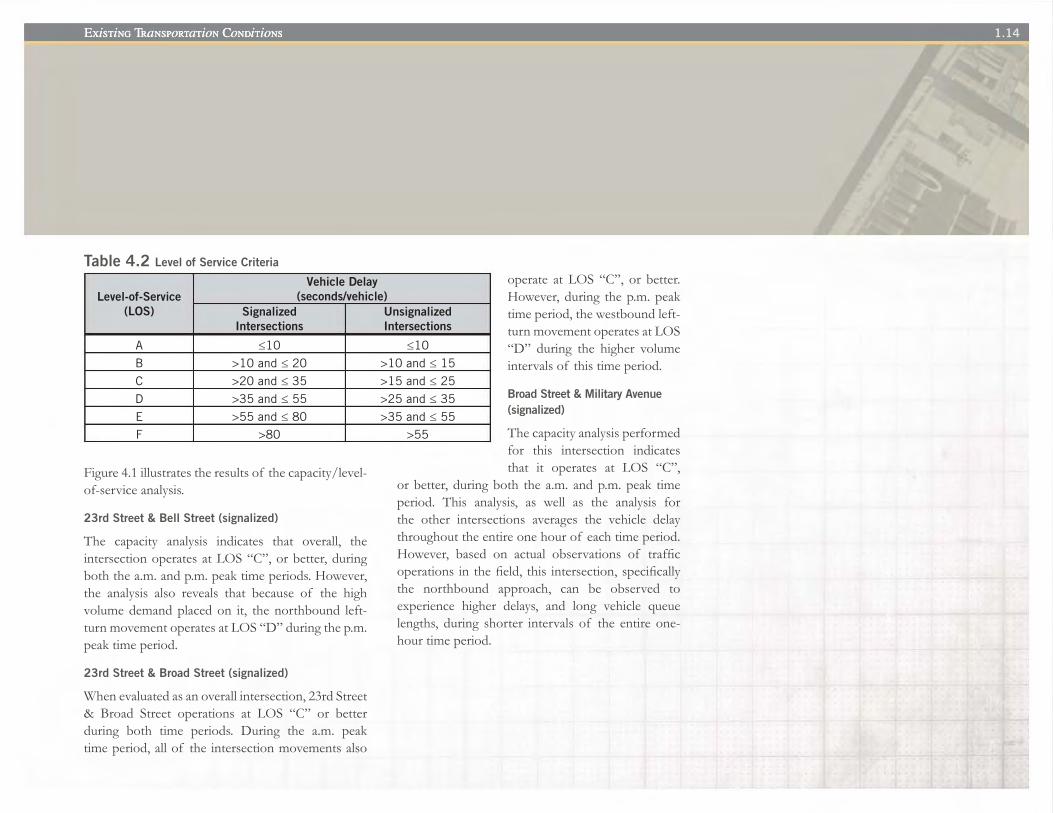
City of Fremont, Nebraska Existing Transportation ConditionsCity of Fremont, Nebraska
Figure.4.1.illustrates.the.results.of .the.capacity/level-of-service.analysis.
23rd Street & Bell Street (signalized)
The. capacity. analysis. indicates. that. overall,. the.intersection.operates.at.LOS.“C”,.or.better,.during.both.the.a.m..and.p.m..peak.time.periods..However,.the. analysis. also. reveals. that. because. of . the. high.volume.demand.placed.on. it,. the.northbound. left-turn.movement.operates.at.LOS.“D”.during.the.p.m..peak.time.period.
23rd Street & Broad Street (signalized)
When.evaluated.as.an.overall.intersection,.23rd.Street.&. Broad. Street. operations. at. LOS. “C”. or. better.during. both. time. periods.. During. the. a.m.. peak.time.period,.all.of .the.intersection.movements.also.
Level-of-Service (LOS)
Vehicle Delay(seconds/vehicle)
Signalized Intersections
UnsignalizedIntersections
A ≤10 ≤10 B >10 and ≤ 20 >10 and ≤ 15 C >20 and ≤ 35 >15 and ≤ 25 D >35 and ≤ 55 >25 and ≤ 35 E >55 and ≤ 80 >35 and ≤ 55 F >80 >55
operate. at. LOS. “C”,. or. better..However,.during. the.p.m..peak.time.period,.the.westbound.left-turn.movement.operates.at.LOS.“D”. during. the. higher. volume.intervals.of .this.time.period.
Broad Street & Military Avenue (signalized)
The.capacity.analysis.performed.for. this. intersection. indicates.that. it. operates. at. LOS. “C”,.
or.better,.during.both. the.a.m.. and.p.m..peak. time.period.. This. analysis,. as. well. as. the. analysis. for.the. other. intersections. averages. the. vehicle. delay.throughout.the.entire.one.hour.of .each.time.period..However,. based. on. actual. observations. of . traffic.operations. in.the.field,. this. intersection,.specifically.the. northbound. approach,. can. be. observed. to.experience. higher. delays,. and. long. vehicle. queue.lengths,. during. shorter. intervals. of . the. entire. one-hour.time.period.
1.14Existing Transportation ConditionsCity of Fremont, Nebraska
Table 4.2 Level of Service Criteria

C (C)B (B
)
(B) B
(C) B(C) C
B (B)C (C)C (C)
B (B
)
(C) C
(B) B
(B) B(C) C
C (E
)C
(D)
C (C)B (C)
C (C
)
(C) B
(C) C
(B) C(C) C(C) C
D (C
)
E (D)
(C) D
(D) E
23RD ST
BROA
D ST
MILITARY AVE
BROA
D ST
23RD ST
BELL
ST
MILITARY AVE
LUTH
ER R
D
B (B
)B
(B)
C (C)C (C)
C (C)
(B) B
C (C)
(C) B
C (B
)
C (C)

Military Avenue & Luther Road (unsignalized / 4-way stop)
The.HCM.methodology.used.to.evaluate.intersection.capacity.does.not.evaluate.unsignalized.intersections.as.an.entire.intersection..Rather,.it.calculates.delay.and.LOS.for. individual.approaches.and/or.movements..Results.of .this.analysis.indicate.that.because.of .the.high. volume. of . traffic. that. is.well-balanced. across.all. four. approaches,. high. levels. of . vehicle. delay.can. be. experienced.. During. the. a.m.. peak. time.period,. the. eastbound. and. westbound. approaches.can. be. expected. to. operate. at. LOS. “E”.while. the.northbound. and. southbound. approaches. operate.at.LOS.“D”..During.the.p.m..peak.time.period,.the.east.and.westbound.approaches.operate.at.LOS.“D”.while.the.remaining.two.approaches.operate.at.LOS.“C”.
Signal Warrant
To. address. the. high. levels. of . delay. experienced. at.the.intersection.of .Military.Avenue.&.Luther.Road,.traffic. signal.warrants.were. evaluated. to. assess. the.need. for. traffic. signalization.. The Manual on Uniform Traffic Control Devices, 2009. Edition.(MUTCD). provides. eight. warrants. for. evaluation.of . signalization. at. intersections.. Typically,. traffic.signalization.is.warranted.based.on.complete.review.of .traffic.volume.information.including.pedestrians,.
crash. experience,. and. traffic. progression.. The.preliminary. need. for. signalization. at. these.intersections.was.evaluated.based.only.on. the.Peak.Hour.Volume.Warrant.(Warrant.3).contained.in.the.MUTCD.
The.results.of .the.analysis.indicate.that.the.individual.approaches.to.the.intersection.of .Military.Avenue.&.Luther.Road.do.experience.moderate.to.high.levels.of .vehicular.delay.during.the.a.m..and.p.m..peak.hour.time.periods..However,.neither.the.volumes.nor.the.vehicular.delays.experienced.at. this. intersection.are.high.enough.to.satisfy.the.specified.warrant.criteria.for.installing.a.traffic.control.signal..One.alternative.strategy.to.mitigate.these.high.vehicle.delays.would.be.the.construction.of .a.roundabout,.however,.right-of-way.impacts.may.preclude.this.as.a.economically.viable.strategy.
5.0 Public InputMore. than. 200. community. residents,. business.owners,. and. other. stakeholders. participated. in.the. Fremont. Community. Symposium,. held. at. the.Fremont.Middle. School. on. January. 17,. 2011..This.symposium.served.as.a.public.input.session.to.help.guide.the.development.of .the.City’s.Comprehensive.Plan,. Parks. and. Recreation. Plan. and. the. Long-Range. Transportation. Plan.. In. an. informal,. open-
house. atmosphere,. participants. rotated. between.topical. discussion. groups,. one. of . which. was.“transportation.”. The. results. of . these. discussion.groups. enabled. the. project. team. to. develop. a. list.of . community. priorities,. issues. and. solutions. with.respect. to. each. topic.. The. list. of . priorities,. issues.and. solutions. for. the. topic. of . “transportation”. is.provided.below.
PRIORITIES
•. Southeast.Beltway
•. West.Military.Avenue
•. Middle.School./.5th.&.6th.Grade.School.–.traffic.concerns
•. Trails.and.sidewalks
•. U.S..Highway.30
ISSUES
•. Getting.across.town.is.difficult.due.to.changing.speed.limits,.poorly.timed.traffic.signals,.and.poor.circulation.and.the.congestion.near.the.Middle.School
•. Military.Avenue./.Johnson.Road:.school.area.traffic.safety/congestion
•. U.S..Highway.77./.Ridge.Road.–.location.of .Southeast.Beltway.is.a.question
Existing Transportation Conditions 1.191.16Existing Transportation Conditions
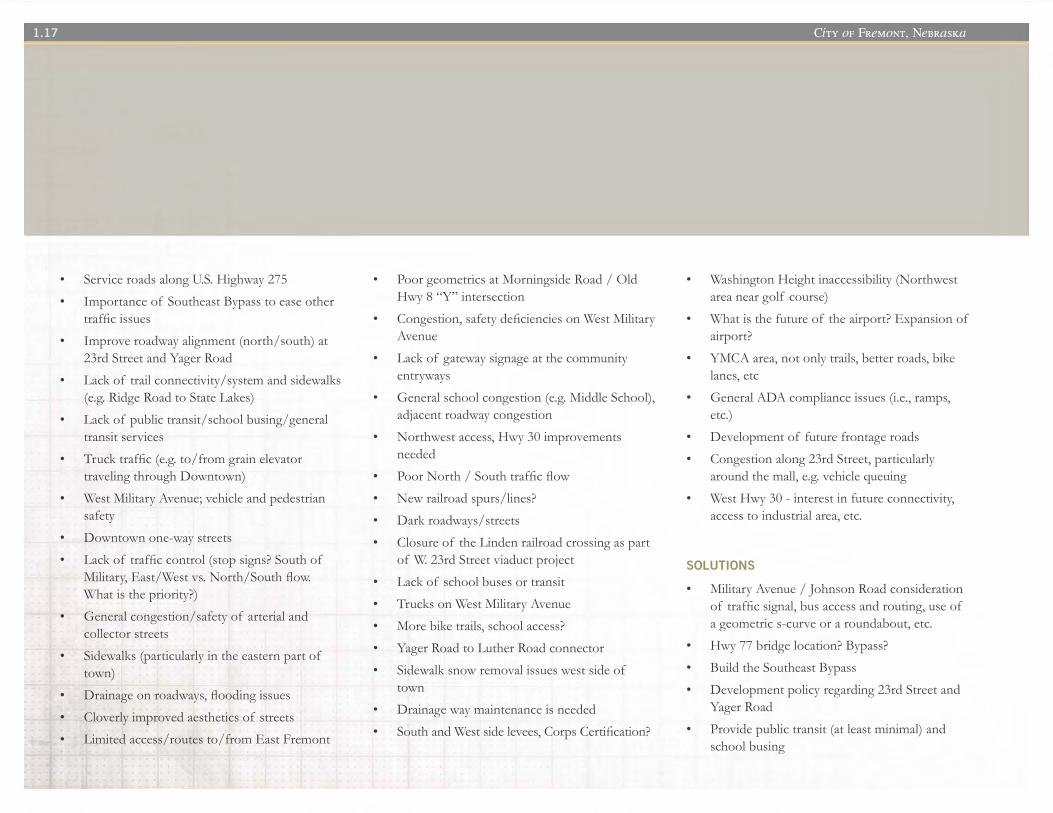
•. Service.roads.along.U.S..Highway.275.
•. Importance.of .Southeast.Bypass.to.ease.other.traffic.issues
•. Improve.roadway.alignment.(north/south).at.23rd.Street.and.Yager.Road
•. Lack.of .trail.connectivity/system.and.sidewalks.(e.g..Ridge.Road.to.State.Lakes)
•. Lack.of .public.transit/school.busing/general.transit.services
•. Truck.traffic.(e.g..to/from.grain.elevator.traveling.through.Downtown)
•. West.Military.Avenue;.vehicle.and.pedestrian.safety
•. Downtown.one-way.streets
•. Lack.of .traffic.control.(stop.signs?.South.of .Military,.East/West.vs..North/South.flow..What.is.the.priority?)
•. General.congestion/safety.of .arterial.and.collector.streets
•. Sidewalks.(particularly.in.the.eastern.part.of .town)
•. Drainage.on.roadways,.flooding.issues
•. Cloverly.improved.aesthetics.of .streets
•. Limited.access/routes.to/from.East.Fremont
•. Poor.geometrics.at.Morningside.Road./.Old.Hwy.8.“Y”.intersection
•. Congestion,.safety.deficiencies.on.West.Military.Avenue
•. Lack.of .gateway.signage.at.the.community.entryways
•. General.school.congestion.(e.g..Middle.School),.adjacent.roadway.congestion
•. Northwest.access,.Hwy.30.improvements.needed
•. Poor.North./.South.traffic.flow
•. New.railroad.spurs/lines?
•. Dark.roadways/streets
•. Closure.of .the.Linden.railroad.crossing.as.part.of .W..23rd.Street.viaduct.project
•. Lack.of .school.buses.or.transit
•. Trucks.on.West.Military.Avenue
•. More.bike.trails,.school.access?
•. Yager.Road.to.Luther.Road.connector
•. Sidewalk.snow.removal.issues.west.side.of .town
•. Drainage.way.maintenance.is.needed
•. South.and.West.side.levees,.Corps.Certification?
•. Washington.Height.inaccessibility.(Northwest.area.near.golf .course)
•. What.is.the.future.of .the.airport?.Expansion.of .airport?
•. YMCA.area,.not.only.trails,.better.roads,.bike.lanes,.etc
•. General.ADA.compliance.issues.(i.e.,.ramps,.etc.)
•. Development.of .future.frontage.roads
•. Congestion.along.23rd.Street,.particularly.around.the.mall,.e.g..vehicle.queuing
•. West.Hwy.30.-.interest.in.future.connectivity,.access.to.industrial.area,.etc.
SOLUTIONS
•. Military.Avenue./.Johnson.Road.consideration.of .traffic.signal,.bus.access.and.routing,.use.of .a.geometric.s-curve.or.a.roundabout,.etc.
•. Hwy.77.bridge.location?.Bypass?
•. Build.the.Southeast.Bypass
•. Development.policy.regarding.23rd.Street.and.Yager.Road
•. Provide.public.transit.(at.least.minimal).and.school.busing
City of Fremont, NebraskaCity of Fremont, Nebraska1.17
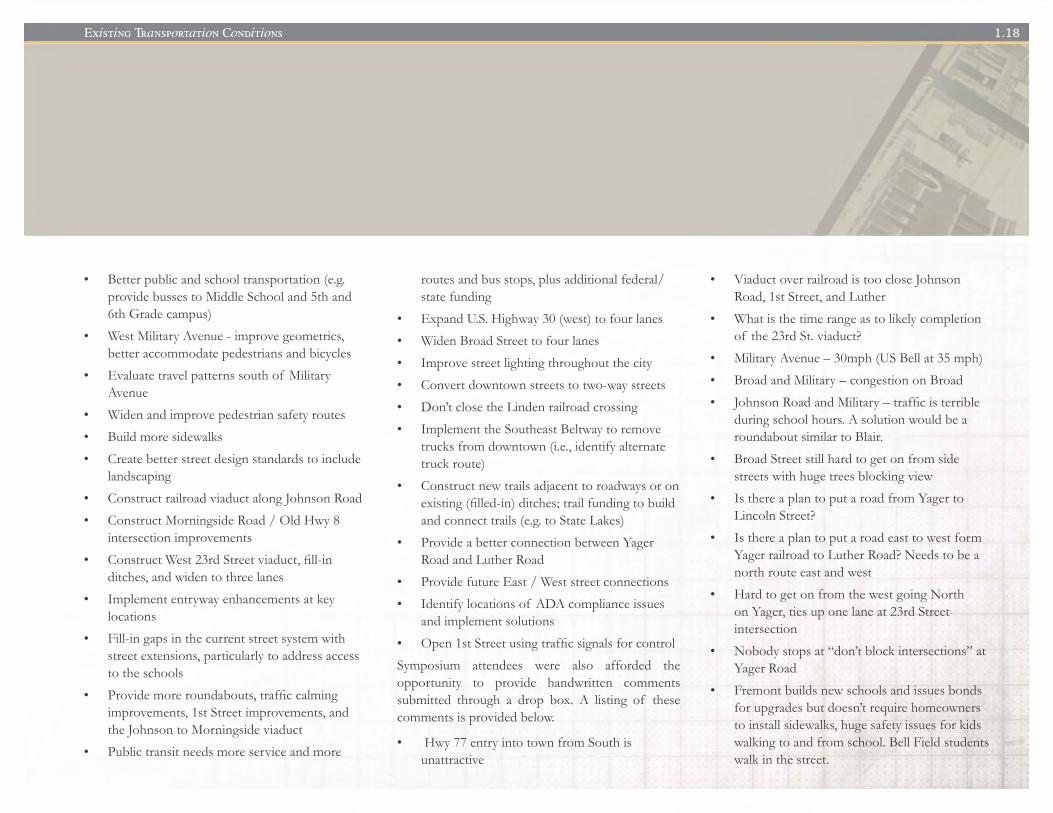
•. Better.public.and.school.transportation.(e.g..provide.busses.to.Middle.School.and.5th.and.6th.Grade.campus)
•. West.Military.Avenue.-.improve.geometrics,.better.accommodate.pedestrians.and.bicycles
•. Evaluate.travel.patterns.south.of .Military.Avenue
•. Widen.and.improve.pedestrian.safety.routes
•. Build.more.sidewalks
•. Create.better.street.design.standards.to.include.landscaping
•. Construct.railroad.viaduct.along.Johnson.Road
•. Construct.Morningside.Road./.Old.Hwy.8.intersection.improvements
•. Construct.West.23rd.Street.viaduct,.fill-in.ditches,.and.widen.to.three.lanes
•. Implement.entryway.enhancements.at.key.locations
•. Fill-in.gaps.in.the.current.street.system.with.street.extensions,.particularly.to.address.access.to.the.schools
•. Provide.more.roundabouts,.traffic.calming.improvements,.1st.Street.improvements,.and.the.Johnson.to.Morningside.viaduct
•. Public.transit.needs.more.service.and.more.
routes.and.bus.stops,.plus.additional.federal/state.funding
•. Expand.U.S..Highway.30.(west).to.four.lanes
•. Widen.Broad.Street.to.four.lanes
•. Improve.street.lighting.throughout.the.city
•. Convert.downtown.streets.to.two-way.streets
•. Don’t.close.the.Linden.railroad.crossing
•. Implement.the.Southeast.Beltway.to.remove.trucks.from.downtown.(i.e.,.identify.alternate.truck.route)
•. Construct.new.trails.adjacent.to.roadways.or.on.existing.(filled-in).ditches;.trail.funding.to.build.and.connect.trails.(e.g..to.State.Lakes)
•. Provide.a.better.connection.between.Yager.Road.and.Luther.Road
•. Provide.future.East./.West.street.connections
•. Identify.locations.of .ADA.compliance.issues.and.implement.solutions
•. Open.1st.Street.using.traffic.signals.for.control
Symposium. attendees. were. also. afforded. the.opportunity. to. provide. handwritten. comments.submitted. through. a. drop. box.. A. listing. of . these.comments.is.provided.below..
•. .Hwy.77.entry.into.town.from.South.is.unattractive
•. Viaduct.over.railroad.is.too.close.Johnson.Road,.1st.Street,.and.Luther.
•. What.is.the.time.range.as.to.likely.completion.of .the.23rd.St..viaduct?.
•. Military.Avenue.–.30mph.(US.Bell.at.35.mph)
•. Broad.and.Military.–.congestion.on.Broad
•. Johnson.Road.and.Military.–.traffic.is.terrible.during.school.hours..A.solution.would.be.a.roundabout.similar.to.Blair.
•. Broad.Street.still.hard.to.get.on.from.side.streets.with.huge.trees.blocking.view
•. Is.there.a.plan.to.put.a.road.from.Yager.to.Lincoln.Street?
•. Is.there.a.plan.to.put.a.road.east.to.west.form.Yager.railroad.to.Luther.Road?.Needs.to.be.a.north.route.east.and.west
•. Hard.to.get.on.from.the.west.going.North.on.Yager,.ties.up.one.lane.at.23rd.Street.intersection
•. Nobody.stops.at.“don’t.block.intersections”.at.Yager.Road
•. Fremont.builds.new.schools.and.issues.bonds.for.upgrades.but.doesn’t.require.homeowners.to.install.sidewalks,.huge.safety.issues.for.kids.walking.to.and.from.school..Bell.Field.students.walk.in.the.street.
City of Fremont, Nebraska Existing Transportation ConditionsCity of Fremont, Nebraska 1.18
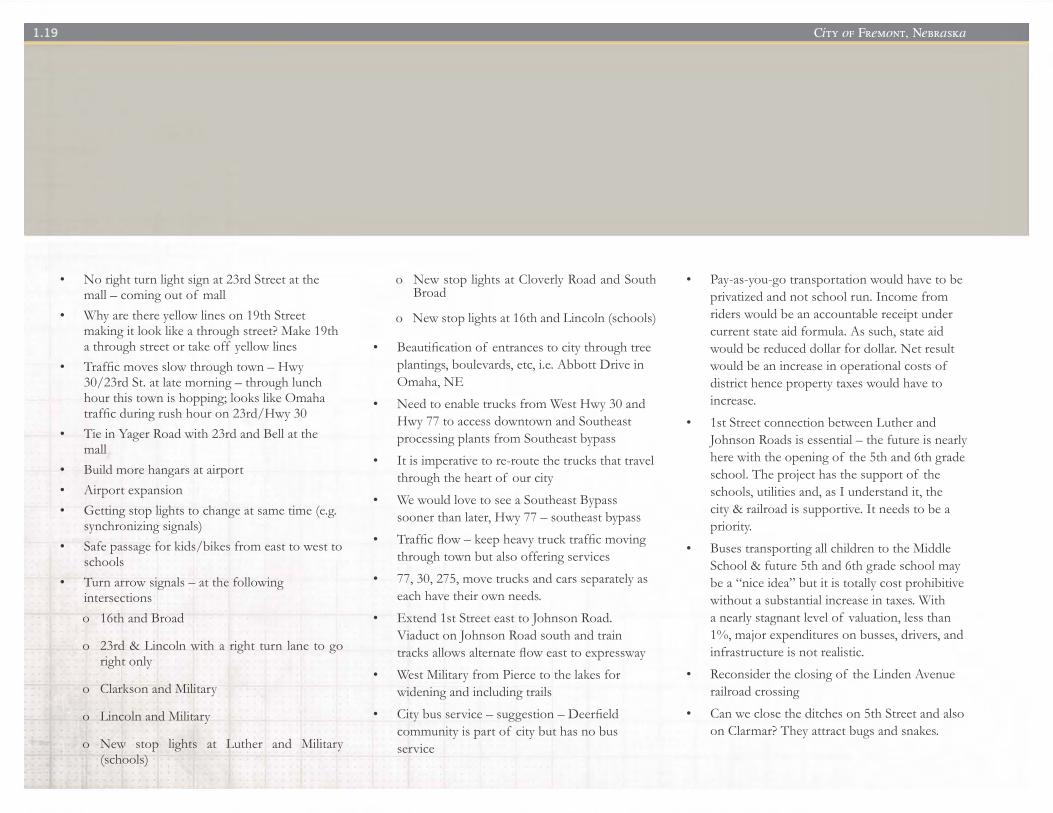
•. No.right.turn.light.sign.at.23rd.Street.at.the.mall.–.coming.out.of .mall
•. Why.are.there.yellow.lines.on.19th.Street.making.it.look.like.a.through.street?.Make.19th.a.through.street.or.take.off .yellow.lines
•. Traffic.moves.slow.through.town.–.Hwy.30/23rd.St..at.late.morning.–.through.lunch.hour.this.town.is.hopping;.looks.like.Omaha.traffic.during.rush.hour.on.23rd/Hwy.30
•. Tie.in.Yager.Road.with.23rd.and.Bell.at.the.mall
•. Build.more.hangars.at.airport•. Airport.expansion•. Getting.stop.lights.to.change.at.same.time.(e.g..
synchronizing.signals)•. Safe.passage.for.kids/bikes.from.east.to.west.to.
schools•. Turn.arrow.signals.–.at.the.following.
intersectionso....16th.and.Broad
.o......23rd.&.Lincoln.with.a.right.turn. lane.to.go.right.only
.o...Clarkson.and.Military
o....Lincoln.and.Military
..o.....New. stop. lights. at. Luther. and. Military.(schools)
..o......New.stop.lights.at.Cloverly.Road.and.South.Broad
o.....New.stop.lights.at.16th.and.Lincoln.(schools)
•. Beautification.of .entrances.to.city.through.tree.plantings,.boulevards,.etc,.i.e..Abbott.Drive.in.Omaha,.NE
•. Need.to.enable.trucks.from.West.Hwy.30.and.Hwy.77.to.access.downtown.and.Southeast.processing.plants.from.Southeast.bypass
•. It.is.imperative.to.re-route.the.trucks.that.travel.through.the.heart.of .our.city
•. We.would.love.to.see.a.Southeast.Bypass.sooner.than.later,.Hwy.77.–.southeast.bypass
•. Traffic.flow.–.keep.heavy.truck.traffic.moving.through.town.but.also.offering.services
•. 77,.30,.275,.move.trucks.and.cars.separately.as.each.have.their.own.needs..
•. Extend.1st.Street.east.to.Johnson.Road..Viaduct.on.Johnson.Road.south.and.train.tracks.allows.alternate.flow.east.to.expressway
•. West.Military.from.Pierce.to.the.lakes.for.widening.and.including.trails.
•. City.bus.service.–.suggestion.–.Deerfield.community.is.part.of .city.but.has.no.bus.service
•. Pay-as-you-go.transportation.would.have.to.be.privatized.and.not.school.run..Income.from.riders.would.be.an.accountable.receipt.under.current.state.aid.formula..As.such,.state.aid.would.be.reduced.dollar.for.dollar..Net.result.would.be.an.increase.in.operational.costs.of .district.hence.property.taxes.would.have.to.increase.
•. 1st.Street.connection.between.Luther.and.Johnson.Roads.is.essential.–.the.future.is.nearly.here.with.the.opening.of .the.5th.and.6th.grade.school..The.project.has.the.support.of .the.schools,.utilities.and,.as.I.understand.it,.the.city.&.railroad.is.supportive..It.needs.to.be.a.priority.
•. Buses.transporting.all.children.to.the.Middle.School.&.future.5th.and.6th.grade.school.may.be.a.“nice.idea”.but.it.is.totally.cost.prohibitive.without.a.substantial.increase.in.taxes..With.a.nearly.stagnant.level.of .valuation,.less.than.1%,.major.expenditures.on.busses,.drivers,.and.infrastructure.is.not.realistic.
•. Reconsider.the.closing.of .the.Linden.Avenue.railroad.crossing
•. Can.we.close.the.ditches.on.5th.Street.and.also.on.Clarmar?.They.attract.bugs.and.snakes.
City of Fremont, Nebraska1.19

Long Range Transportation Plan 2035
TransCAD Travel Demand Forecast Model Validation &
Alternative Analysis
2Appendix
Long Range Transportation Plan 2035
rt t t ~ --
LL i J
..
F"REM~NT
+
--t-1

Long Range Transportation Plan City of Fremont, NE
TransCAD Travel Demand Forecast Model Validation and Alternative Analysis Prepared For:
The City of Fremont, NE Prepared By:
4200 Pioneers Woods Drive Suite A Lincoln, NE 68506
In Cooperation with:
January 2012

Fremont Long Range Transportation Plan Model Validation Documentation
i
Table of Contents 1.0 INTRODUCTION ................................................................................................................................. 1
2.0 MODEL DEVELOPMENT PROCESS ...................................................................................................... 2
2.1 Trip Generation ............................................................................................................................... 2
2.2 Trip Distribution .............................................................................................................................. 6
2.3 Traffic Assignment .......................................................................................................................... 6
3.0 MODEL CALIBRATION / VALIDATION ................................................................................................ 8
3.1 Screenline Analysis .......................................................................................................................... 8
3.2 Root Mean Square Error (RMSE) ................................................................................................... 12
3.3 Comparison of Observed Versus Forecasted Volumes .................................................................. 12
3.4 Coefficient of Determination ......................................................................................................... 12
4.0 EXISTING 2010 MODEL ..................................................................................................................... 14
5.0 2035 FUTURE MODEL ....................................................................................................................... 17
5.2 2035 Committed Model ................................................................................................................ 17
5.3 2035 SE Beltway Model ................................................................................................................ 23
5.4 2035 US‐30 S‐Route Model ........................................................................................................... 23
5.5 2035 Combined Model .................................................................................................................. 30
6.0 CONCLUSIONS AND NEXT STEPS ..................................................................................................... 33

Fremont Long Range Transportation Plan Model Validation Documentation
ii
List of Figures Figure 1: Existing (2010) Fremont Model Roadway Network ....................................................................... 3 Figure 2: Fremont Model TAZ Boundaries .................................................................................................... 7 Figure 3: Fremont Model Screenlines ........................................................................................................... 9 Figure 4: Screenline Validation Diagram ..................................................................................................... 11 Figure 5: Actual Volumes versus Model Volumes....................................................................................... 13 Figure 6: ADT Volumes versus Existing 2010 Model Volumes .................................................................... 15 Figure 7: Existing 2010 Model Peak Hour V/C Plot ..................................................................................... 16 Figure 8: Difference between 2010 and 2035 Socioeconomic Data by TAZ ............................................... 20 Figure 9: 2035 Future Base Model Volumes ............................................................................................... 21 Figure 10: 2035 Future Base Model Peak Hour V/C Plot ............................................................................ 22 Figure 11: 2035 Committed Model Volumes .............................................................................................. 24 Figure 12: 2035 Committed Model Peak Hour V/C Plot ............................................................................. 25 Figure 13: 2035 SE Beltway Model Volumes .............................................................................................. 26 Figure 14: 2035 SE Beltway Model Peak Hour V/C Plot .............................................................................. 27 Figure 15: 2035 US‐30 S‐Route Model Volumes ......................................................................................... 28 Figure 16: 2035 US‐30 S‐Route Model Peak Hour V/C Plot ........................................................................ 29 Figure 17: 2035 Combined Model Volumes ............................................................................................... 31 Figure 18: 2035 Combined Model Peak Hour V/C Plot ............................................................................... 32
List of Tables Table 1: Fremont Model Socioeconomic Data .............................................................................................. 4 Table 2: Fremont Model Screenline Analysis Results ................................................................................. 10 Table 3: Fremont 2035 Future Model Socioeconomic Data ....................................................................... 18
Fremont Long Range Transportation Plan Model Validation Documentation
1
1.0 INTRODUCTION This report is intended to provide complete documentation of the Travel Demand Forecast (TDF) model developed as part of the City of Fremont, Nebraska’s Long Range Transportation Plan (LRTP). The TDF model is included as a key component of the LRTP based upon requirements by the Nebraska Department of Roads (NDOR) Comprehensive Plan Assistance Program. A TDF model was developed as part of the transportation planning process to provide an enhanced method for the evaluation of existing and future roadway conditions in Fremont. The information summarized in this report highlights the development of the TDF model for the City of Fremont. In short, the model is a computerized software tool that allows engineers and planners to more easily develop sound traffic volume forecasts for roadway segments throughout the City. The TDF model consists of a network (map) of desired streets – primarily collector level or higher, and several nodes that contain useful socioeconomic data throughout the City. Traffic volumes are generated based on the characteristics of this data and are routed on the overall street network so that daily volumes can be viewed along the various segments. Once the existing conditions model was developed and calibrated to be representative of the current daily volume activity throughout the community, additional scenarios were modeled to identify their impacts to these daily traffic patterns.
It should be noted that these TDF models are planning level in nature and do not indicate detailed intersection operations or peak hour traffic conditions etc. They do however, provide a useful “high‐level” view of traffic forecasts for potential roadway segment extensions or removals, major roadway capacity upgrades – i.e. 2‐lane to 4‐lane widening, and changes in land use type and intensity that would alter traffic volumes. The traffic volume projections can be utilized to plan needed infrastructure for growth areas and identify potential problem areas. The model projections are best utilized after they are post‐processed. Post processing is the process of analyzing the model results to determine if the model projections are likely higher, lower, or in the general range of volumes based on how closely the model forecasts the existing volumes for the particular links that are being analyzed in detail. Adjustments are then made as needed to create improved future volume projections. The software, TransCAD version 5.0, was utilized to develop the TDF model. TransCAD is one of the predominantly used commercial travel demand forecasting software platforms that incorporates Geographic Information System (GIS), enhanced network editing and travel demand modeling capabilities. The model was developed based on 2010 socioeconomic and roadway network data gathered and input by the project team. The remainder of this document provides information on all aspects of the model development process, the modeling of existing and future conditions, as well as the modeling of several future alternatives.
Fremont Long Range Transportation Plan Model Validation Documentation
2
2.0 MODEL DEVELOPMENT PROCESS The first step in the model development process is to develop the roadway network for the model. Roadways were selected based on their functional classification and circulation patterns in Fremont, NE. The capacities of the roadways were assigned based on the roadways functional classification. Additionally, the speeds, number of lanes, and general roadway characteristics of the network roadways were field collected by project team staff and coded into the model. The roadway network for the Fremont Model is composed of 460 nodes and 659 links that represent major roads in the Fremont area. The existing model roadway network is illustrated in Figure 1. The transportation planning process relies on TDF models, which involves predicting the impacts that various policies and programs will have on travel in an urban area. In general, travel demand forecasting attempts to quantify the amount of travel (demand) on the transportation system (supply). TDF models typically follow a four step modeling process to forecast traffic volumes, including (1) trip generation, (2) trip distribution, (3) mode split (choice), (4) and traffic assignment. The Fremont Model is strictly a vehicle demand model, therefore step 3 (mode split) was not included in the model. A description of the three steps that were included in the model follows below.
2.1 Trip Generation An initially analysis step in the modeling process is to estimate the number of person trips for a typical weekday throughout areas of the City. A person trip consists of a production trip end and an attraction trip end. A production trip end is where a trip begins from, such as a person’s home. The attraction trip end is where the trip is destined to, such as a place of employment. Trip generation models are based on Socio‐Economic Data (SED), in which employment sites such as commercial, warehouse, and industrial sites are represented in terms of number of employees instead of square‐footage or acreage of development, which is used in land use models. The Fremont Model utilized retail employment, non‐retail employment, households, and household population variables to determine the number of person trips. A detailed breakdown of the socioeconomic data by TAZ can be found in Table 1. The trip production model used in developing the Fremont Model was developed based on National Highway Cooperative Research Program (NCHRP) Report 365. Differing trip generation characteristics are utilized to depict trip making patterns of the various data within the planning area. As part of the trip generation process, the overall planning area is divided up into several smaller land areas so that individual characteristics of trips to and from these locations can be calculated. These areas are called Traffic Analysis Zones (TAZs) and are the basic trip generation units in a TDF
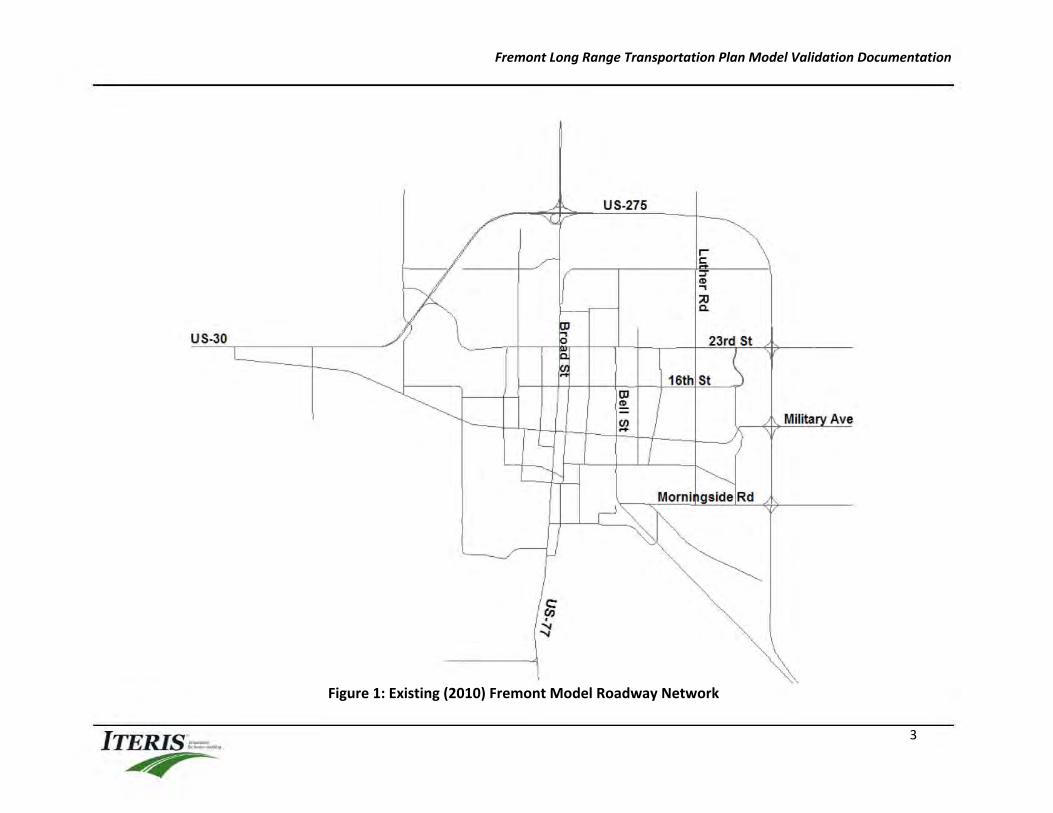
Fremont Long Range Transportation Plan Model Validation Documentation
3
Figure 1: Existing (2010) Fremont Model Roadway Network
US-30
ITERIS=
•
/ h ~
"-
./'
0 " "
US-275
r c ". ~ ~
;0 0.
23rd St
16th St \ III "-~
Militarv Ave
1 ~
Morni gside Rd
r-,\~

Fremont Long Range Transportation Plan Model Validation Documentation
4
Table 1: Fremont Model Socioeconomic Data Zone (TAZ)
Total Employment
Retail Employment
Non - Retail Employment Households
Household Population
1 0 0 0 121 287 2 0 0 0 3 8 3 360 163 197 146 348 4 662 0 662 78 185 5 0 0 0 2 6 6 0 0 0 2 5 7 0 0 0 3 8 8 304 0 304 0 0 9 426 152 273 798 1873
10 204 16 188 0 0 11 476 86 391 465 998 12 512 0 512 0 0 13 209 0 209 258 537 14 318 20 298 1214 2534 15 375 206 169 232 483 16 439 192 247 315 684 17 504 277 227 4 9 18 0 0 0 15 36 19 433 54 379 13 30 20 679 0 679 0 0 21 172 0 172 63 152 22 38 21 17 56 119 23 75 6 69 415 937 24 39 22 18 37 76 25 0 0 0 197 471 26 11 6 5 10 10 27 0 0 0 102 245 28 49 27 22 0 0 29 0 0 0 216 519 30 122 67 55 0 0 31 63 35 28 250 602 32 65 36 29 0 0 33 88 37 51 220 529 34 42 23 19 16 39 35 557 0 557 114 273 36 146 80 66 1 2 37 0 0 0 380 905 38 18 10 8 0 0 39 305 23 281 36 86 40 13 7 6 0 0 41 0 0 0 7 16
42 0 0 0 37 83
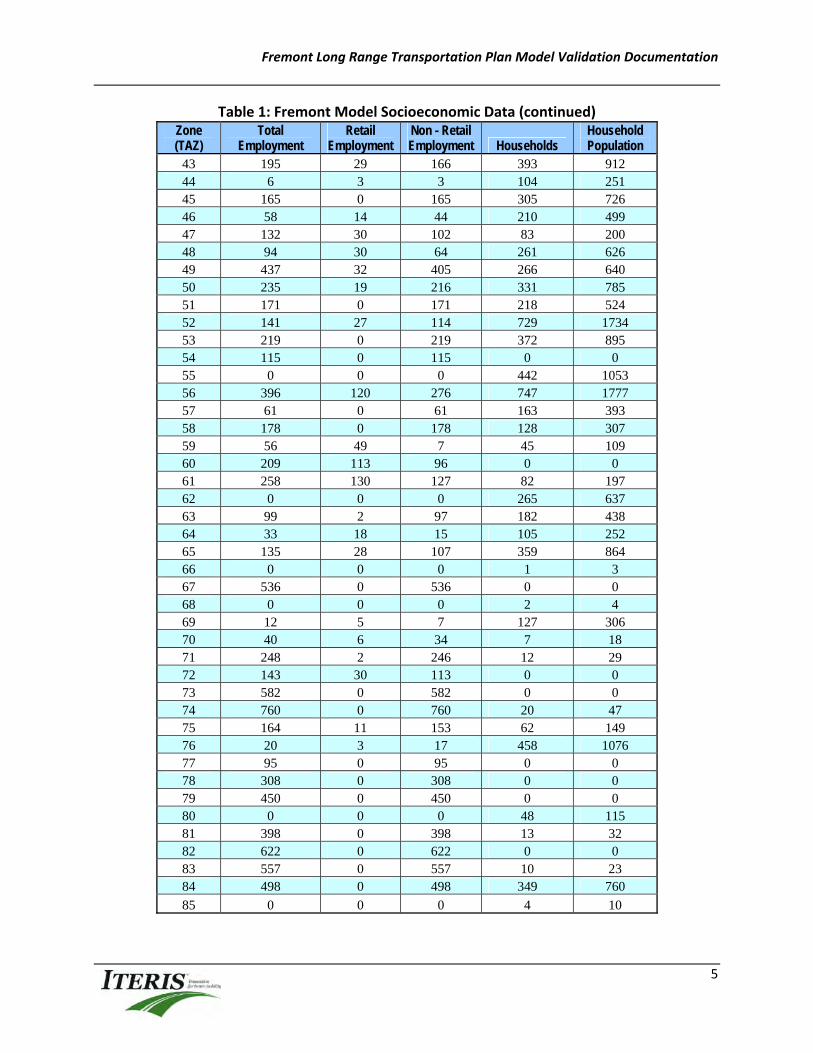
Fremont Long Range Transportation Plan Model Validation Documentation
5
Table 1: Fremont Model Socioeconomic Data (continued) Zone (TAZ)
Total Employment
Retail Employment
Non - Retail Employment Households
Household Population
43 195 29 166 393 912 44 6 3 3 104 251 45 165 0 165 305 726 46 58 14 44 210 499 47 132 30 102 83 200 48 94 30 64 261 626 49 437 32 405 266 640 50 235 19 216 331 785 51 171 0 171 218 524 52 141 27 114 729 1734 53 219 0 219 372 895 54 115 0 115 0 0 55 0 0 0 442 1053 56 396 120 276 747 1777 57 61 0 61 163 393 58 178 0 178 128 307 59 56 49 7 45 109 60 209 113 96 0 0 61 258 130 127 82 197 62 0 0 0 265 637 63 99 2 97 182 438 64 33 18 15 105 252 65 135 28 107 359 864 66 0 0 0 1 3 67 536 0 536 0 0 68 0 0 0 2 4 69 12 5 7 127 306 70 40 6 34 7 18 71 248 2 246 12 29 72 143 30 113 0 0 73 582 0 582 0 0 74 760 0 760 20 47 75 164 11 153 62 149 76 20 3 17 458 1076 77 95 0 95 0 0 78 308 0 308 0 0 79 450 0 450 0 0 80 0 0 0 48 115 81 398 0 398 13 32 82 622 0 622 0 0 83 557 0 557 10 23 84 498 0 498 349 760
85 0 0 0 4 10
Fremont Long Range Transportation Plan Model Validation Documentation
6
model. The TAZs are geographic areas dividing a planning region into relatively similar areas of land use and land activity. Traffic analysis zones are typically relatively homogeneous in character and their boundaries usually lie along major roadways. The boundaries may also follow significant physical features, such as rivers and ridges, or follow county and other political boundaries. The model completed for Fremont, NE is made up of 100 internal and 12 external TAZs that represent a geographical area delineated for transportation analysis. Of the 100 internal TAZs, 15 are spare TAZs. Spare TAZs are those that do not generate any trips within the model and are built into the network during the model development process for use in future analysis that may involve splitting the other internal TAZs into smaller zones. The TAZs in the Fremont Model are illustrated in Figure 2. The TAZ numbers in Table 1 correspond with the TAZs shown in Figure 2. 2.2 Trip Distribution This step in the model development process allocates the TAZ trip productions to the TAZ trip attractions that are estimated by the trip generation model. The output of this step is often called an origin‐destination (O‐D) table because it indicates where trips begin and end. Trips that are generated on the roadway network originate within a TAZ and have a destination in a different TAZ. The Fremont Model used the Gravity Method to distribute the trips between TAZs. The Gravity Method distributes trips between TAZs based on the shortest path, which is defined as the path with the lowest travel time.
Trips from external TAZs were divided into trips that were destined for internal TAZs and trips that were destined for other external TAZs. Based on the 2004 Origin‐Destination study that was conducted in Fremont, NE, it was assumed that 15% of the external TAZ trips were destined for other external TAZs, while the other 85% were destined for internal TAZs. Within the trips destined for external and internal TAZs, the trips were distributed to individual zones based on the percentage of total attractions the zone possessed. 2.3 Traffic Assignment The final model step assigns trip Origin‐Destinations to specific roadway facilities that link the origin TAZ and destination TAZ. The assignment of a particular route is based upon travel times reflecting the travel volume, roadway capacity, and speed relationships. The procedure used in the Fremont Model is an equilibrium assignment process, where the equilibrium algorithm iteratively tests different allocations of traffic to routes while re‐computing travel times based upon each route’s level of congestion. The final solution is an estimate of daily traffic volume on each road segment such that all trips are satisfied and no trip can switch routes without increasing everyone’s travel time.

Fremont Long Range Transportation Plan Model Validation Documentation
7
Figure 2: Fremont Model TAZ Boundaries
ITERIS=
•
----------------------------.. ------- -----------------T"------------------------- ----- ---i------------~ , " , " , " , ..... I ,
..... : : . . , 1/) '
2 ::J : : 4 5 ,
,-?'--~- -1 ~ , , / '
" 3 : , , , , / - , ... -----,...----------r-----+--------~r-----------T-----------1-------------1
: 6 / : 1 12 ,./ : : : : I , _ ~ " " .... I , • , I ' ..: I 10 I ,,' 13 I I , , , 7 ' ... 9 ' )1 ' I I I ,
: " ' .... : ./ !-----f---; 16 : 17 i 18 : l \ ' 8 '~ : / : : 15 : : : : : US-30 / \ !' 11 : 14 : I : 23rd St : : ~-----------------------~- .t--------.------~ .... :2.2,:z:lItl ..... r. :~:a.:t32:i:l4,.- :l!i: -~- :m -~-----.:r------------~ '_- -_ __ 19 : : r 1 , i t I i r- T -,: :
---- ------- -___ : 20 :':' , : 23 :25:: 29 : 3133 135 \ 37 1 39 \ 40 : : "'.. I ... , , " , I I I I ~ , ,
- .. - ... .:.------ --, : 1---1--..... "1---~----t--t---l-----1------_:_ --- -1 41 : -.... 42 I------t-~ : I ~ : : I: : :: .
~ .. ~"' .. : 43 :.u:45 :46! ~ 48 : 49 : 50 :51 : 52 : 53 : 54 : : ..... "j : " , : , , I, ' .. ----:·--'-,..-,-:-++ __ L __ ..:.. , Mi litary : ,~.----r-----------l : • 1590' I : ' "'-+-,.---___ I __ ~ .. " , ,57 1 5lf -!.. ,H1 , 62 :63M 65 ' 66 ,' : : " 1J.." '" ' • I I " - "-- - .. I ,..- .... ----1·-- ....... ------.... ::;- -- - - , 67 I 68 I
L p1l_.;.d!_2~ --!?_ : 76 ___ .... ~ "..{~"' :: : '" i .. _ ...... ~ 7-7 ' 78 l' ,
56 ~1 73 : 74 :~---_---- L----~-----.{------------~ I : ' j-- ' , 82 h. "' : ... --- .. - --~ ~ , , ...... , ~J ,\ , ,~ 84 N ' 80 ,{ .. , I
~ ~--.. • " ", en I ---_. .. 1-.1 ", ....... :::> I
55 :' ", -........ : , '.. I : ' '-" ...... ~
• '~ 83 I , " 85 l " .. :
,f '. : 4 , , , , , , " ' ~ 81 ,\ : ~ .. ,\~ I ' .. ~, : '~~, , . : , , , , , , " I.. __________________________ ___________ ___________ J.. _________ ______ _ ________________ _________ _______ ~
Fremont Long Range Transportation Plan Model Validation Documentation
8
3.0 MODEL CALIBRATION / VALIDATION Accurate transportation model calibration and validation requires that the transportation roadway network represent a similar time horizon as the land‐use data that is used to estimate travel demand. With the completed model being based on 2010 Socio‐Economic Data (SED), the model network was calibrated utilizing the most recent count data available to the project team. This volume data consisted of Average Daily Traffic (ADT) counts from the Nebraska Department of Roads (NDOR) from 2008, and additional 24‐hour counts conducted by the project team in 2010. The following performance measures were reviewed to compare the actual and forecasted volumes:
Screenline Analysis Root Mean Square Error (RMSE) Comparison of Observed Versus Estimated Volumes Coefficient of Determination
These performance measures are discussed in the following sections. 3.1 Screenline Analysis Screenline analysis is often used in the validation of a model’s traffic assignment. Screenlines are imaginary lines drawn across several sections of roadways along major travel corridors to assess the performance of the model by comparing the total assigned volumes from the model and the actual daily count data for those roadway segments. All
model links (segments) that cross a screenline form a group of roadways within a corridor for which the total model produced volumes and ground traffic counts are aggregated and compared. Only links where there is daily traffic volume data available are included in the screenline analysis. Eight (8) screenlines were identified across the City of Fremont, with four being east/west and four north/south. Figure 3 shows the location of the screenlines used in the analysis. After identifying the screenlines, the individual link volumes were summed from both the model and the ADT counts across all screenlines. Table 2 shows the sum of the existing counts and sum of the assigned flows across each screenline, as well as the percentage difference between the two. As shown in the table, the assigned volumes for all screenlines are within the acceptable industry validation standards, which is a difference of less than 10%. The overall ratio between all counts and assigned volumes across all screenlines is ‐3.1%, which indicates the model has an excellent overall fit in total trip estimation. Figure 4 represents the maximum desirable deviation in total screenline volumes adopted by the NCHRP 255 report and the Federal Highway Administration (FHWA), which comprise the national model validation standards. As shown in the figure, all the percent deviation for the screenlines are well below the tolerance levels. This indicates that the traffic volumes on all screenlines and traffic patterns are very closely validated to the existing conditions, which are well within industry standards.

Fremont Long Range Transportation Plan Model Validation Documentation
9
Figure 3: Fremont Model Screenlines
~
..J II)
ITERIS=
•
I
SL5
+
US·30 SL6
SL7
SLB
I I
C'I ..J II)
.... .... • (f)
:>
•
i T
C") "" ..J ..J II) II)
j
r " 23rd St
p"
Military '" .... '" • (f) :>

Fremont Long Range Transportation Plan Model Validation Documentation
10
Table 2: Fremont Model Screenline Analysis Results SCREEN.
UNE
SL Location
10 STREET SEGMENT
Existing ADT
Exlsllng ModelAOT
% Difference (ExlslingJ Modell
Difference DltferenceAZ
19 361 .. -~ . .• .. .• ~-. .. .. ~-
2 259 E 30th 51 E ofUS·17 1,735 1.914 10% -179 32041 ... - ... - ... _ .... __ . .. .. __ . .. .. __ . . __ . .. .. __ .... - .. _ . .. ... - ._. . .. __ . .. .. - ... _- .. __ . .. .. _-._~~~_ ,_?~~_,_~_~_,_ ,_~~~~_~~_,_~~_,~,_2_~~_ ,_ ,_~~~,. ,_~~_~,_<!~~~.:!!_ ,_~~~_,_~~~_,_~~~_,_ , _!~~,~P~~_,_~~~_,_ , _~~._~,!~~~_,_~~~_,_~~:?~~~_,_~~~_,_~~i~,~~~_,_~~~. ,_ , _~~_1_~_,_ ,_~.
2 235 W16~hSI EofUS-17 4.165 4.636 11% -411 221841
2 _________ !~! _____ ~_~!~!~r:i _____________ ~_<!~~~~!1 ___ g~ ~_~ ________ '_~,~Q?______ '_1_~ __________ .:_1_~ !L _____ ._~L~~~_~ ___ . _____ ,_? ___ , _____ ,_, __ !~~ ____ ,_~~~~~!~p_n __ ~~ . , ____ ~,_<!~~~.:!!_ , _____ ,_, ____ ,_, ____ ,_, __ ~._~~p __ , _____ , _ , _~lQ!_~ __ ,_, _____ , ___ ?_1_~ ___ , _____ ,_, __ :~~ ___ ,_, ___ . , _ , _~~!_~_,_ , __ . I TOTAL 40,515 42,538 ~% -2,023 2,518,331
YoRMSE 10%
______ ~ ___________ ~? _______ ~_~!~_~_~~~_~ ____ ~_~~~l~~_o_I!l_~t _______________ ~~~~Q____ 10. 119 13% ______ ~_t.!?~ _______ g?_~~_! __ _ ___ ~, _________ ~!~ __ E,_~~~~_~L _________ ~_~f~~~~~I!l_~~ _________ ~,!2~~_~ ____ )_~~~ _______ :.2_!~ ______ !~_9_~, ______ )}.§~~_~q~ __ _ _____ ~, ______ , _____ ~~~ _____ ~,_!~!~,_~ __________ ,E_~f~l~~_~I!l_~t ______________ ~~~~p ________ ~~~!.?, ___________ :_t.~~ _________ '!.!~_ , _______ ~~_~ ___ _
3 552 RoV E of Lincotn St 8.590 10,309 20% -1719 2954961 -_._._--_._._--_._._-- - - --_._._--_._._--_._._---_._---_._---_._._--_._._--_._.-- - - ---_._._---_._--_._._---_._---_._---_._._--_._---_._.---_._._--_._._--_._._-- - - --_._._--_._._- -_._._--
_____ ~ ______ , _____ !~L ___ ~_!~!_~! ____________ ~_~f!:!~~_~1!l_~I _____________ ~~~p ________ ~!!~_~, _____ , _____ ~L"& __________ ,:~~ ________ }_!§~_~ ___ _ _____ ~, __________ !~P ___ J.!,~_!!~!_~,~ ________ ~_~~l~~_~!l_~t ______________ ~~~~~ _______ ~~~~_~, _____ , _____ ~!! __________ ~~L _______ !~!~_~~ ___ _
_ __________________ !Q!~~ ____ ~~!!!'!L__ 46,361 YoRMSE
333 __ _ '-~,_~§!!~_~ __ ' 5%
4 102 CountyRoadU E of US 215 By-Pass 4.620 4,175 3% ·155 24025
ITERIS=-
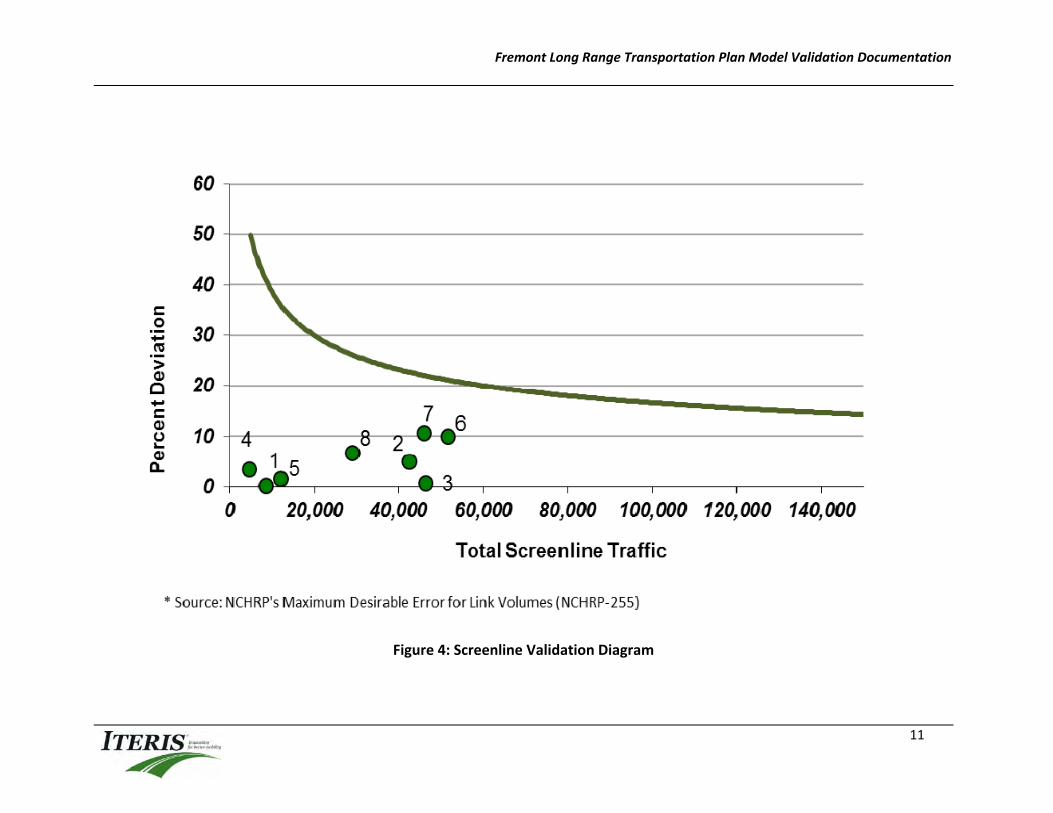
Fremont Long Range Transportation Plan Model Validation Documentation
11
Figure 4: Screenline Validation Diagram

Fremont Long Range Transportation Plan Model Validation Documentation
12
3.2 Root Mean Square Error (RMSE) The Root Mean Square Error (RMSE) is a quadratic scoring rule which measures the average magnitude of the error. The equation for the RMSE is as follows:
i i
i ii
untsNumberofCoCountuntsNumberofCoCountModel
RMSE)/(
100*)1/()(%
5.02
Based on the NCHRP 255 report, RMSE is suggested to be less than 30% for each screenline and total screenlines. As seen in Table 2, the %RMSE for the individual screenlines is below the suggested threshold of 30% and the total %RMSE for the model is 19%, which is well below the suggested value. 3.3 Comparison of Observed Versus Forecasted Volumes In order to evaluate the aggregate statistics on the validity of the traffic assignment across all points in the model regardless of specific corridors or screenlines, counted traffic volumes versus model forecasted volumes were compared on model segments with available traffic counts for all sample segments. Figure 5 compares the actual daily volumes with the daily model output volumes forecasted by the model for all roadway segments where counts were available. As shown in the figure, the numbers are generally clustered along a 45° line‐of‐fit, which shows a good correlation between actual and modeled volumes.
3.4 Coefficient of Determination Another important measure of comparison for the fit between observed traffic counts and estimated model volumes is the Coefficient of Determination (R2), also known as the “goodness of fit” statistic, which is one of the most commonly used tools to measure the overall model accuracy. It shows how well the regression line represents the assignment data (model volumes). The R2 value is calculated based on the following equation:
2
2222
2
)(.)(
)()((()(
iiii
iiii
yynxxn
yxyxnr
where: x = counts y = model volumes n = number of counts The desirable R2 value based on the Model Validation and Reasonableness Checking Manual, Federal Highway Administration, February 1997, is 0.88 or higher. A value of 1.00 represents a perfect fit, but even if traffic counts were compared against themselves, the daily variation would not allow for a regression coefficient of 1.00, due to natural variation in counts. The computed value of R2 was 0.9349 for the Fremont Model, which shows that the model has an excellent overall fit in terms of traffic volume forecasting.

Fremont Long Range Transportation Plan Model Validation Documentation
13
Figure 5: Actual Volumes versus Model Volumes

Fremont Long Range Transportation Plan Model Validation Documentation
14
4.0 EXISTING 2010 MODEL The calibrated Existing 2010 Model for the City of Fremont was run and compared to the existing ADT traffic counts. Where there was traffic count information available, the model volumes were adjusted using the National Cooperative Highway Research Program (NCHRP) 255 Report methodology. Adjusting the model volumes results in the model volumes more closely matching the ground collected traffic counts. All future model scenarios were also adjusted using the NCHRP 255 methodology. Figure 6 shows the adjusted Existing 2010 Model volumes compared to the traffic counts. Figure 7 shows a peak hour volume‐to‐capacity (V/C) map for the Existing 2010 Model. The peak hour V/C plot does not represent any particular peak hour, but rather a “generic” peak hour based on the commonly used rule‐of‐thumb that the highest peak hour volumes are generally 10% of the total daily volumes. The City of Fremont model is a daily model. The daily volumes forecasted by the model were multiplied by 10% to obtain the generic peak hour volume data that was used in the peak hour V/C plots. The V/C plots were created using the models unadjusted volumes and a calculated capacity based on the number of lanes for each roadway. Because the initial input values may be uncharacteristic for the roadway segment (the model may be estimating the volume higher or lower than actual and the capacity may not reflect actual conditions that increase or decrease capacity beyond the number of lanes),
the maps are not meant to be a true V/C calculation, but rather a visual reference that can be used to quickly spot differences between the model alternatives.

Figure 6
0 .5 1 1.5
Miles
ADT Volumes versusExisting 2010 Model Volumes
US-275
23rd St
Morningside Rd
Military Ave
Broad St
Bell St
Luther Rd
US-77
US-30
16th St
86008580
43103335
46103085
8990
97808545
31502310
25402365
1071010000
1350012185
987510260
51954310
52104775
1477515270
1431515675
1166015630
96859715
100609190
1628015480
1856522810
1376517465
9165
1414012930
1343514045
80009285
15452860
35554550
33252540
Existing Model VolumeXXXX ADT CountXXXX
1119010435
1211012570
10120
6935
16385
5860
Fremont Long Range Transportation Plan Model Validation Documentation
15
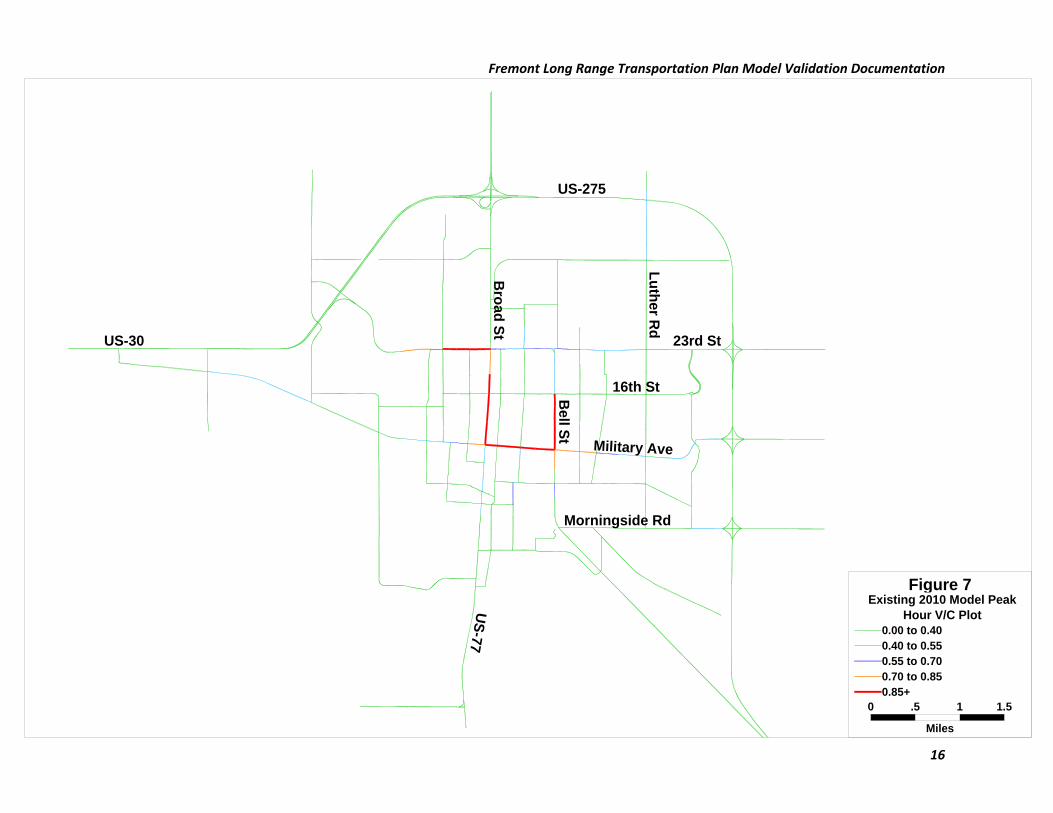
Figure 7
0 .5 1 1.5
Miles
Hour V/C Plot0.00 to 0.400.40 to 0.550.55 to 0.700.70 to 0.850.85+
Existing 2010 Model Peak
US-275
23rd St
Morningside Rd
Military Ave
Broad St
Bell St
Luther Rd
US-77
US-30
16th St
Fremont Long Range Transportation Plan Model Validation Documentation
16

Fremont Long Range Transportation Plan Model Validation Documentation
17
5.0 2035 FUTURE MODEL The Existing 2010 Fremont Model that was developed and calibrated was used to create the 2035 Future Model. The 2035 Future Model was developed using the Existing 2010 Model network combined with future 2035 socioeconomic data. The following sections discuss the development of the 2035 Future Model and the various future alternatives that were analyzed with this model. 5.1 2035 Future Base Model The 2035 Future Base Model was developed to analyze the impacts that the projected 2035 socioeconomic data would have on the existing City of Fremont network if no changes were made to the current street system. The 2035 socioeconomic data was input into the Existing 2010 Model to create the 2035 Future Base Model. The 2035 socioeconomic data is shown in Table 3. In addition, Figure 8 illustrates the changes in magnitude between the existing and future socioeconomic data by various land use type. As shown, the larger the pie chart, the larger the “difference” in the comparison. The 2035 Future Base Model was run with the updated socioeconomic data. The resulting model volume projections, after NCHRP 255 adjustments, are shown in Figure 9. In addition, Figure 10 illustrates the corresponding peak hour V/C plot. Comparing the V/C plot to the Existing 2010 Model V/C plot shows a slight performance decline in V/C along several roadways that are adjacent to the areas
with the largest increase in socioeconomic data, specifically, Luther Road, 23rd Street, Military Avenue, and Morningside Road. 5.2 2035 Committed Model The 2035 Committed Model was built from the 2035 Future Base Model and was intended to depict the future conditions of Fremont with a number of already planned for projects in place. The 2035 Future Base Model network was updated with several “committed” roadway improvements. Those roadway improvements included:
Luther Road capacity improvement from 5th Street to 27th Street
Bell Street capacity improvement from Linden Ave to Cuming Street
E. Military Avenue capacity improvement from Luther Road to US‐275
W. Military Ave capacity improvement from Ridge Road to Pierce Street
Johnson Road capacity improvement from Military Avenue to 16th Street
32nd Street capacity improvement from Clarkson Street to Yager Road
32nd Street road addition from Yager Road to Diers Parkway
Diers Parkway road addition from 23rd Street to 32nd Street
1st Street road addition from Luther Road to Johnson Drive; closure of 1st Street railroad crossing

Fremont Long Range Transportation Plan Model Validation Documentation
18
Table 3: Fremont 2035 Future Model Socioeconomic Data Zone (TAZ)
Total Employment
Retail Employment
Non - Retail Employment Households
Household Population
1 0 0 0 121 287 2 0 0 0 3 8 3 816 235 581 370 893 4 2135 437 1698 78 185 5 0 0 0 2 6 6 0 0 0 2 5 7 0 0 0 3 8 8 607 0 607 0 0 9 380 152 229 962 2311
10 200 0 200 0 0 11 543 93 450 204 490 12 1208 19 1189 0 0 13 262 0 262 11 27 14 387 0 387 304 731 15 726 145 580 44 105 16 1440 233 1207 397 949 17 881 485 396 399 951 18 0 0 0 15 36 19 488 0 488 13 30 20 1441 0 1441 0 0 21 189 0 189 55 133 22 51 28 23 12 29 23 75 6 69 265 639 24 45 25 20 5 12 25 100 0 100 193 466 26 19 10 9 0 0 27 0 0 0 102 245 28 49 27 22 0 0 29 0 0 0 216 520 30 122 67 55 0 0 31 63 35 28 254 612 32 65 36 29 0 0 33 88 37 51 220 529 34 42 23 19 16 39 35 557 0 557 114 274 36 146 80 66 1 2 37 0 0 0 358 862 38 78 43 35 0 0 39 432 96 336 329 786 40 256 141 115 309 737 41 584 321 263 220 524
42 629 0 629 23 56

Fremont Long Range Transportation Plan Model Validation Documentation
19
Table 3: Fremont 2035 Future Model Socioeconomic Data (continued) Zone (TAZ)
Total Employment
Retail Employment
Non - Retail Employment Households
Household Population
43 254 36 218 329 793 44 11 6 5 106 256 45 165 0 165 283 683 46 64 8 56 192 464 47 139 17 122 81 195 48 94 17 78 261 628 49 437 32 405 268 647 50 235 19 216 304 732 51 34 0 34 227 548 52 145 29 116 682 1645 53 483 0 483 661 1587 54 315 110 205 288 685 55 0 0 0 442 1053 56 399 149 250 417 1004 57 129 0 129 133 320 58 172 0 172 124 299 59 59 29 31 44 106 60 234 62 171 0 0 61 253 72 180 137 327 62 0 0 0 265 638 63 102 3 99 183 442 64 48 26 22 103 249 65 135 28 107 361 870 66 62 15 47 299 712 67 1401 0 1401 48 114 68 0 0 0 2 4 69 9 3 6 131 315 70 42 0 42 7 18 71 272 14 258 0 0 72 143 30 113 0 0 73 722 0 722 0 0 74 917 0 917 0 0 75 356 11 345 62 150 76 456 3 453 456 1097 77 240 0 240 134 319 78 1124 26 1098 0 0 79 486 0 486 0 0 80 0 0 0 48 115 81 739 0 739 13 32 82 698 0 698 0 0 83 606 0 606 10 23 84 604 5 599 438 1048
85 0 0 0 4 10
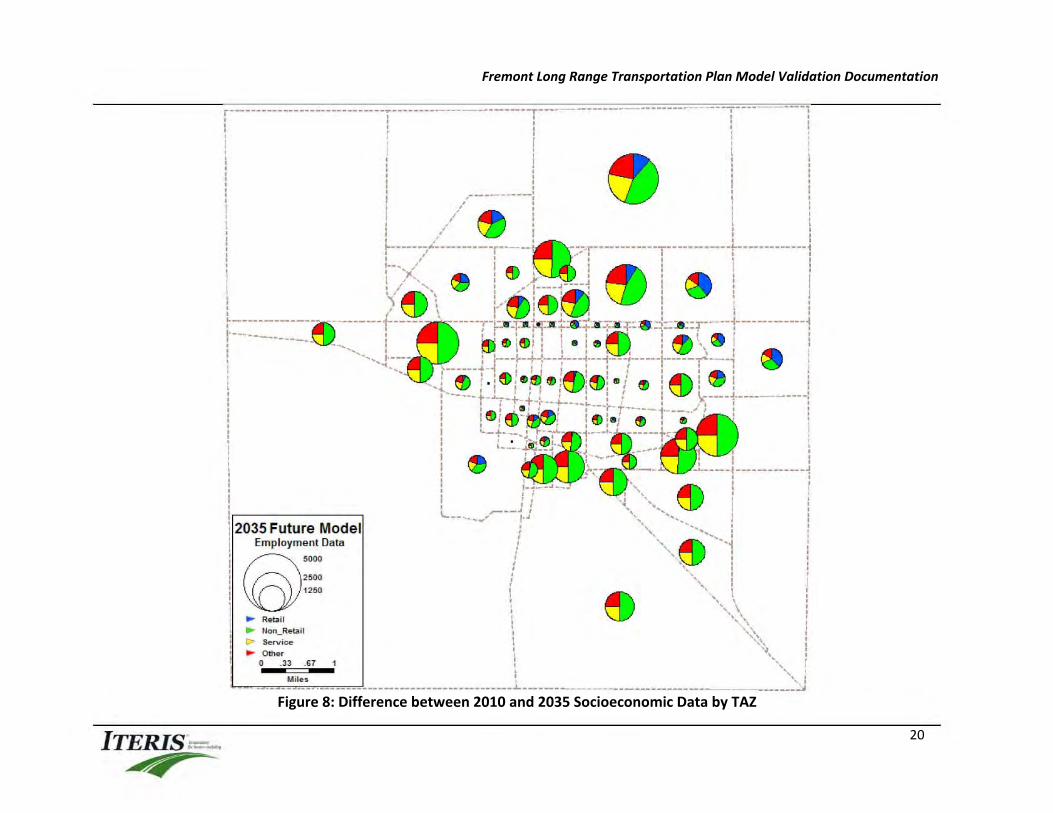
Fremont Long Range Transportation Plan Model Validation Documentation
20
Figure 8: Difference between 2010 and 2035 Socioeconomic Data by TAZ
ITERIS=
•
----------------.... --------------------------r-------r-------------: : o 0 0
: r r o 0 0
I I : o 0 0
I I : o 0 0 I I I I : ____ ________ :
I I , I
I ' ,' I ' I, I
----------- --- ------------- j o 0 o 0 o 0 o 0 o 0 o 0 o 0
o
: i / : I I / :
\ : / I ----'l"'------------T------------t-------------1 : I-------j. ... -----------r------ ~~ , : , : I : " : : I I : : ~--" -' : ~ I : : Or :
\ I ,JI.", ... : w /f-"---~ - ---~ : I : I , /., 'IO , _~"" I I
: 'v.' ~~:/ : !:: : .' W \ r j J ~_ __ _ " _~__ _ ______ ~-------------~ : --;'------ '------T-;-.:."T:I .. :"'"=X ..::a:+:lii -'-lf:r-_3 _,, __ lt __ r : ~---------------- --------- : f r .. -i .JT i . : q!J ~ ! ... I" ~ ! I-- ------ ------~ 0 or< w o ~ o, 0 : ru 0 \U 0 0 ,... :
: . --'~'- : ~.---}-+_:.--L--~.---t.---r·----t-----T"'----l 0 : : '~,I"---- " 1,1" ': " . 1 , . ' .... ", ~------t-i ~ J :..J :~l~: II ' I ~ : \Q I I I I ~ " ' I;lI , l!I w (!l :\l.1:\,l/ ' : ~ ' W ' I _____ ,
: . -,.:. , -~ : j I: i : : ! f ! >-; ____ ~---_----- ! : : - -t- T-t-+-"---~----"---I- - "'~ ___ __ -t. _____ ~ ,: , ' I "" .~'" " ' , _ , . , ' «> ' ' '-': : tI) •• • ~ , I!I : ' , • I CLI' , , ., , , I , '1., _ -.L _~. ___ ._~ ______ ,.::- , ' I '--'- - -'4 .. 1_ ', , _ I ' , I • ' a'! \y l." __ : : : ··---r"--1 '~ - ____ " .,- ,: I
' ! .. 0 \._~ ,__ _, _____ + ____________ , I , '10 " , I " _ ", ~ : I '1-.. --"'--- '. , I " I , , , : ! i: -~, " '~ : : • ...---.1 • '-, .... ~_ : I '- __ _ __ ' , • .1 '... _ _ _ ... '
! 2035 Future Model '; "''-'" ~''''~'_'~ I ", , I Employment Data : ':
: @5000 f '.'" ! I ' . , : 2500 t _,_ : I , ~ _ .... \ I 1250 , _ .. : ~ ".' \ \ : -',\ I .. Ret:o il , "
i .. Uon_ Ret:o il : ",,~) I t>- Service : '.
: : '-, I ~ 0ttMr • " o 33 67 I ,_,
Mil •• _____________________________________ 1 ____________________________________________________ .01

Figure 9
0 .5 1 1.5
Miles
2035 Future Base Model Volumes
23rd St
16th St
Military Ave
Morningside Rd
Bell St
US-77
US-30
Broad St
US-275
Luther Rd
9900
5400
5200
26003600
15300 20300 22400 24500
1400016000
5600
16600
1460018400
15900
4500 1780019600
10400
3800
130001380012600
1760014900
6800
12300
1080
0
XXXX 2035 Base Model Volume
12800
Fremont Long Range Transportation Plan Model Validation Documentation
21
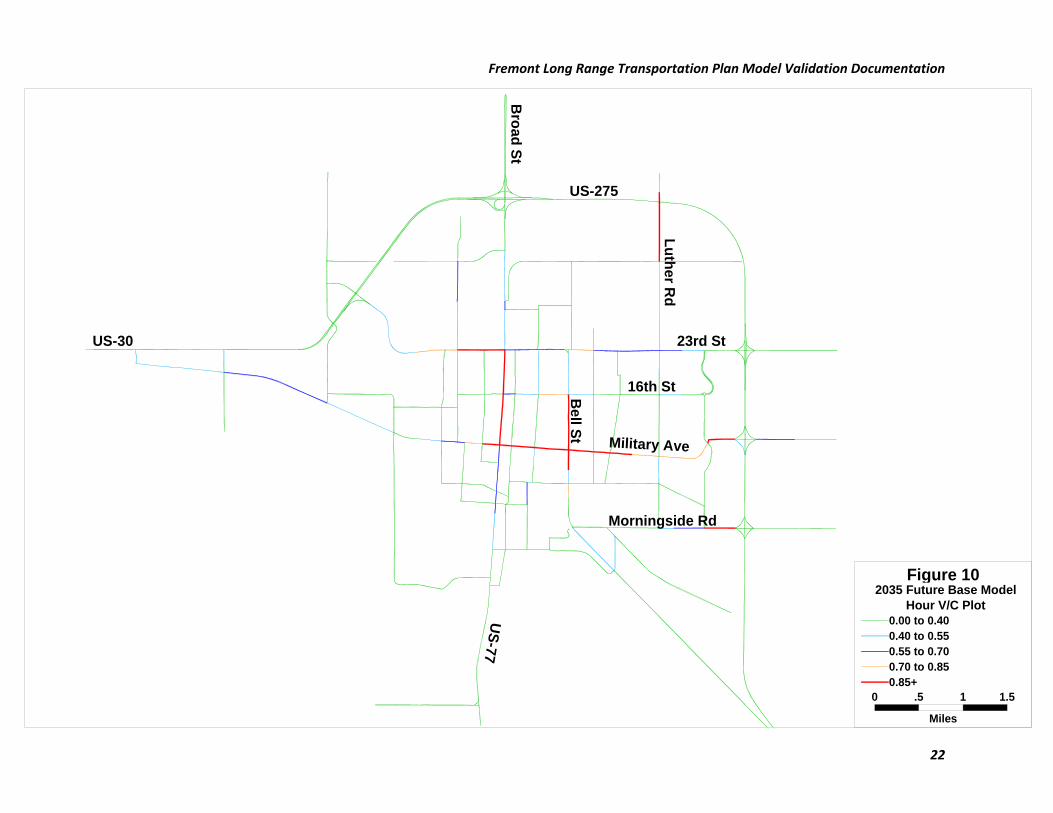
Figure 10
0 .5 1 1.5
Miles
Hour V/C Plot0.00 to 0.400.40 to 0.550.55 to 0.700.70 to 0.850.85+
2035 Future Base Model
US-30
US-275
Broad St
Luther Rd
16th St
23rd St
Military Ave
Morningside Rd
US-77
Bell St
Fremont Long Range Transportation Plan Model Validation Documentation
22

Fremont Long Range Transportation Plan Model Validation Documentation
23
The results of the 2035 Committed Model are illustrated in Figure 11, which shows the model volumes, and Figure 12, which is the corresponding peak hour V/C plot. Comparing the results of the 2035 Committed Model to the 2035 Future Base model shows a shift in traffic patterns related to the closing of the 1st Street railroad crossing. With the closing of the crossing, traffic is no longer able to access US‐275 by using 1st Street. As a result, there was a shift in traffic from Morningside Road and 1st Street to Military Avenue and Luther Road. The capacity improvements along Luther Road indicate an expected stable V/C (little performance decline) and reduced the V/C ratio on Luther north of 23rd Street. 5.3 2035 SE Beltway Model The 2035 SE Beltway Model was developed to evaluate the potential Southeast Beltway connecting US‐77 and US‐275. The 2035 SE Beltway Model was created from the 2035 Committed Model by adding the proposed SE Beltway alignment to the 2035 Committed Model. The volume outputs of the model are illustrated in Figure 13 and the peak hour V/C plot is shown in Figure 14. The model forecasts about 1250 trips on the SE Beltway. It should be noted that this volume has not been adjusted with the NCHRP 255 method, because there were no existing counts to use for the adjustment. Although there are a limited number of trips along the SE Beltway, a reduction in the V/C ratio along Military Avenue is noticeable. This reduction is occurring due to a shift in traffic from using US‐
275/Military Avenue to get into Fremont instead using US‐275/SE Beltway/Old Highway 275/Bell Street. 5.4 2035 US‐30 S‐Route Model The 2035 US‐30 S‐Route Model was developed to analyze the realignment of US‐30 to the west of Fremont. This previously studied project was run as a standalone alternative, similar to the SE Beltway model to gauge the traffic volume shifts. The 2035 US‐30 S‐Route Model was created from the 2035 Committed Model by adding the new US‐30 alignment within the model. Creating the new US‐30 alignment within the model also created an additional external node, where previously there was only an external node with the US‐30 alignment; the 2035 US‐30 S‐Route Model has an external node for the old and new US‐30 alignments. The trips were split between these two nodes with 90% of the trips being assigned to the new US‐30 alignment and 10% being assigned to the old US‐30 alignment, as it is expected that only local traffic would be utilizing the old US‐30 alignment once the new alignment is constructed. The resulting model forecasted volumes are illustrated in Figure 15 and the associated peak hour V/C is shown in Figure 16. The realignment of US‐30 has the biggest impact on Broad Street and 23rd Street. Traffic has shifted from using W. Military Avenue in the 2035 Committed Model to using Broad Street and 23rd Street in the 2035 US‐30 S‐Route Model. The shift resulted in an increase of 1,000‐2,000 vehicles along portions of these roadways. The increase in

Figure 11
0 .5 1 1.5
Miles
2035 Committed Model Volumes
US-30
US-275
Broad St
Luther Rd
16th St
23rd St
Military Ave
Morningside Rd
US-77
Bell St
25200
5700
1790019600
4300
13300
16400
1070
0
14600
3800
5400
5200
14100
15600 21000 22400
1270015500
14100
124006800
1790018300
17000
2600
9800
XXXX
15000
2035 Model Volume
12600 13900
4900
Fremont Long Range Transportation Plan Model Validation Documentation
24
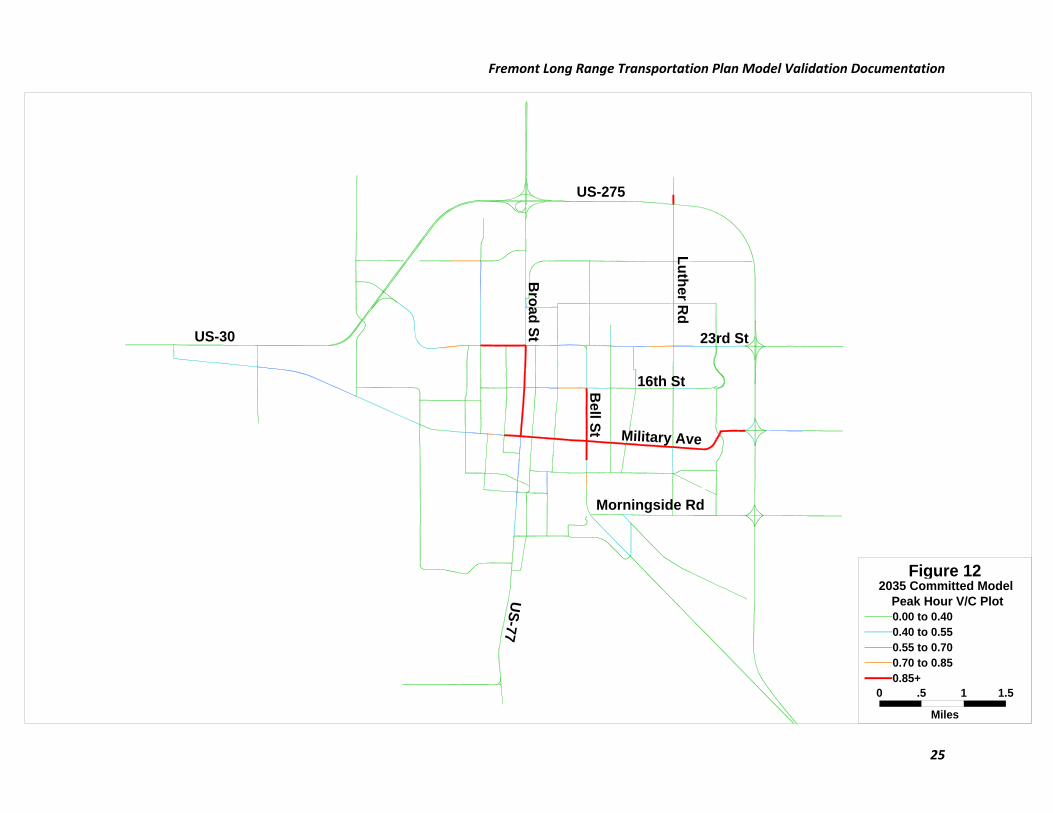
Figure 12
0 .5 1 1.5
Miles
Peak Hour V/C Plot0.00 to 0.400.40 to 0.550.55 to 0.700.70 to 0.850.85+
2035 Committed Model
US-30
US-275
Broad St
Luther Rd
16th St
23rd St
Military Ave
Morningside Rd
US-77
Bell St
Fremont Long Range Transportation Plan Model Validation Documentation
25

Figure 13
0 .5 1 1.5
Miles
2035 SE Beltway Model Volumes
US-30
US-275
Broad St
Luther Rd
16th St
23rd St
Military Ave
US-77
Bell St
Morningside Rd
SE Beltway
XXXX 2035 Model Volume
9200
5300
4300
3600
1320012500
14700 20700 21500 24800
12500
57004300
14700
10200 9000
4500
2250021400
79003300
17800
1260011000
15800168002500
146005245
18800
1200
0
Fremont Long Range Transportation Plan Model Validation Documentation
26

Figure 14
0 .5 1 1.5
Miles
Peak Hour V/C Plot0.00 to 0.400.40 to 0.550.55 to 0.700.70 to 0.850.85+
2035 SE Beltway Model
US-30
US-275
Broad St
Luther Rd
16th St
23rd St
Military Ave
US-77
Bell St
Morningside Rd
SE Beltway
Fremont Long Range Transportation Plan Model Validation Documentation
27

Figure 15
0 .5 1 1.5
Miles
2035 US-30 S-Route Model Volumes
US-30 US-275
Broad St
Luther Rd
16th St
23rd St
Military Ave
Morningside Rd
US-77
Bell St
1400
6000
900
13900 16800
1730017300
19700
15600
37003000
1500018400
9700
18900
1370017300
12200
14000
4300
13400
1800019600
251002240021900
5700
6600
4900
XXXX
13800
2035 Model Volumes
Fremont Long Range Transportation Plan Model Validation Documentation
28

Figure 16
0 .5 1 1.5
Miles
Peak Hour V/C Plot0.00 to 0.400.40 to 0.550.55 to 0.700.70 to 0.850.85+
2035 US-30 S-Route Model
US-30 US-275
Broad St
Luther Rd
16th St
23rd St
Military Ave
Morningside Rd
US-77
Bell St
Fremont Long Range Transportation Plan Model Validation Documentation
29
Fremont Long Range Transportation Plan Model Validation Documentation
30
traffic volumes along these roadways did not have a substantial impact on the V/C plot, as most of the links remained unchanged. The portion of 23rd Street near the old US‐30 alignment did see an increase in the V/C ratio. 5.5 2035 Combined Model The SE Beltway and US‐30 S‐Route alternatives were combined into one model scenario to analyze the results of both alternatives being constructed. Combining these two alternatives resulted in the 2035 Combined Model, which was developed by using the 2035 US‐30 S‐Route Model and then constructing the SE Beltway within the model. The model volume results of the 2035 combined model are shown in Figure 17 and the peak hour V/C plot is illustrated in Figure 18. Comparing the results to the 2035 US‐30 S‐Route Model shows similar changes as were seen when the 2035 SE Beltway Model was compared with the 2035 Committed Model, as the most noticeable change is a shift in traffic from using US‐275/Military Avenue to get into Fremont, to instead using US‐275/SE Beltway/Old Highway 275/Bell Street to enter the City. The 2035 Combined alternative shows an increase in model volume along the perimeter highways and a general reduction of a few hundred to about a thousand on the links illustrated on the volume figure.

Figure 17
0 .5 1 1.5
Miles
2035 Combined Model Volumes
US-30 US-275
Broad St
Luther Rd
16th St
23rd St
Military Ave
US-77
Bell St
Morningside Rd
SE Beltway
14800 18800
1560035005700
700
3000
15100 21200
14900
21400 24800
2270022000
9400
4300
1210015800
800010400
1910016100
8800 13200
17200 3400
434014400
2035 Model Volumes
1400
XXXX
45005700
Fremont Long Range Transportation Plan Model Validation Documentation
31
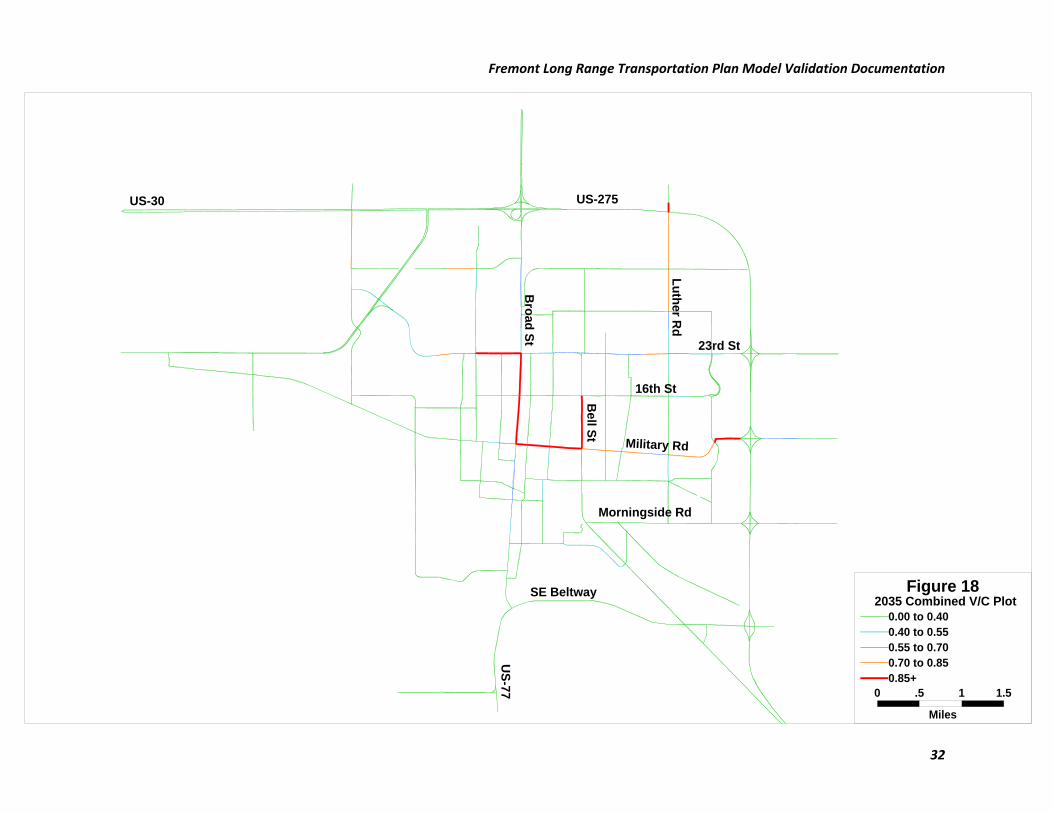
Figure 18
0 .5 1 1.5
Miles
2035 Combined V/C Plot0.00 to 0.400.40 to 0.550.55 to 0.700.70 to 0.850.85+
US-30 US-275
Broad St
Luther Rd
16th St
23rd St
Military Rd
US-77
Bell St
Morningside Rd
SE Beltway
Fremont Long Range Transportation Plan Model Validation Documentation
32

Fremont Long Range Transportation Plan Model Validation Documentation
33
6.0 CONCLUSIONS AND NEXT STEPS In conclusion, it can be stated that the City of Fremont TransCAD model for the 2010 base year serves as a reliable model for preparing and testing future year forecasts for alternative roadway and land use scenarios. This is evident based on the results of the calibration and validation effort, the results of the screenline analysis, root mean square error, comparison of observed versus forecasted volumes, and coefficient of determination. The outcomes of these methods are within the accepted industry standards indicating that the model provides a reasonable forecast of traffic volumes for the City of Fremont. The calibrated and validated model was then used to evaluate several different future alternatives. Results of these future alternatives were compared to the other alternatives. The two primary alternatives evaluated were the SE Beltway connecting US‐77 and US‐275 and the realignment of US‐30. Of the two, the SE Beltway resulted in the greater shift in traffic patterns as evident by the change in traffic from using US‐275/Military Avenue to access Fremont, to instead using US‐275/SE Beltway/Old Highway 275/Bell Street. The change resulted in some reduction to the V/C ratio along Military Avenue. These changes are a result of the improved access to Old Highway 275, which creates another alternative route for traffic. The realignment of US‐30 had a less noticeable impact on the traffic patterns within Fremont. There was a slight shift in traffic from W. Military Ave to Broad Street and 23rd
Street, as the W. Military Avenue route to access US‐30 became less viable with the shift in the US‐30 alignment. With the model calibrated and validated and future scenarios complete, the results will now be discussed with the stakeholders. Comments from the stakeholders will be addressed as necessary. Upon acceptance of the model results, the model will be utilized in the development of the Long Range Transportation Plan, along with other transportation improvements, pedestrian and trails/sidewalk recommendations, future Airport information and a priority project listing with planning level cost information.
Related Documents