CONTRACT REPORT S-69-3 j EFFECT OF. DEGREE OF SATURATION ON COMPRESSIBILITY OF SOILS FROM THE N-\ DEFENCE RESEARCH ESTABLISHMENT SUFFIELD by \ .)A. J. Hendron, Jr. M. T. Davisson • "1 J. F. Parola April 1969 Sponsored by Defense Atomic Support Agency Conducted for U. S. Army Engineer Waterways Experimeruý Station CORPS OF ENGINEERS Vicksburg, Mississippi D D C under Purchase Order No. WESBPJ-68-67 AY 2 0 19 by M. T. L)avisson, Foundation E=nginee- Champaign, Illinois APMY.MOC VI ,KSfUAG. Mig9 THIS DOCUMENT WAS B•EN APPROVED FOR PUBLIC RELEASE AND SALE; ITS DISTRIBUTION IS UNLIMITED

Welcome message from author
This document is posted to help you gain knowledge. Please leave a comment to let me know what you think about it! Share it to your friends and learn new things together.
Transcript

CONTRACT REPORT S-69-3
j EFFECT OF. DEGREE OF SATURATION ONCOMPRESSIBILITY OF SOILS FROM THE
N-\ DEFENCE RESEARCH ESTABLISHMENTSUFFIELD
by
\ .)A. J. Hendron, Jr.
M. T. Davisson
• "1 J. F. Parola
April 1969
Sponsored by
Defense Atomic Support Agency
Conducted for
U. S. Army Engineer Waterways Experimeruý Station
CORPS OF ENGINEERSVicksburg, Mississippi D D C
under
Purchase Order No. WESBPJ-68-67 AY 2 0 19
by
M. T. L)avisson, Foundation E=nginee-
Champaign, IllinoisAPMY.MOC VI ,KSfUAG. Mig9
THIS DOCUMENT WAS B•EN APPROVED FOR PUBLIC RELEASEAND SALE; ITS DISTRIBUTION IS UNLIMITED
FOREWORD
The soil properties presented herein were obtained for the purpoe of clarifying the stress-strain rela-tions which should be used in computer codes for predicting groun~motions due to high pressure loading.This work is in conjunction with research on propagation of ground shock through soils being conducted bythe Soils Division, U. S. Army Engineer Waterways Experiment Station, for the Defense Atomic SupportAgency.
This report was requested and authorized by Mr. J. G. Jackson, Jr., Chief, Impulse Loads Section,Soil Dynamics Branch, under the direction of Mr. W. J. Turnbull, Chief 1f the Soils Division. The reportwas prepared under Purchase Order No. WESBPJ-68-67, dated 16 August 1967, issued to M. T. Davisson,Foundation Engineer, Champaign, Illinois. '
Directors of the Waterways Experiment Station during the perforn ance of this work and preparationand publication of this report were COL John R. Oswalt, Jr., CE, and C :)L Levi A. Brown, CE. Technical
Directors were Mr. J. B. Tiffany and Mr. F. R. Brown.
uii

CONTENTS
FOREWORD ...... .........
CONVERSION FACTORS BRITISH TO METRIC UNITS OF MEASUREMENT ..........
SUMMARY . . .. ..... ix
PART I INTRODUCTION .............. . . .................. I
Object ... ... .. . . . .. .... ....... ..... . IScope ............ ......... ...... .......................... I
PART II. SOILS INVESTIGATED .. .. ............. ........ .... ..... .... ... 2
Site Conditions . . ............................ ....- 2Subsurface Investigation...... ....... ....... . .. ......... 2
PART II1. TEST PROCEDURES .................. . .. . .. ......... ..... 5
Description cf Apparatus ... .. .. .. .... ...... . -. ........... 5Experimental Procedure .... . ............. ............. ........... 7
PART IV. TEST RESULTS AND INTERPRETATION OF RESULTS ................... 9
Stress-Strain Relations ......................... . . . ... 9Secant Moduli-Stress Re!ations ...... ................ : .. ... .... . 13Axial Stress-Ra,'ial Stiess Relations .... ................................... 15Formulation of Three-Dimensional Stress-Strain Relations ............. :............... 15
PART V- CONCLUSIONS ... ...... ................... 17
LI7 ERATURE CITED ................... ......... 18
TABLES 1-3
APPENDIX A TABULATED TEST DATA
APPENDIX B AXIAL STRESS VERSUS AXIAL STRAIN
APPENDIX C CONSTRAINED MODULUS VERSUS AXIAL STRESS
APPENDIX D RADIAL -TRESS VERSUS AXIAL STRESS
APPENDIX E TABULATED DATA FOR THREi. DIMENSIONAL STRE.SS-STRAINRELATIONS
APPENDIX F- OCTAHEDRAL NORMAL STRESS V.RSUS OCTAHEDRAL".LINEAR STRAIN
APPENDIX G OCTAHEDRAL SHEARING STRESS VEFSUS OCTAHEDRALNORMAL STRESS
V
II,
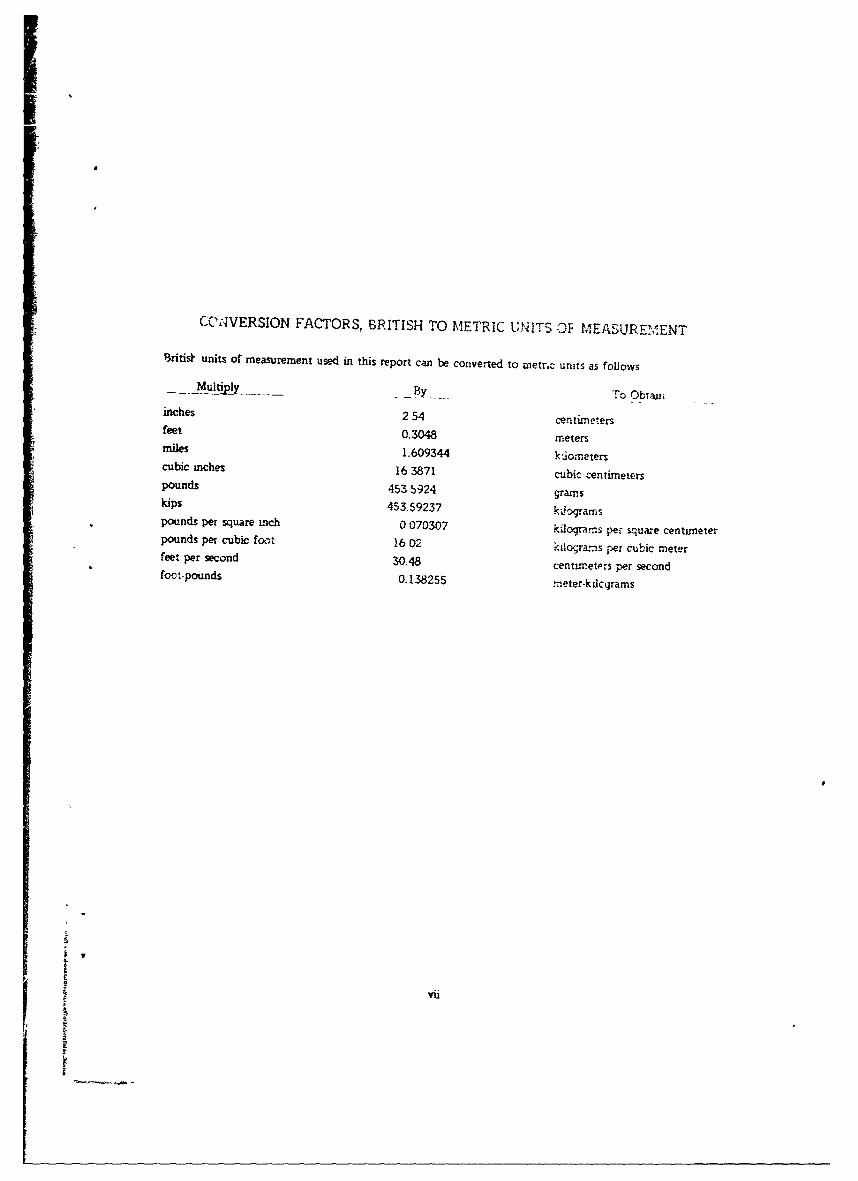
COiVERSION FACTORS, BRITISH TO METRIC UNITS OF MEASUREMENT
Britist units of measurement used in this report can be converted to metr, units as folhows
Mutipy .By To Obtai
inches 2 54 centimetersfeet 0.3048 metersmiles 1.609344 kliometerscubic inches 16 3871 cubic centimeterspounds 453 5924 gramskips 453.59237 kibgrarnspounds per square inch 0 070307 kilograms pe- square centimeterpounds per cubic foct 16 02 ki.ograis per cubic meterfeet per second 30.48 centimetprs per secondfoct-pounds 0.138255 meter-kdlcqrams
.f vii
tI

SUMMARY
The soil te-st reported herein were conducted to provide information on the influence of degreev of
saturation on highh p,essure stress-strain relations of undisturbed and rernolded soils from the Defence Re-
search Establishment, -uffield. These high-pressure one-dimensional test. were 1so to provide input data for
computer codes concernrng the relation between strrss -and strain invanarts at high pressures Soma investi-
gators were concerned that large strains might develop at high pressures in silt and clay as hzs been _served
for sand due to grain crushing. As expected, the tenr results presented herein shcw that large strains dc not
develop at high pressures in fine-qrained soils such as silt and clay
The test program consisted of 12 one-dimensional tests on 4 specimens each of undisturbed and re-
molded silty clay, and 4 specimens of remolded sandy silt in all tests the radial strain was essentially
zero. Axial and radial stresses and aYa strain were measured. The tes-s were carried to an ,xial stress of
20,000 psi unless soil extrusion occurred at a lower stress. The following conclusions were reached:.
a_ The degree of saturation and the initial void ratio are the most significant variablesgoverning the one-dimensional t-ress-strain relations of soil at hiqh pressures.
b. For pressures exceeding 3000 psi the compacted specimens and undisturbed specimens
of Suffield soil yield the same relation if the initial degree of saturation and initial
void atio are identical before loading.
c. A lowe, '_jnd to the secant modulus of deformation M. at a given level of axial
stress 0a is given by
(I = S. a
100I+e, 300,000 psi
for both compacted and undisturbed samples of fine-grained soil subject•t to pressure.
greater than 3000 psi.
JL Th. average unloading modulus of Suffield soils subjected to pressures greater than 3000psi is approximately 10 times the loading secant modulus of deformation Ms ..
e. It is probable that the stiffness of the Suffield soils when unsaturated will bie greater under
dynamic loading than the static values given herein. Previous comparisons of static and
dynamic values of constrained moduli of Suffield soLt7 have shown that the dynamic values
are twice the static values. This observation is consistent with similar comparisons for
NTS Frenchman Flat silt-

EFFH('T OF I ME,;R{1 OF S %T[R %I'ION ON (COIPRESSIIIII.lTIOF SOILS FROM \ 'TIIE IFF,%CF. RESE kRCCII
ESTAIBLISII-1E.NT, SLFFIFFLI)
PART Ik INTRODUCTION
1. The object of this study was to determine the high-pressure, static, one-dimensional stress-str. r
characteristics cf compacted and undisturbed soils from the Defence Research Establishment, Suffiekl (DRES),
in Alberta, Canada. Degree of saturation was the major variable investigated. These one-dimensional tests
were alsc to provide input data for computer codes concerning the relation between stress and strain invari-
ants at high pressures. These high-pressure relations were especially important since some invest'-ators were
concerned that large strains might develop at high pressures in silt and clay as has been observea .jr sand
due to gram crushing.
SCOPE
2. T#o 5-in.*-diarn undisturbed Shelby tube samples and remolded samples of two different soils,
which were air-dried and passed through a No. 10 sieve, were furnished by the U. S. Army Engineer Water-
ways Experiment Station (WES) for this study. A total of 12 static-undrained one-dimensional compression
tests were performed.
3. Specifically, four tests w-re performed on the undisturbed saanples, and fom tesz wvmi --a -
formed on each of the two remolded soils, the remolded soils were compacted at predetermined water con-
tents and dry densities. The results of the tests are presented in the form of plots of axial stress versus
axial strain, secant modulus versus axial stress, and radial stress versus axial strem The index properties for
each of the different wi1 samples tested, and the test apparatus, experimental procedure, and an interpre-
tation of the test results are also presented.
A table of factors for converting Bntish units of meawrement to metric units is presentefi on page vii
I.
I
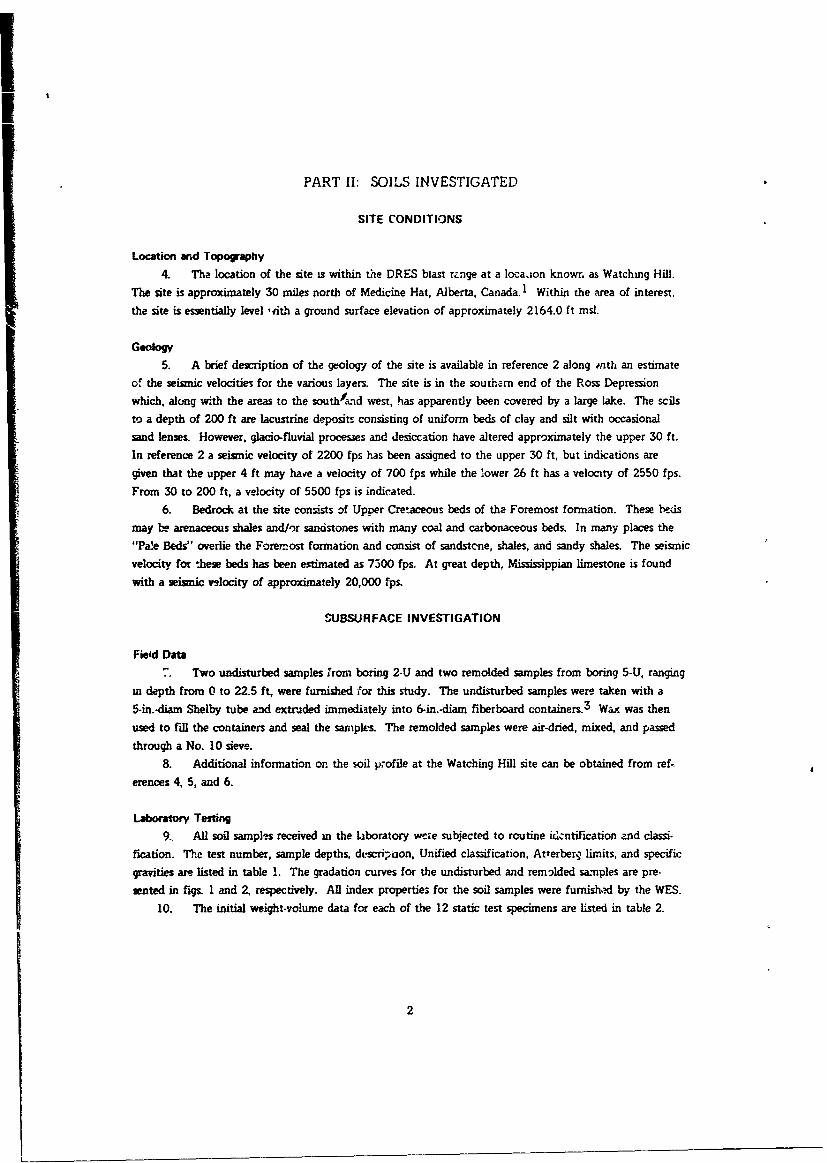
PART II: SOILS INVESTIGATED
SITE CONDITIONS
Location and Topogaphy
4. The location of the site is within the DRES blast rznge at a locaion known as Watching Hill.
The site is approximately 30 miles north of Medicine Hat, Alberta, Canada. 1 Within the area of interest.
the site is essentially level ,ith. a ground surface elevation of approximately 2164.0 ft msl.
Geology5. A brief description of the geology' of the site is available in reference 2 along mnth an estimate
of the seismic velocities for the various layers. The site is in the southern end of the Ross Depression
which, along with the areas to the southload west, has apparently been covered by a large lake. The scils
to a depth of 200 ft are lacustrine deposits consisting of uniform beds of clay and silt with occasional
sand lenses. However, glacio-fluvial processes and desiccation have altered approximately the upper 30 ft.
In reference 2 a seismic velocity of 2200 fps has been assigned to the upper 30 ft, but indications are
given that the upper 4 ft may have a velocity of 700 fps while the lower 26 ft has a velocity of 2550 fps.
From 30 to 200 ft, a velocity of 5500 fps is indicated.
6. Bedrock at the site consists of Upper Cretaceous beds of the Foremost formation. These beds
may be arenaceous shales and/or sandstones with many coal and carbonaceous beds. In many places the
"Pa!e Beds" overlie the Foremost formation and consist of sandstcne, shales, and sandy shales. The seismic
velocity for these beds has been estimated as 7300 fps. At great depth, Mississippian limestone is found
with a seismic velocity of approximately 20,000 fps.
SUBSURFACE INVESTIGATION
Fieid Data
Two undisturbed samples from boring 2-U and two remolded samples from boring S-U, ranging
in depth from 0 to 22.5 ft, were furnished ýor this study. The undisturbed samples weree taken with a
5-in.-diam Shelby tube and extruded imnmediately into 6-in.-diarn fiberboard containers.3 Wax was then
used to fill the containers and seal the sanipk-. The remolded samples were air-dried, mixed, and passed
through a No. 10 sieve.
8. Additional information or the soil p.-ofile at the Watching Hill site can be obtained from ref-
erences 4, 5, and 6.
Laboratory Testing9, All soil samples received in the laboratory werie subjected to routine iiclntification znd classi-
fication. The test number, sample depths, dt&scri-on, Unified classification, Atterberg limits, and specific
gravities are listed in table 1. The gradation curves for the undisturbed and remalded samnples are pre-
sented in figs. 1 and 2, respectively. All index properties for the soil samples were furnish.-d by the WES.
10. The initial weight.volume data for each of the 12 static test specimens are listed in table 2.
2

a ~~ ~ ~ ' Ilsm)ltm-c
0'
-c-
>~~~ ~ ~ In - -- Z V
;-i r hl
Z- f
ItD 10 1o 0D
0 on I It
3C~~*
1 31
Ul =.O ;2:wh U U; L)~ki
0 021
I CA* - 4- ~C
1H~3 ~ -~- ~U ~ - ~ %le)
um I-4

I XIIw
o 2 1
Ln 0
0
-4-- t1
'at !
.0V
1"~ ~ ~ 3MA'321Nr-~-* C -C.~ t'1
~- ~h _z~zKK±

PART III TEST PROCEDURES
DESCRIPTION OF APPARATUS
11 The apparatus used for the stau.; one-dimenstonal tests, shown in fig. 3, consisted of a confin-
ing -ng assembly wiich contained the sodl s aPt-:,,tn The confining ring was centered on the baseplate
with the aid of a lucite qude ring as shown in fig 3 The piston was also centered on the sod specimen
with the a;d of a second lucite -uide ring A spit iing was mounted or the piston and furnished a rea&-
tion for the dl ind:c3tor which neasured the axial deformation to thp nearest 0.001 in. A 300-kip uni-
versal Riehie hydrai.uc testing machine vias used to apply the axial stress to the soil specimen through the
i [I I
I I
I I I I
[ -- -e
-, I- %D,, ".e •. ',-:It I
Fig 3 Schematic of static loading machine snowingaxia strain strumentation
5

loading piston. A photograph of this static test machine is shown in fig 4a, a close-up of the confining ringassembly is shown in fig 4b.
a Static test m~achine
b. C as-up of confining ring assemnbly
Fig. 4. Test. apparatus
6

12. A steel rin,' 1.0 in. high, with 4-in. inside diameter dnd a vl thickness of 1.0 in. was used to
confine the test specimens. An attempt was made to limit the radial strains to the minimum value required
to facilitate accurate recording by use of the SR-4 gages. The output of the SR-4 gages was monitored with
an SR-4 indicator Calibrations of the confining rings were performed previously as desribed in reference 4.
EXPERIMENTAL PROCEDURE
Preparation of Test Specimens
13. For the tests of undisturbed samples, it was mandatory to develop a trimming operation. The
trimming procedure involved placing the waxed soil sample in the hydraulic press along with the sample
trimming equipment. The important feature >f the trimming equipment is the trimming ring. The trim-
ming ring has a 4-in. inside diameter, equal to that of the confining ring, but the ouitside face is beveled
to form a sharp cutting edge. The outer face of the ring has a shoulder that fits the outside diameter of
the 1.0-in.-thick confining ring. When the confining ring and the trimming ring are pressed together, an
integral unit is obtained that can be forced into a soil sample in a manner similar to the use of a thin-wall
sampler in a field sampling operation. Excess soil and wax were trimmed away with a knife as the trim-ming ring was forced into the sample. When the trimming ring had penetrated the sail a sufficient distance,
the ring was carefully removed and the so, s.,ecmei was trimmed l,.el with the height of the confir.ýng
ring. Sample trimmings from each test specimen were set aside for specifir gravity, Atterberg limits, and
9rain-size determinations. Water conteat samples were also taken from the Shelby tube sections before and
during the trimming p ocess
14. The tare wtiqht of the confining ring is known along with its dimensions. Therefore, the
weight of the ring and soil qpcimen furnishes sufficient data to calculate the initial density of the sogl.With the specific gravity and water content data, complete weight-volume determinations can be made
for the test specimen.
15. The final step is to place the confining ring on the baseplate and to assemble the confining
ring assembly. A height determination for the assembly is made in a dial comparm.tor to an accuracy of
0.001 in. Because the height of the assembly itself is known, the dial comparator reading furnishes a
check on the initial height of the specimen.
16. The remolded specimen was compacted into the trimming ring with a Vicksburg tamper after
soi batches were properly mixed to the desired water contents and ailowed to equilibrate for 24 hr. The
soil specimens were compacted in two layers with ninc evenly distributed blows per layer. The heightof fall of the 4-lb hammer was varied to obtain the prede:ermined dry densities.
17. The compaction energy varied from 0.2 ft-lb/in.3 to 1.1 ft-lb/in.3 of soil. All remolded speci-
mens were prepared with the compacuon tamper except the sandy silt specimen at a water content of27 percent. In o:der to obtain the deiired density :.M.s specirn-en was prcpared by hand-placing the soil
into the confining ring. After compaction. the trimming was carried out in the same manner used for the
undisturbed specimens-
Test Procedure
18. The confining ring assembly was placed in the static test machine as shown in fig. 3. The dialindicators were set at zero under the load of the piston itself which corresponds to a stres of appioxunatelyI psi- Succeeding loads were applied in predetermined increments and held until the dial indicator and
radial stress observations were made. A similar procedure was followed during unloading, however, at zero
7

apphed koad the som specunen was allowed to rebound for approximately 5 rin. v-h2reas the lead ,ncre
ments required approxim•.eiy i mm for completion ANl tests were loaded to the 200,0-psi stresi level or
soil extrusion prior i the 20,000-psi stress.
19. Upon ,emovtni- the confinirg ring assembly from the test machine, the height was determined
with the dial comparator, This reading was compared with the initial dial comparator reading and served as
a check on the residua! deflectior. The confining .-u•g and specimen were removed from the assembly and
a careful inspetdon was made for extrusion before a final water content determinatio.- was made
ia
8

PART IV: TEST RESULTS AND INTERPRETATION OF RESULTS
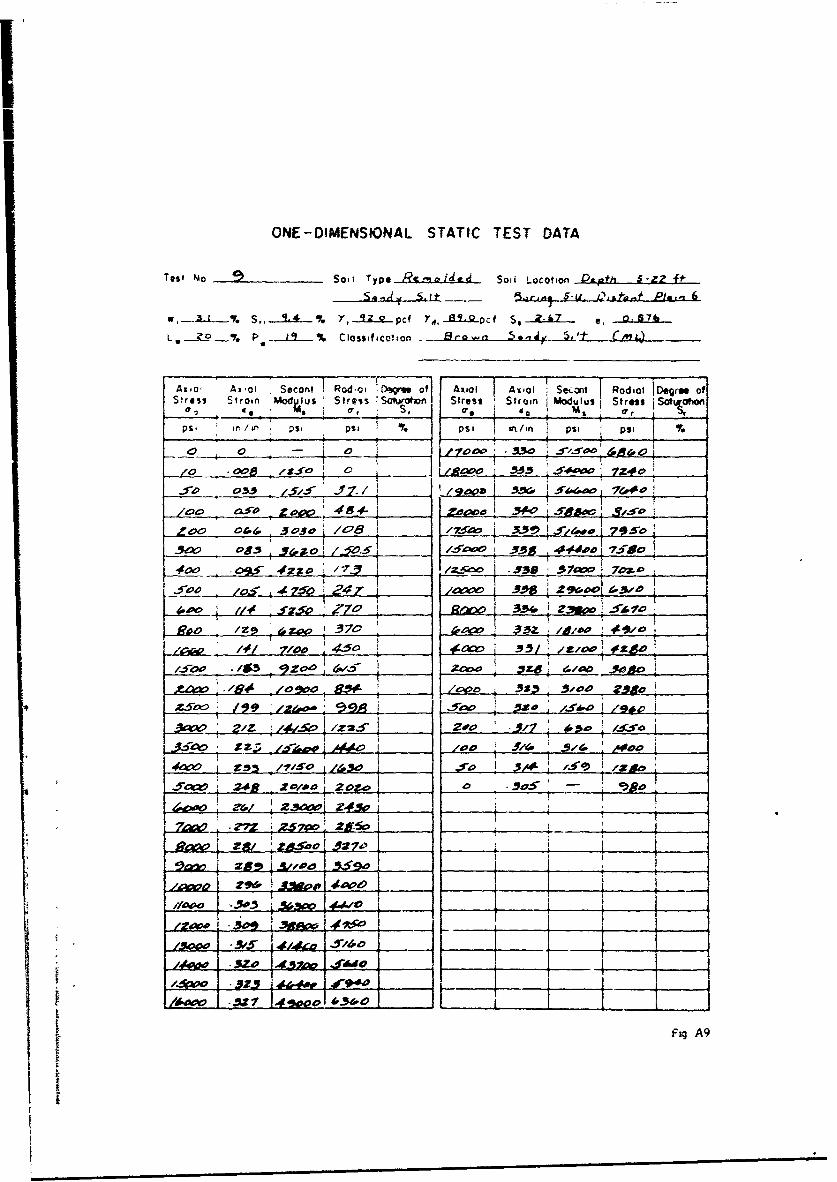
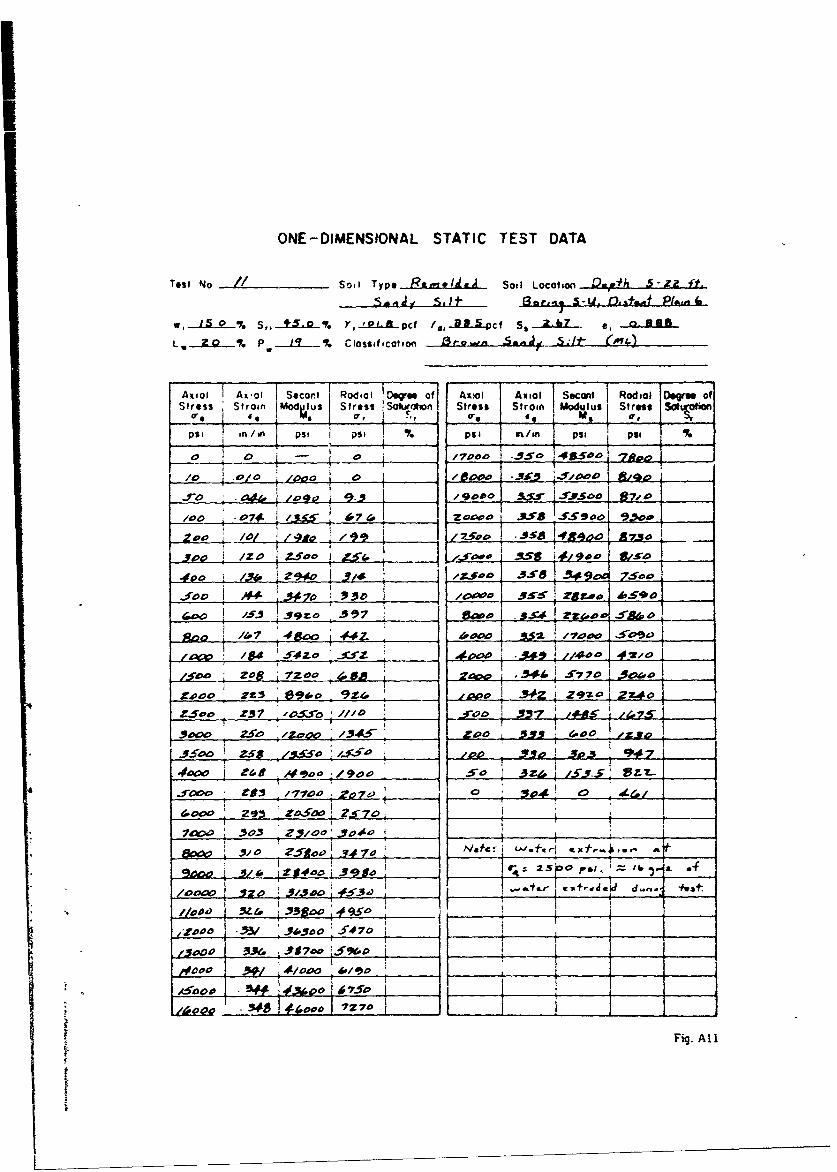
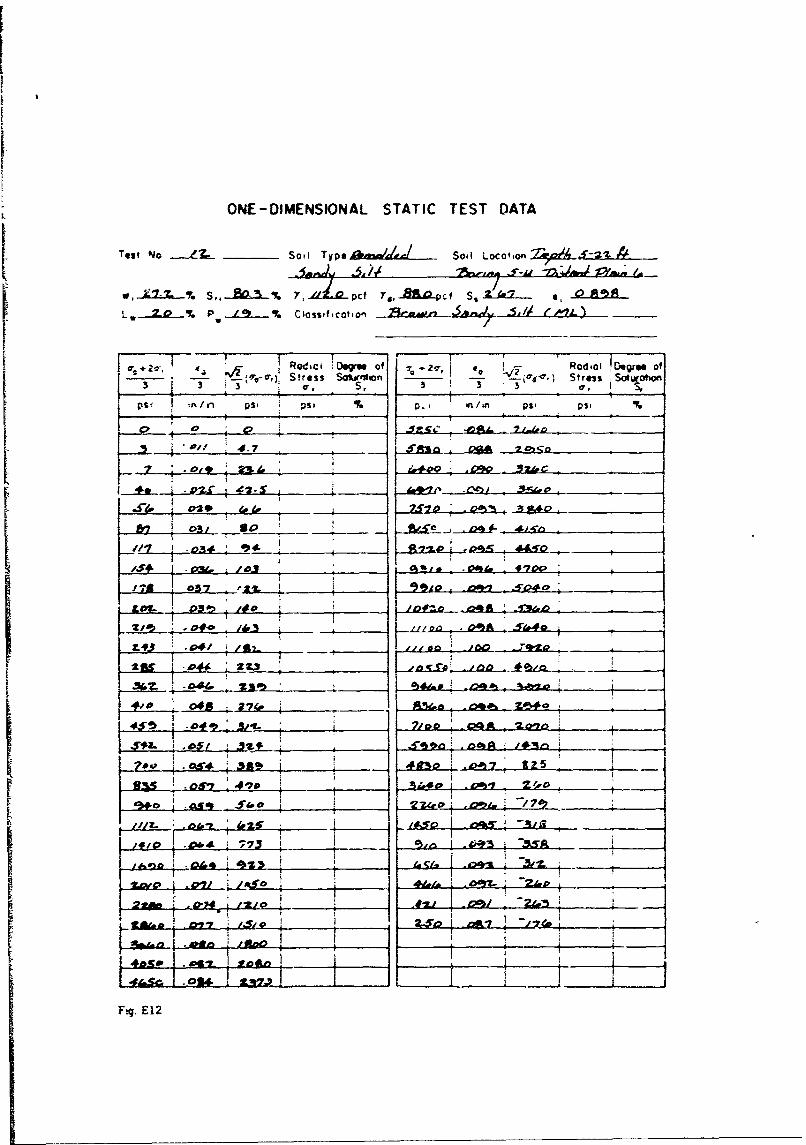
20. The individual testresults are tabulated in figs. A1-A12. The soil index properties are presentedas well as the individual test data such as axial stress, axial strain, secant modulus, and corrected radialstress. An attempt to correct the measured radial stresses has been made by dividing the load determinedfrom a hydraulic calibration on the full height of the ring (1 in.) by the actual height of the specimen.
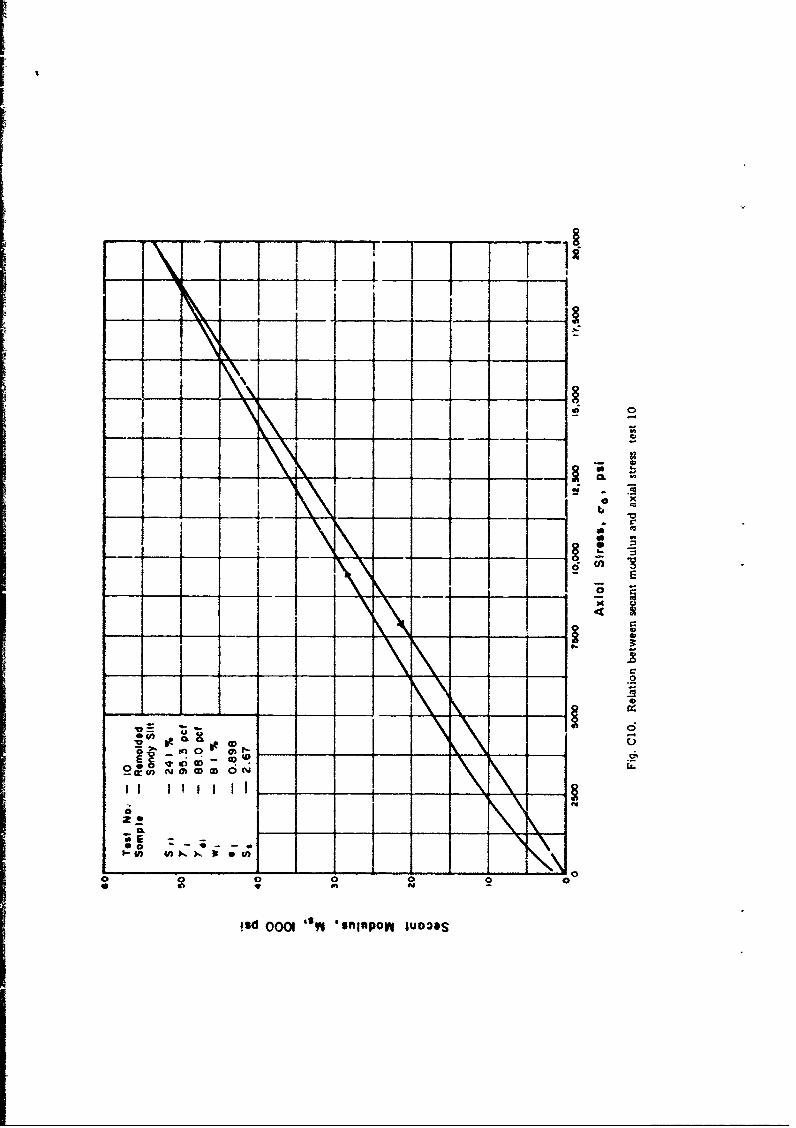
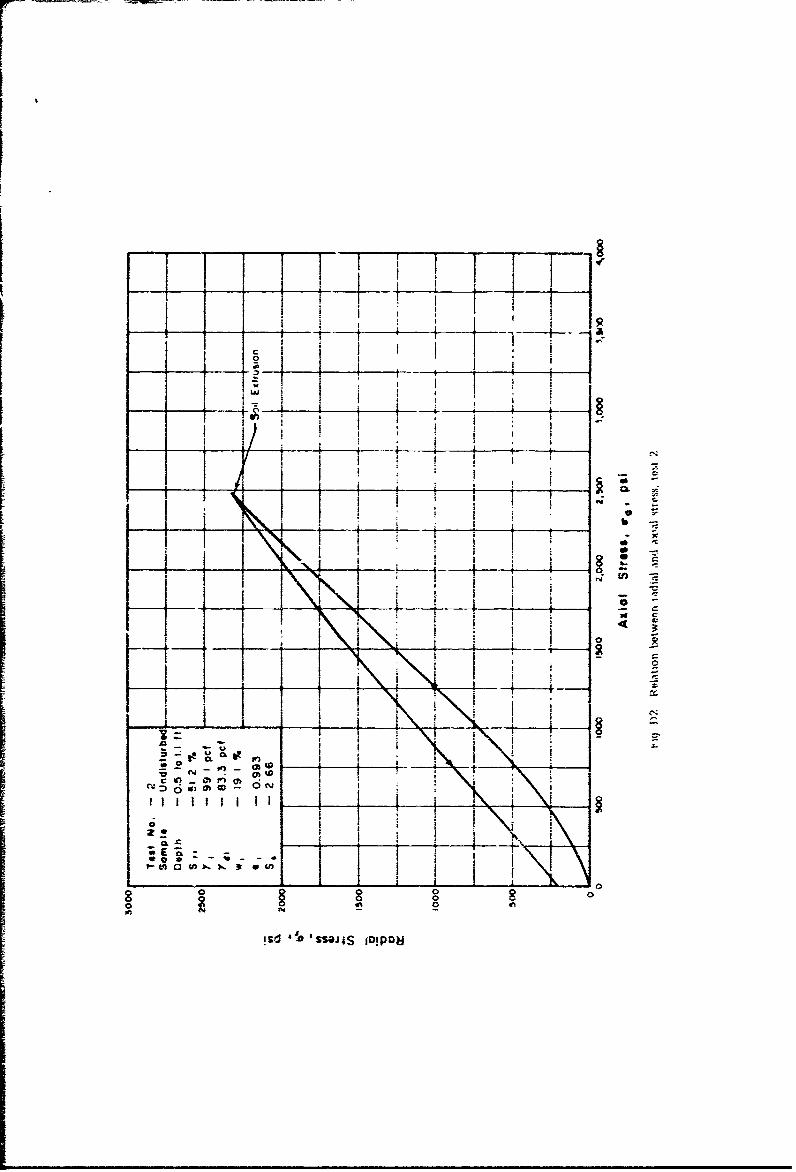
21. These results have also been plotted in the form of axial stress versus corrected axial strain, con-strained modulus versus axial stress, and corrected radial stress versus axial stress. The data points have notbeen shown on the plots because none of the points deviate from the curves. The axial stress versus axialstrain plots for the 12 static tests are given in figs. B1-B12. Similarly, the constrained secant modulus ver-sus axial stress plots are given in figs. C1-C12 and the radial stress versus axial stress plots in figs. D1-D12.The boxes in the upper left corner of the figures contain initial weight.volume data for the samples.
22. A summary of the static test data is presented in table 3. For each test the initial degree of sat-uration is given. At the maximum axial stress the corresponding values of axial strain and the ratio ofradial stress to axial stress (denoted as Ko) are given. A pseudo-Poisson's ratio (p) has been calculated as-suming that elastic theory is applicable. The residual axial strain and the ratio of residual to maximumaxial strain are also presented. A notation is made in table 3 wherever soil extrusion occurred. Otherwise,the static test results ca-, be interpreted in a straightforward manner.
STRESS-STRAIN RELATIONS
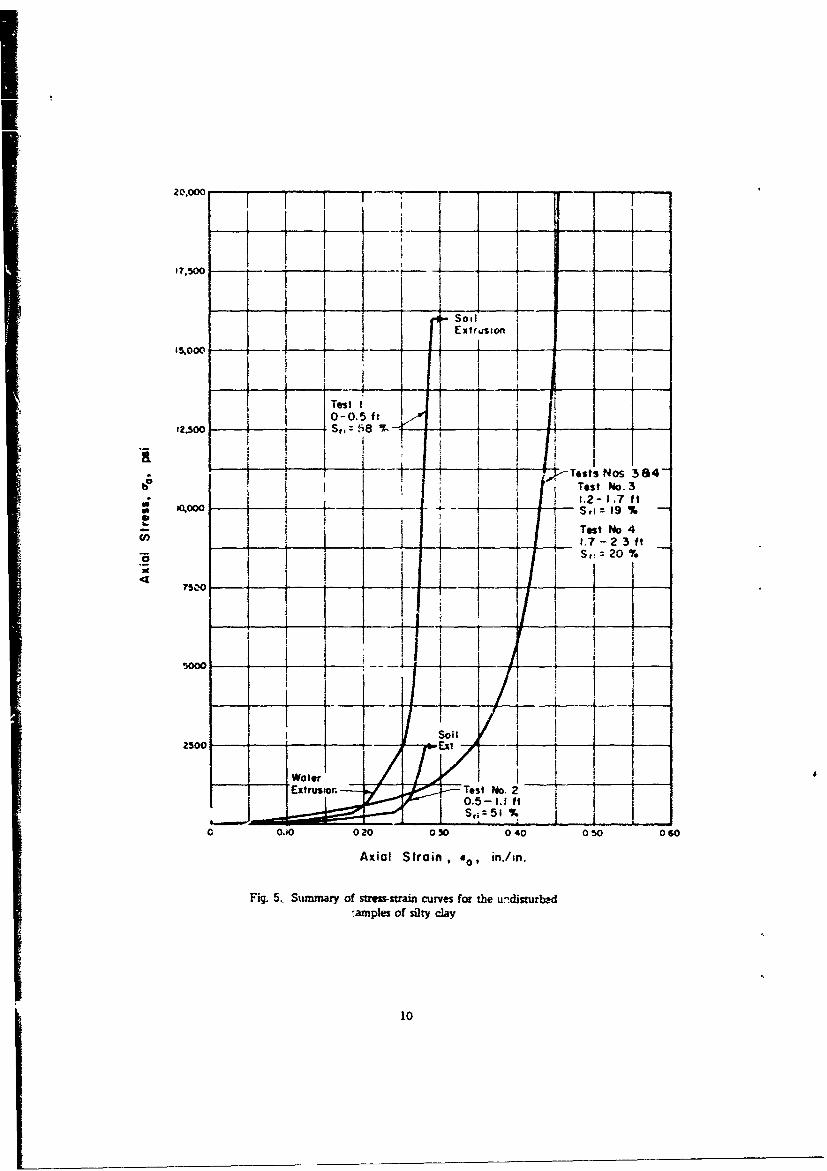
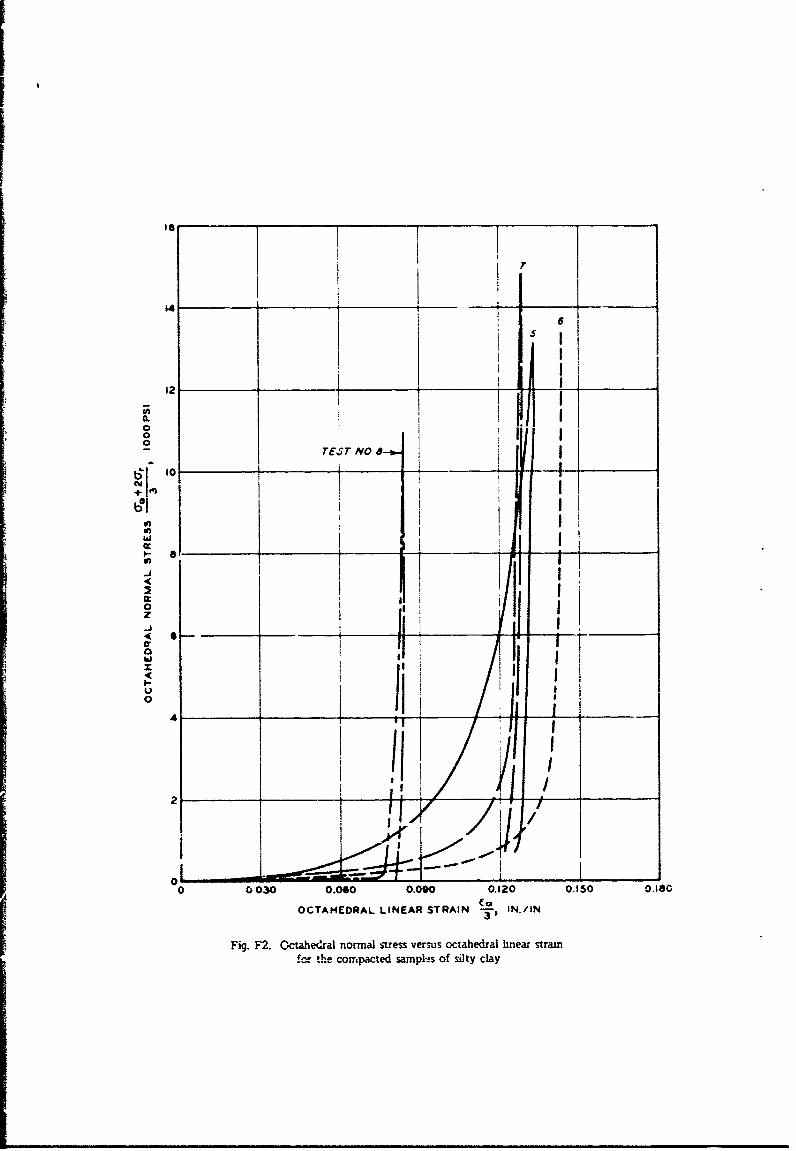
23. A summary of the axial stress-atrain relations for the undisturbed samples of silty clay, com-pacted samples of silty clay, and compacted samples of sandy silt are shown in figs. 5, 6, and 7, respec-tively. The axial stress-strain curves for all static tests were concave toward the stress axis throughoutthe complete loading cycle; therefore, the compressibility decreases as the stress level is increased. Theabsence of the small initial concave downward curvature in the stress-strain diagram of the compactedsamples is believed to be caused by the negligible preload effect because of the low compaction energynecessary to yield the desired dry densities of 80-88 pcf. The unloading p'.ortions of the stress-straincurves, which are shown on the individual test plots in Appendix B, are very steep at high stress ranges,but the slope decreases at a stress of approximately 500 psi. T- . ?) is a list of the maximum axialstrains and ratio of the residual strain to maximum straii foi all tests. The maximum strain at the peakstress of 20,000 psi varied from 0.299 to 0.457 in./in. The ratio of residual to maximum strain variedfrom 0.85 to 0.96 for all test specimens.
24. The stress-strain relations of the compacted or remolded samples of silty clay given in fig. 6show the effect of the initial degree of saturation for a dry density similar to field conditions. As theinitial degree or saturation increases, the strain at which th-_ stress-strain curve turns abruptly upward isreduced because of the amount of pore air decrease. However, the stress-strain curves shift downwardtoward the strain axis at low stress levels for samples with increasing degrees of saturation. Thus atlow stress levels the samples with a high degree of sa•ration are more compressible than those with alow degree of saturation. However, the wetter specimens reach 100% saturation at lower strains andbecome stiffer than the dryer specimens at lower strains, resulting in a crossover of the stress-strain curves:a. illustrated by tests 7 and 8 in fig. 6. Also, variation of the dry density at a particular initial degreeof saturation indicates a more compressible soil structure at a lower dry density as sho'on by tests 6 and7, fig. 6. The behavior of the compacted specimens of sandy silt is similar to that of the silty clay;
9
ii I Soil
Ex trfusion
T2st0 Tes I4Kftt - T .i o 8_ Test No.
b° - 'I I ,.2- 1.7 f2
-. - 2_ 3 -"_-- __ _ I S,,_20 % -
I I _ _I_
,-4 -- __-' __ _
soil I.o,00 Ex t'Extrusonet No. _
wo ~ 0 ,5-' -. i ftSS,i = 51 %
o 0o0 00 oo o 40 050 060
Axial Strain, #0, in./in.
Fig. 5.. Summary of stress-sain curves for the undisturbtdamples of silty clay
10

I
5.0 0 - 2- ---------- -
I
Two No. 5;2,500 •S,:;, 13% -%
Yd q5.6 pcf
Test No 8
SY7 - 85 4pcf
o Test No.?,< . 'S,, = 27 %,<I 7500 ,, L ,__ = 85.2 pcf
'Ts it.
5 0 0 0 T . .. . • EI _ . _ _ ~ 7 9 .2 p ;f
I i
2530 , ! •. _
00 o.o 020 0o3 0 * 050 060
Axial Strain, to, in./in
Fig. 6. Summary of suvss-srain curvft for the cs.apactedsamples of vlty clay

2 0, c-:!I -i i •o
I ,
IT
Test No 12'• •~3,, = 80 % -
Yd : 88 Opc I
Test No it __'5.000 +-----i--"----.--- --.--- -- _ - .. Tsf ,4%0S,, = 4b %
Yd = 88.5pcf
Test No 10
SSr, : 24 %
Y,_: 880pcf" Test No9b°. S,, 9 %
=a 'Y 89 0pcf`10.000 - ________
Strain at Pres.jeSaturion for-_
7500 Test No. II - ----
50000Strain at Pressure
,Soturation forT est, Fi"2 ,- s__ur-e
' I I
00 0.10 0 20 030 040 050 c 60
AxiaI Strain , or, n./n
Fig. 7. Summary of stress-strain curves for the compactedsamples cf sandy sit
12

Ihowever, extrusion of the specimens with a high irutial degree of situration (tests 11 and 12) distorts the
true confined stress-strain curves (fig. 7). The calculations of strain at pressure saturation indicate a modi-
fication of tl'. stress-strain curves for tests II and 12. The strain at saturation can be readily calculated as
1e ( - 1 •) e 1I + e + + ei
where e, is the initial void ratio, Sri is the initial degree of saturation, and c is the axial strain at satu-
ration of the specimen25. The stress-strain curves for the remolded samples approximate the shape of the curves for the
undisturbed samples as shown n fig. 5, but the behavior is different Tests 3 and 4 were plotted as one
curve brcause the differerce between them was not dis.ingulsn3ble In general the behavior of the undis-
turbed samples is similar to that of the compacted samples ot silty clay except that the undisturbed samples
are less compressible in the low stress ranges (less than 2500 psi).
26. The shape of the stress-strain curves (concave upward) for the undisturbed samples at the
shallow depths is indicative of uncemented soils. This behavior is contrary to the behavior at greater depths
as reported previously. 4 The data in reference 4 indicate an initial concave downward stress-strain diagram
and then a change in curvature as the stress level increases. With an increase in stress, the stress st.ain dia-
gram is concave upward as the initial stiffness due to preload is destroyed.
27 A typical variation of degree of saturation with depth for the Watching Hill site is presented in
fig (3 as determined from undisturbed specimens reported in references 4 and 5 These data are given forthe pu-pose ol enabling one to select the popropriate stress-strain curve from this report that is consistent
with th. degree of saturation at the particultr depth for which the high-pressure moduli are desired.
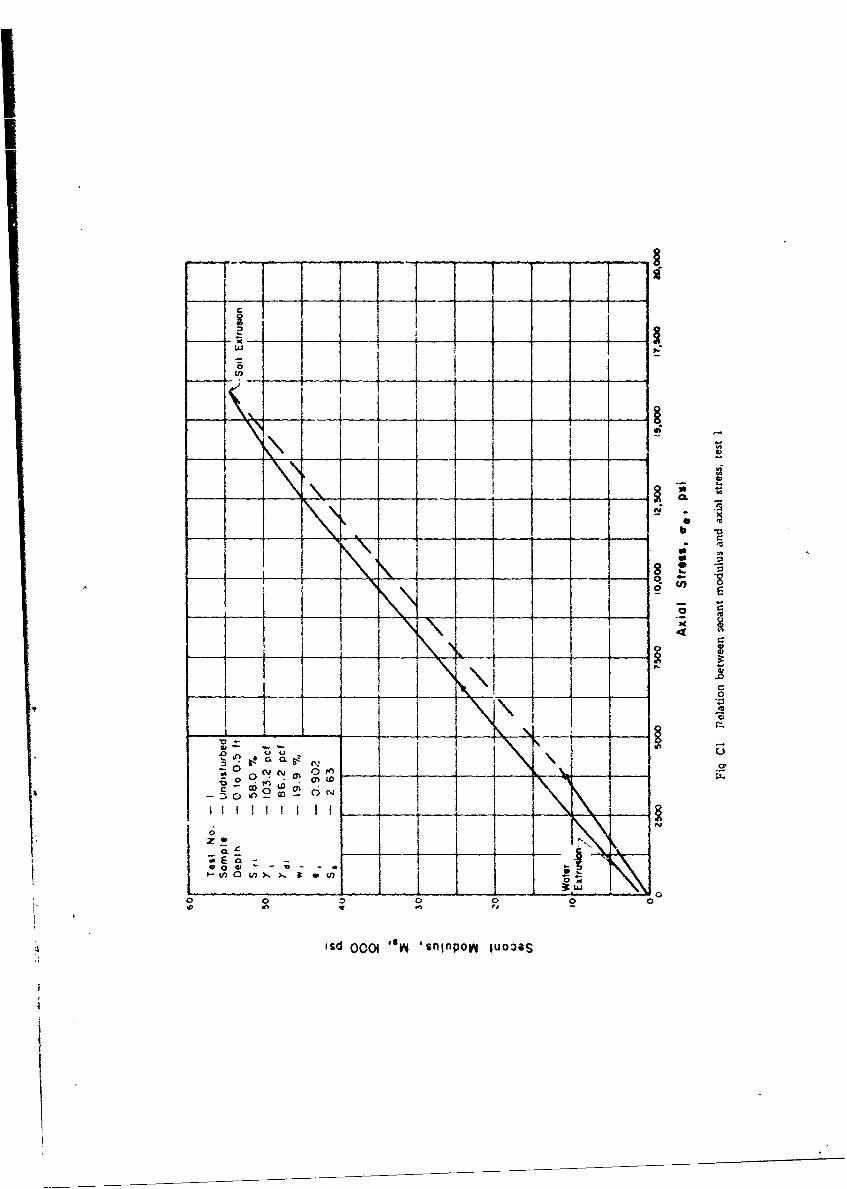
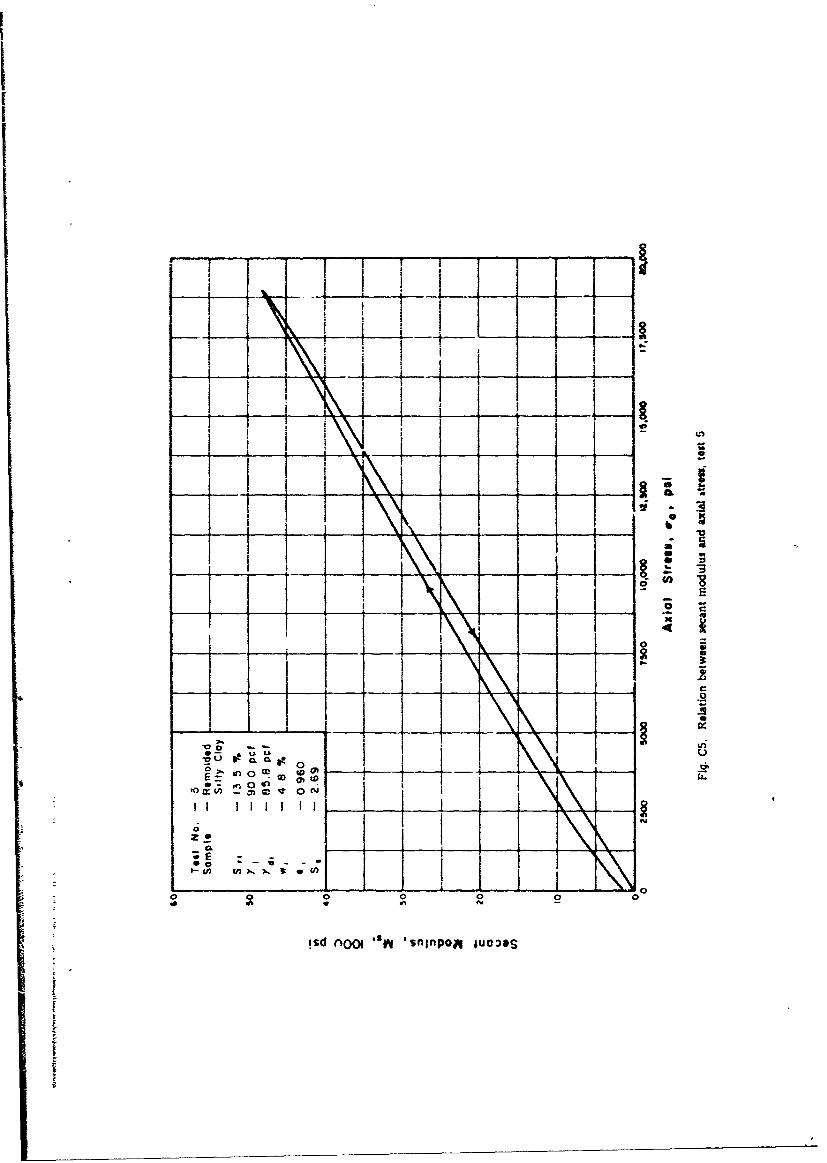
SECANT MODULI-STRESS RELATIONS
28 Many of the ground motion problems in protective constriction can be app:oximated by assim-ing that the displacements occur in the direction of the stress-wave propagation. Under these imposedstrain co-iditions, the constrained modulus is the significant property of the soil controlling the ground
motions. A constrained secant modulus of deformation M. is by definition the ratio of the axial stress
to the axial strain under conditions of zero radial strain.29. All the graphs of the secant modulus versus axial stress are shown in figs CI-C12. The shapes
of the modulus-stress curves follow directly from the changes cf the stress-strain curves jvst examined.and thus require little additional discussii'n The secant rnoduh vary linearly with axial stress for both theloadinq and unlokading curve The secant modul are dependent on the mizal degree of saturation, initialvoid ratio and the =A-::i ztress level The !lwer bound secant modulus of deformation for stress leveis
above 3000 psi can be approximated by
aN1.e0
Se ~ SCOOOO0 psi
13

S ri , 7
Ground 0 0 40 60 80 100
Surface Wi
0 1
0;005 0
0100
00
A IA
0 0
,- 0
00o 0•
00
Key:.' Dovisson 8 Maynard
Report, Ref. 4
30 S, "Shonnon a Wilson
Report, Ref. 5
a S,; This Report
Fig. 8. Soil profile data from referenced reports
14
I

for the sods tested in this study. The average unldcdmg secant modulus from the residual strain intercept is
given by
SMu = 1wM
AXIAL STRESS-RADIAL STRESS RELATIONS
30. At any given stress level, the ratio U. radial stress to axial stress is dencted as Ko ., In thisseries of one-dimensional static tests full drainage could rot occur., therefore, the ratio of radial strew toaxial stress determined for these tests is essentially in terms of total stresses.
31 In general, the value of Ko is closely related to the degree of saturation. As the derree ofsaturation increases, the value of Ko increases and approaches a value of unity for saturated soils- Be-cause the degree of saturation depends on the axiai strain, the value of Ko can vary continuouslythroughout the test. The values of Ko presented in table 3 vary from 0.38 to 1.00, and a pseudo-Poisson's ratio varied from 0.28 to 0.50.
3?. In situ, K0 may be considered as unity for soils below the water iable. For soils above thewater table having high degrees of saturation, by capillarity or clýerwise, the value of K3 '-ýi' bnearly unity. Where the water table fluctuates, as it does at the DriES, the values cf Ko (and secantmodulus) will depend an the applied stress and the deqree of saturation existing -t the time a field test
is performed.
33. During the unloading cycle, the radial stresses ame reduced at a slower rate than the dx•a•--this causes a concave downward curve that lies above the loading curve. Therefore, values of Ko .oftenexceed unity during unloading.
FORMULATION OF THREE-DIMENSIONAL STRESS-STRAIN RELATIONS
34. The test data given in Appendix A have been us, d .. '-ompute: (a) octahedral shearing stress,(b) octahedral normal stress and (c) octahedral linear strain;, tabulated data for each test are pr sented in
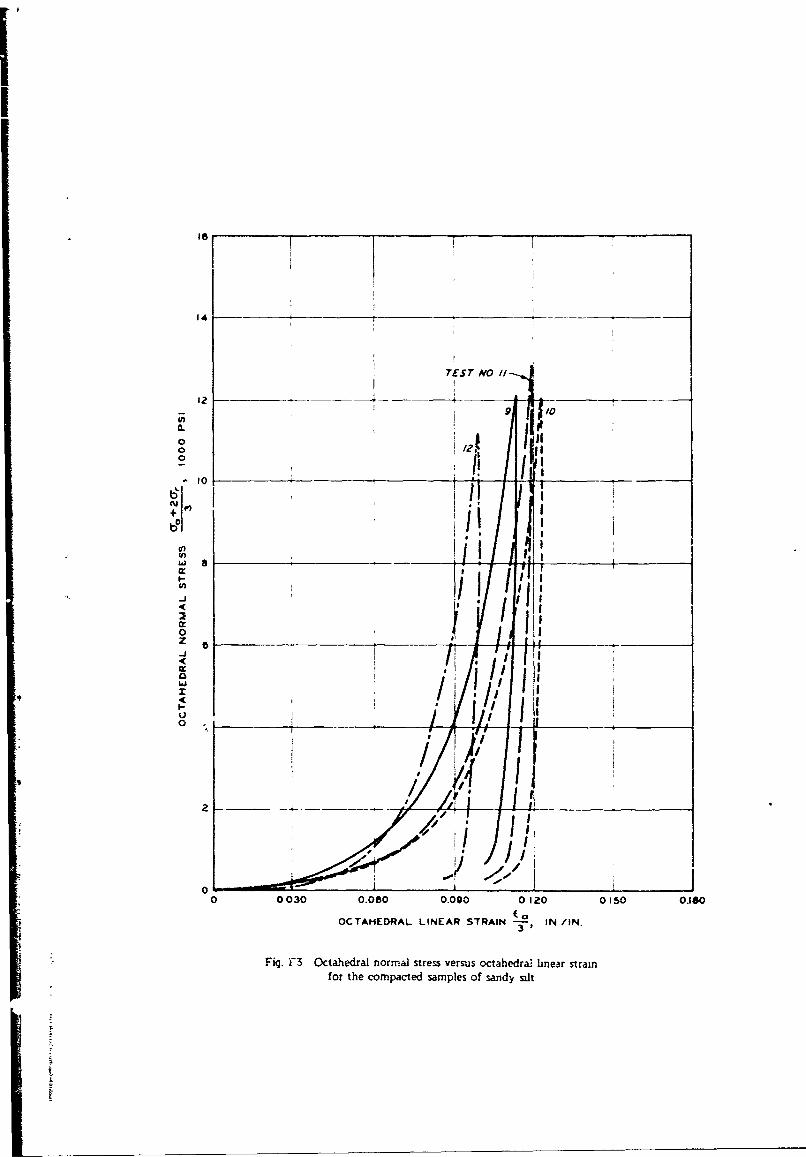
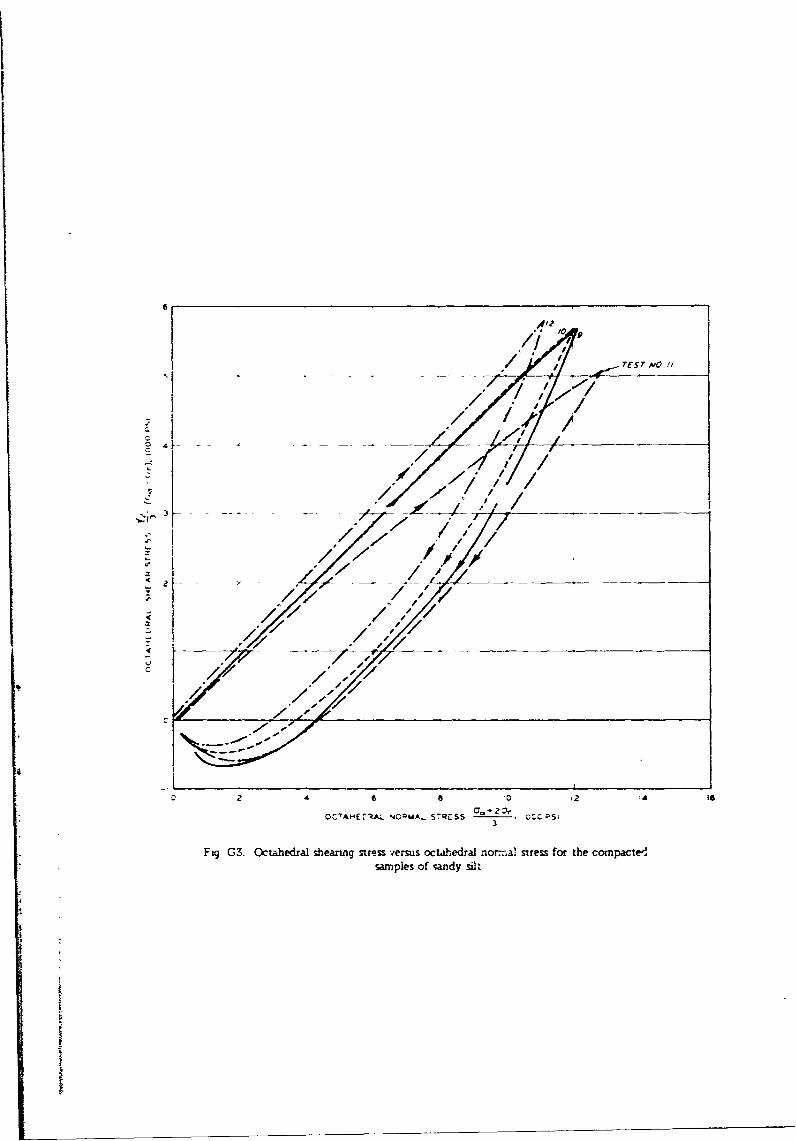
Appendix E. From these data, graphs have been prepared of octaned,-al normal stress versus octahedrallinear strain; the graphs are presented in Appendix F. The relations between octahedral shearing stress and
octahedral normal stress are given in Appendix G in the forma of graphs.35. A detailed discussion of the data in Appendixes F and G is beyond the scope c' this report:
only general comments will be made. Such data are useful in tha formulatior of generalized stress-stainrelations for soils. For instance, the graphs shown in Appendix F show the average principal strain oroctahedral linear stain which results from the average principal stress or octah,-dral norma] stress. Theslope of these curves is equal to three times that of the bulk modulus of the specimen. Note that in allinstances the curves in Appendix F become very steep at some value of the strain. This value of strainis essentially that required for the soil to become fully saturated, The numerical value of the strain at thispoint is dependent upon the initial degree of saturation and the initial void ratio. At higher strains thebulk modulus is etqual to or greater than that of water.
36. The data presented graphically in Appendix G are useful in establishing yield criteria to be usedin multidimensional computer programs. Note the curmes for tests 9, 10, 11. and 12 which show a nearlylinear relation between octahedral shearing stress and octahedral normal stress during loading. This is notsurprising since these samples wer• silty sand, and the shearing resstance of sand increases linearly with
15

InoLmal pressure Note that th. specirnens of relatively dry silt, clay, ttests 3, 4. and 5. showed tie itme be
havyor because the sitial dcgree of saturation wis low and the sTcimens probibly never became sat-. Ated
Thus the shear strength increased with pressure hroughout the enare test Note the results of test 2 6 7
and 8, however,, where the octahedral shearing stress approaches a constant .,s the octahedral normal stress
increases. In each case the specimen has become saturated and is behaving as if ., 0 beyond the n-essure
at which the curve turns forizontal In each of these cases the soil is a nlty clav w-'.h a relatively high ni
tial degree of saturation
16

PART V CONCLTiSIONS
37 The follcwn.g conclusions were drawn frog tLe in 'estigatlon
a The degree of saturation and the initia void :atio are the most signilicant vana1'Ies govern-
ing the one-dimensional stress-strain relations of sod at high pressures
1) For pressures exceeding 3000 psi the compac'ed .im*nens and undisturbed sp,,ecimens of
Suffield soil yield the same :elaticn L. the intial degree of saturation and initial vo~d ratio
are identical before loading
A lower bound to the secant r.iodulus of deformation M. at a given level of axial stress
Sis given by
Ga
M S a
I - e 300.00 psi
for both compacted and undisturbed samples of fine-grained soil subjected to pressures
greater than 3000 psi.
i The average unloading modulus of Suffield soils subjected to pressures greater than 3000
psi is approximately 10 tunes the load&,ýr' secant modulus of deformation Ms.
C It is probable that the stiffness of the Suffield so;ls when unsaturated will be greater under
dynamic loading than the st.,tic values given in this report Previous comparisons of static
and dyna-ni3c values of const-ained moduh of Suffield soils (reference 4) have shown that
the dynamic values are twice the static values. This observation is consistent with similar
compansons for NTS Frenchman Flat silt (reference 7)
17
LITERATURE CITED
1. "Operation Snowball," Technical and Administrative Information for Operation Snowball, UnitedStates Participation with Canada and Great Britain in a Nuclear Weapons Effects 500-ton HighExpkl•sive Experimental Program.
2. Jones, G. H. S., "Strong Motion Seismic Effects of the Suffield Explooons," Suffield Report No208, 1963, Suffield Experimental Station, Ralston, Alberta, Carada.
3. Hvorslev, M. J., "Subsurfac. Exploration and Sampling of Sods for Cil Engineering Purposes,'Nov 1948, Research Projem. of the Committee on Sampling and Testing, Soil Mechanics andFoundations Division, Anm.rican Society of Civil Engineers, published by U. S. Army EngineerWaterway. axperiment Station, CE, V'lksburg, Mis
4k Davisson, M. T. and Maynard, T. R., "Static a&-d Dynamic Comrpressibilty of Suffield Experimenta!Station Soils," TechnicAl Report No. WL-TR 64-118, April 1965, Air Force Weapons Laboratory,Kirtland Air Force Base, N. Mex.
5. Shannon and Wilson, Inc., "Soil Vibration Tests, Suffu'ld E,,perimental Station. Canada," Contra.tReport No. 1-125, July 1964, U.. S P Lmiq.--nFer Waterwsy. Experiment Station, CE, Vicksburg,Misl
6. Hendron, A- J., Jr., "Correltimca of Opecation Snoviball Cro..und Motions with Dynamic Propertiesof Test Site Soils," Miscella.seous ?aper No. 1-745, Oct 1* 5, U. S. Army Engineer WaterwaysExperiment Station, CE, V cksbng. Mi-s
7. Hendron, A J., Jr., and Dav.,.-s M.. T., "Static and YDynamic Rehavior of a Playa S1t in One-Dimensional Compression," Ilechnical Documentary Report No. RTD TDR-63-3078. Sept 1964.Air Force Weapons Laboratory, Kirtland Air F--r.e Base, N, Mex.
I18

ITable I.
Descnrpon and Clamficaton of Soil Samples
Test Sample from Depth Un-ifd w L PL GNo. Distant Plain 6- ft Pý~to Classification -% %_ %_ _
I Undisturbed sample 1, 0-0.5 Brown silty clay, with CL 19.9 37 19 2.63boring 2-U sand, trace of
organic matter2 Undisturbed sample !, 0.5-1.1 Brown silty clay with CL 19.1 38 18 2.66
boring 2-U trace of sand
3 Undisturbed sample 2. 1.2-1.7 Brown silty clay CL 8.3 42 21 2.69boring 2-U
4 Undisturbed sample 2, 1.7-2.3 Brown r.hIy clay CL 9.0 44 23 2.69boring 2-U
61) Remolded sample, 0-5 Brown silty clay CL - 34 16 2.697j bc .. g 5-U
9)
10 Remolded sample. 5-22 Brown sandy silt ML - 20 19 2.671U boring 5-U
12
f
-t.-~ --- ~ ----.-- ________________ ______ ________ _____

ITable 2
Init'al Specimen Data
Dry Water Degree of Void SpecificTest Type of Density Content Saturation Ratio GravltýNo. __ eh.pcf Sn' % e.
I Undisturbed, 86.2 19.9 58 0 0.902 2 630-0.5 ft
2 Undisturbed. 83.3 191 51 2 0993 2660.5-1.1 ft
3 Undisturbed, 77.5 83 191 1 170 2691.2-1.7 ft
4 Undisturbed, 76.2 9.0 20 1 1.200 2 69
1.7-2.3 ft
5 85.8 4.8 135 0.960 269
6 Remolded 79.2 9.7 25 3 1 120 269salty clay.7 0-5 ft 85.2 9.8 271 0972 2.69
8 85.4 19.6 54.3 0.970 269
9 89.0 3.1 9.4 0876 2.67
10 R~raolded 88.0 8.1 24.1 0.898 767sandy silt,
1f 5-22 ft 88.5 15.0 45.0 0.888 2.67
12 88.0 27.2 803 0.898 2.67

0 !: 09 6 0 6 6
cc *1* N 0 qT N
:3 v 0 10
00c
0 It C O00; 6 o 6 0 c; 6 0D
0. e 1 7r 0 LA o) 0' 0
aN 4n co c
mc 0 c-i 0 6 o o 6
CC
-IT en-
j C C) C
ztCIT
Loi

I
APPEND!X A:. TABULATED TEST DATA

ONE-DIMENSION*4L STATIC TEST DATA
Test No _ Soil Type LW Soil LoCation Opoth O -..2 ftl
S. 1 . C i anw 2.-..W- D-. ,..tf Pp... 6
w, • r I, q-o Y i 21ZPC f 7d, -§2pc f SO • ze,-019
L 37 p.L 1P .. % Classification sco...n S. It.Se, ..4 i 20'4,1A it~
*1 or k.,._ ag*fte,_ CCL)
A oz '' o, Secant Radial Deoe of i AxiOa Axial Secant
StreStress Modulus iStress SatPSI inin psi PSI % psi St/in M lpsi ! psi ! %
051 01000 0.352 29 110 0.o00 110 - ' S OO 0.351 4-20ogoo o~•i 1300 'zoo 03l55 S70
o00 0f14 Zo40o 0 o.34,o 0I 1.----
6.00 205 43__ o(s--) o0293 L 0
S00 0 211 *6Z0 *t8 0
0 ,lo. W ' t .. . .. .Iso 0 22 kSS ZML
mo e
J°}t l' .4
2500 C0 2Z4 o50 *.,,
ioo o z' o ,t,,o• t t -2500 0_5 z 'lO _____ Abet._!161 _____-.far, _
.000 0 Z ,7 1,700 ' .
-Soo 0 Zb6, 13490 _ _ _ _ _ .
4-000 0 Z&3 '5200
5000 0216& 196o00 _ __ _ _ _ _ _
booo ()Lzb~ zzzoo
6000 0271 291Z00__ _ _ _ _ _ _ _ _ _ _ _ _ _ -T000 0 2TI ZoO ,o
80ooo 0o 2?4" 0 Ii _ _ _ _ _ __ _ _ _ _ _
qooo 0 Z75 3V80o0
aooo0 0 Z77 342&0
i1000 027? 31500
pZ000 0o z 42600
,3000 0284 '-( SOO t
15000 0 z89 52000
(6oo0 0. 212 54 o00 ______ _
-I---r000 ; 035+ I
SZoo 03•5 3 60[ _
Fig. AI

ONE-DiMENS")NAL STATIC TEST DATA
Test No -s l - Cii Type-112111-.1" 41 Soil Locot;on D-lth o.5 - I l ft.
- S; It*J, C. ..... Z-. :D,-•f.t" P.&LA _wi.-.L % St, 91. I••=L pcf Y¢ • c 03.e,3.q
L 3PB % P .1.J % Classificotion Br5,n .• fi Clay, w/i tr.a J
S.... ...... ... . .
AxiOl AxialI Secant Radial (D of Axia A l Secan t Rd l egRee diaS t r e sss • , s. n S t r e s s S t r a ,n M o d u l u s S t e gsso rS e ,e o iS s Strain * s Mod Stress M, a, 5,1
PsI in/in psi psi % Ps; I r/n i psi psi °0 1 - 0
to 000 1_ _s 0_ _ _ _0 0 I 8J S-
l00 0 IZO 84 ,50 __
S" 167 ZOOSoo 0o. Zo0 oo q8 000 .Z i "3SS 5)0 -__ _, __
-- l 1 - ' ' ;
400 o.z 5o Z350 35 6
Soo o ZVI 0 $1 C, 51
1o0o o z,,z 31820 710 i
/Soo0 0t O b9t ssipc j"2O0" 0.ZSO2Z 7830
200 i 318
7*0 33" o 154
gooo 04-97 1640~ 90
40 o..491b ezo 5610l
zoo o0+*S +,o 3 74t jr
t~oo OLb9 __S. c Zola I _ _ _ _-_ __ _ _ _ __ _ _
5° 0.4,. - 0 4 , Z° o47 8 0 Z- - -J -
Fg A

IIONE-DIMENSIONAL STATIC TEST DATA
Test No 3 Soil Type i/&Jiucealuds• Soil Location Da.nto 1.z- 7"ftS, t., Cly , 2U... - D,.t..-t P•,.:=6
w ,R3_..7. S,,J % 7 5 .S-.pcf Y.,7 1 -. pcf S,2-k&t j. * 7!2Lw.--4Z-% P= T. 211 CIodssiflcotion Bro , SJ1171 , g Cit CQ'
Axial Axial Secant Radial Do" oaf Axial Axiol Secant R a•aol ID* ofStress I Strain Mod~l us I Stress Soalrotion Stress Strain Modulus Stress ISatluralirs , ,°/$ rps no in PS,, °I psi %°°° psi in/n-pi opt0 o i /o7000 0+50 370oo 9 cwAo_
0o04ooB,1 ,zooo , o-71÷ ;oo] ,0100.°
___ 3#Z I q ZIO 0.45 420+oo 0 9001U
t00 0 03o,6 2B 88 I X0600 O5,4. 4400* 11000
zoo 0.090 zZZo 128 a7.500 O•+5+ 38100 107.oo
300 o iS'ooo' 0.4-4 33,000 1to0-0 + oo ' o , 2 =ooI 1,,I,,°!o+ ,o ,~_40 0 i_47 2 ______ 00 214 .43Z 27700 3070Soo o,.1q .. 510= 357o 05/I .Z0oo 7,150
600 oz,13 Zzo 388 9_" 8000 o4441 177oo 6Z5o_____ :c.-, :.o::: 557 ____oo00 o.45J Z,0.o 7130
800 o Z43i 3Z1 +41 4000 0.44? 134,0 3s0o
t000 0 Z4 i 3770 53 4"00 o.444 qonc 4Z-1O
___0_ 03. 4.170 1 "5 2000 0.441 454.0 ,l, b0Z000 012/7 W120 114 ic00 0.4)16 ZZ10 ZZ10
Z500 0. 3. •I0 +50 •oJSoo o.4-3 1I11. &0.103000 C 351t 83bO 1# t40 200 o.4Zd1 4.-41 1312
3 _,".0I _.'3&q q1490 1840 to_,o 0.4+Z1 Z33 1270
'eo,0 0 37o 1 0o520o 5s o.4Ze )/& ,160
5 o.0 0. 3,3 12700 Z-30 o o+z_ _ 1_,o_
#Po 0 +0 14,9001 3020{
7000 0.412 17_001 "3'_o_ _ _8oooi oa, 4 ,;,°°oo 4-,o00 - ____ __i ____'
8000 04)4 119,z1o 4b,00"1000o 0 +24 21 zsoo 4~
1 0"o0301 Z3200 -
J 1000{ 0435 z10 40s ,oooi 0431 1 2-1+ol 16+10830001 0 f*Z 274.001 biso ___ _____
is4oco 0445 )O 710C1j,00 ______ ______
1.0001 0.44,7 M"4o00 ..0O
R 5000 0.4+1 Y7 0 33 1 06.0~ ___
_ _ _Fig 1,3
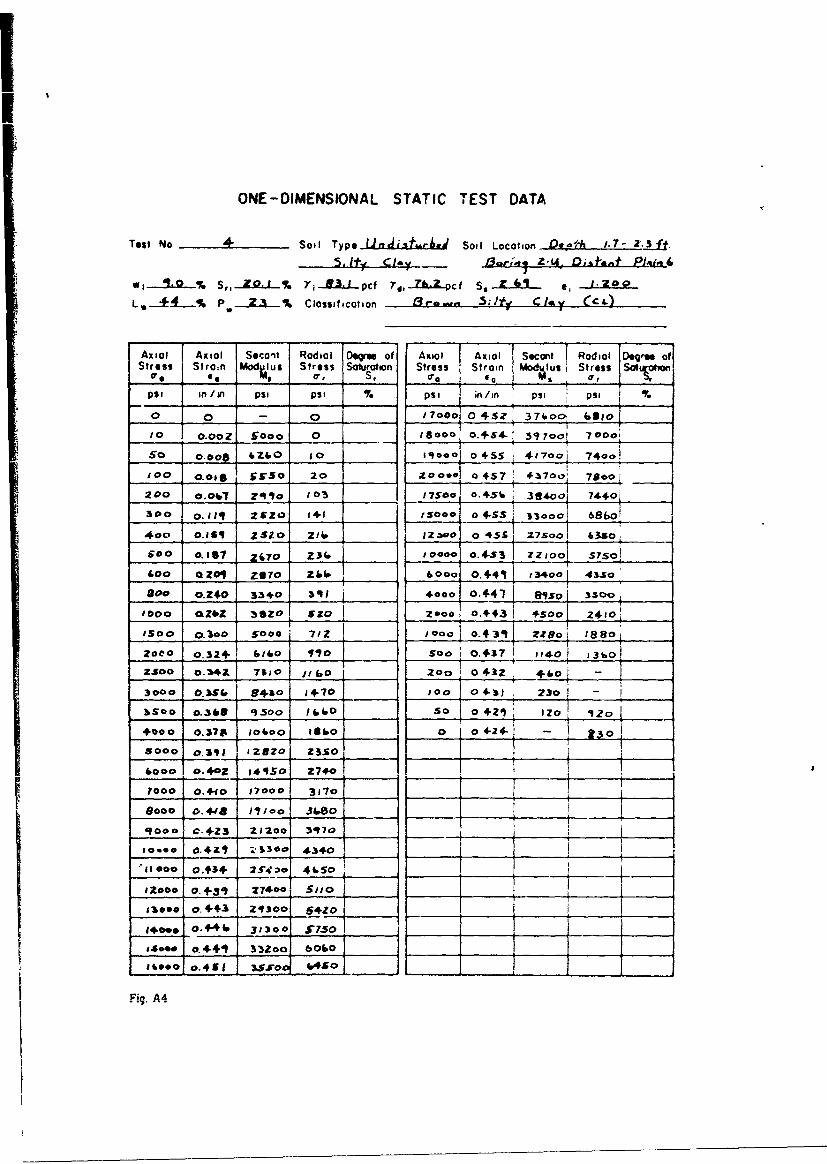
ONE-DIMENSIONAL STATIC TEST DATA
Test No 4- Soil Type .Uni.j;ja_ _Jed Soil Location O gte- 1..7-. 3f..
5. It Cle - Ior~jz-Qu O;~l.A.f PidjJ
w-. 0-% Sr, ZO.Q I% Y,- B8,-jpcf TSZ1cf S,.-L e, .o
L..-...% P, Z-3 % Clossificotion L3 ro. ,, S; Jt CV Cci)
Axial Axial Secant Radial 0" of Axial Axial S•cant Radial Degqw ofStress Stran Md usStress Saturation Stress Strain Modlu Stress Sol
psi in /in psi psi % psi in/./n I psi psi
0 0 0 0 1700,0 4Sz 3716. 1631__ir I10 0.0o2 5o00 0 18000! 0.54.14 31? ool 700o;so 0.008 6260 t0 1_1000 455 s 41700f 74oo0
/00 O.Oe •s'O 20 ZO0 .* 457 43700, 7880
200 o.o#- Z411o I03 17500 o.45b i 3840oil 7440i
300 0.1141 Z ZO £4-1 ISO0 0oS51 33000o 6&86o
4.00 0.61 Z520 Z1, ___ azao 0o45i Z7soo &35so
Sa0o O.117 2670 Z' 3ooo0000 0.4-53 ZZlool S750
400 aZoq Zgvo Z 1 _6, 6_ 0oo .4411 134o00 43.0o
800 0.240 334.0 3-1l 4ooo o.447 _9~so 35oo
'000 aZbZ s3zo szo ,• o.++3_ 1#Soo, 24101o
s500 o.3o0 SOo0o 72 1--- Joo 0.435] ZZo1 180 i8o1
20to 0.32+' 614o 410 SoO1 0.437 I , I i3 __+ '3 02.500 O.34Z1 7910o I 60 20oo 0 43Z
3000 0.350 94.30 14.70 100 04-.3J 20_3o _-_
&Soo 0.360 950oo Ib 4 50, o 40 Z+ IZo 9Zo -
*ooo o.378 1o6 z o 0.00 0+24- _ _ 0
8000 0.448 Il8ro 3s8 ______ __ ______ __
:; ~ooo. 4JoZ I14•O 274.o
• - -- 0.4-1 3,"/ "
8o00 o. +441 11100 •eo+
qO0o C.4-Z3 Z12oo 3q70 -
1o0o. o.4•Z9 Z3o 4340 JI"i o000 0.+3+ 2-C4 2o 411-50 _
*Zo00 o. +3") 27400 So 510
Is**o o.+43 .z,0soo0 O _5±0
14For O.+440 313o0 5740 _
is- O.4411 33Zoo 60160
I60.0 ;.451 _ _ __ _
Fin A4

ONE-OIMENStONAL STATIC TEST DATA
Test No -S---- Soti Typo...A.Lt*L-bl Sol I Location .tk aS
S.ItAi Cla (...l. ~~t Pi.
Ave; AslScnt Radial Do"e of Ax Il Axial secant Rodw9 Oeqrof
Stress bi. C.n Mod lus Stress ISo~qpt Stress Stran usStes
psi in/on' psi psi % psi V'1in. Pei psi
0 0 1 7006 0.3 1 43500 8070
,so .03-1 i300 10 190(0 3.397 48SOW 9090
10. o,6Z 140O 71 20000 0.399 50000 9906
200 097 2100 106 17500 0.339 43800 9350
300 .122 i2500 131 1' 000 0.338 -31700 8850
4c0 0.141 .280 212 12500 o.537 31500 8250
500 10.1453 3300 225 10000 0-5114 253o 7500
92000 o.3IS4 32o001 ~36540 0-510 Wo 45
1 000 0.205 4900 049520 ,8 0o55
2000 0.356 37860 tol150038 300 C
400 (iC 05
390 70
8~000 0,351 42200 38100
goo~~~i 0,5A5S 30

I
ONE-DIMENSiONAL STATIC TEST DATA
Test No....- 6 .. $oil Type Ra. lditd. " I LeastIm Do.1 .th a-3 ft.____ ,_____ ,,______ JL-:a.. D,#..#.. PI.J..h
41-Z % S', _ S.-I % Y,_. pet• jr,l.71 , c 72,X ,1
L,.M % P -. J..-% ClossificOtion A.. , m ;1 , C1-y ,c QM .)
Ax001 Axial Secat Radial 0tr" of Axial Asiol Secant blel ofStress 3,rai Moc us Stress Stress Vi -r.in u, Stress
psi in./in. psi 06;. psi__ kA PSI Pool30 0 - 0 180ooo 0.432 4i0o0 -
1o 0.002 1000 0 19Coo o.435 43700 -50 , ý3 oo Zl coo 200oo 0.437 451o -
100 0,147 7o0 56 175.0 o431 4000 -
2oo 0.219 900 i22 ___ _ _ 0.435 345c0 --300 0.255 1200 147 500 I2e 0.434 2810 -
"400 0.284 o4oo Z53 1_0000 d_433 23100 . -
500 a3.01 1700 272 500 0.432 4 1500 -
00 10.313 1900 290 _os* 0.431 14000800 0._33f 24_ 4_33 40D0 0.430 9300 - -
__D _._52 _2800 P _ 200o 0.430 4100
1_00 03U 4000 7A,0 1000 0.428 300 -
2000 0.390 I 51o1t •75 50o 0-426 12002S00 0.401 o200 J2-0 zo 0 0.425 500 -
3ooo 0.408 7-o0 1490 .00 0.424 2oo00 -
_q500 0.413• 8500 17f0 so 0.423 100
4000 o0.416 9,oO 2130 0 0.418 0 -
50oo 0.419 2o000 2800
40oo o.420 143,o0 3450 S -*rvm 3= ii7boo o.422 &40 AO _______" I___ --- aAI&oidAf8000 0L423 19000 55zo A=,il .•,r-,j 1 l*4 0 ps-i.
9000 0.423 21200 433010000 O.424 23,00 7300
11 000 0,425 25900 8250___ -- -
12000 o.42i 2$00 918oA0ooo 0.42.J 32700 1140I
15oooj o430 135000 /I2900___j
I00oI 0.430 37300 1__O011460 o.4Aw 3s500
Fig. A6

ONE-DIMENSIONAL STATIC TEST DATA
Test No L Soil Type ... SAZUL*.L Soil Location-Dank - .ft
L ,. % P-- "-t-% ClossitiCoton - ro.ia.i 5.i Clay (c.4.)
Asol Ax:oo Secant Radial Aerel oA io S om d Rsd
e S aiSi Stress Strainu trIF I
cr ll 0 W IrI
#so i in psi psi Pt itn/Ii. vel PI
,00 -2000 0
O 0.02 2100 5,6 10000 o.323 2 Ioo 'i$0,
100 o.097 1 fo 0 8000 0.381 29000 8750
200 0.15Z 1300 119 4000 0.350 10oSoO 63501
So00o.193 1500 152 2000 0.318 S3600 35001
400 a. 20 1300 248 - 000 0.37i 2700 1610O
560 0-44A 2000 210 soo 0..313 I 300 9530
900 o.257 2300 372 200 0.311 3o* iZ2o
00 0.210 2900 5i2 toO o 3 00 t 450
I000 0.2_ 5 4 v tI so o,31 too 1390
15oC 0.S2Z 4100 535 0 o.346 0 1196
'2000 0.3? @0 12$0
2500 0.349 1?&* 1550
3000 0.360 8300 1320 N,*is: 4Aifl I1J - 4.I
35O00.345 $400 22o0 I h. p7 a. o.
4000 03-8 18900 2780
,00o o.o 7Z 13400 35300
7000 0 53; gS60•0 ooo
soo 0.3I8 _oo 550
looco o.3 o o 2o3 0 o.395A:a +
$1000 0.3 10 23900 91000
1 ,, ooo 0. 1oo, a J [.
13000 0.3 3 3400 1500iZ
14o 00 0.385 A t .,.... . ..... ..... ..........,
Fig, A7
--

OWE-DIMENSIONAL STATIC TEST DATA
Tast No. - S01l TIP141 174,01SiA..- Soil LacCIltA f0apfl p- Sft.
',34 % P ..4...S Cieaelficefien 0,Ai.a ty C-lag (CC.
Axial I Axlel Secent Radial Ds. of Axial AxtoI Secali Radial Do" ofStress ttu Stre ss luevft Stress Strain We Sres dt
"i t/frk. -ý6 pali psi k/it/W ps pip
0 0 10 0 1 OC9* -0.247 24300 6o000 ___
Ic 00 2 so*Z50 0 - 7o0e 0-148 282oo 7ooO
so '0.116 300 0 So000Co.250 3;-0"0 7970
100 O.ZzO /Soo 12 3000 0.251 390o0 8880 __
150 0.2as 7o 45 __ 10000 0.22 3 ~7" 3550___
2oo 0.230 900 .9 11000 0-253 435*0 110*0300, d.231 1300 191 P__ 5op 10.252 35700 90ooo
400 0.323 1700 2719 660000.250 24"00j 6000
300 0-232 2200 358 __ 4000 0.449 16000 40401-900 0.233 2600 450 ___ 3000 alAl 121001 3070 _
700 0.234 3090 588 2ooo1 -0241 Qa wo£, __
800 O.?34 3400 485 Joao_ 10-2O.46 4100 1010
900 0-234 3900 744 ___ SO& 0.249 2000 4600
t000 0-234 4300 850 200 O.Zi4 S00 25c __
110 -35 400000o 0.246 400 134___&.7 035 4700 SO 0. 244 200 97
9156 0235 4900 1000 Ci 0.241A 0 j ___ __
412131 0.239 54"0 tuO ___ ___I__0 _
1S04 0.231 $300 1340 ____ Noe-. __ __
1400 0.:238 1700 14604Op. S-i*
t 8@ av 238 74 W 1.640 41d ý- s~~w i
2000 &.215 8400 1830 _____c or~,.,.a ~.2250 423%. 3400 2080 _ ____ C.pcf) of' ~ .2...2500 0.240 10400 2370 ___ ~ .~ nti
21SO 0. -40 11500 1460 ___________
3000 0.240 125*0 2.520 ___I
3500 a242 14540 3400___ ___ _________
4009 0.244 *640.0 3900 __
5000 0.246 j 20300 5000___ __
Fig. A8
ONE-DIMENSIONAL STATIC TEST DATA
Tes, No S Soil Type .L4 Soil Locotion 1i.pfh 5-Zz "*
w, __. 3L--% S,, 1-4" % 7,- - -- pcf 'Y4, A 9- p c f S, Z-- JA. 7 e, o. 6i7 6
L, °L % P - % Classificationr Brow..n 5 .",d 5,
A--- A40i Secont Rod- i I° of Axoial,,.,i _ .Secnt Radio) Deree, ofStes tai ot us Siress Sakwait~i Stress ;Strain IModus Stress jSot uj~o
S, a,* iS.rs Soo, Moils,.+ jTlIro uts"• I.o
psi in i psi psi psi in/in psi ps
a ,'i'ooo 33ý ___
x4~~~~~~~o40 ot.. .0 0 _ __ _ _ _ _ _
S- o ,~o 4ll 7. i..__._____ J.• "400 .•."4zz,0 1 /-7- 5140 1.•,o 7,09r.-t
.B.# j s 2> 5 7oI SIS Z7 35421o
-DO ,4" 37 - 34z ,4/,.o4.'I _
4501 ___ 33/ 11So4.6,
/--0 /53 9ZO4 ±
I 1Z &0
4 :' /i ; ____ j-i t__',,I_ 2 _ 201_0_ 0 . & _-
zg 40 7 -"_ _ _ _ _ _ _
! , ~, n7ý6 i-- _ _I
/..o• .. '6,, t I--------t -__ A9
i- d90 FtA9

I.
ONE-DIMENSIONAL STATIC TES' DATA
Test No /0 Soil Type- C.6 PAIdag 4 Soil Location Dapth S -ZZ it
S_ 5..A .f S,+ l3o,.9- u S-u. D m Pal;A, 6w,.- ... % S,,--.• _ y,-,-pc --, •g c f S, &7 e, lf
LP L!L2 % P Classification So-o. n SuI j S,1 (tni4
Ajiail Axial7 Secant TRadial 1 Do".e of Axial Axial ISecant IRadial Do"m of- ss Stai Mod~ luis Stress S. i Stress Strein M , Stress, a
"ZOO . ... iA-4 70 7 -7.
2&10 .IAN 419 _+_0,0
&4oý 4$ -3.0o0 a _. - 5.6 & •.°.im
O7/4 40 It/ ZOO __7,,,_so_____ ___ o.5 ____•'°i"
Z•o•05 .foo I ,, ,÷,oL 9,_,o-0o I z
-7 e/7_p Z40 e.n
.1%o .. •Z.Z.. ___-___o !! ......0 ____
4~ Z70 /*IGO'~- 5 0/1 z# C A
____oozac __99I T JI iT T
d1 a. _I_ _ _ _5zQ. t~,~1o "fi-O __ ___
Fig. A10
II
ONE-DIMENSIONAL STATIC TEST DATA
Test No _ _ __ Soil TypeR g I&d. Soil Locatwon D.. 1h 5- zz ft.
S,,aq Sj 13ar-ty S-t. Dtmf Pt..At
w,LL "% + Y, ,iLl pcf /JL.LLXcf S3.k e, 0.888
L, .to % P _Lq_% Classification 3row.n .S&aJ, Af SIt iOt4.)
Axial Axol Secant Radial fo.o .. of Ar=, Axial Secant i o .. at
Stress Strom fModulus [ Stress Sokv.rton Stress Strain Modulusi Stress SoloL_,. 0, its _.7, at 4, _TOW,
psi n/In psi psi psi ' •n./m p
__ 0 - 0 __ IA pi p5v
S/ . / ,POO ... /000 .155 jS3 S/ .AP .&q/0 *07# i - 674 ___ Z/oDg,0 |.__r_ 9,s'o 70 ___
24___ /0 /99__ _____I ..5A 48, 00, AMD
/o ,.o/ • /oo o l/60o ____ •_ • * •_if /9o I ,•
____ Z _ _ _ 1 // 40_ 0 47-d ,o I 4$ Mo 33,0 ___,_,_ /0W .-,5, Zpg.o b,-o 0 _
z o 3 o 0 ,2,0L: o_ /94 54z M, Z -- ! ,oo ,,4o0 __.___o
t,00 2' 5 . .. 9 z& - Z,,z t
Z-,ooo Z.7 o ///0 . .0 A.37 -7fUZ __,,
.5eoo Z,0o /Zoo 100 ..zo .2J &00 _Z _
35oo 1 ez-
o ':990 04o _.'.,-oo tS ,T oo ,, ____
4,000 zqý z2s9_ __,_.•, _ _,_t __,- ,
70 ~p~ Note L./. fer CXfl- w' At
:'~o .sb 2.5,..oo i 35,,o ____; -so ~ ~r~*i/os" S& 116ev 1495o_______t
___oo -5&/ L•,,,oo +•. +
A:40oo0 4/400 I IF•75 '
Fig. All

ONE-DIMENSIONAL STATIC TEST DATA
Test No L .- Sotl Type_-.lILL.. Soil Location Deit-h 5- Z2 ft.;: S•,,dv_ . SIL .I3,,.r•.j s.jJ Q ;~t.t#t Pi,., 6
S. -g - - S", go-'s % 'Y' "Z42pCf 7d',-_-_QpCf Sit 4 e, .61i
L, 30 % Pop LL % Classificaton , S.,,Jy 5.11 C,•-)
T rAxial Axial Secant Rado ia IDo T of V Axial e,, cant Radial Degr- of
Stress Strain Mo411us Stress iS o~ n Stress Stroan 1 Modulus 1 Stress Sot oho*_r___ M oe Ir, __ -___ _____ ____________ _____a . .... , do
psi in,/in PSiI p , ] psi in t/ in ps. psi__ . ... + ' I
f-0 .- 0•_- _1/o Z70 1,-41P'-0 .
/ .,07& 131A Z
___ .o , { i•o z'/00 9 17,001o Z7649iop4, C #_ 5
z I.'S BIj& 7 4,/oo1 ¢VI,3o£50 .11/ _io. ___ _ Zoe-_-
• 0oo Z000 1°1D 4A,= zoo ff6sp
,// ._ _ _ _ I o4785-9) e ,35,0
J'00 ./zO 14~ 11__ _ __ I51/0
4.5o *,z, 9_____ 4 o 0
A0 17SP4
'400 15 7 - /2 50 Igr
___________ .sf,oo , '9Z. __,___ ,so o, .,~ C. .. ,€.o .
j800 AZ 0 10
4>0 -47 Jf4/*0 Z-7 ____ ,'s'c _q.3~0 __ _
/9.%vo */Cot ?7700 ~4z.5_4 _ -z.91- zuov 204Z50
____ /1 p78I -4 __0 _ ____
9~zo Z4SzO 4Ao~P ___
50 -& /___' /0Z7 .270 7/0 ___ __
Fi.A 2 4) oe wfr 4J f e.S;W tt

II
APPENDIX B AXIAL STRESS VERSUS AXIAL STRAIN

_Test No.r Ir-m
TSample Unitre Saml Extnaslo
A4 -Y 03.2 pCfro - 8 6 .2 p c_"1 -199%
0i 0902 -- -
$2 - - 2 6 3
so
IB . ... .--.
40
- E"- 1 - ---
23 WOWExtruimie
00 g 0.1. 0.003.40 050 040
Axial Strain, ga i
Fig Bl. Stress-strain relation in orne -dinensional compression. test 1
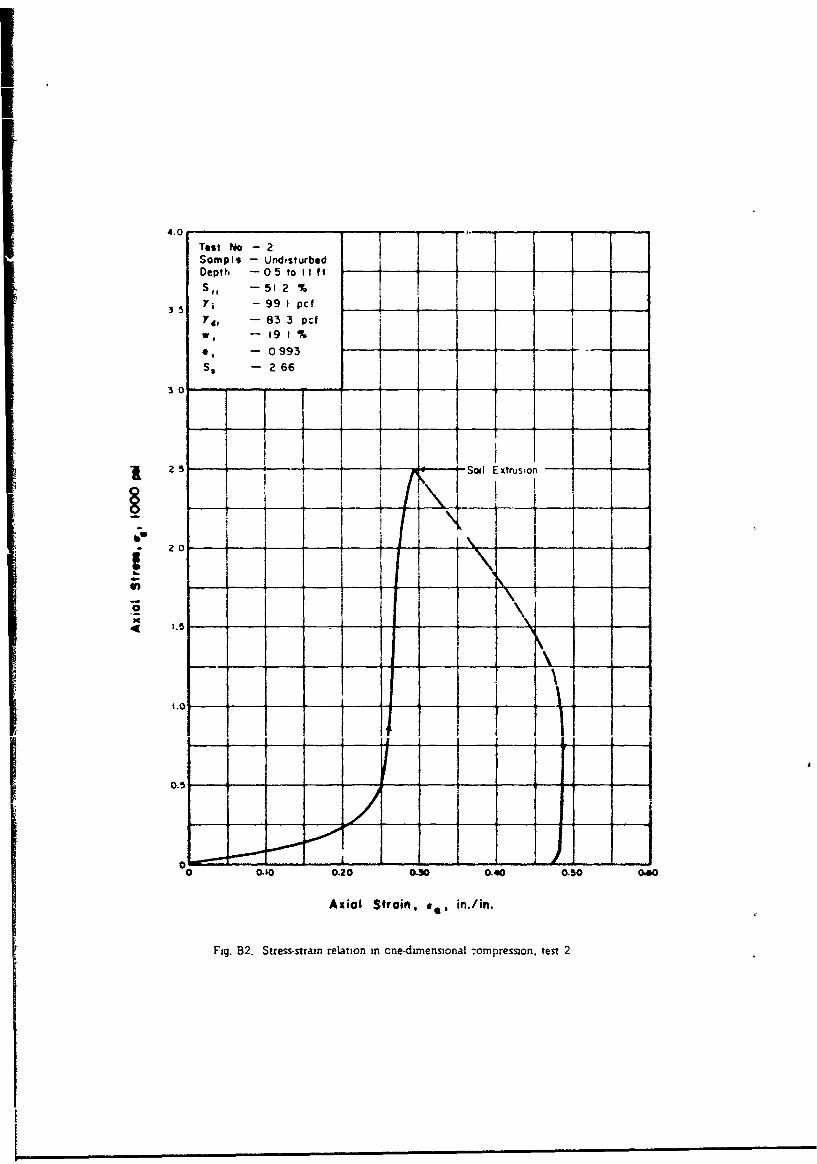
4.0
Test No - 2Sompli - UndisturbedDepth -05 to lIft
35 7, -99 1 pcf4, - 83 3 pcf
w -- 191%0, -- 0993-- -
S, - 2 66
30 - ....---- I-- - -
2 5 fSoil Extrusion
-0 N,
0 .5- --- _ -
-----1 _ __ _
0.10O 0.20 0.30 0.40 0.10 040
Axi .l Strain, c., in./in.
Fig. B2. Stress-strain relation in cne-dliensonal :ompression, test 2
II

II
200
Test No 3Sample UrdisturbedDepth 1 2 fu 17 f t - . .
S,~ ~ 19.1% __
5T 7" -84.0 pcfT d, -77 5 pcf .w*, -- 8.3 % I I, -
S -,1.17 '-- --
S. _ 2.69
Is50
50 -
A il S ri n a. ! , i. in
i ' ii
I I
I 1 i .Ii 4. -- --1 /1-
I i. I ,___ I ____I__ _I__
50 JF7 """
0 0.10 0.20 0..'C 0 40 O.5O w6
Agiol Stroin, E 0 , jfn./inl.
Fig B3. Stress-strain reldtozo' i one-dkmens2ona1 cornpression, test 3
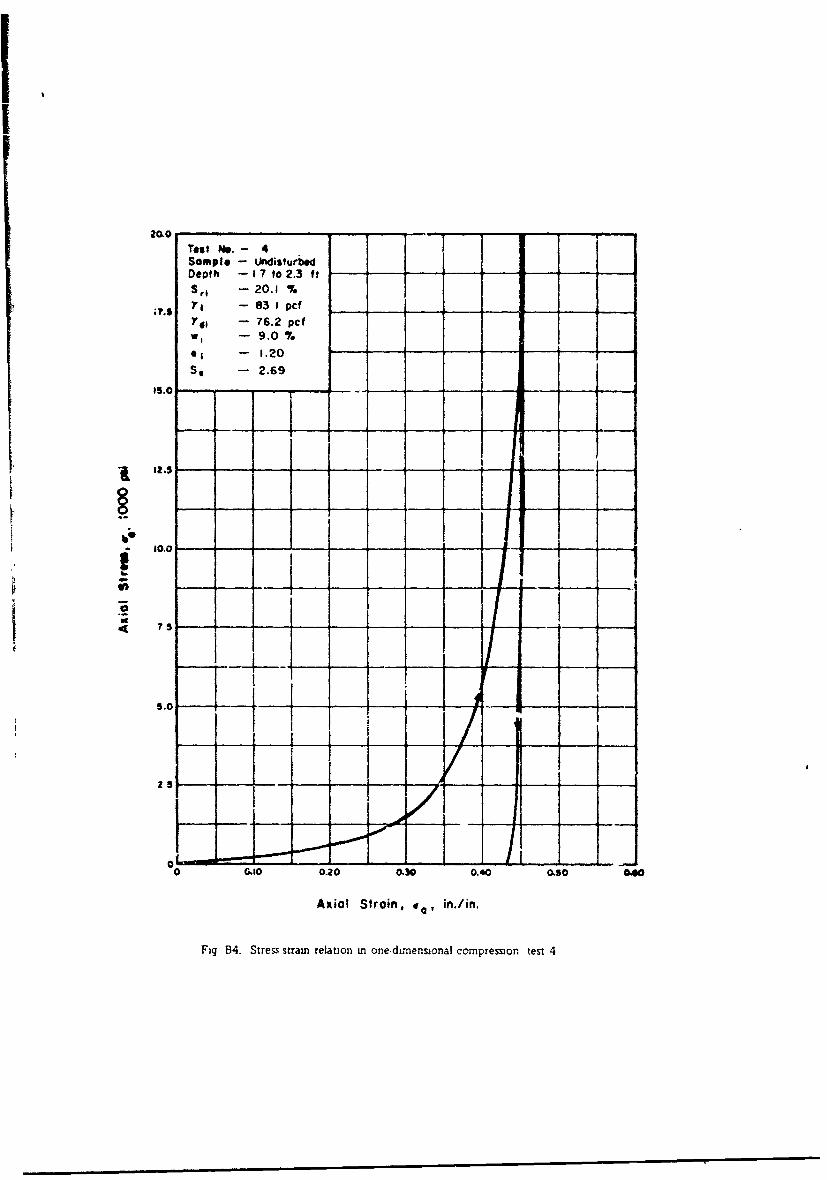
2010 -- --
Test Me. 4Somple - UndisturbedDepth -17 to 2.3 ft -- "
S', -20.1 %. Y -- 83 I pfI
T41 - 76.2 pcfW, -- 9.0 %*1 - 1.20 -
S, - 2.69
,24
I /
10.05.01 1
0 Go 0.20 0.30 0.40 0. 4
Axiol Stroin, o ed in./in,
Fig B4. Stres~s-srain relation mn one-d&-nersional compression test 4

20.0 - -
T~t 11. - 5Sample - ROmold*d Softy
Clay- - -- - - - -
11.5 7 1 - 90 0pct70, - 85 8pcf
w, -48%
0j - 0960
ISO So -269-
- -
50 0.1 0-}11 -6005
AxialStan or in/ .
F:g B5 Stress-str.'n ýelati-.x- iz; one-du-r.E.sicna., ccmpression test 5
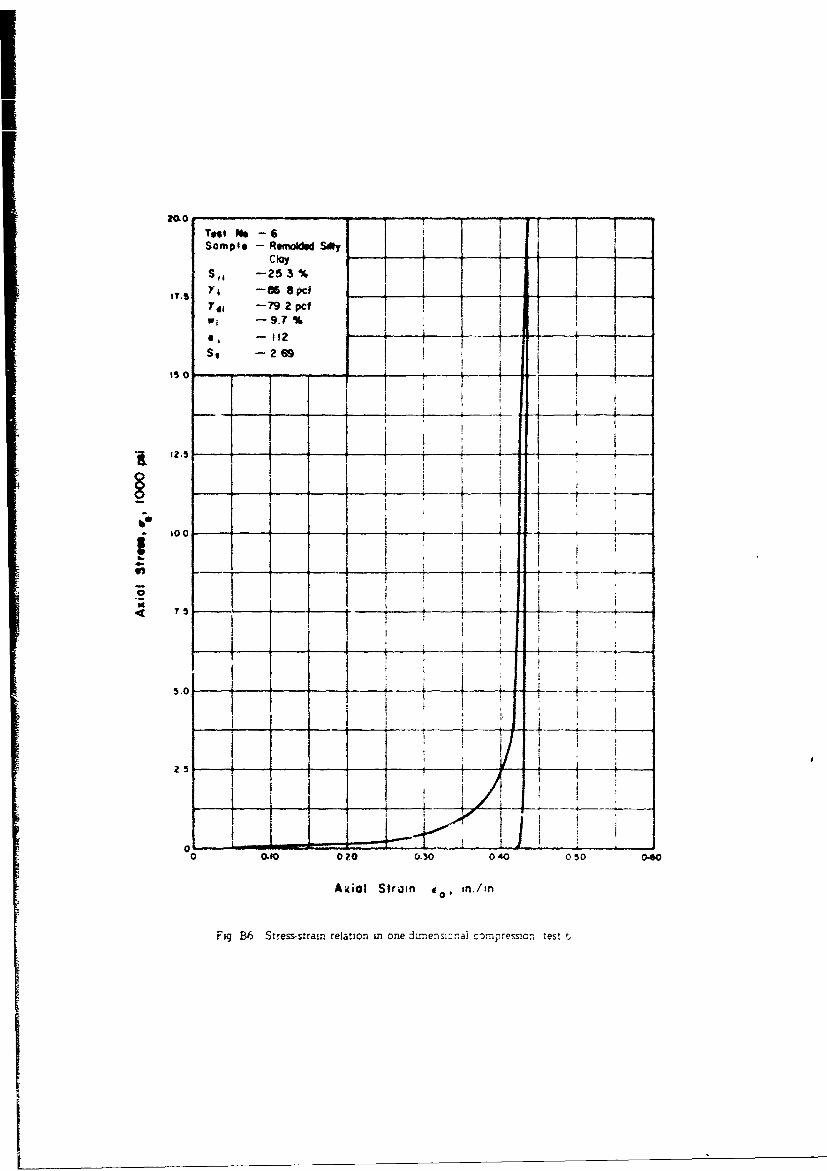
o .T.t Me -6
Sample - Remokldd SOY i
S,, -25 3 %
ITL1S 2.. -W pWi -9.7%
0 , -- t 1 [
S, -2---9- 4 -
In___
5.0-
2 iC - L- --
0 0.1 020 0130 040 050 0460
Axial Strain #, in./in
Fig B6 Stress-strain relation in one dimens-inal c-:rnmresmin test'~,
IM,- ! (tf I
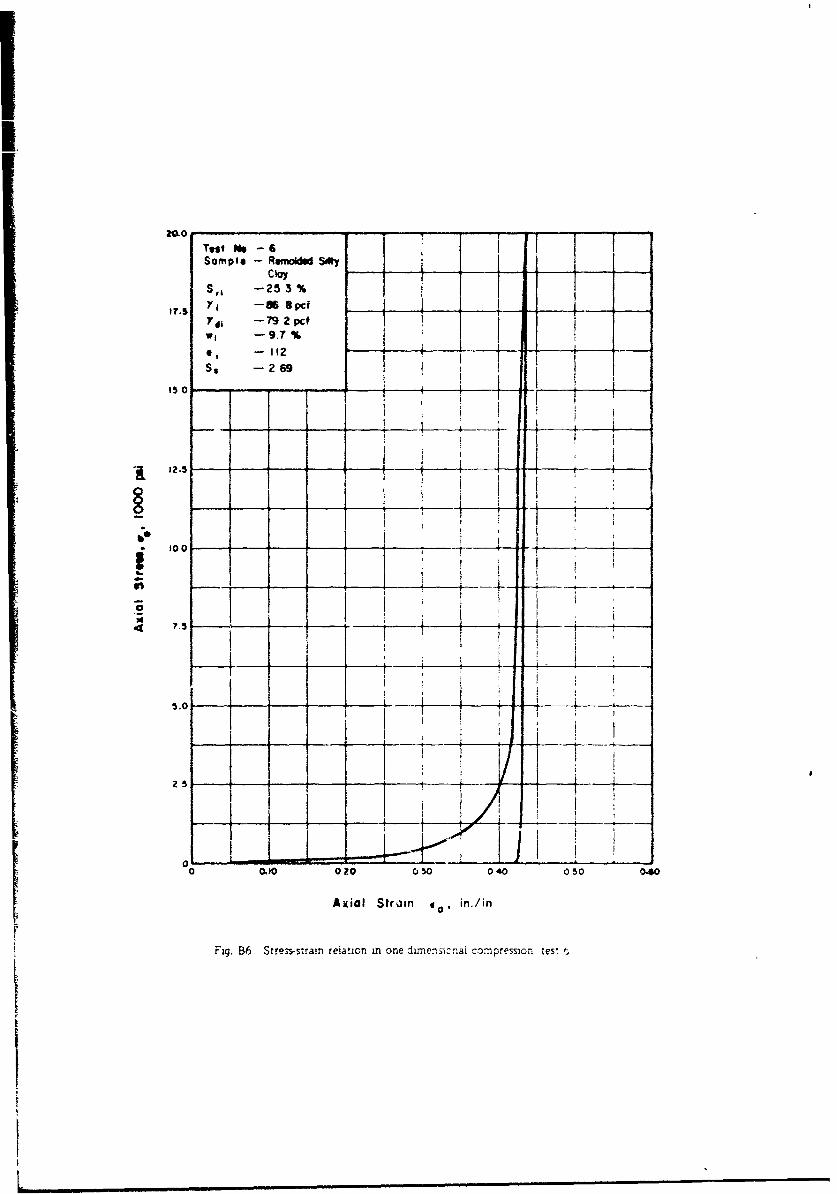
Test Me -6Sample - RemoiWd Sft),
ClayS,6 -253%
, Y. I - asS 8 .f !
Y'dI - 79 2 pcfW1 -9.7%0, - 112
_, -26 9 I
12.5-_ ___b -.. .... _ _ I _ _ _ • l
4- .i I
100411
I ~' - i
5.01
* I i
I I <Li'
0 0.0 020 C50o 040 050 040
Axial Strain ./in
Fig. B6 Stress-strain relation m one dimensiznal compressmon test t

S60 -- i -.... - -
Test N4o - 7Somple -- Rsmold Silty
S, -271%
Y4 , - 935 pcf,40 rd, --85 2 pcf
-98 %
- 0972 - .... i
_ _ -- ,2.69
S 00 4 - -
20 .
00 ,0 0 2u 0 0 3 40 0 500
Axicl Strom, in i.in,
iF g B ' S z e -, s t.rý 'a r r -. t . , c-3,7 i n• : e s icz. te s I 7
i
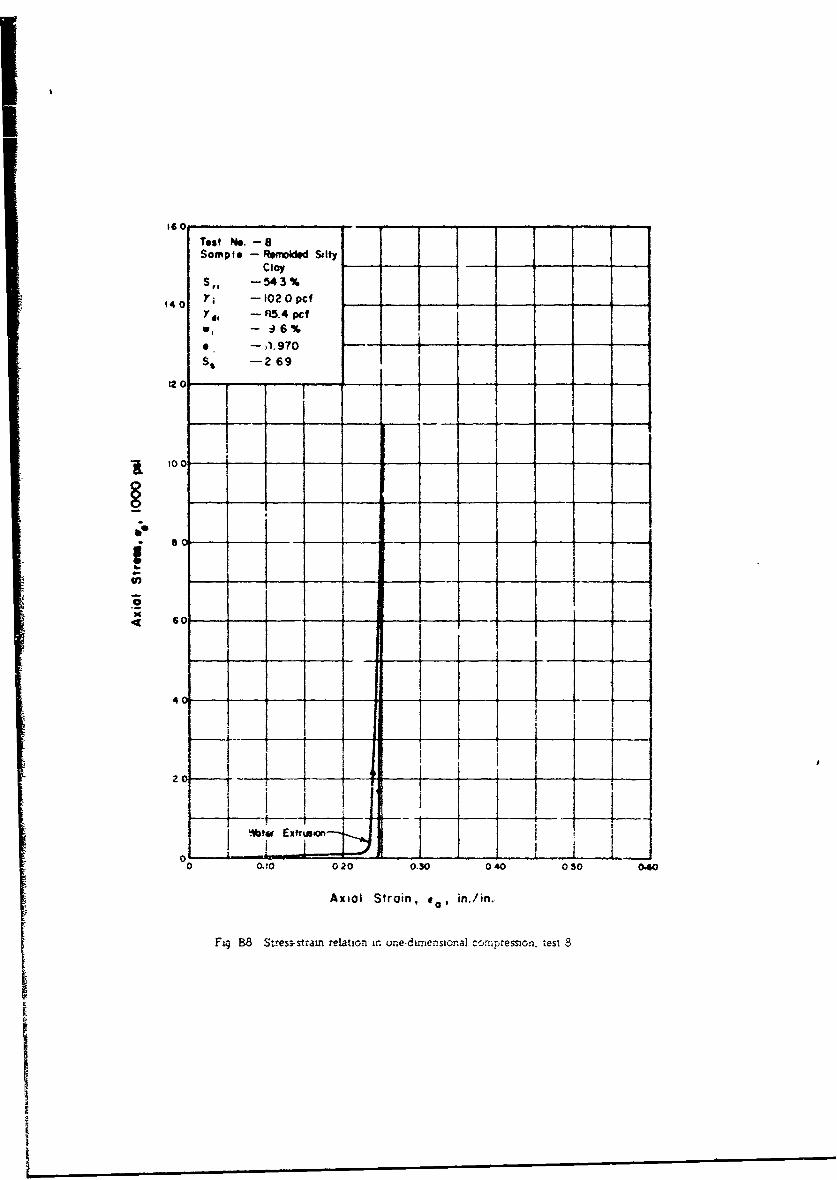
ISO
Test Ne. -8Sample -- Ronokied Sllty
ClayS,, -543%
140 Y -l 0O2O pcfY6, - R5.4 pcf
-- 0,970
St -- 269
s o- -...............
201-
U, -I
__ __ I - -I -ft~tr Extrusion - }I
00 0.10 020 0.30 040 050 040
Axial Strain, c., in./in,
Fig B8 Stressvstram relation mi one-driensional corrpressio:•. tesi "
II

200Test No. -9 iSample - Rerolded SatdyS Si -- 9 4- -
?5Y' -- 92 .0 pcfYs' -- 89 0 pct
W, --- 3.1% -
0 , -0.876-
so -2.67
< ~ f: ... --------------- - __
10
0 0.10 o20 ON) 040 050 040
Axilo Strain, *a in./in.
S~~Fig B9. Stress~strain reL~tnc n m.,-e-dimensmoal campresso., tev. 9
1 I I i II

SI'I
200 V T rTest No -- 0 10Sample - Rervlded Sand
Silt
S,, -241%Y , -- 95 3 PCf7d, -- 880pcf
, 1 - t1%a -0838 98 + fSS -267
....- - " .
Axi StraI c i
Fi TI Stes stai re L3 tni r iesoa o peso. 1
'2. } - ,----4-----*- 9 ___
S. ir - t --
bi i __ __ , !
*- _I __ _ _ _ _ _ _ _i _
a I ¶4 ____ ____ ____ ___ I
L-*-i 1 , !
25 .. _ ~___ .... . ' __ "_ ___ ~-i i -_
Axiol Strain, ,fo, jn./ini.
Fig 810 Stress-strain relt~on in one dirmenszonal compression, test 10

20.0- - ---- -
Test No - iSample - R anced~ Sond y
f4 -450%
15 Y, - !18 pcf- _ _-
7d - 88 5 pctW, -150 %__1
0, -0888- - - - -
s -2 67IISO
or I-i--------+ I
0 _
0 ~ __ 0.1 02 3 4 5 4
Axia Stanc ,In/
F~ Br tessrmrlto n n-ienrl~nrs~n et1

T s Me .....Somple - Ret'oldsdI Sondy
ts, -803% !Tog Ne -12 0 Oc
yej -88O0pcfw, -- 272 •
a i -0898 -- 2s. -267 I
II I I i1t 1 t
_________________________________ I __________ _________2.. - ---- -
100 _ _ __ _ __ _ _I:....... _ _2 5
I-
* I i I
4. . ..! _i__ _-
Aa S _ _
Fg . . ... Srs-ta retion in on-iesoa c pes, tet1
________I___ I ___V i-a -__ _ _II I _ _ _ _
,- ____ ___, ___ ___ 1 _____
0 0.10 0 ZO 0.30 0 40 0.50 040
Axiol Stroin, *o. if./If.
Fgj. B12. Stressstrain relation in cne.dimensional ccrmpression. test 12
IU
APPENDIX C. CONSTRJ_.NED MODULUS VERSUS AXIAL STRE& ,
I0
- a~r -L
0 In
cwxW
00 I : -
is 00) FS4'nnoN loa

fi 0 C I I
CX z
01 0tv 6
ts 00t t #4 jsi p i ju o

II
r111 �I�i I j
______ 1812 I I-12 I i
_ _ S _ I
i 4
_ I _ 1 _ I _ _ I* I
I I -____ _____ I ____ ____ ____ a. ;;
I 1 0 KII b '�I � U-I I v-i ir' __ __----1 ___ * S.
-I__ __ 8 S..--I �----�--- I I -
____ 1 � -4-- Ii ____I 12 I * 012 12
I I I i1 0
a 12 -.L1 iz �SII
. I�2 _ o -- ____
_ 12 * I�wa� ii' __ __
I I j II
I I- I
_________________i-1--i--�--�--� ..L....... I0 C) F' -
!S� 0006 �4 'SflfflpQ� IUO�*S

Ilit
46 6
n ow
!s 0 i *I Is ip y ju Ia
CI
- - - - -! 7U)iii' _ I
-1---- -- ICL a
I I I
0 I'
I ~s nIo I* ________ I _____ 1 -i .2

110 Q'I - I a§eI cm _w-j___ __
CI _ _ U.(1 1- - ___
1-
10 00 WX 3
*S bo) -* uD8

ro- ~*1x
-4---~~~ 4 E_ __
-1l 000 Vg'nnoi--I-I--

I''
0 0
!Sd~ ~ ~ ~ 00E6NInnoif4o&

IIb
Ni
--- -- T- -t--
__ 0 0-Id n snnor 'D
[CI'x
- 06
Ia v r Di
0 00
!i1 -00 'a snnollo*

I7
I-- -~1X
V-CL C--IA- 0-I0-OD-*V1 C 4n - IDI___-t- U)__D__I 4- - -
A V7
0_ 0 _ 0_ __0__
is 001 1lpc uoa

- - 7 6 -.- .-MC
0 0
!s 001IV Unollc*

U
e
APEDXDRDA TES ESSAILSRS
B5

IL
Ini
ca
C 0I-i' ___ 's il 1 -p
S In (A so
con T1 fnI:(
4- jI i . d 1 IM~ DP)

f2
-f V--~-- -~----~--~-
~ I - 8
* 0 ~0
is ssiI Iio

_ _1 ..... . I _ _
, I 1 I I •
It II \ I
_ _ _ _ '_ I _
- i! i I - -- i ! -
i4 __ I i __ ___ ___ • I ___ ___
_____ ___ r -. - i- . i _ --1-I I t i i °'
So o
-o V o4-- d o
I ,,, ,• U,•IS l~p

- L 7777
U) 0
sIa IS II 0

Id
Fq
C'IrIC
0 0
I II-V~ey
is4 H 'sa4 + __ 0

Il
I I
0
IF I i
00
isd sai IS101PO

Io
_____ _____ _____ ______ l l
i8t
I I j 0
I I iO;
100
I 1 0__~~~~~ __ _ _ __ _ _I _ -
_ _d _o _ _o _ _ S_ _ _ _ _ t

<~-1 T
-4-1
-4I-4-4- ~ --------- +-- __ _1
0 0S T1
-f--4 'ss-4 I9Pt

Z JI__ _ _ _ _10I-
V)i I ful* 1____
-- __ __.
i _d -4-,S oio

____ ___ -F - -
CL1-
c COt CD -
tn -
II
I.n
i sd Wsai ISfoipo

LIT
8 8
___ 4- - n
Ln in .isd~~ -.salS lio

APPENDIX E: TABULATED DATA FOR THREE-DIMENSIONALSTRESS-STRAIN RELATIONS
I

OIEE-G!*PENSIONAL STATIC TEST *.)ATIA
Test~ No. 5c" Tye -V41Stre4d Sol ý_co.On - 0I* 0 - O fst
gjay,~I~1 -_-140* 1 3f.Vja4nt Pjg*n 4-
a l i'7 2 Y. -L2.I3J~cf r, ~ s ~37L P JC1% Cvss~f cation -- Ds±Paw -±S1U4'-ýL Sand
~f ~ ~rCC L)
7.o. +, zaRddii $gre Dý g o O#
vi- 1_1_ 1&"~ -of
(0'0: 0" Stressc soral' sr*4 a
rearct~'d for- +h.. fes
_-Fi El

ONE-DIWENSIONAL STA)I IC T EST DATA
Test No 2 Soil Type UnJijt'"rI§C Soi LOC~* OCIth SS -1-1ft5;i t1 CIA* Z-i/. Ost..,t PVw,6
WI, .a~5 Z1- %. S"..POt Y 83._3_pcf S, Z-" 0, -R.q?3
31 %. P 10 %. C:ossifictot,o 6sre n 5114, Cl. "Itg W trdtce of
IRodial Do" m-fj O~*2O Radial Do". ofi3 ~~~ Stress !rS I *0 xa*h. Stress cv
PSI in /in psi psi % s psi PSI %.
o o 0
23 c-018
63 o.*oIB 1
23 0. 040 -toI
342 l0.083 14 -
905 0-097 117H _ _ __ _ _ _ __ _ _ _ __ _ _ _
905O o.o3Y 137
2340 1 .o91 75l.
jz 3O o ;018 -
41070 OI 6X -P1f
0iZ -82
Ois 0 16,1 -1-0
147 o-fI _ _ _ _ _ _ __ _ _ _ _ __ _ _ _ _ _ _ _ _ _ _ _ _
Fig. E2

ONE-DiMENSIONAL STATIC TEST DATA
Test No 3 - Soo Typ* L'nds ftwri~ Soil Location L)..th 5.2 - -7 ft
S A.L.. Zi~ssf~Cotaof -I-Z":-P? S,1* Cla 6,1 0 1.,
L.o.o~ StreCiss-fSantion ____ Degre o#1f- 1t
.20 - Radial$ Do of .20. Do ofuda
PSI ini /In .~s PSI -psi Ps
3_ _ _ o _ __ __ __ j 127000 0.150. _____2
3_________________ i osP 13 501 C>.15 1 +0__0
q270 o/Z 0.15116240
4152 0.030 3#c ~S0~.15.0 3440
311 0 .0 54 /6 3 1-_ _ _ _ _ _ _ _ _
60Q 0.01 166. 500: 0.151 #b2o _ _ __ _ _
__ __ __ __ __ 0.)&+_ ___ o674 *IS _____ __
5,30 o10 40 0. 147 -57 _ _ _ _
1000 a 115 4115 ___ 290 0. 144. -560 ___
0.120 640"10 o-4 -
'239)0 0-1 Z3 Igo0 u - -ss5 ______
74:o. Iz6 975 ~710 .1+-3! -S203"40 0.131 1160 I68. /1-- __
4710 0.137 1610 - I
5400, 0,14-0 1940 ___ _ _ _ _ _ _ _ _ _ _
ii14001 0.14*5 ZS070 ______ _ _
0 1+6 I* 11, 4IL%
41 lop 0.147I 0760
1; 400 j'/ 5 I 2210 __ __
Fig. E3

ONE-DIMENS;ONAL STATIC TEST DATA
Test Nr -- Soil Tpe UJnd-s~&thz bd Soil LoCotion .Drpth I.r.f.
0 ..-22..% S, 20..tQ -L, V83i.Lpct T 8d, 1k.2 pýf SZ.2h61 e, 1.200
L. %... P 23 % C lossI * cot.on A ZnX .5I*, C JA y cc L)....
+ a oil D " o l-2, t Rodiol IDegr o- 7o-01)Y Stress Saturotion - - - .... (-a-- Stress Salo in3 i 3 -3 j S , 3 .
s I n /in PSI Ipsi PSI is n /in psi I psi 7
-_ __ __ 10200.1, +800
3 0o00) /0,700 0 151 5180
Z3 000-3 1911300 0.s1Z 5470
47 a 006 38 11950- 0. 5z 57--o
1___5 _ _o ___ __ ____A4__ _ 0750ý C).IsZ 471ZO
5193 0.0y; 7.5 5500.5Z 184-01
277 0.053 87 __9+000.z 2 410
324- 0.06Z iZ5 -7150 co.15' zooo______
376 0-070 157 +,?o! 4 0.so 79o~
65 o, ORO Iqz 3660! 0. 141 2316
oie .087 226 220 0.1!48 .
970 0.I 372 1___ 550 0 14k -AI5 _____
1?720 0-500 475 ii;o o.!*4- -405
161 0114. 430 I_ 44
194-0 0.119 720 0.14.44
2ZZ70 0.1 Z3 97o 60 0-1+3 -4-to __
ZS70 0 126 1010 50c 0-14/ ,,
3 Z30 0.130 12501
3820 10 134- I!F4.0 _ _ _ _ _ _ _ _ _
44404 0.137 1810
5/00 0.134? 2040 _ .sb30o 0-14f Z370._______ _______
6200 a 143 2670
4750o. 0.*. 3000 _________
735 ,0.1 4 i 32SO__ _ _ _ _ _ _ _ _ _ _ _
7qso 0 14-8 3580 _________________
8SDO0 104.1 3q11oo __ _ _ __ _ _ _ _ _ _
,qbOojo I50I_____________Fig. E4

ONE-DIMENSIONAL STATIC TEST DATA
Test No Soil Type 1CZ2ld.• _- Sot I Locotiol 42C.i09h a 5 .
.. _4-_ ,% s,,S % Y .. ae ), 1 •pcf Yd,8 .-8 s, 2- .6_'__ e, 1-
L1 J % P /aL % Closs,f-cotio. _.raw 5a/tr- Cw.f lcs)
Rodiol Degre of a* 24'D7__ 7+, Ste, oo f ROdOl 2
I " (O Stress Set_ _ _ S, 547psi in /on ps i psi PSI t ,n i %
O 0 0 __I .. 3rW 4Z~ ;6-k03 0.004 - 7, 4P/ -. 4 --2.1 14- 1 -4-1-o, 7;'3- o337 0'.03Z (- '0 _. 33 3,- 1' C
:I . oa.I , 4- ____ __ _ ,o•7:.3
-T - , -04 FO 31 S ' Z-1";
3; 'oos ,3 ZZ : 1Z :-13 cOk3 44 -3(.53 47;-33 30C63a o •o7? . 425 . zco0- "
0 C77 9 . 3.,3 750 _ Z_ o. I 2S -5 2236 _
_3/ 0_.05 5 /47 7 7 -- 5
,-300 0 Z 8-o0 .1 - -23-0 ---- --
233 085 470 00/ 1307 0. Z/ -0 Z 6 9- I
673 0 00o9 585 ,0 'C. C.7 -5.75 ,-2oo
a3oo3 0-1711 479 2 700
4573 1.! !04 718 3360_'_
-- 4-- -'+ ''I -4
:_52-l13 7 !'97o 3•zo __ __ __._ _ __ __ __
5867 1. 9 zzzo 4300 . . . ._ _ _ -
• , ' ,' -- - +• ' -- ,| •
7 ,3 1. 1?-3 Z7750 5170
'77 5-3 .KZ, 3 0 0 , 5-30 ___ 4r_500
836 ,-OZ 3zO ___o0 40
7o0OIJ. 27 54 o 100__ _ _ _ _ _ _ _ _ _ _
3770 70... . ______ .___ _ __ __ _
Fig. E5I+' .. oo s o ---

ONE-DMENSIONAL STATiC TEST DATA
Test No 6 Soil Type_.grhaldad.i Soil Location DJC.fr •L.- t..
w, 19.7 % S,,z-q-3 % Yj&_4 -OC?: YO,_71Y,.Z cf S, a.6'P f ,_Z.z
L, 34 % P ZL.% Clossificoti:n SrE•m j'lfy .017& era)
_Rodiol of 77 40 Rod _ ia
psi p.si, ps i~ % psi im/m ps psi 04 %
71 2.o4q. 2/ 56 - o 1 __ - -- _
/#6 0.073 13 121 __ - 04 ____/I 0'°75 63 1a•. __ - A o.I, -_ -- __
W1 oos 6_ - o. -I5V-Y301 o.0o?6 61 ZS3 __a 14_. - -348 0/001 /o7 272 _ - o./43 - -
3?L Oe. /7S 4o _ - .143 - -596 o. ii1 17.3 433 10__-1a/3 -
64, 0.-17 20 470 .- ./43 - - _-_
,w/oo o.Ia5I 308 760 - o.143 - -1320 0.130 h ,7s -0,1_•5_ -/6•0 &/34 ssz 12 _ - o./4Z - -/4?10 0-/36 --/,o 1490 __
23I60 .135 "-1i o _,._ - ./4/ - --
Zo o.-1J1 878 2/1o -__ _ 1_ _ - _"-
3.50o 0. 0410 3 o co _3_ 200
.oo 0/40 /12 "- 34___
5#oo o./41/z' U3 40__,___ __ _
60oo o.i41 /1170 730016-410- 0.141] /I27 562Z?07220 ./,/ /12 55 6w' __
1/67 -0L 14 /2-91 Jt5SO 7i-Ao 0./43 3/327 I
12247 46 /21 11400

ONE-DIMENSIONAL STAT;C TEST DATA
Test No Soil Type 501 LoCd0Lt1 2 C7_. ft__
L t % P J ,--ZZ'u $1,?j~CO~pon 7;9.~L.-•14 P,--. -% C _u.,hcohion_ -.
7 +20 , .19 Rado, o f•o] • Rod,af- Olfl• o_--:-- --:-_ l (0,4-a' Sires,.. = 0IS Stress•
- -.....i• ,P -TPS ps- i %.
143. ___12__ 1 __ 47
_ ___L• • -__ -o/ _JI 6-7,.,.------_-/ 300 ./4? 14 g OO
4 lo o• !: 6 ---56, 293 "BOO!-•/i •1_9 ____ 119 _i i go Z7
2,. c a,, & 1/82 1 0 10- z24- 7c4 -3
" o- 073-'•-•• X !6.. -7-1... ,0 IýWO
__08 -1_ 260 *1453 ...... .4 -- 71 _ _ ,
50 0. /07 372 - -
-5 -• 5/2 /020 I 123 .140I725 oqcs 1i9i -587 1 ' P3- -C___ 1-391;0/7 j/Im 89 ___z5t
1-50 a.• 3 -4- i /--•a
___ 673 V.? S9 -2607__ 'Be' 573 I
I IR
4- 4 Ar--'D--- 0
93c0 It_ 0._2_
12__ 5471_ II- eo
IOI3.5V4 o.2j.2j~ 00 1_______/1 4 _ __ _ _ __ __ _ _
F4 E7

ONE-OI0ENSIONAL STATIC TEST DATA
Test meo _ Soil Type Rgiftelde Soil Location 241d& o-SN
L _.,• L. P %Z Clossificotion A,, - C/ty (c .. )a
%* Radial Do"o[s of ,, * 2fs I Radial Do"r ofo .oS•re Soyur aeo I l. Street SO
""tS psi In6/i'n I psi %
10.077 A-00
t 2 P7 o.o77 -51 /0/ __00 ____ 0___
317 o.ol 58 :o-7. _ 0o00O'83 -- 6000 7#o5 o-0 .T ;r _ _5 I• !It7 1oc831 i -11_ 4-0401
__o O7 I__ _8. 047C, COS -33I 1 307____ 0 _07 _ ___ 6aoo7 o.082 -S, /0/0
008 "0 !608
-_ 1_0-07_9 107208Z9 -22 1
00 o.o0078 7o t 8o I___ 0-49f tiZ -66.. ;ý 40oa 781 111o _ _
0687 008& 160
2__ / o7.oAD 9b __ _ __ _ _ __ _ _ _ _?#/13 100& Coli 2370__ __ _
2q 7 100& 38 -9?9o ____ _ _ _ _ _ _
~±0~O6II /6? 39001 ___ _
5001,8 1 ' 1 50001 - _ _ _ _
Fig. E8

ONE-DIMENSIONAL STATIC TEST DATA
Test No . _ _ Soil Type ,mal&/t/L Soil LoCotIo0Z;6x9 ,-E-224
W,_ L_ S.,. % ),Z. pef "'d,- .. cf Ss, 2-4-7 e,
L, .% P __L,•L_% Ciass-f,co?.on , ., J M L .1
I /
(_ , do Rodia !De" ofj r,: ! oft a.- o,,)! Stress Soajraon Stres RIod, o ttaS. S .
DS, ,n p , S ps % pSI in/in psi ps,
_ ,_0__ . , 1 "._._,______,,,o , _/ _ _ _,
414____ o// 117 ' _ *-TO .I-__-- , oOL 4!.• .____ , vi _Z.•_.4.ro~o ,
531~ 0367~~ ý //IA ZTI 19 z7
.0-/ O•z . _ I -••__.__. . ;
634 07 P1ieLa- fR u19 13Zs -- '-ii_________.______ .4•~o ; ;/ :";
_1V_2 - ,204 P. .4,,0 __ iO A • ,-.•1, Ao ,
-eva - 42 4,7~b-- i J.t L ~
* H*
249o 07A ~V d.I
U Io OA? /4070 ~~5* ~ ~~~~ Zle i,- 4K-
1 Z _o 7&/ //021' -_o-._. - o-
I £)t 2 SQi -
bbs ic A'
7/b.o /o/& 4=t/o ___________" __________
0
Fbg E9

ONE-DIMFP,,zIONAL STATIC TEST DATA
Test No 10 Soil Tyoe~ajfiidde/JL. Sodi LocotionEZ2WA -T2-7 f-
L....2A....¶ P 19JA CI Shif.COtlon Zj!MfliaaSarM,LJLLLL.ML.Y.j-
-r -------
psi in /.n P~SI ps % si i' psi psi %
J92 .. Z 1&7pd~B0
47- VS& /kla____ 1Lp t.p 11.0~
41 0607 2/ Iix - ZJ. z.:-kI
________________&&0 /z/ 4-7
122&~~" i0 ,, 470
,At&~~/i -nt l..L ,S 4501
244P1 pit?- *z *004, " ______
Skn /00 n_________
Fig E A1 O

ONE-DIMENSIONAL STATIC TEST DATA
Tes, No II Soil Typei n,,,-l / L/ Soi. LoO,,o,, 4L:. 13L____
W, Q% S,,-4,.- L % Y, pcf Y, 6-5 .f S,.Lke, -•.
L.,2..2-. P, /'j Ctosslfkcotiorý 2&rn~aw sa ~:v 4 (
010+2a . 'Radoia Degm of or Zo, RadialAStre So tcf I, Stress ied•tVt~n
- i or '" "
in /in ps; pS, psi of/i I psi pSI ¶..0.. o ; i./" ,7 I
II
I ~-4
-'•- �- ."P- •,,o 4 -7
271 'Wdz Ai7 4
_______., __. _____________ -,,, 4'Stt -140-eta
4do So , 05! t1e 5ft• j9
__ _ __ _ __ _ ";i: •
05.
_ _ _ _ _ _ _ _ _ _ _ _ ide : ., .. _0_ __
DA, /__ __ __ __ __ __
OE b2 ____________________
203 161c_ __ _-
r~ ~ "~ -fI~ in IA.li
-&2&.Q4 X/> -- -
• I
Fig Ell
ONE-DIMENSIONAL STATIC TEST DATA
Tes, t o _40 ____ Soi Typ,•,illba" / Soil Locoto, faa-i ,' -
., spcf T.,-)r,,sQ.pc-f S, 4 --7 ,
v; ., Rada Do of .. 2 Y' #a o
41g-` 17,/n!S tres p S, k-o -Ii 'V <r~n p , Stes, %wv
3 ir 4-S,•,.,+ • 2 ••
ti l PI PS % P. n m Ps S
S41
so L J,______ , __ __ __ __ __o• ._ 0*_1•_ 470_0•
/Sf4 I g 1 I
an _ _
SP,"o 3 o ig, . : - a ;d+ f Al 11 '2u 0:u
jf. 'Z4 12LiLh~. 77___ 1 ______-35
_7., t~o :.___i _ __ _ @__ _o• zS+ _
_ _ + I
IzFi.i gal
Fig. E12

APPENDIX F OCTAHEDRAL NORMAL STRESS VERSUSOCTAHEDRAL LINEAR STRAIN

16 I ' I'
NOTE RADIAL STRESSES WERE NOTRECORDED FOR TEST NO.
a.
0.
In
hi I / -
.2~7- 3 F T,:
°i
U
ISOI
-1. 05 -1 / -c
0 0030 0080 c 090 0120 0150 0180
OCTAPEORAL LINEAR STRAIN f. IN.. N
Fig. Fl. Octahedral normai stre. versus ocahedral linear strainftx the un~disturbed sannpL~s of silty clay
16 6
I'1
12I6 I
(LL0t,2 __ _ ______ ____ j t ___It i
0 I_orE.5r NO 8--t
0 I
a:N I
6--- -
I ~I I, 1 /
I I..
0*
00 00030 0.0e 0.090 0.120 0.150 0.180
OCTAHEDRAL LINEAR STRAIN S-. IN./IN
Fig. F2. Octahedral normal stress versus octahedral linear strainfar the compacted sampl.!s of silty clay
14
II
TEST NO
S' i9 /0CL
o IIo I|
.10 i
0b
6 0I
O LINEAR $TRAIN ____ IN /IN.
Fig. )7 Ocaerlnra tesvruIcaerlhersri
for t°
6I- 1/!__ __ __ _ _,-/ I_ _ _ _ _ _
/i /
0 1 ,.. 10 0 030 0.000 0.090 0 I20 0 ISO 0.1.0
OCTAHE'DRAL LINE'AR STRAIN •-jIN /IN.
i : FiP. f-3 Octa~hedral normal stress versus octahedral hnear stratn; for the compacted samples of sandy silt

APPENDIX G: OCTAHEDRAL SHEARING STRESS VERSUSOCTAHEDRAL NORMAL STRESS

NOTE RADIAL STR:.SES WERE NOTRECORDED FOI TEST NO I i!
I I t
; /i/II / /
o res$r No 4
-7-2FT 7
C //7Q
"= T ,E s r No
0 ~ ~ 52-/='
i I~ z__ _ _ _ __,_,""_ __.
C 2 4 60 Z2 ,S
OCTAtEDRAL NORMAL. STRESS 1 lO00 PS.3
Fig GI Octahedral shearing stress versus octahedral normal vress for the undisturbedsampies of ss-Y clay
I

0.0
!M
0
fCI
o6
0
S I
0 2 4 C 8 '0 2 14
CC-"AHEDQAL NO-UAL S7ESS 3 1000 CS.3
Fig. ,.2. Octahedral shearing stress versus octahedral normal stress for the compactedsamples of silty clay
`"0".1 zil
"--, -- ,, / *//
/ /./
/7/•
/7 //
C24 6 6 '0 '2 •4
3
Fig G3. Octahedral shearnng stress 'versus octmhedra1 no.r..a! stress for the coinpacte,'lsamples of sandy sil
4
iC

Unclassified
DOCLUMENT CONTROL DATA R & Dc.e.i. -tin a1,,•l•la O ,iggi .4 of .bat,.., .n nrd..~n, ae.,,.t e,.u, be .nt....e., Ga. t/o n.S#l nPC. ,=¢aa*id
,t'C.'1", *, 04V $pC.A Tv CLAS$IVCAT.Oft
M. I Davrueon, Foundation Engineer 1 UnclassifiedChampaign. Illinois ab
S"IEPOwt TarLc
EFFECT OF DEGREE OF SATURATION ON COMPRESSIBILITY OF SOILS FROM THE DEFENCERESEARCH ESTABLISHMENT. SUFFIELD
4 ~ s *(1R- .81 Rh(T'. .441.pai pl it.Ch.a. .Final report
A J. Hendron. Jr.M T. Davisson,. F Parola
"April 1%969 98_ __7
80.CONTRACT OR GRANT NT I9- ik CIATOr* RE~ORT n.,dflR,.
SPurchase Order NoWESBPJ-6-67
-ontract Report S-69 3
This document has been approved for public release and sale its distribution is unlimited.
ii SUJPtRLSSEVARY R*OTh. SiPOSOt~m*C b•* 1. •*VARY ACT*VttY
Prepared under contract for U 3 Army Defense Atomic Suppot- AgencyEngineer Waterways Experiment Station Was."ington. D CSVicksburg, Muissppi
Soil tests were condut ted to provide information on the influence of degree of saturation on high-pressurestress-strain relations , f undisturbed and remolded soihl from the Defence Research Establis.ment, Suffield.and to provide input c,%ta for computer codes concerninq the relation betwee- stress and strain invariantsat high pressures As ft-wtctd. the test results presented herein show that laWge strains do not develop athigh pressures in fime-graui -A sois such as silt and clay The test program consisf I of 12 one-dimienmonaltests on 4 specimens each o' undisturbed and remolded silty clay. and 4 specimens of remolded sandy silt.In all tests the radial strain w -m essentially zero Axial and radial stresses and axial strain were measured.The tests were carried to an axial stre--a of 20.000 psi unlem sod extrusion occurred at a lower stress. Thefollowing conclusions were reached The degree of saturation and the initial void ratio are the most signfi-cant variables go.erning the one-dimensional stress-strain relations of sod at high pressures, For presmiresexceeding 3000 psi the compacted specimens and undisturbed specimens of Suffield soil yield the same re-lation if the initial degree of saturation and initial void ratio are identical before loading A lower boundto the secant modulus of deformation Ms at a given level of axial stress oa is given for both compactedand undisturbed samples of fine-grained sod subjected to pressures greater than 3000 psi. The average un-loading modulus of Suffield soils subjected to pressures greater than 3000 psi is approximately 10 timesthe loading secant -odutlus of deformation Ms It is probable that the stiffness of the Suffield soils whenunsaturated will be greater under dynamic loading than the static values given herein. Previous comparisonsof static and dymunic values of constrained moduli of Suffieid soils have shown that the dynamic valuesare twice the static values This observation is consistent with similar comparisons for NTS FrenchmanFlat silt.
DD 1= 411473 a room S "" " Unclassified

Urnc~assified
Defenco- Re-rearc'ý EstabIhsr-en- Slf!~elcSat ;r ated szj,'sSoll ccr,-pac*,n: I
stra.-nsc stress
Unlasiie
I ewt 4uafaw
Related Documents


