IZMO Limited Investor Presentation August 2021

Welcome message from author
This document is posted to help you gain knowledge. Please leave a comment to let me know what you think about it! Share it to your friends and learn new things together.
Transcript

IZMO LimitedInvestor Presentation
August 2021
Disclaimer
2
This presentation has been prepared by IZMO Limited (the “Company”) solely for information purposes and does not constitute any offer,
recommendation or invitation to purchase or subscribe for any securities, and shall not form the basis or be relied on in connection with any
contract or binding commitment what so ever. No offering of securities of the Company will be made except by means of a statutory offering
document containing detailed information about the Company.
This Presentation has been prepared by the Company based on information and data which the Company considers reliable, but the Company
makes no representation or warranty, express or implied, whatsoever, and no reliance shall be placed on, the truth, accuracy, completeness,
fairness and reasonableness of the contents of this Presentation. This Presentation may not be all inclusive and may not contain all of the
information that you may consider material. Any liability in respect of the contents of, or any omission from, this Presentation is expressly excluded.
Certain matters discussed in this Presentation may contain statements regarding the Company’s market opportunity and business prospects that
are individually and collectively forward-looking statements. Such forward-looking statements are not guarantees of future performance and are
subject to known and unknown risks, uncertainties and assumptions that are difficult to predict. These risks and uncertainties include, but are not
limited to, the performance of the Indian economy and of the economies of various international markets, the performance of the industry in India
and world-wide, competition, the company’s ability to successfully implement its strategy, the Company’s future levels of growth and expansion,
technological implementation, changes and advancements, changes in revenue, income or cash flows, the Company’s market preferences and its
exposure to market risks, as well as other risks. The Company’s actual results, levels of activity, performance or achievements could differ materially
and adversely from results expressed in or implied by this Presentation. The Company assumes no obligation to update any forward-looking
information contained in this Presentation. Any forward-looking statements and projections made by third parties included in this Presentation are
not adopted by the Company and the Company is not responsible for such third party statements and projections.

Table of Contents
3
01
02
03
04
05
Company Overview
Industry Overview
Business Overview
Financial Highlights
Way Ahead

Company Overview

About Us
5
World leader in Automotive Interactive Marketing Solutions▪ Founded in 1995▪ Global footprint with operations in 7 countries across Americas,
Europe and Asia; clients spread worldwide▪ Product Specialists in e-marketing solutions for automotive sector▪ Go-to provider of bespoke SaaS solutions for auto dealers targeted to
boost productivity and sales▪ Comprehensive repository of auto images, interactive media content
and VR products▪ Industry leader in software solutions for automotive e-marketing,
CRM and VR graphics
Rich Management Experience
▪ Experienced Management backed by diverse and skilled team with a right mix of operational & technical expertise combined with dedicated and skilled employee base
▪ Dynamic & rich experience across business verticals
Business Mix
▪ Automotive Solutions – Internet solutions to automotive industry worldwide, partnering with dealer & dealer groups, OEMs, finance, insurance, & leasing companies, and leading portals to deliver compelling marketing and customer experiences online
▪ Interactive Media Solutions – Offers world’s largest library of automotive images and animation, virtual brochures, video brochures with voice over, and state-of-the-art CGI graphics
▪ Enterprise Products – Provides packaged product solutions that meet enterprise requirements In connectivity, security and interoperability
Marquee Clients
▪ Automotive – PSA France (Peugeot Citroen), Sony Gaming, Mitsubishi Motors, Toyota, Ford, Lexus, Renault, Nissan, Hyundai, Siemens, Europcar, Avis, Jato, Hertz, Arval, GM, Vehicullum, MeinAuto.de, Lamirault, AutoSCOUT24, Mobilede, DME automotive, 12Auto, Autotrader, Multilease, Emil Frey, Stellantis (PSA Group) and Automotive.com
▪ Information Technology – Microsoft, Infosys, Wipro, Dataone, Rambus and IBM
▪ Telecommunication – Airtel and Idea

Our Journey so far…
6
1995
▪ Incorporated in 1995
1999
▪ Went public listed in 1999
2000
▪ Launched CRM BI/Suite with hummingbird
▪ Entered into an alliance with Cotelligent of USA
2002
▪ Launched izmo Cars with first Interactive Media Showroom for Automotive industry
2003
▪ Automation Inc. USA adopted then logix products izmocars as their internet Sales business Solution
2004▪ Strategic Tie-up with DCI
marketing Inc
2006▪ Emerged as leading provider of
Automotive Retail Solutions in US
2007
▪ Purchased CarSite- automotive portal business of PowerOne Media
▪ Acquired Reckon Up - CRM product from Prize Corporation
2008
▪ Entered European market with the establishment of Interactive Media Studio in Belgium in 2008
2009
▪ izmoCars acquired performance drive SVC
▪ Launched industry-first Accessory Visualizer and Sales platform – A.O.A.
2012 ▪ Expanded
by launch of Online Retail Platform in France, Spain, Italy & Portugal
2013 -15
▪ A.O.A becomes USA’s largest Accessories Platform for Dealer
▪ Divests A.O.A to Reynolds DMS▪ Name changed from Logix
Microsystem Ltd to IZMO Ltd
2016
▪ Introduced virtual reality (VR) products/services
2017
▪ Became largest provider of Interactive Media Content for Automotive globally -marquee clients like Microsoft, Toyota and rental car companies
▪ Launched FrogData, Auto Industry AI Platform
2018
▪ Enters Gaming Industry with CGI Solution
2019
▪ Largest provider of Web Solutions for Automotive in France with 18% market share
2020-21
▪ Launches es.autoworld.cars , Renault Used Car Portal in Spain to be followed by other countries
▪ Launches izmoEmporio, world’s first Interactive 3D showroom for Online Auto Retail

Core & Experienced Management
7
U.S.A. IndiaFrance
▪ Founder of Logix Microsystem later changed into IZMO▪ Over 17 years experience in automotive industry with several
publications in computer science▪ Postgraduate from IIM Bangalore
Mr. Sanjay Soni(MD & Promoter)
Mr. Tej Soni(President & Founder of izmocars, USA)
Rod Lampart(Director of Product, US-based)
Brian Wiklem(Director of CDGI/VR , US-based)
Chris Daniels(Director of Interactive Media, US-based)
Mr. Cedric BretonCommercial Director
Mr. Boris OlivieroDirector - Digital Solutions
Mr. Danish Reza(CS & Compliance Officer)
Mr. Gopi SD(Associate Director - Finance & Accounts)
Mr. Akula Satya Kiran(Head - Web Division)
Mr. Dipankar Kacharia(Head - AOA Division)
Mr. Sarbashish Bhattacharjee(Chief Technology Officer)
Mr. Srinivasan Vaidyanathan(VP Operations)
Mr. Ganesh Kumar B(Director - Engineering)
Mrs. Kiran Soni(Chief Financial Officer)

Key Strengths
8
01
05
07
02
04
06
08
03
Only Multinational / Multilingual Online Auto Retail Platform
Unique & Innovative Product & Service Offerings
Experienced Leadership with deep domain expertise
Highly-Profitable SaaS Platform with Annual Recurring Revenue (ARR)
revenue model
Growth driven by surge in Online Retail for Automotive
Proprietary methodology & process for CGI products & VR platform
Strong reputation and brand image among customers
Strong R&D Initiatives▪ Average annual spend of Rs. 10-12 cr
(>10% of revenue)

Industry Overview

Market Scenario
10
Sources: https://www.grandviewresearch.com/industry-analysis/business-software-services-markethttps://www.beroeinc.com/category-intelligence/digital-marketing-services-market/
Y
Business Software Market
▪ Global business software & services market valued at $389.86 billion in 2020 and forecasted to grow at CAGR of 11.3% during 2021-28
▪ Growing automation of business processes and increase in enterprise data are driving growth in this industry
▪ COVID-19 pandemic further expedited this growth as demand for SaaS based services and products increase across sectors
E-Marketing Industry
▪ Global digital marketing vertical valued at approximately $300 billion in 2019, and reached $330-340 billion in 2020, growing at CAGR of 12.8%
▪ Rising investments in online video and mobile advertising have fueled overall digital marketing expenditure in North America and Western Europe
▪ Mobile ad expenditure contributes to approximately 39-42% of digital spend in Western European markets such as the UK, Germany, and Spain and expected to have reach 55-60%
Automotive Dealer Market
11Sources: Company
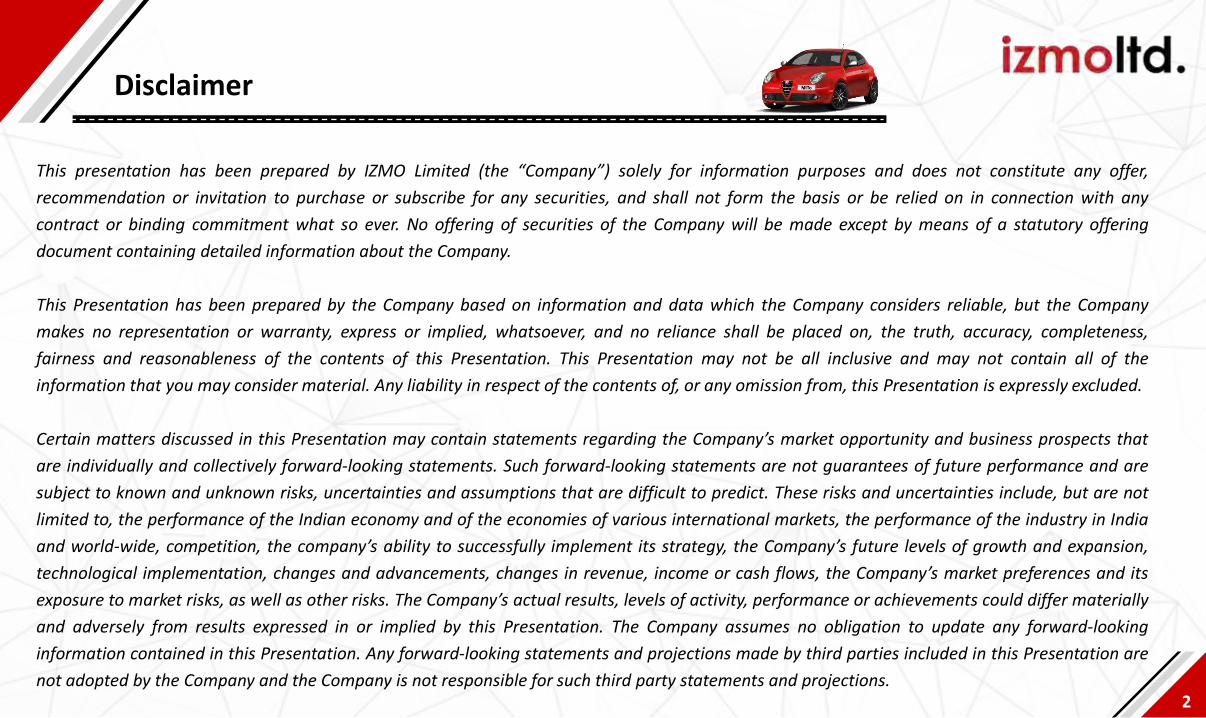
▪ Auto sales in 2018: 20 Million▪ Sales Revenue > $ 1 Trillion▪ No. of Car Dealers: 20,000▪ Avg. Dealership:
▪ $60M Sales/ Year▪ Employs 100 people▪ Monthly Marketing Spend: $600/car =
$60,000/month
▪ Base Platform Billing Per Dealer: $1,500 –$2,000/month
▪ Add Consulting: $500/month
▪ Add Derivative Products: $1,000/month
▪ Total: $3,500/month
▪ Market Size: $840 million
Auto Dealer Industry Size
Market Opportunity

Global Trends & US Automotive Sector
12Sources: Company
Prevailing Global Trends
▪ Strong growth in online Auto retail
▪ Interactive Media content fast
gaining popularity
▪ Online spend by Auto dealers on
rise
▪ Consumers demanding better
content before buying decision
▪ Very few players offering interactive
media content for automotive
US Auto Sector
▪ Total Dealerships: 16,682
▪ Total Advertising Spend: $9.2 billion
▪ Advertising Budget / Vehicle: $640
▪ Sales: 17.1 million / $1.02 Trillion
▪ Online Spend: 56% of total
▪ Average Annual Internet Spend/
Dealer: $310,127

Business Overview

Business Divisions
14
Online Auto Retail SolutionSpecialized e-marketing SaaS solution
for automotive traders
▪ Multinational presence with multilingual platform
▪ Recognized brand and domain experts since 2002
▪ Solid customer base with low churn
izmo CarsInteractive Media ProductsExhaustive library of automotive images, videos and animations
▪ Global Leader in Interactive Automotive Content
▪ Photography, CGI, Video, VR Studios
▪ Low-cost production center in India
izmo Studio
Big Data Platform for AutomotiveData Aggregation, analytics and Artificial
Intelligence (AI) services
▪ Most advanced platform for Automotive Data Analytics
▪ Integration with major platforms in the Industry
▪ Next Generation Ai applications
Frogdata
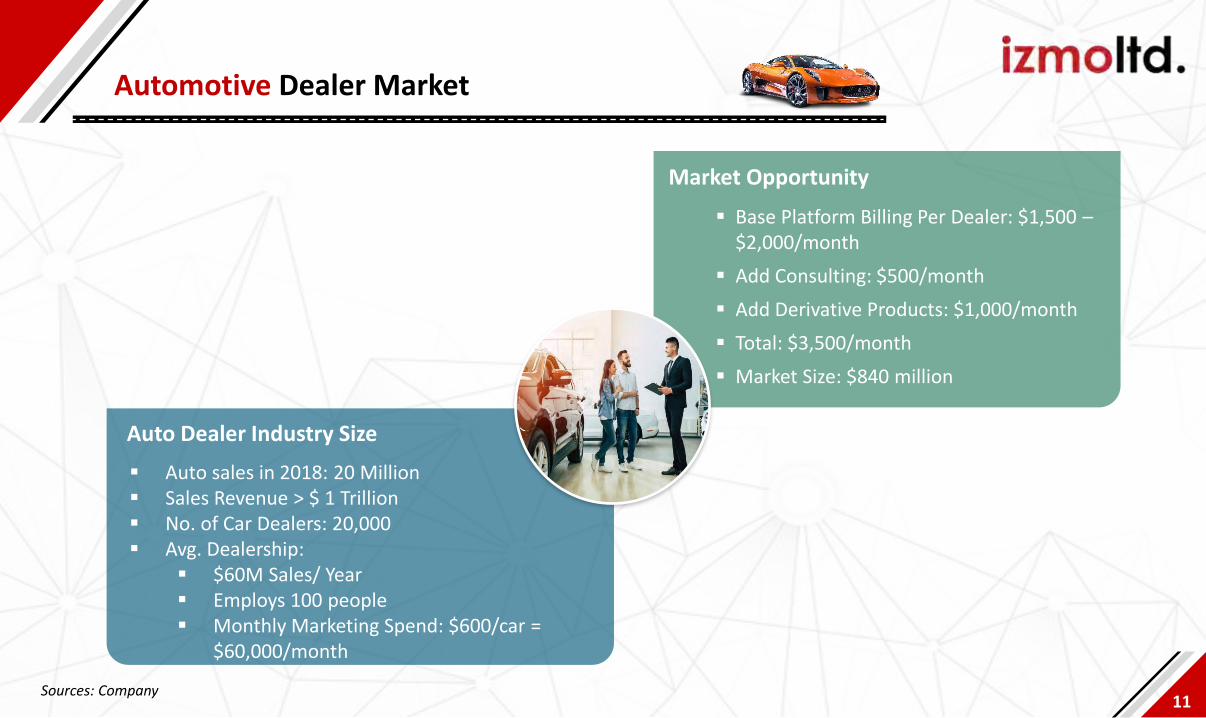
izmo Cars
15
Automotive Web Platform
▪ Multi-lingual Web Platform for Automotive
▪ Proprietary Automotive Web Platform for Tier I & II clients
▪ Largest provider in Mexico and France
▪ More than 2,000 dealers worldwide use izmoweb
▪ Clients include OEM Networks, Large & Small Dealer Groups
izmo Web
▪ Google Partner
▪ Comprehensive AdWords & Social
Media Marketing
▪ Verified Leads Program for lead
qualification
izmo TheAgency
▪ SaaS based Parts Distribution Sales & Marketing CRM
▪ Integration with major DMS systems
▪ PSA Alliance (Peugeot) Standard for Distributors
▪ Comprehensive platform for Parts Distribution Management
▪ Integration with major DMS systems in Europe
PartsVelocity CRM

izmo Studio
16
▪ Global Automotive Image Library
▪ #1 in Automotive Stock Images
▪ Tier 1 Client List
▪ 2% Client Churn
izmo Stock
▪ CGI Development Services
▪ 3D Virtual Showroom with
Accessories
▪ Kinetic CGI - Interactive Product
Experience Platform
izmo FX
▪ Automotive VR Platform
▪ izmoVR Lead Generation Kiosk
▪ Virtual Reality Experience Apps
izmo VR

FrogData
17
▪ Integrated with major DMS Systems
▪ Many Systems, One Dashboard
(DMS, CRM, Google, Service)
▪ Data Analytics Platform for Auto
Retail
FrogPlus Advanced Reporting Platform
▪ Normalization and migration
of DMS data
▪ Single Repository for all data
FrogData Lake – Data Repository for Dealers
▪ Next generation apps and
automation for dealers
▪ Alexa Apps, Pre-Pencil Tool, Service
Upsell enablement
FrogAI Factory

Other Key Products/Services
18
izmoEmporio3D CGI Virtual Showroom
izmoVRVirtual Car Test Drive
▪ High user engagement & conversion rate >90%
▪ Increased Online Sales
▪ Content available for all countries
▪ Unique product with no competition
▪ One line integration with any dealer website
▪ Low cost, high-volume production capacity
▪ New concept in Auto Retailing – Virtual Test Drives
▪ Innovative & Immersive User Experience
▪ One of the largest content library in the world, being repurposed for VR
▪ Build Content, Distribute, Monetize
▪ Easy to scale in any country
▪ Potential to launch in App Store for private viewing
▪ Facilitates better Lead generation for sales

Strong R&D Team
19
Developed WebGL based 3D Interactive Platform for personalization of cars with accessories
Developed CGI technology for Rapid 3D Modeling for Automotive using On-Site Laser Scanning and AI based modeling process
Developed AI Big Data Platform for Decision Analytics based on Integrated Data Model with Heuristic Algorithms for quick analysis Developed Used Car Price
Optimizer - AI based Used Car Pricing platform
Developed industry first CGI based Virtual Reality & Augmented Reality Platform for Auto Retailing
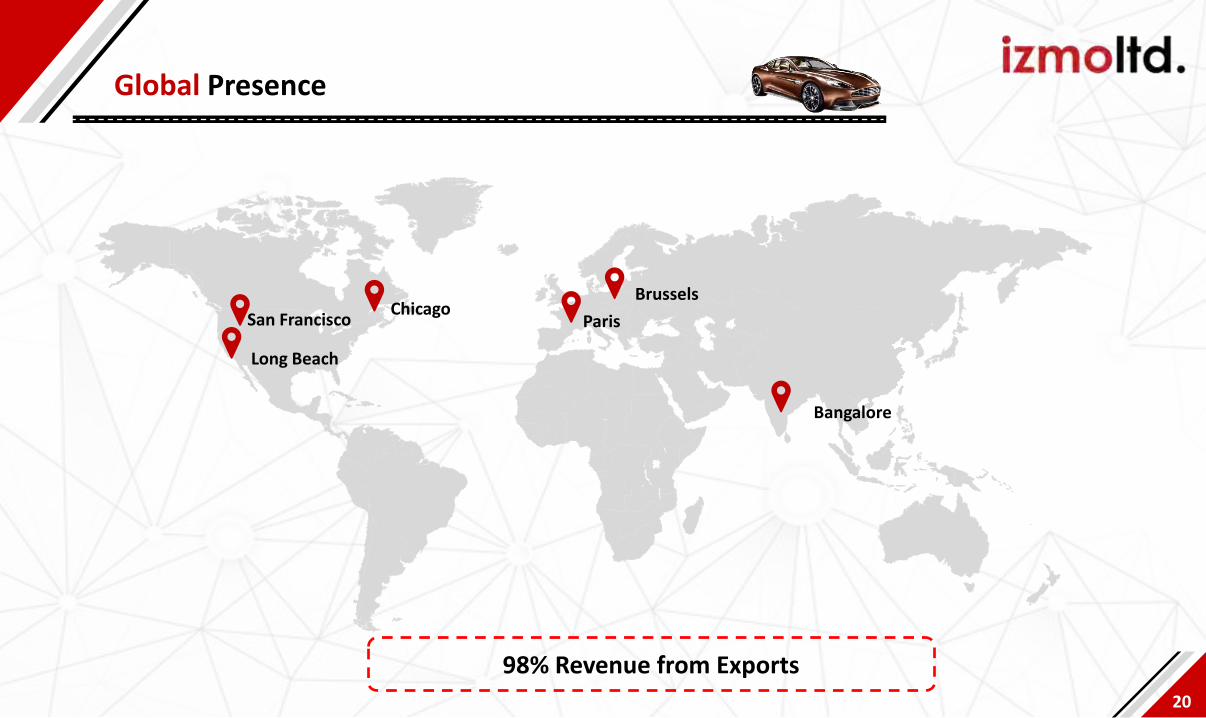
Global Presence
20
San FranciscoChicago
Bangalore
Brussels
Long Beach
Paris
98% Revenue from Exports

Marquee Clients
21

Recognition from Reputed News Entities
22
Economic Times ranked izmo Ltd. 71st in “India Growth Champions 2021” rankings list
Financial Times ranked izmo Ltd. 363rd in “High Growth Companies –Asia Pacific, 2021”

Consolidated Financial Highlights
Management Comment
24
“While the last financial year was stricken by the COVID pandemic impacting industriesworldwide, we have seen a strong recovery in global markets over the last few months in ourindustry. Despite the second wave hampering industries in several countries, overall marketscenario and consumer sentiment has been improving.
In the first quarter ended June 2021, we reported a 19.03% year-on-year rise in revenue at Rs.29.35 cr, with EBITDA and PAT at Rs. 4.93 cr and Rs. 1.71 cr, respectively. This represents ourCompany’s resilience, product appeal and geographical reach, which enables us to navigateturbulent market conditions and remain in an upward trajectory. New contracts and clientadditions in Europe & US boosted the top line. However, continued fixed expenses and salaryhikes given during the period had some bearing on the margins.
However, growth came in from existing as well as new customers, especially from the US market,many of which are moving operations online. The ongoing pandemic has expedited the shift ofbusiness operations to online platforms among many dealers across countries. Similar trend canbe witnessed among consumers as well, who are increasingly making their buying decisiononline. In this paradigm shift, digital content and SaaS products are playing a paramount role,and we see this reflected in the number of new contracts we have been getting.
In line with our strategy, we continue to invest in R&D and innovation to stay ahead of themarket. I would like to thank the entire team of izmo and all our stakeholders, for their untiringefforts and support, which drives the Company forward.”
Commenting on the results,
Mr. Sanjay Soni, Managing
Director, IZMO Ltd said :

Consolidated Quarterly Financial Highlights
25
5.22
17.54
13.93 13.08
4.93
21.16%
61.59%
48.75%
38.00%
16.79%
0%
10%
20%
30%
40%
50%
60%
70%
0
2
4
6
8
10
12
14
16
18
20
Q1 FY21 Q2 FY21 Q3 FY21 Q4 FY21 Q1 FY22
24.6528.48 28.58
34.4329.35
Q1 FY21 Q2 FY21 Q3 FY21 Q4 FY21 Q1 FY22
Revenue (Rs. Cr.)
PAT (Rs. Cr.) / Margin (%)EBITDA (incl. other income (Rs. Cr.) / Margin (%)
1.30
12.01
8.29
5.06
1.71
5.29%
42.16%
29.00%
14.70%
5.82%
0%
5%
10%
15%
20%
25%
30%
35%
40%
45%
0
2
4
6
8
10
12
14
Q1 FY21 Q2 FY21 Q3 FY21 Q4 FY21 Q1 FY22

Consolidated Quarterly Financial Highlights
26
Rs. Crs Q1 FY22 Q1 FY21 YoY% Q4 FY21
Income from Operations 29.35 24.65 34.43
Other Operating Income 0.00 0.00 0.00
Total Income from Operations 29.35 24.65 19.03% 34.43
Raw Material Expenses 0.10 0.16 0.79
Employee Cost 14.30 11.28 11.28
Other Costs 10.80 8.36 12.18
Total Expenditure 25.20 19.79 24.25
EBITDA (including other income) 4.93 5.22 (5.55%) 13.08
EBITDA Margin % 16.79% 21.16% (437 bps) 38.00%
Other Income 0.78 0.36 2.89
Depreciation 3.05 3.70 7.43
Interest 0.17 0.22 0.33
Profit Before Tax 1.71 1.30 5.32
Tax 0.00 0.00 0.26
Profit After Tax 1.71 1.30 31.04% 5.06
PAT Margin % 5.82% 5.29% 53 bps 14.70%
EPS in Rs. 1.30 1.00 30.00% 3.84
• Won 32 new contracts in Europe and 41 client additions in the US
• Revenue growth driven by new contracts and client additions in the US and Europe
• Continued fixed expenses and salary increments offered during quarter impacted margins

Consolidated Annual Financial Highlights – FY21 vs. FY20
27
Revenue from OperationsRs. 116.14 Crore
14.75%EBITDA (including other income)Rs. 49.77 Crore
74.11%EBITDA Margin42.85%
1461 bps
139.05%PATRs. 26.66 Crore
1193 bpsPAT Margin 22.95%
138.92%Basic EPSRs. 20.38

Consolidated Annual Financial Highlights – FY21
28
Rs. Crs FY21 FY20 YoY %
Income from Operations 116.14 101.21
Other Operating Income 0.00 0.00
Total Income from Operations 116.14 101.21 14.75%
Raw Material Expenses 2.19 0.43
Employee Cost 46.76 44.19
Other Costs 40.22 36.48
Total Expenditure 89.17 81.10
EBITDA (including other income) 49.77 28.59 74.11%
EBITDA Margin % 42.85% 28.24% 1,461 bps
Other Income 22.80 8.47
Depreciation 22.06 15.62
Interest 0.87 1.04
Profit Before Tax 26.84 11.93
Tax 0.18 0.78
Profit After Tax 26.66 11.15 139.05%
PAT Margin % 22.95% 11.02% 1,193 bps
EPS in Rs. 20.38 8.53 138.92%
• Strong growth driven by
rising demand from new
and existing customers
• Increasing number of
customers moving
operations online
• Stringent control on
costs supported growth
in profit margins

Interactive Media
Licensing35%
Digital Web Services
42%
CRM5%
Data Analytics SaaS4%
Recurring Services9%
Others5%
Consolidated Segmental Revenue – FY21 vs. FY20
29
By Product
By Geography
Interactive Media
Licensing32%
Digital Web Services
33%
CRM3%
Data Analytics
SaaS9%
Recurring Services
6%
Others17%
US75%
Europe23%
India2%
FY20
FY20
FY21
US65%
Europe32%
India3% FY21
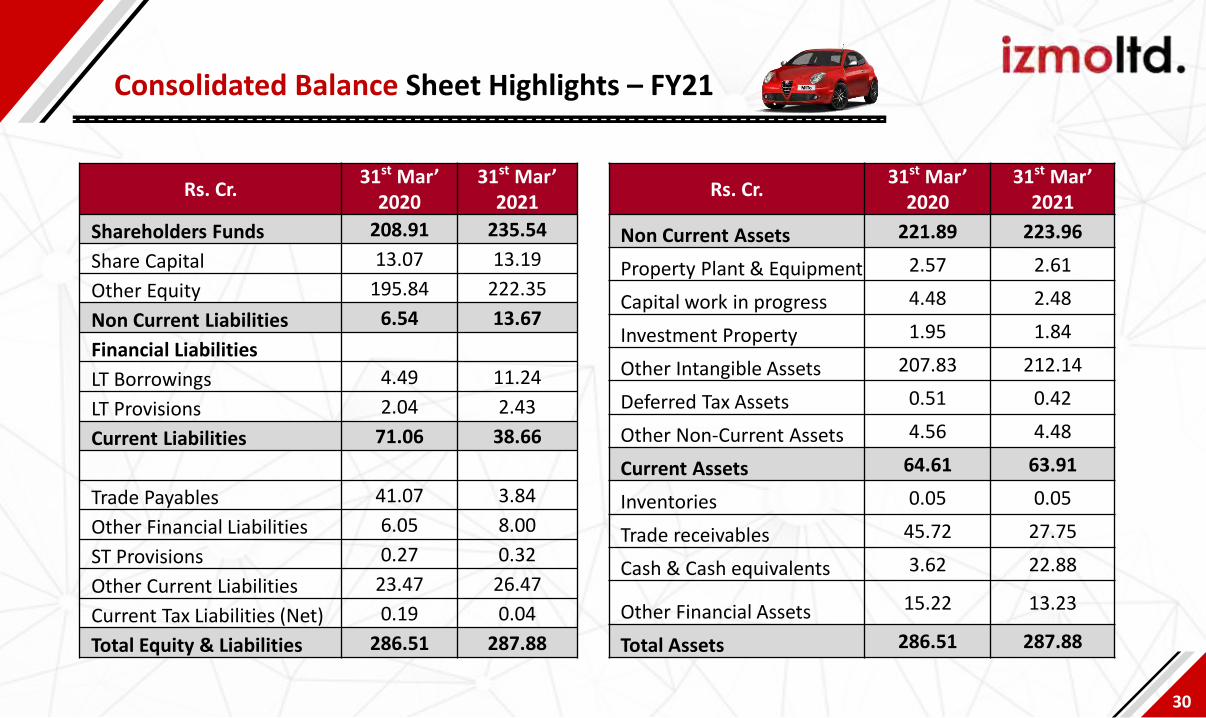
Consolidated Balance Sheet Highlights – FY21
30
Rs. Cr.31st Mar’
202031st Mar’
2021
Shareholders Funds 208.91 235.54
Share Capital 13.07 13.19
Other Equity 195.84 222.35
Non Current Liabilities 6.54 13.67
Financial Liabilities
LT Borrowings 4.49 11.24
LT Provisions 2.04 2.43
Current Liabilities 71.06 38.66
Trade Payables 41.07 3.84
Other Financial Liabilities 6.05 8.00
ST Provisions 0.27 0.32
Other Current Liabilities 23.47 26.47
Current Tax Liabilities (Net) 0.19 0.04
Total Equity & Liabilities 286.51 287.88
Rs. Cr.31st Mar’
202031st Mar’
2021
Non Current Assets 221.89 223.96
Property Plant & Equipment 2.57 2.61
Capital work in progress 4.48 2.48
Investment Property 1.95 1.84
Other Intangible Assets 207.83 212.14
Deferred Tax Assets 0.51 0.42
Other Non-Current Assets 4.56 4.48
Current Assets 64.61 63.91
Inventories 0.05 0.05
Trade receivables 45.72 27.75
Cash & Cash equivalents 3.62 22.88
Other Financial Assets 15.22 13.23
Total Assets 286.51 287.88

Way Ahead

Way Ahead
32
Focus on Growing Existing Products in Existing Geographies
▪ izmoStudio – Driven by growth in online auto sales
▪ izmocars – French market continues to grow
▪ FrogData – Data Analytics boom fuels growth
Focus on Existing Products in New Geographies
▪ izmoweb to be re-introduced in USA
▪ Full Suite Digital Solutions in Germany, Spain & Switzerland
Focus on New Products in Existing Geographies
▪ izmoEmporio - 3D Virtual Showroom for dealers – US/ EU
▪ izmoVR – VR Lead Generation Platform for Automotive
▪ Kinetic CGI – CGI Product Visualization
Expanding Data Repository and Auto Dealers Subscriptions
▪ Focus on updating repository of data with latest and
state-of-the-art imagery and information

For further information, please contact:
Ms Savli Mangle/ Mr Rahul TrivediBridge Investor Relations Pvt. Ltd.Email: [email protected], [email protected] : www.bridge-ir.com
Thank You
Related Documents