IX Mathematics C.B.S.E. Practice Papers Page 81 11. Constructions Q 1 Draw an angle of 135 using ruler and compasses only. Marks (2) Q 2 Draw a line segment of length 8 cm. Bisect it and measure the length of each part. Marks (3) Q 3 Construct an equilateral triangle whose altitude is 4 cm. Marks (3) Q 4 Constructed a triangle ABC in which AB = 5.8 cm BC+CA = 8.4 cm and B = 60 degree. Marks (3) Q 5 Construct a triangle ABC in which BC = 3.4 cm , AB–AC = 1.5 cm and B = 45 . Marks (3) Q 6 Construct an equilateral triangle whose altitude is 5 cm. Marks (3) Q 7 Construct a triangle ABC in which AB = 5.8 cm , BC + CA = 8.4 cm and B = 45°. Marks (4) Q 8 Construct a right angled triangle whose base is 5 cm and sum of its hypotenuse and other side is 8 cm. Marks (4) Q 9 Construct a triangle ABC in which BC = 3.4 cm , AB – AC = 1.5 cm and B = 30°. Marks (4) Q 10 Write the steps of constructions for a triangle ABC whose perimeter and two base angles B and C are given.Marks (4) Q 11 Using ruler and compasses only, construct a triangle ABC from the following data AB+BC+CA = 12 cm B = 45 and C= 60. Marks (4) Most Important Questions Q 1 Q 2 Construct an angle 45° at the initial point of a line segment PQ of length 6 cm. Q 3 Construct an angle 30° at the initial point of a line segment PQ of length 4 cm. Q 4 Construct an angle 15° at the initial point of a line segment PQ of length 6 cm. Q 5 Construct an angle 105° at the initial point of a line segment PQ of length 4 cm. Q 6 Construct an angle 135° at the initial point of a line segment PQ of length 5 cm. Q 7 Construct an angle 22 ° at the initial point of a line segment PQ of length 7 cm. Q 8 Construct an angle 75° at the initial point of a line segment PQ of length 5 cm. Q 9 Construct a triangle PQR, in which PQ Q 10 Construct a triangle PQR, in which PQ = 6 cm P = 45° and PR + RQ = 10 cm. Q 11 Construct a triangle PQR, in which PQ = 8 cm, P = 45° and PR – RQ = 3 cm. Q 12 Construct a triangle PQR, in which PQ = 7cm, P = 60° and RQ – PR = 2.5 cm. Q 13 Q 14 Construct a triangle PQR, in which PQ = 7cm, P = 30° and PR – RQ = 2 cm. Q 15 Construct a similar triangle PQR, in which P = 30° and Q = 60° and PR + RQ + QP = 12 cm. Q 16 Construct a triangle PQR, in which P = 45° and Q = 60° and PR + RQ + QP = 9 cm. Downloaded from www.studiestoday.com Downloaded from www.studiestoday.com www.studiestoday.com

Welcome message from author
This document is posted to help you gain knowledge. Please leave a comment to let me know what you think about it! Share it to your friends and learn new things together.
Transcript
IX Mathematics C.B.S.E. Practice Papers Page 81
11. Constructions
Q 1 Draw an angle of 135 using ruler and compasses only.
Marks (2)
Q 2 Draw a line segment of length 8 cm. Bisect it and measure the length of each part.
Marks (3)
Q 3 Construct an equilateral triangle whose altitude is 4 cm.
Marks (3)
Q 4 Constructed a triangle ABC in which AB = 5.8 cm BC+CA = 8.4 cm and B = 60 degree.
Marks (3)
Q 5 Construct a triangle ABC in which BC = 3.4 cm , AB–AC = 1.5 cm and B = 45 .
Marks (3)
Q 6 Construct an equilateral triangle whose altitude is 5 cm.
Marks (3)
Q 7 Construct a triangle ABC in which AB = 5.8 cm , BC + CA = 8.4 cm and B = 45°.
Marks (4)
Q 8 Construct a right angled triangle whose base is 5 cm and sum of its hypotenuse and other side is 8 cm. Marks (4)
Q 9 Construct a triangle ABC in which BC = 3.4 cm , AB – AC = 1.5 cm and B = 30°. Marks (4)
Q 10 Write the steps of constructions for a triangle ABC whose perimeter and two base angles B and C are given.Marks (4)
Q 11 Using ruler and compasses only, construct a triangle ABC from the following data AB+BC+CA = 12 cm B = 45 and
C= 60. Marks (4)
Most Important Questions
Q 1 Q 2 Construct an angle 45° at the initial point of a line segment PQ of length 6 cm.
Q 3 Construct an angle 30° at the initial point of a line segment PQ of length 4 cm.
Q 4 Construct an angle 15° at the initial point of a line segment PQ of length 6 cm.
Q 5 Construct an angle 105° at the initial point of a line segment PQ of length 4 cm.
Q 6 Construct an angle 135° at the initial point of a line segment PQ of length 5 cm.
Q 7 Construct an angle 22 ° at the initial point of a line segment PQ of length 7 cm.
Q 8 Construct an angle 75° at the initial point of a line segment PQ of length 5 cm.
Q 9 Construct a triangle PQR, in which PQ
Q 10 Construct a triangle PQR, in which PQ = 6 cm P = 45° and PR + RQ = 10 cm.
Q 11 Construct a triangle PQR, in which PQ = 8 cm, P = 45° and PR – RQ = 3 cm.
Q 12 Construct a triangle PQR, in which PQ = 7cm, P = 60° and RQ – PR = 2.5 cm.
Q 13 Q 14 Construct a triangle PQR, in which PQ = 7cm, P = 30° and PR – RQ = 2 cm.
Q 15 Construct a similar triangle PQR, in which P = 30° and Q = 60° and PR + RQ + QP = 12 cm.
Q 16 Construct a triangle PQR, in which P = 45° and Q = 60° and PR + RQ + QP = 9 cm.
Downloaded from www.studiestoday.com
Downloaded from www.studiestoday.com
www.stu
dies
toda
y.co
m
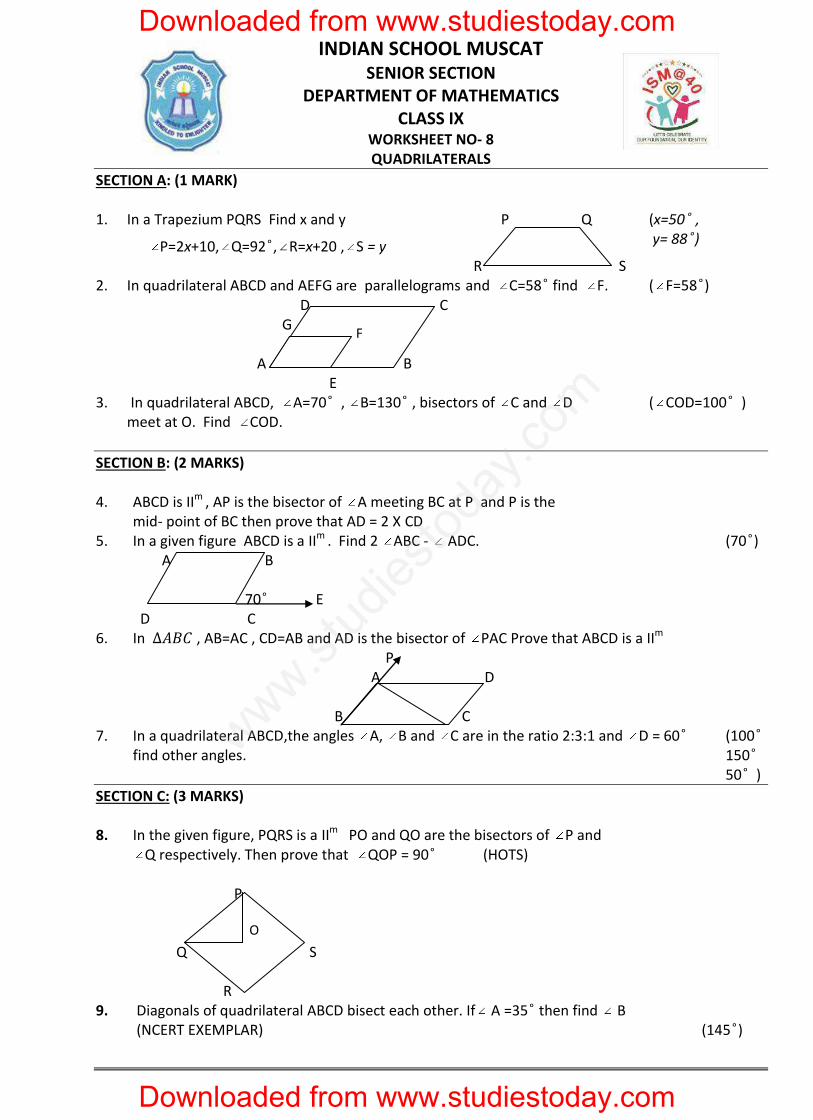
INDIAN SCHOOL MUSCAT
SENIOR SECTION
DEPARTMENT OF MATHEMATICS
CLASS IX WORKSHEET NO- 8
QUADRILATERALS
SECTION A: (1 MARK)
1. In a Trapezium PQRS Find x and y P Q
P=2x+10, Q=92 ͦ, R=x+20 , S = y
R S
(x=50 ͦ ,
y= 88 ͦ)
2. In quadrilateral ABCD and AEFG are parallelograms and C=58 ͦ find F.
D C
G
A B
E
( F=58 ͦ)
3. In quadrilateral ABCD, A=70 ͦ , B=130 ͦ , bisectors of C and D
meet at O. Find COD.
( COD=100 ͦ )
SECTION B: (2 MARKS)
4. ABCD is IIm
, AP is the bisector of A meeting BC at P and P is the
mid- point of BC then prove that AD = 2 X CD
5. In a given figure ABCD is a IIm
. Find 2 ABC - ADC.
A B
70 ͦ E
D C
(70 ͦ)
6. In ∆ , AB=AC , CD=AB and AD is the bisector of PAC Prove that ABCD is a IIm
P
A D
B C
7. In a quadrilateral ABCD,the angles A, B and C are in the ratio 2:3:1 and D = 60 ͦ
find other angles.
(100 ͦ
150 ͦ
50 ͦ ) SECTION C: (3 MARKS)
8. In the given figure, PQRS is a IIm
PO and QO are the bisectors of P and
Q respectively. Then prove that QOP = 90 ͦ (HOTS)
P
Q S
R
9. Diagonals of quadrilateral ABCD bisect each other. If A =35 ͦ then find B
(NCERT EXEMPLAR)
(145 ͦ)
F
O
Downloaded from www.studiestoday.com
Downloaded from www.studiestoday.com
www.stu
dies
toda
y.co
m
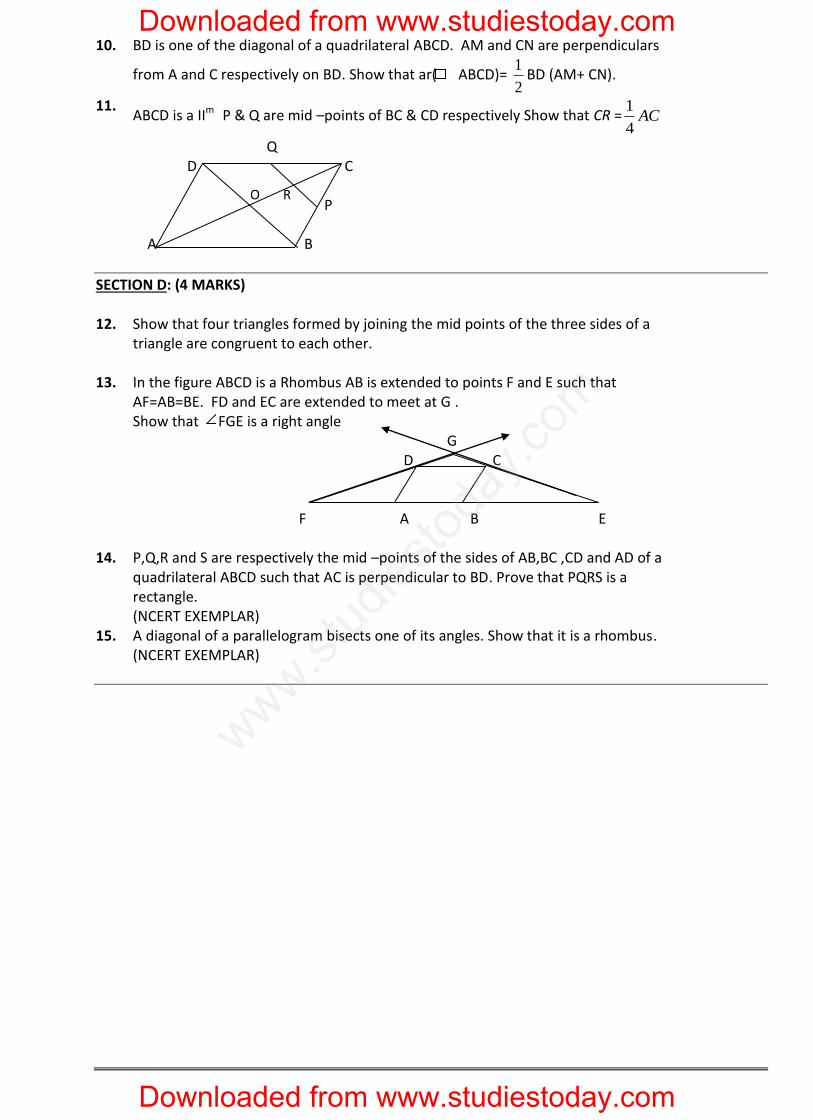
10. BD is one of the diagonal of a quadrilateral ABCD. AM and CN are perpendiculars
from A and C respectively on BD. Show that ar( ABCD)= 2
1BD (AM+ CN).
11. ABCD is a II
m P & Q are mid –points of BC & CD respectively Show that CR = AC
4
1
Q
D C
P
A B
SECTION D: (4 MARKS)
12. Show that four triangles formed by joining the mid points of the three sides of a
triangle are congruent to each other.
13. In the figure ABCD is a Rhombus AB is extended to points F and E such that
AF=AB=BE. FD and EC are extended to meet at G .
Show that FGE is a right angle
G
D C
F A B E
14. P,Q,R and S are respectively the mid –points of the sides of AB,BC ,CD and AD of a
quadrilateral ABCD such that AC is perpendicular to BD. Prove that PQRS is a
rectangle.
(NCERT EXEMPLAR)
15. A diagonal of a parallelogram bisects one of its angles. Show that it is a rhombus.
(NCERT EXEMPLAR)
O R
Downloaded from www.studiestoday.com
Downloaded from www.studiestoday.com
www.stu
dies
toda
y.co
m
IX Mathematics C.B.S.E. Practice Papers Page 58
8. Quadrilaterals Q 1 Name a quadrilateral whose each pair of opposite sides is equal.
Mark (1)
Q 2 What is the sum of two consecutive angles in a parallelogram?
Mark (1)
Q 3 The angles of quadrilateral are respectively 100 , 30 , 92 and x. Find the value of x.
Marks (2)
Q 4 The angles of quadrilateral are in the ratio 3:5:9:13. Find all the angles of the quadrilateral.
Marks (2)
Q 5 Thee sides AB and CD of a parallelogram ABCD are
bisected at E and F. Prove that EBFD is a parallelogram.
Marks (2)
Q 6 In a triangle ABC, P,Q and R are the mid – points of sides BC, CA and AB respectively.
If AC = 21 cm, BC = 29 cm and AB = 30 cm, find the perimeter of the quadrilateral ARPQ.
Marks (2)
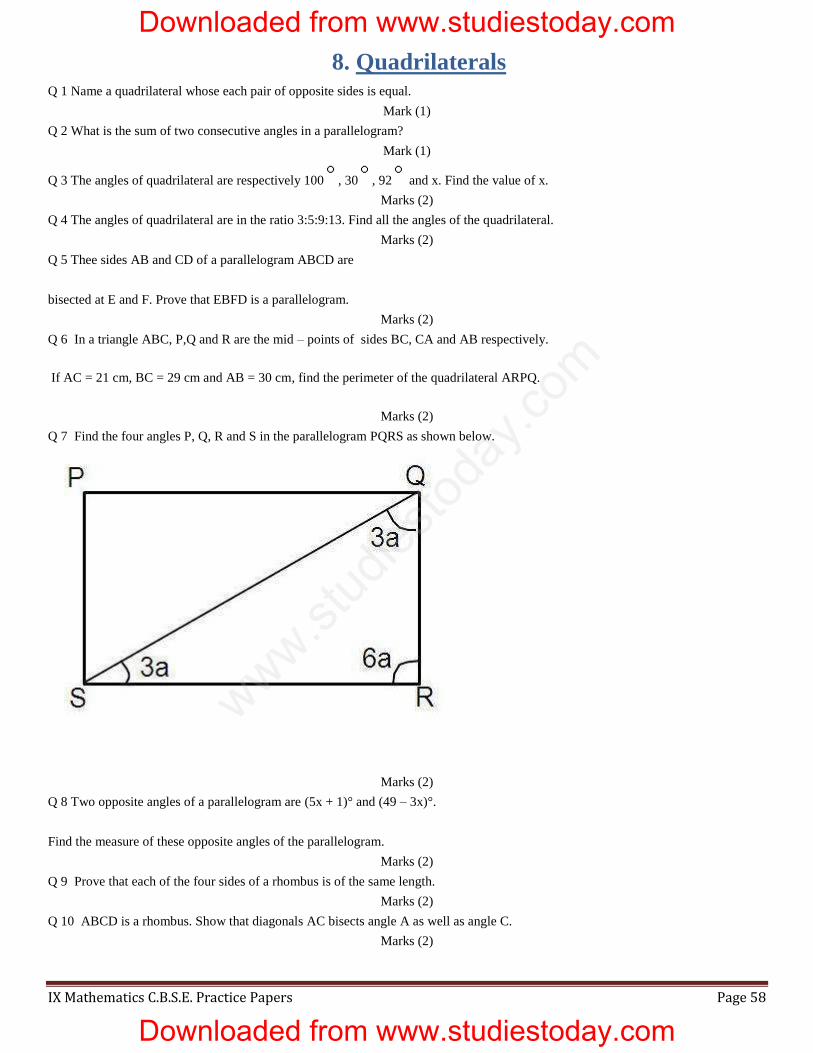
Q 7 Find the four angles P, Q, R and S in the parallelogram PQRS as shown below.
Marks (2)
Q 8 Two opposite angles of a parallelogram are (5x + 1)° and (49 – 3x)°.
Find the measure of these opposite angles of the parallelogram.
Marks (2)
Q 9 Prove that each of the four sides of a rhombus is of the same length.
Marks (2)
Q 10 ABCD is a rhombus. Show that diagonals AC bisects angle A as well as angle C.
Marks (2)
Downloaded from www.studiestoday.com
Downloaded from www.studiestoday.com
www.stu
dies
toda
y.co
m
IX Mathematics C.B.S.E. Practice Papers Page 59
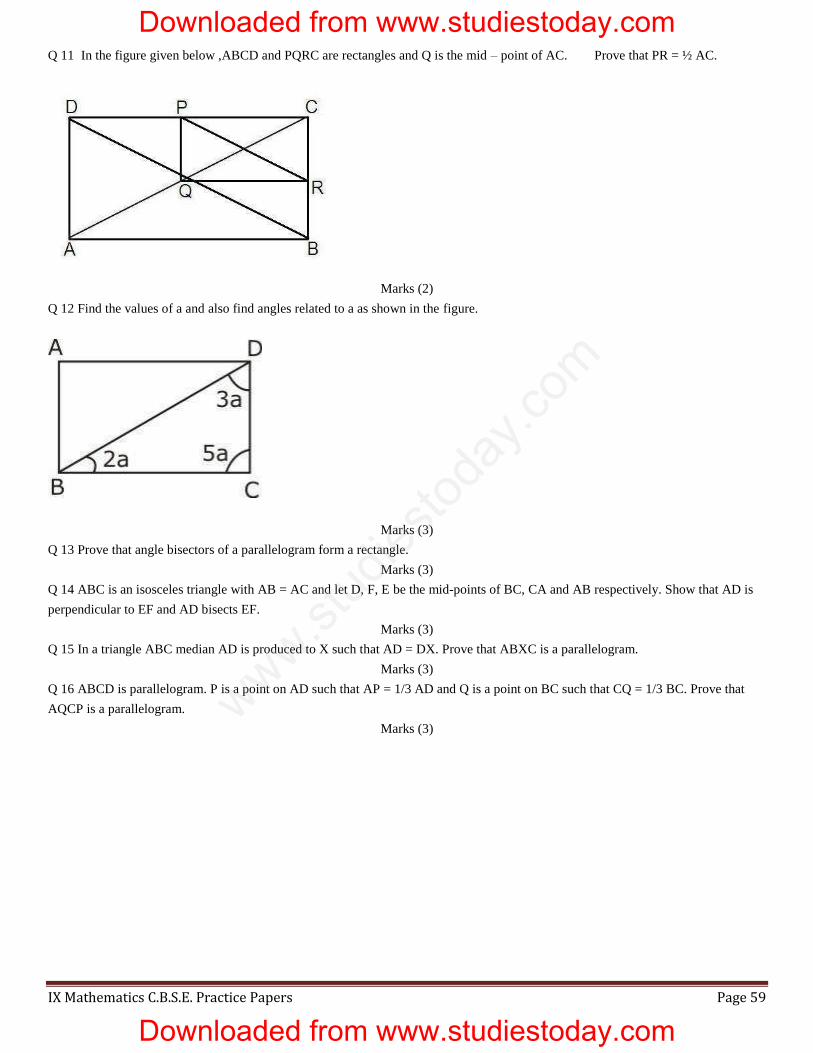
Q 11 In the figure given below ,ABCD and PQRC are rectangles and Q is the mid – point of AC. Prove that PR = ½ AC.
Marks (2)
Q 12 Find the values of a and also find angles related to a as shown in the figure.
Marks (3)
Q 13 Prove that angle bisectors of a parallelogram form a rectangle.
Marks (3)
Q 14 ABC is an isosceles triangle with AB = AC and let D, F, E be the mid-points of BC, CA and AB respectively. Show that AD is
perpendicular to EF and AD bisects EF.
Marks (3)
Q 15 In a triangle ABC median AD is produced to X such that AD = DX. Prove that ABXC is a parallelogram.
Marks (3)
Q 16 ABCD is parallelogram. P is a point on AD such that AP = 1/3 AD and Q is a point on BC such that CQ = 1/3 BC. Prove that
AQCP is a parallelogram.
Marks (3)
Downloaded from www.studiestoday.com
Downloaded from www.studiestoday.com
www.stu
dies
toda
y.co
m
IX Mathematics C.B.S.E. Practice Papers Page 60
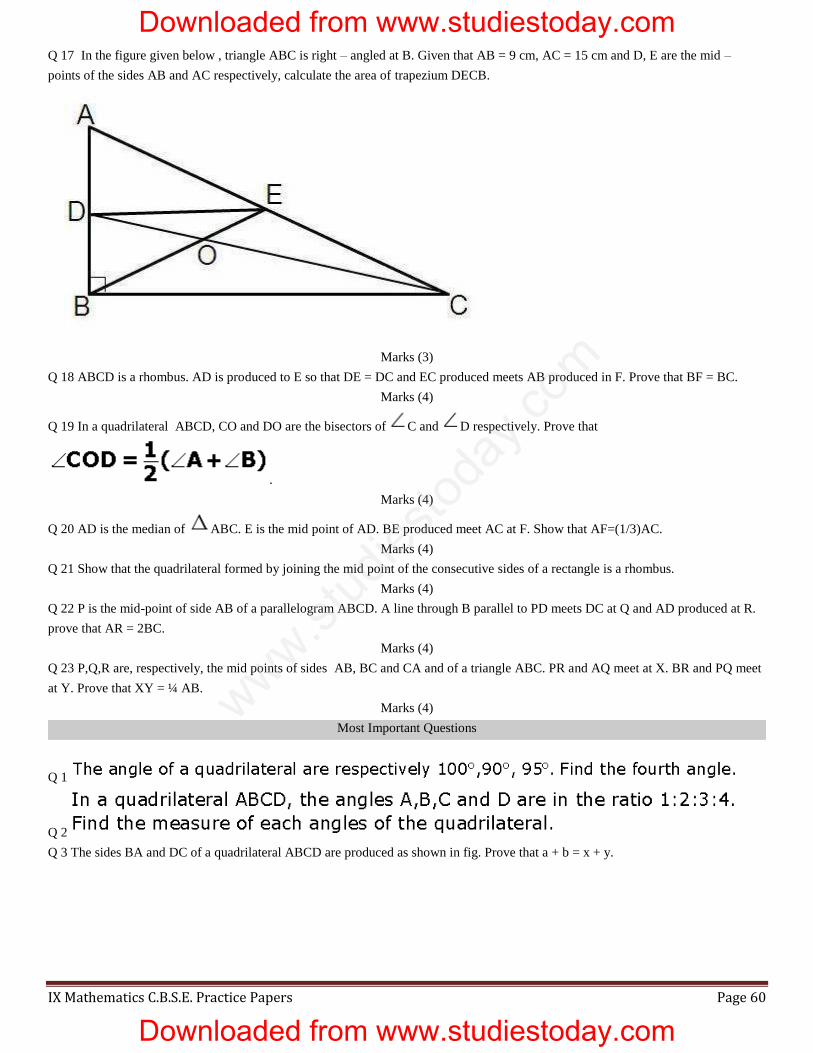
Q 17 In the figure given below , triangle ABC is right – angled at B. Given that AB = 9 cm, AC = 15 cm and D, E are the mid – points of the sides AB and AC respectively, calculate the area of trapezium DECB.
Marks (3)
Q 18 ABCD is a rhombus. AD is produced to E so that DE = DC and EC produced meets AB produced in F. Prove that BF = BC.
Marks (4)
Q 19 In a quadrilateral ABCD, CO and DO are the bisectors of C and D respectively. Prove that
.
Marks (4)
Q 20 AD is the median of ABC. E is the mid point of AD. BE produced meet AC at F. Show that AF=(1/3)AC.
Marks (4)
Q 21 Show that the quadrilateral formed by joining the mid point of the consecutive sides of a rectangle is a rhombus.
Marks (4)
Q 22 P is the mid-point of side AB of a parallelogram ABCD. A line through B parallel to PD meets DC at Q and AD produced at R.
prove that AR = 2BC.
Marks (4)
Q 23 P,Q,R are, respectively, the mid points of sides AB, BC and CA and of a triangle ABC. PR and AQ meet at X. BR and PQ meet
at Y. Prove that XY = ¼ AB.
Marks (4)
Most Important Questions
Q 1
Q 2
Q 3 The sides BA and DC of a quadrilateral ABCD are produced as shown in fig. Prove that a + b = x + y.
Downloaded from www.studiestoday.com
Downloaded from www.studiestoday.com
www.stu
dies
toda
y.co
m
IX Mathematics C.B.S.E. Practice Papers Page 61
Q 4 The angles of a quadrilateral are in the ratio 3 : 5 : 9 : 13. Find all the angles of the quadrilateral.
Q 5
Q 6 In a parallelogram ABCD, prove that sum of any two consecutive angles is 1800.
Q 7
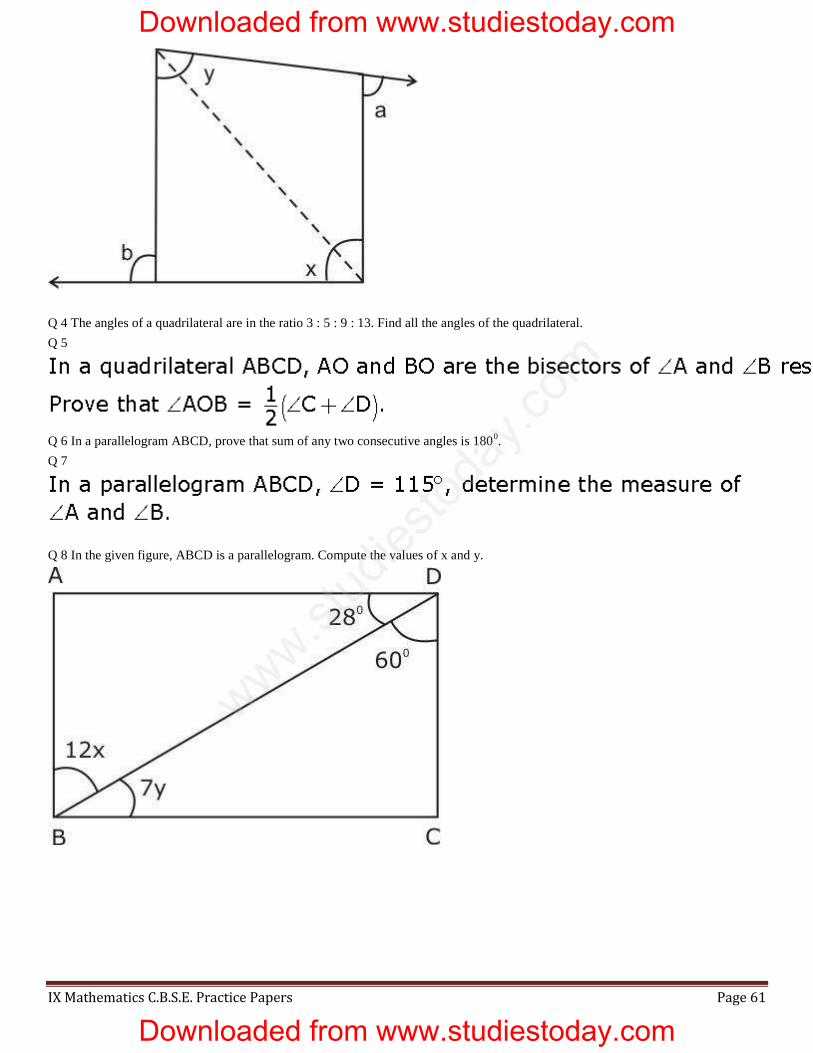
Q 8 In the given figure, ABCD is a parallelogram. Compute the values of x and y.
Downloaded from www.studiestoday.com
Downloaded from www.studiestoday.com
www.stu
dies
toda
y.co
m
IX Mathematics C.B.S.E. Practice Papers Page 62
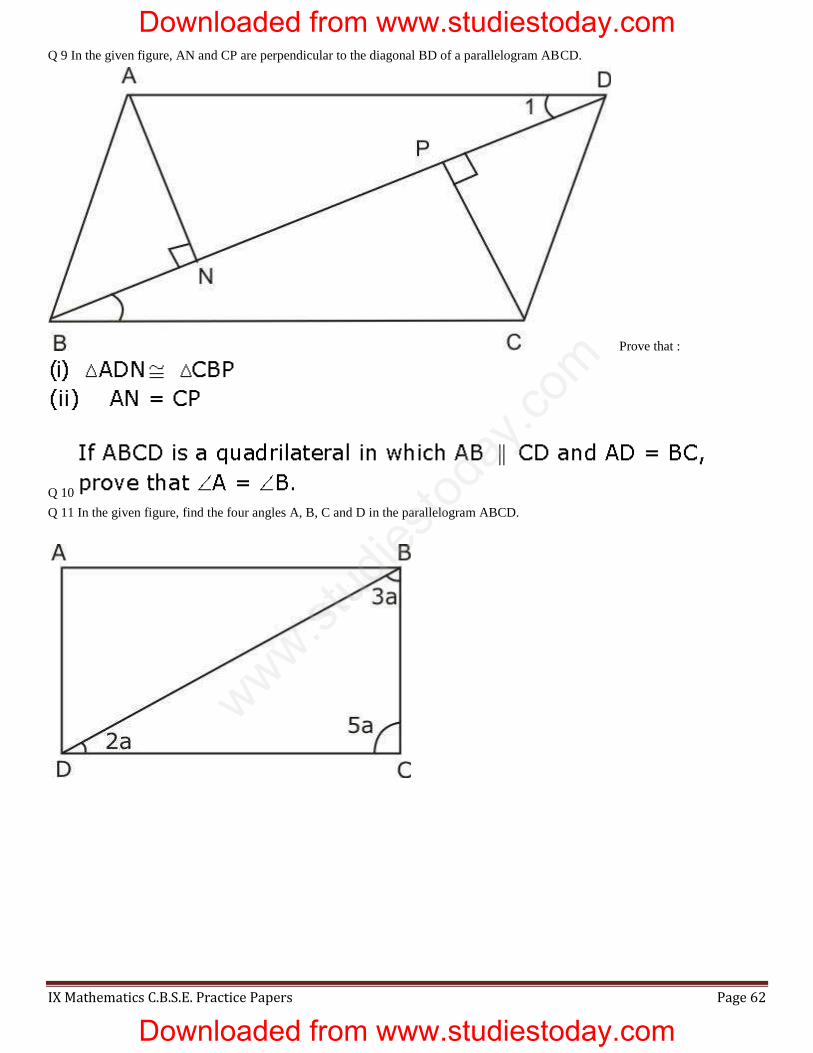
Q 9 In the given figure, AN and CP are perpendicular to the diagonal BD of a parallelogram ABCD.
Prove that :
Q 10
Q 11 In the given figure, find the four angles A, B, C and D in the parallelogram ABCD.
Downloaded from www.studiestoday.com
Downloaded from www.studiestoday.com
www.stu
dies
toda
y.co
m
IX Mathematics C.B.S.E. Practice Papers Page 63
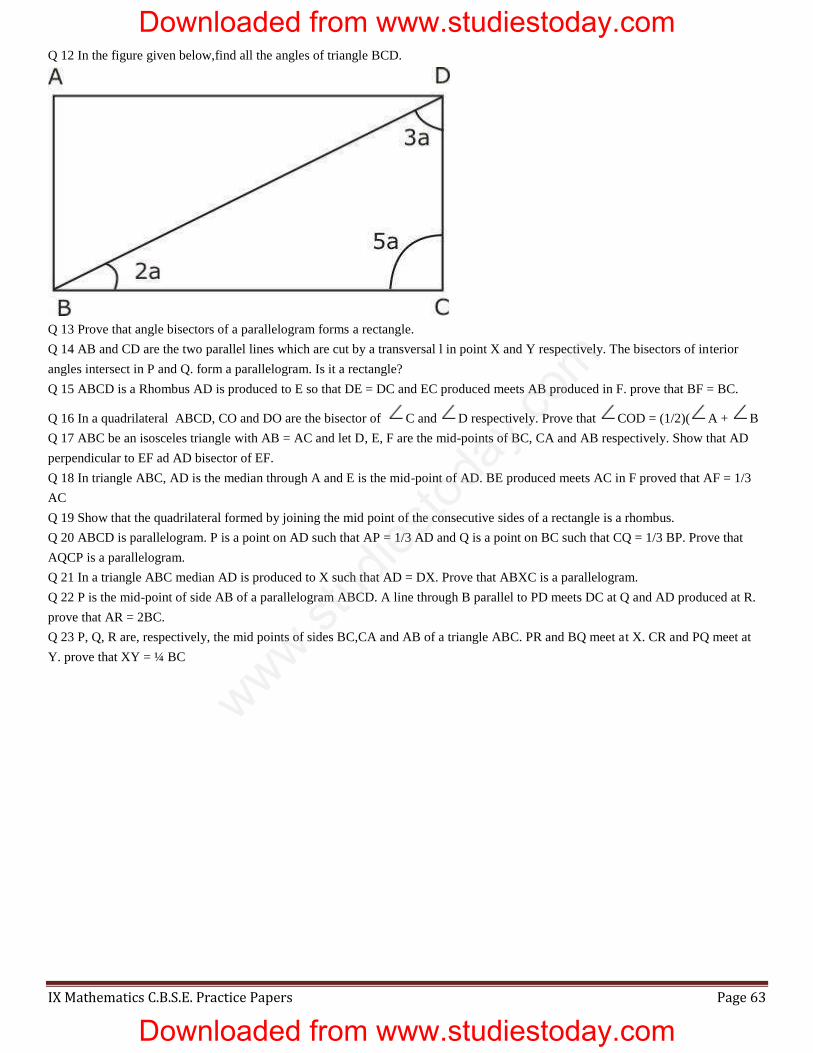
Q 12 In the figure given below,find all the angles of triangle BCD.
Q 13 Prove that angle bisectors of a parallelogram forms a rectangle.
Q 14 AB and CD are the two parallel lines which are cut by a transversal l in point X and Y respectively. The bisectors of interior
angles intersect in P and Q. form a parallelogram. Is it a rectangle?
Q 15 ABCD is a Rhombus AD is produced to E so that DE = DC and EC produced meets AB produced in F. prove that BF = BC.
Q 16 In a quadrilateral ABCD, CO and DO are the bisector of C and D respectively. Prove that COD = (1/2)( A + B
Q 17 ABC be an isosceles triangle with AB = AC and let D, E, F are the mid-points of BC, CA and AB respectively. Show that AD
perpendicular to EF ad AD bisector of EF.
Q 18 In triangle ABC, AD is the median through A and E is the mid-point of AD. BE produced meets AC in F proved that AF = 1/3
AC
Q 19 Show that the quadrilateral formed by joining the mid point of the consecutive sides of a rectangle is a rhombus.
Q 20 ABCD is parallelogram. P is a point on AD such that AP = 1/3 AD and Q is a point on BC such that CQ = 1/3 BP. Prove that
AQCP is a parallelogram.
Q 21 In a triangle ABC median AD is produced to X such that AD = DX. Prove that ABXC is a parallelogram.
Q 22 P is the mid-point of side AB of a parallelogram ABCD. A line through B parallel to PD meets DC at Q and AD produced at R.
prove that AR = 2BC.
Q 23 P, Q, R are, respectively, the mid points of sides BC,CA and AB of a triangle ABC. PR and BQ meet at X. CR and PQ meet at
Y. prove that XY = ¼ BC
Downloaded from www.studiestoday.com
Downloaded from www.studiestoday.com
www.stu
dies
toda
y.co
m
IX Mathematics C.B.S.E. Practice Papers Page 94
14. Statistics Q 1 Define array or arrayed data.
Mark (1)
Q 2 Define frequency.
Mark (1)
Q 3 Write the relation between class mark, lower limit and upper limit of a class interval.
Mark (1)
Q 4 Define primary data.
Marks (2)
Q 5 Define secondary data. How it is differ from the primary data?
Marks (2)
Q 6 Find the mode of the following data :
Marks Number of students
48 4
49 10
50 12
51 10
52 10
How many students are there whose marks are less than the modal value?
Marks (2)
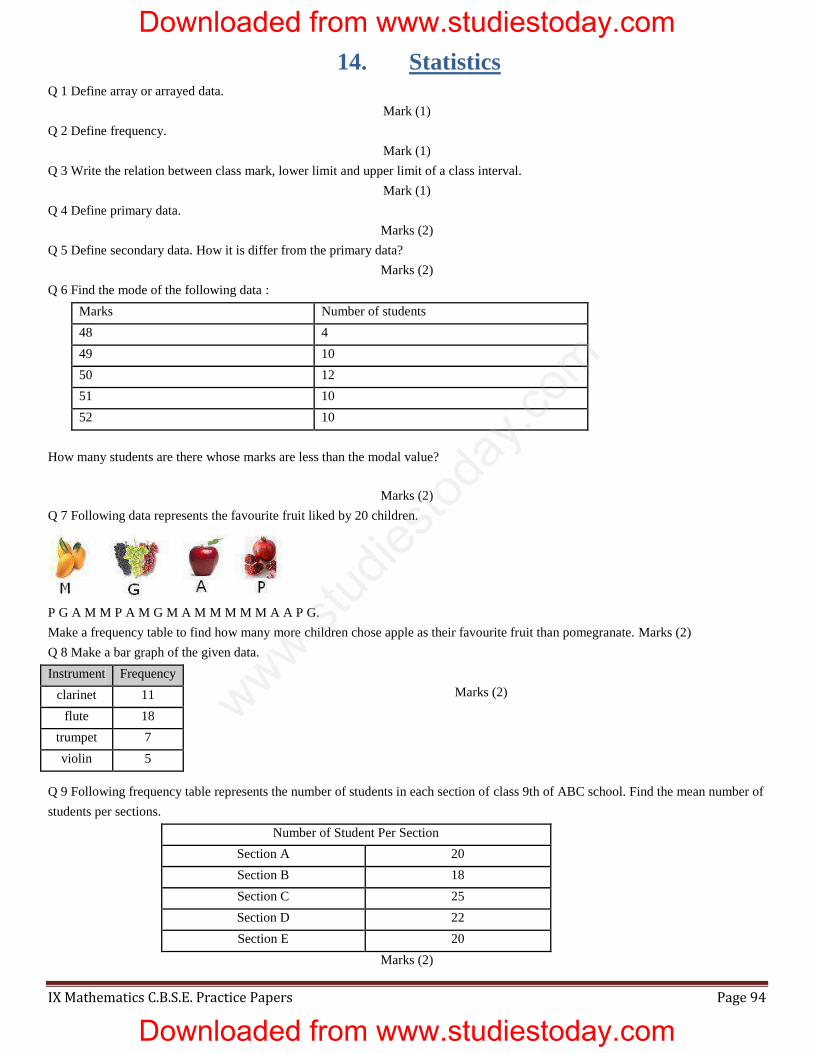
Q 7 Following data represents the favourite fruit liked by 20 children.
P G A M M P A M G M A M M M M M A A P G.
Make a frequency table to find how many more children chose apple as their favourite fruit than pomegranate. Marks (2)
Q 8 Make a bar graph of the given data.
Marks (2)
Q 9 Following frequency table represents the number of students in each section of class 9th of ABC school. Find the mean number of
students per sections.
Number of Student Per Section
Section A 20
Section B 18
Section C 25
Section D 22
Section E 20
Marks (2)
Instrument Frequency
clarinet 11
flute 18
trumpet 7
violin 5
Downloaded from www.studiestoday.com
Downloaded from www.studiestoday.com
www.stu
dies
toda
y.co
m
IX Mathematics C.B.S.E. Practice Papers Page 95
Q 10 The table below shows the age of seven students participating in a music recital. Find the median and mode of the data.
Marks (2)
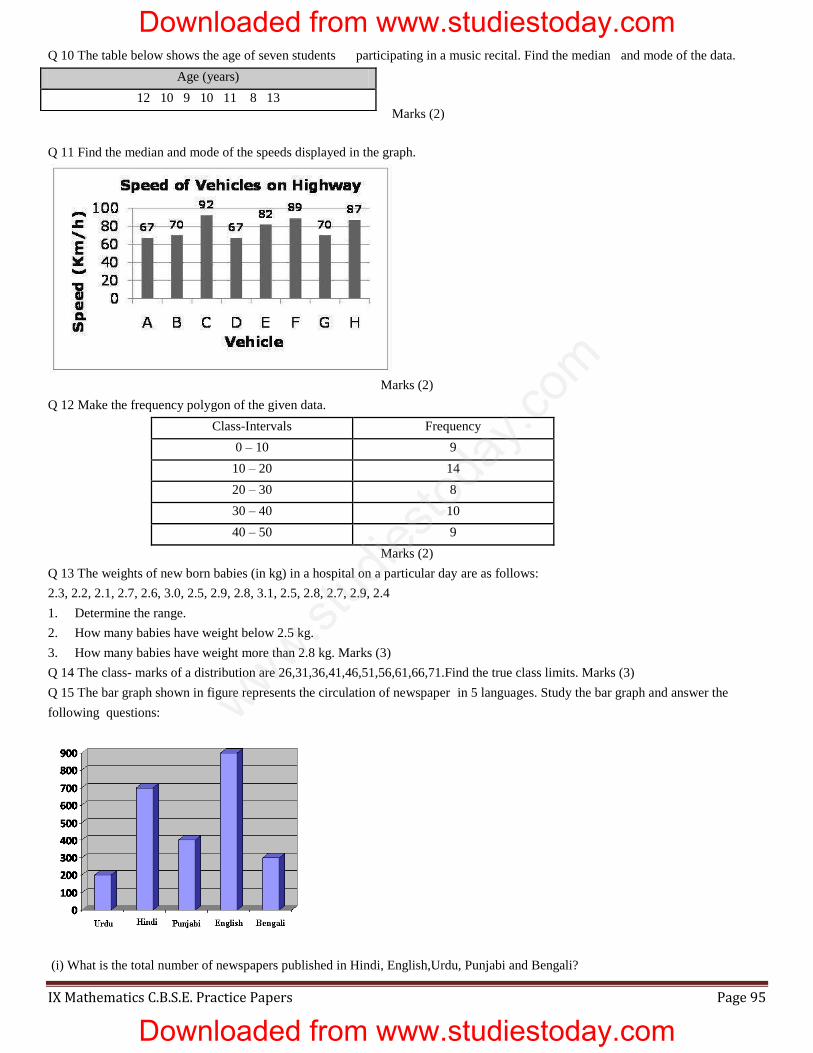
Q 11 Find the median and mode of the speeds displayed in the graph.
Marks (2)
Q 12 Make the frequency polygon of the given data.
Class-Intervals Frequency
0 – 10 9
10 – 20 14
20 – 30 8
30 – 40 10
40 – 50 9
Marks (2)
Q 13 The weights of new born babies (in kg) in a hospital on a particular day are as follows:
2.3, 2.2, 2.1, 2.7, 2.6, 3.0, 2.5, 2.9, 2.8, 3.1, 2.5, 2.8, 2.7, 2.9, 2.4
1. Determine the range.
2. How many babies have weight below 2.5 kg.
3. How many babies have weight more than 2.8 kg. Marks (3)
Q 14 The class- marks of a distribution are 26,31,36,41,46,51,56,61,66,71.Find the true class limits. Marks (3)
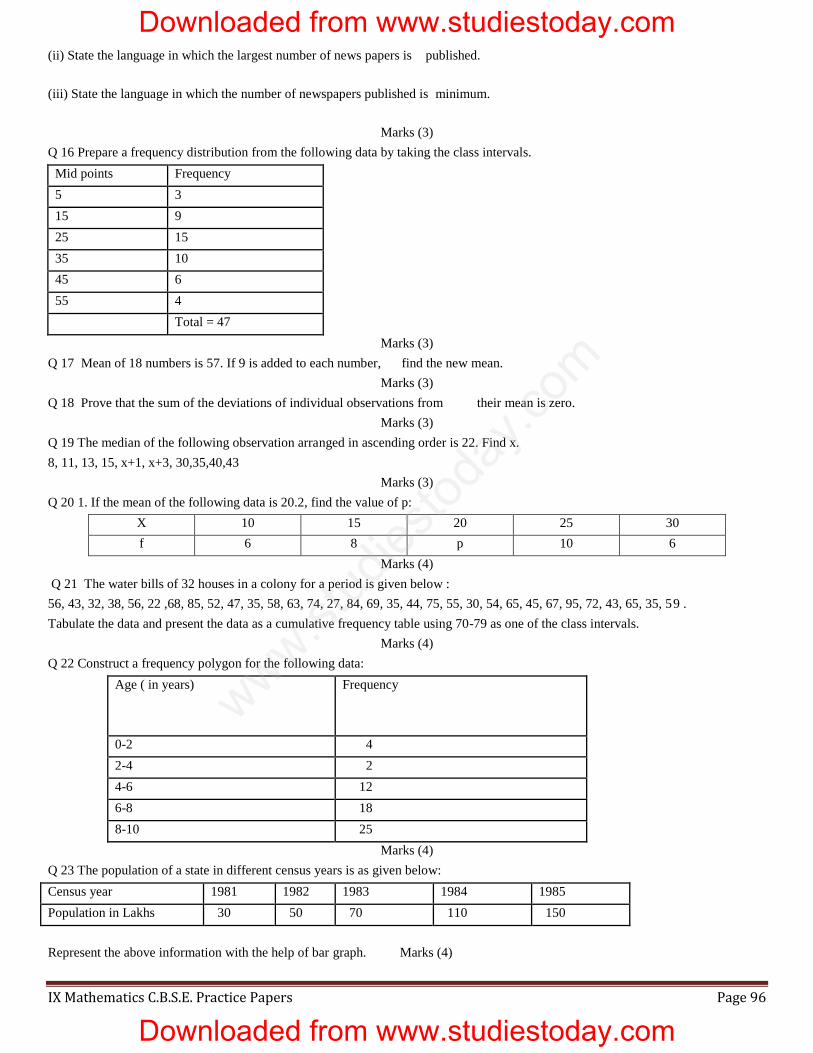
Q 15 The bar graph shown in figure represents the circulation of newspaper in 5 languages. Study the bar graph and answer the
following questions:
(i) What is the total number of newspapers published in Hindi, English,Urdu, Punjabi and Bengali?
Age (years)
12 10 9 10 11 8 13
Downloaded from www.studiestoday.com
Downloaded from www.studiestoday.com
www.stu
dies
toda
y.co
m
IX Mathematics C.B.S.E. Practice Papers Page 96
(ii) State the language in which the largest number of news papers is published.
(iii) State the language in which the number of newspapers published is minimum.
Marks (3)
Q 16 Prepare a frequency distribution from the following data by taking the class intervals.
Mid points Frequency
5 3
15 9
25 15
35 10
45 6
55 4
Total = 47
Marks (3)
Q 17 Mean of 18 numbers is 57. If 9 is added to each number, find the new mean.
Marks (3)
Q 18 Prove that the sum of the deviations of individual observations from their mean is zero.
Marks (3)
Q 19 The median of the following observation arranged in ascending order is 22. Find x.
8, 11, 13, 15, x+1, x+3, 30,35,40,43
Marks (3)
Q 20 1. If the mean of the following data is 20.2, find the value of p:
X 10 15 20 25 30
f 6 8 p 10 6
Marks (4)
Q 21 The water bills of 32 houses in a colony for a period is given below :
56, 43, 32, 38, 56, 22 ,68, 85, 52, 47, 35, 58, 63, 74, 27, 84, 69, 35, 44, 75, 55, 30, 54, 65, 45, 67, 95, 72, 43, 65, 35, 59 .
Tabulate the data and present the data as a cumulative frequency table using 70-79 as one of the class intervals.
Marks (4)
Q 22 Construct a frequency polygon for the following data:
Age ( in years) Frequency
0-2 4
2-4 2
4-6 12
6-8 18
8-10 25
Marks (4)
Q 23 The population of a state in different census years is as given below:
Census year 1981 1982 1983 1984 1985
Population in Lakhs 30 50 70 110 150
Represent the above information with the help of bar graph. Marks (4)
Downloaded from www.studiestoday.com
Downloaded from www.studiestoday.com
www.stu
dies
toda
y.co
m
IX Mathematics C.B.S.E. Practice Papers Page 97
Q 24 The average marks of boys in an examination are 65 and that of girls is 74. If the average of marks of all candidates in that
examination is 70, find the ratio of the number of boys to the number of girls that appeared in the examination.
Marks (4)
Q 25 1. The marks obtained (out of 100) by a class of 80 students are given below:
Marks Number of students
10-20 6
20-30 17
30-50 15
50-70 16
70-100 26
Construct a histogram to represent the data above.
Marks (4)
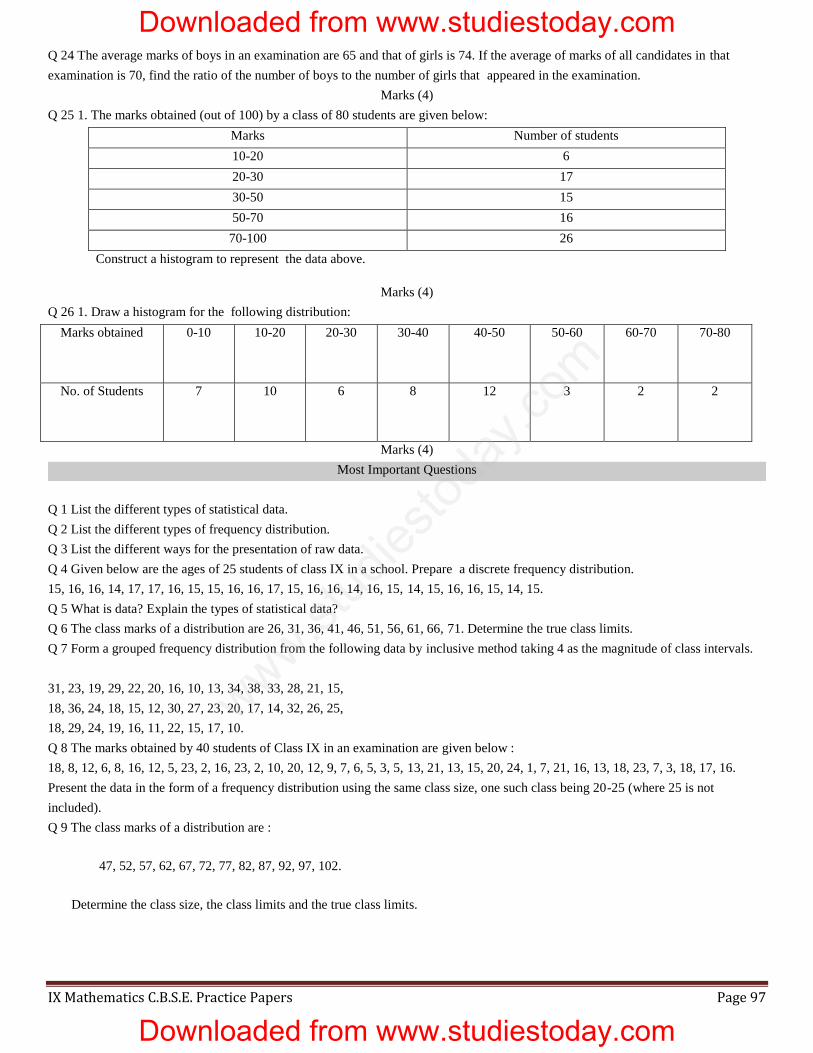
Q 26 1. Draw a histogram for the following distribution:
Marks obtained 0-10 10-20 20-30 30-40 40-50 50-60 60-70 70-80
No. of Students 7 10 6 8 12 3 2 2
Marks (4)
Most Important Questions
Q 1 List the different types of statistical data.
Q 2 List the different types of frequency distribution.
Q 3 List the different ways for the presentation of raw data.
Q 4 Given below are the ages of 25 students of class IX in a school. Prepare a discrete frequency distribution.
15, 16, 16, 14, 17, 17, 16, 15, 15, 16, 16, 17, 15, 16, 16, 14, 16, 15, 14, 15, 16, 16, 15, 14, 15.
Q 5 What is data? Explain the types of statistical data?
Q 6 The class marks of a distribution are 26, 31, 36, 41, 46, 51, 56, 61, 66, 71. Determine the true class limits.
Q 7 Form a grouped frequency distribution from the following data by inclusive method taking 4 as the magnitude of class intervals.
31, 23, 19, 29, 22, 20, 16, 10, 13, 34, 38, 33, 28, 21, 15,
18, 36, 24, 18, 15, 12, 30, 27, 23, 20, 17, 14, 32, 26, 25,
18, 29, 24, 19, 16, 11, 22, 15, 17, 10.
Q 8 The marks obtained by 40 students of Class IX in an examination are given below :
18, 8, 12, 6, 8, 16, 12, 5, 23, 2, 16, 23, 2, 10, 20, 12, 9, 7, 6, 5, 3, 5, 13, 21, 13, 15, 20, 24, 1, 7, 21, 16, 13, 18, 23, 7, 3, 18, 17, 16.
Present the data in the form of a frequency distribution using the same class size, one such class being 20-25 (where 25 is not
included).
Q 9 The class marks of a distribution are :
47, 52, 57, 62, 67, 72, 77, 82, 87, 92, 97, 102.
Determine the class size, the class limits and the true class limits.
Downloaded from www.studiestoday.com
Downloaded from www.studiestoday.com
www.stu
dies
toda
y.co
m
IX Mathematics C.B.S.E. Practice Papers Page 98
Q 10 100 plants each were planted in 100 schools during Van Mahotsava. After one month, the number of plants that survived were
recorded as :
95 67 28 32 65 65 69 33 98 96
76 42 32 38 42 40 40 69 95 92
75 83 76 83 85 62 37 65 63 42
89 65 73 81 49 52 64 76 83 92
93 68 52 79 81 83 59 82 75 82
86 90 44 62 31 36 38 42 39 83
87 56 58 23 35 76 83 85 30 68
69 83 86 43 45 39 83 75 66 83
92 75 89 66 91 27 88 89 93 42
53 69 90 55 66 49 52 83 34 36
Represent the above data in a frequency distribution table.
Q 11 Consider the marks obtained (out of 100 marks) by 30 students of Class IX of a school:
10 20 36 92 95 40 50 56 60 70
92 88 80 70 72 70 36 40 36 40
92 40 50 50 56 60 70 60 60 88
Construct a frequency distribution table.
Q 12 For the following data of daily wages(in rupees) received by 30 labourers in a certain factory, construct a grouped frequency
distribution table by dividing the range into class intervals of equal width, each corresponding to 2 rupees, in such a way that the mid-
value of the first class interval corresponds to 12 rupees.
14, 16, 16, 14, 22, 13, 15, 24, 12, 23, 14, 20, 17, 21, 22, 18, 18, 19, 20,17, 16, 15, 11, 12, 21, 20 ,17, 18, 19, 23.
Q 13 Form a discrete frequency distribution from the following scores :
15, 18, 16, 20, 25, 24, 25, 20, 16, 15, 18, 18, 16, 24, 15, 20, 28, 30, 27, 16, 24, 25, 20, 18, 28, 27, 25, 24, 24, 18, 18, 25, 20 ,16, 15, 20,
27, 28, 29, 16.
Q 14 The weights in grams of 50 oranges picked at random from a consignment are as follows :
131, 113, 82, 75, 204, 81, 84, 118, 104, 110, 80, 107, 111, 141, 136, 123, 90, 78, 90, 115, 110, 98, 106, 99, 107, 84, 76, 186, 82,
100, 109, 128, 115, 107, 115, 119, 93, 187, 139, 129, 130, 68, 195, 123, 125, 111, 92, 86, 70, 126.
Form the grouped frequency table by dividing the variable range into intervals of equal width, each corresponding to 20 gms in such
a way that the mid-value of the first class corresponds to 70 gms.
Q 15 The marks obtained by 35 students in an examination are given below:
Downloaded from www.studiestoday.com
Downloaded from www.studiestoday.com
www.stu
dies
toda
y.co
m
IX Mathematics C.B.S.E. Practice Papers Page 99
370, 290, 318, 175, 170, 410, 378, 405, 380, 375, 315, 305, 325, 275, 241, 288, 261, 355, 402, 380, 178, 253, 428, 240, 210, 175, 154,
405, 380, 370, 306, 460, 328, 440, 425.
Form a cumulative frequency table with class intervals of length 50.
Q 16 List the different ways for representing data graphically.
Q 17 What is a histogram?
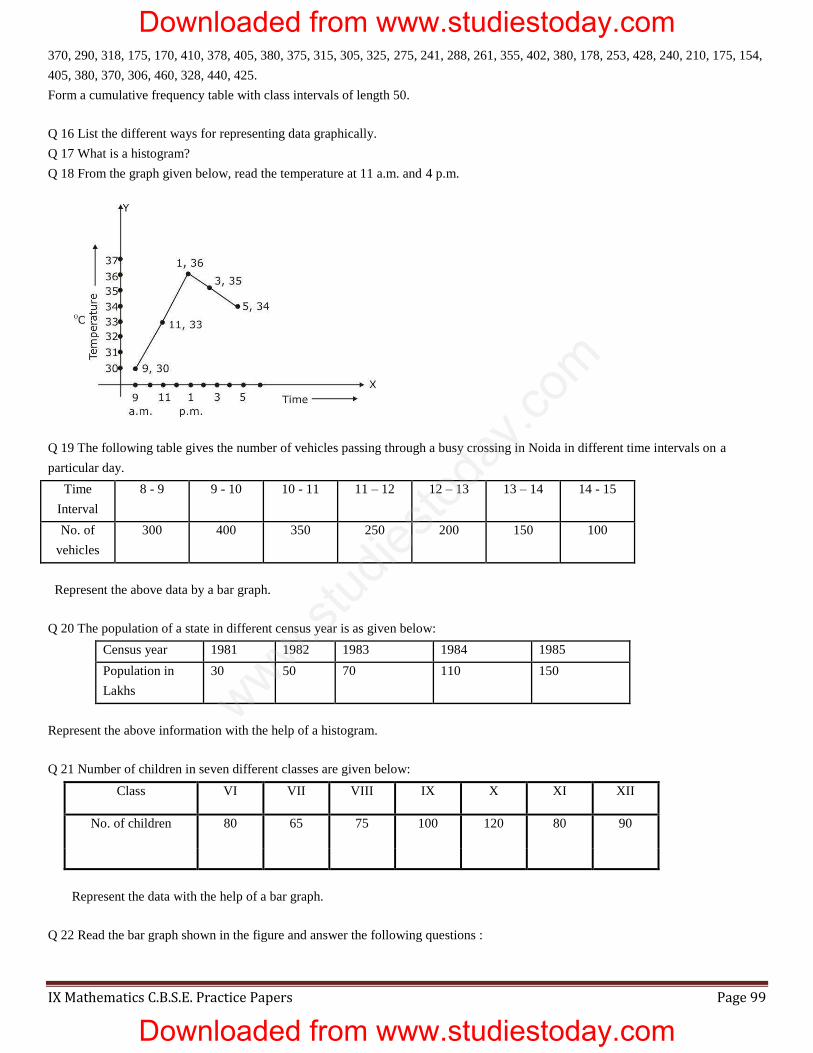
Q 18 From the graph given below, read the temperature at 11 a.m. and 4 p.m.
Q 19 The following table gives the number of vehicles passing through a busy crossing in Noida in different time intervals on a
particular day.
Time
Interval
8 - 9 9 - 10 10 - 11 11 – 12 12 – 13 13 – 14 14 - 15
No. of
vehicles
300 400 350 250 200 150 100
Represent the above data by a bar graph.
Q 20 The population of a state in different census year is as given below:
Census year 1981 1982 1983 1984 1985
Population in
Lakhs
30 50 70 110 150
Represent the above information with the help of a histogram.
Q 21 Number of children in seven different classes are given below:
Class VI VII VIII IX X XI XII
No. of children 80 65 75 100 120 80 90
Represent the data with the help of a bar graph.
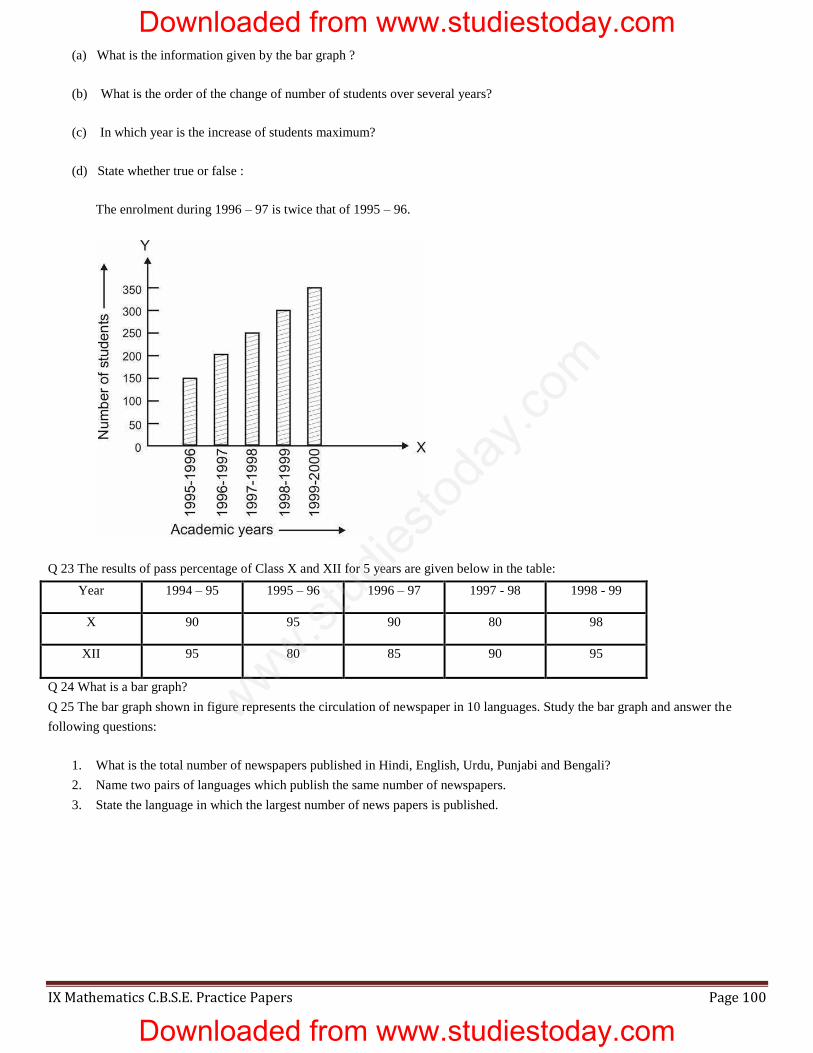
Q 22 Read the bar graph shown in the figure and answer the following questions :
Downloaded from www.studiestoday.com
Downloaded from www.studiestoday.com
www.stu
dies
toda
y.co
m
IX Mathematics C.B.S.E. Practice Papers Page 100
(a) What is the information given by the bar graph ?
(b) What is the order of the change of number of students over several years?
(c) In which year is the increase of students maximum?
(d) State whether true or false :
The enrolment during 1996 – 97 is twice that of 1995 – 96.
Q 23 The results of pass percentage of Class X and XII for 5 years are given below in the table:
Year 1994 – 95 1995 – 96 1996 – 97 1997 - 98 1998 - 99
X 90 95 90 80 98
XII 95 80 85 90 95
Q 24 What is a bar graph?
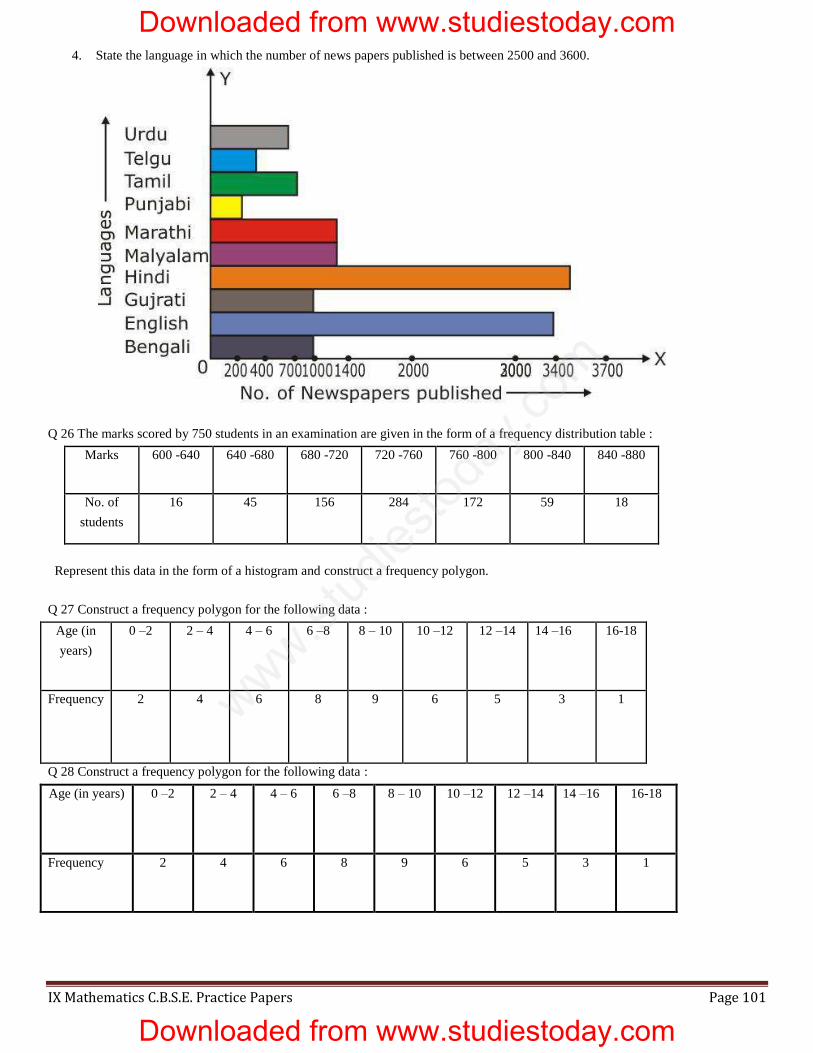
Q 25 The bar graph shown in figure represents the circulation of newspaper in 10 languages. Study the bar graph and answer the
following questions:
1. What is the total number of newspapers published in Hindi, English, Urdu, Punjabi and Bengali?
2. Name two pairs of languages which publish the same number of newspapers.
3. State the language in which the largest number of news papers is published.
Downloaded from www.studiestoday.com
Downloaded from www.studiestoday.com
www.stu
dies
toda
y.co
m
IX Mathematics C.B.S.E. Practice Papers Page 101
4. State the language in which the number of news papers published is between 2500 and 3600.
Q 26 The marks scored by 750 students in an examination are given in the form of a frequency distribution table :
Marks 600 -640 640 -680 680 -720 720 -760 760 -800 800 -840 840 -880
No. of
students
16 45 156 284 172 59 18
Represent this data in the form of a histogram and construct a frequency polygon.
Q 27 Construct a frequency polygon for the following data :
Age (in
years)
0 –2 2 – 4 4 – 6 6 –8 8 – 10 10 –12 12 –14 14 –16 16-18
Frequency 2 4 6 8 9 6 5 3 1
Q 28 Construct a frequency polygon for the following data :
Age (in years) 0 –2 2 – 4 4 – 6 6 –8 8 – 10 10 –12 12 –14 14 –16 16-18
Frequency 2 4 6 8 9 6 5 3 1
Downloaded from www.studiestoday.com
Downloaded from www.studiestoday.com
www.stu
dies
toda
y.co
m
IX Mathematics C.B.S.E. Practice Papers Page 102
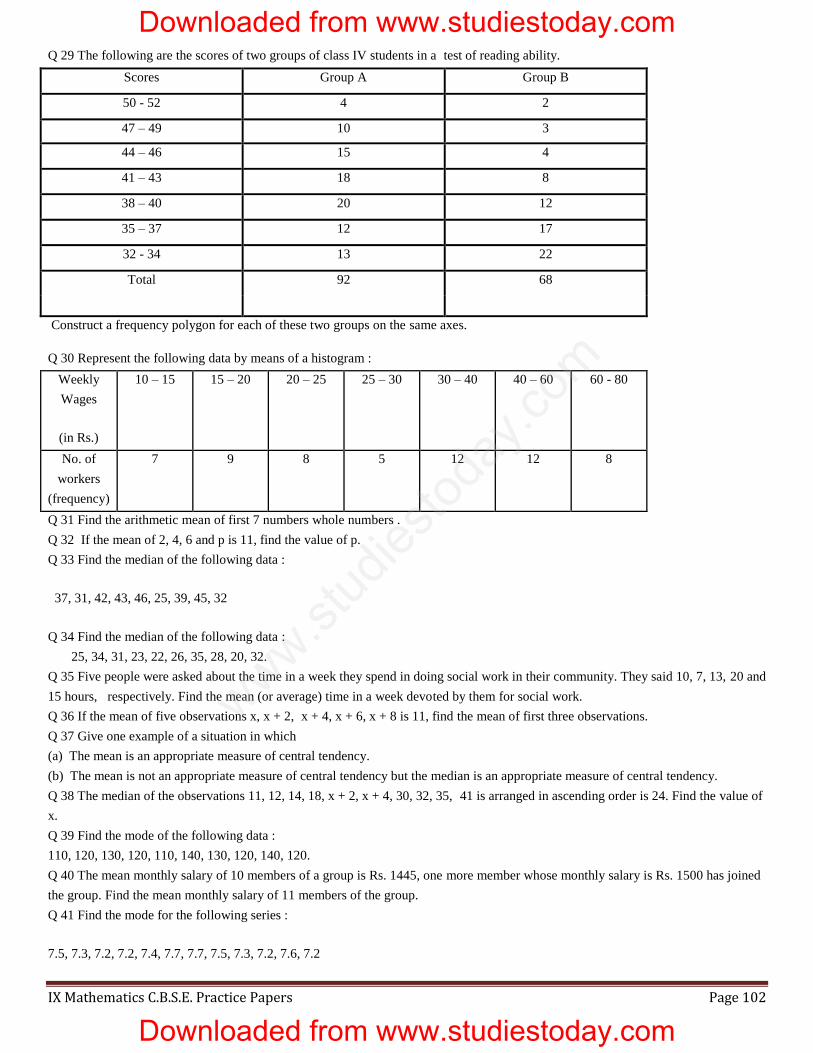
Q 29 The following are the scores of two groups of class IV students in a test of reading ability.
Scores Group A Group B
50 - 52 4 2
47 – 49 10 3
44 – 46 15 4
41 – 43 18 8
38 – 40 20 12
35 – 37 12 17
32 - 34 13 22
Total 92 68
Construct a frequency polygon for each of these two groups on the same axes.
Q 30 Represent the following data by means of a histogram :
Weekly
Wages
(in Rs.)
10 – 15 15 – 20 20 – 25 25 – 30 30 – 40 40 – 60 60 - 80
No. of
workers
(frequency)
7 9 8 5 12 12 8
Q 31 Find the arithmetic mean of first 7 numbers whole numbers .
Q 32 If the mean of 2, 4, 6 and p is 11, find the value of p.
Q 33 Find the median of the following data :
37, 31, 42, 43, 46, 25, 39, 45, 32
Q 34 Find the median of the following data :
25, 34, 31, 23, 22, 26, 35, 28, 20, 32.
Q 35 Five people were asked about the time in a week they spend in doing social work in their community. They said 10, 7, 13, 20 and
15 hours, respectively. Find the mean (or average) time in a week devoted by them for social work.
Q 36 If the mean of five observations x, x + 2, x + 4, x + 6, x + 8 is 11, find the mean of first three observations.
Q 37 Give one example of a situation in which
(a) The mean is an appropriate measure of central tendency.
(b) The mean is not an appropriate measure of central tendency but the median is an appropriate measure of central tendency.
Q 38 The median of the observations 11, 12, 14, 18, x + 2, x + 4, 30, 32, 35, 41 is arranged in ascending order is 24. Find the value of
x.
Q 39 Find the mode of the following data :
110, 120, 130, 120, 110, 140, 130, 120, 140, 120.
Q 40 The mean monthly salary of 10 members of a group is Rs. 1445, one more member whose monthly salary is Rs. 1500 has joined
the group. Find the mean monthly salary of 11 members of the group.
Q 41 Find the mode for the following series :
7.5, 7.3, 7.2, 7.2, 7.4, 7.7, 7.7, 7.5, 7.3, 7.2, 7.6, 7.2
Downloaded from www.studiestoday.com
Downloaded from www.studiestoday.com
www.stu
dies
toda
y.co
m
IX Mathematics C.B.S.E. Practice Papers Page 103
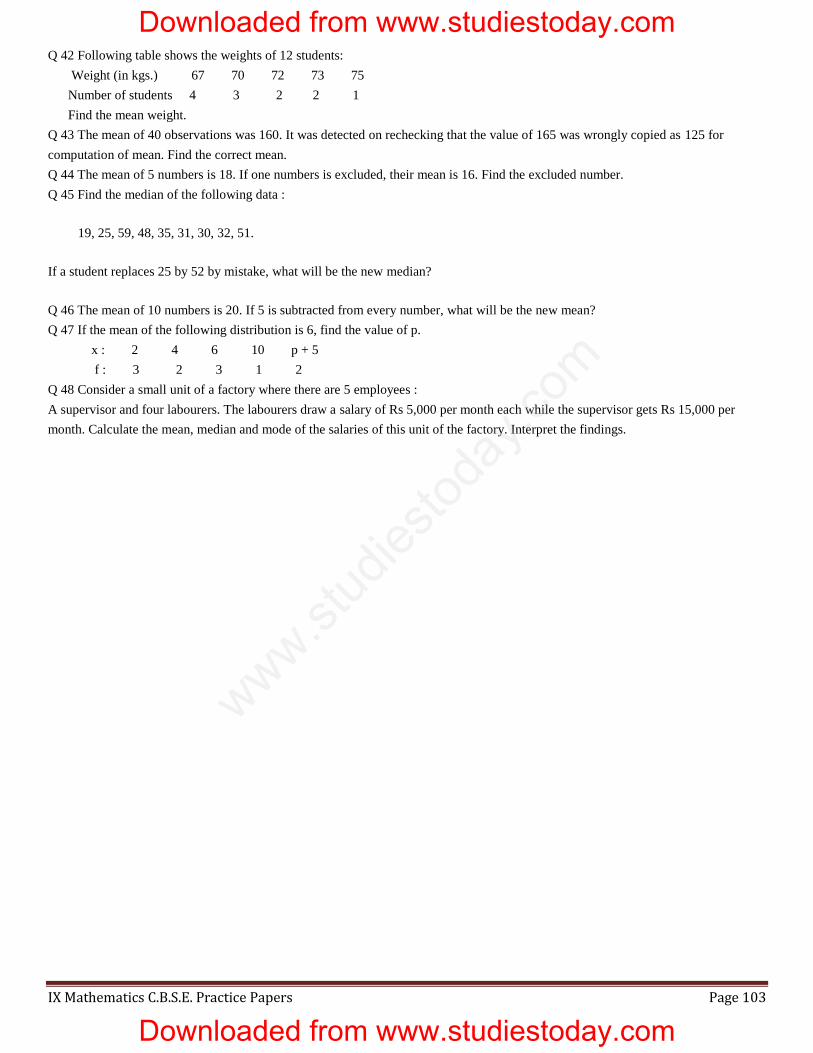
Q 42 Following table shows the weights of 12 students:
Weight (in kgs.) 67 70 72 73 75
Number of students 4 3 2 2 1
Find the mean weight.
Q 43 The mean of 40 observations was 160. It was detected on rechecking that the value of 165 was wrongly copied as 125 for
computation of mean. Find the correct mean.
Q 44 The mean of 5 numbers is 18. If one numbers is excluded, their mean is 16. Find the excluded number.
Q 45 Find the median of the following data :
19, 25, 59, 48, 35, 31, 30, 32, 51.
If a student replaces 25 by 52 by mistake, what will be the new median?
Q 46 The mean of 10 numbers is 20. If 5 is subtracted from every number, what will be the new mean?
Q 47 If the mean of the following distribution is 6, find the value of p.
x : 2 4 6 10 p + 5
f : 3 2 3 1 2
Q 48 Consider a small unit of a factory where there are 5 employees :
A supervisor and four labourers. The labourers draw a salary of Rs 5,000 per month each while the supervisor gets Rs 15,000 per
month. Calculate the mean, median and mode of the salaries of this unit of the factory. Interpret the findings.
Downloaded from www.studiestoday.com
Downloaded from www.studiestoday.com
www.stu
dies
toda
y.co
m
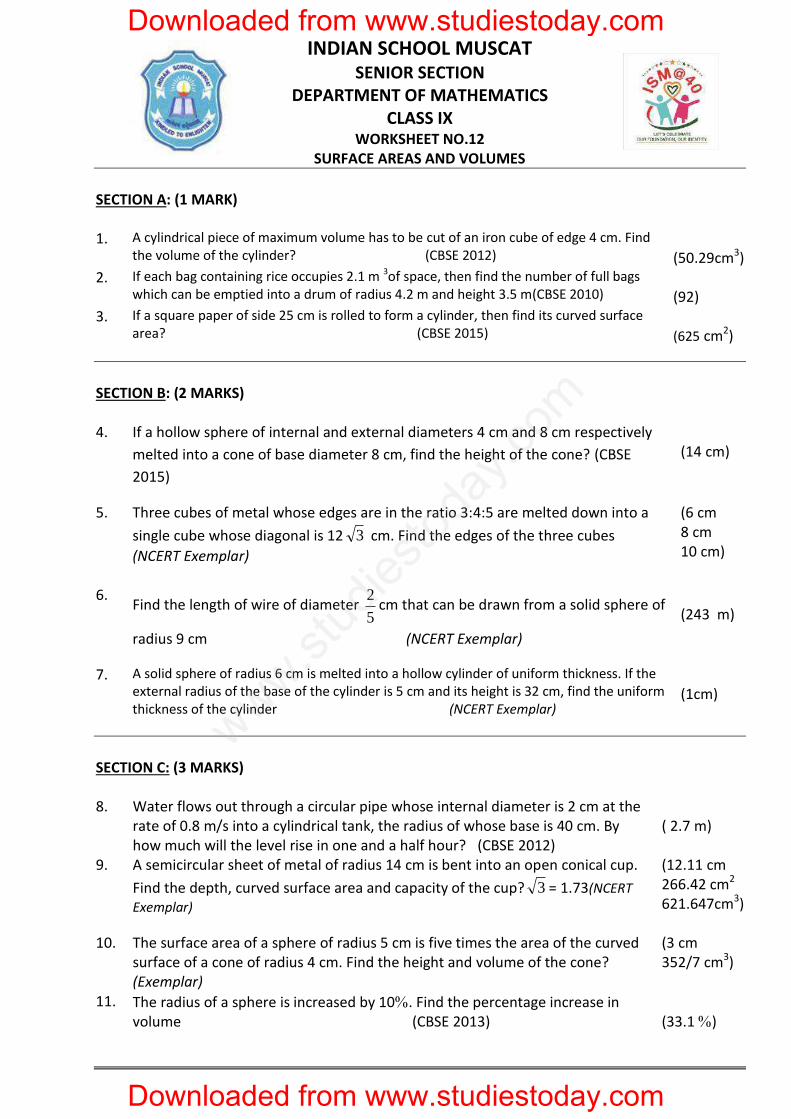
INDIAN SCHOOL MUSCAT
SENIOR SECTION
DEPARTMENT OF MATHEMATICS
CLASS IX WORKSHEET NO.12
SURFACE AREAS AND VOLUMES
SECTION A: (1 MARK)
1. A cylindrical piece of maximum volume has to be cut of an iron cube of edge 4 cm. Find
the volume of the cylinder? (CBSE 2012)
(50.29cm3)
2. If each bag containing rice occupies 2.1 m 3of space, then find the number of full bags
which can be emptied into a drum of radius 4.2 m and height 3.5 m(CBSE 2010)
(92)
3. If a square paper of side 25 cm is rolled to form a cylinder, then find its curved surface
area? (CBSE 2015)
(625 cm2)
SECTION B: (2 MARKS)
4. If a hollow sphere of internal and external diameters 4 cm and 8 cm respectively
melted into a cone of base diameter 8 cm, find the height of the cone? (CBSE
2015)
(14 cm)
5. Three cubes of metal whose edges are in the ratio 3:4:5 are melted down into a
single cube whose diagonal is 12 3 cm. Find the edges of the three cubes
(NCERT Exemplar)
(6 cm
8 cm
10 cm)
6. Find the length of wire of diameter
5
2cm that can be drawn from a solid sphere of
radius 9 cm (NCERT Exemplar)
(243 m)
7. A solid sphere of radius 6 cm is melted into a hollow cylinder of uniform thickness. If the
external radius of the base of the cylinder is 5 cm and its height is 32 cm, find the uniform
thickness of the cylinder (NCERT Exemplar)
(1cm)
SECTION C: (3 MARKS)
8. Water flows out through a circular pipe whose internal diameter is 2 cm at the
rate of 0.8 m/s into a cylindrical tank, the radius of whose base is 40 cm. By
how much will the level rise in one and a half hour? (CBSE 2012)
( 2.7 m)
9. A semicircular sheet of metal of radius 14 cm is bent into an open conical cup.
Find the depth, curved surface area and capacity of the cup? 3 = 1.73(NCERT
Exemplar)
(12.11 cm
266.42 cm2
621.647cm3)
10. The surface area of a sphere of radius 5 cm is five times the area of the curved
surface of a cone of radius 4 cm. Find the height and volume of the cone?
(Exemplar)
(3 cm
352/7 cm3)
11. The radius of a sphere is increased by 10. Find the percentage increase in
volume (CBSE 2013)
(33.1 )
Downloaded from www.studiestoday.com
Downloaded from www.studiestoday.com
www.stu
dies
toda
y.co
m
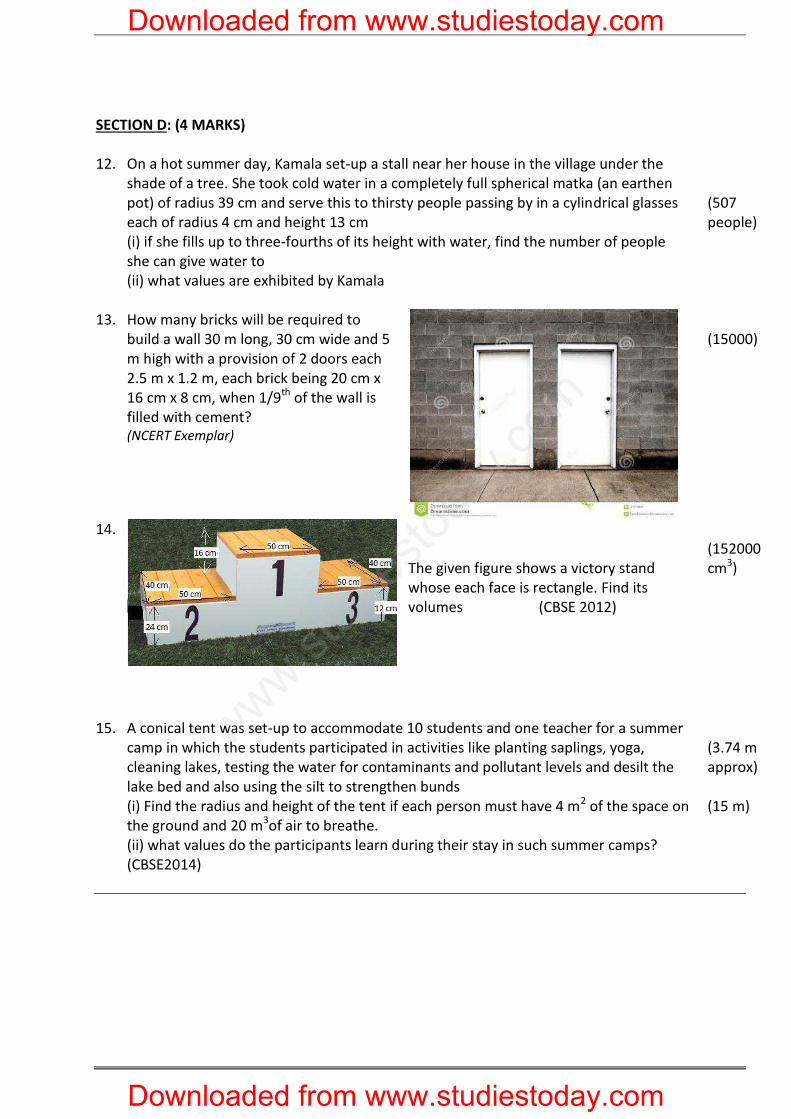
SECTION D: (4 MARKS)
12. On a hot summer day, Kamala set-up a stall near her house in the village under the
shade of a tree. She took cold water in a completely full spherical matka (an earthen
pot) of radius 39 cm and serve this to thirsty people passing by in a cylindrical glasses
each of radius 4 cm and height 13 cm
(i) if she fills up to three-fourths of its height with water, find the number of people
she can give water to
(ii) what values are exhibited by Kamala
(507
people)
13. How many bricks will be required to
build a wall 30 m long, 30 cm wide and 5
m high with a provision of 2 doors each
2.5 m x 1.2 m, each brick being 20 cm x
16 cm x 8 cm, when 1/9th
of the wall is
filled with cement?
(NCERT Exemplar)
(15000)
14.
The given figure shows a victory stand
whose each face is rectangle. Find its
volumes (CBSE 2012)
(152000
cm3)
15. A conical tent was set-up to accommodate 10 students and one teacher for a summer
camp in which the students participated in activities like planting saplings, yoga,
cleaning lakes, testing the water for contaminants and pollutant levels and desilt the
lake bed and also using the silt to strengthen bunds
(i) Find the radius and height of the tent if each person must have 4 m2 of the space on
the ground and 20 m3of air to breathe.
(ii) what values do the participants learn during their stay in such summer camps?
(CBSE2014)
(3.74 m
approx)
(15 m)
Downloaded from www.studiestoday.com
Downloaded from www.studiestoday.com
www.stu
dies
toda
y.co
m
90
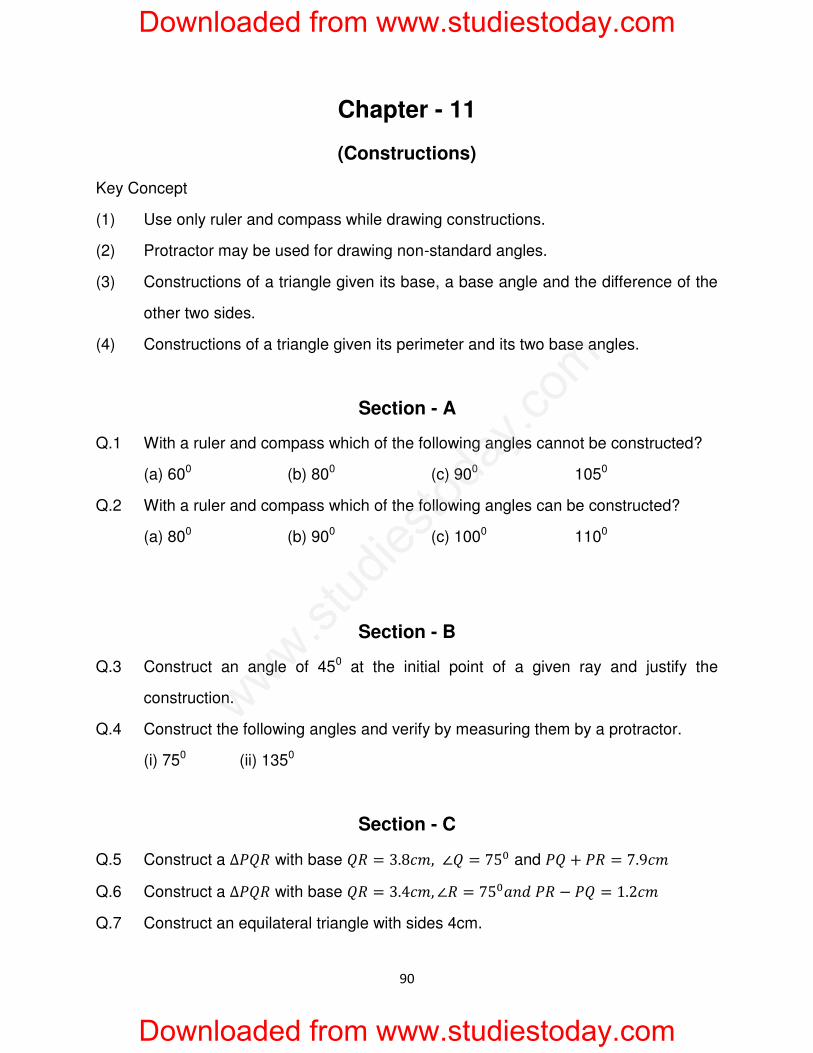
Chapter - 11
(Constructions)
Key Concept
(1) Use only ruler and compass while drawing constructions.
(2) Protractor may be used for drawing non-standard angles.
(3) Constructions of a triangle given its base, a base angle and the difference of the
other two sides.
(4) Constructions of a triangle given its perimeter and its two base angles.
Section - A
Q.1 With a ruler and compass which of the following angles cannot be constructed?
(a) 600 (b) 800 (c) 900 1050
Q.2 With a ruler and compass which of the following angles can be constructed?
(a) 800 (b) 900 (c) 1000 1100
Section - B
Q.3 Construct an angle of 450 at the initial point of a given ray and justify the
construction.
Q.4 Construct the following angles and verify by measuring them by a protractor.
(i) 750 (ii) 1350
Section - C
Q.5 Construct a with base and
Q.6 Construct a with base
Q.7 Construct an equilateral triangle with sides 4cm.
Downloaded from www.studiestoday.com
Downloaded from www.studiestoday.com
www.stu
dies
toda
y.co
m
91
Section -D
Q.8 Construct a triangle ABC in which and
AB+BC+CA = 13 cm.
Q.9 Construct a right triangle whose base is 12cm and sum of its hypotenuse and
other side is 18cm.
Q.10 Construct a with its perimeter = 11cm and the base angles of 750 and 300.
Answers:
Q.1 b Q.2 b
Downloaded from www.studiestoday.com
Downloaded from www.studiestoday.com
www.stu
dies
toda
y.co
m
Downloaded from www.studiestoday.com
© Studiestoday.com Downloaded from www.studiestoday.com
Downloaded from www.studiestoday.com
Downloaded from www.studiestoday.com
www.stu
dies
toda
y.co
m
Downloaded from www.studiestoday.com
© Studiestoday.com Downloaded from www.studiestoday.com
Downloaded from www.studiestoday.com
Downloaded from www.studiestoday.com
www.stu
dies
toda
y.co
m
Downloaded from www.studiestoday.com
© Studiestoday.com Downloaded from www.studiestoday.com
Downloaded from www.studiestoday.com
Downloaded from www.studiestoday.com
www.stu
dies
toda
y.co
m
Downloaded from www.studiestoday.com
© Studiestoday.com Downloaded from www.studiestoday.com
Downloaded from www.studiestoday.com
Downloaded from www.studiestoday.com
www.stu
dies
toda
y.co
m
Downloaded from www.studiestoday.com
© Studiestoday.com Downloaded from www.studiestoday.com
Downloaded from www.studiestoday.com
Downloaded from www.studiestoday.com
www.stu
dies
toda
y.co
m
Downloaded from www.studiestoday.comDownloaded from www.studiestoday.com
Downloaded from www.studiestoday.com
www.stu
dies
toda
y.co
m
© www.studiestoday.com. Downloaded from www.studiestoday.com
© www.studiestoday.com. Downloaded from www.studiestoday.com
Downloaded from www.studiestoday.com
Downloaded from www.studiestoday.com
www.stu
dies
toda
y.co
m
© www.studiestoday.com. Downloaded from www.studiestoday.com
© www.studiestoday.com. Downloaded from www.studiestoday.com
Downloaded from www.studiestoday.com
Downloaded from www.studiestoday.com
www.stu
dies
toda
y.co
m
© www.studiestoday.com. Downloaded from www.studiestoday.com
© www.studiestoday.com. Downloaded from www.studiestoday.com
Downloaded from www.studiestoday.com
Downloaded from www.studiestoday.com
www.stu
dies
toda
y.co
m
© www.studiestoday.com. Downloaded from www.studiestoday.com
© www.studiestoday.com. Downloaded from www.studiestoday.com
Downloaded from www.studiestoday.com
Downloaded from www.studiestoday.com
www.stu
dies
toda
y.co
m
97
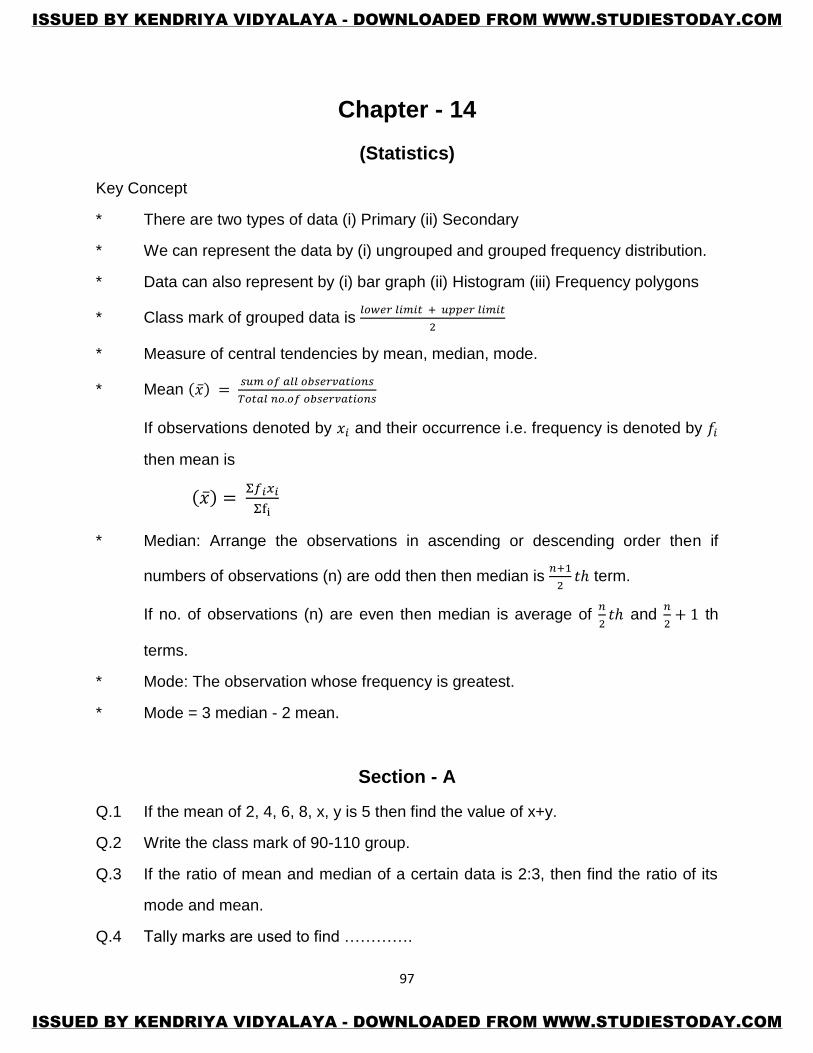
Chapter - 14
(Statistics)
Key Concept
* There are two types of data (i) Primary (ii) Secondary
* We can represent the data by (i) ungrouped and grouped frequency distribution.
* Data can also represent by (i) bar graph (ii) Histogram (iii) Frequency polygons
* Class mark of grouped data is
* Measure of central tendencies by mean, median, mode.
* Mean
If observations denoted by and their occurrence i.e. frequency is denoted by
then mean is
* Median: Arrange the observations in ascending or descending order then if
numbers of observations (n) are odd then then median is
term.
If no. of observations (n) are even then median is average of
and
th
terms.
* Mode: The observation whose frequency is greatest.
* Mode = 3 median - 2 mean.
Section - A
Q.1 If the mean of 2, 4, 6, 8, x, y is 5 then find the value of x+y.
Q.2 Write the class mark of 90-110 group.
Q.3 If the ratio of mean and median of a certain data is 2:3, then find the ratio of its
mode and mean.
Q.4 Tally marks are used to find ………….
ISSUED BY KENDRIYA VIDYALAYA - DOWNLOADED FROM WWW.STUDIESTODAY.COM
ISSUED BY KENDRIYA VIDYALAYA - DOWNLOADED FROM WWW.STUDIESTODAY.COM
98
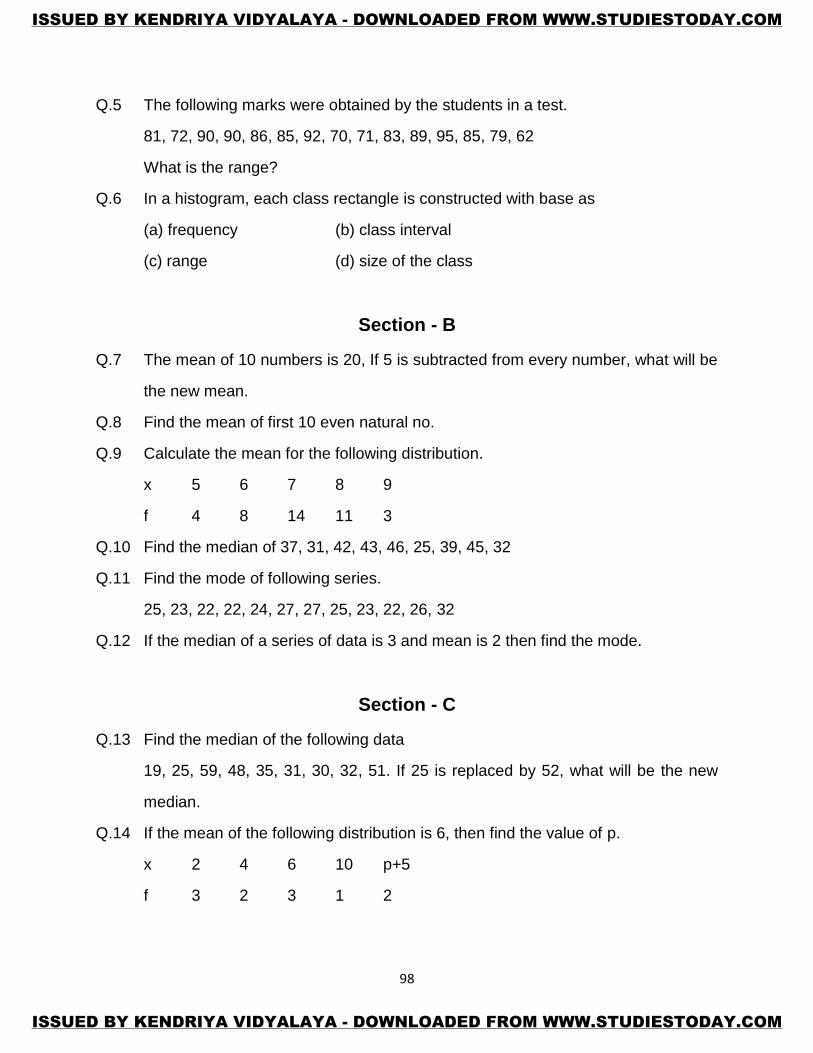
Q.5 The following marks were obtained by the students in a test.
81, 72, 90, 90, 86, 85, 92, 70, 71, 83, 89, 95, 85, 79, 62
What is the range?
Q.6 In a histogram, each class rectangle is constructed with base as
(a) frequency (b) class interval
(c) range (d) size of the class
Section - B
Q.7 The mean of 10 numbers is 20, If 5 is subtracted from every number, what will be
the new mean.
Q.8 Find the mean of first 10 even natural no.
Q.9 Calculate the mean for the following distribution.
x 5 6 7 8 9
f 4 8 14 11 3
Q.10 Find the median of 37, 31, 42, 43, 46, 25, 39, 45, 32
Q.11 Find the mode of following series.
25, 23, 22, 22, 24, 27, 27, 25, 23, 22, 26, 32
Q.12 If the median of a series of data is 3 and mean is 2 then find the mode.
Section - C
Q.13 Find the median of the following data
19, 25, 59, 48, 35, 31, 30, 32, 51. If 25 is replaced by 52, what will be the new
median.
Q.14 If the mean of the following distribution is 6, then find the value of p.
x 2 4 6 10 p+5
f 3 2 3 1 2
ISSUED BY KENDRIYA VIDYALAYA - DOWNLOADED FROM WWW.STUDIESTODAY.COM
ISSUED BY KENDRIYA VIDYALAYA - DOWNLOADED FROM WWW.STUDIESTODAY.COM
99
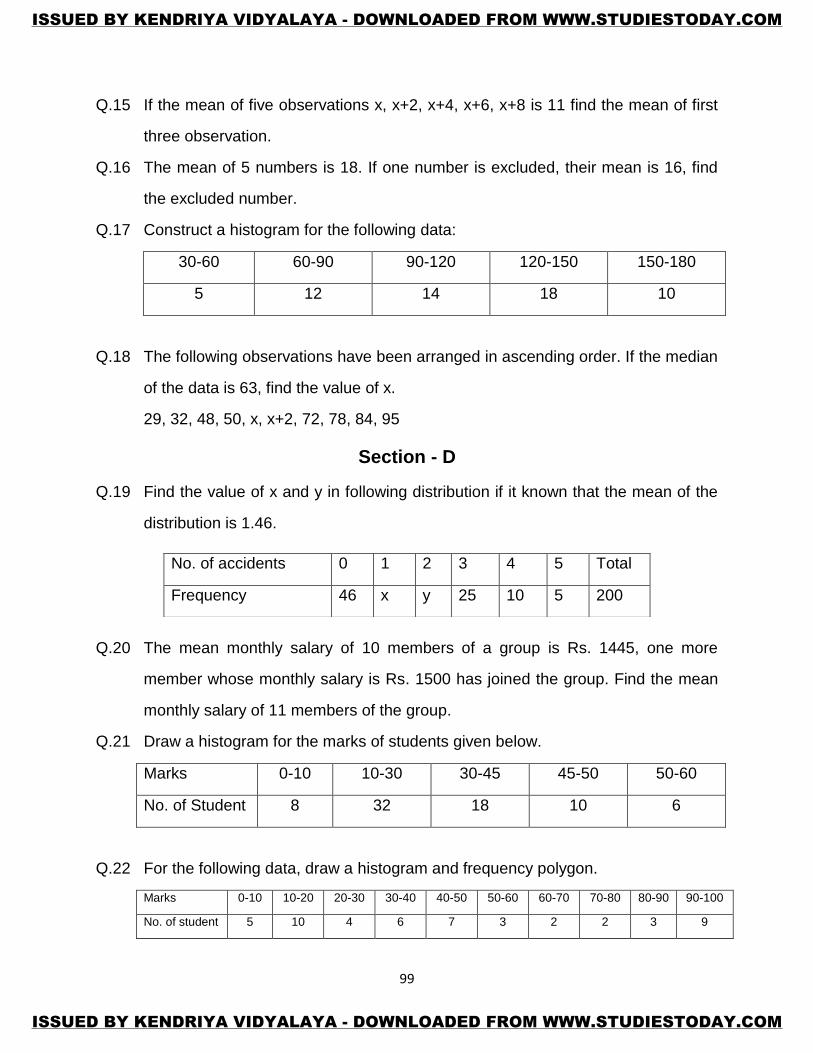
Q.15 If the mean of five observations x, x+2, x+4, x+6, x+8 is 11 find the mean of first
three observation.
Q.16 The mean of 5 numbers is 18. If one number is excluded, their mean is 16, find
the excluded number.
Q.17 Construct a histogram for the following data:
30-60 60-90 90-120 120-150 150-180
5 12 14 18 10
Q.18 The following observations have been arranged in ascending order. If the median
of the data is 63, find the value of x.
29, 32, 48, 50, x, x+2, 72, 78, 84, 95
Section - D
Q.19 Find the value of x and y in following distribution if it known that the mean of the
distribution is 1.46.
Q.20 The mean monthly salary of 10 members of a group is Rs. 1445, one more
member whose monthly salary is Rs. 1500 has joined the group. Find the mean
monthly salary of 11 members of the group.
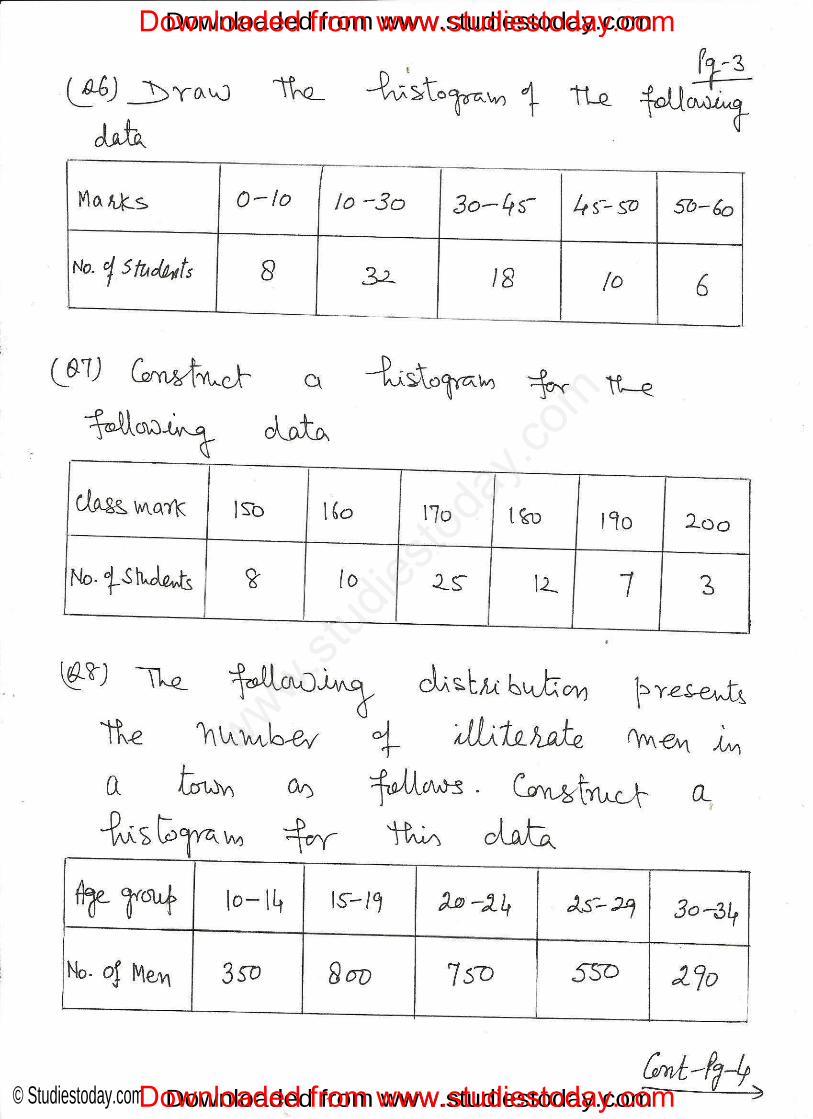
Q.21 Draw a histogram for the marks of students given below.
Marks 0-10 10-30 30-45 45-50 50-60
No. of Student 8 32 18 10 6
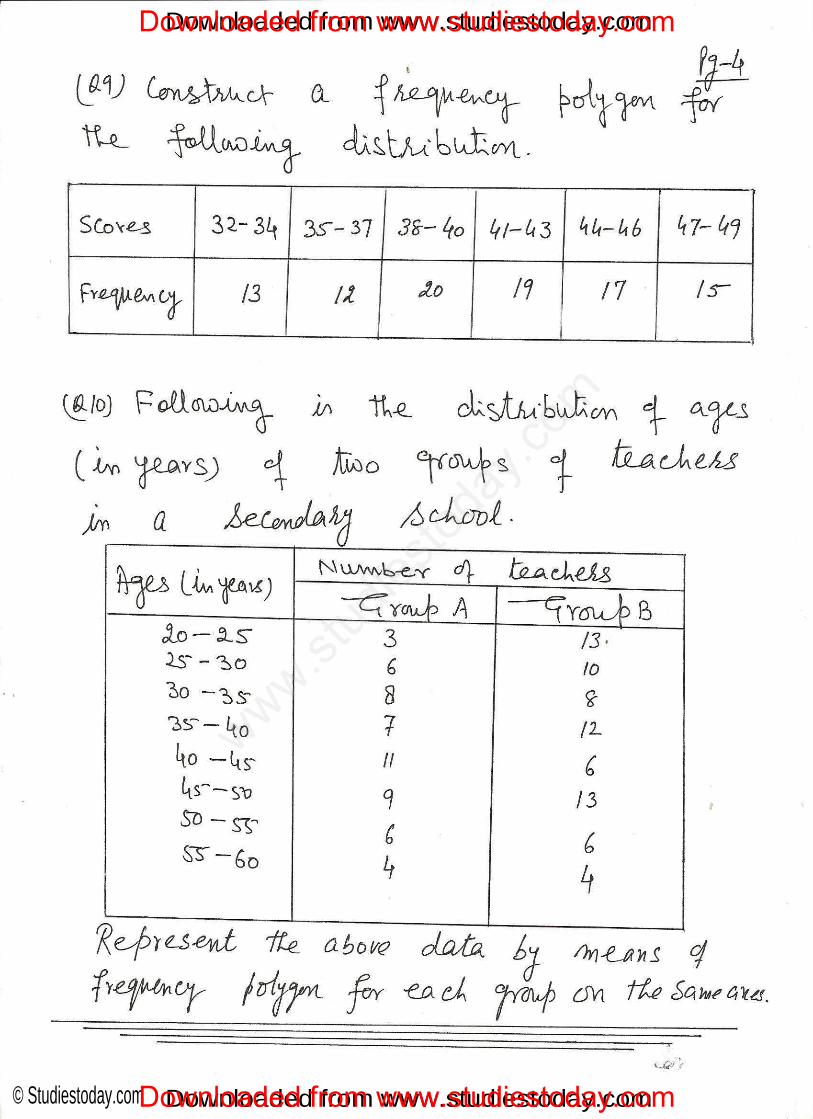
Q.22 For the following data, draw a histogram and frequency polygon.
Marks 0-10 10-20 20-30 30-40 40-50 50-60 60-70 70-80 80-90 90-100
No. of student 5 10 4 6 7 3 2 2 3 9
No. of accidents 0 1 2 3 4 5 Total
Frequency 46 x y 25 10 5 200
ISSUED BY KENDRIYA VIDYALAYA - DOWNLOADED FROM WWW.STUDIESTODAY.COM
ISSUED BY KENDRIYA VIDYALAYA - DOWNLOADED FROM WWW.STUDIESTODAY.COM
100
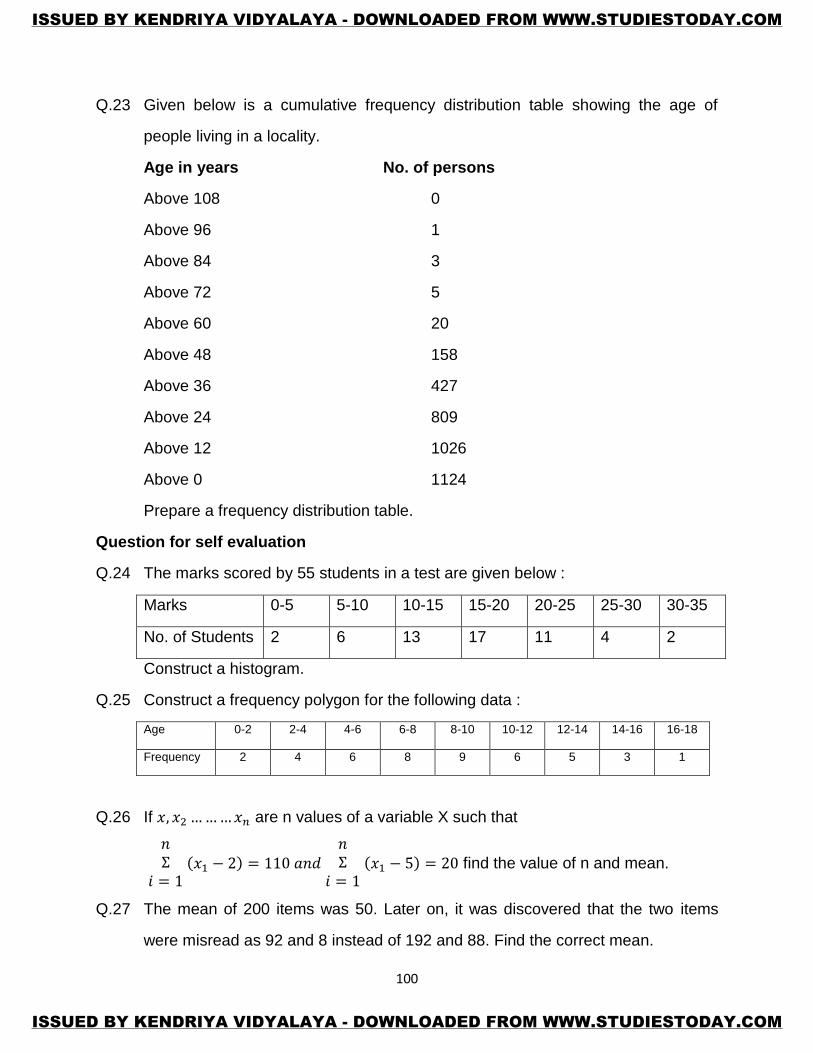
Q.23 Given below is a cumulative frequency distribution table showing the age of
people living in a locality.
Age in years No. of persons
Above 108 0
Above 96 1
Above 84 3
Above 72 5
Above 60 20
Above 48 158
Above 36 427
Above 24 809
Above 12 1026
Above 0 1124
Prepare a frequency distribution table.
Question for self evaluation
Q.24 The marks scored by 55 students in a test are given below :
Marks 0-5 5-10 10-15 15-20 20-25 25-30 30-35
No. of Students 2 6 13 17 11 4 2
Construct a histogram.
Q.25 Construct a frequency polygon for the following data :
Age 0-2 2-4 4-6 6-8 8-10 10-12 12-14 14-16 16-18
Frequency 2 4 6 8 9 6 5 3 1
Q.26 If are n values of a variable X such that
find the value of n and mean.
Q.27 The mean of 200 items was 50. Later on, it was discovered that the two items
were misread as 92 and 8 instead of 192 and 88. Find the correct mean.
ISSUED BY KENDRIYA VIDYALAYA - DOWNLOADED FROM WWW.STUDIESTODAY.COM
ISSUED BY KENDRIYA VIDYALAYA - DOWNLOADED FROM WWW.STUDIESTODAY.COM
101
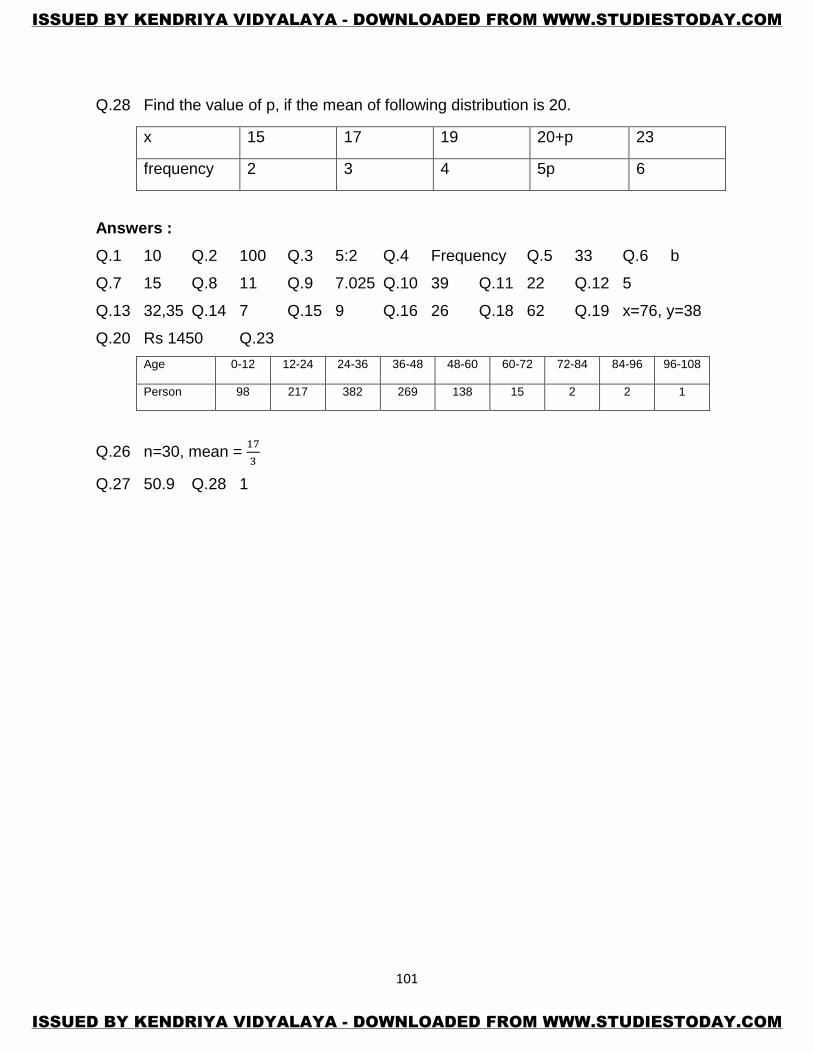
Q.28 Find the value of p, if the mean of following distribution is 20.
x 15 17 19 20+p 23
frequency 2 3 4 5p 6
Answers :
Q.1 10 Q.2 100 Q.3 5:2 Q.4 Frequency Q.5 33 Q.6 b
Q.7 15 Q.8 11 Q.9 7.025 Q.10 39 Q.11 22 Q.12 5
Q.13 32,35 Q.14 7 Q.15 9 Q.16 26 Q.18 62 Q.19 x=76, y=38
Q.20 Rs 1450 Q.23
Age 0-12 12-24 24-36 36-48 48-60 60-72 72-84 84-96 96-108
Person 98 217 382 269 138 15 2 2 1
Q.26 n=30, mean =
Q.27 50.9 Q.28 1
ISSUED BY KENDRIYA VIDYALAYA - DOWNLOADED FROM WWW.STUDIESTODAY.COM
ISSUED BY KENDRIYA VIDYALAYA - DOWNLOADED FROM WWW.STUDIESTODAY.COM
Related Documents