IEEE TRANSACTIONS ON GEOSCIENCE AND REMOTE SENSING, VOL. XX, NO. XX 1 IWRAP: the Imaging Wind and Rain Airborne Profiler for Remote Sensing of the Ocean and the Atmospheric Boundary Layer within Tropical Cyclones Daniel Esteban Fernandez, Elizabeth Kerr, Antoni Castells, and Stephen Frasier University of Massachusetts, Knowles Engineering Building, Amherst, MA, 01003 James R. Carswell Remote Sensing Solutions Barnstable, MA 02630 Paul S. Chang NOAA/NESDIS/ORA 5200 Auth Road, Camp Springs, MD 20746 Peter G. Black and Frank M. Marks NOAA/AOML/HRD 4301 Rickenbacker Causeway, Miami, FL 33149 Abstract IWRAP, the Imaging Wind and Rain Airborne Profiler, is the first high-resolution dual-band airborne Doppler radar designed to study the inner core of Tropical Cyclones (TCs). IWRAP is operated from a National Oceanic and Atmospheric Administration (NOAA) WP-3D aircraft during missions through TCs and severe ocean storms. The system is designed to provide high-resolution dual-polarized C- and Ku-band reflectivity and Doppler velocity profiles of the atmospheric boundary layer (ABL) within the inner core precipitation bands of TCs and to study the effects precipitation has on ocean wind scatterometry as it applies to TCs. IWRAP implements a very unique measurement strategy; it profiles simultaneously at four separate incidence angles (approximately 30, 35, 40 and 50 degrees) while conically scanning at 60 RPM. A summary of the principles of operation and the design of the instrument is given, followed by examples of IWRAP’s unique imaging capability. To our knowledge, these examples include the highest-resolution measurements of the ABL winds in a hurricane ever obtained. I. I NTRODUCTION Tropical Cyclones (TCs) and severe ocean storms pose one of the largest natural threats to coastal areas and maritime interests. Accurate track and intensity forecasts with skill extending out several days are required to minimize the financial impact and eliminate the loss of life caused by these extreme weather events. Microwave scatterometers and Doppler radars have already proven their effectiveness in tracking the position and intensity of these weather phenomena [1] and have aided researchers to better understand air-sea transfer under very strong wind forcing to improve TC forecasting. Currently, satellite-based scatterometers are used on a daily basis to map the global ocean surface wind field.

Welcome message from author
This document is posted to help you gain knowledge. Please leave a comment to let me know what you think about it! Share it to your friends and learn new things together.
Transcript
IEEE TRANSACTIONS ON GEOSCIENCE AND REMOTE SENSING, VOL. XX, NO. XX 1
IWRAP: the Imaging Wind and Rain AirborneProfiler for Remote Sensing of the Ocean and the
Atmospheric Boundary Layer within TropicalCyclones
Daniel Esteban Fernandez, Elizabeth Kerr, Antoni Castells, and Stephen FrasierUniversity of Massachusetts,
Knowles Engineering Building, Amherst, MA, 01003
James R. CarswellRemote Sensing Solutions
Barnstable, MA 02630
Paul S. ChangNOAA/NESDIS/ORA
5200 Auth Road, Camp Springs, MD 20746
Peter G. Black and Frank M. MarksNOAA/AOML/HRD
4301 Rickenbacker Causeway, Miami, FL 33149
Abstract
IWRAP, the Imaging Wind and Rain Airborne Profiler, is the first high-resolution dual-band airborne Dopplerradar designed to study the inner core of Tropical Cyclones (TCs). IWRAP is operated from a National Oceanicand Atmospheric Administration (NOAA) WP-3D aircraft during missions through TCs and severe ocean storms.The system is designed to provide high-resolution dual-polarized C- and Ku-band reflectivity and Doppler velocityprofiles of the atmospheric boundary layer (ABL) within the inner core precipitation bands of TCs and to studythe effects precipitation has on ocean wind scatterometry as it applies to TCs. IWRAP implements a very uniquemeasurement strategy; it profiles simultaneously at four separate incidence angles (approximately 30, 35, 40 and50 degrees) while conically scanning at 60 RPM. A summary of the principles of operation and the design ofthe instrument is given, followed by examples of IWRAP’s unique imaging capability. To our knowledge, theseexamples include the highest-resolution measurements of the ABL winds in a hurricane ever obtained.
I. INTRODUCTION
Tropical Cyclones (TCs) and severe ocean storms pose one of the largest natural threats to coastal areas and
maritime interests. Accurate track and intensity forecasts with skill extending out several days are required to
minimize the financial impact and eliminate the loss of life caused by these extreme weather events. Microwave
scatterometers and Doppler radars have already proven their effectiveness in tracking the position and intensity of
these weather phenomena [1] and have aided researchers to better understand air-sea transfer under very strong
wind forcing to improve TC forecasting. Currently, satellite-based scatterometers are used on a daily basis to map
the global ocean surface wind field.
IEEE TRANSACTIONS ON GEOSCIENCE AND REMOTE SENSING, VOL. XX, NO. XX 2
Scatterometers are microwave radars designed to accurately measure the normalized radar cross section (NRCS) of
natural targets such as the ocean surface. At microwave frequencies, and for incidence angles between approximately
25 and 60 degrees, the composite surface theory tries to explain the backscatter from the sea surface. In this region,
the amplitude of the radar signal is primarily determined by Bragg resonance from the ocean capillary-gravity
waves. These waves are induced by wind-ocean coupling, so its average is governed by the local wind speed [2]
[3]. The NRCS is measured by transmitting a known amount of power and measuring the reflected power.
For more than three decades, physically-based [4] [5] and empirically-based [6] [7] [8] [9] [10] model functions
have been developed to describe the ocean backscatter’s relationship to the ocean surface wind speed and direction.
Due to insufficient knowledge of the complex relationship between the sea surface roughness and environmental
conditions, and the electromagnetic scattering mechanisms from rough ocean surfaces, the inversion of aircraft
and spacecraft scatterometer measurements currently relies on empirically-based models rather than physically-
based theoretical models. Two presently used model functions are the QuikSCAT (QSCAT1) model function at
Ku-Band (derived from the SeaWinds scatterometer aboard the National Aeronautics and Space Administration
(NASA) QSCAT satellite) and the CMOD5 model function at C-Band (developed from the Active Microwave
Instrument (AMI) sensor aboard the European Space Agency (ESA) ERS-1 and ERS-2 satellites and the University
of Massachusetts (UMass) scatterometer data).
Although generally robust, scatterometer wind vector retrievals can be contaminated by precipitation [11]. Rain
affects the radar measurement in three primary ways: 1) the microwave signal is attenuated by rain drops resulting in
an underestimate of the NRCS; 2) part of the radar signal is scattered by the rain drops resulting in an overestimate
of the NRCS due to volume backscatter; and 3) the ocean surface roughness is perturbed by the impinging rain
drops, thereby influencing the surface backscatter measurement. Additionally, down and up drafts associated with
precipitation events may also modify the NRCS measurements by making the local wind more anisotropic. These
effects are complicated and have not been quantified in such a way to provide definitive guidance for operational
users working with potentially rain contaminated data. Another limitation of the current ocean surface wind vector
retrievals is associated with the fact that current Geophysical Model Functions (GMFs) overpredict the NRCS
values for high wind speeds, and thus wind fields derived from satellite-based scatterometers can significantly
underestimate the high winds.
Doppler weather radars have also proven to be extremely helpful for metereologists in TC monitoring and
forecasting. By measuring the radial velocity and backscatter power of rain drops, they provide researchers with
horizontal and vertical winds, fall speeds of the hydrometeors and radar reflectivity. These measurements are crucial
in understanding the air-sea interfacial boundary layer under hurricane force winds, where the physical processes are
not properly characterized [12]. Doppler radars have also been used to map horizontal and vertical components of
IEEE TRANSACTIONS ON GEOSCIENCE AND REMOTE SENSING, VOL. XX, NO. XX 3
amospheric boundary layer (ABL) winds within TCs, which makes it possible to reconstruct their inner core structure
[13], where the strongest convection, precipitation, and winds are concentrated. Thusfar, aircraft measurements have
neither provided sufficient spatial resolution of the ABL wind field to aid understanding of the temporal evolution
of the inner-core structure of hurricanes [14], nor have they been able to identify the sub-kilometer scale, boundary
layer rolls that strongly modulate the near-surface wind speed [15]. This has limited the improvement of intensity
forecasts over the last decade. Accurate knowledge of precipitation and convective processes, as elements impacting
on the resultant latent heating of the tropical disturbances and their structure, has become an exceedingly important
ingredient in the numerical model prediction of hurricane intensity and movement.
A high-resolution microwave radar capable of measuring the ocean surface backscatter, the attenuation and
volume backscatter from precipitation, and Doppler velocity profiles from precipitation could play a significant
role by: 1) improving the intensity forecasts by providing high resolution ABL velocity data to properly initialize
inner-core circulation for high-resolution numerical models; 2) improving track and intensity forecasts, as well as
our understanding of severe storm structure from the derived ABL and ocean surface wind field; and 3) answering
the question of how precipitation modifies the ocean surface backscatter at microwave frequencies. In this paper,
we describe such a radar: the Imaging Wind and Rain Airborne Profiler (IWRAP), a conically scanning microwave
radar that images the 3-D ABL winds by acquiring Doppler and reflectivity profiles of precipitation simultaneously
at four separate incidence angles, two frequencies and 30 m range resolution. By providing the ocean surface wind
vector via scatterometry, 3-D ABL wind field via Doppler measurements from precipitation, and rain rate estimates
from dual-wavelength differential attenuation, IWRAP is a powerful tool to improve the understanding of the inner
core structure of TCs. The IWRAP surface backscatter measurements, together with the coincident observations of
precipitation, will also allow to analyze the effects of precipitation on the surface backscatter for all wind conditions.
This paper describes the principles of operation and design of IWRAP. It also presents experimental results
that show, to our knowledge, the highest resolution measurements ever obtained within the inner core of a
hurricane. Section II describes the systems design. Section III provides the engineering details about the IWRAP
system hardware implementation, and in Section IV we present initial results that demonstrate its performance and
capabilities through a unique set of measurements acquired during the field deployments for the Hurricane Seasons
2002 and 2003.
II. SYSTEM DESIGN
IWRAP is a conically scanning, dual frequency (C- and Ku-band) Doppler radar that measures Doppler velocity
and reflectivity profiles from precipitation as well as ocean surface backscatter at 30 m resolution simultaneously at
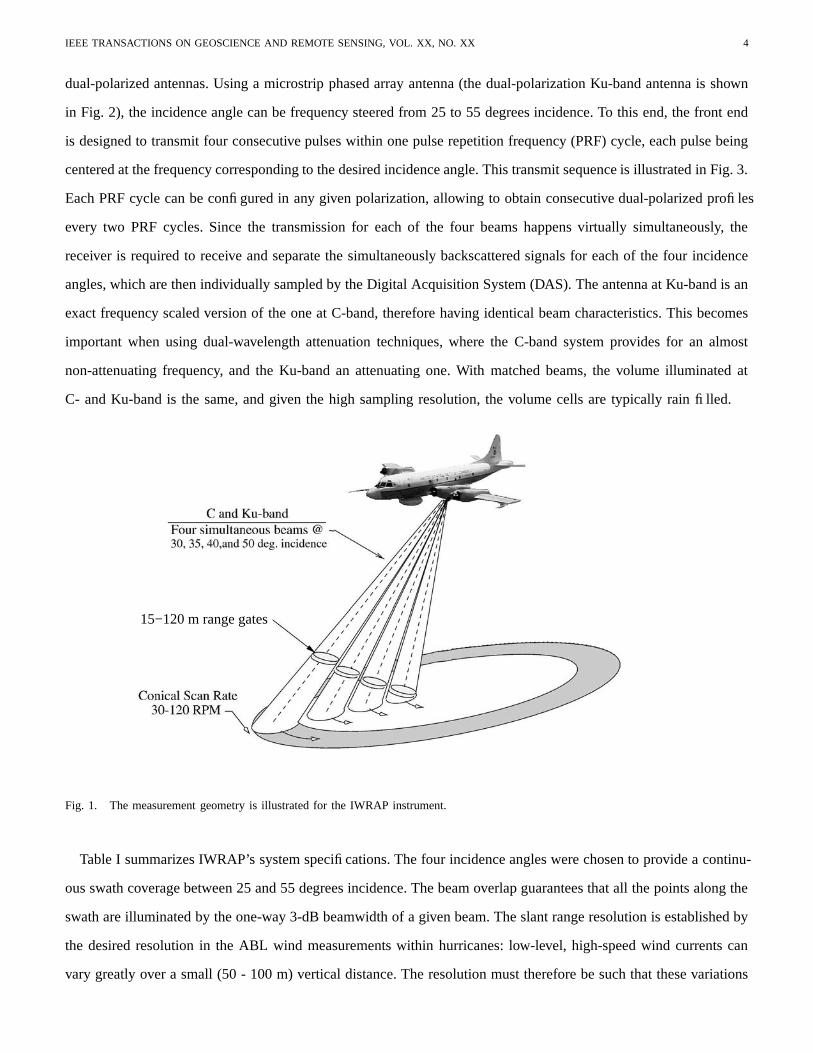
four different incidence angles (approximately 30, 35, 40 and 50 degrees). Fig. 1 illustrates the unique measurement
technique employed by this instrument. The instrument can operate either with single-polarized antennas or with
IEEE TRANSACTIONS ON GEOSCIENCE AND REMOTE SENSING, VOL. XX, NO. XX 4
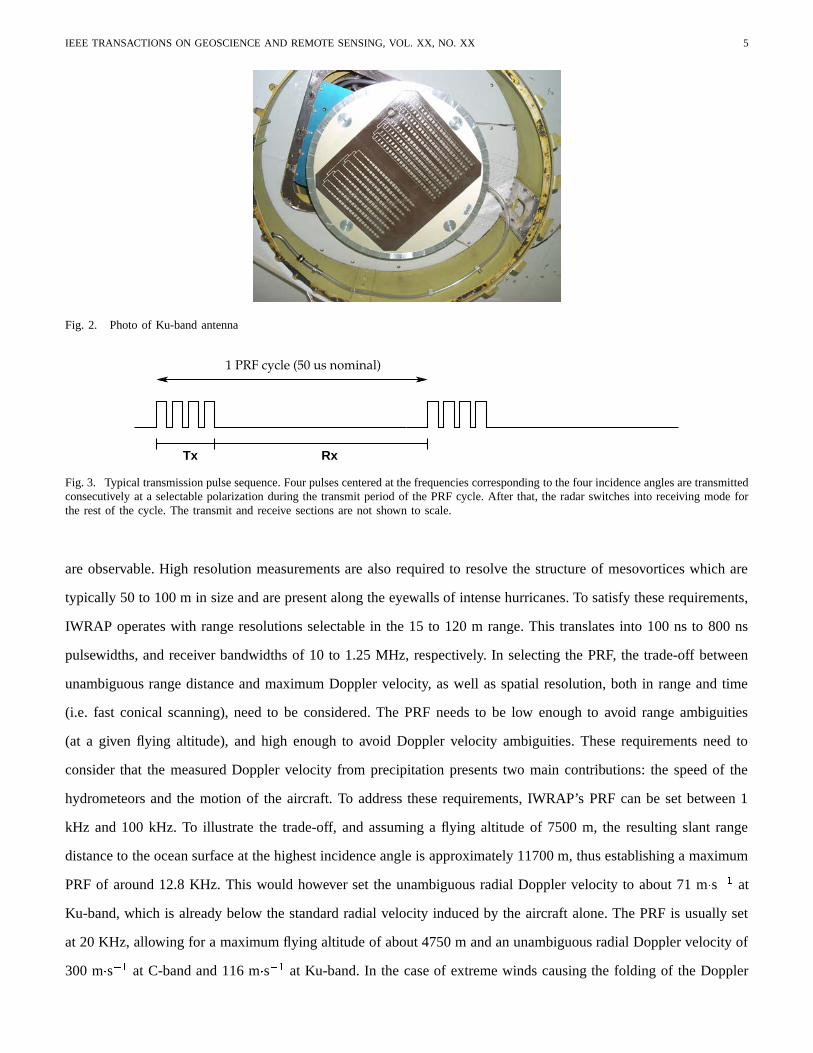
dual-polarized antennas. Using a microstrip phased array antenna (the dual-polarization Ku-band antenna is shown
in Fig. 2), the incidence angle can be frequency steered from 25 to 55 degrees incidence. To this end, the front end
is designed to transmit four consecutive pulses within one pulse repetition frequency (PRF) cycle, each pulse being
centered at the frequency corresponding to the desired incidence angle. This transmit sequence is illustrated in Fig. 3.
Each PRF cycle can be configured in any given polarization, allowing to obtain consecutive dual-polarized profiles
every two PRF cycles. Since the transmission for each of the four beams happens virtually simultaneously, the
receiver is required to receive and separate the simultaneously backscattered signals for each of the four incidence
angles, which are then individually sampled by the Digital Acquisition System (DAS). The antenna at Ku-band is an
exact frequency scaled version of the one at C-band, therefore having identical beam characteristics. This becomes
important when using dual-wavelength attenuation techniques, where the C-band system provides for an almost
non-attenuating frequency, and the Ku-band an attenuating one. With matched beams, the volume illuminated at
C- and Ku-band is the same, and given the high sampling resolution, the volume cells are typically rain filled.
15−120 m range gates
Fig. 1. The measurement geometry is illustrated for the IWRAP instrument.
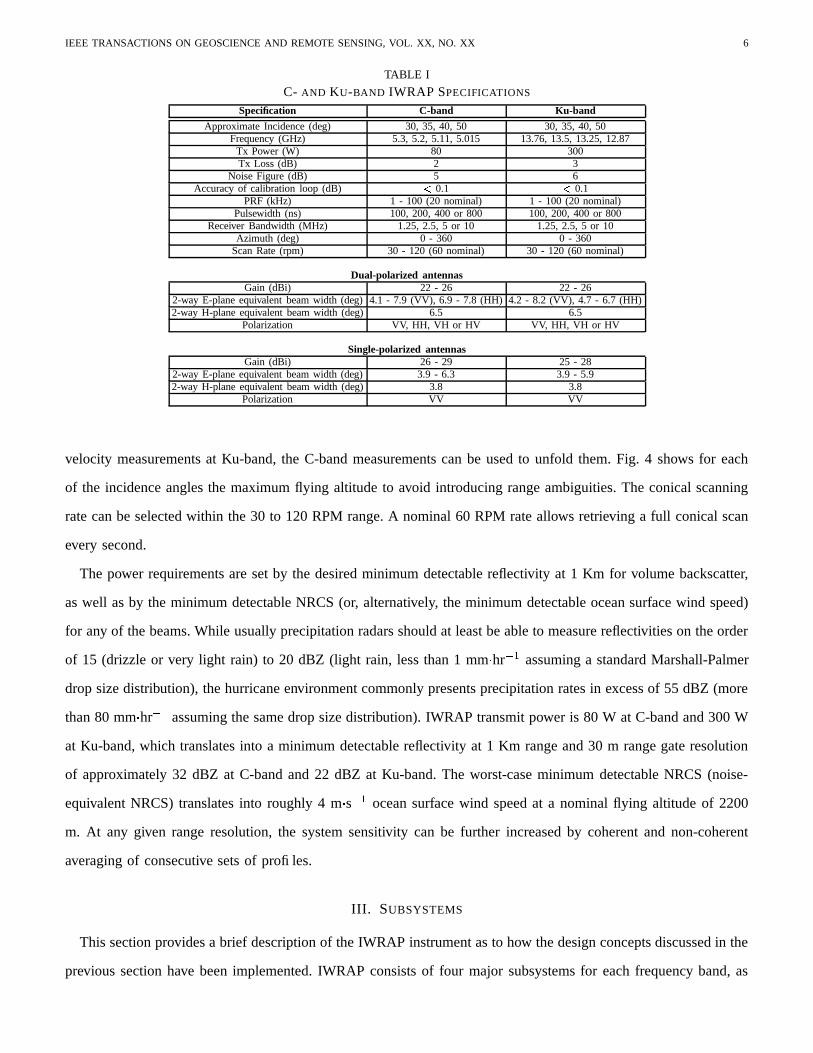
Table I summarizes IWRAP’s system specifications. The four incidence angles were chosen to provide a continu-
ous swath coverage between 25 and 55 degrees incidence. The beam overlap guarantees that all the points along the
swath are illuminated by the one-way 3-dB beamwidth of a given beam. The slant range resolution is established by
the desired resolution in the ABL wind measurements within hurricanes: low-level, high-speed wind currents can
vary greatly over a small (50 - 100 m) vertical distance. The resolution must therefore be such that these variations
IEEE TRANSACTIONS ON GEOSCIENCE AND REMOTE SENSING, VOL. XX, NO. XX 5
Fig. 2. Photo of Ku-band antenna
Tx Rx
1 PRF cycle (50 us nominal)
Fig. 3. Typical transmission pulse sequence. Four pulses centered at the frequencies corresponding to the four incidence angles are transmittedconsecutively at a selectable polarization during the transmit period of the PRF cycle. After that, the radar switches into receiving mode forthe rest of the cycle. The transmit and receive sections are not shown to scale.
are observable. High resolution measurements are also required to resolve the structure of mesovortices which are
typically 50 to 100 m in size and are present along the eyewalls of intense hurricanes. To satisfy these requirements,
IWRAP operates with range resolutions selectable in the 15 to 120 m range. This translates into 100 ns to 800 ns
pulsewidths, and receiver bandwidths of 10 to 1.25 MHz, respectively. In selecting the PRF, the trade-off between
unambiguous range distance and maximum Doppler velocity, as well as spatial resolution, both in range and time
(i.e. fast conical scanning), need to be considered. The PRF needs to be low enough to avoid range ambiguities
(at a given flying altitude), and high enough to avoid Doppler velocity ambiguities. These requirements need to
consider that the measured Doppler velocity from precipitation presents two main contributions: the speed of the
hydrometeors and the motion of the aircraft. To address these requirements, IWRAP’s PRF can be set between 1
kHz and 100 kHz. To illustrate the trade-off, and assuming a flying altitude of 7500 m, the resulting slant range
distance to the ocean surface at the highest incidence angle is approximately 11700 m, thus establishing a maximum
PRF of around 12.8 KHz. This would however set the unambiguous radial Doppler velocity to about 71 m � s�
�
at
Ku-band, which is already below the standard radial velocity induced by the aircraft alone. The PRF is usually set
at 20 KHz, allowing for a maximum flying altitude of about 4750 m and an unambiguous radial Doppler velocity of
300 m � s�
�
at C-band and 116 m � s�
�
at Ku-band. In the case of extreme winds causing the folding of the Doppler
IEEE TRANSACTIONS ON GEOSCIENCE AND REMOTE SENSING, VOL. XX, NO. XX 6
TABLE I
C- AND KU-BAND IWRAP SPECIFICATIONS
Specification C-band Ku-band
Approximate Incidence (deg) 30, 35, 40, 50 30, 35, 40, 50Frequency (GHz) 5.3, 5.2, 5.11, 5.015 13.76, 13.5, 13.25, 12.87
Tx Power (W) 80 300Tx Loss (dB) 2 3
Noise Figure (dB) 5 6Accuracy of calibration loop (dB) � 0.1 � 0.1
PRF (kHz) 1 - 100 (20 nominal) 1 - 100 (20 nominal)Pulsewidth (ns) 100, 200, 400 or 800 100, 200, 400 or 800
Receiver Bandwidth (MHz) 1.25, 2.5, 5 or 10 1.25, 2.5, 5 or 10Azimuth (deg) 0 - 360 0 - 360
Scan Rate (rpm) 30 - 120 (60 nominal) 30 - 120 (60 nominal)
Dual-polarized antennasGain (dBi) 22 - 26 22 - 26
2-way E-plane equivalent beam width (deg) 4.1 - 7.9 (VV), 6.9 - 7.8 (HH) 4.2 - 8.2 (VV), 4.7 - 6.7 (HH)2-way H-plane equivalent beam width (deg) 6.5 6.5
Polarization VV, HH, VH or HV VV, HH, VH or HV
Single-polarized antennasGain (dBi) 26 - 29 25 - 28
2-way E-plane equivalent beam width (deg) 3.9 - 6.3 3.9 - 5.92-way H-plane equivalent beam width (deg) 3.8 3.8
Polarization VV VV
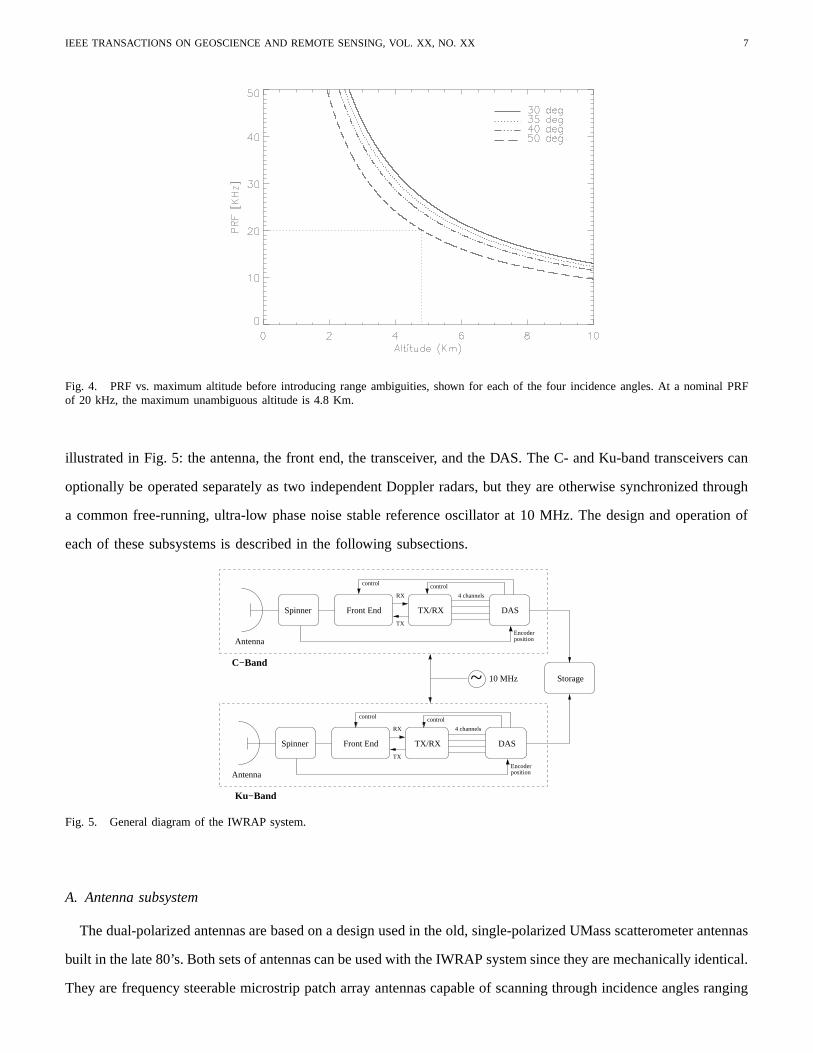
velocity measurements at Ku-band, the C-band measurements can be used to unfold them. Fig. 4 shows for each
of the incidence angles the maximum flying altitude to avoid introducing range ambiguities. The conical scanning
rate can be selected within the 30 to 120 RPM range. A nominal 60 RPM rate allows retrieving a full conical scan
every second.
The power requirements are set by the desired minimum detectable reflectivity at 1 Km for volume backscatter,
as well as by the minimum detectable NRCS (or, alternatively, the minimum detectable ocean surface wind speed)
for any of the beams. While usually precipitation radars should at least be able to measure reflectivities on the order
of 15 (drizzle or very light rain) to 20 dBZ (light rain, less than 1 mm � hr�
�
assuming a standard Marshall-Palmer
drop size distribution), the hurricane environment commonly presents precipitation rates in excess of 55 dBZ (more
than 80 mm � hr�
�
assuming the same drop size distribution). IWRAP transmit power is 80 W at C-band and 300 W
at Ku-band, which translates into a minimum detectable reflectivity at 1 Km range and 30 m range gate resolution
of approximately 32 dBZ at C-band and 22 dBZ at Ku-band. The worst-case minimum detectable NRCS (noise-
equivalent NRCS) translates into roughly 4 m � s�
�
ocean surface wind speed at a nominal flying altitude of 2200
m. At any given range resolution, the system sensitivity can be further increased by coherent and non-coherent
averaging of consecutive sets of profiles.
III. SUBSYSTEMS
This section provides a brief description of the IWRAP instrument as to how the design concepts discussed in the
previous section have been implemented. IWRAP consists of four major subsystems for each frequency band, as
IEEE TRANSACTIONS ON GEOSCIENCE AND REMOTE SENSING, VOL. XX, NO. XX 7
Fig. 4. PRF vs. maximum altitude before introducing range ambiguities, shown for each of the four incidence angles. At a nominal PRFof 20 kHz, the maximum unambiguous altitude is 4.8 Km.
illustrated in Fig. 5: the antenna, the front end, the transceiver, and the DAS. The C- and Ku-band transceivers can
optionally be operated separately as two independent Doppler radars, but they are otherwise synchronized through
a common free-running, ultra-low phase noise stable reference oscillator at 10 MHz. The design and operation of
each of these subsystems is described in the following subsections.
TX/RX
Antenna
TX
RX 4 channels
DASFront EndSpinner
Encoderposition
TX/RX
Antenna
TX
RX 4 channels
DASFront EndSpinner
Encoderposition
Storage~C−Band
Ku−Band
control control
control control
10 MHz
Fig. 5. General diagram of the IWRAP system.
A. Antenna subsystem
The dual-polarized antennas are based on a design used in the old, single-polarized UMass scatterometer antennas
built in the late 80’s. Both sets of antennas can be used with the IWRAP system since they are mechanically identical.
They are frequency steerable microstrip patch array antennas capable of scanning through incidence angles ranging
IEEE TRANSACTIONS ON GEOSCIENCE AND REMOTE SENSING, VOL. XX, NO. XX 8
from 20 to 50 degrees off boresight by sweeping the transmitted frequency from approximately 5 to 5.5 GHz at
C-Band for the dual-polarized antenna (4.98 to 5.7 GHz for the single-polarized antenna), and from 12.9 to 14.2
GHz at Ku-Band (12.8 to 14.8 GHz for the single-polarized antenna). The wide bandwidth comes as a result of the
element spacing chosen to accomplish the frequency scanning. Each dual-polarized antenna consists of two patch
arrays of eight corporate feed columns, one patch array for each polarization. Each column is made up of twenty
Taylor weighted series elements mounted over a 48-inch aluminum-honeycomb panel. The gain is maximized at
35 degrees, and it increases with an increasing frequency (i.e. lower incidence angles) due to the increasing of
effective aperture size, which is a function of the cosine of the incidence angle. A single-pole dual-throw (SPDT)
switch is used to select the polarization port in the antenna to be used during receiving or transmitting modes.
The single-polarized antenna is made up of 16 series fed columns, each with 27 elements. A Taylor weighting is
applied to the 27 elements resulting in sidelobe levels for the array that are approximately 20 dB from the main
lobe. A hollow shaft is mounted on the other side of the aluminum-honeycomb disc. This shaft fits up through the
bearing housing of the spinner unit.
The spinner unit consists of a baseplate on which a dc motor, an encoder, and the bearing housing are mounted.
The motor rotates the antenna in azimuth at speeds up to 120 RPM. A 12-bit encoder is used with each antenna,
thereby providing an accuracy better than one tenth of a degree in the measurement of the antenna azimuth position.
The encoder position is read by the DAS subsystem with every transmitted pulse to determine the exact field of
view for each pulse.
B. Front end and Tx/Rx subsytems
The basic function of the Transmit/Receive (Tx/Rx) subsystem is to generate the transmitted pulses and upconvert
them to the appropriate radiofrequency (RF) frequencies, as well as to downconvert the received signal and separate
it into the channels that will then be routed to the DAS. The front end subsystem performs the amplification of the
signals to be transmitted and routes them to the antenna subsystem during transmission, and amplifies the received
signal and routes it back to the Tx/Rx subsystem during reception. It also incorporates an internal calibration loop
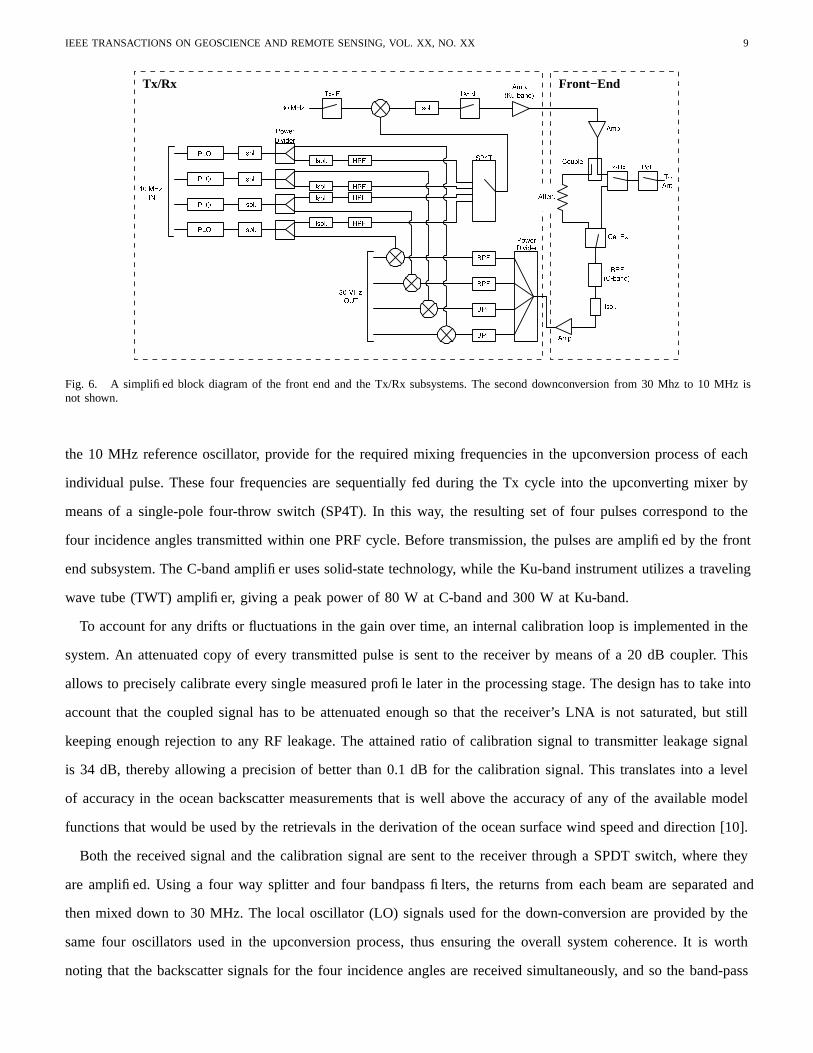
to correct for system gain drifts. A functional block diagram of both the front end and the Tx/Rx subsystem is
shown in Fig. 6.
To generate the signals for transmission, a 30 MHz CW signal in the Tx/Rx subsystem, locked to the reference
10 MHz oscillator, is first pulsed by means of a single-pole single-throw (SPST) switch to generate the train of
four consecutive pulses. Each individual pulse is then upconverted to the appropriate transmission frequency (5.015,
5.11 5.2 and 5.3 GHz for the C-band portion of the instrument, and 12.87, 13.25, 13.5 and 13.76 GHz for the
Ku-band portion) by the front end subsystem. For each frequency band, four separate oscillators, also locked to
IEEE TRANSACTIONS ON GEOSCIENCE AND REMOTE SENSING, VOL. XX, NO. XX 9
Tx/Rx Front−End
Fig. 6. A simplified block diagram of the front end and the Tx/Rx subsystems. The second downconversion from 30 Mhz to 10 MHz isnot shown.
the 10 MHz reference oscillator, provide for the required mixing frequencies in the upconversion process of each
individual pulse. These four frequencies are sequentially fed during the Tx cycle into the upconverting mixer by
means of a single-pole four-throw switch (SP4T). In this way, the resulting set of four pulses correspond to the
four incidence angles transmitted within one PRF cycle. Before transmission, the pulses are amplified by the front
end subsystem. The C-band amplifier uses solid-state technology, while the Ku-band instrument utilizes a traveling
wave tube (TWT) amplifier, giving a peak power of 80 W at C-band and 300 W at Ku-band.
To account for any drifts or fluctuations in the gain over time, an internal calibration loop is implemented in the
system. An attenuated copy of every transmitted pulse is sent to the receiver by means of a 20 dB coupler. This
allows to precisely calibrate every single measured profile later in the processing stage. The design has to take into
account that the coupled signal has to be attenuated enough so that the receiver’s LNA is not saturated, but still
keeping enough rejection to any RF leakage. The attained ratio of calibration signal to transmitter leakage signal
is 34 dB, thereby allowing a precision of better than 0.1 dB for the calibration signal. This translates into a level
of accuracy in the ocean backscatter measurements that is well above the accuracy of any of the available model
functions that would be used by the retrievals in the derivation of the ocean surface wind speed and direction [10].
Both the received signal and the calibration signal are sent to the receiver through a SPDT switch, where they
are amplified. Using a four way splitter and four bandpass filters, the returns from each beam are separated and
then mixed down to 30 MHz. The local oscillator (LO) signals used for the down-conversion are provided by the
same four oscillators used in the upconversion process, thus ensuring the overall system coherence. It is worth
noting that the backscatter signals for the four incidence angles are received simultaneously, and so the band-pass
IEEE TRANSACTIONS ON GEOSCIENCE AND REMOTE SENSING, VOL. XX, NO. XX 10
filters are the devices responsible of separating these signals, resulting in four completely independent channels that
will then be sent to the digital receiver. At C-Band, the system also includes a band-reject filter, used to remove
interfering signals from the aircraft’s lower fuselage C-Band radar, prior to splitting the received signal.
The final intermediate frequency (IF) section in the Tx/Rx subsystem (not shown in Fig. 6) performs a second
downconversion from 30 MHz to 10 MHz right before the DAS. The 30 MHz signal for each incidence angle
is mixed down by means of a 40 MHz oscillator (also locked to the reference 10 MHz oscillator). The 40 MHz
oscillator is also the reference clock used by the DAS subsystem. As it can be seen, great effort has been devoted
to ensure the overall system coherence so that the Doppler measurements are not contaminated.
C. Digital Acquisition System
The DAS implements a digital receiver that performs in-phase and quadrature (I�
Q) demodulation on each
one of the four IF output received signals provided by the Tx/Rx subsystem. These IF signals have a maximum
1 dB bandwdith of 10 MHz. The IF demodulation into complex baseband in the digital domain avoids typical
gain imbalances and DC offsets associated with analog quadrature phase detectors. The digital receiver is primarily
implemented on a GV Associates GV290 board, which contains four 100 MHz Analog to Digital Converters (ADCs)
connected to two Xilinx XCV2000e Field Programmable Gate Arrays (FPGAs), each one containing a two channel
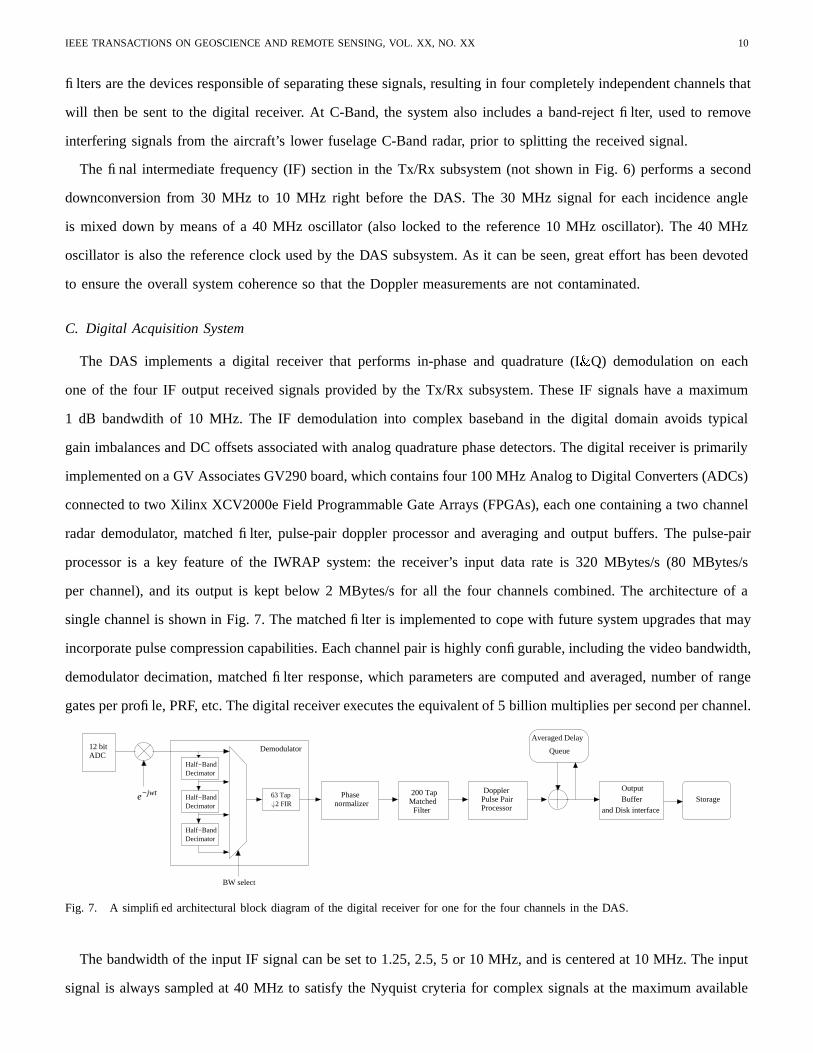
radar demodulator, matched filter, pulse-pair doppler processor and averaging and output buffers. The pulse-pair
processor is a key feature of the IWRAP system: the receiver’s input data rate is 320 MBytes/s (80 MBytes/s
per channel), and its output is kept below 2 MBytes/s for all the four channels combined. The architecture of a
single channel is shown in Fig. 7. The matched filter is implemented to cope with future system upgrades that may
incorporate pulse compression capabilities. Each channel pair is highly configurable, including the video bandwidth,
demodulator decimation, matched filter response, which parameters are computed and averaged, number of range
gates per profile, PRF, etc. The digital receiver executes the equivalent of 5 billion multiplies per second per channel.
Half−BandDecimator
Half−BandDecimator
Half−BandDecimator
63 Tap2 FIR
12 bit
−jwte
ADC
BW select
Queue
OutputBuffer Storagenormalizer
Phase Doppler Pulse PairProcessor
Averaged Delay
and Disk interface
200 TapMatched
Filter
Demodulator
Fig. 7. A simplified architectural block diagram of the digital receiver for one for the four channels in the DAS.
The bandwidth of the input IF signal can be set to 1.25, 2.5, 5 or 10 MHz, and is centered at 10 MHz. The input
signal is always sampled at 40 MHz to satisfy the Nyquist cryteria for complex signals at the maximum available
IEEE TRANSACTIONS ON GEOSCIENCE AND REMOTE SENSING, VOL. XX, NO. XX 11
bandwidth. The demodulator implements a digital mixer with a local oscillator at 10 MHz and a decimating
filter bank. The mixer mixes the real input signal with a complex sinusoid at one fourth the sampling frequency.
The resulting baseband signal is low pass filtered and decimated to conform the bandwidth to the configured
specifications. The phase normalizer captures the phase angle of the complex sample at the range gate corresponding
to the copy of the transmitted signal provided by the calibration loop and rotates all the range gates by that angle
so that the reference range gate has a zero phase angle. This feature is currently not used due to the excellent
phase stability of the amplifiers, but allows to cope with future upgrades to high-power, non-coherent amplifiers
such as magnetrons. The signal is then pulse compressed using a programable 200 tap complex matched filter.
The number of taps provide for a range sidelobe ratio better than 45 dB when a conventional chirp pulse is used.
IWRAP does not currently use pulse compression, and so the matched filter is configured as a delta function. The
Doppler pulse pair processor is implemented as a magnitude and covariance estimate of the demodulated, pulse
compressed data for each range gate (the covariance estimate uses the range gate from the previous profile), and
the result is summed on a per-range gate basis using an external SRAM memory block. Among other functions,
the pulse-pair processor provides the averaged magnitude ( ����� ), expressed as
������� �� �
�� ������� ����� � � (1)
where � ��� ����� ��� ����� ��� � with the ��� subscript denoting the transmit and receive polarization, and�
giving
the number of profiles to average. The pulse-pair processor also provides the real ( � � ��� ) and imaginary ( �!� ��� )parts of the complex covariance estimate (i.e. the autocorrelation function, "# ��� ). At a given range gate $&% , "# ��� is
given by [18]: "# ���(')$&%(*+�,� �-���(')$&%(*.�0/1�2�3���4')$&%(*5� �� �
������ �76��� ')8�* � ���4')89� � * (2)
where 6 denotes complex conjugate. The Doppler velocity can thus be derived directly from the � �:��� and �!�;���as given by: "< ��= >?1@BADC1EGFIH �
�KJ �2�3���� � ���;L (3)
whereA C
is the pulse repetition period. The averaging logic in the digital receiver performs only the summation;
the results are not divided by M. In addition to the above accumulations, position information (encoder, pitch, and
roll data) are also accumulated. Raw data mode is also available, and the pulse compressed data can be averaged
without the pulse-pair operation. In that case, letting� � � provides for the direct output of the raw data. The
accumulation logic is also flexible enough to cope with different combinations of transmit and receive polarization
states. Consecutive profiles acquired at VV and HH polarizations can be accumulated independently by means of a
number of separate buffers implemented in the FPGAs, and the pulse-pair processor can be run independently with
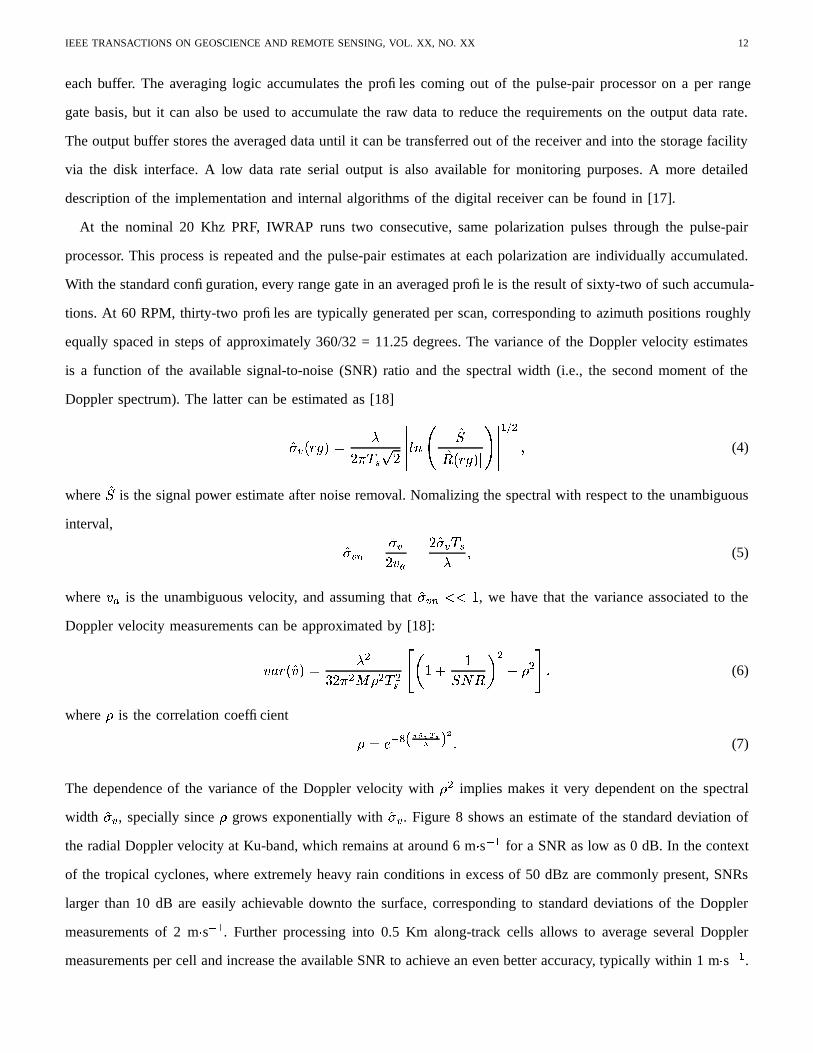
IEEE TRANSACTIONS ON GEOSCIENCE AND REMOTE SENSING, VOL. XX, NO. XX 12
each buffer. The averaging logic accumulates the profiles coming out of the pulse-pair processor on a per range
gate basis, but it can also be used to accumulate the raw data to reduce the requirements on the output data rate.
The output buffer stores the averaged data until it can be transferred out of the receiver and into the storage facility
via the disk interface. A low data rate serial output is also available for monitoring purposes. A more detailed
description of the implementation and internal algorithms of the digital receiver can be found in [17].
At the nominal 20 Khz PRF, IWRAP runs two consecutive, same polarization pulses through the pulse-pair
processor. This process is repeated and the pulse-pair estimates at each polarization are individually accumulated.
With the standard configuration, every range gate in an averaged profile is the result of sixty-two of such accumula-
tions. At 60 RPM, thirty-two profiles are typically generated per scan, corresponding to azimuth positions roughly
equally spaced in steps of approximately 360/32 = 11.25 degrees. The variance of the Doppler velocity estimates
is a function of the available signal-to-noise (SNR) ratio and the spectral width (i.e., the second moment of the
Doppler spectrum). The latter can be estimated as [18]
"��� ')$&%(*5� >� @BA C�� � ����� � H � "�� "# ')$&%(* � ����� ��� �� (4)
where "� is the signal power estimate after noise removal. Nomalizing the spectral with respect to the unambiguous
interval, "� ��� � "���� <�� � � "��� A C> (5)
where <�� is the unambiguous velocity, and assuming that "��������� � , we have that the variance associated to the
Doppler velocity measurements can be approximated by [18]:
< F $4' "< * � > ���� @ � ��� � A �C�� J � � ���� # L � = � ��� (6)
where�
is the correlation coefficient � � � ��! '#"%$&('*),+- */.10 (7)
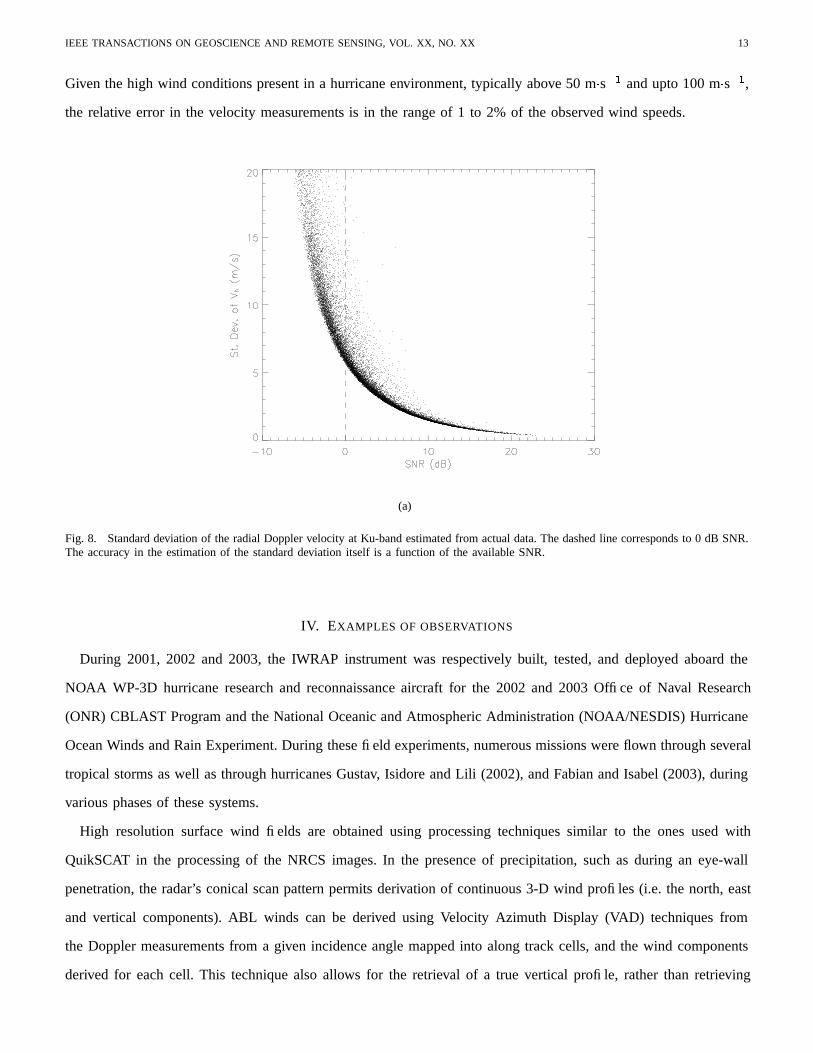
The dependence of the variance of the Doppler velocity with� �
implies makes it very dependent on the spectral
width "��� , specially since�
grows exponentially with "��� . Figure 8 shows an estimate of the standard deviation of
the radial Doppler velocity at Ku-band, which remains at around 6 m � s�
�
for a SNR as low as 0 dB. In the context
of the tropical cyclones, where extremely heavy rain conditions in excess of 50 dBz are commonly present, SNRs
larger than 10 dB are easily achievable downto the surface, corresponding to standard deviations of the Doppler
measurements of 2 m � s�
�
. Further processing into 0.5 Km along-track cells allows to average several Doppler
measurements per cell and increase the available SNR to achieve an even better accuracy, typically within 1 m � s�
�
.
IEEE TRANSACTIONS ON GEOSCIENCE AND REMOTE SENSING, VOL. XX, NO. XX 13
Given the high wind conditions present in a hurricane environment, typically above 50 m � s�
�
and upto 100 m � s�
�
,
the relative error in the velocity measurements is in the range of 1 to 2% of the observed wind speeds.
(a)
Fig. 8. Standard deviation of the radial Doppler velocity at Ku-band estimated from actual data. The dashed line corresponds to 0 dB SNR.The accuracy in the estimation of the standard deviation itself is a function of the available SNR.
IV. EXAMPLES OF OBSERVATIONS
During 2001, 2002 and 2003, the IWRAP instrument was respectively built, tested, and deployed aboard the
NOAA WP-3D hurricane research and reconnaissance aircraft for the 2002 and 2003 Office of Naval Research
(ONR) CBLAST Program and the National Oceanic and Atmospheric Administration (NOAA/NESDIS) Hurricane
Ocean Winds and Rain Experiment. During these field experiments, numerous missions were flown through several
tropical storms as well as through hurricanes Gustav, Isidore and Lili (2002), and Fabian and Isabel (2003), during
various phases of these systems.
High resolution surface wind fields are obtained using processing techniques similar to the ones used with
QuikSCAT in the processing of the NRCS images. In the presence of precipitation, such as during an eye-wall
penetration, the radar’s conical scan pattern permits derivation of continuous 3-D wind profiles (i.e. the north, east
and vertical components). ABL winds can be derived using Velocity Azimuth Display (VAD) techniques from
the Doppler measurements from a given incidence angle mapped into along track cells, and the wind components
derived for each cell. This technique also allows for the retrieval of a true vertical profile, rather than retrieving
IEEE TRANSACTIONS ON GEOSCIENCE AND REMOTE SENSING, VOL. XX, NO. XX 14
a wind field at an increasing radial distance from the nadir axis as the distance from the aircraft increases. This
constitutes a novel type of measurement within the inner core of TCs: GPS dropsondes, routinely used since 1997
by NOAA during their hurricane reconnaissance flights, cannot provide truly vertical profiles because they advect,
on average, 10 to 15 Km tangentially as they fall for about 2 Km vertically due to the hurricane force winds
within the inner core; and other radars aboard the aircraft, such as the Lower Fuselage (LF) radar and the Tail
(TA) Doppler radar, cannot see below the aircraft or well near the surface: the TA Doppler radar has a much lower
resolution and has very little azimuth diversity, and the LF radar is magnitude only. With IWRAP, at a nominal
spinning rate of 60 RPMs, a full scan is retrieved every second, at a worst case (outer incidence angle) vertical
sampling of 30 m.
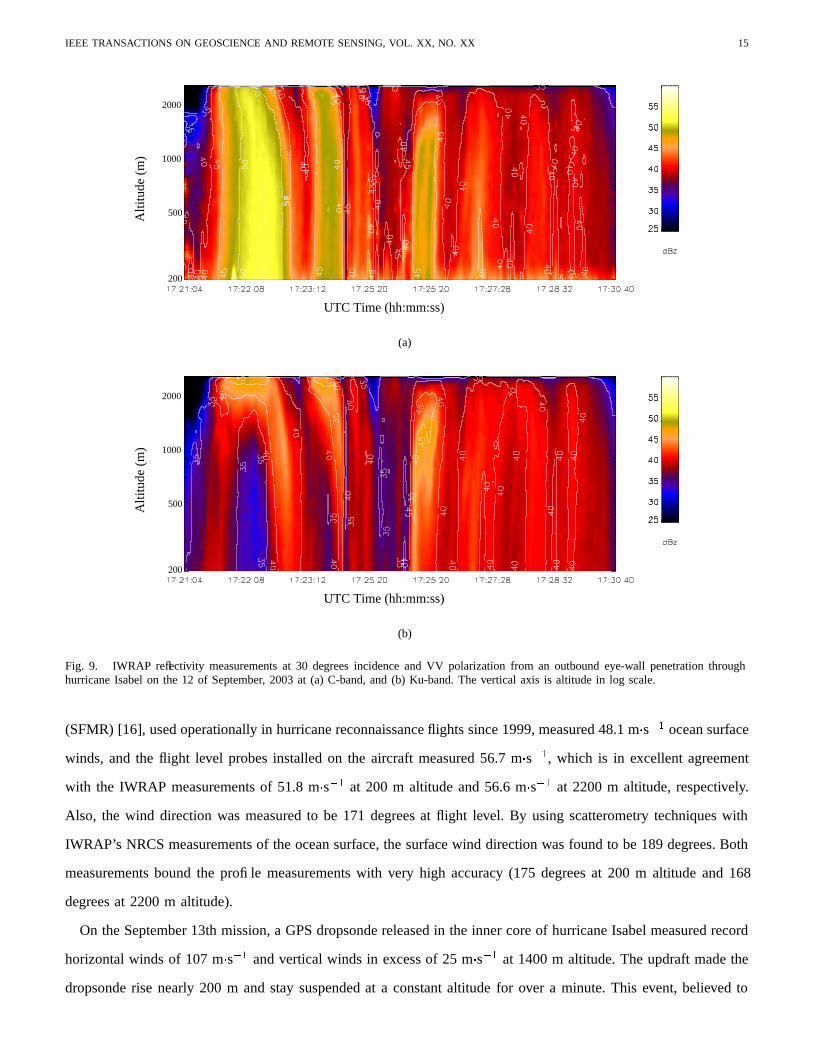
As an example of the instrument’s capabilities and potential, Fig. 9 presents the IWRAP reflectivity measurements
for an outbound eye-wall penetration through Hurricane Isabel’s eye on September 12th, 2003 at C- and Ku-band
and 30 degrees incidence. Both reflectivity maps show important differencies, particularly during the strongest rain
events (for example, at 17:22:08 GMT): while C-band remains a virtually unattenuated frequency, the measurements
at Ku-band suffer from heavy attenuation in the presence of rain. It is precisely such differential reflectivity between
frequencies that allows to derive the rainfall rate. The two independent reflectivity measurements also enable
the derivation of two-parameter drop size distribution (DSD) models. The reflectivity maps also show a unique
observation: a very significative periodic structure of rainbands within the inner-core of the eye-wall. These rainbands
seem to repeat every 4 to 8 Km, which seem too large a separation to be boundary layer rolls. The reflectivities
involved are very large as well, almost reaching 55 dBZ, very near the hail threshold. Given that hail is very rare
in hurricanes, it is likely to be associated to very large drops in the drop size distribution.
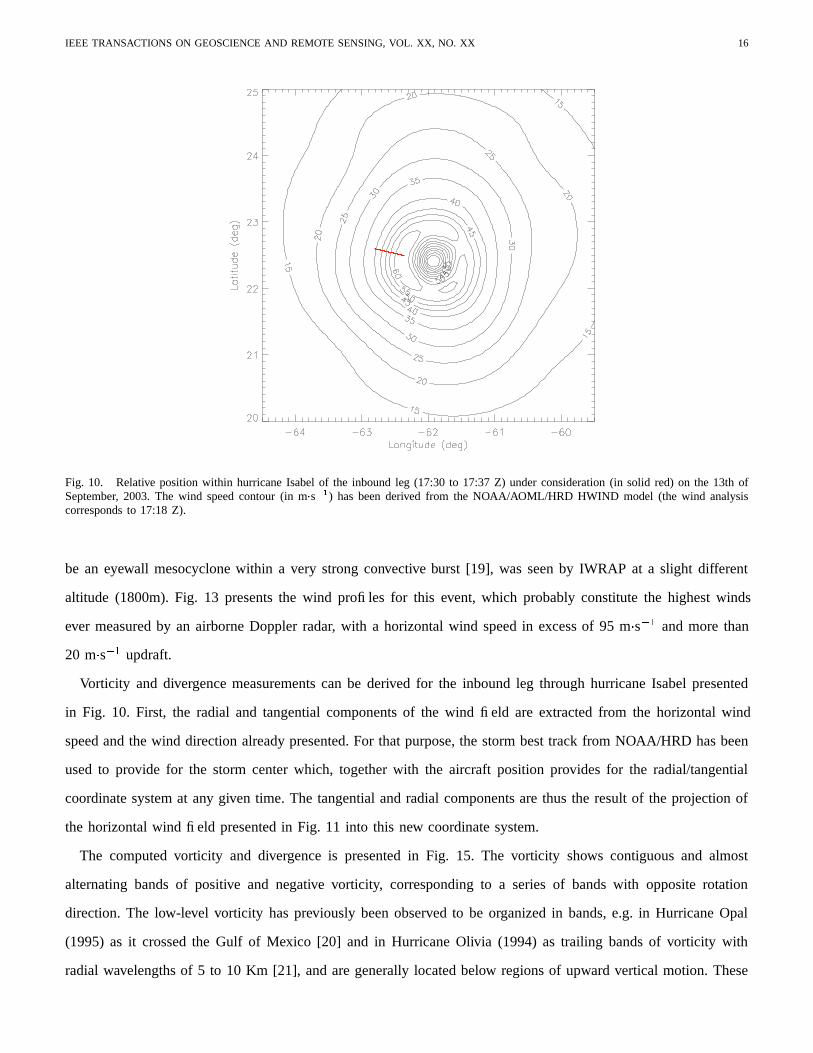
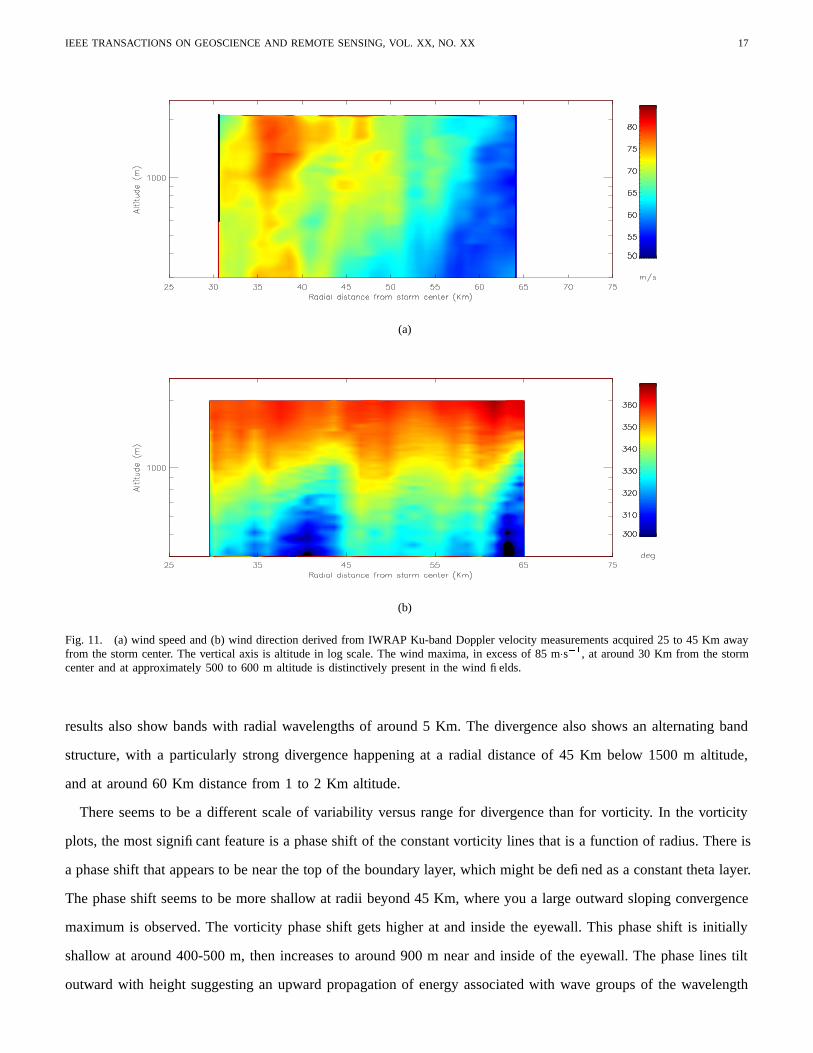
Fig. 11 presents the ABL horizontal wind speed and direction an inbound leg corresponding to an inbound
penetration through hurricane Isabel on September 13th, 2003, from approximately 17:30 to 17:37 GMT. Fig. 10
shows the leg path over the NOAA/AOML/HRD wind analysis (HWIND model), generated at 17:18 GMT. The
HWIND model uses all available surface weather observations (from ships, buoys, coastal platforms, as well as
airborne microwave radiometer ocean surface wind speed estimates from reconnaissance flights, and QuikSCAT,
TRMM and GOES products) to generate an ocean surface wind product. All these data are composited in storm
relative coordinates and processed to derive 10 m maximum sustained 1 minute wind speeds [24] [25].
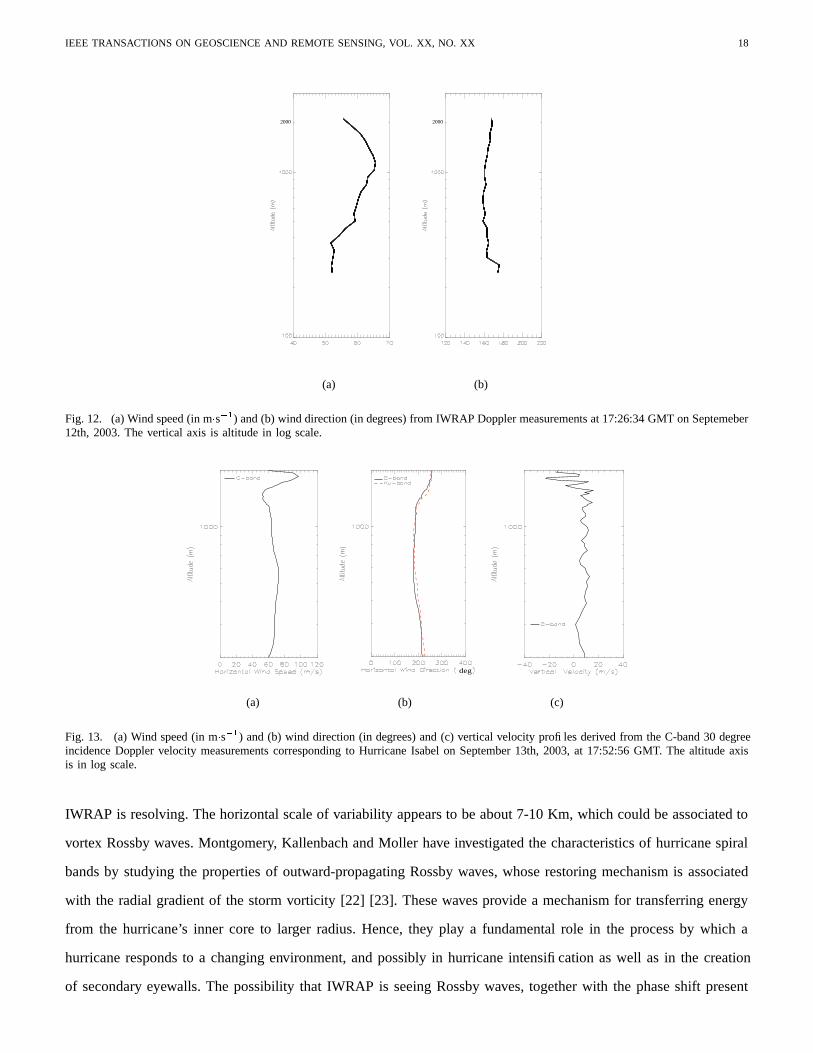
The high vertical and temporal resolution of these wind maps account for the highest resolution ABL vertical
profiles from precipitation ever obtained within the inner core of a hurricane. A single vertical profile example,
corresponding to 17:26:34 GMT during a leg through hurricane Isabel on September 12th, 2003, is shown in Fig. 12.
The strongest winds in this profile are found near 1100 m elevation; these are about 20% higher than those recorded
at flight level. At the same instant, the on-board UMass C-Band Simultaneous Frequency Microwave Radiometer
IEEE TRANSACTIONS ON GEOSCIENCE AND REMOTE SENSING, VOL. XX, NO. XX 15
UTC Time (hh:mm:ss)
Alti
tude
(m
)
200
500
2000
1000
(a)
UTC Time (hh:mm:ss)
Alti
tude
(m
)
200
500
2000
1000
(b)
Fig. 9. IWRAP reflectivity measurements at 30 degrees incidence and VV polarization from an outbound eye-wall penetration throughhurricane Isabel on the 12 of September, 2003 at (a) C-band, and (b) Ku-band. The vertical axis is altitude in log scale.
(SFMR) [16], used operationally in hurricane reconnaissance flights since 1999, measured 48.1 m � s�
�
ocean surface
winds, and the flight level probes installed on the aircraft measured 56.7 m � s�
�
, which is in excellent agreement
with the IWRAP measurements of 51.8 m � s�
�
at 200 m altitude and 56.6 m � s�
�
at 2200 m altitude, respectively.
Also, the wind direction was measured to be 171 degrees at flight level. By using scatterometry techniques with
IWRAP’s NRCS measurements of the ocean surface, the surface wind direction was found to be 189 degrees. Both
measurements bound the profile measurements with very high accuracy (175 degrees at 200 m altitude and 168
degrees at 2200 m altitude).
On the September 13th mission, a GPS dropsonde released in the inner core of hurricane Isabel measured record
horizontal winds of 107 m � s�
�
and vertical winds in excess of 25 m � s�
�
at 1400 m altitude. The updraft made the
dropsonde rise nearly 200 m and stay suspended at a constant altitude for over a minute. This event, believed to
IEEE TRANSACTIONS ON GEOSCIENCE AND REMOTE SENSING, VOL. XX, NO. XX 16
Fig. 10. Relative position within hurricane Isabel of the inbound leg (17:30 to 17:37 Z) under consideration (in solid red) on the 13th ofSeptember, 2003. The wind speed contour (in m � s
��
) has been derived from the NOAA/AOML/HRD HWIND model (the wind analysiscorresponds to 17:18 Z).
be an eyewall mesocyclone within a very strong convective burst [19], was seen by IWRAP at a slight different
altitude (1800m). Fig. 13 presents the wind profiles for this event, which probably constitute the highest winds
ever measured by an airborne Doppler radar, with a horizontal wind speed in excess of 95 m � s�
�
and more than
20 m � s�
�
updraft.
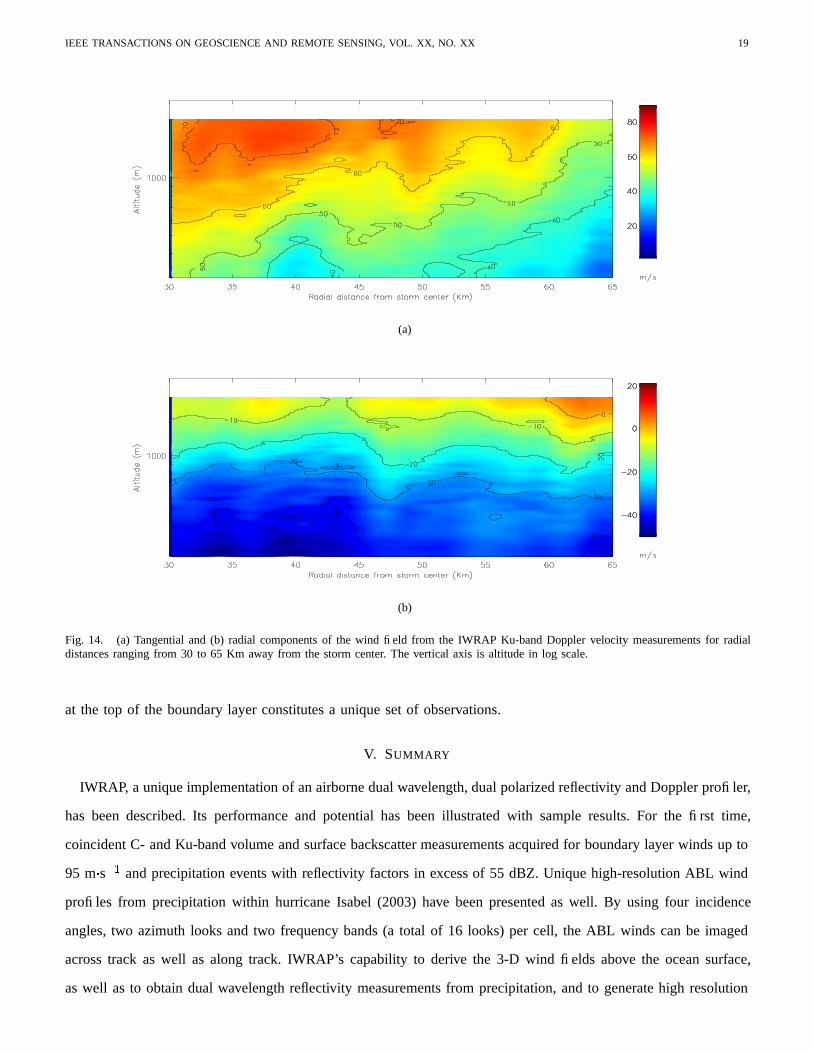
Vorticity and divergence measurements can be derived for the inbound leg through hurricane Isabel presented
in Fig. 10. First, the radial and tangential components of the wind field are extracted from the horizontal wind
speed and the wind direction already presented. For that purpose, the storm best track from NOAA/HRD has been
used to provide for the storm center which, together with the aircraft position provides for the radial/tangential
coordinate system at any given time. The tangential and radial components are thus the result of the projection of
the horizontal wind field presented in Fig. 11 into this new coordinate system.
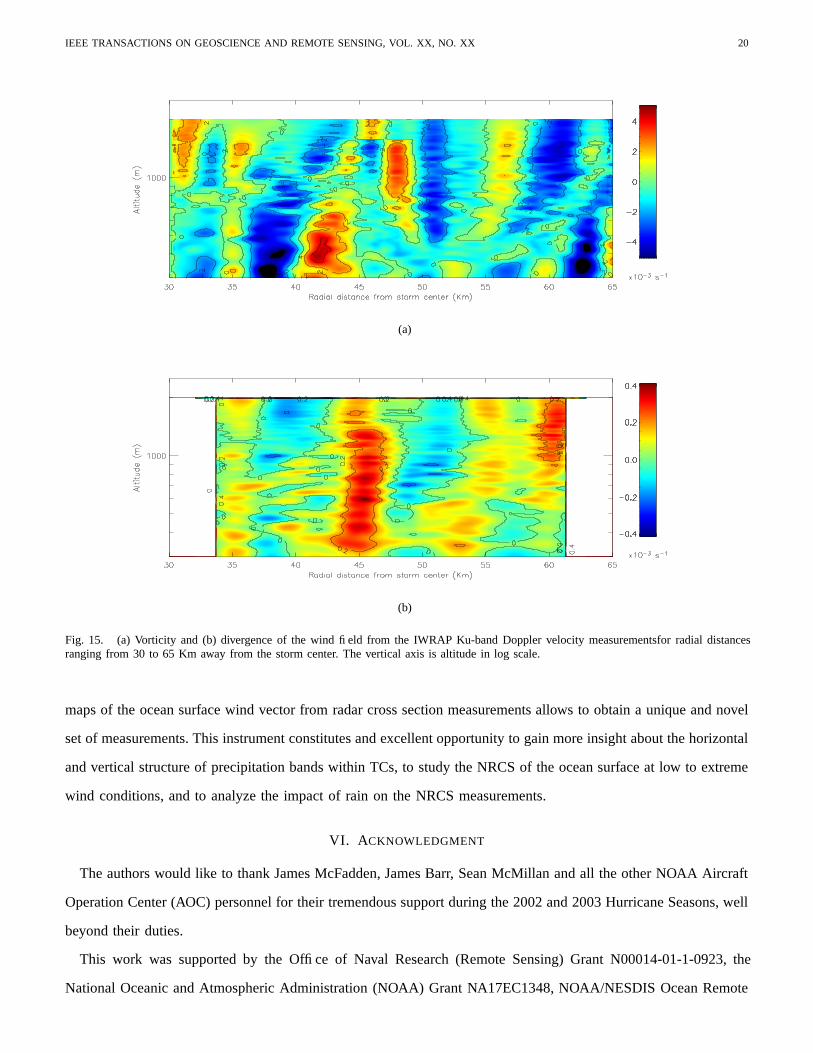
The computed vorticity and divergence is presented in Fig. 15. The vorticity shows contiguous and almost
alternating bands of positive and negative vorticity, corresponding to a series of bands with opposite rotation
direction. The low-level vorticity has previously been observed to be organized in bands, e.g. in Hurricane Opal
(1995) as it crossed the Gulf of Mexico [20] and in Hurricane Olivia (1994) as trailing bands of vorticity with
radial wavelengths of 5 to 10 Km [21], and are generally located below regions of upward vertical motion. These
IEEE TRANSACTIONS ON GEOSCIENCE AND REMOTE SENSING, VOL. XX, NO. XX 17
(a)
(b)
Fig. 11. (a) wind speed and (b) wind direction derived from IWRAP Ku-band Doppler velocity measurements acquired 25 to 45 Km awayfrom the storm center. The vertical axis is altitude in log scale. The wind maxima, in excess of 85 m � s
��
, at around 30 Km from the stormcenter and at approximately 500 to 600 m altitude is distinctively present in the wind fields.
results also show bands with radial wavelengths of around 5 Km. The divergence also shows an alternating band
structure, with a particularly strong divergence happening at a radial distance of 45 Km below 1500 m altitude,
and at around 60 Km distance from 1 to 2 Km altitude.
There seems to be a different scale of variability versus range for divergence than for vorticity. In the vorticity
plots, the most significant feature is a phase shift of the constant vorticity lines that is a function of radius. There is
a phase shift that appears to be near the top of the boundary layer, which might be defined as a constant theta layer.
The phase shift seems to be more shallow at radii beyond 45 Km, where you a large outward sloping convergence
maximum is observed. The vorticity phase shift gets higher at and inside the eyewall. This phase shift is initially
shallow at around 400-500 m, then increases to around 900 m near and inside of the eyewall. The phase lines tilt
outward with height suggesting an upward propagation of energy associated with wave groups of the wavelength
IEEE TRANSACTIONS ON GEOSCIENCE AND REMOTE SENSING, VOL. XX, NO. XX 18
2000
(a)
2000
(b)
Fig. 12. (a) Wind speed (in m � s�
�
) and (b) wind direction (in degrees) from IWRAP Doppler measurements at 17:26:34 GMT on Septemeber12th, 2003. The vertical axis is altitude in log scale.
(a)
deg
(b) (c)
Fig. 13. (a) Wind speed (in m � s�
�
) and (b) wind direction (in degrees) and (c) vertical velocity profiles derived from the C-band 30 degreeincidence Doppler velocity measurements corresponding to Hurricane Isabel on September 13th, 2003, at 17:52:56 GMT. The altitude axisis in log scale.
IWRAP is resolving. The horizontal scale of variability appears to be about 7-10 Km, which could be associated to
vortex Rossby waves. Montgomery, Kallenbach and Moller have investigated the characteristics of hurricane spiral
bands by studying the properties of outward-propagating Rossby waves, whose restoring mechanism is associated
with the radial gradient of the storm vorticity [22] [23]. These waves provide a mechanism for transferring energy
from the hurricane’s inner core to larger radius. Hence, they play a fundamental role in the process by which a
hurricane responds to a changing environment, and possibly in hurricane intensification as well as in the creation
of secondary eyewalls. The possibility that IWRAP is seeing Rossby waves, together with the phase shift present
IEEE TRANSACTIONS ON GEOSCIENCE AND REMOTE SENSING, VOL. XX, NO. XX 19
(a)
(b)
Fig. 14. (a) Tangential and (b) radial components of the wind field from the IWRAP Ku-band Doppler velocity measurements for radialdistances ranging from 30 to 65 Km away from the storm center. The vertical axis is altitude in log scale.
at the top of the boundary layer constitutes a unique set of observations.
V. SUMMARY
IWRAP, a unique implementation of an airborne dual wavelength, dual polarized reflectivity and Doppler profiler,
has been described. Its performance and potential has been illustrated with sample results. For the first time,
coincident C- and Ku-band volume and surface backscatter measurements acquired for boundary layer winds up to
95 m � s�
�
and precipitation events with reflectivity factors in excess of 55 dBZ. Unique high-resolution ABL wind
profiles from precipitation within hurricane Isabel (2003) have been presented as well. By using four incidence
angles, two azimuth looks and two frequency bands (a total of 16 looks) per cell, the ABL winds can be imaged
across track as well as along track. IWRAP’s capability to derive the 3-D wind fields above the ocean surface,
as well as to obtain dual wavelength reflectivity measurements from precipitation, and to generate high resolution
IEEE TRANSACTIONS ON GEOSCIENCE AND REMOTE SENSING, VOL. XX, NO. XX 20
(a)
(b)
Fig. 15. (a) Vorticity and (b) divergence of the wind field from the IWRAP Ku-band Doppler velocity measurementsfor radial distancesranging from 30 to 65 Km away from the storm center. The vertical axis is altitude in log scale.
maps of the ocean surface wind vector from radar cross section measurements allows to obtain a unique and novel
set of measurements. This instrument constitutes and excellent opportunity to gain more insight about the horizontal
and vertical structure of precipitation bands within TCs, to study the NRCS of the ocean surface at low to extreme
wind conditions, and to analyze the impact of rain on the NRCS measurements.
VI. ACKNOWLEDGMENT
The authors would like to thank James McFadden, James Barr, Sean McMillan and all the other NOAA Aircraft
Operation Center (AOC) personnel for their tremendous support during the 2002 and 2003 Hurricane Seasons, well
beyond their duties.
This work was supported by the Office of Naval Research (Remote Sensing) Grant N00014-01-1-0923, the
National Oceanic and Atmospheric Administration (NOAA) Grant NA17EC1348, NOAA/NESDIS Ocean Remote
IEEE TRANSACTIONS ON GEOSCIENCE AND REMOTE SENSING, VOL. XX, NO. XX 21
Sensing Program (contract 40-AA-NE-00598), the National Aeronautics and Space Administration (NASA) JPL
Grant 1217185 and NASA/JPL Grant 1201304.
REFERENCES
[1] Isaksen, L., Stoffelen, A. ERS scatterometer wind data impact on ECMWF’s tropical cyclone forecasts, IEEE Transactions on Geoscience
and Remote Sensing, vol. 38, no.4, pp. 1885-1892, July 2000.
[2] Ulaby, F.T., Moore, R.K., Fung, A.K. Microwave Remote Sensing; Active and Passive, vol 1-3, Norwood, MA, Artech House, 1982.
[3] Moore, R.K., Fung, A.K. Radar determination of winds at sea. Proceedings of the IEEE, vol. 67, no. 11, pp. 1504-1521, 1979.
[4] Plant, W.J. A two-scale model of short wind-generated waves and scatterometry. Journal of Geophysical Research, vol. 91, no. C9, pp.
10735-10749, 1986.
[5] Donelan, M.A., Pierson, W. J., Radar scattering and equilibrium ranges in wind-generated waves with applications to scatterometry,
Journal of Geophysical Research, vol. 92, no. C5, pp. 4971-5029, 1987.
[6] Carswell, J.R., Carson, S.C., McIntosh, R.E. et al. Airborne scatterometers: investigating ocean backscatter under low- and high-wind
conditions. Proceedings of the IEEE, vol. 82, no.12, pp. 1835-1860, 1994.
[7] Wentz, F. J., Smith, D. K. 1999 A model function for the ocean-normalized radar cross section at 14 GHz derived from NSCAT
observations. J. Geophys. Res., Vol. 104 , No. C5 , p. 11,499, 1999.
[8] Jones, W.L., Zec, J., Rice, L., NSCAT geophysical algorithm for inferring hurricane ocean surface winds, 22nd Conference on Hurricanes
and Tropical Meteorology, Fort Collins, CO (USA), 19-23 May 1997 (World Meeting Number 972 5005).
[9] Freilich M.H., and Dunbar R.S., Derivation of satellite wind model functions using operational surface wind analyses : an altimeter
axample. J. Geophys. Res., vol. 98, 1993, pp. 14633-14649.
[10] Stoffelen, A., Anderson, D., Scatterometer data interpretation: Estimation and validation of the transfer function: CMOD4, J. Geophys.
Res., 102, 5767-5780, 1997.
[11] Stiles, W.B., Simon. H.Y., Impact of rain on spaceborne Ku-Band wind scatterometer data, IEEE Transactions of Geoscience and
Remote Sensing, vol. 40, no. 9, September 2002.
[12] Marks, F.D., Shay, L.K and PDT-5, USWRP PDT-5 Report, 1998: Tropical Cyclones: Forecast problems and associated research
opportunities . Bull. Amer. Met. Soc., Vol.79, No.2 , 305-323
[13] Marks, F. D., Houze R.A., Inner core structure of hurricane Alicia from airborne Doppler radar observations, Journal of the
Atmospheric Sciences, vol. 44, no. 9, pp. 1296-1317, May 1987.
[14] Liu, Y. Zhang, D. Yau, M.K. A multiscale numerical study of hurricane Andrew (1992). Part II: kinematics and inner-core structures.
Monthly weather review - American Meteorological Society, vol. 35, no.1, pp. 115-126, 1997.
[15] Wurman, J., Winslow, J. Intense sub-kilometer-scale boundary layer rolls observed in hurricane Fran. Science, vol. 280, pp. 555-557,
April 1998.
[16] Knapp, E., Carswell, J., Swift, C., A dual polarization multi-frequency microwave radiometer, IEEE Proc. of IGARSS, 2000.
[17] Andraka, R., Berkun, A., FPGAs make a radar signal processor on a chip a reality, Proceedings of the 33rd Asilomar Conference on
Singals, Systems and Computers, October 24-27, 1999, Monterey, CA.
[18] Doviak, R.J., and Zrnic, D.S., Doppler Radar and Weather Observations, New Tork: Academic, 1984, 2nd edition.
[19] Aberson, S. D., Black, M.L., Mongomery, M., Bell, M. A record wind measurement in Hurricane Isabel: Direct evidence of an eyewall
mesocyclone, AMS 26th conference on Hurricanes and Tropical Metereology, May 2004, Miami, FL.
[20] Persing, J., Montgometry, M., and Tuleya, R., “Environmental interactive GFDL hurricane model for hurricane Opal”, American
Meteorological Society Monthly Weather Review, vol. 130, 298-317.
IEEE TRANSACTIONS ON GEOSCIENCE AND REMOTE SENSING, VOL. XX, NO. XX 22
[21] Reasor, P., Montgomery, M., Marks, F., Gamache, J., “Low-wavenumber structure and evolution of the Hurricane inner core observed
by airborne dual-Doppler radar”, American Meteorological Society Monthly Weather Review, vol. 128, 1653-1680.
[22] Montgomery, M. T., and R. J. Kallenbach, “A theory for vortex Rossby-waves and its application to spiral bands and intensity changes
in hurricanes”, Quart. J. Roy. Meteor. Soc., 123, 435-465.
[23] Moller, J. D., and M. T. Montgomery, “Vortex Rossby waves and hurricane intensification in a barotropic model”, J. Atmos. Sci., 56,
1674-1687.
[24] Powell, M. D., S. H.Houston, and T. A. Reinhold, “Hurricane Andrew’s Landfall in South Florida. Part I: Standardizing measurements
for documentation of surface wind fields”, Weather Forecast., 11, 304-328.
[25] Powell, M. D., and S. H. Houston “Hurricane Andrew’s Landfall in South Florida. Part II: Surface Wind Fields and Potential Real-time
Applications”, Weather. Forecast., 11, 329-349.
Related Documents