Declarative Visualization Ivan Viola Vienna University of Technology Austria

Welcome message from author
This document is posted to help you gain knowledge. Please leave a comment to let me know what you think about it! Share it to your friends and learn new things together.
Transcript

Declarative Visualization
Ivan ViolaVienna University of Technology
Austria

Ivan Viola 2
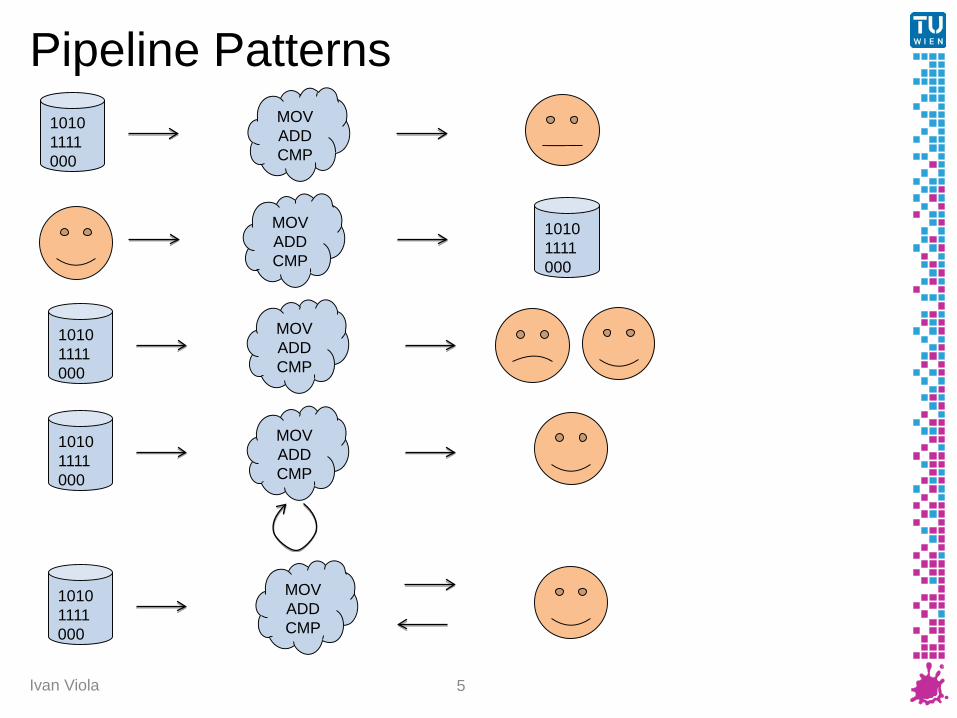
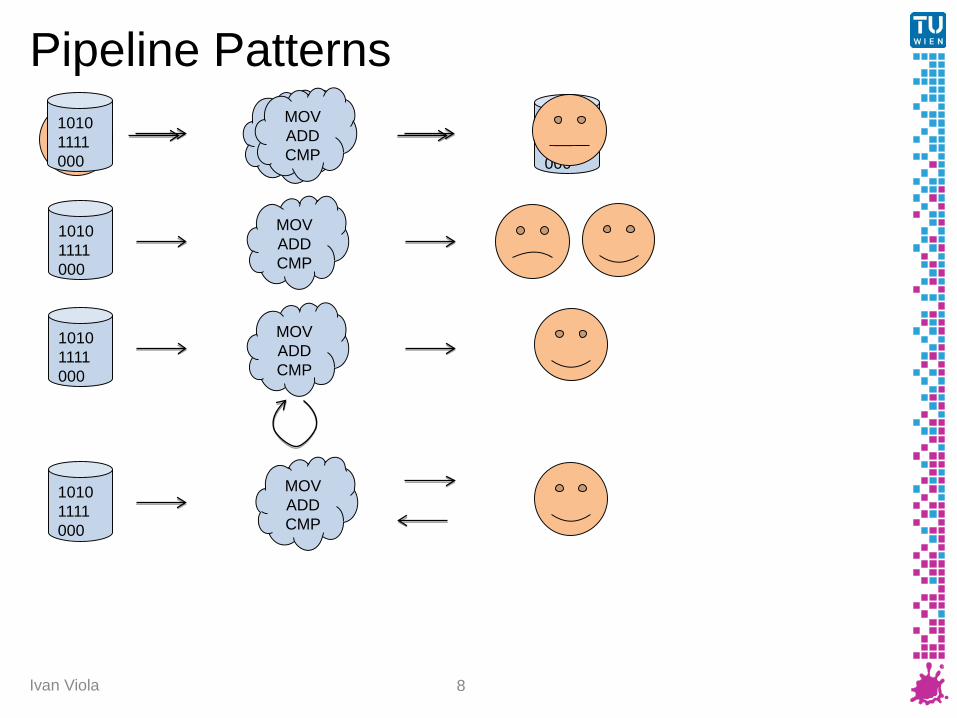
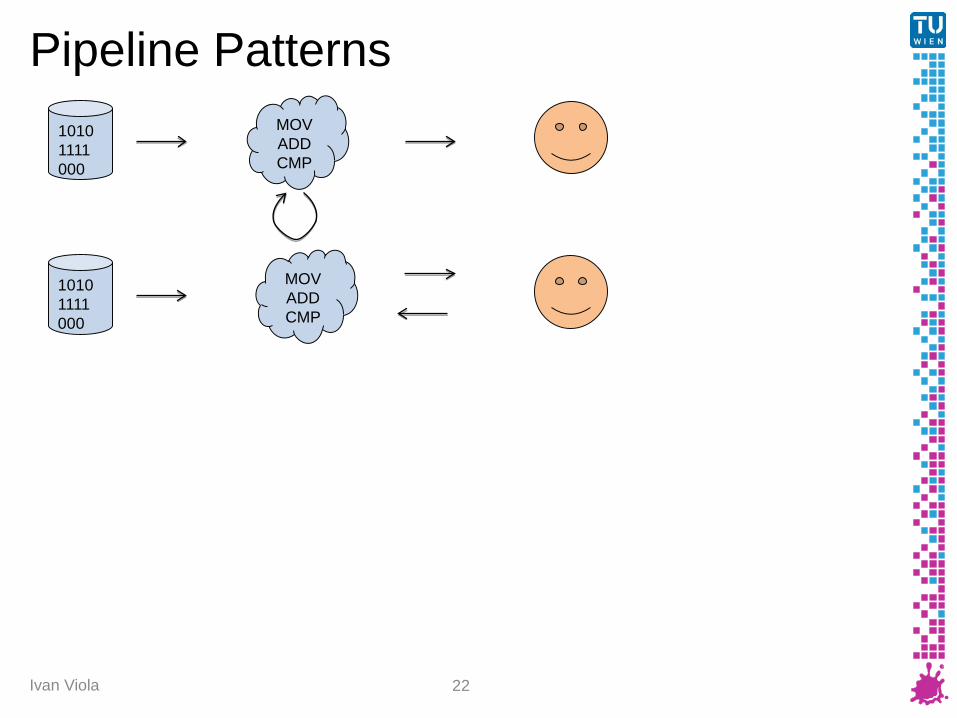
Pipeline Patterns
MOVADDCMP
10101111000
MOVADDCMP
10101111000
MOVADDCMP
10101111000
MOVADDCMP
10101111000
MOVADDCMP
10101111000

● Aligned with the data-flow network● Data is “thrown over fence” on visualizers● Piped into visual representation● Splatted on to the display● Viewer is staring at it
Ivan Viola 3
Traditional Visualization Pipeline
Data-Centric Stage Computation-Centric Stage
User-Centric Stage
Acquisition Filtering Visual Mapping Rendering Display
Optical TransferViewingPerceptionCognition
10101111000
MOVADDCMP

Ivan Viola 4
Direct Volume Rendering● Imperative
character● Multitude of
parameters to adjust(which could be automatized)
● Effect of parameter change is hard to predict
Ivan Viola 5
Pipeline PatternsMOVADDCMP
10101111000
MOVADDCMP
10101111000
MOVADDCMP
10101111000
MOVADDCMP
10101111000
MOVADDCMP
10101111000

Ivan Viola 6
Visualization Goal● Visualization is enabling technology● Primary goal is to provide insight● Exploiting perceptual / cognitive capabilities ● Specific tasks to reach the goal● Strictly generic pipeline does not exist● Common pattern: visual dialog: HMD● Data: measurements, models, mental reps.● Goal is the reason for visualization

● Imperative paradigm: Splat data on the user● Declarative paradigm:
User drives visualization of data
Ivan Viola 7
Information Flow
10101111000
MOVADDCMP
10101111000
Data-Centric Stage Computation-Centric Stage
User-Centric Stage
Acquisition Filtering Visual Mapping Rendering Display
Optical TransferViewingPerceptionCognition
10101111000
MOVADDCMP
Ivan Viola 8
Pipeline PatternsMOVADDCMP
10101111000
MOVADDCMP
10101111000
MOVADDCMP
10101111000
MOVADDCMP
10101111000
MOVADDCMP
10101111000

Ivan Viola 9
Importance-Driven Volume Rendering
Howell Medigraphics
[Viola et al. 2004]

Ivan Viola 10
Design Guidelines for Geo-Cutaways
[Lidal et al. 2012]

Ivan Viola 11
Importance-Driven Focus of Attention
[Viola et al. 2006]

Ivan Viola 12
Importance-Driven Focus of Attention
v 1
v 2
v 3
o 1
o 2
o 3
visibility estimation image-space weight
p(v 1)
p(v n)
p(o 1 |v 1)
p(o m |v n)
p(o 1) p(o m)
...
I(v i ,O) = p(o j |v i ) log∑j
m p(o j |v i)p(o j)
...
...
information-theoretic framework for optimal viewpoint estimation
v
o 1
o 2
o 3
object-space distance weight
...
[Viola et al. 2006]

Ivan Viola 13
Pipeline Patterns
MOVADDCMP
10101111000
MOVADDCMP
10101111000
MOVADDCMP
10101111000
MOVADDCMP
10101111000

Ivan Viola 14
Occlusion Shading
[Solteszova et al. 2011]

Ivan Viola 15
● Constant perceptual distancebetween shadow colorand object color
S3 S4 S5
S0 S1 S2
[Solteszova et al. 2011]
Chromatic Shadows

Assessment of Surface Perception● Gauge figure task [Koenderink et al. ‘92]
Ivan Viola 16 [Solteszova et al. 2011]

Experiment on Surface Perception● Users rotated the
gauge until it was perceived tangential to the surface
● Perceived and ground truth normal
● Tested shadow colors S0-S4 from the palette
Ivan Viola 17 [Solteszova et al. 2011]

Experiment on Depth Perception● Relative depth estimation of a yellow point
with respect to the red and blue point
Ivan Viola 18 [Solteszova et al. 2011]

User-Centric Stage
Data-Centric Stage Computation-Centric Stage
Acquisition Filtering Visual Mapping Rendering Display
Optical TransferViewingPerceptionCognition
10101111000
MOVADDCMP
● Final visual design is at the end evaluated● The outcome can be…
● positive or● negative…
Ivan Viola 19
Traditional Role of Evaluation
10101111000
MOVADDCMP

Ivan Viola 20
Pipeline PatternsMOVADDCMP
10101111000
MOVADDCMP
10101111000
MOVADDCMP
10101111000
initial transfer function
Ivan Viola 21
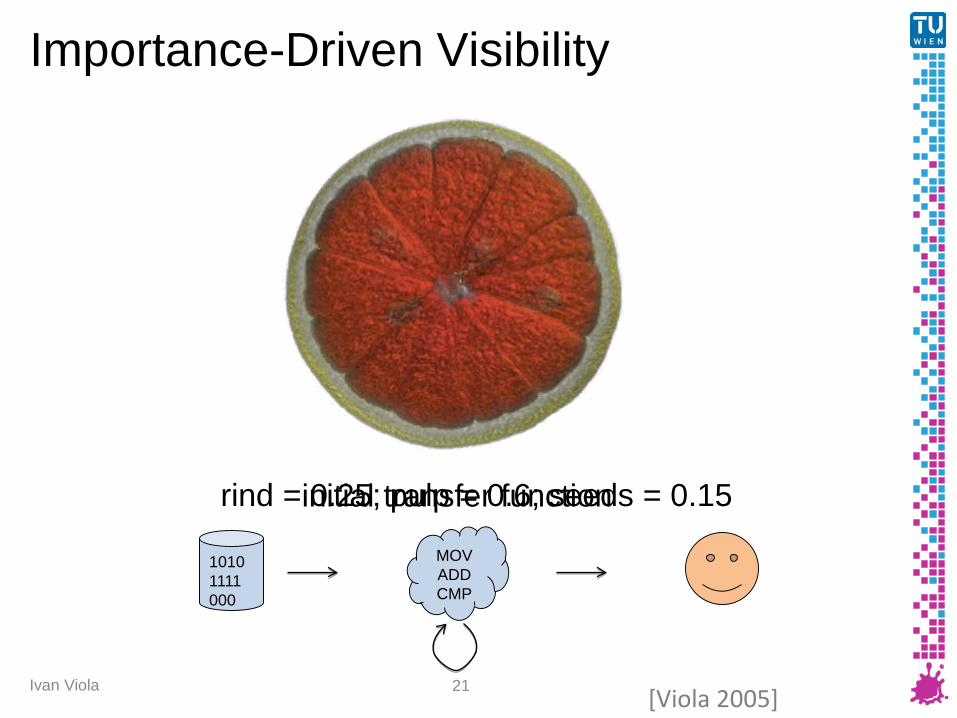
Importance-Driven Visibility
rind = 0.25; pulp = 0.6; seeds = 0.15
MOVADDCMP
10101111000
[Viola 2005]
Ivan Viola 22
Pipeline PatternsMOVADDCMP
10101111000
MOVADDCMP
10101111000

● The goal is to provide most accurate match between information and its perceptual stimulus
● Iterative approach of visualization redesign
Ivan Viola 23
Iterative Visualization Redesign
MOVADDCMP
10101111000

Perceptual-Statistics Shading Model
Ivan Viola 24
[Solteszova et al. 2012]

Surface Slant and Tilt
Ivan Viola 25 [Solteszova et al. 2012]

Underestimation of Slant
[Stu
dy D
ata:
Col
e et
al.]
GROUND TRUTH SLANT
ESTI
MAT
ED S
LAN
T
Ivan Viola 26 [Solteszova et al. 2012]
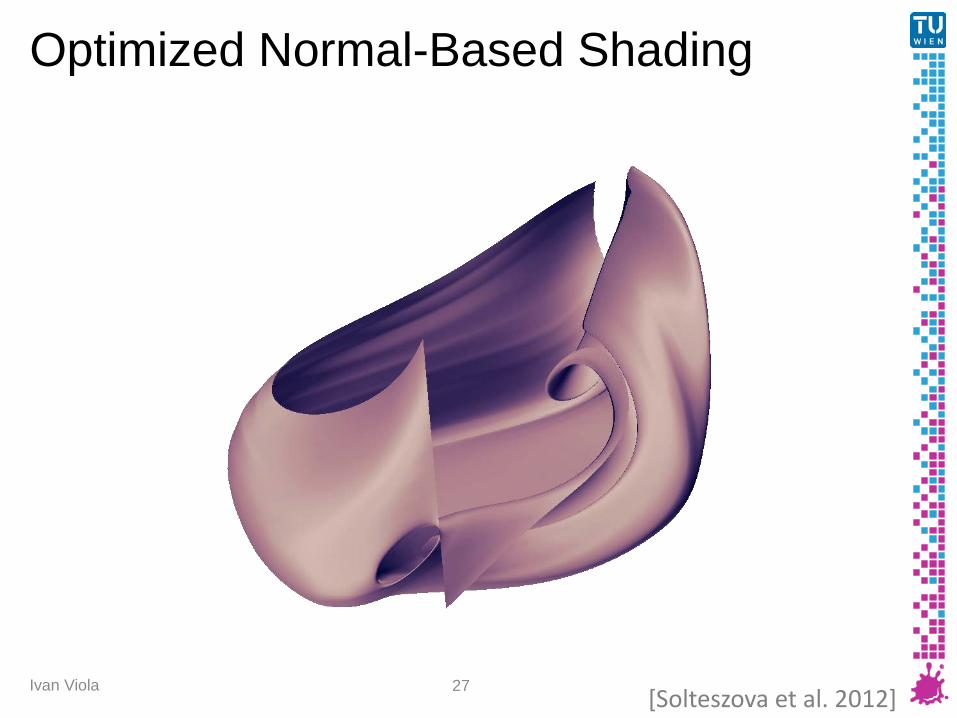
Optimized Normal-Based Shading
Ivan Viola 27 [Solteszova et al. 2012]

Quantifying the Error
Ivan Viola 28 [Solteszova et al. 2012]

Quantifying the Error
Ivan Viola 29 [Solteszova et al. 2012]

Iterative Evaluation and Redesign
Ivan Viola 30 [Solteszova et al. 2012]

● How is motion perceived in relation of one to another?
● Can we linearize perception of motion?
● Estimation from a motion legend
Ivan Viola 31
Perceptually Uniform Motion
[Birkeland et al. 201X]

● Task: Estimate relative speed-up factor● Global scale of velocities● Direction● Contrast-type● Representation
Ivan Viola 32
Studied Characteristics
[Birkeland et al. 201X]

● Task: Estimate relative speed-up factor● Global scale of velocities● Direction● Contrast-type● Representation
Ivan Viola 33
Studied Characteristics
[Birkeland et al. 201X]

● Task: Estimate relative speed-up factor● Global scale of velocities● Direction● Contrast-type● Representation
Ivan Viola 34
Studied Characteristics
[Birkeland et al. 201X]

Ivan Viola 35
Information Visualization: Circle Size
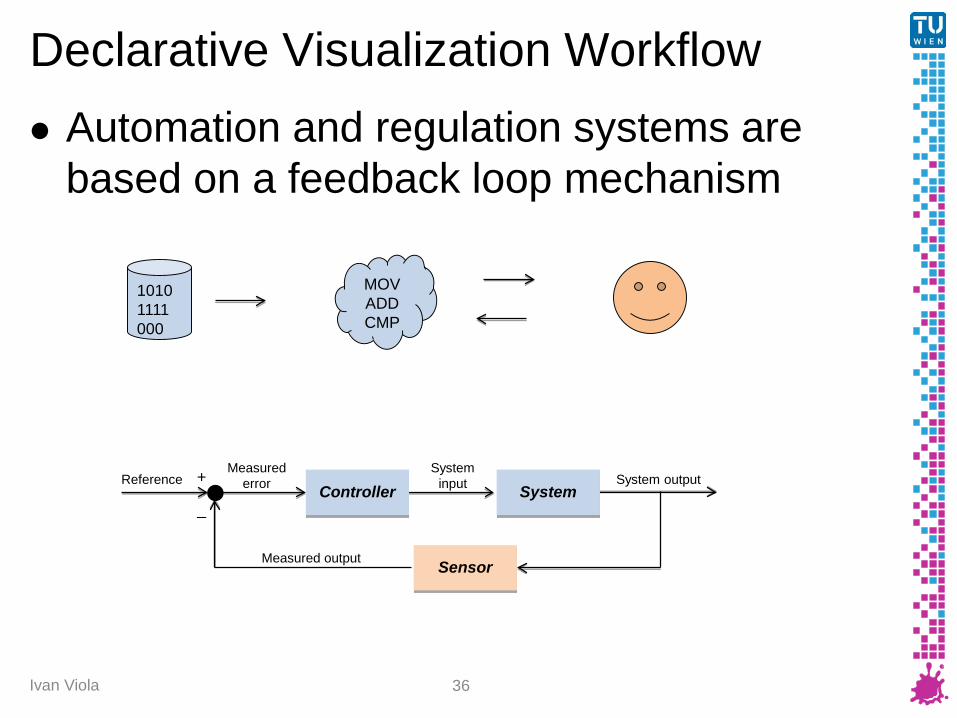
● Automation and regulation systems are based on a feedback loop mechanism
Ivan Viola 36
Declarative Visualization Workflow
Measurederror
SysteminputReference System output
Measured output
+
Controller System
Sensor
MOVADDCMP
10101111000

● Can we learn from process automation?● What would the PID controller look like?
Ivan Viola 37
Declarative Visualization Workflow
InputMeasured
error
Systeminput
Reference
System output
Measuredoutput
+
Controller
Acquisition
Filtering
System – Visual Interface
Visual Mapping Rendering
DisplayOptical Transfer
Viewing Perception
Cognition
Sensor – Study
Task
Analysis
10101111000
MOVADDCMP
Measurederror
SysteminputReference System output
Measured output
+
Controller System
Sensor

● Psychophysics● Controlled Study● Surveillance
● Eye Tracking (Tobii)● Digital Pen (Lifetrons)● EEG (Emotiv)
● Crowdsourcing● Statistical Analysis● Individuality is realityIvan Viola 38
Sensor

● ReCaptcha idea
● ReGauge-figure task?
Ivan Viola 39
Invisible Perceptual Study
overlooks inquiry

Ivan Viola 40
Statistical Model of Illustration
Eye Tracking
Pen Tracking
EEG Tracking
Surveillance
Reference Scene
IllustrationCrafting
Reference Geometry
Surveillance Data
Statistical model
InputMeasured
error
Systeminput
Reference
System output
Measuredoutput
+
Controller
Acquisition
Filtering
System – Visual Interface
Visual Mapping Rendering
DisplayOptical Transfer
Viewing Perception
Cognition
Sensor – Study
Task
Analysis
Analysis

Ivan Viola 41
Pipeline Patterns
MOVADDCMP
10101111000
MOVADDCMP
10101111000
MOVADDCMP
10101111000
MOVADDCMP
10101111000
MOVADDCMP
10101111000

● Veronika Šoltészová● Åsmund Birkeland● Endre Lidal● Manu Waldner● many others!
Ivan Viola 42
Thanks
Related Documents