IV Displacements in Capillary Tubes IV.1 Introduction In this chapter the displacement by gas of a viscoplastic material, initially occupying the interior of a tube, is considered. This situation is encountered in applications such as the flow through porous media during enhanced oil recovery, coating flows, and the displacement of biological materials and pastes in different physiological systems (e.g. [64, 65, 66, 67]). Comprehensive reviews on capillary displacements are available in the literature [68, 69]. In these processes, it is important to understand the mechanism of material displacement and to determine the amount of material that is left behind adjacent to the wall. The configuration of the interface between the two materials depends on the relative role of viscous, elastic, and capillary forces near the interface. Fairbrother and Stubbs [70] and Taylor [71] pioneered this subject by studying experimentally the Newtonian inertialess case. Their goal was to de- termine the fraction of mass deposited on the tube wall, m. Mass conservation allows m to be written in terms of the velocity of the tip of the interface, U , and the mean velocity, ¯ u, of the liquid ahead (downstream) of the gas-liquid interface, viz., m = U - ¯ u U =1 - R b R 2 (1) where R is the capillary tube radius and R b is the bubble radius (Fig. IV.1). Taylor [71] studied the dependence of the mass fraction on the capillary number, Ca ≡ μU/σ, where μ and σ are the liquid Newtonian viscosity and surface tension, respectively. His analysis indicated that the amount of liquid deposited on the wall rises with the interface speed, and that m tends asymptotically to a value of 0.56 as Ca approaches 2. Cox [72] expanded the range of the capillary number up to 10, and showed that the asymptotic value

Welcome message from author
This document is posted to help you gain knowledge. Please leave a comment to let me know what you think about it! Share it to your friends and learn new things together.
Transcript

IVDisplacements in Capillary Tubes
IV.1 IntroductionIn this chapter the displacement by gas of a viscoplastic material, initially
occupying the interior of a tube, is considered. This situation is encountered
in applications such as the flow through porous media during enhanced oil
recovery, coating flows, and the displacement of biological materials and
pastes in di!erent physiological systems (e.g. [64, 65, 66, 67]). Comprehensive
reviews on capillary displacements are available in the literature [68, 69]. In
these processes, it is important to understand the mechanism of material
displacement and to determine the amount of material that is left behind
adjacent to the wall. The configuration of the interface between the two
materials depends on the relative role of viscous, elastic, and capillary forces
near the interface.
Fairbrother and Stubbs [70] and Taylor [71] pioneered this subject by
studying experimentally the Newtonian inertialess case. Their goal was to de-
termine the fraction of mass deposited on the tube wall, m. Mass conservation
allows m to be written in terms of the velocity of the tip of the interface, U ,
and the mean velocity, u, of the liquid ahead (downstream) of the gas-liquid
interface, viz.,
m =U ! u
U= 1!
!Rb
R
"2
(1)
where R is the capillary tube radius and Rb is the bubble radius (Fig. IV.1).
Taylor [71] studied the dependence of the mass fraction on the capillary
number, Ca " µU/!, where µ and ! are the liquid Newtonian viscosity
and surface tension, respectively. His analysis indicated that the amount of
liquid deposited on the wall rises with the interface speed, and that m tends
asymptotically to a value of 0.56 as Ca approaches 2. Cox [72] expanded the
range of the capillary number up to 10, and showed that the asymptotic value
DBD
PUC-Rio - Certificação Digital Nº 0621119/CA

Chapter IV. Displacements in Capillary Tubes 67
(as Ca # $) is actually 0.60 for Newtonian liquids. Using the lubrication
approximation, Bretherton [73] derived a theoretical correlation between the
mass fraction and the capillary number, and the agreement between his pre-
dictions and Cox’s experiments is good in the range of 10!3 < Ca < 10!2.
Figure IV.1: Displacement of a viscoplastic material in a capillary.
Giavedoni and Saita [74] reviewed the literature concerned with the
theoretical modeling of gas-liquid displacement in the small gap between
two parallel plates. They also presented a theoretical analysis of the steady
displacement of a viscous liquid by a semi-infinite gas bubble using the finite
element method, for capillary number values within the range 5 % 10!5 to
10. Lee et al. [75] used a finite-element method to study the steady gas
displacement of viscoelastic materials confined between two parallel plates,
while Quintella et al. [76] performed a similar study for the flow through
capillaries.
The displacement of a material by another one has been first studied by
Goldsmith and Mason [77], who reported experimental results on the amount of
displaced material left on the tube wall as a function of di!erent parameters,
and showed that the mass fraction rises as the viscosity ratio is decreased.
This trend agrees with their theoretical predictions and experimental data.
Teletzke et al. [78] extended the work of Bretherton [73] to account for a viscous
displacing fluid, and the e!ects of intermolecular forces in submicroscopically
thin films. Their predictions, limited to Ca < 10!4, agreed with the observation
of Goldsmith and Mason [77], who showed that the film thickness of the
displaced material left on the wall rises with the viscosity of the displacing
fluid. Allouche et al. [79] reported a comprehensive study of the displacement
of one yield-stress material by another in a plane channel. In this paper, the
DBD
PUC-Rio - Certificação Digital Nº 0621119/CA

Chapter IV. Displacements in Capillary Tubes 68
authors discuss the conditions for the existence of static residual layers of the
displaced material. Gabard [80] and Gabard and Hulin [81] report experiments
and finite-volume calculations to determine the influence of rheology on the
layer thickness of Carbopol dispersions displaced by water-glycerol solution in
a 24-mm vertical tube (miscible displacement). They observed that the layer
thickness decreases as the yield stress of the displaced material is increased.
More recently, Soares et al. [82] analyzed, using finite-element simulations
and experiments, the steady displacement of a viscous liquid by a long
drop of another viscous liquid in a capillary tube, for a wide range of the
capillary number and viscosity ratio. Their theoretical predictions and flow
visualization experiments showed the e!ect of di!erent parameters on the
interface configuration and on the thickness of the layer of the displaced liquid
left on the walls.
Regarding the gas displacement of viscoplastic materials, most of the
articles available in the literature are concerned with Hele-Shaw cells, and
in particular with the Sa!man-Taylor instability. Alexandrou and Entov [83]
analyzed the advancement and shape of bubbles in a Hele-Shaw cell previously
occupied by Bingham materials. In a more recent study [84], this analysis
is employed to the specific problem of the rising of a bubble in a cell filled
with a Bingham material. Lindner et al. [85] showed that a modified capillary
number containing the yield stress governs the Sa!man-Taylor instability and
determines the finger width. Finite-element simulations of the transient gas-
displacement of Bingham (Papanastasiou) materials in straight and constricted
tubes are reported by Dimakopoulos and Tsamopoulos [86]. For the high-
capillary-number, inertialess displacement in tubes, they conclude that the
deposited mass is quite insensitive to the Bingham number in the range
investigated. The largest value of the Papanastasiou regularizing parameter
employed to obtain their solutions corresponds to a jump number value of
150, as discussed later in this text.
This chapter reports experimental results for the displacement by air
of a viscoplastic material in a capillary tube, as depicted in Fig. IV.1. The
materials employed in the experiments were aqueous Carbopol dispersions.
Their viscosity functions were well represented by a recently proposed four-
parameter viscosity function [24]. In contrast to what happens for Newtonian
and viscoelastic materials, it was observed that, for flow rates (or wall shear
stresses) below a certain threshold value, the displacement is apparently
perfect, i.e. no observable mass of material is left attached to the wall
(Fig. IV.1). To help interpreting the experimental findings, the laminar fully-
developed flow of viscoplastic materials in tubes was revisited to include
DBD
PUC-Rio - Certificação Digital Nº 0621119/CA
Chapter IV. Displacements in Capillary Tubes 69
the interesting transition that occurs when the wall shear stress value is
in the vicinity of the yield stress. This transition is closely related to the
existence of the threshold wall shear stress values observed in the displacement
experiments.
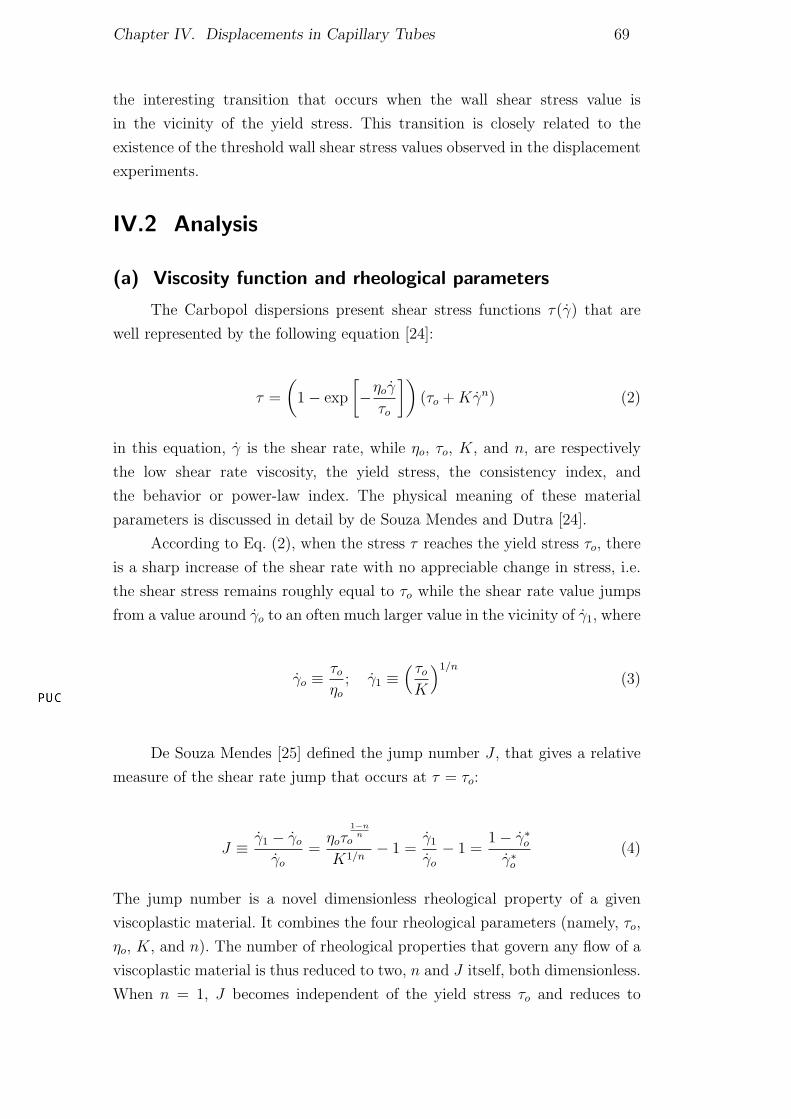
IV.2 Analysis
(a) Viscosity function and rheological parameters
The Carbopol dispersions present shear stress functions "(#) that are
well represented by the following equation [24]:
" =
!1! exp
#!$o#
"o
$"("o + K#n) (2)
in this equation, # is the shear rate, while $o, "o, K, and n, are respectively
the low shear rate viscosity, the yield stress, the consistency index, and
the behavior or power-law index. The physical meaning of these material
parameters is discussed in detail by de Souza Mendes and Dutra [24].
According to Eq. (2), when the stress " reaches the yield stress "o, there
is a sharp increase of the shear rate with no appreciable change in stress, i.e.
the shear stress remains roughly equal to "o while the shear rate value jumps
from a value around #o to an often much larger value in the vicinity of #1, where
#o ""o
$o; #1 "
% "o
K
&1/n
(3)
De Souza Mendes [25] defined the jump number J , that gives a relative
measure of the shear rate jump that occurs at " = "o:
J " #1 ! #o
#o=
$o"1!n
no
K1/n! 1 =
#1
#o! 1 =
1! #"o#"o
(4)
The jump number is a novel dimensionless rheological property of a given
viscoplastic material. It combines the four rheological parameters (namely, "o,
$o, K, and n). The number of rheological properties that govern any flow of a
viscoplastic material is thus reduced to two, n and J itself, both dimensionless.
When n = 1, J becomes independent of the yield stress "o and reduces to
DBD
PUC-Rio - Certificação Digital Nº 0621119/CA

Chapter IV. Displacements in Capillary Tubes 70
J = $o/K ! 1, i.e. for n = 1, J + 1 becomes the ratio between $o and the
plastic viscosity.
Choosing #1 as characteristic shear rate and "o as the characteristic stress,
so that " " " "/"o and #" " #/#1 are respectively the dimensionless versions of
the shear stress and shear rate, then the following dimensionless form of Eq.
(2) can be written:
" " = (1! exp [!(J + 1)#"]) (1 + #"n) (5)
The dimensionless viscosity function is defined as
$" =" "
#"=
$
$o(J + 1) = (1! exp [!(J + 1)#"])
!1
#"+ #"n!1
"(6)
(b) Governing equations and boundary conditions
The parameters relevant to this physical situation are defined with the
aid of its governing equations, which are written in dimensionless form. To
this end, the following dimensionless variables are defined:
v" =v
#1R; T " =
T
"o; p" =
p
"o; &" = R& (7)
where R is the tube radius, v is the velocity field, T is the stress field, and p
is the pressure field.
This flow is isochoric and attains a steady state when described from a
reference frame attached to the bubble front. For this steady-state situation,
the dimensionless mass and momentum conservation equations are:
&" · v" = 0; &" · T " = 0 (8)
In this analysis it is assumed that the material behaves like the generalized
Newtonian material model [6], given by:
T " = !p"1 + $"(#")!" (9)
where !" = &"v" + (&"v")T is the rate-of-deformation tensor field, #" "
DBD
PUC-Rio - Certificação Digital Nº 0621119/CA

Chapter IV. Displacements in Capillary Tubes 71
'tr !"2/2 is a measure of its intensity, and $"(#") is given by Eq. (6).
The boundary conditions are now described with the aid of Fig. IV.2.
The no-slip/impermeability boundary condition is assumed at the tube wall,
v" = !U"ez, where U" is the (dimensionless) speed of the bubble front and ez
is a unit vector in the axial direction. Each value of U" implies a given value
of " "R " "R/"o, the wall shear stress far ahead of the bubble front, and hence
either one (" "R or U") can be chosen as the parameter related to the flow rate.
2R2R
b
- U
reference frame is !
attached to the bubble front
uniform pressure fully developed flow
!R
Figure IV.2: The boundary conditions as described from a reference frameattached to the bubble front.
Far upstream of the bubble front, the pressure is assumed to be uniform
within the material layer and equal to pin, i. e. ez · T " · ez = !pin/"o, where
pin is also dictated by U" (or " "R).
Far away downstream of the bubble front, fully developed flow is ex-
pected, i. e. ez · T " = 0 on the downstream cross section.
At the interface, two boundary conditions are imposed. The first is a
kinematic condition, n ·u" = 0, where n is the local unit vector normal to the
interface and pointing into the gas phase. The second condition arises from a
stress balance, n · T " = n/(R"mCap), where R"
m = Rm/R is the local mean
curvature radius, and Cap " "oR/! is a parameter that gives the relative
importance of yield stress and surface tension as far as the interface shape is
concerned. This parameter is called the plastic capillary number.
(c) Governing parameters
The foregoing analysis indicates that this flow is governed by four di-
mensionless parameters. Two of these parameters are just rheological material
properties, namely, the jump number, J , and the power-law exponent, n. The
third parameter is the plastic capillary number, Cap, which depends on the
yield stress, the surface tension, and the tube geometry.
DBD
PUC-Rio - Certificação Digital Nº 0621119/CA

Chapter IV. Displacements in Capillary Tubes 72
The last parameter is a flow parameter, and there are a number of
equivalent choices for it. One possible choice is the dimensionless wall shear
stress far ahead of the bubble front, " "R. Because the yield stress was taken
as the characteristic stress, this parameter can also be seen as the reciprocal
of a Bingham number. Another possible choice is the dimensionless average
velocity of the material far ahead of the bubble front, u". It is clear that there
is a one-to-one relationship between u" and " "R (see Sec. IV.4(a) below). The
dimensionless velocity of the bubble front, U" = u"/(1 ! m) is still another
choice.
IV.3 The Experiments
(a) The displacement experiments
The displacement experiments are now described with the aid of Fig.
IV.3. The main components of the test rig are an air tank, a Carbopol storage
tank, a glass tube, and a glass box. The tube diameter is 2R = 3 mm,
while its length is L = 600 mm. During the visualization tests, the glass box
that surrounds the tube is kept full with glycerin, to help eliminating image
distortion due to refraction.
After the storage tank is loaded with a previously prepared and char-
acterized Carbopol dispersion, both tanks are pressurized with the aid of the
laboratory compressed air line. Pressostatic valves (not shown in Fig. IV.3)
keep their pressure at a preselected constant value.
The flow-control valves are first set to allow the Carbopol dispersion to
flow into the hose and then into the glass tube. When the latter is completely
filled with the dispersion, the flow is interrupted, the tube (full with dispersion)
is disconnected from the test section and then weighed in a 0.01 g-resolution
balance. It is then reassembled into the flow circuit.
A new setting of the valves allows the air from the air tank to push the
dispersion through the glass tube and out of the flow circuit. For di!erent
flow rates, the shape of the air-dispersion interface front is photographed with
a CCD camera, and the total displacement time is recorded. An essentially
constant speed U is obtained during the experiments by maintaining the valve
downstream partially closed, thus ensuring that the dominant pressure drop
in the flow circuit occurs past this valve.
After the bubble front has left the glass tube, the flow is stopped. The
glass tube is disconnected from the flow circuit and then it is weighted again.
The results of these two weighings (together with the weight of the clean tube)
DBD
PUC-Rio - Certificação Digital Nº 0621119/CA

Chapter IV. Displacements in Capillary Tubes 73
U
Carbopol!
tank
air!
tank
glass tube
valves
transparent box
hoses
valves
Figure IV.3: The experimental setup.
allow the determination of the fractional mass coverage m of the tube inner
surface by taking the ratio of mass of dispersion remaining on the tube wall
to the total mass of dispersion for the full tube:
m =mass remaining
total mass(10)
The mass and time measurements allow the determination of the mass flow
rate and the average velocity of the dispersion. The bubble front velocity
U is also calculated with these data and with the aid of the continuity
principle. The mass density of the Carbopol dispersions was measured with
a calibrated picnometer, and the value obtained was % = 999.6± 0.2 kg/m3 for
all dispersions.
The plastic capillary number Cap = "oR/! was also evaluated for
each Carbopol dispersion. The surface tension ! was measured with the
aid of a platinum-ring tensiometer. This measurement was feasible for low-
concentration dispersions only, and ! = 0.06 ± 0.005 Pa.m was obtained
independently of the concentration. It was not possible to perform reliable
measurements for high-concentration dispersions, and the value ! = 0.06 Pa.m
was assumed for all dispersions. This approximation seems to be of little
importance in the evaluation of Cap because "o is expected to be a much
stronger function of concentration than !.
The shear stress at the wall, "R, appearing in the flow parameter " "R =
"R/"o was evaluated by obtaining, for each flow rate, the numerical solution
of the momentum equation for the fully developed flow ahead of the bubble
DBD
PUC-Rio - Certificação Digital Nº 0621119/CA

Chapter IV. Displacements in Capillary Tubes 74
front (see sec. IV.4(a) below). In the experiments, " "R was varied by varying
the air pressure and hence the flow rate. An uncertainty analysis yielded error
estimates below 10% both for m and " "R.
(b) Rheology of the Carbopol dispersions
1
10
100
1000
10-6
0.0001 0.01 1 100
0.11%
0.15%
0.17%
0.09%
! (Pa)
" (s-1).
#o = 6.06 x 10
6 Pa.s
!o = 78.7 Pa
K = 39.5 Pa.sn
n = 0.36
#o = 4.39 x 10
6 Pa.s
!o = 32.6 Pa
K = 21.4 Pa.sn
n = 0.36
#o = 2.11 x 10
6 Pa.s
!o = 17.6 Pa
K = 6.31 Pa.sn
n = 0.41
#o = 5.95 x 10
5 Pa.s
!o = 8.03 Pa
K = 2.85 Pa.sn
n = 0.44
Figure IV.4: The flow curves of the Carbopol dispersions.
Aqueous dispersions of Carbopol 676 at di!erent concentrations were
employed in the flow experiments. The dispersions were NaOH-neutralized to
achieve a pH of about 7. Right after preparation, the dispersions presented
too many air bubbles, but after a few days at rest the small bubbles seem
to dissolve into the dispersion. The viscosity function of these materials was
obtained with an ARES rotational rheometer at controlled strain mode and
a modified Couette geometry designed to circumvent possible apparent-slip
problems (e.g. [21, 22]). The modification consists of the introduction of longi-
tudinal grooves on both the bob and the cup surfaces. The grooves are 1-mm
deep, 2-mm wide, and roughly 2-mm spaced. This geometry was successfully
tested with standard Newtonian mineral oils. The results obtained essentially
coincided with the corresponding ones obtained with smooth surfaces. Each
data point was taken only after the steady state was achieved. The data-points
corresponding to the lowest shear rate were obtained from creep experiments
DBD
PUC-Rio - Certificação Digital Nº 0621119/CA

Chapter IV. Displacements in Capillary Tubes 75
performed in a UDS 200 Paar-Phisica rheometer, because the rate-sweep tests
of the ARES rheometer employed could not handle such low shear rates. In
these creep tests, a constant stress below the yield stress is imposed, and, after
a steady flow is attained, typically after up to 48 hours, the corresponding
shear rate is obtained. Flow curves were obtained both with fresh samples and
with samples collected after the experiments, and no significant degradation
signs were observed.
0.0001
0.01
1
100
104
106
0.001 0.01 0.1 1 10 100 1000
J = 7.80 x 10⁵; n = 0.44 (0.09%)
J = 1.46 x 10⁶; n = 0.41 (0.11%)
J = 4.34 x 10⁵; n = 0.36 (0.15%)
J = 5.23 x 10⁵; n = 0.36 (0.17%)
!*
"*
Figure IV.5: The dimensionless viscosity functions of the Carbopol dispersions.
The results obtained are shown in Fig. IV.4, together with the rheological
parameters determined with curve fittings employing Eq. (2). These fittings
are shown to reproduce well the data obtained. All materials present a clearly
viscoplastic behavior, characterized by the shear rate jump at the yield stress.
Fig. IV.5 presents the viscosity functions of the Carbopol dispersions in
dimensionless form, with their respective dimensionless rheological parame-
ters. This figure shows that, in the range covered by the Carbopol dispersions
investigated, the e!ect of power-law exponent n on the viscosity function is
restricted to " " ! 8. Therefore, when " " " 8, the only relevant rheological
parameter is the jump number J .
DBD
PUC-Rio - Certificação Digital Nº 0621119/CA

Chapter IV. Displacements in Capillary Tubes 76
IV.4 Results and Discussion
(a) Results for the fully-developed flow
Before presenting the displacement results, it is important to examine
the fully developed flow that occurs far downstream of the bubble front. This
analysis was done by de Souza Mendes et al. [26].
For the fully developed flow through a tube of radius R, driven by an
axial pressure gradient dp/dz, an overall force balance yields
! "r!(R) = "(R) = "R = !dp
dz
R
2(11)
The momentum conservation principle also dictates that the shear stress
"r! is a linear function of the radial coordinate r. Thus, it is possible to write,
in dimensionless form:
" " = " "Rr" (12)
For fully developed flow, the dimensionless shear rate is
#" = !du"
dr"(13)
where u" " u/#1R is the dimensionless axial velocity. Combining Eqs. (5) and
(12)
" "Rr" = (1! exp [!(J + 1)#"]) (1 + #"n) (14)
Equation (14) yields #"(r"), which can be combined with Eq. (13)
and integrated for the velocity profile u"(r"). The integration is performed
numerically with the aid of a non-uniform mesh of 2000 nodal points along the
radial coordinate r". Half of the nodal points (1000) are concentrated in the
region of high velocity gradients, namely, around the radial position r"o = 1/" "Rwhere " " = 1. This mesh was shown to yield mesh-independent results for all
cases investigated. To handle the non-linear nature of this equation, for each
set of values of the parameters {" "R, J, n}, the following solution strategy is
adopted:
1. for each nodal point, Eq. (14) is solved iteratively for #";
DBD
PUC-Rio - Certificação Digital Nº 0621119/CA

Chapter IV. Displacements in Capillary Tubes 77
2. then Eq. (13) is integrated using the trapezoidal rule. The axial symmetry
and no-slip boundary conditions, namely, #"(0) = 0 and u"(1) = 0 are
employed.
10-9
10-7
10-5
10-3
10-1
101
10-2
10-1
100
101
102
J = 100
J = 10000
J = 1000000
!*R
n = 1
u*
10-9
10-7
10-5
10-3
10-1
101
10-2
10-1
100
101
102
J = 100
J = 10000
J = 1000000
!*R
n = 0.8
u*
10-9
10-7
10-5
10-3
10-1
101
103
10-2
10-1
100
101
102
J = 100
J = 10000
J = 1000000
!*R
n = 0.5
u*
10-9
10-7
10-5
10-3
10-1
101
103
105
10-2
10-1
100
101
102
J = 100
J = 10000
J = 1000000
n = 0.3
!*R
u*
Figure IV.6: Dimensionless average velocity as a function of the dimensionlesswall shear stress.
The average axial velocity u" is obtained from
u" = 2
( 1
0
u"r"dr" (15)
Fig. IV.6 shows the dimensionless average velocity as a function of the
dimensionless wall shear stress for di!erent values of the jump number. A
steep increase in average velocity is observed just beyond " "R = 1. As " "R is
further increased, the curves for di!erent J values merge, at u" ' 1/J , into
the J #$ envelope curve.
DBD
PUC-Rio - Certificação Digital Nº 0621119/CA

Chapter IV. Displacements in Capillary Tubes 78
0.1
1
10
102
103
104
105
106
0 0.2 0.4 0.6 0.8 1
J = 100
J = 10000
J = 1000000
r*
!*
"*R= 1.02
n = 1
10
102
103
104
105
106
0 0.2 0.4 0.6 0.8 1
J = 100
J = 10000
J = 1000000
r*
!*
"*R= 1.02
n = 0.5
10
102
103
104
105
106
0 0.2 0.4 0.6 0.8 1
J = 100
J = 10000
J = 1000000
r*
!*
"*R= 1.08
n = 1
10
102
103
104
105
106
0 0.2 0.4 0.6 0.8 1
J = 100
J = 10000
J = 1000000
r*
!*
"*R= 1.08
n = 0.5
1
10
102
103
104
105
106
0 0.2 0.4 0.6 0.8 1
J = 100
J = 10000
J = 1000000
r*
!*
"*R= 10
n = 1
0.1
1
10
102
103
104
105
106
0 0.2 0.4 0.6 0.8 1
J = 100
J = 10000
J = 1000000
r*
!*
"*R= 10
n = 0.5
Figure IV.7: Dimensionless viscosity profiles.
These results demonstrate the existence of three distinct flow regimes,
depending on the range of " "R:
– when " "R ( 1, a Newtonian flow regime is observed, with a dimensionless
average velocity u" < 1/J ;
– when 1 < " "R < f(n), a lubricated-plug flow regime is observed. The
function f(n) is the value of " "R corresponding to u" = 1. From Fig. IV.6
it is seen that 2.9 " f(n) " 5 for 0.3 < n < 1. In this range the average
velocity increases from 1/J up to 1, very steeply in the vicinity of " "R = 1
and progressively less steeply as " "R increases towards f(n);
DBD
PUC-Rio - Certificação Digital Nº 0621119/CA

Chapter IV. Displacements in Capillary Tubes 79
0
0.5
1
1.5
2
0 0.2 0.4 0.6 0.8 1
J = 100
J = 10000
J = 1000000
!*R= 1.02
n = 1
r*
u*/u
*
0 0.2 0.4 0.6 0.8 1
J = 100
J = 10000
J = 1000000
0
0.5
1
1.5
2
u*/u
*
r*
!*R= 1.02
n = 0.5
0
0.5
1
1.5
2
0 0.2 0.4 0.6 0.8 1
J = 100
J = 10000
J = 1000000
!*R= 1.08
n = 1
r*
u*/u
*
0
0.5
1
1.5
2
0 0.2 0.4 0.6 0.8 1
J = 100
J = 10000
J = 1000000
u*/u
*
r*
!*R= 1.08
n = 0.5
0
0.5
1
1.5
2
0 0.2 0.4 0.6 0.8 1
J = 100
J = 10000
J = 1000000
!*R= 10
n = 1
r*
u*/u
*
0
0.5
1
1.5
2
0 0.2 0.4 0.6 0.8 1
J = 100
J = 10000
J = 1000000
u*/u
*
r*
!*R= 10
n = 0.5
Figure IV.8: Dimensionless velocity profiles.
– at the other end when " "R > f(n), a power-law flow regime is observed,
i.e. the flow rate is no longer a!ected by the viscoplastic nature of the
material.
The viscosity profiles shown in Fig. IV.7 illustrate the important viscosity
changes that occur for high jump numbers in the vicinity of the radial position
where the shear stress equals the yield stress. When this radial position is close
to the tube wall, a thin layer of low-viscosity, lubricating liquid is observed,
causing the steep flow rate increases observed in the lubricated-plug flow
regime.
Fig. IV.8 illustrates the shape of the axial velocity profile for di!erent
DBD
PUC-Rio - Certificação Digital Nº 0621119/CA

Chapter IV. Displacements in Capillary Tubes 80
values of J , n, and " "R. As illustrated in the graphs pertaining to " "R values
closer to unity, the jump number dictates the shape of the velocity profile.
For example, it can be observed that the velocity profile for the case n = 0.5,
J = 106 undergoes a significant change as " "R is further increased from 1.02
(Fig. IV.8, top right graph) to 1.08 (Fig. IV.8, middle right graph). This change
is explained as follows. For this case, when " "R = 1.02, the thickness of the low-
viscosity layer, say &, is so small that the velocity jump across it, #1&, is still
negligible. As " "R is further increased to 1.08, & increases enough to render #1&
large, modifying the velocity profile and causing the flow rate jump illustrated
in Fig. IV.6. However, it is seen from the last two graphs (" "R = 10) that,
for wall shear stress values much larger than the yield stress (power-law flow
regime), the jump number has essentially no e!ect on the profile shape, because
most of the material in the flow domain is yielded.
For a given value of " "R within the lubricated-plug flow regime, the
thickness & of the low-viscosity layer is a function of the jump number, as
inferred from Figs. IV.7 and IV.8. As it will be discussed shortly, the fractional
mass coverage m and the low-viscosity layer thickness & are closely related.
(b) Fractional mass coverage results
The foregoing discussion for the fully developed-flow that occurs ahead of
the bubble provides the basis for understanding the observations made during
the displacement experiments, to be presented in what follows.
In a typical set of experiments with a given Carbopol dispersion, at low
flow rates it is possible to observe perfect displacements and low-curvature air-
liquid interfaces, whereas imperfect displacements and higher-curvature bubble
fronts were observed for higher flow rates.
Figure IV.9 shows the air-liquid interfaces for the four viscoplastic
materials investigated, corresponding to Cap = 0.20, 0.45, 0.83, and 2.0. For
each of these materials, the picture of the interface is shown for four di!erent
flow rates, i.e. the picture on the left pertains to a very low value of u", and the
subsequent pictures towards the right pertain to progressively larger values of
u". Table IV.1 gives the values of Cap, u", " "R, and m corresponding to each of
the pictures shown in Fig. IV.9.
It is seen in these pictures that, for each material, the interface curvature
increases as u" is increased. Moreover, the thickness of the layer of viscoplastic
material left on the tube wall increases as u" is increased. Actually, in the
left-hand side pictures (very low-u" cases) of Fig. IV.9, no material seems to
be left behind, i.e. the displacement seems to be perfect. For the higher-Cap
cases, the interface remains undeformed because most of the material is un-
DBD
PUC-Rio - Certificação Digital Nº 0621119/CA

Chapter IV. Displacements in Capillary Tubes 81
yielded. It is worth emphasizing that a perfect displacement is not observed
for Newtonian or viscoelastic materials (e.g. [68, 75, 76, 87]).
(a)
(b)
(c)
(d)
Figure IV.9: Interface shapes. (a) Carbopol 0.09%; (b) Carbopol 0.11%; (c)Carbopol 0.15%; (d) Carbopol 0.17%. The bubble speed increases from left toright; see Table IV.1 for the corresponding Cap, u", " "R, and m values.
As the material yields (at higher u"’s), the air penetrates into the
material and the interface curvature increases, and a layer of material is left
behind on the wall. This layer remains static and unyielded. The pictures
on the second column in Fig. IV.9 (low-u" cases) illustrate the early stages
of deposition, when only small lumps of unyielded material are left on the
wall. This observation may be related to instabilities of the type reported by
Gabard and Hulin [81]. As the average velocity is further increased (medium
and fast flow cases), the amount of material left behind on the wall increases,
and a smooth layer of nearly-uniform1 thickness is observed. The approximate
maximum Reynolds number values achieved were 0.8 for air and 0.3 for the
Carbopol dispersions.
1A mild buoyancy e!ect was present in the experiments, displacing the bubble upwardsand somewhat distorting the interface.
DBD
PUC-Rio - Certificação Digital Nº 0621119/CA
Chapter IV. Displacements in Capillary Tubes 82
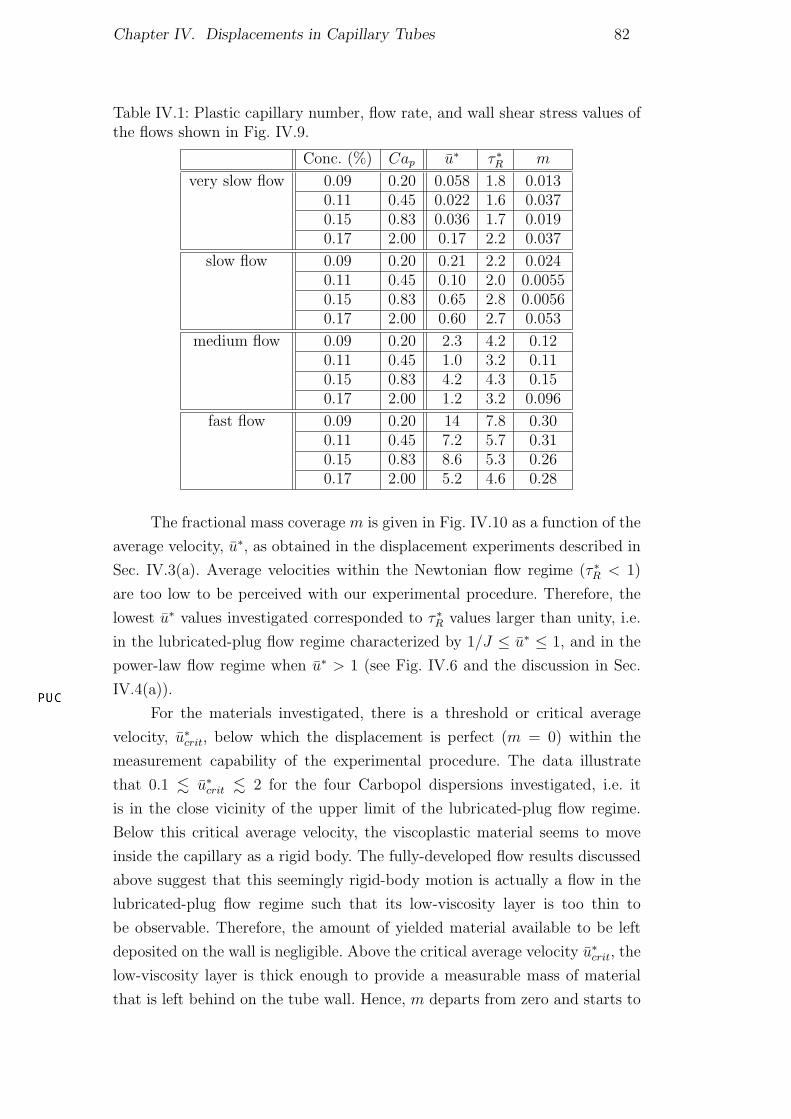
Table IV.1: Plastic capillary number, flow rate, and wall shear stress values ofthe flows shown in Fig. IV.9.
Conc. (%) Cap u" " "R m
very slow flow 0.09 0.20 0.058 1.8 0.0130.11 0.45 0.022 1.6 0.0370.15 0.83 0.036 1.7 0.0190.17 2.00 0.17 2.2 0.037
slow flow 0.09 0.20 0.21 2.2 0.0240.11 0.45 0.10 2.0 0.00550.15 0.83 0.65 2.8 0.00560.17 2.00 0.60 2.7 0.053
medium flow 0.09 0.20 2.3 4.2 0.120.11 0.45 1.0 3.2 0.110.15 0.83 4.2 4.3 0.150.17 2.00 1.2 3.2 0.096
fast flow 0.09 0.20 14 7.8 0.300.11 0.45 7.2 5.7 0.310.15 0.83 8.6 5.3 0.260.17 2.00 5.2 4.6 0.28
The fractional mass coverage m is given in Fig. IV.10 as a function of the
average velocity, u", as obtained in the displacement experiments described in
Sec. IV.3(a). Average velocities within the Newtonian flow regime (" "R < 1)
are too low to be perceived with our experimental procedure. Therefore, the
lowest u" values investigated corresponded to " "R values larger than unity, i.e.
in the lubricated-plug flow regime characterized by 1/J ( u" ( 1, and in the
power-law flow regime when u" > 1 (see Fig. IV.6 and the discussion in Sec.
IV.4(a)).
For the materials investigated, there is a threshold or critical average
velocity, u"crit, below which the displacement is perfect (m = 0) within the
measurement capability of the experimental procedure. The data illustrate
that 0.1 " u"crit " 2 for the four Carbopol dispersions investigated, i.e. it
is in the close vicinity of the upper limit of the lubricated-plug flow regime.
Below this critical average velocity, the viscoplastic material seems to move
inside the capillary as a rigid body. The fully-developed flow results discussed
above suggest that this seemingly rigid-body motion is actually a flow in the
lubricated-plug flow regime such that its low-viscosity layer is too thin to
be observable. Therefore, the amount of yielded material available to be left
deposited on the wall is negligible. Above the critical average velocity u"crit, the
low-viscosity layer is thick enough to provide a measurable mass of material
that is left behind on the tube wall. Hence, m departs from zero and starts to
DBD
PUC-Rio - Certificação Digital Nº 0621119/CA

Chapter IV. Displacements in Capillary Tubes 83
increase monotonically with u".
0
0.1
0.2
0.3
0.4
0.5
0.01 0.1 1 10 100
0.09%: J = 7.80 x 10⁵, n = 0.44, Cap = 0.20
0.11%: J = 1.46 x 10⁶, n = 0.41, Cap = 0.45
0.15%: J = 4.34 x 10⁵, n = 0.36, Cap = 0.83
0.17%: J = 5.23 x 10⁵, n = 0.36, Cap = 2.00m
u*
Figure IV.10: The fractional mass coverage as a function of the average velocity.
The data in Fig. IV.10 suggests that the plastic capillary number Cap
governs the slope dm/du" of the m % u" curves at m = 0. More specifically,
dm/du" at m = 0 increases as Cap is increased. Indeed, for Newtonian and
viscoelastic materials (Cap = 0), the results available in the literature show
that this slope is very small in the low-flow rate (or capillary number) range,
where m is very small. In the power-law flow regime, m is expected not
to depend on the plastic capillary number, because much of the material is
yielded, and hence the relative importance of the yield stress at the interface
becomes small.
For intermediate values of m (0.1 " m " 0.25), the slope of the curves
becomes roughly the same. In this range, where the average velocity values are
u" " 6, the corresponding fully-developed wall shear stress values are " "R " 6.
Fig. 6 shows that the power-law exponent n does not a!ect significantly the
(dimensionless) viscosity function in this range of shear stress, and hence it
should not a!ect the m curves either. Therefore, m should depend on J only.
Indeed, in this range the curves are positioned with respect to each other
according to their jump number values, J increasing from left to right. Thus, for
a given flow rate u", m decreases as J is increased. This behavior is consistent
with the dependence of the velocity profiles on the jump number, illustrated in
DBD
PUC-Rio - Certificação Digital Nº 0621119/CA

Chapter IV. Displacements in Capillary Tubes 84
Fig. IV.8. This figure shows that the thickness of the layer of yielded material
decreases as the jump number is increased.
For larger values of u" (and hence larger values of m), the slopes of the m
curves decrease, and this trend is more pronounced for the curves pertaining to
lower jump number values. In the range of u" well within the power-law flow
regime, the shear stresses are within the range where the viscosity depends
strongly on the power-law exponent n and does not depend on the jump
number J (Fig. 6). Thus, in the transition range where the jump number
influence diminishes while the influence of the power-law exponent increases,
the m curves for the four Carbopol dispersions tend to approach each other as
u" is increased. Indeed, from the behavior already established for Newtonian
liquids, is seems reasonable to expect that, at su"ciently large values of u"
such that the flow is well within the power-law regime, the four curves reach
asymptotic values that depend on the power-law exponent only. However, large
enough flow rates could not be achieved with the experimental setup employed,
and hence the just described expected trend remains to be verified.
Finally for this section, it is illustrative to discuss what it is expected to
occur in the range " "R < 1, which was not explored in the experiments due to
the extremely low velocities. In this range the Carbopol dispersions behave as
Newtonian liquids with viscosity $o. Hence, Taylor’s Newtonian m%Ca curve
[71] should be applicable for Ca = $oU/! " Cap/(1 !m) (or u" " 1/J), i.e.
when " "R < 1.
IV.5 Final RemarksAn investigation about the displacement of viscoplastic materials in
capillary tubes by gas injection was reported in this chapter. The research
encompassed experiments with Carbopol aqueous dispersions and an analysis
of the fully-developed flow of the viscoplastic materials alone [26], to aid in the
understanding of the experimental flow-displacement results.
The measured viscosity data were fitted to the viscosity function pro-
posed by de Souza Mendes and Dutra [24]. This equation was made dimen-
sionless with the aid of its own parameters only, giving rise to the jump number,
a novel rheological property of viscoplastic materials.
The results obtained showed that, below a certain critical flow rate, the
viscoplastic material is perfectly displaced by the pushing gas. Just above this
critical flow rate, which depends on the jump number, small lumps of unyielded
material begin to deposit on the tube wall. As the flow rate is further increased,
a smooth material layer of uniform thickness begins to form. The thickness
DBD
PUC-Rio - Certificação Digital Nº 0621119/CA

Chapter IV. Displacements in Capillary Tubes 85
of the layer is observed to increase with the dimensionless flow rate and to
decrease as the jump number is increased.
IV.6 NoteIn this chapter it was realized an analysis of the displacements of
viscoplastic materials in capillary tubes. Sec. IV.1 is a bibliography review
about the subject performed by prof. de Souza Mendes. In Sec. IV.2 the
governing equations found in the bibliography review are shown. In Sec. IV.3
the experiments realized by Jose Roberto Si!ert in partnership with myself
and Eduardo Dutra are described. It is important to point out that when I
started to work in this research the paper had already been submitted, so
that my name does not appear in the publication. Although, after I started
to work in this research all experimental results were redone. I spent a lot of
time developing the techniques used to capture the images taken and shown
in this chapter. I also worked hard in the techniques of Carbopol dispersions
preparation. I characterized all of the dispersions used, and collaborated with
the fraction mass measurements. Thus, this chapter is in my thesis. The results
of this research are shown and discussed in Sec. IV.4, and some final remarks
can be found in Sec. IV.5. This research in which I collaborated was led by
prof. de Souza Mendes.
DBD
PUC-Rio - Certificação Digital Nº 0621119/CA
Related Documents