IUPAC critical evaluation of the rotational–vibrational spectra of water vapor. Part II Energy levels and transition wavenumbers for HD 16 O, HD 17 O, and HD 18 O Jonathan Tennyson a, , Peter F. Bernath b , Linda R. Brown c , Alain Campargue d , Attila G. Csa ´ sza ´r e , Ludovic Daumont f , Robert R. Gamache g , Joseph T. Hodges h , Olga V. Naumenko i , Oleg L. Polyansky j,a , Laurence S. Rothman k , Robert A. Toth c , Ann Carine Vandaele l , Nikolai F. Zobov j , Sophie Fally m , Alexander Z. Fazliev i , Tibor Furtenbacher e , Iouli E. Gordon k , Shui-Ming Hu n , Semen N. Mikhailenko i , Boris A. Voronin i a Department of Physics and Astronomy, University College London, London WC1E 6BT, UK b University of York, York, UK c Jet Propulsion Laboratory, California Institute of Technology, Pasadena, CA, USA d Universite´ Joseph Fourier, Grenoble, France e Lora ´nd E¨ otv¨ os University, Budapest, Hungary f Universite´ de Reims Champagne-Ardenne, Reims, France g University of Massachussets, Lowell, MA, USA h National Institute of Standards and Technology, Gaithersburg, MD, USA i V. E. Zuev Institute of Atmospheric Optics, Russian Academy of Sciences, 1, Academician Zuev square, 634021 Tomsk, Russia j Institute of Applied Physics, Russian Academy of Sciences, Nizhny Novgorod, Russia k Harvard-Smithsonian Center for Astrophysics, Cambridge, MA, USA l Institut d’Ae´ronomie Spatiale de Belgique, Brussels, Belgium m Universite´ Libre de Bruxelles, Brussels, Belgium n Laboratory of Bond-Selective Chemistry, University of Science and Technology of China, Hefei 230026, China article info Keywords: Water vapor Transition wavenumbers Atmospheric physics Energy levels MARVEL Information system Database W@DIS Infrared spectra Microwave spectra HD 16 O HD 17 O HD 18 O abstract This is the second of a series of articles reporting critically evaluated rotational– vibrational line positions, transition intensities, pressure dependences, and energy levels, with associated critically reviewed assignments and uncertainties, for all the main isotopologues of water. This article presents energy levels and line positions of the following singly deuterated isotopologues of water: HD 16 O, HD 17 O, and HD 18 O. The MARVEL (measured active rotational–vibrational energy levels) procedure is used to determine the levels, the lines, and their self-consistent uncertainties for the spectral regions 0–22 708, 0–1674, and 0–12 105 cm 1 for HD 16 O, HD 17 O, and HD 18 O, respectively. For HD 16 O, 54 740 transitions were analyzed from 76 sources, the lines come from spectra recorded both at room temperature and from hot samples. These lines correspond to 36 690 distinct assignments and 8818 energy levels. For HD 17 O, only 485 transitions could be analyzed from three sources; the lines correspond to 162 MARVEL energy levels. For HD 18 O, 8729 transitions were analyzed from 11 sources and these lines correspond to 1864 energy levels. The energy levels are checked against ones determined from accurate variational nuclear motion computations employing exact Contents lists available at ScienceDirect journal homepage: www.elsevier.com/locate/jqsrt Journal of Quantitative Spectroscopy & Radiative Transfer 0022-4073/$ - see front matter & 2010 Elsevier Ltd. All rights reserved. doi:10.1016/j.jqsrt.2010.06.012 Corresponding author. E-mail address: [email protected] (J. Tennyson). Journal of Quantitative Spectroscopy & Radiative Transfer 111 (2010) 2160–2184

Welcome message from author
This document is posted to help you gain knowledge. Please leave a comment to let me know what you think about it! Share it to your friends and learn new things together.
Transcript
Contents lists available at ScienceDirect
Journal of Quantitative Spectroscopy &Radiative Transfer
Journal of Quantitative Spectroscopy & Radiative Transfer 111 (2010) 2160–2184
0022-40
doi:10.1
� Cor
E-m
journal homepage: www.elsevier.com/locate/jqsrt
IUPAC critical evaluation of the rotational–vibrational spectra ofwater vapor. Part IIEnergy levels and transition wavenumbers for HD16O, HD17O,and HD18O
Jonathan Tennyson a,�, Peter F. Bernath b, Linda R. Brown c, Alain Campargue d,Attila G. Csaszar e, Ludovic Daumont f, Robert R. Gamache g, Joseph T. Hodges h,Olga V. Naumenko i, Oleg L. Polyansky j,a, Laurence S. Rothman k, Robert A. Toth c,Ann Carine Vandaele l, Nikolai F. Zobov j, Sophie Fally m, Alexander Z. Fazliev i,Tibor Furtenbacher e, Iouli E. Gordon k, Shui-Ming Hu n,Semen N. Mikhailenko i, Boris A. Voronin i
a Department of Physics and Astronomy, University College London, London WC1E 6BT, UKb University of York, York, UKc Jet Propulsion Laboratory, California Institute of Technology, Pasadena, CA, USAd Universite Joseph Fourier, Grenoble, Francee Lorand Eotvos University, Budapest, Hungaryf Universite de Reims Champagne-Ardenne, Reims, Franceg University of Massachussets, Lowell, MA, USAh National Institute of Standards and Technology, Gaithersburg, MD, USAi V. E. Zuev Institute of Atmospheric Optics, Russian Academy of Sciences, 1, Academician Zuev square, 634021 Tomsk, Russiaj Institute of Applied Physics, Russian Academy of Sciences, Nizhny Novgorod, Russiak Harvard-Smithsonian Center for Astrophysics, Cambridge, MA, USAl Institut d’Aeronomie Spatiale de Belgique, Brussels, Belgiumm Universite Libre de Bruxelles, Brussels, Belgiumn Laboratory of Bond-Selective Chemistry, University of Science and Technology of China, Hefei 230026, China
a r t i c l e i n f o
Keywords:
Water vapor
Transition wavenumbers
Atmospheric physics
Energy levels
MARVEL
Information system
Database
W@DIS
Infrared spectra
Microwave spectra
HD16O
HD17O
HD18O
73/$ - see front matter & 2010 Elsevier Ltd. A
016/j.jqsrt.2010.06.012
responding author.
ail address: [email protected] (J. Tennyson
a b s t r a c t
This is the second of a series of articles reporting critically evaluated rotational–
vibrational line positions, transition intensities, pressure dependences, and energy
levels, with associated critically reviewed assignments and uncertainties, for all the
main isotopologues of water. This article presents energy levels and line positions of
the following singly deuterated isotopologues of water: HD16O, HD17O, and HD18O. The
MARVEL (measured active rotational–vibrational energy levels) procedure is used to
determine the levels, the lines, and their self-consistent uncertainties for the spectral
regions 0–22 708, 0–1674, and 0–12 105 cm�1 for HD16O, HD17O, and HD18O,
respectively. For HD16O, 54 740 transitions were analyzed from 76 sources, the lines
come from spectra recorded both at room temperature and from hot samples. These
lines correspond to 36 690 distinct assignments and 8818 energy levels. For HD17O, only
485 transitions could be analyzed from three sources; the lines correspond to 162
MARVEL energy levels. For HD18O, 8729 transitions were analyzed from 11 sources and
these lines correspond to 1864 energy levels. The energy levels are checked against ones
determined from accurate variational nuclear motion computations employing exact
ll rights reserved.
).
J. Tennyson et al. / Journal of Quantitative Spectroscopy & Radiative Transfer 111 (2010) 2160–2184 2161
Table 1Experimental sources recalibrated for the three isoto
Tag Range (cm�1)
78KaKaKy [43] 151–420
86FlCaMaGu [52] 1125–1890
91RiSmDeBe [58] 1176–1650
83Guelachv [47] 1191–1740
89OhSa [55] 6384–6596
99HuLiHeCh [70] 12 525–12 912
00NaBeCaSc [75] 13 165–13 500
a Shift of the middle wavenumber value of the rb Indicates that half of the energy levels involv
transitions.c This shift is within the original precision of abod The same calibration factor was determined ine A very similar calibration factor was determinef This is the only ICLAS measurement which was
kinetic energy operators. This comparison shows that the measured transitions account
for about 86% of the anticipated absorbance of HD16O at 296 K and that the transitions
predicted by the MARVEL energy levels account for essentially all the remaining
absorbance. The extensive list of MARVEL lines and levels obtained are given in the
Supplementary Material of this article, as well as in a distributed information system
applied to water, W@DIS, where they can easily be retrieved. In addition, the transition
and energy level information for H217O and H2
18O, given in the first paper of this series
[Tennyson, et al. J Quant Spectr Rad Transfer 2009;110:573–96], has been updated.
& 2010 Elsevier Ltd. All rights reserved.
1. Introduction
The water molecule is the most abundant polyatomicmolecule in the universe and the single most importantspecies for controlling the Earth’s climate. Thus, thespectrum of water is both one of the most importantand one of the most thoroughly studied.
The first 14 authors of this article form a Task Groupunder the auspices of the International Union of Pure andApplied Chemistry (IUPAC) with the aim of constructing adatabase of water transitions from experiment andtheory, with individual tasks described in Table 1 of thefirst paper in this series [1], henceforth known as Part I.Given the nature of water spectroscopy [2], this databasewill concentrate on the pure rotational and rotation–vibration transitions of water which we consider simul-taneously on an equal basis. This paper is the second in aseries presenting our evolving methods for collecting andanalyzing the experimental and quantum chemical spec-troscopic information as well as our validated dataadvocated for deposition in databases. In Part I, wederived energy levels and transition wavenumbers forthe water isotopologues H2
17O and H218O. This was done
using the measured active rotational–vibrational energylevels (MARVEL) protocol of Furtenbacher et al. [3–5],which was refined during Part I to allow for the treatmentof larger datasets and to perform a significant amount ofchecking in order to minimize errors and inconsistenciesin the initial experimental transition data.
In this work we apply MARVEL to the HD16O, HD17O,and HD18O isotopologues of the water molecule. HD16O,
pologues of HDO during t
Calibration factor
1.000005413
0.99999977
0.99999998
0.99999977d
0.99999893
1.000000819e
0.999999452f
ange (new–old).
ed in the transitions in th
ut 0.00006 cm�1.
[130].
d in [100].
recalibrated as part of the
singly deuterated water, has a fractional abundance in theearth’s atmosphere, compared to H2
16O, of about 0.0003(note that the natural HD17O/H2
17O and HD18O/H218O
abundances have a similar, about 3�10�4 value). Eventhough a trace species, atmospheric absorption by HDO canbe significant. This is particularly true for HD16O sincesome of its absorption spectrum, unlike that of H2
17O andH2
18O, is significantly shifted from that of H216O. Observa-
tion of atmospheric HDO spectra has long been used onboth Earth [6] and other planets [7,8] as a proxy tounderstand their climatic evolution. Atmospheric HDOspectra are also being extensively observed because of theinformation they provide on the transport of water vaporinto the stratosphere [9,10]. Abundance of HDO relative toH2O can vary significantly; the proportion of HDO onVenus, for example, is over 100 times that of the terrestrialvalue [11].
Astrophysical observations of HDO are also potentiallyimportant [9]. Deuterium was formed in the first fewminutes after the Big Bang. As D is burnt rapidly in stellarinteriors, the abundance of D has been decreasing sincethis time. Deuterium burns in objects with masses greaterthan about 13 times that of Jupiter, which is one way ofdefining the boundary between a brown dwarf and aplanet. Observations of HDO in the atmospheres of suchobjects, which are cool enough to be largely molecular buthot by terrestrial standards, could be the key to adeuterium test [12] that would distinguish betweenplanets and other sub-stellar objects. In the cold inter-stellar medium fractionation effects become importantleading to an expected over-abundance of HDO [13].
he course of this work.
Shifta (cm�1) Medianb Original standard
+0.0013 293
�0.00035 29 [47]
�0.00003c 49 [132]
�0.00035 45 [133]
�0.0069 23 [134]
+0.0104 7 [135]
�0.0073
e given source are part of at least this many measured and validated
present study.
J. Tennyson et al. / Journal of Quantitative Spectroscopy & Radiative Transfer 111 (2010) 2160–21842162
Astronomical applications of water spectra thereforerequire spectral data appropriate for very low tempera-tures up to stellar temperatures of about 3000 K.
As emphasized in Part I, a distinguishing feature of thepresent series of IUPAC-sponsored studies is the jointutilization of all available experimental and the besttheoretical line and level data, with a long-term aim tocreate a complete linelist for all water isotopologues.While determination of a complete linelist is outside thescope of present-day experiments, it can be determinedby means of sophisticated first-principles quantum me-chanical computations. Consequently, as long as experi-ments have a higher precision than even the mostadvanced computations that can be performed for amolecule of the size of water, the complete linelist willnecessarily contain accurate experimental data and lessaccurate computational data. MARVEL-type efforts help to(a) replace as many computed lines as possible with theirexperimental counterparts, (b) validate and ideally reducethe uncertainty with which a transition has beendetermined, and (c) facilitate the assignment of experi-mental spectra.
2. Methods, input data, and data treatment
The methods employed in this study for collecting andcritically evaluating experimental transition wavenum-bers and their uncertainties and for inverting thewavenumbers in order to obtain the best possible energylevels with uncertainties are based on the MARVELprocedure [3–5] involving the iterative robust reweight-ing scheme [14]. During a MARVEL analysis we simulta-neously process all the available assigned experimentallines and the associated energy levels for the chosenisotopologue. MARVEL is not designed to determine anynew energy levels. However, from the MARVEL energylevels obtained one can determine transitions whetherthey have been measured or not. The reweighting schememeans that uncertainties for certain selected transitionsare changed (increased) during iterations of the MARVELprocedure. After cleansing of the database and applyingthe iterative robust reweighting algorithm of MARVEL, adatabase is created containing self-consistent and cor-rectly assigned transitions and the seemingly bestpossible related uncertainties supported by the database.Energy levels, and their uncertainties, determined fromthese transitions are in harmony with the measuredtransitions and their (adjusted) uncertainties.
The first step in the MARVEL procedure is to split thetransition data into spectroscopic networks (SN). SNscontain all interconnecting rotational–vibrational energylevels supported by the grand database of the transitions.For HDO, as there is no nuclear spin symmetry, the vastmajority of the data forms a single SN. Other inter-connecting but unattached transition networks are desig-nated as floating networks (FSNs) or, in the case of a singletransition with no energy level in common with any of theother transitions in the compilation, orphans (ORPs).
For HD16O there is a considerable number of experi-mental data sources available [15–109].In particular, we
note that a number of hot HD16O spectra [64,82,86,106]are included in the above list. Hot spectra are usuallyconsiderably richer in transitions but have significantlylarger uncertainties and a higher chance of misassignmentthan spectra recorded at room temperature. As expected,there is a much smaller number of publications reportingmeasured and assigned transitions for HD17O [61,110,111] and HD18O [42,51,61,102,108,110,112–115].
Tables 2–4 provide, for each data source, experimentalinformation related to the spectra of HD16O, HD17O, andHD18O, respectively. The number of originally measured(A) and validated (V) transitions for each data source isgiven there, as well. Due to the large number of relatedexperimental studies, a nearly continuous coverage hasbeen achieved for HD16O up to 22 800 cm�1 but not forthe other two isotopologues. As modern measurements ofpure rotational transitions at microwave frequenciesðo30 cm�1Þ are very scarce, the microwave transitionswere mostly obtained from early works and are limitedin number. Conversely, early infrared measurements,such as that by Benedict et al. [29], have largely beensuperceded by more recent and more accurate measure-ments and were therefore largely omitted from the finalcompilation.
To be included in our tabulation, data sources mustinclude original experimental line positions with uncer-tainties, line assignment, and information on the experi-mental conditions under which the experimental datawere recorded. The latter data are summarized in thecolumn ‘‘Physical conditions’’ in Tables 2–4. In eachcase the data source is identified with a tag, as specifiedin Part I, based on year of publication and the names of theauthors.
Abundance is a particular issue with spectra of HDO.Since a pure sample of HDO would partially dispropor-tionate to H2O and D2O, it is not possible to record spectraof pure HDO. In practice, 50% HDO is normally the bestthat can be achieved. The presence of significant quan-tities of H2O and D2O in any HDO sample means that agood knowledge of spectra of these species is a pre-requisite for analyzing spectra of HDO. Furthermore, it isvery difficult to get complete spectral coverage for HDOsince some transitions are obscured by strong linesassociated with H2O or D2O.
Most of the spectra were obtained by Fourier trans-form spectroscopy (FTS), which gives a wide spectralcoverage from the microwave region to the near ultra-violet. In order to detect weak lines, FTS spectrometershave been equipped with long multipass cells. Absorptionpath lengths as large as 433 and 1804 m have beenachieved with the cells available at Kitt Peak and Reims,respectively, providing a large number of observedtransitions, mostly in the near infrared (NIR) region.
Laser-based methods, such as CRDS (cavity ringdownspectroscopy) and ICLAS (intracavity laser absorptionspectroscopy), are limited to certain spectral regionsdepending on the availability of tunable laser sources.These techniques have specific advantages in terms ofsensitivity and spectral resolution, which make themparticularly suitable for the characterization of spectralregions with weak absorption features. This is why

Table 2Data sources and their characteristics for HD16O (see Section 2.8 for commentsa).
Tag Range (cm�1) Trans. A/V Physical conditions Comments
T (K) p (hPa) Abun. Rec. L (m)
62TrBe [32] 0.016–0.028 2/2 RT SMM (2a)
55WeBeHe [27] 0.016–0.102 6/1 RT SMM (2b)
53BeWe [21] 0.027–0.101 5/4 RT SMM (2c)
54PoSt [26] 0.19–0.90 7/7 RT MS (2d)
68VeBlDy [35] 0.286 1/1 RT BMS (2e)
53Crawford [24] 0.295 3/1 RT SMM (2f)
57Posener [30] 0.343 1/1 RT SMM (2g)
64ThKrLo [33] 0.343 1/1 RT BMS (2h)
67BlVeDy [34] 0.343 1/1 RT BMS (2i)
49Strandbe [18] 0.343–1.676 3/3 RT 29.33 SMM (2j)
71LaBeSt [39] 0.35–2.24 9/9 RT
70BeSt [37] 0.682–5.344 3/3 RT MS
46ToMe [15] 0.744 1/1 RT (2k)
53JeBiMa [22] 0.830–0.89 2/2 RT 50% MS (2l)
49Mcafee [17] 0.90–0.90 1/1
56ErCo [28] 1.674–8.052 6/6 RT MS
70StBe [36] 1.730–8.872 11/11 RT MS
73ClBeKlRo [40] 2.93–8.872 6/0 RT SMM
71DeCoHeGo [38] 2.93–25.13 36/36 RT 50% TMS
93GoFeDeDu [62] 7.54–8.07 3/3 100–600 0.013–1.3 CCC (2m)
87BaAlAlPo [54] 7.680–11.527 3/1 1000 MW (2n)
84MeDeHe [49] 0.39–33.67 32/32 MW (2o)
76FlGi [42] 15.51–39.37 20/13 RT 13.3 50% FS (2p)
85Johns [51] 20–339 225/225 1.33 FTS (2q)
78KaKaKy [43] 152–419 60/60 RT 0.53–5.3 FTS 0.50 (2r)
95PaHo [63] 171–498 335/335 295 0.5 50% FTS (2s)
03JaTeBeZo [86] 381–3932 11 503/11 184 1770 3.33 25% FTS (2t)
99Toth [72] 657–2066 749/748 296 0.6–6.8 40–47% FTS (2u)
93Tothb [61] 969–1892 1267/1265 297 0.4–21.2 10–49% FTS 0.25–2.39 (2v)
86FlCaMaGu [52] 1125–1890 1253/1252 RT 7.6 FTS (2w)
91RiSmDeBe [58] 1176–1650 266/266 294–297 Z1:3 Z1% FTS 1.21 (2x)
83Guelachv [47] 1191–1740 428/420 RT 13–1000 Nat FTS (2y)
00SiBeMaMa [76] 1480 1/1 RT 0.2–4.6 50% L 2.7 (2z)
82PaCaFlGu [44] 2237–3114 1902/1892 295:871 1.3–8.9 Z10% FTS 20.18–60.18 (2aa)
82ToGuBr [46] 2503–3099 575/574 296 21.4 FTS 0.25 (2bb)
92RiSmDeBe [59] 2576–2726 48/48 294–297 41:3 41% FTS 1.21 (2cc)
83ToBr [48] 3289–4369 1002/1000 296 16.07 48% FTS (2dd)
73CaFlGuAm [41] 3702–3789 8/7 FTS
07JeDaReTy [101] 4200–6599 3088/3074 29372 2.7–22.7 Nat FTS
97Tothb [66] 4719–5781 1824/1816 RT 1.3–22.7 50% FTS 0.25–73 (2ee)
07MiWaKaCa [103] 5964–7015 274/274 1.5–20 CRDS (2ff)
J.T
enn
yso
net
al.
/Jo
urn
al
of
Qu
an
titativ
eSp
ectrosco
py
&R
ad
iativ
eT
ran
sfer1
11
(20
10
)2
16
0–
21
84
21
63

Table 2 (continued )
Tag Range (cm�1) Trans. A/V Physical conditions Comments
T (K) p (hPa) Abun. Rec. L (m)
01UlHuBeOn [81] 6003–7064 2424/2384 RT 15.16 15–44% FTS 64–87 (2gg)
97Tothc [67] 6003–7626 2590/2571 296 1.8–13 3–49.1% FTS 2.39–73 (2hh)
09LiNaKaCa [108] 6076–6623 498/498 CRDS (2ii)
04MaRoMiNa [91] 6131–6748 1695/1693 RT 22.3 Nat CRDS (2jj)
89OhSa [55] 6384–6596 596/576 RT 12 50% L (2kk)
91SaTaIrNa [57] 6563–6565 3/3 RT 16.4 50% L 1.0 (2ll)
05ToTe [92] 7428–8759 171/163 29273 FTS (2mm)
04NaVoHu [90] 7500–8194 1415/1401 296 10 50% FTS 87
01HuHeZhWa [83] 8246–9063 899/873 RT 10 50% FTS 105 (2nn)
05UlHuBeZh [95] 8713–9598 1000/996 296 18.4 FTS 123
06NaLeCa [98] 9099–9645 1999/1900 RT 18 50% ICLAS r23 400
08PeSoSi [106] 9387–9450 232/220 13–26
05ToNaZoSh [93] 9758–10 797 212/201 294.4 20.08 Nat FTS r600 (2oo)
00WaHeHuZh [79] 9648–10 201 654/649 RT 10 50% FTS 123 (2pp)
03BeNaCa [87] 9628–10 111 1416/1361 RT 26.3 50% ICLAS r35 000 (2qq)
08ToTe [107] 9879–13 901 133/87 RT 9–23 Nat FTS 5–800 (2rr)
04NaHuHeCa [89] 10 110–12 215 1827/1787 RT 15 50% FTS 105 (2ss)
97VoFaPlRi [65] 10 631–10 690 17/16 OPO
08LiHo [105] 10 693–10 738 4/4 RT Nat CRDS (2tt)
07MaToCa [102] 11 809–12 126 64/56 RT 26.7 ICLAS 4800–14 000 (2uu)
05CaVaNa [96] 11 645–12 329 1615/1542 RT 18.4 50% ICLAS 9000
07VoNaCaCo [100] 11 750–22 708 3481/3378 291 6.7 48% FTS 600 (2vv)
08NaVoMaTe [104] 12 144–13 159 1330/1300 RT 18.4 50% ICLAS r24 000
99HuLiHeCh [70] 12 525–12 912 243/219 FTS (2ww)
98LaPeSiZh [68] 12 720–12 912 121/120 300 17 50% PAS (2xx)
10NaBeLeCa [109] 13 021–14 113 2078/2019 RT 18.4 Various ICLAS 24 000
00NaBeCaSc [75] 13 165–13 500 676/572 RT 18.4 50% ICLAS r15 000
99NaBeCa [71] 13 579–14 033 459/391 298 26.7 50% ICLAS r15 000
00NaCa [73] 14 986–15 340 470/405 RT 17.3 50% ICLAS r12 000
00CaBeNa [74] 16 304–18 349 400/348 RT 50% ICLAS
01JeMeCaCo [80] 16 344–22 703 507/488 291.1 13.07 47% FTS 603.32 (2yy)
00BeNaCa [78] 16 542–17 054 309/287 RT 17.3 50% ICLAS 12 000, 19 500
90ByKaKoNa [56] 16 746–17 013 237/203 RT 20 50% PAS
a The tags listed are used to identify experimental data sources throughout this paper. The range given represents the range corresponding to wavenumber entries within the MARVEL input file of the
particular water isotopologue and not the range covered by the relevant experiment. Uncertainties of the individual lines can be obtained from the Supplementary Material. Trans. = transitions, with A =
number of assigned transitions in the original paper, V = number of transitions validated in this study. T = temperature (K), given explicitly when available from the original publication, with RT = room
temperature. p = pressure (hPa). Abun. = abundance (%) of the given isotopologue in the gas mixture, with Enr = enriched and Nat = natural abundance. Rec. = experimental technique used for the recording of
the spectrum, with SMM = Stark-modulated microwave spectrometer, L = different lasers, CCC = collisionally cooled cell, MC = microwave cavities, TMS = tunable microwave spectrometer, PAS = photo-
acoustic spectrometer, and OPO = optical parametric oscillator.
J.T
enn
yso
net
al.
/Jo
urn
al
of
Qu
an
titativ
eSp
ectrosco
py
&R
ad
iativ
eT
ran
sfer1
11
(20
10
)2
16
0–
21
84
21
64
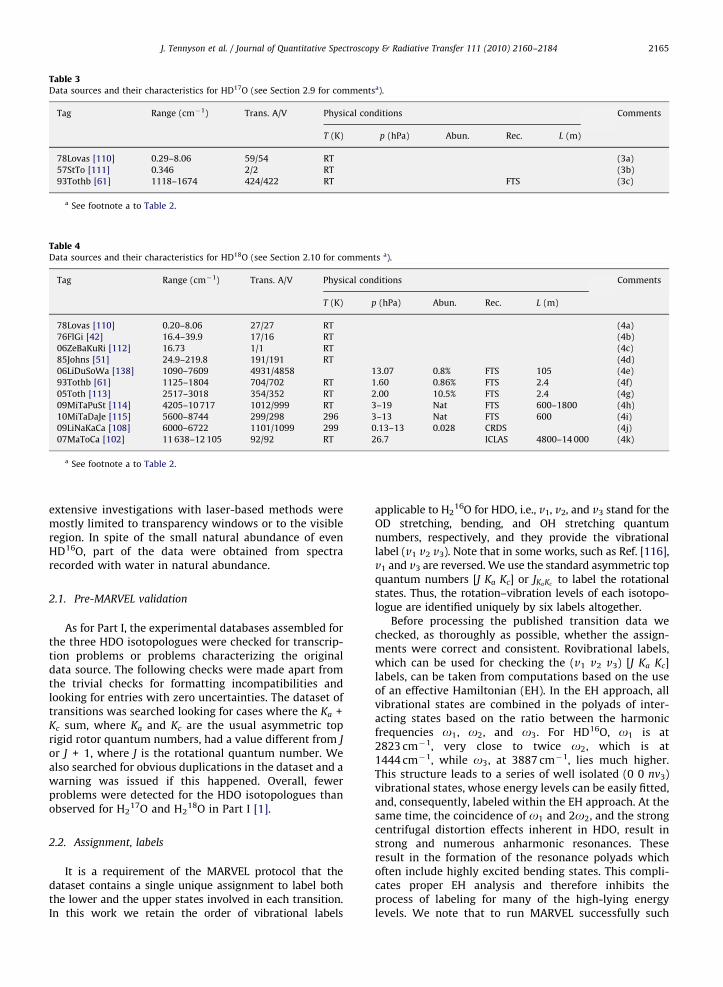
Table 3Data sources and their characteristics for HD17O (see Section 2.9 for commentsa).
Tag Range (cm�1) Trans. A/V Physical conditions Comments
T (K) p (hPa) Abun. Rec. L (m)
78Lovas [110] 0.29–8.06 59/54 RT (3a)
57StTo [111] 0.346 2/2 RT (3b)
93Tothb [61] 1118–1674 424/422 RT FTS (3c)
a See footnote a to Table 2.
Table 4Data sources and their characteristics for HD18O (see Section 2.10 for comments a).
Tag Range (cm�1) Trans. A/V Physical conditions Comments
T (K) p (hPa) Abun. Rec. L (m)
78Lovas [110] 0.20–8.06 27/27 RT (4a)
76FlGi [42] 16.4–39.9 17/16 RT (4b)
06ZeBaKuRi [112] 16.73 1/1 RT (4c)
85Johns [51] 24.9–219.8 191/191 RT (4d)
06LiDuSoWa [138] 1090–7609 4931/4858 13.07 0.8% FTS 105 (4e)
93Tothb [61] 1125–1804 704/702 RT 1.60 0.86% FTS 2.4 (4f)
05Toth [113] 2517–3018 354/352 RT 2.00 10.5% FTS 2.4 (4g)
09MiTaPuSt [114] 4205–10 717 1012/999 RT 3–19 Nat FTS 600–1800 (4h)
10MiTaDaJe [115] 5600–8744 299/298 296 3–13 Nat FTS 600 (4i)
09LiNaKaCa [108] 6000–6722 1101/1099 299 0.13–13 0.028 CRDS (4j)
07MaToCa [102] 11 638–12 105 92/92 RT 26.7 ICLAS 4800–14 000 (4k)
a See footnote a to Table 2.
J. Tennyson et al. / Journal of Quantitative Spectroscopy & Radiative Transfer 111 (2010) 2160–2184 2165
extensive investigations with laser-based methods weremostly limited to transparency windows or to the visibleregion. In spite of the small natural abundance of evenHD16O, part of the data were obtained from spectrarecorded with water in natural abundance.
2.1. Pre-MARVEL validation
As for Part I, the experimental databases assembled forthe three HDO isotopologues were checked for transcrip-tion problems or problems characterizing the originaldata source. The following checks were made apart fromthe trivial checks for formatting incompatibilities andlooking for entries with zero uncertainties. The dataset oftransitions was searched looking for cases where the Ka +Kc sum, where Ka and Kc are the usual asymmetric toprigid rotor quantum numbers, had a value different from J
or J + 1, where J is the rotational quantum number. Wealso searched for obvious duplications in the dataset and awarning was issued if this happened. Overall, fewerproblems were detected for the HDO isotopologues thanobserved for H2
17O and H218O in Part I [1].
2.2. Assignment, labels
It is a requirement of the MARVEL protocol that thedataset contains a single unique assignment to label boththe lower and the upper states involved in each transition.In this work we retain the order of vibrational labels
applicable to H216O for HDO, i.e., v1, v2, and v3 stand for the
OD stretching, bending, and OH stretching quantumnumbers, respectively, and they provide the vibrationallabel (v1 v2 v3). Note that in some works, such as Ref. [116],v1 and v3 are reversed. We use the standard asymmetric topquantum numbers [J Ka Kc] or JKaKc
to label the rotationalstates. Thus, the rotation–vibration levels of each isotopo-logue are identified uniquely by six labels altogether.
Before processing the published transition data wechecked, as thoroughly as possible, whether the assign-ments were correct and consistent. Rovibrational labels,which can be used for checking the (v1 v2 v3) [J Ka Kc]labels, can be taken from computations based on the useof an effective Hamiltonian (EH). In the EH approach, allvibrational states are combined in the polyads of inter-acting states based on the ratio between the harmonicfrequencies o1, o2, and o3. For HD16O, o1 is at2823 cm�1, very close to twice o2, which is at1444 cm�1, while o3, at 3887 cm�1, lies much higher.This structure leads to a series of well isolated (0 0 nv3)vibrational states, whose energy levels can be easily fitted,and, consequently, labeled within the EH approach. At thesame time, the coincidence of o1 and 2o2, and the strongcentrifugal distortion effects inherent in HDO, result instrong and numerous anharmonic resonances. Theseresult in the formation of the resonance polyads whichoften include highly excited bending states. This compli-cates proper EH analysis and therefore inhibits theprocess of labeling for many of the high-lying energylevels. We note that to run MARVEL successfully such

J. Tennyson et al. / Journal of Quantitative Spectroscopy & Radiative Transfer 111 (2010) 2160–21842166
labels simply have to be self-consistent; the MARVELprocess itself says nothing about the physical basis of thelabels [117].
Validation of the assignments attached to the observedtransitions was performed as follows. All transitions wereexamined for consistency of the upper levels derived fromcombination difference (CD) relations. This method is asimple and powerful tool for the assignment of rovibrationalspectra; however, it is often inapplicable to weak transitionsbecause of the incompleteness of the set of observedtransitions. All the transitions associated with a givenrotational level of the (0 0 0) vibrational ground state havebeen considered for combination differences. At this stage,conflicting labels could be easily traced and corrected. Thisstep was helped considerably by the availability of resultsfrom variational nuclear motion computations [118]. Wherenecessary, labels were changed assuming similar increasesin rotational energies as a function J and Ka for similarvibrational states with the same v2 quantum number aswell as quasi-degeneracy of rotational levels with Ka close toJ or Ka equal to 0 or 1. In the end, consistent labeling hasbeen established for all the assignments considered. Werecommend that the labeling provided in this paper shouldbe generally adopted, although in case of strongly perturbedenergy levels there is some remaining ambiguity.
2.3. Uncertainties
Within the MARVEL protocol reasonable estimates forthe accuracy of the observed transitions must be provided.Despite the adjustments by the robust reweighting scheme,false uncertainties attached to the transitions can notice-ably deteriorate the accuracy of the MARVEL energy levels.
In the majority of the data sources proper experi-mental uncertainties are not given for each transition.
00
0.05
0.1
0.15
0.2
0.25
Obs
- C
alc
(cm
-1)
4 128
Ka = 1
Ka = 2
Ka = 3
Ka = 4
Ka = 5
Fig. 1. Residuals of ‘‘observed’’ (MARVEL) minus calculated (VTT [118]) energy
Often only the general accuracy of the data for theregion investigated is provided. For a few publicationswe were forced to estimate the experimental uncertain-ties. As no values were presented in the original source,these were based on average values characteristic of theexperimental setup exploited in the measurement.
For further important adjustment of the uncertaintiesof the transitions see Sections 2.6 and 2.8.
2.4. Variational validation
As an independent validation of the experimentaltransition wavenumbers and the derived MARVEL energylevels, systematic comparisons were made with theresults of state-of-the-art variational nuclear motioncomputations. For this comparison the newly computedVTT HD16O linelist [118] was used; this linelist wascomputed using the spectroscopically determined HDOpotential energy hypersurfaces of Yurchenko et al. [119],the so-called CVR dipole moment surface [120], and theDVR3D nuclear motion program suite [121].
When variational results are used for validation,we can rely on a well-known feature of such calculations:the smooth and slow variation of obs–calc residualsfor the energy levels of a particular vibrational statehaving the same Ka and increasing J values [122]. Thelongest obs–calc sequences could be investigated forthe hot spectra, where transitions involving J as high as30 have been detected. Examples of the obs–calcdeviations for the energy levels of the (0 0 0) state withKa = 1–5 are shown in Fig. 1. The obs–calc residuals forlevels with a given Ka but different Kc increase as J
increases, hindering the assignment of the dense observedspectrum without detailed consideration of these neardegeneracies.
16 20
J
24 28
levels of HD16O for the ground vibrational state and Ka between 1 and 5.
0 5 10 15 20 25 30
-0.4
-0.2
0
0.2
0.4
Obs
- C
alc
(cm
-1)
J +Ka/J
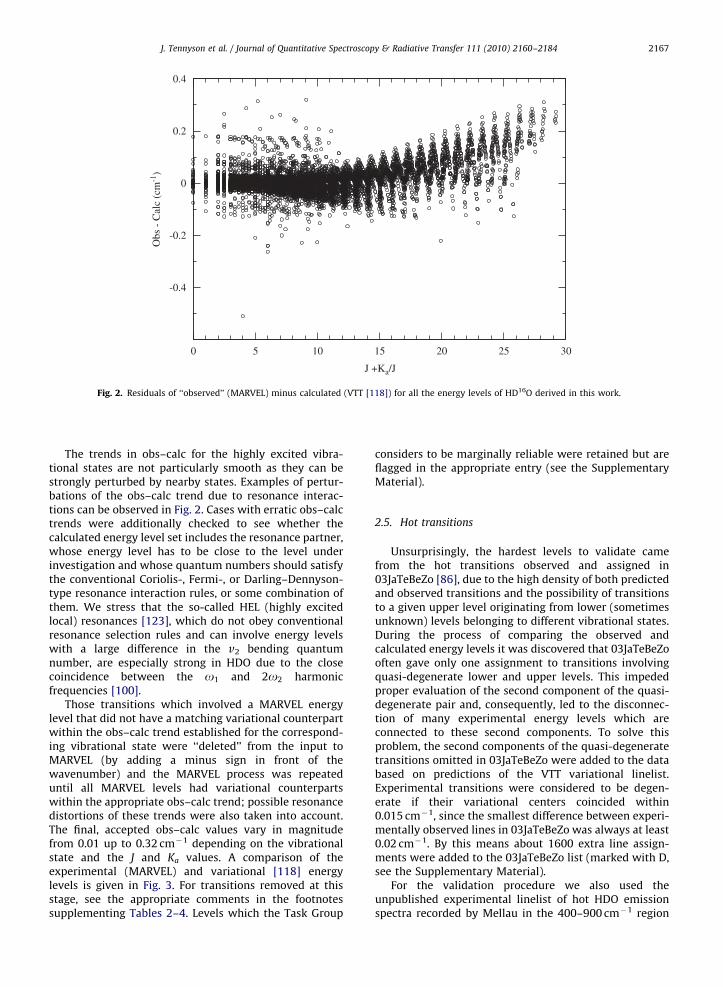
Fig. 2. Residuals of ‘‘observed’’ (MARVEL) minus calculated (VTT [118]) for all the energy levels of HD16O derived in this work.
J. Tennyson et al. / Journal of Quantitative Spectroscopy & Radiative Transfer 111 (2010) 2160–2184 2167
The trends in obs–calc for the highly excited vibra-tional states are not particularly smooth as they can bestrongly perturbed by nearby states. Examples of pertur-bations of the obs–calc trend due to resonance interac-tions can be observed in Fig. 2. Cases with erratic obs–calctrends were additionally checked to see whether thecalculated energy level set includes the resonance partner,whose energy level has to be close to the level underinvestigation and whose quantum numbers should satisfythe conventional Coriolis-, Fermi-, or Darling–Dennyson-type resonance interaction rules, or some combination ofthem. We stress that the so-called HEL (highly excitedlocal) resonances [123], which do not obey conventionalresonance selection rules and can involve energy levelswith a large difference in the v2 bending quantumnumber, are especially strong in HDO due to the closecoincidence between the o1 and 2o2 harmonicfrequencies [100].
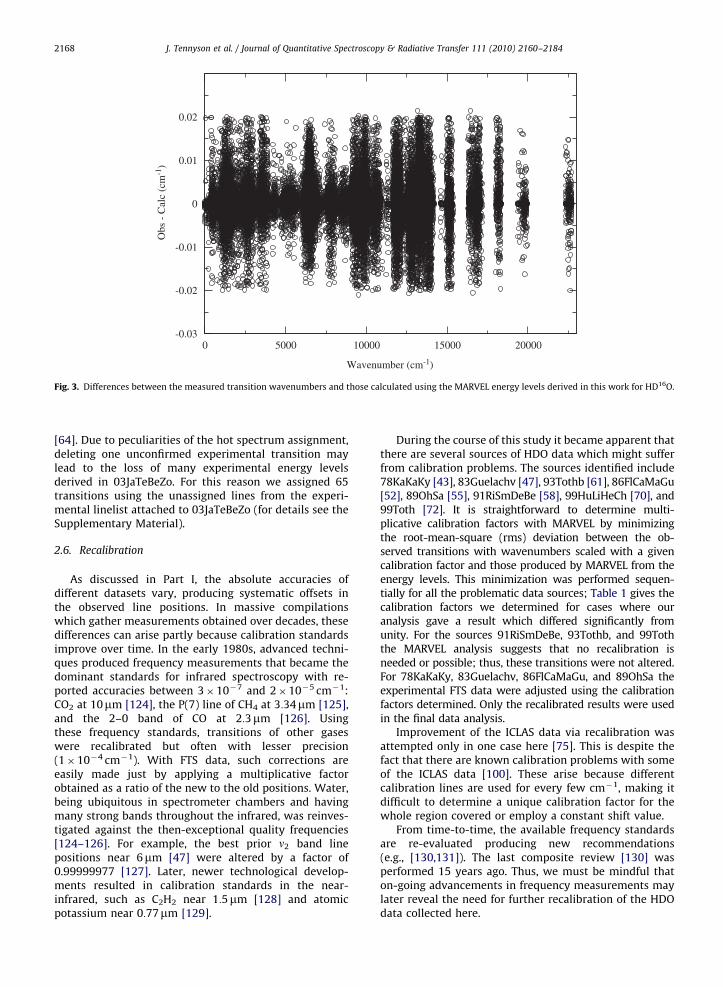
Those transitions which involved a MARVEL energylevel that did not have a matching variational counterpartwithin the obs–calc trend established for the correspond-ing vibrational state were ‘‘deleted’’ from the input toMARVEL (by adding a minus sign in front of thewavenumber) and the MARVEL process was repeateduntil all MARVEL levels had variational counterpartswithin the appropriate obs–calc trend; possible resonancedistortions of these trends were also taken into account.The final, accepted obs–calc values vary in magnitudefrom 0.01 up to 0.32 cm�1 depending on the vibrationalstate and the J and Ka values. A comparison of theexperimental (MARVEL) and variational [118] energylevels is given in Fig. 3. For transitions removed at thisstage, see the appropriate comments in the footnotessupplementing Tables 2–4. Levels which the Task Group
considers to be marginally reliable were retained but areflagged in the appropriate entry (see the SupplementaryMaterial).
2.5. Hot transitions
Unsurprisingly, the hardest levels to validate camefrom the hot transitions observed and assigned in03JaTeBeZo [86], due to the high density of both predictedand observed transitions and the possibility of transitionsto a given upper level originating from lower (sometimesunknown) levels belonging to different vibrational states.During the process of comparing the observed andcalculated energy levels it was discovered that 03JaTeBeZooften gave only one assignment to transitions involvingquasi-degenerate lower and upper levels. This impededproper evaluation of the second component of the quasi-degenerate pair and, consequently, led to the disconnec-tion of many experimental energy levels which areconnected to these second components. To solve thisproblem, the second components of the quasi-degeneratetransitions omitted in 03JaTeBeZo were added to the databased on predictions of the VTT variational linelist.Experimental transitions were considered to be degen-erate if their variational centers coincided within0.015 cm�1, since the smallest difference between experi-mentally observed lines in 03JaTeBeZo was always at least0.02 cm�1. By this means about 1600 extra line assign-ments were added to the 03JaTeBeZo list (marked with D,see the Supplementary Material).
For the validation procedure we also used theunpublished experimental linelist of hot HDO emissionspectra recorded by Mellau in the 400–900 cm�1 region
0 5000 10000 15000 20000-0.03
-0.02
-0.01
0
0.01
0.02
Obs
- C
alc
(cm
-1)
Wavenumber (cm-1)
Fig. 3. Differences between the measured transition wavenumbers and those calculated using the MARVEL energy levels derived in this work for HD16O.
J. Tennyson et al. / Journal of Quantitative Spectroscopy & Radiative Transfer 111 (2010) 2160–21842168
[64]. Due to peculiarities of the hot spectrum assignment,deleting one unconfirmed experimental transition maylead to the loss of many experimental energy levelsderived in 03JaTeBeZo. For this reason we assigned 65transitions using the unassigned lines from the experi-mental linelist attached to 03JaTeBeZo (for details see theSupplementary Material).
2.6. Recalibration
As discussed in Part I, the absolute accuracies ofdifferent datasets vary, producing systematic offsets inthe observed line positions. In massive compilationswhich gather measurements obtained over decades, thesedifferences can arise partly because calibration standardsimprove over time. In the early 1980s, advanced techni-ques produced frequency measurements that became thedominant standards for infrared spectroscopy with re-ported accuracies between 3�10�7 and 2�10�5 cm�1:CO2 at 10mm [124], the P(7) line of CH4 at 3:34mm [125],and the 2–0 band of CO at 2:3mm [126]. Usingthese frequency standards, transitions of other gaseswere recalibrated but often with lesser precision(1�10�4 cm�1). With FTS data, such corrections areeasily made just by applying a multiplicative factorobtained as a ratio of the new to the old positions. Water,being ubiquitous in spectrometer chambers and havingmany strong bands throughout the infrared, was reinves-tigated against the then-exceptional quality frequencies[124–126]. For example, the best prior n2 band linepositions near 6mm [47] were altered by a factor of0.99999977 [127]. Later, newer technological develop-ments resulted in calibration standards in the near-infrared, such as C2H2 near 1:5mm [128] and atomicpotassium near 0:77mm [129].
During the course of this study it became apparent thatthere are several sources of HDO data which might sufferfrom calibration problems. The sources identified include78KaKaKy [43], 83Guelachv [47], 93Tothb [61], 86FlCaMaGu[52], 89OhSa [55], 91RiSmDeBe [58], 99HuLiHeCh [70], and99Toth [72]. It is straightforward to determine multi-plicative calibration factors with MARVEL by minimizingthe root-mean-square (rms) deviation between the ob-served transitions with wavenumbers scaled with a givencalibration factor and those produced by MARVEL from theenergy levels. This minimization was performed sequen-tially for all the problematic data sources; Table 1 gives thecalibration factors we determined for cases where ouranalysis gave a result which differed significantly fromunity. For the sources 91RiSmDeBe, 93Tothb, and 99Toththe MARVEL analysis suggests that no recalibration isneeded or possible; thus, these transitions were not altered.For 78KaKaKy, 83Guelachv, 86FlCaMaGu, and 89OhSa theexperimental FTS data were adjusted using the calibrationfactors determined. Only the recalibrated results were usedin the final data analysis.
Improvement of the ICLAS data via recalibration wasattempted only in one case here [75]. This is despite thefact that there are known calibration problems with someof the ICLAS data [100]. These arise because differentcalibration lines are used for every few cm�1, making itdifficult to determine a unique calibration factor for thewhole region covered or employ a constant shift value.
From time-to-time, the available frequency standardsare re-evaluated producing new recommendations(e.g., [130,131]). The last composite review [130] wasperformed 15 years ago. Thus, we must be mindful thaton-going advancements in frequency measurements maylater reveal the need for further recalibration of the HDOdata collected here.
J. Tennyson et al. / Journal of Quantitative Spectroscopy & Radiative Transfer 111 (2010) 2160–2184 2169
2.7. Post-MARVEL validation
While data handling within the MARVEL process isperformed as automatically as possible, for a number oftransitions, which proved to be clear outliers by combina-tion difference relations, the experimental uncertaintieswere increased manually (see footnotes to Tables 2–4) bya process we call post-MARVEL validation.
This extra validation and the subsequent adjustmentwas done when the energy of an upper rotational–vibrational state deviated far more from the correspond-ing mean value established by the lower MARVEL energylevels plus the transition wavenumbers than the statedexperimental uncertainty. The MARVEL protocol canmake similar adjustments automatically if the errorassociated with a transition is an outlier and all the datahave similar accuracy. However, a problem arises if anerroneously small experimental uncertainty is attached towhat is actually a much less accurate experimentaldatum, the same level is involved in several measure-ments, and other transitions in the combination differencerelations, though are consistent, have formally muchlarger uncertainties. In this case the MARVEL energy levelwill be determined by the formally most accuratetransition which, in fact, represents an outlier.
For HDO, all data declared to have very high accuracy,such as those from 07VoNaCaCo [100], 07JeDaReTy [101],97Tothc [67], and 07MiWaKaCa [103], were subject topost-MARVEL checks. In this context we note that some-times the experimental uncertainty attached to a line inthe original source reflects the quality of the line profile fitrather than the real accuracy with which the wavenumberwas determined.
This validation was not performed in Part I. Thus, inthe active update of the data of H2
17O and H218O
presented in the Appendix of this paper the energy levelswere subjected to a post-MARVEL validation.
2.8. Comments on the data sources for HD16O given in
Table 2
(2a) 62TrBe: A spectrometer containing a Stark-modulated microwave coaxial cavity was used to measurenine hyperfine components of two rotational transitions,the 331-330 and 542-541 lines at 487 and 825 MHz,respectively. The hyperfine components are not includedin the MARVEL analysis.
(2b) 55WeBeHe: The apparatus of Ref. [21] was usedfor the measurements. Frequencies and absorption coeffi-cients of six transitions between 486 and 3045 MHz arereported. Frequencies of five of these have been pre-viously measured in Ref. [21].
(2c) 53BeWe: The spectrometer employed Starkmodulation and operated at frequencies lower than600 MHz.
(2d) 54PoSt: The number of original measured linefrequencies is 5. In addition, the authors reproduce threefrequencies from two other measurements: one transitionfrom 49Mcafee [17] and two transitions from ‘‘MicrowaveSpectroscopy Laboratory, Research Laboratory of Electro-
nics, Massachusetts Institute of Technology (unpublishedwork)’’. Note also that one of the five frequencies of thissource (8577.770.1 MHz, the 744-743 transition) waspreviously reported in 53BuSt [23] but without anuncertainty.
(2e) 68VeBlDy: The hyperfine structure of one rota-tional line, at 8577.812 MHz, was investigated with a beammaser spectrometer. The wrong rotational assignment,743-745, of the reported line was changed to the correct744-743. Measured and calculated values of the hyperfinecoupling constants are reported but not used here.
(2f) 53Crawford: Three observed lines are reported inthis paper. The 8577.8070.08 and 8837.2270.12 MHztransitions correspond to HD16O transitions 744-743 and1056-1055, respectively; only the latter was included inthe final transitions file. The third one at 8884.83 MHz isneither an HDO nor a D2O line.
(2g) 57Posener: Fine structure of the 221-220 rota-tional line reported previously in Ref. [18] was examinedby Stark modulation spectroscopy. Five components wereobserved but not employed here.
(2h) 64ThKrLo: Nine hyperfine components of the221-220 rotational transition have been reported at about10 278.2455 MHz with a beam maser spectrometer.
(2i) 67BlVeDy: The hyperfine structure of the 221-220
rotational line at 10 278.246 MHz was investigated with abeam maser spectrometer. Measured values of thehyperfine coupling constants as well as the electricquadrupole coupling tensor are reported but not em-ployed here.
(2j) 49Strandbe: Four rotational absorption transitions,221-220, 322-321, 414-321, and 533-532, have beenobserved and identified using the Stark effect. Thefrequencies of the first three transitions are given in thepaper. The last one was reported earlier in Ref. [16].
(2k) 46ToMe: Frequency of one pure rotational transi-tion, 533-532, was reported. The frequency value,22 30975 MHz, is rather far from the more precise valuesreported later for the same transition.
(2l) 53JeBiMa: The frequencies of four rotational lineshave been observed in microwave absorption. One ofthem, 26 880.4770.1 MHz, was observed previously [17].Two lines at 24 884.8570.1 (A) and 26 880.4770.1 (B)MHz correspond to the HD16O transitions 845-844 and624-717, respectively. The two unassigned lines at30 182.5770.1 (C) and 30 778.6270.1 MHz (D) corre-spond to D2
16O transitions 963-872 and 964-871,respectively. Stark spectra of all four lines and Zeemanspectra of the A and B lines were recorded.
(2m) 93GoFeDeDu: Three microwave transitions ofHD16O, reported previously by 84MeDeHe [49], werebroadened by H2, N2, O2, and He for 100rTr600 K.Measurements made at 10 mTorr of HD16O and about 40broadening gas pressures up to 1 Torr.
(2n) 87BaAlAlPo: Three rotational transitions in the(0 1 0) vibrational state are reported. Only one of them,414-321 at 230 427.34 MHz, is confirmed. The othertransitions, 633-726 at 334 018.30 MHz and 524-413 at345 795.94 MHz, have very large discrepancies as com-pared to the expected frequency values (about 335 138and 346 620 MHz, respectively).
J. Tennyson et al. / Journal of Quantitative Spectroscopy & Radiative Transfer 111 (2010) 2160–21842170
(2o) 84MeDeHe: 32 newly reported rotational transi-tions complemented by transitions reported previously[40].
(2p) 76FlGi: Among the 20 HD16O transition only 13were validated. The seven excluded transitions havedifferences between reported and expected frequencyvalues larger than 0.02 cm�1.
(2q) 85Johns: Far infrared pure rotational spectra of sixwater isotopologues were recorded with pressures lessthan 1 Torr (only for wavenumbers below 30 cm�1 wasthe pressure raised to 2 Torr) to minimize pressure shiftsand broadening. The list of HD16O transitions includes84 MW frequencies from 84MeDeHe [49] and 212 mea-sured line positions which correspond to 225 transitions.The experimental uncertainty was raised to 0.0002 cm�1
instead of 0.00005 cm�1 stated originally.(2r) 78KaKaKy: Three spectra were recorded but only
for one spectrum (150–320 cm�1, p = 1.8 Torr) was theHD16O abundance greater than natural. The experimentalaccuracy has been estimated in the original source to bebetter than 0.001 cm�1 under favorable conditions. Afterrecalibration, 65% (39 lines) of the 65 observed transitionsagree with the MARVEL transitions within the declaredexperimental accuracy of 1.0�10�3 cm�1. All originalexperimental uncertainties equal to 5�10�4 were chan-ged to 1.5�10�3.
(2s) 95PaHo: Pure rotational spectra of 16O waterisotopic species were measured with a high resolution FTSin order to obtain better calibration line positions in the110–500 cm�1 spectral region.
(2t) 03JaTeBeZo: Fourier transform emission spectraanalyzed together with line positions obtained in01PaBeZoSh [82]. Supplementary data for this articlecontain a list of 32 399 records which correspond to31 645 unique line positions. Ten thousand six hundredand fifty seven rotation–vibration assignments are givenin this line list. Seven hundred and forty five of them arelabeled with ‘‘D2O’’ or ‘‘H2O’’, probably they are HDO linesblended by ‘‘D2O’’ and ‘‘H2O’’, respectively. About 1600transitions which represent the second components ofquasi-degenerate transitions, omitted in the originalsource, have been added to the list, as well as 65 newlyassigned transitions. After validation of the spectrum, alist of 11 182 transitions has been included into the finaltransitions file. Of the 11 182 validated transitions, only67.9% (7592 lines) agree with the MARVEL transitionswithin the declared experimental uncertainty of1.0�10�3 cm�1, suggesting that the true experimentalaccuracy of the line positions can be lower than declared.Furthermore, all original experimental uncertainties of5.0�10�3 have been lowered to 2.0�10�3 cm�1.
(2u) 99Toth: High-resolution Fourier-transform spec-tra were analyzed to obtain line positions and strengths ofover 6000 transitions of HDO and D2O. For HD16O, linepositions and strengths of pure lines and of rovibrationalbands (0 1 0)–(0 0 0), (0 2 0)–(0 1 0), and (1 0 0)–(0 1 0) arereported. Of the 749 observed transitions reported forHD16O, 95.5% (715 lines) agree with the MARVEL transi-tions within the declared experimental uncertainty of1�10�4 cm�1. There is an asymmetry in the obs–MARVEL deviations with respect to the zero line: there
are 276 positive and 473 negative deviations. Thisasymmetry concerns mainly the 1000–1360 cm�1 region.A calibration factor could not be determined.
(2v) 93Tothb: Fourier transform spectra in the n2 bandregion have been recorded for the determination of linepositions and line intensities of HD16O, HD17O, andHD18O. Of the 1267 lines assigned to HD16O, 94.8%(1201 lines) agree with MARVEL transitions within thedeclared experimental uncertainty of 1.2�10�4 cm�1. Anasymmetry is detected in the obs–MARVEL deviationswith respect to zero line: there are 412 positive and 855negative deviations. A calibration factor could not bedetermined as it does not seem to be constant for thewhole spectral region considered.
(2w) 86FlCaMaGu: Four spectra recorded between 1040and 1900 cm�1 with different pressures and mixtures ofD2O and H2O in order to obtain n2 line positions of HD16O.After recalibration of the experimental spectrum, 99.3%(1244 lines) of the 1253 observed transitions agree with theMARVEL transitions within 2.0�10�4 cm�1, compared tothe stated experimental uncertainty of 4.0�10�4 cm�1.The experimental uncertainties of the lines between 1210and 1890 cm�1 were decreased from 4�10�4 to 2�10�4
cm�1. As the applied calibration factor was not constantthroughout the spectrum, there is a remaining asymmetryin the obs–MARVEL deviations with respect to the zero line:there are 764 positive and 489 negative deviations.In the region below 1200 cm�1 most part of the ob-served–MARVEL deviations are negative, with a root-mean-square agreement of 3.6�10�4 cm�1. Uncertaintiesthat belong to the 1210–1890 cm�1 interval were changedfrom 4.0�10�4 to 2.0�10�4 cm�1.
(2x) 91RiSmDeBe: Measured Lorentz-broadening andpressure-shift coefficients by air, N2, and O2 are presentedfor the 266 n2 HD16O lines. Twelve spectra were recorded at0.0053 cm�1 resolution. Spectra with buffer gas wererecorded at total sample pressures of about 200, 300, and400 Torr. Spectra have been calibrated using 93Tothb [61]data, and then the experimental accuracy has been adoptedin this study as 1.2�10�4 cm�1, similar to that of 93Tothb.All 265 observed lines agree with MARVEL transitionswithin 7.4�10�5 cm�1. An asymmetry in the obs–MARVELdeviations with respect to the zero line: there are 182positive and 83 negative deviations. A calibration factorcould not be determined with the technique employedin this study as it is not constant for the whole spectralregion considered. Original experimental uncertainties of5.0�10�4 cm�1 have been adjusted to 1.2�10�4 cm�1.
(2y) 83Guelachv: Fourier transform spectra withabsorption paths of 16, 24.17, 32.17, and 44.17 m. Dueto a calibration problem the original reported transitionshad to be scaled by a scale factor of 0.99999977 [130]. TheMARVEL input file includes only the recalibrated transi-tions, with the original uncertainties. After recalibration ofthe spectrum, 95.1% (407 lines) of the 428 observedtransitions agree with the MARVEL transitions with anrms deviation of 1.5�10�4 cm�1, compared to anexperimental uncertainty of 1.2�10�4 cm�1, estimatedas an average value of individual experimental uncertain-ties attached to every line. As the applied calibrationfactor was not constant throughout the spectrum, there is

J. Tennyson et al. / Journal of Quantitative Spectroscopy & Radiative Transfer 111 (2010) 2160–2184 2171
a remaining asymmetry in the obs–MARVEL deviationswith respect to the zero line: there are 151 positive and277 negative deviations, with the most serious discre-pancies in the 1400–1600 cm�1 region.
(2z) 00SiBeMaMa: A CO laser was used for observation ofthe saturated absorption dip of the nearby n2 524-515 lineof HD16O. The absolute frequency of this line was obtainedas 1480.094038033767�10�9 cm�1 (44 372 102.97370.002 MHz).
(2aa) 82PaCaFlGu: The 2n2 and n1 bands of HD16Owere analyzed using Fourier transform spectra of pureD2O and of 90% H2O–10% D2O mixtures.
(2bb) 82ToGuBr: HDO gas samples obtained fromdifferent mixtures of H2O and D2O with concentrationsof HD16O estimated as 50%, 48%, and 28%. For a number oflines the experimental uncertainties were adjusted from4�10�3 to 4�10�4 cm�1.
(2cc) 92RiSmDeBe: Absorption spectra recorded formeasurements of Lorentz-broadening coefficients andpressure-induced line-shift coefficients of 48 lines in then1 band of HDO were recorded using the FTS of the KittPeak National Observatory. Gas samples were prepared bymixing distilled H2O with 99.96 at% D2O. Low pressureðo1:0 TorrÞ samples were mixed with samples dilutedwith high-purity N2, O2, or ultra zero air at total samplepressures of about 200, 300, and 400 Torr.
(2dd) 83ToBr: FTS spectra recorded by 82ToGuBr [46][see comment (2bb)] were studied for line positions andstrengths in the 3289–4369 cm�1 region.
(2ee) 97Tothb: The FTS of the Kitt Peak NationalObservatory was used for measuring HD16O spectra withabsorption path lengths of 0.25, 2.39, 25, and 73 m. Of the1824 observed transitions, 66.5% (1213 lines) agree withthe MARVEL transitions with an rms deviation equal to thedeclared experimental uncertainty of 1.0�10�4 cm�1. Themeasurement accuracy seems to be slightly overestimated.
(2ff) 07MiWaKaCa: Absorption spectra of naturalabundance water vapor near the 5911.0–5922.5,5926.0–5941.8, 5957.0–6121.6, and 6475.0–7015.6 cm�1
spectral regions. Pressure values on the order of 10–20 hPa were chosen in the 1:66mm region and of about1.5–2.0 hPa in the 1:455mm region. Most of the originalexperimental uncertainties were increased, from8.0�10�5 to 1.0�10�3 cm�1.
(2gg) 01UlHuBeOn: The Bruker IFS 120 HR FTS of theUniversity of Science and Technology (Hefei, China) wasused to record two spectra: the first spectrum had a totalpressure of 1516 Pa, 44% HDO and a path length of 87 m;the second spectrum had a total pressure of 1500 Pa, 15%HDO and a path length of 69 m. Transition data suppliedby Hu. Of the 2424 observed transitions, 92.9% (2251lines) agree with the MARVEL transitions with an rmsdeviation equal to the declared measurement accuracy of2.0�10�3 cm�1. There is an asymmetry in the observed–MARVEL deviations with respect to the zero line: there are735 positive and 1689 negative deviations. A calibrationfactor for the whole spectral region covered could not bedetermined. For 60% of the reported transitions obs–MARVEL deviations are less than 0.001 cm�1, confirmingthat the measurement accuracy is slightly better thandeclared.
(2hh) 97Tothc: Of the 2590 observed transitions, 61.8%(1600 lines) agree with the MARVEL transitions with anrms deviation equal to the declared experimental un-certainty of 1.0�10�4 cm�1. The stated measurementaccuracy seems to be slightly overestimated.
(2ii) 09LiNaKaCa: Absorption spectrum of 18O enrichedwater was recorded using CW-CRDS and a series offibered DFB lasers. The CRDS sensitivity allowed thedetection of lines with intensity as low as 10�28 cm/molecule. Uncertainties of 2.0�10�3 cm�1 were adjustedto 1.0�10�3 cm�1.
(2jj) 04MaRoMiNa: A pressure of 17 Torr was used inthe whole spectral region; additional recordings at 1 Torrpressure were performed above 6510 cm�1 due to thepresence of strong lines. As the HD16O absorption lineshave been observed in natural abundance, they mostlyrepresent weak lines. Thus, the declared measurementaccuracy, better than 0.001 cm�1 on average, for theselines was decreased to 0.002 cm�1. Of the 1695 observedtransitions, 88.7% (1503 lines) agree with MARVELtransitions with an rms deviation equal to the adoptedmeasurement accuracy of 2�10�3 cm�1. All transitionswith measurement accuracy of 3�10�3 cm�1 have beenchanged to 2�10�3 cm�1.
(2kk) 89OhSa: Absorption spectra of HDO and D2Orecorded using single-mode distributed feedback semi-conductor lasers. After recalibration of the experimentalspectrum, 96.3% (574 lines) of the 596 observed transi-tions agree with the MARVEL transitions within an rmsdeviation of 4.4�10�3 cm�1, as compared to the mea-surement accuracy of 5.0�10�3 cm�1.
(2ll) 91SaTaIrNa: A near-infrared semiconductor-laserspectrometer was used for measurements of absolutefrequencies of 30 vibration–rotation transitions of severalmolecular species. Three HDO frequencies were measuredwith an accuracy of about 30 MHz and can be used as acalibration standard in the near infrared region. Vibra-tional labeling given in the paper was changed bycomparison with other assignments: the band studied isnot (2 0 1)–(0 0 0) but (0 2 1)–(0 0 0).
(2mm) 05ToTe: Experimental spectra recorded bySchermaul et al. [136] were analyzed here.
(2nn) 01HuHeZhWa: Transitions list supplied by Hu.Of the 899 observed transitions, 85.6% (770 lines) agreewith the MARVEL transitions with an rms deviation equalto the declared measurement accuracy of 0.001 cm�1.
(2oo) 05ToNaZoSh: Re-analysis of the absorption spectraof natural abundance water vapor in the 9250–26 000 cm�1
region reported previously by Coheur et al. [84] and byMerienne et al. [88]. The original spectra were recorded byan FTS Bruker IFS 120M coupled with two White multiple-reflection cells of 5 and 50 m base path. The total absorptionpath was up to 600 m. For weak lines assigned to HD16Oabsorption, an experimental accuracy of 0.003 cm�1 hasbeen adopted in this study, though in the original source themeasurement accuracy was declared to be higher (onaverage). Of the 212 transitions assigned to HD16O absorp-tion, only 58% (212 lines) agree with the MARVEL transitionswith an rms deviation equal to the adopted experimentalaccuracy of 0.003 cm�1, suggesting that the measurementaccuracy was indeed slightly overestimated.

J. Tennyson et al. / Journal of Quantitative Spectroscopy & Radiative Transfer 111 (2010) 2160–21842172
(2pp) 00WaHeHuZh: Spectra recorded with the BrukerIFS 120HR FTS of the University of Science and Technology(Hefei, China). Transitions list supplied by Hu. Of the 626observed transitions, 98.2% (642 lines) agree with theMARVEL transitions with an rms deviation equal to thedeclared measurement accuracy of 0.003 cm�1. There isan asymmetry in the observed–MARVEL deviations withrespect to the zero line: there are 248 positive and 406negative deviations. A calibration factor for the wholespectral region could not be determined. For 91% of thereported transitions observed–MARVEL deviations arewithin 0.0016 cm�1, suggesting that the measurementaccuracy is better than declared.
(2qq) 03BeNaCa: 55 transitions could not be validated.(2rr) 08ToTe: A multi-pathlength refit of the data of
Schermaul et al. [136,137].(2ss) 04NaHuHeCa: A 1:1 mixture of H2O and D2O was
used to make HDO. An additional spectrum of water vaporwith much higher concentration of D2O was recorded. Theobserved spectrum consists of two parts: 10 110–11 451and 11 751–12 215 cm�1, containing 1489 and 338 lines,respectively. Of the 1489 observed transitions in the firstregion, 85.8% (1277 lines) agree with the MARVELtransitions with an rms deviation equal to the declaredmeasurement accuracy of 0.002 cm�1. In the 11 751–12 215 cm�1 region there is an asymmetry in theobserved–MARVEL deviations with respect to the zeroline: there are 252 positive and 84 negative deviations. Acalibration factor for this spectral region could not bedetermined. For 75.4% of the transitions observed–MARVEL deviations are within 0.005 cm�1, suggestingthat the experimental accuracy is lower in this region.
(2tt) 08LiHo: CRDS was used for precision measure-ments of the water line intensities in the 10 603–10 852 cm�1 region. Four lines of the 3n3 band of HDOwere measured.
(2uu) 07MaToCa: ICLAS absorption spectra of 18Oenriched water were recorded; HDO lines were observeddue to high sensitivity of the spectrometer used.
(2vv) 07VoNaCaCo: Assignment of previously reportedFTS spectra of Bach et al. [94].
(2ww) 99HuLiHeCh: After applying a calibration factorof 1.00000070 (Table 1), 86% (209 lines) of the 243observed transitions agree with the MARVEL transitionswith an rms deviation equal to the declared measurementaccuracy of 0.005 cm�1.
(2xx) 98LaPeSiZh: Absorption spectrum of HDO wasinvestigated using a photo-acoustic spectrometer basedon a Ti–Sapphire laser.
(2yy) 01JeMeCaCo: Some of the lines published inthis paper were assigned by 07VoNaCaCo [100]. Of the507 observed transitions, 84.6% (429 lines) agree withMARVEL transitions with an rms deviation equal to thedeclared measurement accuracy of 0.002 cm�1.
2.9. Comments on the data sources for HD17O given in
Table 3
(3a) 78Lovas: 59 microwave transitions reproducedfrom G. Steenbeckeliers, private communication, July1971. This data source contains three orphans: 78Lovas.2
at 0.305972, 78Lovas.11 at 0.781876, and 78Lovas.45 at4.614810 cm�1. 78Lovas.27 is also part of an FSN alongwith 93Tothb.72.
(3b) 57StTo: The quadrupole hyperfine structure of the220-221 rotational transition was measured. The unsplitline position is given as 10 374.56 MHz, while thestrongest component of the multiplet is estimated as10 374.31 MHz.
(3c) 93Tothb: 93Tothb.72 is part of an FSN along with78Lovas.27.
2.10. Comments on the data sources for HD18O given in
Table 4
(4a) 78Lovas: 27 microwave transitions reproducedfrom G. Steenbeckeliers, private communication, July1971 (seemingly the first observation of the HD18Ospectrum). The correct assignment of the pure rotationaltransition reported at 5902.38 MHz is ½4 3 1�’½4 3 2�instead of ½4 4 1�’½4 3 2�.
(4b) 76FlGi: Commented on in detail in 09MiTaPuSt[114], see its Sections 2 and 6 and Table 4. One of the firststudies of water vapor spectra using the Fourier transformtechnique.
(4c) 06ZeBaKuRi: The line of the ½1 1 0�’½1 0 1� transi-tion has been detected at a frequency of 501 567.39 MHzin the atmosphere using the sub-millimeter radiometer(SMR) instrument aboard the Odin satellite.
(4d) 85Johns: Commented on in detail in 09MiTaPuSt[114], see Sections 2 and 6, and Table 4. Note that 24 MWwavenumbers reproduced by Johns from 78Lovas [110]were incorrectly cited in 83MeLuHe [139].
(4e) 06LiDuSoWa: 17 transitions are part of an FSN,seven are ORPs and 13 have been deleted by the MARVELanalysis.
(4f) 93Tothb: See Section 2.2 for comments about re-calibration.
(4g) 05Toth: Transitions corresponding to the 2n2 andn1 bands. For more detailed comments see Sections 2 and6 of 09MiTaPuSt.
(4h) 09MiTaPuSt: Assignment of 38 unassigned linesreported by 07JeDaReTy [101] in the 4205–6588 cm�1
range (see Section 3.1 and Table 1 of 09MiTaPuSt)and 970 transitions from 6129 to 10 717 cm�1. Thetransition ð0 2 1Þ½6 2 4�’ð0 0 0Þ½5 2 3� transition reportedat 6538.24339 cm�1 is re-assigned to 6538.26139 cm�1.
(4i) 10MiTaDaJe: The transition deleted by MARVELis: 7015.213870 ð0 0 2Þ½12 1 11�’ð0 0 0Þ½13 1 12�,10MiTaDaJe.186.
(4j) 09LiNaKaCa: This source contains two orphans:6139.12 ð1 0 1Þ½14 1 13�’ð0 0 0Þ½15 2 14�, 09LiNaKaCa.43
and 6139.6 ð1 0 1Þ½14 2 13�’ð0 0 0Þ ½15 1 14�, 09LiNaKa-Ca.44. The following transitions have been deleted by theMARVEL analysis:
6157.76 ð1 0 1Þ½13 2 12�’ð0 0 0Þ½14 1 13�, 09LiNaKaCa.54and 6538.88 ð1 0 1Þ½13 2 12�’ð0 0 0Þ½12 1 11�, 09LiNaKa-Ca.945. One transition, 09LiNaKaCa.594 is part of an FSN.
(4k) 07MaToCa: Transitions belonging to the n2þ3n3
band are commented in 09MiTaPuSt [114], see Sections 2and 6 and Fig. 4.
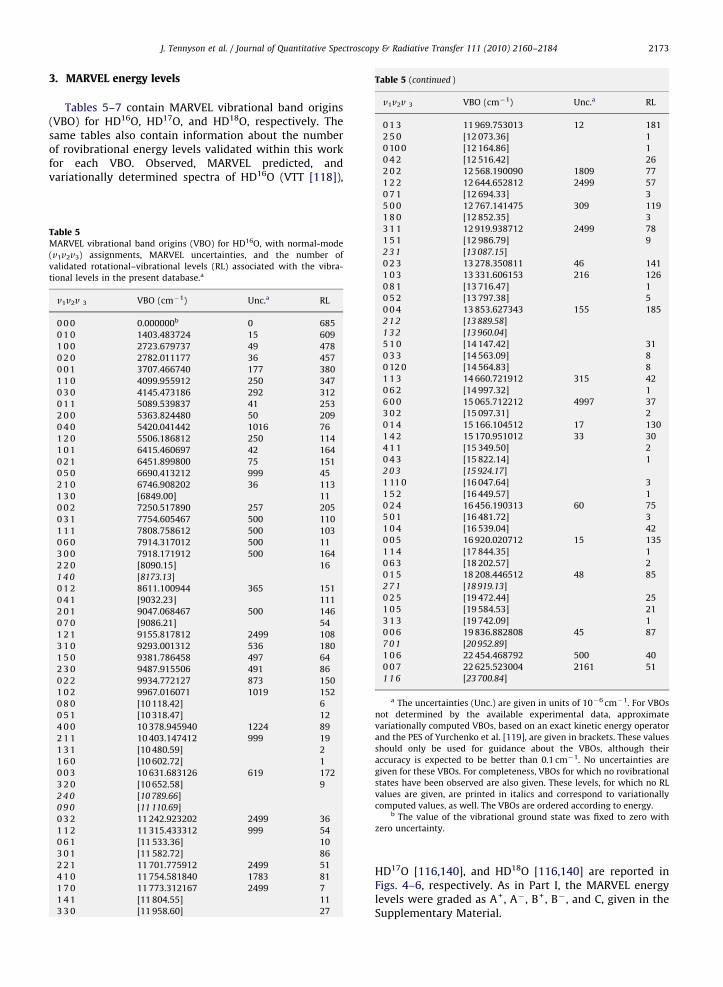
Table 5 (continued )
v1v2v 3 VBO (cm�1) Unc.a RL
0 1 3 11 969.753013 12 181
2 5 0 [12 073.36] 1
0 10 0 [12 164.86] 1
0 4 2 [12 516.42] 26
2 0 2 12 568.190090 1809 77
1 2 2 12 644.652812 2499 57
J. Tennyson et al. / Journal of Quantitative Spectroscopy & Radiative Transfer 111 (2010) 2160–2184 2173
3. MARVEL energy levels
Tables 5–7 contain MARVEL vibrational band origins(VBO) for HD16O, HD17O, and HD18O, respectively. Thesame tables also contain information about the numberof rovibrational energy levels validated within this workfor each VBO. Observed, MARVEL predicted, andvariationally determined spectra of HD16O (VTT [118]),
Table 5MARVEL vibrational band origins (VBO) for HD16O, with normal-mode
(v1v2v3) assignments, MARVEL uncertainties, and the number of
validated rotational–vibrational levels (RL) associated with the vibra-
tional levels in the present database.a
v1v2v 3 VBO (cm�1) Unc.a RL
0 0 0 0.000000b 0 685
0 1 0 1403.483724 15 609
1 0 0 2723.679737 49 478
0 2 0 2782.011177 36 457
0 0 1 3707.466740 177 380
1 1 0 4099.955912 250 347
0 3 0 4145.473186 292 312
0 1 1 5089.539837 41 253
2 0 0 5363.824480 50 209
0 4 0 5420.041442 1016 76
1 2 0 5506.186812 250 114
1 0 1 6415.460697 42 164
0 2 1 6451.899800 75 151
0 5 0 6690.413212 999 45
2 1 0 6746.908202 36 113
1 3 0 [6849.00] 11
0 0 2 7250.517890 257 205
0 3 1 7754.605467 500 110
1 1 1 7808.758612 500 103
0 6 0 7914.317012 500 11
3 0 0 7918.171912 500 164
2 2 0 [8090.15] 16
1 4 0 [8173.13]
0 1 2 8611.100944 365 151
0 4 1 [9032.23] 111
2 0 1 9047.068467 500 146
0 7 0 [9086.21] 54
1 2 1 9155.817812 2499 108
3 1 0 9293.001312 536 180
1 5 0 9381.786458 497 64
2 3 0 9487.915506 491 86
0 2 2 9934.772127 873 150
1 0 2 9967.016071 1019 152
0 8 0 [10 118.42] 6
0 5 1 [10 318.47] 12
4 0 0 10 378.945940 1224 89
2 1 1 10 403.147412 999 19
1 3 1 [10 480.59] 2
1 6 0 [10 602.72] 1
0 0 3 10 631.683126 619 172
3 2 0 [10 652.58] 9
2 4 0 [10 789.66]
0 9 0 [11 110.69]
0 3 2 11 242.923202 2499 36
1 1 2 11 315.433312 999 54
0 6 1 [11 533.36] 10
3 0 1 [11 582.72] 86
2 2 1 11 701.775912 2499 51
4 1 0 11 754.581840 1783 81
1 7 0 11 773.312167 2499 7
1 4 1 [11 804.55] 11
3 3 0 [11 958.60] 27
0 7 1 [12 694.33] 3
5 0 0 12 767.141475 309 119
1 8 0 [12 852.35] 3
3 1 1 12 919.938712 2499 78
1 5 1 [12 986.79] 9
2 3 1 [13 087.15]
0 2 3 13 278.350811 46 141
1 0 3 13 331.606153 216 126
0 8 1 [13 716.47] 1
0 5 2 [13 797.38] 5
0 0 4 13 853.627343 155 185
2 1 2 [13 889.58]
1 3 2 [13 960.04]
5 1 0 [14 147.42] 31
0 3 3 [14 563.09] 8
0 12 0 [14 564.83] 8
1 1 3 14 660.721912 315 42
0 6 2 [14 997.32] 1
6 0 0 15 065.712212 4997 37
3 0 2 [15 097.31] 2
0 1 4 15 166.104512 17 130
1 4 2 15 170.951012 33 30
4 1 1 [15 349.50] 2
0 4 3 [15 822.14] 1
2 0 3 [15 924.17]
1 11 0 [16 047.64] 3
1 5 2 [16 449.57] 1
0 2 4 16 456.190313 60 75
5 0 1 [16 481.72] 3
1 0 4 [16 539.04] 42
0 0 5 16 920.020712 15 135
1 1 4 [17 844.35] 1
0 6 3 [18 202.57] 2
0 1 5 18 208.446512 48 85
2 7 1 [18 919.13]
0 2 5 [19 472.44] 25
1 0 5 [19 584.53] 21
3 1 3 [19 742.09] 1
0 0 6 19 836.882808 45 87
7 0 1 [20 952.89]
1 0 6 22 454.468792 500 40
0 0 7 22 625.523004 2161 51
1 1 6 [23 700.84]
a The uncertainties (Unc.) are given in units of 10�6 cm�1. For VBOs
not determined by the available experimental data, approximate
variationally computed VBOs, based on an exact kinetic energy operator
and the PES of Yurchenko et al. [119], are given in brackets. These values
should only be used for guidance about the VBOs, although their
accuracy is expected to be better than 0.1 cm�1. No uncertainties are
given for these VBOs. For completeness, VBOs for which no rovibrational
states have been observed are also given. These levels, for which no RL
values are given, are printed in italics and correspond to variationally
computed values, as well. The VBOs are ordered according to energy.b The value of the vibrational ground state was fixed to zero with
zero uncertainty.
HD17O [116,140], and HD18O [116,140] are reported inFigs. 4–6, respectively. As in Part I, the MARVEL energylevels were graded as A+, A� , B+ , B� , and C, given in theSupplementary Material.

Table 6MARVEL vibrational band origins (VBO) for HD17O, with normal-mode
(v1v2v3) assignments, MARVEL uncertainties, and the number of
rotational levels (RL) the vibrational levels are holding within the
present database.a
v1v2v3 VBO (cm�1) Unc. RL
0 0 0 0.000000b 0 86
0 1 0 1399.674626 182 76
a See footnote a to Table 5.b See footnote b to Table 5.
Table 7MARVEL and RITZ vibrational band origins (VBO) for HD18O, with
normal-mode (v1v2v3) assignments, uncertainties, and the number of
rotational levels (RL) the vibrational levels are holding within the related
databases.a
v1v2v3 MARVEL RITZ [114]
VBO (cm�1) Unc. RL VBO/cm�1 Unc.
0 0 0 0.000000b 0 168 0.000000b 0
0 1 0 1396.266365 176 155 1396.266540 299
1 0 0 2709.284316 178 125 2709.284528 311
0 2 0 2767.209640 220 84 2767.212120 696
0 0 1 3696.330134 345 153 3696.330305 696
1 1 0 4080.544716 484 99 4080.544949 484
0 3 0 4121.754251 349 75 4121.754430 348
0 1 1 5071.496323 352 115 5071.496500 696
0 4 0 7
2 0 0 5335.360667 485 71 5335.360899 484
1 0 1 6390.982474 189 133 6390.982322 188
0 2 1 6425.951205 175 109 6425.951439 342
2 1 0 6711.672686 173 80 6711.672989 185
0 0 2 7229.185072 227 135 7229.185309 226
0 5 0 11
0 3 1 10
1 1 1 11
1 2 1 1
3 0 0 7876.171252 399 47 7876.171489 676
0 2 2 23
1 0 2 9930.723962 968 29 9930.724199 966
0 1 2 79
2 0 1 3
0 0 3 61
0 7 0 1
3 1 0 5
0 1 3 69
4 0 0 4
3 0 1 1
a See footnote a to Table 5.b See footnote b to Table 5.
J. Tennyson et al. / Journal of Quantitative Spectroscopy & Radiative Transfer 111 (2010) 2160–21842174
3.1. HD16O
For HD16O, 53 291 transitions of the 54 740 initialtransitions have been validated and used in the finalMARVEL analysis. From these transitions we derive a finalset of 8818 energy levels which belong to 54 vibrationalstates and have J up to 30 and Ka up to 21. 66 transitionsfrom 03JaTeBeZo [86] form an FSN and 13 transitionsfrom the same source are orphans; thus, they could not beused for energy level determination.
A comparison of the experimental (MARVEL) andvariational (VTT [118]) energy level values is given inFig. 2. The root-mean-square deviation for this compar-ison is 0.058 cm�1, with the maximum obs–calc residualsbeing �0.51 and �1.27 cm�1 for the [4 0 4] and [3 0 3]levels of the (0 6 3) vibrational state, respectively. The(0 6 3) [3 0 3] energy level at 18 293.1607 cm�1 wasderived from two weak lines in 07VoNaCaCo [100] andshould most likely be considered incorrect. Note thatthese two levels were excluded when the above quotedrms deviation was determined.
A comparison can be made between the original set ofobserved transitions and those calculated from theexperimental energy levels determined by MARVEL; thisis presented in Fig. 3. The differences do not exceed0.038 cm�1; 52.6% and 84% of all transitions are repro-duced within 0.001 and 0.005 cm�1, respectively. Only5.6% of the observed transitions differ from the MARVELcalculated values by more than 0.01 cm�1.
MARVEL may increase, via robust reweighting, anexperimental uncertainty of a transition when it is notconsistent with that derived from the MARVEL energylevels. For transitions with low J and Ka values it is rathereasy to evaluate a feasible experimental uncertainty ifenough CDs are available. However, for increased valuesof J and Ka the CD relations become less accurate andinstructive, a number of experimental lines representunresolved multiplets, and it becomes more and moredifficult to judge properly the actual experimentalaccuracy of the transitions. This in turn limits theaccuracy of the MARVEL energy levels derived. Thissituation could be improved only by including additionalaccurate experimental information in the MARVEL inputfile.
The set of MARVEL energy levels derived from proces-sing the validated observed transitions has been used topredict a large number of rovibrational transitions withpositions at the level of experimental accuracy. These linepositions were augmented with variational intensities. Thetotal number of predicted transitions with intensitieslarger than 1.0�10�29 cm molecule�1 is 188 565 for T =296 K. Observed, observed + predicted, and variationaltransitions are shown in Fig. 4 for HD16O. The number ofresidual unobserved variational lines was obtained as thedifference between the variationally calculated and ob-served + predicted transitions; their number is 185 751with intensities greater than 1�10�29 cm molecule�1.This figure is especially important for future experimentalstudies of the high-resolution spectra of HD16O. Thestrongest unobserved lines fall in the 3600–9600 and9600–12 400 cm�1 regions with intensities 3�10�23 and4�10�25 cm molecule�1, respectively. Interestingly, inthe spectral region below 2400 cm�1 intensities of theresidual lines do not exceed 1�10�27 cm molecule�1, andin the 2400–3600 cm�1 region their intensities are notlarger than 1�10�26 cm molecule�1. Such a completecoverage of the 0–2400 cm�1 region by the obs +predicted transitions is due to energy levels derived fromthe analysis of hot spectra in 03JaTeBeZo [86]. Similarly tothe ‘‘cold’’ spectrum, a set of 74 122 ‘‘hot’’ transitions at T =1770 K in the 380–3932 cm�1 region have been predicted
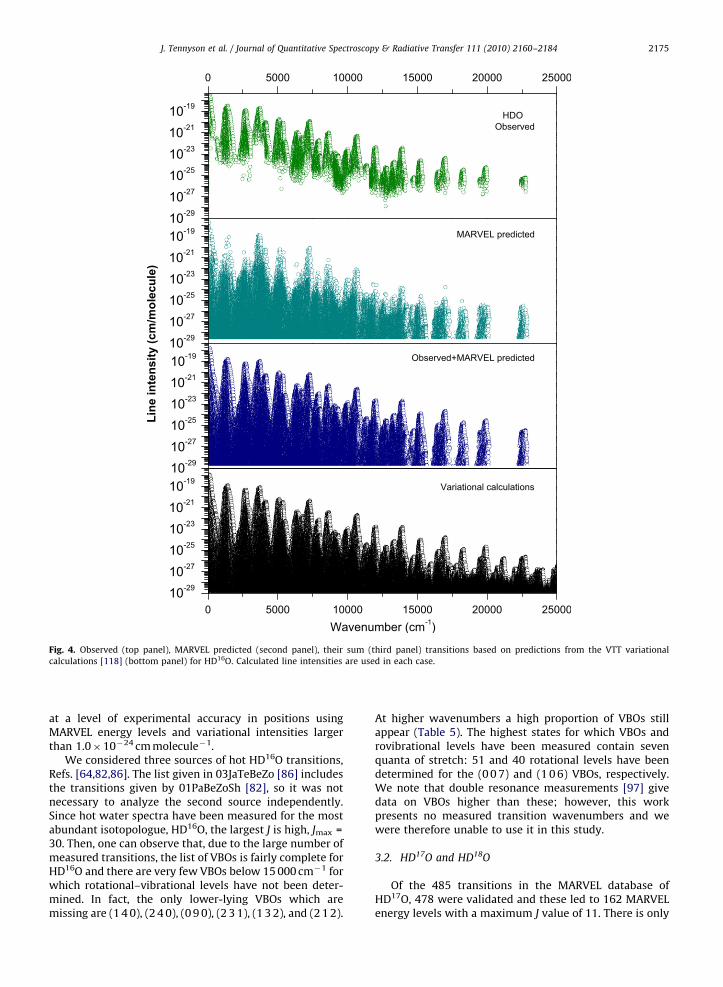
Fig. 4. Observed (top panel), MARVEL predicted (second panel), their sum (third panel) transitions based on predictions from the VTT variational
calculations [118] (bottom panel) for HD16O. Calculated line intensities are used in each case.
J. Tennyson et al. / Journal of Quantitative Spectroscopy & Radiative Transfer 111 (2010) 2160–2184 2175
at a level of experimental accuracy in positions usingMARVEL energy levels and variational intensities largerthan 1.0�10�24 cm molecule�1.
We considered three sources of hot HD16O transitions,Refs. [64,82,86]. The list given in 03JaTeBeZo [86] includesthe transitions given by 01PaBeZoSh [82], so it was notnecessary to analyze the second source independently.Since hot water spectra have been measured for the mostabundant isotopologue, HD16O, the largest J is high, Jmax =30. Then, one can observe that, due to the large number ofmeasured transitions, the list of VBOs is fairly complete forHD16O and there are very few VBOs below 15 000 cm�1 forwhich rotational–vibrational levels have not been deter-mined. In fact, the only lower-lying VBOs which aremissing are (1 4 0), (2 4 0), (0 9 0), (2 3 1), (1 3 2), and (2 1 2).
At higher wavenumbers a high proportion of VBOs stillappear (Table 5). The highest states for which VBOs androvibrational levels have been measured contain sevenquanta of stretch: 51 and 40 rotational levels have beendetermined for the (0 0 7) and (1 0 6) VBOs, respectively.We note that double resonance measurements [97] givedata on VBOs higher than these; however, this workpresents no measured transition wavenumbers and wewere therefore unable to use it in this study.
3.2. HD17O and HD18O
Of the 485 transitions in the MARVEL database ofHD17O, 478 were validated and these led to 162 MARVELenergy levels with a maximum J value of 11. There is only
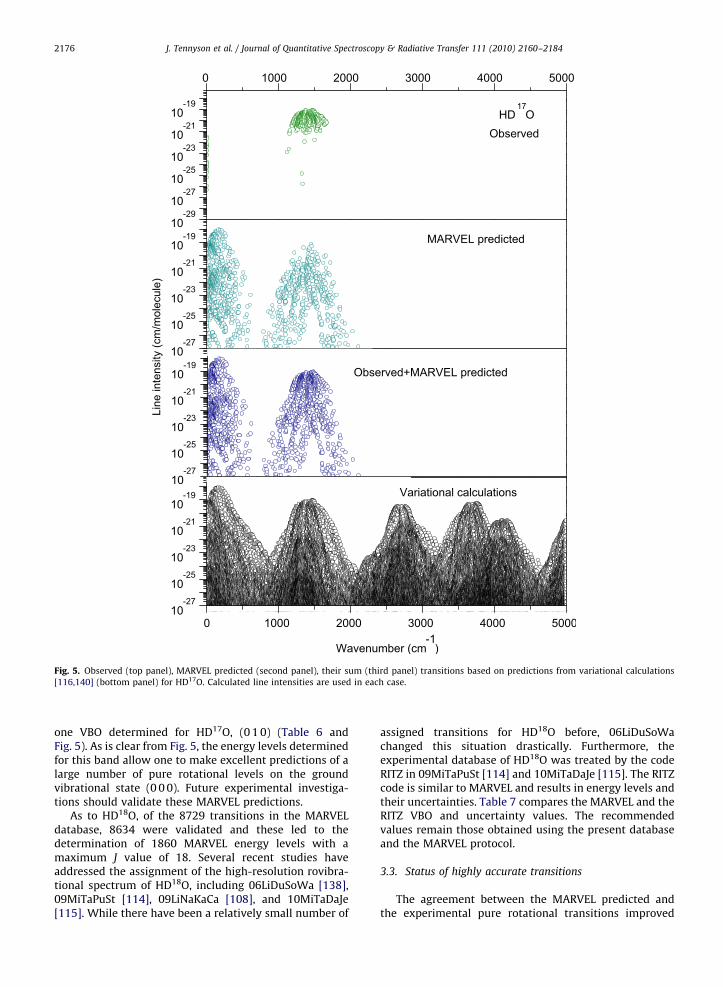
Fig. 5. Observed (top panel), MARVEL predicted (second panel), their sum (third panel) transitions based on predictions from variational calculations
[116,140] (bottom panel) for HD17O. Calculated line intensities are used in each case.
J. Tennyson et al. / Journal of Quantitative Spectroscopy & Radiative Transfer 111 (2010) 2160–21842176
one VBO determined for HD17O, (0 1 0) (Table 6 andFig. 5). As is clear from Fig. 5, the energy levels determinedfor this band allow one to make excellent predictions of alarge number of pure rotational levels on the groundvibrational state (0 0 0). Future experimental investiga-tions should validate these MARVEL predictions.
As to HD18O, of the 8729 transitions in the MARVELdatabase, 8634 were validated and these led to thedetermination of 1860 MARVEL energy levels with amaximum J value of 18. Several recent studies haveaddressed the assignment of the high-resolution rovibra-tional spectrum of HD18O, including 06LiDuSoWa [138],09MiTaPuSt [114], 09LiNaKaCa [108], and 10MiTaDaJe[115]. While there have been a relatively small number of
assigned transitions for HD18O before, 06LiDuSoWachanged this situation drastically. Furthermore, theexperimental database of HD18O was treated by the codeRITZ in 09MiTaPuSt [114] and 10MiTaDaJe [115]. The RITZcode is similar to MARVEL and results in energy levels andtheir uncertainties. Table 7 compares the MARVEL and theRITZ VBO and uncertainty values. The recommendedvalues remain those obtained using the present databaseand the MARVEL protocol.
3.3. Status of highly accurate transitions
The agreement between the MARVEL predicted andthe experimental pure rotational transitions improved

Fig. 6. Observed (top panel), MARVEL predicted (second panel), their sum (third panel) transitions based on predictions from variational calculations
[116,140] (bottom panel) for HD18O. Calculated line intensities are used in each case.
J. Tennyson et al. / Journal of Quantitative Spectroscopy & Radiative Transfer 111 (2010) 2160–2184 2177
slightly by the recalibration of the experimental transi-tions. Nevertheless, the MARVEL uncertainties of the purerotational levels is still uniformly larger than is usual forlines coming from microwave determinations. To showthat this is due to the uncertainties of the upper states weperformed a MARVEL analysis of the pure rotationalstates. MARVEL can reproduce the microwave uncertain-ties very nicely, down to the level of the experimentaluncertainties, as also observed before [5]. For example,the mean of the reproduction of the pure rotational linesfor HD16O is 2.3�10�5 cm�1 if only the (0 0 0) transitionsare employed in the MARVEL analysis. The agreementworsens to 4.8�10�5 cm�1 if the full calibrated databaseis used to predict the pure rotational transitions.
Another source of inaccuracy when combining mea-sured results from several sources is due to pressureshifts. This is especially of concern for this study as thepressure of HDO had to be increased several times inorder to allow the detection of the HDO lines. Since thereis no theory of pressure shifts of sufficient accuracy, noattempt was made in this work to correct the observedlines to, for example, zero pressure. This introduces aperhaps appreciable uncertainty for most of the measuredlines. This is reflected in MARVEL uncertainties larger thanotherwise expected for many rotational–vibrational le-vels.
Of all the transitions outside of the micro- andmillimeterwave regions treated in this study, the most

J. Tennyson et al. / Journal of Quantitative Spectroscopy & Radiative Transfer 111 (2010) 2160–21842178
accurate one available is at 1480.094038033(67) cm�1
[76], observed for HD16O. Toth [72] has measured thesame transition although with much less precision.Guelachvili [47] also measured this transition (as ex-pected, his measured value only agrees with the otherones after the multiplicative recalibration of his results).As the present study of all the measured transitionsof HD16O shows, the lower (0 0 0) 515 and the upper(0 1 0) 524 energy levels of this transition are involved in461 and 76 transitions, respectively. This means thatMARVEL can fix the energies of these levels, and thusthe transition, with considerable certainty. The MARVELwave number and uncertainty of this transition is1480.094038033(7000) cm�1. Therefore, it is clear thatMARVEL (a) did not change the value of the transitionknown accurately and precisely, and (b) increased theuncertainty of the measured line considerably. None ofthis is surprising given the large number of much lessprecisely determined transitions the two energy levels areinvolved in and the fact that MARVEL did not find itnecessary to adjust the uncertainty of the originalexperimental measurement (which confirms its highprecision).
4. Discussion
4.1. A comparison with HITRAN
The relevant features of the HITRAN database[141,142] are summarized in the original publicationsand in Part I; thus, they are not repeated here in detail,and just a few remarks are made. Table 8 compares thedata used in this study with those in the HITRAN [141]database. There are several notable differences betweenHITRAN and the (present) IUPAC water-vapor dataanalysis. First, HITRAN contains a mixture of observedand calculated entries, whereas the lines used in thepresent analysis are based strictly on publishedexperimental values. Even though the goal in HITRAN isto have a complete set of self-consistent and maintainablevalues, in practice this is not possible at this time. Entriesthat have been determined under controlled laboratoryconditions and are very accurate are frequently used inHITRAN. However, in order to have adequate sets of lines
Table 8Comparison of HD16O, HD17O, and HD18O transition data found in
HITRAN [141] and used in the present compilation.
HD16O HD17O HD18O
Total number of transitions in present
database
54 740 485 8728
Unique transitions in present database 36 690 445 7186
Number of validated transitions 53 291 478 8635
Transitions in HITRAN database 13 238 175 1611
Concordant transitionsa 9627 169 848
Transitions absent in present database 3611 6 763
Transitions absent in HITRAN 27 063 276 6338
a Transitions which are present both in HITRAN and in the present
validated IUPAC database.
for important vibration–rotation bands, it is necessary touse theoretical extrapolations of the data (especially tothe higher rotational levels), to have calculations of linesthat are blended or obscured in laboratory observations,or to have calculations for quantities that theory actuallyyields better constrained values at present thanexperiment (some line-shape parameters, for example).Second, in the case of multiple sets of data for a quantity,HITRAN takes each datum from a single source. Thisconsolidation of data has been made by judgment of thequality of the different data sets. With the superiorstructure of the IUPAC database, all high-quality datahave been retained. In principle one can use a filteringcode to produce a smaller list for a specific application.Third, HITRAN is aimed at atmospheric temperatureapplications and, by application of a minimum transitionintensity at 296 K requirement, rejects many hottransitions; our present analysis aims to capture allmeasured transitions. The increased number oftransitions in the present compilation is partly areflection of this.
The line positions of HD16O in the pure rotational bandhave remained unchanged in HITRAN since the 1986 edition[132] and originate from an older version of the JPL catalog[143]. It was generated based on the constants obtained inthe simultaneous fit of submillimeter measurements ofMesser et al. [49] and a set of experimentally determinedground state energy levels based on infrared measurementsin the n2 band. All the lines from 500 to 7514 cm�1 originatefrom the SISAM database [144]. Most of the HD16O lines inSISAM are experimentally observed, while 1525 werecalculated based on the experimentally determined energylevels. There are no HD16O lines between 7514 and9751 cm�1. From 9751 to 10 782 cm�1, data from Tolchenovand Tennyson [107] were used, and starting from11 750 cm�1 lines were taken from Voronin et al. [100].
For HD18O, the current version of the JPL catalogue[145] was used in HITRAN for the pure rotational bandand data from Toth’s website [144] was used for all otherlines from 500 to 3825 cm�1. Note that line positions of56 of these lines were determined from experimentallyderived energy levels rather than directly measured. Themajority of 6338 lines in the IUPAC dataset of experi-mental transitions that are absent in HITRAN (see Table 8)are lines above 3825 cm�1.
For HD17O, the only lines in HITRAN are those from theSISAM database [144], while IUPAC data include measure-ments in the pure rotational band [111,110] and the n2
band from 93Tothb [61].
4.2. Completeness of data
As shown in Part I, a comparison between thevariational nuclear motion calculations and the resultsof the MARVEL analysis can be used to assess the overallcompleteness of the spectroscopic data for each waterisotopologue and to indicate key regions for furtherexperimental study. In this context the results of theMARVEL analysis can be used to predict new transitionsbetween already determined energy levels but cannot be
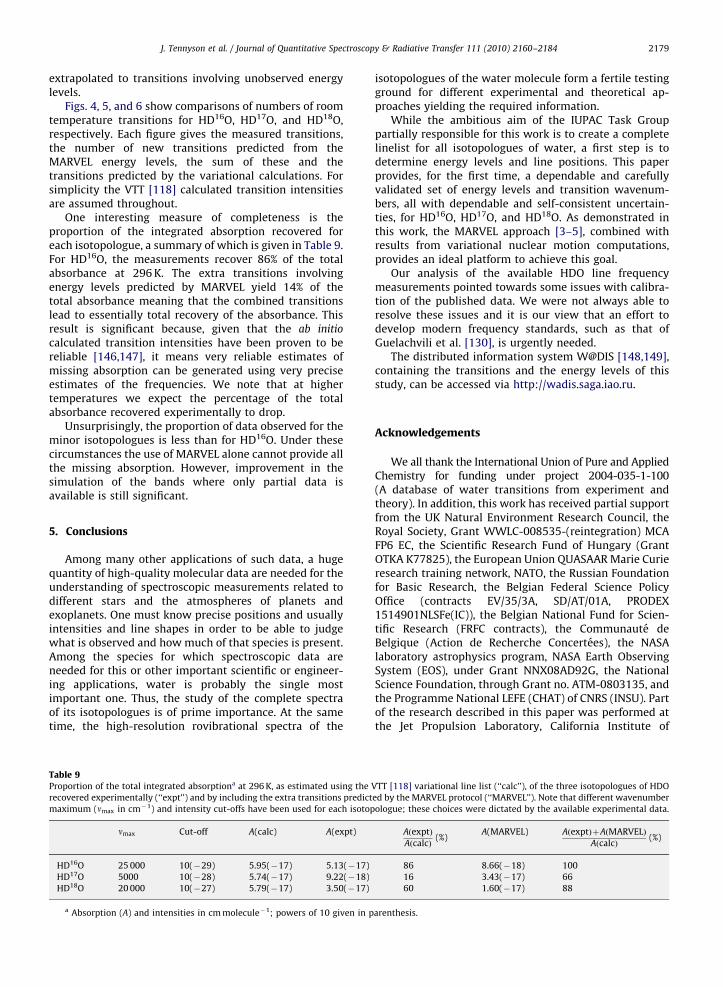
J. Tennyson et al. / Journal of Quantitative Spectroscopy & Radiative Transfer 111 (2010) 2160–2184 2179
extrapolated to transitions involving unobserved energylevels.
Figs. 4, 5, and 6 show comparisons of numbers of roomtemperature transitions for HD16O, HD17O, and HD18O,respectively. Each figure gives the measured transitions,the number of new transitions predicted from theMARVEL energy levels, the sum of these and thetransitions predicted by the variational calculations. Forsimplicity the VTT [118] calculated transition intensitiesare assumed throughout.
One interesting measure of completeness is theproportion of the integrated absorption recovered foreach isotopologue, a summary of which is given in Table 9.For HD16O, the measurements recover 86% of the totalabsorbance at 296 K. The extra transitions involvingenergy levels predicted by MARVEL yield 14% of thetotal absorbance meaning that the combined transitionslead to essentially total recovery of the absorbance. Thisresult is significant because, given that the ab initio
calculated transition intensities have been proven to bereliable [146,147], it means very reliable estimates ofmissing absorption can be generated using very preciseestimates of the frequencies. We note that at highertemperatures we expect the percentage of the totalabsorbance recovered experimentally to drop.
Unsurprisingly, the proportion of data observed for theminor isotopologues is less than for HD16O. Under thesecircumstances the use of MARVEL alone cannot provide allthe missing absorption. However, improvement in thesimulation of the bands where only partial data isavailable is still significant.
5. Conclusions
Among many other applications of such data, a hugequantity of high-quality molecular data are needed for theunderstanding of spectroscopic measurements related todifferent stars and the atmospheres of planets andexoplanets. One must know precise positions and usuallyintensities and line shapes in order to be able to judgewhat is observed and how much of that species is present.Among the species for which spectroscopic data areneeded for this or other important scientific or engineer-ing applications, water is probably the single mostimportant one. Thus, the study of the complete spectraof its isotopologues is of prime importance. At the sametime, the high-resolution rovibrational spectra of the
Table 9Proportion of the total integrated absorptiona at 296 K, as estimated using the
recovered experimentally (‘‘expt’’) and by including the extra transitions predict
maximum (nmax in cm�1) and intensity cut-offs have been used for each isotop
nmax Cut-off A(calc) A(expt)
HD16O 25 000 10(�29) 5.95(�17) 5.13(�17)
HD17O 5000 10(�28) 5.74(�17) 9.22(�18)
HD18O 20 000 10(�27) 5.79(�17) 3.50(�17)
a Absorption (A) and intensities in cm molecule�1; powers of 10 given in p
isotopologues of the water molecule form a fertile testingground for different experimental and theoretical ap-proaches yielding the required information.
While the ambitious aim of the IUPAC Task Grouppartially responsible for this work is to create a completelinelist for all isotopologues of water, a first step is todetermine energy levels and line positions. This paperprovides, for the first time, a dependable and carefullyvalidated set of energy levels and transition wavenum-bers, all with dependable and self-consistent uncertain-ties, for HD16O, HD17O, and HD18O. As demonstrated inthis work, the MARVEL approach [3–5], combined withresults from variational nuclear motion computations,provides an ideal platform to achieve this goal.
Our analysis of the available HDO line frequencymeasurements pointed towards some issues with calibra-tion of the published data. We were not always able toresolve these issues and it is our view that an effort todevelop modern frequency standards, such as that ofGuelachvili et al. [130], is urgently needed.
The distributed information system W@DIS [148,149],containing the transitions and the energy levels of thisstudy, can be accessed via http://wadis.saga.iao.ru.
Acknowledgements
We all thank the International Union of Pure and AppliedChemistry for funding under project 2004-035-1-100(A database of water transitions from experiment andtheory). In addition, this work has received partial supportfrom the UK Natural Environment Research Council, theRoyal Society, Grant WWLC-008535-(reintegration) MCAFP6 EC, the Scientific Research Fund of Hungary (GrantOTKA K77825), the European Union QUASAAR Marie Curieresearch training network, NATO, the Russian Foundationfor Basic Research, the Belgian Federal Science PolicyOffice (contracts EV/35/3A, SD/AT/01A, PRODEX1514901NLSFe(IC)), the Belgian National Fund for Scien-tific Research (FRFC contracts), the Communaute deBelgique (Action de Recherche Concertees), the NASAlaboratory astrophysics program, NASA Earth ObservingSystem (EOS), under Grant NNX08AD92G, the NationalScience Foundation, through Grant no. ATM-0803135, andthe Programme National LEFE (CHAT) of CNRS (INSU). Partof the research described in this paper was performed atthe Jet Propulsion Laboratory, California Institute of
VTT [118] variational line list (‘‘calc’’), of the three isotopologues of HDO
ed by the MARVEL protocol (‘‘MARVEL’’). Note that different wavenumber
ologue; these choices were dictated by the available experimental data.
AðexptÞ
AðcalcÞ(%)
A(MARVEL) AðexptÞþAðMARVELÞ
AðcalcÞ(%)
86 8.66(�18) 100
16 3.43(�17) 66
60 1.60(�17) 88
arenthesis.

Table 11MARVEL vibrational band origins (VBO), with polyad quantum number
(P=2v1+v2+2v3), normal-mode (v1v2v3) and local-mode ððmnÞ7 v2Þ
assignments, MARVEL uncertainties (Unc.), and the number of rotational
levels (RL) the vibrational levels are holding within the present,
improved database, for H217O.a
P v1v2v3 (mn)7v2 VBO (cm�1) Unc. RL
0 0 0 0 (00)+0 0.000000b 0 192
1 0 1 0 (00)+1 1591.325719 47 153
2 0 2 0 (00)+2 3144.980520 46 78
2 1 0 0 (10)+0 3653.142275 28 108
2 0 0 1 (10)�0 3748.318105 31 141
3 1 1 0 (10)+1 5227.705615 473 69
3 0 1 1 (10)�1 5320.251393 527 157
4 1 2 0 (10)+2 6764.725615 473 73
4 0 2 1 (10)�2 6857.272485 47 94
4 2 0 0 (20)+0 7193.246415 47 81
4 1 0 1 (20)�0 7238.714012 51 110
4 0 0 2 (11)+0 7431.076115 473 27
5 1 1 1 (20)�1 8792.544010 360 108
5 0 1 2 (11)+1 8982.869215 473 55
6 1 2 1 (20)�2 10 311.201787 440 75
6 2 0 1 (30)�0 10 598.475620 492 103
6 1 0 2 (21)+0 10 853.505315 473 69
6 0 0 3 (21)�0 11 011.882910 2465 84
7 1 3 1 (20)�3 11 792.822200 490 40
7 2 1 1 (30)�1 12 132.992610 493 94
7 0 1 3 (21)�1 12 541.227060 517 51
8 2 2 1 (30)�2 13 631.499810 542 52
9 0 7 1 (10)�7 13 808.273310 493 2
8 3 0 1 (40)�0 13 812.158110 493 74
8 1 0 3 (31)�0 14 296.279510 197 36
10 3 2 1 (40)�2 16 797.167510 3944 70
10 4 0 1 (50)�0 16 875.620510 3944 55
a The uncertainties (Unc.) are given in units of 10�6 cm�1. The VBOs
are ordered by energy.b The value of the vibrational ground state was fixed to zero with
zero uncertainty.
Table 10Data sources additional to those presented in Part I and their characteristics for H2
17O.a
Tag Range (cm�1) Trans. A/V Physical conditions Comments
T (K) p (hPa) Abun. (%) Rec. L (m)
86GuRa [150] 100–1986 203/202 (10a)
09LiNaKaCa [108] 5907–6726 212/212 299 0.13–13 0.3 CRDS (10b)
a See footnote a to Table 2.
(10a) 86GuRa. MARVEL cuts the transition 83GuRa.5 at 207.73575 cm�1.
(10b) 09LiNaKaCa. H217O transitions assigned in the CRDS spectrum of a highly 18O enriched sample.
J. Tennyson et al. / Journal of Quantitative Spectroscopy & Radiative Transfer 111 (2010) 2160–21842180
Technology, under contract with the National Aeronauticsand Space Administration.
Appendix A
The MARVEL protocol involves active maintenance(the A in MARVEL) and periodic update of the databasescontaining the measured transitions. Since the publicationof Part I [1], new measurements [108,150] came to ourattention for H2
17O and H218O, the two water isotopolo-
gues treated there. Furthermore, during preparation of thePart II manuscript the MARVEL procedure, as noted above,has also been slightly adjusted in order to determine morereliable energy values and uncertainty estimates via apost-MARVEL validation scheme. Therefore, in this ap-pendix we give improved VBOs for H2
17O and H218O and
in the Supplementary Material we provide new orimproved MARVEL energy levels for these two isotopolo-gues, as well. These new data should replace the onespresented in Part I.
A.1. H217O
Two new sources have been added to the Part Idatabase, 09LiNaKaCa [108] and 86GuRa [150]. Character-istics of these two sources are given in Table 10.Compared to Part I, the number of validated transitionsincreased from 8614 to 9028 and the number of energylevels increased from 2687 to 2723.
Application of the post-MARVEL validation schemealso meant that the MARVEL energy levels for thisisotopologue changed as compared to Part I. The fullset of VBOs and their improved uncertainties are givenin Table 11. There are no new VBOs compared to Part I.The improved set of MARVEL rotational–vibrationalenergy levels are provided in the SupplementaryMaterial.
A.2. H218O
Three new sources have been added to the Part Idatabase, 09LiNaKaCa [108], 09PuCaHaVa [151], and86GuRa [150]. Characteristics of these sources are givenin Table 12. There are six orphans in the database and anFSN containing 22 transitions. Compared to Part I, the
number of validated transitions increased from 29 364 to31 705 and the number of energy levels increased from4849 to 5131.
Application of the post-MARVEL validation schemealso meant that the MARVEL energy levels for H2
18Oisotopologue changed as compared to Part I. The full set ofVBOs and their improved uncertainties are given inTable 13. The improved set of MARVEL energy levels areprovided in the Supplementary Material.

Table 13MARVEL vibrational band origins (VBO), with polyad quantum number
(P=2v1+v2+2v3), normal-mode (v1v2v3) and local-mode ((mn)7v2)
assignments, MARVEL uncertainties, and the number of rotational levels
(RL) the vibrational levels are holding within the present revised
database, for H218O.a
P v1v2v3 (mn)7v2 VBO (cm�1) Unc. RL
0 0 0 0 (00)+0 0.000000 0 298
1 0 1 0 (00)+1 1588.276029 22 227
2 0 2 0 (00)+2 3139.050028 36 146
2 1 0 0 (10)+0 3649.685417 50 192
2 0 0 1 (10)�0 3741.566775 45 216
3 0 3 0 (00)+3 4648.477809 341 130
3 1 1 0 (10)+1 5221.243308 377 170
3 0 1 1 (10)�1 5310.461383 281 246
4 1 2 0 (10)+2 6755.510366 283 167
4 0 2 1 (10)�2 6844.598785 194 169
4 2 0 0 (20)+0 7185.878096 506 176
4 1 0 1 (20)�0 7228.883501 493 181
4 0 0 2 (11)+0 7418.724061 294 147
5 1 3 0 (10)+3 8249.037152 459 79
5 0 3 1 (10)�3 8341.107933 417 120
5 2 1 0 (20)+1 8739.525858 503 84
5 1 1 1 (20)�1 8779.719569 349 143
5 0 1 2 (11)+1 8967.565058 503 87
6 0 4 1 (10)�4 9795.331502 473 72
6 2 2 0 (20)+2 10 256.584858 503 61
6 1 2 1 (20)�2 10 295.634509 450 108
6 0 2 2 (11)+2 10 483.221458 503 53
6 3 0 0 (30)+0 10 573.916858 503 97
6 2 0 1 (30)�0 10 585.285174 460 133
6 1 0 2 (21)+0 10 839.955723 499 90
6 0 0 3 (21)�0 10 993.681009 450 103
7 2 3 0 (20)+3 11 734.525057 503 68
7 1 3 1 (20)�3 11 774.707602 373 103
7 0 3 2 (11)+3 11 963.537158 503 73
7 3 1 0 (30)+1 12 106.977658 503 98
7 2 1 1 (30)�1 12 116.797008 466 133
7 1 1 2 (21)+1 12 372.705608 410 103
7 0 1 3 (21)�1 12 520.122915 47 110
8 2 2 1 (30)�2 13 612.710202 47 74
8 3 0 1 (40)�0 13 795.398204 47 94
8 2 0 2 (31)+0 14 187.982458 1358 49
8 1 0 3 (31)�0 14 276.336099 464 68
10 3 2 1 (40)�2 16 775.380902 1418 28
10 4 0 1 (50)�0 16 854.990902 1418 44
a See footnotes a and b to Table 11.
Table 12Data sources additional to those presented in Part I and their characteristics for H2
18O.a
Tag Range (cm�1) Trans. A/V Physical conditions Comments
T (K) p (hPa) Abun. (%) Rec. L (m)
09PuCaHaVa [151] 6.4–18.4 5/5 RT
86GuRa [150] 55–2053 351/350 (12a)
09LiNaKaCa [108] 5907–6726 2015/2006 299 0.13–13 84–92 CRDS
a See footnote a to Table 2:
(12a) 86GuRa. MARVEL cuts the transition 83GuRa.21 at 147.19380 cm�1.
J. Tennyson et al. / Journal of Quantitative Spectroscopy & Radiative Transfer 111 (2010) 2160–2184 2181
Appendix B. Supplementary data
Supplementary data associated with this article can befound in the online version at doi:10.1016/j.jqsrt.2010.06.012.
References
[1] Tennyson J, Bernath PF, Brown LR, Campargue A, Carleer MR,Csaszar AG, et al. Critical evaluation of the rotational-vibrationalspectra of water vapor. Part I. Energy levels and transitionwavenumbers for H2
17O and H218O. J Quant Spectrosc Radiat
Transfer 2009;110:573–96.[2] Bernath PF. The spectroscopy of water vapour: experiment, theory
and applications. Phys Chem Chem Phys 2002;4:1501–9.[3] Csaszar AG, Czako G, Furtenbacher T, Matyus E. An active database
approach to complete spectra of small molecules. Ann Rep CompChem 2007;3:155–76.
[4] Furtenbacher T, Csaszar A, Tennyson J. MARVEL: measured activerotational–vibrational energy levels. J Mol Spectrosc 2007;245:115–25.
[5] Furtenbacher T, Csaszar AG. On employing H216O, H2
17O, H218O,
and D216O lines as frequency standards in the 15–170 cm�1
window. J Quant Spectrosc Radiat Transfer 2008;109:1234–51.[6] Joussaume S, Sadourny R, Jouzel J. A general circulation model of
water isotope cycles in the atmosphere. Nature 1984;311:24–9.[7] Fouchet T, Lellouch E. Vapor pressure isotope fractionation effects
in planetary atmospheres: application to deuterium. Icarus2000;144:114–23.
[8] Montmessin F, Fouchet T, Forget F. Modeling the annual cycle ofHDO in the Martian atmosphere. J Geophys Res 2005;110:E03006.
[9] Payne VN, Noone D, Dudhia A, Piccolo C, Grainger RG. Globalsatellite measurements of HDO and implications for understandingthe transport of water vapour into the stratosphere. J Quart RoyMeteor Soc 2007;133:1459–71.
[10] Steinwagner J, Milz M, von Clarmann T, Glatthor N, Grabowski U,Hopfner M, et al. HDO measurements with MIPAS. Atmos ChemPhys 2007;7:2601–15.
[11] De Bergh C, Bezard B, Owen T, Crisp D, Maillard J-P, Lutz BL.Deuterium on Venus—observations from Earth. Science1991;251:547–9.
[12] Pavlenko YV, Harris GJ, Tennyson J, Jones HRA, Brown JM, HarrisonJ, et al. The electronic bands of CrD, CrH, MgD and MgH:application to the ‘‘deuterium’’ test. Mon Not R Astr Soc2008;386:1338–46.
[13] Hewitt AJ, Doss N, Zobov NF, Polyansky OL, Tennyson J. Deuteratedwater: partition functions and equilibrium constant. Mon Not RAstr Soc 2005;356:1123–6.
[14] Watson JKG. Robust weighting in least-squares fits. J Mol Spectrosc2003;219:326–8.
[15] Townes CH, Merrit FR. Water spectrum near one-centimeter wave-length. Phys Rev 1946;70:558–9.
[16] Strandberg MWP, Wentink Jr T, Hillger RE, Wannier GH, DeutschML. Stark spectrum of HDO. Phys Rev 1948;73:188.
[17] McAfee Jr KB. A study of the absorption of some gases at microwavefrequencies. PhD thesis, Harvard; 1949 [data given by [22]].
[18] Strandberg MWP. Rotational absorption spectrum of HDO. J ChemPhys 1949;17:901–4.
[19] Jen CK. Rotational magnetic moments for H2O and HDO. Phys Rev1949;76:471.
[20] Jen CK. Rotational magnetic moment in polyatomic molecules. PhysRev 1951;81:197–203.
[21] Beerd Y, Weisbaum S. An ultra-high frequency rotational line ofHDO. Phys Rev 1953;91:1010–4.
[22] Jen CK, Bianco DR, Massey JT. Some heavy water rotationalabsorption lines. J Chem Phys 1953;21:520–5.
[23] Burke BF, Strandberg MWP. Zeeman effect in rotational spectra ofasymmetric-rotor molecules. Phys Rev 1953;90:303–8.

J. Tennyson et al. / Journal of Quantitative Spectroscopy & Radiative Transfer 111 (2010) 2160–21842182
[24] Crawford HD. Two new lines in the microwave spectrum of heavywater. J Chem Phys 1953;21:2099.
[25] Posener DW, Strandberg MWP. Microwave spectrum of HDO. JChem Phys 1953;21:1401–2.
[26] Posener DW, Strandberg MWP. Centrifugal distortion effect inasymmetric top molecules III. H2O, D2O, and HDO. Phys Rev1954;95:374–84.
[27] Weisbaum S, Beers Y, Hermann G. Low-frequency rotationalspectrum of HDO. J Chem Phys 1955;23:1601–5.
[28] Erlandson G, Cox J. Millimeter-wave lines of heavy water. J ChemPhys 1956;25:778–9.
[29] Benedict WS, Gailar N, Plyler EK. Rotation–vibration spectra ofdeuterated water vapor. J Chem Phys 1956;24:1139–65.
[30] Posener DW. Hyperfine structure in the microwave spectrum ofwater. Austr J Phys 1957;10:276–85.
[31] Gailar NM, Dickey FP. The vibration–rotation band n2 of HDO vapor.J Mol Spectrosc 1960;4:1–15.
[32] Treacy EB, Beers Y. Hyperfine structure of the rotational spectrumof HDO. J Chem Phys 1962;36:1473–80.
[33] Thaddeus P, Krisher LC, Loubser JHN. Hyperfine structure of themicrowave spectrum of HDO, HDS, CH2O, and CHDO: beam-maserspectroscopy and asymmetric-top molecules. J Chem Phys1964;40:257–73.
[34] Bluyssen H, Verhoeven J, Dymanus A. Hyperfine structure of HDOand D2O by beam maser spectroscopy. Phys Lett A 1967;25:214–5.
[35] Verhoeven J, Bluyssen H, Dymanus A. Hyperfine structure of HDOand D2O by beam maser spectroscopy. Phys Lett A 1968;26:424–5.
[36] Steenbeckeliers G, Bellet J. Spectre de rotation de l’eau lourde. C RHebd Seances Acad Sci B 1970;270:1039–41.
[37] Bellet J, Steenbeckeliers G. Calcul des constantes rotationnelles desmolecules H2O, HDO et D2O dans leurs etats fondamentaux devibration. C R Hebd Seances Acad Sci B 1970;271:1208–11.
[38] De Lucia FC, Cook RL, Helminger P, Gordy W. Millimeter andsubmillimeter wave rotational spectrum and centrifugal distortioneffects of HDO. J Chem Phys 1971;55:5334–9.
[39] Lafferty W, Bellet J, Steenbeckeliers G. Spectre microonde destransitions de faible intensite de la molecule HDO. Etude de lamolecule dans l’etat vibrationell exite n2. C R Hebd Seances Acad SciB 1971;273:388–91.
[40] Clough SA, Beers Y, Klein GP, Rothman LS. Dipole moment of waterfrom Stark measurements of H2O, HDO, and D2O. J Chem Phys1973;59:2254–9.
[41] Camy-Peyret C, Flaud J-M, Guelachvili G, Amiot C. High resolutionFourier transform spectrum of water between 2930 and4255 cm�1. Mol Phys 1973;26:825–55.
[42] Fleming JW, Gibson MJ. Far-infrared absorption spectra of water vaporH2
16O and isotopic modifications. J Mol Spectrosc 1976;62:326–37.[43] Kauppinen J, Kakkainen T, Kyro E. High-resolution spectrum of
water vapour between 30 and 720 cm�1. J Mol Spectrosc 1978;71:15–45.
[44] Papineau N, Camy-Peyret C, Flaud JM, Guelachvili G. The 2n2 and n1
bands of HD16O. J Mol Spectrosc 1982;92:451–68.[45] Bykov AD, Lopasov VP, Makushkin YS, Sinitsa LN, Ulenikov ON,
Zuev VE. Rotation–vibration spectra of deuterated water vapor inthe 9160–9390 cm�1 region. J Mol Spectrosc 1982;94:1–27.
[46] Toth RA, Gupta VD, Brault JW. Line positions and strengths of HDOin the 2400–3300 cm�1 region. Appl Opt 1982;21:3337–45.
[47] Guelachvili G. Experimental Doppler-limited spectra of then2�bands of H2
16O, H217O, H2
18O, and HDO by Fourier-transformspectroscopy—secondary wave-number standards between 1066and 2296 cm�1. J Opt Soc Am 1983;2:137–50.
[48] Toth RA, Brault JW. Line positions and strengths of lines inthe (0 0 1), (1 0 0), and (0 3 0) bands of HDO. Appl Opt 1983;22:908–926.
[49] Messer JK, De Lucia FC, Helminger P. Submillimeter spectroscopy ofthe major isotopes of water. J Mol Spectrosc 1984;105:139–55.
[50] Bykov AD, Makushkin YS, Serdyukov VI, Sinitsa LN, Ulenikov ON,Ushakova GA. The vibration–rotation HDO absorption spectrumbetween 8558 and 8774 cm�1. J Mol Spectrosc 1984;105:397–409.
[51] Johns JWC. High-resolution far-infrared (20–350-cm�1) spectra ofseveral isotopic species of H2O. J Opt Soc Am B 1985;2:1340–54.
[52] Flaud J-M, Camy-Peyret C, Mahmoudi A, Guelachvili G. The n2 bandof HD16O. Int J Infrared Millimeter Waves 1986;7:68–76.
[53] Devi VM, Benner DC, Rinsland CP, Smith MAH, Sidney BD. Diodelaser measurements of air and nitrogen broadening in the n2 bandsof HDO, H2
16O, and H218O. J Mol Spectrosc 1986;117:403–7.
[54] Baskakov OI, Alekseev VA, Alekseev EA, Polevoi BI. New submilli-meter rotational lines of water and its isotopes. Opt Spectrosc1987;63:1016–8.
[55] Ohshima T, Sasada H. 1:5-mm DFB semiconductor laser spectro-scopy of deuterated water. J Mol Spectrosc 1989;136:250–63.
[56] Bykov AD, Kapitanov VA, Kobtsev SM, Naumenko OV. Detection andanalysis of the 5n3 absorption band in HD16O. Atm Ocean Opt1990;3:133–41.
[57] Sasada H, Takeuchi S, Iritani M, Nakatani K. Semiconductor-laserheterodyne frequency measurements of 1:52mm molecular transi-tions. J Opt Soc Am B 1991;8:713–8.
[58] Rinsland CP, Smith MAH, Devi VM, Benner DC. Measurements ofLorentz-broadening coefficients and pressure-induced line shiftcoefficients in the n2 band of HD16O. J Mol Spectrosc 1991;150:640–6.
[59] Rinsland CP, Smith MAH, Devi VM, Benner DC. Measurement ofLorentz-broadening coefficients and pressure-induced line-shiftcoefficients in the n1 band of HD16O and the n3 band of D2
16O. J MolSpectrosc 1992;156:507–11.
[60] Toth RA. 2n2�n2 and 2n2 bands of H216O, H2
17O, and H218O: line
positions and strengths. J Opt Soc Am B 1993;10:1526–44.[61] Toth RA. HD16O, HD18O, and HD17O transition frequencies and
strengths in the n2 bands. J Mol Spectrosc 1993;162:20–40.[62] Goyette TM, Ferguson DW, De Lucia FC, Dutta JM, Jones CR. The
pressure broadening of HDO by O2, N2, H2, and He between 100 and600 K. J Mol Spectrosc 1993;162:366–74.
[63] Paso R, Horneman V-M. High-resolution rotational absorptionspectra of H2
16O, HD16O, and D216O between 110 and 500 cm�1.
J Opt Soc Am B 1995;12:1813–38.[64] Mellau G. ZH2OAES emission spectrum, P(H2O) = 16.6 Torr, L =
60 cm, T = 1160 K, 1997, Private communication.[65] Votava O, Fair JR, Plusquellic DF, Riedle E, Nesbitt DJ. High
resolution vibrational overtone studies of HOD and H2O withsingle mode, injection seeded ring optical parametric oscillators. JChem Phys 1997;107:8854–6.
[66] Toth RA. Measurement of HDO between 4719 and 5843 cm�1. J MolSpectrosc 1997;186:276–92.
[67] Toth RA. Line positions and strengths of HDO between 6000 and7700 cm�1. J Mol Spectrosc 1997;186:66–89.
[68] Lazarev VV, Petrova TM, Sinitsa LN, Zhu Q-S, Han J-X, Hao L-Y.Absorption spectrum of HD16O in 0:7mm region. Atm Ocean Opt1998;11:809–12.
[69] Fair JR, Votava O, Nesbitt DJ. OH stretch overtone spectroscopy andtransition dipole alignment of HOD. J Chem Phys 1998;108:72–80.
[70] Hu S-M, Lin H, He S-G, Cheng J, Zhu Q-S. Fourier-transform intra-cavity laser absorption spectroscopy of HOD VOD=5 overtone. PhysChem Chem Phys 1999;1:3727–30.
[71] Naumenko O, Bertseva E, Campargue A. The 4v(OH) absorptionspectrum of HDO. J Mol Spectrosc 1999;197:122–32.
[72] Toth RA. HDO and D2O low pressure, long path spectra in the600–3100 cm�1 region; I. HDO line positions and strengths. J MolSpectrosc 1999;195:73–97.
[73] Naumenko O, Campargue A. High-order resonance interactionsin HDO: analysis of the absorption spectrum in the 14 980–15 350 cm�1 spectral region. J Mol Spectrosc 2000;199:59–72.
[74] Campargue A, Bertseva E, Naumenko O. The absorption spectrum ofHDO in the 16 300–16 670 and 18 000–18 350 cm�1 spectralregions. J Mol Spectrosc 2000;204:94–105.
[75] Naumenko O, Bertseva E, Campargue A, Schwenke DW. Experi-mental and ab initio studies of the HDO absorption spectrum in the13 165–13 500 cm�1 spectral region. J Mol Spectrosc 2000;201:297–309.
[76] Siemsen KJ, Bernard JE, Madej AA, Marmet L. Absolute frequencymeasurement of an HDO absorption line near 1480 cm�1. J MolSpectrosc 2000;199:144–5.
[77] Hu S-M, Ulenikov ON, Onopenko GA, Bekhtereva ES, He S-G, WangX-H, et al. High-resolution ro-vibrational spectroscopy of HDO inthe region of 7600–8100 cm�1. J Mol Spectrosc 2000;203:228–34.
[78] Bertseva E, Naumenko O, Campargue A. The 5vOH overtonetransition of HDO. J Mol Spectrosc 2000;203:28–36.
[79] Wang X-H, He S-G, Hu S-M, Zheng J-J, Zhu Q-S. Analysis of the HDOabsorption spectrum between 9600–10 200 cm�1. Chin Phys2001;9:885–91.
[80] Jenouvrier A, Merienne MF, Carleer M, Colin R, Vandaele AC,Bernath PF, et al. The visible and near ultraviolet overtonespectrum of HOD. J Mol Spectrosc 2001;209:165–8.
[81] Ulenikov ON, Hu S-M, Bekhtereva ES, Onopenko GA, Wang XH, HeS-G, et al. High-resolution Fourier transform spectrum of HDO inthe region 6140–7040 cm�1. J Mol Spectrosc 2001;208:224–35.
[82] Parekunnel T, Bernath PF, Zobov NF, Shirin SV, Polyansky OL,Tennyson J. Emission spectrum of hot HDO in the 380–2190 cm�1
region. J Mol Spectrosc 2001;210:28–40.
J. Tennyson et al. / Journal of Quantitative Spectroscopy & Radiative Transfer 111 (2010) 2160–2184 2183
[83] Hu S-M, He S-G, Zheng J-J, Wang X-H, Ding Y, Zhu Q-S. High-resolution analysis of the v2+2v3 band of HDO. Chin Phys 2001;10:1021–7.
[84] Coheur P-F, Fally S, Carleer M, Clerbaux C, Colin R, Jenouvrier A,et al. New water vapor line parameters in the 26 000–13 000 cm�1
region. J Quant Spectrosc Radiat Transfer 2002;74:493–510.[85] Mikhailenko SN, Tyuterev VG, Starikov VI, Albert KK, Winnewisser
BP, Winnewisser M, et al. Water spectra in the region 4200–6250 cm�1; extended analysis of n1þn2, n2þn3, and 3n2 bands andconfirmation of highly excited states from flame spectra and fromatmospheric long-path observations. J Mol Spectrosc 2002;213:91–121.
[86] Janca A, Tereszchuk K, Bernath PF, Zobov NF, Shirin SV, PolyanskyOL, et al. Emission spectrum of hot HDO below 4000 cm�1. J MolSpectrosc 2003;219:132–5.
[87] Bertseva E, Naumenko OV, Campargue A. The absorption spectrumof HDO around 1:0mm by ICLAS-VECSEL. J Mol Spectrosc 2003;221:38–46.
[88] Merienne MF, Jenouvrier A, Hermans C, Vandaele AC, Carleer M,Clerbaux C, et al. Water vapor line parameters in the13 000–9250 cm�1 region. J Quant Spectrosc Radiat Transfer 2003;82:92–117.
[89] Naumenko OV, Hu SM, He S-G, Campargue A. Rovibrational analysisof the absorption spectrum of HDO between 10 110 and12 215 cm�1. Phys Chem Chem Phys 2004;6:910–8.
[90] Naumenko OV, Voronina S, Hu S-M. High resolution Fouriertransform spectrum of HDO in the 7500–8200 cm�1 region:revisited. J Mol Spectrosc 2004;227:151–7.
[91] Macko P, Romanini D, Mikhailenko SN, Naumenko OV, Kassi S,Jenouvrier A, et al. High sensitivity CW-cavity ring down spectro-scopy of water in the region of the 1:5mm atmospheric window.J Mol Spectrosc 2004;227:90–108.
[92] Tolchenov RN, Tennyson J. Water line parameters for weak lines inthe range 7400–9600 cm�1. J Mol Spectrosc 2005;231:23–7.
[93] Tolchenov RN, Zobov NF, Shirin SV, Polyansky OL, Tennyson J,Naumenko O, et al. Water vapor line assignments in the 9250–26 000 cm�1 frequency range. J Mol Spectrosc 2005;233:68–76.
[94] Bach M, Fally S, Coheur P-F, Carleer M, Jenouvrier A, Vandaele AC.Line parameters of HDO from high-resolution Fourier transformspectroscopy in the 11 500–23 000 cm�1 spectral region. J MolSpectrosc 2005;232:341–50.
[95] Ulenikov ON, Hu S-M, Bekhtereva ES, Zhu Q-S. High-resolution ro-vibrational spectroscopy of HDO in the region of 8900–9600 cm�1.J Mol Spectrosc 2005;231:57–65.
[96] Campargue A, Vasilenko I, Naumenko O. Intracavity laser absorp-tion spectroscopy of HDO between 11 645 and 12 330 cm�1. J MolSpectrosc 2005;234:216–27.
[97] Theule P, Callegari A, Rizzo TR, Muenter JS. Dipole moments of HDOin highly excited vibrational states measured by Stark inducedphotofragment quantum beat spectroscopy. J Chem Phys 2005;122:124312.
[98] Naumenko OV, Leshchishina O, Campargue A. High sensitivityabsorption spectroscopy of HDO by ICLAS-VeCSEL between 9100and 9640 cm�1. J Mol Spectrosc 2006;236:58–69.
[99] Joly L, Parvitte B, Zeninari V, Courtois D, Durry G. A spectroscopicstudy of water vapor isotopologues H2
16O, H218O and HDO using a
continuous wave DFB quantum cascade laser in the 6:7mm regionfor atmospheric applications. J Quant Spectrosc Radiat Transfer2006;102:129–38.
[100] Voronin BA, Naumenko OV, Tolchenov RN, Tennyson J, Fally S,Coheur P-F, et al. HDO absorption spectrum above 11 500 cm�1:assignment and dynamics. J Mol Spectrosc 2007;244:87–101.
[101] Jenouvrier A, Daumont L, Regalia-Jarlot L, Tyuterev VG, Carleer M,Vandaele AC, et al. Fourier transform measurements of watervapor line parameters in the 4200–6600 cm�1 region. J QuantSpectrosc Radiat Transfer 2007;105:326–55.
[102] Mazzotti F, Tolchenov RN, Campargue A. High sensitivity ICLAS ofH2
18O in the region of the second decade (11 520–12 810 cm�1).J Mol Spectrosc 2007;243:78–89.
[103] Mikhailenko SN, Wang L, Kassi S, Campargue A. Weak waterabsorption lines around 1.455 and 1:66mm by CW-CRDS. J MolSpectrosc 2007;244:170–8.
[104] Naumenko OV, Voronin BA, Mazzotti F, Tennyson J, Campargue A.Intracavity laser absorption spectroscopy of HDO between 12 145and 13 160 cm�1. J Mol Spectrosc 2008;248:122–33.
[105] Lisak D, Hodges JT. Low-uncertainty H2O line intensities for the930-nm region. J Mol Spectrosc 2008;249:6–13.
[106] Petrova TM, Sinitsa LN, Solodov AM. H2O lines shifts measure-ments in 1:06mm region. SPIE 2008;6936:93602.
[107] Tolchenov RN, Tennyson J. Water line parameters from refittedspectra constrained by empirical upper state levels: study of the9500–14 500 cm�1 region. J Quant Spectrosc Radiat Transfer2008;109:559–68.
[108] Liu A, Naumenko O, Kassi S, Campargue A. High sensitivity CW-CRDS of 18O enriched water near 1:6mm. J Quant Spectrosc RadiatTransfer 2009;110:1781–800.
[109] Naumenko OV, Beguier S, Leshchishina OM, Campargue A. ICLASof HDO between 13 020 and 14 115 cm�1. J Quant SpectroscRadiat Transfer 2010;111:36–44.
[110] Lovas FJ. Microwave spectral tables. II. Triatomic molecules. J PhysChem Ref Data 1978;7:1445–750.
[111] Stevenson MJ, Townes CH. Quadrupole moment of 17O. Phys Rev1957;107:635–7.
[112] Zelinger Z, Barret B, Kubat P, Ricaud P, Attie J-L, Flochmoen EL,et al. Observation of HD18O, CH3OH and vibrationally-excitedN2O from Odin/SMR measurements. Mol Phys 2006;104:2815–20.
[113] Toth RA. Measurements of line positions and strengths of HD18Oand D2
18O in the 2500–4280 cm�1 region. J Mol Struct 2005;742:49–68.
[114] Mikhailenko SN, Tashkun SA, Putilova TA, Starikova EN, DaumontL, Jenouvrier A, et al. Critical evaluation of measured rotation–vibration transitions and an experimental dataset of energylevels of HD18O. J Quant Spectrosc Radiat Transfer 2009;110:597–608.
[115] Mikhailenko SN, Tashkun SA, Daumont L, Jenouvrier A, Fally S,Vandaele AC, et al. Line positions and energy levels of the18O substitutions from the HDO/D2O spectra between 5600 and8800 cm�1. J Quant Spectrosc Radiat Transfer, 2010, doi:10.1016/j.jqsrt.2010.01.028.
[116] Partridge H, Schwenke DW. The determination of an accurateisotope dependent potential energy surface for water fromextensive ab initio calculations and experimental data. J ChemPhys 1997;106:4618–39.
[117] Matyus E, Fabri C, Szidarovszky T, Czako G, Allen WD, Csaszar AG.Assigning quantum labels to variationally computed rotational–vibrational eigenstates. J Chem Phys, 2010, doi:10.1063/1.3451075.
[118] Voronin BA, Tolchenov RN, Tennyson J, Lugovskoy AA, YurchenkoSN. A high accuracy computed line list for the HDO molecule. MonNot R Astr Soc 2009;402:492–6.
[119] Yurchenko SN, Voronin BA, Tolchenov RN, Doss N, Naumenko OV,Thiel W, et al. Potential energy surface of HDO up to 25 000 cm�1.J Chem Phys 2008;128:044312.
[120] Lodi L, Tolchenov RN, Tennyson J, Lynas-Gray AE, Shirin SV, ZobovNF, et al. A high accuracy dipole surface for water. J Chem Phys2008;128:044304.
[121] Tennyson J, Kostin MA, Barletta P, Harris GJ, Ramanlal J, PolyanskyOL, et al. DVR3D: a program suite for the calculation of rotation–vibration spectra of triatomic molecules. Comput Phys Commun2004;163:85–116.
[122] Polyansky OL, Zobov NF, Viti S, Tennyson J, Bernath PF, Wallace L.K band spectrum of water in sunspots. Astrophys J 1997;489:L205–8.
[123] Bykov A, Naumenko O, Sinitsa L, Voronin B, Camy-Peyret J-MFC,Lanquetin RA. High-order resonances in the water molecule. J MolSpectrosc 2001;205:1–8.
[124] Freed C, Odonnell RG, Ross AHM. Absolute frequency calibrationof CO2 isotope laser transitions. IEEE Trans Instrum Meas 1976;25:431–7.
[125] Knight DJE, Edwards GJ, Pearce PR, Cross NR. Measurement of thefrequency of the 3:39-mm methane-stabilized laser to 73 parts in1011. IEEE Trans Instrum Meas 1980;29:257–64.
[126] Pollock CR, Petersen FR, Jennings DA, Wells JS, Maki AG. Absolutefrequency measurements of the 2–0 band at CO at 2:3mm;calibration standard frequencies from high resolution color centerlaser spectroscopy. J Mol Spectrosc 1983;99:357–68.
[127] Brown LR, Toth RA. Comparisons of the frequencies of NH3, CO2,H2O, N2O and CH4 as infrared calibration standards. J Opt Soc AmB 1985;2:842–56.
[128] Nakagawa K, deLabachelerie M, Awaji Y, Kourogi M. Accurateoptical frequency atlas of the 1:5mm bands of acetylene. J Opt SocAm B 1996;13:842–56.
[129] Falke S, Tiemann E, Lisdat C, Schnatz H, Grosche G. Transitionfrequencies of the D lines of 39K, 40K and 41K measured with afemtosecond laser frequency comb. Phys Rev A 2006;149:032503.
[130] Guelachvili G, Birk M, Borde CJ, Brault JW, Brown LR, Carli B, et al.High resolution wavenumber standards for the infrared. J MolSpectrosc 1996;177:164–79.
J. Tennyson et al. / Journal of Quantitative Spectroscopy & Radiative Transfer 111 (2010) 2160–21842184
[131] Maki A, Wells J. New wave-number calibration tables fromheterodyne frequency measurements. J Res Nat Inst Stand Technol1992;97:409–70.
[132] Rothman LS, Gamache RR, Goldman A, Brown LR, Toth RA, PickettHM, et al. The HITRAN database—1986 edition. Appl Opt1987;26:4058–97.
[133] Guelachvili G. Absolute wavenumbers and molecular constants ofthe fundamental bands of 12C16O, 12C17O, 12C18O, 13C16O, 13C18Oand of the 2-1 bands of 12C16O and 13C16O around 5mm by Fourierspectroscopy under vacuum. J Mol Spectrosc 1979;75:251–69.
[134] Sasada H, Yamada K. Calibration lines of HCN in the 1:5mm region.Appl Opt 1990;29:3535–47.
[135] Toth RA. Measurement of H216O line positions and strengths—11 610
to 12 861 cm�1. J Mol Spectrosc 1994;116:176–83.[136] Schermaul R, Brault JW, Canas AAD, Learner RCM, Polyansky OL,
Zobov NF, et al. Weak line water vapour spectrum in the regions13 200–15 000 cm�1. J Mol Spectrosc 2002;211:169–78.
[137] Schermaul R, Learner RCM, Newnham DA, Williams RG, Ballard J,Zobov NF, et al. The water vapour spectrum in the region8600–15 000 cm�1: experimental and theoretical studies for anew spectral line database i: laboratory measurements. J MolSpectrosc 2001;208:32–42.
[138] Liu AW, Du JH, Song KF, Wang L, Wan L, Hu SM. High-resolutionFourier-transform spectroscopy of 18O-enriched water moleculein the 1080–7800 cm�1 region. J Mol Spectrosc 2006;237:149–62.
[139] Messer JK, De Lucia FC, Helminger P. The pure rotational spectrumof water-vapor—a millimeter, submillimeter and far infraredanalysis. Int J Infrared Millimeter Waves 1983;4:505–39.
[140] Schwenke DW, Partridge H. Convergence testing of the analyticrepresentation of an ab initio dipole moment function for water:improved fitting yields improved intensities. J Chem Phys2000;113:6592–7.
[141] Rothman LS, Gordon IE, Barbe A, Benner DC, Bernath PF, Birk M,et al. The HITRAN 2008 molecular spectroscopic database. J QuantSpectrosc Radiat Transfer 2009;110:533–72.
[142] Rothman LS, Jacquemart D, Barbe A, Benner DC, Birk M, Brown LR,et al. The HITRAN 2004 molecular spectroscopic database. J QuantSpectrosc Radiat Transfer 2005;96:139–204.
[143] Pickett HM, Poynter RL, Cohen EA, Delitsky ML, Pearson JC, MullerHSP. Submillimeter, millimeter, and microwave spectral linecatalog. J Quant Spectrosc Radiat Transfer 1998;60:883–90.
[144] Toth RA. SISAM database /http://mark4sun.jpl.nasa.govS, 2007.[145] JPL catalog. URL /http://spec.jpl.nasa.gov/ftp/pub/catalog/catdir.
htmlS.[146] Lodi L, Tennyson J. A linelist of allowed and forbidden rotational
transitions for water. J Quant Spectrosc Radiat Transfer2008;109:1219–33.
[147] Lisak D, Havey DK, Hodges JT. Spectroscopic line parameters ofwater vapor for rotation–vibration transitions near 7180 cm�1.Phys Rev A 2009;79:052507.
[148] Bykov AD, Fazliev AZ, Filippov NN, Kozodoev AV, Privezentsev AI,Sinitsa LN, et al. Distributed information system on atmosphericspectroscopy. Geophysical Research Abstracts, vol. 9, 01906, SRef-ID: 1607-7962/gra/EGU2007-A-01906, 2007.
[149] Csaszar AG, Fazliev AZ, Tennyson J. W@DIS—Prototype informationsystem for systematization of spectral data of water. In: Abstracts ofthe twentieth colloquium on high resolution molecular spectroscopy,Dijon, France /http://vesta.u-bourgogne.fr/hrms/S, 2007.
[150] Guelachvili G, Rao KN. Handbook of infrared standards. Orlando,FL: Academic Press; 1986.
[151] Puzzarini C, Cazzoli G, Harding ME, Vazquez J, Gauss J. A newexperimental absolute nuclear magnetic shielding scale foroxygen based on the rotational hyperfine structure of H2
17O.J Chem Phys 2009;131:234304.
Related Documents


