IUFRO 3.08.00 Small-Scale Forestry Conference 2012: Science for Solutions 24-27 September 2012 Amherst, Massachusetts USA CONFERENCE PROCEEDINGS

Welcome message from author
This document is posted to help you gain knowledge. Please leave a comment to let me know what you think about it! Share it to your friends and learn new things together.
Transcript

IUFRO 3.08.00 Small-Scale Forestry Conference 2012: Science for Solutions
24-27 September 2012
Amherst, Massachusetts USA
CONFERENCE PROCEEDINGS

IUFRO 3.08.00 Small-Scale Forestry Conference 2012: Science for Solutions
24-27 September 2012 Amherst, Massachusetts USA
http://iufrossf2012.org/
Coordinated by the Family Forest Research Center(www.familyforestresearchcenter.org) – a joint project between
the USDA Forest Service and the University of Massachusetts Amherst
Conference Sponsors
CONFERENCE PROCEEDINGS
Designed and Edited by Spencer R. Meyer
Cover ImageThis word cloud represents the nearly 150,000 words contained in this document. The larger
the relative size of the word, the more prominently the word appears in this proceedings.

2012 Conference Proceedings | iii
Table of ContentsAcknowledgements viPreface viiConference Papers (Listed alphabetically by last name of first author) 1
Public Preferences and Values for Ecological Goods and Services in a Northern New Brunswick Watershed 3
Tonia Anderson, Van Lantz, Wolfgang Haider, Ryan Trenholm, Monica McKendy, and Tom Beckley
The time is right for a renaissance in Southern Pine agroforestry:Bringing Back Grazing and longleaf Pine 11
Rebecca J. Barlow, Janice F. Dyer, John S. Kush, and John C. Gilbert
Opportunities for Development of local Forest Markets: The Case of amish Furniture Manufacturing 16
Matt Bumgardner, Gary Graham and Charles Goebel
Factors affecting adoption of agroforestry-Based land Management Practice: a Case of Dhanusha District Nepal 20
Arun Dhakal, Geoff Cockfield and Tek Narayan Maraseni
Using GiS to Benefit Family Forests: it’s More Than You Think 33John C. Gilbert, John S. Kush, and Rebecca J. Barlow,
The Driftless Forest Network (Wi, USa): innovation, Complexity, and Evaluation in a regional landowner Engagement initiative 38
Jerry Greenberg, Alanna Koshollek, and Mark Rickenbach*
ash Management for Private Forest landowners: Using a Delphi Process 45Angela Gupta and Julie Meidtke
Social acceptability of Biofuels among Small-Scale Forest landowners in the U.S. South 51Sarah Hitchner and John Schelhas
trialogical learning – a Concept for Enhancing interactive Forest Planning 58Teppo Hujala, Henna Höglund, Lauri Mehtätalo and Jouni Pykäläinen
Collective actions by Community Forest User Groups in Conserving Forest to halt Deforestation and Degradation by Controlling Forest Fire: linking Science to Practice, a rEDD+ Case Study of Three Watersheds in Nepal 64
Seema Karki, Sudip Pradhan, Bhaskar Singh Karky, Rajan Kotru
Sustainable Forest Management of Old Cooperatives in Bavaria 72Marc Koch and Anika Gaggermeier
District Council Members and the Organizational renewal of Forest Owners’ associations 76Thomas Kronholm and Dianne Staal Wästerlund
iv | IUFRO 3.08.00 Small-Scale Forestry
longleaf Pine: Providing Opportunities for landowners Beyond Belief 83John S. Kush, John C. Gilbert and Rebecca J. Barlow
The Potential for Using agroforests for Bioenergy Production in the lower Mississippi alluvial Valley 88
Hal O. Liechty, Michael Blazier, Matthew Pelkki, Don White Jr. and Zachary Robinson
Do You know Your Neighbors? results of a Cross-Boundary Survey in West Virginia, USa 93David W. McGill and Megan E. McCuen
informing Forest Policy With a Snapshot of New Brunswick Non-industrial Forest Owner’s attitudes, Behavior, Stewardship and Future Prospects 99
Solange Nadeau and Thomas M. Beckley
The availability of Woody Biomass for Energy- a Social Perspective from Non-industrial Private Forest landowners in the U.S. Great lakes region 106
Lana L. Narine and Francisco X. Aguilar
towards Commercially Oriented Community Forestry Management: Coping With Economic Globalisation and Commercialisation 114
Ani Adiwinata Nawir
adoption of heat-led Bioenergy Systems in rural Eastern Oregon 124Meagan L. Nuss and John C. Bliss
The Meaning of Forest Possession for Small-Scale Owners in Japan: how to Get and Why to keep the Forest? 131
Ikuo Ota
in Competition: teak Smallholders in Java, indonesia 138Aulia Perdanaand James M. Roshetko
Understanding Forest Owners’ Behaviour and Values to Encourage Cross-Boundary Cooperation in Estonia 144
Priit Põllumäe and Henn Korjus
Conversational Versus Computer-aided Forest Planning Service 149Jouni Pykäläinen and Teppo Hujala
Sustaining Forested landscapes in the long term: knitting together Stakeholder Support in the Development of a regional Conservation Plan and toolkit for the rensselaer Plateau 154
Rachel Riemann and Jim Bonesteel
Smallholder teak Systems on Java, indonesia, income for Families, timber for industry 162James M Roshetko, Agus Astho, Dede Rohadi, Nurin Widyani, Gerhard S Manurung, Anies Fauzi, and Purnomo Sumardamto
Exploring Variations in landowners’ Social Networks: The Effect of harvesting activity, resource Professionals, and Ownership Size 168
Tatyana B. Ruseva, Tom Evans, and Burnell C. Fischer
2012 Conference Proceedings | v
The influence of the household and Farm attributes on adoption of Smallholder timber Production Systems in the Gunungkidul region, indonesia 176
Gerhard Sabastian, Peter Kanowski, Digby Race, Emlyn Williams, James Roshetko
increasing role of local associations in Providing Extension Services to Private Forest Owners 182
Agnese Trojanovska and Lelde Vilkriste
Economic and Behavioural Factors Motivating Private afforestation Decisions in ireland 189Herath Vidyaratne, Mary Ryan, Stephen O Neill, Nuala Ni Fhlatharta and Srinivas Raghavendra
Enabling Small Scale Forestry in Venezuela:taking action at the local Scale 196Emilio Vilanova, Hirma Ramírez-Ángulo, Gustavo Ramírez, Armando Torres-Lezama
What to Put at the Basis of Forest Extension – Forest Owner Needs Or Proactive approach? 204
Lelde Vilkriste
Potential for Forest-Based Bioenergy Production for Small and Medium Forest Owners in the Southeast USa 211
Richard P. Vlosky, Michael A. Blazier, Roger Smithart, Glenn Hughes, Paul Darby, Dek Terrell
Study on the Domestication of lesser known tropical Species Neolamarckia Cadamba among the Small to Medium Scale Forest Owners in Malaysia 215
Ahmad Zuhaidi Yahya, Hashim, M. N., Sarifah, K. and Norhazaedawati, B.
Developing an asynchronous Online Education Program for Small Forest landowners 221Kevin W. Zobrist
vi | IUFRO 3.08.00 Small-Scale Forestry
Acknowledgements
Coordinating CommitteeBrett J. Butler (Conference Co-Chair), USDA Forest ServiceJaketon H. Hewes, Family Forest Research CenterDavid B. Kittredge (Conference Co-Chair), University of MassachusettsJessica Leahy, University of MaineStephanie Snyder, USDA Forest Service
Science CommitteeThomas Beckley, University of New BrunswickA. Paige Fischer, USDA Forest ServiceDavid B. Kittredge, University of Massachusetts (Science Committee Co-Chair)John Herbohn, University of QueenslandTeppo Hujala, Finnish Forest Research Institute Jessica Leahy, University of Maine (Science Committee Co-Chair)Gun Lidestav, Swedish University of Agricultural SciencesIkuo Ota, Ehime University
Proceedings Editor Spencer R. Meyer, University of Maine
Special ThanksPaul Catanzaro, Tyler Van Fleet, Mount Grace Land Conservation Trust, Red Apple Farm, and Harvard Forest’s Fisher Museum
Recommended Citation Spencer R. Meyer (editor). 2012. IUFRO Small-Scale Forestry Conference 2012: Science for Solutions Conference Proceedings. 24-27 September 2012, Amherst, Massachusetts USA. 227 p.
2012 Conference Proceedings | vii
Preface
From Science to Solutions: Solving Small-Scale Forestry IssuesFrom urbanization to wildfires to global climate change, the world is facing unprecedented challenges to the sustainable stewardship of its forested resources. Now, more than ever, society needs solutions that can help mitigate and avoid the threats facing forests. In many parts of the world, extensive forested landscapes have been divided into numerous small ownerships. Forest ecosystem pattern and function occur at broader scales, but this small-scale ownership phenomenon introduces unique constraints and considerations for conservation and management. Most, if not all, of the challenges have a human component and people, especially those who own or manage the resource, will need to be part of the solution. The 2012 IUFRO Small-scale Forestry Conference focused on the special issues facing small-scale forests around the world and the solutions to these problems that can benefit landowners, society, and the natural environment.
Papers presented at the conference covered a wide range of topics including:
Agroforestry• Attitudes & Behaviors• Bioenergy• Carbon• Community forestry• Enterprise development• Forest owners associations• Methods• Outreach & Communications • Policies & Programs• Social networks• Timber and non-timber forest products•
This proceedings provides an opportunity to further share the information presented at this conference.
Brett J. Butler Dave B. Kittredge Conference Co-Chairs


2012 Conference Proceedings | 1
Conference Papers(Listed alphabetically by last name of first author)

2012 Conference Proceedings | 3
Introduction
Healthy watersheds provide valuable ecological goods and services (EG&S) to Canadian communities, including the supply and purification of fresh water and provision of wildlife habitat, among others (Postel and Thompson 2005; Gagnon 2005). Because these EG&S lack well-established property rights and lie outside the traditional domain of commercial markets, they are often under-valued and consequently under-protected as they do not enter the land manager’s or politician’s decision-making processes (Postel and Thompson 2005).
With continual pressure for intensified land-use and urban development, watershed EG&S in many Canadian communities are being degraded, lost, or both; some perhaps for good (Olewiler 2004). The Little River water-shed (LRW), located in the heart of New Brunswick’s potato belt in eastern Canada is no exception. This watershed has experienced increasing levels of soil erosion, sedimentation, and nutrient loading which has contributed to a decline in soil and water quality (Chow 2007). To-date, there has been no evaluation of the social or economic implications of this degradation. Non-profit organizations have emphasized the need to value EG&S in this watershed and emphasize their importance to policy-makers to ensure they are not lost (Daigle 2012).
The purpose of this study was to: (i) assess how the general public perceives the rights and responsibilities of private landowners in managing EG&S’ in the Little River watershed (LRW) in northern New Brunswick; and (ii) quantify the benefits associated with EG&S improve-ments in the Little River watershed using the choice experiment method (CEM).
Several studies have used the CEM to value specific watershed EG&S including improved biodiversity (Birol et al. 2009; Birol and Cox 2007), improved soil conserva-tion (Colombo et al. 2005; Hanley et al. 2006), improved wildlife habitat (Christie et al. 2006; Jacobsen et al. 2008), and improved water quality (Smyth et al. 2009; Birol et al. 2009) amongst others.
The Little River watershed
The Little River watershed is approximately 380 km². It is located just north of Grand Falls, New Brunswick. The area is dominated by forests which represent 85% of the land base. The remaining 15% is dominated by agricul-ture which is mainly potato farming. The topography of the watershed is designated as having rolling slopes, ranging from 2% to 9%, but sometimes having inclines up to 15%.The average yearly temperature is approxi-mately 3.5 degrees Celsius and average precipitation is just over 1100 mm per year. Heavy rainstorms in the summer months, and rapid snow melts during spring thaw are contributing to accelerated soil erosion of up to 20 tons per hectare per year (Chow 2007).
It is estimated that much of the productive land in the watershed is experiencing excessive or unsustainable soil erosion. Although landowners are aware of the need to implement conservation practices, market condi-tions, little technical support and unfavourable short term economics make it difficult to do so. According to Service New Brunswick data (2012) and Statistics Canada (2006) Census Division data, there are an esti-mated 160 famers, 547 woodlot owners, and 16,085 people living in, or around the Little River Watershed boundary.
Public Preferences and Values for Ecological Goods and Services in a Northern New Brunswick WatershedTonia Anderson1, Van Lantz2, Wolfgang Haider3, Ryan Trenholm4, Monica McKendy5,
and Tom Beckley6
1 University of New Brunswick, P.O. Box 4400, Fredericton, NB, Canada, E3B 5A3, [email protected] University of New Brunswick, P.O. Box 4400, Fredericton, NB, Canada, E3B 5A3, [email protected] Simon Fraser University, 8888 University Drive, Burnaby, B.C. Canada V5A 1S6, [email protected] Simon Fraser University, 8888 University Drive, Burnaby, B.C. Canada V5A 1S6, [email protected] University of New Brunswick, P.O. Box 4400, Fredericton, NB, Canada, E3B 5A3, [email protected] University of New Brunswick, P.O. Box 4400, Fredericton, NB, Canada, E3B 5A3, [email protected]
Keywords: choice experiment, latent class, ordered logit, willingness to pay, water quality, wildlife habitat
4 | IUFRO 3.08.00 Small-Scale Forestry
Public Preferences and Values for Ecological Goods and Services in a Northern New Brunswick Watershed
Methods
Survey design and Implementation
The objectives of this study were to evaluate how the public perceives the landowner’s role in environmental stewardship of the Little River watershed and estimate their WTP for environmental improvements. The survey was structured into five sections. The first section included questions related to the respondent’s asso-ciation with the Little River watershed. The second and third sections included questions about the respondent’s perspective on landowner rights and responsibilities for managing EG&S within the Little River watershed, as well as their perspective on the current and future state of the watershed. Questions were asked using a Likert scale from strongly agree to strongly disagree, as well as “don’t know”.
The fourth section included the CE and follow-up protest questions. The selection of attributes was developed through a review of the literature (i.e., Christie et al. 2006; Colombo et al. 2005; 2006; Jacobsen et al. 2008) and refined through focus groups with the general public and
watershed officials. The attributes included in the choice experiment were: (i) water quality; (ii) wildlife habitat; (iii) landowner income; and (iv) cost. The selected attri-bute levels were defined through GIS mapping of legis-
Attribute Definition LevelsWildlife Habitat
- Increase in the % of land that is protected to support wildlife in the region.
5%*, 15%, 25%
Water Quality
- Frequency of threats to water quality.
Often*, Sometimes, Rarely
Farm/Woodlot Income
- % of income reduced by taking land out of production to support environmental programs.
0%*, -10%, -20%
Income Tax (Cdn $)
- Increase in income tax for the next 10 years,
0*, 25, 50, 75, 100, 150, 200
Table 1. Attribute and Attribute levels used in the study (repre-sents status quo levels).
Figure 1. Example of a choice set.
2012 Conference Proceedings | 5
Anderson et al.
lated watercourse buffers and protected natural areas in the watershed (wildlife habitat), the Canadian Council of Ministers of the Environment Water Quality Index (CCME WQI; water quality), and speaking with local farmers and watershed officials (landowner income and cost). Landowner income was included to create a more realistic scenario for respondents as this attribute may need to be reduced in order to improve EG&S in the watershed. Specifically, landowners may need to take land out of production or invest more money on erosion control structures, etc. in an effort to protect water quality and wildlife habitat. The attribute levels described the current (status quo) and likely future condi-tions of the LRW in ten years with and without environ-mental programs being put into place. The attributes and attribute levels are defined in Table 1(Respondents were given an example choice set where attributes and attribute levels were explained).
In each choice set, respondents were asked to choose 1 out of 3 program alternatives (see Figure 1). Under each program, the attributes varied randomly within their range. Respondents were also asked a number of follow-up questions in order to identify possible protest bids. For example, if the respondent chose “Program A”, they were asked why they chose that response, with choices being “The tax amount was too high”, “I don’t have enough information”, and “I don’t trust the govern-ment”. The fifth section of the survey collected socio-economic characteristics of respondents including age, gender, educational level, and household income.
The questionnaire was administered through a mail survey to 800 randomly selected households in Census Subdivisions that intersect with the Little River water-shed boundary. The survey was implemented according
to a modified Tailored Design (Dillman, 2000). Respon-dents were first contacted by a third party telemarking company in June 2011 asking them if they would be willing to participate in the mail survey. If they agreed, a survey was mailed in late June with a cover letter outlining the intent of the survey and the importance of the responses. The respondent was then asked to complete the survey in full and return it in the pre-paid envelope provided. A reminder card and a second mail-out followed approximately two to four weeks after the first mail-out, respectively.
data Analysis
The general public’s responses regarding landowner rights and responsibilities of landowners for EG&S management were analyzed using an ordered logistic model that accounted for the effect of socio-demo-graphic characteristics (such as age and education) on responses. The model follows maximum likelihood estimation (Ananth and Kleinbaum 1997; Martinez-Espi-neira and Hallstrom 2009).
Responses to the choice experiment questions were analyzed using a Latent Class (LC) model whereby the marginal rate of substitution (MRS) was used to find an implicit price for each attribute. This expresses the marginal willingness-to-pay for a discrete change in each attribute level. Using this information, compensating surplus (i.e., total social benefits) for different program scenarios associated with multiple changes in attribute levels were found (Colombo, et al. 2005; Pearce et al. 2006). LC was used because it accounts for preference
Table 2. Results of ordinal regression analysis.
Variable
Too much gov’t regulation
Sensitive Areas on private land
whatever they like on their land
Protect wetlands
Protect wildlife habitat
Use of fertilizer
Clear cutting
Use of pesticides
High_School 0.420* -0.068 0.499** -0.182 .178 -.030 -.102 -.092Income<$50,000 0.376* .592** 0.398* 0.495** .309 .154 .406* .423*Rural 0.111 -0.423* 0.195 -0.452** -.287 -.524** -.182 -.199Female 0.420* 0.141 0.387* 0.032 -.262 .223 .027 .279Age -0.274 0.081 -0.446** 0.547** -.104 .063 .201 .085Full_Time -0.708 0.617 -1.615*** -0.464 -.255 -.106 -.018 -1.002**Part_time -0.261 0.996* -1.157** -0.441 .385 .121 .494 -.565Retired -0.499 0.841* -1.570*** -0.431 .138 .532 .340 -.355Producer 0.390 -2.322*** 0.710 -0.600 -.812* -1.372** -.503 -1.074**Passive_Rec -0.278 0.308 -0.322 -0.163 .062 -.004 .036 -.057Motor_Rec 0.500** 0.003 0.026 -0.013 -.038 -.242 .191 -.314Hunt_Fish -0.019 0.437* 0.210 0.324 .438* .476** .281 .679**Lives_within -0.105 -0.425* -0.143 0.231 .304 .257 .142 .031
6 | IUFRO 3.08.00 Small-Scale Forestry
Public Preferences and Values for Ecological Goods and Services in a Northern New Brunswick Watershed
Table 3. Parameter estimates for a 3 class model of choice attributes (No Repeats, No Protests).
Attribute Level
Class 1 Class 2 Class 3
Parameter z-score Parameter z-score Parameter z-scoreASC 2.5423*** 7.9138 -1.006*** -7.3221 2.2546 0.3727Wildlife habitat +5% -0.5784** -2.5686 0.3448** 2.2206 -0.8554*** -4.4172
+15% 0.2174 1.5048 0.0571 0.4115 0.6435*** 4.4777+25% 0.361* 1.8239 -0.4019** -2.4373 0.2119 1.4407
Water quality often -2.7531*** -7.4725 0.1455 0.936 -0.662*** -3.3181sometimes 0.662*** 3.5661 -0.0004 -0.0029 0.1875 1.216rarely 2.0911*** 7.0967 -0.1451 -1.0015 0.4745*** 2.9622
Farmer income 0% 0.1866** 2.2274 0.1866** 2.2274 0.1866** 2.2274-10% 0.1476* 1.9406 0.1476* 1.9406 0.1476* 1.9406-20% -0.3342*** -3.9114 -0.3342*** -3.9114 -0.3342*** -3.9114
Income tax Linear -0.4576*** -10.0722 -0.4576*** -10.0722 -0.4576*** -10.0722Quadratic -0.151*** -2.7879 0.0553 1.1727 0.0394 0.9748
Parameter Estimates for a 3 class model of classesIntercept -0.3461 -0.2571 0.921 0.9348 -0.5749 -0.3781Covariates:
Huntinga -1.1465* -1.6361 -0.3927 -0.8648 1.5392*** 3.1948Bird_watchingb -1.1631* -1.6767 -0.2038 -0.3801 1.3669*** 2.6337Accountc 0.1524 0.7841 -0.3221** -2.4528 0.1697 0.8078Educd 0.6706 2.2554 -0.5096** -2.2256 -0.161 -0.4994Agee -0.2329 -0.8835 0.416* 1.8469 -0.1831 -0.5539Govtf -0.3571 -2.7351 0.2545** 2.4321 0.1025 0.7337
Fit StatisticsR²(0) 0.5829 0.1853 0.297
Class Membershipn 71 65 60Notes:1 *, **, and *** denote that the parameter is significantly different from zero at the 10%, 5%, and 1% level, respectivelya 1 if the respondent in the past 12 months had participated in any hunting within the LRW; b 1 if the respondent in the past 12 months had participated in any bird watching within the LRW; c Likert scale (strongly agree – strongly disagree, and don’t know) “Landowners have a responsibility to take into account the values and interests of society at large when making decisions about their land”; d Education level (scale) 1=elementary school, 2=high school, 3=post-secondary, 4=master/PhDe Age of respondent (scale) 1= 1 thru 30, 2=31 thru 50, 3= 51 thru 75, 4=76 thru 98; f Likert scale (strongly agree – strongly disagree, and don’t know) “There is too much government regulation of private land use”
2012 Conference Proceedings | 7
Anderson et al.
heterogeneity across different groups of participants (Colombo et al. 2005; Shen and Saijo 2009; Milon and Scrogin 2006).
Results
Out of the 800 surveys delivered, 386 were returned (44% response rate). All of the 386 surveys were used in the ordered logistic analysis. However, for the choice experiment analysis, 117 responses were removed because they did not respond to the choice experiment questions, or they answered systematically, giving a 34% response rate. Systematic answers were identified if the respon-dent chose the same program for all six choice sets. Another 73 were identified as protest votes. This left 196 people who completed the choice experiment success-fully, reducing the response rate to 24.5%. The sample was representative of the population in terms of house-hold income, education level, immigration status, and employment status (Statistics Canada 2007). Average age was 56 years old. The youngest respondent was 23, and the oldest was 88. Men were slightly overrep-resented (61%) where the total population is 49%.
Public Percepetion Results
A number of statements were analyzed using ordered logistic analysis, based on socioeconomic variables. These statements were chosen to assess the public’s perceptions of the role that private landowners and the government should have in managing private land, to better understand if the public feels landowners should be more accountable to the community as a whole when making decisions about their land use, and to estimate any general biases the public has towards specific best management practices.
Statements were first analyzed by looking at response distribution from strongly disagree to strongly agree to ensure they passed the test of parallel lines. If the data does not pass the test of parallel lines a simpler model is needed. This occurs when the data does not meet the proportional odds assumption: the notion that the rela-
tionship between all categories is statistically the same. The statement with regards to the use of soil erosion structures was the only one that did not pass. This is because over 93% of respondents agreed to the state-ment that landowners should be implementing these structures on their land.
Table 2. Represents the ordered logistic results for each statement. The results indicate that based on the prede-termined socioeconomic variables, certain individual characteristics of respondents are determining factors when answering the public perception section of the survey. Respondents with a high school education or less, with an income level of $50,000 or less, or are female, are all more likely to agree to the statement “there is too much government regulation on privately owned land” and the statement “landowners have the right to do whatever they like with their land without regard for their neighbours”. However, respondents with a household income less than $50,000, who are retired or working part-time (compared to being unemployed), or who hunt or fish in the watershed are more likely to agree that sensitive areas on private land should be protected from being altered or damaged. Even so, respondents who grew up in a rural area, live within the watershed boundary, or are farm or forestry producers are less likely to agree that sensitive areas should be protected on private land.
Farm and woodlot producers are less likely to agree to statements that reduce the use of pesticides and fertil-izers, as well as statements that require an increase in wildlife habitat protection. Respondents who are in a higher income bracket than $50,000 were also more likely to disagree with statements that concerned protecting wetlands, protecting woodlots from being cleared, as well as reducing the use of pesticides. Finally, recreationists in the watershed (i.e. respon-dents who indicated they hunt or fish in the watershed) were more likely to agree to preservation statements such as providing wildlife habitat and reducing the use of fertilizers and pesticides.
Table 4. Marginal willingness-to-pay estimates.
Scenario
Individual CS($/year/person for 10 years)
Aggregate CS($/year for 10 years)
Scenario 1 153.19 1,650,962.33Scenario 2 193.26 2,082,723.31Scenario 3 137.63 1,480,335.13
Table 5. Compensating Surplus (CS) for three possible water-shed restoration scenarios.
Attribute Level Class 1 Class 2 Class 3ASC $194.45 -$76.94 $172.45
Wildlife habitat +10% $60.87 -$22.01 $114.64 +20% $71.85 -$57.11 $81.63Water quality sometimes $261.21 -$11.16 $64.97 rarely $370.51 -$22.23 $86.93
Farmer income -10% -$2.98 -$2.98 -$2.98 -20% -$39.83 -$39.83 -$39.83
8 | IUFRO 3.08.00 Small-Scale Forestry
Public Preferences and Values for Ecological Goods and Services in a Northern New Brunswick Watershed
Choice Experiment Results
The choice data was examined using a Latent Class (LC) model. A three class model was proven to be the best fit for water quality, wildlife habitat, and quadratic tax attributes; however, landowner income and the linear tax attribute did not prove to be statistically different between classes The Wald (=) statistic was not significant at the 10% level. These two attributes were re-grouped into one class for the analysis. The adjusted R-squared (R^2(0)) ranged between 0.58 and 0.18, respectively. These results suggest that the model is a relatively good fit to the data, as Louviere (2000) argues that a pseudo R-squared should be expected to range between 0.2 and 0.4.
Table 3 represents the coefficient estimates produced by the three class model. All coefficient estimates were as expected for class one: utility increases as quality of an environmental attribute increases. Class two has a negative ASC implying there is a potential status quo bias where respondents do not want to move away from the current scenario (Adamowicz et al. 1998). As Adamo-wicz et al. (1998) state, there are numerous reasons for why this occurs. Respondents may find the choice task too complex; therefore they opt for no change at all, they may be uncertain about the tradeoffs they are willing to make, or they do not trust the government to actually implement their preferred option. Class three has dimin-ishing marginal returns for wildlife habitat because their utility decreases after a 10% increase from the status quo level. All respondents have decreasing utility for the landowner income attribute, but significant decreasing utility does not occur until income decreases by 20%.
To explain class determination, covariates were added to the model including: recreational activities the respon-dent participates in within the watershed, their perspec-tive of private landowner accountability to society at large, education level, age, and their perspective on the role of government regulation on privately owned land. Class one respondents (water-lovers) are more likely to have a higher education level, not participate in recreational activities in the watershed, and believe there should be more government regulation on privately owned land. Class two respondents (traditionalists) are more likely to believe there is too much government regulation on privately owned land, be older citizens with a lower education level, and believe landowners do not have to take into account the values and inter-ests of society at large when making decisions about their land. Class three respondents (recreationists) are more likely to participate in hunting or bird watching within watershed limits.
Table 4 shows willingness-to-pay (WTP) estimates, using a mean tax level (required for the quadratic term). These estimates suggest that the average respondent is WTP $50.39 per year over the next 10 years for a 10% increase in wildlife habitat, but only $32.54 for a 20%
increase. They are WTP $110.68 per year for 10 years to see water quality improve from often to sometimes threatened, and $153.25 to see it improve from often to rarely threatened. Respondents would also require $2.98 in compensation for their utility to remain constant if landowner income decreased by 10% and $39.83 if it decreases by 20%.
Results of the compensating surplus scenario analysis are shown in Table 5. As expected, the social benefits derived from environmental programs increases as environmental conditions improve for water quality. In scenario 1, water quality is sometimes threatened compared to the status quo level of often. The mean WTP per person for this scenario is $153.19 per year for 10 years. In scenario 2 water quality improves to rarely threatened, compared to often (all else is held constant between scenarios). The mean WTP per person for this scenario is $193.26 per year for 10 years. However, mean WTP decreases if the percentage of land used to support wildlife habitat increases from 5% to 25%. This is seen in scenario 3 where water quality remains at rarely threatened and wildlife habitat increases to 25%. Mean WTP per person is $137.36. This is due to decreasing marginal returns for wildlife habitat once habitat increases surpass 10%. In scenario 3 landowner income losses also drop to 20% in order to, hypotheti-cally, support such a strict environmental policy.
Individual welfare estimates can be aggregated to estimate the total WTP for environmental programs in the watershed. Based on Census Canada data, there are approximately 16,085 people living in Census Divisions that intersect the Little River Watershed boundary and 67% of respondents to the survey expressed a positive WTP. Accordingly, aggregate WTP varies between $1.4 and $2.1 million ((16,085*.67)*scenario $) per year for 10 years (see Table 5).
Discussion
The public perceptions analysis conducted indicates that certain socioeconomic variables do have an influence on respondent perceptions of private land management. The results suggest that there is an underlying distrust for the government, particularly for respondents with a high school education or less, along with respondents in the income bracket of $50,000 or less. These findings are consistent with the findings of Martinez-Espineira and Hallstrom (2009) that suggest that factors such as income can influence respondent’s attitudes in wildlife habitat preservation as part of woodlot management. Because of this, it would be beneficial if more was done to educate the public with regards to environmental stewardship. The findings also suggest producers are concerned about conservation programs that will inter-fere with productivity. Consequently, care must be taken
2012 Conference Proceedings | 9
Anderson et al.
to educate landowners of best management practices that not only aid in environmental protection, but also aid in landowner economics.
The results from the choice experiment indicate that a majority of respondents are prepared to pay some amount of money to improve water quality and protect wildlife habitat in the region. Overall, mean WTP per person for water quality improvements align with previous literature. Zander et al. (2010) found that resi-dents in Australia would be WTP between $162.00 and $238.00 to see water quality improvements in the Fitzroy River, Daly River, and Mitchell River. However, these estimates tend to be higher than those found in Colombo et al. (2006) who found estimates to range between $18.39 and $26.27 for water quality improvements from the status quo to “medium” and from medium to “high”, respectively, for residents in a South Australian water-shed. Discrepancies in these findings could be based on a number of reasons such as varying levels of current water conditions, socioeconomic status of the residents surveyed, and timing of survey implementation. The values estimated for wildlife habitat are consistent with previous literature where values range from $13.89 to $92.04 for habitat improvements (Christie et al. 2006; Jacobsen et al. 2008). The findings that there exists DMR are also consistent with other findings across Canada, where the public was willing to pay a higher amount to see habitat increase by 20% from the status quo, compared to a 30% increase (Angus 2012).
When comparing attribute WTP values, it is clear that the general public in the region values improved water quality more than wildlife habitat, although both have a positive WTP. Should the government decide to implement a program to improve these environmental services, money might be best spent on first improving water quality, then wildlife habitat, but only up to a 10% increase over base-line levels, due to DMR in wildlife habitat.
The compensating surplus analysis conducted for three different scenarios indicated public values ranging from $1.4 to $2.1 million per year over the next 10 years. This suggests that the government could implement an environmental program in which environmental services are improved, so long as the costs do not exceed $2 million per year.
Despite the fact of the positive WTP and CS estimates found in the LRW, it is important to note that there remain limitations to this study. The theoretical background encompassing choice modeling is founded on exam-ining trade-offs between attributes and depends wholly on respondent comprehension of the attributes involved in the model. The quality of the results is determined by how a respondent interpreted the attribute definitions, and if these definitions captured the principle of the good being valued. Because it was the general public surveyed, it was essential to define the attributes in a
way in which it would reduce their cognitive burden, but still capture the scientific accuracy that should encom-pass EG&S definitions. To ensure the quality of welfare estimates, balance between scientific accuracy and public comprehension is vital, and remains a limitation of all stated preference techniques.
Overall, the results of this study suggest residents of the Little River watershed and surrounding areas are inter-ested in seeing environmental improvements in water quality and wildlife habitat. Although concerns about landowner income decreases due to environmental programs exist, most believe a 10% decrease in land-owner income is acceptable to see other improvements in the watershed. The findings also suggest that there is still an underlying distrust of government intervention among some groups in the watershed. This analysis should provide policy makers with the tools necessary to put into place a conservation plan to protect some of our most valuable resources in the region.
References
Adamowicz, W., Boxall, P., Williams, M., Louviere, J. 1998. Stated preference approaches for measuring passive use values: choice experiments and contingent valuation. American Journal of Agricultural Economics, 80-1, 64-75.
Ananth, C. V., Kleinbaum d. 1997. Regression models for ordinal responses: a review of methods and applications. International Journal of Epidemiology, 26-6. A
Angus, d. 2012. Valuing Ecosystem Services in the Salmon River Watershed, British Columbia: A Choice Experiment Approach. MRM Thesis. School of Resource and Environ-mental Management, Simon Fraser University, Burnaby, BC.
Birol E., Cox V. 2007. Using choice experiments to design wetland management programmes: The case of Severn Estuary Wetland, UK. Journal of Environmental Planning and Management, 50-3, 363-380.
Birol, E., Hanley, N., Koundouri, P., Kountouris Y. 2009. Optimal management of wetlands: Quantifying trade-offs between flood risks, recreation, and biodiversity conserva-tion, Water Resource Research, 45, W11426.
Chow, L. 2007. Impacts of potato production on soil erosion and water quality in N.-B. Report presented at the Quebec/New Brunswick Technical Exchange Workshop, Grand Falls, NB.
Christie, M., Hanley, N., Warren, J., Murphy, K., Wright, R., Hyde, T. 2006. Valuing the diversity of biodiversity. Ecolog-ical Economics, 58, 304-317.
Colombo, S., Calatrava-Requena, J., Hanley, N. 2005. designing policy for reducing the off-farm effects of soil erosion using choice experiments. Journal of Agricultural Economics, 56-1, 81-95.
10 | IUFRO 3.08.00 Small-Scale Forestry
Public Preferences and Values for Ecological Goods and Services in a Northern New Brunswick Watershed
Colombo, S., Calatrava-Requena, J., Hanley, N. 2006. Analysing the social benefits of soil conservation measures using stated preference methods. Ecological Economics, 58, 850- 861.
daigle, J-L. 2012. Personal Communication, director, Eastern Canada Soil & Water Conservation Centre, Grand Falls, NB.
dillman dA. 2000. Mail and Internet Surveys: The Tailored design Method, New York: Wiley.
Fairchild, G. 2007. description of soil degradation problems in this region of N.-B. Report presented at the Quebec/New Brunswick Technical Exchange Workshop, Grand Falls, NB.
Gagnon, B. 2005. Remuneration for ecological goods and services produced by agriculture: elements for a Quebec analysis. Agri-Environmental Policy Branch, Agriculture Quebec, Quebec, QE.
Government of Canada. 2011. Black Brook Watershed - watershed evaluation of best panagement Practices. Retrieved October 2, 2011, from Agriculture and Agri-food Canada: http://www4.agr.gc.ca/AAFC-AAC/displayafficher.do?id=1298406 458612&lang=eng
Hanley, N., Wright, R. E., Alvarez-Farizo, B. 2006. Estimating the economic value of improvements in river ecology using choice experiments: an application to the water frame-work directive. Journal of Environmental Management, 78, 183-193.
Jacobsen, J. B., Boiesen, J. H., Thorsen, B. J., Strange, N. 2008. What’s in a name? The use of quantitative measures versus ‘Iconised’ species when valuing biodiversity. Environ. Resource Econ, 39, 247-263.
Louviere, J. J., Hensher, d.A. and Swait, J., 2000. Stated choice methods. Analysis and Applications University Press, Cambridge, UK.
Martinez-Espineria, R., Hallstrom, L. K., 2009. Attitudes towards wildlife habitat preservation in the management of private woodlots in Cape Breton. Human dimensions of Wildlife, 14, 265–277
Milon, W. J., Scrogin, d. 2006. Latent preferences and valuation of wetland ecosystem restoration. Ecological Economics, 56, 162-175.
Olewiler, N. 2004. The value of natural capital in settled areas of Canada. Published by ducks Unlimited Canada and the Nature Conservancy of Canada. 36 pp.
Postel, S. L., Thompson, B. H. 2005. Watershed protection: capturing the benefits of nature’s water supply services. Natural Resources Forum, 29, 98-108.
Shen, J., Saijo, T. 2009. Does an energy efficiency label alter consumers’ purchasing decisions? A latent class approach based on a stated choice experiment in Shanghai. Journal of Environmental Management, 90, 3561-3573.
Smyth, R. L., Watzin, M. C., Manning, R. E. 2009. Investigating public preferences for managing Lake Champlain using a choice experiment. Journal of Environmental Management, 90, 615-623.
Statistics Canada. 2007. 2006 community profiles. 2006 Census. Statistics Canada Catalogue no. 92-591-XWE. Ottawa. Released March 13, 2007.
Zander, K. K., Garnett, S. T., Straton, A. 2010. Trade-offs between development, culture and conservation-willing-ness to pay for tropical river management among urban Australians. Journal of Environmental Management, 91, 2519-2528.
2012 Conference Proceedings | 11
Introduction
As early as the 1500’s, cattle brought to the American Southwest by Spanish explorers, grazed the open prairie (Wahlenberg 1946). European settlers continued this practice as they moved westward in the late 1800’s, grazing cattle and sheep on the seemingly endless arid and semi-arid grasslands. Similarly, much of the forestland of the southeastern United States was grazed during this time with longleaf-slash pine forests making up much of the historical range for southern cattle
grazing (Wahlenberg 1946). It was here that piney-woods cattle were managed on open rangeland at a rate of about 2-4 hectares per head depending on time of year and forage type. Wahlenberg (1946) points out that although the majority of southern forest land-owners had little to no interest in livestock production, “In accordance with age-old custom, southern land-owners usually tolerate grazing on their forest lands by the livestock of numerous small famers. The typical forest range is open, no permits are required, no fees are charged, and usually no attempt is made to control fires
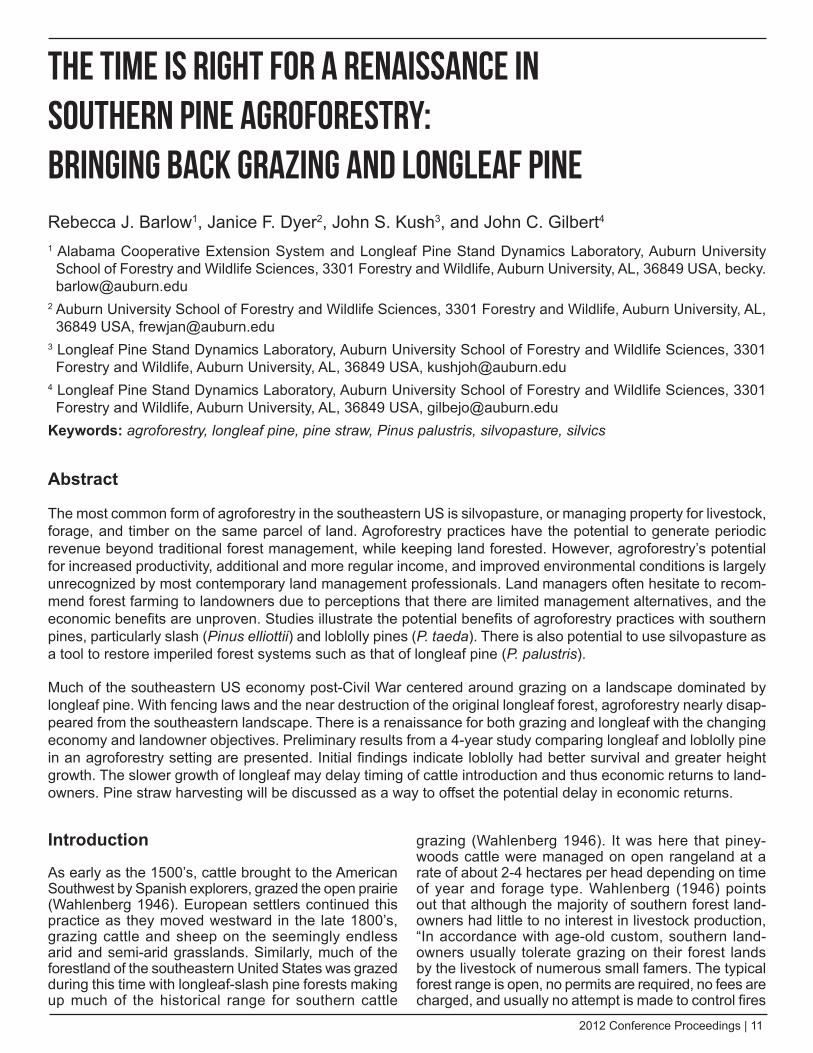
The Time Is Right for a Renaissance in Southern Pine Agroforestry: Bringing Back Grazing and longleaf PineRebecca J. Barlow1, Janice F. Dyer2, John S. Kush3, and John C. Gilbert4
1 Alabama Cooperative Extension System and Longleaf Pine Stand Dynamics Laboratory, Auburn University School of Forestry and Wildlife Sciences, 3301 Forestry and Wildlife, Auburn University, AL, 36849 USA, [email protected]
2 Auburn University School of Forestry and Wildlife Sciences, 3301 Forestry and Wildlife, Auburn University, AL, 36849 USA, [email protected]
3 Longleaf Pine Stand Dynamics Laboratory, Auburn University School of Forestry and Wildlife Sciences, 3301 Forestry and Wildlife, Auburn University, AL, 36849 USA, [email protected]
4 Longleaf Pine Stand Dynamics Laboratory, Auburn University School of Forestry and Wildlife Sciences, 3301 Forestry and Wildlife, Auburn University, AL, 36849 USA, [email protected]
Keywords: agroforestry, longleaf pine, pine straw, Pinus palustris, silvopasture, silvics
Abstract
The most common form of agroforestry in the southeastern US is silvopasture, or managing property for livestock, forage, and timber on the same parcel of land. Agroforestry practices have the potential to generate periodic revenue beyond traditional forest management, while keeping land forested. However, agroforestry’s potential for increased productivity, additional and more regular income, and improved environmental conditions is largely unrecognized by most contemporary land management professionals. Land managers often hesitate to recom-mend forest farming to landowners due to perceptions that there are limited management alternatives, and the economic benefits are unproven. Studies illustrate the potential benefits of agroforestry practices with southern pines, particularly slash (Pinus elliottii) and loblolly pines (P. taeda). There is also potential to use silvopasture as a tool to restore imperiled forest systems such as that of longleaf pine (P. palustris).
Much of the southeastern US economy post-Civil War centered around grazing on a landscape dominated by longleaf pine. With fencing laws and the near destruction of the original longleaf forest, agroforestry nearly disap-peared from the southeastern landscape. There is a renaissance for both grazing and longleaf with the changing economy and landowner objectives. Preliminary results from a 4-year study comparing longleaf and loblolly pine in an agroforestry setting are presented. Initial findings indicate loblolly had better survival and greater height growth. The slower growth of longleaf may delay timing of cattle introduction and thus economic returns to land-owners. Pine straw harvesting will be discussed as a way to offset the potential delay in economic returns.
12 | IUFRO 3.08.00 Small-Scale Forestry
The time is right for a renaissance in Southern pine agroforestry: Bringing back grazing and longleaf pine
set by stock owners”. Woodland grazing management helped limit unwanted understory brush and promoted native grasses in this forest system. At the same time, it promoted wildlife habitat for species such as Bobwhite quail (Colinus virginianus) (Wahlenberg 1946).
Fencing laws were enacted in the 1930’s and 1940’s which also coincided with the decline of longleaf pine forests. Although these laws were not enforced early on, as the practice of fencing increased and open range practices limited, longleaf pine forests were harvested and not regenerated - often turned into pasture or agri-cultural land (Wahlenberg 1946). If abandoned, lack of fire on the landscape caused fallow agricultural land to be reforested with faster growing southern pine species such as loblolly (Pinus taeda) and slash (P. elliottii). Today, longleaf pine is enjoying resurgence in popularity, with restoration efforts increasing across the range. A significant portion of this effort is concentrated on private lands were planting of old agricultural fields in longleaf pine as low-density plantings (<1480 trees per hectare) are often promoted or required by cost-share programs to improve wildlife habitat. History has shown that natural longleaf pine stands can be ideally suited for woodland grazing, but little is known about how planted longleaf silvopastures may respond to grazing.
Silvopasture is the practice of managing property for livestock, forage, and timber on the same parcel of land (USDA National Agroforestry Center 2008). Recognized benefits of this system include the production of high quality timber while also having improved cash flow opportunities from livestock and forage production. Addi-tional benefits of wildlife habitat, native grass produc-tion, and improved soil and water quality may also be achieved with proper management. To date, consider-able work has been completed to examine the suitability of southern pines such as loblolly (Grado and Husak 2004) and slash pine for use in agroforestry systems; however, few studies have included longleaf pine. Of importance is understanding when cattle can be intro-duced into the system.
As part of a silvopasture, cattle are a source of addi-tional income and cash flow that can be important to a private landowner. However, if introduced too early, live-stock may damage seedlings by browsing, trampling, or rubbing on seedlings (Hamilton 2008; Brauer et al. 2009). Therefore, it is usually recommended that on newly planted agroforestry sites, livestock grazing should be delayed for approximately 3 - 4 years depending on the tree species (Hamilton 2008). This translates to approximately 1.5-2.5 meters in height for most southern pines (Hamilton 2008). However, due to the character-istic ability of longleaf pine to remain in the “grass stage” for as long as 7-20 years, it is important that landowners understand the silvics of southern pine species and how differences may impact their land management deci-sions such as when to introduce cattle.
It is projected that the number of pine plantations on private lands will increase by approximately 5.6 million hectares by 2050 (Alig and Butler 2004). Small-scale landowners are expected to own almost half of those acres. In Alabama, one-fourth of the forestland is in plantations and 67 percent of the state’s forests are in family forest ownership (Hartsell and Johnson 2009). At the same time, small-scale private landowners do not think that they can make money from their forests, and so do not spend the resources to actively manage their property (Zhou 2010). They are often unaware of methods that may help them maximize productivity and economic returns. In addition, they are usually ignorant of the possibility that they can manage their lands to produce both timber and additional revenue generating products. There is also often reluctance on the part of land managers to promote agroforestry practices because they are unsure or unaware of the potential benefits. Reviving the practice of agroforestry on these lands provides promise for forest-dependent commu-nities such as those in the Black Belt across central Mississippi to Georgia that are usually poor and may be under-served by financial and technical assistance (Zekeri 1996). Of particular interest for Alabama land-owners is the management of longleaf pine in agro-forestry systems. Information is needed to examine the economic tradeoffs inherent in agroforestry/forest farming systems and what the potential benefits and costs are to private landowners. One of these potentially unexplored benefits is the production of pine straw.
Pine straw is a non-timber forest product that can be harvested to provide landowners with additional revenue without having to harvest their timber. Past studies have shown that depending on region of the country, land-owners may receive from $30 to $250 per hectare (Taylor and Foster 2004, Minogue et al. 2007). When surveyed in 2010, approximately 72% of Alabama landowners that responded stated that their property produced pine straw (Dyer 2012). Approximately 60% of those surveyed were at least slightly interested in pine straw production on their forestland. These same landowners expressed a wide range of values expected from pine straw produc-tion on their lands ($15 to $460 per hectare), with the majority expecting approximately $250/hectare (Dyer 2012).
Despite interest by private landowners, the pine straw market in Alabama is not well developed. Alabama retailers often express a preference for longleaf pine straw, which is sometimes purchased from over 200 miles away (Dyer 2012). Alabama landowners have not capitalized on this form of “forest farming” which is compatible with many land uses including timber production and silvopasture and should be considered as opportunity to offset costs associated with longleaf pine management.
2012 Conference Proceedings | 13
Barlow et al.
In 2008, the National Agroforestry Center collaborated with the Alabama Forestry Commission, Alabama Coop-erative Extension, Auburn University School of Forestry and Wildlife Sciences, and the USDA Forest Service to develop a demonstration forest in south Alabama to compare longleaf and loblolly silvopasture systems. Since that time, these plantings have been monitored for survival and growth to examine how differences may influence silvopasture establishment practices. The primary objective of the early stages of this project is to examine how early growth of longleaf and loblolly seed-lings may affect the timing of cattle introduction.
Methods
There is a need for agroforestry demonstrations in Alabama and a better understanding of how longleaf pine may function in these systems. In response to this need, a collaboration of the National Agroforestry Center, the Alabama Forestry Commission, and Auburn Univer-sity established an approximately 30 hectare longleaf and loblolly silvopasture demonstration site during the winter of 2008 on the E.A. Hauss Demonstration Forest near Atmore, Alabama USA.
The Alabama Forestry Commission’s E.A. Hauss Demonstration Forest (HDF) (formerly the E.A. Hauss Nursery) in Escambia County, Alabama offers a valuable opportunity for silvopasture research and extension among partners from the Alabama Forestry Commis-sion, Alabama A&M University, Auburn University, and the USDA Forest Service, among others. Commercial seedling production ceased on Hauss Nursery in 2006 and the mission was re-aligned in 2007 to reflect growing interest and demand for silvopasture and longleaf pine research and demonstration in Alabama.
Approximately 30 hectares of the former nursery site were established as longleaf or loblolly silvopasture systems. In the winter of 2008 twelve, approximately 2.5 hectare blocks were hand planted in double row sets on old fields that had been previously in tree seedling nursery produc-tion. Since these fallow fields were in pasture grasses such as Bermuda (Cynodon spp.) or Bahia (Paspalum notatum) at the time of planting, rows were scalped the month prior. Planting rows were established in an east/west orientation with 2.4 meters between the double rows. A 12-meter “alley” between double rows of trees was left for forage production. Seedlings were planted 2 meters apart within the scalped double rows.
The allocation of tree species to each block was assigned randomly. Initially, there were to be six blocks planted of each species, however, a miscommunication with the contractor resulted in the establishment of eight longleaf and four loblolly pine blocks. All seedlings were planted on the same day. Bare-root loblolly seedlings
were planted with a dibble bar while the containerized longleaf were planted using a plug tool. The resulting trees per hectare was approximately 865.
An initial herbicide treatment of imazapyr at a rate of 12.4 ounces/ha was machine applied in the summer of 2008. Morning glory (Ipomoea purpurea) was a primary source of competition for young seedlings and in some cases was removed from areas around seedlings by hand. Seedlings were examined for first and second year ground line diameter and height growth as well as survival.
During the fall of 2009 all 12 meter “alleys” within each of the blocks were treated with imazapic and glyphosate mix to prepare the site for forage establishment. The following spring (2010), in six blocks (two loblolly and four longleaf) exotic pasture such as Bermuda (Cynodon spp.) or Bahia (Paspalum notatum) were established and in six blocks (two loblolly and four longleaf) native warm season gamma grasses (Tripsacum dactyloides) were established.
Total tree heights and survival were sampled again during the winter/spring of 2011. All samples were collected using a line plot inventory of 0.04 ha circular plots which resulted in an approximately 17% cruise. At each plot, a tally of longleaf pines that were still in the grass-stage was also recorded. Third year height measurements were then compared to recommenda-tions for timing of livestock introduction or when seed-lings are approximately 1.5- 2.5 meters tall.
Results
First year seedling survival was variable for both loblolly and longleaf paddocks and ranged from 30-80 percent. Survival averaged 68 percent for all longleaf paddocks at the end of the first growing season and 78 percent for those planted with loblolly. Some longleaf paddocks with very low survival were replanted at the end of the first growing season to fill in gaps where mortality was highest. At the end of the third growing season, survival averaged about 55 percent across all stands regardless of tree species. One factor impacting survival on these sites was equipment operator error. When alleyways were mowed large groups of trees were also sometimes removed accidentally.
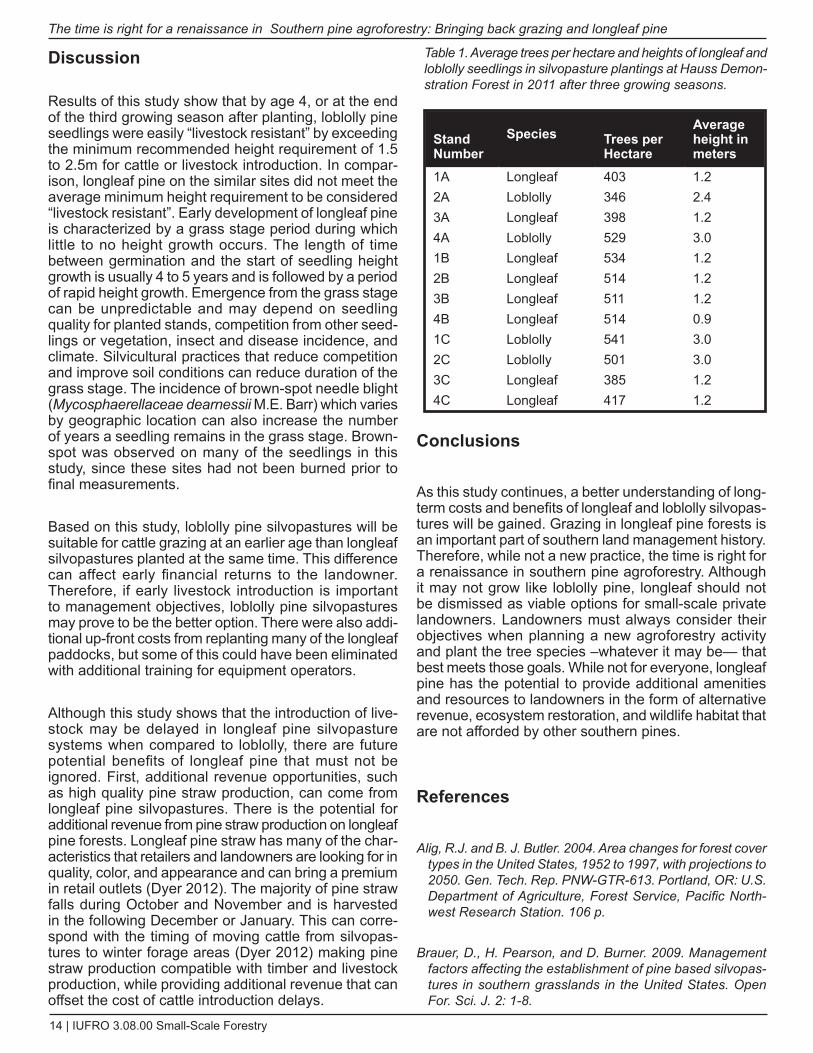
Average tree heights at time of planting were 1.6 cm for longleaf and 19.7 cm for loblolly. In 2009 at the end of the first growing season, loblolly agroforestry paddocks averaged 61.9 cm and longleaf 5.6 cm. Loblolly seed-lings ranged from 31.5 to 108.0 cm and longleaf seed-lings ranged from 0.5 to 20.0 cm. By the end of the third growing season, loblolly pines in this study had easily reached an average height of 3.0m. In contrast, longleaf pine at the same age averaged only about 1.2 m in height (Table 1).
14 | IUFRO 3.08.00 Small-Scale Forestry
The time is right for a renaissance in Southern pine agroforestry: Bringing back grazing and longleaf pine
Discussion
Results of this study show that by age 4, or at the end of the third growing season after planting, loblolly pine seedlings were easily “livestock resistant” by exceeding the minimum recommended height requirement of 1.5 to 2.5m for cattle or livestock introduction. In compar-ison, longleaf pine on the similar sites did not meet the average minimum height requirement to be considered “livestock resistant”. Early development of longleaf pine is characterized by a grass stage period during which little to no height growth occurs. The length of time between germination and the start of seedling height growth is usually 4 to 5 years and is followed by a period of rapid height growth. Emergence from the grass stage can be unpredictable and may depend on seedling quality for planted stands, competition from other seed-lings or vegetation, insect and disease incidence, and climate. Silvicultural practices that reduce competition and improve soil conditions can reduce duration of the grass stage. The incidence of brown-spot needle blight (Mycosphaerellaceae dearnessii M.E. Barr) which varies by geographic location can also increase the number of years a seedling remains in the grass stage. Brown-spot was observed on many of the seedlings in this study, since these sites had not been burned prior to final measurements.
Based on this study, loblolly pine silvopastures will be suitable for cattle grazing at an earlier age than longleaf silvopastures planted at the same time. This difference can affect early financial returns to the landowner. Therefore, if early livestock introduction is important to management objectives, loblolly pine silvopastures may prove to be the better option. There were also addi-tional up-front costs from replanting many of the longleaf paddocks, but some of this could have been eliminated with additional training for equipment operators.
Although this study shows that the introduction of live-stock may be delayed in longleaf pine silvopasture systems when compared to loblolly, there are future potential benefits of longleaf pine that must not be ignored. First, additional revenue opportunities, such as high quality pine straw production, can come from longleaf pine silvopastures. There is the potential for additional revenue from pine straw production on longleaf pine forests. Longleaf pine straw has many of the char-acteristics that retailers and landowners are looking for in quality, color, and appearance and can bring a premium in retail outlets (Dyer 2012). The majority of pine straw falls during October and November and is harvested in the following December or January. This can corre-spond with the timing of moving cattle from silvopas-tures to winter forage areas (Dyer 2012) making pine straw production compatible with timber and livestock production, while providing additional revenue that can offset the cost of cattle introduction delays.
Conclusions
As this study continues, a better understanding of long-term costs and benefits of longleaf and loblolly silvopas-tures will be gained. Grazing in longleaf pine forests is an important part of southern land management history. Therefore, while not a new practice, the time is right for a renaissance in southern pine agroforestry. Although it may not grow like loblolly pine, longleaf should not be dismissed as viable options for small-scale private landowners. Landowners must always consider their objectives when planning a new agroforestry activity and plant the tree species –whatever it may be— that best meets those goals. While not for everyone, longleaf pine has the potential to provide additional amenities and resources to landowners in the form of alternative revenue, ecosystem restoration, and wildlife habitat that are not afforded by other southern pines.
References
Alig, R.J. and B. J. Butler. 2004. Area changes for forest cover types in the United States, 1952 to 1997, with projections to 2050. Gen. Tech. Rep. PNW-GTR-613. Portland, OR: U.S. Department of Agriculture, Forest Service, Pacific North-west Research Station. 106 p.
Brauer, d., H. Pearson, and d. Burner. 2009. Management factors affecting the establishment of pine based silvopas-tures in southern grasslands in the United States. Open For. Sci. J. 2: 1-8.
Stand Number
Species Trees per Hectare
Average height in meters
1A Longleaf 403 1.22A Loblolly 346 2.43A Longleaf 398 1.24A Loblolly 529 3.01B Longleaf 534 1.22B Longleaf 514 1.23B Longleaf 511 1.24B Longleaf 514 0.91C Loblolly 541 3.02C Loblolly 501 3.03C Longleaf 385 1.24C Longleaf 417 1.2
Table 1. Average trees per hectare and heights of longleaf and loblolly seedlings in silvopasture plantings at Hauss demon-stration Forest in 2011 after three growing seasons.
2012 Conference Proceedings | 15
Barlow et al.
dyer. 2012. Three Essays on Pine Straw in Alabama: Needle-fall Yields, Market demands, and Landowner Interest in Harvesting. doctoral dissertation. Available online at http://hdl.handle.net/10415/3110 Last accessed August 12, 2012. 159p.
Grado, S.C. and A.L. Husak. 2004. Economic analyses of a sustainable agroforestry system in the southeastern United States. P. 39-57 in Valuing agroforestry systems: Methods and applications, Alavalapati, J.R.R. and d.E. Mercer (eds.). Kluwer Academic Publishers, Netherlands.
Hamilton, J. 2008. Silvopasture: Establishment & manage-ment principles for pine forests in the Southeastern United States. USdA Forest Service/ UNL Faculty Publications.
Hartsell, A.J. and T.G. Johnson. 2009. Alabama’s Forests 2005. Resource Bulletin SRS-146. Asheville, NC. US department of Agriculture Forest Service, Southern Research Station, 42 p. Available online at http://www.srs.fs.usda.gov/pubs/rb/rb_srs146.pdf
Minogue, P.J., H.K. Ober, and S. Rosenthal. 2007. Overview of pine straw production in north Florida: Potential revenues, fertilization practices, and vegetation management recom-mendations. Florida Cooperative Extension Service, IFAS, University of Florida, Publication FOR125.
Taylor, E.L., and C.d. Foster. 2004. Producing pine straw in East Texas forests. Texas Cooperative Extension, Publi-cation B-6145.
USdA National Agroforestry Center. 2008. Silvopasture: Establishment and management principles for pine forests in the Southeastern United States. USdA National Agrofor-estry Center. Lincoln, Nebraska. 71 p.
Wahlenberg, WG. 1946. Longleaf pine: Its use, ecology, regeneration, protection, growth and management. Charles Lathrop Pack Forestry Foundation. Washington dC. 429 p.
Zekeri, A. 1996. Community action in Alabama’s Black Belt timber-dependent communities. Social Indicators Research. 39(2): 203-228.
Zhou N. 2010. 2009. Alabama rural land value and cash rent: an econometrics analysis of factors affecting timberland prices. Unpublished Master’s Thesis. Auburn University. Auburn, Alabama. 114p.
16 | IUFRO 3.08.00 Small-Scale Forestry
Introduction
The decline in wood furniture manufacturing in the United States has been well-documented, with imports from low-cost sources such as China, Vietnam, and other locations being the primary driver (e.g., Dugan 2009). According to data from the U.S. Bureau of Labor Statistics (2012), there has been a 67 percent decline in employment in the nonupholstered wood household furniture sector, declining from 116,626 employees in 2001 to just 38,246 by 2011. Similarly, the number of establishments in this sector has declined by 36 percent over the same period, with a loss of 1,565 firms (U.S. Bureau of Labor Statistics 2012).
An important component of the furniture manufacturing shift to offshore sources is the impact on local forest economies, for both finished products and produc-tion inputs such as hardwood lumber. For example, hardwood lumber consumption by the U.S. furniture industry declined from 20 percent of total U.S. production in 1999 to 8 percent by 2008 (Hardwood Market Report
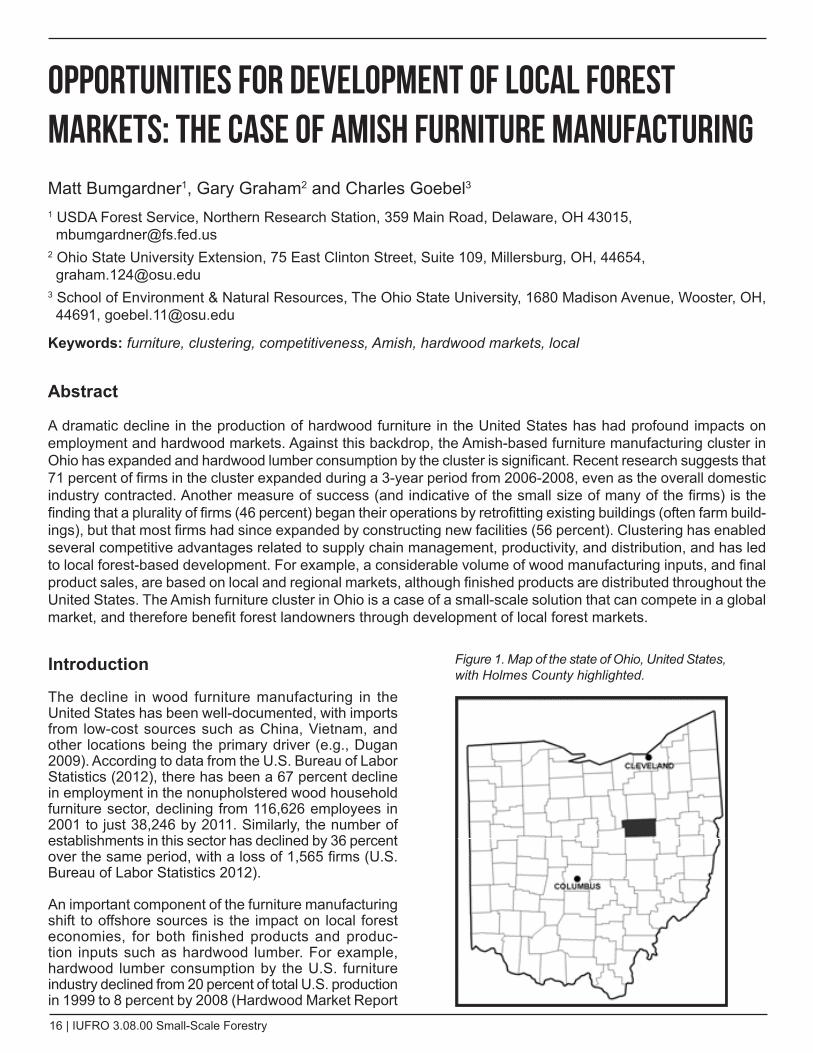
Figure 1. Map of the state of Ohio, United States, with Holmes County highlighted.
Opportunities for Development of local Forest Markets: The Case of Amish Furniture ManufacturingMatt Bumgardner1, Gary Graham2 and Charles Goebel3
1 USDA Forest Service, Northern Research Station, 359 Main Road, Delaware, OH 43015, [email protected]
2 Ohio State University Extension, 75 East Clinton Street, Suite 109, Millersburg, OH, 44654, [email protected]
3 School of Environment & Natural Resources, The Ohio State University, 1680 Madison Avenue, Wooster, OH, 44691, [email protected]
Keywords: furniture, clustering, competitiveness, Amish, hardwood markets, local
Abstract
A dramatic decline in the production of hardwood furniture in the United States has had profound impacts on employment and hardwood markets. Against this backdrop, the Amish-based furniture manufacturing cluster in Ohio has expanded and hardwood lumber consumption by the cluster is significant. Recent research suggests that 71 percent of firms in the cluster expanded during a 3-year period from 2006-2008, even as the overall domestic industry contracted. Another measure of success (and indicative of the small size of many of the firms) is the finding that a plurality of firms (46 percent) began their operations by retrofitting existing buildings (often farm build-ings), but that most firms had since expanded by constructing new facilities (56 percent). Clustering has enabled several competitive advantages related to supply chain management, productivity, and distribution, and has led to local forest-based development. For example, a considerable volume of wood manufacturing inputs, and final product sales, are based on local and regional markets, although finished products are distributed throughout the United States. The Amish furniture cluster in Ohio is a case of a small-scale solution that can compete in a global market, and therefore benefit forest landowners through development of local forest markets.
2012 Conference Proceedings | 17
Bumgardner et al.
2009). Overall, the loss of furniture manufacturing in the United States was the leading cause for the decline of U.S. hardwood lumber production from 1999 (the histor-ical peak) to 2003 (Luppold and Bumgardner 2010).
Against this backdrop, the number of firms in the Amish-based furniture cluster in and around Holmes County, Ohio, expanded as opportunities for production and marketing of semi-customized solid hardwood furni-ture were identified and pursued by local manufacturers (Bumgardner et al. 2007). Such cases of competitive manufacturing models help shed light on opportunities to develop or maintain local forest-based markets. For example, research indicates that the Holmes County furniture cluster consumes the equivalent of 19 percent of the grade hardwood lumber production in Ohio annually (Bumgardner et al. 2011a). Given the small size of most of the firms (median of four employees) in this cluster (Bumgardner et al. 2007), it seems possible that clusters of small-scale firms can contribute to demand for local forest products.
Clusters are defined as, “. . . critical masses – in one particular place – of unusual competitive success in particular fields” (Porter 1998, p. 78). Similarly, Brook-field (2008, p. 408) refers to such clusters as, “ . . . an industrial district made up of a number of [locally-owned] firms, possibly even including some large firms,
but absent a dominant one.” One of the key advantages of clustering is aggregate productivity. According to Porter (1998, p. 80), “A cluster allows each member to benefit as if it had greater scale or as if it had joined with others without sacri-ficing its flexibility.” An example of such productivity in the Holmes County cluster is related to hardwood lumber use per employee, which was found to be quite similar to the broader U.S. furniture industry, despite the small size of most firms within the cluster (Bumgardner et al. 2011a).
Cluster development in the Holmes County region is evident by the timing of different types of firms becoming established in the cluster. The median establishment year for manufacturers was 1996, 1997 for wholesale distributors, and the year 2000 for specialized finishing companies (Bumgardner et al. 2007). The presence of finishing firms using a standardized set of finish colors is a key element of cluster success, as it enables the produc-tion of semi-customized products that can be made uniform across multiple manufacturing firms. Furniture manufac-turers within the cluster can either finish in-house (often also using the standard-ized finishes) or make use of the finishing
services within the cluster. Furthermore, some of the manufacturers focus on producing components that are then purchased and used by other manufacturers to build furniture, whereas other manufacturers produce and assemble all of their furniture production in-house. The wood use characteristics of furniture producers and component producers are described in Bumgardner et al. (2011a), but much of the hardwood lumber used by both groups is sourced locally.
In this paper, we describe some of the growth attri-butes and local economic contributions associated with the Amish-based furniture cluster in Ohio, which had an estimated 3,000 employees and 500 firms in 2005 (Bumgardner et al. 2007).
Methods
Results presented here are based on a mail survey of furniture manufacturers in the Amish cluster in Holmes and surrounding counties in Ohio (Figure 1). For brevity, the cluster is referred to throughout the paper as the Holmes County cluster or region, even though surrounding counties are included in an area approxi-mately 1,000 square miles (2,590 square km) in size.
Start-up actions taken PercentRetrofit an existing building or buildings 46.3Constructed an entirely new building or buildings 41.7Combined existing and new buildings 10.4Other 1.6
Table 1. Actions taken by firms when first starting furniture manufacturing operations in the Holmes County cluster.
Expansion actions taken PercentDid not expand 29.2Expanded by retrofitting an existing building or buildings 13.5Expanded by constructing a new building or buildings 56.3Other 1.0
Table 2. Actions taken by firms to expand furniture manufacturing operations in the Holmes County cluster after beginning operations.
Future plans for expansion PercentNo expansion planned 58.2Will expand by retrofitting an existing building or buildings 7.9Will expand by constructing a new building or buildings 27.5Other 6.4
Table 3. Future plans for firms to expand furniture manufacturing operations in the Holmes County cluster.
18 | IUFRO 3.08.00 Small-Scale Forestry
Opportunities for development of Local Forest Markets: The Case of Amish Furniture Manufacturing
While details of the survey method employed can be found elsewhere (Bumgardner et al. 2011a), a brief description is provided below.
A packet containing the questionnaire, a cover letter, and postage-paid return envelope was mailed in May of 2008 to 569 firms appearing in The Furniture Book: A Complete Guide to the Furniture Manufacturers and Wholesalers in Ohio’s Amish Country (Anonymous 2005), which served as the sampling frame. A reminder post card was mailed to nonrespondents approximately 1 month after the initial mailing, and a second packet (containing a duplicate questionnaire, postage-paid return envelope, and updated cover letter) was mailed to all nonrespondents approximately 2 weeks after the postcard. All mailings originated from (and were returned to) the Ohio Agricultural Research and Development Center in Wooster, Ohio.
A total of 196 usable questionnaires were returned, for an adjusted response rate of 43.4 percent after removing undeliverable packets and/or those firms that had ceased operations or were not manufacturers. More than 96 percent of respondents indicated that they were the shop owner or co-owner, thus respondents were very familiar with the specifics of their respective opera-tions. As described in Bumgardner et al. (2011a), tests for nonresponse bias suggested such bias was not a serious problem in the study.
Results and Discussion
Growth of the Cluster
Growth within the cluster has been impressive, given the trend toward imports and loss of domestic market share in the broader furni-ture industry. Nearly 71 percent of respondents indicated that they had expanded into making new products during the 3-year period from 2006-2008, which also included the beginning of the reces-sion in late 2007. However, cluster growthy may have been leveling off thereafter, as only 55 percent indi-cated they had plans to expand into
new products during the 2008-2010 period.
Growth also was measured in terms of changes in physical manufacturing facilities. As shown in Table 1, a slim plurality of the firms (46 percent) made use of existing buildings (often farm buildings) when first starting-up. However, for those firms that have since grown, the most common means of expansion was to construct entirely new buildings to house machinery and warehousing needs (Table 2). Also of interest was that most firms expanded after first building their facility (nearly 70 percent), suggesting growth in the overall cluster. However, most firms (58 percent) indicated they had no plans for further expansion (Table 3). When coupled with the timing of firm establishment described previously (manufacturers forming just prior to distribu-tors, who formed just before finishers), a picture emerges of cluster establishment. A distinguishing characteristic of the Holmes County furniture cluster is that it devel-oped locally and with little external support by way of government grants, loans, or other financial incentives (Bratkovich et al. 2009).
An important point regarding the physical facilities in the cluster, consistent with the above findings, is that furniture manufacturing represents a broader transi-tion in Amish communities from an agricultural-based economy to one centered on manufacturing (Kreps et al. 1994, Lowery and Noble 2000). It is therefore not an uncommon sight to see a barn or other farm building with an attached dust collection unit or other evidence of wood manufacturing, which represents this transition.
Impacts on Local and Regional Forest Markets
An important component of the success of the cluster has been the associated impacts on local forest product markets, particularly for hardwood lumber and compo-nents. For example, most furniture manufacturers sold directly to local retail stores, and a large majority sold to
Channel typeFurniture firms(% indicating*)
Component firms(% indicating)
Directly to local retail stores 59.6 3.6Directly to retail stores in Ohio 71.1 14.3Directly to retail stores outside Ohio 77.7 7.1To distributors who sell locally 7.9 3.6To distributors who sell in Ohio 18.7 10.7To distributors who sell outside Ohio 34.9 17.9Directly to consumers 23.0 10.7To local manufacturers 15.7 89.3To other manufacturers 8.4 64.3
Table 4. General marketing channels for selling furniture products from the Holmes County cluster. *Respondents were asked to indicate each channel type that accounted for at least 10 percent of total sales, thus columns total to more than 100 percent.
Geographic unitFurniture firms (%)
Component firms (%)
Holmes County region 20.5 53.4State of Ohio 47.9 72.8United States 96.8 96.6
Table 5. Percentage of product sales staying within geographic ranges, on average, for firms within the Holmes County cluster.
2012 Conference Proceedings | 19
Bumgardner et al.
retail stores in Ohio (Table 4). The largest percentage sold to retail stores outside of Ohio, which is an indi-cation of growth in the markets being used by firms in the cluster. Fewer firms sold to distributors, directly to consumers, or to other manufacturers. However, a substantial percentage (23 percent) sold directly to consumers, which represents the importance of the region as a destination location for hardwood furniture purchasing. It also seems distributors become more important for sales farther from the cluster (Table 4).
A subset of the sample (n=28) were component manu-facturers and these firms were considered separately from the furniture manufacturers to determine impacts on the local forest economy. As shown in Table 4, a large majority of these firms (89 percent) sold to local manu-facturers. As described in other studies (Bumgardner et al 2011a), the presence of component manufacturers is important to the aggregate productivity evident in the cluster. A majority but smaller percentage also sold to manufacturers outside the Holmes County region.
Relatedly, Table 5 shows the percentage of product sales, on average, staying within certain geographic boundaries. For component manufacturers, over half remained within the Holmes County region and nearly three-quarters stayed within Ohio. This finding is consis-tent with Brookfield (2008), who states that clusters are characterized by firms that outsource manufacturing inputs, and Porter (1998), who states that an important characteristic of clusters is the presence of specialized supplier bases that enables vertical interfirm integra-tion. It has been shown that firms within the cluster rate access to local suppliers and manufacturing services as key advantages to being in the cluster (Bumgardner et al. 2011b). Table 5 also shows that for furniture manu-facturers, most product sales (52 percent) are destined for out-of-state markets.
Summary
The Amish furniture manufacturing cluster in Ohio is a case of a small-scale manufacturing solution that has emerged and successfully competed in a global market, benefitting landowners through development of local forest markets. The cluster has grown as part of a tran-sition from agricultural production to manufacturing in the Amish community as opportunities for semi-custom-ized production of solid wood furniture were realized and marketed by local manufacturers. A considerable volume of wood manufacturing inputs, as well as final product sales, are based on local and regional markets, although finished products are distributed throughout the United States. Clustering has enabled several competi-tive advantages related to supply chain development, productivity, and distribution.
References
Anonymous. 2005. The Furniture Book: A Complete Guide to the Furniture Manufacturers and Wholesalers in Ohio’s Amish Country, 2005-2006 edition. Overland Publishing, Inc., Orrville, OH, 168 p.
Bratkovich, S., Fernholz, K., Bowyer, J., and Lindburg, A. 2009. Forest-based Economic Clusters: Models for Sustain-able Economic development. dovetail Partners, Inc., Minne-apolis, MN, 9 p.
Brookfield, J. 2008. Firm clustering and specialization: a study of Taiwan’s machine tool industry. Small Business Economics. 30:405-422.
Bumgardner, M., Romig, R., and Luppold, W. 2007. Wood use by Ohio’s Amish furniture cluster. Forest Products Journal. 57(12):6-12.
Bumgardner, M.S., Graham, G.W., Goebel, P.C., and Romig, R.L. 2011a. How clustering dynamics influence lumber utili-zation patterns in the Amish-based furniture industry in Ohio. Journal of Forestry. 109(2):74-81.
Bumgardner, M.S., Graham, G.W., Goebel, P.C., and Romig, R.L. 2011b. Perceptions of firms within a cluster regarding the cluster’s function and success: Amish furniture manu-facturing in Ohio. Proceedings of the 17th Central Hardwood Forest Conference, GTR-NRS-P-78, USdA Forest Service, Northern Research Station, Newtown Square, PA, p. 597-606.
dugan, M.K. 2009. The Furniture Wars: How America Lost a Fifty Billion dollar Industry. Goosepen Press, Conover, NC, 450 p.
Hardwood Market Report. 2009. 2008: The Year at a Glance - 12th Annual Statistical Analysis of the North American Hardwood Marketplace. Hardwood Market Report, Memphis, TN, 78 p.
Kreps, G.M., donnermeyer, J.F., and Kreps, M.W. 1994. The changing occupational structure of Amish males. Rural Soci-ology. 59(4):708-719.
Lowery, S. and Noble, A.G. 2000. The changing occupational structure of the Amish of the Holmes County, Ohio, settle-ment. The Great Lakes Geographer. 7(1):26-37.
Luppold, W.G. and Bumgardner, M.S. 2010. Two eras of globalization and hardwood sawtimber. In Gan, J, Grado, S., and Munn, I.A. (eds.). Global Change and Forestry: Economic and Policy Impacts and Responses. Nova Science Publishers, Inc., New York, p. 171-178.
Porter, M.E. 1998. Clusters and the new economics of competition. Harvard Business Review. November-december:77-90.
U.S. Bureau of Labor Statistics. 2012. Quarterly Census of Employment and Wages. Available online at http://www.bls.gov/data/ (accessed July 9, 2012).
20 | IUFRO 3.08.00 Small-Scale Forestry
Introduction
Agroforestry is an integrated land management system whereby land, labour and capital inputs are combined to produce trees and agricultural crops and/or livestock on the same unit of land (Nair, 1985). By this very definition, any farming practice that combines trees with agriculture and /or livestock can be an agroforestry. From this view point, agroforestry can be considered as a traditional land management practice adopted by farmers for centu-ries in the tropics and many developing countries such as Nepal where the rural livelihood is largely dependent on forest, agriculture and livestock (Floyd et al., 2003; Garforth et al., 1999). However, such a long- practiced and adopted land management practice emerged only in the late 1970s as a modern, improved land use system suitable for scientific study and further interest in agrofor-
estry increased in the late 1990s when scientific commu-nity discovered the complex land management system developed by rural landowners in North America and Europe including forest farming, shelterbelts, riparian buffers and silvopastoral systems (Lassoie and Buck, 1999). Efforts were made for rural development through agroforestry interventions in the 1980s and 1990s, but they were frequently unsuccessful (Nair, 1996). There might be several reasons behind the failure of such agro-forestry intervention, but one common factor that scien-tific community agreed was the inadequate attention given to the socioeconomics in the development of the systems and projects (Current et al., 1995). Since then (beginning in mid-1990s), agroforestry leaders argued for increased emphasis on research to understand the agroforestry adoption decision process (Mercer and Miller, 1998; Sanchez, 1995). As a result, agrofor-
Factors Affecting Adoption of Agroforestry-Based land Management Practice: A Case of Dhanusha District NepalArun Dhakal1, Geoff Cockfield2 and Tek Narayan Maraseni31Faculty of Business and Law, University of Southern Queensland (USQ), Toowoomba, QLD-4350, Australia2 Faculty of Business and Law/Australian Centre for Sustainable Catchments (ACSC), University of Southern Queensland (USQ), Australia
3 Australian Centre for Sustainable Catchments (ACSC), University of Southern Queensland (USQ), Australia
Abstract
This paper explains how an index value can be developed to study the adoption of multiple farming technolo-gies such as agroforestry based land management practice in the Dhanusha District of Nepal, and analyses the factors explaining the variation in adoption decision of such practice. Data about the different farming technologies and the factors (bio-physical, socio-economic) influencing adoption were collected from focus group discussion and randomly selected households through a household survey questionnaire. Farmers of the study area had adopted several types of farming technologies to maintain the farm productivity. The study revealed that some variables such as low fertility of soil, high slope gradient of farm land, erosion and flood potential had no influ-ence on adoption decision of agroforestry based land management practice while these variables were highly influential in case of the single technology adoption decision such as tree planting. The variables found significant were: farm size, availability of irrigation water, education, agricultural labour force, frequency of visits, expenditure on farm input purchase, household’s experience in agroforestry, and distance of home to government forest. All these variables had a positive influence on adoption decision of agroforestry based land management practice. However, the first five variables had remarkably influenced the adoption decision as 72% of variation in adoption decision was caused by these variables. Therefore, provision of irrigation water, extension services and motiva-tion to obtaining higher education are needed for farmers elsewhere in the terai of Nepal to promote this type of agroforestry based land management practice.
Keywords: Multiple farming technologies; adoption; index value; determinants of adoption; step wise linear regression
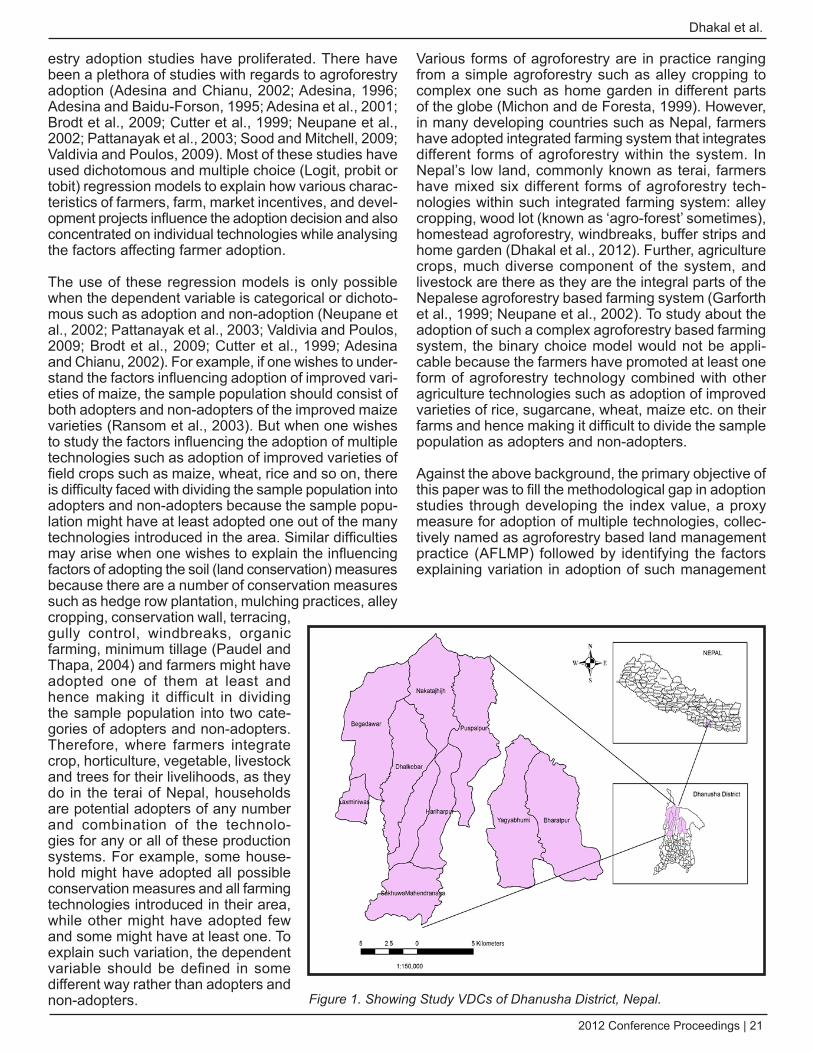
2012 Conference Proceedings | 21
Dhakal et al.
estry adoption studies have proliferated. There have been a plethora of studies with regards to agroforestry adoption (Adesina and Chianu, 2002; Adesina, 1996; Adesina and Baidu-Forson, 1995; Adesina et al., 2001; Brodt et al., 2009; Cutter et al., 1999; Neupane et al., 2002; Pattanayak et al., 2003; Sood and Mitchell, 2009; Valdivia and Poulos, 2009). Most of these studies have used dichotomous and multiple choice (Logit, probit or tobit) regression models to explain how various charac-teristics of farmers, farm, market incentives, and devel-opment projects influence the adoption decision and also concentrated on individual technologies while analysing the factors affecting farmer adoption.
The use of these regression models is only possible when the dependent variable is categorical or dichoto-mous such as adoption and non-adoption (Neupane et al., 2002; Pattanayak et al., 2003; Valdivia and Poulos, 2009; Brodt et al., 2009; Cutter et al., 1999; Adesina and Chianu, 2002). For example, if one wishes to under-stand the factors influencing adoption of improved vari-eties of maize, the sample population should consist of both adopters and non-adopters of the improved maize varieties (Ransom et al., 2003). But when one wishes to study the factors influencing the adoption of multiple technologies such as adoption of improved varieties of field crops such as maize, wheat, rice and so on, there is difficulty faced with dividing the sample population into adopters and non-adopters because the sample popu-lation might have at least adopted one out of the many technologies introduced in the area. Similar difficulties may arise when one wishes to explain the influencing factors of adopting the soil (land conservation) measures because there are a number of conservation measures such as hedge row plantation, mulching practices, alley cropping, conservation wall, terracing, gully control, windbreaks, organic farming, minimum tillage (Paudel and Thapa, 2004) and farmers might have adopted one of them at least and hence making it difficult in dividing the sample population into two cate-gories of adopters and non-adopters. Therefore, where farmers integrate crop, horticulture, vegetable, livestock and trees for their livelihoods, as they do in the terai of Nepal, households are potential adopters of any number and combination of the technolo-gies for any or all of these production systems. For example, some house-hold might have adopted all possible conservation measures and all farming technologies introduced in their area, while other might have adopted few and some might have at least one. To explain such variation, the dependent variable should be defined in some different way rather than adopters and non-adopters.
Various forms of agroforestry are in practice ranging from a simple agroforestry such as alley cropping to complex one such as home garden in different parts of the globe (Michon and de Foresta, 1999). However, in many developing countries such as Nepal, farmers have adopted integrated farming system that integrates different forms of agroforestry within the system. In Nepal’s low land, commonly known as terai, farmers have mixed six different forms of agroforestry tech-nologies within such integrated farming system: alley cropping, wood lot (known as ‘agro-forest’ sometimes), homestead agroforestry, windbreaks, buffer strips and home garden (Dhakal et al., 2012). Further, agriculture crops, much diverse component of the system, and livestock are there as they are the integral parts of the Nepalese agroforestry based farming system (Garforth et al., 1999; Neupane et al., 2002). To study about the adoption of such a complex agroforestry based farming system, the binary choice model would not be appli-cable because the farmers have promoted at least one form of agroforestry technology combined with other agriculture technologies such as adoption of improved varieties of rice, sugarcane, wheat, maize etc. on their farms and hence making it difficult to divide the sample population as adopters and non-adopters.
Against the above background, the primary objective of this paper was to fill the methodological gap in adoption studies through developing the index value, a proxy measure for adoption of multiple technologies, collec-tively named as agroforestry based land management practice (AFLMP) followed by identifying the factors explaining variation in adoption of such management
Figure 1. Showing Study VdCs of dhanusha district, Nepal.
22 | IUFRO 3.08.00 Small-Scale Forestry
Factors affecting adoption of agroforestry-based land management practice: A Case of dhanusha district Nepal
practice. To show how this can be done, this study was carried out in the Dhanusha District (Figure1), part of Nepal’s terai.
Theoretical Perspectives
Agroforestry based farming system is an integrated land management practice that aims at land resource conservation and improving land productivity through integration/introduction of tree crops with agriculture and/or livestock. However, the adoption of this sort of practice, which is also environment-friendly, is influenced and constrained by several factors.
According to induced innovation theory, as population densities rises and/or demand for agricultural products increases, the resulting land pressures induce adoption of technological and institutional innovations to inten-sify land use for sustaining their livelihood (Binswanger and Ruttan, 1978; Boserup and Kaldor, 1965; Pingali et al., 1987; Ruttan, 1997). But other researchers argued that only the population growth can’t be an inducing factor that motivates farmers towards adopting new land management practice, there are several other factors: socio-economic, institutional and technological inducing farmers to adopt new agricultural innovations/technol-ogies (Adesina and Chianu, 2002; Rasul and Thapa, 2003).
Ali (1995) and Brush (1987) considered the land management practice at a given time and space to be the function of constraints imposed by physical envi-ronment and technological capabilities to reduce and modify the constraints. According to Hayami & Ruttan (1971) adoption of new land management practice takes place as a result of combined influence of institutions and technologies because institution plays an effective role in creating scientific and technical knowledge and also facilitates the implementation of new technology in agricultural production (Rasul and Thapa, 2003). Brady (1996), however, argues that the availability of resources (natural, human, technological, capital), constraints (biophysical, socioeconomic) and the policy environ-ment (including land rights, land tenure, subsidies, taxes, commodity prices, transportation and marketing oppor-tunities) influence land-use change.
Adopting new practice is a complex process involving four different stages: awareness, interest, evaluation and finally adoption, each influenced by various biophysical, personal, socioeconomic and institutional factors (Rogers and Shoemaker, 1971). Farmers’ individual attitudes, characteristics, feelings and inspirations greatly influ-ence the adoption decision (Giampietro, 1997; Valdivia and Poulos, 2009). Those who have knowledge of the practice and perceived problems with environment and concerns about the future generations are more likely to be interested in adoption of new land management technology such as agro-forestry and older farmers are
less interested in adoption of such innovative measures (Valdivia and Poulos, 2009). Demographic character-istics of farm households, including household labour force size (Rauniyar, 1998) and social background, like caste, and resource endowments such as land, livestock and savings also play important roles (Pattanayak et al., 2003; Paudel and Thapa, 2004). People whose primary source of income is not agriculture are less concerned about land management compared to others whose live-lihood derives mainly from agriculture (Ervin and Ervin, 1982; Mehta and Kellert, 1998).
Research Methods
Study Area and Site descriptions
This study was conducted in the southern foothills of the Churia hills, Dhanusha (350-27.50 N and 85.50-86.20 E) from May to August 2010. The Dhanusha District is located in the central development region of Nepal, 350 km south-east of the capital city, Kathmandu. The district shares a border with India in the south. The elevation is approximately 95 m. The climate is sub-tropical with three distinct seasons: spring, monsoon and winter. Mean monthly minimum/maximum tempera-ture is 9.3/21.40 C in January and 26.7/39.60 C in April. The average annual rainfall is 2199 mm (DDC, 2009). The District covers an area of 119,000 ha, out of which 76,792 ha land is used for agriculture. It is administra-tively divided into one municipality and 101 village devel-opment committees (VDCs) (DDC, 2009).
Dhanusha was selected as a study district because the farmers have been involved with private forestry (tree growing on private land). It has the highest numbers of registered (with the district forest office) private forests of any region in Nepal. Within that district, the project area of the Terai Private Forest Development Asso-ciation (TPFDA) was selected as a study site. The project covers an area of 10,500 ha and nine village development committees (VDCs) namely Bengadawar, dhalkebar, Pushpalpur, Bharatpur, Yagyabhumi, Hari-harpur, Nakatajhijh, Sakhuwa mahendranagar, and Laxminiwas (Map 1). The TPFDA, in support of Nepal Agroforestry Foundation (NAF), has been promoting agroforestry based farming system in these VDCs since 1998. The TPFDA is the only NGO in the district working in the field of integrated land use management such as agroforestry. The study site is near the east-west highway, providing access to major centres and there-fore markets, with five VDCs on the both sides (north and south) of the highway and the rest are located further south of the highway, on a feeder road.
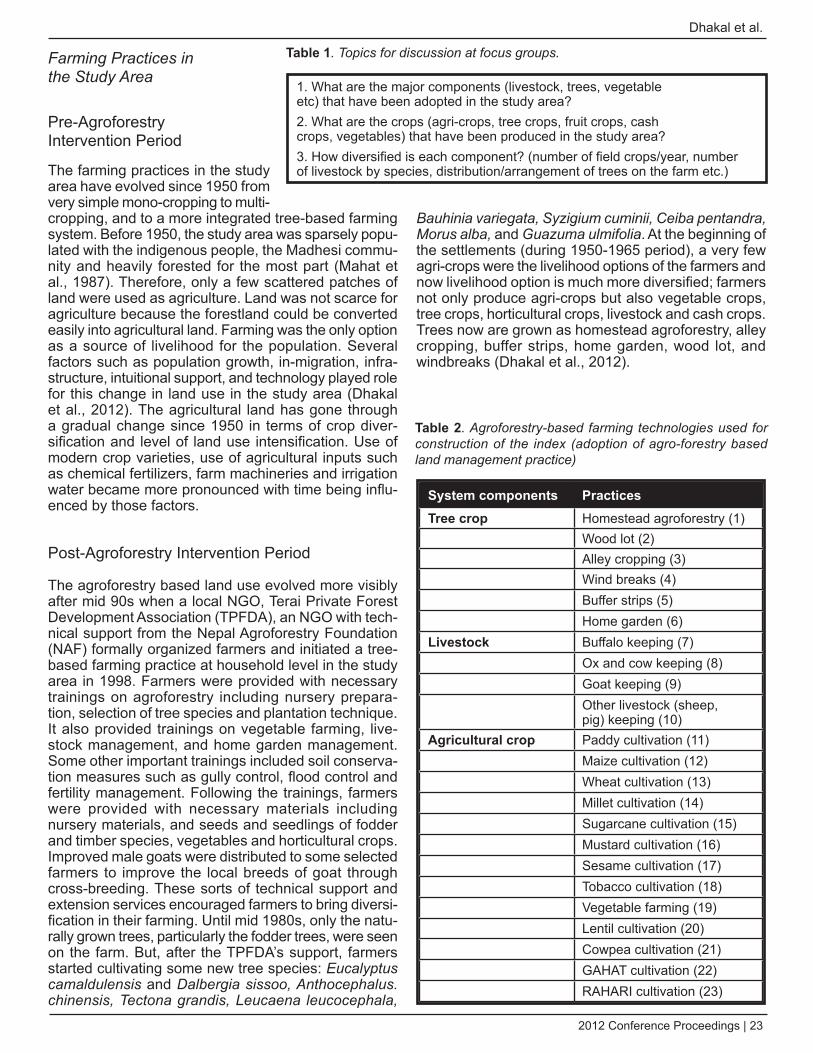
2012 Conference Proceedings | 23
Dhakal et al.
Farming Practices in the Study Area
Pre-Agroforestry Intervention Period
The farming practices in the study area have evolved since 1950 from very simple mono-cropping to multi-cropping, and to a more integrated tree-based farming system. Before 1950, the study area was sparsely popu-lated with the indigenous people, the Madhesi commu-nity and heavily forested for the most part (Mahat et al., 1987). Therefore, only a few scattered patches of land were used as agriculture. Land was not scarce for agriculture because the forestland could be converted easily into agricultural land. Farming was the only option as a source of livelihood for the population. Several factors such as population growth, in-migration, infra-structure, intuitional support, and technology played role for this change in land use in the study area (Dhakal et al., 2012). The agricultural land has gone through a gradual change since 1950 in terms of crop diver-sification and level of land use intensification. Use of modern crop varieties, use of agricultural inputs such as chemical fertilizers, farm machineries and irrigation water became more pronounced with time being influ-enced by those factors.
Post-Agroforestry Intervention Period
The agroforestry based land use evolved more visibly after mid 90s when a local NGO, Terai Private Forest Development Association (TPFDA), an NGO with tech-nical support from the Nepal Agroforestry Foundation (NAF) formally organized farmers and initiated a tree-based farming practice at household level in the study area in 1998. Farmers were provided with necessary trainings on agroforestry including nursery prepara-tion, selection of tree species and plantation technique. It also provided trainings on vegetable farming, live-stock management, and home garden management. Some other important trainings included soil conserva-tion measures such as gully control, flood control and fertility management. Following the trainings, farmers were provided with necessary materials including nursery materials, and seeds and seedlings of fodder and timber species, vegetables and horticultural crops. Improved male goats were distributed to some selected farmers to improve the local breeds of goat through cross-breeding. These sorts of technical support and extension services encouraged farmers to bring diversi-fication in their farming. Until mid 1980s, only the natu-rally grown trees, particularly the fodder trees, were seen on the farm. But, after the TPFDA’s support, farmers started cultivating some new tree species: Eucalyptus camaldulensis and dalbergia sissoo, Anthocephalus. chinensis, Tectona grandis, Leucaena leucocephala,
Bauhinia variegata, Syzigium cuminii, Ceiba pentandra, Morus alba, and Guazuma ulmifolia. At the beginning of the settlements (during 1950-1965 period), a very few agri-crops were the livelihood options of the farmers and now livelihood option is much more diversified; farmers not only produce agri-crops but also vegetable crops, tree crops, horticultural crops, livestock and cash crops. Trees now are grown as homestead agroforestry, alley cropping, buffer strips, home garden, wood lot, and windbreaks (Dhakal et al., 2012).
1. What are the major components (livestock, trees, vegetable etc) that have been adopted in the study area?2. What are the crops (agri-crops, tree crops, fruit crops, cash crops, vegetables) that have been produced in the study area? 3. How diversified is each component? (number of field crops/year, number of livestock by species, distribution/arrangement of trees on the farm etc.)
Table 1. Topics for discussion at focus groups.
System components PracticesTree crop Homestead agroforestry (1)
Wood lot (2) Alley cropping (3)Wind breaks (4) Buffer strips (5)Home garden (6)
Livestock Buffalo keeping (7) Ox and cow keeping (8) Goat keeping (9)Other livestock (sheep, pig) keeping (10)
Agricultural crop Paddy cultivation (11)Maize cultivation (12)Wheat cultivation (13)Millet cultivation (14)Sugarcane cultivation (15)Mustard cultivation (16)Sesame cultivation (17)Tobacco cultivation (18)Vegetable farming (19)Lentil cultivation (20)Cowpea cultivation (21)GAHAT cultivation (22)RAHARI cultivation (23)
Table 2. Agroforestry-based farming technologies used for construction of the index (adoption of agro-forestry based land management practice)
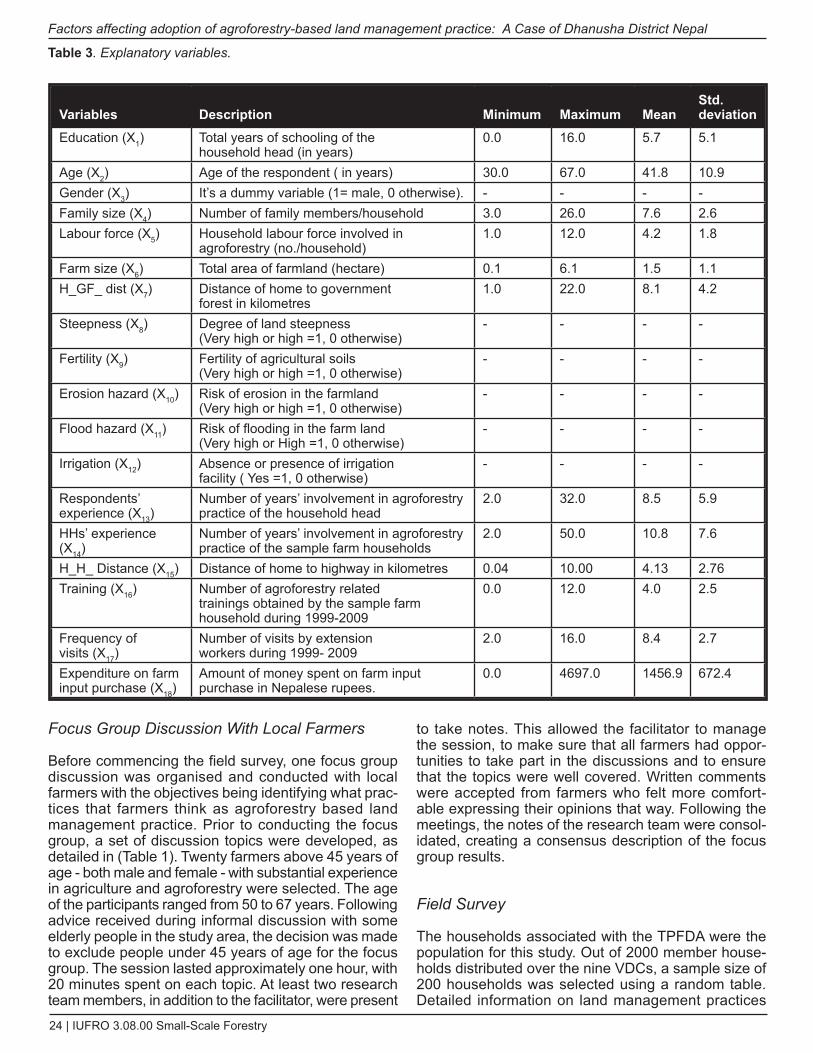
24 | IUFRO 3.08.00 Small-Scale Forestry
Factors affecting adoption of agroforestry-based land management practice: A Case of dhanusha district Nepal
Focus Group discussion With Local Farmers
Before commencing the field survey, one focus group discussion was organised and conducted with local farmers with the objectives being identifying what prac-tices that farmers think as agroforestry based land management practice. Prior to conducting the focus group, a set of discussion topics were developed, as detailed in (Table 1). Twenty farmers above 45 years of age - both male and female - with substantial experience in agriculture and agroforestry were selected. The age of the participants ranged from 50 to 67 years. Following advice received during informal discussion with some elderly people in the study area, the decision was made to exclude people under 45 years of age for the focus group. The session lasted approximately one hour, with 20 minutes spent on each topic. At least two research team members, in addition to the facilitator, were present
to take notes. This allowed the facilitator to manage the session, to make sure that all farmers had oppor-tunities to take part in the discussions and to ensure that the topics were well covered. Written comments were accepted from farmers who felt more comfort-able expressing their opinions that way. Following the meetings, the notes of the research team were consol-idated, creating a consensus description of the focus group results.
Field Survey
The households associated with the TPFDA were the population for this study. Out of 2000 member house-holds distributed over the nine VDCs, a sample size of 200 households was selected using a random table. Detailed information on land management practices
Variables Description Minimum Maximum MeanStd. deviation
Education (X1) Total years of schooling of the household head (in years)
0.0 16.0 5.7 5.1
Age (X2) Age of the respondent ( in years) 30.0 67.0 41.8 10.9Gender (X3) It’s a dummy variable (1= male, 0 otherwise). - - - -Family size (X4) Number of family members/household 3.0 26.0 7.6 2.6Labour force (X5) Household labour force involved in
agroforestry (no./household)1.0 12.0 4.2 1.8
Farm size (X6) Total area of farmland (hectare) 0.1 6.1 1.5 1.1H_GF_ dist (X7) Distance of home to government
forest in kilometres 1.0 22.0 8.1 4.2
Steepness (X8) Degree of land steepness (Very high or high =1, 0 otherwise)
- - - -
Fertility (X9) Fertility of agricultural soils (Very high or high =1, 0 otherwise)
- - - -
Erosion hazard (X10) Risk of erosion in the farmland (Very high or high =1, 0 otherwise)
- - - -
Flood hazard (X11) Risk of flooding in the farm land (Very high or High =1, 0 otherwise)
- - - -
Irrigation (X12) Absence or presence of irrigation facility ( Yes =1, 0 otherwise)
- - - -
Respondents’ experience (X13)
Number of years’ involvement in agroforestry practice of the household head
2.0 32.0 8.5 5.9
HHs’ experience (X14)
Number of years’ involvement in agroforestry practice of the sample farm households
2.0 50.0 10.8 7.6
H_H_ Distance (X15) Distance of home to highway in kilometres 0.04 10.00 4.13 2.76Training (X16) Number of agroforestry related
trainings obtained by the sample farm household during 1999-2009
0.0 12.0 4.0 2.5
Frequency of visits (X17)
Number of visits by extension workers during 1999- 2009
2.0 16.0 8.4 2.7
Expenditure on farm input purchase (X18)
Amount of money spent on farm input purchase in Nepalese rupees.
0.0 4697.0 1456.9 672.4
Table 3. Explanatory variables.
2012 Conference Proceedings | 25
Dhakal et al.
adopted by farmers, socioeconomic condition, institu-tional support, and biophysical condition was collected using a structured questionnaire. Land management practices are those practices that, according to the farmers, can help in land conservation and maintain farm productivity. The focus group discussion identified the following practices (technologies) as land manage-ment practice: alley cropping, wood lot (agro-forest), windbreaks, buffer strips, home garden, homestead agroforestry, mixed and multiple cropping (to maximize the use of resources applied) and stall-fed livestock keeping. These management practices are collec-tively termed as agroforestry-based land management practice (AFLMP) for this study. However, the adoption of these management practices varies from one farm household to another. For example some farmers have adopted alley cropping while others have not and simi-larly some are promoting trees as buffer strips to control flood and hence protect their marginal land while others are leaving such land fallow.
Before the field survey was commenced, pre-testing of the questionnaire was done through a pilot survey in a village in the study area through face-to-face interview with the heads of the selected households. A few modi-fications were made following the pre-testing. The data were collected on pre-structured questionnaire through face-to-face interview with the household heads.
Model Description
Farmers of the study area have adopted the agroforestry based land management practice. They have integrated trees, horticulture, agri-crops, vegetables, and livestock into their farming system to a varying degree. There were identified twenty three practices (technologies) characterising the integration level of agroforestry based land management practice (AFLMP) (table 2). Farmers have adopted a number of combinations of these tech-nologies varying from one farm household to another. Since one of objectives was to assess factors explaining the variation in adoption of AFLMP, the multiple- regres-sion model would serve the purpose. Therefore, the dependent variable, adoption of agroforestry based land management practice, is hypothesized as being influ-enced by a set of independent variables: X1,. . . Xn (Table 2). The model is specified as follows:
Y = b0 + b1X1 + b2X2 +_ _ _+bnXn
Where, Y is the dependent variable (adoption of agro-forestry based land management practice) , b0 is the intercept, b1,b2,. . .,bn are the coefficients of explana-tory variables X1, X2, . . ., Xn.
dependent Variable (Adoption of Agroforestry Based Land Management)
Tree crop, livestock and agriculture crops were identified as system components through the focus group discus-sion. Under each system component, there are number of practices adopted by farmers to conserve their land resources and maintain farm production. A score of 1.0 was assigned to the practice (technology) adopted by farmers and 0.0 to the practice not adopted by them. An index value for each system component based on the number of practices under each component was calcu-lated. Here is how we developed the index value.
(1) Index value for the tree crop (IVtree) = Number of technologies adopted by individual farmers (n)
Total number of technologies (N)
Where, N= 6
(2) Index value for the livestock (IVlivestock) = Number of species raised by individual farmers (n)
Total number of livestock species (N)
Where, N= 4
(3) Index value for the agricultural crop (IVagri) =Number of crop species cultivated by individual farmers (n)
Total number of crop species (N)
Where, N=13
(4) Overall average index value (OAIV) =
∑ (IVtree + IVlivestock + IVagri) ∕ 3
This overall average index value (OAIV) was used as dependent variable as a proxy measure of the adoption of agroforestry based land management practice (AFLMP).
Procedure and Scientific Basis of Index Value (IV) development
Anley et al. (2007) used lengths of conservation struc-tures as a proxy of conservation efforts to determine the factors influencing adoption of soil and water conserva-tion measures. Similar proxy such as tree density (no/ha), area covered by trees (ha) and length of bunds with trees (m/ha) could be used to study the factors explaining the adoption of agroforestry based land management practice but agroforestry is not just trees but is an inte-grated land management practice that includes agricul-ture and livestock (Garforth et al., 1999; Nair, 1985). And therefore using trees only as a proxy would be a bias. To avoid this bias in analysis, some index value that could represent all components (trees, agriculture and livestock) equally is necessary. Being integral parts of
26 | IUFRO 3.08.00 Small-Scale Forestry
Factors affecting adoption of agroforestry-based land management practice: A Case of dhanusha district Nepal
an agroforestry system, an equal weightage was given to each component while developing the index value (formula 1).
But the farming system in the study area is not that simple; there are a number of technologies (practices) adopted under each system component, making the system more complex. In case of the component “tree crops”, there are a number of variations in terms of arrangement of trees/vegetation within the farming system. From the focus group discussion, six types of tree planting technologies were documented: home-stead agroforestry (trees raised around the homestead), windbreaks (trees raised around the farm boundary and home garden), alley (trees raised in the alley), wood lot (trees raised as a tree stand), buffer strips (vegeta-tion raised between farmland and waterways to avoid flooding and control erosion) and home garden (fruit orchard). Since the tree species raised and role they play in overall land management and farm productivity vary with the types of tree arrangement, each arrange-ment was treated as a separate agroforestry technology (table 2). The index value for the tree crops (IVtree) was calculated as shown in the formula 1 for each house-hold surveyed.
Likewise, in order to derive an index value for the compo-nent “livestock”, the livestock diversity (number of live-stock species) was considered rather than total number of livestock per household. Since our aim is to document the practices within the component “livestock”, simply the size would not fit into our model. And therefore, livestock diversity was documented through field survey, consid-ering each livestock species as a separate practice as detailed in the table 2. The index value for the livestock (IVlivestock) was calculated as shown in the formula 2 for each household surveyed.
For the third component “agriculture crops”, each crop that farmers have cultivated was considered as a separate practice because each crop has its own significance in soil fertility management. For example the use of legume crop would enhance the soil fertility through nitrogen fixation. Further to this, the nutritional need also varies with crop types and hence rational use of available nutrients can be expected in mixed and multiple cropping system and this would help in soil fertility maintenance. The index value for the agricultural crops (IVagri) was calculated as shown in the formula 3 for each household surveyed. Once the index value (IV) was calculated separately for the three components, the overall average index value (OAIV) was derived by using the formula 4 for each household surveyed.
Independent Variables
Eighteen explanatory variables were selected (table 3). Multi-collinearity test was performed to see whether the selected independent variables are correlated to one
another. The correlation matrix presented in Table 4 shows that multi-collinearity was a bit of concern, since some of the explanatory variables were strongly corre-lated with each other. The test revealed that the vari-ables X13 & X14 and X4 & X5 (table 3) were found to be highly correlated and therefore two variables X13 and X4 were dropped from the model since they showed low degree of correlation with the dependant variable (Tables 3 & 4). Altogether nine variables were found to be highly correlated with the dependent variable and less corre-lated with independent variables. They included: educa-tion (X1), labour force (X5), farm size (X6), distance of home to government forest (X7), availability of irrigation water (X12), household’s experience in agroforestry (X14), training (X16), visits by extension workers (X17) and expenditure on farm input purchase (X18).
Model Verification
Once the model was developed with this index value taking as a response variable, it was tested at the field level whether the index value represented the adoption of AFLMP. This was done through a comparison between model findings with the field reality.
Results
Nine independent variables that were strongly correlated with the dependent variable, (adoption of agroforestry based land management practice, Y) were entered step by step in the regression model. Except the variable, ‘training’, all the remaining eight variables had signifi-cantly influenced the adoption of agroforestry based land management practice (table 5). The model has increased its explanatory power with addition of explana-tory variables. While all variables included, the power of the model has increased from 44.9 to 74.9%. The model has a very high explanatory power since about 75 % of variation in adoption of AF based land management practice (AFLMP) is explained by the model.
Even though the addition of two variables, ‘household’s experience in agroforestry’ and ‘distance of home to government forest’ have significantly influenced the adoption, the overall increase in adjusted R square is visibly low indicating that a very slight variation is explained by these two variables in adoption of AFLMP. The regression analysis revealed that adoption of AFLMP is significantly influenced by eight variables namely, ‘farm size’, ‘ availability of irrigation water’, ‘education’, ‘agricul-tural labour force’, ‘frequency of visits’, ‘expenditure on farm input purchase’, ‘household’s experience in agrofor-estry’, and ‘distance of home to government forest’. Out of eight variables, ‘farm size’ played the most powerful role in explaining the variation in adoption. About 45% variation is explained by the farm size alone in farmer’s decision of AFLMP adoption. In other words, out of the total variation that the model could explain, nearly 60%
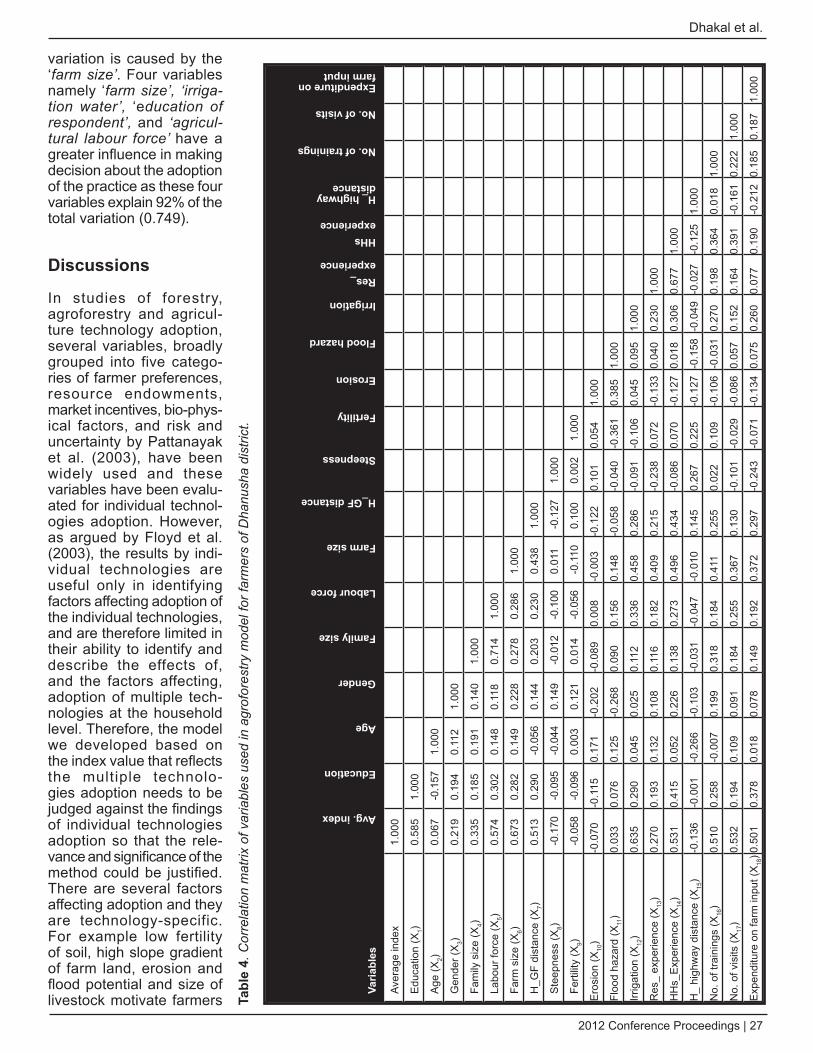
2012 Conference Proceedings | 27
Dhakal et al.
variation is caused by the ‘farm size’. Four variables namely ‘farm size’, ‘irriga-tion water’, ‘education of respondent’, and ‘agricul-tural labour force’ have a greater influence in making decision about the adoption of the practice as these four variables explain 92% of the total variation (0.749).
Discussions
In studies of forestry, agroforestry and agricul-ture technology adoption, several variables, broadly grouped into five catego-ries of farmer preferences, resource endowments, market incentives, bio-phys-ical factors, and risk and uncertainty by Pattanayak et al. (2003), have been widely used and these variables have been evalu-ated for individual technol-ogies adoption. However, as argued by Floyd et al. (2003), the results by indi-vidual technologies are useful only in identifying factors affecting adoption of the individual technologies, and are therefore limited in their ability to identify and describe the effects of, and the factors affecting, adoption of multiple tech-nologies at the household level. Therefore, the model we developed based on the index value that reflects the multiple technolo-gies adoption needs to be judged against the findings of individual technologies adoption so that the rele-vance and significance of the method could be justified. There are several factors affecting adoption and they are technology-specific. For example low fertility of soil, high slope gradient of farm land, erosion and flood potential and size of livestock motivate farmers
Varia
bles
Avg. index
Education
Age
Gender
Family size
Labour force
Farm size
H_GF distance
Steepness
Fertility
Erosion
Flood hazard
Irrigation
Res_experience
HHsexperience
H_ highway distance
No. of trainings
No. of visits
Expenditure on farm input
Aver
age
inde
x1.
000
Edu
catio
n (X
1)0.
585
1.00
0
Age
(X2)
0.06
7-0
.157
1.00
0
Gen
der (
X3)
0.21
90.
194
0.11
21.
000
Fam
ily s
ize
(X4)
0.33
50.
185
0.19
10.
140
1.00
0
Labo
ur fo
rce
(X5)
0.57
40.
302
0.14
80.
118
0.71
41.
000
Farm
siz
e (X
6) 0.
673
0.28
20.
149
0.22
80.
278
0.28
61.
000
H_G
F di
stan
ce (X
7)0.
513
0.29
0-0
.056
0.14
40.
203
0.23
00.
438
1.00
0
Ste
epne
ss (X
8)-0
.170
-0.0
95-0
.044
0.14
9-0
.012
-0.1
000.
011
-0.1
271.
000
Ferti
lity
(X9)
-0.0
58-0
.096
0.00
30.
121
0.01
4-0
.056
-0.1
100.
100
0.00
21.
000
Ero
sion
(X10
)-0
.070
-0.1
150.
171
-0.2
02-0
.089
0.00
8-0
.003
-0.1
220.
101
0.05
41.
000
Floo
d ha
zard
(X11
)0.
033
0.07
60.
125
-0.2
680.
090
0.15
60.
148
-0.0
58-0
.040
-0.3
610.
385
1.00
0
Irrig
atio
n (X
12)
0.63
50.
290
0.04
50.
025
0.11
20.
336
0.45
80.
286
-0.0
91-0
.106
0.04
50.
095
1.00
0
Res
_ ex
perie
nce
(X13
)0.
270
0.19
30.
132
0.10
80.
116
0.18
20.
409
0.21
5-0
.238
0.07
2-0
.133
0.04
00.
230
1.00
0
HH
s_E
xper
ienc
e (X
14)
0.53
10.
415
0.05
20.
226
0.13
80.
273
0.49
60.
434
-0.0
860.
070
-0.1
270.
018
0.30
60.
677
1.00
0
H_
high
way
dis
tanc
e (X
15)
-0.1
36-0
.001
-0.2
66-0
.103
-0.0
31-0
.047
-0.0
100.
145
0.26
70.
225
-0.1
27-0
.158
-0.0
49-0
.027
-0.1
251.
000
No.
of t
rain
ings
(X16
)0.
510
0.25
8-0
.007
0.19
90.
318
0.18
40.
411
0.25
50.
022
0.10
9-0
.106
-0.0
310.
270
0.19
80.
364
0.01
81.
000
No.
of v
isits
(X17
)0.
532
0.19
40.
109
0.09
10.
184
0.25
50.
367
0.13
0-0
.101
-0.0
29-0
.086
0.05
70.
152
0.16
40.
391
-0.1
610.
222
1.00
0
Exp
endi
ture
on
farm
inpu
t (X
18)0
.501
0.37
80.
018
0.07
80.
149
0.19
20.
372
0.29
7-0
.243
-0.0
71-0
.134
0.07
50.
260
0.07
70.
190
-0.2
120.
185
0.18
71.
000
Tabl
e 4.
Cor
rela
tion
mat
rix o
f var
iabl
es u
sed
in a
grof
ores
try m
odel
for f
arm
ers
of d
hanu
sha
dist
rict.
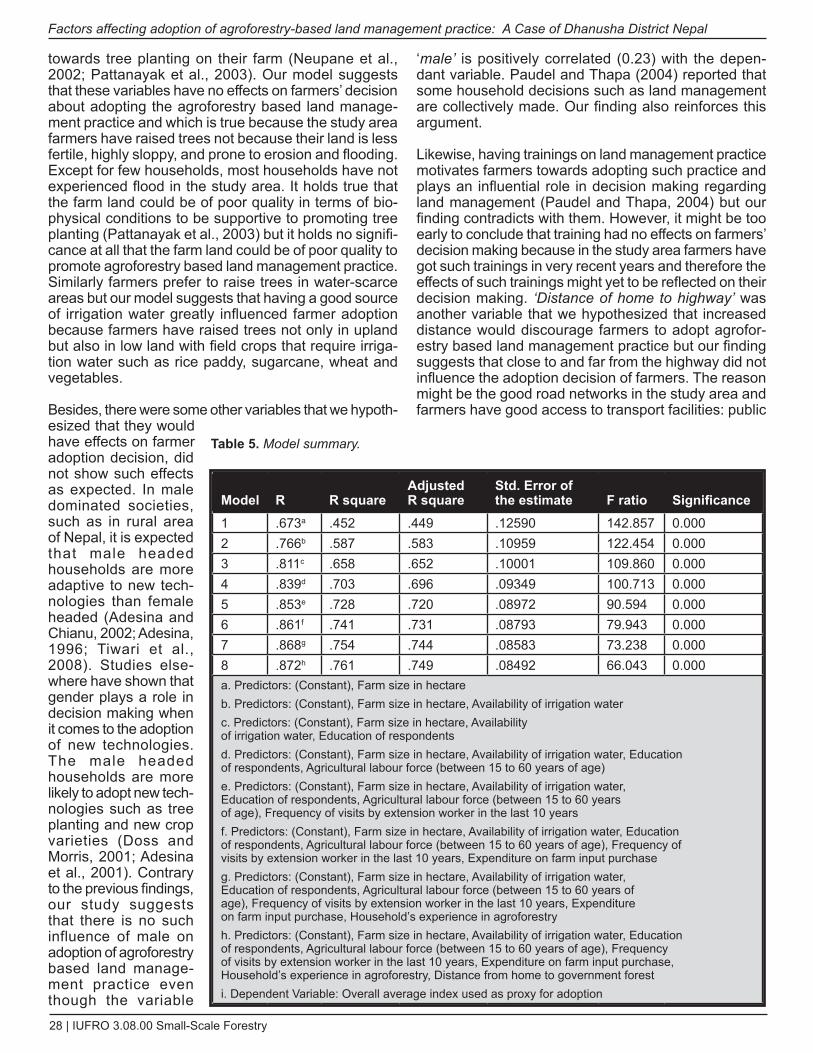
28 | IUFRO 3.08.00 Small-Scale Forestry
Factors affecting adoption of agroforestry-based land management practice: A Case of dhanusha district Nepal
towards tree planting on their farm (Neupane et al., 2002; Pattanayak et al., 2003). Our model suggests that these variables have no effects on farmers’ decision about adopting the agroforestry based land manage-ment practice and which is true because the study area farmers have raised trees not because their land is less fertile, highly sloppy, and prone to erosion and flooding. Except for few households, most households have not experienced flood in the study area. It holds true that the farm land could be of poor quality in terms of bio-physical conditions to be supportive to promoting tree planting (Pattanayak et al., 2003) but it holds no signifi-cance at all that the farm land could be of poor quality to promote agroforestry based land management practice. Similarly farmers prefer to raise trees in water-scarce areas but our model suggests that having a good source of irrigation water greatly influenced farmer adoption because farmers have raised trees not only in upland but also in low land with field crops that require irriga-tion water such as rice paddy, sugarcane, wheat and vegetables.
Besides, there were some other variables that we hypoth-esized that they would have effects on farmer adoption decision, did not show such effects as expected. In male dominated societies, such as in rural area of Nepal, it is expected that male headed households are more adaptive to new tech-nologies than female headed (Adesina and Chianu, 2002; Adesina, 1996; Tiwari et al., 2008). Studies else-where have shown that gender plays a role in decision making when it comes to the adoption of new technologies. The male headed households are more likely to adopt new tech-nologies such as tree planting and new crop varieties (Doss and Morris, 2001; Adesina et al., 2001). Contrary to the previous findings, our study suggests that there is no such influence of male on adoption of agroforestry based land manage-ment practice even though the variable
‘male’ is positively correlated (0.23) with the depen-dant variable. Paudel and Thapa (2004) reported that some household decisions such as land management are collectively made. Our finding also reinforces this argument.
Likewise, having trainings on land management practice motivates farmers towards adopting such practice and plays an influential role in decision making regarding land management (Paudel and Thapa, 2004) but our finding contradicts with them. However, it might be too early to conclude that training had no effects on farmers’ decision making because in the study area farmers have got such trainings in very recent years and therefore the effects of such trainings might yet to be reflected on their decision making. ‘distance of home to highway’ was another variable that we hypothesized that increased distance would discourage farmers to adopt agrofor-estry based land management practice but our finding suggests that close to and far from the highway did not influence the adoption decision of farmers. The reason might be the good road networks in the study area and farmers have good access to transport facilities: public
Model R R square Adjusted R square
Std. Error of the estimate F ratio Significance
1 .673a .452 .449 .12590 142.857 0.0002 .766b .587 .583 .10959 122.454 0.0003 .811c .658 .652 .10001 109.860 0.0004 .839d .703 .696 .09349 100.713 0.0005 .853e .728 .720 .08972 90.594 0.0006 .861f .741 .731 .08793 79.943 0.0007 .868g .754 .744 .08583 73.238 0.0008 .872h .761 .749 .08492 66.043 0.000a. Predictors: (Constant), Farm size in hectareb. Predictors: (Constant), Farm size in hectare, Availability of irrigation water c. Predictors: (Constant), Farm size in hectare, Availability of irrigation water, Education of respondents d. Predictors: (Constant), Farm size in hectare, Availability of irrigation water, Education of respondents, Agricultural labour force (between 15 to 60 years of age)e. Predictors: (Constant), Farm size in hectare, Availability of irrigation water, Education of respondents, Agricultural labour force (between 15 to 60 years of age), Frequency of visits by extension worker in the last 10 yearsf. Predictors: (Constant), Farm size in hectare, Availability of irrigation water, Education of respondents, Agricultural labour force (between 15 to 60 years of age), Frequency of visits by extension worker in the last 10 years, Expenditure on farm input purchaseg. Predictors: (Constant), Farm size in hectare, Availability of irrigation water, Education of respondents, Agricultural labour force (between 15 to 60 years of age), Frequency of visits by extension worker in the last 10 years, Expenditure on farm input purchase, Household’s experience in agroforestryh. Predictors: (Constant), Farm size in hectare, Availability of irrigation water, Education of respondents, Agricultural labour force (between 15 to 60 years of age), Frequency of visits by extension worker in the last 10 years, Expenditure on farm input purchase, Household’s experience in agroforestry, Distance from home to government foresti. Dependent Variable: Overall average index used as proxy for adoption
Table 5. Model summary.
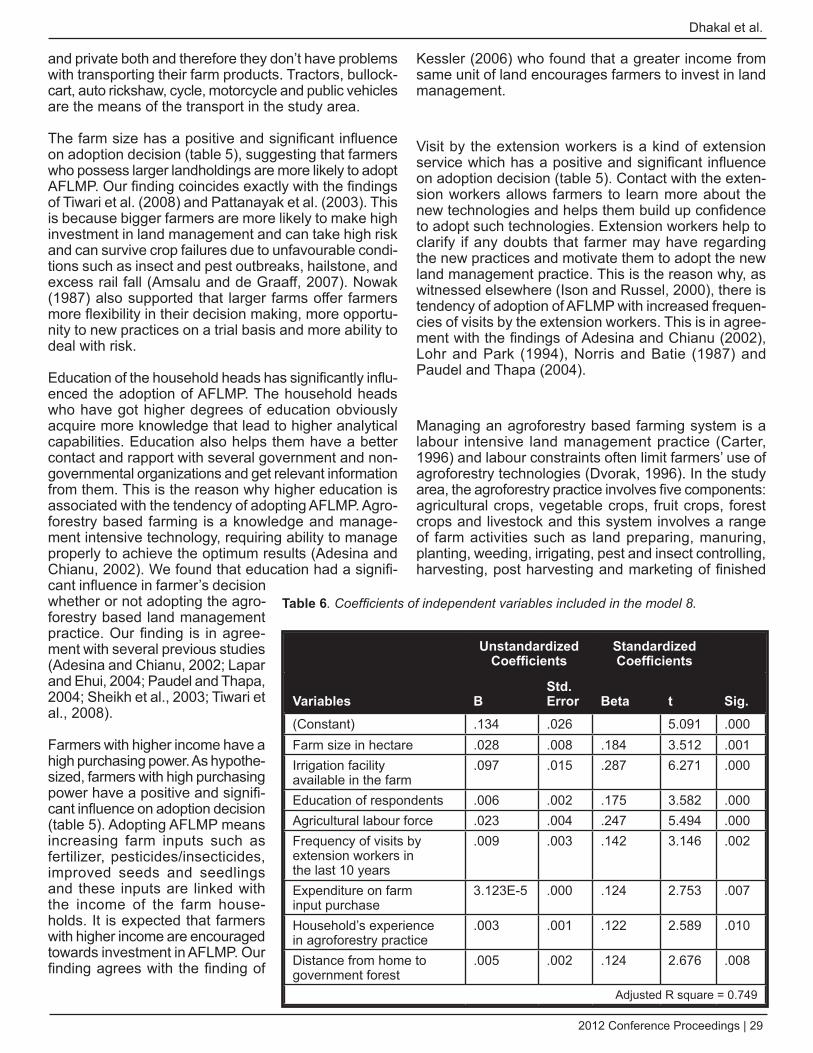
2012 Conference Proceedings | 29
Dhakal et al.
and private both and therefore they don’t have problems with transporting their farm products. Tractors, bullock-cart, auto rickshaw, cycle, motorcycle and public vehicles are the means of the transport in the study area.
The farm size has a positive and significant influence on adoption decision (table 5), suggesting that farmers who possess larger landholdings are more likely to adopt AFLMP. Our finding coincides exactly with the findings of Tiwari et al. (2008) and Pattanayak et al. (2003). This is because bigger farmers are more likely to make high investment in land management and can take high risk and can survive crop failures due to unfavourable condi-tions such as insect and pest outbreaks, hailstone, and excess rail fall (Amsalu and de Graaff, 2007). Nowak (1987) also supported that larger farms offer farmers more flexibility in their decision making, more opportu-nity to new practices on a trial basis and more ability to deal with risk.
Education of the household heads has significantly influ-enced the adoption of AFLMP. The household heads who have got higher degrees of education obviously acquire more knowledge that lead to higher analytical capabilities. Education also helps them have a better contact and rapport with several government and non-governmental organizations and get relevant information from them. This is the reason why higher education is associated with the tendency of adopting AFLMP. Agro-forestry based farming is a knowledge and manage-ment intensive technology, requiring ability to manage properly to achieve the optimum results (Adesina and Chianu, 2002). We found that education had a signifi-cant influence in farmer’s decision whether or not adopting the agro-forestry based land management practice. Our finding is in agree-ment with several previous studies (Adesina and Chianu, 2002; Lapar and Ehui, 2004; Paudel and Thapa, 2004; Sheikh et al., 2003; Tiwari et al., 2008).
Farmers with higher income have a high purchasing power. As hypothe-sized, farmers with high purchasing power have a positive and signifi-cant influence on adoption decision (table 5). Adopting AFLMP means increasing farm inputs such as fertilizer, pesticides/insecticides, improved seeds and seedlings and these inputs are linked with the income of the farm house-holds. It is expected that farmers with higher income are encouraged towards investment in AFLMP. Our finding agrees with the finding of
Kessler (2006) who found that a greater income from same unit of land encourages farmers to invest in land management.
Visit by the extension workers is a kind of extension service which has a positive and significant influence on adoption decision (table 5). Contact with the exten-sion workers allows farmers to learn more about the new technologies and helps them build up confidence to adopt such technologies. Extension workers help to clarify if any doubts that farmer may have regarding the new practices and motivate them to adopt the new land management practice. This is the reason why, as witnessed elsewhere (Ison and Russel, 2000), there is tendency of adoption of AFLMP with increased frequen-cies of visits by the extension workers. This is in agree-ment with the findings of Adesina and Chianu (2002), Lohr and Park (1994), Norris and Batie (1987) and Paudel and Thapa (2004).
Managing an agroforestry based farming system is a labour intensive land management practice (Carter, 1996) and labour constraints often limit farmers’ use of agroforestry technologies (Dvorak, 1996). In the study area, the agroforestry practice involves five components: agricultural crops, vegetable crops, fruit crops, forest crops and livestock and this system involves a range of farm activities such as land preparing, manuring, planting, weeding, irrigating, pest and insect controlling, harvesting, post harvesting and marketing of finished
Unstandardized
CoefficientsStandardized Coefficients
Variables BStd. Error Beta t Sig.
(Constant) .134 .026 5.091 .000Farm size in hectare .028 .008 .184 3.512 .001Irrigation facility available in the farm
.097 .015 .287 6.271 .000
Education of respondents .006 .002 .175 3.582 .000Agricultural labour force .023 .004 .247 5.494 .000Frequency of visits by extension workers in the last 10 years
.009 .003 .142 3.146 .002
Expenditure on farm input purchase
3.123E-5 .000 .124 2.753 .007
Household’s experience in agroforestry practice
.003 .001 .122 2.589 .010
Distance from home to government forest
.005 .002 .124 2.676 .008
Adjusted R square = 0.749
Table 6. Coefficients of independent variables included in the model 8.
30 | IUFRO 3.08.00 Small-Scale Forestry
Factors affecting adoption of agroforestry-based land management practice: A Case of dhanusha district Nepal
products such as timber, fruits, vegetables, and agricul-tural crops. These activities demand higher labour force. Therefore, we hypothesized ‘agricultural labour force’ as a predicting variable of adoption. As expected we found that the labour size had a positive and significant influ-ence on adoption of such an integrated land manage-ment practice. This is similar to the findings of Adesina and Chianu (2002) and Paudel and Thapa (2004).
‘Availability of irrigation water’, ‘household’s experience in agro-forestry’ and ‘distance of home to government forest’ has also significantly influenced the adoption decision (table 5). Agroforestry based farming system being an intensive type of farming, irrigation is very much necessary to maintain the farm productivity and there-fore farmers who have got the regular source of water for irrigation are more likely to adopt this kind of land management practice. Likewise, farmers who have got a long experience in agro-forestry may have accumulated more knowledge of benefits of such land management practice from their accumulative years of experience and that motivates farmers to adopt more integrated land use system such as agro-forestry based land management. The variable, ‘distance of home to government forest’ is one of the least influential predicting variables of the model (table 5). The household that are located far from the nearby forest tend to promoting trees on their farms (Sapkota and Oden, 2008) and the extent of tree planting is influenced by the livestock size (Neupane et al., 2002). Since our study covers the adoption of multiple technol-ogies including field crops varieties, which have nothing to do with distance of home to forest and therefore, this variable might have the lowest explanatory power on the farmers’ decision of adoption of such a complex agro-forestry based land management. There is a tendency of introducing tree crops within the farming system as the distance of home to government forest increases because the people living adjacent to an access forest like government forest can get their basic needs of timber, fuel-wood, fodder and other non-timber products from there quite easily and therefore they are reluctant to tree planting in the farm.
Conclusions
Our model clearly indicates that the variables which are significant in case of single technology adoption were non-significant in case of farmer’s decision about multiple technologies adoption such as agroforestry based land management practice. Since we verified the model results with the field situation and found to be representing the ground reality, we can conclude that the overall average index value (OAIV) more truly reflected the proxy measure of the adoption of agroforestry based land management practice rather than simply using the tree variable. The findings of such model would have wider applicability than that of technology specific model (Floyd et al., 2003). Policy recommendation based on
such model could reflect the ground reality at house-hold level and such policy intervention would be more successful.
The model clearly suggests adoption of agro-forestry based land management practice was significantly influenced by a range of factors. The multiple regres-sion analysis revealed that AFLMP was significantly influenced by farm size, education, expenditure in farm input purchase, availability of irrigation water, agricultural labour force, frequency of visits by extension workers, household’s experience in agro-forestry, and distance of home to the government forest.
It appears that knowledge base of the farmers greatly influence the adoption decision. Therefore, efforts to promote agro-forestry based land management practice should focus on interaction between farmers and exten-sion workers so that farmers could get access to infor-mation regarding new farming technology that enhances the farm productivity and supports in mitigating land degradation. It is clear from the model that level of adoption of AFLMP tends to decrease as household is closer to the open access forest and therefore focus should be towards formulating the policies that can motivate the farmers living close to the forest towards adopting AFLMP. Such policy effort will not only support in conserving forest resource and hence enhancing carbon sequestration but also support in restoring land productivity of the farm.
Analysis and presentation of results by individual tech-nologies, while useful in identifying factors and effects related to the individual technologies, is therefore limited in its ability to identify and describe the effects of, and the factors affecting, adoption at the household level. Therefore, we believe that the model we developed using the index value could better serve the purpose of analysing the factors influencing adoption decision of farmers who have promoted a number of farming tech-nologies. Although this research is directly applicable to the study site, more specifically to the households sampled in Dhanusha District, the findings could be helpful in understanding what could be the drivers that lead to adoption of the more integrated farming system such as agroforestry in similar areas ( in Nepal’s terai, Sothern Asia, and Sub-tropical developing countries).
Acknowledgements
This research work was financially supported by the University of Southern Queensland (USQ), Faculty of Business and Law. The authors acknowledge the contri-bution of the Terai Private Forest Development Asso-ciation (TPFDA) and Nepal Agroforestry Foundation (NAF) and their staffs for their support during data collec-tion. We truly appreciate the comments of anonymous reviewers. All remaining mistakes are the responsibility of the authors.
2012 Conference Proceedings | 31
Dhakal et al.
References
Adesina, A., Chianu, J., 2002. determinants of farmers’ adoption and adaptation of alley farming technology in Nigeria. Agroforestry systems 55 (2), 99-112.
Adesina, A. A., 1996. Factors affecting the adoption of fertil-izers by rice farmers in Côte d’Ivoire. Nutrient Cycling in Agroecosystems 46 (1), 29-39.
Adesina, A. A., Baidu-Forson, J., 1995. Farmers’ perceptions and adoption of new agricultural technology: evidence from analysis in Burkina Faso and Guinea, West Africa. Agricul-tural Economics 13 (1), 1-9.
Adesina, A. A. , Mbila, d., Nkamleu, G. B., Endamana, d., 2001. Econometric analysis of the determinants of adoption of alley farming by farmers in the forest zone of southwest Cameroon. Agriculture, Ecosystems and Environment 80 (3), 255-265.
Ali, A. M. S., 1995. Population pressure, environmental constraints and agricultural change in Bangladesh: examples from three agroecosystems. Agriculture, Ecosystems and Environment 55 (2), 95-109.
Amsalu, A., de Graaff, J., 2007. determinants of adoption and continued use of stone terraces for soil and water conservation in an Ethiopian highland watershed. Ecolog-ical Economics 61 (2-3), 294-302.
Anley, Y., Bogale, A., Haile-Gabriel, A., 2007. Adoption decision and use intensity of soil and water conservation measures by smallholder subsistence farmers in dedo district, Western Ethiopia. Land degradation and devel-opment 18 (3), 289-302.
Binswanger, H. P., Ruttan, V. W., 1978. Induced innovation: technology, institutions, and development, Johns Hopkins University Press Baltimore, Md.
Boserup, E., Kaldor, N., 1965. The conditions of agricultural growth, Aldine Chicago.
Brady, N. C., 1996. Alternatives to slash-and-burn: a global imperative. Agriculture, Ecosystems and Environment 58 (1), 3-11.
Brodt, S., Klonsky, K., Jackson, L., Brush, S., Smukler, S., 2009. Factors affecting adoption of hedgerows and other biodiversity-enhancing features on farms in California, USA. Agroforestry systems 76 (1), 195-206.
Brush, S. B., 1987. Comparative farming systems, The Guilford Press.
Carter, J., 1996. Alley farming: Have resource-poor farmers benefited? Agroforestry Today 8, 5-7.
Current, D., Lutz, E. Scherr, S. J., 1995. Costs, benefits, and farmer adoption of agroforestry: Project experience in Central America and the Caribbean, World Bank Publi-cations.
Cutter, B., Rahmadi, A., Kurtz, W., Hodge, S., 1999. State policies for agroforestry in the United States. Agroforestry systems 46 (3), 217-227.
DDC, 2009. District profile of Dhanusha District. District Administration Office, Dhanusha, Nepal.
Dhakal, A., Cockfield, G., Maraseni T. N., 2012. Evolution of agroforestry based farming systems: a case of dhanusha district Nepal. Agroforestry systems. doi: 10.1007/S10457-012-9504-x
doss, C. R., Morris, M. L., 2001. How does gender affect the adoption of agricultural innovation? The case of improved maize technology in Ghana. Agricultural Economics 25, 27–39.
dvorak, K., 1996.’Adoption potential of alley cropping. Final Project Report. Resource and Crop Management Research Monograph.
Ervin, C. A., Ervin, d. E., 1982. Factors affecting the use of soil conservation practices: hypotheses, evidence, and policy implications. Land Economics 58 (3), 277-292.
Floyd, C., Harding, A. H., Paudel, K. C., Rasali, d. P., Subedi, K., Subedi, P. P., 2003. Household adoption and the associated impact of multiple agricultural technologies in the western hills of Nepal. Agricultural Systems 76 (2), 715-738.
Garforth, C., Malla, Y., Neopane, R., Pandit, B., 1999. Socio-economic factors and agro-forestry improvements in the hills of Nepal. Mountain Research and development 19 (3), 273-278.
Giampietro, M., 1997. Socioeconomic pressure, demographic pressure, environmental loading and technological changes in agriculture. Agriculture, Ecosystems and Environment 65 (3), 201-229.
Hayami, Y., Ruttan, V. W., 1971. Agricultural development: an international perspective. Baltimore, Md/London: The Johns Hopkins Press
Ison, R. L., Russell, d. B., 2000. Agricultural extension and rural development: breaking out of traditions: a second-order systems perspective, Cambridge University Press.
Kessler, C. A., 2006. Decisive key-factors influencing farm households’ soil and water conservation investments. Applied Geography 26 (1), 40-60.
Lapar, M. L. A., Ehui, S. K., 2004. Factors affecting adoption of dual-purpose forages in the Philippine uplands. Agricul-tural Systems 81 (2), 95-114.
Lassoie, J., Buck, L., 1999. Exploring the opportunities for agroforestry in Changing rural landscapes in North America. Agroforestry systems 44 (2-3), 107-108.
Lohr, L., Park, T., 1994. discrete/continuous choices in contin-gent valuation surveys: Soil conservation decisions in Michigan. Review of Agricultural Economics 16 (1), 1-15.
Mahat, T. B. S., Griffin D. M., Shepherd K. R., 1987. Human impact on some forests of the middle hills of Nepal: forest in subsistence economy of Sindhupalchok and Kabhrepalan-chok. Mountain Research and development 7 (1), 53 -70.
32 | IUFRO 3.08.00 Small-Scale Forestry
Factors affecting adoption of agroforestry-based land management practice: A Case of dhanusha district Nepal
Mehta, J. N., Kellert, S. R., 1998. Local attitudes toward community-based conservation policy and programmes in Nepal: a case study in the Makalu-Barun Conservation Area. Environmental Conservation 25 (4), 320-333.
Mercer, d., Miller, R., 1998. Socioeconomic research in agroforestry: progress, prospects, priorities. Agroforestry systems 38 (1-3),177-193.
Michon, G., de Foresta, H., 1999. Agro-Forests: Incorporating a Forest Vision in Agroforestry. Agroforestry in sustainable agricultural systems 381-404.
Nair, P. K. R., 1996. Agroforestry directions and literature trends. Cornell University Press, Ithaca, New York, USA.
Nair, P. K. R., 1985. Classification of agroforestry systems. Agroforestry systems 3 (2), 97-128.
Neupane, R. P., Sharma, K. R., Thapa, G. B., 2002. Adoption of agroforestry in the hills of Nepal: a logistic regression analysis. Agricultural Systems 72 (3), 177-196.
Norris, P. E., Batie, S. S., 1987. Virginia farmers’ soil conser-vation decisions: An application of Tobit analysis. Southern Journal of Agricultural Economics 19 (1), 79-90.
Pattanayak, S., Mercer, d. E., Sills, E., Yang, J. C., 2003. Taking stock of agroforestry adoption studies. Agroforestry systems 57 (3), 173-186.
Paudel, G. S., Thapa, G. B., 2004. Impact of social, institu-tional and ecological factors on land management practices in mountain watersheds of Nepal. Applied Geography 24 (1), 35-55.
Pingali, P. L., Bigot, Y., Binswanger, H. P., 1987. Agricultural mechanization and the evolution of farming systems in sub-Saharan Africa, Johns Hopkins University Press.
Ransom, J. K., Paudyal, K., Adhikari, K., 2003. Adoption of improved maize varieties in the hills of Nepal. Agricultural Economics 29 (3), 299-305.
Rasul, G., Thapa, G. B. 2003. Shifting cultivation in the moun-tains of South and Southeast Asia: regional patterns and factors influencing the change. Land Degradation and development 14 (5), 495-508.
Rauniyar, G. P., 1998. Adoption of management and techno-logical practices by fishpond operators in Nepal. Aquacul-ture Economics and Management 2 (3), 89-99.
Rogers, E. M., Shoemaker, F. F., 1971. Communication of Innovations: A Cross-Cultural Approach. The Free Press, 866 Third Avennue, New York, 10022.
Ruttan, V. W., 1997. Induced innovation, evolutionary theory and path dependence: sources of technical change. The Economic Journal 107 (444), 1520-1529.
Sanchez, P., 1995. Science in agroforestry. Agroforestry systems 30 (1), 5-55.
Sapkota, I., Oden, P., 2008. Household characteristics and dependency on community forests in Terai of Nepal. Inter-national Journal of Social Forestry1 (2), 123-144.
Sheikh, A. d., Rehman, T., Yates, C. M., 2003. Logit models for identifying the factors that influence the uptake of new ‘no-tillage’ technologies by farmers in the rice-wheat and the cotton-wheat farming systems of Pakistan’s Punjab. Agricultural Systems 75 (1), 79-95.
Sood, K., Mitchell, C., 2009. Identifying important biophysical and social determinants of on-farm tree growing in subsis-tence-based traditional agroforestry systems. Agroforestry systems 75 (2), 175-187.
Tiwari, K., Sitaula, B., Nyborg, I., Paudel, G., 2008. determi-nants of farmers’ adoption of improved soil conservation technology in a middle mountain watershed of central Nepal. Environmental Management 42 (2), 210-222.
Valdivia, C., Poulos, C., 2009. Factors affecting farm oper-ators’ interest in incorporating riparian buffers and forest farming practices in northeast and southeast Missouri. Agro-forestry systems 75 (1), 61-71
2012 Conference Proceedings | 33
Introduction
There is growing interest among private landowners to diversify the benefits of their property through multiple-use management. Often landowners desire the ability to receive regular income from their property, in addition to traditional timber production. Multiple-use manage-ment has the potential for increased productivity, addi-tional and more regular income, and improved environ-mental conditions on private forestland by promoting uses like pine straw production, wildlife habitat, live-stock forage, watershed management, aesthetics, and recreation in addition to timber production. However, small-scale private landowners often have limited infor-mation regarding how to plan for management of these benefits.Effective management begins with a good plan. A map is one of the most important tools a rural or urban forest landowner needs for planning and management especially when planning for multiple uses. Mapping
and spatial resources like Geographical Information Systems (GIS) and Global Position System (GPS) units continue to be unknown or considered too complicated to use. Many landowners have a consumer mindset, and online mapping and spatial resources can provide them with the information necessary to make more informed, economical, and ecological decisions about how to manage their property and market it for a variety of uses. This is especially true for landowners in the southeastern United States interested in conservation and restoration.
Longleaf Pine Restoration
Longleaf pine (Pinus palustris Mill.) restoration is a commonly heard buzz word across the southeastern United States today. The longleaf pine ecosystem that once dominated the southern landscape has been deci-
Using GIS to Benefit Family Forests: It’s More Than You Think John C. Gilbert1, John S. Kush2, and Rebecca J. Barlow,3
1 Longleaf Pine Stand Dynamics Laboratory, Auburn University School of Forestry and Wildlife Sciences, 3301 Forestry and Wildlife, Auburn University, AL, 36849 USA, [email protected]
2 Longleaf Pine Stand Dynamics Laboratory, Auburn University School of Forestry and Wildlife Sciences, 3301 Forestry and Wildlife, Auburn University, AL, 36849 USA, [email protected]
3 Alabama Cooperative Extension System and Longleaf Pine Stand Dynamics Laboratory, Auburn University School of Forestry and Wildlife Sciences, 3301 Forestry and Wildlife, Auburn University, AL, 36849 USA, [email protected]
Keywords: longleaf pine, Pinus palustris, GIS
Abstract
There is growing interest among private landowners to diversify the benefits derived from their property. This is especially true for small-scale private landowners, where traditional timber production alone might be difficult with the current economy. Multiple-use management and creating landowner cooperative networks has the potential for increased productivity, additional and more regular income, and improved environmental conditions for private forestland. Geographical Information Systems (GIS) can be used to facilitate landowner efforts by assisting land-owners with basic mapping skills, identifying opportunities for local markets, and creating landowner networks.
In the southeastern United States, ongoing efforts to restore longleaf pine forests (Pinus palustris Mill.) are building momentum with plans to more than double the current acreage of the species. The majority of current forests are privately owned, isolated fragments where millions of acres once existed. The success of restoration efforts beyond one rotation is dependent on sustainable restoration and conservation practices that promote natural regeneration and the use of prescribed fire in existing stands and for future plantations. These activities may be difficult for small-scale private landowners without landowner cooperation. This presentation will focus on using GIS to facilitate multiple-use management and landowner cooperation for small-scale private landowners by building upon a database of existing longleaf pine stands and landowners. The database will be used to connect landowners and identify opportunities for sustainable management, cooperative agreements, and education.
34 | IUFRO 3.08.00 Small-Scale Forestry
Using GIS to Benefit Family Forests: It’s More Than You Think
mated to isolated fragments representing only about 3 percent of the once 90 million acres it occupied (Frost 1993). Wahlenberg (1946) describes how the virgin forest was lost in the late 1800’s and early 1900’s without concern for any type of regeneration to logging and to the poor implementation of fire or fire suppression. These lessons of the past were not learned or prac-ticed, and the acts of mismanagement have continued, creating the results and conditions that continue to be a challenge for modern forestry. Sadly, the restoration of longleaf pine ecosystems has become an unfortunate but very common topic due to the condition of longleaf pine ecosystems today.
When thinking about restoring ecosystems, it is important to understand what an ecosystem represents. Kimmins (1997) describes an ecosystem as a concept composed of five attributes including structure, function, complexity, interaction and interdependency, and temporal change. One of the key factors that drives the longleaf pine ecosystem and is related to all five attributes is fire. Chapman (1932) defines the longleaf pine forest type as a climax with fire being as important to the system as the soil and climate. Without fire, on a frequent basis, the longleaf pine ecosystem will be converted to another forest type like a mixed hardwood forest, which will disrupt the attributes of the functioning ecosystem (Chapman 1932, Wahlenberg 1946). The current status of longleaf pine stands today shows that the warnings of the past were ignored. Outcalt (2000) looked at a sample of the Forest Inventory Analysis dataset from the USDA Forest Service to evaluate if prescribed fire was being used in longleaf pine stands in Florida, Georgia, South Carolina, and North Carolina. He reported that although it varied by state, about half of the evaluated longleaf pine stands were being burned at greater than 5 year intervals, if they were being burned at all. For any longleaf pine restoration effort to be successful, it is imperative to know where longleaf pine stands are on the ground and the condition of the stands.
There has been a surge of interest in longleaf pine restoration over the past decade and the momentum continues to build. A conservation plan released by Amer-ica’s Longleaf in 2009 set a goal of more than doubling an estimated 3.4 million acres of longleaf pine to 8 million acres over 15 years (America’s Longleaf Restoration Initiative 2009). Efforts to restore the ecosystem across the different types of landownership are driven by a multi-tude of factors including but not limited to restoring the natural ecosystem, growing high quality wood products, producing non-timber commodities like grazing and pine straw, aesthetics, and increasing threatened and endan-gered species (T&E) habitat. The ongoing restoration movement in the longleaf pine community needs to emphasize restoring functional longleaf pine ecosys-tems across its historic range by capturing landowner interest and promoting sustainability through multple use management.
GIS Database
Preserving, enhancing, and restoring functional longleaf pine ecosystems requires conservation and restora-tion of longleaf ecosystems on both public and private lands, where the majority of the land is under private ownership. A regional GIS database of existing spatial data about longleaf pine is being created to provide a baseline of knowledge and aid in conservation and restoration efforts. The GIS database is being created and continuously updated by collecting and compiling existing available spatial data about longleaf pine stands using the best available technology. This GIS database helps assess the extent and condition of available spatial data on longleaf pine forests, which provides a building block in the restoration of the longleaf pine ecosystem. The success of restoration efforts beyond one rotation is dependent on sustainable restoration and conserva-tion practices that promote natural regeneration and the use of prescribed fire in existing stands and for future plantations. These activities may be difficult for small-scale private landowners without more natural resource education opportunties and landowner cooperation. Over 60% of longleaf pine stands today in private ownership (Miles 2012). Therefore, a priority of working with private landowners is essential to successful conservation and restoration of the longleaf pine ecosystem. GIS will be used to facilitate multiple-use management and land-owner cooperation for small-scale private landowners by building upon a database of existing longleaf pine stands and landowners and by integrating education about available online GIS applications. The database will be used to connect landowners and identify opportu-nities for sustainable management, cooperative agree-ments, and education.
Data Requests
The main portion of this effort began with requesting, collecting, and compiling existing available spatial data for longleaf pine stands from Federal and State agencies, non-government organizations, forest industry, and private landowners. All data were requested at the stand level. Stand level data were selected because it is a familiar term that provides information about longleaf pine “on the ground” that is under the same management. Requests were sent out through broad-cast emails, phone calls, newsletters, flyers at confer-ences or landowner meetings, presentations at regional and international conferences, and through word of mouth. An extensive database of potential data sources and contacts including conservation professionals was built and used to request data. Data were requested and received on a daily basis.
Since ArcGIS was the basis for the database, initial requests centered on shapefiles with metadata for stands of longleaf pine greater than or equal to 500 acres. Due to the lack of existing data for longleaf pine
2012 Conference Proceedings | 35
Gilbert et al.
stands of that size and to various responses from all types of landowners, a broader data request with more detail was created. The data request solicited any spatial data or maps that could be provided for longleaf pine stands. Examples were outlined as GIS files, GPS files, paper maps (aerial photographs or topographic maps), or even legal descriptions. Google Earth was also listed as an option in the data request. All types of longleaf pine stands were accepted including pure, mixed, planted, and natural stands. The request also outlined infor-mation needed to describe stand condition like stand type (planted/natural), stand composition (longleaf pine, longleaf pine/hardwood, etc.), age, density, understory composition, burn history, etc. Additionally, forms were created for planted stands and existing stands. These forms were sent out to help sources organize their data for submission. These forms were also sent out to tree nursery managers to attempt to track seedlings being planted. In addition to the stand data, any spatial data about known populations of T&E species were also collected. With the understanding that data might be sensitive, sources were encouraged to submit data at any scale that was appropriate for the database. Sources were acknowledged for their input or remained anonymous if desired. The option of submitting general locations or fuzzing the locations by buffering or merging stands was also offered as a means of collecting more private landowner or sensitive data.
Data Summary
Building a GIS database of existing spatial data provides many limitations that are necessary for the creation of a baseline. The quantity and quality of data is dependent upon what exists and the success of sources volun-teering data and time. The database contains data for over 1.5 million acres of longleaf pine stands in all nine states of the historic range, representing the most exten-sive collection of stand level data about longleaf pine known. Points and polygons were submitted with and without acreage or other stand condition information. Some complete polygon datasets with metadata data exist, but often partial or incomplete datasets for points or polygons were submitted with various levels of attri-bute data and metadata. In addition to data limitations, misconceptions, and sensitivity of data also limited the data collection.
Point data ranged from coordinates or general legal and location descriptions to shapefiles. Polygon data were composed mostly of shapefiles. Where stand level data were not available, property and proclama-tion boundaries were provided. Polygon data repre-sented 62% of the private lands data and almost all of the public lands data. Polygon data represented 95% of the database, with pubic polygons representing 87% of the entire database. Average stand size submitted to the database was less than 100 acres. Almost all of the data collected included some type of condition infor-
mation ranging from baisc observational data to very detailed stand metrics, but only a small portion of the data contained prescribed fire information.
Stand level data was requested, but these data were often not available. This prompted the use of data request forms and accepting data at various scales and file types. GoogleEarth points and polygons helped data collection especially with private landowners and other sources that did not work with ArcGIS. Data for over 7,500 acres were collected using the data request forms where private landowners did not have any GIS expe-rience. Hundreds of contacts were made with private landowners across the Southeast. A common response from landowners was they were interested in creating maps for their property but often did not know how to get started. This prompted a need for GIS education for private forest landowners.
Online Mapping and Spatial Resources
Through working with the longleaf pine mapping effort and interacting with landowners, the Longleaf Pine Stand Dynamics Lab became interested in creating a timely, readily available, source of information and examples of online spatial resources to help landowners and conser-vation professionals as they make decisions regarding the management of their property. With funding from an Alabama Forests Forever Education Grant, a book titled “Online Mapping and Spatial Resources for the Private Forest Landowner” was developed by Gilbert and Kush (2011). This book focuses on utilizing online mapping and spatial resources to make maps and utilize aerial photography, topographic layers, soils information, data collected with GPS units, and even visual simulations for an area of interest (timber stand, agriculture field, pasture, etc.). The book is designed for beginners and provides keywords, homepage links, tutorial information, examples, and screenshots for online programs like the USDA/NRCS Web Soil Survey, Google Earth, Alabama Historic Aerial Photo Archive, USDA/NRCS Geospatial Data Gateway, and USDA National Agroforestry Center CanVIS. The book can be downloaded on the Longleaf Pine Stand Dynamics Lab website at http://www.lpsdl.auburn.edu/ under recent publications.
Potential uses for these resources include making maps, storing and sharing data, and even creating databases for areas of interest including: timber stands, sensitive areas like stream side management zones (SMZs), stream crossings, logging hazards, logging decks, wildlife food plots, burn plans, roads, agroforestry or silvopasture areas, and recreation areas. The book also provides users with instructions to store descriptive data with the spatial data, which provides more oppor-tunities to capture stand condition information. Digital maps and detailed reports can also be created using these tools.
36 | IUFRO 3.08.00 Small-Scale Forestry
Using GIS to Benefit Family Forests: It’s More Than You Think
Discussion
Two major misconceptions were encountered while collecting longleaf pine stand data. The first miscon-ception was that all longleaf pine stands on public lands have been mapped and have updated existing spatial and stand condition data. The second misconcep-tion was that private landowners do not have existing spatial data about their longleaf pine stands, and if it did exist, it could not be collected and displayed in a public database. Both of the misconceptions were encountered and were major obstacles for data collection. These misconceptions occurred in both the public and private sectors. Data for public lands do exist, but not all longleaf pine stands on public lands have been mapped. Stand condition information does exist for some locations, but it does not exist for all public lands and is often not consis-tent from agency to agency. For the second miscon-ception, private landowners did support the effort and submitted data for the database. However, numerous large and small private landowners did decline to submit data for the database. Fears of government intervention, acquisitions, or restrictions were major reasons noted for not submitting data. These misconceptions and the sensitivity of private landowner data also inhibited some organizations with cost-share programs from submitting data where it was available. The same reasons were also noted for data about T&E species. Concerns from both private and public landowners about data being released to the public were major reasons that limited stand level locations for T&E species. Educating land-owners and land managers about the current state of longleaf pine stand data and how the data can be used for restoration efforts will help to change these miscon-ceptions in the future.
The average stand size of submitted data shows that focusing only on stands 500 acres and larger dramati-cally limits the data that can be collected. Landowners that have been doing restoration on smaller stands need to accounted for to determine if these patchworks of small stands actually represent small corridors across the landscape. Although there are limitations with location information for longleaf pine, the locations of longleaf pine stands are often easier to obtain than stand condition data.
The available data show clusters of longleaf pine stands which can be used to connect landowners and target natural resource education now and into the future. The approaches for restoration projects could be to work in areas where longleaf pine stands have been identi-fied or to work in areas where no longleaf pine stands have been identified yet. Both approaches provide the opportunities to promote education about longleaf pine conservation and restoration, which is needed for all types of landowners and land managers. Private land-owners need to be a priority for natural resource educa-tional efforts because, as the owners of the bulk of the land base, they are the key to restoring the longleaf pine
ecosystem. More education and outreach about longleaf pine management and restoration is needed along with better descriptions of restoration efforts like building corridors and focal areas to overcome these issues. Private landowners also need to be more involved with local and region-wide longleaf pine restoration efforts.
One way to involve landowners in the restoration efforts is to show them how their property fits into a local or regional context. Landowners are interested in creating maps and storing spatial data for their property, but often do not know how to get started. This limits their ability to value the bigger picture of restoration. Incorporating the online spatial resources of other educational oppor-tunities for landowners into the platform of the database provides an opportunity to reach and to connect private landowners and conservation professionals. Enabling landowners to be able to create maps and store spatial data, and share digital information can increase commu-nication, aide management plans, and contribute to the economic and ecological development multiple-use management on small family farms. The expectation is that more knowledge of online spatial tools will provide opportunities for private landowners and conservation professionals to be able create maps, aid management plans, and increase communication that will contribute to the economic and ecological development multiple-use management on small family farms.
Conclusions
The database provides the best foundation of spatial information about longleaf pine stands. It is unique because the focus is on stand level data (i.e. actual acreage on the ground). Maintaining the database is a dynamic process that involves continuously collecting and updating existing spatial data along with mapping new areas. Ground truthing needs to be implemented with basic standard operating procedures for data collec-tion and submission. This is the only way to validate and ensure data quality. With a majority of the land base being privately owned, the future focus needs to concentrate on working with private landowners through promotion of educational and cost-share opportunities for longleaf pine conservation and restoration.
Incorporating the online spatial resources for landowners into the platform of the database provides an opportunity to reach and to connect private landowners and conser-vation professionals now and into the future. Enabling landowners to be able create maps, store spatial data, and share digital information can increase communica-tion, landowner cooperation, aide management plans, and contribute to the economic and ecological devel-opment of multiple-use management on small family farms. The database provides the best existing founda-tion with established name recognition. With promises of continuing support coming from across the range, this

2012 Conference Proceedings | 37
Gilbert et al.
effort has the opportunity to be expanded and imple-mented across the range to create a dynamic conser-vation planning tool for restoring longleaf pine.
References
America’s Longleaf Restoration Initiative. 2009. Range-wide conservation plan for longleaf pine. Report prepared by the Steering Committee of the Regional Working Group for America’s Longleaf. 42p. http://www.americaslongleaf.org/media/86/conservation_plan.pdf. [date accessed: August 14, 2012].
Chapman, H.H. 1932. Is the longleaf type a climax? Ecology 13: 328-334.
Frost, C.C. 1993. Four centuries of changing landscape patterns in the longleaf pine ecosystem. P. 139-158 in Proc. of the Tall Timbers Fire Ecology Conference, No. 18, Longleaf Pine Ecosystem: ecology, restoration and management, Herman, S.M. (ed). Tall Timbers Research Station, Tallahassee, FL.
Gilbert, J.C. and J.S. Kush. 2011. Mapping your land: an overview for landowners. Online mapping and spatial resources for the private landowner. Longleaf Pine Stand dynamics Laboratory. 14 pages. http://www.lpsdl.auburn.edu/pdfs/MappingBook_FINAL.pdf. [date accessed: August 14, 2012].
Kimmins, J.P. 1997. Forest ecology a foundation for sustain-able management. Second edition. Prenice Hall, Upper Saddle River, New Jersey. 596p.
Miles, P.d. 2012. Forest Inventory EVALIdator web-applica-tion version 1.5.1.2. St. Paul, MN: U.S. department of Agri-culture, Forest Service, Northern Research Station. http://apps.fs.fed.us/Evalidator/tmattribute.jsp]. [date accessed: August 13, 2012].
Outcalt, K.W. 2000. Occurrence of fire in longleaf pine stands in the southeastern United States. P 178-182 in Proc. of the Tall Timbers Fire Ecology Conference, No. 21, Fire and forest ecology: innovative silviculture and vegetation management, Moser, K.W., Moser, C.E. (eds). Tall Timbers Research Station, Tallahassee, FL.
Wahlenberg, W.G. 1946. Longleaf pine: its use, ecology, regeneration, protection, growth, and management. Charles Lathrop Pack Forestry Foundation, Washington, dC: 429p.
38 | IUFRO 3.08.00 Small-Scale Forestry
Introduction
Natural resource professionals responsible for managing forest resources and assisting woodlands owners have long sought ways to increase landowner engagement. Yet, such efforts have often yielded mixed results, with only a modest portion of landowners actively managing their land as defined by traditional benchmarks (i.e., forester contact, management plans). Moreover, changing landowner demographics, decreased land tenure, and reduced scale economies (Kendra & Hull 2005) present new challenges to effective and efficient landowner engagement. Further complicating engage-ment strategies is the increasing need for landscape and regional scale outcomes classified under the rubrics of ecosystem services and multifunctionality.
Such outcomes necessarily often require some levels of aggregation and coordination (Goldman et al. 2007; Schulte et al. 2008).
In 2010, partners from over 15 state and federal agencies, and not-for-profit organizations (table 1) came together as the Driftless Forest Network (DFN), centered on promoting sustainable forestry in Southwest Wisconsin. The DFN partners all work with landowners as part of their individual missions and feel it is through this collab-oration they can work together to best foster further landowner engagement. Desired ecological outcomes include oak restoration and bird habitat (Knoot et al. 2009). A novel comprehensive engagement strategy to promote sustainable private forestry in Southwest Wisconsin emerged to address three key challenges.
The Driftless Forest Network (WI, USA): Innovation, Complexity, and Evaluation in a Regional landowner Engagement Initiative Jerry Greenberg1, Alanna Koshollek2, and Mark Rickenbach3*1 American Forest Foundation, Washington, DC USA, [email protected] Aldo Leopold Foundation, Baraboo, WI USA, [email protected] University of Wisconsin - Madison, Madison, WI USA, [email protected]* Authors are listed alphabetically.Keywords: private forest owners, typologies, owner engagement, evaluation, social network analysis
Abstract
The Driftless Forest Network (DFN) is a collaboration of local, state and national organizations working together to increase landowner engagement in the Driftless Area of Southwestern Wisconsin (USA). The region is home to nearly 32,000 family forest owners that collectively own 825,000 ha. DFN’s objectives are threefold.
Develop and implement tools and strategies to increase private family forest owner engagement toward active 1. forest management. Create capacity to sustain and enhance relationships among resource professionals and owners over time. 2. Evaluate DFN activities toward a systematic understanding of their efficacy and applicability both within the 3. Driftless Area and beyond.
In this paper, we outline the breadth and functioning of the initiative that include My Wisconsin Woods and a collaborative network supported by a knowledge system. We also describe central role of developmental evalua-tion to answer key operational and policy questions. Overall, one can envision the DFN as a learning laboratory, in which we apply research findings, experiential knowledge, and continuous data collection to collaboratively and adaptively engage landowners to increase learning and land management.
2012 Conference Proceedings | 39
Greenberg et al.
Can we effectively and efficiently apply social 1. marketing techniques that move interested woodland owners toward greater forestry knowledge and competency with an emphasis on implementing forestry practices?
Can we build a collaborative landowner assis-2. tance network (i.e., increase collective capacity) of partners and others to support active engagement and emergent opportunities?
Taken together, do we have the potential to effect 3. landscape-scale changes in provisioning ecosystem services and attaining multifunctionality?
Driftless Forest Network Project
Note: In this paper, we introduce the Driftless Forest Network project and its key elements. This is not a research paper or project, but has and will generate new knowledge through practice and intensive evalu-ation. If you would like to learn more or have sugges-tions, please contact us.
Figure 1. Conceptual diagram displaying the four core elements of the driftless Forest Network Project.
OrganizationsAldo Leopold FoundationAmerican Forest FoundationAmerican Tree Farm SystemDriftless Area InitiativeKickapoo Woods CooperativeSouthwest Badger RC & DUniversity of Wisconsin-MadisonUniversity of Wisconsin-Stevens PointUSDA Forest Service, Northeast Area State & Private ForestryUSDA-Natural Resource Conservation ServiceUW-Extension-Regional Natural Resource Education ProgramWisconsin Department of Natural ResourcesWisconsin Family ForestsWisconsin Tree Farm CommitteeWisconsin Woodland Owners Association
Table 1. driftless Forest Network Project partner list.
40 | IUFRO 3.08.00 Small-Scale Forestry
The driftless Forest Network (WI, USA): Innovation, Complexity, and Evaluation in a Regional Landowner Engagement Initiative
Conceptually, the DFN project encompasses four core elements (Figure 1) applied in the Driftless Area (Figure 2), the first two of which bring together major streams in the forestry literature into broad-scale application. First, it uses landowner segmentation to drive a social marketing and engagement campaign (i.e., My Wisconsin Woods). Second, it applies network concepts and metrics toward effective (professional) network collaboration to initiate and maintain landowner engagement. Third, we rely on a comprehensive knowledge system to track, coor-dinate, and assess landowner assistance and engage-ment. Fourth, we apply a developmental evaluation framework (Patton 2011) to adaptively refine or refor-mulate engagement strategies, support network config-uration, and overall goals. Next, we describe the above four elements in greater detail.
My Wisconsin Woods
Understanding that language and branding matter when communicating with an audience, DFN partners decided to use the brand “My Wisconsin Woods” when inter-facing with the landowners. A similar branding scheme “My Minnesota Woods” has been successfully used in the neighboring state (University of Minnesota 2009).The brand is user centric and therefore more likely to resonate with landowners. It is under this brand that social marketing strategies to reach and engage landowners are being tested. Our current marketing campaigns depend on an initial landowner segmen-
tation component. Direct mail campaigns test messages based on those segments and assistance offers, including the offer of peer-to-peer advisers (Woodland Advocates) and their training.
Landowner Segmentation
Recent studies from various g e o g r a p h i e s s u g g e s t segmenting landowners based on demographic characteris-tics and owner interests could be one approach to increasing engagement (Ingemarson et al. 2006; Karppinen 1998; Kendra and Hull 2005; Surendra et al. 2009). Moreover, different land-owners will seek information through different methods and also will look for information to appear in a variety of formats (Butler 2008; Ferranto et al. 2012). However, a gap exists in applying segmentation such that messages and assistance
offers are crafted in such ways as to be more appealing to one segment or another.
The DFN seeks to use and test landowner segmentation as part of its engagement strategy, hence an initial action was to segment landowners in Wisconsin’s portion of the Driftless Area. While the full methodology and its results will be published elsewhere (Butler et al. in prep-aration), segmentation of all landowners in the project area depended on three steps. First, 1,200 woodland owners in the project area were surveyed (response rate = 54%). Second, secondary marketing data (i.e., InfoUSA) were also purchased for all landowners. The survey included questionnaire items that allowed for the segmenting of respondents into landowner typolo-gies following Butler, et al. 2007 and for the develop-ment of proxies to apply segmentation to the secondary marketing data. Third, we were able to associate all landowners in the project area with segments found in the National Woodland Owner Survey (NWOS). (Most fell into either the “Woodland Retreat” or “Working the Land” NWOS segments.) The survey and market data are two of several datasets that populate the database of our knowledge system and are key to the targeted marketing campaigns.
Figure 2. The driftless Area of the Midwest showing the 12 Wisconsin counties where the dFN pilot project is working.
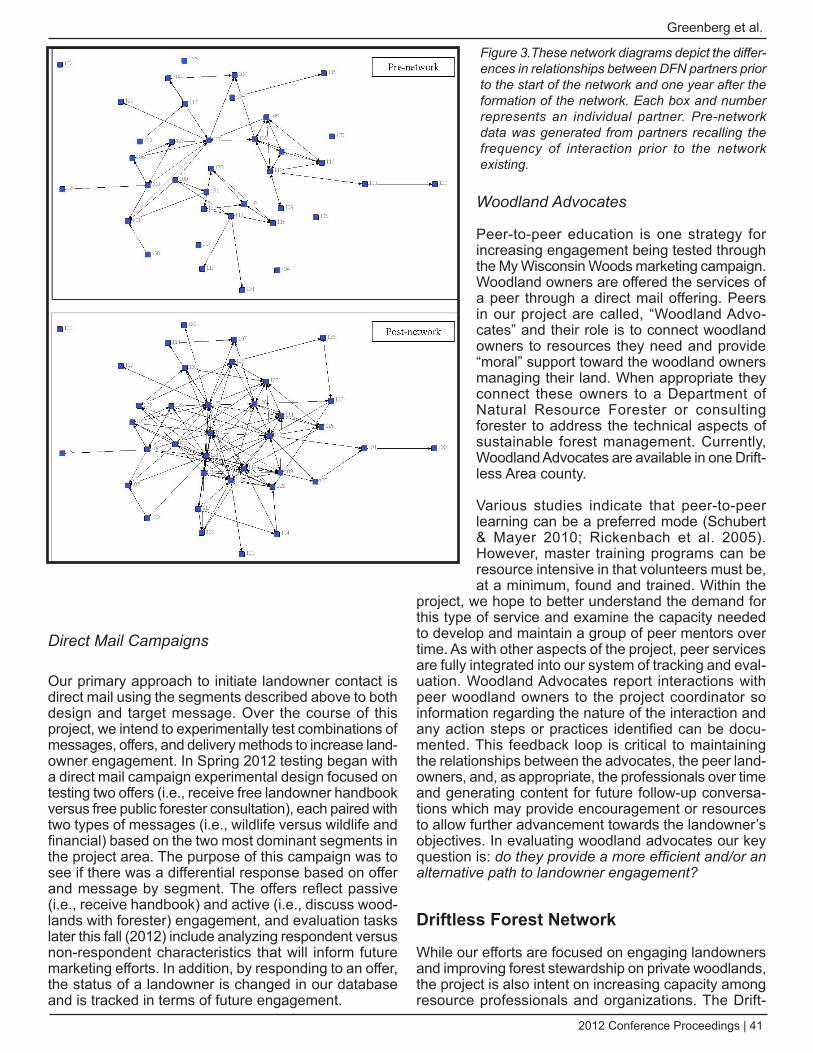
2012 Conference Proceedings | 41
Greenberg et al.
direct Mail Campaigns
Our primary approach to initiate landowner contact is direct mail using the segments described above to both design and target message. Over the course of this project, we intend to experimentally test combinations of messages, offers, and delivery methods to increase land-owner engagement. In Spring 2012 testing began with a direct mail campaign experimental design focused on testing two offers (i.e., receive free landowner handbook versus free public forester consultation), each paired with two types of messages (i.e., wildlife versus wildlife and financial) based on the two most dominant segments in the project area. The purpose of this campaign was to see if there was a differential response based on offer and message by segment. The offers reflect passive (i.e., receive handbook) and active (i.e., discuss wood-lands with forester) engagement, and evaluation tasks later this fall (2012) include analyzing respondent versus non-respondent characteristics that will inform future marketing efforts. In addition, by responding to an offer, the status of a landowner is changed in our database and is tracked in terms of future engagement.
Woodland Advocates
Peer-to-peer education is one strategy for increasing engagement being tested through the My Wisconsin Woods marketing campaign. Woodland owners are offered the services of a peer through a direct mail offering. Peers in our project are called, “Woodland Advo-cates” and their role is to connect woodland owners to resources they need and provide “moral” support toward the woodland owners managing their land. When appropriate they connect these owners to a Department of Natural Resource Forester or consulting forester to address the technical aspects of sustainable forest management. Currently, Woodland Advocates are available in one Drift-less Area county.
Various studies indicate that peer-to-peer learning can be a preferred mode (Schubert & Mayer 2010; Rickenbach et al. 2005). However, master training programs can be resource intensive in that volunteers must be, at a minimum, found and trained. Within the
project, we hope to better understand the demand for this type of service and examine the capacity needed to develop and maintain a group of peer mentors over time. As with other aspects of the project, peer services are fully integrated into our system of tracking and eval-uation. Woodland Advocates report interactions with peer woodland owners to the project coordinator so information regarding the nature of the interaction and any action steps or practices identified can be docu-mented. This feedback loop is critical to maintaining the relationships between the advocates, the peer land-owners, and, as appropriate, the professionals over time and generating content for future follow-up conversa-tions which may provide encouragement or resources to allow further advancement towards the landowner’s objectives. In evaluating woodland advocates our key question is: do they provide a more efficient and/or an alternative path to landowner engagement?
Driftless Forest Network
While our efforts are focused on engaging landowners and improving forest stewardship on private woodlands, the project is also intent on increasing capacity among resource professionals and organizations. The Drift-
Figure 3.These network diagrams depict the differ-ences in relationships between dFN partners prior to the start of the network and one year after the formation of the network. Each box and number represents an individual partner. Pre-network data was generated from partners recalling the frequency of interaction prior to the network existing.
42 | IUFRO 3.08.00 Small-Scale Forestry
The driftless Forest Network (WI, USA): Innovation, Complexity, and Evaluation in a Regional Landowner Engagement Initiative
less Forest Network is comprised of resource profes-sionals and key landowners from government agencies, NGO’s, and, to a lesser extent, the private sector. Two of these foresters are new and at least partially funded on the USDA Forest Service grant that support portions of the project. Partners are committed to the vision of a healthier landscape through increased landowner engagement. A core belief (and important evaluation question) is that each partner brings unique perspec-tives, experience, and expertise to the network and that working together we can have a greater impact than individually. For example, state agency involvement provides technical resources and creates a conduit for partners’ feedback and project results to impact future policy decisions influencing the landscape beyond the region of focus (Leach & Pelkey 2001; Genskow 2009). Whereas, NGO and private sector actors with less formal rules and regulations can more quickly implement and test new tools and strategies.
In a short time, we have seen an increase in the frequency of interactions among network members (Figure 3). These data emerged as part of our network evaluation (see below) through a web-based partner survey. Additional longitudinal analysis is needed, but anecdotal evidence suggests such interactions may be fostering improved landowner engagement. For example, a Department of Natural Resource Forester recently contacted DFN to see if the network could provide technical assistance to approximately 20 land-owners who requested property visits and management plans. The landowners had been placed on a waiting list; some had been waiting for months. The forester added that while it is their role to serve these landowners, they couldn’t do it as soon as they would like and did not want their limitations to influence the interest expressed by these owners to take action on their land. The DFN was able to allocate resources within the network to serve the waiting landowners, making initial contact within two weeks of the request. Hence, the DFN is able to respond to new partner needs and emerging opportu-nities. Whether that is enough to justify the costs and impositions of collaboration is yet to be seen.
Knowledge System
Central to DFN’s efforts to manage landowner engage-ment is a knowledge system that allows for continuous updating and tracking. The knowledge system, while impossible without a powerful relational database, is most dependent on partners to provide, analyze, and interpret data. Indeed, one person is dedicated to managing the database and several others have key roles in shaping input and interpretation. The database itself was specifically designed for the American Forest Foundation and the DFN and relies on ClearVantage Association Management Software as the platform. The database was initially populated with landowners owning 10 or more wooded acres based on county tax rolls
purchased from each of the twelve counties selected for the pilot project. This database adds capacity to the project in four main ways. We can...
Identify and select landowners for My Wisconsin 4. Woods targeted outreach (e.g. direct mail campaigns);Track responses to My Wisconsin Woods outreach 5. activities;Sustain relationships between landowners and the 6. My Wisconsin Woods and DFN resource professional with capacity to record progress on recommended management projects and facilitate follow-up contact via a “tickler” system, among others; andEvaluate the effectiveness of outreach activities, 7. landowner progress toward greater engagement, and pathways of engagement.
The data and relationships maintained through use of this tool will be the source of emerging informa-tion, garnered by the evaluation process, which will assist partners in identifying engagement priorities and impacts. In the end, we hope that the knowledge system will allow us to effectively and efficiently direct resources to support landowners where they are in the engage-ment process.
Developmental Evaluation
Evaluation has been a key component of the DFN since its start. The intent has always been to learn something that advancing forestry in the Driftless Area, as well as help others elsewhere grappling with landowner engage-ment. However, the evaluation model has evolved. Initially, the intent was to apply traditional formative and summative evaluation to determine answer rela-tively straightforward questions. For example, does targeting based on landowner segmentation efficiently and effectively begin landowner engagement? While such questions remain important, we have come to envision the evaluation as addressing a broader and markedly murkier question: does the DFN work?
In essence, the DFN brings together a suite of landowner engagement programs, support tools, and partners to expand a coarsely defined concept, “landowner engage-ment.” While there is a need to generate formative and summative evaluation metrics to satisfy our funding agencies and foundations, this is not enough for most partners, who envision the DFN is a possible new way of doing business in private forestry assistance. As one partner noted, “…my point would be even if the specific elements of what occur here don’t bear a lot of fruit, there’s still this great potential that it spawns something else that no one even envisioned in year one — that happens in year six...It’s just the fact that there have been relationships established and connections made that will bear fruit down the road, even in areas outside of
2012 Conference Proceedings | 43
Greenberg et al.
forestry potentially, for example.” Hence, it has become evident that we are actually engaged in developmental evaluation (Patton 2011).
Developmental evaluation is tailored toward under-standing and adaptively managing complex situations and interventions. It may rely on a range of data collec-tion efforts, but the central premise is one in which data and analysis inform the program development and design often in responses to unexpected developments. As such, the evaluators are engaging in near constant dialogue with practitioners and managers, and must adapt (and document) methods as best inform the effort and maintain adequate rigor. Such twists and turns are regularly present in the DFN project. For example, our direct mail campaigns offer landowners a free consul-tation with a forester. There is an initial question as to how many such offers should we send out as to not overwhelm the capacity to provide forester visits and achieve sufficient sample size to detect statistical differ-ences. Moreover, once a landowner requests a visit there is a need to evaluate the speed and quality of our response (i.e., how well does the knowledge system interact with foresters to provide the service?). These latter evaluations offer insights that suggest alterna-tives in response, which then feedback into DFN efforts. Moreover, DFN doesn’t control the operating environ-ment (or even partners). Hence, opportunities and chal-lenges emerge that serve as “tests” that are important learning opportunities for the DFN and its efforts to effec-tively engage woodland owners.
Conclusion
The Driftless Forest Network project reflects a system-atic and collaborative effort to engage woodland owners. It entails a broad partnership and novel strategies that seek effect change in the complex area of woodland management to improve practice and to increase our understanding of how that works and how it could work. These are still formative days, but partners are enthusi-astic and starting to think about where we are headed. Perhaps the most novel piece of this effort is the commit-ment to test, learn, and adapt, i.e., it is our learning labo-ratory. How things will ultimately unfold is, of course, unknown, but our hope is that we will be able to under-stand and communicate how and why.
Acknowledgements
Authors wish to thank and acknowledge the USDA-Forest Service Northeastern Area State and Private Forestry for their direct financial support and all the Driftless Forest Network partners for their financial and in-kind contributions.
References
Butler, B.J. 2008. Family forest owner of the United States, 2006. General Technical Report NRS-27, U.S. Forest Service, Northern Research Station, Newton Square, PA.
Butler, B.J., A. Koshollek, K. Kirchner, M. Tyrrell. (In prepa-ration). distant social networks of family forest owners: Results from a survey in southwestern Wisconsin. Northern Journal of Applied Forestry.
Butler, B. J., M. Tyrrell, G. Feinberg, S. VanManen, L. Wiseman, S.Wallinger. 2007. Understanding and researching family forest owners: Lessons from social marketing research. Journal of Forestry. p. 348-357.
Clayton, L., J.W. Attig. 1990. Geology of Sauk County, Wisconsin. Wisconsin Geological and Natural History Survey. Information Circular 67.
Ferranto, S., L. Huntsinger, W. Stewart, C. Getz, G. Nakamura, M. Kelly. 2012. Consider the source: The impact of media and authority in outreach to private forest and rangeland owners. Journal of Environmental Management. 97. p. 131-140.
Genskow, K.d. 2009. Catalyzing collaboration: Wisconsin’s agency-initiated basin partnerships. Environmental Manage-ment. 43. p. 411-424.
Goldman, R.L., B.H. Thompson, G. C. daily. 2007. Institutional Incentives for Managing the Landscape: Inducing Coopera-tion for the Production of Ecosystem Services. Ecological Economics 64(20):333–343.
Ingemarson, F., A. Lindhagen, L. Eriksson. 2006. A typology of small-scale private forest owners in Sweden. Scandina-vian Journal of Forest Research. 21(3). p. 249-259
Karppinen, H. 1998. Values and objectives of Non-industrial Private Forest Owners in Finland. Silva Fennica. 31(1). p. 43-59.
Kendra, A. & R.B. Hull. 2005. Motivations and behaviors of new forest owners in Virginia. Forest Science. 51(2). p. 142-154.
Knoot, T.G., L.A. Schulte, N. Grudens-Schuck, & M . R i ckenbach . 2009 . The Chang ing Social Landscape in the Midwest: A Boon for Forestry and Bust for Oak? Journal of Forestry 107(5). p.260-266.
Leach, W.d., N.W. Pelkey. 2001. Making watershed part-nerships work: A review of the empirical literature. Journal of Water Resource Planning and Management. 126(7). p. 378-385.
Patton, M.Q. 2011. developmental Evaluation: Applying Complexity Concepts to Enhance Innovation and Use. New York: The Guilford Press. 375 pages.
Rickenbach, M.G., R.P. Guries, d. L. Schmoldt. Membership Matters: Comparing Members and Non-members of NIPF Owner Organizations in Southwest Wisconsin, USA. Forest Policy and Economics 8(1). p. 93–103.
44 | IUFRO 3.08.00 Small-Scale Forestry
The driftless Forest Network (WI, USA): Innovation, Complexity, and Evaluation in a Regional Landowner Engagement Initiative
Rickenbach, M., K. Zeuli, E. Sturgess-Cleek. despite Failure: The Emergence of ‘New’ Forest Owners in Private Forest Policy in Wisconsin, USA. Scandinavian Journal of Forest Research 20 (2005). p.503–513.
Schubert, J.R., A.L. Mayer. Peer Influence of Non-Industrial Private Forest Owners in the Western Upper Peninsula of Michigan. Open Journal of Forestry 2(3) p. 147–155.
Schulte, Lisa A., Mark Rickenbach, and Laura C. Merrick. 2008. Ecological and Economic Benefits of Cross-boundary Coordination Among Private Forest Landowners. Land-scape Ecology 23(4). p.481-496.
Surendra G.C., S.Mehmood, J. Schelhas. 2009. Segmenting landowners based on their motivations: A look at landowner education on the red oak borer. Journal of Forestry. 107(6). p. 313-319.
Sustaining Family Forest Initiative. 2009. Overview of woodland owners in Wisconsin. Tools for engaging land-owners effectively. October 9, 2009. Available at: http://www.engaginglandowners.org/profile/State/Wisconsin/Overview/55 (accessed June 20, 2012).
US Forest Service. 2008. Wisconsin’s Forests, 2004. Resource Bulletin NRS-23. USdA Forest Service, Newtown Square, PA.
US Forest Service. 2011, FIA program FIdO custom table retrieval tool. US Forest Service. Available at http://apps.fs.fed.us/fido/output.html (accessed July 31, 2012).
University of Minnesota. 2009. My Minnesota Woods. January 9, 2009. Available at: http://www.myminnesotawoods.umn.edu. (accessed 20 June 2012).
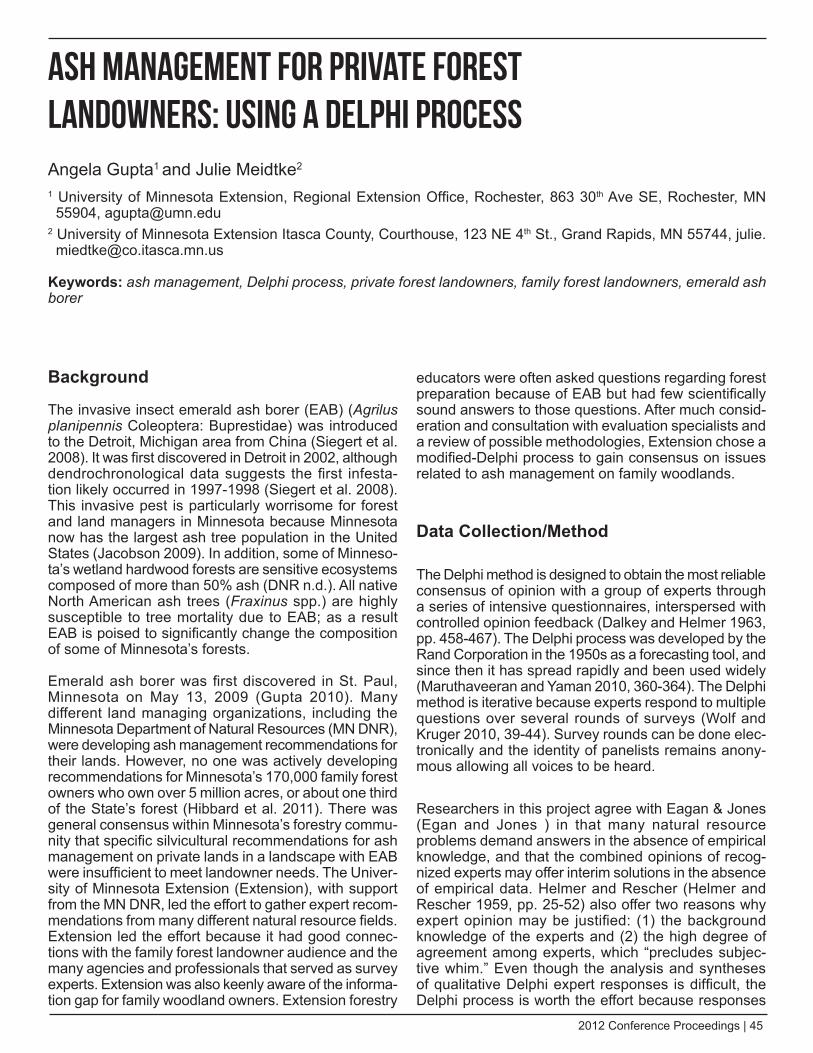
2012 Conference Proceedings | 45
Background
The invasive insect emerald ash borer (EAB) (Agrilus planipennis Coleoptera: Buprestidae) was introduced to the Detroit, Michigan area from China (Siegert et al. 2008). It was first discovered in Detroit in 2002, although dendrochronological data suggests the first infesta-tion likely occurred in 1997-1998 (Siegert et al. 2008). This invasive pest is particularly worrisome for forest and land managers in Minnesota because Minnesota now has the largest ash tree population in the United States (Jacobson 2009). In addition, some of Minneso-ta’s wetland hardwood forests are sensitive ecosystems composed of more than 50% ash (DNR n.d.). All native North American ash trees (Fraxinus spp.) are highly susceptible to tree mortality due to EAB; as a result EAB is poised to significantly change the composition of some of Minnesota’s forests.
Emerald ash borer was first discovered in St. Paul, Minnesota on May 13, 2009 (Gupta 2010). Many different land managing organizations, including the Minnesota Department of Natural Resources (MN DNR), were developing ash management recommendations for their lands. However, no one was actively developing recommendations for Minnesota’s 170,000 family forest owners who own over 5 million acres, or about one third of the State’s forest (Hibbard et al. 2011). There was general consensus within Minnesota’s forestry commu-nity that specific silvicultural recommendations for ash management on private lands in a landscape with EAB were insufficient to meet landowner needs. The Univer-sity of Minnesota Extension (Extension), with support from the MN DNR, led the effort to gather expert recom-mendations from many different natural resource fields. Extension led the effort because it had good connec-tions with the family forest landowner audience and the many agencies and professionals that served as survey experts. Extension was also keenly aware of the informa-tion gap for family woodland owners. Extension forestry
educators were often asked questions regarding forest preparation because of EAB but had few scientifically sound answers to those questions. After much consid-eration and consultation with evaluation specialists and a review of possible methodologies, Extension chose a modified-Delphi process to gain consensus on issues related to ash management on family woodlands.
Data Collection/Method
The Delphi method is designed to obtain the most reliable consensus of opinion with a group of experts through a series of intensive questionnaires, interspersed with controlled opinion feedback (Dalkey and Helmer 1963, pp. 458-467). The Delphi process was developed by the Rand Corporation in the 1950s as a forecasting tool, and since then it has spread rapidly and been used widely (Maruthaveeran and Yaman 2010, 360-364). The Delphi method is iterative because experts respond to multiple questions over several rounds of surveys (Wolf and Kruger 2010, 39-44). Survey rounds can be done elec-tronically and the identity of panelists remains anony-mous allowing all voices to be heard.
Researchers in this project agree with Eagan & Jones (Egan and Jones ) in that many natural resource problems demand answers in the absence of empirical knowledge, and that the combined opinions of recog-nized experts may offer interim solutions in the absence of empirical data. Helmer and Rescher (Helmer and Rescher 1959, pp. 25-52) also offer two reasons why expert opinion may be justified: (1) the background knowledge of the experts and (2) the high degree of agreement among experts, which “precludes subjec-tive whim.” Even though the analysis and syntheses of qualitative Delphi expert responses is difficult, the Delphi process is worth the effort because responses
Ash Management for Private Forest landowners: Using a Delphi ProcessAngela Gupta1 and Julie Meidtke2 1 University of Minnesota Extension, Regional Extension Office, Rochester, 863 30th Ave SE, Rochester, MN 55904, [email protected]
2 University of Minnesota Extension Itasca County, Courthouse, 123 NE 4th St., Grand Rapids, MN 55744, [email protected]
Keywords: ash management, delphi process, private forest landowners, family forest landowners, emerald ash borer
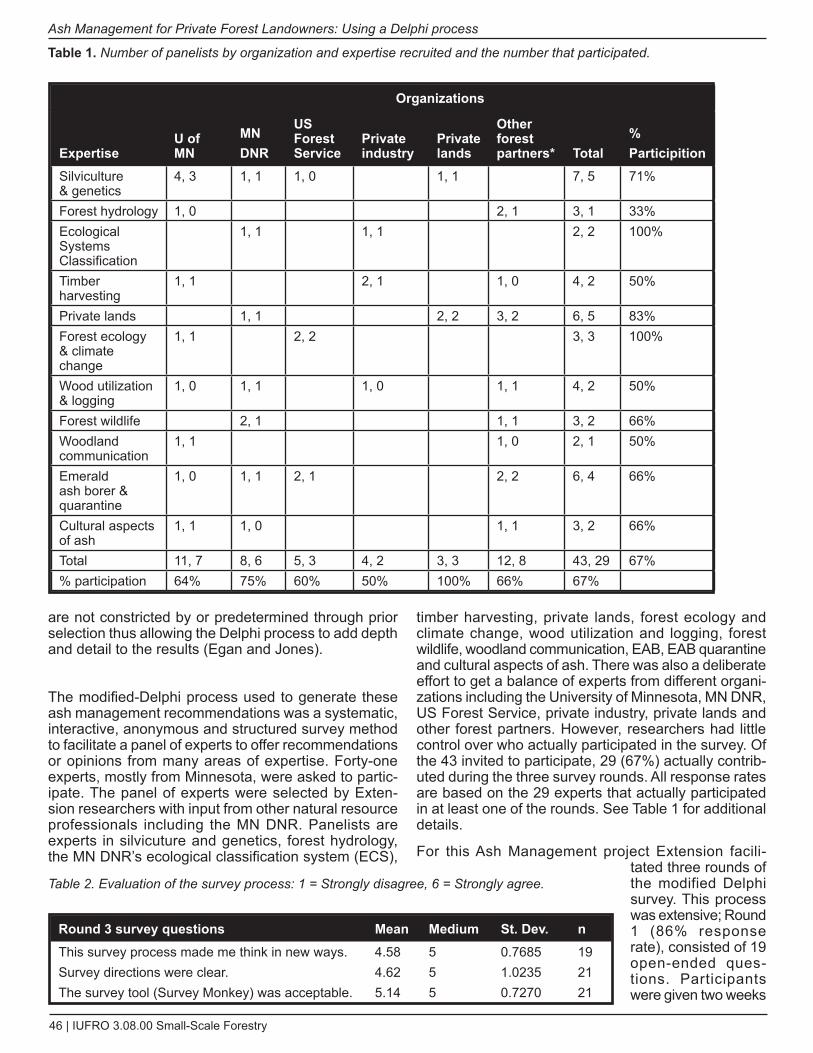
46 | IUFRO 3.08.00 Small-Scale Forestry
Ash Management for Private Forest Landowners: Using a delphi process
are not constricted by or predetermined through prior selection thus allowing the Delphi process to add depth and detail to the results (Egan and Jones).
The modified-Delphi process used to generate these ash management recommendations was a systematic, interactive, anonymous and structured survey method to facilitate a panel of experts to offer recommendations or opinions from many areas of expertise. Forty-one experts, mostly from Minnesota, were asked to partic-ipate. The panel of experts were selected by Exten-sion researchers with input from other natural resource professionals including the MN DNR. Panelists are experts in silvicuture and genetics, forest hydrology, the MN DNR’s ecological classification system (ECS),
timber harvesting, private lands, forest ecology and climate change, wood utilization and logging, forest wildlife, woodland communication, EAB, EAB quarantine and cultural aspects of ash. There was also a deliberate effort to get a balance of experts from different organi-zations including the University of Minnesota, MN DNR, US Forest Service, private industry, private lands and other forest partners. However, researchers had little control over who actually participated in the survey. Of the 43 invited to participate, 29 (67%) actually contrib-uted during the three survey rounds. All response rates are based on the 29 experts that actually participated in at least one of the rounds. See Table 1 for additional details.
For this Ash Management project Extension facili-tated three rounds of the modified Delphi survey. This process was extensive; Round 1 (86% response rate), consisted of 19 open-ended ques-tions. Participants were given two weeks
Organizations
ExpertiseU of MN
MN DNR
US Forest Service
Private industry
Private lands
Other forest partners* Total
%Participition
Silviculture & genetics
4, 3 1, 1 1, 0 1, 1 7, 5 71%
Forest hydrology 1, 0 2, 1 3, 1 33%Ecological Systems Classification
1, 1 1, 1 2, 2 100%
Timber harvesting
1, 1 2, 1 1, 0 4, 2 50%
Private lands 1, 1 2, 2 3, 2 6, 5 83%Forest ecology & climate change
1, 1 2, 2 3, 3 100%
Wood utilization & logging
1, 0 1, 1 1, 0 1, 1 4, 2 50%
Forest wildlife 2, 1 1, 1 3, 2 66%Woodland communication
1, 1 1, 0 2, 1 50%
Emerald ash borer & quarantine
1, 0 1, 1 2, 1 2, 2 6, 4 66%
Cultural aspects of ash
1, 1 1, 0 1, 1 3, 2 66%
Total 11, 7 8, 6 5, 3 4, 2 3, 3 12, 8 43, 29 67%% participation 64% 75% 60% 50% 100% 66% 67%
Table 1. Number of panelists by organization and expertise recruited and the number that participated.
Table 2. Evaluation of the survey process: 1 = Strongly disagree, 6 = Strongly agree.
Round 3 survey questions Mean Medium St. Dev. nThis survey process made me think in new ways. 4.58 5 0.7685 19Survey directions were clear. 4.62 5 1.0235 21The survey tool (Survey Monkey) was acceptable. 5.14 5 0.7270 21
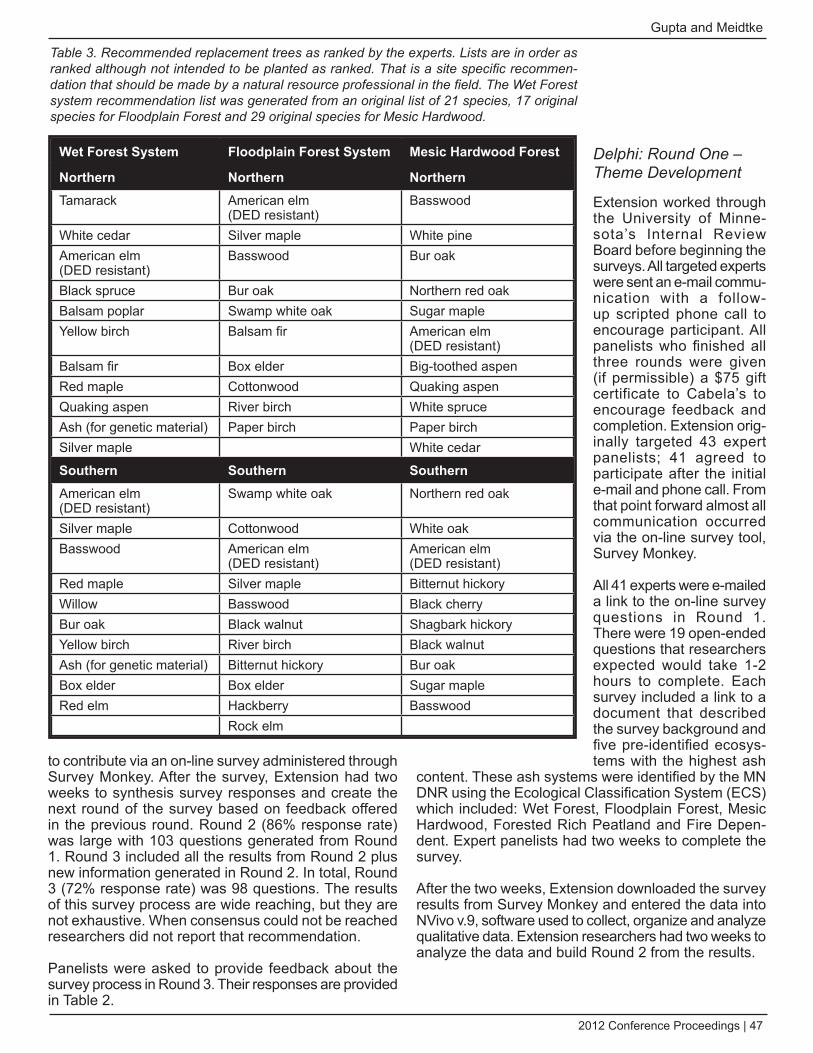
2012 Conference Proceedings | 47
Gupta and Meidtke
to contribute via an on-line survey administered through Survey Monkey. After the survey, Extension had two weeks to synthesis survey responses and create the next round of the survey based on feedback offered in the previous round. Round 2 (86% response rate) was large with 103 questions generated from Round 1. Round 3 included all the results from Round 2 plus new information generated in Round 2. In total, Round 3 (72% response rate) was 98 questions. The results of this survey process are wide reaching, but they are not exhaustive. When consensus could not be reached researchers did not report that recommendation.
Panelists were asked to provide feedback about the survey process in Round 3. Their responses are provided in Table 2.
delphi: Round One – Theme development
Extension worked through the University of Minne-sota’s Internal Review Board before beginning the surveys. All targeted experts were sent an e-mail commu-nication with a follow-up scripted phone call to encourage participant. All panelists who finished all three rounds were given (if permissible) a $75 gift certificate to Cabela’s to encourage feedback and completion. Extension orig-inally targeted 43 expert panelists; 41 agreed to participate after the initial e-mail and phone call. From that point forward almost all communication occurred via the on-line survey tool, Survey Monkey.
All 41 experts were e-mailed a link to the on-line survey questions in Round 1. There were 19 open-ended questions that researchers expected would take 1-2 hours to complete. Each survey included a link to a document that described the survey background and five pre-identified ecosys-tems with the highest ash
content. These ash systems were identified by the MN DNR using the Ecological Classification System (ECS) which included: Wet Forest, Floodplain Forest, Mesic Hardwood, Forested Rich Peatland and Fire Depen-dent. Expert panelists had two weeks to complete the survey.
After the two weeks, Extension downloaded the survey results from Survey Monkey and entered the data into NVivo v.9, software used to collect, organize and analyze qualitative data. Extension researchers had two weeks to analyze the data and build Round 2 from the results.
wet Forest System Floodplain Forest System Mesic Hardwood Forest
Northern Northern NorthernTamarack American elm
(DED resistant)Basswood
White cedar Silver maple White pineAmerican elm (DED resistant)
Basswood Bur oak
Black spruce Bur oak Northern red oakBalsam poplar Swamp white oak Sugar mapleYellow birch Balsam fir American elm
(DED resistant)Balsam fir Box elder Big-toothed aspenRed maple Cottonwood Quaking aspenQuaking aspen River birch White spruceAsh (for genetic material) Paper birch Paper birchSilver maple White cedar
Southern Southern SouthernAmerican elm (DED resistant)
Swamp white oak Northern red oak
Silver maple Cottonwood White oakBasswood American elm
(DED resistant)American elm (DED resistant)
Red maple Silver maple Bitternut hickoryWillow Basswood Black cherryBur oak Black walnut Shagbark hickoryYellow birch River birch Black walnutAsh (for genetic material) Bitternut hickory Bur oakBox elder Box elder Sugar mapleRed elm Hackberry Basswood
Rock elm
Table 3. Recommended replacement trees as ranked by the experts. Lists are in order as ranked although not intended to be planted as ranked. That is a site specific recommen-dation that should be made by a natural resource professional in the field. The Wet Forest system recommendation list was generated from an original list of 21 species, 17 original species for Floodplain Forest and 29 original species for Mesic Hardwood.
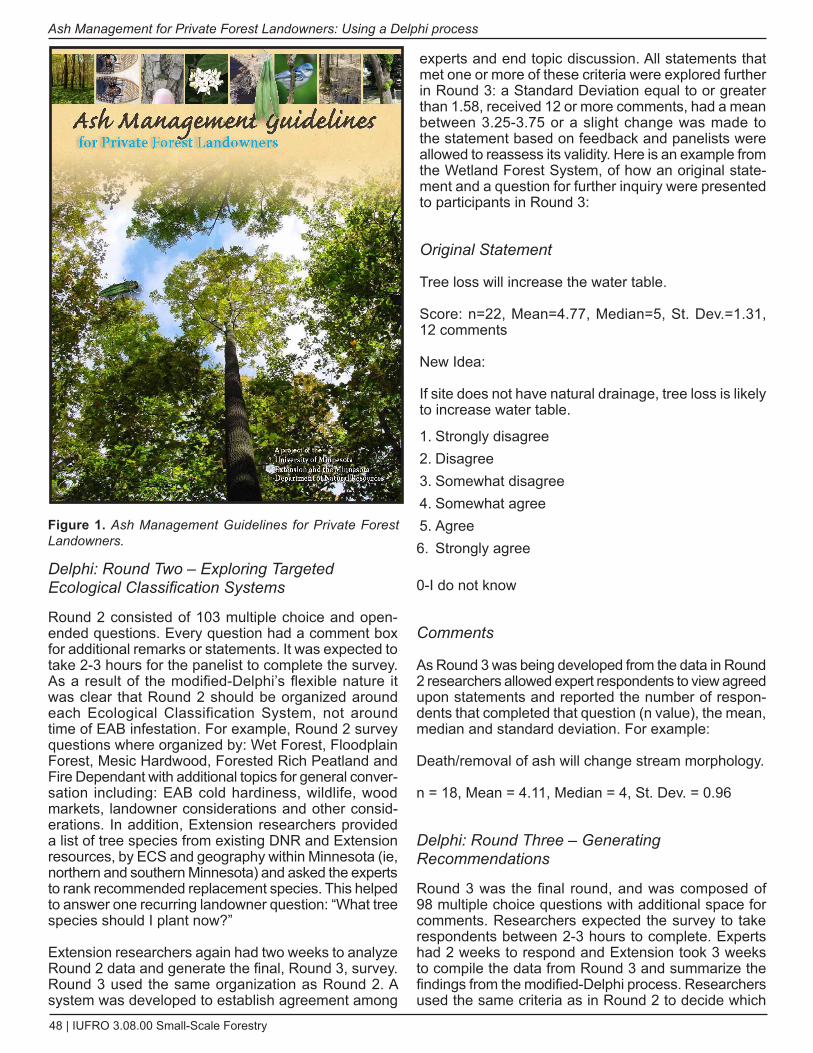
48 | IUFRO 3.08.00 Small-Scale Forestry
Ash Management for Private Forest Landowners: Using a delphi process
delphi: Round Two – Exploring Targeted Ecological Classification Systems
Round 2 consisted of 103 multiple choice and open-ended questions. Every question had a comment box for additional remarks or statements. It was expected to take 2-3 hours for the panelist to complete the survey. As a result of the modified-Delphi’s flexible nature it was clear that Round 2 should be organized around each Ecological Classification System, not around time of EAB infestation. For example, Round 2 survey questions where organized by: Wet Forest, Floodplain Forest, Mesic Hardwood, Forested Rich Peatland and Fire Dependant with additional topics for general conver-sation including: EAB cold hardiness, wildlife, wood markets, landowner considerations and other consid-erations. In addition, Extension researchers provided a list of tree species from existing DNR and Extension resources, by ECS and geography within Minnesota (ie, northern and southern Minnesota) and asked the experts to rank recommended replacement species. This helped to answer one recurring landowner question: “What tree species should I plant now?”
Extension researchers again had two weeks to analyze Round 2 data and generate the final, Round 3, survey. Round 3 used the same organization as Round 2. A system was developed to establish agreement among
experts and end topic discussion. All statements that met one or more of these criteria were explored further in Round 3: a Standard Deviation equal to or greater than 1.58, received 12 or more comments, had a mean between 3.25-3.75 or a slight change was made to the statement based on feedback and panelists were allowed to reassess its validity. Here is an example from the Wetland Forest System, of how an original state-ment and a question for further inquiry were presented to participants in Round 3:
Original Statement
Tree loss will increase the water table.
Score: n=22, Mean=4.77, Median=5, St. Dev.=1.31, 12 comments
New Idea:
If site does not have natural drainage, tree loss is likely to increase water table.
Strongly disagree1. Disagree2. Somewhat disagree3. Somewhat agree4. Agree5. Strongly agree6.
0-I do not know
Comments
As Round 3 was being developed from the data in Round 2 researchers allowed expert respondents to view agreed upon statements and reported the number of respon-dents that completed that question (n value), the mean, median and standard deviation. For example:
Death/removal of ash will change stream morphology.
n = 18, Mean = 4.11, Median = 4, St. Dev. = 0.96
delphi: Round Three – Generating Recommendations
Round 3 was the final round, and was composed of 98 multiple choice questions with additional space for comments. Researchers expected the survey to take respondents between 2-3 hours to complete. Experts had 2 weeks to respond and Extension took 3 weeks to compile the data from Round 3 and summarize the findings from the modified-Delphi process. Researchers used the same criteria as in Round 2 to decide which
Figure 1. Ash Management Guidelines for Private Forest Landowners.
2012 Conference Proceedings | 49
Gupta and Meidtke
statements had reached consensus. It is those final recommendations that are featured in the publication, “Ash Management Guidelines for Family Forest Owners” (Gupta and Miedtke 2011, 70) which was produced as a result of this work.
Discussion & Recommendations
The results of this survey process were wide reaching but not exhaustive. When consensus could not be reached recommendations were not reported. For a complete list of recommendations please view the Ash Manage-ment Guidelines for Family Forest Owners (Gupta and Miedtke 2011, 70). This guide, from its inception, was intended for woodland owners, not professionals. As a result of this survey professional agreement was reached on many subjects but used very specific and technical terms. These terms were often unfamiliar or unclear to the landowner audience. Extension, with the help of a professional forestry writer, presented the recommenda-tions but also offered context and descriptions to make the recommendations understandable. The result: a 70 page, full color booklet for family forest landowners. This booklet, see Figure 1, contains six chapters, a four part appendix and a glossary. The chapters are: 1) A History of Minnesota’s Ash Resource, 2) Minnesota Ash Species Identification, 3) Ash: A 21st Century Resource, 4) The Emerald Ash Borer, 4) The Emerald Ash Borer, 5) Native Plant Communities: Wet Forest, Floodplain Forest, Mesic Hardwood, Forested Rich Peatland and Fire Dependent and 6) Wildlife Among the Ash. The MN Department of Natural Resources provided funding to print this resource.
There were several topics that researchers expected to generate many comments and others that took us by surprise. We correctly anticipated a great deal of compli-cated discussion about Wetland Forests because of the high water table, poor drainage, ash dominance (some-times more than 50% ash) and limited suggestions for tree replacement options within those sites. However, researchers did not anticipate the stream morphology discussions generated from the Floodplain Forest ques-tions. Likewise, the need to recommend replacement species was always present but a mechanism to achieve those lists did not become obvious until Round 2 when the recommended replacement lists were introduced to panelists. It is those lists that held the largest surprise: the recommendation to reintroduce Dutch Elm Disease (DED) resistant elms in 7 of the 9 ecosystems under consideration. This is particularly noteworthy because ash often replaced elm in Minnesota’s forests following the aftermath of DED. So to recommend replacing ash with DED resistant elm in some of these same stands may actually be creating a stand more similar to its pre-invasive species structure and function. One of many other recommendations that relates to regeneration is to “actively discourage invasive plant and insect species; manage for native species.” This is a mantra often heard
from fellow foresters, but to see it clearly expressed and agreed-upon in an academically rigorous process is reassuring. See Table 3 for recommended replace-ment species for three of the five ecosystems under consideration.
In addition to the recommended replacement tree lists, significant and specific recommendations were gener-ated for the Wet Forest and Floodplain Forest systems. The Wetland Forests of northern Minnesota are the most diverse forest type in the state. They are also defined by the seasonal variability in soil moisture and their high water tables. These issues coupled with the dominance of ash in many Wet Forest stands concerned many panelists. Several important warnings and recommen-dations resulted from this research, for example:
If the site does not have natural drainage, tree loss • is likely to increase the water depth.Fire occurence will increase when ash sites are • replaced with grasses or cattails especially if the late summer or autumn is dry. Fire intensity will increase. Harvesting wet forest sites is very sensitive and • extreme care should be taken when considering such an activity. Harvest when the ground is dry or frozen. Clearcutting is not recommended, however strip or patch cuts may be appropriate especially when dealing with stands mixed with conifers. Stand regeneration in these sites can be tricky • because of stand hydrology so attention to micro sites and monitoring will be important.
Floodplain Forests are found throughout Minnesota and are dominated by the presence of rivers. Unlike Wet Forests, Floodplain Forests are defined by their natural drainage. Panelists cited examples of Dutch elm disease mortality and its impact on stream hydrology when making recommendations for these stands. Some of the recommendations and warnings for the Flood-plain Forest included:
Death or tree removal of ash will change tree • morphology.When a harvest is viable, select harvest may be the • best silvicultural practice. On quality sites continue to manage for quality • ash. On poor sites do not harvest unless a harvest achieves specific objectives.
Conclusion
This project was, from its inception, intended to produce timely, useable and understandable recommendations for Minnesota’s family woodland owners. We believe this modified-Delphi process worked well to achieve that goal. This project went from inception to publication of
50 | IUFRO 3.08.00 Small-Scale Forestry
Ash Management for Private Forest Landowners: Using a delphi process
a full color, 70 page booklet in one year; that includes using the modified-Delphi to establish the recommenda-tions. Traditional methods of forest research could not have generated these recommendations in the same period of time. The need to move quickly is critical so family forest landowners can begin implementing recom-mendations before EAB has significantly changed stand dynamics. This publication has been out for a year. Over 5,000 hard copies have been distributed to woodland owners and the online version has been viewed almost 2,000 times on-line with over 1,400 unique visits. In addition, this document recently won the 2012 Notable Documents award for public policy from the Legislative Research Librarians section of the National Conference of State Legislatures, a bipartisan group that serves the legislature and staff of the 50 US states, commonwealths and territories. In the future, we intend to do additional evaluative work to see if recommendations are being implemented.
References
dalkey, Norman, and Olaf Helmer. 1963. An experimental application of the delphi method to the use of experts. Management Science 9 (3) (Apr.): pp. 458-467.
DNR. n.d. Native plant communities classification system WFn55 wet forest system northern floristic region.
Egan, A. F., and S. B. Jones. determining forest harvest impact assessment criteria using expert opinion: A delphi study. Northern Journal of Applied Forestry.Mar 1997.14(1) P.20-25.
Gupta, Angela, and Julie Miedtke, eds. 2011. Ash manage-ment guidelines for private forest landowner University of Minnesota Extension.
Gupta, A. 2010. Emerald ash borer first detector: A volun-teer early detection programme. New Zealand Journal of Forestry Science; 2010.40: 123-132.11 Ref (16-20 March 2009).
Helmer, Olaf, and Nicholas Rescher. 1959. On the episte-mology of the inexact sciences. Management Science 6 (1) (Oct.): pp. 25-52.
Hibbard, C., L. McInenly, L. Nellis, K. Block-Torgerson, J. Prohaska, M. Kilgore, B. Ohm, J. Coleman, S. Taff, and S. Snyder. 2011. Maintaining the forestland base in Minnesota: Forestland parcelization and policy tools.
Jacobson, K. 2009. Minnesota’s ash resource and markets.
Maruthaveeran, Sreetheran, and Amat Ramsa Yaman. 2010. The identification of criteria and indicators to evaluate hazardous street trees of kuala lumpur malaysia: A delphi study. Journal of Forestry 108 (7) (Oct-Nov): 360-4.
Siegert, N., d. McCullough, A. Liebhold, and F. Telewski. 2008. Reconstruction of the establishment and spread of emerald ash borer through dendrochronological analysis. Abstract. Proceedings 19th U.S. department of Agriculture Interagency Research Forum on Invasive Species 2008.
Wolf, Kathleen L., and Linda E. Kruger. 2010. Urban forestry research needs: A participatory assessment process. Journal of Forestry 108 (1) (Jan-Feb): 39-44.
2012 Conference Proceedings | 51
Introduction
Global interest in bioenergy development has increased dramatically in recent years, due to its promise to reduce dependence on fossil fuel energy supplies, its contri-bution to global and national energy security, its poten-tial to produce a carbon negative or neutral fuel source and to mitigate climate change, and its potential as a vehicle for rural development. However, a number of societal concerns about bioenergy have been identi-fied, including deforestation and landscape fragmen-tation, loss of biodiversity, depletion of soil and water resources, introduction of invasive and/or genetically modified species, competition with food crops, high levels of required subsidies, and potentially inequitable distribution of risks and benefits associated with biofuels. Bioenergy’s promises of renewability, net energy gain, and reductions in emissions of greenhouse gases and other pollutants have also been questioned. Several studies reveal the complexity of public perceptions of biofuels and landowners’ willingness to manage their forests and cropland specifically for biofuel markets (Delshad 2010, Plate et al. 2010, Selfa 2010, Susaeta 2010).
As the U.S. South has a warm, wet climate that is condu-cive to high vegetative productivity of many leading bioen-ergy crops, as well as well-developed extant forestry and agricultural industries, it is likely that there will be a rapid expansion of the biofuel industry in this region as the demand for biofuels increases both domestically and internationally. There is a wide and still-unfolding array of energy technologies and feedstocks in the U.S. South. These include pellets from woody biomass and energy grasses; biodiesel from oilseed crops such as soybean, oilseed rape, crambe, and camelina and from algae and animal fats; ethanol from traditional food crops such as corn, sugarcane/bagasse, wheat, and rice; and cellulosic ethanol and gasoline from non-food sources such as woody biomass, energy grasses, and forestry industry byproducts.
There are significant developments in liquid fuels from biomass in the U.S. South; a number of facilities have been announced, several are under construction, and at least one opened briefly before suspending operations due to technical problems. The only bioenergy plants currently purchasing biomass on a commercial scale are pellet plants that are shipping pellets to Europe to meet renewable energy requirements. However, purchasing of biomass for domestic markets and drop-in fuels is likely to begin over the next several years. In many rural communities in the U.S. South, there is a long tradi-tion of forest management for timber and other wood-based products; the integration of bioenergy devel-opment into these existing management frameworks, rather than competition with them, is often seen as key to the regional success of bioenergy development.
Bioenergy development in the South will utilize forest lands in new ways, thereby bringing about changes in the landscape, and will also create different sets of opportunities for and impacts on forest landowners and rural communities. Aesthetics, enjoyment of beauty and scenery, privacy, wildlife, investment, and family heritage are all important to family forest landowners in the South. However, the South is currently the major timber producing region of the United States; Southern forest landowners are more timber-oriented than their counterparts in the North and West, and Wicker (2002) notes that significant percentages of Southern forest landowners sell trees at some point. In the South, 41% of family forest owners indicated that timber was an important reason for owning forest, compared to 22% in the North and 18% in the West (Butler and Leath-erberry 2004). Newman and Wear (1993) developed production functions for private forest landowners in the U.S. South and found that they were profit maximizers but that nonmarket benefits influence their production behavior. These results suggest that that under certain market conditions, even people with little interest in timber may sell it. Given the active industrial forest sector in the U.S. South and the developing markets for bioen-ergy products, forest landowners in the South appear
Social Acceptability of Biofuels Among Small-Scale Forest landowners in the U.S. SouthSarah Hitchner1 and John Schelhas2 1 Center for Integrative Conservation Research, University of Georgia, Athens, GA, [email protected] 2 USDA Forest Service, Southern Research Station, Athens, GA, [email protected]
Keywords: bioenergy, biomass, cellulosic ethanol, wood pellets, forest landowners, rural communities, ethnography, social acceptability, U.S. South
52 | IUFRO 3.08.00 Small-Scale Forestry
Social Acceptability of Biofuels among Small-Scale Forest Landowners in the U.S. South
to be likely to adjust their forest management practices to meet available markets for bioenergy - if and when a viable bioenergy infrastructure emerges.
In addition to the development of a bioenergy infra-structure, the social acceptability of bioenergy in the U.S. South is contingent on how people interpret and understand the sustainability of biomass production for energy. Sustainability seeks to maximize synergies and minimize trade-offs across environmental, economic, and social domains. McCormick (2010) notes that, prag-matically, social acceptability is important because: (1) local communities can organize and prevent implemen-tation of bioenergy projects, and (2) public concern and the popular media can damage legitimacy of bioenergy and limit policy options. Mayfield et al. (2007) note the importance of developing collaborative processes that bring together industry, academia, and communities for the development of successful and locally benefi-cial bioenergy projects. Because of the multiple values and perspectives at play across the Southern land-scape, the social acceptability of bioenergy must be analyzed broadly in a way that takes into account diverse values, governance processes, and equity concerns. Such analysis should also recognize and elucidate the multiplicity of and dynamics between various stake-holders and pay particular attention to the multi-scalar dimensions of bioenergy development.
Social Acceptability Research
Acknowledging the inherent social complexity of bioen-ergy development, our ongoing research broadly analyzes social acceptability as it plays out across regional, community, and landowner scales by exam-ining biofuels narratives, stakeholder positions, policies and structures of governance, and mechanisms and criteria for landowner decision-making in a range of contexts of industrial biofuel sites that produce different bioenergy products.
Our research builds upon an ongoing collaborative project undertaken by social scientists from the USDA-Forest Service Southern Research Station and the Center for Integrative Conservation Research at the University of Georgia which has focused on under-standing the social context of biofuels and the factors that influence the social acceptability of bioenergy. We are currently conducting in-depth ethnographic research in three sites where bioenergy facilities have been, will be, and are currently operating: 1) Waycross, GA (site of Georgia Biomass, an operating pellet mill; 2) Soperton, GA (site of a proposed cellulosic ethanol/aviation fuel plant formerly operated by Range Fuels and currently owned by LanzaTech); and western Alabama/eastern Mississippi (site of several operating and proposed bioenergy facilities, including a pellet mill and sawmill run by wood-based electricity owned by Westervelt and what could be the world’s first cellulosic gasoline plant,
operated by KiOR). We will also conduct shorter field work in three additional sites with bioenergy plants: Baxley, GA; Cottondale, FL; and Jennings, LA.
Conceptually, we will draw upon the Integrative Frame-work developed by the Advancing Conservation in a Social Context (ACSC) research initiative, (Hirsch et al. 2011, McShane et al. 2011, Zia et al. 2011), to examine the socioeconomic impacts and social acceptability of wood-based biofuel development in rural communities in the U.S. South. ACSC was premised on the recogni-tion that conservation problems are complex and that decisions about conservation and development inher-ently involve trade-offs. These trade-offs are experi-enced and understood from multiple perspectives, and each perspective highlights certain elements of complex problems while obscuring others (Hirsch et al. 2011).
The ACSC Integrative Framework is designed to facili-tate recognition of the insights that emerge from a multi-plicity of disparate perspectives. It serves a variety of purposes, and we have adapted it for use in our proposed research project as an analytic framework for examining specific case studies. We have drawn upon the Integrative Framework’s three conceptual lenses – values and valuation, process and governance, and power and inequality – to design our research approach and methodology on the social acceptability of biofuels among small-scale forest owners in the U.S. South.
Values and Valuation
Bioenergy development will bring about changes in regional economies and landscapes, particularly in the areas immediately surrounding bioenergy facilities. Ecological, economic, social, and cultural values are all important. Social analysis, with attention to stakeholders and scale, enables us to understand how different people and groups perceive bioenergy development, how they frame the issues, where value conflicts and compatibili-ties lie, and how values influence behavior.
Process and Governance
In conjunction with studies of stakeholders’ values, it is necessary to examine the various institutional frame-works, legislative structures, and regulatory mecha-nisms involved with decision-making about biofuels at different spatial and temporal scales (Hitchner 2010). On a national level, the U.S. Energy Policy Act [EPACT] of 2005 and the Energy Independence and Security Act [EISA] of 2007 mandate the use of renewable energy sources. EISA mandates a six-fold increase of ethanol usage in the US by 2022 (to 36 billion gallons a year, of which only 15 billion gallons can be corn ethanol; advanced biofuels, including cellulosic ethanol, account for the other 21 billion gallons) and established a manda-tory Renewable Fuel Standard (RFS). The European
2012 Conference Proceedings | 53
Hitchner and Schelhas
Union also plays an important governance role in the U.S. South, as their mandates for renewable energy directly affect production of bioenergy products (espe-cially wood pellets) in this region. Incentives to partici-pate in various forest certification programs such as SFI (Sustainable Forestry Initiative), FSC (Forest Steward-ship Council), and American Tree Farm, can also influ-ence forest landowners’ management decisions.
Power and Inequality
In the development of a bioenergy plant, like the imple-mentation of any conservation or development project, certain groups often have more power to shape activi-ties. Racial and ethnic minorities and limited resource landowners have often been underrepresented and underserved in forestry-related developments in the South (Schelhas 2002). In particular, this is true both for African American forest landowners (Schelhas et al. 2003) and African American employees in forest product industries (Bailey et al. 1996). It is not uncommon for the individual interests of minority stakeholders to be neglected when pursuing broad goals such as forest conservation or energy independence that are defined as being in the public interest (Schelhas and Pfeffer 2008).
Our ethnographic research, guided by our project objec-tives and research questions, enables us to examine the trade-offs and synergies that occur in bioenergy devel-opment and how they are dependent on social context and the specifics of certain bioenergy projects.
We are engaging in a specific set of research activities, guided by this larger analytical framework and rooted in comparative ethnography, in a set of field sites selected to represent a variety of types and stages of bioen-ergy development in different socio-economic contexts. The combination of complementary research methods, including interviews, content analysis, and participant observation, allow us to gain nuanced understandings not only of the range of ways that people think about biofuel development in our primary and secondary field sites, but also how the multiplicity of values and valuation systems, structures of institutional and informal gover-nance, and dynamics of power and inequality affect perceptions and acceptability of bioenergy development in the U.S. South.
We will produce a systematic analysis of the multiple perspectives and ways that people view other perspec-tives for use by managers, policy-makers, non-profit organizations, and community-based groups to guide sustainable bioenergy development. We are paying particular attention to identifying ways that bioenergy development can fit into current community develop-ment and forest management goals, as well as avoid the potential pitfalls that may result when particular stakeholder groups are negatively affected or when
certain values are underrepresented in decisions. This approach enables a comprehensive and dynamic under-standing of social acceptability that can guide efforts to maximize the sustainability of bioenergy development, focus attention on areas where negative impacts of bioenergy development need to be addressed, improve our ability to communicate with stakeholders, and ulti-mately lay critical groundwork for bioenergy develop-ment by increasing its social acceptability.
Preliminary Research Findings and Discussion
In this paper, we will primarily discuss preliminary findings from our work in Soperton, GA, the site in which we have conducted the most research to date. In this site, we have met with extension personnel, county and state foresters, industry representatives, and members of community organizations, including the development councils involved with promoting bioenergy industry in Treutlen County. We have also met with a number of forest owners, whose landholdings vary greatly in size.
Construction began on Range Fuels, a wood-based cellulosic ethanol plant using gasification technology, in Soperton, GA in November 2007, after the company received a $76 million grant from the DOE (followed by an $80 loan guarantee from the USDA in 2009). The company was also backed financially by over $160 million of investor funds and a $6.25 million grant from the state of Georgia (Lane 2011), as well as a $80 million construction loan from AgSouth Farm Credit bank (on which it defaulted) (Lane 2011). Range Fuels was expected to produce 40 MGY of cellulosic ethanol with technology based on its demonstration scale plant in Colorado. However, due to technical problems in scaling up the technology, Range Fuels was only able to produce one batch of methanol from synthesis gas. The failure of Range Fuels has been compared to the dramatic failure of solar energy company Solyndra.
The implications of Range Fuels’ failure have been profound, both within the national biofuel industry and within the communities in and around Soperton, GA. There is fear that the U.S. government will end loan guarantees and grants to commercial-scale biofuel industries, as well as public anger over what is seen as a waste of taxpayer money. In Soperton, the initial announcement of the plant was met with great enthu-siasm, as it would bring many jobs to relatively poor and underdeveloped Treutlen County, as well as a new market for wood products, including forest residue that previously had little or no monetary value. However, after the closure (or “temporary suspension of operations”) of Range Fuels, jobs were lost, potential markets for wood waste dried up, and as one resident told us, “Even our Dairy Queen shut down.” According to the extension agent and landowners in Soperton with whom we have
54 | IUFRO 3.08.00 Small-Scale Forestry
Social Acceptability of Biofuels among Small-Scale Forest Landowners in the U.S. South
conducted preliminary interviews, people in Treutlen County are now wary, but also cautiously optimistic that the facility will re-open (after being purchased at auction for $5.1 million on January 3, 2012 by New Zealand-based company LanzaTech and being renamed the Freedom Pines Biorefinery) and eventually bring the promised development and markets.
Our preliminary ethnographic research has helped us identify key informants and plan interview strate-gies; it has also provided several insights into local issues surrounding biofuels. We have noted that there are broad societal concerns about deforestation and intensification of forest management from bioenergy development, although others feel that thinning and harvesting of small diameter trees for bioenergy will look a lot like conventional (and socially acceptable) forest management. Local forest owners and communi-ties with bioenergy plants have different interests than those expressed in broader public debate and discourse. Our initial interviews with landowners, foresters, and community members help outline some of the key atti-tudes, issues, opportunities, and constraints related to bioenergy development.
Bioenergy Plant Location and Community development
We have found that landowner and community expec-tations prior to the opening of a bioenergy facility are often not realistic, and so we have selected sites at different stages of development of bioenergy facilities and markets. There has been considerable activity in bioenergy development in the South, with states and communities creating incentives and promoting bioen-ergy plant location. The forest-dependent rural commu-nities we have visited are desperate for local jobs and say they would take almost anything short of toxic waste dumps. Some community members in Soperton, GA did express safety concerns regarding the siting of a new school in close proximity to the Range Fuels/Freedom Pines facility.
Press releases, negotiations with communities for plant location, and announcements of plants all are just the beginning of the bioenergy development process. Companies locating plants are often still developing commercial-scale technologies, and plant location plans and announcements are a precursor for obtaining government assistance and loan guarantees and raising private capital. It appears that plant announcements are also used to stake out a place within regional woodsheds and discourage other companies from locating in the same region. The result, particularly for liquid biofuel plants, is that even after announcements there is still a high level of uncertainty. Even for pellets plants, which have generally been the first plants to become opera-
tional, markets have some uncertainty due to being highly dependent on European Union commitments to renewable energy goals.
The uncertainties and the financial arrangements for bioenergy industry start-ups have implications for social acceptability. Press releases and negotiations with communities create high expectations, which can crash if plants are put on hold or cancelled (as was the case for the Range Fuels facility in Soperton, GA and the Coskata facility in Boligee, AL). For example, comments after the closing of the Range Fuels facility, strongly influenced by the fact that local tax abatements were awarded, included: “we got hoodwinked,” “it was a scam,” and “we got taken to the cleaners.” In a very politically conserva-tive part of the country, people are also very sensitive to government involvement and government loans, and publicity around the failure of the Solyndra solar plant in California has tainted government loans for renew-able energy in general.
Attitudes Toward Biofuels
Attitudes toward biofuels in communities and among landowners are mixed. There is a general dislike of ethanol. We frequently encounter gas stations in our study sites with signs proudly advertising ethanol-free gas. Many people believe that ethanol is bad for engines, particularly small engines, and that it decreases gas mileage. There is a dislike for using food crops, corn in particular, for fuel. People believe it drives up corn prices (including animal feed) and don’t like the fact that it is being mandated by the government. Concerns related to the food-versus-fuel debate tend to support, rather than discourage, interest in forest biomass. However, in the case of cellulosic ethanol, there are also local concerns about the size of the market for ethanol and whether it is already saturated.
Biofuels and Forests
While some industrial developments, notably Range Fuels in Soperton, GA, have planned to use waste wood that is currently left on-site (tops and branches), making this economically feasible is a challenge. Land-owner enthusiasm for this is high, because they would like to have a market for a product that is not currently used and a way to leave logging sites “cleaner.” One forester’s in-woods chipping experiment near Soperton was discouraging; he said if the chips had been sold the price would have been $90 a ton. This forester is more enthused about whole tree harvesting and trans-port. However, a forest product company in Alabama sees in-woods chipping as viable in the near future. The material used for bioenergy will depend on the type of facility, and is often categorized as clean versus dirty chips. Tops and branches do not provide the clean chips needed for pellets, which require chips made
2012 Conference Proceedings | 55
Hitchner and Schelhas
from debarked trees in order to hold together during shipment. Liquid fuel plants are beginning with clean chips, basically pulpwood, but expect to be able to take more diverse materials in the future. Combined heat and power plants, often associated with sawmills and their by-products, may be the best market for dirty chips.
The economics of wood transport mean that harvesting will be concentrated near biofuel plants (probably within a 50 – 70 miles radius). Sites where plants are locating, such as Soperton, generally have a lot of wood avail-able due to CRP [Conservation Reserve Program] plant-ings within the past 20- 30 years. Landowners would like to see a biomass market develop to create more competition for pulp wood, thereby increasing prices. While in most cases forest growth data suggests that the growth increment exceeds the harvesting increment, there are important questions related to price. Some foresters suggest that the pulp and paper industry can afford to pay much higher than current prices; bioen-ergy feasibility, on the other hand, may be dependent on low prices. However, bioenergy markets may be more predictable and fluctuate less, which could make biomass attractive to landowners and even change the way wood is bought and sold by leading to changes such as long-term contracts or forest owner marketing cooperatives.
If it is economically feasible to have biomass produc-tion as a land management goal, some landowners say they may be willing to shorten rotations on some of their forest tracts. The constraint to this is that sawtimber has historically provided greatest returns and is critical to the economics of forest management. Most forest owners want to continue to manage for sawtimber, as well as for hunting and recreation. But there may be ways to increase biomass yields early in the management cycle, for example, with high density pine planting and early thinning for biomass and then allowing the stand to move into chip and saw and sawtimber. One tree seedling company has a planting system that combines high value saw timber seedlings with lower cost biomass seedlings to reduce planting costs. In middle and south Georgia, increasing early biomass thinnings may not be compatible with pine straw production, which often provides very good returns in the middle years of slash and longleaf pine management (although it is depen-dent on immigrant labor, which is currently a contentious issue, both nationally and regionally).
While there are experiments with fast-growing tree species targeted for bioenergy (e.g., frost resistant eucalyptus, paulownia), most landowners prefer tradi-tional forestry species (loblolly, longleaf, and slash pine) that they perceive to be less risky because of existing markets and multiple uses. In some study sites (e.g., near Soperton), there are experiments with energy grasses (Giant Miscanthus, switchgrass), and there are indications that, with appropriate markets, some land-owners may convert poorer forestry sites to grasses. But
due to planting requirements, land for energy grasses appears more likely to come from what is now pasture. Over the past few decades there have been several highly promoted new biomass crops in the Soperton area, such as kenaf and paulownia, that did not pan out. These have left landowners very skeptical of new species that do not have existing markets and finan-cial support for planting. Many of these new species also raise social sensitivities related to genetic modi-fication and invasive species among landowners and the public.
Renewability and Sustainability
Biomass is ultimately likely to be most successful as a renewable and sustainable energy resource, suggesting that certification issues may be important. Some certi-fication programs, such as FSC, have lagged in the South, and in general the certification programs more popular with consumers and environmental groups have been less popular with forest landowners (Cashore et al. 2004). Newsom et al. (2003) found that forest landowners in Alabama tended to view certification as another form of government regulation. In the end, the way that landowners think about the broader policy motivations behind biofuels, combined with their accep-tance of certification, may be as important as markets in willingness to produce biofuels. Interviews with forest owners and community members indicate an interest in biofuels primarily as a mechanism to reduce depen-dence on foreign oil, create markets for local biomass, and improve community and landowner well-being. Climate change is rarely mentioned in the rural South, and when it is, generally only in the context of disbe-lief. Most landowners and foresters feel that certification is not necessary because they are already managing sustainably, and are not interested in separate BMPs or certification requirements for biomass. A number of pulp and paper mills and pellet plants that are shipping to Europe, however, are planning for acquisition of certified wood (both FSC and SFI), and certification for biomass may be inevitable.
Conclusion
The development of the liquid biofuels industry in the U.S. South is in the early stages and has seen some fluc-tuations, and most landowners and community members are now cautiously optimistic about a bioenergy industry and related markets. There is limited investment due to uncertainty, careful attention to long-term job creation and development potential, and interest in environmental sustainability. In some sites, there has been opposition to bioenergy development. Interest in biofuels is usually justified on the basis of energy independence and rural development. Our interviews with diverse stakeholders suggest that no one has a complete understanding of
56 | IUFRO 3.08.00 Small-Scale Forestry
Social Acceptability of Biofuels among Small-Scale Forest Landowners in the U.S. South
what is happening at any particular site, and that our research can play a key role in bringing clarity to the diverse perspectives and interests.
While our results are preliminary, they show the poten-tial for the Integrative Framework to improve our under-standing of the social acceptability of biofuels in the South. Values and valuation dimensions are highlighted in different stakeholder interests, including economic returns to land, community development, and the many non-commercial forest values and uses. Acceptability of bioenergy development in general is also affected by broader social values related to the environment, government, and markets. Process and governance dimensions are highlighted by multiple levels of govern-ment support for bioenergy development, as well as by emphasis on who does, and who does not, have a place at the table when these decisions are made. Bioenergy development is dependent on government policies such as renewable fuel standards, ethanol mandates, and loan guarantees. Certification programs and their legiti-macy will play a role in ensuring that biofuels meet public standards for renewability and sustainability. Power and inequality issues come to play in differential access of landowners and community members to decision-making processes about biofuel plant location and differential access to biomass opportunities. Many of the commu-nities where biofuel development is taking place have sharp racial and economic divisions, a backdrop that will influence how biofuel facility locations are viewed and will determine which landowners have access to biofuel opportunities and which receive few benefits or are negatively impacted.
We anticipate that the results of our research will high-light many interrelated factors that make bioenergy development for liquid fuels in the U.S. South a socially complex phenomenon. The results will clarify elements of social complexity that are often left out of models based on other research approaches. By analyzing this complexity with an integrative analytical framework that uses different theoretical lenses, our research will: (1) show the different value dimensions that underlie bioen-ergy discussion and actions, provide insights into how these are formed and change, and examine ways that discourses can drive collaboration and polarization; (2) show how the current policies shape biofuel develop-ment and determine the potential for developing gover-nance mechanisms to assure renewability and sustain-ability that effectively work across stakeholder groups; and (3) highlight groups that are underrepresented in the process and identify ways to incorporate them. Our results will also be important for designing effective policies, incentives and programs, and new land use technologies. Finally, our research will provide a foun-dation for collaborative planning in bioenergy sites.
Acknowledgement
Financial support for this research was provided by the Southern Research Station, USDA Forest Service through the project “Social and Cultural Dimensions of Climate Change Adaptation: Anthropological and Socio-logical Approaches to Social Vulnerability and Biofuels in the U.S. South” (11-JV11330144-147).
References
Bailey, C., Sinclair, P., Bliss, J., Perez, K. 1996. Segmented Labor Markets in Alabama’s Pulp and Paper Industry. Rural Sociology 61(3): 475-496.
Butler, B. J., Leatherberry, E. C. 2004. America’s Family Forest Owners. Journal of Forestry 102(7): 4-14.
Cashore, B., Auld, G., Newsom, d. 2004 Governing through Markets: Forest Certification and the Emergence of Non-State Authority. New Haven: Yale University Press.
delshad, A. B., Raymond, L., Sawicki, V., Wegener, d. T. 2010. Public Attitudes toward Political and Technological Options for Biofuels. Energy Policy 38: 3414-3425.
Hirsch, P. d., Adams, W. M., Brosius, J. P., Zia, A., Bariola, N., dammert, J. L. 2011. Acknowledging Conservation Trade-offs and Embracing Complexity. Conservation Biology 25(2): 259-264.
Hitchner, S. L. 2010. Heart of Borneo as a jalan tikus: Exploring the Links between Indigenous Rights, Extrac-tive and Exploitative Industries, and Conservation at the World Conservation Congress, 2008. Conservation and Society 8(4): 320-330.
Lane, J. 2011. The Range Fuels Failure. Biofuels digest. Available at: http://biofuelsdigest.com/bdigest/2011/12/05/the-range-fuels-failure/
Mayfield, C. A., Foster, C.D., Smith, C. T., Gan, J., Fox, S. 2007. Opportunities, Barriers, and Strategies for Forest Bioenergy and Bio-based Product development in the Southern United States. Biomass and Bioenergy 31: 631-637
McCormick, K. 2010. Communicating Bioenergy: A Growing Challenge. Biofuels, Bioproducts, and Biorefining 4: 494-502.
McShane, T. O., Hirsch, P. d., Trung, T. C., Songorwa, A. N., Kinzig, A., Monteferri, B., Mutekanga, d., Thang, H. d., dammert, J. L., Pulgar-Vidal, M., Welch-devine, M., Brosius, J. P., Coppolollo, P., O’Connor, S. 2011. Hard Choices: Making Trade-offs between Biodiversity Conser-vation and Human Well-being. Biological Conservation 144(3): 966-972.
Newman, d.H., Wear, d. N. 1993. Production Economics of Private Forestry: A Comparison of Industrial and Nonin-dustrial Forest Owners. American Journal of Agricultural Economics 75: 674-684.
2012 Conference Proceedings | 57
Hitchner and Schelhas
Newsom, d., Cashore, B., Auld, G., Granskog, J. E. 2003. Forest Certification in the Heart of dixie: A Survey of Alabama Landowners. In Teeter, L., Cashore, B., Zhang, d. (eds). Forest Policy for Private Forestry: Global and Regional Challenges CABI, Wallingford, p. 291-300.
Plate, R. R., Monroe, M. C., Oxarart, A. 2010. Public Percep-tions of Using Woody Biomass as a Renewable Energy Source. Journal of Extension 48(3): 1-15. Article Number 3FEA7.
Schelhas, J. 2002. Race, Ethnicity, and Natural Resources in the United States: A Review. Natural Resources Journal 42(4): 723-763.
Schelhas, J., Pfeffer, M. J. 2005. Forest Values of National Park Neighbors in Costa Rica. Human Organization 64(4): 385-397.
Schelhas, J., Zabawa, R., and Molnar, J. J. 2003. New Oppor-tunities for Social Research in Forest Landowners in the South. Southern Rural Sociology 19(2): 60-69.
Selfa, T., Kulcsar, L., Bain, C., Goe, R., Middendorf, G. 2010. Biofuels Bonanza? Exploring Community Perceptions of the Promises and Perils of Biofuels Production. Biomass and Bioenergy 34: 1-11.
Susaeta, A., Alavalapati, J., Lal, P., Matta, J. R., Mercer, E. 2010. Assessing Public Preferences for Forest Biomass Based Energy in the Southern United States. Environmental Management 45: 697-710.
Wicker, G. 2002. Motivation for private forest landowners. In Wear, d. N., Greis, J. G. (eds). Southern Forest Resource Assessment. Gen. Tech. Rep. SRS-253. USdA Forest Service, Asheville, NC.
Zia, A., Hirsch, P., Songorwa, A., Mutekanga, d. R., O’Connor, S., McShane, T., Brosius, J. P., Norton, B. 2011. Cross-scale Value Trade-offs in Managing Social-ecological Systems: The politics of Scale in Ruaha National Park, Tanzania. Ecology and Society 16(4): 7. [online] URL: http://www.ecologyandsociety.org/vol16/iss4/art7/
58 | IUFRO 3.08.00 Small-Scale Forestry
Introduction
Small-scale family forest owners vary increasingly in terms of how they value different purposes of forest and what they pursue regarding their own land (Hogl et al. 2005, Kendra and Hull 2005, Karppinen 2012). Forest ownership is fundamentally a matter of perceived identity in connection with the owner’s actualized life-style (Bliss and Martin 1989, Ziegenspeck et al. 2004). Therefore, forest advisory can no longer rely purely on the expert-driven mode of extension and technology transfer, assuming a predominantly economic view on timber production.
Increasing the role of the small-scale forest owner’s perspective in forest advisory and management planning has been considered one way to tackle the challenge of changing forest ownership patterns. In a broad sense, this principle has been actualized, for example, in voluntary forest conservation programmes (Kauneckis and York 2009, Mäntymaa et al. 2009). In turn, forest research has produced the concepts of owner-driven forest planning (Hujala 2009) and adaptive decision analysis (Leskinen et al. 2009) as well as customer segmentations for policy and market services based on various forest owner typologies worldwide (e.g. Boon et al. 2004, Salmon et al. 2006, Hujala et al. 2012).
Due to changes in forest owners’ objectives and their operational environments, interactive forest planning may have an important role especially in the forthcoming forest planning practices. Interactive forest planning can be defined as a learning-oriented form of forest advisory, which focuses on finding a documented chain of planned actions in forest by means of assessing the owner’s objectives and the holding’s production possi-bilities with the aid of discussions, computer simulations and comparison of alternatives (e.g. Pykäläinen 2000,
Pykäläinen et al. 2006). Interactive planning charac-teristics may also be realized in computer-supported participatory planning processes (e.g. Tyrväinen et al. 2006, Salter et al. 2009).
One of the main ideas in interactive planning is that the forest owner (or the stakeholder participant in the participatory case) learns to know the production possi-bilities (alternative forest plans) of the forest area under planning and the connections between different forest uses in general. Typically the owner’s forest manage-ment goals also become clearer during the planning process. On the other hand, the planner learns as well about the production possibilities and about the owner’s goals. Hence, interactive forest planning can be seen as a process of collaborative learning (see Dillenbourg 1999).
Thus far however, the research work of interactive forest planning has mainly focused on technical method devel-opment, not so much on the actual root-level commu-nication and learning. An example of such research approach is a video analysis of owners’ and the plan-ner’s discussions in forest-planning meetings (Virkkula et al. 2009).
Meanwhile, the science of higher education has devel-oped useful new concepts for approaching the learning processes among advisory interlocutors. This paper introduces the concept of ‘trialogical learning’ as a prom-ising theoretical framework for improving collaboration and mutual learning in the context of interactive forest planning. Furthermore, to demonstrate some impor-tant viewpoints of the trialogical learning approach, two interview-based case studies from eastern Finland are presented. The general aim of this paper is to acquire evidence of the usefulness of the trialogical learning
Trialogical learning – A Concept For Enhancing Interactive Forest Planning Teppo Hujala1, Henna Höglund2, Lauri Mehtätalo3 and Jouni Pykäläinen4
1 Finnish Forest Research Institute, Vantaa Unit, P.O. Box 18, FI-01301 Vantaa, Finland, [email protected] University of Eastern Finland, School of Forest Sciences, P.O. Box 111, FI-80101 Joensuu, Finland, [email protected]
3 University of Eastern Finland, School of Computing and School of Forest Sciences, P.O. Box 111, FI-80101 Joensuu, Finland, [email protected]
4 Finnish Forest Research Institute, Joensuu Unit, P.O. Box 68, FI-80101 Joensuu, Finland, [email protected]
Keywords: artifacts, communication, forestry advisory, mediation, metaphors of learning, recognition
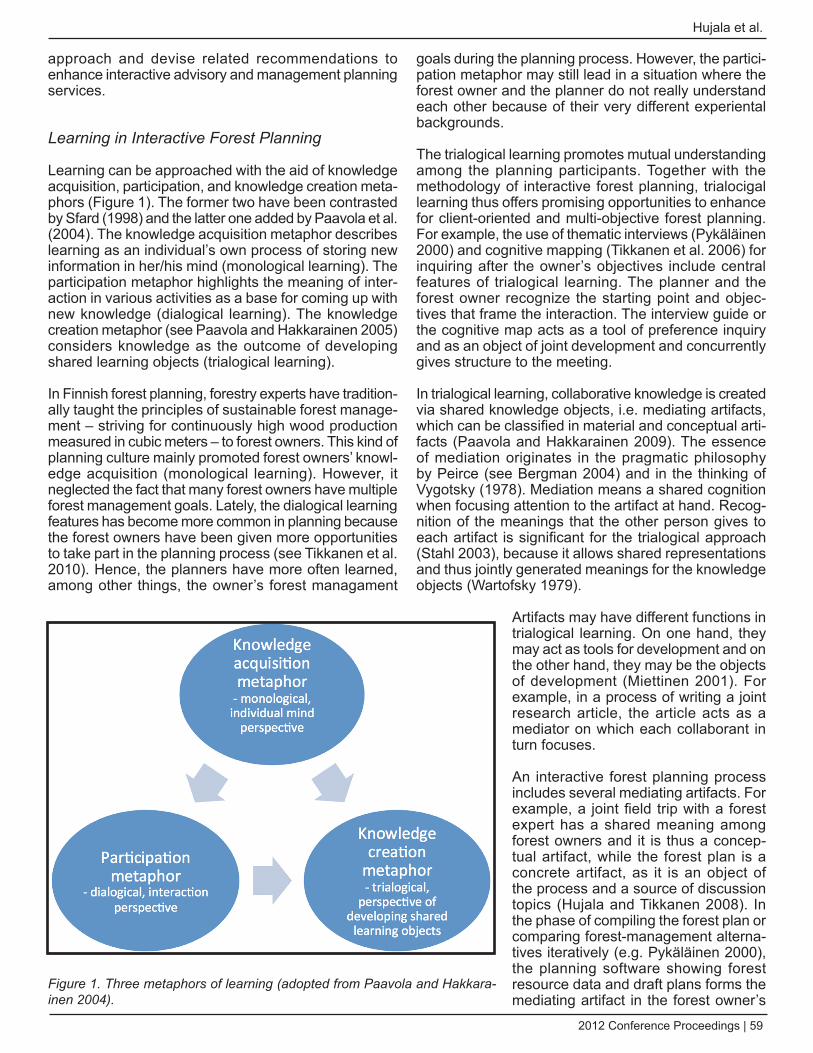
2012 Conference Proceedings | 59
Hujala et al.
approach and devise related recommendations to enhance interactive advisory and management planning services.
Learning in Interactive Forest Planning
Learning can be approached with the aid of knowledge acquisition, participation, and knowledge creation meta-phors (Figure 1). The former two have been contrasted by Sfard (1998) and the latter one added by Paavola et al. (2004). The knowledge acquisition metaphor describes learning as an individual’s own process of storing new information in her/his mind (monological learning). The participation metaphor highlights the meaning of inter-action in various activities as a base for coming up with new knowledge (dialogical learning). The knowledge creation metaphor (see Paavola and Hakkarainen 2005) considers knowledge as the outcome of developing shared learning objects (trialogical learning).
In Finnish forest planning, forestry experts have tradition-ally taught the principles of sustainable forest manage-ment – striving for continuously high wood production measured in cubic meters – to forest owners. This kind of planning culture mainly promoted forest owners’ knowl-edge acquisition (monological learning). However, it neglected the fact that many forest owners have multiple forest management goals. Lately, the dialogical learning features has become more common in planning because the forest owners have been given more opportunities to take part in the planning process (see Tikkanen et al. 2010). Hence, the planners have more often learned, among other things, the owner’s forest managament
goals during the planning process. However, the partici-pation metaphor may still lead in a situation where the forest owner and the planner do not really understand each other because of their very different experiental backgrounds.
The trialogical learning promotes mutual understanding among the planning participants. Together with the methodology of interactive forest planning, trialocigal learning thus offers promising opportunities to enhance for client-oriented and multi-objective forest planning. For example, the use of thematic interviews (Pykäläinen 2000) and cognitive mapping (Tikkanen et al. 2006) for inquiring after the owner’s objectives include central features of trialogical learning. The planner and the forest owner recognize the starting point and objec-tives that frame the interaction. The interview guide or the cognitive map acts as a tool of preference inquiry and as an object of joint development and concurrently gives structure to the meeting.
In trialogical learning, collaborative knowledge is created via shared knowledge objects, i.e. mediating artifacts, which can be classified in material and conceptual arti-facts (Paavola and Hakkarainen 2009). The essence of mediation originates in the pragmatic philosophy by Peirce (see Bergman 2004) and in the thinking of Vygotsky (1978). Mediation means a shared cognition when focusing attention to the artifact at hand. Recog-nition of the meanings that the other person gives to each artifact is significant for the trialogical approach (Stahl 2003), because it allows shared representations and thus jointly generated meanings for the knowledge objects (Wartofsky 1979).
Artifacts may have different functions in trialogical learning. On one hand, they may act as tools for development and on the other hand, they may be the objects of development (Miettinen 2001). For example, in a process of writing a joint research article, the article acts as a mediator on which each collaborant in turn focuses.
An interactive forest planning process includes several mediating artifacts. For example, a joint field trip with a forest expert has a shared meaning among forest owners and it is thus a concep-tual artifact, while the forest plan is a concrete artifact, as it is an object of the process and a source of discussion topics (Hujala and Tikkanen 2008). In the phase of compiling the forest plan or comparing forest-management alterna-tives iteratively (e.g. Pykäläinen 2000), the planning software showing forest resource data and draft plans forms the mediating artifact in the forest owner’s
Figure 1. Three metaphors of learning (adopted from Paavola and Hakkara-inen 2004).
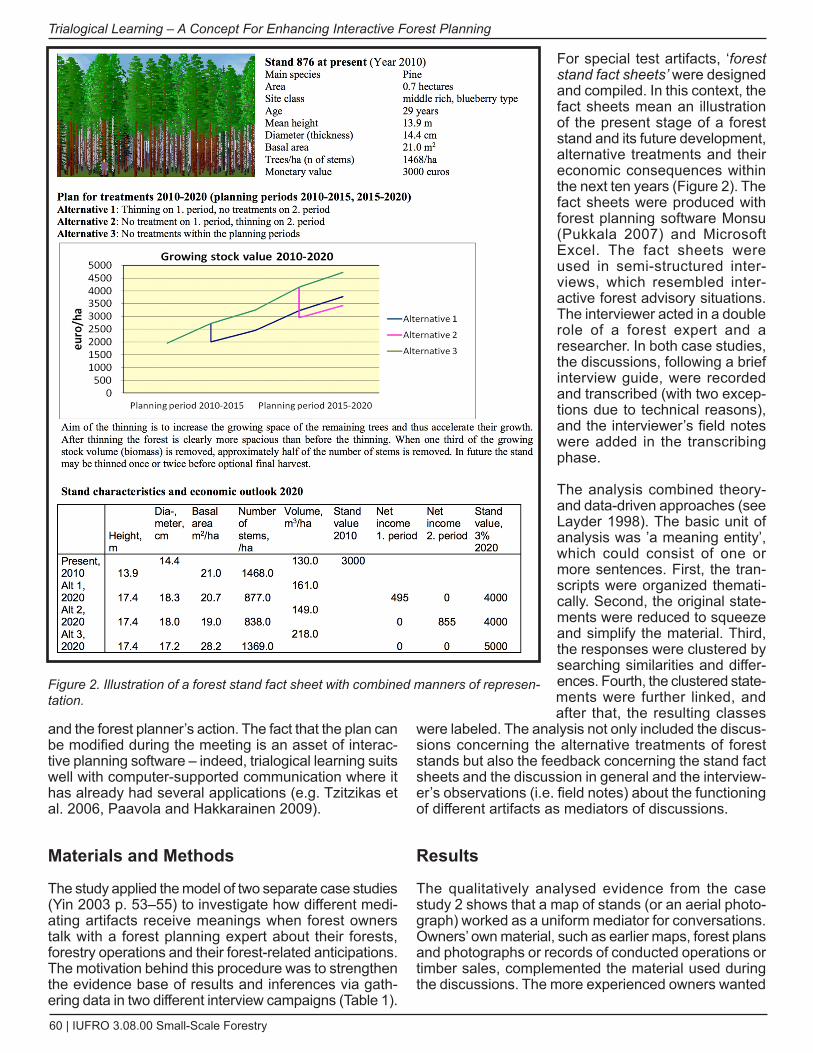
60 | IUFRO 3.08.00 Small-Scale Forestry
Trialogical Learning – A Concept For Enhancing Interactive Forest Planning
and the forest planner’s action. The fact that the plan can be modified during the meeting is an asset of interac-tive planning software – indeed, trialogical learning suits well with computer-supported communication where it has already had several applications (e.g. Tzitzikas et al. 2006, Paavola and Hakkarainen 2009).
Materials and Methods
The study applied the model of two separate case studies (Yin 2003 p. 53–55) to investigate how different medi-ating artifacts receive meanings when forest owners talk with a forest planning expert about their forests, forestry operations and their forest-related anticipations. The motivation behind this procedure was to strengthen the evidence base of results and inferences via gath-ering data in two different interview campaigns (Table 1).
For special test artifacts, ‘forest stand fact sheets’ were designed and compiled. In this context, the fact sheets mean an illustration of the present stage of a forest stand and its future development, alternative treatments and their economic consequences within the next ten years (Figure 2). The fact sheets were produced with forest planning software Monsu (Pukkala 2007) and Microsoft Excel. The fact sheets were used in semi-structured inter-views, which resembled inter-active forest advisory situations. The interviewer acted in a double role of a forest expert and a researcher. In both case studies, the discussions, following a brief interview guide, were recorded and transcribed (with two excep-tions due to technical reasons), and the interviewer’s field notes were added in the transcribing phase.
The analysis combined theory- and data-driven approaches (see Layder 1998). The basic unit of analysis was ’a meaning entity’, which could consist of one or more sentences. First, the tran-scripts were organized themati-cally. Second, the original state-ments were reduced to squeeze and simplify the material. Third, the responses were clustered by searching similarities and differ-ences. Fourth, the clustered state-ments were further linked, and after that, the resulting classes
were labeled. The analysis not only included the discus-sions concerning the alternative treatments of forest stands but also the feedback concerning the stand fact sheets and the discussion in general and the interview-er’s observations (i.e. field notes) about the functioning of different artifacts as mediators of discussions.
Results
The qualitatively analysed evidence from the case study 2 shows that a map of stands (or an aerial photo-graph) worked as a uniform mediator for conversations. Owners’ own material, such as earlier maps, forest plans and photographs or records of conducted operations or timber sales, complemented the material used during the discussions. The more experienced owners wanted
Figure 2. Illustration of a forest stand fact sheet with combined manners of represen-tation.
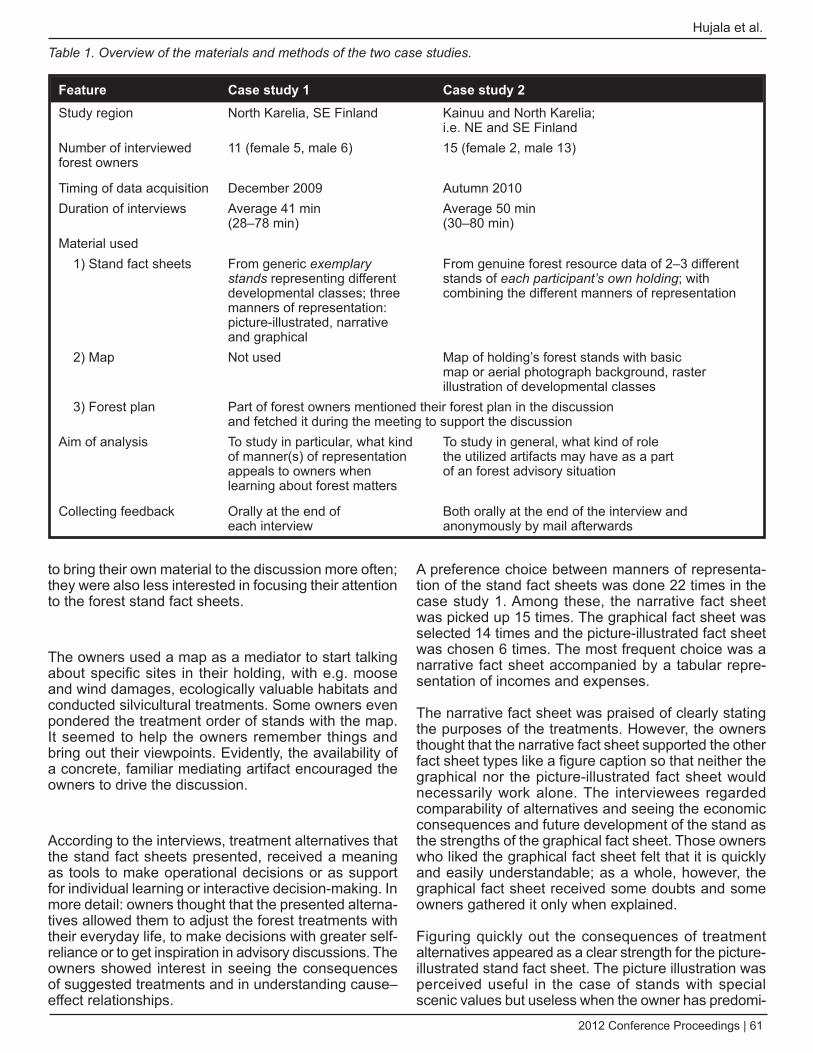
2012 Conference Proceedings | 61
Hujala et al.
to bring their own material to the discussion more often; they were also less interested in focusing their attention to the forest stand fact sheets.
The owners used a map as a mediator to start talking about specific sites in their holding, with e.g. moose and wind damages, ecologically valuable habitats and conducted silvicultural treatments. Some owners even pondered the treatment order of stands with the map. It seemed to help the owners remember things and bring out their viewpoints. Evidently, the availability of a concrete, familiar mediating artifact encouraged the owners to drive the discussion.
According to the interviews, treatment alternatives that the stand fact sheets presented, received a meaning as tools to make operational decisions or as support for individual learning or interactive decision-making. In more detail: owners thought that the presented alterna-tives allowed them to adjust the forest treatments with their everyday life, to make decisions with greater self-reliance or to get inspiration in advisory discussions. The owners showed interest in seeing the consequences of suggested treatments and in understanding cause–effect relationships.
A preference choice between manners of representa-tion of the stand fact sheets was done 22 times in the case study 1. Among these, the narrative fact sheet was picked up 15 times. The graphical fact sheet was selected 14 times and the picture-illustrated fact sheet was chosen 6 times. The most frequent choice was a narrative fact sheet accompanied by a tabular repre-sentation of incomes and expenses.
The narrative fact sheet was praised of clearly stating the purposes of the treatments. However, the owners thought that the narrative fact sheet supported the other fact sheet types like a figure caption so that neither the graphical nor the picture-illustrated fact sheet would necessarily work alone. The interviewees regarded comparability of alternatives and seeing the economic consequences and future development of the stand as the strengths of the graphical fact sheet. Those owners who liked the graphical fact sheet felt that it is quickly and easily understandable; as a whole, however, the graphical fact sheet received some doubts and some owners gathered it only when explained.
Figuring quickly out the consequences of treatment alternatives appeared as a clear strength for the picture-illustrated stand fact sheet. The picture illustration was perceived useful in the case of stands with special scenic values but useless when the owner has predomi-
Feature Case study 1 Case study 2Study region North Karelia, SE Finland Kainuu and North Karelia;
i.e. NE and SE FinlandNumber of interviewed forest owners
11 (female 5, male 6) 15 (female 2, male 13)
Timing of data acquisition December 2009 Autumn 2010Duration of interviews Average 41 min
(28–78 min)Average 50 min (30–80 min)
Material used1) Stand fact sheets From generic exemplary
stands representing different developmental classes; three manners of representation: picture-illustrated, narrative and graphical
From genuine forest resource data of 2–3 different stands of each participant’s own holding; with combining the different manners of representation
2) Map Not used Map of holding’s forest stands with basic map or aerial photograph background, raster illustration of developmental classes
3) Forest plan Part of forest owners mentioned their forest plan in the discussion and fetched it during the meeting to support the discussion
Aim of analysis To study in particular, what kind of manner(s) of representation appeals to owners when learning about forest matters
To study in general, what kind of role the utilized artifacts may have as a part of an forest advisory situation
Collecting feedback Orally at the end of each interview
Both orally at the end of the interview and anonymously by mail afterwards
Table 1. Overview of the materials and methods of the two case studies.
62 | IUFRO 3.08.00 Small-Scale Forestry
Trialogical Learning – A Concept For Enhancing Interactive Forest Planning
nantly other than scenic objectives, e.g. economic ones. Forestry terms (e.g. basal area, seed tree cutting) were problematic for some owners, because they did not understand the terms and thus the comprehension of the stand only came via the pictures. Most owners, however, felt that numbers meant more than pictures, which only vivify and thus increase the meaningfulness of contemplating the fact sheets.
Discussion and Conclusions
The findings encourage using artifact-focused approach in further action research aiming to improve interactive forest planning and advisory. In both case studies, the stand fact sheets worked as stimulating mediating arti-facts making the forest-use alternatives visible. When seeing and understanding stand-level alternatives, owner’s power on driving the advisory discussion and making forestry decisions increases. Presenting alter-natives seems to be a feasible way to go deeper in mutual learning about the owner’s objectives and moti-vations.
The results indicated that the role of a map was essen-tial as a general tool to guide the discussions. There were signs that the map did function as a mediator for shared cognition of the interlocutors. The phase of forest ownership of the interviewees seemed to affect the choice of material used as mediating artifacts: the less experienced owners applied the given forest stand fact sheets while the more experienced rather used their own material. There are two probable reasons for this: on one hand, the more experienced owners more often have such material of their own, and on the other hand, the fact sheets present basic knowledge of forest treat-ments, which usually is of interest among owners with less prior knowledge.
The results indicate that fact sheets could be used as tools in marketing forest plans and other advisory services, because they have the potential to give more understandable view on the contents of the service. The observed essence of map as structuring the advisory interaction should be utilized when organizing meetings with forest owners. Concurrently, owners’ own material should be given more room in discussions, because to allow using those as mediating artifacts will reshape the forest planner’s role from advice giver towards situation-sensitive consultant (see Hujala 2009). This, in turn, could contribute to the commitment to plans among owners and the effectiveness of planning.
To sum up, the approach of trialogical learning encour-ages developing advisory services towards such interac-tion that begins with recognizing the participants’ back-grounds and continues with organizing the interaction around joint mediating artifacts. Trialogical learning offers forest professionals grounds and tools to i) pre-structure advisory meetings and ii) make owners elicit
their preferences. Both forest professionals and forest owners should be encouraged to using concrete medi-ating artifacts as a help in highlighting their viewpoints. That way the interlocutors can affect the learning of each other.
The inherent demand for flexibility is an evident chal-lenge for trialogical learning, because for following that approach only direct-giving features can be given. It may also be that part of forest owners and forest professionals are not yet familiar with interactive planning culture. Miti-gating this challenge will require active public discus-sion about reshaping planning services as well as train-ings and experiential workshops. In addition, because forest planning software suitable for iterative interac-tive services are currently in their infancy, research and development should focus on computer-mediated inter-action and related tools. With more profound interactive planning software and higher awareness of how arti-facts enhance participants’ mutual understanding, the promises of trialogical learning in forest advisory would be closer to fulfillment.
References
Bergman, M. 2004. Fields of Signification: Explorations in Charles S. Peirce’s Theory of Signs. Philosophical Studies from the University of Helsinki 6. 495 p.
Bliss, J.C. & Martin, A.J. 1989. Identifying NIPF Manage-ment Motivations with Qualitative Methods. Forest Science 35(2): 601–622.
Boon, T.E., Meilby, H. & Thorsen, B.J. 2004. An empiri-cally based typology of private forest owners in denmark: Improving communication between authorities and owners. Scandinavian Journal of Forest Research 19 (Suppl. 4): 45–55.
dillenbourg, P. 1999. What do you mean by collaborative learning? In: dillenbourg, P. (ed.). Collaborative-learning: Cognitive and Computational Approaches. Elsevier, Oxford. p.1–19.
Hogl, K., Pregernig, M. & Weiss, G. 2005. What is new about new forest owners? A typology of private forest ownership in Austria. Small-scale Forest Economics, Management and Policy 4(3): 325–342.
Hujala, T. 2009. Owner-driven decision support in holding-specific forest planning. Doctoral Thesis, University of Helsinki, Finland. dissertationes Forestales 85. 40 p. + 4 articles. Available at: http://www.metla.fi/dissertationes/df85.htm.
Hujala, T. & Tikkanen, J. 2008. Boosters of and barriers to smooth communication in family forest owners’ decision making. Scandinavian Journal of Forest Research 23(5): 466–477.
2012 Conference Proceedings | 63
Hujala et al.
Hujala, T., Kurttila, M. & Karppinen, H. 2012. Customer segments among family forest owners: Combining owner-ship objectives and decision-making styles. To appear in Small-scale Forestry. http://dx.doi.org/10.1007/s11842-012-9215-1
Karppinen, H. 2012. New forest owners and owners-to-be: apples and oranges? Small-scale Forestry 11(1): 15–26.
Kauneckis, d. & York, A.M. 2009. An Empirical Evaluation of Private Landowner Participation in Voluntary Forest Conservation Programs. Environmental Management 44(3): 468–484.
Kendra, A. & Hull, R.B. 2005. Motivations and behaviors of new forest owners in Virginia. Forest Science 51(2):142–154.
Layder, d. 1998. Sociological practice: Linking theory and social research. Sage Publications, London. 208 p.
Leskinen, P., Hujala, T., Tikkanen, J., Kainulainen, T., Kangas, A., Kurttila, M., Pykäläinen, J. & Leskinen, L.A. 2009. Adaptive decision analysis in forest management planning. Forest Science 55(2): 95–108.
Miettinen, R. 2001. Artifact Mediation in dewey and in Cultural–Historical Activity Theory. Mind, Culture, And Activity 8(4): 297–308.
Mäntymaa, E., Juutinen, A., Mönkkönen, M. & Svento, R. 2009. Participation and compensation claims in voluntary forest conservation: A case of privately owned forests in Finland. Forest Policy and Economics 11(7): 498–507.
Paavola, S., Lipponen, L. & Hakkarainen, K. 2004. Models of Innovative Knowledge Communities and Three Meta-phors of Learning. Review of Educational Research 74(4): 557–576.
Paavola, S. & Hakkarainen, K. 2005. The Knowledge Creation Metaphor – An Emergent Epistemological Approach to Learning. Science & Education 14(6): 535–557.
Paavola, S. & Hakkarainen, K. 2009. From meaning making to joint construction of knowl-edge practices and artefacts – A trialogical approach to CSCL. In: O’Malley, C., Suthers, d., Reimann, P. and dimitracopoulou, A. (eds.). Computer Supported Collaborative Learning Practices: CSCL2009 Conference Proceedings. p. 83–92.
Pukkala, T. 2007. MONSU-metsäsuunnitteluohjelmisto, Versio 5.1. Ohjelmiston toiminta ja käyttö. [MONSU Forest planning program, version 5.1. Functioning and use of the software.] University of Joensuu, Finland. 53 p. (In Finnish.)
Pykäläinen, J. 2000. Defining forest owner’s forest-manage-ment goals by means of a thematic interview in interactive forest planning. Silva Fennica 34(1): 47–59.
Pykäläinen, J., Kurttila, M. & Pukkala, T. 2006. Interactive forest planning with NIPF owners. Working Papers of the Finnish Forest Research Institute 38: 61–65. Available at: http://www.metla.fi/julkaisut/workingpapers/2006/mwp038.htm.
Salmon, O., Brunson, M. & Kuhns, M. 2006. Benefit-based audience segmentation: A tool for identifying nonindustrial private forest (NIPF) owner education needs. Journal of Forestry 104(8): 419–425.
Salter, J.d., Campbell, C., Journeay, M. & Sheppard, S.R.J. 2009. The digital workshop: Exploring the use of inter-active and immersive visualisation tools in participatory planning. Journal of Environmental Management 90(6): 2090–2101.
Sfard, A. 1998. On two metaphors for learning and the dangers of choosing just one. Educational Researcher 27(2): 4–13.
Stahl, G. 2003. Meaning and interpretation in collaboration. In: Wasson, B., Ludvigsen, S. and Hoppe, U. (eds.). designing for Change in Networked Learning Environments: Proceed-ings of the International Conference on Computer Support for Collaborative Learning 2003. Computer-supported Collaborative Learning, Volume 2. Kluwer, dordrecht. p. 523–532.
Tikkanen, J., Isokääntä, T., Pykäläinen, J. & Leskinen, P. 2006. Applying cognitive mapping approach to explore the objective-structure of forest owners in a Northern Finnish case area. Forest Policy and Economics 9(2): 139–152.
Tikkanen, J., Hokajärvi, R. & Hujala, T. 2010. development phases of forest planning on non-industrial private lands in Finland: Perspective of planners’ work. Small-scale Forestry 9(3): 331–347.
Tyrväinen, L., Gustavsson, R., Konijnendijk & Ode, Å. 2006. Visualization and landscape laboratories in planning, design and management of urban woodlands. Forest Policy and Economics 8(8): 811–823.
Virkkula, O., Hujala, T., Hokajärvi, R. & Tikkanen, J. 2009. Are forestry consultation meetings owner-driven? – Analyzing the interplay between the owner and the planner. In: Piatek, K., Spong, B., Harrison, S. and McGill, d. (eds.). Seeing the Forest Beyond the Trees: New possibilities and expec-tations for products and services from small-scale forestry. Proceedings of the 2009 IUFRO 3.08 Small-Scale Forestry Symposium, June 7–11, 2009, Morgantown, West Virginia (USA). p. 304–313. Available at: http://www.iufro.org/publi-cations/proceedings/
Vygotsky, L.S. 1978. Mind in Society. The development of Higher Psychological Processes. Cambridge, Massachu-setts: Harvard University Press. 159 p.
Wartofsky, M. 1979. Models: Representation, and the Scien-tific Understanding. Boston Studies in the Philosophy of Science, Volume XLVIII. Reidel, Boston. 428 p.
Yin, R.K. 2003. Case study research: design and methods, 3rd ed. Sage Publications, Thousand Oaks. 200 p.
Ziegenspeck, S., Hardter, U., and Schraml, U. 2004. Lifestyles of private forest owners as an indication of social change. Forest Policy and Economics 6(5): 447–458.
64 | IUFRO 3.08.00 Small-Scale Forestry
Introduction
Forests of the world have gained high attention within the climate change arena since one of the major sources of world’s green house gas emissions is related to defores-tation and forest degradation. Globally it is realized that past regulatory instruments alone have not been effec-tive in halting deforestation and forest degradation (Karky 2008). A new paradigm in natural resources manage-ment has emerged which is based on performance-oriented economic incentives to reward conservation and good management practices. Reducing Emissions
from Deforestation and Forest Degradation1 (REDD+) deals with climate change mitigation combined with adaptation measures. It is also an ecosystem based adaptation strategy for communities depending on forest resources.REDD+ is an incentive based mechanism which is being discussed under the aegis of the United Nations Framework Convention on Climate Change
1 REDD and REDD+ are used inter-changeably in the paper (REDD represents is maintaining existing forest stock while REDD+ represents carbon stock enhancement in addition to maintaining standing carbon stock)
Collective Actions by Community Forest User Groups in Conserving Forest to halt Deforestation and Degradation by Controlling Forest Fire: linking Science to Practice, a REDD+ Case Study of Three Watersheds in Nepal
Seema Karki1, Sudip Pradhan2, Bhaskar Singh Karky3, and Rajan Kotru4
1 REDD Research Associate, International Centre for Integrated Mountain Development (ICIMOD), GPO Box: 3226, Khumaltar, Kathmandu, Nepal. Tel: +977-1-5003222 Fax: +977-1-5003277, [email protected]
2 GIS/DSS Developer, International Centre for Integrated Mountain Development (ICIMOD), GPO Box: 3226, Khumaltar, Kathmandu, Nepal. Tel: +977-1-5003222 Fax: +977-1-5003277, [email protected]
3 Resource Economist, Economic Analysis Division, ICIMOD, International Centre for Integrated Mountain Development (ICIMOD), GPO Box: 3226, Khumaltar, Kathmandu, Nepal. Tel: +977-1-5003222 Fax: +977-1-5003277, [email protected]
4 Action Area Team Leader, Integrated Forest & Watershed Services, International Centre for Integrated Mountain Development (ICIMOD), GPO Box: 3226, Khumaltar, Kathmandu, Nepal. Tel: +977-1-5003222 Fax: +977-1-5003277, [email protected]
Keywords: deforestation and degradation, Forest-Fire, REdd+ incentives
Abstract
At the national level in Nepal, community’s participation in managing and conserving forests to rehabilitate and restore degraded landscapes are now widely promoted and enabled by the government policy. At the international level, an incentive based mechanism Reducing Emissions from Deforestation and Forest Degradation (REDD) is being discussed under United Nations Framework Convention on Climate Change (UNFCCC) to recognize and incentivize the role of community people in conserving forests. If and how global incentive-based mechanism under REDD could further promote sustainable forest management and enhance the conservation of natural forests while principles of inclusiveness and equity are maintained, is the key question being researched. This paper analyzes performance-based payments made under REDD mechanism to measure and monitor if such additionality can bring incentives to promote better forest management. Forest fire is considered as one of the main drivers of Deforestation and Degradation (D and D) and, how REDD payments can spur conserving commu-nities to curtail this will be discussed by this paper.
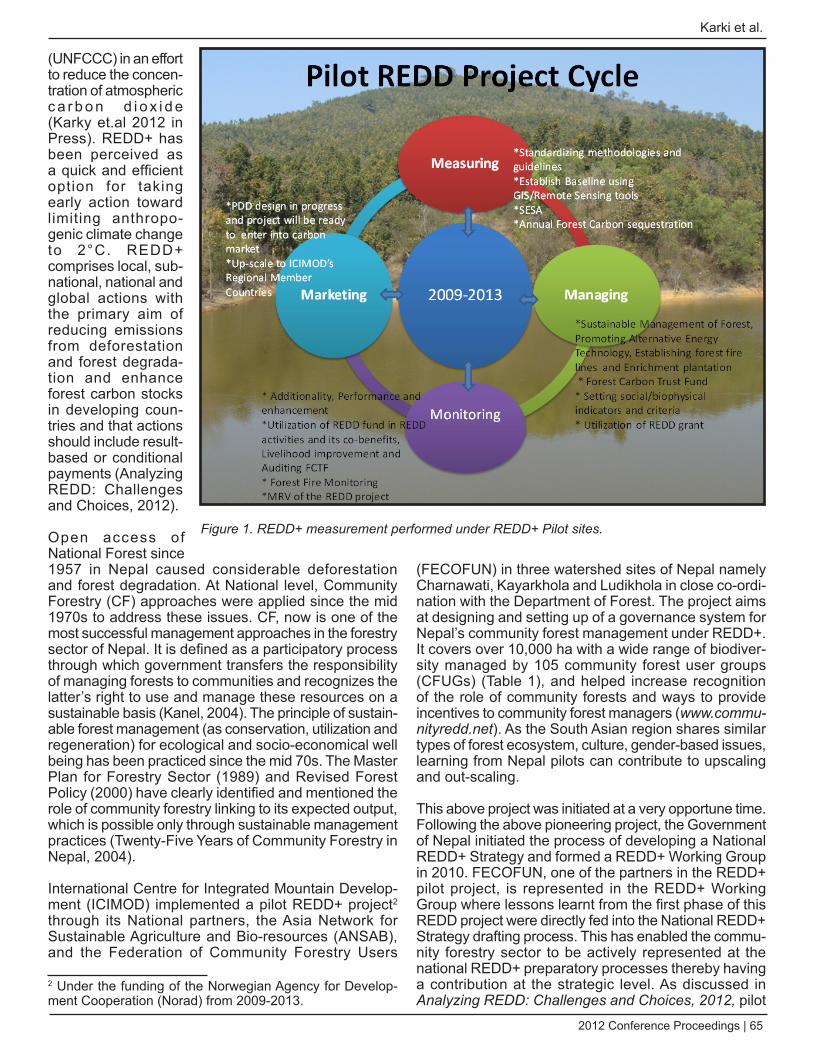
2012 Conference Proceedings | 65
Karki et al.
(UNFCCC) in an effort to reduce the concen-tration of atmospheric c a r b o n d i o x i d e (Karky et.al 2012 in Press). REDD+ has been perceived as a quick and efficient option for taking early action toward limiting anthropo-genic climate change to 2°C. REDD+ comprises local, sub-national, national and global actions with the primary aim of reducing emissions from deforestation and forest degrada-tion and enhance forest carbon stocks in developing coun-tries and that actions should include result-based or conditional payments (Analyzing REDD: Challenges and Choices, 2012).
Open access of National Forest since 1957 in Nepal caused considerable deforestation and forest degradation. At National level, Community Forestry (CF) approaches were applied since the mid 1970s to address these issues. CF, now is one of the most successful management approaches in the forestry sector of Nepal. It is defined as a participatory process through which government transfers the responsibility of managing forests to communities and recognizes the latter’s right to use and manage these resources on a sustainable basis (Kanel, 2004). The principle of sustain-able forest management (as conservation, utilization and regeneration) for ecological and socio-economical well being has been practiced since the mid 70s. The Master Plan for Forestry Sector (1989) and Revised Forest Policy (2000) have clearly identified and mentioned the role of community forestry linking to its expected output, which is possible only through sustainable management practices (Twenty-Five Years of Community Forestry in Nepal, 2004).
International Centre for Integrated Mountain Develop-ment (ICIMOD) implemented a pilot REDD+ project2 through its National partners, the Asia Network for Sustainable Agriculture and Bio-resources (ANSAB), and the Federation of Community Forestry Users
2 Under the funding of the Norwegian Agency for Develop-ment Cooperation (Norad) from 2009-2013.
(FECOFUN) in three watershed sites of Nepal namely Charnawati, Kayarkhola and Ludikhola in close co-ordi-nation with the Department of Forest. The project aims at designing and setting up of a governance system for Nepal’s community forest management under REDD+. It covers over 10,000 ha with a wide range of biodiver-sity managed by 105 community forest user groups (CFUGs) (Table 1), and helped increase recognition of the role of community forests and ways to provide incentives to community forest managers (www.commu-nityredd.net). As the South Asian region shares similar types of forest ecosystem, culture, gender-based issues, learning from Nepal pilots can contribute to upscaling and out-scaling.
This above project was initiated at a very opportune time. Following the above pioneering project, the Government of Nepal initiated the process of developing a National REDD+ Strategy and formed a REDD+ Working Group in 2010. FECOFUN, one of the partners in the REDD+ pilot project, is represented in the REDD+ Working Group where lessons learnt from the first phase of this REDD project were directly fed into the National REDD+ Strategy drafting process. This has enabled the commu-nity forestry sector to be actively represented at the national REDD+ preparatory processes thereby having a contribution at the strategic level. As discussed in Analyzing REdd: Challenges and Choices, 2012, pilot
Figure 1. REdd+ measurement performed under REdd+ Pilot sites.
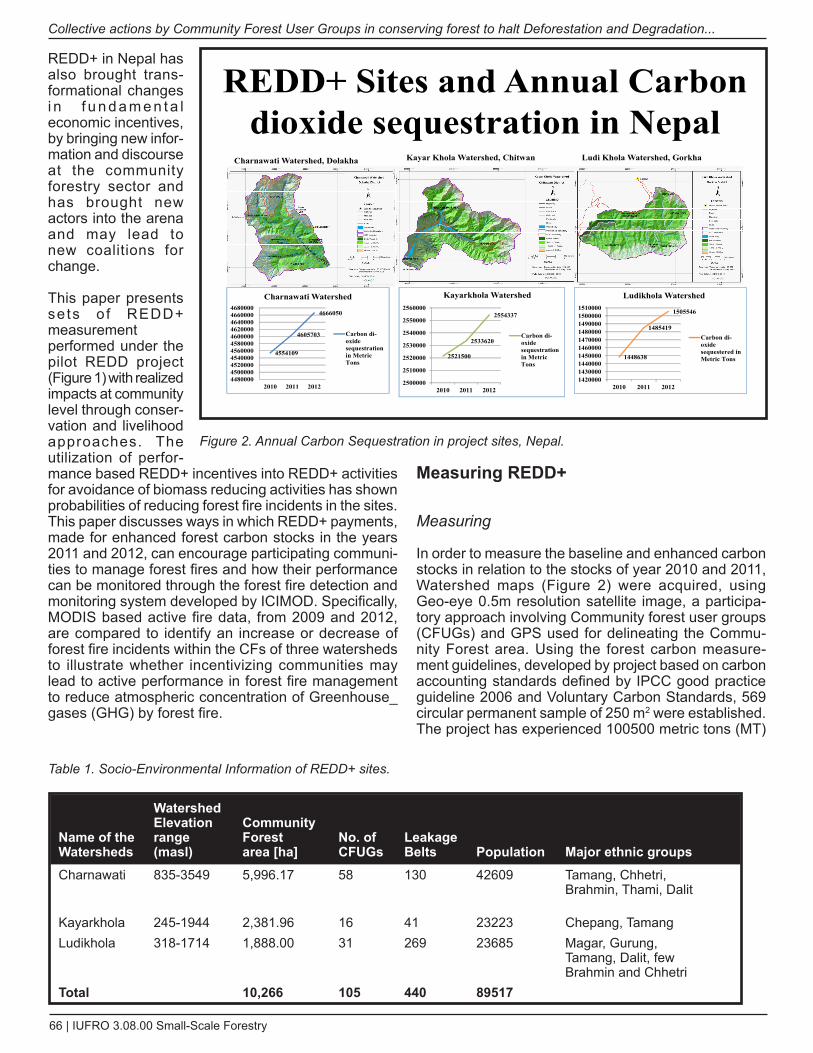
66 | IUFRO 3.08.00 Small-Scale Forestry
Collective actions by Community Forest User Groups in conserving forest to halt deforestation and degradation...
REDD+ in Nepal has also brought trans-formational changes i n f u n d a m e n t a l economic incentives, by bringing new infor-mation and discourse at the community forestry sector and has brought new actors into the arena and may lead to new coalitions for change.
This paper presents sets o f REDD+ measurement performed under the pilot REDD project (Figure 1) with realized impacts at community level through conser-vation and livelihood approaches. The utilization of perfor-mance based REDD+ incentives into REDD+ activities for avoidance of biomass reducing activities has shown probabilities of reducing forest fire incidents in the sites.This paper discusses ways in which REDD+ payments, made for enhanced forest carbon stocks in the years 2011 and 2012, can encourage participating communi-ties to manage forest fires and how their performance can be monitored through the forest fire detection and monitoring system developed by ICIMOD. Specifically, MODIS based active fire data, from 2009 and 2012, are compared to identify an increase or decrease of forest fire incidents within the CFs of three watersheds to illustrate whether incentivizing communities may lead to active performance in forest fire management to reduce atmospheric concentration of Greenhouse_ gases (GHG) by forest fire.
Measuring REDD+
Measuring
In order to measure the baseline and enhanced carbon stocks in relation to the stocks of year 2010 and 2011, Watershed maps (Figure 2) were acquired, using Geo-eye 0.5m resolution satellite image, a participa-tory approach involving Community forest user groups (CFUGs) and GPS used for delineating the Commu-nity Forest area. Using the forest carbon measure-ment guidelines, developed by project based on carbon accounting standards defined by IPCC good practice guideline 2006 and Voluntary Carbon Standards, 569 circular permanent sample of 250 m2 were established. The project has experienced 100500 metric tons (MT)
REDD+ Sites and Annual Carbon dioxide sequestration in Nepal
Kayar Khola Watershed, ChitwanCharnawati Watershed, Dolakha Ludi Khola Watershed, Gorkha
4554109
4605703
4666050
44800004500000452000045400004560000458000046000004620000464000046600004680000
2010 2011 2012
Charnawati Watershed
Carbon di-oxidesequestrationin MetricTons
2521500
2533620
2554337
2500000
2510000
2520000
2530000
2540000
2550000
2560000
2010 2011 2012
Kayarkhola Watershed
Carbon di-oxidesequestrationin MetricTons
1448638
1485419
1505546
1420000143000014400001450000146000014700001480000149000015000001510000
2010 2011 2012
Ludikhola Watershed
Carbon di-oxidesequestered inMetric Tons
Figure 2. Annual Carbon Sequestration in project sites, Nepal.
Name of the watersheds
watershed Elevation range (masl)
Community Forest area [ha]
No. of CFUGs
Leakage Belts Population Major ethnic groups
Charnawati 835-3549 5,996.17 58 130 42609 Tamang, Chhetri, Brahmin, Thami, Dalit
Kayarkhola 245-1944 2,381.96 16 41 23223 Chepang, Tamang Ludikhola 318-1714 1,888.00 31 269 23685 Magar, Gurung,
Tamang, Dalit, few Brahmin and Chhetri
Total 10,266 105 440 89517
Table 1. Socio-Environmental Information of REdd+ sites.
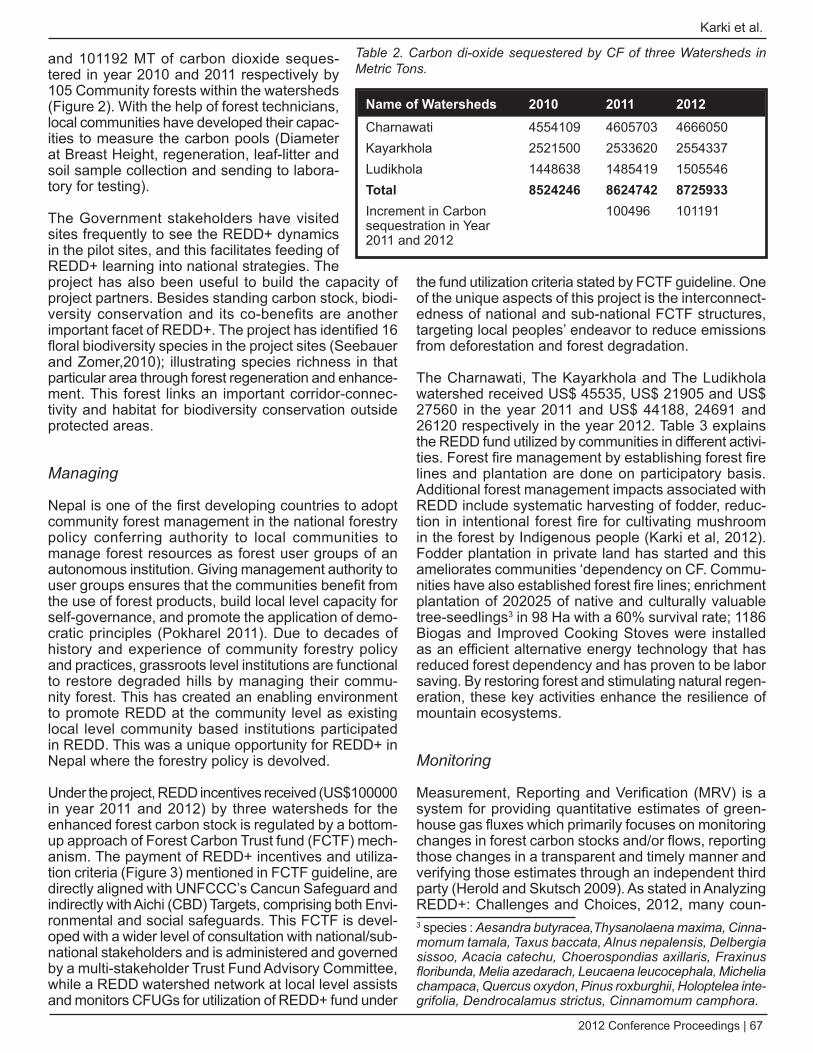
2012 Conference Proceedings | 67
Karki et al.
and 101192 MT of carbon dioxide seques-tered in year 2010 and 2011 respectively by 105 Community forests within the watersheds (Figure 2). With the help of forest technicians, local communities have developed their capac-ities to measure the carbon pools (Diameter at Breast Height, regeneration, leaf-litter and soil sample collection and sending to labora-tory for testing).
The Government stakeholders have visited sites frequently to see the REDD+ dynamics in the pilot sites, and this facilitates feeding of REDD+ learning into national strategies. The project has also been useful to build the capacity of project partners. Besides standing carbon stock, biodi-versity conservation and its co-benefits are another important facet of REDD+. The project has identified 16 floral biodiversity species in the project sites (Seebauer and Zomer,2010); illustrating species richness in that particular area through forest regeneration and enhance-ment. This forest links an important corridor-connec-tivity and habitat for biodiversity conservation outside protected areas.
Managing
Nepal is one of the first developing countries to adopt community forest management in the national forestry policy conferring authority to local communities to manage forest resources as forest user groups of an autonomous institution. Giving management authority to user groups ensures that the communities benefit from the use of forest products, build local level capacity for self-governance, and promote the application of demo-cratic principles (Pokharel 2011). Due to decades of history and experience of community forestry policy and practices, grassroots level institutions are functional to restore degraded hills by managing their commu-nity forest. This has created an enabling environment to promote REDD at the community level as existing local level community based institutions participated in REDD. This was a unique opportunity for REDD+ in Nepal where the forestry policy is devolved.
Under the project, REDD incentives received (US$100000 in year 2011 and 2012) by three watersheds for the enhanced forest carbon stock is regulated by a bottom-up approach of Forest Carbon Trust fund (FCTF) mech-anism. The payment of REDD+ incentives and utiliza-tion criteria (Figure 3) mentioned in FCTF guideline, are directly aligned with UNFCCC’s Cancun Safeguard and indirectly with Aichi (CBD) Targets, comprising both Envi-ronmental and social safeguards. This FCTF is devel-oped with a wider level of consultation with national/sub-national stakeholders and is administered and governed by a multi-stakeholder Trust Fund Advisory Committee, while a REDD watershed network at local level assists and monitors CFUGs for utilization of REDD+ fund under
the fund utilization criteria stated by FCTF guideline. One of the unique aspects of this project is the interconnect-edness of national and sub-national FCTF structures, targeting local peoples’ endeavor to reduce emissions from deforestation and forest degradation.
The Charnawati, The Kayarkhola and The Ludikhola watershed received US$ 45535, US$ 21905 and US$ 27560 in the year 2011 and US$ 44188, 24691 and 26120 respectively in the year 2012. Table 3 explains the REDD fund utilized by communities in different activi-ties. Forest fire management by establishing forest fire lines and plantation are done on participatory basis. Additional forest management impacts associated with REDD include systematic harvesting of fodder, reduc-tion in intentional forest fire for cultivating mushroom in the forest by Indigenous people (Karki et al, 2012). Fodder plantation in private land has started and this ameliorates communities ‘dependency on CF. Commu-nities have also established forest fire lines; enrichment plantation of 202025 of native and culturally valuable tree-seedlings3 in 98 Ha with a 60% survival rate; 1186 Biogas and Improved Cooking Stoves were installed as an efficient alternative energy technology that has reduced forest dependency and has proven to be labor saving. By restoring forest and stimulating natural regen-eration, these key activities enhance the resilience of mountain ecosystems.
Monitoring
Measurement, Reporting and Verification (MRV) is a system for providing quantitative estimates of green-house gas fluxes which primarily focuses on monitoring changes in forest carbon stocks and/or flows, reporting those changes in a transparent and timely manner and verifying those estimates through an independent third party (Herold and Skutsch 2009). As stated in Analyzing REDD+: Challenges and Choices, 2012, many coun-3 species : Aesandra butyracea,Thysanolaena maxima, Cinna-momum tamala, Taxus baccata, Alnus nepalensis, delbergia sissoo, Acacia catechu, Choerospondias axillaris, Fraxinus floribunda, Melia azedarach, Leucaena leucocephala, Michelia champaca, Quercus oxydon, Pinus roxburghii, Holoptelea inte-grifolia, dendrocalamus strictus, Cinnamomum camphora.
Name of watersheds 2010 2011 2012Charnawati 4554109 4605703 4666050Kayarkhola 2521500 2533620 2554337Ludikhola 1448638 1485419 1505546Total 8524246 8624742 8725933Increment in Carbon sequestration in Year 2011 and 2012
100496 101191
Table 2. Carbon di-oxide sequestered by CF of three Watersheds in Metric Tons.
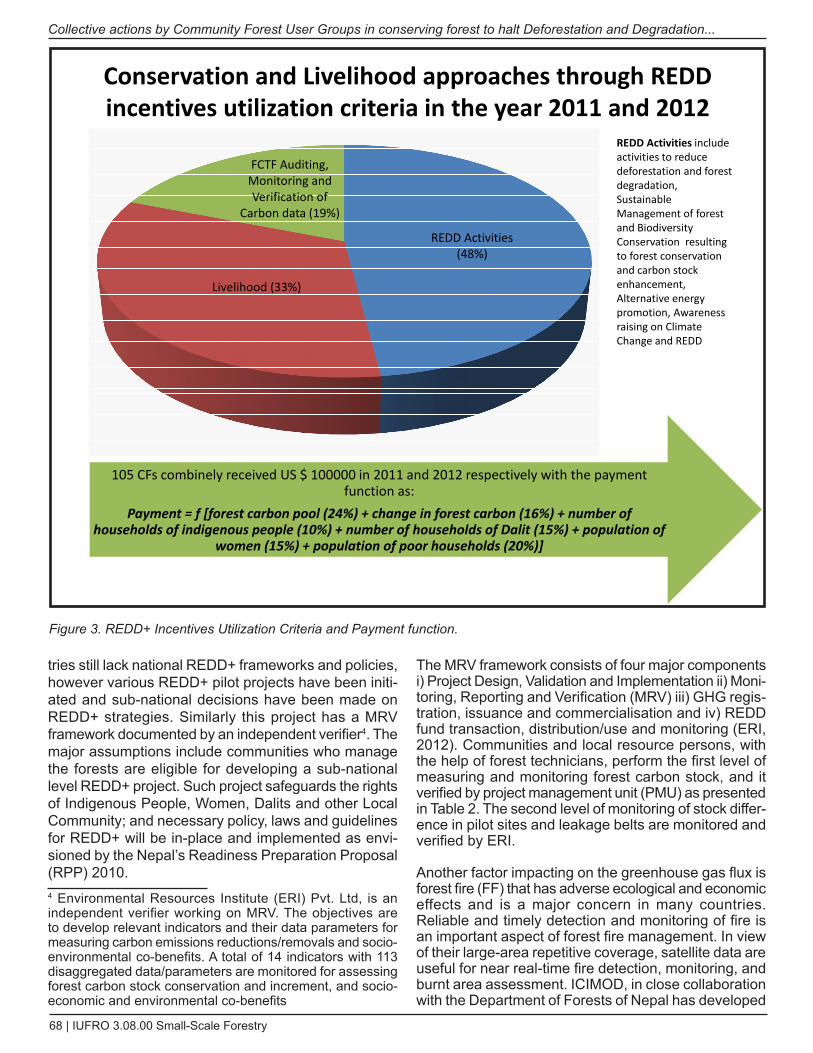
68 | IUFRO 3.08.00 Small-Scale Forestry
Collective actions by Community Forest User Groups in conserving forest to halt deforestation and degradation...
tries still lack national REDD+ frameworks and policies, however various REDD+ pilot projects have been initi-ated and sub-national decisions have been made on REDD+ strategies. Similarly this project has a MRV framework documented by an independent verifier4. The major assumptions include communities who manage the forests are eligible for developing a sub-national level REDD+ project. Such project safeguards the rights of Indigenous People, Women, Dalits and other Local Community; and necessary policy, laws and guidelines for REDD+ will be in-place and implemented as envi-sioned by the Nepal’s Readiness Preparation Proposal (RPP) 2010.4 Environmental Resources Institute (ERI) Pvt. Ltd, is an independent verifier working on MRV. The objectives are to develop relevant indicators and their data parameters for measuring carbon emissions reductions/removals and socio-environmental co-benefits. A total of 14 indicators with 113 disaggregated data/parameters are monitored for assessing forest carbon stock conservation and increment, and socio-economic and environmental co-benefits
The MRV framework consists of four major components i) Project Design, Validation and Implementation ii) Moni-toring, Reporting and Verification (MRV) iii) GHG regis-tration, issuance and commercialisation and iv) REDD fund transaction, distribution/use and monitoring (ERI, 2012). Communities and local resource persons, with the help of forest technicians, perform the first level of measuring and monitoring forest carbon stock, and it verified by project management unit (PMU) as presented in Table 2. The second level of monitoring of stock differ-ence in pilot sites and leakage belts are monitored and verified by ERI.
Another factor impacting on the greenhouse gas flux is forest fire (FF) that has adverse ecological and economic effects and is a major concern in many countries. Reliable and timely detection and monitoring of fire is an important aspect of forest fire management. In view of their large-area repetitive coverage, satellite data are useful for near real-time fire detection, monitoring, and burnt area assessment. ICIMOD, in close collaboration with the Department of Forests of Nepal has developed
Conservation and Livelihood approaches through REDD incentives utilization criteria in the year 2011 and 2012
REDD Activities (48%)
Livelihood (33%)
FCTF Auditing, Monitoring and Verification of
Carbon data (19%)
105 CFs combinely received US $ 100000 in 2011 and 2012 respectively with the payment function as:
Payment = f [forest carbon pool (24%) + change in forest carbon (16%) + number of households of indigenous people (10%) + number of households of Dalit (15%) + population of
women (15%) + population of poor households (20%)]
REDD Activities include activities to reduce deforestation and forest degradation, Sustainable Management of forest and Biodiversity Conservation resulting to forest conservation and carbon stock enhancement, Alternative energy promotion, Awareness raising on Climate Change and REDD
Figure 3. REdd+ Incentives Utilization Criteria and Payment function.
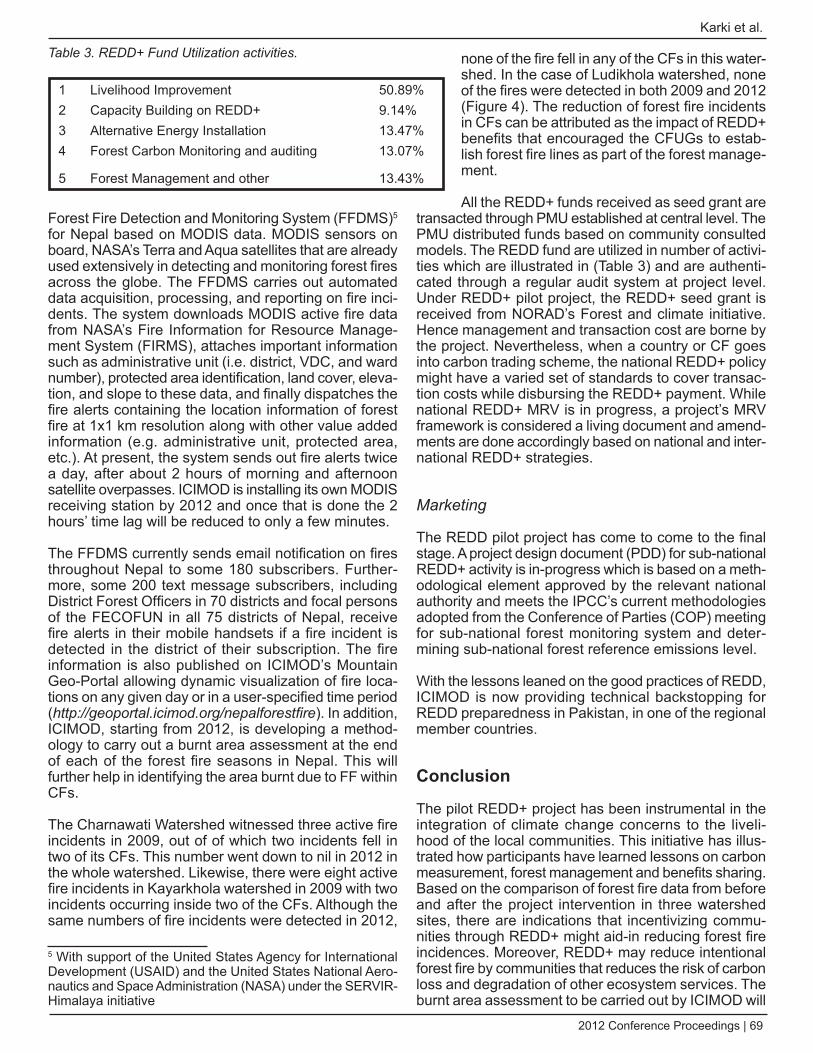
2012 Conference Proceedings | 69
Karki et al.
Forest Fire Detection and Monitoring System (FFDMS)5 for Nepal based on MODIS data. MODIS sensors on board, NASA’s Terra and Aqua satellites that are already used extensively in detecting and monitoring forest fires across the globe. The FFDMS carries out automated data acquisition, processing, and reporting on fire inci-dents. The system downloads MODIS active fire data from NASA’s Fire Information for Resource Manage-ment System (FIRMS), attaches important information such as administrative unit (i.e. district, VDC, and ward number), protected area identification, land cover, eleva-tion, and slope to these data, and finally dispatches the fire alerts containing the location information of forest fire at 1x1 km resolution along with other value added information (e.g. administrative unit, protected area, etc.). At present, the system sends out fire alerts twice a day, after about 2 hours of morning and afternoon satellite overpasses. ICIMOD is installing its own MODIS receiving station by 2012 and once that is done the 2 hours’ time lag will be reduced to only a few minutes.
The FFDMS currently sends email notification on fires throughout Nepal to some 180 subscribers. Further-more, some 200 text message subscribers, including District Forest Officers in 70 districts and focal persons of the FECOFUN in all 75 districts of Nepal, receive fire alerts in their mobile handsets if a fire incident is detected in the district of their subscription. The fire information is also published on ICIMOD’s Mountain Geo-Portal allowing dynamic visualization of fire loca-tions on any given day or in a user-specified time period (http://geoportal.icimod.org/nepalforestfire). In addition, ICIMOD, starting from 2012, is developing a method-ology to carry out a burnt area assessment at the end of each of the forest fire seasons in Nepal. This will further help in identifying the area burnt due to FF within CFs.
The Charnawati Watershed witnessed three active fire incidents in 2009, out of of which two incidents fell in two of its CFs. This number went down to nil in 2012 in the whole watershed. Likewise, there were eight active fire incidents in Kayarkhola watershed in 2009 with two incidents occurring inside two of the CFs. Although the same numbers of fire incidents were detected in 2012,
5 With support of the United States Agency for International Development (USAID) and the United States National Aero-nautics and Space Administration (NASA) under the SERVIR-Himalaya initiative
none of the fire fell in any of the CFs in this water-shed. In the case of Ludikhola watershed, none of the fires were detected in both 2009 and 2012 (Figure 4). The reduction of forest fire incidents in CFs can be attributed as the impact of REDD+ benefits that encouraged the CFUGs to estab-lish forest fire lines as part of the forest manage-ment.
All the REDD+ funds received as seed grant are transacted through PMU established at central level. The PMU distributed funds based on community consulted models. The REDD fund are utilized in number of activi-ties which are illustrated in (Table 3) and are authenti-cated through a regular audit system at project level. Under REDD+ pilot project, the REDD+ seed grant is received from NORAD’s Forest and climate initiative. Hence management and transaction cost are borne by the project. Nevertheless, when a country or CF goes into carbon trading scheme, the national REDD+ policy might have a varied set of standards to cover transac-tion costs while disbursing the REDD+ payment. While national REDD+ MRV is in progress, a project’s MRV framework is considered a living document and amend-ments are done accordingly based on national and inter-national REDD+ strategies.
Marketing
The REDD pilot project has come to come to the final stage. A project design document (PDD) for sub-national REDD+ activity is in-progress which is based on a meth-odological element approved by the relevant national authority and meets the IPCC’s current methodologies adopted from the Conference of Parties (COP) meeting for sub-national forest monitoring system and deter-mining sub-national forest reference emissions level.
With the lessons leaned on the good practices of REDD, ICIMOD is now providing technical backstopping for REDD preparedness in Pakistan, in one of the regional member countries.
Conclusion
The pilot REDD+ project has been instrumental in the integration of climate change concerns to the liveli-hood of the local communities. This initiative has illus-trated how participants have learned lessons on carbon measurement, forest management and benefits sharing. Based on the comparison of forest fire data from before and after the project intervention in three watershed sites, there are indications that incentivizing commu-nities through REDD+ might aid-in reducing forest fire incidences. Moreover, REDD+ may reduce intentional forest fire by communities that reduces the risk of carbon loss and degradation of other ecosystem services. The burnt area assessment to be carried out by ICIMOD will
1 Livelihood Improvement 50.89%2 Capacity Building on REDD+ 9.14%3 Alternative Energy Installation 13.47%4 Forest Carbon Monitoring and auditing 13.07%
5 Forest Management and other 13.43%
Table 3. REdd+ Fund Utilization activities.
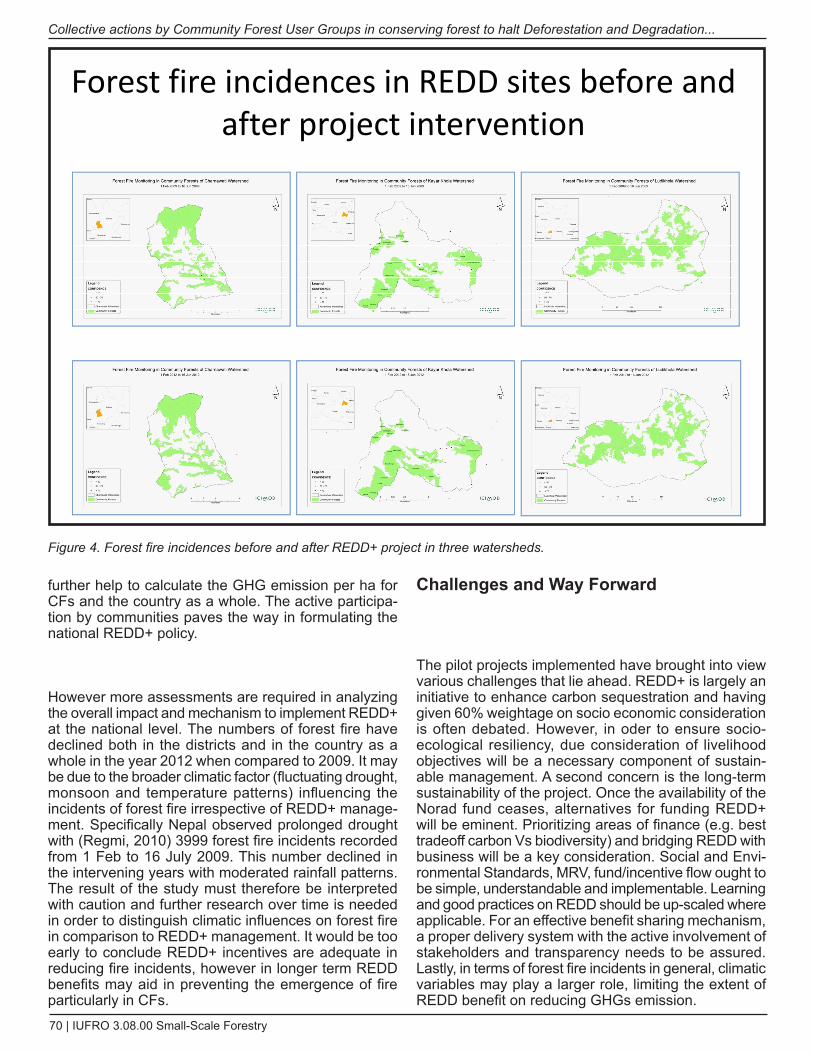
70 | IUFRO 3.08.00 Small-Scale Forestry
Collective actions by Community Forest User Groups in conserving forest to halt deforestation and degradation...
further help to calculate the GHG emission per ha for CFs and the country as a whole. The active participa-tion by communities paves the way in formulating the national REDD+ policy.
However more assessments are required in analyzing the overall impact and mechanism to implement REDD+ at the national level. The numbers of forest fire have declined both in the districts and in the country as a whole in the year 2012 when compared to 2009. It may be due to the broader climatic factor (fluctuating drought, monsoon and temperature patterns) influencing the incidents of forest fire irrespective of REDD+ manage-ment. Specifically Nepal observed prolonged drought with (Regmi, 2010) 3999 forest fire incidents recorded from 1 Feb to 16 July 2009. This number declined in the intervening years with moderated rainfall patterns. The result of the study must therefore be interpreted with caution and further research over time is needed in order to distinguish climatic influences on forest fire in comparison to REDD+ management. It would be too early to conclude REDD+ incentives are adequate in reducing fire incidents, however in longer term REDD benefits may aid in preventing the emergence of fire particularly in CFs.
Challenges and way Forward
The pilot projects implemented have brought into view various challenges that lie ahead. REDD+ is largely an initiative to enhance carbon sequestration and having given 60% weightage on socio economic consideration is often debated. However, in oder to ensure socio-ecological resiliency, due consideration of livelihood objectives will be a necessary component of sustain-able management. A second concern is the long-term sustainability of the project. Once the availability of the Norad fund ceases, alternatives for funding REDD+ will be eminent. Prioritizing areas of finance (e.g. best tradeoff carbon Vs biodiversity) and bridging REDD with business will be a key consideration. Social and Envi-ronmental Standards, MRV, fund/incentive flow ought to be simple, understandable and implementable. Learning and good practices on REDD should be up-scaled where applicable. For an effective benefit sharing mechanism, a proper delivery system with the active involvement of stakeholders and transparency needs to be assured. Lastly, in terms of forest fire incidents in general, climatic variables may play a larger role, limiting the extent of REDD benefit on reducing GHGs emission.
Forest fire incidences in REDD sites before and after project intervention
Figure 4. Forest fire incidences before and after REDD+ project in three watersheds.
2012 Conference Proceedings | 71
Karki et al.
Implementation and MRV of the REDD+ has high trans-action costs. Thus, understanding the cost-effectiveness for mitigating climate change arising from small scale projects with high transaction costs is needed. Cap and Trade shows insignificant or less benefits for small projects. Forest fire is one of the key degradation activi-ties and must be used as a key parameter in future to assess REDD+ performances in Nepal.
ReferencesAngelsen, A., Brockhaus, M., Sunderlin, W.d. and Verchot,
L.V. (eds) 2012 Analysing REdd+: Challenges and choices, CIFOR, Bogor, Indonesia.
ERI 2012, Sub-national Framework for REdd+ Monitoring Reporting and Verification (MRV) in Community Based Forest Management System (CBMS) in Nepal, In-press International Centre for Integrated Mountain development, Kathmandu, Nepal.
http://geoportal.icimod.org/nepalforestfire
Kanel, K. R. and d.R. Niraula (2004) Relation between Community Forestry and Livelihood: an Experience from Four districts, CF Bulletin, No. 11, Community Forestry division, Kathmandu.
Karki, S., Khadka, M., Chapagain, A., Karky, B.S., Kotru, R.,2012, Gender dimensions of REdd+ in Nepal: Where are we now?, unpublished International Centre for Inte-grated Mountain development, Kathmandu, Nepal.
Karky, B.S. 2008. The economics of reducing emissions from community managed forests in Nepal Himalaya. University of Twente, the Netherlands, Phd thesis.
Karky, B.S., Karki. S., Rana, E.B., Kotru, R., 2012, Reducing Emissions from deforestation and Forest degradation Plus (REdd+): A Spotlight on South Asia - Innovative Intervention and Strategy for Implementing REdd+ at the Community Level, Sustainable development Policy Institute, Pakistan (in Press)
Pokharel, R.K. 2011, ‘Factors influencing the management regime of Nepal’s community forestry, Forest Policy and Economics’, Press Rural development Forestry Study Guide 3, Rural development Forestry, London.
Regmi, H. R., 2010, drought Risk Management in Nepal in drought Risk Management in South Asia, SAARC Workshop South Asia, Kabul Afghanistan 8-9 August 2010, accessed: http://saarc-sdmc.nic.in/pdf/publications/drought/drought.pdf#page=117
Seebauer, M. and Zomer. R. 2010, Assessing land-use carbon finance for multiple benefits in the HKH region: Case study of a community based REdd+ pilot project in Nepal, unpub-lished International Centre for Integrated Mountain devel-opment, Kathmandu, Nepal.
Twenty-five Years of Community Forestry, Proceedings of the Fourth National Workshop on Community Forestry, 2004, Community Forest division, department of Forest, Nepal
72 | IUFRO 3.08.00 Small-Scale Forestry
Introduction
Hans Carl von Carlowitz (v. Carlowitz: 1713) is known as the inventor of sustainability. Carlowitz was no quali-fied Forester; he was responsible for mining in Saxony. But for mining a lot of timber was needed. So from its origin, Sustainability is a concept that was consciously practised in forestry. In German forestry it has been refined now for 300 years.
Due to the lack of timber, it was only a question of time when people came to the point, where they had to adjust their cutting to the growth. Especially in regions where no affordable way could be found to bring the timber to where it was irreplaceable needed in these times.
Businesses which could be shifted to other places had to move, like charcoal burning or glassworks. But in some areas of Germany all the measures to regulate the timber use could not really ease the deficiency. In the eyes of some scientists it is doubtable, that there has been a real timber deficiency at all (Radkau, J.; Grewe, B.S.). They argue that not the devastated forests represented the limit, but the strict usage rules made by aristocratic and ecclesiastical rulers to keep their busi-nesses running. The new founded forest administra-tions controlled these rules with a passionate commit-ment, because they could fulfill their own goals as well, like hunting or silvicultural objectives. The quarrel about the true reasons is still going on; “natural limitation” or “scarcity caused by the ruling class” or a mix of both.
Considering the effect, there is no doubt that “not enough timber for everybody” was a limiting factor for the growing national economies in general. Historians describe the centuries between 1700 and 1900 as a period where economical development was restricted by the slow growing timber. From the middle of the 19th century coal and steel ousted timber as dominating source of energy and construction material. New transportation options also relieved timber import. From that point, nobody was talking about timber deficiency in Europe any more.
Most of the cooperatives and commons we are talking about, were officially founded as institutions in the 19th century under these circumstances. Their history and
tradition goes back much further. For a long time it was customary to use greater parts of the landscape, mostly forests and pastures, commonly without written rules for a management. The forests around the villages were used by the local people especially farmers for grazing and fattening their animals, litter raking and fuel wood as well as construction timber.
Developing economies as mentioned above paired with a rising population required measures to regulate the access and the utilization of the forest resources. The old-established groups of inhabitants looked out for ways to protect their claims. This led to a common law for the using families respectively their farms or houses. They found a way to tie the rights to a certain group of users. Using the former common property became a privilege of a defined group of people. Even the scale of use was regulated. With this procedure they, on the one hand, could secure the sustainable utilisation of the shared areas and on the other hand, they were able to exclude “newcomers”. The founding of commons like these ended in the year 1900 with the inception of a new Civil Law Code in Germany.
In Bavaria, over 950 of these old cooperatives are still listed. The prevailling Situation is, that the right to use forest resources like fuelwood is tied to a certain group of people or rather several properties they live on. The rights are recorded in the land register. They may include all forest resources or describe exactly which forest resource is covered by the right and how much the appropriators are allowed to use. In these cases the terrain is owned by the local community. But there are also a number of cooperatives, where the appropriators commonly own the land as well.
Because of the low prices for oil between the 1960s and 1980s, a lot of people switched their heating tech-nology from firewood to oil. Agricultural needs like litter raking regressed till they disappeared completely. The number of active Members in the commons decreased. The forests have been neglected. Many of the coopera-tives seem to be inactive or even want to break up. But there are also numerous cooperatives that managed the change all over the decades.
Sustainable Forest Management of Old Cooperatives in BavariaMarc Koch1 and Anika Gaggermeier1 Chair of forest and environmental policy, Technische Universität München, Germany; [email protected]
Key words: Small scale forestry, Mobilization, cooperatives, qualitative research, structural change, rural devel-opment
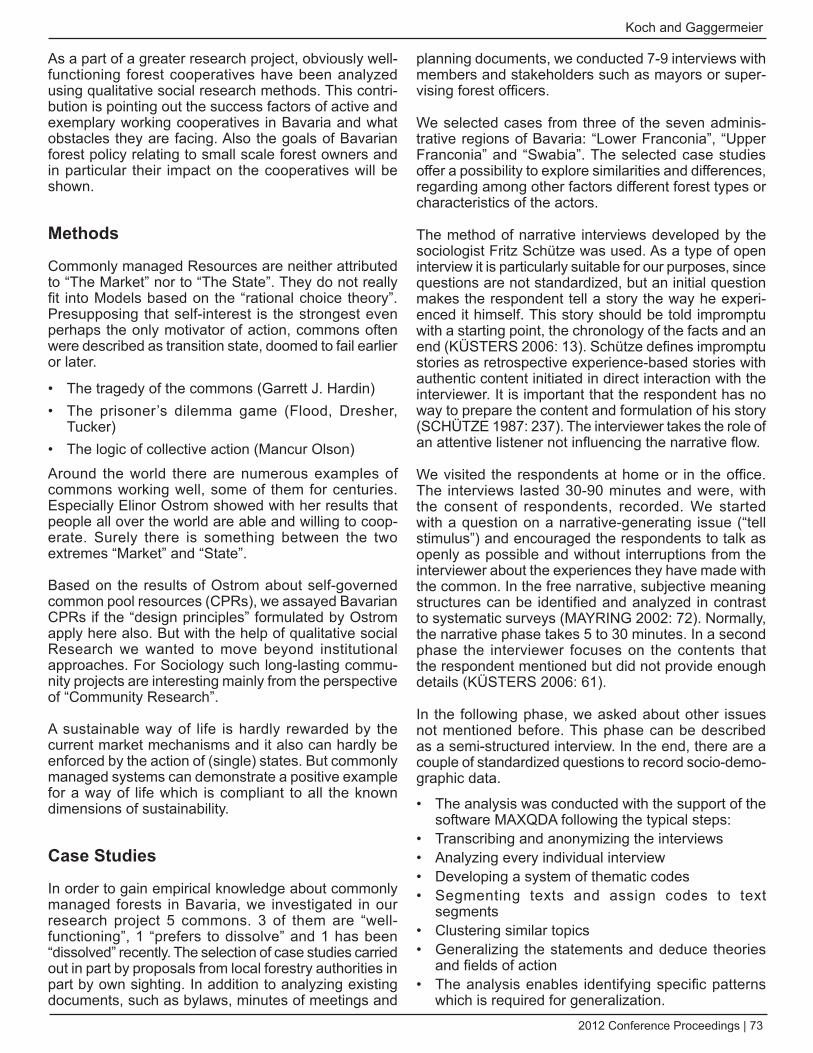
2012 Conference Proceedings | 73
Koch and Gaggermeier
As a part of a greater research project, obviously well-functioning forest cooperatives have been analyzed using qualitative social research methods. This contri-bution is pointing out the success factors of active and exemplary working cooperatives in Bavaria and what obstacles they are facing. Also the goals of Bavarian forest policy relating to small scale forest owners and in particular their impact on the cooperatives will be shown.
Methods
Commonly managed Resources are neither attributed to “The Market” nor to “The State”. They do not really fit into Models based on the “rational choice theory”. Presupposing that self-interest is the strongest even perhaps the only motivator of action, commons often were described as transition state, doomed to fail earlier or later.
The tragedy of the commons (Garrett J. Hardin)• The prisoner’s dilemma game (Flood, Dresher, • Tucker)The logic of collective action (Mancur Olson)•
Around the world there are numerous examples of commons working well, some of them for centuries. Especially Elinor Ostrom showed with her results that people all over the world are able and willing to coop-erate. Surely there is something between the two extremes “Market” and “State”.
Based on the results of Ostrom about self-governed common pool resources (CPRs), we assayed Bavarian CPRs if the “design principles” formulated by Ostrom apply here also. But with the help of qualitative social Research we wanted to move beyond institutional approaches. For Sociology such long-lasting commu-nity projects are interesting mainly from the perspective of “Community Research”.
A sustainable way of life is hardly rewarded by the current market mechanisms and it also can hardly be enforced by the action of (single) states. But commonly managed systems can demonstrate a positive example for a way of life which is compliant to all the known dimensions of sustainability.
Case Studies
In order to gain empirical knowledge about commonly managed forests in Bavaria, we investigated in our research project 5 commons. 3 of them are “well-functioning”, 1 “prefers to dissolve” and 1 has been “dissolved” recently. The selection of case studies carried out in part by proposals from local forestry authorities in part by own sighting. In addition to analyzing existing documents, such as bylaws, minutes of meetings and
planning documents, we conducted 7-9 interviews with members and stakeholders such as mayors or super-vising forest officers.
We selected cases from three of the seven adminis-trative regions of Bavaria: “Lower Franconia”, “Upper Franconia” and “Swabia”. The selected case studies offer a possibility to explore similarities and differences, regarding among other factors different forest types or characteristics of the actors.
The method of narrative interviews developed by the sociologist Fritz Schütze was used. As a type of open interview it is particularly suitable for our purposes, since questions are not standardized, but an initial question makes the respondent tell a story the way he experi-enced it himself. This story should be told impromptu with a starting point, the chronology of the facts and an end (KÜSTERS 2006: 13). Schütze defines impromptu stories as retrospective experience-based stories with authentic content initiated in direct interaction with the interviewer. It is important that the respondent has no way to prepare the content and formulation of his story (SCHÜTZE 1987: 237). The interviewer takes the role of an attentive listener not influencing the narrative flow.
We visited the respondents at home or in the office. The interviews lasted 30-90 minutes and were, with the consent of respondents, recorded. We started with a question on a narrative-generating issue (“tell stimulus”) and encouraged the respondents to talk as openly as possible and without interruptions from the interviewer about the experiences they have made with the common. In the free narrative, subjective meaning structures can be identified and analyzed in contrast to systematic surveys (MAYRING 2002: 72). Normally, the narrative phase takes 5 to 30 minutes. In a second phase the interviewer focuses on the contents that the respondent mentioned but did not provide enough details (KÜSTERS 2006: 61).
In the following phase, we asked about other issues not mentioned before. This phase can be described as a semi-structured interview. In the end, there are a couple of standardized questions to record socio-demo-graphic data.
The analysis was conducted with the support of the • software MAXQDA following the typical steps:Transcribing and anonymizing the interviews• Analyzing every individual interview• Developing a system of thematic codes• Segmenting texts and assign codes to text • segmentsClustering similar topics• Generalizing the statements and deduce theories • and fields of actionThe analysis enables identifying specific patterns • which is required for generalization.
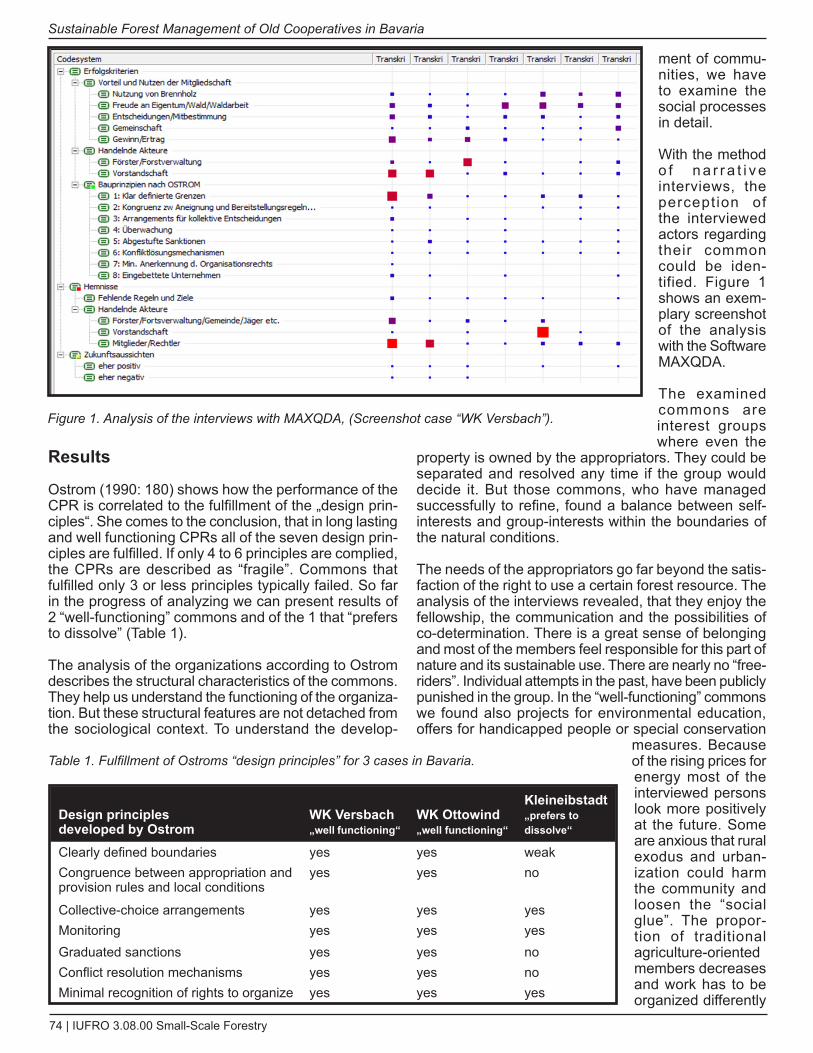
74 | IUFRO 3.08.00 Small-Scale Forestry
Sustainable Forest Management of Old Cooperatives in Bavaria
Results
Ostrom (1990: 180) shows how the performance of the CPR is correlated to the fulfillment of the „design prin-ciples“. She comes to the conclusion, that in long lasting and well functioning CPRs all of the seven design prin-ciples are fulfilled. If only 4 to 6 principles are complied, the CPRs are described as “fragile”. Commons that fulfilled only 3 or less principles typically failed. So far in the progress of analyzing we can present results of 2 “well-functioning” commons and of the 1 that “prefers to dissolve” (Table 1).
The analysis of the organizations according to Ostrom describes the structural characteristics of the commons. They help us understand the functioning of the organiza-tion. But these structural features are not detached from the sociological context. To understand the develop-
ment of commu-nities, we have to examine the social processes in detail.
With the method o f n a r r a t i v e interviews, the perception of the interviewed actors regarding their common could be iden-tified. Figure 1 shows an exem-plary screenshot of the analysis with the Software MAXQDA.
The examined commons are interest groups where even the
property is owned by the appropriators. They could be separated and resolved any time if the group would decide it. But those commons, who have managed successfully to refine, found a balance between self-interests and group-interests within the boundaries of the natural conditions.
The needs of the appropriators go far beyond the satis-faction of the right to use a certain forest resource. The analysis of the interviews revealed, that they enjoy the fellowship, the communication and the possibilities of co-determination. There is a great sense of belonging and most of the members feel responsible for this part of nature and its sustainable use. There are nearly no “free-riders”. Individual attempts in the past, have been publicly punished in the group. In the “well-functioning” commons we found also projects for environmental education, offers for handicapped people or special conservation
measures. Because of the rising prices for energy most of the interviewed persons look more positively at the future. Some are anxious that rural exodus and urban-ization could harm the community and loosen the “social glue”. The propor-tion of traditional agriculture-oriented members decreases and work has to be organized differently
Design principles developed by Ostrom
wK Versbach „well functioning“
wK Ottowind „well functioning“
Kleineibstadt „prefers to dissolve“
Clearly defined boundaries yes yes weakCongruence between appropriation and provision rules and local conditions
yes yes no
Collective-choice arrangements yes yes yesMonitoring yes yes yesGraduated sanctions yes yes noConflict resolution mechanisms yes yes noMinimal recognition of rights to organize yes yes yes
Table 1. Fulfillment of Ostroms “design principles” for 3 cases in Bavaria.
Figure 1. Analysis of the interviews with MAXQDA, (Screenshot case “WK Versbach”).
2012 Conference Proceedings | 75
Koch and Gaggermeier
now. In some families one or two generations stopped using their rights, now younger family members start using again because of the rising oil price.
How the members behave in other areas of life cannot be deduced from the interviews. However, there is no doubt that especially members, who are involved in commit-tees (e.g. executive position or arbitrator), incorporate ecological, economic and social aspects of sustainable management of community goods into their plans and proposals. The shared responsibility, joint decisions and joint action is stretching and satisfying them at the same time. The structure of the organization gives the leading persons the authority and recognition, to influ-ence the discussions as well as the decisions. Like elsewhere it depends a lot on the leading persons. The jointly managed forest is both – a place of action and learning at the same time.
Discussion
Actually it’s not about the resources themselves. The question is how to solve the problems of society? Which institutions are needed? How do they influence the people and how are people influencing and changing the organizations? Currently we are witnessing a series of crises. And we are part of it. We are both cause and solution.
People are able to move beyond individual self-interest. Not only the appropriation-rights have to be satisfied, aspects of a post-materialism society are on a par with them. Communication, trust, responsibility, the creation of shared values and rules and their respect can control behavior well enough to prevent a tragedy. As we see, the drama of the commons does not inevitably play out as tragedy.
What does Bavaria do for the commons, where the appropriators are usually small “shareholders”? 2011 one of the examined communities won a price for exem-plary forestry and was honoured for its sustainable management by the ministry of forestry. But there is no further support for commons (e. g. for the foundation of new commons). Since the revised version of the forest law in 2005 they are treated as private forest owners. They now have to find their niche. Larger communities, which also sell timber, are interesting for forest asso-ciations. The subsidies for those associations depend mainly on the amount of timber sold in the order of the association. Small scale private owners and commons with “small shareholders” are not interesting for them, because the transaction costs are too high in compar-ison to the amount of timber mobilized. Regarding to the high proportion of small scale forest owners in Bavaria under 2 Hectares property of more than 71% and their structural problems (Gaggermeier, Koch, Suda: 2011),
communities could be a good solution. But therefore more efforts are needed, in particular, to initiate start-ups.
Sustainable use of resources, commonly managed, is one of the indicators of successfully acting commons or cooperatives. Some of them live these values since more than 300 years. Considering their positive contri-butions to the society they could be a role model for all living areas not only forestry.
References
Carlowitz v. H. C. (1713): Sylvicultura Oeconomica – Hauss-wirthliche Nachricht und Naturmäßige Anweisung zur Wilden Baum-Zucht. Verlag Kessel - Remagen-Oberwinter, Reprint der zweiten Auflage von 1732.
Gaggermeier A., Koch M. und Suda M. (2011): Waldflur-bereinigung – Bedeutung und Einflussfaktoren auf den Verfahrensablauf. In: AFJZ Heft 11&12, 182. Jahrg. 2011.
Grewe B. S. (2004): der versperrte Wald – Ressourcen-mangel in der bayerischen Pfalz (1814-1870). Verlag Böhlau – Köln.
Hardin, G. (1968). The Tragedy of the Commons. Science 162, 1243-1248
Küsters, I. (2006): Narrative Interviews. Grundlagen und Anwendungen. VS Verlag für Sozialwissenschaften – Wies-baden:.
Mayring, P. (2002): Einführung in die Qualitative Sozialforsc-hung.: Beltz Verlag – Weinheim und Basel.
Ostrom E. (1990): Governing the Commons – The Evolution of Institutions for Collective Action. Cambridge University Press – New York.
Radkau J. (1983): Holzverknappung und Krisenbewusst-sein im 18. Jahrhundert. In: Geschichte und Gesellschaft 9, 513-543;
Schütze, F. (1987). das narrative Interview in Interaktionsfeld-studien I. Studienbrief der Fernuniversität Hagen.
76 | IUFRO 3.08.00 Small-Scale Forestry
Introduction
The private (non-industrial) forest owners organized themselves into associations for almost a hundred years ago and have ever since been an important actor on the market for wood and timber. They started as small, often local, associations of farmers who were dissatisfied with how terms on the market for timber were dictated by a few large companies. By cooperation the farmers improved their position to negotiate for better prices and to create a better functioning market for wood products (Wennebro, 2008). Today, the associations are signifi-cant players in the Swedish forestry sector. Approxi-mately 110 000 forest owners (out of 330 000 forest owners in Sweden) with a total of 6.2 million hectares of forest land are members in one of the four major forest owners’ associations, which are part of The Federation of Swedish Farmers (Swedish Forest Agency, 2011).
While the forest owners’ associations have not changed very much during the last decades in terms of organi-zational structure or in offered services to the forest owners, a lot have changed in the society and among the forest owner collective. Previously most of the privately owned forests were possessed by farmers but today the forest owners as a group is much more hetero-genic (Berlin et al., 2006). The technological develop-ment society has gone through since many of today’s forest owners grew up have been enormous and our socio-economic standards have increased. Further,
urbanization has lead to a situation where many forest owners live and work further away from their estates (Ingemarson et al., 2006). Along with this change the ownership structure has changed and joint ownership as well as female ownership has become more common (Berlin et al., 2006). In a study by Karppinen (1998) the transfer of ownership, through inheritance, from farmers to non-farmers is pointed out as the most significant structural change. Finally, the forest owners are today less dependent on their forest as a source of work and income (Nordlund & Westin, 2011).
This kind of societal development has been shown by e.g. Inglehart (2000) to change people’s values and that there will be differences between different genera-tions. The study by Nordlund and Westin (2011) confirms that the new types of forest owners, non-resident and female, hold different values compared to the traditional resident owners. Women tend to put more focus on recreational forest values and non-resident owners are less interested in forest revenues than resident owners, which might affect their forest management in a way which is not fully compatible with the current focus of the forest owners’ associations which is very produc-tion centered.
This might become a huge challenge for the associa-tions in a near future since today’s members, and the forest owners in general, are getting quite old. This means that associations are facing a time of change,
District Council Members and the Organizational Renewal of Forest Owners’ AssociationsThomas Kronholm1 and Dianne Staal Wästerlund2
1 Swedish University of Agricultural Sciences, 901 83 Umeå, Sweden, [email protected] Swedish University of Agricultural Sciences, 901 83 Umeå, Sweden, [email protected]
Keywords: reproduction, involvement, volunteer
Abstract
The Swedish forest owners’ associations (cooperatives) have been able to increase their number of members but are facing problems with getting people involved and thereby to renew their member organization. The objec-tive of this study was to increase our understanding of the reproduction process (organization renewal) in forest owners’ associations. Based on 15 qualitative interviews with district council members in a forest owners’ asso-ciation the characteristics of today’s involved members was studied; their motives to volunteer, their relationship to the organization and the organizational practices and routines in the renewal process. The study showed that council members are very traditional forest owners, often with a family legacy in the association, and are not representative for all groups of members. Our conclusion is that the forest owners’ associations carefully need to consider how they want to be perceived by future members in order to attract people whose characteristics and motives fit with the associations profile and want to become involved in the organization.
2012 Conference Proceedings | 77
Kronholm and Wästerlund
when older members drop of and should be replaced by a new generation of owners. However, the changes among forest owners and society in general might make recruitment and involvement of new members more difficult in the future.
In a report by Vogel et al. (2003) some interesting trends in peoples’ engagement in associations between the years1992-2000 where described. First, associations in Sweden have experienced decreasing numbers of members and the decrease has not been isolated to any single type of association. Second, those who are members are becoming increasingly passive, i.e. they pay their membership fee but do not take part in any of the association’s activities. It has also become harder for the associations to find people who want to take on roles as trustees or volunteers in their organiza-tions. The amount of time spent on these assignments did however increase, which means that fewer people are doing more work to keep the associations running. Finally, it was shown that younger people (under 35) are less interested in becoming members of associations, which lead to problems in a longer perspective since no replacement of members take place. This seems not to be just a Swedish problem. Also other authors, e.g. Robert Putnam (2000), have shown how people’s rela-tionships towards associations have changed during the last decades.
The forest owners associations have so far been an exception in terms of number of members. However, an increase in number of memberships does not neces-sarily mean that all new members embrace the ideology of the organization; instead there can be a variety of reasons to join an association (Einarsson, 2008). Forest owners associations might instead have benefited from the good market prices on the timber market during the last years. Because members get a price premium when selling to the association it has been economically wise to become a member. One can thus ask oneself if the forest owner associations have been “buying” their members rather than recruiting them. However, the association’s current organizational structure requires that people also are willing to get involved in the asso-ciational work. In this area the cooperatives in the agri-cultural sector experiences the same kind of problem as other types of member associations (Echeverri, 2006). One implication of such a development might be that the organization has to decrease its role as a member steered association and become a pure member owned company, run exclusively by professional management. Such a development would not be unique for the forest owners’ association but is a common problem for this type of organization (Stryjan 1994; Chaves et al. 2004 & Nilsson et al. 2009).
During the last years “renewal” has been a buzzword in media when discussing the future of member associa-tions, e.g. when political parties or trade unions have elected new leaders. The same discussion is now
ongoing in the forest owners’ associations and is seen as necessary in order to meet the future challenges (Jonsson, 2009). But renewal does not come by itself nor does it develop from nothing. The process has been described by Yohanan Stryjan (1987) as a loop where organizational renewal (reproduction) is determined by existing organizational culture and practice, which will affect recruitment of members and the creation of new assumptions and practices within the organization. Since the forest owners’ association is a democratic organization the members should play a crucial role in how the future organization is to be shaped. Especially, those who involve themselves in the organization and take on voluntary roles as district council members are expected to contribute to the process. However, few studies have been done on the organizational renewal of forest owners’ associations and little is thus known about the members’ role in this process and why they volunteer to do this work. As Bussell and Forbes (2002) argue, when recruitment of new volunteers become harder, it gets even more important for organizations that are in need of volunteers to develop their under-standing of this group of people.
The objective of this study is therefore to increase our understanding of the reproduction process (organiza-tion renewal) in a forest owners’ association and the role of the district council members in this process. In order to analyze the organization from the reproductive perspective we investigated:
Who are involved in today’s organization? • What are their motives and driving forces for volun-• teering?How is the involvement stimulated (e.g. recruiting, • possibilities to contribute to the organization, etc.)?How does the democratic process work and how do • the members experience their influence in organiza-tional steering processes?
Member Involvement and Organizational development
Organization renewal is in conventional organizations mostly regarded as management’s task. In member steered organizations, or self-managed, much more responsibility should be laid on its members to address the problems that occur and to be active in the orga-nization renewal process. According to the reproduc-tive perspective a cooperative organization should be “manned, steered and continuously (re)designed by its members” (Stryjan, 1994). This reproductive perspective was introduced by Yohanan Stryjan (1989) in his work on cooperative organizations. The renewal process of member organization (cooperatives) is being described by Stryjan (1994) as a loop where members’ assump-tions lead to decisions, which in turn creates new orga-nizational routines and practices, which finally leads to new assumptions. How the organization develops will be affected by components as a) the recruitment of new
78 | IUFRO 3.08.00 Small-Scale Forestry
district council members and the organizational renewal of forest owners’ associations
members, b) what kind of identity the organization and its members have, and c) what kind of inputs members can bring to the organizations.
According to Stryjan (1994) there are four types of inputs that the member can contribute with to the reproductive process: involvement, protest/voice, loyalty and exit. Involvement is a member input which often is held as strength for the democratic organization and should be welcomed by it. Complicating members’ involvement might lead to less willingness to participate and then leaves the decision-making to ruling elite. The growing size of the associations has lead to changes in their business structure and management of the association. Several authors have described how the traditional coop-eratives or associations have faced problems related to their growth. From a population ecology point of view, the association will imitate the structure of other investor owned firms in the same business sector (Nilsson et al., 2009). Further, the growing size and increasing heterogeneity among the association’s members might create steering problems since the heterogenic group of members lacks the ability to control the management in an efficient way (Jussila et al., 2006).
Democratic organizations thus have a tendency to develop towards a situation when members are standing with less power to influence while the managers increase theirs. As Echeverri (2006) states, fewer members
attend meetings and the shifting focus towards econom-ical concerns creates a conflict between the historic ideals and the corporatization process, which seems dominant today. This leads to diminishing democracy and increased administrative power. Chaves et al. (2004) argues that there are four stages in the evolu-tion of democratic organization into administrative orga-nizations, ranging from sole volunteerism and ideology based governance to full administrative power where members lack influence and control of management and the business focus is purely economical.
To prevent managers to take over total control of the association members need to get involved and this is what we focus on in this paper. Members in forest owners associations can get involved in the organiza-tion by taking on voluntary assignments in the organi-zation, mainly as representatives in the district councils which act as consultative bodies for the association board and management. According to Wilson (2000), voluntary action is defined in terms of giving away time and effort for free (or below market price) to benefit a person, group or cause and it should be separated from being active in an organization run by volunteers. Volun-teers are those who give time and effort to produce the services which others can consume.
Figure 1. The figure is a modification of Penner’s (2002) model for sustained volunteerism. Solid lines represent strong causal relationships and the dashed lines weaker ones. The backward curved lines from B and C represents Stryjan’s (1994) ideas, that inputs from the involved members (volunteers) will affect the organizational attributes and practices, which thus will affect A. This is a continuous process.
2012 Conference Proceedings | 79
Kronholm and Wästerlund
Not everyone is likely to volunteer and get involved in a forest owners’ association. According to Penner’s (2002) conceptual model for sustained volunteerism, demo-graphic characteristics, personal motives, personality traits and values will impact on the probability to become a volunteer as well as the attributes and practices of the organization. The implication for organizations is thus to provide situations and content in the work that will fulfill the motivation that the volunteer has (Clary et al., 1999). The thing that determines who volunteers are thus the attributes and practices of the organiza-tion and the relationship members have with the orga-nization. However, Penner’s conceptual model did not consider how the organization’s attributes and prac-tices changes over time in as it was argued by Stryjan (1994) in his loop of reproduction. Combining these two models (Figure 1) thus offers an overview of how the renewal and reproduction process of the organization should be working in several directions, simultaneously and continuously.
Method
The empirical data in this study was collected through 15 qualitative interviews with district council members in the forest owners’ association Norra Skogsägarna, located in the northern parts of Sweden. The associa-tion (cooperative) is owned by its 16 000 members and is built on traditional cooperative principles, meaning that each member has one vote regardless of the size of investment or amount of land owned. Due to its wide geographical area the association is divided into 27 districts (SBO) and four regions. Each district has a council of elected member representatives who are responsible for arranging member activities and to serve as a consultative body for the association board. The members of the districts also elect representa-tives to attend the association’s general annual meeting, the highest deciding body of the association. On the business side, the association is a full-service forestry organization with 400 employees and a turnover of 1 700 MSEK in 2011 (www.norra.se).
Based on the theoretical framework, the elected member representatives in the district councils are the members who are supposed to be central in the reproduction process of the association and thus of most interest for our study. Within this sample group it was impor-tant to find a balanced selection of the interviewees in order to get information from more than one angle (Ritchie & Lewis, 2003). To assure this we used three guiding criteria when selecting interviewees. Geograph-ical location: The geographically scattered organization made it important to select respondents from several districts in order to capture eventual similarities and differences between the districts and regions. The final selection of districts was made through a convenience sample. In the end 13 districts, from all regions, were represented in the study. Gender: Male and female forest owners might have different values and thus have
different motives to join and become active in a forest owners association. Female council members might also have different experiences and views on the associa-tion’s routines and practices since they are in minority (~20 %). Six female council members were interviewed in the study, which imply a slightly higher representa-tion in the sample than in the councils. Seniority: It was assumed that there could be a difference between those who where chairmen in their district and ordinary district council members. Reasons for this could be e.g. time spent in the organization, access to information, possi-bilities to influence, values, etc. Due to same reasons it could also be expected that chairmen can provide more valuable information to the study and therefore the balance in the study was 9 chairpersons and 6 ordinary council members.
All interviews were semi-structured, face-to-face, inter-views and where conducted during August 2011. Time for each interview varied between 50 minutes to 2 hours, with an average duration of 61 minutes. The interviews were recorded and listened to after each interview and after completing all interviews they were transcribed in order to make the data easier to sort and handle for the analysis. The transcripts were done as what Pointdexter (2008) describe as “rough transcripts” or “content-only”, meaning that details in the interviews such as pauses or changes in tone of voice were not considered.
Results
Characteristics
The persons interviewed were between 41 to 70 years of age, with a mean age at 52. They owned between 30 and 700 hectares of forest land and the time they had owned their forest varied between 10-45 years. The education level among the respondents varied to quite high extent. There were respondents who only had gone through upper secondary school while a few had a university degree. A majority of the respondents had a background in agriculture. Four of the respondents were milk producers and that was their main business operation. Three other respondents have previously had animals but had now gone into other employments; however they were still in the agriculture or forestry sector. Additionally one respondent was working with agriculture just as an employee but had never had own animals. Further, two of the respondents was or had been growing crops in varying scale. Forestry seemed to be 10-20% of the operations for those who combined farming with forestry. Only one of the respondents had forestry as the main source of income. The respondents had a huge interest in forestry and all except one did work in their own forests with e.g. thinning and planting. To their characteristics, the respondents were thus tradi-tional forest owners.
80 | IUFRO 3.08.00 Small-Scale Forestry
district council members and the organizational renewal of forest owners’ associations
Why did They Get Involved?
The respondents had many different reasons to why they decided to volunteer and get involved in the organiza-tion by becoming district council members. A common response was simply that they had been asked by the election committee. To increase their access to infor-mation and knowledge was one main reason for their decision, especially among those with less experi-ence from forestry. A clear difference between male and female respondents was identified. While male respondents expressed that they got involved because of increased power to influence and a strong feeling that they could contribute to the development of the asso-ciation, the female respondent said that this was some-thing that developed over time when they gained more experience. Other reasons to join were social contacts and personal interest in working for the common cause. Important is also that most of the respondents fathers have been involved in the association and had strong influence on the respondents decisions, first to become member in the association and later to become more actively involved in the organization.
Shared Frame of Reference
Both the respondents’ views on their own mission in the organization and what the organization should do and stand for were very consistent. Regarding their personal role the respondents expressed that they think their mission is to represent the forest owners, the thoughts and ideas of forest owners, and the expectations that forest owners have on the association. The view of how this mission should be carried out was also quit uniform. First, they saw themselves as a contact link between the members and the board, i.e. they are supposed to pick-up the latest news, rumors, complaints or other kind of issues that the forest owners out in the villages have on their mind and report it through the right channels so that it can be taken care of. Most often it is ques-tions of operational nature and then they just pass it on to the forest inspectors (professionals employed by the association to advice to members and to procure timber). If it is member/owner issues they can discuss it in the district council or bring it upwards in the orga-nization, to the board or management. Second, on the issue of recruitment of new members, they saw them-selves as ambassadors for the organization who should promote the association and get forest owners to sell their timber and become members of the association. The formal recruitment, signing a membership form, is left to the forest inspectors since it is closely connected to the business transaction. Finally, they said that a huge part of their work in the council goes to the arrange-ment of member activities like forest days, courses or social activities.
Organization Attributes
Regarding organizational attributes and their percep-tion of what the association stands for the responses were also very similar from all respondents. The most commonly mentioned attribute that the respondents put on the organization was honesty. They had a strong belief in that the association always will treat them fairly and that the organization always sees to the best of its members. They said that this is what makes the asso-ciation different from other companies. Companies have their stockholders’ interest in first place and not the forest owners. A component in this honesty is the transpar-ency regarding pricing.
A second important attribute, which many of the respon-dents mentioned as one of the most important things that the association stands for, is the work with polit-ical issues regarding landowners’ rights. This was also regarded to be a service which distinguishes the asso-ciation from the companies.
The respondents who did a lot of forestry work them-selves expressed that the association should stand for good forest management practices. In good practice they included both good economic growth in the forest and that the forest management should be focused on a long-term basis so that the management practice will be sustainable.
Finally, the association can also be seen as a part of the respondents own business. The long term partnership gives close personal contacts and a good cooperation which benefits both the individual and the association.
Member Inputs
The respondents generally thought that they had fairly good possibilities to influence on decisions. The members can send in motions both to the district council and directly to the association’s annual meeting. However, they also said that like in all democratic decision making it takes a lot of effort to anchor ideas and opinions and things go rather slowly. The most important forum to make inputs through was said to be the chairmen confer-ences, which are held twice a year. During these occa-sions the district chairmen meet and discuss member/owner issues and can have a dialogue with the board and top management. This forum was considered to have the strongest power to influence on the board’s and management’s decisions.
Another important factor in the association’s internal life was the election committee. These committees have strong influence on the selection process of represen-tatives to the district councils and to the association board and will thus affect the strategic work in significant way. The election committees often consist of members with a long history and respected position within the organization. Their working practice is normally that
2012 Conference Proceedings | 81
Kronholm and Wästerlund
the committee first asks the current board or council members if they wish to be re-elected before they start looking for other candidates. However, members are always free to suggest new candidates to the election committee or at the annual meeting if the election committee decides not to nominate this person.
Discussion
Several previous studies have shown that the forest owner collective has become more heterogenic and that their values and objectives as owners are changing (see e.g. Berlin et al. 2006 & Ingemarson et al. 2006). This trend is expected to continue and increase in pace.
Since the forest owners’ associations have grown in number of members during the recent years it is reason-able to believe that the heterogeneity among the asso-ciation’s members also has increased in similar way. However, it appears that these new types of forest owners have not made their way into the district councils which still are composed by very traditional forest owners. These traditionalists have grown up with forestry in their families and have early been introduced to forestry practice. Most of them live close to their forests and do some amounts of forestry work themselves. The forest related values expressed in this study were very tradi-tional with high focus on production and economically efficient forestry practice. With the association’s history and mission in mind this is not surprising but it might have implications for the association’s ability to repro-duce and renew itself.
In view of both Stryjan’s (1994) and Penner’s (2002) models, the recruitment of new members and volunteers might become difficult since it might be hard for younger forest owners to identify with the people and the prac-tices in the organization. Considering how the selection process is structured in the association we argue that the election committees will have an important role for how the association will develop. However, this will not be a quick and easy process. Traditional values and practices are ranked highly in the election committees since they most often consist of members with a long history in the organization. There is thus a barrier for forest owners with other qualifications than handling a chainsaw and who are interested in other forest values than production to become involved in the associations work. To get the renewal process going it will be neces-sary that the election committees, and others with strong influence, are active and ask people from different back-grounds than their own. The fact that few of the respon-dents claim that they actively have been striving for a place in the board or to advance in the hierarchy clearly show the need to get encouragement from those already inside the organization in order to volunteer.
Analyzing the second stage in the reproduction cycle we found that the organizational identity was very strong among those who are active within the organization.
Honesty, transparent pricing, sustainability (e.g. long term perspective on planning) are attributes which the association is perceived to stand for. There is a very strong trust among the respondents towards the orga-nization that it always has the members best in focus. The fact that all respondents in some way expressed that the most important thing with the association is its honesty towards its members is something for the orga-nization to keep in mind when doing business. About the organizations role there was also a consensus that it should act in a way which ensures good prices for the members and have good forestry practices.
There was also a consensus about the district council representatives own role in the organization. They saw themselves as important bearers of information between members and management but did not see themselves as very important in the recruitment process of new members. They try to act as ambassadors and promote the association to forest owners but much responsibility is given to the forest inspectors since the membership is so closely connected to the business transaction. This might be a danger if we put it in a long term perspec-tive. If the recruitment is left to the employees of the company it will be less apparent for new members that there are differences between the association and the other companies on the market. In the long run it will be harder to involve people in the association if the only connection members have with the organization is the business contacts. Thus, at the same time that this strong organizational identity can act as a strength for the organization to keep long time volunteers in the association it can also be identified as a threat if the current members are not involved in the whole repro-duction process.
The final aspect of the reproduction process consid-ered the members options of input in the association and the possibilities to have influence on the associa-tion. Generally the respondents felt that the possibilities to have an influence on the organization was good in some aspects but that it takes a lot of work if you want to make any bigger changes. The association’s statutes give all members the right to send in suggestions to the association’s annual meeting, which ensures that all at least can make their suggestions heard. It requires, as in all democratic organizations, that you put a lot of effort to anchor your ideas among other groups. The development of the chairmen conferences seems to have given some new energy to at least some of the people involved in the organization and the legitimacy of the democratic process seems to have increased. The respondents’ views on the democratic process were in general very pragmatic. They had an understanding of that the management needs to take quick decisions and cannot always ask the member representatives before making every decision. We thus find evidence that shows that the growing size of the business has created such conditions which was described by Jussila et al. (2006). However, it does not appear to have lead to
82 | IUFRO 3.08.00 Small-Scale Forestry
district council members and the organizational renewal of forest owners’ associations
decreased trust in the organization, as it was argued by Nilsson et al. (2009), at least not among the interviewed council representatives. Instead they were very confi-dent in that the management does what is best for the association and its members. A risk that might exists if the representatives becomes too naïve in this belief and does not show any skepticism towards the management is that the administrative power will increase unnoticed. It could then follow the path which Chaves et al. (2004) argued that democratic organizations usually does.
From the study we can conclude that both Stryjan’s reproduction model and Pennner’s model for sustainable volunteerism offers a good explanation to the reason behind why people decide to become involved in the organization and how the renewal of it will take place. A good understanding of this process thus offers the organization a tool in their ambition to renew them-selves in order to be attractive for the next generation of forest owners. Our conclusion is thus that the asso-ciations actively need to consider how they want to be perceived by members in the future in order to improve their chances of finding people whose characteristics and motives will fit in to it. And, importantly, make sure to ask them to involve.
ReferencesBerlin, C. Lidestav, G. and Holm, S. 2006. Values Placed on
Forest Property Benefits by Swedish NIPF Owners: Differ-ences between Members in Forest Owner Associations and Non-members. Small-scale Forest Economics, Manage-ment and Policy, 5(1), p. 83-96.
Bussell, H. and Forbes, d. 2002. Understanding the volun-teer market: The what, where, who and why of volunteering. International Journal of Nonprofit and Voluntary Sector Marketing, 7 (3), p. 244-257.
Chaves, R. and Sajardo-Moreno, A. 2004. Social Economy Managers: Between Values and Entrenchment. Annals of Public and Cooperative Economics 75:1, p. 139-161.
Clary, E.G. and Snyder, M. 1999. The Motivations to Volunteer: Theoretical and Practical Considerations. Currant directions in Psychological Science, vol. 8, no5, p. 156-159.
Coffey, A. and Atkinson, P. 1996. Making Sense of Qualita-tive data. Sage. Thousand Oaks, California.
Echeverri, P. 2006. Bortom ideologi och ekonomi: Lantbruk-skooperation, medlemsinflytande och strategiutveckling i förändring. Research report, Karlstad University Studies, 2006:19, Karlstad.
Einarsson, T. 2008. Ownership and control in Swedish federa-tive organizations – or a member is a member is a member?. 2nd LAEMOS Colloquium.
Inglehart, R. 2000. Globalization and postmodern values. The Washington Quarterly, 23:1, p. 215-228.
Ingemarsson, F. Lindhagen, A. and Eriksson, L. 2006. A typology of small-scale private forest owners in Sweden. Scandina-vian Journal of Forest Research, 21, p. 249-259.
Jonsson, E. 2009. En samlad spaning. Norra Skogsägarna, Umeå.
Jussila, I. and Goel, S. 2006. Cooperation and conflict: Four Perspectives on Governance of Co-operatives. Proceeding of the 13th Conference of the International Association for the Economics of Participation.
Karppinen, H. 1998. Values and objectives of non-industrial private forest owners in Finland. Silva Fennica, 32(1), p. 43-59.
Nilsson, J. Kihlén, A. and Norell, L. 2009. Are Traditional Cooperatives an Endangered species? About Shrinking Satisfaction, Involvement and Trust. International Food and Agribusiness Management Review, Vol. 12, Issue 4, p. 101-122.
Nordlund, A. and Westin, K. 2011. Forest Values and Forest Management Attitudes among Private Forest Owners in Sweden. Forests, 2, p. 30-50.
Penner, L.A. 2002. Dispositional and Organizational Influences on Sustained Volunteerism: An Interactionist Perspective. Journal of Social Issues, Vol. 58, No. 3, p. 447-467.
Pointdexter, C.C. 2002. Meaning from Methods: Re-presenting Narratives of an HIV-affected Caregiver. Qualitative Social Work, 1:59, p. 59-78.
Putnam, R. 2000. Bowling Alone: The collapse and revival of the American community. Simon & Schuster, New York.
Ritchie, J. and Lewis, J. 2003. Qualitative Research Practice. SAGE Publications, London.
Stryjan, Y. 1987. Impossible Organizations: On Self-manage-ment and Organizational Reproduction. doctoral disserta-tion. Uppsala University, Uppsala.
Stryjan, Y. 1994. Understanding Cooperatives: The repro-duction perspective. Annals of Public and Cooperative Economics, Vol.65, p. 59-79.
Swedish Forest Agency. 2011. Swedish Statistical Yearbook of Forestry 2011. Swedish Forest Agency, Jönköping.
Vogel, A., Amnå, E., Munck, I. and Häll, L. 2003. Associa-tional Life in Sweden: General Welfare Production, Social Capital, Training in democracy. Report no 98. Statistics Sweden, Stockholm.
Wennebro, T. 2008. En samlad kraft: Norra Skogsägarna 75 år. Norra Skogsägarna, Umeå.
Widerberg, K. 2002. Kvalitativ forskning i praktiken. Studen-tlitteratur, Lund.
Wilson, J. 2000. Volunteering. Annual Review of Sociology, Vol. 26, p. 215-240.
2012 Conference Proceedings | 83
Introduction
Prior to the arrival of settlers to the United States, natural communities dominated by longleaf pine (Pinus palustris Mill.) and maintained by periodic fire occurred throughout most of the southern Atlantic and Gulf coastal plains. These communities once covered and estimated 80-90 million acres (2/3 of the area of the Southeast) (Vance, 1895; Chapman, 1926). Its range covers a broad arc along the Coastal Plain and Piedmont from southeast Virginia, south to central Florida, and west to eastern Texas, extending further inland to the Cumberland Palteau and Ridege and Valley physiographic prov-inces in Alabama and Georgia. It covered more acreage than any other North American ecosystem dominated by a single tree species (Chapman, 1932).
How did the pre-settlement longleaf pine forests origi-nate? There is no consensus on their origin, but fire played a role whether the result of ignition due to light-ning strikes or set by Native Americans. The result, as observed by early traveller’s, such as Bartram (1791), provided the following observation of the southeastern landscape: “this plain is mostly a forest of the great long-leaved pine (P. palustris Linn.), the earth covered with grass, interspersed with an infinite variety of herba-ceous plants, and embellished with extensive savan-nahs, always green, sparkling with ponds of water…”.
This original longleaf pine forest was self-perpetuating where seedlings always had to be present. It repro-duced itself in openings in the overstory where young stands developed. These openings would have ranged from a few tenths of an acre due to the loss of a single
longleaf Pine: Providing Opportunities for landowners Beyond BeliefJohn S. Kush1, John C. Gilbert2 and Rebecca J. Barlow3
1 Longleaf Pine Stand Dynamics Laboratory, Auburn University School of Forestry and Wildlife Sciences, 3301 Forestry and Wildlife, Auburn University, AL, 36849 USA, [email protected]
2 Longleaf Pine Stand Dynamics Laboratory, Auburn University School of Forestry and Wildlife Sciences, 3301 Forestry and Wildlife, Auburn University, AL, 36849 USA, [email protected]
3 Alabama Cooperative Extension System and Longleaf Pine Stand Dynamics Laboratory, Auburn University School of Forestry and Wildlife Sciences, 3301 Forestry and Wildlife, Auburn University, AL, 36849 USA, [email protected]
Keywords: longleaf pine, Pinus palustris, small ownerships, uneven-aged management, pine straw, silvopas-ture, silvics, agroforestry
Abstract
Longleaf pine (Pinus palustris) dominated the southeastern landscape for millennia prior to European settlement; this is a fact of its evolution and natural history. As the original longleaf pine forests were harvested, there was little regard for regeneration; “the supply of wood was endless.” Through time, the demand for fiber products grew, and because it was viewed as a “slow growing” species, interest in managing longleaf declined in the South. In response, loblolly pine (P. taeda) plantation management dominated for decades. Forest managers did not seri-ously consider longleaf pine in their management plans because they believed that it had poor survival and slow early growth compared to loblolly and slash pines (P. elliottii). Today, the southern landscape and markets are changing. Timber markets are no longer what they were. Landowners have objectives beyond management for timber, but few believe longleaf can compete with loblolly and slash pine.
As data begins to emerge from long-term studies, evidence indicates that many long-held beliefs may need to be reconsidered. These studies show that the long-term growth rate of longleaf is actually equal or superior to other southern pines. In addition, recent spikes in reforestation costs across the Southeast may limit landowner options, making natural regeneration an appealing alternative. Income potential from non-timber forest products such as pine straw is also an overlooked opportunity. This presentation will provide evidence that longleaf pine is not as intolerant, or as slow a grower as many believe, and that it is well-suited for management on a small-scale.
84 | IUFRO 3.08.00 Small-Scale Forestry
Longleaf pine: providing opportunities for landowners beyond belief
tree to a lightning strike or wind fall, a few acres due to insects or a larger scale wind event, to large openings of several thousands of acres due to tornados or hurri-canes. Regardless of the event size, longleaf pine was able to regenerate these openings. The result was the park-like, uneven-aged forest, composed of many even-aged stands of varying sizes described by Bartram (1791) and Schwarz (1907).
It was recognized as early as the turn of the 20th century that obtaining natural regeneration from longleaf pine would be difficult because of human activities and its own life history. After the cutting of the pre-European settlement forest, efforts to regenerate longleaf pine were minimal. In addition, pressures from cattle grazing, feral hogs, and a policy of fire suppression made the task of longleaf pine regeneration problematic (Landers and others 1995). Problems with the regeneration of longleaf pine were noted by Schwarz (1907) when he wrote “Longleaf pine has an astonishing power of resis-tance to fires, except during its very early life, points to the possibility of possible renewal, in spite of the many destructive human agencies that are constantly threat-ening it.” Wells and Shunk (1931) wrote this about the demise of longleaf pine: “In its pristine condition with millions of trees measuring a yard or more in basal diameter, the Pinus palustris ecosystem unquestion-ably presented one of the most wonderful forests in the world. And today hardly an acre is left in North Carolina to give its citizens a conception of what nature had wrought in an earlier day. The complete destruction of this forest constitutes one of the major social crimes of American history.”
Wahlenberg (1946) in his landmark text “Longleaf pine: Its use, ecology, regeneration, protection, growth, and management” devoted three chapters to the topic of longleaf pine regeneration, nearly one-quarter of the book. In his introduction he stated “Where formerly it had complete possession of the land, it has often failed to reproduce; this failure has resulted in deterioration of land values in many localities.” The two major problems he identified for the frequent failure were: 1: fire, whether too frequent, killing recent regeneration, or too infre-quent resulting in competition from other species; and 2: logging practices that left little or nothing on the ground or no seed trees. He summed this up by saying “Misman-agement of longleaf pine has been the rule rather than the exception, due to ignorance of the unique life history and incomplete knowledge of factors determining the life and death of seedlings and hence the succession of forest types.”
Longleaf pine ecosystems are considered to be in a perilous condition. A report by the U.S. Department of Interior lists the longleaf pine ecosystem as the second-most threatened ecosystem in the U.S. (Noss 1989). Today, there are less than an estimated 3 million acres
left. Until the mid-1990’s, it was estimated that longleaf pine forests were decreasing at a rate of 70,000 acres/year.
There has been renewed interest in longleaf pine over the past 10-15 years for a variety of reasons. It is valued as a straight-growing tree of higher value than other southern pines. It is relatively resistant to insects and wind, as well as being very tolerant of fire. Several threatened and endangered species are often associ-ated with frequently burned longleaf pine ecosystems, such as the red-cockaded woodpecker and gopher tortoise. For wildlife, in general, the understory ground-cover and “open pine” habitat of these frequently burned ecosystems are highly valued. Most recently, there is “America’s Longleaf Initiative” and its impossible goal of increasing longleaf pine 3.4 million acres today to 8 million over the next 15 years (America’s Longleaf Initiative 2009).
If this restoration is to be successful, longleaf pine will have to be “successful” with the small landowner. Currently, nearly 60% of longleaf pine is owned by non-industrial private landowners. A majority of these owner-ships are small-scale. Longleaf pine is perfectly suited to small ownerships because of its silvical character-istics.
Silvics of Longleaf Pine
The Society of American Forester’s (SAF) Handbook says tolerance is a measure of the ability of a tree to survive low overhead light and/or intense root compe-tition. Light is usually considered to be the major factor where a tolerant species can establish itself under a canopy and respond rapidly to release. An intolerant species can only establish itself in the open or in large openings. Other characteristics of intolerant species are: frequent and prolific seed producers, short lived species, and early and rapid stem growth. The SAF lists longleaf pine as a very intolerant species. However, longleaf pine does not have any of the characteristics associated with early successional species. It is not a prolific seed producer, the seed is not disseminated great distances, and its early growth is not rapid. Regeneration of longleaf pine occurs erratically. Excellent seed mast years occur once every 4–7 years, with variations locally.
Survival and growth are closely related to longleaf pine’s two unique silvical characteristics: its grass-stage and its high tolerance of fire. The grass-stage usually lasts 4-5 years but may range from 2 to 20 years. During this grass-stage, the seedling is putting on root growth with no elongation of the stem until some “condition” is met.
Fire is absolutely critical for the maintenance of longleaf pine ecosystems. If fire is removed from the ecosystem and/or burned to infrequently, competing species can
2012 Conference Proceedings | 85
Kush et al.
grow freely and they will completely dominate the site while longleaf seedlings are still in the grass-stage. Once this has occurred, the longleaf pine stand can never regain dominance without some type of intervention.
While longleaf pine is considered an intolerant species, it has many of the characteristics of tolerant species such as American beech (Fagus grandifolia) and sugar maple (Acer saccharum). Longleaf pine can remain in its grass-stage for up to 20 years (personal observation) and then grow when released. In addition, longleaf can grow at advanced ages, as evidenced by work done by Chapman (1909). Longleaf pine management is well-suited to small-scale forestry in that it does the best by frequent, low-intensity thinnings (Lauer and Kush 2011). These thinnings can provide the landowner with a periodic income. In addition, longleaf pine produces a higher quality product than the other southern pines. A typical, naturally-regenerated longleaf pine stand may have up to 70% of the stems as poles. The stumpage price for pine poles is bringing twice that for pine saw timber and is a price that has been relatively stable over the years (Timber Mart-South 2012).
Long-Term Studies
It is difficult to get articles published about longleaf pine because too many reviewers do not have the necessary knowledge of the species to make well-informed deci-sions. Certainly, some of the issues lie in the forestry education system, but much is due to the fact that indus-trial forestry controlled much to the South’s forest profes-sion over the past several decades and the perception that longleaf pine should be managed like loblolly or slash pine.
Several unpublished studies (Dr. William Boyer, U.S. Forest Service retired) indicate that for longer rotations (especially on sites with low to marginal site quality), longleaf pine will outperform the other three major commercial southern pines. In the past, forest managers generally did not seriously consider longleaf pine in their management plans because of poor survival and the slow early growth (during longleaf’s grass-stage period) compared to slash (P. elliottii) and loblolly pines (P. taeda) which do not have a grass-stage. However, as more data from long-term studies emerge, addi-tional evidence that the long-term growth rate of longleaf pine is equal or superior to other southern pines and it produces a higher quality, longer lasting product mix.
A comparative study has followed a naturally-regener-ated stand of longleaf pine to a plantation that is now 39 years old. At age 14, the trees in the plantation were 14 feet taller than trees in the naturally regenerated stand. By age 30, the difference had closed and by age 36 the naturally-regenerated trees were taller, and they have remained that way. In terms of cubic foot volume, there is no difference between the two stands at 39 years from
seed. In this case, the expense of planting longleaf on intensively prepared sites may have little, if any, payoff at rotation end.
In south Mississippi, a side by side comparison with longleaf, loblolly, and slash pine, longleaf pine grew as well as, or better, than loblolly or slash once it had emerged from the grass stage. A reexamination of that study at 39 years found that longleaf pine had higher survival, total basal area, and volume when compared with either slash or loblolly pine. In addition, more than 70 percent of the longleaf pine could be classified as having a quality to make them into utility poles compared to 12 percent for slash pine and 8 percent of the loblolly pine.
A Small-Scale Example
In 1948, the U.S. Forest Service set aside a 40-acre tract on the Escambia Experimental Forest in south Alabama to demonstrate longleaf pine management for the small landowner. At that time, the management goal for this “Farm Forty” was to produce high-quality poles and logs on a 60-year rotation (Boyer and Farrar 1981). The goal was to be accomplished entirely through manage-ment of the existing natural forest with little to no capital investment other than the cost for prescribed burning, marking trees for cut, and limited control of cull hard-woods. Management of the forest has continued, making the “Farm 40” an excellent demonstration of small-scale longleaf pine management. Frequent harvests and small capital outlay only to conduct prescribed fires should continue to make this type of management strategy especially appealing to today’s landowners with limited resources.
With the private landowner in mind, this goal was to be accomplished through management of the existing forest with little to no additional investment or expense. Expenses were primarily for the cost of prescribed burning. Regeneration and intermediate cuts provided regular income from the forest.
Management over the last 30 years continued with periodic shelterwood harvests where stands were thinned to approximately 30 square feet of basal area, creating openings in canopy to promote regenera-tion, and tracts were burned on a 2- to 3-year cycle. Shelterwood systems create small even-aged patches throughout the forest which mimic the natural regenera-tion process that evolved with the species, and eventu-ally make the forest an uneven-aged system. Season of burn was shifted from winter to spring burns during this time to improve hardwood control.
With the exception of salvage harvests that were a result of Hurricane Ivan in 2004, harvests from the Escambia “Farm 40” have been thinnings and shelterwood regen-eration harvests. The initial goal was to have harvest
86 | IUFRO 3.08.00 Small-Scale Forestry
Longleaf pine: providing opportunities for landowners beyond belief
volumes that were less than total growth and to establish a range of age classes across the forest on a 60-year planning cycle. Documented harvests from 1948-1998 yielded almost 1,400 cubic feet of per acre removed from the forest, with 75 percent of all volume removed in high quality sawlogs and poles (Barlow and others 2011).
Using the shelterwood method, stands were thinned and naturally regenerated to mimic natural processes on a small scale. Eventually, older stands were removed as the new stand matured. Over time, a number of age classes were developed within the Farm 40 so there were always mature stands to be harvested providing periodic revenue from the forest with minimal cost to the landowner. An additional benefit of this method is that while a stand re-establishes itself, high-value wood can be grown on the remaining large, seed bearing trees.
Non-Timber Resources
Sustaining the interest of the non-industrial private forest landowners in longleaf pine management must ulti-mately overcome the cash flow problem associated with longer rotations. Several surveys have shown that most of these non-industrial private owners are not seeking to maximize growth and yield but are interested in a range of stewardship objectives which integrate commodity (forest products) values with non- commodity values (wildlife, water, aesthetics etc.). Managing for value, not volume has become the new paradigm for these owners. The cash flow problem is being partially addressed by the promotion of alternative revenue streams derived from non-traditional forest products such as pine straw and wildlife or hunting leases.
Silvopasture
Another potential practice for small-scale landowners to consider is silvopasture that integrates trees, live-stock, and forage into a single system. Silvopasture is a sustainable system creates structure and plant diversity making the system attractive to wildlife species such as wild turkey, quail, and deer. In addition, this can diver-sify an income source because long-term profits from trees respond to different market pressures and reduce risk when combined.
Livestock and longleaf pine go back to the settling of the US and beliefs of free range. As Bartram described the original longleaf pine forests were covered in “grasses”. Some of the early settlers brought with them traditions of animal husbandry. The use of fire was among these. As described by Sargent (1884) in a U.S. Department of Interior publication, “the early settlers in this region were stock raisers. They kept up the Indian practice of burning off the woods during the winter. The destruction
of the undergrowth by this means favored the growth of grasses and numerous herds of almost wild cattle and horses found abundant pasturage”.
Forest range had long furnished an impressive source of forage for the livestock industry in the Southeast. The common practice was to burn these ranges throughout the early 20th century. It was not until the 1930’s that it was realized there were beneficial effects of fire as a management tool for livestock. The opportunity of combining cattle and raising and growing timber in the longleaf pine range was brought out in the pioneer paper of Wahlenberg and others (1939) in southern Missis-sippi (Campbell 1946).
Silvopasture is not a new practice to the Southeast but a renaissance of something forgotten over the past several decades. There are many sources of information available to landowners interested in silvopasture. The best place to start would be the National Agroforestry Center based out of Lincoln, NE. They are a partner-ship of the U.S. Forest Service and Natural Resources Conservation Service. The purpose of the National Agro-forestry Center is to accelerate the development and application of agroforestry technologies to attain more economically, environmentally, and socially sustained land use systems.
Pine Straw
Markets for U.S. timber are declining as manufac-turing facilities move to other countries and as cheaper products are made available. This has had a tremen-dous impact on small-scale ownerships as they are increasingly cut out of traditional markets. Landowners are seeking new ways to generate income from their forestland, while maintaining ecologically diverse and sustainable ecosystems.
As landowners look for alternative ways to generate some income from their forested land, many have turned towards agroforestry. One of the popular practices in the South is harvesting pine straw. Pine straw is a by-product of a natural biological process. Pine needles are shed on an annual basis, and it is a product obtained from a forest without having to cut a tree.
Pine straw offers landowners the opportunity to earn short-term income while managing their property for other land uses. However, there are a number of impor-tant factors to consider before investing time and money into pine straw harvesting operations. Owners must first consider what is biologically possible on their sites. Second, they must carefully evaluate current manage-ment plans and whether pine straw operations would interfere with other land uses and ownership objectives. Finally, before investing in site preparation or signing contracts, landowners must ensure their product has a market and meets quality specifications.
2012 Conference Proceedings | 87
Kush et al.
An average acre of a longleaf pine stand can produce anywhere from 100 to nearly 300 bales of pine straw per year (Dyer and others 2012). The amount depends on site quality, stand density and age, weather condi-tions, and silvicultural practices. A bale of pine straw sells anywhere between $3 and $8 per bale depending on size at locations such as Lowe’s and/or Home Depot. What a landowner could make from selling pine straw depends on how much involvement they want to have in the operation. Several southeastern states have pine straw associations that could help in the decision-making process.
Conclusion
Harper (1928) wrote: Longleaf pine might have once been the most abundant tree in the United States and was certainly the most abundant tree in Alabama….”. “Longleaf had more uses than any other tree in North America, if not the whole world….”. Of all the forest types in the Southeastern U.S., longleaf pine has had the most profound effect on the economic development of the region. Figuratively and literally, it truly was the tree that built the South.
Numerous opportunities exist for small-scale land-owners in the Southeast who have longleaf pine or are thinking of growing/managing it. However, we continue to lose the best quality longleaf pine stands in structure and ground cover through the loss of natural stands of longleaf pine on privately-held lands. We need to maintain what existing stands are left, and yes, we need to give landowners and land managers reasons to plant longleaf pine. However, more importantly, we need to get information to the people who have longleaf pine to help them understand how to maintain it and their options for the future.
References
America’s Longleaf Initiative. 2009. http://www.americaslon-gleaf.net/initiative/goals. [date accessed: May 17, 2011].
Barlow, R.J., J.S. Kush, and W.d. Boyer. 2011. Sixty years of management on a small longleaf pine forest. Southern Journal of Applied Forestry 35(1):50-53.
Bartram, W. 1791. Travels through North and South Carolina, Georgia, East and West Florida. dover Publications (reprinted 1955), New York.
Boyer, W.d., and R.M. Farrar, Jr. 1981. Thirty years of manage-ment on a small longleaf pine forest. Southern Journal of Applied Forestry 5(2):73-77.
Campbell, R.S. 1946. determination of grazing values of native vegetation on southern pine forest ranges. Ecology 27(3):195-204.
Chapman, H.H. 1909. A method of studying growth and yield of longleaf pine applied in Tyler County, Texas. Proceedings of the Society of American Foresters 4:207-220.
Chapman, H.H. 1926. Factors determining the natural repro-duction of longleaf pine on cut-over lands in LaSalle Parish, LA. Yale University School of Forestry Bulletin 16, 44 p.
Chapman, H.H. 1932. Is the longleaf type a climax? Ecology 13:328-334.
dyer, J.F., R.J. Barlow, J.S. Kush, and J.C. Gilbert. 2012. Pine straw production: From forest to front yard. Pages 98-106, In: (Butnor, J.R., ed.) Proceedings of the 16th biennial southern silvicultural research conference. e-Gen. Tech. Rep. SRS-156. Asheville, NC: U.S. department of Agricul-ture Forest Service, Southern Research Station.
Harper, R.M. 1928. Economic botany of Alabama, part 2. Catalogue of the trees, shrubs, and vines of Alabama, with their economic properties and local distribution. Alabama Geological Survey, Monograph 9, 357 p.
Landers, J.L., d.H. Van Lear, and W.d. Boyer. 1995. The longleaf pine forests of the southeast: Requiem or renais-sance? Journal of Forestry 93(11):39-44.
Lauer, d.K., and J.S. Kush. 2011. A variable density stand level growth and yield model for even-aged natural longleaf pine. Alabama Agricultural Experiment Station Special Report No. 10. Available at: www.aaes.auburn.edu/comm/pubs/specialreports/sr10-longleaf-pine.pdf.
Noss, R.F. 1989. Longleaf pine and wiregrass: keystone components of an endangered ecosystem. Natural Areas Journal 9(4):234-235.
Sargent, C.S. 1884. Report on the forests of North America (exclusive of Mexico). U.S. department of Interior Census Office. 10th Census Report v. 9. 612 p.
Schwarz, G.F. 1907. The longleaf pine in virgin forest. A silvical study. John Wiley & Sons, New York, 135 p.
Timber Mart-South. 2012. http://www.timbermart-south.com/ [date accessed: July 26, 2012].
Vance, L.J. 1895. The future of the longleaf pine belt. Garden and Forest 8:278-279.
Wahlenberg, W.G. 1946. Longleaf pine: Its use, ecology, regeneration, protection, growth, and management. Wash-ington dC: Charles Lathrop Pack Foundation and USdA Forest Service.
Wahlenberg, W.G., S.W. Greene, and H.R. Reed. 1939. Effects of fire and cattle grazing on longleaf pine lands as studied at McNeill, Mississippi. U.S. department of Agricul-ture Technical Bulletin 683, 52 p.
Wells, B.W. and I.V. Shunk. 1931. The vegetation and habitat factors of the coarser sands of the North Carolina Coastal Plain: an ecological study. Ecological Monographs 1:465-520.
88 | IUFRO 3.08.00 Small-Scale Forestry
Introduction
Increased national and international demand for renew-able energy has increased the use of biomass for energy production. Currently energy from biomass represents approximately 4% of the energy generated in the US (US Energy Information Administration 2011). New export markets resulting from renewable energy and green-house gas reduction standards in the European Union have also increased the demand for energy products such as wood pellets (Sikkema et al. 2011). Wood pellets are commonly used for residential heating or co-firing with coal for electricity generation. Wood pellet produc-tion capacity in North America increased from 1.1 million tonnes in 2003 to 6.9 million tonnes in 2009, with the Southern US accounting for 33% of this capacity in 2009 (Spelter and Toth 2009). Exports of pellets from North America to the European Union was estimated to be 0.5 million tonnes in 2009 (Sikkema et al. 2011). The use of dedicated energy grass, such as switchgrass, is also being used for pellet production in the southern US. Development of second-generation conversion technol-ogies that transform cellulosic feedstocks to transpor-tation fuels (de Wit et al. 2010, Londo et al. 2010) will likely increase the demand for biomass in the US and Europe which would increase the value of these crops for farmers and producers.
The Lower Mississippi Alluvial Valley (LMAV) region of the Southern US has a high potential for cellulosic biomass production due to its long growing season and well-developed agricultural industry (Trip et al. 2009). In addition the transportation and pipeline systems within this region provide a suitable logistical infrastructure for the delivery of the feedstocks to processing facilities as well as the distribution to consumers (Strata G. LLC et al. 2009). Thus, the LMAV appears to be well posi-tioned for capitalizing on the potential market values of biomass bioenergy crops.
In order to reduce the impact of bioenergy crop produc-tion on the yield of the current agricultural crops grown in this region, bioenergy crops will likely be established on marginal soils which typically have nutrient and/or moisture constraints and are less suitable for traditional agricultural crops. Often these soils support crops and vegetation that provide conservation benefits and impor-tant ecosystems services. Given these considerations we are determining the levels of biomass production of two native species, cottonwood trees and switch-grass, grown on marginal soils in the LMAV. In addition, we are assessing how these crops might be grown in either monocultures or alley cropped agroforests to provide suitable biomass yields as well as important ecosystem services such as wildlife habitat and nutrient retention. Growing cottonwood trees and switchgrass in agroforests may not only enhance the ecosystems services of these two crops but also economically benefit small landowners by diversifying their bioenergy crops. Cottonwood-switchgrass agroforests would provide an annually harvested crop (switchgrass) and a peren-nial (cottonwood) crop which could be managed on a flexible harvesting schedule to take advantage of varia-tions in bioenergy or other product markets. This manu-script provides initial results in regard to cottonwood and switchgrass yields, impacts of these species on nutrient retention or loss, and the potential effects of agroforest systems on small mammal populations in the LMAV.
Methods
This study was established in 2009 at three locations; the (1) UA Pine Tree Branch Station (PTBS) near Colt, AR, (2) the UA Southeast Research and Extension Center (SREC) in Rohwer, AR, and (3) the Stephenson Farm (SF) near Archibald, LA (Figure 1). Five different cropping treatments were established in replicate plots on marginal soils at each location. The five cropping treatments were 1) 100% cottonwood (CW), 2) 100%
The Potential for Using Agroforests for Bioenergy Production in the lower Mississippi Alluvial ValleyHal O. Liechty1, Michael Blazier2, Matthew Pelkki3, Don White Jr.4 and Zachary Robinson5
1 Arkansas Forest Resources Center, 110 University Ct., Monticello, AR, [email protected] Hill Farm Research Station, LSU AgCenter, 11959 Highway 9 · Homer, LA · 71040, [email protected]
3 Arkansas Forest Resources Center, 110 University Ct., Monticello, AR, [email protected] Arkansas Forest Resources Center, 110 University Ct., Monticello, AR, [email protected] 1221 Grand Ridge Road, Charleston, AR 72933, [email protected]
Keywords: cottonwood, switchgrass, ecosystem services, marginal soils
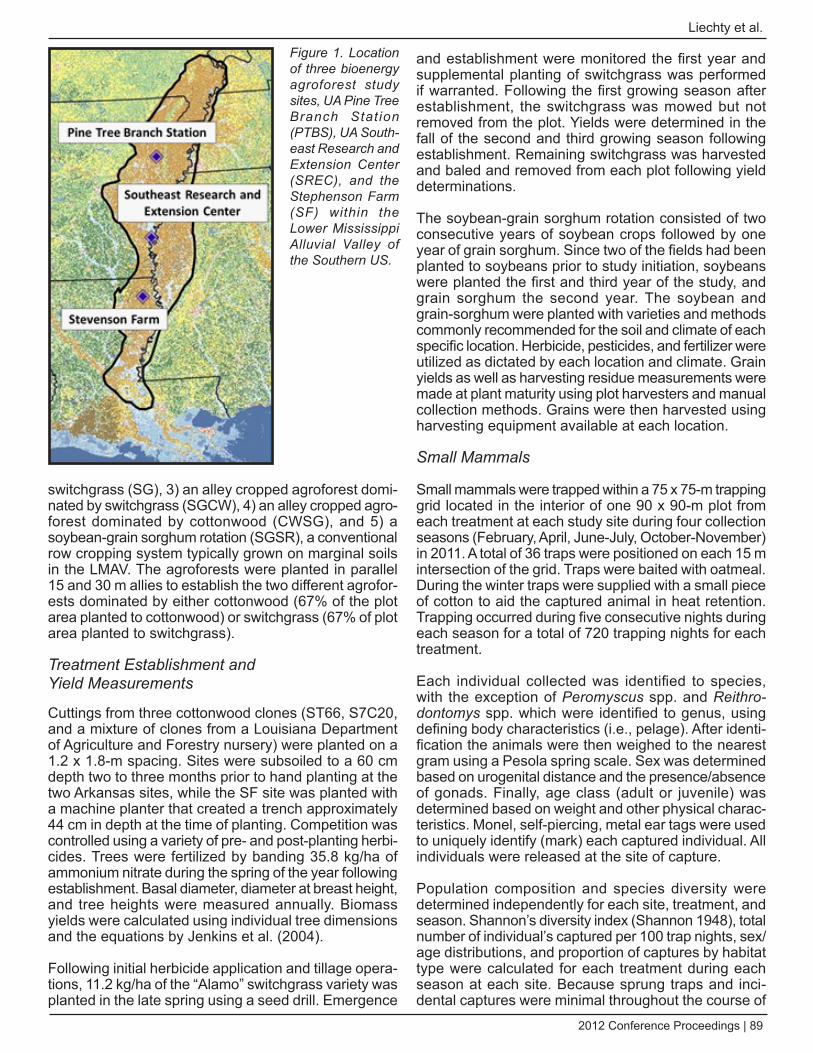
2012 Conference Proceedings | 89
Liechty et al.
switchgrass (SG), 3) an alley cropped agroforest domi-nated by switchgrass (SGCW), 4) an alley cropped agro-forest dominated by cottonwood (CWSG), and 5) a soybean-grain sorghum rotation (SGSR), a conventional row cropping system typically grown on marginal soils in the LMAV. The agroforests were planted in parallel 15 and 30 m allies to establish the two different agrofor-ests dominated by either cottonwood (67% of the plot area planted to cottonwood) or switchgrass (67% of plot area planted to switchgrass).
Treatment Establishment and Yield Measurements
Cuttings from three cottonwood clones (ST66, S7C20, and a mixture of clones from a Louisiana Department of Agriculture and Forestry nursery) were planted on a 1.2 x 1.8-m spacing. Sites were subsoiled to a 60 cm depth two to three months prior to hand planting at the two Arkansas sites, while the SF site was planted with a machine planter that created a trench approximately 44 cm in depth at the time of planting. Competition was controlled using a variety of pre- and post-planting herbi-cides. Trees were fertilized by banding 35.8 kg/ha of ammonium nitrate during the spring of the year following establishment. Basal diameter, diameter at breast height, and tree heights were measured annually. Biomass yields were calculated using individual tree dimensions and the equations by Jenkins et al. (2004).
Following initial herbicide application and tillage opera-tions, 11.2 kg/ha of the “Alamo” switchgrass variety was planted in the late spring using a seed drill. Emergence
and establishment were monitored the first year and supplemental planting of switchgrass was performed if warranted. Following the first growing season after establishment, the switchgrass was mowed but not removed from the plot. Yields were determined in the fall of the second and third growing season following establishment. Remaining switchgrass was harvested and baled and removed from each plot following yield determinations.
The soybean-grain sorghum rotation consisted of two consecutive years of soybean crops followed by one year of grain sorghum. Since two of the fields had been planted to soybeans prior to study initiation, soybeans were planted the first and third year of the study, and grain sorghum the second year. The soybean and grain-sorghum were planted with varieties and methods commonly recommended for the soil and climate of each specific location. Herbicide, pesticides, and fertilizer were utilized as dictated by each location and climate. Grain yields as well as harvesting residue measurements were made at plant maturity using plot harvesters and manual collection methods. Grains were then harvested using harvesting equipment available at each location.
Small Mammals
Small mammals were trapped within a 75 x 75-m trapping grid located in the interior of one 90 x 90-m plot from each treatment at each study site during four collection seasons (February, April, June-July, October-November) in 2011. A total of 36 traps were positioned on each 15 m intersection of the grid. Traps were baited with oatmeal. During the winter traps were supplied with a small piece of cotton to aid the captured animal in heat retention. Trapping occurred during five consecutive nights during each season for a total of 720 trapping nights for each treatment.
Each individual collected was identified to species, with the exception of Peromyscus spp. and Reithro-dontomys spp. which were identified to genus, using defining body characteristics (i.e., pelage). After identi-fication the animals were then weighed to the nearest gram using a Pesola spring scale. Sex was determined based on urogenital distance and the presence/absence of gonads. Finally, age class (adult or juvenile) was determined based on weight and other physical charac-teristics. Monel, self-piercing, metal ear tags were used to uniquely identify (mark) each captured individual. All individuals were released at the site of capture.
Population composition and species diversity were determined independently for each site, treatment, and season. Shannon’s diversity index (Shannon 1948), total number of individual’s captured per 100 trap nights, sex/age distributions, and proportion of captures by habitat type were calculated for each treatment during each season at each site. Because sprung traps and inci-dental captures were minimal throughout the course of
Figure 1. Location of three bioenergy agroforest study sites, UA Pine Tree Branch Station (PTBS), UA South-east Research and Extension Center (SREC), and the Stephenson Farm (SF) within the Lower Mississippi Alluvial Valley of the Southern US.
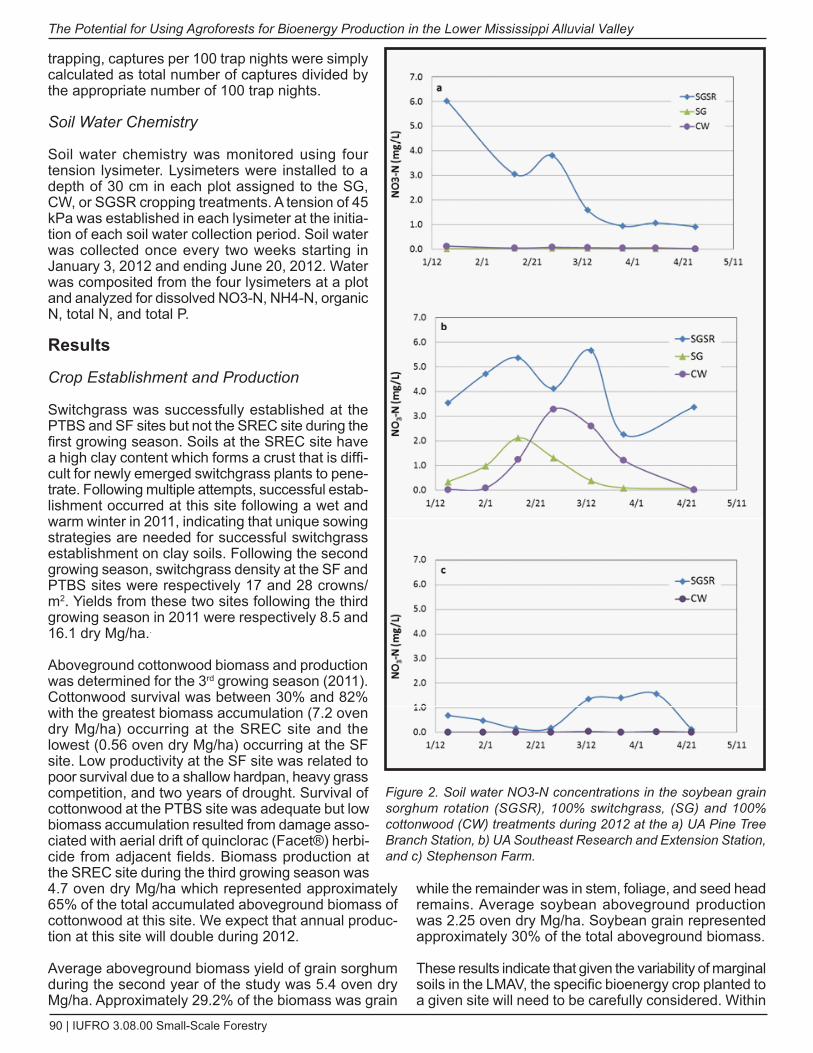
90 | IUFRO 3.08.00 Small-Scale Forestry
The Potential for Using Agroforests for Bioenergy Production in the Lower Mississippi Alluvial Valley
trapping, captures per 100 trap nights were simply calculated as total number of captures divided by the appropriate number of 100 trap nights.
Soil Water Chemistry
Soil water chemistry was monitored using four tension lysimeter. Lysimeters were installed to a depth of 30 cm in each plot assigned to the SG, CW, or SGSR cropping treatments. A tension of 45 kPa was established in each lysimeter at the initia-tion of each soil water collection period. Soil water was collected once every two weeks starting in January 3, 2012 and ending June 20, 2012. Water was composited from the four lysimeters at a plot and analyzed for dissolved NO3-N, NH4-N, organic N, total N, and total P.
Results
Crop Establishment and Production
Switchgrass was successfully established at the PTBS and SF sites but not the SREC site during the first growing season. Soils at the SREC site have a high clay content which forms a crust that is diffi-cult for newly emerged switchgrass plants to pene-trate. Following multiple attempts, successful estab-lishment occurred at this site following a wet and warm winter in 2011, indicating that unique sowing strategies are needed for successful switchgrass establishment on clay soils. Following the second growing season, switchgrass density at the SF and PTBS sites were respectively 17 and 28 crowns/m2. Yields from these two sites following the third growing season in 2011 were respectively 8.5 and 16.1 dry Mg/ha..
Aboveground cottonwood biomass and production was determined for the 3rd growing season (2011). Cottonwood survival was between 30% and 82% with the greatest biomass accumulation (7.2 oven dry Mg/ha) occurring at the SREC site and the lowest (0.56 oven dry Mg/ha) occurring at the SF site. Low productivity at the SF site was related to poor survival due to a shallow hardpan, heavy grass competition, and two years of drought. Survival of cottonwood at the PTBS site was adequate but low biomass accumulation resulted from damage asso-ciated with aerial drift of quinclorac (Facet®) herbi-cide from adjacent fields. Biomass production at the SREC site during the third growing season was 4.7 oven dry Mg/ha which represented approximately 65% of the total accumulated aboveground biomass of cottonwood at this site. We expect that annual produc-tion at this site will double during 2012.
Average aboveground biomass yield of grain sorghum during the second year of the study was 5.4 oven dry Mg/ha. Approximately 29.2% of the biomass was grain
while the remainder was in stem, foliage, and seed head remains. Average soybean aboveground production was 2.25 oven dry Mg/ha. Soybean grain represented approximately 30% of the total aboveground biomass.
These results indicate that given the variability of marginal soils in the LMAV, the specific bioenergy crop planted to a given site will need to be carefully considered. Within
Figure 2. Soil water NO3-N concentrations in the soybean grain sorghum rotation (SGSR), 100% switchgrass, (SG) and 100% cottonwood (CW) treatments during 2012 at the a) UA Pine Tree Branch Station, b) UA Southeast Research and Extension Station, and c) Stephenson Farm.
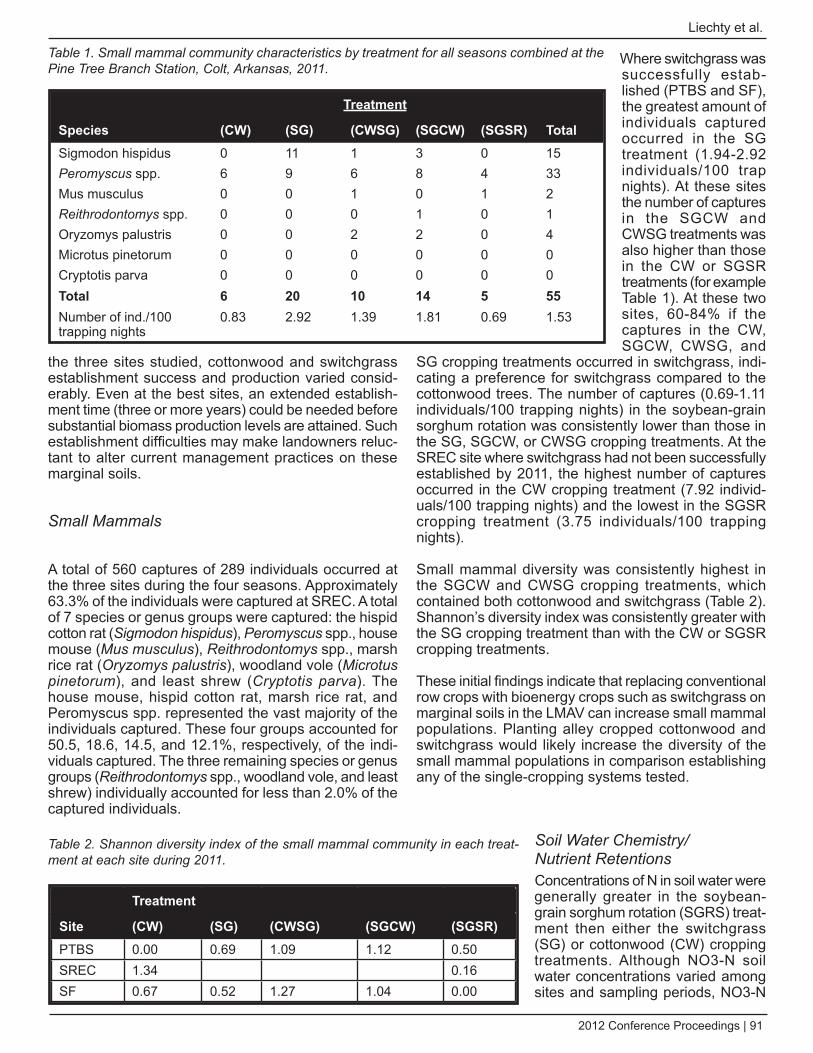
2012 Conference Proceedings | 91
Liechty et al.
the three sites studied, cottonwood and switchgrass establishment success and production varied consid-erably. Even at the best sites, an extended establish-ment time (three or more years) could be needed before substantial biomass production levels are attained. Such establishment difficulties may make landowners reluc-tant to alter current management practices on these marginal soils.
Small Mammals
A total of 560 captures of 289 individuals occurred at the three sites during the four seasons. Approximately 63.3% of the individuals were captured at SREC. A total of 7 species or genus groups were captured: the hispid cotton rat (Sigmodon hispidus), Peromyscus spp., house mouse (Mus musculus), Reithrodontomys spp., marsh rice rat (Oryzomys palustris), woodland vole (Microtus pinetorum), and least shrew (Cryptotis parva). The house mouse, hispid cotton rat, marsh rice rat, and Peromyscus spp. represented the vast majority of the individuals captured. These four groups accounted for 50.5, 18.6, 14.5, and 12.1%, respectively, of the indi-viduals captured. The three remaining species or genus groups (Reithrodontomys spp., woodland vole, and least shrew) individually accounted for less than 2.0% of the captured individuals.
Where switchgrass was successfully estab-lished (PTBS and SF), the greatest amount of individuals captured occurred in the SG treatment (1.94-2.92 individuals/100 trap nights). At these sites the number of captures in the SGCW and CWSG treatments was also higher than those in the CW or SGSR treatments (for example Table 1). At these two sites, 60-84% if the captures in the CW, SGCW, CWSG, and
SG cropping treatments occurred in switchgrass, indi-cating a preference for switchgrass compared to the cottonwood trees. The number of captures (0.69-1.11 individuals/100 trapping nights) in the soybean-grain sorghum rotation was consistently lower than those in the SG, SGCW, or CWSG cropping treatments. At the SREC site where switchgrass had not been successfully established by 2011, the highest number of captures occurred in the CW cropping treatment (7.92 individ-uals/100 trapping nights) and the lowest in the SGSR cropping treatment (3.75 individuals/100 trapping nights).
Small mammal diversity was consistently highest in the SGCW and CWSG cropping treatments, which contained both cottonwood and switchgrass (Table 2). Shannon’s diversity index was consistently greater with the SG cropping treatment than with the CW or SGSR cropping treatments.
These initial findings indicate that replacing conventional row crops with bioenergy crops such as switchgrass on marginal soils in the LMAV can increase small mammal populations. Planting alley cropped cottonwood and switchgrass would likely increase the diversity of the small mammal populations in comparison establishing any of the single-cropping systems tested.
Soil Water Chemistry/Nutrient RetentionsConcentrations of N in soil water were generally greater in the soybean-grain sorghum rotation (SGRS) treat-ment then either the switchgrass (SG) or cottonwood (CW) cropping treatments. Although NO3-N soil water concentrations varied among sites and sampling periods, NO3-N
Treatment
Species (Cw) (SG) (CwSG) (SGCw) (SGSR) TotalSigmodon hispidus 0 11 1 3 0 15Peromyscus spp. 6 9 6 8 4 33Mus musculus 0 0 1 0 1 2Reithrodontomys spp. 0 0 0 1 0 1Oryzomys palustris 0 0 2 2 0 4Microtus pinetorum 0 0 0 0 0 0Cryptotis parva 0 0 0 0 0 0Total 6 20 10 14 5 55Number of ind./100 trapping nights
0.83 2.92 1.39 1.81 0.69 1.53
Table 1. Small mammal community characteristics by treatment for all seasons combined at the Pine Tree Branch Station, Colt, Arkansas, 2011.
Treatment
Site (Cw) (SG) (CwSG) (SGCw) (SGSR)PTBS 0.00 0.69 1.09 1.12 0.50SREC 1.34 0.16SF 0.67 0.52 1.27 1.04 0.00
Table 2. Shannon diversity index of the small mammal community in each treat-ment at each site during 2011.
92 | IUFRO 3.08.00 Small-Scale Forestry
The Potential for Using Agroforests for Bioenergy Production in the Lower Mississippi Alluvial Valley
concentrations were consistently greater in the SGRS treatment than the other two treatments during each sampling period (Figure 2). Average NO3-N concentra-tions in the SGRS cropping treatment were approximately 5 to 6 times greater than in the SG and CW cropping treatments (Table 3). Nitrate-N was the dominant N ion in these soil solutions and total N concentrations like NO3-N were significantly greater in the SGRS treatment than in the SG or CW crops. Concentrations of NH4-N, organic N, and total P were numerically but not signifi-cantly (p<0.10) greater in the SGRS than the other two cropping treatments (Table 3).
The higher levels of soil water N in the SGRS treatment likely reflected the nitrogen fixing ability of the soybeans and the fertilizer applied to this cropping treatment. In addition soybeans and grain sorghum are annual crops which have rapid decomposition of harvest residues and below-ground tissues. Comparisons in root biomass among these three cropping treatments at the three study sites (unpublished data) indicated significantly higher levels of living roots in the SG and CW treat-ments than the SGRS. The maintenance of living roots of cottonwood and switchgrass during the entire year would likely help to absorb available N, reduce N inputs from decomposing roots, and thus increase N retention. The similar concentrations of N in the soil water of the switchgrass and cottonwood suggest that these two crops have similar N retention abilities.
Summary
Biomass yields from switchgrass and cottonwood during the initial establishment phase significantly varied among different marginal soils and locations in the LMAV. It may take an extended period of time for these crops to reach their maximum yield and provide suitable amounts of biomass for energy production. The amount of N reten-tion in these biomass crops appear to be greater than those from typical row crop agriculture practiced on marginal soils in the LMAV. In addition small mammal populations and diversity can be increased with conver-sion of row crop agriculture to cottonwood and switch-grass agroforests.
ReferencesBerry, L. and K. Mitchell. 2009. Logistics Assessment of the
delta Region. http://agbioworks.org/downloads/home.cfm?CFId=39720412&CFTOKEN=290d0d89942ac09d-146C623C-5056-A338-C8FE15167EFC783B&jsessionid=84303a2ba7643b83c2195c7d7b4357ea3f7b
de Wit, M and Faaijl, APC. 2010. Biomass Bioenergy 34:188-202.
Jenkins, Jennifer C.; Chojnacky, david C.; Heath, Linda S.; Birdsey, Richard A. 2004. Comprehensive database of diameter-based biomass regressions for North American tree species. Gen. Tech. Rep. NE-319. Newtown Square, PA: U.S. department of Agriculture, Forest Service, North-eastern Research Station. 45 p.
Londo, M., Lensink, S., Wakker, S., Fischer, G., Prieler, S. 2010. The REFUEL EU road map for biofuels in transport. Biomass Bioenergy 34:244-55.
Shannon, C.E. 1948. A mathematical theory of communica-tion. Bell System Technical Journal 27:379-423, 623-656.
Sikkema, R., Steiner, M., Junginger, M., Wolfgang, H., Morten, T.H, and Faaij, A. 2011. The European wood pellet markets: current status and prospects for 2020. Biofuels, Bioprod., Bioref. 5:250-278.
Spelter, H. and Toth, d. 2009. North America’s wood pellet sector. Research Paper FPL-RP-656. Madison, WI. U.S.d.A., Forest Service, Forest Products Laboratory. 21. p.
Tripp, S. , Powell, S.R., Nelson, P. 2009 Regional strategy for biobased products in the Mississippi delta, Executive Summary. Battelle Technology Partnership Practice, pp 23.
US. Energy Information Administration. 2011. Annual Energy Review 2010. dOE/EIA-0384(2010. pp 384.
Soil water
Site & TreatmentNO3-N (mg/L)
NH4-N (mg/L)
Organic N (mg/L)
Total N (mg/L)
Total P (mg/L)
PTBS & SFSGSR 3.32* 0.88 1.26 5.14* 0.08SG 0.39 0.09 0.24 0.72 0.03PTBS, SREC, & SFSGSR 2.38* 0.69 1.01 3.84* 0.07CW 0.41 0.10 0.29 0.78 0.04
Table 3. Mean N and P soil water concentrations in the soybean grain sorghum rotation (SGSR), switchgrass (SG) and cottonwood (CW) cropping treatments. SGSR concentrations noted with * are significantly (p<0.10) higher than those for the SG or CW cropping treatments.
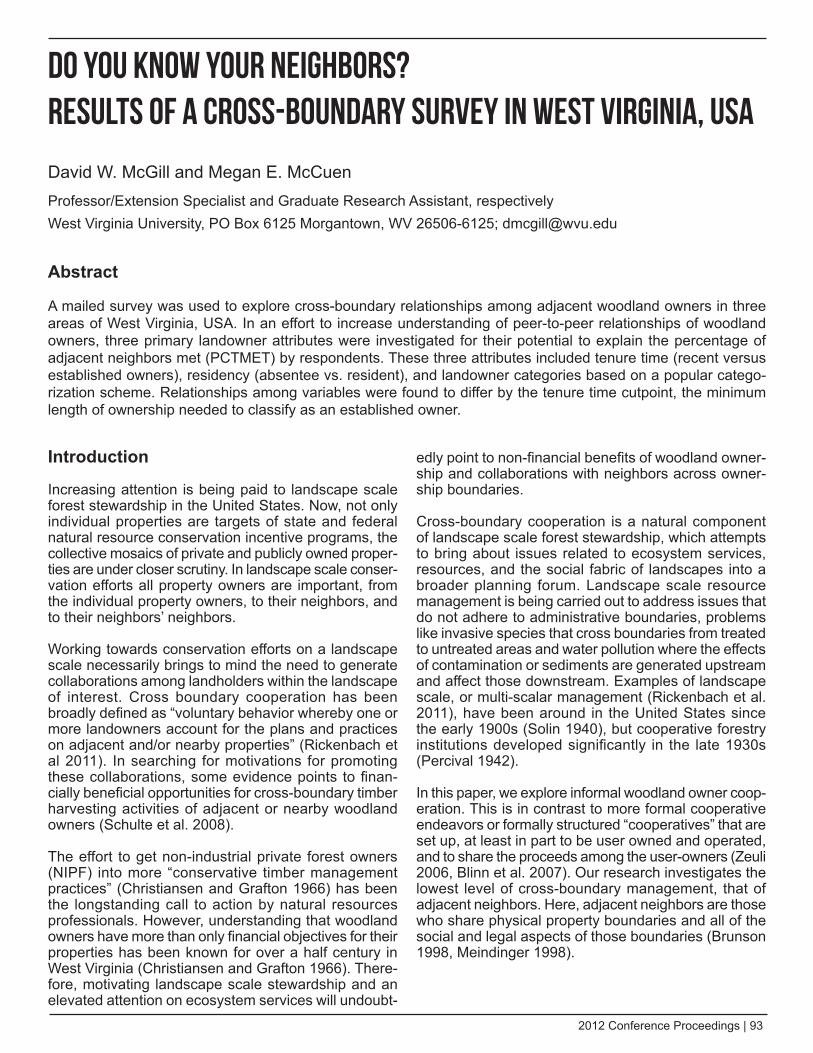
2012 Conference Proceedings | 93
Introduction
Increasing attention is being paid to landscape scale forest stewardship in the United States. Now, not only individual properties are targets of state and federal natural resource conservation incentive programs, the collective mosaics of private and publicly owned proper-ties are under closer scrutiny. In landscape scale conser-vation efforts all property owners are important, from the individual property owners, to their neighbors, and to their neighbors’ neighbors.
Working towards conservation efforts on a landscape scale necessarily brings to mind the need to generate collaborations among landholders within the landscape of interest. Cross boundary cooperation has been broadly defined as “voluntary behavior whereby one or more landowners account for the plans and practices on adjacent and/or nearby properties” (Rickenbach et al 2011). In searching for motivations for promoting these collaborations, some evidence points to finan-cially beneficial opportunities for cross-boundary timber harvesting activities of adjacent or nearby woodland owners (Schulte et al. 2008).
The effort to get non-industrial private forest owners (NIPF) into more “conservative timber management practices” (Christiansen and Grafton 1966) has been the longstanding call to action by natural resources professionals. However, understanding that woodland owners have more than only financial objectives for their properties has been known for over a half century in West Virginia (Christiansen and Grafton 1966). There-fore, motivating landscape scale stewardship and an elevated attention on ecosystem services will undoubt-
edly point to non-financial benefits of woodland owner-ship and collaborations with neighbors across owner-ship boundaries.
Cross-boundary cooperation is a natural component of landscape scale forest stewardship, which attempts to bring about issues related to ecosystem services, resources, and the social fabric of landscapes into a broader planning forum. Landscape scale resource management is being carried out to address issues that do not adhere to administrative boundaries, problems like invasive species that cross boundaries from treated to untreated areas and water pollution where the effects of contamination or sediments are generated upstream and affect those downstream. Examples of landscape scale, or multi-scalar management (Rickenbach et al. 2011), have been around in the United States since the early 1900s (Solin 1940), but cooperative forestry institutions developed significantly in the late 1930s (Percival 1942).
In this paper, we explore informal woodland owner coop-eration. This is in contrast to more formal cooperative endeavors or formally structured “cooperatives” that are set up, at least in part to be user owned and operated, and to share the proceeds among the user-owners (Zeuli 2006, Blinn et al. 2007). Our research investigates the lowest level of cross-boundary management, that of adjacent neighbors. Here, adjacent neighbors are those who share physical property boundaries and all of the social and legal aspects of those boundaries (Brunson 1998, Meindinger 1998).
Do You know Your Neighbors? Results of a Cross-Boundary Survey in West Virginia, USA
David W. McGill and Megan E. McCuenProfessor/Extension Specialist and Graduate Research Assistant, respectivelyWest Virginia University, PO Box 6125 Morgantown, WV 26506-6125; [email protected]
Abstract
A mailed survey was used to explore cross-boundary relationships among adjacent woodland owners in three areas of West Virginia, USA. In an effort to increase understanding of peer-to-peer relationships of woodland owners, three primary landowner attributes were investigated for their potential to explain the percentage of adjacent neighbors met (PCTMET) by respondents. These three attributes included tenure time (recent versus established owners), residency (absentee vs. resident), and landowner categories based on a popular catego-rization scheme. Relationships among variables were found to differ by the tenure time cutpoint, the minimum length of ownership needed to classify as an established owner.
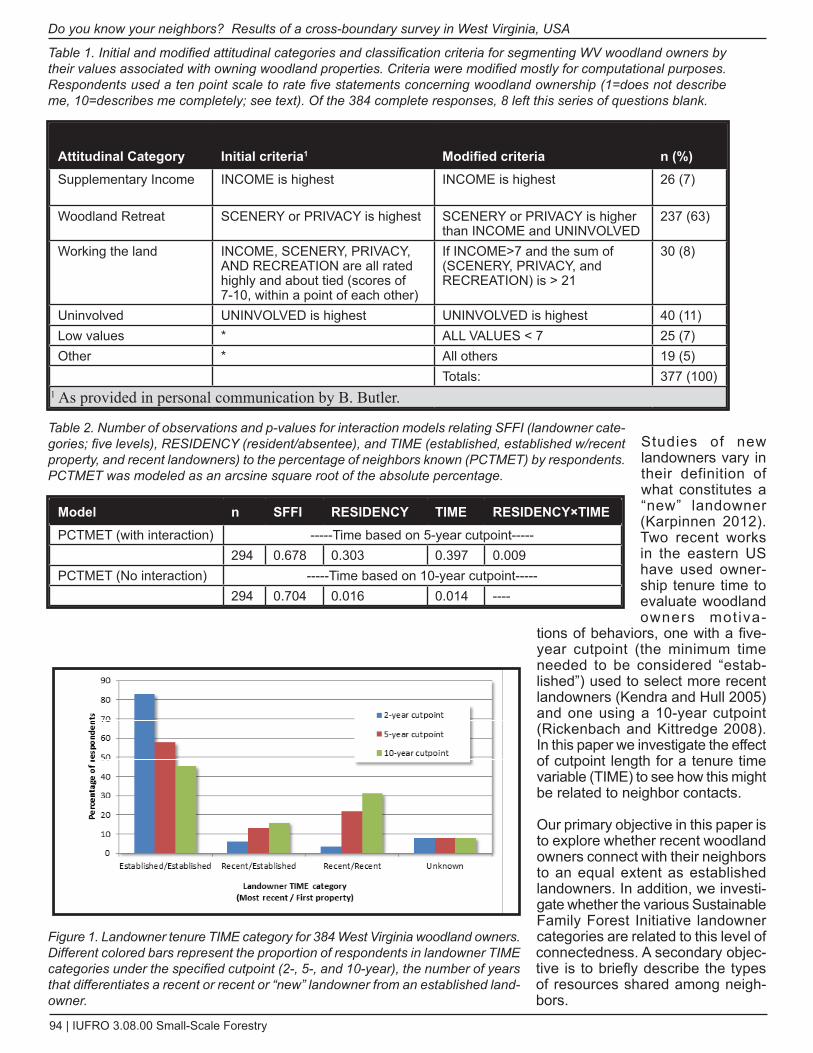
94 | IUFRO 3.08.00 Small-Scale Forestry
do you know your neighbors? Results of a cross-boundary survey in West Virginia, USA
Studies of new landowners vary in their definition of what constitutes a “new” landowner (Karpinnen 2012). Two recent works in the eastern US have used owner-ship tenure time to evaluate woodland owners mot iva-
tions of behaviors, one with a five-year cutpoint (the minimum time needed to be considered “estab-lished”) used to select more recent landowners (Kendra and Hull 2005) and one using a 10-year cutpoint (Rickenbach and Kittredge 2008). In this paper we investigate the effect of cutpoint length for a tenure time variable (TIME) to see how this might be related to neighbor contacts.
Our primary objective in this paper is to explore whether recent woodland owners connect with their neighbors to an equal extent as established landowners. In addition, we investi-gate whether the various Sustainable Family Forest Initiative landowner categories are related to this level of connectedness. A secondary objec-tive is to briefly describe the types of resources shared among neigh-bors.
Figure 1. Landowner tenure TIME category for 384 West Virginia woodland owners. different colored bars represent the proportion of respondents in landowner TIME categories under the specified cutpoint (2-, 5-, and 10-year), the number of years that differentiates a recent or recent or “new” landowner from an established land-owner.
Attitudinal Category Initial criteria1 Modified criteria n (%)Supplementary Income INCOME is highest INCOME is highest 26 (7)
Woodland Retreat SCENERY or PRIVACY is highest SCENERY or PRIVACY is higher than INCOME and UNINVOLVED
237 (63)
Working the land INCOME, SCENERY, PRIVACY, AND RECREATION are all rated highly and about tied (scores of 7-10, within a point of each other)
If INCOME>7 and the sum of (SCENERY, PRIVACY, and RECREATION) is > 21
30 (8)
Uninvolved UNINVOLVED is highest UNINVOLVED is highest 40 (11)Low values * ALL VALUES < 7 25 (7)Other * All others 19 (5)
Totals: 377 (100)1 As provided in personal communication by B. Butler.
Table 1. Initial and modified attitudinal categories and classification criteria for segmenting WV woodland owners by their values associated with owning woodland properties. Criteria were modified mostly for computational purposes. Respondents used a ten point scale to rate five statements concerning woodland ownership (1=does not describe me, 10=describes me completely; see text). Of the 384 complete responses, 8 left this series of questions blank.
Model n SFFI RESIDENCY TIME RESIDENCY×TIMEPCTMET (with interaction) -----Time based on 5-year cutpoint-----
294 0.678 0.303 0.397 0.009PCTMET (No interaction) -----Time based on 10-year cutpoint-----
294 0.704 0.016 0.014 ----
Table 2. Number of observations and p-values for interaction models relating SFFI (landowner cate-gories; five levels), RESIDENCY (resident/absentee), and TIME (established, established w/recent property, and recent landowners) to the percentage of neighbors known (PCTMET) by respondents. PCTMET was modeled as an arcsine square root of the absolute percentage.
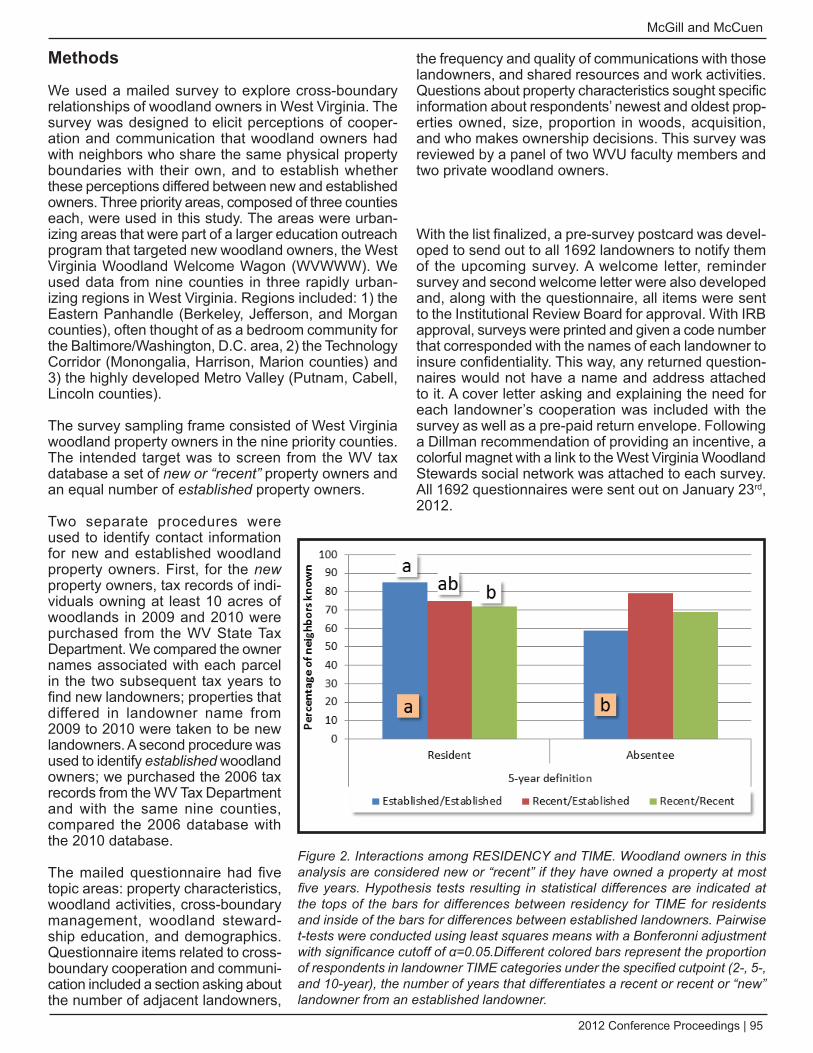
2012 Conference Proceedings | 95
McGill and McCuen
Methods
We used a mailed survey to explore cross-boundary relationships of woodland owners in West Virginia. The survey was designed to elicit perceptions of cooper-ation and communication that woodland owners had with neighbors who share the same physical property boundaries with their own, and to establish whether these perceptions differed between new and established owners. Three priority areas, composed of three counties each, were used in this study. The areas were urban-izing areas that were part of a larger education outreach program that targeted new woodland owners, the West Virginia Woodland Welcome Wagon (WVWWW). We used data from nine counties in three rapidly urban-izing regions in West Virginia. Regions included: 1) the Eastern Panhandle (Berkeley, Jefferson, and Morgan counties), often thought of as a bedroom community for the Baltimore/Washington, D.C. area, 2) the Technology Corridor (Monongalia, Harrison, Marion counties) and 3) the highly developed Metro Valley (Putnam, Cabell, Lincoln counties).
The survey sampling frame consisted of West Virginia woodland property owners in the nine priority counties. The intended target was to screen from the WV tax database a set of new or “recent” property owners and an equal number of established property owners.
Two separate procedures were used to identify contact information for new and established woodland property owners. First, for the new property owners, tax records of indi-viduals owning at least 10 acres of woodlands in 2009 and 2010 were purchased from the WV State Tax Department. We compared the owner names associated with each parcel in the two subsequent tax years to find new landowners; properties that differed in landowner name from 2009 to 2010 were taken to be new landowners. A second procedure was used to identify established woodland owners; we purchased the 2006 tax records from the WV Tax Department and with the same nine counties, compared the 2006 database with the 2010 database.
The mailed questionnaire had five topic areas: property characteristics, woodland activities, cross-boundary management, woodland steward-ship education, and demographics. Questionnaire items related to cross-boundary cooperation and communi-cation included a section asking about the number of adjacent landowners,
the frequency and quality of communications with those landowners, and shared resources and work activities. Questions about property characteristics sought specific information about respondents’ newest and oldest prop-erties owned, size, proportion in woods, acquisition, and who makes ownership decisions. This survey was reviewed by a panel of two WVU faculty members and two private woodland owners.
With the list finalized, a pre-survey postcard was devel-oped to send out to all 1692 landowners to notify them of the upcoming survey. A welcome letter, reminder survey and second welcome letter were also developed and, along with the questionnaire, all items were sent to the Institutional Review Board for approval. With IRB approval, surveys were printed and given a code number that corresponded with the names of each landowner to insure confidentiality. This way, any returned question-naires would not have a name and address attached to it. A cover letter asking and explaining the need for each landowner’s cooperation was included with the survey as well as a pre-paid return envelope. Following a Dillman recommendation of providing an incentive, a colorful magnet with a link to the West Virginia Woodland Stewards social network was attached to each survey. All 1692 questionnaires were sent out on January 23rd, 2012.
Figure 2. Interactions among RESIdENCY and TIME. Woodland owners in this analysis are considered new or “recent” if they have owned a property at most five years. Hypothesis tests resulting in statistical differences are indicated at the tops of the bars for differences between residency for TIME for residents and inside of the bars for differences between established landowners. Pairwise t-tests were conducted using least squares means with a Bonferonni adjustment with significance cutoff of α=0.05.Different colored bars represent the proportion of respondents in landowner TIME categories under the specified cutpoint (2-, 5-, and 10-year), the number of years that differentiates a recent or recent or “new” landowner from an established landowner.
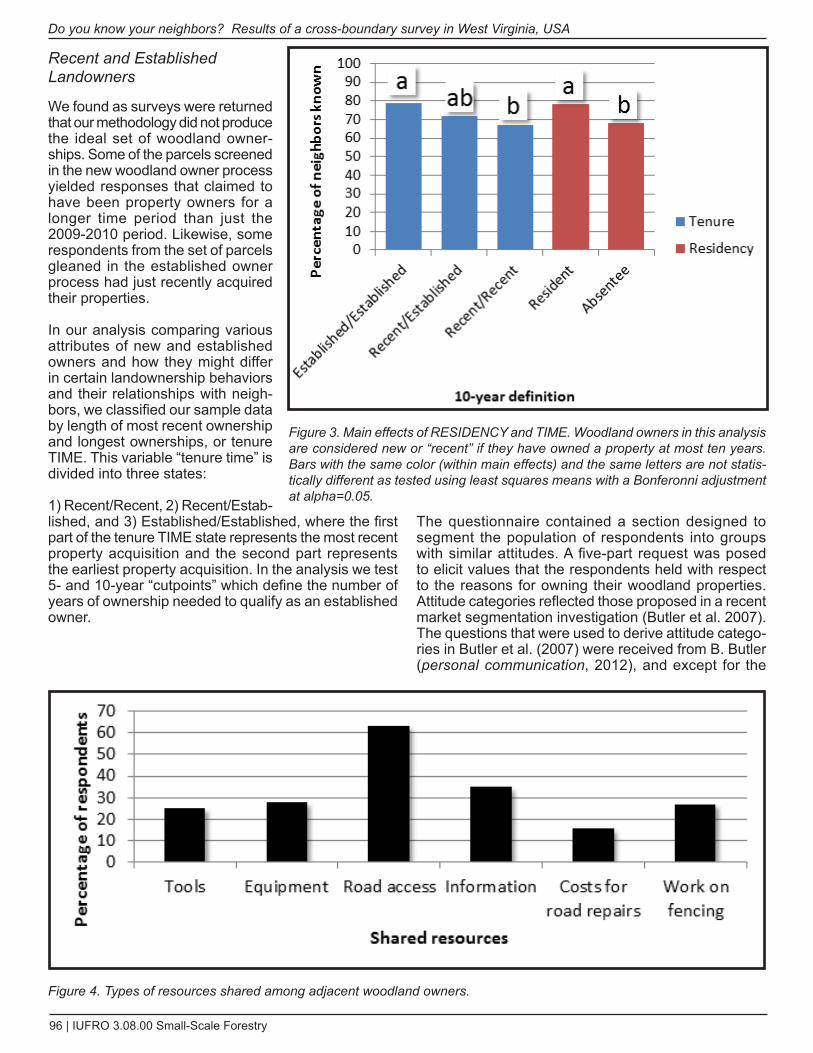
96 | IUFRO 3.08.00 Small-Scale Forestry
do you know your neighbors? Results of a cross-boundary survey in West Virginia, USA
Recent and Established Landowners
We found as surveys were returned that our methodology did not produce the ideal set of woodland owner-ships. Some of the parcels screened in the new woodland owner process yielded responses that claimed to have been property owners for a longer time period than just the 2009-2010 period. Likewise, some respondents from the set of parcels gleaned in the established owner process had just recently acquired their properties.
In our analysis comparing various attributes of new and established owners and how they might differ in certain landownership behaviors and their relationships with neigh-bors, we classified our sample data by length of most recent ownership and longest ownerships, or tenure TIME. This variable “tenure time” is divided into three states:
1) Recent/Recent, 2) Recent/Estab-lished, and 3) Established/Established, where the first part of the tenure TIME state represents the most recent property acquisition and the second part represents the earliest property acquisition. In the analysis we test 5- and 10-year “cutpoints” which define the number of years of ownership needed to qualify as an established owner.
The questionnaire contained a section designed to segment the population of respondents into groups with similar attitudes. A five-part request was posed to elicit values that the respondents held with respect to the reasons for owning their woodland properties. Attitude categories reflected those proposed in a recent market segmentation investigation (Butler et al. 2007). The questions that were used to derive attitude catego-ries in Butler et al. (2007) were received from B. Butler (personal communication, 2012), and except for the
Figure 4. Types of resources shared among adjacent woodland owners.
Figure 3. Main effects of RESIdENCY and TIME. Woodland owners in this analysis are considered new or “recent” if they have owned a property at most ten years. Bars with the same color (within main effects) and the same letters are not statis-tically different as tested using least squares means with a Bonferonni adjustment at alpha=0.05.
2012 Conference Proceedings | 97
McGill and McCuen
alphanumeric characters used to identify the specific value statements below (financial, scenery, privacy, recreation, involvement) were incorporated into the questionnaire as follows:
Express how you relate to the following statements. Use a 1 to 10 point scale, with 10 meaning it describes you completely and 1 meaning it doesn’t describe you at all.A.___ I generate income from my land or own it for
financial investment purposesB.___ I own my land for the enjoyment of the
sceneryC.___ I own my land for the privacy it affordsD.___ I use my land for recreation purposesE.___ I’m not particularly involved with my land
Using the original attitude classification criteria, most respondents were classified into one of the four catego-ries (table 1). However, half (50%) of respondents fell outside of these categories and were not classified using the initial criteria. Class ratings by individual respon-dents were visually inspected to assess the numerical loopholes in the classification scheme. Modified criteria were specified to match as closely as possible to the original classification scheme, but in a way that most of the observations would be sorted into a category (table 1). For example, one modification was made to the Woodland Retreat class so that the scenery and privacy value statements would only have to have values greater than the financial and uninvolved statements, and hence could have equal values with the recreation statement. Another modification was made to relax the Working the Land category criteria to assure that financial was a high value (not necessarily the highest) and to allow more variation in the scenery, privacy, and recreation state-ment levels. The resulting classification scheme neces-sarily included two new categories, one labeled as “low values” where respondents reported no value statement as being greater than a “5”. An “other” category was used to take all of the remaining special cases.
data Analysis
PROC GLM (SAS Institute 2000) was used to assess the effects of the TIME, RESIDENCY, TIME×RESIDENCY, and SFFI on the proportion of adjacent neighbors known (PCTMET) by the woodland owner respondents in this study. Separate hypothesis testing for significant interac-tions and main effects was carried out using LSMEANS and a Bonferoni adjustment to pairwise t-tests. Signifi-cance level cutoff was α=0.05.
Results
Of 1581 questionnaires that were sent out to prospec-tive new and established woodland owners, 798 (47%) were returned. Of these, 384 were good responses and 7 partial responses. The remainder of the returned ques-
tionnaires were bad addresses (25%), explicit refusals (13%), ineligible (no longer owned property; 7%), blanks (implicit refusals; 4%), and deceased (2%). There were 828 noncontacts. The overall survey response rate was 26% (based on AAPOR 2011; response rate RR2). The cooperation rate for the survey was 78% (AAPOR 2011; cooperation rate COOP2).
The classification of woodland owners by tenure TIME was influenced by the cutpoint defining recent from established woodland owners. For example, when the cutpoint of new landownership is only 2 years, the proportion of woodland owner respondents in the “estab-lished” category is 83% (Figure 1). When the cutpoint increases to 5 years, the percentage of established landowners decreases to 58%; at a 10-year cutpoint this percentage is 45%. Woodland owners that drop from the “established” category (i.e., established/established) as the cutpoint increases are reallocated into either the category that describes established woodland owners with new properties (recent/established) or exclusively new property owners (recent/recent). It is important to consider that when using a 10-year cutpoint that new woodland owners (recent/recent) may have purchased a property one year ago and another property ten years ago and hence would have been in the recent/estab-lished category at the 5-year cutpoint.
Under a 5-year cutpoint, the RESIDENCY×TIME term in the model was statistically significant (p=0.009; table 2). The analysis of this interaction indicated two main findings. First, woodland owners who reside on their properties (residents) and who were in the “established/established” category knew on average a higher propor-tion of their adjacent neighbors than the woodland owners who acquired property within the past 5 years (recent/recent categories). The middle category of woodland owners who have an older property and have acquired a more recent property (recent/established) were not significantly different from the other two cate-gories. Secondly, resident established owners knew a higher proportion of their neighbors than do absentee owners (Figure 2). SFFI was not a significant predictor of PCTMET in this analysis.
The RESIDENCY×TIME interaction term in the model was not statistically significant in the model using a 10-year cutpoint for TIME. Both RESIDENCY and TIME were significant main effects (p=0.016 and p=0.014, respectively; table 2). For both residents and absentee landowners, established owners knew a higher propor-tion of the adjacent neighbors (79%) than did more recent owners (67%). The middle category (72% of neighbors known) was again not significantly different than the other two. The RESIDENCY main effect indi-cates that residents know a higher proportion of neigh-bors than did absentee woodland owners; these two categories differed by 10 percentage points with resi-dents knowing an average of 78% of their neighbors.
98 | IUFRO 3.08.00 Small-Scale Forestry
do you know your neighbors? Results of a cross-boundary survey in West Virginia, USA
As for the sharing of resources, a secondary objec-tive of this paper, sixty percent of the respondents indi-cated that they had shared at least one resource with one or more of their adjacent neighbors who “shared a boundary” with them. Road access to properties was the most frequently cited resource shared among adjacent woodland owners; 66% of those who shared resources checked this resource as one they shared (Figure 4). Costs for road repairs was the least commonly checked (16%). Just over a third of woodland owners sharing resources indicated they shared information with neigh-bors. Others shared equipment (28%), work on fencing (27%), and tools (25%). Most (53%) woodland owners sharing resources listed only one resource that they shared with an adjacent neighbor. Of these individuals, 59% shared road access, 18% shared only informa-tion, and 11% shared work on fencing. Other singly listed shared resources were less than 6%. Forty-seven percent of the respondents who shared resources share multiple resources.
Discussion
Cross boundary cooperation has been broadly defined as “voluntary behavior whereby one or more landowners account for the plans and practices on adjacent and/or nearby properties” (Rickenbach et al. 2011). We carried out this study under the assumption that adjacent neigh-bors are under more constrained relations than “nearby” neighbors as joint boundary ownerships have proximate legal implications. So definitions of “neighbor” as used in this paper are only describing two woodland owners with joint boundaries.
Many efforts have been made recently to explore attri-butes of woodland owners that might help facilitate land-scape scale management (see Rickenback et al. 2011). Among these works are those that explore behavioral or motivational differences between established and recent landowners use various definitions for recent versus established (Kendra and Hull 2005; Rickenbach and Kittredge 2008).
This study corroborates the importance of tenure TIME as a factor that can help to explain woodland owner attri-butes as it was found to be related to the percentage of adjacent neighbors known. Rickenbach and Kittredge (2008) found that the interaction between tenure time and distance from property explained a statistically signif-icant amount of variation in the number of neighbors that New England woodland owners respondents “reported personally knowing.” While the dependent variable used in this study varied slightly (PCTMET=percentage of adjacent neighbors that respondents have met), the results were somewhat similar. For the 5-year cutpoint, we also found a significant interaction between our distant (residence vs. nonresidence) and TIME variable. However, when using the 10-year cutpoint this interac-tion was not significant.
In the investigation of tenure TIME, we also brought forth the idea that there may be an intermediate category of landowners. This intermediate category includes those landowners who have owned property in the past and would qualify as an established owner, but who have also acquired a property more recently. The impor-tance of this category is seen in the fact that in certain cases where the established landowners differ from the newer landowners, but this intermediate category differs from neither. It is conceivable that this middle category has a higher degree of variation with certain attributes more closely related to those of long-term owners (e.g., desires to maintain the family heritage) and some more closely related to new owners (like interest in education, cost-share, and other support programs).
ReferencesAAPOR. 2011. Standard definitions: Final dispositions of case
codes and outcome rates for surveys. American Association for Public Opinion Research, 7th edition. Accessed July 4, 2012 at: http://www.aapor.org/Standard_Definitions2.htm.
Blinn, C.R., P.J. Jakes, and M. Sakai. 2007. Forest landowner cooperatives in the United States: A local focus for engaging landowners. J. For. 105(5): 245-251.
Brunson, M. W. 1998. Social dimensions of boundaries: Balancing cooperation and self-interest. In R.L. Knight and P.B. Landres (eds.), Stewardship Across Boundaries, Island Press, Washington, d.C. 371 p.
Karpinnen, H. 2012. New forest owners and owners-to-be: apples and oranges? Small Scale Forestry 11:15-26.
Meindinger, E.E. 1998. Laws and institutions in cross-boundary stewardship. In R.L. Knight and P.B. Landres (eds.), Stew-ardship Across Boundaries, Island Press, Washington, d.C. 371 p.
Percival, W.C. 1942. Cooperative woodland management and marketing—An essential part of a complete land-use program. J. For. 40(12):944-947.
Rickenbach, M. and d.B. Kittredge. 2008. Time and distance: Comparing motivations among forest owners in New England, USA. Small Scale Forestry 8(1):95-108.
Rickenbach, M., L.A. Schulte, d.B. Kittredge, W.G. Labich, and d.J. Shinneman. 2011. Cross-boundary coopera-tion: A mechanism for sustaining ecosystem services from private lands. Journal of Soil and Water Conservation 66(4): 91A-96A.
Schulte, L.A., M. Rickenbach, and L.C. Merrick. 2008. Ecolog-ical and economic benefits of cross-boundary coordina-tion among private forest owners. Landscape Ecol 23: 481-496.
Zeuli, K. 2006. What is a cooperative? P. 13-20 in Proc. of conf on forestry cooperatives: What today’s resource profes-sionals need to know, Jakes, P.J. (comp.). US For. Serv. Gen. Tech. Rep. NC-GTR-266. North Central For. Exp. Stn., St. Paul, MN.
2012 Conference Proceedings | 99
Introduction
As in many parts of Canada, forests are a significant feature of the Maritimes landscape. However, in this region a portion of these forests belongs to small private forest owners. In the province of New Brunswick, this group owns roughly a third of the province’s forests (1.7 millions ha) and their stewardship and management practices are likely to have a significant impacts on the provision of forest goods and services. Over the last 25 years there has been much debate over forest manage-ment in New Brunswick, but little attention has been paid to private forests (Floyd and al. 2012). A decade ago the auditor general questioned the sustainability of forest management of private forests and highlighted a need to learn more about their management (Auditor General, 2000).
More recently, as the forest industry of New Brunswick struggles with an economic downturn; the provincial government mandated a Task Force to look at the contri-bution of the private forest to the forest sector. To inform the work of this group, we conducted a mail survey among owners of non-industrial forest to elicit their values, aspirations, practices and attitudes regarding their private forests. The survey contained over 40 ques-tions that combined the interest and concerns of the Task Force, the New Brunswick Department of Natural Resources, and the authors of this report. Collectively, we were interested in a wide range of topics including; forest owners’ stewardship ethic and values toward their forest, forest use and harvesting history and inten-tions, willingness to collaborate with other owners on conservation or fiber management, other management activities, and attitudes toward property rights among other things. This paper will highlight key results from that survey.
Insights from the Literature
There is a rich literature on forest owners aiming at providing information on their ownership and manage-ment motivations as well as their behavior in order to inform public policy. These studies, conducted in different regions of the world reveal a broad diversity among forest owners regarding their motivations for owning a forest, or their use of these forests (Ingemarson and al., 2006; Hodgdon et al., 2011; Urquhart and Courtney 2011). The diversified profile of forest owners have also been correlated with the size of their forest holdings: owners of larger forest holdings being more likely to be engaged in commercial timber production (Butler 2008) and with use of public programs (Hogdon et al., 2011; Nadeau and al. 2005.).
These observations, as well as our previous work on survey of forest owners (Nadeau and al 2005, Nadeau 2001) were very helpful in responding to the fast pace set up by policy requirement for this study.
Method
An important challenge in any survey project is to build or obtain access to a reliable database from which to select a sample. In New Brunswick, the provincial government maintains a property database that contains information about properties and their owners. For this survey, we were interested in selecting a random sample that would be stratified according to size of ownership. Through a partnership with the provincial Department of Natural Resources (DNR) we were able to contribute to the development of a database of forest properties that could then be used to select a stratified sample of owners of non-industrial forests.
To be considered an “owner of non-industrial forests” the owner had to own at least 5 ha but less than 100 000ha (total of all forest parcels), the forest must not be located
Informing Forest Policy With a Snapshot of New Brunswick Non-Industrial Forest Owner’s Attitudes, Behavior, Stewardship, and Future ProspectsSolange Nadeau1 and Thomas M. Beckley2
1 Natural Resources Canada, Canadian Forest Service, PO Box 4000, Fredericton, NB. Canada, E3B 2L9, [email protected]
2 University of New Brunswick, P.O. Box 4400, Fredericton, NB, Canada, E3B 5A3 [email protected]
Keywords: private forest, motivations, attitudes, forest management, Canada
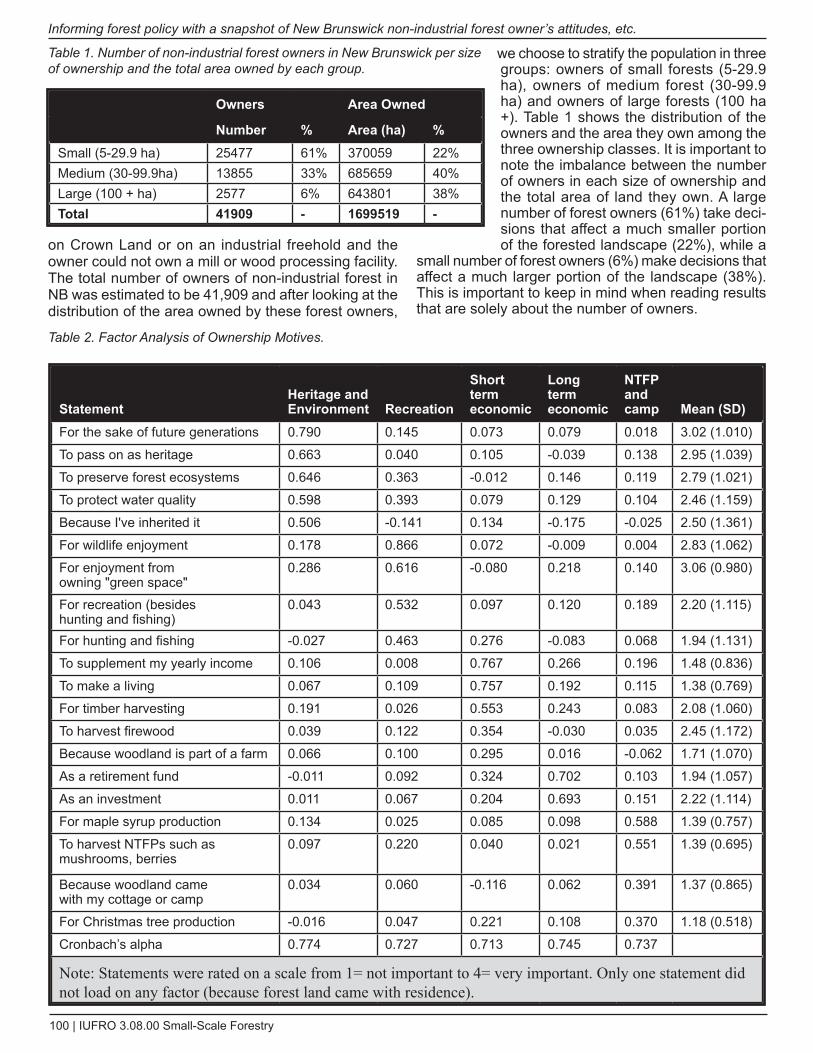
100 | IUFRO 3.08.00 Small-Scale Forestry
Informing forest policy with a snapshot of New Brunswick non-industrial forest owner’s attitudes, etc.
on Crown Land or on an industrial freehold and the owner could not own a mill or wood processing facility. The total number of owners of non-industrial forest in NB was estimated to be 41,909 and after looking at the distribution of the area owned by these forest owners,
we choose to stratify the population in three groups: owners of small forests (5-29.9 ha), owners of medium forest (30-99.9 ha) and owners of large forests (100 ha +). Table 1 shows the distribution of the owners and the area they own among the three ownership classes. It is important to note the imbalance between the number of owners in each size of ownership and the total area of land they own. A large number of forest owners (61%) take deci-sions that affect a much smaller portion of the forested landscape (22%), while a
small number of forest owners (6%) make decisions that affect a much larger portion of the landscape (38%). This is important to keep in mind when reading results that are solely about the number of owners.
Owners Area Owned
Number % Area (ha) %Small (5-29.9 ha) 25477 61% 370059 22%Medium (30-99.9ha) 13855 33% 685659 40%Large (100 + ha) 2577 6% 643801 38%Total 41909 - 1699519 -
Table 1. Number of non-industrial forest owners in New Brunswick per size of ownership and the total area owned by each group.
StatementHeritage and Environment Recreation
Short term economic
Long term economic
NTFP and camp Mean (SD)
For the sake of future generations 0.790 0.145 0.073 0.079 0.018 3.02 (1.010)
To pass on as heritage 0.663 0.040 0.105 -0.039 0.138 2.95 (1.039)
To preserve forest ecosystems 0.646 0.363 -0.012 0.146 0.119 2.79 (1.021)
To protect water quality 0.598 0.393 0.079 0.129 0.104 2.46 (1.159)
Because I've inherited it 0.506 -0.141 0.134 -0.175 -0.025 2.50 (1.361)
For wildlife enjoyment 0.178 0.866 0.072 -0.009 0.004 2.83 (1.062)
For enjoyment from owning "green space"
0.286 0.616 -0.080 0.218 0.140 3.06 (0.980)
For recreation (besides hunting and fishing)
0.043 0.532 0.097 0.120 0.189 2.20 (1.115)
For hunting and fishing -0.027 0.463 0.276 -0.083 0.068 1.94 (1.131)
To supplement my yearly income 0.106 0.008 0.767 0.266 0.196 1.48 (0.836)
To make a living 0.067 0.109 0.757 0.192 0.115 1.38 (0.769)
For timber harvesting 0.191 0.026 0.553 0.243 0.083 2.08 (1.060)
To harvest firewood 0.039 0.122 0.354 -0.030 0.035 2.45 (1.172)
Because woodland is part of a farm 0.066 0.100 0.295 0.016 -0.062 1.71 (1.070)
As a retirement fund -0.011 0.092 0.324 0.702 0.103 1.94 (1.057)
As an investment 0.011 0.067 0.204 0.693 0.151 2.22 (1.114)
For maple syrup production 0.134 0.025 0.085 0.098 0.588 1.39 (0.757)
To harvest NTFPs such as mushrooms, berries
0.097 0.220 0.040 0.021 0.551 1.39 (0.695)
Because woodland came with my cottage or camp
0.034 0.060 -0.116 0.062 0.391 1.37 (0.865)
For Christmas tree production -0.016 0.047 0.221 0.108 0.370 1.18 (0.518)
Cronbach’s alpha 0.774 0.727 0.713 0.745 0.737
Note: Statements were rated on a scale from 1= not important to 4= very important. Only one statement did not load on any factor (because forest land came with residence).
Table 2. Factor Analysis of Ownership Motives.
2012 Conference Proceedings | 101
Nadeau and Beckley
Mail surveys were delivered to 2060 owners of non-industrial forest. Ten days after the first mail out, a post card reminder was sent to all participants. About a month after the first survey mail out, a second questionnaire was mailed to people who had not returned one. The budget did not allow us to send a survey in each official language to every home, but to diminish the likelihood that language could be a barrier in taking part in the study; we used information from Statistics Canada to identified, based on postal codes, the predominant language in each region of the province. We also sent a cover letter in English and French with a question-naire in the most common language in the area. Some people used the contact information provided to request a questionnaire in a different language. A total of 728 participants (35%) returned a questionnaire despite interruption of mail service due to a work stoppage just as our survey was put in the mail. The response rate among owners of small forests was lower (28%) than the response rate of owners of medium (39%) or large forests (38%). Since we used a stratified sample that had unequal sampling rates for each type of ownerships, weights were used in the statistical analysis. Details on the questionnaire and sampling can be found in Nadeau and al. 2012.
who Are the Owners of Non-Industrial Forests and what Type of Land do They Own?
Since this was the first reliable baseline data created for New Brunswick forest landowners, it was important to obtain profile data. Given varying levels of interest in forest management, our respondents do not likely perfectly represent the population of owners. For example, a large majority of participants are men (82%) and 93% are at least 45 years old1.
1 For detailed results on frequency distribution please see Nadeau and al. 2012 (http://www2.gnb.ca/content/dam/gnb/departments/nr-rn/pdf/en/CrownLandsForests/2011SnapshotOfNB-NonIndustrialForestOwners.pdf)
Most of the participants grew up in a rural area (78%) and have spent most of their lives in a rural area (65%). Many, though not a majority (40%), live on their forested land whereas another 33% live within 25 km from their closest forest parcel. There are 12% of the owners who reside outside NB.
With respect to work status, 43% of survey respondents are retired, 38 % work full time and 12% work part-time. The sub-group of owners of small forest holdings significantly more likely to work full-time, have a higher income than other owners and have a smaller proportion of household income coming from their forest land. The forest land contributes to none of the income for 89% of owners of small forest compared to 42% of owners of large forests.
A majority of participants (60%) own a single parcel of forest land, and this is more likely to be the case for owners of small forests (74%) than for owners of medium (44%) or large forests (12%). Thirty-six percent of owners of large forest holdings own more than 6 parcels, while only 3% of owners of medium and 1% of owners of small forests own that many parcels.
It is not surprising to see that the duration of ownership is positively correlated with size of ownership. However, when looking at the relationship between length of ownership and age of the owners, we notice that in the last 10 years, owners aged between 45 and 54 were the most active in obtaining forest land. Thus the “new generation” of forest owners, is not that young and as baby boomer are retiring, there is no reason to believe that this trend will change in the near future. The most common ways for participants to obtain some of their forest land is by buying it (60%), and through inheritance (40%). Owners of large forest being more likely to have bought and inherited some of their forest land compare to other owners. Most of the owners have obtained some or all of their forest land from family members (61%). Whether owners obtain their land through inheritance or through purchase, the 45 to 54 age range seems a reasonable age where parents might pass away or
Ownership motive
Size of ownership
TotalSmall Medium LargeHeritage and environment
2.66a (0.85) 2.74a(0.78) 2.64a (0.78) 2.68a (0.82)
Recreation 2.45a (0.78) 2.58b (0.81) 2.44ab (0.90) 2.49 (0.80)Short term economic 1.60a (0.54) 1.98b (0.72) 2.27c (0.79) 1.76 (0.66)Long term economic 1.94a (0.95) 2.16b (0.95) 2.51c (1.00) 2.05 (0.96)NTFP and camp 1.31a (0.46) 1.31a (0.45) 1.31a (0.41) 1.31a (0.45)Note: Rated on a scale from 1= not important to 4= very important. Means that do not share a letter are significantly different (p≤0.05) according to Tukey-Kramer multiple comparison test.
Table 3.Means (Sd) of the importance of ownership motives by size of ownership.
102 | IUFRO 3.08.00 Small-Scale Forestry
Informing forest policy with a snapshot of New Brunswick non-industrial forest owner’s attitudes, etc.
individuals would have an opportunity to obtain enough capital to purchase land. Young woodlot owners (45 and below) are rare.
There do appear to be fairly long family legacies amongst a significant segment of owners. About a quarter of those who have inherited forest land (26%) have had this land in their family for more than a 100 years. This propor-tion grows from 24% for owners of small forests to 37% to owners of large forests.
Only 17% of participants have sold or given away any forest land. Once again there are significant differences according to size of ownership: 15% among owners of small forests, 37% among owners of large forests. Those who have sold land have mostly done so to family (38%) and/or private citizens (33%).
what Motivations Are Behind Ownership and Management Decisions?
Participants were asked to rate the importance of various motivation for their choice to own forest land. A factor analysis helped identify major groupings among these elements. The most important factor for all the owners, no matter the size of their forest land, is related to heritage and environmental values associated to the forest land. The second most important factor, once again without any significant differences between the sizes of forest ownership, is related to recreational uses. The third factor is related to short-term economic gain and its importance increases with the size of ownership. A similar trend is observed for the fourth factor which relates to long-term economic gain. The fifth and last factor related to the use of non-timber forest products and having a camp on the forest land is the least impor-tant factor for owners of each group, with no significant differences between groups.
Owners of larger forests attach more importance to a greater number of factors, and thus appear to have a more complex set of motivations. This might be because with larger forest base they can “allocate” different part of their forest estate to different uses and still meet objec-tives that might be conflicting (i.e. timber harvesting, recreation).
Aside from eliciting information on motivation for owner-ship, the study also addressed the motivations that underlie stewardship decisions. Responsibility towards their family when making decision about their forest land is rated high by almost three quarter of the partici-pants (73%). Responsibility towards the land is rated as high by about two thirds of the participants (67%), while responsibility towards the watershed of which their land is a part is rated as important by half of the respondents (52%).
what Are Owners’s Attitudes Towards Stewardship, Timber Supply, and Conservation
When assessing the stewardship of their peers, about a third of survey participants had a positive attitude and believed that forest owners in NB were good stewards of their forest (36%) although fewer agreed that forest owners knew how to look after their forests (15%).
A majority of participants (53%) voiced concerns about the level of timber harvesting taking place in the province. About a quarter of participants (27%) believe that there is enough wood in NB for all users while about the same proportion (26%) disagree with that statement. A similar pattern is observed regarding the sustainability of timber supply from private land: 26% agreed that there will be little harvestable wood on private forest land in the next 10 to 20 years, while 27% disagreed with this state-ment.
A majority of participants believe that more effort should be invested in the protection of rare plants and animals (67%) and old growth forests (61%), and also that government should provide incentives to forest owners to establish protected areas (54%). Despite a strong level of support for conservation, a fair proportion of participants also voiced strong concerns about require-ments for protected areas and endangered species.
With such a high level of interest for conservation, it is not surprising that about a third of participants (34%) answered they were likely to participate in a volun-tary program that made them eligible for grants. Still, a stronger proportion of survey participants (40%) said they were unlikely to take part in such conservation program.
How Involved Are Private Owners in Forest Management Activities?
Only 13% of respondents are using or developing a formal (written) forest management plan for their forests. This proportion goes from 8% among owners of small forests to 38% among owners of large forests. About a fourth of participants in each of our three groups are interested in developing such a plan. This stated inten-tion aligns with the fact that a third of the participants said they would be likely to have a management plan and carry out its recommendations if it allows them to participate in property tax reduction programs.
Timber Harvesting: Past Activities and Intentions
A third of participants have removed or harvested timber every year in the 10 years preceding the survey, while another third has done so at least once during that period. These proportions increase with size of owner-
2012 Conference Proceedings | 103
Nadeau and Beckley
ship. 16% of participants have never harvested timber and this proportion decreases from 20% among owners of small forests to 3% among owners of large forests.
As for participants’ intention to harvest in the future, a majority (54%) intend to harvest in the 10 year period following the survey, while another 29% intend to harvest later than that time period. An additional 9% have no intention of ever harvesting timber from their forests.
Motivations for Harvesting Timber and for Not Harvesting
Among those who have harvested timber in the 10 years preceding the survey, the five most popular motives were because the trees were mature (68%), to improve quality of remaining trees (67%), the need for wood for personal use (64%), to remove trees damaged by natural catastrophe (55%), and to achieve objectives in management plans (34%). Among the other motivations listed in the survey but that were less popular, the ones related to economic factors and to finding trustworthy harvesting crews tended to be much more important for owners of larger forests.
Harvesting firewood is by far the most common harvesting activity by those who have harvested in the 10 years preceding the survey, 82% having produced it for their personal use and 11% having sold some. The product most commonly sold by the forest owners were sawlogs (37%) and pulpwood (35%). Owners of large forest holdings were much more involved in selling these products as about two thirds have sold some at some point in the 10 years preceding the survey.
The most common reasons for abstaining from harvesting by those that did not harvest timber in the 10 years preceding the survey were: the trees were not large enough to harvest (47%), there was no financial need to harvest (46%), cutting trees could damage the land, the soil or remaining trees (38%), owners was too busy with other activities (37%) and prices were too low (23%).
Types of Forest Management Activities Undertaken
During the 10 years preceding the survey, a majority of owners (57%) undertook at least one management activity aside from timber harvesting. The most popular ones were building and maintaining roads (37%), thinning or spacing young stands (33%), and surveying or upgrading boundaries (28%). Aside from these activi-ties, planting trees and preparing sites for plantations also appear to be popular activities among owners of large forests with respectively 42% and 30% of them having undertaken these.
The patterns of answers observed regarding the forest management activities conducted in the ten years preceding the survey are quite similar to the patterns of answers observed regarding forest management activi-ties planned in the ten years following the survey. There is, however less differences according to size of owner-ship for future management activities.
Constraint in Making decisions About Forest Management
We were interested to learn about forest owners self-reported constraints for why they do not undertake more management activities in their forests. A lack of time is by far the factor rated as having moderate to high influ-ence on the forest management by the largest group of forest owners (58%), it is followed by lack of equipment (38%), lack of money (34%) and lack of knowledge of markets and opportunities (27%).
Attitudes Toward Ownership Rights and Potential Collaboration
Participants express mixed views regarding ownership rights and the need to balance these with society’s views and the provision of public goods from private forests. Forty one percent agree that society should not have any control over what the owners do with privately owned forest. However, 49% agree that forest owner-ship doesn’t give the owners to do whatever they want with it, thus recognizing limits to the right of owners.
Establishing boundaries on ownership rights through regulatory frameworks also met with mixed feelings. A majority of participants agrees that provincial govern-ment should not regulate private woodland harvesting and 45% express their disagreement with the suggestion that legislation should be enacted requiring woodland owners to adhere to best forest management practices on their own land. Owners of large forests were more likely to support strong, private ownership rights and less likely to endorse the need for intervention from society or from government.
Slightly more than a quarter of participants would be likely to accept government funding to conduct forest management activities even if it meant that they would have to harvest the trees once they are mature. A lower proportion of participants (16%) are likely to accept forest management services from a forest product company in return for sale of wood to them. In both cases, owners of large forests were more likely to take part in these types of partnerships. Not surprising given that they are already much more active in the marketplace for fiber.
The sovereignty of individual owners to make their own decisions was evident in the fairly low level of interest in jointly managing forest land. A small number are likely to
104 | IUFRO 3.08.00 Small-Scale Forestry
Informing forest policy with a snapshot of New Brunswick non-industrial forest owner’s attitudes, etc.
become a member of a group of forest owners in their area to jointly manage forests for habitat, recreation and water quality (19%), or a group that would manage for logs, pulp, chips, and biomass (14%).
Conclusions
While there has been interest in obtaining baseline data on forest owners in New Brunswick for over a decade, the political will to actually conduct a study that would provide a profile of all forest owners and their manage-ment behavior only emerged in 2011. Unfortunately, a previous study commissioned in 1981 did not follow a method that yielded reliable data so the present study is the first accurate picture of forest land owners for the province. New Brunswick is unique in several dimen-sions. No other jurisdiction in eastern North America has half its land held in private hands and half held in public trust (known as Crown land in NB, with responsibility for its management falling to the provincial government). As well, issues that seem to be increasingly common in other jurisdictions in North America, such as parceliza-tion, may be less prevalent in New Brunswick. Esti-mates for the number of forest owners have consis-tently been in the 40,000 range for the past decade (Neave and Wolthausen 2004, Dansereau and de Marsh 2003). In collaboration with the Department of Natural Resources, we estimate the current number to be slightly under 42,000, so there has been little change thus little evidence of parcelization over the course of the last decade.
Given the tendency toward more urban and absentee forest owners in other nearby jurisdictions in the United States (Rickenbach and Kittridge 2009), it is interesting to note the high number of forest owners in New Bruns-wick that continue to produce fiber products. At the same time, very few forest owners there are reliant upon income from fiber production. This paints a picture of forest owners harvesting regularly, but most likely for their own use (firewood).
New Brunswick is similar to other jurisdictions in eastern North America in the aging demographics of its forest land owners.
Forest owners that answered our survey expressed a high concern for heritage values as well as for envi-ronmental quality and the ecological integrity of their own and others’ private forests. In this, they resemble the long term commitment that Daniels and al. (2010) observed in their study. Also, similarly to Daniels and al. study participants, our survey respondents also appear to be confident in private owners’ ability to self-regulate and appear somewhat averse to government involvement and regulatory oversight. There was little appetite among our respondents for greater restric-tions on private property rights to ensure the delivery of public goods such as clean water, habitat or visual
quality. Similarly, there was little appetite to work with neighboring landowners to maintain or enhance such public goods. The flip side of regulations is incentive and our survey respondents were much more favor-able about government involvement that entails subsi-dizing management efforts. Nevertheless, traditions of independence with respect to private property remain strong in New Brunswick.
Acknowledgement
The author would like to acknowledge the dedication of Monica McKendy and Harry Keess who worked as research assistants on this project, as well as the support of the member of the NB Private Forest Task Force, and of the New Brunswick department of Natural Resources.
References
Auditor General. 2000. Chapter 6: department of Natural Resources and Energy: Private Forest Lands. in Auditor General’s Report. Government of New Brunswick, Freder-icton, NB. Canada
Butler, B.J. 2008. Family Forest Owners of the United States, 2006. Gen. Tech. Rep. NRS-27. U.S. department of Agri-culture, Forest Service, Northern Research Station, Newton Square, PA.
daniels, S.E., Kilgore, M.A., Jacobson, M.G., Greene, J.L. and T.J. Straka. 2010. Examining the compatibility between forest incentive programs in the US and the practice of sustainable forest management. Forests, 1:49-64.
dansereau, J. P. and P. deMarsh. 2003. A portrait of Canadian woodlot owners in 2003. Forestry Chronicle. 79(4):774-778.
Floyd, d., Ritchie, R. and T. Rotherham. 2012. New approaches for private woodlots: reframing the forest policy debate. Private Forest Task Force Report, New Brunswick depart-ment of Natural Resources. Fredericton, NB. Canada. 49 p.
Hodgdon, B., Cusack, C., Smith S., and M. Tyrrell. 2011. An annotated bibliography of the literature on family forest owners. Compiled for the Sustaining Family Forests Initia-tive, Update March 2011. GISF Research Paper 002-R. Global Institute of Sustainable Forestry, School of Forestry and Environmental Studies, Yale University. New Haven, CT.
Ingemarson, F., Lindhagen A., and L. Eriksson. 2006. A typology of small-scale private forest owners in Sweden. Scandinavian Journal of Forest Research. 21:249-259.
Nadeau, S. 2011. Prince Edward Island woodlot owners: current trends regarding their forest uses, management, and values. Information Report M-X-225E. Natural Resources Canada, Canadian Forest Service - Atlantic Forestry Centre, Fredericton, NB.
2012 Conference Proceedings | 105
Nadeau and Beckley
Nadeau, S. 2001. Forest owners and their forests: snapshot of the situation in some Quebec regions. Report prepared on behalf of the Fédération des producteurs de bois du Québec, Regroupement des Sociétés d’aménagement forestier du Québec, Ministère des ressources naturelles du Québec, Société de la Faune et des Parcs du Québec, Fondation de la Faune du Québec.
Nadeau, S., Beckley T., McKendy, M. and H. Keess (2012). A snapshot of New Brunswick Non-Industrial Forest Owners in 2011: Attitudes, Behaviour, Stewardship and Future Pros-pects. Appendix A, Private Forest Task Force. Government of New Brunswick, Fredericton, NB, Canada. Available from http://www2.gnb.ca/content/dam/gnb/departments/nr-rn/pdf/en/CrownLandsForests/2011SnapshotOfNB-NonIndus-trialForestOwners.pdf (Accessed 10 July 2012).
Nadeau, S., Beckley, T.M., and Short, R. 2005. The woodlot owners of Prince Edward Island: a survey of their forest use, management, and values. Information Report M-X-218E. Natural Resources Canada, Canadian Forest Service - Atlantic Forestry Centre, Fredericton, NB.
Neave, E. and d. Wolthausen. 2004. Private woodland owners: Meeting the stewardship challenge. Ottawa, ON, Canada. Natural Resources Canada.
Rickenbach, M. and d. B. Kittridge. 2009. Time and distance: Comparing Motivations Among Forest Landowners in New England, USA. Small-scale Forestry. Volume 8:95–108.
Urquhart, J., and Courtney, P. 2011. Seeing the owner behind the trees: a typology of small-scale private woodlot owners in England. Forest Policy and Economics 13: 535–544.
106 | IUFRO 3.08.00 Small-Scale Forestry
Introduction
Woody biomass may be defined as “the trees and woody plants, including limbs, tops, needles, leaves, and other woody parts, grown in a forest, woodland, or rangeland environment, that are the by-products of forest manage-ment” (USDA Forest Service 2008). Woody biomass is an abundant and locally available renewable energy resource and biofuel generation from biomass is seen as a way to decrease carbon emissions, reduce dependence on and importation of coal and liquid natural gas and create new markets for an otherwise disposal problem for farmers and forest landowners (Bartuska 2010). In recognition of the potential to displace fossil fuels with a renewable, reliable and domestically produced fuel along with the environmental and economic benefits associated with its use, the United States (U.S.) has set a goal for transportation fuels to contain 36 billion gallons of renewable fuels including at least 16 billion gallons of cellulosic biofuels such as woody biomass by 2022 (P.L. 110-140; EPA, 2010). Currently biomass used for biofuel is largely sourced from agricultural feedstock but with a goal to achieve energy security, the continued use of food for ethanol may conflict with food supplies (Skipper
et al. 2009). The combination of agricultural feedstocks with woody biomass can significantly increase supplies (Becker et al. 2010) to help meet national goals.
Forests cover about 33% or 751 million acres of land in the United States where about 56% of this total are under private ownership but most of this, about two-thirds accounting for nearly 40% of all forestlands or 285 million acres are owned by non-industrial private forest (NIPF) landowners (Butler 2008; Smith et al. 2009). There are 52.2 million acres of forest land in the U.S. Great Lakes of Michigan, Minnesota and Wisconsin combined and 30.3 million acres or 58% of this total are privately owned. Non-industrial private forests account for 27.9 million acres which equates to 92% of all private forest lands in the region (Butler 2008). The extent of forest ownership by NIPF land-owners indicates a necessity for understanding these landowners in order to capture a realistic estimation of biomass supplies to support a bioenergy market. While physical estimates on woody biomass can be derived from the United States Forest Service resource inventory (Goerndt et al. 2012), availability is constrained by the social factors that need to be considered when evalu-ating the supply side of this resource. This study serves
The Availability of Woody Biomass for Energy: A Social Perspective from Non-Industrial Private Forest landowners in the U.S. Great lakes RegionLana L. Narine1 and Francisco X. Aguilar1
1 University of Missouri, 203 Anheuser-Busch Natural Resources Bldg. Columbia MO 65211Keywords: Woody biomass, social availability, non-industrial private forest landowners, bioenergy, Great Lakes
Abstract
While there is expected to be significant growth in demand for woody biomass for energy in the U.S. Great Lakes, the supply side needs to be comprehensively examined for the social availability of the resource since social factors affect the volume that can be realistically harvested. Nearly 60% of forestland in the region is owned by private forestland owners and non-industrial private forest landowners (NIPF) represent 92% of this total. Rendering the decision to supply from this ownership group is crucial for determining feedstock availability. A mail survey following the Tailored Design Method was sent to 4190 NIPF landowners from Michigan, Minnesota and Wisconsin in order to determine the factors that influence their willingness-to-harvest woody biomass for energy. Analyses of responses from this survey indicated that membership in an environmental or forest organization and having a forest management plan significantly increased the odds of harvesting woody biomass while owning woodlands for aesthetics greatly decrease those odds. Securing potential biomass feedstock supplies must entail effective education and outreach programs to not only promote awareness of the utilization of woody biomass for bioen-ergy but also to encourage active management of woodlands.
2012 Conference Proceedings | 107
Narine and Aguilar
to evaluate the social availability of woody biomass in the U.S. Great Lakes by determining the factors that affect NIPF landowners’ willingness-to-harvest (WTH) woody biomass for bioenergy. The aim of this study will be to portray a more holistic representation of the availability of woody biomass from potentially crucial sources in the Great Lakes and exhibit the necessity for an evalu-ation of social factors for proposing a viable bioenergy market from woody biomass in the region. Preliminary findings will be presented and analyzed for the purpose of this study.
Theoretical Framework
Factors affecting NIPF landowners’ WTH timber have been extensively studied over the years, (Kurtz and Lewis 1981; Young and Reichenbach 1987; Amacher et al. 2003; Vokoun et al. 2005) but with recent interest in woody biomass usage for energy production, social availability studies on woody biomass have become crucial for predicting supplies. The harvest of woody biomass must be done in conjunction with a timber harvest as this activity will not be economically feasible if done alone (Ashton et al., 2007) and by-products of a timber harvest can be used as woody biomass feed-stock. It is therefore crucial to incorporate the same factors previously found to affect timber harvesting as potential factors that may affect biomass harvesting decisions. Landowners’ decision to engage in forest management activities such as biomass harvesting is a reflection of their ownership objectives, motivations and constraints (Kurtz and Lewis, 1981). Specific factors that have been found to affect landowners’ decisions to harvest timber include stumpage price, technical assis-tance, ownership objectives and demographics like age, income and education (Young and Reichenbach 1987; Amacher et al. 2003). Kurtz and Lewis (1981) found that a lack of previous timber harvesting experi-ence, low timber prices, absence of incentives, physical resource availability and lack of technical assistance constrained participation in forest management. Other factors such as land tenureship, has been shown to positively correlate with timber harvesting intensity and landowners who have owned their land for a longer time (ten years or more) have been found to be more involved in active forest management versus new landowners (less than ten years) (Vokoun et al. 2005; Butler 2007). A study of NIPF landowners’ WTH woody biomass for bioenergy in Arkansas, Florida and Virginia revealed similar findings with timber studies where an increase in acreage owned was positively associated with an increase in landowners’ willingness to supply biomass (Joshi and Mehmood 2011). However, another study of NIPF landowners in Mississippi found that an increase in ownership size was associated with a decrease in WTH woody biomass since these landowners were more interested in timber production (Gruchy et al. 2011). The effect of acreage must be analyzed to determine their impact on landowners’ decisions from the Great Lakes
as results evidently vary across regions. Demographics like landowners’ age and education influence owner-ship objectives since older landowners are more likely to transfer or bequeath their forestland in the near future and would be less interested in harvesting their forest (Butler and Leatherberry 2004). Consequently, older landowners were found to be less likely to engage in both timber and woody biomass harvesting (Becker et al. 2010; Joshi and Mehmood 2011; Gruchy et al. 2011). Unlike age, education positively influenced decisions to harvest woody biomass in the southern U.S. and Minne-sota (Becker et al. 2010; Joshi and Mehmood 2011; Gruchy et al. 2011). According to a study of Minnesota forest landowners by Becker et al. (2010), those who were more likely to harvest biomass were landowners who chose the highest price offers for harvesting. Signifi-cant negative influences on WTH were indicated by land-owners who did not believe that woody biomass could improve U.S. energy independence and absentee land-owners who did not reside on their woodlands (Becker et al. 2010).
Since landowners’ decisions will be based on those factors that maximize utility, the utility model can be summarized as: Ui = f (L,LO, E) + ε, where Ui is the utility received by the ith landowner from harvesting (or not) woody biomass, L is a vector of land characteristics of forest owned by the landowner, LO is representative of all the landowner attributes, E stands for external factors and ε is a random error term. L consists of woodland acres owned, volume of sawtimber, and road accessi-bility; LO, residence on woodland, tenureship, support for bioenergy from woody biomass, reasons for forest ownership, future plans to sell timber and demographics (age, income and education); E encompasses timber price, biomass price and public programs involvement (Table 1).
Methods
data
A survey developed by Daniel et al. (unpublished) for Missouri NIPF landowners was used as an initial template for the development of questionnaires for the study area consisting of Michigan, Minnesota and Wisconsin. This instrument served to gather information on landowners’ views towards the harvesting of woody biomass for bioenergy and potential constraints to supply as well as landowners’ price preferences for carrying out a harvest. Following research of the region’s timber markets and resource inventory, reviews from each of the three states’ Department of Natural Resources (DNR) and forestry faculty members from University of Missouri, University of Minnesota and University of Wisconsin, a survey instrument was developed and pretested among a sample of forest landowners from the study area via mail. The final survey instrument was divided into five
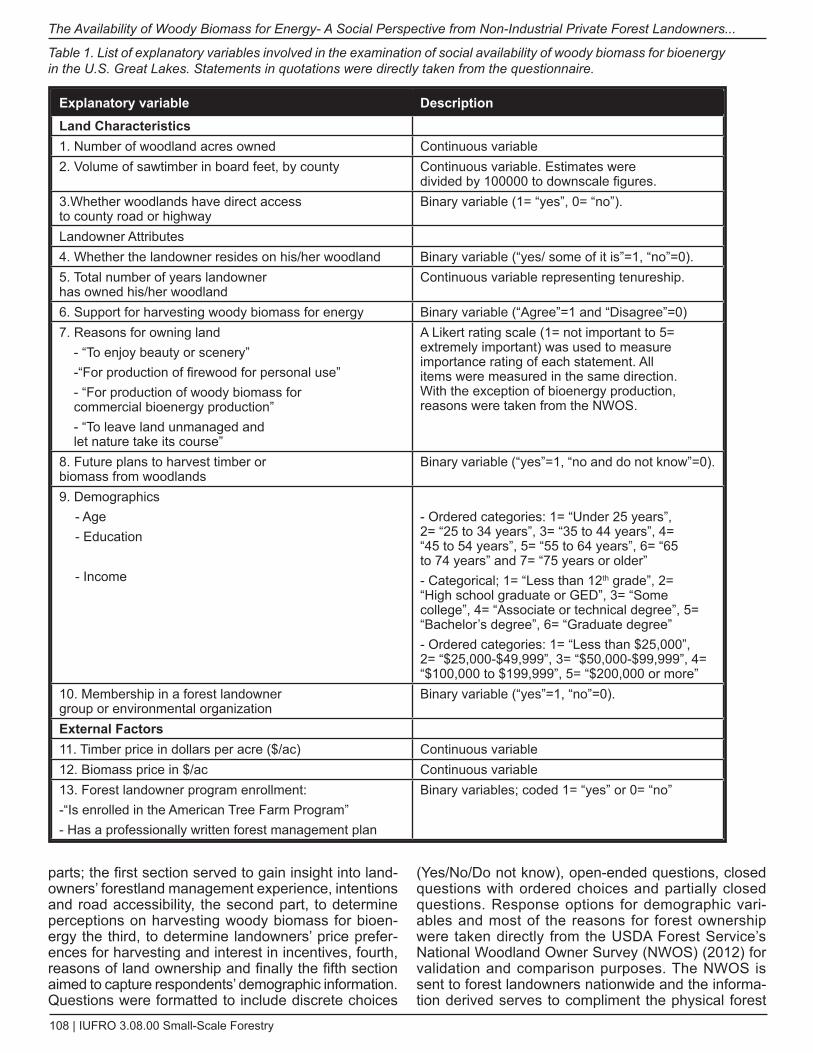
108 | IUFRO 3.08.00 Small-Scale Forestry
The Availability of Woody Biomass for Energy- A Social Perspective from Non-Industrial Private Forest Landowners...
parts; the first section served to gain insight into land-owners’ forestland management experience, intentions and road accessibility, the second part, to determine perceptions on harvesting woody biomass for bioen-ergy the third, to determine landowners’ price prefer-ences for harvesting and interest in incentives, fourth, reasons of land ownership and finally the fifth section aimed to capture respondents’ demographic information. Questions were formatted to include discrete choices
(Yes/No/Do not know), open-ended questions, closed questions with ordered choices and partially closed questions. Response options for demographic vari-ables and most of the reasons for forest ownership were taken directly from the USDA Forest Service’s National Woodland Owner Survey (NWOS) (2012) for validation and comparison purposes. The NWOS is sent to forest landowners nationwide and the informa-tion derived serves to compliment the physical forest
Explanatory variable DescriptionLand Characteristics 1. Number of woodland acres owned Continuous variable2. Volume of sawtimber in board feet, by county Continuous variable. Estimates were
divided by 100000 to downscale figures.3.Whether woodlands have direct access to county road or highway
Binary variable (1= “yes”, 0= “no”).
Landowner Attributes4. Whether the landowner resides on his/her woodland Binary variable (“yes/ some of it is”=1, “no”=0).5. Total number of years landowner has owned his/her woodland
Continuous variable representing tenureship.
6. Support for harvesting woody biomass for energy Binary variable (“Agree”=1 and “Disagree”=0) 7. Reasons for owning land
- “To enjoy beauty or scenery”-“For production of firewood for personal use”- “For production of woody biomass for commercial bioenergy production”- “To leave land unmanaged and let nature take its course”
A Likert rating scale (1= not important to 5= extremely important) was used to measure importance rating of each statement. All items were measured in the same direction. With the exception of bioenergy production, reasons were taken from the NWOS.
8. Future plans to harvest timber or biomass from woodlands
Binary variable (“yes”=1, “no and do not know”=0).
9. Demographics- Age- Education - Income
- Ordered categories: 1= “Under 25 years”, 2= “25 to 34 years”, 3= “35 to 44 years”, 4= “45 to 54 years”, 5= “55 to 64 years”, 6= “65 to 74 years” and 7= “75 years or older” - Categorical; 1= “Less than 12th grade”, 2= “High school graduate or GED”, 3= “Some college”, 4= “Associate or technical degree”, 5= “Bachelor’s degree”, 6= “Graduate degree”- Ordered categories: 1= “Less than $25,000”, 2= “$25,000-$49,999”, 3= “$50,000-$99,999”, 4= “$100,000 to $199,999”, 5= “$200,000 or more”
10. Membership in a forest landowner group or environmental organization
Binary variable (“yes”=1, “no”=0).
External Factors11. Timber price in dollars per acre ($/ac) Continuous variable 12. Biomass price in $/ac Continuous variable13. Forest landowner program enrollment:-“Is enrolled in the American Tree Farm Program”- Has a professionally written forest management plan
Binary variables; coded 1= “yes” or 0= “no”
Table 1. List of explanatory variables involved in the examination of social availability of woody biomass for bioenergy in the U.S. Great Lakes. Statements in quotations were directly taken from the questionnaire.
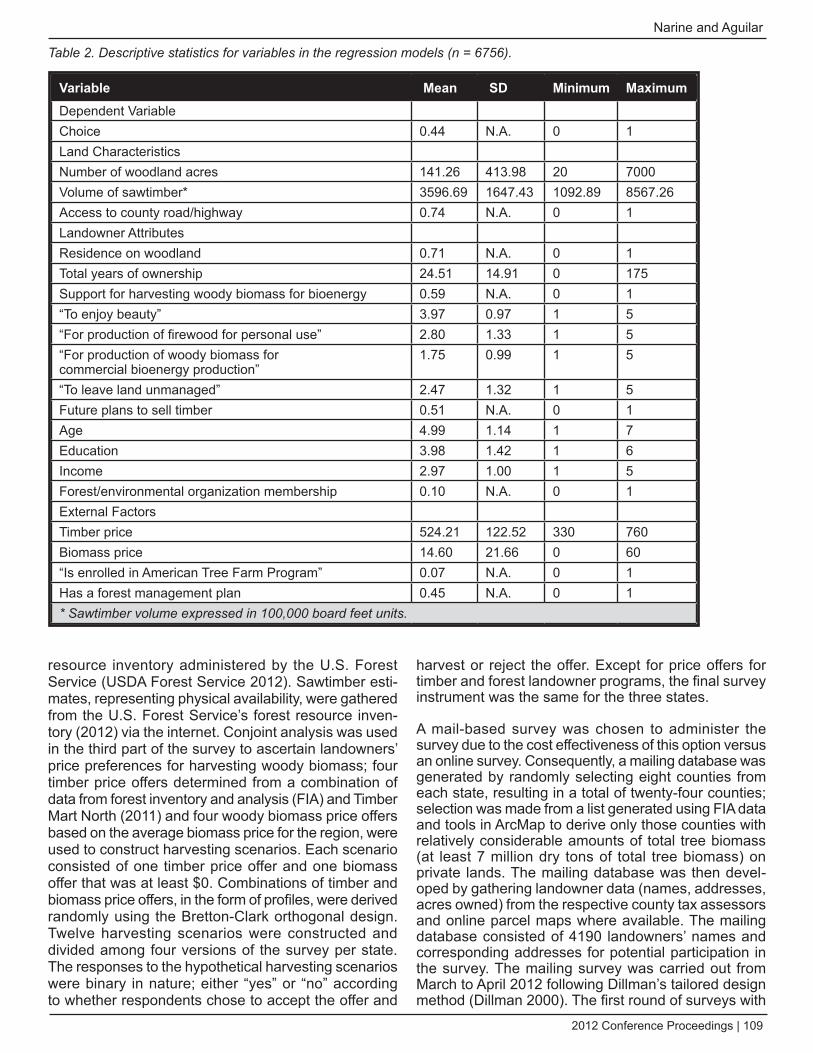
2012 Conference Proceedings | 109
Narine and Aguilar
resource inventory administered by the U.S. Forest Service (USDA Forest Service 2012). Sawtimber esti-mates, representing physical availability, were gathered from the U.S. Forest Service’s forest resource inven-tory (2012) via the internet. Conjoint analysis was used in the third part of the survey to ascertain landowners’ price preferences for harvesting woody biomass; four timber price offers determined from a combination of data from forest inventory and analysis (FIA) and Timber Mart North (2011) and four woody biomass price offers based on the average biomass price for the region, were used to construct harvesting scenarios. Each scenario consisted of one timber price offer and one biomass offer that was at least $0. Combinations of timber and biomass price offers, in the form of profiles, were derived randomly using the Bretton-Clark orthogonal design. Twelve harvesting scenarios were constructed and divided among four versions of the survey per state. The responses to the hypothetical harvesting scenarios were binary in nature; either “yes” or “no” according to whether respondents chose to accept the offer and
harvest or reject the offer. Except for price offers for timber and forest landowner programs, the final survey instrument was the same for the three states.
A mail-based survey was chosen to administer the survey due to the cost effectiveness of this option versus an online survey. Consequently, a mailing database was generated by randomly selecting eight counties from each state, resulting in a total of twenty-four counties; selection was made from a list generated using FIA data and tools in ArcMap to derive only those counties with relatively considerable amounts of total tree biomass (at least 7 million dry tons of total tree biomass) on private lands. The mailing database was then devel-oped by gathering landowner data (names, addresses, acres owned) from the respective county tax assessors and online parcel maps where available. The mailing database consisted of 4190 landowners’ names and corresponding addresses for potential participation in the survey. The mailing survey was carried out from March to April 2012 following Dillman’s tailored design method (Dillman 2000). The first round of surveys with
Variable Mean SD Minimum MaximumDependent Variable Choice 0.44 N.A. 0 1Land Characteristics Number of woodland acres 141.26 413.98 20 7000Volume of sawtimber* 3596.69 1647.43 1092.89 8567.26Access to county road/highway 0.74 N.A. 0 1Landowner AttributesResidence on woodland 0.71 N.A. 0 1Total years of ownership 24.51 14.91 0 175Support for harvesting woody biomass for bioenergy 0.59 N.A. 0 1“To enjoy beauty” 3.97 0.97 1 5“For production of firewood for personal use” 2.80 1.33 1 5“For production of woody biomass for commercial bioenergy production”
1.75 0.99 1 5
“To leave land unmanaged” 2.47 1.32 1 5Future plans to sell timber 0.51 N.A. 0 1Age 4.99 1.14 1 7Education 3.98 1.42 1 6Income 2.97 1.00 1 5Forest/environmental organization membership 0.10 N.A. 0 1External FactorsTimber price 524.21 122.52 330 760Biomass price 14.60 21.66 0 60“Is enrolled in American Tree Farm Program” 0.07 N.A. 0 1Has a forest management plan 0.45 N.A. 0 1* Sawtimber volume expressed in 100,000 board feet units.
Table 2. descriptive statistics for variables in the regression models (n = 6756).
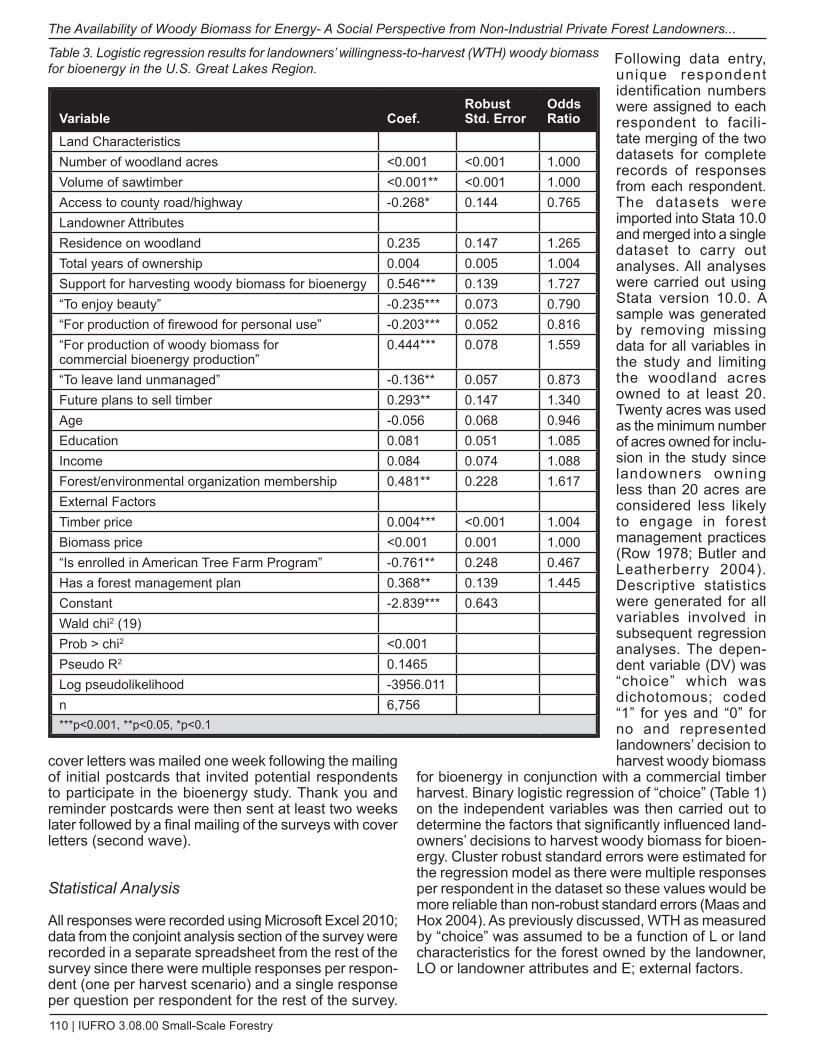
110 | IUFRO 3.08.00 Small-Scale Forestry
The Availability of Woody Biomass for Energy- A Social Perspective from Non-Industrial Private Forest Landowners...
cover letters was mailed one week following the mailing of initial postcards that invited potential respondents to participate in the bioenergy study. Thank you and reminder postcards were then sent at least two weeks later followed by a final mailing of the surveys with cover letters (second wave).
Statistical Analysis
All responses were recorded using Microsoft Excel 2010; data from the conjoint analysis section of the survey were recorded in a separate spreadsheet from the rest of the survey since there were multiple responses per respon-dent (one per harvest scenario) and a single response per question per respondent for the rest of the survey.
Following data entry, unique respondent identification numbers were assigned to each respondent to facili-tate merging of the two datasets for complete records of responses from each respondent. The datasets were imported into Stata 10.0 and merged into a single dataset to carry out analyses. All analyses were carried out using Stata version 10.0. A sample was generated by removing missing data for all variables in the study and limiting the woodland acres owned to at least 20. Twenty acres was used as the minimum number of acres owned for inclu-sion in the study since landowners owning less than 20 acres are considered less likely to engage in forest management practices (Row 1978; Butler and Leatherberry 2004). Descriptive statistics were generated for all variables involved in subsequent regression analyses. The depen-dent variable (DV) was “choice” which was dichotomous; coded “1” for yes and “0” for no and represented landowners’ decision to harvest woody biomass
for bioenergy in conjunction with a commercial timber harvest. Binary logistic regression of “choice” (Table 1) on the independent variables was then carried out to determine the factors that significantly influenced land-owners’ decisions to harvest woody biomass for bioen-ergy. Cluster robust standard errors were estimated for the regression model as there were multiple responses per respondent in the dataset so these values would be more reliable than non-robust standard errors (Maas and Hox 2004). As previously discussed, WTH as measured by “choice” was assumed to be a function of L or land characteristics for the forest owned by the landowner, LO or landowner attributes and E; external factors.
Variable Coef. Robust Std. Error
Odds Ratio
Land Characteristics Number of woodland acres <0.001 <0.001 1.000Volume of sawtimber <0.001** <0.001 1.000Access to county road/highway -0.268* 0.144 0.765Landowner AttributesResidence on woodland 0.235 0.147 1.265Total years of ownership 0.004 0.005 1.004Support for harvesting woody biomass for bioenergy 0.546*** 0.139 1.727“To enjoy beauty” -0.235*** 0.073 0.790“For production of firewood for personal use” -0.203*** 0.052 0.816“For production of woody biomass for commercial bioenergy production”
0.444*** 0.078 1.559
“To leave land unmanaged” -0.136** 0.057 0.873Future plans to sell timber 0.293** 0.147 1.340Age -0.056 0.068 0.946Education 0.081 0.051 1.085Income 0.084 0.074 1.088Forest/environmental organization membership 0.481** 0.228 1.617External FactorsTimber price 0.004*** <0.001 1.004Biomass price <0.001 0.001 1.000“Is enrolled in American Tree Farm Program” -0.761** 0.248 0.467Has a forest management plan 0.368** 0.139 1.445Constant -2.839*** 0.643Wald chi2 (19) Prob > chi2 <0.001Pseudo R2 0.1465Log pseudolikelihood -3956.011n 6,756***p<0.001, **p<0.05, *p<0.1
Table 3. Logistic regression results for landowners’ willingness-to-harvest (WTH) woody biomass for bioenergy in the U.S. Great Lakes Region.
2012 Conference Proceedings | 111
Narine and Aguilar
Results
The adjusted response rate, after accounting for non-deliverables, non-responses and removing feedback from landowners owning less than 20 acres, was 32%. There were 6,756 observations for each variable in the sample generated for analyses (Table 2). 88% of sample respondents were male and the average age group of a respondent, education level and income, was between 55 and 64 years old, Associate or tech-nical degree and between $50,000 and $99,999 respec-tively. Landowners at least 55 years of age represented the majority of respondents from each state; 78% of Michigan landowners, 69% of Minnesota landowners and 62% of Wisconsin landowners. An estimated 74% of landowners indicated that their woodlands have direct access to roads and landowners on average, owned 141 acres of forestland and were found to be in posses-sion of their land for about 25 years. 59% of landowners supported the harvest of woody biomass for bioenergy but 49% had future plans to sell timber. The average price offered for a timber harvest and additional offer for a biomass harvest were $524 and $15 respectively. Enjoyment of beauty was found to have the highest mean rating of all ownership objectives and deemed at least very important by 72% of respondents. The owner-ship of woodlands for commercial bioenergy production had the lowest average mean rating that translated to being only a “slightly important” reason. Less than half or 45% of landowners indicated having a management plan written by a professional forester, indicating that 56% of landowners are either not managing their wood-lands in a sustainable manner or are not interested in actively managing their woodlands.
The likelihood ratio test result (Table 3) indicated the appropriateness of the logistic regression model for analyzing factors affecting WTH woody biomass. The percent improvement in log likelihood from the null to the full model was 14.65%. Regression results revealed that the significant factors positively affecting WTH woody biomass were support for harvesting woody biomass for bioenergy, involvement in an environmental or forest organization, indication of importance of harvesting woody biomass for bioenergy production, owning a forest management plan, having future plans to sell timber and timber price. The greatest magnitude on WTH woody biomass at an alpha of 0.001 was attrib-uted to support; the odds of WTH woody biomass were 73% higher for landowners in support of harvesting woody biomass for bioenergy than those who indicated no support. Second to this factor, landowners involved in an organization had 62% greater odds of harvesting woody biomass for energy than those who were not part of one. Timber price exhibited one of smallest significant impact on the choice to harvest woody biomass; odds of harvesting increased by only 0.4% for each $1 per acre offered. Factors representing non-timber values and personal use as measured by importance ratings for owning woodlands for beauty, to leave unmanaged
and for firewood, were found to be statistically significant and reduced the odds of harvesting by 21%, 13% and 18% respectively for each unit increase in importance rating. The greatest magnitude among factors nega-tively influencing WTH woody biomass was attributed to enrollment in American Tree Farm Program (ATFS); landowners enrolled in ATFS had 53% lower odds of being willing to harvest woody biomass than those not enrolled in the program.
Discussion and Conclusions
The magnitude of significant factors positively affecting landowners’ harvesting decisions were generally smaller than anticipated. For instance, the effects of timber price and sawtimber volume were significant at 99% and 95% respectively but increased the odds of harvesting by 0.44% for each $1 per acre increase and sawtimber volume, only 0.01%. These values represented the lowest predicted odds of all other factors positively affecting WTH woody biomass. Surprisingly, the offer of an additional price to harvest biomass did not signif-icantly influence landowners’ WTH woody biomass. Consequently, only sawtimber price rather than biomass price or both, had a positive effect on landowners’ decision to harvest woody biomass in conjunction with a timber harvest. It is noteworthy that the involvement in a forest landowner group or environmental associa-tion increased the odds of harvesting by 62% but only an average of 10% of all respondents indicated their involvement in one. Landowners involved in an envi-ronmental or forest organization may likely be more informed about bioenergy from woody biomass and multiple-use of forests through networking and conse-quently more inclined to harvest woody biomass. Enroll-ment in ATFS represented another factor with tremen-dous impact on the predicted probability of harvesting but its effect was not realistically substantial as only 7% of landowners indicated being enrolled. Nevertheless, the odds of harvesting were 52% less for landowners enrolled in ATFS than those who were not part of this program. Given that enrollment in ATFS is an indicator to sustainable forest management where this program is focused on promoting and encouraging sustainable timber production, landowners might have been unfa-miliar or uncertain about the option of energy production from woody biomass and possibility of simultaneously harvesting both timber and woody biomass in a sustain-able manner (Joshi and Mehmood 2011).
Landowners who indicated future plans to sell timber in the future represented 51% of all respondents in the sample and had 34% greater odds of harvesting woody biomass that those who had no plans to sell timber from their lands. This result coupled with the finding that having a forest management plan increased the odds of harvesting woody biomass by 45% and nearly half or 45% of sample respondents indicated having one, translates to considerable potential for procuring
112 | IUFRO 3.08.00 Small-Scale Forestry
The Availability of Woody Biomass for Energy- A Social Perspective from Non-Industrial Private Forest Landowners...
future biomass sources. The integration of biomass harvest with landowners’ current forest management plan and promotion of the adoption of management plans to landowners without one can serve to enhance the social availability of woody biomass. At the same time, however, non-timber objectives that were high ranking in popularity among respondents like aesthetics and leaving land unmanaged, had considerable effects on WTH woody biomass and consequently represent constraints to potential woody biomass supplies.
A number of variables were not found to be statistically significant resulting in a contradiction of past findings and expected relationships. None of the demographic variables had significant influences on WTH woody biomass. Even though the coefficient on age was negative, it was not significant, at least at an alpha of 0 .1. Similarly, tenureship, residence on woodland and acres owned were expected to have significant effects on WTH woody biomass; while the expected relation-ship directions were found, none were statistically signif-icant.
This preliminary study found both promising possi-bilities and constraints to woody biomass availability. Although landowners’ education level did not influence the choice to harvest, other factors that exhibited signif-icantly positive impacts like involvement in an envi-ronmental or forest organization and owning a forest management plan represent educational platforms where landowners would more likely be informed about multiple use and active management of their woodlands. However, landowners on average possess mainly non-timber objectives and these objectives lead to unwill-ingness to harvest woody biomass. Extensive research and planning efforts must be invested into the develop-ment of effective education and outreach programs that serve to potentially increase landowner involvement in existing wood production and encourage participation for a sustainable bioenergy market. Finally, it is important to recognize that the viability of a bioenergy market partially rests upon flourishing timber markets since timber prices rather than biomass prices drive landowners’ decision to harvest woody biomass from their woodlands.
References
Amacher, G. S., M. C. Conway and J. Sullivan. 2003. Econo-metric analyses of nonindustrial forest landowners: Is there anything left to study? Journal of Forest Economics 9(2):137 164.
Ashton, S., S. Baker, B. Jackson and R. Schroeder. 2007. Conventional Biomass Harvesting Systems. Sustainable Forestry for Bioenergy and Bio-based Products.133-136.
Bartuska, A. 2010. Why is Biomass Important- The Role of the USdA Forest Service in Managing and Using Biomass for Energy and Other Uses. Available online at http; last accessed May 2, 2012.
Becker, d. R., J. J. Klapperich, G.M. domke, M. A. Kilgore, A. W. d’Amato, d. A. Current, and A. R. Ek. 2010. 2010 Outlook for Forest Biomass Availability in Minnesota: Physical, Envi-ronmental, Economic and Social Availability. Staff Paper Series No. 211, department of Forest Resources, Univer-sity of Minnesota. 83p.
Butler, B. J. 2007. Private Forest Owners: Past, Present and Future. Society of American Foresters National Conven-tion. Available online at http://www.auburn.edu/academic/forestry_wildlife/forest_policy_ctr/SAF/day1 bbutler.pdf; last accessed June 14, 2012.
Butler, B.J. 2008. Family Forest Owners of the United States, 2006. Gen. Tech. Rep. NRS-27.
United States department of Agriculture, Forest Service, Northern Research Station. 72p.
Butler, B. J. and E. C. Leatherberry. 2004. America’s Family Forest Owners. Journal of Forestry 102(7): 4-9.
d’Amato, Anthony .W., Paul F. Catanzaro, david T. damery, david B. Kittredge and Kristina A. Ferrare, K.A. 2010.Are Family Forest Owners Facing a Future In Which Forest Management is Not Enough. Journal of Forestry 108(1): 32-38.
daniel M., F. X. Aguilar, H. Stelzer and L. L. Narine. Unpub-lished. Multivariate Analysis of Missouri’s Non-Industrial Private Forest Landowner’s and their Willingness-to-Harvest Woody Biomass.
dillman, d. A. 2000. Mail and Internet Surveys: The Tailored design Method. 2nd ed. Wiley and Sons, Inc, New York. 464p.
Goerndt, M.E., F.X. Aguilar, P. Miles, S. Shifley, N. Song and H. Stelzer. 2012. Regional Assessment of Woody Biomass Physical Availability as an Energy Feedstock for Combined Combustion in the US Northern Region. Journal of Forestry 110(3): 138-148.
Gruchy, S. R., d. L. Grebner, I. A. Munn, O. Joshi and A. Hussain. 2011. An assessment of nonindustrial private forest landowner willingness to harvest woody biomass in support of bioenergy production in Mississippi: A contingent rating approach. Forest Policy and Economics 15:140-145.
Hall, d.O. 1997. Biomass in industrialized countries- a view of the future. Forest Ecology and Management 91(1): 17-45.
Joshi, O. and S.R. Mehmood. 2011. Factors affecting nonin-dustrial private forest landowners’ willingness to supply woody biomass for bioenergy. Biomass and Bioenergy 35(1): 186 192.
Kurtz, W. B. and B. J. Lewis. decision-making Framework for Nonindustrial Private Forest Owners: An Application in the Missouri Ozarks. Journal of Forestry 79(5):285-288.
Office of the State Forester, Oregon Department of Forestry. 2008. Report: Environmental Effects of Forest Biomass Removal. Available online at http://www.oregon.gov/OdF/PUBS/docs/OdF_Biomass_Removal_Effects_Report.pdf? ga=t; last accessed May 2, 2012.
2012 Conference Proceedings | 113
Narine and Aguilar
Maas, C.J.M. and J.J. Hox. Robustness issues in multi-level regression analysis. Statistica Neerlandica 58(2): 127-137.
Public Law 110-140. 2007. Energy Independence and Security Act of 2007. Available online at http://frwebgate.access.gpo.gov/cgibin/getdoc.cgi?dbname=110_cong_public_laws&doci d=f:publ140.110.pdf; last accessed May 2, 2012.
Row, C. Economies of Tract Size in Timber Growing. 1978. Journal of Forestry 76(9): 576 582.
Skipper, d., L. V. Velde, M. Popp, G. Vickery, G. Huylen-broeck and W. Verbeke. 2009. Consumers’ perceptions regarding tradeoffs between food and fuel expenditures: A case study of U.S. and Belgian fuel users. Biomass and Bioenergy 33(6-7): 973-987.
S. G.C. and S. R. Mehmood. 2010. Factors Influencing Nonin-dustrial Private Forest Landowners’ Policy Preference for Promoting Bioenergy. Forest Policy and Economics 12 (8): 581-588.
Smith, W.B, P.d. Miles, C.H. Perry and S.A. Pugh. 2009. Forest Resources of the United
States, 2007.Gen. Tech. Rep. WO-78.United States depart-ment of Agriculture, Forest Service, Washington Office. 336p.
United States Environmental Protection Agency (EPA). 2010. Renewable Fuel Standard (RFS) Available online at http://www.epa.gov/otaq/fuels/renewablefuels/index.htm; last accessed June 15, 2012.
United States department of Agriculture, Forest Service. 2012. Forest Inventory and Analysis Program. Available online at http://www.fia.fs.fed.us/; last accessed June 15, 2012.
United States department of Agriculture, Forest Service. 2012. National Woodland Owner Survey. Available online at http://www.fia.fs.fed.us/nwos/; last accessed June 15, 2012.
United States department of Agriculture, Forest Service. 2008. Woody Biomass Utilization. Available online at http://www.fs.fed.us/woodybiomass/whatis.shtml; last accessed June 14, 2012.
Vokoun, M., G. S. Amacher and d. N. Wear. 2005. Scale of harvesting by non-industrial private forest landowners. Journal of Forest Economics 11(4): 223- 244.
Young, R. A. and M.R. Reichenbach. 1987. Factors Influ-encing the Timber Harvest Intentions of Nonindustrial Private Forest Owners. Forest Science 33(2): 381-393.
114 | IUFRO 3.08.00 Small-Scale Forestry
Introduction
Community forestry (CF) systems have been refined over time as experience is gained in programme design, and notable successes have been achieved as well as failures (Harrison and Suh, 2004). Scholars have analysed CF from different perspectives (Kubo, 2009), the review on CF in this paper focuses mainly on linking community forest uses and management , and liveli-hood strategies, which eventually provide the basis for economic decision making. The current CF approach analysed in this paper focuses not only on collec-tive management, but also includes individual house-hold activities, such as tree growing on farms (Arnold, 2001; Angelsen and Wunder, 2003). This is important to be emphasized, since some scholars tend to focus on CF in the context of natural forest-based manage-ment only based on formal rights, while excluding the de facto forms of forest uses and management. They
also exclude diverse agroforestry that provides inte-grated social, economic, and environmental benefits (e.g. Charnley and Poe, 2007).
Despite more than three decades of CF develop-ment as a concept and practical implementation, past and current CF management practices have failed to improve the livelihoods of forest communities. There has been little in the way of expansion and economic forest benefits provide no more than subsistence leaving these communities firmly in the grasp of poverty. In this paper, I explore important components and neces-sary conditions for developing feasible and viable enter-prises and in turn a more resilient CF management more capable of dealing with the dynamics of globa-lised economics. I present specific case studies to give a clear overview. The paper is organised as follows: first, I discuss the evolving CF approaches and prac-tices; second, I present the evolving CF approaches and practices and discuss challenges and opportunities for improving the livelihoods of forest communities, and
Towards Commercially Oriented Community Forestry Management: Coping With Economic Globalisation and CommercialisationAni Adiwinata Nawir1
1 CIFOR - Center for International Forestry Research, Jl. CIFOR Situgede, Sindang Barang, Bogor Barat 16115, Indonesia, [email protected]
Keywords: Community forestry management, economic globalisation, commercialisation, incentive framework
Abstract
Past and current community forestry (CF) management practices have not successfully improved the livelihoods of forest communities. There have been limited options for expansion and optimising economic forest benefits to lift these communities out of poverty. One recent challenge is the rapid development of economic globalisation and commercialisation. There are serious challenges in translating opportunities under globalised and commer-cialised economics into policy and socioeconomic incentives that benefit local communities.
It is important for local enterprises to be more commercially competitive in this globalised economic era. Ensuring feasible and viable management practices can help communities work themselves out of poverty. Increasing local producers commercial and business knowledge and skills, mainly understanding the risks of development options, can also help empower. This paper aims to explore important components and necessary conditions for developing feasible and viable enterprises that increase CF management resilience in this dynamic globa-lised economic climate. The main underlying assumption is that the communities involved are rational decision-makers interested in change. Important components of feasible and viable CF enterprises include: the need to have good institutional capacity in financial management and technical skills to implement commercial activities; a system for allocating benefits and costs; and an economically profitable forest unit. These should be supported by an incentive framework based on benefit-sharing and power-sharing principles.
2012 Conference Proceedings | 115
Nawir
dealing with the rapid development of globalisation and commercialisation; third, I highlight the necessary and favourable conditions for local enterprises to become more commercially competitive within this globalised economic condition.
The Evolving CF Approaches and Practices: Lessons Learnt from More Than Three decades
The current CF system has resulted from more than three decades of an evolution of practices and conceptu-alisation of the relationship between people and forests, specifically under the changing conditions within the communities and external influences. There are at least five key aspects that have shaped the direction of and approaches in the current CF. First, during the 1970s, there was a common understanding of the counter-productive impacts of industrial-based forest manage-ment based on logging, which resulted in ecological destruction and gaps in socioeconomic benefits for local communities (Arnold, 1992; Mallik and Rahman, 1994; Gilmour, 1998; Arnold, 2001; Poffenberger, 2006). The CF concept was designed to release the pressures on national forests and meet the people’s subsistence needs for forest products (Arnold, 2001; Poffenberger, 2006). Second, during the 1980s, there was a conceptu-alisation of the Sustainable Livelihoods Approach (SLA) as the mainstream of the development policy agenda driven by the Brundlant Commission Report in 1987
(Abbot and Guijt, 1998; Arnold, 2001; Solesbury, 2003). Third, during the 1990s, there was a reformulation of the Common Property Resource Management Concept based on Hardin’s ‘tragedy of the commons’ (World Bank, 1998; Meinzen-Dick et al., 2004; Ostrom, 2004; 2008). Fourth, also during the late 1990s to 2000s and present, the decentralisation and devolution policies have influenced forest management since the late 1990s, in responding to increasing illegal logging and uncon-trolled deforestation due to the failures of centralised government-based forest management (Shackleton et al., 2002; Edmunds and Wollenberg, 2003; Gregersen et al., 2005). And fifth, during all periods, the interna-tional donor agencies, such as WB (World Bank) and FAO (Food and Agriculture Organization of the United Nations) have always provided financial and technical assistance for community-based forest management programmes (Capistrano and Colfer, 2005). Figure 1 shows the evolving key drivers and CF approaches.
Despite initial failures during the 1970s to meet rural villagers’ subsistence needs through a broad range of forest products and services, and to release the pres-sures on natural forests, the CF movement gained voices for rural communities’ greater access and rights to utilise the resources in the 1980s (Dewees, 1997; Glasmeier and Farrigan, 2005; Poffenberger, 2006; Charnley and Poe, 2007). The formal recognition of communities’ access to forest areas has mainly been stimulated by the shift towards decentralisation and
Figure 1. The evolving key drivers and CF approaches (1970s – present).
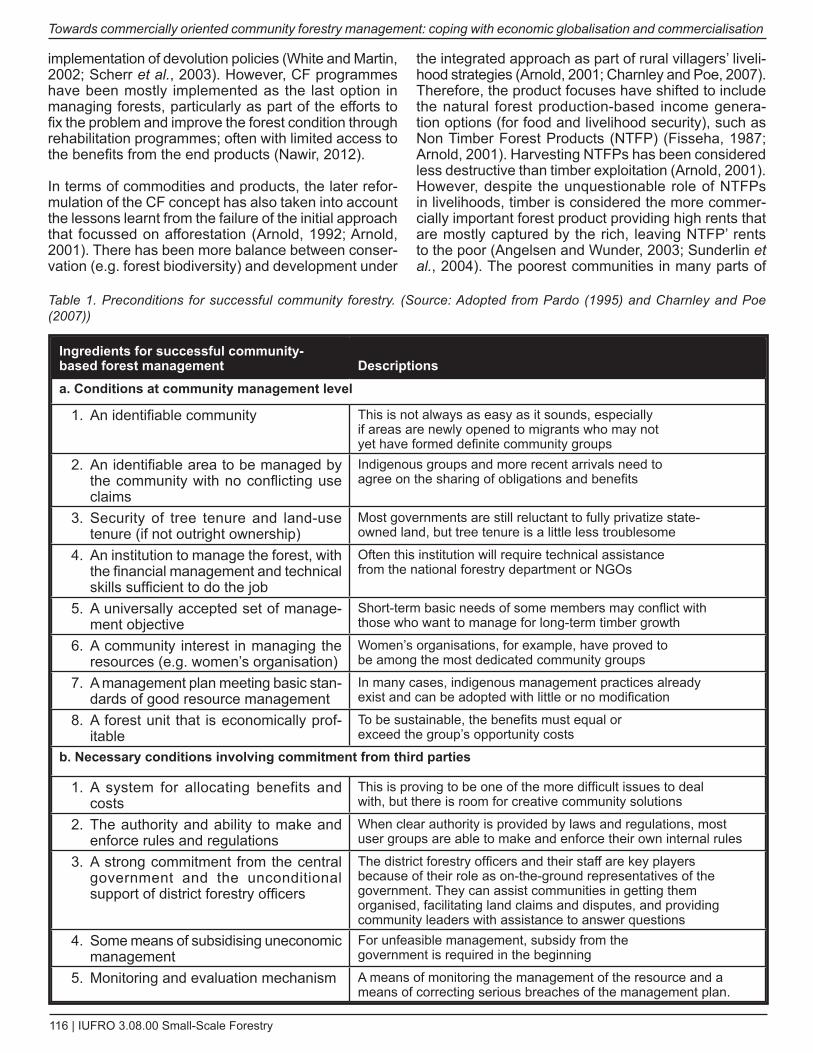
116 | IUFRO 3.08.00 Small-Scale Forestry
Towards commercially oriented community forestry management: coping with economic globalisation and commercialisation
implementation of devolution policies (White and Martin, 2002; Scherr et al., 2003). However, CF programmes have been mostly implemented as the last option in managing forests, particularly as part of the efforts to fix the problem and improve the forest condition through rehabilitation programmes; often with limited access to the benefits from the end products (Nawir, 2012).
In terms of commodities and products, the later refor-mulation of the CF concept has also taken into account the lessons learnt from the failure of the initial approach that focussed on afforestation (Arnold, 1992; Arnold, 2001). There has been more balance between conser-vation (e.g. forest biodiversity) and development under
the integrated approach as part of rural villagers’ liveli-hood strategies (Arnold, 2001; Charnley and Poe, 2007). Therefore, the product focuses have shifted to include the natural forest production-based income genera-tion options (for food and livelihood security), such as Non Timber Forest Products (NTFP) (Fisseha, 1987; Arnold, 2001). Harvesting NTFPs has been considered less destructive than timber exploitation (Arnold, 2001). However, despite the unquestionable role of NTFPs in livelihoods, timber is considered the more commer-cially important forest product providing high rents that are mostly captured by the rich, leaving NTFP’ rents to the poor (Angelsen and Wunder, 2003; Sunderlin et al., 2004). The poorest communities in many parts of
Ingredients for successful community-based forest management Descriptionsa. Conditions at community management level
An identifiable community1. This is not always as easy as it sounds, especially if areas are newly opened to migrants who may not yet have formed definite community groups
An identifiable area to be managed by 2. the community with no conflicting use claims
Indigenous groups and more recent arrivals need to agree on the sharing of obligations and benefits
Security of tree tenure and land-use 3. tenure (if not outright ownership)
Most governments are still reluctant to fully privatize state-owned land, but tree tenure is a little less troublesome
An institution to manage the forest, with 4. the financial management and technical skills sufficient to do the job
Often this institution will require technical assistance from the national forestry department or NGOs
A universally accepted set of manage-5. ment objective
Short-term basic needs of some members may conflict with those who want to manage for long-term timber growth
A community interest in managing the 6. resources (e.g. women’s organisation)
Women’s organisations, for example, have proved to be among the most dedicated community groups
A management plan meeting basic stan-7. dards of good resource management
In many cases, indigenous management practices already exist and can be adopted with little or no modification
A forest unit that is economically prof-8. itable
To be sustainable, the benefits must equal or exceed the group’s opportunity costs
b. Necessary conditions involving commitment from third parties
A system for allocating benefits and 1. costs
This is proving to be one of the more difficult issues to deal with, but there is room for creative community solutions
The authority and ability to make and 2. enforce rules and regulations
When clear authority is provided by laws and regulations, most user groups are able to make and enforce their own internal rules
A strong commitment from the central 3. government and the unconditional support of district forestry officers
The district forestry officers and their staff are key players because of their role as on-the-ground representatives of the government. They can assist communities in getting them organised, facilitating land claims and disputes, and providing community leaders with assistance to answer questions
Some means of subsidising uneconomic 4. management
For unfeasible management, subsidy from the government is required in the beginning
Monitoring and evaluation mechanism5. A means of monitoring the management of the resource and a means of correcting serious breaches of the management plan.
Table 1. Preconditions for successful community forestry. (Source: Adopted from Pardo (1995) and Charnley and Poe (2007))
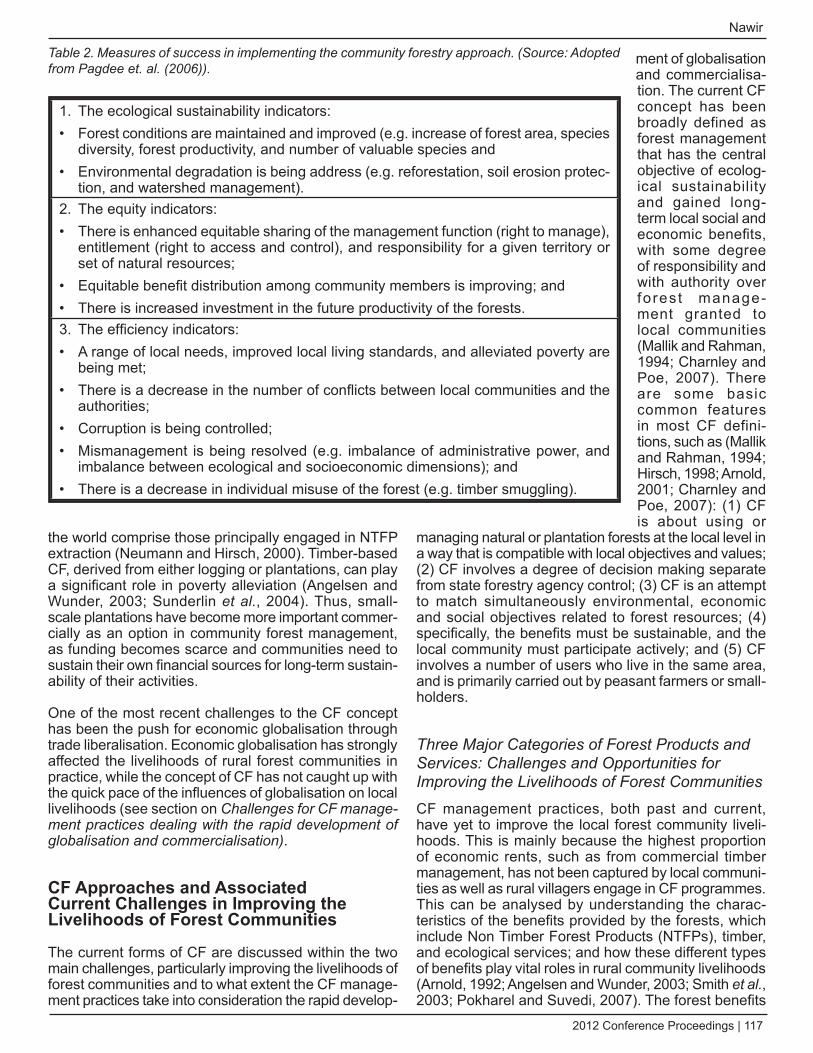
2012 Conference Proceedings | 117
Nawir
the world comprise those principally engaged in NTFP extraction (Neumann and Hirsch, 2000). Timber-based CF, derived from either logging or plantations, can play a significant role in poverty alleviation (Angelsen and Wunder, 2003; Sunderlin et al., 2004). Thus, small-scale plantations have become more important commer-cially as an option in community forest management, as funding becomes scarce and communities need to sustain their own financial sources for long-term sustain-ability of their activities.
One of the most recent challenges to the CF concept has been the push for economic globalisation through trade liberalisation. Economic globalisation has strongly affected the livelihoods of rural forest communities in practice, while the concept of CF has not caught up with the quick pace of the influences of globalisation on local livelihoods (see section on Challenges for CF manage-ment practices dealing with the rapid development of globalisation and commercialisation).
CF Approaches and Associated Current Challenges in Improving the Livelihoods of Forest Communities
The current forms of CF are discussed within the two main challenges, particularly improving the livelihoods of forest communities and to what extent the CF manage-ment practices take into consideration the rapid develop-
ment of globalisation and commercialisa-tion. The current CF concept has been broadly defined as forest management that has the central objective of ecolog-ical sustainability and gained long-term local social and economic benefits, with some degree of responsibility and with authority over forest manage-ment granted to local communities (Mallik and Rahman, 1994; Charnley and Poe, 2007). There are some basic common features in most CF defini-tions, such as (Mallik and Rahman, 1994; Hirsch, 1998; Arnold, 2001; Charnley and Poe, 2007): (1) CF is about using or
managing natural or plantation forests at the local level in a way that is compatible with local objectives and values; (2) CF involves a degree of decision making separate from state forestry agency control; (3) CF is an attempt to match simultaneously environmental, economic and social objectives related to forest resources; (4) specifically, the benefits must be sustainable, and the local community must participate actively; and (5) CF involves a number of users who live in the same area, and is primarily carried out by peasant farmers or small-holders.
Three Major Categories of Forest Products and Services: Challenges and Opportunities for Improving the Livelihoods of Forest Communities
CF management practices, both past and current, have yet to improve the local forest community liveli-hoods. This is mainly because the highest proportion of economic rents, such as from commercial timber management, has not been captured by local communi-ties as well as rural villagers engage in CF programmes. This can be analysed by understanding the charac-teristics of the benefits provided by the forests, which include Non Timber Forest Products (NTFPs), timber, and ecological services; and how these different types of benefits play vital roles in rural community livelihoods (Arnold, 1992; Angelsen and Wunder, 2003; Smith et al., 2003; Pokharel and Suvedi, 2007). The forest benefits
The ecological sustainability indicators: 1. Forest conditions are maintained and improved (e.g. increase of forest area, species • diversity, forest productivity, and number of valuable species and Environmental degradation is being address (e.g. reforestation, soil erosion protec-• tion, and watershed management). The equity indicators:2. There is enhanced equitable sharing of the management function (right to manage), • entitlement (right to access and control), and responsibility for a given territory or set of natural resources; Equitable benefit distribution among community members is improving; and • There is increased investment in the future productivity of the forests.• The efficiency indicators: 3. A range of local needs, improved local living standards, and alleviated poverty are • being met;There is a decrease in the number of conflicts between local communities and the • authorities; Corruption is being controlled; • Mismanagement is being resolved (e.g. imbalance of administrative power, and • imbalance between ecological and socioeconomic dimensions); and There is a decrease in individual misuse of the forest (e.g. timber smuggling).•
Table 2. Measures of success in implementing the community forestry approach. (Source: Adopted from Pagdee et. al. (2006)).
118 | IUFRO 3.08.00 Small-Scale Forestry
Towards commercially oriented community forestry management: coping with economic globalisation and commercialisation
include both those derived from extraction and those from planting in various forms, for example, agrofor-esty or monoculture (Arnold, 2001; Snelder and Lasco, 2008).
The most favourable characteristic of NTFPs for rural communities as livelihood options is that most NTFPs are a reliable source of subsistence and income at anytime, especially during difficult times for the poorest, as coping strategies or ‘safety nets’ (Angelsen and Wunder, 2003). NTFPs are more important for poor households with limited livelihood options outside the forests, such as hunter gatherers, and landless families, rather than wealthier farmers with land (Arnold, 1992; Wollenberg and Nawir, 1998). Despite long term community depen-dence on NTFPs, these products hardly serve as a means to elevate people out of poverty under increasing external pressures and challenges (Neumann and Hirsch, 2000; Angelsen and Wunder, 2003; Dunning, 2007). Some of the reasons for this include (Arnold, 2001; Ravallion, 2001b;a; Angelsen and Wunder, 2003; Wollenberg and Nawir, 2005): (1) the limited econo-mies of scale to extract NTFPs for commercialisation purposes due to high harvesting costs per unit area, specifically the ratio between production and large areas to be covered for extracting the products; (2) there is often a lack of physical infrastructure in remote areas making it difficult to access markets, and high transporta-tion costs, resulting in low product prices at the commu-nity level; (3) tenurial arrangements are usually based on communal customary rights, which often underlie the mode of NTFP collection under open-access conditions, and without secure rights there is little incentive for inten-sive management. On the other hand, establishing and enforcing property rights could involve transaction costs; (3) when opportunities beyond subsistence arise, the local communities receive only a small share of the profit margins, since they rely on middle-men or brokers due to the remoteness of their locations, and limited market information; and (4) the future long-term sustainability of incomes from NTFPs is in danger of following the diminishing forests in many parts of the world.
As NTFPs tend to be the poor person’s share, other source of income from e forest comes from timber, which is the most important commercial product, and the benefits are mostly captured by outsiders due to high economic timber rents (FAO, 2001; Ross, 2001; Angelsen and Wunder, 2003; Sunderlin et al., 2004). Similarly, benefits from timber produced in plantations are also captured by private companies and states, and rarely by forest communities (Nawir et al., 2003; Dunning, 2007). For example, based on the meta-anal-ysis of 54 case studies in East and South Africa, Asia and Latin America, it is suggested that the contribution of timber to communities’ household incomes is only 2%, compared to other incomes from wild food, fuelwood, fodder, grass, and wild medicine at 84.5% (Vedeld et al., 2004).
There are two important reasons for the ‘unfavour-able characteristics’ of timber-based management that provide no advantages for most forestry communities, especially the poor. First, timber-based management is a long term investment in nature with high risks due to fluc-tuating prices s, tenure insecurity, and natural hazards (e.g. fire) (Angelsen and Wunder, 2003; Sunderlin et al., 2004; Herbohn, 2006). And second, feasible econ-omies of scale requires a specific minimum produc-tion level, which can only be met by large-scale oper-ations (Dunning, 2007). There are three approaches for allowing timber as a means to improve the liveli-hoods of forest communities: (1) providing local access to and management of natural forests, in some cases have been implemented through the decentralisation policy and devolution; (2) promoting smallholder tree growing, which requires innovative approaches; and (3) adding value-based options through small-scale wood processing, which needs a certain amount of finan-cial capital (Arnold, 2001; Angelsen and Wunder, 2003; Dunning, 2007).
However, these options are possible, since there are some unexploited characteristics favouring commu-nity-based timber management (Godoy, 1992b; Scherr, 2004; Herbohn, 2006; Nawir et al., 2007a; Bliss and Kelly, 2008). First, despite the long-term horizon, timber at a mature age, with certain economic value, can be harvested during difficult times; therefore, timber can be used as a form of savings with minimum labour requirements (FAO, 1985; Godoy, 1992b; Arnold, 2001). Second, there have been recent initiatives favouring the involvement of rural communities in timber-based forest management, such as the Ejidos in Mexico for logging activities, and outgrower schemes and/or other forms of community-company partnerships that can help to overcome the challenge of economics in terms of scale (Mayers, 2000; Antinori and Bray, 2005; Dunning, 2007). Third, the market niche opportunities come from the environmental and social timber markets that favour timber produced by communities at the small scale level (Scherr et al., 2003; Bliss and Kelly, 2008). Further, there are more technical innovations for optimising the intercropping between timber species and food crops to meet subsistence household needs (Noordwijk et al., 2008; Roshetko et al., 2008).
The other category of benefits from forest is the ecolog-ical/environmental services provided to on-site forest users (e.g. water) and off-site beneficiaries at the regional, national or global levels (e.g. downstream water supplies) (Arnold, 2001; Angelsen and Wunder, 2003; Vedeld et al., 2004). The mechanism, of Payment for Environmental Services (PES), is perhaps the most promising for poverty reduction. PES compensates local communities for the benefits from natural resources provided to those off-site, which are currently enjoyed for free (Angelsen and Wunder, 2003). Compensation mechanisms are relevant in at least four forest related areas: (1) carbon storage and sequestration; (2) biodi-
2012 Conference Proceedings | 119
Nawir
versity conservation; (3) hydrological services; and (4) tourism (Angelsen and Wunder, 2003; Vedeld et al., 2004). However, applications on the ground are chal-lenging and still limited, particularly in Asia and Africa.
Challenges for CF Management Practices dealing With the Rapid development of Globalisation and Commercialisation
One definition of globalisation refers to a close asso-ciation between global and local or ‘glocalization (Robertson,1995 in Haan, 2000). This has been promoted mostly by key intergovernmental organisations (e.g. WB and IMF), to stimulate the global economic growth as a way to reduce poverty (Hansen, 1990; Tisdell, 2001). The most significant impacts of globalisation on CF can be observed from the changes in livelihood options (de Haan, 2000; de Haan and Zoomers, 2003; Pleumarom, 2007). It is believed that globalisation can open up more opportunities for non-traditional suppliers by creating new niche markets and potential buyers of scarce forest products looking for reliable sources, even from remote locations (Jaffee, 1995; de Haan and Zoomers, 2003; Scherr et al., 2003; Roberts, 2008).
There are at least four serious challenges and their consequences in translating opportunities under glob-alised and commercialised economics into policy and socioeconomic incentives that can benefit local commu-nities. First, the international trade policies favouring free trade bounded by multilateral agreements have counter productive impacts. There has been consid-erable debate about the extent to which international trade policies can effectively in attain the objective of environmental and socioeconomic sustainability, while multilateral agreements have been noted as having less consideration for social and ecological concerns (Tisdell, 2001; Pleumarom, 2007). However, the extent of the impacts varies, depending on the forest products that communities rely on as the main source of their live-lihoods and how well they know the market as enter-prises facing open competition with suppliers from other countries (Jaffee, 1995; Tisdell, 2001; Roberts, 2008). In India, for example, globalisation might drive the forest industry on wood and energy to import its raw materials and invest in plantations in other countries (Roberts, 2008). Second, intensive global forestry investment in estates (e.g. oil palm plantations) and agricultural crops (e.g. soybean), has led to more conversion of forest lands to other uses and also, displacing lands for food, creating local food security problems, shifts in labour and other capital allocations (Molnar et al., 2011; Hoyle and Levang, 2012; Pacheco, 2012). Third, CF manage-ment principles have not been robust enough to face the new challenges coming from trade liberalisation, and adding to them the decreasing role of the state. Globalisation is often perceived as the end of the state (Haan, 2000). On the other hand, communities involved in CF do not have adequate management and financial
capacity, nor do they have the business knowledge and skills required to deal with international investors and traders (Jaffee, 1995; Antinori and Bray, 2005; Nawir, 2012). Local products cannot compete with imported mass-produced products. Therefore, there are two possible consequences: (1) a drop in prices and profits received by local producers; and (2) increased pressure on forests since they have to switch to unsustainable practices to instantly compensate the decreasing returns from the drop in price and profits.
Components of Feasible and Viable CF Enterprises
Following the increasing complexities and multiple-objectives catered by various CF approaches; scholars identify key components in providing the guidance in initiating and implementing successful CF. These key components are important for feasible and viable CF in facing the dynamic globalised economic climate. CF as enterprises need to be prepared to face globalisation and trade liberalisation; however, adopting industrial forestry methods (with their attendant work rhythms and financial demands) can place severe strains on tradi-tional cultural beliefs and authority systems (Forster and Vargas, 1995). Tailoring the approach to empower CF as enterprises thus becomes crucial (Jaffee, 1995). There are three major principles/indicators in preparing CF to be resilient in facing the dynamic globalised economic climate as enterprises: first, is the pre-conditions for a feasible CF programme, second, is the key indicators in measuring the successful impact of CF implementa-tion, and third, is direct and indirect incentives to support feasible and competitive community enterprises.
Pre-Conditions for Successful CF
There are two major precondition categories first, those to be considered at the community management level, and second, those involving third parties (Table 2). At the community management level there are seven precon-ditions that provide a useful checklist in analysing what should be there to start with or in identifying the gaps in the existing conditions. Therefore, areas for improve-ment can be planned as part of the CF development programme. In line with the preparation steps, at the community management level, there are at least five necessary preconditions involving commitment from third parties, particularly the government in charge of managing the forest area. The underlying principle for the second category of pre-conditions is that there should be a process of devolution or decentralisation of rights, responsibilities, and authority from the state to forest communities (Charnley and Poe, 2007). It is expected that there is a more significant local control for more ecologically sustainable forest use and a better forest condition, as well as providing greater benefits from the improved forest and forest management for
120 | IUFRO 3.08.00 Small-Scale Forestry
Towards commercially oriented community forestry management: coping with economic globalisation and commercialisation
the community (Charnley and Poe, 2007). These condi-tions are important for implementing benefit and power sharing, as discussed further in the next section.
Measures of Success in Implementing the CF Approach
In preparing CF to be resilient when facing the dynamic globalised economic climate as enterprises, the second key indicators in guiding the implementation refer to the measures of expected successful impacts. From a worldwide analysis of 69 article-based case studies , it is suggested that there are three main indicator groups to measure success: ecological sustainability, equity, effi-ciency (Table 2) (Pagdee et al., 2006). The ecological sustainability indicators focus on maintaining forest as the main natural capital as the centre of CF management by maintaining and improving the forest conditions, as well as addressing environmental degradation.
A mechanism for allocating benefits and costs through a benefit-sharing principle is the centre of the equity indica-tors as part of the measures of success in implementing CF in practice. The benefit-sharing mechanism provides forest communities with de jure/legalised access rights to forests and a share of the benefits derived from forests often generated by external commercial parties. This should cover the revenue generated from forest products, or jobs associated with forest-based activi-ties; and/or local investment in community develop-ment projects in buffer zones (Wily and Mbaya, 2001; Dhakal and Masuda, 2009; Mahanty et al., 2009). For example, the main aim of this approach in Southern Africa is to secure local co-operation in management, and in Zimbabwe, building on the Campfire programme (Wily and Mbaya, 2001).
The third measure on the efficiency indicators focuses on ensuring both local needs and the need for addressing the governance aspect, such as focussing on reducing conflicts and resolving mismanagement are required in implementing successful CF. Applying the efficiency indi-cators requires a power-sharing principle, which focuses on involving forest communities as managers based on devolving authority provided to them by the state as the incentives for communities to engage in sustainable forest use and management (Carlsson, 2000; Wily and Mbaya, 2001). The aim in power-sharing approaches is to localise management and put it into the hands of that group of society perceived as having the strongest and most sustained vested interest in the forest’s future (Wily and Mbaya, 2001). With moves towards decen-tralisation and devolution, the transfer of power has mostly been in the form of joint management between government and local user communities, rather than complete devolution of rights and responsibilities to the latter (Berkes et al., 1991; Arnold, 1998; Arnold, 2001; Matose, 2006). The co-management has been imple-mented through different partnership arrangements,
power-sharing and integration of local and centralised management systems as the essential components (Pomeroy and Berkes, 1997; Sandstrom and Widmark, 2007). There has been an increasing shift from passive to active community participation under Adaptive Collab-orative Management (ACM) (Arnold, 2001; Nayak, 2004; Armitage et al., 2008). At the end of ACM-based projects in Nepal and the Philippines, the researchers believed that ACM had provided realistic opportunities for the communities that enabled them to manage the forest resources sustainably, and share the livelihood benefits equitably (Hartanto et al., 2003; McDougall et al., 2008). However, implementing the ACM approach appropriately and effectively is quite challenging and takes up a lot of resources (e.g. time and budget). It requires reasonably clear property rights to the resources of concern (e.g. fisheries, forest), commitment to support a long-term institution-building process, key leaders or individuals prepared to champion the process, and the openness of participants to share and draw upon a plurality of knowl-edge systems and sources (Armitage et al., 2008).
direct and Indirect Incentives to Support Feasible and Competitive Community Enterprises
Beyond the community management level, to be feasible and competitive under dynamic commercialised and globalised economic conditions, there should be a policy framework that provides direct and indirect incentives in place. ‘Incentives’ is defined as: ‘Policy instruments that increase the comparative advantage of forest plantations and thus stimulates investment in plantation establish-ment and management (Enters et al., 2004)’.
There are three important reasons why creating the right incentives is well grounded. First, there is a high expecta-tion that under the current trends of implementing decen-tralisation and devolution of power to local communi-ties, the roles of government have shifted, from being involved directly in implementing any programme, to taking prominent roles in providing direction, facilitating and stimulating the key agents to be interested in imple-menting any forestry related programmes voluntarily (Berkes et al., 1991; Meijerink, 1997; World Bank, 1998; Carlsson and Berkes, 2005). Second, a‘command-and-control’ approach, in the absence of economic incentives has been demonstrated to be ineffective in stimulating NRM (Natural Resources Management) and for refor-estation initiatives to be successfully executed (Wunder, 2005; Nawir et al., 2007).
The incentives are divided into direct and indirect incen-tives. Indirect incentives are categorised into variable and enabling incentives. Direct incentives include, for example: seedlings, specific provision of local infrastruc-ture to support plantations, grants, tax concessions, differential fees, subsidized loans, and cost-sharing arrangements. There are two categories of variable incentives, which are sectoral incentives (e.g. input and
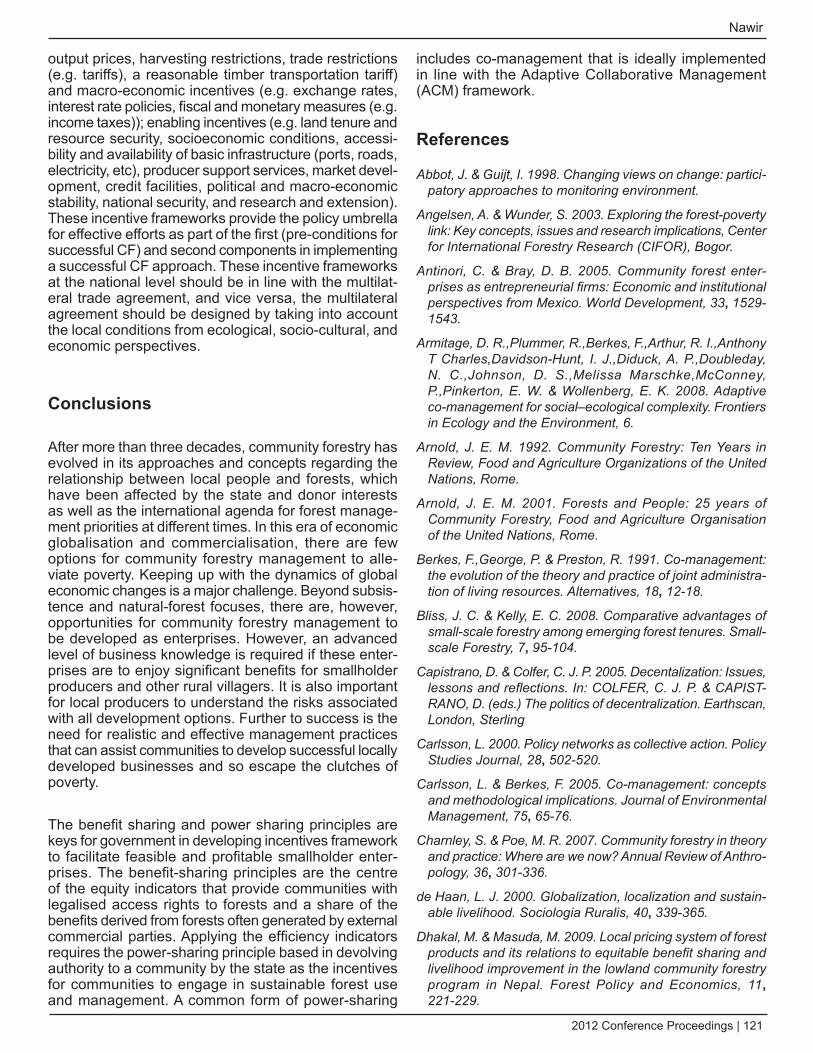
2012 Conference Proceedings | 121
Nawir
output prices, harvesting restrictions, trade restrictions (e.g. tariffs), a reasonable timber transportation tariff) and macro-economic incentives (e.g. exchange rates, interest rate policies, fiscal and monetary measures (e.g. income taxes)); enabling incentives (e.g. land tenure and resource security, socioeconomic conditions, accessi-bility and availability of basic infrastructure (ports, roads, electricity, etc), producer support services, market devel-opment, credit facilities, political and macro-economic stability, national security, and research and extension). These incentive frameworks provide the policy umbrella for effective efforts as part of the first (pre-conditions for successful CF) and second components in implementing a successful CF approach. These incentive frameworks at the national level should be in line with the multilat-eral trade agreement, and vice versa, the multilateral agreement should be designed by taking into account the local conditions from ecological, socio-cultural, and economic perspectives.
Conclusions
After more than three decades, community forestry has evolved in its approaches and concepts regarding the relationship between local people and forests, which have been affected by the state and donor interests as well as the international agenda for forest manage-ment priorities at different times. In this era of economic globalisation and commercialisation, there are few options for community forestry management to alle-viate poverty. Keeping up with the dynamics of global economic changes is a major challenge. Beyond subsis-tence and natural-forest focuses, there are, however, opportunities for community forestry management to be developed as enterprises. However, an advanced level of business knowledge is required if these enter-prises are to enjoy significant benefits for smallholder producers and other rural villagers. It is also important for local producers to understand the risks associated with all development options. Further to success is the need for realistic and effective management practices that can assist communities to develop successful locally developed businesses and so escape the clutches of poverty.
The benefit sharing and power sharing principles are keys for government in developing incentives framework to facilitate feasible and profitable smallholder enter-prises. The benefit-sharing principles are the centre of the equity indicators that provide communities with legalised access rights to forests and a share of the benefits derived from forests often generated by external commercial parties. Applying the efficiency indicators requires the power-sharing principle based in devolving authority to a community by the state as the incentives for communities to engage in sustainable forest use and management. A common form of power-sharing
includes co-management that is ideally implemented in line with the Adaptive Collaborative Management (ACM) framework.
References
Abbot, J. & Guijt, I. 1998. Changing views on change: partici-patory approaches to monitoring environment.
Angelsen, A. & Wunder, S. 2003. Exploring the forest-poverty link: Key concepts, issues and research implications, Center for International Forestry Research (CIFOR), Bogor.
Antinori, C. & Bray, d. B. 2005. Community forest enter-prises as entrepreneurial firms: Economic and institutional perspectives from Mexico. World development, 33, 1529-1543.
Armitage, d. R.,Plummer, R.,Berkes, F.,Arthur, R. I.,Anthony T Charles,davidson-Hunt, I. J.,diduck, A. P.,doubleday, N. C.,Johnson, d. S.,Melissa Marschke,McConney, P.,Pinkerton, E. W. & Wollenberg, E. K. 2008. Adaptive co-management for social–ecological complexity. Frontiers in Ecology and the Environment, 6.
Arnold, J. E. M. 1992. Community Forestry: Ten Years in Review, Food and Agriculture Organizations of the United Nations, Rome.
Arnold, J. E. M. 2001. Forests and People: 25 years of Community Forestry, Food and Agriculture Organisation of the United Nations, Rome.
Berkes, F.,George, P. & Preston, R. 1991. Co-management: the evolution of the theory and practice of joint administra-tion of living resources. Alternatives, 18, 12-18.
Bliss, J. C. & Kelly, E. C. 2008. Comparative advantages of small-scale forestry among emerging forest tenures. Small-scale Forestry, 7, 95-104.
Capistrano, d. & Colfer, C. J. P. 2005. decentalization: Issues, lessons and reflections. In: COLFER, C. J. P. & CAPIST-RANO, d. (eds.) The politics of decentralization. Earthscan, London, Sterling
Carlsson, L. 2000. Policy networks as collective action. Policy Studies Journal, 28, 502-520.
Carlsson, L. & Berkes, F. 2005. Co-management: concepts and methodological implications. Journal of Environmental Management, 75, 65-76.
Charnley, S. & Poe, M. R. 2007. Community forestry in theory and practice: Where are we now? Annual Review of Anthro-pology, 36, 301-336.
de Haan, L. J. 2000. Globalization, localization and sustain-able livelihood. Sociologia Ruralis, 40, 339-365.
dhakal, M. & Masuda, M. 2009. Local pricing system of forest products and its relations to equitable benefit sharing and livelihood improvement in the lowland community forestry program in Nepal. Forest Policy and Economics, 11, 221-229.
122 | IUFRO 3.08.00 Small-Scale Forestry
Towards commercially oriented community forestry management: coping with economic globalisation and commercialisation
dunning, G. 2007. The potential of commercial forestry to reduce poverty. In: OBERNdORF, R., dURST, P., MAHANTY, S., BURSLEM, K. & SUZUKI, R. (eds.) A cut for the poor. FAO and RECOFT, Bangkok.
Enters, T.,durst, P. B.,Brown, C.,Carle, J. & McKenzie, P. 2004. What does it take? The role of incentives in forest plantation development in Asia adn the Pacific. Executive summary. RAP Publication 2004/28. Asia-Pacific Forestry Commission, Food and Agriculture Organization of the United Nations, Regional office for Asia and the Pacific, Bankok.
Fisseha, Y. 1987. Small-scale forest-based processing enter-prises, FAO, Rome.
Glasmeier, A. K. & Farrigan, T. 2005. Understanding commu-nity forestry: a qualitative meta-study of the concept, the process, and its potential for poverty alleviation in the United State case. The Geographical Journal, 171, 56-69.
Haan, L. J. d. 2000. Globalization, localization and sustain-able livelihood. Sociologia Ruralis, 40, 339-365.
Hansen, S. 1990. Macroeconomic policies and sustainable development in the Third World. Journal of International development, 2, 533-557.
Harrison, S. & Suh, J. 2004. Progress and prospect of community forestry in developing and developed coun-tries. Small-scale Forest Economics, Management and Policy, 3, 287-302.
Hartanto, H.,Lorenzo, M. C.,Valmores, C.,Arda-Minas, L.,Burton, E. M. & Prabu, R. 2003. Learning together: Responding to change and complexity to improve commu-nity forests in the Philippines CIFOR, Bogor.
Hoyle, d. & Levang, P. 2012. Oil palm development in Cameroon. WWF Cameroon, Cameroon.
Jaffee, d. 1995. Confronting globalization in the commu-nity forests of Michoacán, Mexico: Free trade, neoliberal reforms, and resource degradation. Institute for Environ-mental Studies, Madison.
Kubo, H. 2009. Incorporating agency perspective into commu-nity forestry analysis. Small-scale Forestry, 8, 305-321.
Mahanty, S.,Guernier, J. & Yasmi, Y. 2009. A fair share? Sharing the benefist and costs of collaborative forest management. International Forestry Review, 11, 268-280.
Mallik, A. U. & Rahman, H. 1994. Community forestry in developed and developing countries. The Forestry Chron-icle, 70, 731-735.
Mcdougall, C.,Ojha, H.,Banjade, M. R.,Pandit, B. H.,Bhattarai, T.,Maharjan, M. & Rana, S. 2008. Forests of learning: Expe-riences from research on an adaptive collaborative approach to community forestry in Nepal, CIFOR, Bogor.
Meijerink, G. W. 1997. Incentives for tree growing and managing forest sustainably: more than just carrots and sticks Stichting BOS, Wagenigen.
Molnar, A.,Barney, K.,deVito, M.,Karsenty, A.,Elson, d.,Benavides, M.,Tipula, P.,Soria, C.,Shearman, P. & France, M. 2011. Large acquisition of rights on forest lands for tropical timber concessions and commercial wood plan-tations. Policy Brief. International Land Coalition, Rome.
Nawir, A. A. 2012. Strategies to enhance small-scale commer-cial tree-growing inside state forests in Indonesia (Case study analysis in Jambi, West Kalimantan and West Nusa Tenggara). Phd Thesis, Australian National University.
Nawir, A. A.,Murniati,Rumboko, L.,Hiyama, C. & Gumartini, T. 2007. Chapter 5. Portraits of rehabilitation projects in Indonesia: impacts and lessons learnt. In: NAWIR, A. A., MURNIATI & RUMBOKO, L. (eds.) Forest rehabilitation in Indonesia: Where to after more than three decades? Center for International Forestry Research (CIFOR), Bogor, Indo-nesia.
Nawir, A. A.,Santoso, L. & Mudhofar, I. 2003. Towards mutually beneficial company-community partnerships in timber plantation: lessons learnt from Indonesia. Working Paper 26. CIFOR (Center for International Forestry Research), Bogor.
Neumann, R. P. & Hirsch, E. 2000. Commercialisation of non-timber forest products: review and analysis of reserach, CIFOR (Center for International Forestry Research) and FAO (Food and Agriculture Organization of the United Nations, Bogor and Rome.
Noordwijk, M. V.,Roshetko, J. M.,Murniati,Angeles, M. d.,Suyanto,Fay, C. & Tomich, T. P. 2008. Farmer tree planting barriers to sustainable forest management. In: SNELdER, d. J. & LASCO, R. d. (eds.) Smallholder tree growing for rural development and environmental services: Lessons from Asia. Advances in agroforestry volume 5. Springer.
Pacheco, P. 2012. Soybean and oil palm expansion in South America. A review of main trends and implications, Center for International Forestry Research (CIFOR), Bogor.
Pagdee, A.,Kim, Y. & daugherty, P. J. 2006. What makes community forest management successful: A meta-study from community forests throughout the world. Society & Natural Resources, 19, 33-52.
Pardo, R. 1995. Community forestry comes of age Journal of Forestry 93, 20-24.
Pleumarom, A. 2007. Tourism, globalisation and sustainable development. Tourism Investigation and Monitoring Team, Untamedpath, Bangkok.
Poffenberger, M. 2006. People in the forest: community forestry experiences from Southeast Asia. International Journal Environment and Sustainable development, 5, 57-69.
Roberts, d. G. 2008. Globalisation and its implications for the Indian forest sector. International Forestry Review, 10, 401-413.
Roshetko, J. M.,Snelder, d. J.,Lasco, R. d. & Noordwijk, M. V. 2008. Future challenge: A paradigm shift in the forestry sector. In: SNELdER, d. J. & LASCO, R. d. (eds.) Small-
2012 Conference Proceedings | 123
Nawir
holder tree growing for rural development and environ-mental services: Lessons from Asia. Advances in agrofor-estry volume 5. Springer.
Scherr, S. J.,White, A. & Kaimowitz, d. 2003. Making markets work for forest communities. International Forestry Review, 5, 67-73.
Snelder, d. J. & Lasco, R. d. 2008. Smallholder tree growing in South and Southeast Asia. In: SNELdER, d. J. & LASCO, R. d. (eds.) Smallholder tree growing for rural development and environmental services: Lessons from Asia. Advances in agroforestry volume 5. Springer.
Solesbury, W. 2003. Sustainable livelihoods: A case study of the evolution of dFId policy, Overseas development Insti-tute, London.
Sunderlin, W. d.,Angelsen, A.,Belcher, B.,Burgers, P.,Nasi, R.,Santoso, L. & Wunder, S. 2004. Livelihoods, forests, and conservation in developing countries: An overview. World development, 33, 1383-1402.
Tisdell, C. 2001. Globalisation and sustainability: environ-mental Kuznets curve and the WTO. Ecological Economics, 39, 185-196.
Vedeld, P.,Angelsen, A.,Sjaastad, E. & Kobugabe, B. 2004. Counting on the environment: Forest incomes for the rural poor. Environmental Economic Series No. 98. World Bank, Washington, d. C.
White, A. & Martin, A. 2002. Who owns the world’s forests? Forest tenure and public forests in transition. Forest Trends, Washington, d. C.
Wily, L. A. & Mbaya, S. 2001. Land, People, and Forests in Eastern and Southern Africa at the Beginning of the 21st Century, World Conservation Union (IUCN), Nairobi, Kenya.
Wollenberg, E. & Nawir, A. S. 1998. Estimating the incomes of people who depend on forests. In: WOLLENBERG, E. & INGLES, A. (eds.) Incomes from the forest: methods for the development and conservation of forest products for local communities. CIFOR and IUCN, Bogor.
World Bank 1998. Report from the international Community-Based Natural Resource Management (CBNRM) workshop, 10-14 May 1998.
Wunder, S. 2005. Payment for environmental services: some nuts and bolts, Center for International Forestry Research (CIFOR), Bogor.
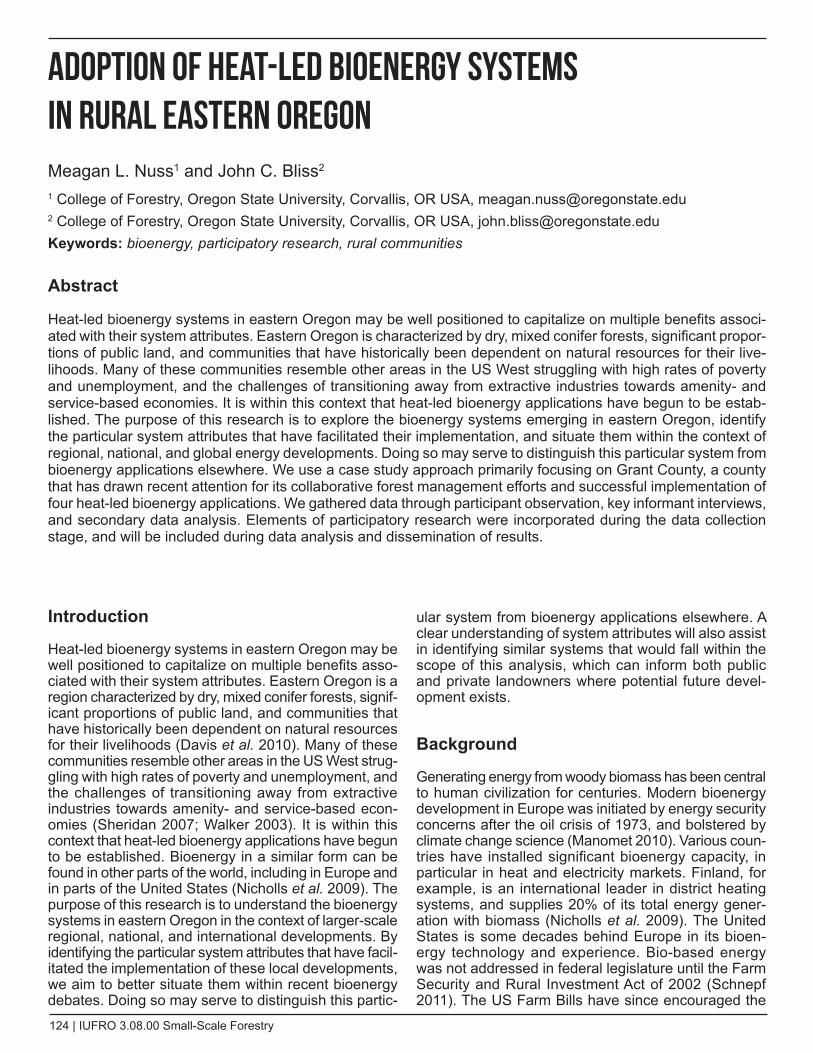
124 | IUFRO 3.08.00 Small-Scale Forestry
Introduction
Heat-led bioenergy systems in eastern Oregon may be well positioned to capitalize on multiple benefits asso-ciated with their system attributes. Eastern Oregon is a region characterized by dry, mixed conifer forests, signif-icant proportions of public land, and communities that have historically been dependent on natural resources for their livelihoods (Davis et al. 2010). Many of these communities resemble other areas in the US West strug-gling with high rates of poverty and unemployment, and the challenges of transitioning away from extractive industries towards amenity- and service-based econ-omies (Sheridan 2007; Walker 2003). It is within this context that heat-led bioenergy applications have begun to be established. Bioenergy in a similar form can be found in other parts of the world, including in Europe and in parts of the United States (Nicholls et al. 2009). The purpose of this research is to understand the bioenergy systems in eastern Oregon in the context of larger-scale regional, national, and international developments. By identifying the particular system attributes that have facil-itated the implementation of these local developments, we aim to better situate them within recent bioenergy debates. Doing so may serve to distinguish this partic-
ular system from bioenergy applications elsewhere. A clear understanding of system attributes will also assist in identifying similar systems that would fall within the scope of this analysis, which can inform both public and private landowners where potential future devel-opment exists.
Background
Generating energy from woody biomass has been central to human civilization for centuries. Modern bioenergy development in Europe was initiated by energy security concerns after the oil crisis of 1973, and bolstered by climate change science (Manomet 2010). Various coun-tries have installed significant bioenergy capacity, in particular in heat and electricity markets. Finland, for example, is an international leader in district heating systems, and supplies 20% of its total energy gener-ation with biomass (Nicholls et al. 2009). The United States is some decades behind Europe in its bioen-ergy technology and experience. Bio-based energy was not addressed in federal legislature until the Farm Security and Rural Investment Act of 2002 (Schnepf 2011). The US Farm Bills have since encouraged the
Adoption of heat-led Bioenergy Systems in Rural Eastern OregonMeagan L. Nuss1 and John C. Bliss2 1 College of Forestry, Oregon State University, Corvallis, OR USA, [email protected] College of Forestry, Oregon State University, Corvallis, OR USA, [email protected] Keywords: bioenergy, participatory research, rural communities
Abstract
Heat-led bioenergy systems in eastern Oregon may be well positioned to capitalize on multiple benefits associ-ated with their system attributes. Eastern Oregon is characterized by dry, mixed conifer forests, significant propor-tions of public land, and communities that have historically been dependent on natural resources for their live-lihoods. Many of these communities resemble other areas in the US West struggling with high rates of poverty and unemployment, and the challenges of transitioning away from extractive industries towards amenity- and service-based economies. It is within this context that heat-led bioenergy applications have begun to be estab-lished. The purpose of this research is to explore the bioenergy systems emerging in eastern Oregon, identify the particular system attributes that have facilitated their implementation, and situate them within the context of regional, national, and global energy developments. Doing so may serve to distinguish this particular system from bioenergy applications elsewhere. We use a case study approach primarily focusing on Grant County, a county that has drawn recent attention for its collaborative forest management efforts and successful implementation of four heat-led bioenergy applications. We gathered data through participant observation, key informant interviews, and secondary data analysis. Elements of participatory research were incorporated during the data collection stage, and will be included during data analysis and dissemination of results.
2012 Conference Proceedings | 125
Nuss and Bliss
development of biomass liquid fuels, and state-by-state renewable portfolio standards (RPS) have encouraged renewable energy in the form of electricity (Nicholls et al. 2008). Unlike in Europe, a number of factors have put heat-led uses of biomass (e.g., primary generation of thermal heat) in a little-heard position in policy and development.
Biomass can refer to many forms of biological material, however in this paper we focus on woody biomass as a result of forest management, restoration, hazardous fuels treatments, and mill residues (Becker et al. 2010). Bioen-ergy can vary widely with respect to feedstock require-ments, scale, conversion technology, end products, and other production attributes. Furthermore, the system of removing biomass material from the woods, processing it, and converting it into energy is embedded in complex interactions of social, economic, and ecological factors (Buchholz et al. 2007; Gaudreau and Gibson 2005).
The Blue Mountain Ecoregion provides the context of our case study. The region is rich in diversity, and includes sagebrush and juniper, low- to mid-elevation ponde-rosa pine forests, dry to mesic mixed conifer, and alpine vegetation (Johnson et al. 1994; Davis et al. 2010). The landscape has evolved with and adapted to distur-bances, including disease, insects, and fire (Johnson et al. 1994; Johnson 1994; Hessburg et al. 1994). Histor-ical fire regimes in the ecoregion have included frequent low-severity fire as well as mixed- to high-severity fire, depending on site species, climatic conditions, and fuel buildup (Agee 1993). Forest management on federal lands encouraged fire suppression and the conversion of old forests to young stands throughout the latter half of the 20th century (Oregon State of the Environment Report 2000). As a result, public forests in the Blue Mountain region (more than fifty percent of the area) have become denser and at risk of mortality from high-severity fire, disease, or insects.
In addition to a shared ecological landscape, communi-ties in eastern Oregon have similar socioeconomic chal-lenges. Recent poverty rates in the six counties of the ecoregion were about 15.6%, while unemployment was 13.2% (Davis et al. 2010). They resemble many other communities in the US West undergoing a transition that is reflected by, among other things, shifts from extractive industries towards amenity services, and an influx of new migrants holding different political and social values from longstanding residents (Sheridan 2007; Walker 2003). Timber production objectives dominated forest manage-ment through most of the twentieth century, until policy changes contributed to dramatic declines in harvests on federal land in the 1990s and 2000s (Hamilton et al. 2012). As with other areas in the west, conflict over proper management of public lands has contributed to a divisive history between stakeholders (Bergmann and Bliss 2004).
We begin with a brief literature review regarding system attributes that have been identified as relevant for bioen-ergy systems. We then outline the methodological foun-dations of this research. Finally, we comment on our preliminary observations with regard to the system attri-butes of the bioenergy developments in eastern Oregon, and consider the implications of these attributes.
System Attributes
Forest Ecosystem
Various forms of biomass-to-energy scenarios have been criticized for the land use changes associated with feedstock characteristics (Searchinger et al. 2008; Gillon 2010; Ariza-Montobbio et al. 2010). For woody biomass production, the science is still uncertain regarding poten-tial ecosystem impacts, for example, regarding nutrient cycling, hydrology, energy balance, and biodiversity (Janowiak and Webster 2010, ForestGuild 2010). Considerably more research has been devoted to assessing carbon implications of these activities.
The carbon dynamics of a forest ecosystem are affected by climate, past and present disturbance regimes, forest age, and forest type (Harmon et al. 2009; Hoover and Stout 2007; Hudiburg et al. 2009; Campbell et al. 2009). While gauging the carbon benefits or losses of bioen-ergy production relative to “business as usual” also depends on these factors, recent research suggests that any increase in intensity or frequency of disturbance will almost always outweigh other processes and result in increased carbon emissions (Campbell et al. 2011; Hudiburg et al. 2011; Mitchell et al. 2009).
However, disagreement remains regarding tradeoffs between high-severity wildfire emissions and those resulting from fuel reduction treatments to mitigate such fire events (Hurteau and Brooks 2011; Hurteau and North 2009; Campbell et al. 2011). Hurteau and North (2009) argue that removing understory vegetation in overstocked forests with historically frequent fire regimes mitigates the potential for significant emissions entering the atmosphere via stand-replacing fires. Campbell et al. (2011), however, suggest that such effects may only be achieved if treatments succeed in altering the maximum biomass potential, i.e., prevent an ecosystem state change.
Mitchell et al. (2009) considered the effects of fire, harvests, and bioenergy production on three types of forests in Oregon: the Coast Range, west Cascades, and east Cascades. Their analysis clearly demonstrates that even when including harvested wood product stores of carbon and offset fossil fuels from bioenergy use, managing forests in the Coast Range or west Cascades for bioenergy will not increase carbon stores over what would have been stored in the forest itself. However,
126 | IUFRO 3.08.00 Small-Scale Forestry
Adoption of heat-led bioenergy systems in rural eastern Oregon
modeled understory removal of vegetation in the east Cascades forest resulted in slight, but significant, additional carbon storage. A similar pattern is seen in Hudiburg et al. (2011). While 16 of the 19 studied ecore-gions demonstrated increased carbon emissions under bioenergy management schemes, the remaining regions were found to potentially benefit from a combination of fire prevention strategies and bioenergy production.
The uncertainty related to the interaction between distur-bance, management, and carbon dynamics in fire-prone regions will likely best be addressed at finer scales and in site-specific cases. It is beyond the scope of this paper to analyze these processes further, however the ongoing debate suggests that the potential negative carbon impacts of bioenergy production in some regions may not apply to forest ecosystems with historically frequent and low-severity fire regimes (Mitchell et al. 2009; Hurteau and North 2009; Hudiburg et al. 2011).
End Product
Whether the end energy product of the conversion process in a biomass project is electricity or heat has important economic and environmental implications. Converting biomass to electricity using direct combus-tion with a steam turbine can yield between 15 and 35% efficiency (Peterson and Haase 2009). Generating heat or co-generating electricity, alternatively, captures 80 to 90% of the potential energy (Biomass Combus-tion and Co-firing 2001; Manomet 2010). As a result of this difference in efficiencies, the supply needs of an electric versus a heat facility can be significant. A power facility will require more material to generate the same amount of energy as a thermal facility. High feed-stock demand may force project managers to procure material from sources further away, which will affect costs and potential accessibility. Longer-term contracts may also be required to mitigate risk associated with higher supply needs. These issues may still be relevant to heat-led systems, but will be less so than electric-only facilities.
An additional component of heat-led versus power-led generation is the availability of alternative energy options. Up to 70% of electricity in Oregon is supplied by cheap, abundant hydropower (EERE 2012). While Oregon has an RPS requirement to meet 25% of the state’s energy needs with eligible renewable energies by 2025, the prevalence of wind energy has kept the value of Renewable Energy Credits low. These cheap power competitors force biomass electricity into low market values. Alternatively, many rural Oregonians do not have access to natural gas for thermal heating, and rely on fuel oil or propane. These options have both been rising in price, and can account for signifi-cant proportions of building operating costs (EIA 2012). The efficiency of heat, in addition to the absence of a
cheap energy competitor, can make using biomass for heat an obvious economic decision for rural communi-ties near an available supply.
Scale
A body of literature suggests small-scale bioenergy applications may be preferred over large-scale in many instances. In thermal energy, micro- or small-scale is often considered to be less than 1 MW to 5 MW (equivalent to less than 17.1 million Btu/hr) (Zerbe 2006), although this range has also included medium-scale projects (Peterson and Haase 2009). Burton and Hubacek (2007) consider large-scale projects as typically favored for their perceived financial advan-tages, as well as their general degree of government support relative to smaller projects (at least in the UK). Their analysis of renewable energies at various scales suggests that small-scale projects tend to have greater ecological and social benefits (including, for example, general impact on the environment and ability to keep money in the community), while larger-scale projects tend to be more economically viable.
Buchholz and Volk (2008) question the assumption that economies of scale are always achieved in large projects, and compare a 50 MW biomass power plant to a 200 kW biomass cogeneration plant using a systems theory framework. A central theme in their analysis is recognizing the respective facilities as nested in larger social and ecological systems, and that increasing the scale of the plant necessitates increased spatial and temporal complexity and risk. For example, larger projects usually require longer planning and implemen-tation periods, and must respond to cumbersome regu-lations. While a small-scale project may be able to repay its capital investment in a decade, a large project must have a longevity that enables long-term financing. The authors go on to address efficiency, social aspects, and impacts on the ecosystem, and conclude that the distinct benefits of a small-scale bioenergy system become more obvious when analysis goes beyond traditional cost-benefit analysis or environmental and social impact assessments. They recommend, additionally, that small-scale systems be held to less stringent rules so as to facilitate flexibility and innovation in their implementa-tion.
Cluster development and distributed Economies
Rather than favoring a particular scale of operation, the concepts of cluster development and distributed econo-mies are more concerned with the relationship between entities. Both terms refer to loosely bounded geographic clusters of closely related companies that function with some degree of cooperation among them (Barkley and Henry 1997; Porter 2000; Johansson et al. 2005). They are both described as being particularly applicable either
2012 Conference Proceedings | 127
Nuss and Bliss
in declining industries in need of revitalization (Barkley and Henry 1997; Bratkovich et al. 2009) or in areas that are experiencing a transition towards new modes of operation (Johansson et al. 2005). Expanding on Buchholz and Volk (2008), Barkley and Henry (1997) suggest that entities in industrial clusters can collec-tively result in significant cost savings by capitalizing on economies that are “external to the firms but internal to the cluster” (313). The authors describe four cluster types that range in their characteristics and degree of business interdependencies. Of particular interest to our study site are hub-and-spoke clusters, which are dominated by one or several large firms and surrounded by suppliers and service providers. Smaller firms may locate to the region to buy or sell from the anchor firm, or take advantage of services and other benefits attrib-uted to the aggregate cluster.
Accessibility of Supply
Peterson and Haase (2009) consider resource avail-ability to be the most important issue for the economics and long-term sustainability of a bioenergy project. In Oregon as well as in the greater United States, a number of studies have investigated the physical availability of biomass (Bowyer 2006; ORNL 2011; White 2010). The technical availability of woody biomass (e.g., the logis-tics of getting the material out of the woods) presents a number of challenges, because removing this material from the forest typically involves a high harvest cost to economic value ratio (Evans and Finkral 2009; Nicholls et al. 2008). Hauling distances and transportation costs are important factors, as are payment strategies. If a facility is only receiving byproducts from commercial harvests, operation costs will be easier to cover with the high-value sawlog material. If fuel reduction treat-ments supply the majority of a biomass plant, it may be difficult to generate enough value to make activities pay for themselves.
Recent research has also examined the social avail-ability of biomass, including stakeholder perspectives on barriers and opportunities to utilizing biomass for energy. The social availability of material will be nested within cultural, economic, and regional contexts, and will also differ depending on forest ownership (Nielsen-Pincus and Moseley 2009). In addition, historical tension and distrust between stakeholders can act as a barrier to accessing material (Stidham and Simon-Brown 2011).
Methodology
To understand the attributes that have facilitated the development of bioenergy in eastern Oregon, we use a case study approach focusing on bioenergy develop-ments in Grant County. The county has drawn recent attention for its collaborative forest management efforts and successful implementation of four heat-led bioen-
ergy applications. We also consider Harney County and Wallowa County in our analysis, as two other eastern Oregon areas that have installed heat-led bioenergy capacities.
The first author spent the summer of 2012 in Grant County conducting participant observation to become familiar with the community, introduce the project to community members, and discuss research ideas with key informants. Key informants and community members were solicited for feedback on research questions early on, and will be involved with data analysis and deter-mining appropriate means of distributing results. Six key informant interviews have been conducted to date, with a target of around twenty. Interviewees were selected first by purposive sampling, then by snowball sampling. In addition, ongoing data analysis and literature review is being conducted to fact-check interview data and provide further context for the local developments.
Preliminary Observations
The context of Grant County and the region provides parameters within which bioenergy has developed. Degraded federal forest conditions and diminishing value on private forestland has prompted collabora-tive efforts through the Blue Mountain Forest Partners (BMFP) to facilitate a means of restoring forest func-tions and reestablishing active management in over-stocked ponderosa pine forest ecosystems (Davis et al. 2010). Social acceptance of fuel reduction treatments in these ecosystems has enabled the US Forest Service to utilize creative management tools to remove small-diameter biomass trees on the Malheur National Forest. The primary driver of the eventual bioenergy systems in this region arose from a felt need to develop a market for this low-value material. Tied closely to this objective is the perceived threat of stand-replacing wildfire and a widely felt desire to mitigate this possibility.
Our observations indicate that climate change and carbon accounting are largely, although not entirely, absent from conversations about bioenergy in this region. When carbon is discussed, it typically is in refer-ence to the perceived carbon and other particulate emis-sions that result from high-severity fires, which would be diminished with a functioning bioenergy market. While the literature is still divided about the carbon emissions of wildfire (e.g., Campbell et al. 2011; Hurteau and North 2009), high carbon costs associated with wildfires appears to be intuitively felt by many of the informants we spoke to.
An apparent conflict in the scale of treatments needed versus that of a feasible bioenergy application exists at the study site. The overriding objectives of forest health and wildfire mitigation in the region suggest that removal of understory vegetation and ladder fuels require efforts on a large-scale. This is further supported by assess-
128 | IUFRO 3.08.00 Small-Scale Forestry
Adoption of heat-led bioenergy systems in rural eastern Oregon
ments of physically available harvestable biomass. However, constraints related to financing and the end energy product seem to favor small-scale uses of bioen-ergy. For example, the biomass boilers installed in the three-county region are designed to closely match the actual heat load, which is often less than the nameplate capacity of the fossil fuel boilers they replace. In addition, different attempts to install medium-scaled cogenera-tion plants (approximately 2-10 MW of power capacity) have inevitably run against obstacles of cheap alterna-tive energy sources, lack of a sizeable heat load, or high infrastructure costs.
The multiple biomass boilers implemented in Grant, Wallowa, and Harney Counties have developed organi-cally in the form of clustered or distributed facilities. To a certain extent, each boiler acts as a demand “spoke” anchored to the “hub” of Malheur Lumber, although other pellet providers exist in the region as potential additional hubs. Aggregated together, the boilers have increased demand for pellets and consequently aided in offset-ting some of the costs of biomass removal, if slightly. Other attributes of clusters are in their early stages of developing, such as the recruitment of a shared main-tenance provider in Grant County. There is, neverthe-less, much room for expansion. Additional small-scale boilers can strengthen the demand for biomass material and attract other related businesses, such as a dedi-cated distributor of bulk pellets. Medium-scaled district heating projects could generate this pull to a greater degree. However, our observations indicate that even an increase in bioenergy applications such as these would not be sufficient to keep the Malheur Lumber mill in operation without an increase in merchantable sawlogs as well. The loss of the mill infrastructure would devastate the local economy, halt restoration activities on the Malheur Forest, disincentivize future bioenergy projects, and be difficult to reverse in the near future. Thus for the cluster to develop further, the full value-added market for timber products will likely need to be strengthened as well.
Finally, the social availability of biomass material in Grant County has been uniquely facilitated by BMFP efforts to work with and influence the Forest Service. The collaborative process has had moderate success thus far in producing the social contract needed to remove material from federal land. Stewardship contracts have also been an important tool to address technical avail-ability issues, by allowing more flexible and efficient uses of resources (Moseley and Davis 2010). It is unclear, however, if the social availability will remain uncon-tested if projects become larger and expand into new vegetation classes. Despite the benefits of stewardship contracts, technical availability of biomass remains a significant barrier to the long-term viability and success of these bioenergy developments. The high harvest cost and low value ratio of removing biomass necessi-tates the supplemental removal of higher-value material, which is less socially acceptable in some cases and
impossible in others. Conducting fuels reduction treat-ments for the bioenergy market alone almost inevitably remains economically infeasible, and requires subsidies of some form.
Conclusions
We have identified a number of attributes that potentially contribute to positive impacts of a bioenergy system. These include potential carbon benefits of supplied material from overstocked forests with historically frequent fire regimes; increased flexibility, decreased risk, and decreased supply demands of small-scale applications; efficient heat-led end products; economies of scale and transformative potential of cluster or distrib-uted economy development; and physical, technical, and social availability. Our preliminary observations suggest that the bioenergy system in eastern Oregon may be well positioned to capitalize on the positive implications of these attributes. In addition, the context of the ecological, economic, and social conditions of the region seem to inherently shape the characteristics of the system. These preliminary findings suggest that communities in eastern Oregon with similar characteris-tics as those included in this study might be opportune places for further development of heat-led bioenergy, especially if it continues in the trajectory of clusters. It also assists in identifying how other bioenergy scenarios in various contexts might perform. For example, because technical and social availability of biomass material from federal lands pose the largest challenges for our study site, a similar scenario pursued on non-industrial or industrial private land might be more successfully implemented. Additional system attributes would need to be examined before drawing firm conclusions about an alternate bioenergy system. From our observations, we posit that eastern Oregon is a region uniquely poised to generate positive bioenergy systems.
Acknowledgements
The Starker Program in Private and Family Forestry at Oregon State University provided financial support for this study.
References
Agee, J.K. 1993. Fire Ecology of Pacific Northwest Fires. Island Press: Washington dC.
Ariza-Montobbio, P. et al., 2010. The political ecology of Jatropha plantations for biodiesel in Tamil Nadu, India, Institut de Ciència i Tecnologia Ambientals (ICTA).
Barkley, d.L. and M.S. Henry. 1997. Rural industrial devel-opment: to cluster or not to cluster? Applied Economic Perspectives and Policy: 19(2): 308-325.
2012 Conference Proceedings | 129
Nuss and Bliss
Becker, dennis R., Cassandra Moseley, and Christine Lee. 2010. A supply chain analysis framework for assessing state-level forest biomass utilization policies in the United States. Biomass and Bioenergy, 35: 1429-1439.
Bergmann, S.A. and J.C. Bliss. 2004. Foundations of cross-boundary cooperation: Resource management at the public-private interface. Society and Natural Resources, 17: 377-392.
Biomass Combustion and Co-firing: An Overview. 2001. IEA Bioenergy Task 32. International Energy Agency.
“Blue Mountains Ecoregion”. 2006. Oregon Conservation Strategy.
Bowyer, Jim. 2006. Biomass energy and biofuels from Oregon’s forests. Prepared for Oregon Forest Resources Institute.
Bratkovich, S., K. Fernholz, J. Bowyer, A. Lindburg. 2009. Forest-based economic clusters: Models for sustainable economic development. dovetail Partners. 10pp.
Buchholz, T. and T. Volk. 2008. Is project scale the key to sustainable modern bioenergy systems? Berlin Confer-ence on the Human dimensions of Global Environmental Change.
Burton, J. and K. Hubacek. 2007. Is small beautiful? A multicri-teria assessment of small-scale energy technology applica-tions in local governments. Energy Policy, 35: 6402-6412.
Campbell, J., G. Alberti, J. Martin, and B.E. Law. 2009. Carbon dynamics of a ponderosa pine plantation following a thinning treatment in the northern Sierra Nevada. Forest Ecology and Management, 257: 453-463.
Campbell, J.L., M.E. Harmon, and S.R. Mitchell. 2011. Can fuel-reduction treatments really increase forest carbon storage in the western US by reducing future fire emis-sions? Frontiers in Ecology and the Environment.
davis, E.J., C. Moseley, and M. Nielsen-Pincus (eds). 2010. The State of the dry Forest Zone and its Communities. 95pp.
Energy Efficiency and Renewable Energy (EERE). 2012. “Oregon Energy Summary”. Available at http://apps1.eere.energy.gov/states/energy_summary.cfm/state=OR. Accessed 8/13/12.
Evans, A.M. and A.J. Finkral. 2009. From renewable energy to fire risk reduction: a synthesis of biomass harvesting and utilization case studies in US forests. GCB Bioenergy, 1: 211-219.
ForestGuild. 2010. Policy statement: forest biomass. Avail-able at http://www.forestguild.org/policy.html#policy_state-ments.
Gaudreau, K. and R.B. Gibson. 2010. Illustrating integrated sustainability and resilience based assessments: a small-scale biodiesel project in Barbados. Impact Assessment and Project Appraisal, 28(3): 233-243.
Gillon, S., 2010. Fields of dreams: negotiating an ethanol agenda in the Midwest United States. Journal of Peasant Studies, 37(4), pp.723–748.
Hamilton, L.C., J. Hartter, F. Stevens, R.G. Congalton, M. ducey, M. Campbell, d. Maynard, and M. Staunton. 2012. Forest views: Northeast Oregon survey looks at community and environment. Carsey Institute, 47: 1-12.
Harmon, M.E., A. Moreno, and J.B. domingo. 2009. Effects of partial harvest on the carbon stores of douglas-fir/Western hemlock forests: a simulation study. Ecosystems, 12: 777-791.
Hessburg, P., R. Mitchell, and G. Filip. 1994. Historical and current roles of insects and pathogens in eastern Oregon and Washington forested landscapes. USDA-USFS. Pacific Northwest Research Station. Gen Tech. PNW-GTR-327.
Hoover, C. and S. Stout. 2007. The carbon consequences of thinning techniques: Stand structure makes a difference. Journal of Forestry: 266-270.
Hudiburg, T., B. Law, d.P. Turner, J. Campbell, d. donato, M. duane. 2009. Carbon dynamics of Oregon and northern California forests and potential land-based carbon storage. Ecological Applications, 19(1): 163-180.
Hudiburg, T.W., B.E. Law, C. Wirth, and S. Luyssaert. 2011. Regional carbon dioxide implications of forest bioenergy production. Nature Climate Change, 1: 419-423.
Hurteau, M.d. and M.L. Brooks. 2011. Short- and long-term effects of fire on carbon in US dry temperate forest systems. BioScience, 61(2): 139-146.
Hurteau, M. and M. North. 2009. Fuel treatment effects on tree-based forest carbon storage and emissions under modeled wildfire scenarios. Frontiers in Ecology and the Environment: 409-414.
Janowiak M, and C. Webster. 2010. Promoting ecological sustainability in woody biomass harvesting. Journal of Forestry, 108(1): 16-23.
Johansson, A., Kisch, P. & Mirata, M., 2005. distributed econ-omies – A new engine for innovation. Journal of Cleaner Production, 13(10–11), pp.971–979.
Johnson, C. 1994. Forest health in the Blue Mountains: a plant ecologist’s perspective on ecosystem processes and biolog-ical diversity. USDA-USFS. Pacific Northwest Research Station. Gen. Tech. PNW-GTR-339.
Johnson, C., R. Clausnitzer, P. Mehringer, and C. Oliver. 1994. Biotic and abiotic processes of eastside ecosystems: the effects of management on plant and community ecology, and on stand and landscape vegetation dynamics. USdA-USFS. Gen. Tech. PNW-GTR-322.
Manomet Center for Conservation Sciences (Manomet). 2010. Biomass sustainability and carbon policy study.
Moseley, C. and E.J. davis. 2010. Stewardship Contracting for Landscape-Scale Projects. Ecosystem Workforce Program Working Paper Number 25. 24pp.
Mitchell, S.R., M.E. Harmon, K.E.B. O’Connell. 2009. Forest fuel reduction alters fire severity and long-term carbon storage in three Pacific Northwest ecosystems. Ecological Applications, 19(3): 643-655.
130 | IUFRO 3.08.00 Small-Scale Forestry
Adoption of heat-led bioenergy systems in rural eastern Oregon
Nicholls, d.L., R.A. Monserud, and d.P. dykstra. 2008. Biomass utilization for bioenergy in the western United States. Forest Products Journal, 58(1/2): 6-16.
Nicholls, d.L., R. Monserud, and d. dykstra. 2009. Interna-tional bioenergy synthesis-lessons learned and opportu-nities for the western United States. Forest Ecology and Management, 257(8), pp.1647–1655.
Nielsen-Pincus, M. & Moseley, C., 2009. Social Issues of Woody Biomass Utilization: A Review of the Literature. Available at: https://scholarsbank.uoregon.edu/xmlui/handle/1794/10770.
Oakridge National Laboratory. 2011. U.S. Billion-ton update: biomass supply for a bioenergy and bioproducts industry. Prepared for the Office of the Biomass Program, Energy Efficiency and Renewable Energy, U.S. Dept. of Energy. Pp. 16-51.
Oregon State of the Environment Report 2000 - Statewide Summary. 2000. SOER Science Panel, Paul Risser, Chair. Salem, Oregon: Oregon Progress Board.
Peterson, d. and S. Hasse. 2009. Market Assessment of Biomass Gasification and combustion Technology for Small- and Medium-Scale Applications. National Renew-able Energy Laboratory. U.S. department of Energy.
Porter, M.E. 2000. Location, competition, and economic devel-opment: Local clusters in a global economy. Economic development Quarterly, 14(15): 15-34.
Schnepf, R. 2011. Renewable energy programs and the farm bill: status and issues. Congressional Research Service. R41985. Available at http://www.nationalaglawcenter.org/crs/.
Searchinger, T.d., S.P. Hamburg, J. Melillo, W. Chameides, P. Havlik, d.M. Kammen, G.E. Likens, R.N. Lubowski, M. Obersteiner, M. Oppenheimer, G.P. Robertson, W.H. Schle-singer, G.d. Tilman.2009. Fixing a critical climate accounting error. Science. 326: 527-528.
Sheridan, Thomas E. 2007. Embattled ranchers, endan-gered species, and urban sprawl: the political ecology of the new American West. Annual Review of Anthropology, 36: 121-138.
Stidham, M. and V. Simon-Brown. 2011. Stakeholder perspec-tives on converting biomass to energy in Oregon, USA. Biomass and Bioenergy, 35: 203-213.
US Census Bureau 2012. Available at http://2010.census.gov/2010census/data/. Accessed 8/12/12.
US Energy Information Administration (EIA). 2012. “Petro-leum and Other Liquids”. Available at http://www.eia.gov/petroleum/heatingoilpropane/. Accessed 8/13/12.
Walker, Peter A. 2003. Reconsidering ‘regional’ political ecolo-gies: toward a political ecology of the rural American West. Progress in Human Geography, 27(1): 7-24.
White, E.M. 2010. Woody biomass for bioenergy and biofuels in the United States – a briefing paper. USDA-USFS. Pacific Northwest Research Station. Gen. Tech. PNW-GTR-825.
Zerbe, J.I. 2006. Thermal energy, electricity, and transpor-tation fuels from wood. Forest Products Journal, 56(1): 6-14.
2012 Conference Proceedings | 131
Introduction
Private forest ownership is popular in many of developed countries. In Japan, 57.9% of total forestland belongs to private owners. As a result of active reforestation and afforestation efforts after the World War II, 46.3% of private forest becomes artificial plantation. Timber inven-tory is growing steadily and most of them are softwood species.
Private forests have been playing a major role in timber production for many decades. In addition, because of mountainous geography with steep terrains, soil protec-tion and water holding capacity of forests are really important functions for the country. Therefore, the government spent huge amount of subsidies for plan-tation and other forest practices, such as weeding and thinning, in private forests. Importance of private forests in terms of timber production is growing while national forest reduces its production.
However, not a few private forest owners have been giving up forest management in recent years. Problems related to absentee owners or aging are the leading reasons of such phenomena. Low profitability in forestry is the background issue of the problems. Depopulation in rural area is another potential reason. One would say that forestry in Japan is in uphill battle.
Having a difficult situation in private forestry, it would be useful to know why people still own forests and what they want to do in the future. This paper tries to analyze the meaning of forest possession. There are plenty of questionnaire surveys for forest owners about practical issues of their forests such as plan to thin, cut, replant and so on. However, there is almost no survey about the question like why they own forests. It is an experi-mental trial and the number of data is not enough yet, but it would be of value to begin to research such issues in case of Japan as to compare with other countries.
Conditions of Private Forest in Japan
As shown in Table 1, within 25.1 million hectares (ha) of forestland in Japan, 14.5 million ha or 57.9% is privately owned. There are several kinds of private owners in Japanese governmental statistics. Individual house-hold is the most common type of private ownerships. In addition to that, companies, communities, group of people, traditional ownership of hamlets, and temple and shrines are distinguished. The government used to correct data of individual forest households who have over 0.1ha, but for the simplification of data correction it was changed to over 1ha after the year of 2000. There were about 2.5 million individual forest households of over 0.1ha in 1995, but it is impossible to know the exact number of such statistics today. Table 2 shows
The Meaning of Forest Possession for Small-Scale Owners in Japan: how to Get and Why to keep the Forest?Ikuo OtaDepartment of Forest Resources, Faculty of Agriculture, Ehime University; 3-5-7 Tarumi Matsuyama, 790-8566 Japan, [email protected]
Keywords: Family property, forest owner, inheritance, timber production, Tokushima
Abstract
This study aims to provide an idea about the meaning of owning forest land for small-scale forest owners in Japan. The author conducted a questionnaire for 196 private forest owners in Tokushima Prefecture, and acquired some interesting results. A great majority of forest owners inherited their forest land from their parents and are willing to succeed it to their children. Most of them are not much interested in producing timber because it does not make money today. Not a small number of forest owners doesn’t know exact place and boundary of their property. Therefore, it is not easy to conclude some reasonable purposes of owning forest land for many of such owners. In other words, inherited family property is the only reason why small-scale forest owners continue to posses their forest land.
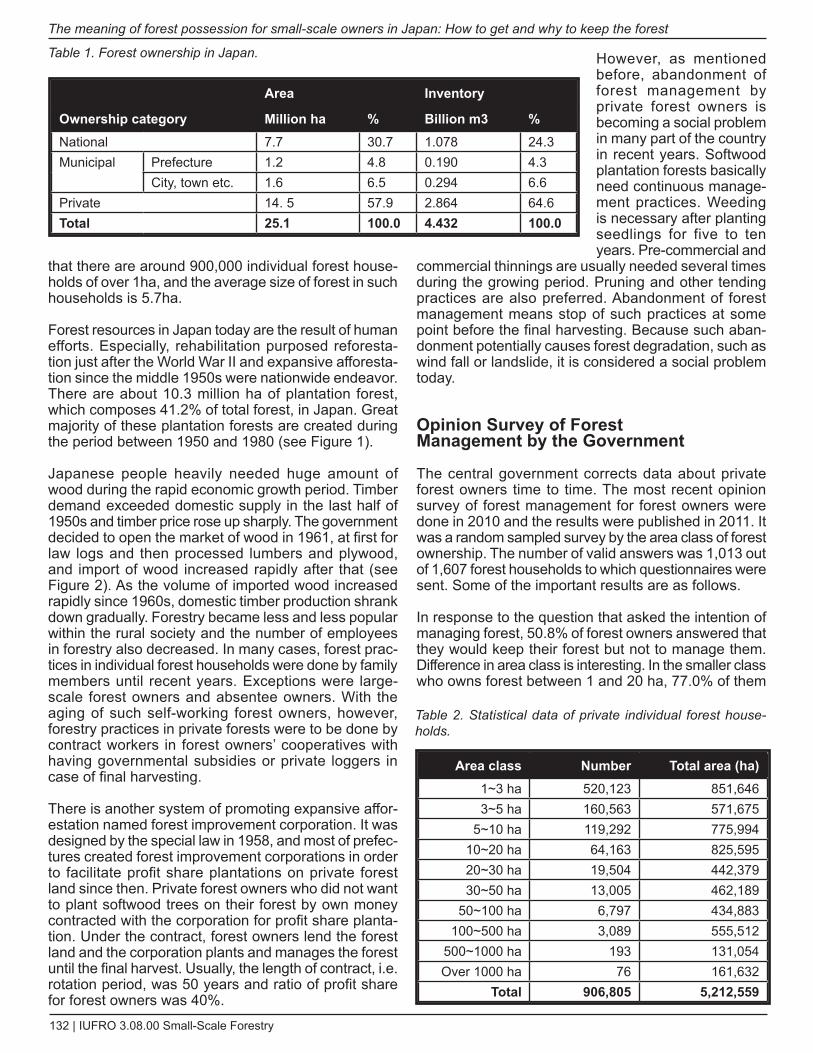
132 | IUFRO 3.08.00 Small-Scale Forestry
The meaning of forest possession for small-scale owners in Japan: How to get and why to keep the forest
that there are around 900,000 individual forest house-holds of over 1ha, and the average size of forest in such households is 5.7ha.
Forest resources in Japan today are the result of human efforts. Especially, rehabilitation purposed reforesta-tion just after the World War II and expansive afforesta-tion since the middle 1950s were nationwide endeavor. There are about 10.3 million ha of plantation forest, which composes 41.2% of total forest, in Japan. Great majority of these plantation forests are created during the period between 1950 and 1980 (see Figure 1).
Japanese people heavily needed huge amount of wood during the rapid economic growth period. Timber demand exceeded domestic supply in the last half of 1950s and timber price rose up sharply. The government decided to open the market of wood in 1961, at first for law logs and then processed lumbers and plywood, and import of wood increased rapidly after that (see Figure 2). As the volume of imported wood increased rapidly since 1960s, domestic timber production shrank down gradually. Forestry became less and less popular within the rural society and the number of employees in forestry also decreased. In many cases, forest prac-tices in individual forest households were done by family members until recent years. Exceptions were large-scale forest owners and absentee owners. With the aging of such self-working forest owners, however, forestry practices in private forests were to be done by contract workers in forest owners’ cooperatives with having governmental subsidies or private loggers in case of final harvesting.
There is another system of promoting expansive affor-estation named forest improvement corporation. It was designed by the special law in 1958, and most of prefec-tures created forest improvement corporations in order to facilitate profit share plantations on private forest land since then. Private forest owners who did not want to plant softwood trees on their forest by own money contracted with the corporation for profit share planta-tion. Under the contract, forest owners lend the forest land and the corporation plants and manages the forest until the final harvest. Usually, the length of contract, i.e. rotation period, was 50 years and ratio of profit share for forest owners was 40%.
However, as mentioned before, abandonment of forest management by private forest owners is becoming a social problem in many part of the country in recent years. Softwood plantation forests basically need continuous manage-ment practices. Weeding is necessary after planting seedlings for five to ten years. Pre-commercial and
commercial thinnings are usually needed several times during the growing period. Pruning and other tending practices are also preferred. Abandonment of forest management means stop of such practices at some point before the final harvesting. Because such aban-donment potentially causes forest degradation, such as wind fall or landslide, it is considered a social problem today.
Opinion Survey of Forest Management by the Government
The central government corrects data about private forest owners time to time. The most recent opinion survey of forest management for forest owners were done in 2010 and the results were published in 2011. It was a random sampled survey by the area class of forest ownership. The number of valid answers was 1,013 out of 1,607 forest households to which questionnaires were sent. Some of the important results are as follows.
In response to the question that asked the intention of managing forest, 50.8% of forest owners answered that they would keep their forest but not to manage them. Difference in area class is interesting. In the smaller class who owns forest between 1 and 20 ha, 77.0% of them
Ownership category
Area Inventory
Million ha % Billion m3 %National 7.7 30.7 1.078 24.3Municipal Prefecture 1.2 4.8 0.190 4.3
City, town etc. 1.6 6.5 0.294 6.6Private 14. 5 57.9 2.864 64.6Total 25.1 100.0 4.432 100.0
Area class Number Total area (ha)1~3 ha 520,123 851,6463~5 ha 160,563 571,675
5~10 ha 119,292 775,99410~20 ha 64,163 825,59520~30 ha 19,504 442,37930~50 ha 13,005 462,189
50~100 ha 6,797 434,883100~500 ha 3,089 555,512
500~1000 ha 193 131,054Over 1000 ha 76 161,632
Total 906,805 5,212,559
Table 1. Forest ownership in Japan.
Table 2. Statistical data of private individual forest house-holds.
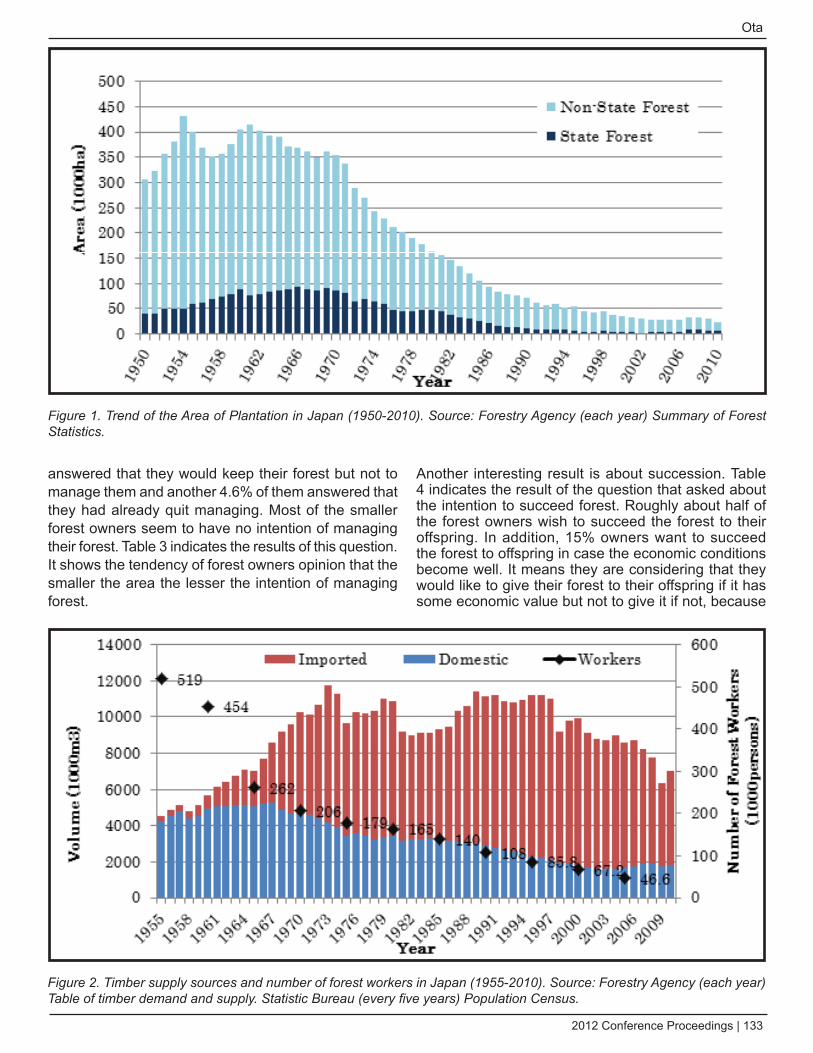
2012 Conference Proceedings | 133
Ota
answered that they would keep their forest but not to manage them and another 4.6% of them answered that they had already quit managing. Most of the smaller forest owners seem to have no intention of managing their forest. Table 3 indicates the results of this question. It shows the tendency of forest owners opinion that the smaller the area the lesser the intention of managing forest.
Another interesting result is about succession. Table 4 indicates the result of the question that asked about the intention to succeed forest. Roughly about half of the forest owners wish to succeed the forest to their offspring. In addition, 15% owners want to succeed the forest to offspring in case the economic conditions become well. It means they are considering that they would like to give their forest to their offspring if it has some economic value but not to give it if not, because
Figure 1. Trend of the Area of Plantation in Japan (1950-2010). Source: Forestry Agency (each year) Summary of Forest Statistics.
Figure 2. Timber supply sources and number of forest workers in Japan (1955-2010). Source: Forestry Agency (each year) Table of timber demand and supply. Statistic Bureau (every five years) Population Census.
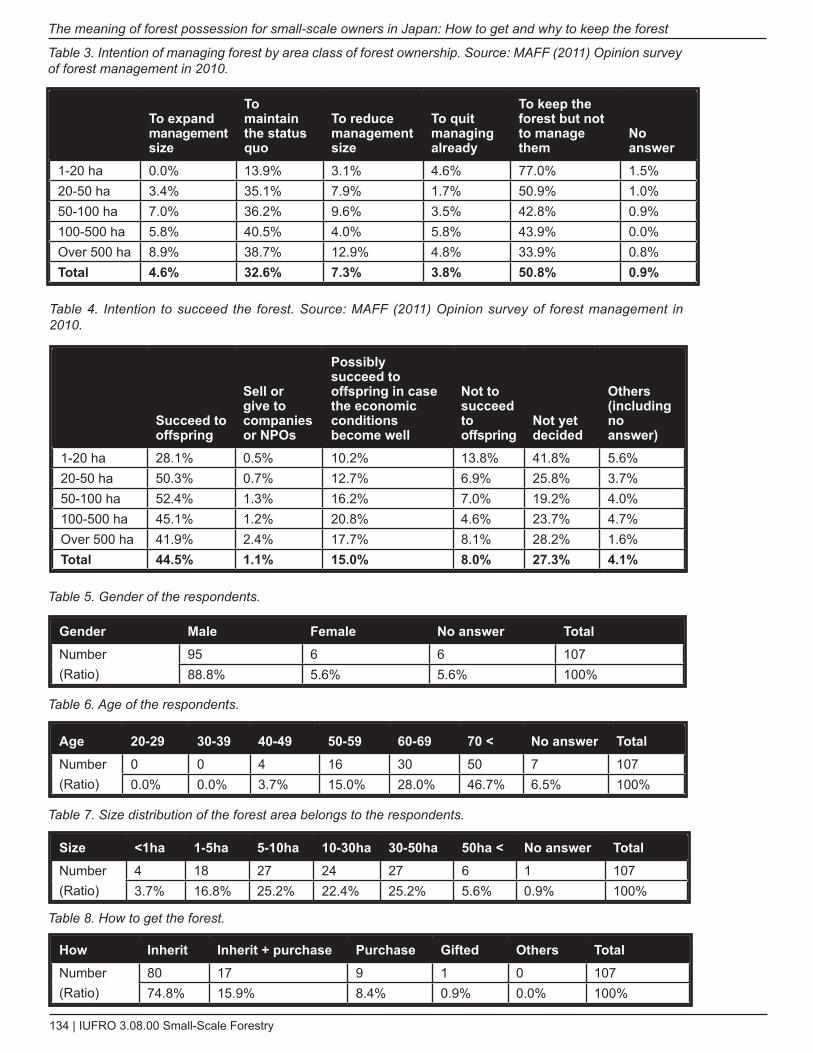
134 | IUFRO 3.08.00 Small-Scale Forestry
The meaning of forest possession for small-scale owners in Japan: How to get and why to keep the forest
Table 3. Intention of managing forest by area class of forest ownership. Source: MAFF (2011) Opinion survey of forest management in 2010.
To expand management size
To maintain the status quo
To reduce management size
To quit managing already
To keep the forest but not to manage them
No answer
1-20 ha 0.0% 13.9% 3.1% 4.6% 77.0% 1.5%20-50 ha 3.4% 35.1% 7.9% 1.7% 50.9% 1.0%50-100 ha 7.0% 36.2% 9.6% 3.5% 42.8% 0.9%100-500 ha 5.8% 40.5% 4.0% 5.8% 43.9% 0.0%Over 500 ha 8.9% 38.7% 12.9% 4.8% 33.9% 0.8%Total 4.6% 32.6% 7.3% 3.8% 50.8% 0.9%
Table 4. Intention to succeed the forest. Source: MAFF (2011) Opinion survey of forest management in 2010.
Gender Male Female No answer TotalNumber(Ratio)
95 6 6 10788.8% 5.6% 5.6% 100%
Age 20-29 30-39 40-49 50-59 60-69 70 < No answer TotalNumber(Ratio)
0 0 4 16 30 50 7 1070.0% 0.0% 3.7% 15.0% 28.0% 46.7% 6.5% 100%
Size <1ha 1-5ha 5-10ha 10-30ha 30-50ha 50ha < No answer TotalNumber(Ratio)
4 18 27 24 27 6 1 1073.7% 16.8% 25.2% 22.4% 25.2% 5.6% 0.9% 100%
How Inherit Inherit + purchase Purchase Gifted Others TotalNumber(Ratio)
80 17 9 1 0 10774.8% 15.9% 8.4% 0.9% 0.0% 100%
Table 5. Gender of the respondents.
Table 6. Age of the respondents.
Table 7. Size distribution of the forest area belongs to the respondents.
Table 8. How to get the forest.
Succeed to offspring
Sell or give to companies or NPOs
Possibly succeed to offspring in case the economic conditions become well
Not to succeed to offspring
Not yet decided
Others (including no answer)
1-20 ha 28.1% 0.5% 10.2% 13.8% 41.8% 5.6%20-50 ha 50.3% 0.7% 12.7% 6.9% 25.8% 3.7%50-100 ha 52.4% 1.3% 16.2% 7.0% 19.2% 4.0%100-500 ha 45.1% 1.2% 20.8% 4.6% 23.7% 4.7%Over 500 ha 41.9% 2.4% 17.7% 8.1% 28.2% 1.6%Total 44.5% 1.1% 15.0% 8.0% 27.3% 4.1%
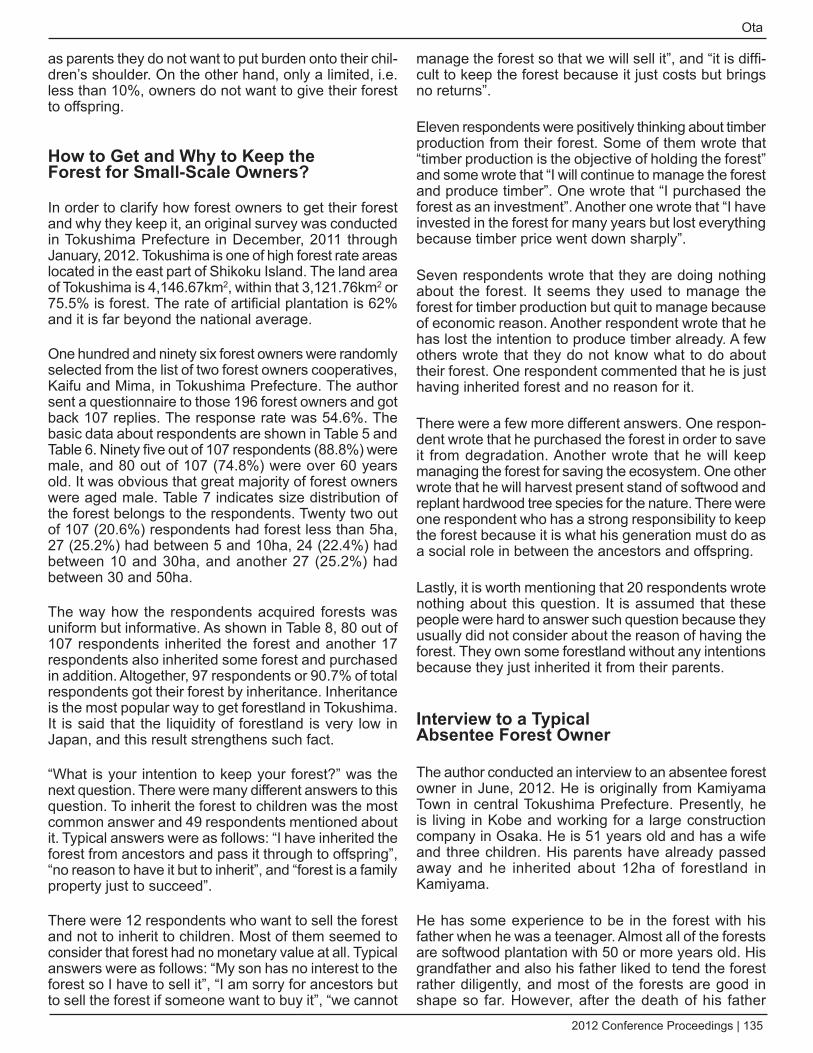
2012 Conference Proceedings | 135
Ota
as parents they do not want to put burden onto their chil-dren’s shoulder. On the other hand, only a limited, i.e. less than 10%, owners do not want to give their forest to offspring.
How to Get and why to Keep the Forest for Small-Scale Owners?
In order to clarify how forest owners to get their forest and why they keep it, an original survey was conducted in Tokushima Prefecture in December, 2011 through January, 2012. Tokushima is one of high forest rate areas located in the east part of Shikoku Island. The land area of Tokushima is 4,146.67km2, within that 3,121.76km2 or 75.5% is forest. The rate of artificial plantation is 62% and it is far beyond the national average.
One hundred and ninety six forest owners were randomly selected from the list of two forest owners cooperatives, Kaifu and Mima, in Tokushima Prefecture. The author sent a questionnaire to those 196 forest owners and got back 107 replies. The response rate was 54.6%. The basic data about respondents are shown in Table 5 and Table 6. Ninety five out of 107 respondents (88.8%) were male, and 80 out of 107 (74.8%) were over 60 years old. It was obvious that great majority of forest owners were aged male. Table 7 indicates size distribution of the forest belongs to the respondents. Twenty two out of 107 (20.6%) respondents had forest less than 5ha, 27 (25.2%) had between 5 and 10ha, 24 (22.4%) had between 10 and 30ha, and another 27 (25.2%) had between 30 and 50ha.
The way how the respondents acquired forests was uniform but informative. As shown in Table 8, 80 out of 107 respondents inherited the forest and another 17 respondents also inherited some forest and purchased in addition. Altogether, 97 respondents or 90.7% of total respondents got their forest by inheritance. Inheritance is the most popular way to get forestland in Tokushima. It is said that the liquidity of forestland is very low in Japan, and this result strengthens such fact.
“What is your intention to keep your forest?” was the next question. There were many different answers to this question. To inherit the forest to children was the most common answer and 49 respondents mentioned about it. Typical answers were as follows: “I have inherited the forest from ancestors and pass it through to offspring”, “no reason to have it but to inherit”, and “forest is a family property just to succeed”.
There were 12 respondents who want to sell the forest and not to inherit to children. Most of them seemed to consider that forest had no monetary value at all. Typical answers were as follows: “My son has no interest to the forest so I have to sell it”, “I am sorry for ancestors but to sell the forest if someone want to buy it”, “we cannot
manage the forest so that we will sell it”, and “it is diffi-cult to keep the forest because it just costs but brings no returns”.
Eleven respondents were positively thinking about timber production from their forest. Some of them wrote that “timber production is the objective of holding the forest” and some wrote that “I will continue to manage the forest and produce timber”. One wrote that “I purchased the forest as an investment”. Another one wrote that “I have invested in the forest for many years but lost everything because timber price went down sharply”.
Seven respondents wrote that they are doing nothing about the forest. It seems they used to manage the forest for timber production but quit to manage because of economic reason. Another respondent wrote that he has lost the intention to produce timber already. A few others wrote that they do not know what to do about their forest. One respondent commented that he is just having inherited forest and no reason for it.
There were a few more different answers. One respon-dent wrote that he purchased the forest in order to save it from degradation. Another wrote that he will keep managing the forest for saving the ecosystem. One other wrote that he will harvest present stand of softwood and replant hardwood tree species for the nature. There were one respondent who has a strong responsibility to keep the forest because it is what his generation must do as a social role in between the ancestors and offspring.
Lastly, it is worth mentioning that 20 respondents wrote nothing about this question. It is assumed that these people were hard to answer such question because they usually did not consider about the reason of having the forest. They own some forestland without any intentions because they just inherited it from their parents.
Interview to a Typical Absentee Forest Owner
The author conducted an interview to an absentee forest owner in June, 2012. He is originally from Kamiyama Town in central Tokushima Prefecture. Presently, he is living in Kobe and working for a large construction company in Osaka. He is 51 years old and has a wife and three children. His parents have already passed away and he inherited about 12ha of forestland in Kamiyama.
He has some experience to be in the forest with his father when he was a teenager. Almost all of the forests are softwood plantation with 50 or more years old. His grandfather and also his father liked to tend the forest rather diligently, and most of the forests are good in shape so far. However, after the death of his father
136 | IUFRO 3.08.00 Small-Scale Forestry
The meaning of forest possession for small-scale owners in Japan: How to get and why to keep the forest
nearly twenty years ago, no practices have done at all. He does not go to see the forest often, maybe once in five years or so.
His father was a member of the forest owners’ coop-erative in the area, and he also succeeded the status. However, he has no contact with the cooperative at all. He said there were no approaches from the cooperative side for offering thinning operation or requesting integra-tion of fragmented forest management area.
There is no specific intention of forest ownership, he said. He inherited the forest because he was the only child for the parents. He left his hometown more than 30 years ago, and has no plan to come back at the moment. He never expect any monetary value for the forest, instead he is afraid it would make a burden to his children in case he succeeded it to them. He said he has no clear objective to keep the forest, but it must be very common for the forest owners like him. The forest was given to him regardless of his intention.
He is hesitating to inherit the forest to his children. His elder son is working at a company in Yokohama, and has no experience to live in Tokushima nor to go into the forest. His two daughters are in Kobe with the family and also they do not have interest in the forest. Is it reason-able for the father to succeed the forest to such young people who does not know anything about their family forest? That is why he is looking for a possibility to sell the forestland. He is wondering that to sell the forest and to distribute the proceed to children would be the better way to do.
Discussion
This study prevails several important facts related to small-scale forest owners in Japan. First, great majority of the forest owners inherited the forest as a family property. Therefore, for most of the forest owners, their role is just to keep the forest and succeed it to their children. It means that there are no clear objectives to own forest. It is obvious that timber production is not the strong intention of owning the forest for most of the owners today.
Some, but not many, of the owners mentioned about the responsibility of owning the forest. That is why a few of them are wishing to sell the forest because they cannot keep managing it well in the future. Another reason of selling the forest is its economic unprofitability.
Japanese government promoted expansive afforesta-tion since the middle 1950s, and the policy resulted 10 million ha of artificial plantation all over the country today. The government also spent huge amount of subsidy for private forest owners to manage the forest. The reason of spending public money on private forests is that the forest should be maintained well in order to demonstrate
public benefit functions such as water holding capacity, soil keeping function, landslide prevention, habitat for wild animals, recreation for people and so on.
However, there are not enough researches about the intention of forest owners. Therefore, governmental policy to promote thinning operation in the softwood plantations was not successful after the price of timber went down in 1980s. In some cases, subsidy for pre-commercial thinning became a kind of coercive selling of operation through forest owners’ cooperatives.
The government revised the Basic Forest Law of 1964 into the Basic Forest and Forestry Law in 2001. The primary reason of this revision was to change the objective of forest management from timber produc-tion to environmental function. The government aimed to promote thinning in unmanaged softwood planta-tions not because for timber production but for demon-strating public benefit functions. However, here again, the intentions of forest owners were neglected. They were supposed to be obedient for governmental policy direction, but it was not the case for everybody.
Intentions of forest owners are important. Even though many of forest owners have no objectives to keep the forest, that is the fact. For the government, to make forest owners having some concrete objectives would be necessary before deciding policy directions or spending subsidies.
Conclusions
It must be strange for foreign people that many of Japanese private forest owners have no intention of owning the forest. Forests are family property to inherit, so that the objective of keeping forest is just keeping it. However, forests, especially softwood plantation forests, that occupies more than 40% of the forest in Japan, need proper management during whole the rotation periods.
To know what forest owners intend to do is very impor-tant for policy makers. A kind of study like this is a first step to do. The author believe that education for forest owners also is necessary. Responsibility to have forest-land used to be widely shared by forest owners in former days. However, such kind of consideration or a social role of owners seems to have mostly disappeared in recent years.
Average size of private forest is very small in Japan, but the accumulation of such small-scale forestland is not small. Meaning of forest possession for single owner may be negligible, but these of millions of owners are not. It is important to publicly discuss about the meaning of forest possession to create a better rela-tionship between forest and people.
2012 Conference Proceedings | 137
Ota
References
Forestry Agency (2012) Forestry White Paper. (in Japanese)
Fujisawa, Hideo (2008) Plantation and forest road policy in private forest. In Endo (edt.) Modern Forest policy. J-Fic.271p.(in Japanese)
Ministry of Agriculture, Forestry and Fishery (2011) Opinion survey of forest management in 2010. (in Japanese)
Ota, Ikuo (2011) A study for the present status of ‘family forest’ and the purpose of forest holding in the USA. Bulletin of the Ehime University Forest 48-50:15-34. (in Japanese)
Ota, Ikuo (2012) Historical development of afforestation and reforestation policy in Japan since 1860s. Legal Aspects of European Forest Sustainable development; Proceedings of the 14th International Symposium of IUFRO Unit 9.06.00 in Berezinski Biosphere Reserve, Belarus. (in press)
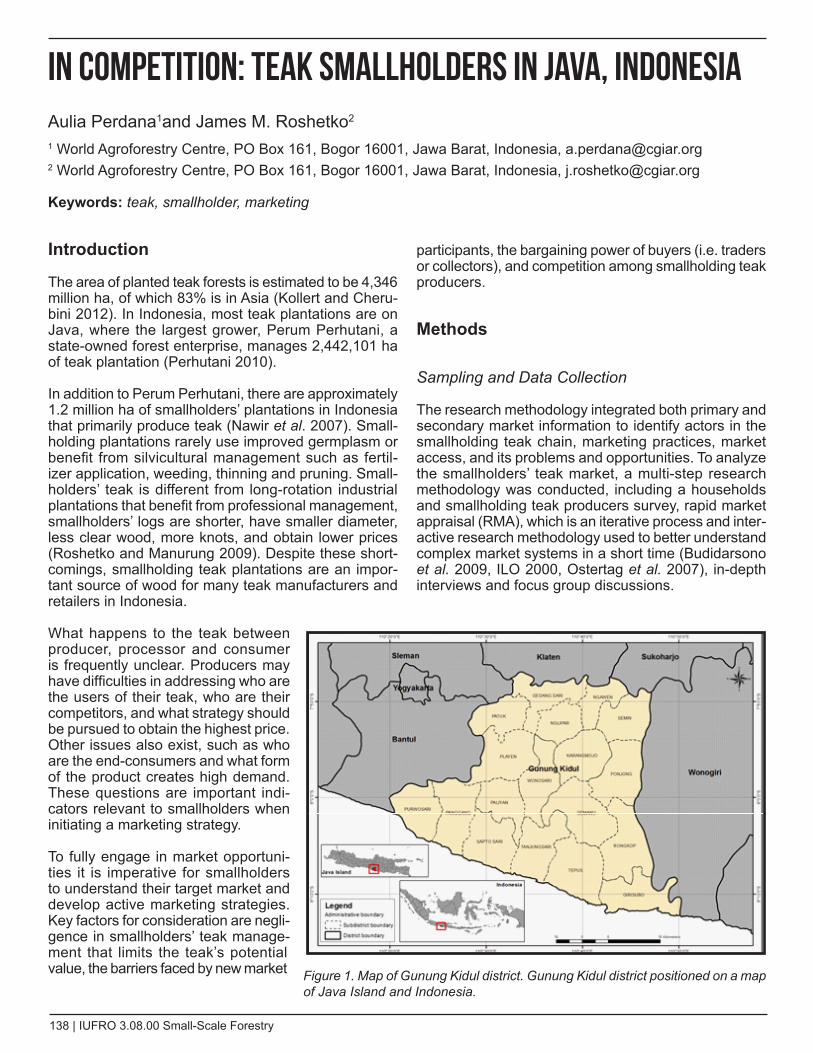
138 | IUFRO 3.08.00 Small-Scale Forestry
Introduction
The area of planted teak forests is estimated to be 4,346 million ha, of which 83% is in Asia (Kollert and Cheru-bini 2012). In Indonesia, most teak plantations are on Java, where the largest grower, Perum Perhutani, a state-owned forest enterprise, manages 2,442,101 ha of teak plantation (Perhutani 2010).
In addition to Perum Perhutani, there are approximately 1.2 million ha of smallholders’ plantations in Indonesia that primarily produce teak (Nawir et al. 2007). Small-holding plantations rarely use improved germplasm or benefit from silvicultural management such as fertil-izer application, weeding, thinning and pruning. Small-holders’ teak is different from long-rotation industrial plantations that benefit from professional management, smallholders’ logs are shorter, have smaller diameter, less clear wood, more knots, and obtain lower prices (Roshetko and Manurung 2009). Despite these short-comings, smallholding teak plantations are an impor-tant source of wood for many teak manufacturers and retailers in Indonesia.
What happens to the teak between producer, processor and consumer is frequently unclear. Producers may have difficulties in addressing who are the users of their teak, who are their competitors, and what strategy should be pursued to obtain the highest price. Other issues also exist, such as who are the end-consumers and what form of the product creates high demand. These questions are important indi-cators relevant to smallholders when initiating a marketing strategy.
To fully engage in market opportuni-ties it is imperative for smallholders to understand their target market and develop active marketing strategies. Key factors for consideration are negli-gence in smallholders’ teak manage-ment that limits the teak’s potential value, the barriers faced by new market
participants, the bargaining power of buyers (i.e. traders or collectors), and competition among smallholding teak producers.
Methods
Sampling and data Collection
The research methodology integrated both primary and secondary market information to identify actors in the smallholding teak chain, marketing practices, market access, and its problems and opportunities. To analyze the smallholders’ teak market, a multi-step research methodology was conducted, including a households and smallholding teak producers survey, rapid market appraisal (RMA), which is an iterative process and inter-active research methodology used to better understand complex market systems in a short time (Budidarsono et al. 2009, ILO 2000, Ostertag et al. 2007), in-depth interviews and focus group discussions.
Figure 1. Map of Gunung Kidul district. Gunung Kidul district positioned on a map of Java Island and Indonesia.
In Competition: Teak Smallholders in Java, IndonesiaAulia Perdana1and James M. Roshetko2
1 World Agroforestry Centre, PO Box 161, Bogor 16001, Jawa Barat, Indonesia, [email protected] World Agroforestry Centre, PO Box 161, Bogor 16001, Jawa Barat, Indonesia, [email protected]
Keywords: teak, smallholder, marketing
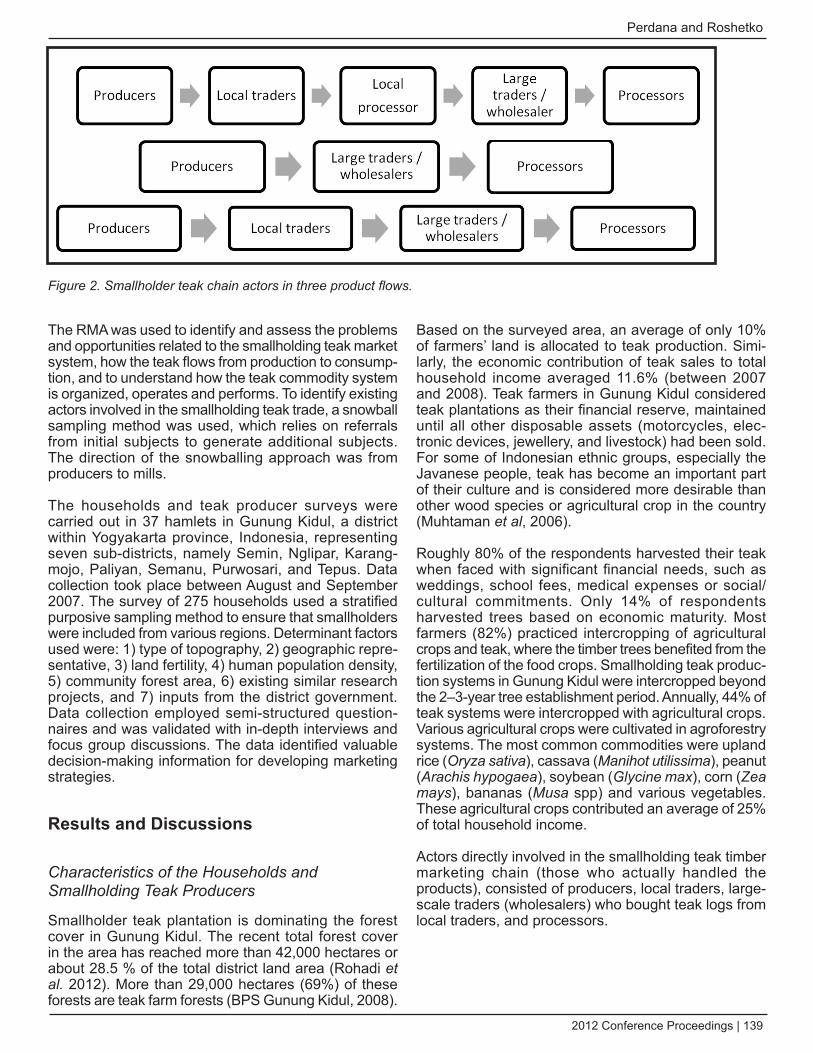
2012 Conference Proceedings | 139
Perdana and Roshetko
The RMA was used to identify and assess the problems and opportunities related to the smallholding teak market system, how the teak flows from production to consump-tion, and to understand how the teak commodity system is organized, operates and performs. To identify existing actors involved in the smallholding teak trade, a snowball sampling method was used, which relies on referrals from initial subjects to generate additional subjects. The direction of the snowballing approach was from producers to mills.
The households and teak producer surveys were carried out in 37 hamlets in Gunung Kidul, a district within Yogyakarta province, Indonesia, representing seven sub-districts, namely Semin, Nglipar, Karang-mojo, Paliyan, Semanu, Purwosari, and Tepus. Data collection took place between August and September 2007. The survey of 275 households used a stratified purposive sampling method to ensure that smallholders were included from various regions. Determinant factors used were: 1) type of topography, 2) geographic repre-sentative, 3) land fertility, 4) human population density, 5) community forest area, 6) existing similar research projects, and 7) inputs from the district government. Data collection employed semi-structured question-naires and was validated with in-depth interviews and focus group discussions. The data identified valuable decision-making information for developing marketing strategies.
Results and Discussions
Characteristics of the Households and Smallholding Teak Producers
Smallholder teak plantation is dominating the forest cover in Gunung Kidul. The recent total forest cover in the area has reached more than 42,000 hectares or about 28.5 % of the total district land area (Rohadi et al. 2012). More than 29,000 hectares (69%) of these forests are teak farm forests (BPS Gunung Kidul, 2008).
Based on the surveyed area, an average of only 10% of farmers’ land is allocated to teak production. Simi-larly, the economic contribution of teak sales to total household income averaged 11.6% (between 2007 and 2008). Teak farmers in Gunung Kidul considered teak plantations as their financial reserve, maintained until all other disposable assets (motorcycles, elec-tronic devices, jewellery, and livestock) had been sold. For some of Indonesian ethnic groups, especially the Javanese people, teak has become an important part of their culture and is considered more desirable than other wood species or agricultural crop in the country (Muhtaman et al, 2006).
Roughly 80% of the respondents harvested their teak when faced with significant financial needs, such as weddings, school fees, medical expenses or social/cultural commitments. Only 14% of respondents harvested trees based on economic maturity. Most farmers (82%) practiced intercropping of agricultural crops and teak, where the timber trees benefited from the fertilization of the food crops. Smallholding teak produc-tion systems in Gunung Kidul were intercropped beyond the 2–3-year tree establishment period. Annually, 44% of teak systems were intercropped with agricultural crops. Various agricultural crops were cultivated in agroforestry systems. The most common commodities were upland rice (Oryza sativa), cassava (Manihot utilissima), peanut (Arachis hypogaea), soybean (Glycine max), corn (Zea mays), bananas (Musa spp) and various vegetables. These agricultural crops contributed an average of 25% of total household income.
Actors directly involved in the smallholding teak timber marketing chain (those who actually handled the products), consisted of producers, local traders, large-scale traders (wholesalers) who bought teak logs from local traders, and processors.
Figure 2. Smallholder teak chain actors in three product flows.
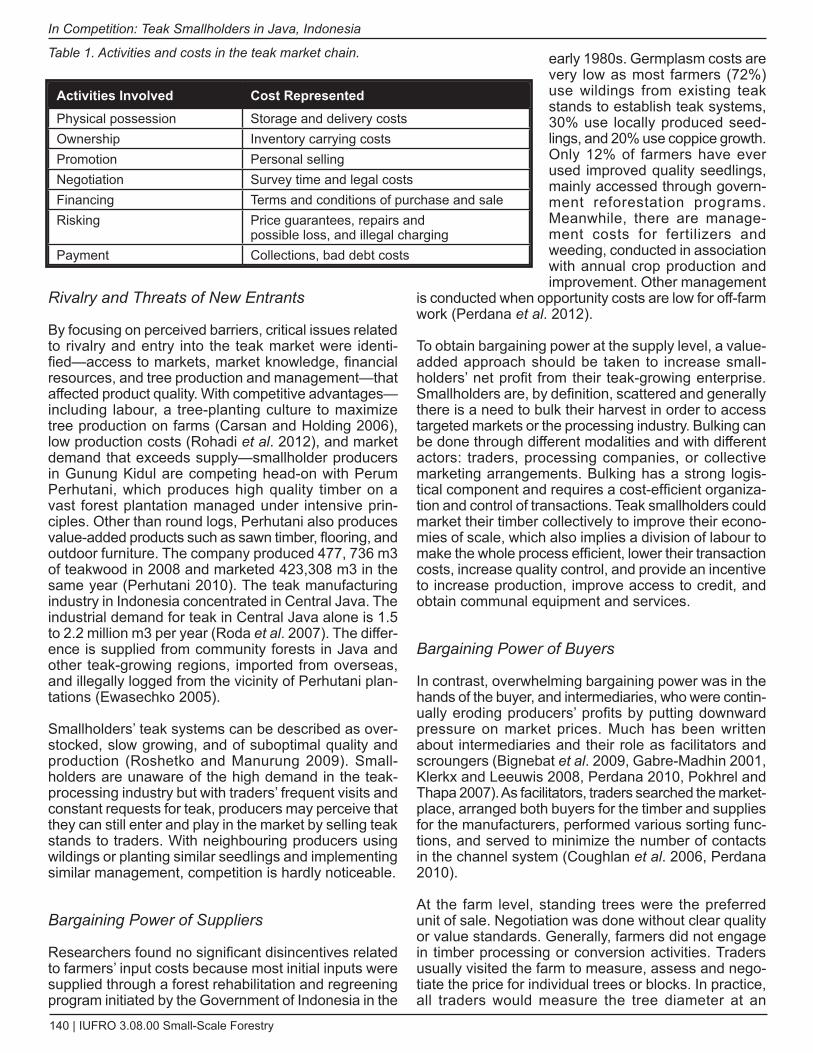
140 | IUFRO 3.08.00 Small-Scale Forestry
In Competition: Teak Smallholders in Java, Indonesia
Rivalry and Threats of New Entrants
By focusing on perceived barriers, critical issues related to rivalry and entry into the teak market were identi-fied—access to markets, market knowledge, financial resources, and tree production and management—that affected product quality. With competitive advantages—including labour, a tree-planting culture to maximize tree production on farms (Carsan and Holding 2006), low production costs (Rohadi et al. 2012), and market demand that exceeds supply—smallholder producers in Gunung Kidul are competing head-on with Perum Perhutani, which produces high quality timber on a vast forest plantation managed under intensive prin-ciples. Other than round logs, Perhutani also produces value-added products such as sawn timber, flooring, and outdoor furniture. The company produced 477, 736 m3 of teakwood in 2008 and marketed 423,308 m3 in the same year (Perhutani 2010). The teak manufacturing industry in Indonesia concentrated in Central Java. The industrial demand for teak in Central Java alone is 1.5 to 2.2 million m3 per year (Roda et al. 2007). The differ-ence is supplied from community forests in Java and other teak-growing regions, imported from overseas, and illegally logged from the vicinity of Perhutani plan-tations (Ewasechko 2005).
Smallholders’ teak systems can be described as over-stocked, slow growing, and of suboptimal quality and production (Roshetko and Manurung 2009). Small-holders are unaware of the high demand in the teak-processing industry but with traders’ frequent visits and constant requests for teak, producers may perceive that they can still enter and play in the market by selling teak stands to traders. With neighbouring producers using wildings or planting similar seedlings and implementing similar management, competition is hardly noticeable.
Bargaining Power of Suppliers
Researchers found no significant disincentives related to farmers’ input costs because most initial inputs were supplied through a forest rehabilitation and regreening program initiated by the Government of Indonesia in the
early 1980s. Germplasm costs are very low as most farmers (72%) use wildings from existing teak stands to establish teak systems, 30% use locally produced seed-lings, and 20% use coppice growth. Only 12% of farmers have ever used improved quality seedlings, mainly accessed through govern-ment reforestation programs. Meanwhile, there are manage-ment costs for fertilizers and weeding, conducted in association with annual crop production and improvement. Other management
is conducted when opportunity costs are low for off-farm work (Perdana et al. 2012).
To obtain bargaining power at the supply level, a value-added approach should be taken to increase small-holders’ net profit from their teak-growing enterprise. Smallholders are, by definition, scattered and generally there is a need to bulk their harvest in order to access targeted markets or the processing industry. Bulking can be done through different modalities and with different actors: traders, processing companies, or collective marketing arrangements. Bulking has a strong logis-tical component and requires a cost-efficient organiza-tion and control of transactions. Teak smallholders could market their timber collectively to improve their econo-mies of scale, which also implies a division of labour to make the whole process efficient, lower their transaction costs, increase quality control, and provide an incentive to increase production, improve access to credit, and obtain communal equipment and services.
Bargaining Power of Buyers
In contrast, overwhelming bargaining power was in the hands of the buyer, and intermediaries, who were contin-ually eroding producers’ profits by putting downward pressure on market prices. Much has been written about intermediaries and their role as facilitators and scroungers (Bignebat et al. 2009, Gabre-Madhin 2001, Klerkx and Leeuwis 2008, Perdana 2010, Pokhrel and Thapa 2007). As facilitators, traders searched the market-place, arranged both buyers for the timber and supplies for the manufacturers, performed various sorting func-tions, and served to minimize the number of contacts in the channel system (Coughlan et al. 2006, Perdana 2010).
At the farm level, standing trees were the preferred unit of sale. Negotiation was done without clear quality or value standards. Generally, farmers did not engage in timber processing or conversion activities. Traders usually visited the farm to measure, assess and nego-tiate the price for individual trees or blocks. In practice, all traders would measure the tree diameter at an
Activities Involved Cost RepresentedPhysical possession Storage and delivery costsOwnership Inventory carrying costsPromotion Personal sellingNegotiation Survey time and legal costsFinancing Terms and conditions of purchase and saleRisking Price guarantees, repairs and
possible loss, and illegal chargingPayment Collections, bad debt costs
Table 1. Activities and costs in the teak market chain.
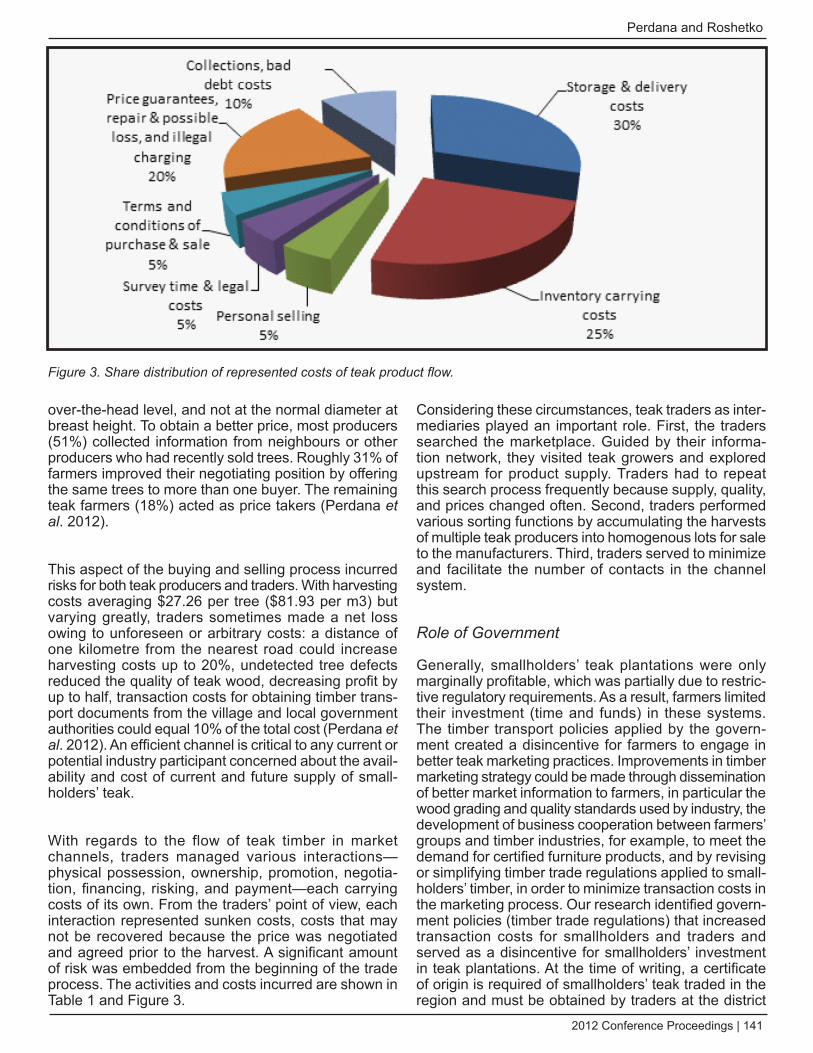
2012 Conference Proceedings | 141
Perdana and Roshetko
over-the-head level, and not at the normal diameter at breast height. To obtain a better price, most producers (51%) collected information from neighbours or other producers who had recently sold trees. Roughly 31% of farmers improved their negotiating position by offering the same trees to more than one buyer. The remaining teak farmers (18%) acted as price takers (Perdana et al. 2012).
This aspect of the buying and selling process incurred risks for both teak producers and traders. With harvesting costs averaging $27.26 per tree ($81.93 per m3) but varying greatly, traders sometimes made a net loss owing to unforeseen or arbitrary costs: a distance of one kilometre from the nearest road could increase harvesting costs up to 20%, undetected tree defects reduced the quality of teak wood, decreasing profit by up to half, transaction costs for obtaining timber trans-port documents from the village and local government authorities could equal 10% of the total cost (Perdana et al. 2012). An efficient channel is critical to any current or potential industry participant concerned about the avail-ability and cost of current and future supply of small-holders’ teak.
With regards to the flow of teak timber in market channels, traders managed various interactions—physical possession, ownership, promotion, negotia-tion, financing, risking, and payment—each carrying costs of its own. From the traders’ point of view, each interaction represented sunken costs, costs that may not be recovered because the price was negotiated and agreed prior to the harvest. A significant amount of risk was embedded from the beginning of the trade process. The activities and costs incurred are shown in Table 1 and Figure 3.
Considering these circumstances, teak traders as inter-mediaries played an important role. First, the traders searched the marketplace. Guided by their informa-tion network, they visited teak growers and explored upstream for product supply. Traders had to repeat this search process frequently because supply, quality, and prices changed often. Second, traders performed various sorting functions by accumulating the harvests of multiple teak producers into homogenous lots for sale to the manufacturers. Third, traders served to minimize and facilitate the number of contacts in the channel system.
Role of Government
Generally, smallholders’ teak plantations were only marginally profitable, which was partially due to restric-tive regulatory requirements. As a result, farmers limited their investment (time and funds) in these systems. The timber transport policies applied by the govern-ment created a disincentive for farmers to engage in better teak marketing practices. Improvements in timber marketing strategy could be made through dissemination of better market information to farmers, in particular the wood grading and quality standards used by industry, the development of business cooperation between farmers’ groups and timber industries, for example, to meet the demand for certified furniture products, and by revising or simplifying timber trade regulations applied to small-holders’ timber, in order to minimize transaction costs in the marketing process. Our research identified govern-ment policies (timber trade regulations) that increased transaction costs for smallholders and traders and served as a disincentive for smallholders’ investment in teak plantations. At the time of writing, a certificate of origin is required of smallholders’ teak traded in the region and must be obtained by traders at the district
Figure 3. Share distribution of represented costs of teak product flow.
142 | IUFRO 3.08.00 Small-Scale Forestry
In Competition: Teak Smallholders in Java, Indonesia
forestry office. Further, government policies restricted smallholders’ involvement in timber production because regulations designed for large-scale timber production (e.g. cutting and transportation permits, registration procedures) were applied to smallholders.
Government needs to provide more suitable timber trade regulations, specifically for timber coming from small-holders’ plantations. The current regulations tend to generate high transaction costs that may hinder farmers’ access to better markets. Providing farmers with more access to state land would be a good intervention, in particular, in regions where farmers’ land is very limited, such as in Gunung Kidul and possibly other parts of Java. More access for farmers to state land would increase the economies of scale of smallholding plantations and at the same time potentially reduces unproductive land areas (Rohadi et al. 2010).
Conclusion
By looking at the smallholders’ teak market, key issues that affected the market were identified. Weaknesses such as low bargaining power, high transaction costs, lack of accessible market information, low tree quality standards, and unfavourable policies were identified. Strategies, including collective marketing, may have the potential to overcome these problems.
The findings of the study lead to a number of recommen-dations to initiate effective marketing strategies for small-holders’ teak: 1) Improve market information for small-holders by introducing producers to the log grading and pricing system that is used by the timber industry. In this context, training sessions led by industry experts can be implemented to improve the knowledge of farmers and middlemen of the teak grading system applied by most of timber industries. Local governments could introduce a standing tree valuation system to reduce marketing risk for both timber growers and middlemen. This could have considerable impact by motivating producers to improve their timber quality. Regular market information on teak prices and qualities could be provided through local mass media, such as radio and local newspaper, 2) Simplify timber trade regulations to minimize trans-action costs, making the smallholding teak market more efficient, for example, by including smallholder teakwood into the certificate of origin scheme (Surat Keterangan Asal Usul) or to promote the exclusion of smallholder teak wood from the obligations of the certificate of legal logs (Surat Keterangan Sahnya Kayu Bulat) and certifi-cate of legal forest product (Surat Keterangan Sahnya Hasil Hutan) to the Ministry of Forestry. Simpler proce-dures for timber distribution would provide incentives to smallholders to invest in teak plantations, 3) Develop links between teak producers and teak industries, for example, certified furniture exporters could provide new market opportunities for producers. Smallholders could be trained to apply the wood tracking system that is
required for certified products. In return, producers might obtain a premium price for the timber. Collaboration with teak processing industries could further be devel-oped by involving teak producers in furniture processing, such as by supplying semi-processed furniture compo-nents to companies. Teak producers could be involved in the wood-processing sector, especially furniture indus-tries. Engaging farmers in furniture industries would reduce transaction costs and might provide opportu-nities for producers to receive benefits from the value added to their teak wood. Developing a sound strategy to strengthen cooperation between farmers’ groups and the furniture industry would be an interesting area for further research.
Acknowledgement
The research presented in this paper was conducted through the Improving Economic Outcomes for Small-holders Growing Teak in Agroforestry Systems in Indonesia project funded by the Australian Centre for International Agricultural Research (ACIAR) (No. FST/2005/177). The opinions, findings, conclusions, and recommendations expressed in this paper are those of the authors and do not necessarily reflect the views of ACIAR.
References
Bhat, K.M., Valdez, R.B. and Estoquia, d.A. 1998. Wood production and use. In: Roshetko, J.M. (ed.) Albizia and Paraserianthes production and use: a field manual. Winrock International, Morrilton, Ark, USA, 13 pp.
Bignebat, C., Koç, A.A. and Lemeiller, S. 2009. Small producers, supermarkets, and the role of intermediaries in Turkey’s fresh fruit and vegetable market. Agricultural Economics 40: 807–816.
BPS Gunung Kidul, 2008. Gunung Kidul in Numbers Year 2008 (In Indonesian). Statistics Bureau in cooperation with district development Planning Agency, Gunung Kidul, Wonosari.
Budidarsono, S., Kurniawan, I. and Roshetko, J.M. 2009. Rapid market appraisal. Trees in multi-use landscapes in Southeast Asia project (TUL-SEA). World Agroforestry Centre (ICRAF) Southeast Asia Regional Program, Bogor, Indonesia.
Carsan, S. and Holding, C. 2006. Growing farm timber: prac-tices, markets and policies. The Meru timber marketing pilot programme case studies and reviews. World Agroforestry Centre, Nairobi.
Coughlan, A.T., Anderson, E., Stern, L.W. and El-Ansary, A.I. 2006. Marketing channels. 7th ed. Pearson, Upper Saddle River, NJ, USA.
2012 Conference Proceedings | 143
Perdana and Roshetko
Ewasechko, A.C. 2005. Upgrading the Central Java wood furniture industry: a value-chain approach. International Labor Organization, Manila.
Gabre-Madhin, E.Z. 2001. The role of intermediaries in enhancing market efficiency in the Ethiopian Grain Market. Agricultural Economics 25: 311–320.
International Labor Organization. 2000. Rapid market appraisal: A manual for entrepreneurs. The FIT Manual Series. International Labor Organization, Geneva.
Klerkx, L. and Leeuwis, C. 2008. Matching demand and supply in the agricultural knowledge infrastructure: experiences with innovation intermediaries. Food Policy 22: 260–276.
Kollert, W. and Cherubini, L. 2012. Teak resources and market assessment 2010 (Tectona grandis Linn. F.). Food and Agri-culture Organization, Rome.
Muhtaman, d., Guizol, P., Roda, J.M. and Purnomo, H. 2006. Geographic Indications for Javanese teak: a consti-tutional change. Paper presented at the 11th Biennial Global Conference of The International Association for the Study of Common Property (IASCP) on 19–23 June 2006 in Bali, Indonesia.
Nawir, A.A., Murniati and Rumboko, L. 2007. Past and present policies and programmes affecting forest and land rehabil-itation initiatives. In: Nawir, A.A., Murniati and Rumboko, L. (eds) Forest rehabilitation in Indonesia: Where to after more than three decades? Center for International Forestry Research, Bogor, Indonesia, 77 pp.
Ostertag, C., Lundy, M., Gottret, M.V., Best, R. and Ferris, S. 2007. Identifying market opportunities for rural smallholder producers. Rural Agroenterprise development Project, Centro Internacional de Agricultura Tropical, Palmira, Colombia.
Perdana, A. 2010. Understanding the teak trade chain (in Indonesian). Kiprah Agroforestry 7(3): 3.
Perdana, A., Roshetko, J.M. and Kurniawan, I. 2012. Forces of competition: smallholding teak producers in Indonesia. International Forestry Review 14 (2): 238-248.
Perhutani. 2010. Annual Report 2010. Perum Perhutani, Jakarta.
Pokhrel, d.M. and Thapa, G.B. 2007. Are marketing interme-diaries exploiting mountain farmers in Nepal? A study based on market price, marketing margin and income distribution analyses. Agricultural Systems 94: 151–164.
Roda, J., Cadéne, P., Guizol, P., Santoso, L. and Fauzan, A.U. 2007. Atlas of wooden furniture industry in Jepara, Indo-nesia. Center for International Forestry Research, Bogor, Indonesia.
Rohadi, d., Kallio, M., Krisnawati, H. and Manalu, P. 2010. Economic incentives and household perceptions on small-holder timber plantations: Lessons from case studies in Indonesia. Paper presented at the International Commu-nity Forestry Conference. Montpellier, France.
Rohadi, d., Roshetko, J.M., Perdana, A., Blyth, M., Nuryar-tono, N., Kusumowardani, N., Pramono, A.A., Widyani, N., Fauzi, A., Sasono, J., Sumardamto, P. and Manalu, P. 2012. Improving economic outcomes for smallholders growing teak in agroforestry systems in Indonesia. Austra-lian Centre for International Agricultural Research (ACIAR), Canberra.
Roshetko, J.M. and Manurung, G.E.S. 2009. Smallholder teak production system in Gunungkidul, Indonesia. Poster presented at the 2nd World Congress of Agroforestry, Nairobi.
144 | IUFRO 3.08.00 Small-Scale Forestry
Introduction
Being a transition country Estonia has faced the restruc-turing of the whole economy since 1990-s. These changes occurred also in the forest sector including the reestablishment of private forest ownership. The new situation, however, meant also reforms in the insti-tutional environment, governance and resource alloca-tion and employment. These reforms included the intro-duction of a new Forest Act in 19931, the formulation of national forest policy (1997) and the establishment of a National Forestry Development Plan2 (NFDP) in early 2000. With policies there is an important relation-ship between makers and followers of the policy. As
1 Many problems arouse with the Act form 1993 i.e. illegal harvesting and the new act was established in 1998. Still imperfect, this Act was changed 12 times (Muiste et al 2006) after it was once again replaced in 2007. Due to several polit-ical changes the Acts, and thus the legislative environment as a whole, have been quite hectic and for forest owners quite strict, inflexible and unstable.2 Adopted by the Parliament in 2002 the first NFDP was valid until 2010. Now there is an ex-post evaluation completed on the NFDP until 2010 and a new NFDP until 2020 has already been adopted.
outlined by Kallas (2002) policies can be successful if the proposed changes are in line with informal rules i.e. social norms. Forest owners perceived values and long- term objectives are the basis for their decision-making in forest management (Karppinen, 1998). Therefore top-down policies should take this into account. If the policy aim is to change some of those mental stand-points it is important to select and use proper policy tools.
Cooperation between forest owners occurs usually on a voluntary basis although the state can use certain policy tools to make cooperation more attractive to owners. The possible positive effects of cross-boundary coop-eration are highlighted in many studies (Kittredge, 2003; Kittredge, 2005; Lazdinis et al. 2005). Mostly lower trans-action costs (Schlüter, 2007), reducing the impacts of externalities (Mendes et al. 2011) or information sharing (Schulte et al. 2008) are highlighted. Schraml (2005) already underlines that the use of associations in the forestry sector can also have other reasons than economic. Forest owners’ interest to cooperate depends largely on benefits that cooperation brings about. These possible benefits could be very different ranging from an increased economic performance to a wider social network or it might just include possible subsidies which
Understanding Forest Owners’ Behaviour and Values to Encourage Cross-Boundary Cooperation in EstoniaPriit Põllumäe1 and Henn Korjus2 1 PhD student. Estonian University of Life Sciences, Department of Forest Management. Kreutzwaldi 5, Tartu, Estonia, [email protected]
2 Associate Professor. Estonian University of Life Sciences, Department of Forest Management. Kreutzwaldi 5, Tartu, Estonia, [email protected]
Keywords: private forestry, Estonia, cooperation, private forest policy
Abstract
Forest ownership in Estonia is in its youth – twenty years after the start of the restitution and privatization process roughly half of the forests are in private hands i.e. ~1 M ha. Although the first forest owners organizations emerged in the mid 90es the rate of cooperation is still rather slow – only 6% of forest owners (out of ~80 000) are members of Forest Owner Associations (FOA). The National Forestry Development Plan (NFDP) 2020 puts forward ambi-tious goals – 500 000 ha of private forests should be covered by owners with FOA memberships (baseline 150 000 ha) and during the 10 year period these forest owners should put 5 M m3 of wood on the market (baseline is 65 000 m3). The policy goals are quite straight forward, yet we argue that this kind of one-sided approach towards cooperation might not lead to desired results. Using datasets from FOA surveys conducted in 2007 and 2011 we aim to identify the main characteristics and differences between members who belong to FOA-s and those are not engaged with cooperative actions. Special attention is put three aspects – future management plans, harvesting decisions and perceived values. Since policy goals are usually set to encourage people to behave in a desirable way we draw some recommendations on how to achieve the goals set in the NFDP.
2012 Conference Proceedings | 145
Põllumäe and Korjus
forest owners get through the membership. Some of these aspects are used also as incentives to promote the development of FOA. As Milijic et al. (2010) point out the high fragmentation of private forests is one of the impending factors for the creation of FOA.
Forest owners’ organizations have emerged and devel-oped since the beginning of 1990-es yet the low interest towards forest owners associations (FOA) is still a signif-icant problem in the sector. The governments have acknowledged this problem and now it is being targeted also in the NFDP until 2020 (2010). NFDP 2020 (2010) puts forward ambitious goals – 500 000 ha of private forests should be covered by owners with FOA member-ships (baseline 150 000 ha) and during the 10 year period these forest owners should put 5 M m3 of wood on the market (baseline is 65 000 m3). Yet the level of knowledge about forest owners in general and about their cooperation is rather low. Many overviews on this topic (for example the Private Forestry Yearbook 2009-2010 by Erametsakeskus, 2011) tend to focus only on numbers and there is no in-depth analysis or view on why forest owners have joined FOA and what would be a general profile of a FOA member. Having this knowl-edge is of great importance to understand how coopera-tion has developed and what the potential way to further enhance cooperative actions is. Since the state obvi-ously has the willingness to support forest owner’s coop-eration it is essential to understand the forest owners’ attitudes towards it. As Nonic et al (2011) underline those two aspects are the keys to the successful development of forest owner’s organizations. Without the knowledge about forests owners the potential policy tools to be used, to reach the NFP goals, might fail.
Private Forestry in Estonia
Private ownership emerged again in the early 1990-s when the restitution and privatization began. Although this was roughly 20 years ago the process is still ongoing, although in its final stages. In 2011 there were 93 271 private forest owners (96%) and 4001 (4%) legal forest owners (companies, firms) who covered 747 000 ha (74%) and 263 000 ha (26%) of private forest land respectively (Forinfo, 2011). The study made for the Ministry of Environment by Forinfo (2011) reveals that ~56% of private forest owners own properties between 0.1-5 ha (76% between 0.1-10 ha) yet they cover only 14% of the private forests (excluding legal owners). Forest owners who own 20 ha or more cover 42% of private forests yet in numbers they make only 9% out of the 93 000 ie. 8000-9000 owners. The average size of private forests in total is 10.4 ha i.e. in the case of private persons 8,0 and private legal owners 65.7 (Forinfo, 2011).
Management activities were planned in 2010 on 95 000 ha of private forests (Forinfo 2011) which makes ~9% of the total private forests. Compared to private
persons the legal forest owners (companies) planned in an average 2.6 times as much management activities per one area unit. The study also underlines that among private forest owners the activities were planned more actively by owners whose forest property was 10-50 ha in size (Forinfo, 2011). It is very usual that a permit for various management activities is obtained but eventu-ally in some cases even 40-60% of those permits are not executed.
First FOA were established in 1992/1993 and according to Erametsakeskus (2012) there are nowadays 47 regional FOA. Obviously during the two decades there have been associations who have quit and some who have joined. In a national level most of those FOAs are represented in international and national policy issues by the umbrella organization Estonian Private Forest Union (EPFU). Regards training and support measures there was a state foundation formed in 1999 called Private Forest Centre (PFC) who now acts under the Ministry of Environment. The PFC acts as a centre of compe-tence in private forestry and they forward forest-related subsidies both from the state and from the Common Agricultural Policy. As a very specific state measure regards cooperation, they also support collective sales of wood and the establishment of support persons in regional FOA.
At a first glance it seems that the environment for forest owners’ cooperation is quite favorable. Yet according to the National Forest Program until 2020 (2010) only 6% of forest owners are engaged in FOA-s. Our calculations from Erametsakeskus (2011) revealed approximately the same numbers. These calculations also revealed that FOA members cover roughly 25% of total private forests. The analysis conducted by Forinfo (2011) found that in the beginning of 2010 there were 2811 forest owners in FOA-s. This, if calculated with the total number of private owners, is 3%. Aun (2012) indicated that there are ~4500 forest owners in FOA which makes a 4-5% cooperation rate. These differences in results characterize well the level of knowledge, or lack of it, about forest owners and their cooperation. Out of all the planned forest manage-ment activities in 2010 FOA members accounted for 87% in terms of area covered with permits. All these figures indicate that an average FOA member has more forest than the overall average owner and he/she is more active in terms of management.
Materials and Methods
The materials used in this study were collected in 2007 and in 2011 through a questionnaire survey among private forest owners. In both cases the majority of the sample was directed to a target population i.e. FOA and the PFC channels were used to reach the owners. In the case of 2011 also a random sample was used (600 questionnaires were sent out and 98 were received back). The questionnaires included questions about
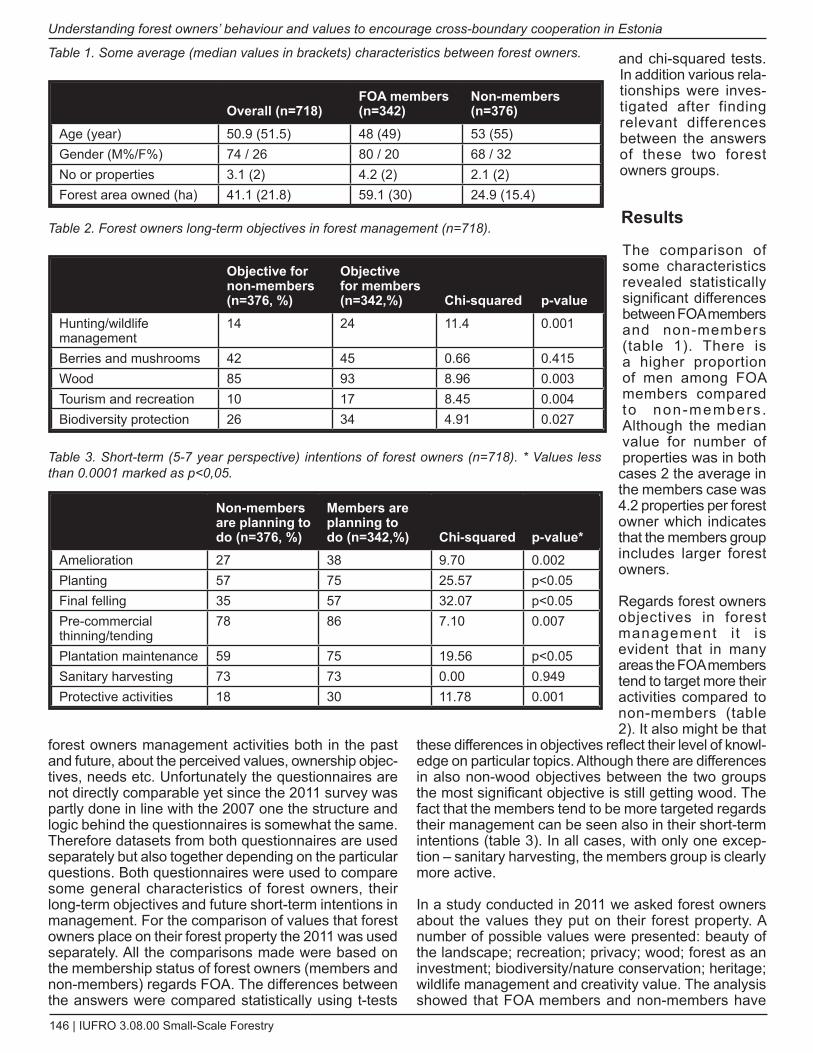
146 | IUFRO 3.08.00 Small-Scale Forestry
Understanding forest owners’ behaviour and values to encourage cross-boundary cooperation in Estonia
forest owners management activities both in the past and future, about the perceived values, ownership objec-tives, needs etc. Unfortunately the questionnaires are not directly comparable yet since the 2011 survey was partly done in line with the 2007 one the structure and logic behind the questionnaires is somewhat the same. Therefore datasets from both questionnaires are used separately but also together depending on the particular questions. Both questionnaires were used to compare some general characteristics of forest owners, their long-term objectives and future short-term intentions in management. For the comparison of values that forest owners place on their forest property the 2011 was used separately. All the comparisons made were based on the membership status of forest owners (members and non-members) regards FOA. The differences between the answers were compared statistically using t-tests
and chi-squared tests. In addition various rela-tionships were inves-tigated after finding relevant differences between the answers of these two forest owners groups.
Results
The comparison of some characteristics revealed statistically significant differences between FOA members and non-members (table 1). There is a higher proportion of men among FOA members compared to non-members . Although the median value for number of properties was in both cases 2 the average in the members case was 4.2 properties per forest owner which indicates that the members group includes larger forest owners.
Regards forest owners objectives in forest management i t is evident that in many areas the FOA members tend to target more their activities compared to non-members (table 2). It also might be that
these differences in objectives reflect their level of knowl-edge on particular topics. Although there are differences in also non-wood objectives between the two groups the most significant objective is still getting wood. The fact that the members tend to be more targeted regards their management can be seen also in their short-term intentions (table 3). In all cases, with only one excep-tion – sanitary harvesting, the members group is clearly more active.
In a study conducted in 2011 we asked forest owners about the values they put on their forest property. A number of possible values were presented: beauty of the landscape; recreation; privacy; wood; forest as an investment; biodiversity/nature conservation; heritage; wildlife management and creativity value. The analysis showed that FOA members and non-members have
Overall (n=718)FOA members (n=342)
Non-members (n=376)
Age (year) 50.9 (51.5) 48 (49) 53 (55)Gender (M%/F%) 74 / 26 80 / 20 68 / 32No or properties 3.1 (2) 4.2 (2) 2.1 (2)Forest area owned (ha) 41.1 (21.8) 59.1 (30) 24.9 (15.4)
Objective for non-members (n=376, %)
Objective for members (n=342,%) Chi-squared p-value
Hunting/wildlife management
14 24 11.4 0.001
Berries and mushrooms 42 45 0.66 0.415Wood 85 93 8.96 0.003Tourism and recreation 10 17 8.45 0.004Biodiversity protection 26 34 4.91 0.027
Non-members are planning to do (n=376, %)
Members are planning to do (n=342,%) Chi-squared p-value*
Amelioration 27 38 9.70 0.002Planting 57 75 25.57 p<0.05Final felling 35 57 32.07 p<0.05Pre-commercial thinning/tending
78 86 7.10 0.007
Plantation maintenance 59 75 19.56 p<0.05Sanitary harvesting 73 73 0.00 0.949Protective activities 18 30 11.78 0.001
Table 2. Forest owners long-term objectives in forest management (n=718).
Table 3. Short-term (5-7 year perspective) intentions of forest owners (n=718). * Values less than 0.0001 marked as p<0,05.
Table 1. Some average (median values in brackets) characteristics between forest owners.
2012 Conference Proceedings | 147
Põllumäe and Korjus
different approaches towards some of these values. Statistically different value placements were in the cases of privacy; forest as an investment; wildlife management and creativity in developing the stands. In each case the members group had higher value indicators towards these aspects compared to non-members.
The difference in how these two groups valued wood did not appear of significance. Yet it is important to highlight that even though both groups valued wood highly they still have different approaches towards it i.e. their long-term objectives regards wood are different. The 2011 study revealed that 83% of FOA members consider wood sales as a very important or important long-term objective. Among non-members this was 43%. In the case of self consumption objectives (fuelwood) both groups address this objective with the same amount of importance. These tendencies might explain why the sanitary harvesting is for both groups of equal signifi-cance (table 3). Since final felling is less common within the non-members group sanitary harvesting is seen as an effective tool to gather fuelwood for self consuming purposes. It might also be linked to the differences in size i.e. a larger forest holding can provide wood for both economic purposes but also for self use.
Discussion and Conclusions
The cooperation between forest owners and the devel-opment of FOA-s have been advancing slowly in Estonia despite of all the efforts by the state and the applied policy tools. Cooperation between forest owners relies mostly on a voluntary basis. The analysis and overview provided in the previous chapters show that the estab-lishment and development of FOA seems to rely on larger forest owners – those who are more active in forest management and who might depend more on forest-related income. Certainly one of the key elements of FOA tasks is representing the interests of forest owners, knowledge transfer etc. Yet, it seems that to a large extent the driving force has initially been economic considerations. Berlin et al. (2006) also outlines that FOA-s serves usually forest owners who are more inter-ested in income generation. Property characteristics play an important role in this case as showed the results above as well as Malovrh et al. (2010) – there is an existing relationship between the size of forest land and willingness to cooperate.
The differences between forest management activities by members and non-members showed as well that there are differences in the objectives as also outlined by Favada et al (2009). For forest owners with smaller properties income might not be the ownership objec-tive they pursue which influences their management decisions. Many of the services that FOA-s offer might not be of relevance for them or even more – due to the small property some services might be too costly. Although decision making of forest owners depends
on very different aspects e.g. institutional environment, market conditions, forest condition etc. one of the main fundamental basis are perceived values (Karppinen, 1998).
To enhance cooperation between forest owners it is therefore essential to understand what do forest owners want i.e. what do they value and develop further the services that FOA can provide. These aspects involve data collection, training and extension. Shulte et al. (2008) conclude that to support cooperation in forest management it is essential to have a well established data infrastructure and professional training. The goals set by the NFP until 2020 (2010) are ambitious and it is difficult to assess the current progress and the like-lihood of reaching the goals especially without a good understanding about forest owners needs. The Forinfo (2011) study shed some light on the ownership struc-ture of forest owners in Estonia but there is still a lack of understanding about forest owners’ values, manage-ment objectives and their willingness to cooperate in forest management. Policy makers have been, to a large extent, operating on ´unknown territories´.
Further research would be needed to assess the effec-tiveness of policy instruments used during the transi-tion period to understand how private forestry has been guided and what potential instruments could be used to enhance cooperative initiatives and cooperation in the sector. The choices for instruments should be then care-fully assessed taking under consideration the owner-ship structure (in FOA-s and outside). In addition it is important to see these processes in the frame of what people value in their forests and what are their manage-ment objectives.
References
Aun, J. 2012. Board member of the Private Forest Centre, personal communication in March 2012.
Berlin, C., Lidestav, G., Holm, S. 2006. Values Placed on Forest Property Benefits by Swedish NIPF Owners: Differ-ences between Members in Forest Owner Associations and Non-members. Small Scale Forest Economics, Manage-ment and Policy 5 (1), p. 83-96.
Erametsakeskus. 2011. Erametsanduse aastaraamat Eramets 2009-2010 [Private Forestry Yearbook 2009-2010]. Annual report, Tallinn (In Estonian).
Erametsakeskus. 2012. Metsaühistute jaotus maakondade kaupa [The distribution of forest owners association]. http://www.eramets.ee/metsauhistute-jaotus-maakondade-kaupa (Accessed 12.03.2012, In Estonian).
Favada, I.M., Karppinen, H., Kuuluvainen, J., Mikkola, J., Stavness, C. 2009. Effects of Timber Prices, Ownership Objectives, and Owner Characteristics on Timber Supply. Forest Science 55 (6), p. 512-523.
148 | IUFRO 3.08.00 Small-Scale Forestry
Understanding forest owners’ behaviour and values to encourage cross-boundary cooperation in Estonia
Forinfo. 2011. Eesti erametsaomandi struktuur ja kasutamine 2010. aastal [The structure and use of Estonian private forests in 2010]. Ministry of Environment (In Estonian).
Kallas, A. 2002. Public forest policy making in post-Communist Estonia. Forest Policy and Economics 4, p. 323-332.
Karppinen, H. 1998. Values and Objectives of Non-industrial Private Forest Owners in Finland. Silva Fennica 32 (1), p. 43-59.
Kittredge, d.B. 2003. Private Forestland Owners in Sweden: Large-Scale Cooperation in Action. Journal of Forestry 2(2), p. 41-46.
Kittredge, d.B. 2005. The cooperation of private forest owners on scales larger than one individual property: international examples and potential applications in the United States. Forest Policy and Economics 7, p. 671-688.
Lazdinis, M., Pivoriūnas, A., Lazdinis, I. 2005. Cooperation in Private Forestry of Post-Soviet System: Forest Owners´ Cooperatives in Lithuania. Small Scale Forest Economics, Management and Policy 4 (4), p. 377-390.
Malovrh, Š.P., Stirn, L.Z., Krć, J. 2010. Influences on asso-ciating private forest owners in Slovenia. In: Small scale forestry in a changing world: opportunities and challenges and the role of extension and technology transfer, IUFRO Conference: 3.08 Small Scale Forestry, 6.06.02 Exten-sion, 6.06.01 Technology Transfer. Bled, Slovenia 6-10 June 2010.
Mendes, A.M.S.C., Štefanek, B., Feliciano, d., Mizaraite, D., Nonić, D., Kitchoukov, E., Nybakk, E., Duduman, G., Weiss ,G., Nichiforel, L., Stoyanova, M., Mäkinen, P., Alves, R., Milijić, V., Sarvašova, Z. 2011. Institutional Inno-vation in European Private Forestry: the Emergence of Forest Owners´ Organizations. In: Weiss G, Pettenella d, Ollonqvist P, Slee B (eds.). Innovation in Forestry. CABI publishing, Oxfordshire, ch. 5.
Milijic, V., Rankovic, N., Nonic, d., Nedeljkovic, J. 2010. Orga-nization of private forest sector in Timok forest area. Annals of Forest Research 53 (1), p. 59-69.
Muiste, P., Kurvits, V., Mitt, R., Teder, M., Kakko T. 2006. Forest harvesting in Estonia during the transition period. Forestry Studies 45, p. 164-171.
NFdP until 2020. 2010. Ministry of Environment of Estonia, Tallinn, 39 p. (In Estonian).
Nonic, d., Bliss, J.C., Milijic, V., Petrovic, N., Avdibegovic, M., Mataruga, M. 2011. Challenges of Organizing Private Forest Owners in Serbia. Small-scale Forestry 10 (4), p. 435-455.
Schlüter, A. 2007. Institutional change in the forestry sector – The explanatory potential of New Institutional Economics. Forest Policy and Economics 9, p. 1090-1099.
Schraml, U. 2005. Between Legitimacy and Efficiency: The development of Forestry Associations in Germany. Small-scale Forest Economics, Management and Policy 4 (3), p. 251-268.
Schulte, L.A., Rickenbach, M., Merrick, L.C. 2008. Ecolog-ical and economic benefits of cross-boundary coordination among private forest landowners. Landscape Ecology 23, p. 481-496.
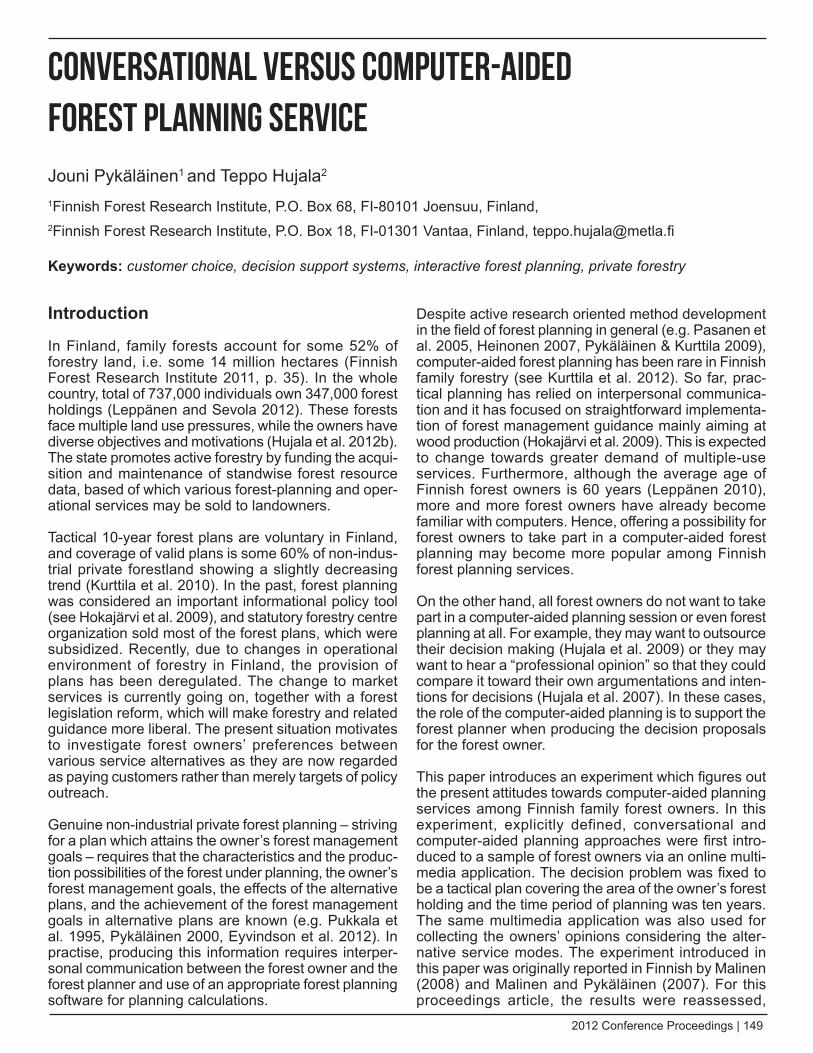
2012 Conference Proceedings | 149
Introduction
In Finland, family forests account for some 52% of forestry land, i.e. some 14 million hectares (Finnish Forest Research Institute 2011, p. 35). In the whole country, total of 737,000 individuals own 347,000 forest holdings (Leppänen and Sevola 2012). These forests face multiple land use pressures, while the owners have diverse objectives and motivations (Hujala et al. 2012b). The state promotes active forestry by funding the acqui-sition and maintenance of standwise forest resource data, based of which various forest-planning and oper-ational services may be sold to landowners.
Tactical 10-year forest plans are voluntary in Finland, and coverage of valid plans is some 60% of non-indus-trial private forestland showing a slightly decreasing trend (Kurttila et al. 2010). In the past, forest planning was considered an important informational policy tool (see Hokajärvi et al. 2009), and statutory forestry centre organization sold most of the forest plans, which were subsidized. Recently, due to changes in operational environment of forestry in Finland, the provision of plans has been deregulated. The change to market services is currently going on, together with a forest legislation reform, which will make forestry and related guidance more liberal. The present situation motivates to investigate forest owners’ preferences between various service alternatives as they are now regarded as paying customers rather than merely targets of policy outreach.
Genuine non-industrial private forest planning – striving for a plan which attains the owner’s forest management goals – requires that the characteristics and the produc-tion possibilities of the forest under planning, the owner’s forest management goals, the effects of the alternative plans, and the achievement of the forest management goals in alternative plans are known (e.g. Pukkala et al. 1995, Pykäläinen 2000, Eyvindson et al. 2012). In practise, producing this information requires interper-sonal communication between the forest owner and the forest planner and use of an appropriate forest planning software for planning calculations.
Despite active research oriented method development in the field of forest planning in general (e.g. Pasanen et al. 2005, Heinonen 2007, Pykäläinen & Kurttila 2009), computer-aided forest planning has been rare in Finnish family forestry (see Kurttila et al. 2012). So far, prac-tical planning has relied on interpersonal communica-tion and it has focused on straightforward implementa-tion of forest management guidance mainly aiming at wood production (Hokajärvi et al. 2009). This is expected to change towards greater demand of multiple-use services. Furthermore, although the average age of Finnish forest owners is 60 years (Leppänen 2010), more and more forest owners have already become familiar with computers. Hence, offering a possibility for forest owners to take part in a computer-aided forest planning may become more popular among Finnish forest planning services.
On the other hand, all forest owners do not want to take part in a computer-aided planning session or even forest planning at all. For example, they may want to outsource their decision making (Hujala et al. 2009) or they may want to hear a “professional opinion” so that they could compare it toward their own argumentations and inten-tions for decisions (Hujala et al. 2007). In these cases, the role of the computer-aided planning is to support the forest planner when producing the decision proposals for the forest owner.
This paper introduces an experiment which figures out the present attitudes towards computer-aided planning services among Finnish family forest owners. In this experiment, explicitly defined, conversational and computer-aided planning approaches were first intro-duced to a sample of forest owners via an online multi-media application. The decision problem was fixed to be a tactical plan covering the area of the owner’s forest holding and the time period of planning was ten years. The same multimedia application was also used for collecting the owners’ opinions considering the alter-native service modes. The experiment introduced in this paper was originally reported in Finnish by Malinen (2008) and Malinen and Pykäläinen (2007). For this proceedings article, the results were reassessed,
Conversational Versus Computer-Aided Forest Planning ServiceJouni Pykäläinen1 and Teppo Hujala2 1Finnish Forest Research Institute, P.O. Box 68, FI-80101 Joensuu, Finland, 2Finnish Forest Research Institute, P.O. Box 18, FI-01301 Vantaa, Finland, [email protected]
Keywords: customer choice, decision support systems, interactive forest planning, private forestry
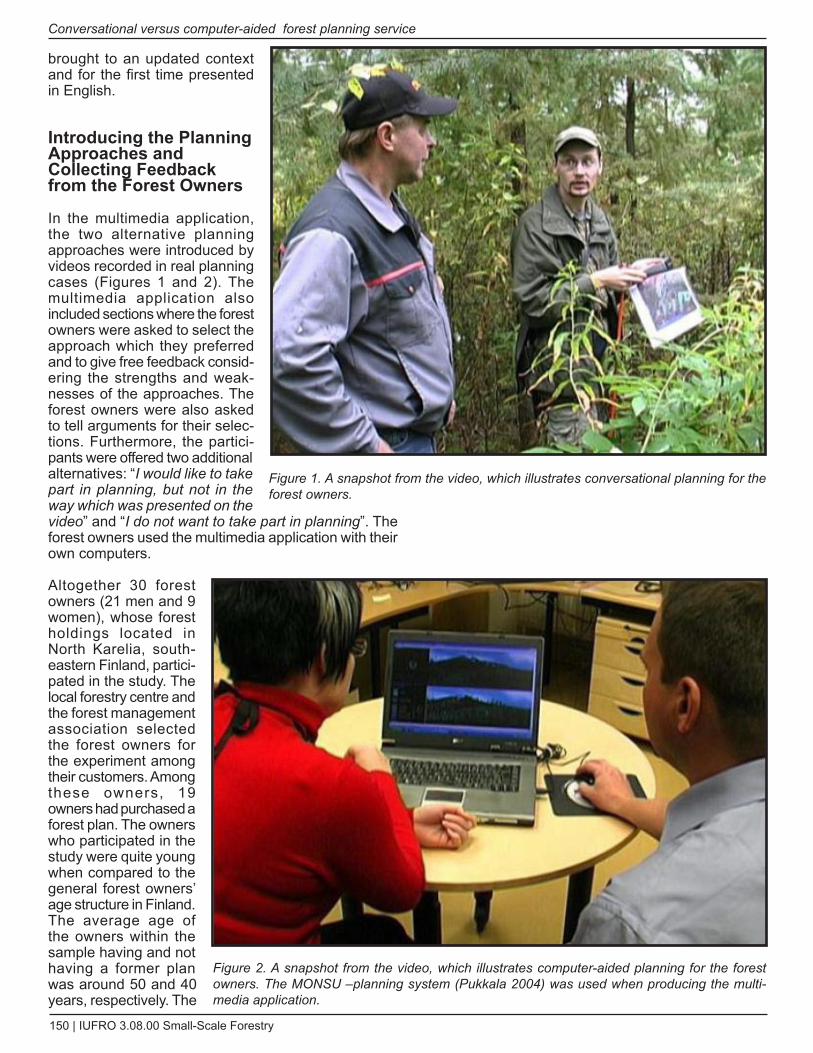
150 | IUFRO 3.08.00 Small-Scale Forestry
Conversational versus computer-aided forest planning service
brought to an updated context and for the first time presented in English.
Introducing the Planning Approaches and Collecting Feedback from the Forest Owners
In the multimedia application, the two alternative planning approaches were introduced by videos recorded in real planning cases (Figures 1 and 2). The multimedia application also included sections where the forest owners were asked to select the approach which they preferred and to give free feedback consid-ering the strengths and weak-nesses of the approaches. The forest owners were also asked to tell arguments for their selec-tions. Furthermore, the partici-pants were offered two additional alternatives: “I would like to take part in planning, but not in the way which was presented on the video” and “I do not want to take part in planning”. The forest owners used the multimedia application with their own computers.
Altogether 30 forest owners (21 men and 9 women), whose forest holdings located in North Karelia, south-eastern Finland, partici-pated in the study. The local forestry centre and the forest management association selected the forest owners for the experiment among their customers. Among these owners, 19 owners had purchased a forest plan. The owners who participated in the study were quite young when compared to the general forest owners’ age structure in Finland. The average age of the owners within the sample having and not having a former plan was around 50 and 40 years, respectively. The
Figure 1. A snapshot from the video, which illustrates conversational planning for the forest owners.
Figure 2. A snapshot from the video, which illustrates computer-aided planning for the forest owners. The MONSU –planning system (Pukkala 2004) was used when producing the multi-media application.
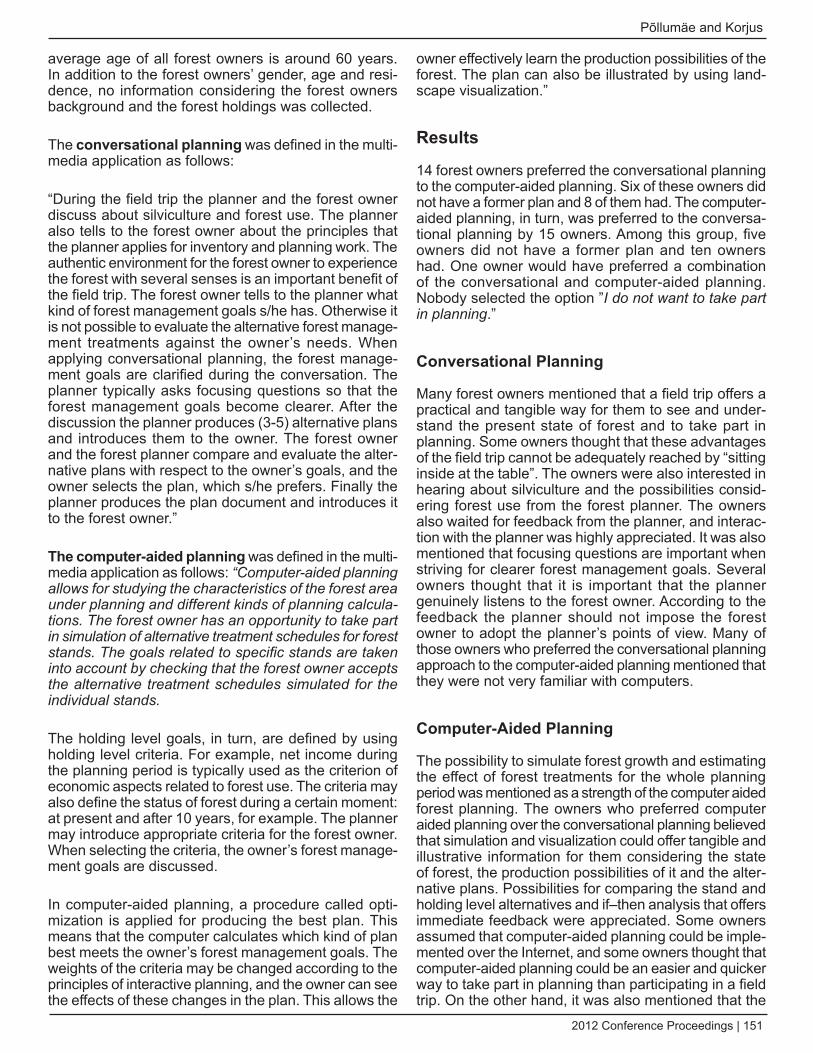
2012 Conference Proceedings | 151
Põllumäe and Korjus
average age of all forest owners is around 60 years. In addition to the forest owners’ gender, age and resi-dence, no information considering the forest owners background and the forest holdings was collected.
The conversational planning was defined in the multi-media application as follows:
“During the field trip the planner and the forest owner discuss about silviculture and forest use. The planner also tells to the forest owner about the principles that the planner applies for inventory and planning work. The authentic environment for the forest owner to experience the forest with several senses is an important benefit of the field trip. The forest owner tells to the planner what kind of forest management goals s/he has. Otherwise it is not possible to evaluate the alternative forest manage-ment treatments against the owner’s needs. When applying conversational planning, the forest manage-ment goals are clarified during the conversation. The planner typically asks focusing questions so that the forest management goals become clearer. After the discussion the planner produces (3-5) alternative plans and introduces them to the owner. The forest owner and the forest planner compare and evaluate the alter-native plans with respect to the owner’s goals, and the owner selects the plan, which s/he prefers. Finally the planner produces the plan document and introduces it to the forest owner.”
The computer-aided planning was defined in the multi-media application as follows: “Computer-aided planning allows for studying the characteristics of the forest area under planning and different kinds of planning calcula-tions. The forest owner has an opportunity to take part in simulation of alternative treatment schedules for forest stands. The goals related to specific stands are taken into account by checking that the forest owner accepts the alternative treatment schedules simulated for the individual stands.
The holding level goals, in turn, are defined by using holding level criteria. For example, net income during the planning period is typically used as the criterion of economic aspects related to forest use. The criteria may also define the status of forest during a certain moment: at present and after 10 years, for example. The planner may introduce appropriate criteria for the forest owner. When selecting the criteria, the owner’s forest manage-ment goals are discussed.
In computer-aided planning, a procedure called opti-mization is applied for producing the best plan. This means that the computer calculates which kind of plan best meets the owner’s forest management goals. The weights of the criteria may be changed according to the principles of interactive planning, and the owner can see the effects of these changes in the plan. This allows the
owner effectively learn the production possibilities of the forest. The plan can also be illustrated by using land-scape visualization.”
Results
14 forest owners preferred the conversational planning to the computer-aided planning. Six of these owners did not have a former plan and 8 of them had. The computer-aided planning, in turn, was preferred to the conversa-tional planning by 15 owners. Among this group, five owners did not have a former plan and ten owners had. One owner would have preferred a combination of the conversational and computer-aided planning. Nobody selected the option ”I do not want to take part in planning.”
Conversational Planning
Many forest owners mentioned that a field trip offers a practical and tangible way for them to see and under-stand the present state of forest and to take part in planning. Some owners thought that these advantages of the field trip cannot be adequately reached by “sitting inside at the table”. The owners were also interested in hearing about silviculture and the possibilities consid-ering forest use from the forest planner. The owners also waited for feedback from the planner, and interac-tion with the planner was highly appreciated. It was also mentioned that focusing questions are important when striving for clearer forest management goals. Several owners thought that it is important that the planner genuinely listens to the forest owner. According to the feedback the planner should not impose the forest owner to adopt the planner’s points of view. Many of those owners who preferred the conversational planning approach to the computer-aided planning mentioned that they were not very familiar with computers.
Computer-Aided Planning
The possibility to simulate forest growth and estimating the effect of forest treatments for the whole planning period was mentioned as a strength of the computer aided forest planning. The owners who preferred computer aided planning over the conversational planning believed that simulation and visualization could offer tangible and illustrative information for them considering the state of forest, the production possibilities of it and the alter-native plans. Possibilities for comparing the stand and holding level alternatives and if–then analysis that offers immediate feedback were appreciated. Some owners assumed that computer-aided planning could be imple-mented over the Internet, and some owners thought that computer-aided planning could be an easier and quicker way to take part in planning than participating in a field trip. On the other hand, it was also mentioned that the
152 | IUFRO 3.08.00 Small-Scale Forestry
Conversational versus computer-aided forest planning service
best practice would be a planning process consisting of both the field trip and the computer-aided planning session.
Discussion
According to the feedback, almost all forest owners, who participated in the study, would be willing to take part either in the conversational (14 owners) or computer-aided (15 owners) planning. Thus the present results indicate that both the conversational and the computer-aided planning approaches are needed when striving for client-oriented planning services in non-industrial private forestry. The owners who participated in the study were younger than the owners in general in the study region. Therefore the observed proportion of the owners interested in computer-aided planning might give a slightly overestimated image of the attractive-ness of the computer-aided approach. However, the small sample size does not allow statistical generaliza-tion of the preference shares. The qualitative meanings of the free feedback are the most relevant part of the results. They give evidence of important assets that the both illustrated planning approaches have among forest owners. Conversational planning might appeal for owners who are emotionally engaged in their forest ownership and want to discuss various aspects of forests with an expert. Computer-aided planning, in turn, might appeal for owners who take a more disci-plined view on decisions regarding their forests and want to ponder between rigorously presented alter-natives. These different customer approaches repre-sent different decision-making modes, for which Hujala and colleagues (2007) recommended different service approaches.
In the study of Pykäläinen (2000) interactive computer-aided planning was used together with a preliminary thematic interview. The purpose of the thematic interview was to qualitatively define the owner’s forest manage-ment goals and the purpose of interactive optimization was to produce a plan, which best meets these goals. In that study, it was asked from the forest owner after the planning sessions, whether they prefer the traditional planning, mainly offering wood production and silvicul-tural instruction, to the interactive planning or vice versa. The result was that half of the owners preferred inter-active planning to the traditional planning. A reason for this result might be that the forest owners’ goals are not profoundly taken into account in traditional planning. The traditional planning is still the mainstream approach in Finland. However, the characteristics of conversational planning introduced in this paper are becoming more common also in practical planning services.
The importance of the field trip was emphasized in the feedback considering the conversational planning. However, it is not always possible to arrange a field trip where both the owner and the planner participate.
In these cases tangible and illustrative material that presents the state of forest and the alternative forest plans should be used. The role of so called trialocigal learning (Hujala et al. 2012a) – where so called artefacs work as the mediators of interaction between the partici-pants of the learning process – may be the key to finding owner-oriented practices to both conversational and computer-supported planning. In forest planning, typical artefacts consist of maps, aerial photographs, charts and earlier forest plan documents.
In the present experiment, the multimedia application well served as the illustration of alternative planning modes to the forest owners. The forest owners gave plenty of consistent and logical feedback. It seems that the participants of the experiment well understood the planning approaches and the potential benefits of the services for the forest owners. This result indicates that multimedia could be used as a tool of marketing planning services.
In the future, the planning approaches presented here can be flexibly combined to each other. Computer-aided planning can be done in forest by using mobile tech-nology and forest can be better illustrated by highly developed visualization tools (see Falcão 2008). Lidar-based digital elevation models allow very accurate virtual forest planning environments (Tinkham et al. 2012). Planning over the Internet (e.g. Pasanen et al. 2006, Eyvindson et al. 2011) offers very interesting possibilities for non-industrial private forest planning. In future, these new planning approaches need to be tested in prac-tical situations to acquire evidence of fulfilled customer values as well as pitfalls of each approach.
References
Eyvindson, K., Kurttila, M., Hujala, T. & Salminen, O. 2011. An internet-supported planning approach for joint ownership forest holdings. Small-scale Forestry 10(1): 1–17.
Eyvindson, K., Hujala, T., Kangas, A. & Kurttila, M. 2012. Selecting a forest plan among alternatives: Consis-tency of preferences within decision support frameworks. Forest Policy and Economics 15: 114–122. http://dx.doi.org/10.1016/j.forpol.2011.09.009
Falcão, A.O. 2008. Visualization in the design of Forested Landscapes. In: von Gadow, K. and Pukkala, T. (eds). designing Green Landscapes. Managing Forest Ecosys-tems 15(IV): 245–263.
Finnish Forest Research Institute. 2011. Forest Finland in Brief. 84 p. Available at: http://www.metla.fi/julkaisut/muut/forest-fin-brief/index-en.htm.
Heinonen, T. 2007. developing spatial optimization in forest planning. doctoral thesis, University of Joensuu, Faculty of Forestry. dissertationes Forestales 34. 48 p. + 5 articles. Available at: http://www.metla.fi/dissertationes/df34.htm.
2012 Conference Proceedings | 153
Põllumäe and Korjus
Hokajärvi, R., Hujala, T., Leskinen, L.A. & Tikkanen, J. 2009. Effectiveness of sermon policy instruments: forest management planning practices applying the activity theory approach. Silva Fennica 43(5): 889-906. Available at: http://www.metla.fi/silvafennica/abs/sa43/sa435889.htm.
Hujala, T., Pykäläinen, J. & Tikkanen, J. 2007. decision making among Finnish non-industrial private forest owners: The role of professional opinion and desire to learn. Scandi-navian Journal of Forest Research, 22(5): 454–463. http://dx.doi.org/10.1080/02827580701395434
Hujala, T., Tikkanen, J., Hänninen, H. & Virkkula, O. 2009. Family forest owners’ perception of decision support. Scan-dinavian Journal of Forest Research 24(5): 448–460. http://dx.doi.org/10.1080/02827580903140679
Hujala, T., Höglund, H., Mehtätalo, L. & Pykäläinen, J. 2012a. Trialogical learning – a concept for enhancing interactive forest planning. In: Proceedings of the IUFRO 3.08 2012 Small-scale Forestry Conference “Science for Solutions”, September 24-27, 2012, Amherst, Massachusetts, USA (this compilation).
Hujala, T., Kurttila, M. & Karppinen, H. 2012b. Customer segments among family forest owners: Combining owner-ship objectives and decision-making styles. To appear in Small-scale Forestry. http://dx.doi.org/10.1007/s11842-012-9215-1
Kurttila, M., Korhonen, K., Hänninen, H. & Hujala, T. 2010. Yksityismetsien metsäsuunnittelu 2010 - nykytilanne ja kehittämistarpeita [Forest planning in private forests 2010 – present state and development needs]. Working Papers of the Finnish Forest Research Institute 153. 43 p. Avail-able at: http://www.metla.fi/julkaisut/workingpapers/2010/mwp153.htm (in Finnish).
Kurttila, M., Heinonen, T., Hujala, T., Kangas, A., Nuutinen, T., Pukkala, T., Pykäläinen, J., Rasinmäki, J. and Tikkanen, J. 2012. The use of forest decision support systems in Finland. To appear in: Borges, J.G., Nordström E-M., Garcia-Gonzalo, J., Hujala T. and Trasobares, A. (eds). Computer-based tools for supporting forest management. The experience and the expertise world-wide. EFI Tech-nical Report. (in press)
Leppänen, J. 2010. Finnish family forest owner 2010 survey. In: Helles, F. and Nielsen, P.S. (eds). Proceedings of the Biennial Meeting of the Scandinavian Society of Forest Economics, Gilleleje, denmark, May 19-22, 2010. Scan-dinavian Forest Economics 43, pp. 184–195. Available at: http://www.metla.fi/org/ssfe/sfe.htm.
Leppänen, J. & Sevola, Y. 2012. Metsämaan omistus 2010 [Ownership of Forestland 2010]. Forest Statistical Bulletin 8/2012, 20.2.2012. Available at: http://www.metla.fi/metinfo/tilasto/julkaisut/mtt/2012/metsamaan_omistus2010.pdf (in Finnish).
Malinen, T. 2008. Metsänomistajaa huomioiva tietokonea-vusteinen metsäsuunnittelu [Computer-supported forest planning taking into account the forest owner]. Master’s
thesis, University of Joensuu, Finland. 50 p. + appendices. Available at: ftp://cs.joensuu.fi/pub/Theses/2008_MSc_Malinen_Toni.pdf (in Finnish).
Malinen, T. & Pykäläinen, J. 2007. Multimediasovellus metsäsuunnittelupalvelujen havainnollistamiseen ja metsänomistajapalautteen keräämiseen [A multimedia appli-cation for illustrating forest planning services and collecting feedback from forest owners]. In: Tikkanen, J., Hokajärvi, R., Hujala, T. and Lappalainen, S. (eds). Asiakaslähtöisyys metsäsuunnittelun kehittämishaasteena [Customer orien-tation as the development challenge of forest planning ]. Working Papers of the Finnish Forest Research Institute 65: 80–89. Available at: http://www.metla.fi/julkaisut/work-ingpapers/2007/mwp065.htm (in Finnish).
Pasanen, K., Kurttila, M., Pykäläinen, J., Kangas, J. & Leskinen, P. 2005. MESTA – Non-industrial private forest owners’ decision-support environment for the evaluation of alternative forest plans over the internet. International Journal of Information Technology & decision Making 4(4): 601–620. http://dx.doi.org/10.1142/S0219622005001726
Pukkala, T. 2004. Monsu metsäsuunnitteluohjelma - Ohjelm-iston toiminta ja käyttö [Monsu forest planning program – Functioning and use of the software]. 75 p.
Pukkala, T., Nuutinen, T. & Kangas, J. 1995. Integrating scenic and recreational amenities into numerical forest planning. Landscape and Urban Planning 32(3): 185–195. http://dx.doi.org/10.1016/0169-2046(94)00195-9
Pykäläinen, J. 2000. Defining forest owner’s forest manage-ment goals by means of thematic interview in interactive forest planning. Silva Fennica 34(1): 47–59. Available at: http://www.metla.fi/silvafennica/abs/sa34/sa341047.htm.
Pykäläinen, J. & Kurttila, M. 2009. Interactive Method for Supporting Forest Owners in Biodiversity Protection deci-sions. Small-scale Forestry 8(3): 337–348. http://dx.doi.org/10.1007/s11842-009-9087-1
Tinkham, W.T., Smith, A.M.S., Hoffman, C., Hudak, A.T., Falkowski, M.J., Swanson, M.E. & Gessler, P.E. 2012. Inves-tigating the influence of LiDAR ground surface errors on the utility of derived forest inventories. Canadian Journal of Forest Research 42(3): 413–422. http://dx.doi.org/10.1139/x11-193.
154 | IUFRO 3.08.00 Small-Scale Forestry
Introduction
The problem is common: a forested landscape under development pressure. A landscape is valuable as forest land because it provides forest products, numerous ecosystem services, recreation opportunities, wildlife habitat, and cultural history, as well as a setting for several rural communities. How do residents protect and sustain this forested system that crosses into multiple municipalities, is in an area where citizens tend to oppose planning, and is in a region and current economic climate of varied and limited financial resources, both public and private? Can citizens establish a forest protection plan that will be owned and accepted by residents, land-owners, municipal officials, local forest industry, and recreation groups, all of whom are important decision-makers affecting the landscape as well as each other’s ability to operate in the landscape? And can citizens
create, or facilitate the creation of, the tools that munici-palities and landowners and forest industry will need to implement their portions of the plan?
Landscapes such as the Rensselaer Plateau, particu-larly those within commuting distances to metropolitan areas, are under increasing development pressure that is expected to continue. When an area is suddenly under such pressure, it can force individuals and municipalities to act too quickly without the full benefit of support and information. A lack of apparent development feeds the feeling that ”no action,” including no planning, will lead to keeping the forested landscape as it is.
In this paper we outline the approach used by the Rens-selaer Plateau Alliance (RPA) to address this problem and describe the progress to date.
Sustaining Forested landscapes in the long Term: knitting Together Stakeholder Support in the Development of a Regional Conservation Plan and Toolkit for the Rensselaer Plateau Rachel Riemann1 and Jim Bonesteel1 1 Rensselaer Plateau Alliance, 167 Brainard Road, Averill Park, NY 12018, [email protected]: local planning, regional cooperation, engaging stakeholders, development pressure
Abstract
A forested landscape provides forest products, numerous ecosystem services, recreation opportunities, wildlife habitat, and cultural history. Development pressures, economic insecurity, and the absence of planning can unwit-tingly combine forces to threaten the existence and/or healthy function of forested landscapes in rural areas, particularly those in amenity-rich areas or within moderate traveling distance from urban centers. The Rensse-laer Plateau in eastern New York is one of the largest and most ecologically intact native habitats in New York, covering about 105,000 acres within 20-30 minutes of the Albany urban area. Forest industry is still active, but is under economic distress. Recreation opportunities bring 300,000 visitors each year. Yet neither of these oppor-tunities has replaced the jobs that were lost when small industries left. This has resulted in limited employment, services, and tax revenue for small communities. How do stakeholders protect and sustain a forested system that extends into multiple municipalities, is in an area that tends to dislike planning, and is in a region of varied and limited landowner, municipal, and county financial resources? The Rensselaer Plateau Alliance has used a grass-roots and multi-faceted approach that includes education, community involvement, cross-boundary cooperation, information gathering, and systematic collaboration with landowner needs, attitudes, practices, and perceptions. This paper describes the challenges faced, the approach used, and the progress to date as a regional conser-vation plan and toolkit emerge.
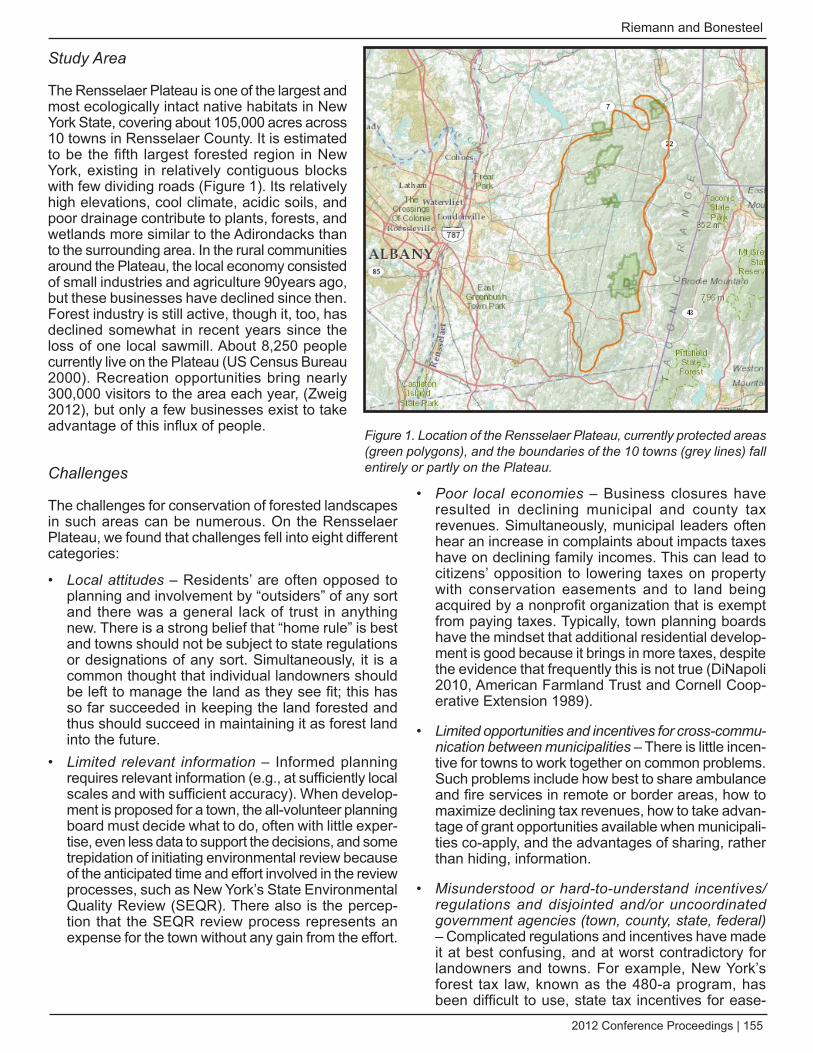
2012 Conference Proceedings | 155
Riemann and Bonesteel
Study Area
The Rensselaer Plateau is one of the largest and most ecologically intact native habitats in New York State, covering about 105,000 acres across 10 towns in Rensselaer County. It is estimated to be the fifth largest forested region in New York, existing in relatively contiguous blocks with few dividing roads (Figure 1). Its relatively high elevations, cool climate, acidic soils, and poor drainage contribute to plants, forests, and wetlands more similar to the Adirondacks than to the surrounding area. In the rural communities around the Plateau, the local economy consisted of small industries and agriculture 90years ago, but these businesses have declined since then. Forest industry is still active, though it, too, has declined somewhat in recent years since the loss of one local sawmill. About 8,250 people currently live on the Plateau (US Census Bureau 2000). Recreation opportunities bring nearly 300,000 visitors to the area each year, (Zweig 2012), but only a few businesses exist to take advantage of this influx of people.
Challenges
The challenges for conservation of forested landscapes in such areas can be numerous. On the Rensselaer Plateau, we found that challenges fell into eight different categories:
Local attitudes• – Residents’ are often opposed to planning and involvement by “outsiders” of any sort and there was a general lack of trust in anything new. There is a strong belief that “home rule” is best and towns should not be subject to state regulations or designations of any sort. Simultaneously, it is a common thought that individual landowners should be left to manage the land as they see fit; this has so far succeeded in keeping the land forested and thus should succeed in maintaining it as forest land into the future. Limited relevant information• – Informed planning requires relevant information (e.g., at sufficiently local scales and with sufficient accuracy). When develop-ment is proposed for a town, the all-volunteer planning board must decide what to do, often with little exper-tise, even less data to support the decisions, and some trepidation of initiating environmental review because of the anticipated time and effort involved in the review processes, such as New York’s State Environmental Quality Review (SEQR). There also is the percep-tion that the SEQR review process represents an expense for the town without any gain from the effort.
Poor local economies • – Business closures have resulted in declining municipal and county tax revenues. Simultaneously, municipal leaders often hear an increase in complaints about impacts taxes have on declining family incomes. This can lead to citizens’ opposition to lowering taxes on property with conservation easements and to land being acquired by a nonprofit organization that is exempt from paying taxes. Typically, town planning boards have the mindset that additional residential develop-ment is good because it brings in more taxes, despite the evidence that frequently this is not true (DiNapoli 2010, American Farmland Trust and Cornell Coop-erative Extension 1989).
Limited opportunities and incentives for cross-commu-• nication between municipalities – There is little incen-tive for towns to work together on common problems. Such problems include how best to share ambulance and fire services in remote or border areas, how to maximize declining tax revenues, how to take advan-tage of grant opportunities available when municipali-ties co-apply, and the advantages of sharing, rather than hiding, information.
Misunderstood or hard-to-understand incentives/• regulations and disjointed and/or uncoordinated government agencies (town, county, state, federal) – Complicated regulations and incentives have made it at best confusing, and at worst contradictory for landowners and towns. For example, New York’s forest tax law, known as the 480-a program, has been difficult to use, state tax incentives for ease-
Figure 1. Location of the Rensselaer Plateau, currently protected areas (green polygons), and the boundaries of the 10 towns (grey lines) fall entirely or partly on the Plateau.
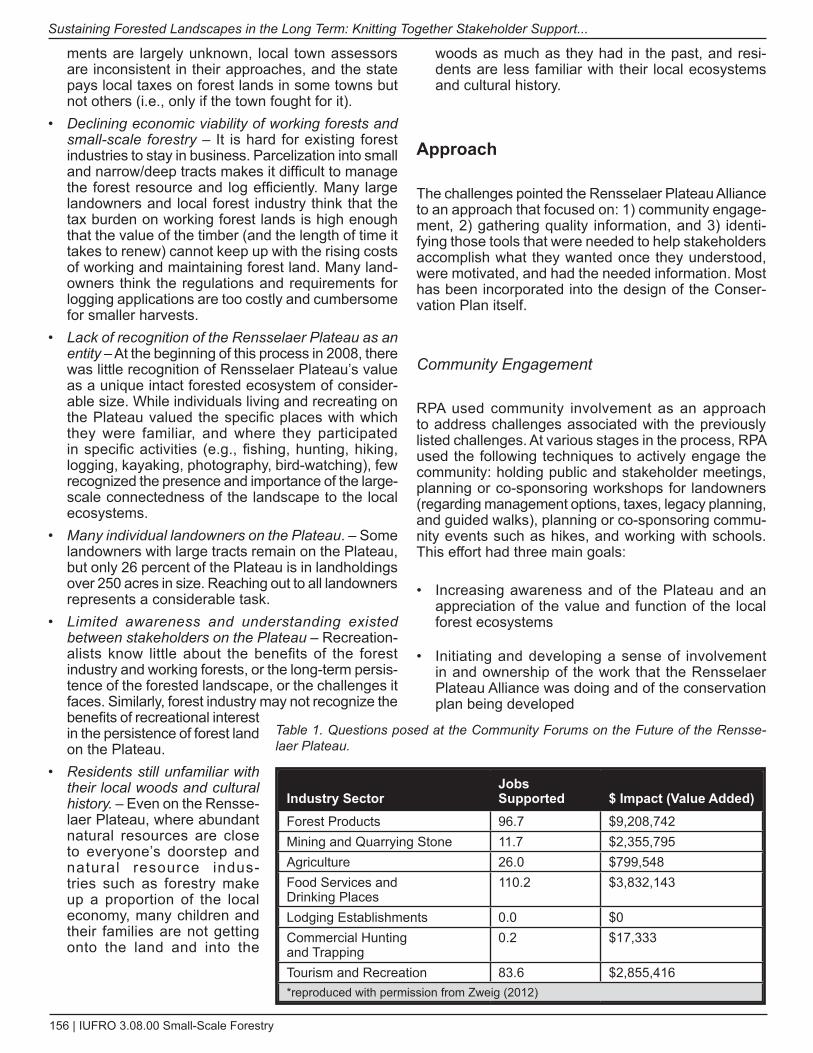
156 | IUFRO 3.08.00 Small-Scale Forestry
Sustaining Forested Landscapes in the Long Term: Knitting Together Stakeholder Support...
ments are largely unknown, local town assessors are inconsistent in their approaches, and the state pays local taxes on forest lands in some towns but not others (i.e., only if the town fought for it). declining economic viability of working forests and • small-scale forestry – It is hard for existing forest industries to stay in business. Parcelization into small and narrow/deep tracts makes it difficult to manage the forest resource and log efficiently. Many large landowners and local forest industry think that the tax burden on working forest lands is high enough that the value of the timber (and the length of time it takes to renew) cannot keep up with the rising costs of working and maintaining forest land. Many land-owners think the regulations and requirements for logging applications are too costly and cumbersome for smaller harvests. Lack of recognition of the Rensselaer Plateau as an • entity – At the beginning of this process in 2008, there was little recognition of Rensselaer Plateau’s value as a unique intact forested ecosystem of consider-able size. While individuals living and recreating on the Plateau valued the specific places with which they were familiar, and where they participated in specific activities (e.g., fishing, hunting, hiking, logging, kayaking, photography, bird-watching), few recognized the presence and importance of the large-scale connectedness of the landscape to the local ecosystems. Many individual landowners on the Plateau• . – Some landowners with large tracts remain on the Plateau, but only 26 percent of the Plateau is in landholdings over 250 acres in size. Reaching out to all landowners represents a considerable task.Limited awareness and understanding existed • between stakeholders on the Plateau – Recreation-alists know little about the benefits of the forest industry and working forests, or the long-term persis-tence of the forested landscape, or the challenges it faces. Similarly, forest industry may not recognize the benefits of recreational interest in the persistence of forest land on the Plateau.Residents still unfamiliar with • their local woods and cultural history. – Even on the Rensse-laer Plateau, where abundant natural resources are close to everyone’s doorstep and natural resource indus-tries such as forestry make up a proportion of the local economy, many children and their families are not getting onto the land and into the
woods as much as they had in the past, and resi-dents are less familiar with their local ecosystems and cultural history.
Approach
The challenges pointed the Rensselaer Plateau Alliance to an approach that focused on: 1) community engage-ment, 2) gathering quality information, and 3) identi-fying those tools that were needed to help stakeholders accomplish what they wanted once they understood, were motivated, and had the needed information. Most has been incorporated into the design of the Conser-vation Plan itself.
Community Engagement
RPA used community involvement as an approach to address challenges associated with the previously listed challenges. At various stages in the process, RPA used the following techniques to actively engage the community: holding public and stakeholder meetings, planning or co-sponsoring workshops for landowners (regarding management options, taxes, legacy planning, and guided walks), planning or co-sponsoring commu-nity events such as hikes, and working with schools. This effort had three main goals:
Increasing awareness and of the Plateau and an • appreciation of the value and function of the local forest ecosystems
Initiating and developing a sense of involvement • in and ownership of the work that the Rensselaer Plateau Alliance was doing and of the conservation plan being developed
Table 1. Questions posed at the Community Forums on the Future of the Rensse-laer Plateau.
Industry SectorJobs Supported $ Impact (Value Added)
Forest Products 96.7 $9,208,742Mining and Quarrying Stone 11.7 $2,355,795Agriculture 26.0 $799,548Food Services and Drinking Places
110.2 $3,832,143
Lodging Establishments 0.0 $0Commercial Hunting and Trapping
0.2 $17,333
Tourism and Recreation 83.6 $2,855,416*reproduced with permission from Zweig (2012)
2012 Conference Proceedings | 157
Riemann and Bonesteel
Creating (and facilitating the creation of) opportu-• nities for communication and collaboration within and between municipalities, landowners, and stake-holders about this resource and its conservation and economic importance.
Timing: Early in the process, the RPA contacted the 10 towns encompassing the Plateau, trying to ensure that town officials were aware of what the Rensselaer Plateau Alliance was, what it was doing, and offering opportunities to be engaged in the process of devel-oping a conservation plan. Rumors and misinformation travel quickly in rural areas and the RPA wanted to be proactive in providing information about what the RPA was doing rather than react to mis-information. Press releases about upcoming events were submitted to the local newspapers, and a current and informative web page was created and kept up-to-date.
After the conservation plan was funded by the Hudson River Estuary Program and work began in earnest, the RPA simultaneously began to work with landowners, municipal officials, local forest industry, recreation groups, and residents, because all of these groups are important decision makers affecting the landscape and affecting each other’s ability to operate in the land-scape. While communication to all groups was consid-ered essential, the best mechanisms and timing might be different for each group.
Developing and communicating a clear and consis-tent vision: The RPA spent time working on a vision, both as a board and in the community. The community process took the form of two open forums in April 2010. (see table 1 for list of questions posed; —Responses are posted at: http://rensselaerplateau.org/Rensselaer-Plateau/Public%20Files/Community_Forum_Results_April2010_Rev1_sig.pdf).
The RPA board held several working retreats to ensure that every board member had a similar understanding of the goals, and how best to communicate those goals. These sessions helped board members understand how their own particular images of the future of the Plateau fit in with these shared goals and overall vision.
Board members considered it very important to commu-nicate frequently and in as many places as possible what this vision was, and how the design and components of the conservation plan were supporting that vision. It was particularly important to communicate that the conser-vation plan was not going to be a plan “written in stone” that dictated to towns where and when things should occur, but rather datasets of information, a summary of current status, guidelines, and a “tool box” and resources accessible to everyone.
Gathering Information
Many town planning boards lack information to make critical decisions and often find themselves at a disad-vantage dealing with a developer who has the finan-cial resources to fund their own resource assess-ments. Even towns interested in planning frequently lacked the necessary information, experience, financial resources, motivation, and/or tools necessary to make truly informed decisions about development proposals within the town.
The first data gap― the need for ecological informa-tion― was needed to determine the location of high biodiversity areas, unique and sensitive ecological communities, and areas that might be less sensitive to increased human development and activities. This information also was needed to differentiate between areas that were intact core forest and those that were connectors between core forest areas,
The RPA reached beyond ecological information and included the economic component by initiating two economic studies. It quickly became apparent that, as in most places, substantial amounts of conserva-tion were impossible without economically and cultur-ally vibrant communities. Financial concerns by the towns and economic hardships of residents have been pressing for some time. RPA thought no one would take a conservation plan seriously if it ignored the economic context of the Rensselaer Plateau region.
The RPA also decided to include not only a traditional economic study but also an assessment of the value of the ecosystem services provided by the natural resources of the Plateau. These ecosystem services are numerous and extend well outside the area of the Plateau itself, however these services are frequently not recognized or fully appreciated. The RPA felt that this was a very important part of the work that needed to be done – compiling and reporting the presence and importance of these largely nonmonetary products and services provided by the natural resources on the Plateau, such as water regulation and supply, flood protection, and wildlife habitat.
To fund these efforts, RPA applied successfully for several grants (Hudson River Estuary Program, Hudson River Valley Greenway, and Barnabas McHenry) and succeeded in finding consultants with both the experi-ence and enthusiasm for taking on these studies with dedication. Since the funding was never quite enough to cover the task, all consultants contributed volunteer time to the project during the course of the studies.
158 | IUFRO 3.08.00 Small-Scale Forestry
Sustaining Forested Landscapes in the Long Term: Knitting Together Stakeholder Support...
The Toolkit
As one participant at the stakeholder meeting for munic-ipal officials pointed out, the conservation plan should be a plan of “how” and not a plan of “no” – i.e., the plan should identify not just prohibited activities and land uses, but rather frame the solution in terms of how to organize and locate necessary activities and develop-ment to get the best possible result, how to determine what the costs and benefits of a particular decision or activity are, how to manage multiple activities, and some-times how to determine what is necessary. An important part of both the approach and the conservation plan will be a “toolkit” of information and resources to help municipalities, landowners, and forest industry accom-plish their goals and the recommendations of the report. From information gathered at the public and stakeholder meetings and in conversations, a list of useful “tools” is being developed. Some of these tools may be avail-able soon after the conservation plan itself, and others may require additional funding or time to develop. These “tools” include anything that supports implementation and include such things as access to data, software or expertise, assistance with planning, coordination efforts, and finding relevant resources, and support in improving existing programs. Some examples are:
A clearinghouse of information regarding resources • currently available for landowners, municipalities, and forest industry. Information requested has included such topics as available tax credits, succes-sion planning, grant opportunities, inter-municipal agreements, options for addressing the burden of increased recreation on local emergency services, and opportunities for off-setting the cost of landown-ership (e.g., windmills, hunt club leases…).Access to natural resource expertise. Many land-• owners are interested in learning more about what’s on their property and how to manage it. Most land-owners had little knowledge of the Master Forest Owners program, which provides private forest owners of New York State with the information and encouragement necessary to manage their forest holdings. Also of specific interest was access to ecological expertise regarding what natural communi-ties are present on their property and how to manage the land in a way that is sensitive to and protects the integrity of those communities it would be important to conserve. Access to geographic information system (GIS) • software and expertise. None of the municipalities have or expect to have GIS software or expertise in-house, but most are interested in getting access to this information. Recommendations for improving some of the programs • that already exist, such as the 480-A program, to make these programs more readily used. Support for the grant application process. •
A clearinghouse of education resources for schools • and camps, including links to programs and oppor-tunities that already exist.Planning assistance. What resources currently exist • or could be developed to help towns afford planning? Also, suggestions for growing the net tax base, and tools for managing public spaces in towns. Benchmarking with similar areas in New York and • beyond. How does the Rensselaer Plateau commu-nities compare to other areas that have done well, and what lessons can be learned from areas that have been less successful. Tools for increasing understanding between forest • industry, landowners, and municipalities, and between forest industry and the recreating public.
Components of the Conservation Plan
Using the approach outlined above, the components of the conservation plan began to emerge. The plan will be “owned” by a sizeable proportion of the popu-lation of the Plateau and will demonstrate the value of working together and community engagement. The Plan will also identify mechanisms/approaches to facili-tate further efforts at cross-municipal and cross-stake-holder cooperation and collaboration. The conservation plan will contain quality information on the ecological, economic (both traditional and ecosystem services), and community values of the Plateau. And finally, the Plan will contain a toolkit with an initial set of tools that have been identified to date. It should be a body of informa-tion by the end of 2012, but it will not be a fixed set of rules. Rather, it should be a source of reliable informa-tion and informed guidelines that can be used by towns as they need it to improve the quality of decisions, and even the design of new plans. Recommendations that come from the plan will continue to be worked on, the toolbox will continue to be developed from the long list of suggestions, and new information will be added as it comes available.
Results/Discussion
Stakeholder and Public Meetings
Stakeholder meetings for owners of large land tracts, municipal officials, forest industry officials, and alliance members occurred in May and June 2012 and had two important functions. First, the meetings created an opportunity for RPA to develop and share information of particular relevance to one stakeholder group at a time and receive feedback specific to their particular perspective. However, an equally important aspect of the meetings was creating the opportunity for members of the same stakeholder group to meet and share ideas and opinions with others in the same group, increasing familiarity and camaraderie and decreasing misunder-
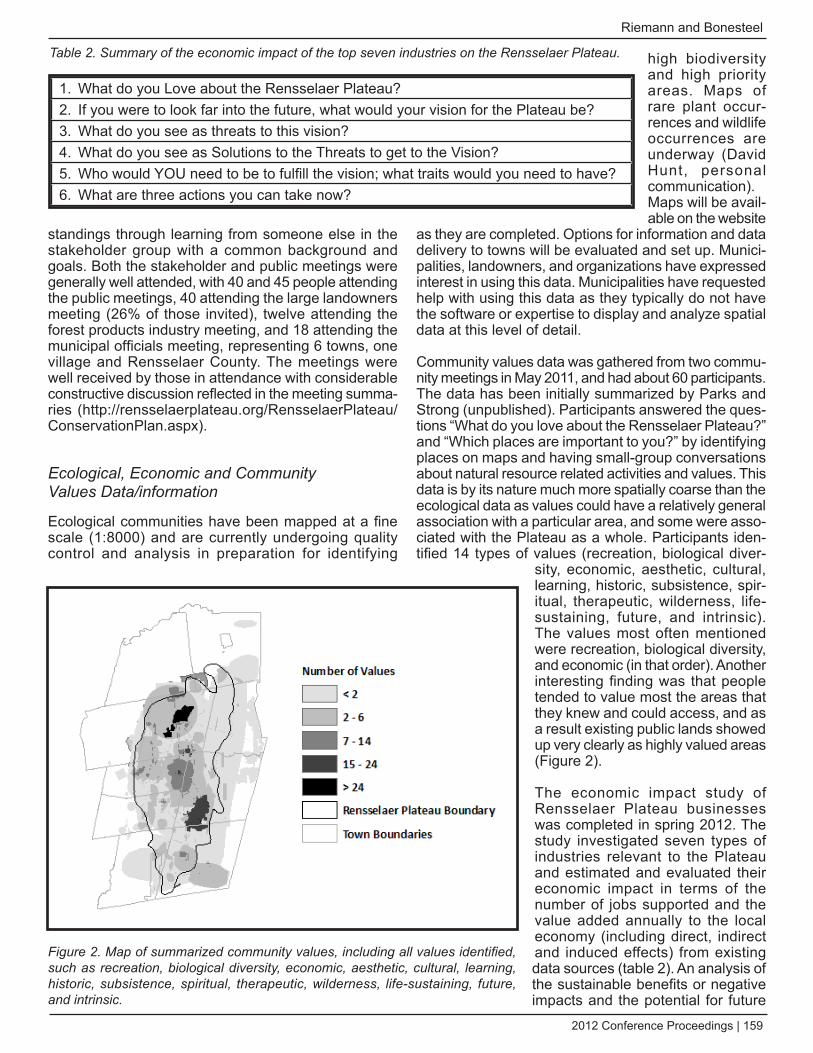
2012 Conference Proceedings | 159
Riemann and Bonesteel
standings through learning from someone else in the stakeholder group with a common background and goals. Both the stakeholder and public meetings were generally well attended, with 40 and 45 people attending the public meetings, 40 attending the large landowners meeting (26% of those invited), twelve attending the forest products industry meeting, and 18 attending the municipal officials meeting, representing 6 towns, one village and Rensselaer County. The meetings were well received by those in attendance with considerable constructive discussion reflected in the meeting summa-ries (http://rensselaerplateau.org/RensselaerPlateau/ConservationPlan.aspx).
Ecological, Economic and Community Values data/information
Ecological communities have been mapped at a fine scale (1:8000) and are currently undergoing quality control and analysis in preparation for identifying
high biodiversity and high priority areas. Maps of rare plant occur-rences and wildlife occurrences are underway (David Hunt, personal communication). Maps will be avail-able on the website
as they are completed. Options for information and data delivery to towns will be evaluated and set up. Munici-palities, landowners, and organizations have expressed interest in using this data. Municipalities have requested help with using this data as they typically do not have the software or expertise to display and analyze spatial data at this level of detail.
Community values data was gathered from two commu-nity meetings in May 2011, and had about 60 participants. The data has been initially summarized by Parks and Strong (unpublished). Participants answered the ques-tions “What do you love about the Rensselaer Plateau?” and “Which places are important to you?” by identifying places on maps and having small-group conversations about natural resource related activities and values. This data is by its nature much more spatially coarse than the ecological data as values could have a relatively general association with a particular area, and some were asso-ciated with the Plateau as a whole. Participants iden-tified 14 types of values (recreation, biological diver-
sity, economic, aesthetic, cultural, learning, historic, subsistence, spir-itual, therapeutic, wilderness, life-sustaining, future, and intrinsic). The values most often mentioned were recreation, biological diversity, and economic (in that order). Another interesting finding was that people tended to value most the areas that they knew and could access, and as a result existing public lands showed up very clearly as highly valued areas (Figure 2).
The economic impact study of Rensselaer Plateau businesses was completed in spring 2012. The study investigated seven types of industries relevant to the Plateau and estimated and evaluated their economic impact in terms of the number of jobs supported and the value added annually to the local economy (including direct, indirect and induced effects) from existing data sources (table 2). An analysis of the sustainable benefits or negative impacts and the potential for future
Table 2. Summary of the economic impact of the top seven industries on the Rensselaer Plateau.
What do you Love about the Rensselaer Plateau? 1. If you were to look far into the future, what would your vision for the Plateau be?2. What do you see as threats to this vision?3. What do you see as Solutions to the Threats to get to the Vision?4. Who would YOU need to be to fulfill the vision; what traits would you need to have?5. What are three actions you can take now?6.
Figure 2. Map of summarized community values, including all values identified, such as recreation, biological diversity, economic, aesthetic, cultural, learning, historic, subsistence, spiritual, therapeutic, wilderness, life-sustaining, future, and intrinsic.
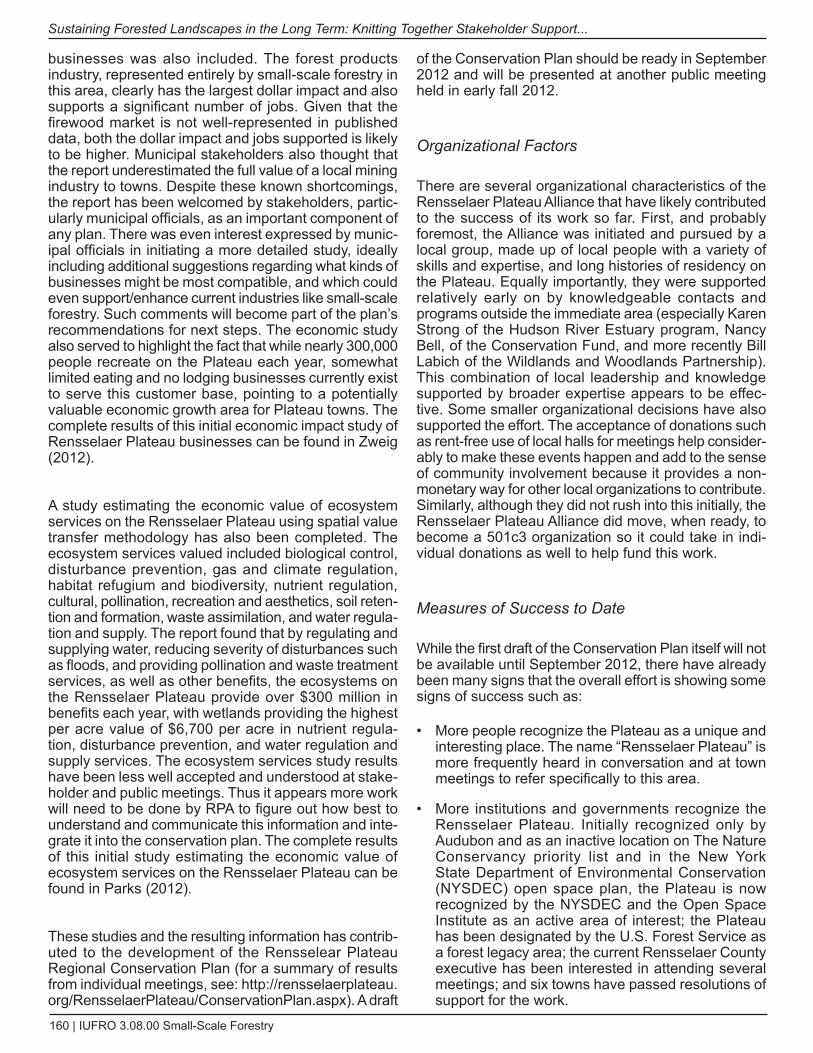
160 | IUFRO 3.08.00 Small-Scale Forestry
Sustaining Forested Landscapes in the Long Term: Knitting Together Stakeholder Support...
businesses was also included. The forest products industry, represented entirely by small-scale forestry in this area, clearly has the largest dollar impact and also supports a significant number of jobs. Given that the firewood market is not well-represented in published data, both the dollar impact and jobs supported is likely to be higher. Municipal stakeholders also thought that the report underestimated the full value of a local mining industry to towns. Despite these known shortcomings, the report has been welcomed by stakeholders, partic-ularly municipal officials, as an important component of any plan. There was even interest expressed by munic-ipal officials in initiating a more detailed study, ideally including additional suggestions regarding what kinds of businesses might be most compatible, and which could even support/enhance current industries like small-scale forestry. Such comments will become part of the plan’s recommendations for next steps. The economic study also served to highlight the fact that while nearly 300,000 people recreate on the Plateau each year, somewhat limited eating and no lodging businesses currently exist to serve this customer base, pointing to a potentially valuable economic growth area for Plateau towns. The complete results of this initial economic impact study of Rensselaer Plateau businesses can be found in Zweig (2012).
A study estimating the economic value of ecosystem services on the Rensselaer Plateau using spatial value transfer methodology has also been completed. The ecosystem services valued included biological control, disturbance prevention, gas and climate regulation, habitat refugium and biodiversity, nutrient regulation, cultural, pollination, recreation and aesthetics, soil reten-tion and formation, waste assimilation, and water regula-tion and supply. The report found that by regulating and supplying water, reducing severity of disturbances such as floods, and providing pollination and waste treatment services, as well as other benefits, the ecosystems on the Rensselaer Plateau provide over $300 million in benefits each year, with wetlands providing the highest per acre value of $6,700 per acre in nutrient regula-tion, disturbance prevention, and water regulation and supply services. The ecosystem services study results have been less well accepted and understood at stake-holder and public meetings. Thus it appears more work will need to be done by RPA to figure out how best to understand and communicate this information and inte-grate it into the conservation plan. The complete results of this initial study estimating the economic value of ecosystem services on the Rensselaer Plateau can be found in Parks (2012).
These studies and the resulting information has contrib-uted to the development of the Rensselear Plateau Regional Conservation Plan (for a summary of results from individual meetings, see: http://rensselaerplateau.org/RensselaerPlateau/ConservationPlan.aspx). A draft
of the Conservation Plan should be ready in September 2012 and will be presented at another public meeting held in early fall 2012.
Organizational Factors
There are several organizational characteristics of the Rensselaer Plateau Alliance that have likely contributed to the success of its work so far. First, and probably foremost, the Alliance was initiated and pursued by a local group, made up of local people with a variety of skills and expertise, and long histories of residency on the Plateau. Equally importantly, they were supported relatively early on by knowledgeable contacts and programs outside the immediate area (especially Karen Strong of the Hudson River Estuary program, Nancy Bell, of the Conservation Fund, and more recently Bill Labich of the Wildlands and Woodlands Partnership). This combination of local leadership and knowledge supported by broader expertise appears to be effec-tive. Some smaller organizational decisions have also supported the effort. The acceptance of donations such as rent-free use of local halls for meetings help consider-ably to make these events happen and add to the sense of community involvement because it provides a non-monetary way for other local organizations to contribute. Similarly, although they did not rush into this initially, the Rensselaer Plateau Alliance did move, when ready, to become a 501c3 organization so it could take in indi-vidual donations as well to help fund this work.
Measures of Success to date
While the first draft of the Conservation Plan itself will not be available until September 2012, there have already been many signs that the overall effort is showing some signs of success such as:
More people recognize the Plateau as a unique and • interesting place. The name “Rensselaer Plateau” is more frequently heard in conversation and at town meetings to refer specifically to this area.
More institutions and governments recognize the • Rensselaer Plateau. Initially recognized only by Audubon and as an inactive location on The Nature Conservancy priority list and in the New York State Department of Environmental Conservation (NYSDEC) open space plan, the Plateau is now recognized by the NYSDEC and the Open Space Institute as an active area of interest; the Plateau has been designated by the U.S. Forest Service as a forest legacy area; the current Rensselaer County executive has been interested in attending several meetings; and six towns have passed resolutions of support for the work.
2012 Conference Proceedings | 161
Riemann and Bonesteel
RPA membership is growing in organizations and • individuals, from six members in 2008, 17 members in 2010, to 27 members in 2012.More people have been interested in looking for infor-• mation about the Rensselaer Plateau and the Plateau Alliance. For example, although Web page visits tend to fluctuate with news from email updates and news-paper articles, but an upward trend has been steady since 2009 (277 hits on the Web page in January 2009, 1046 in January 2010, 2089 in January 2011, 1794 in January 2012, and 2249 in June 2012).Town supervisors see value in meeting and exploring • opportunities for cooperation at many levels (from sharing ambulance services to joint grant applica-tions). Of the 10 towns and one village on the Plateau, nine have attended one of the two all-supervisor meetings and/or the stakeholder meeting for munic-ipal officials. Not necessarily always glowingly positive, but almost • always constructive feedback is received from the public and stakeholders at each meeting, as if they see some potential in the project, are really inter-ested in the project succeeding, and are trying to help shape it to fit what they need. An increasingly diverse group of people are becoming • members, coming to meetings, providing input. For example, the initial six Alliance members were either recreation groups or conservation groups. Alliance members today include a broader set of recreation groups (from hiking to snowmobiling clubs), both local and national conservation groups, one town, several residential associations, the local chapter of the New York Forest Owners Association, and the Agricultural Stewardship Association. More people seem to be willing to speak out about • their interest in the future of the Plateau and in seeing the currently forested landscape conserved in some form. People have continued to attend the public meetings In addition to receiving information via email, one • town has even designated a representative to keep in touch with RPA activities and bring information back to the town board.One school district has become actively engaged in • ensuring that elementary school children get out on several field trips to the Plateau each year. These measures indicate some level of success • in addressing challenges in the areas of local atti-tudes, local engagement, recognition of the Plateau as an entity, cooperation between municipalities, and perhaps an increasing awareness between stake-holder groups of the common challenges faced by each. It will be interesting to observe how the draft Conservation Plan is received at the public meeting in September and what further ideas are generated.
Acknowledgements
The authors thank all past and present board members of the Rensselaer Plateau Alliance, Karen Strong of the Hudson River Estuary Program, and consultants Mike Welti, Rick Lederer-Barnes, Brian Zweig, and Sarah Parks.
References
American Farmland Trust and Cornell Cooperative Exten-sion. 1989. The cost of community services in towns in dutchess County, New York. American Farmland Trust, Northampton, MA.
deMay, F. 2010. Home sweet home on the Rensselaer Plateau. New York State Conservationist. NY department of Environmental Conservation. Albany, NY. October 2010: 28-32.
DiNapoli, T.P. 2010. Economic Benefits of Open Space Pres-ervation. Report from the Office of the State Comptroller. March 2010. New York State Office of the State Comptroller. Albany, NY. 20pp.
Parks, S. 2012. The economic value of ecosystem services on the Rensselaer Plateau. A report produced for the Rens-selaer Plateau Alliance. Averill Park, NY. 65 pp.
Zweig, B. 2012. Economic impact study of activities of the Rensselaer Plateau. A report produced for the Rensselaer Plateau Alliance. Averill Park, NY. 16 pp.
162 | IUFRO 3.08.00 Small-Scale Forestry
Background
Teak (Tectona grandis) is among the most valuable tropical timber species. Its durable, strong timber is easy to work and commonly used to produce furniture, housing materials, crafts, ships and many other products. Market demand at national and international levels generally exceeds supply. Native to India, Myanmar, Laos and Thailand, teak was introduced to Indonesia by Hindu missionaries around the second century. On Java teak harvest for ship building started in the 10th century, with
plantation development believed to have started during the 13th century (Simatupang, 2000). The Dutch colonial government established intensive teak plantations in the late 19th century. Following Indonesian independence, responsibility for teak plantation management passed to the state forest industry Perum Perhutani in 1963 (Simon, 2000). In the 1960’s small-scale farmer plan-tations became widespread in Java. Java remains the center of teak production in Indonesia. In Jepara alone, a centre of the furniture industry in Central Java, more than 15 thousand small-scale teak furniture industries
Smallholder Teak Systems on Java, Indonesia, Income for Families, Timber for IndustryJames M Roshetko1, Agus Astho2, Dede Rohadi3, Nurin Widyani2, Gerhard S Manurung4, Anies
Fauzi5, and Purnomo Sumardamto6
1 World Agroforestry Centre (ICRAF) and Winrock International, P O Box 161, Bogor 16001, Indonesia, [email protected]
2 Balai Penelitian Teknologi Perbenihan Tanaman Hutan, PO Box 105, Bogor 16144, Indonesia [email protected]
3 FORDA, Jl. Gunung Batu No. 5 Bogor 16610, West Java, Indonesia [email protected] World Agroforestry Centre (ICRAF), P O Box 161, Bogor 16001, Indonesia5 Centre for Forest Biotechnology and Tree Improvement Jl.Palagan Tentara Pelajar KM 15 Pelem, Purwobinangun, Pakem 55582 Sleman, Yogyakarta, Indonesia [email protected]
6 Dinas Kehutanan dan Perkebunan Kabupaten Gunung Kidul Jl. Brigjen Katamso No. 8 Wonosari, Gunung Kidul, Indonesia [email protected])
Keywords: silviculture, thinning, pruning, tebang butuh
Abstract
Teak is among the most valuable timbers in Indonesia with international and domestic demand generally exceeds supply. Java is the center of teak production in Indonesia. As in other teak producing countries, the decline of plan-tation production has created opportunity for smallholder producers. Approximately 1.5 million Javanese house-holds grow teak, managing 444,000 ha of mixed cropping systems, mainly on degraded land. Those families are independent growers providing raw material for the thriving Java teak furniture industry. The viability and profit-ability of smallholder teak production systems are threatened by poor silvicultural management which yield small quantities of low value timber. Smallholder producers are aware of this shortcoming, but have difficulty adapting better silvicultural management due to a lack of capital and limited ability to wait the duration of a rotation before needing returns. Additionally, most smallholders produce teak with an array of other crops to met short- and medium-term livelihood needs. Working in communities in Yogyakarta on Java, the authors conducted a number of studies to identify solutions that enable farmer producers to mitigate the threat mentioned above and improve the benefits to their families (income) and society (quality timber supply). A baseline study, teak system inventory, and management survey were conducted to identify existing conditions and practices. Participatory silvicultural trials were conducted on farms to identify management options appropriate for smallholders’ conditions. Based on research findings guidelines for improved smallholder teak production were developed and evaluated with farmers. The paper provides recommendations for improving economic returns for smallholder teak producers.
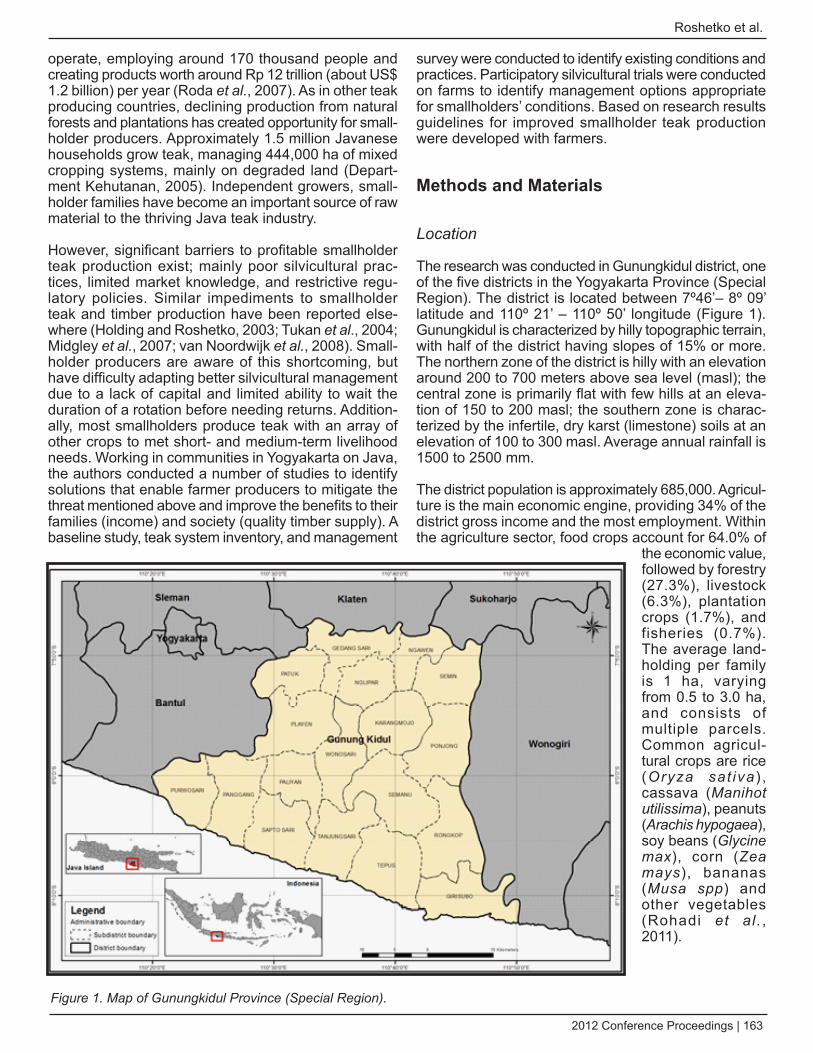
2012 Conference Proceedings | 163
Roshetko et al.
operate, employing around 170 thousand people and creating products worth around Rp 12 trillion (about US$ 1.2 billion) per year (Roda et al., 2007). As in other teak producing countries, declining production from natural forests and plantations has created opportunity for small-holder producers. Approximately 1.5 million Javanese households grow teak, managing 444,000 ha of mixed cropping systems, mainly on degraded land (Depart-ment Kehutanan, 2005). Independent growers, small-holder families have become an important source of raw material to the thriving Java teak industry.
However, significant barriers to profitable smallholder teak production exist; mainly poor silvicultural prac-tices, limited market knowledge, and restrictive regu-latory policies. Similar impediments to smallholder teak and timber production have been reported else-where (Holding and Roshetko, 2003; Tukan et al., 2004; Midgley et al., 2007; van Noordwijk et al., 2008). Small-holder producers are aware of this shortcoming, but have difficulty adapting better silvicultural management due to a lack of capital and limited ability to wait the duration of a rotation before needing returns. Addition-ally, most smallholders produce teak with an array of other crops to met short- and medium-term livelihood needs. Working in communities in Yogyakarta on Java, the authors conducted a number of studies to identify solutions that enable farmer producers to mitigate the threat mentioned above and improve the benefits to their families (income) and society (quality timber supply). A baseline study, teak system inventory, and management
survey were conducted to identify existing conditions and practices. Participatory silvicultural trials were conducted on farms to identify management options appropriate for smallholders’ conditions. Based on research results guidelines for improved smallholder teak production were developed with farmers.
Methods and Materials
Location
The research was conducted in Gunungkidul district, one of the five districts in the Yogyakarta Province (Special Region). The district is located between 7º46’– 8º 09’ latitude and 110º 21’ – 110º 50’ longitude (Figure 1). Gunungkidul is characterized by hilly topographic terrain, with half of the district having slopes of 15% or more. The northern zone of the district is hilly with an elevation around 200 to 700 meters above sea level (masl); the central zone is primarily flat with few hills at an eleva-tion of 150 to 200 masl; the southern zone is charac-terized by the infertile, dry karst (limestone) soils at an elevation of 100 to 300 masl. Average annual rainfall is 1500 to 2500 mm.
The district population is approximately 685,000. Agricul-ture is the main economic engine, providing 34% of the district gross income and the most employment. Within the agriculture sector, food crops account for 64.0% of
the economic value, followed by forestry (27.3%), livestock (6.3%), plantation crops (1.7%), and fisheries (0.7%). The average land-holding per family is 1 ha, varying from 0.5 to 3.0 ha, and consists of multiple parcels. Common agricul-tural crops are rice (Oryza sat iva ) , cassava (Manihot utilissima), peanuts (Arachis hypogaea), soy beans (Glycine max), corn (Zea mays), bananas (Musa spp) and other vegetables (Rohadi et al. , 2011).
Figure 1. Map of Gunungkidul Province (Special Region).
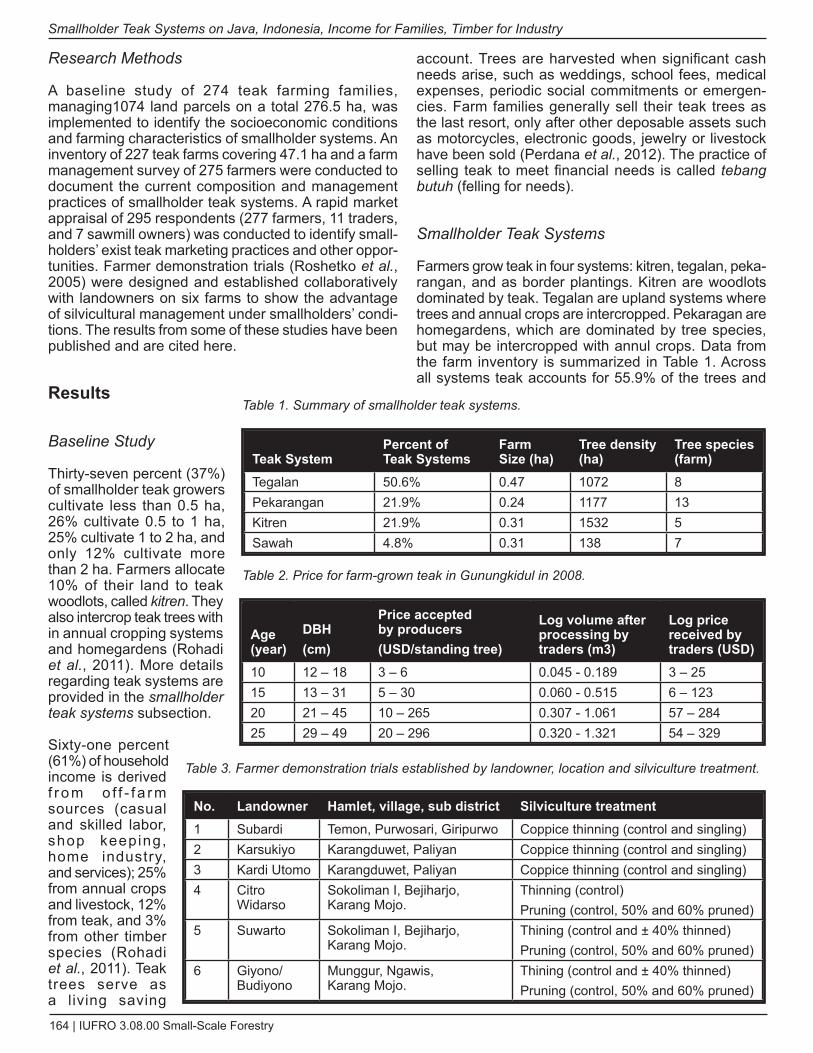
164 | IUFRO 3.08.00 Small-Scale Forestry
Smallholder Teak Systems on Java, Indonesia, Income for Families, Timber for Industry
Research Methods
A baseline study of 274 teak farming families, managing1074 land parcels on a total 276.5 ha, was implemented to identify the socioeconomic conditions and farming characteristics of smallholder systems. An inventory of 227 teak farms covering 47.1 ha and a farm management survey of 275 farmers were conducted to document the current composition and management practices of smallholder teak systems. A rapid market appraisal of 295 respondents (277 farmers, 11 traders, and 7 sawmill owners) was conducted to identify small-holders’ exist teak marketing practices and other oppor-tunities. Farmer demonstration trials (Roshetko et al., 2005) were designed and established collaboratively with landowners on six farms to show the advantage of silvicultural management under smallholders’ condi-tions. The results from some of these studies have been published and are cited here.
Results
Baseline Study
Thirty-seven percent (37%) of smallholder teak growers cultivate less than 0.5 ha, 26% cultivate 0.5 to 1 ha, 25% cultivate 1 to 2 ha, and only 12% cultivate more than 2 ha. Farmers allocate 10% of their land to teak woodlots, called kitren. They also intercrop teak trees with in annual cropping systems and homegardens (Rohadi et al., 2011). More details regarding teak systems are provided in the smallholder teak systems subsection.
Sixty-one percent (61%) of household income is derived f r om o f f - f a rm sources (casual and skilled labor, shop keeping, home industry, and services); 25% from annual crops and livestock, 12% from teak, and 3% from other timber species (Rohadi et al., 2011). Teak trees serve as a living saving
account. Trees are harvested when significant cash needs arise, such as weddings, school fees, medical expenses, periodic social commitments or emergen-cies. Farm families generally sell their teak trees as the last resort, only after other deposable assets such as motorcycles, electronic goods, jewelry or livestock have been sold (Perdana et al., 2012). The practice of selling teak to meet financial needs is called tebang butuh (felling for needs).
Smallholder Teak Systems
Farmers grow teak in four systems: kitren, tegalan, peka-rangan, and as border plantings. Kitren are woodlots dominated by teak. Tegalan are upland systems where trees and annual crops are intercropped. Pekaragan are homegardens, which are dominated by tree species, but may be intercropped with annul crops. Data from the farm inventory is summarized in Table 1. Across all systems teak accounts for 55.9% of the trees and
Teak SystemPercent of Teak Systems
Farm Size (ha)
Tree density (ha)
Tree species (farm)
Tegalan 50.6% 0.47 1072 8Pekarangan 21.9% 0.24 1177 13Kitren 21.9% 0.31 1532 5Sawah 4.8% 0.31 138 7
Table 1. Summary of smallholder teak systems.
Table 2. Price for farm-grown teak in Gunungkidul in 2008.
Table 3. Farmer demonstration trials established by landowner, location and silviculture treatment.
Age (year)
DBH(cm)
Price accepted by producers(USD/standing tree)
Log volume after processing by traders (m3)
Log price received by traders (USD)
10 12 – 18 3 – 6 0.045 - 0.189 3 – 2515 13 – 31 5 – 30 0.060 - 0.515 6 – 12320 21 – 45 10 – 265 0.307 - 1.061 57 – 28425 29 – 49 20 – 296 0.320 - 1.321 54 – 329
No. Landowner Hamlet, village, sub district Silviculture treatment1 Subardi Temon, Purwosari, Giripurwo Coppice thinning (control and singling)2 Karsukiyo Karangduwet, Paliyan Coppice thinning (control and singling)3 Kardi Utomo Karangduwet, Paliyan Coppice thinning (control and singling)4 Citro
WidarsoSokoliman I, Bejiharjo, Karang Mojo.
Thinning (control)Pruning (control, 50% and 60% pruned)
5 Suwarto Sokoliman I, Bejiharjo, Karang Mojo.
Thining (control and ± 40% thinned)Pruning (control, 50% and 60% pruned)
6 Giyono/Budiyono
Munggur, Ngawis, Karang Mojo.
Thining (control and ± 40% thinned)Pruning (control, 50% and 60% pruned)
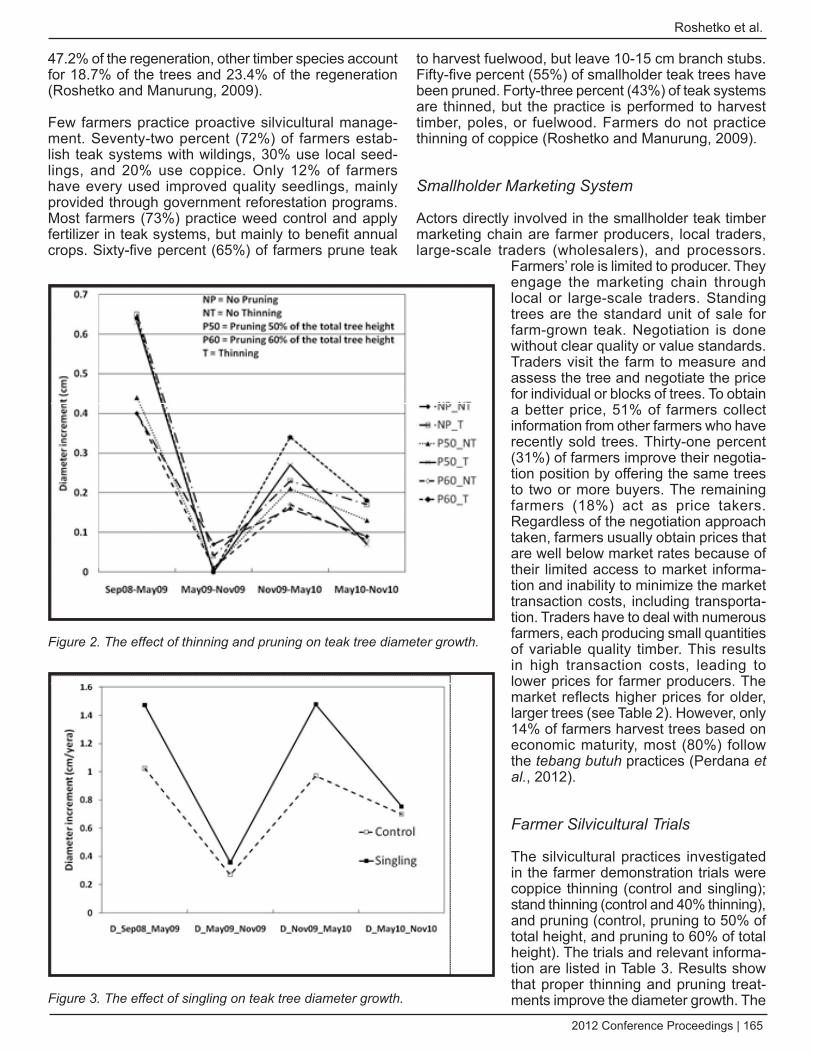
2012 Conference Proceedings | 165
Roshetko et al.
47.2% of the regeneration, other timber species account for 18.7% of the trees and 23.4% of the regeneration (Roshetko and Manurung, 2009).
Few farmers practice proactive silvicultural manage-ment. Seventy-two percent (72%) of farmers estab-lish teak systems with wildings, 30% use local seed-lings, and 20% use coppice. Only 12% of farmers have every used improved quality seedlings, mainly provided through government reforestation programs. Most farmers (73%) practice weed control and apply fertilizer in teak systems, but mainly to benefit annual crops. Sixty-five percent (65%) of farmers prune teak
to harvest fuelwood, but leave 10-15 cm branch stubs. Fifty-five percent (55%) of smallholder teak trees have been pruned. Forty-three percent (43%) of teak systems are thinned, but the practice is performed to harvest timber, poles, or fuelwood. Farmers do not practice thinning of coppice (Roshetko and Manurung, 2009).
Smallholder Marketing System
Actors directly involved in the smallholder teak timber marketing chain are farmer producers, local traders, large-scale traders (wholesalers), and processors.
Farmers’ role is limited to producer. They engage the marketing chain through local or large-scale traders. Standing trees are the standard unit of sale for farm-grown teak. Negotiation is done without clear quality or value standards. Traders visit the farm to measure and assess the tree and negotiate the price for individual or blocks of trees. To obtain a better price, 51% of farmers collect information from other farmers who have recently sold trees. Thirty-one percent (31%) of farmers improve their negotia-tion position by offering the same trees to two or more buyers. The remaining farmers (18%) act as price takers. Regardless of the negotiation approach taken, farmers usually obtain prices that are well below market rates because of their limited access to market informa-tion and inability to minimize the market transaction costs, including transporta-tion. Traders have to deal with numerous farmers, each producing small quantities of variable quality timber. This results in high transaction costs, leading to lower prices for farmer producers. The market reflects higher prices for older, larger trees (see Table 2). However, only 14% of farmers harvest trees based on economic maturity, most (80%) follow the tebang butuh practices (Perdana et al., 2012).
Farmer Silvicultural Trials
The silvicultural practices investigated in the farmer demonstration trials were coppice thinning (control and singling); stand thinning (control and 40% thinning), and pruning (control, pruning to 50% of total height, and pruning to 60% of total height). The trials and relevant informa-tion are listed in Table 3. Results show that proper thinning and pruning treat-ments improve the diameter growth. The
Figure 2. The effect of thinning and pruning on teak tree diameter growth.
Figure 3. The effect of singling on teak tree diameter growth.
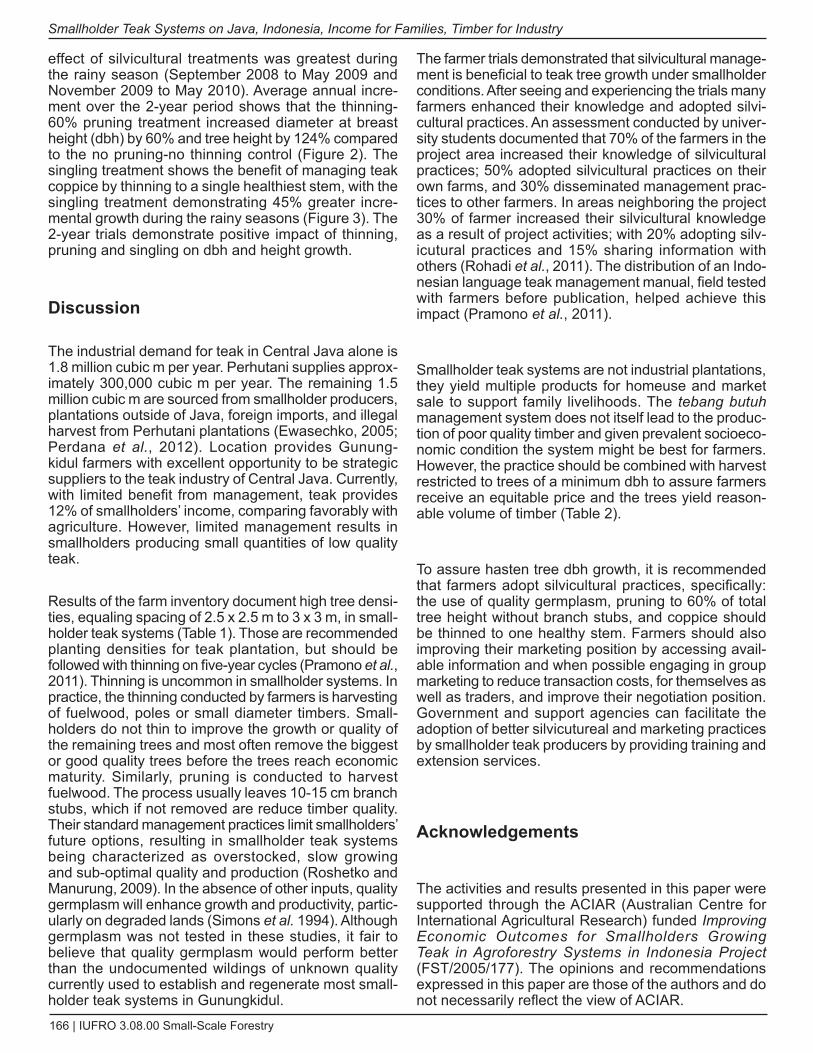
166 | IUFRO 3.08.00 Small-Scale Forestry
Smallholder Teak Systems on Java, Indonesia, Income for Families, Timber for Industry
effect of silvicultural treatments was greatest during the rainy season (September 2008 to May 2009 and November 2009 to May 2010). Average annual incre-ment over the 2-year period shows that the thinning-60% pruning treatment increased diameter at breast height (dbh) by 60% and tree height by 124% compared to the no pruning-no thinning control (Figure 2). The singling treatment shows the benefit of managing teak coppice by thinning to a single healthiest stem, with the singling treatment demonstrating 45% greater incre-mental growth during the rainy seasons (Figure 3). The 2-year trials demonstrate positive impact of thinning, pruning and singling on dbh and height growth.
Discussion
The industrial demand for teak in Central Java alone is 1.8 million cubic m per year. Perhutani supplies approx-imately 300,000 cubic m per year. The remaining 1.5 million cubic m are sourced from smallholder producers, plantations outside of Java, foreign imports, and illegal harvest from Perhutani plantations (Ewasechko, 2005; Perdana et al., 2012). Location provides Gunung-kidul farmers with excellent opportunity to be strategic suppliers to the teak industry of Central Java. Currently, with limited benefit from management, teak provides 12% of smallholders’ income, comparing favorably with agriculture. However, limited management results in smallholders producing small quantities of low quality teak.
Results of the farm inventory document high tree densi-ties, equaling spacing of 2.5 x 2.5 m to 3 x 3 m, in small-holder teak systems (Table 1). Those are recommended planting densities for teak plantation, but should be followed with thinning on five-year cycles (Pramono et al., 2011). Thinning is uncommon in smallholder systems. In practice, the thinning conducted by farmers is harvesting of fuelwood, poles or small diameter timbers. Small-holders do not thin to improve the growth or quality of the remaining trees and most often remove the biggest or good quality trees before the trees reach economic maturity. Similarly, pruning is conducted to harvest fuelwood. The process usually leaves 10-15 cm branch stubs, which if not removed are reduce timber quality. Their standard management practices limit smallholders’ future options, resulting in smallholder teak systems being characterized as overstocked, slow growing and sub-optimal quality and production (Roshetko and Manurung, 2009). In the absence of other inputs, quality germplasm will enhance growth and productivity, partic-ularly on degraded lands (Simons et al. 1994). Although germplasm was not tested in these studies, it fair to believe that quality germplasm would perform better than the undocumented wildings of unknown quality currently used to establish and regenerate most small-holder teak systems in Gunungkidul.
The farmer trials demonstrated that silvicultural manage-ment is beneficial to teak tree growth under smallholder conditions. After seeing and experiencing the trials many farmers enhanced their knowledge and adopted silvi-cultural practices. An assessment conducted by univer-sity students documented that 70% of the farmers in the project area increased their knowledge of silvicultural practices; 50% adopted silvicultural practices on their own farms, and 30% disseminated management prac-tices to other farmers. In areas neighboring the project 30% of farmer increased their silvicultural knowledge as a result of project activities; with 20% adopting silv-icutural practices and 15% sharing information with others (Rohadi et al., 2011). The distribution of an Indo-nesian language teak management manual, field tested with farmers before publication, helped achieve this impact (Pramono et al., 2011).
Smallholder teak systems are not industrial plantations, they yield multiple products for homeuse and market sale to support family livelihoods. The tebang butuh management system does not itself lead to the produc-tion of poor quality timber and given prevalent socioeco-nomic condition the system might be best for farmers. However, the practice should be combined with harvest restricted to trees of a minimum dbh to assure farmers receive an equitable price and the trees yield reason-able volume of timber (Table 2).
To assure hasten tree dbh growth, it is recommended that farmers adopt silvicultural practices, specifically: the use of quality germplasm, pruning to 60% of total tree height without branch stubs, and coppice should be thinned to one healthy stem. Farmers should also improving their marketing position by accessing avail-able information and when possible engaging in group marketing to reduce transaction costs, for themselves as well as traders, and improve their negotiation position. Government and support agencies can facilitate the adoption of better silvicutureal and marketing practices by smallholder teak producers by providing training and extension services.
Acknowledgements
The activities and results presented in this paper were supported through the ACIAR (Australian Centre for International Agricultural Research) funded Improving Economic Outcomes for Smallholders Growing Teak in Agroforestry Systems in Indonesia Project (FST/2005/177). The opinions and recommendations expressed in this paper are those of the authors and do not necessarily reflect the view of ACIAR.
2012 Conference Proceedings | 167
Roshetko et al.
References
departemen Kehutanan 2005. data Potensi Hutan Rakyat (Updating data Hutan Rakyat). direktorat Jenderal Rehabili-tasi Lahan dan Perhutanan Sosial dan Biro Pusat Statistik. Jakarta.
Ewasechko, AC. 2005. Upgrading the Central Java Wood Furniture Industry: A Value-Chain Approach. International Labour Organization (ILO), Manila. 42 p
Holding-Anyonge, C, and J Roshetko. 2003. Farm-level timber production: orienting farmers towards the market. Unasylva 212 (54):48-56.
Midgley, S, M Blyth, K Mounlamai, d Midgley and A Brown. 2007. Towards improving profitability of teak in integrated smallholder farming systems in northern Laos. ACIAR Tech-nical Reports No. 64.
Perdana, A, JM Roshetko and I Kurniawan. 2012. Foreces of competition: smallholding teak producers in Indonesia. International Forestry Review: 14 (2): 238-248.
Pramono, AA, MA Fauzi, N Widyani, I Heriansyah, JM Roshetko. 2011. Management of Community Teak Forests: A Field Manual for Farmers. CIFOR, ICRAF, and FORdA. Bogor. 82 p.
Roda, JM, P Cadène, P Guizol, L Santoso and AU Fauzan. 2007. Atlas Industri Mebel Kayu di Jepara, Indonesia. Bogor: Center for International Forestry Research (CIFOR). ISBN 978-979-1412-13-1. 54 p.
Rohadi, d, JM Roshetko, A Perdana, M Blyth, N Nuryartono, N Kusumowardani, AA Pramono, N Widyani, A Fauzi, J Sasono, P Sumardamto, and P Manalu. 2011. Improving economic outcomes for smallholders growing teak in agro-forestry systems in Indonesia. Australian Centre for Inter-national Agricultural Research (ACIAR), Canberra.
Roshetko, JM and GES Manurung. 2009. Smallholder Teak Production Systems in Gunungkidul, Indonesia. Poster presented at the 2nd World Congress of Agroforestry, Nairobi.
Roshetko JM, P Purnomosidhi and Mulawarman. 2005. Farmer demonstration Trials (FdTs): Promoting tree planting and farmer innovation in Indonesia. In J Gonsalves, T Becker, A Braun, J Caminade, d Campilan, H de Chavez, E Fajber, M Kapiriri and R Vernooy (eds). Participatory Research and development for Sustainable Agriculture and Natural Resource Management: A Sourcebook, Laguna, Philip-pines, International Potato Center (CIP); Ottawa, Canada, International development Research Centre; Rome, Italy, International Fund for Agricultural development. 3 volumes. pp 384-392
Simatupang, MH. 2000. Some notes on the origin and estab-lishment of teak forest (Tectona grandis L.F.) in Java, Indo-nesia. In: Proceedings of the Third Regional Seminar on Teak. Potential and Opportunities in Marketing and Trade of Plantation Teak: Challenges for the New Millennium. Yogya-karta-Indonesia. 31 July – 4 August. pp xxx-xxx.
Simon, H. 2000. History of Teak Forestry in the Region. discus-sion Paper the development of Management of Teak Forest in Java. In: Proceedings of the Third Regional Seminar on Teak. Potential and Opportunities in Marketing and Trade of Plantation Teak: Challenges for the New Millennium. Yogya-karta-Indonesia. 31 July – 4 August. pp xxx-xxx.
Simons, AJ, dJ MacQueen and JL Stewart. 1994. Strategic concepts in the domestication of non-industrial trees. In: RRB Leakey and AC Newton (eds). Tropical trees: the potential of domestication and rebuilding of the forest resources, HMSO, London. 91-102 pp.
Tukan, JCM., Yulianti, JM Roshetko, and d darusman. 2004. Pemasaran Kayu dari Lahan Petani di Provinsi Lampung. Agrivita 26: 131-140.
van Noordwijk M, JM Roshetko, Murniati, M delos Angeles, Suyanto, C Fay, and TP Tomich. 2008. Farmer Tree Planting Barriers to Sustainable Forest Management. In: dJ Snelder and R Lasco (eds). Smallholder Tree Growing for Rural development and Environmental Services. pp 429-451.
168 | IUFRO 3.08.00 Small-Scale Forestry
Introduction
In this study tools and concepts from social network analysis are applied to understand how diverse land-owner experiences and attributes shape the personal networks of forest owners. Personal networks consist of the contacts an individual (ego) has with others (alters) in their social environment (Pescosolido, 2006). The focus typically is on the type of relationships between an ego and its network members, the attributes of each member, and the influences they have on the ego. Some recent work has already examined landowners’ personal networks in the context of timber sales (Korhonen, Hujala, & Kurttila, 2012), timber harvests (Knoot and Rickenbach 2011), and landowner cooperatives (Kueper & Sagor, 2011; Rickenbach 2009). These studies identify typical network structures for communication during timber sales (Korhonen et al. 2012), and the influence of social networks on forest decision-making (Knoot and Rickenbach 2011).
Observations about how landowner social networks vary relative to different management activities and owner-ship characteristics, however, are largely absent from the literature. The growing number and increasing diversity of woodland owners in America prompts efforts to better understand how these changes shape the composition of woodland owners’ networks (Kendra 2005; Butler and Leatherberry 2004). In addition, more conceptual and analytical application of network approaches has been called for to assess “the potential and limits of social networks” in private forestry (Rickenbach, 2009: 599).
In response to this call, this study explores the ego network characteristics of different landowner groups. Specifically, the structure (size) and composition (diver-
sity) of landowner egocentric networks are compared across groups, by: recent harvesting activity, reforesta-tion, use of resource professionals, demographic and ownership attributes, and local context. The assump-tion is that the diversity of landowner experiences and attributes conditions different pathways of social interac-tions in private forestry. Two questions are addressed: (1) Who are the people landowners talk to about land management activities, and who do they turn to for advice and help in dealing with critical issues related to their woodland? (2) How do the personal networks of landowners vary across different landowner attributes and experiences?
The Personal Networks of Forest Owners
According to network theory, social interactions form the basic mechanism through which landowner attitudes and behaviors are shaped (Pescosolido 2006; Mitchell 1969; Borgatti et al. 2009). Researchers have shown that personal interaction was important for landowner acceptance of oak restoration practices (Knoot et al. 2010), cross-boundary cooperation (Sisock 2009; Gass et al. 2009), communication and innovativeness among forest owners (Hujala and Tikkanen 2008; Nybakk et al. 2009). Many of the social contacts of forest owners occur in the context of management activities, like thinning, harvesting, or planting trees. In this study, timber harvest in the past five years and reforestation are indicators of how active or engaged forest owners are with the management of their woodland (Gass et al. 2009; Kittredge 2005). Active forest owners may engage in conversations with a large and more diverse set of people than passive owners, because of the need for
Exploring Variations in landowners’ Social Networks: The Effect of harvesting Activity, Resource Professionals, and Ownership SizeTatyana B. Ruseva1, Tom Evans2,3 and Burnell C. Fischer3
1 Department of Government, Appalachian State University, USA, rusevatb(at)appstate.edu2 Department of Geography and Center for the Study of Institutions, Population and Environmental Change, Indiana University, USA, evans(at)indiana.edu
3 Vincent and Elinor Ostrom Workshop on Political Theory and Policy Analysis, and School of Public and Environmental Affairs, Indiana University, USA, bufische(at)indiana.edu
Keywords: social interaction, egocentric networks, resource professionals, timber harvest, parcel size
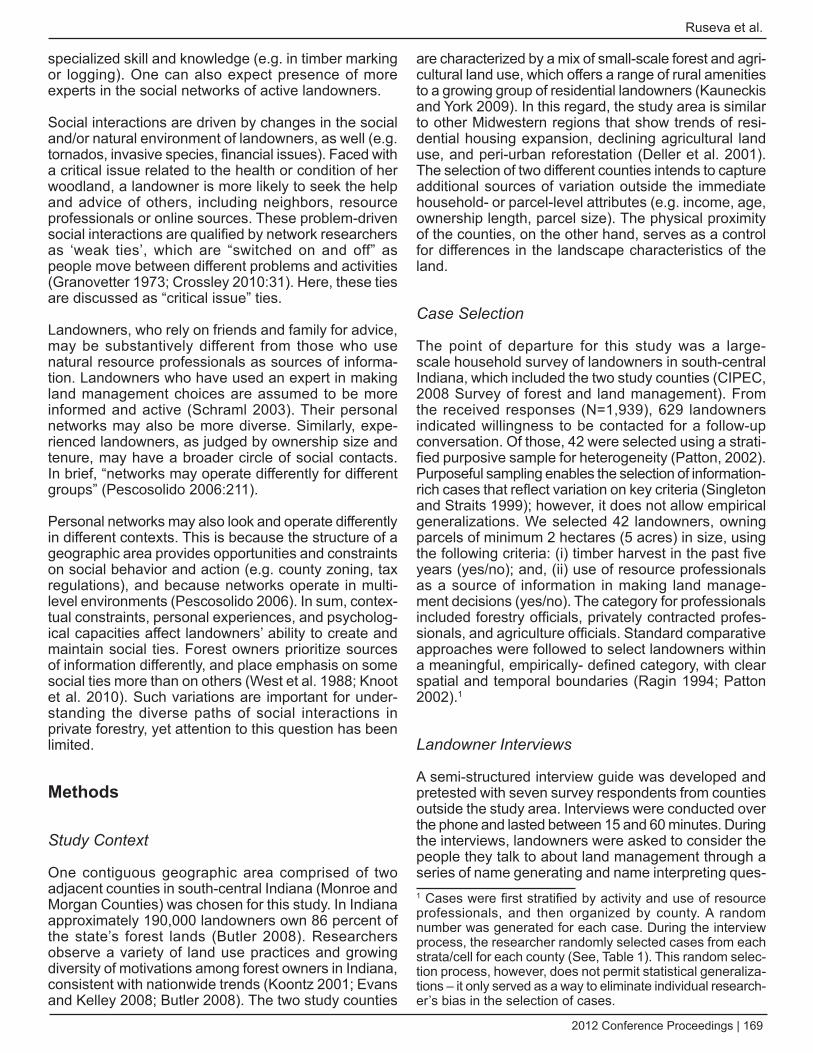
2012 Conference Proceedings | 169
Ruseva et al.
specialized skill and knowledge (e.g. in timber marking or logging). One can also expect presence of more experts in the social networks of active landowners.
Social interactions are driven by changes in the social and/or natural environment of landowners, as well (e.g. tornados, invasive species, financial issues). Faced with a critical issue related to the health or condition of her woodland, a landowner is more likely to seek the help and advice of others, including neighbors, resource professionals or online sources. These problem-driven social interactions are qualified by network researchers as ‘weak ties’, which are “switched on and off” as people move between different problems and activities (Granovetter 1973; Crossley 2010:31). Here, these ties are discussed as “critical issue” ties.
Landowners, who rely on friends and family for advice, may be substantively different from those who use natural resource professionals as sources of informa-tion. Landowners who have used an expert in making land management choices are assumed to be more informed and active (Schraml 2003). Their personal networks may also be more diverse. Similarly, expe-rienced landowners, as judged by ownership size and tenure, may have a broader circle of social contacts. In brief, “networks may operate differently for different groups” (Pescosolido 2006:211).
Personal networks may also look and operate differently in different contexts. This is because the structure of a geographic area provides opportunities and constraints on social behavior and action (e.g. county zoning, tax regulations), and because networks operate in multi-level environments (Pescosolido 2006). In sum, contex-tual constraints, personal experiences, and psycholog-ical capacities affect landowners’ ability to create and maintain social ties. Forest owners prioritize sources of information differently, and place emphasis on some social ties more than on others (West et al. 1988; Knoot et al. 2010). Such variations are important for under-standing the diverse paths of social interactions in private forestry, yet attention to this question has been limited.
Methods
Study Context
One contiguous geographic area comprised of two adjacent counties in south-central Indiana (Monroe and Morgan Counties) was chosen for this study. In Indiana approximately 190,000 landowners own 86 percent of the state’s forest lands (Butler 2008). Researchers observe a variety of land use practices and growing diversity of motivations among forest owners in Indiana, consistent with nationwide trends (Koontz 2001; Evans and Kelley 2008; Butler 2008). The two study counties
are characterized by a mix of small-scale forest and agri-cultural land use, which offers a range of rural amenities to a growing group of residential landowners (Kauneckis and York 2009). In this regard, the study area is similar to other Midwestern regions that show trends of resi-dential housing expansion, declining agricultural land use, and peri-urban reforestation (Deller et al. 2001). The selection of two different counties intends to capture additional sources of variation outside the immediate household- or parcel-level attributes (e.g. income, age, ownership length, parcel size). The physical proximity of the counties, on the other hand, serves as a control for differences in the landscape characteristics of the land.
Case Selection
The point of departure for this study was a large-scale household survey of landowners in south-central Indiana, which included the two study counties (CIPEC, 2008 Survey of forest and land management). From the received responses (N=1,939), 629 landowners indicated willingness to be contacted for a follow-up conversation. Of those, 42 were selected using a strati-fied purposive sample for heterogeneity (Patton, 2002). Purposeful sampling enables the selection of information-rich cases that reflect variation on key criteria (Singleton and Straits 1999); however, it does not allow empirical generalizations. We selected 42 landowners, owning parcels of minimum 2 hectares (5 acres) in size, using the following criteria: (i) timber harvest in the past five years (yes/no); and, (ii) use of resource professionals as a source of information in making land manage-ment decisions (yes/no). The category for professionals included forestry officials, privately contracted profes-sionals, and agriculture officials. Standard comparative approaches were followed to select landowners within a meaningful, empirically- defined category, with clear spatial and temporal boundaries (Ragin 1994; Patton 2002).1
Landowner Interviews
A semi-structured interview guide was developed and pretested with seven survey respondents from counties outside the study area. Interviews were conducted over the phone and lasted between 15 and 60 minutes. During the interviews, landowners were asked to consider the people they talk to about land management through a series of name generating and name interpreting ques-1 Cases were first stratified by activity and use of resource professionals, and then organized by county. A random number was generated for each case. During the interview process, the researcher randomly selected cases from each strata/cell for each county (See, Table 1). This random selec-tion process, however, does not permit statistical generaliza-tions – it only served as a way to eliminate individual research-er’s bias in the selection of cases.
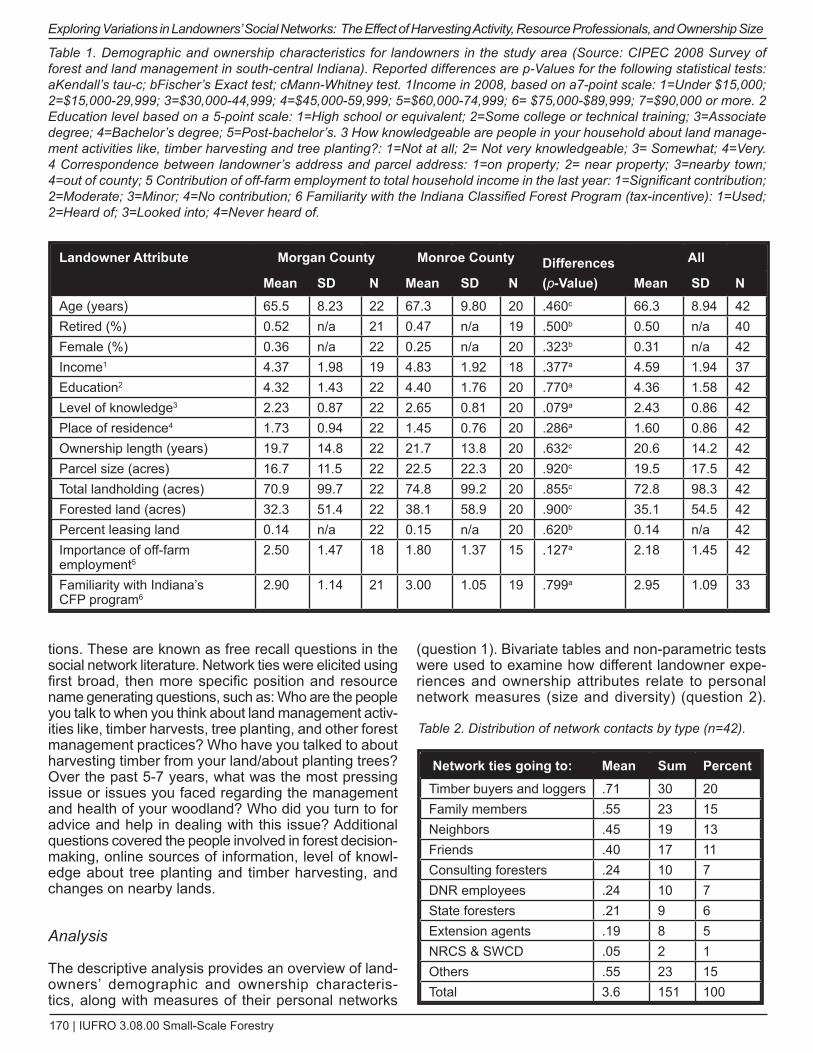
170 | IUFRO 3.08.00 Small-Scale Forestry
Exploring Variations in Landowners’ Social Networks: The Effect of Harvesting Activity, Resource Professionals, and Ownership Size
tions. These are known as free recall questions in the social network literature. Network ties were elicited using first broad, then more specific position and resource name generating questions, such as: Who are the people you talk to when you think about land management activ-ities like, timber harvests, tree planting, and other forest management practices? Who have you talked to about harvesting timber from your land/about planting trees? Over the past 5-7 years, what was the most pressing issue or issues you faced regarding the management and health of your woodland? Who did you turn to for advice and help in dealing with this issue? Additional questions covered the people involved in forest decision-making, online sources of information, level of knowl-edge about tree planting and timber harvesting, and changes on nearby lands.
Analysis
The descriptive analysis provides an overview of land-owners’ demographic and ownership characteris-tics, along with measures of their personal networks
(question 1). Bivariate tables and non-parametric tests were used to examine how different landowner expe-riences and ownership attributes relate to personal network measures (size and diversity) (question 2).
Landowner Attribute Morgan County Monroe County Differences(p-Value)
All
Mean SD N Mean SD N Mean SD NAge (years) 65.5 8.23 22 67.3 9.80 20 .460c 66.3 8.94 42Retired (%) 0.52 n/a 21 0.47 n/a 19 .500b 0.50 n/a 40Female (%) 0.36 n/a 22 0.25 n/a 20 .323b 0.31 n/a 42Income1 4.37 1.98 19 4.83 1.92 18 .377a 4.59 1.94 37Education2 4.32 1.43 22 4.40 1.76 20 .770a 4.36 1.58 42Level of knowledge3 2.23 0.87 22 2.65 0.81 20 .079a 2.43 0.86 42Place of residence4 1.73 0.94 22 1.45 0.76 20 .286a 1.60 0.86 42Ownership length (years) 19.7 14.8 22 21.7 13.8 20 .632c 20.6 14.2 42Parcel size (acres) 16.7 11.5 22 22.5 22.3 20 .920c 19.5 17.5 42Total landholding (acres) 70.9 99.7 22 74.8 99.2 20 .855c 72.8 98.3 42Forested land (acres) 32.3 51.4 22 38.1 58.9 20 .900c 35.1 54.5 42Percent leasing land 0.14 n/a 22 0.15 n/a 20 .620b 0.14 n/a 42Importance of off-farm employment5
2.50 1.47 18 1.80 1.37 15 .127a 2.18 1.45 42
Familiarity with Indiana’s CFP program6
2.90 1.14 21 3.00 1.05 19 .799a 2.95 1.09 33
Table 1. demographic and ownership characteristics for landowners in the study area (Source: CIPEC 2008 Survey of forest and land management in south-central Indiana). Reported differences are p-Values for the following statistical tests: aKendall’s tau-c; bFischer’s Exact test; cMann-Whitney test. 1Income in 2008, based on a7-point scale: 1=Under $15,000; 2=$15,000-29,999; 3=$30,000-44,999; 4=$45,000-59,999; 5=$60,000-74,999; 6= $75,000-$89,999; 7=$90,000 or more. 2 Education level based on a 5-point scale: 1=High school or equivalent; 2=Some college or technical training; 3=Associate degree; 4=Bachelor’s degree; 5=Post-bachelor’s. 3 How knowledgeable are people in your household about land manage-ment activities like, timber harvesting and tree planting?: 1=Not at all; 2= Not very knowledgeable; 3= Somewhat; 4=Very. 4 Correspondence between landowner’s address and parcel address: 1=on property; 2= near property; 3=nearby town; 4=out of county; 5 Contribution of off-farm employment to total household income in the last year: 1=Significant contribution; 2=Moderate; 3=Minor; 4=No contribution; 6 Familiarity with the Indiana Classified Forest Program (tax-incentive): 1=Used; 2=Heard of; 3=Looked into; 4=Never heard of.
Table 2. distribution of network contacts by type (n=42).
Network ties going to: Mean Sum Percent Timber buyers and loggers .71 30 20Family members .55 23 15Neighbors .45 19 13Friends .40 17 11Consulting foresters .24 10 7DNR employees .24 10 7State foresters .21 9 6Extension agents .19 8 5NRCS & SWCD .05 2 1Others .55 23 15Total 3.6 151 100
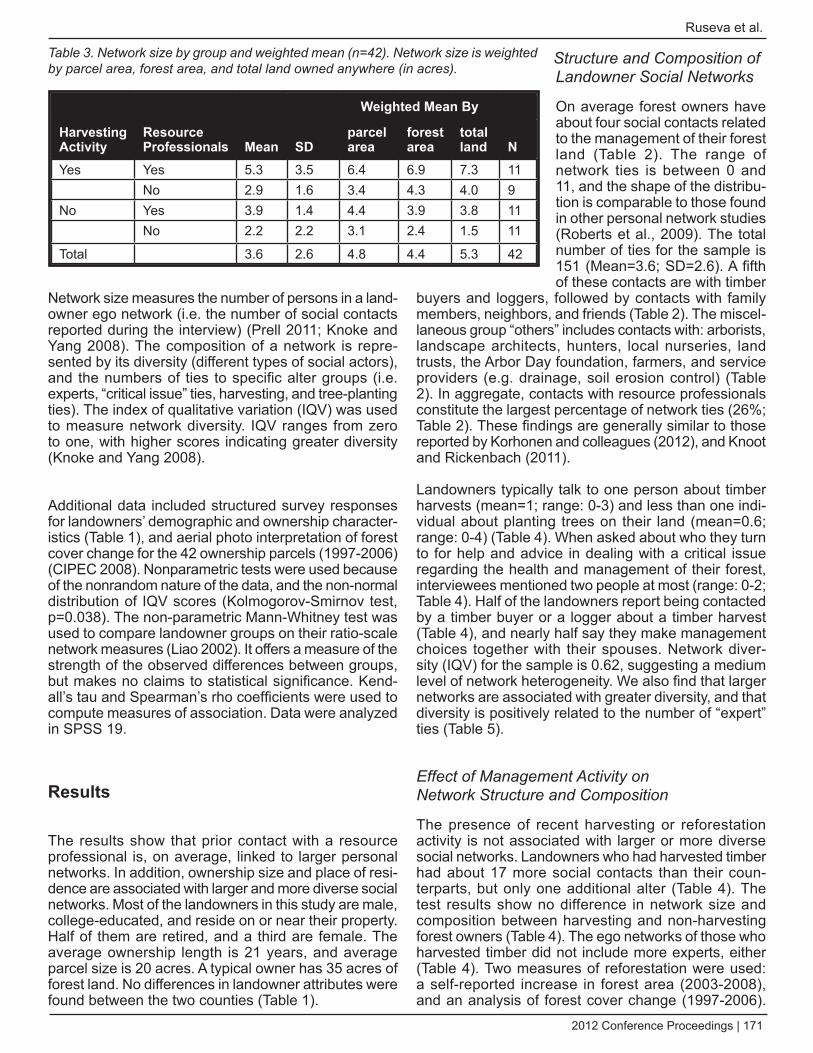
2012 Conference Proceedings | 171
Ruseva et al.
Network size measures the number of persons in a land-owner ego network (i.e. the number of social contacts reported during the interview) (Prell 2011; Knoke and Yang 2008). The composition of a network is repre-sented by its diversity (different types of social actors), and the numbers of ties to specific alter groups (i.e. experts, “critical issue” ties, harvesting, and tree-planting ties). The index of qualitative variation (IQV) was used to measure network diversity. IQV ranges from zero to one, with higher scores indicating greater diversity (Knoke and Yang 2008).
Additional data included structured survey responses for landowners’ demographic and ownership character-istics (Table 1), and aerial photo interpretation of forest cover change for the 42 ownership parcels (1997-2006) (CIPEC 2008). Nonparametric tests were used because of the nonrandom nature of the data, and the non-normal distribution of IQV scores (Kolmogorov-Smirnov test, p=0.038). The non-parametric Mann-Whitney test was used to compare landowner groups on their ratio-scale network measures (Liao 2002). It offers a measure of the strength of the observed differences between groups, but makes no claims to statistical significance. Kend-all’s tau and Spearman’s rho coefficients were used to compute measures of association. Data were analyzed in SPSS 19.
Results
The results show that prior contact with a resource professional is, on average, linked to larger personal networks. In addition, ownership size and place of resi-dence are associated with larger and more diverse social networks. Most of the landowners in this study are male, college-educated, and reside on or near their property. Half of them are retired, and a third are female. The average ownership length is 21 years, and average parcel size is 20 acres. A typical owner has 35 acres of forest land. No differences in landowner attributes were found between the two counties (Table 1).
Structure and Composition of Landowner Social Networks
On average forest owners have about four social contacts related to the management of their forest land (Table 2). The range of network ties is between 0 and 11, and the shape of the distribu-tion is comparable to those found in other personal network studies (Roberts et al., 2009). The total number of ties for the sample is 151 (Mean=3.6; SD=2.6). A fifth of these contacts are with timber
buyers and loggers, followed by contacts with family members, neighbors, and friends (Table 2). The miscel-laneous group “others” includes contacts with: arborists, landscape architects, hunters, local nurseries, land trusts, the Arbor Day foundation, farmers, and service providers (e.g. drainage, soil erosion control) (Table 2). In aggregate, contacts with resource professionals constitute the largest percentage of network ties (26%; Table 2). These findings are generally similar to those reported by Korhonen and colleagues (2012), and Knoot and Rickenbach (2011).
Landowners typically talk to one person about timber harvests (mean=1; range: 0-3) and less than one indi-vidual about planting trees on their land (mean=0.6; range: 0-4) (Table 4). When asked about who they turn to for help and advice in dealing with a critical issue regarding the health and management of their forest, interviewees mentioned two people at most (range: 0-2; Table 4). Half of the landowners report being contacted by a timber buyer or a logger about a timber harvest (Table 4), and nearly half say they make management choices together with their spouses. Network diver-sity (IQV) for the sample is 0.62, suggesting a medium level of network heterogeneity. We also find that larger networks are associated with greater diversity, and that diversity is positively related to the number of “expert” ties (Table 5).
Effect of Management Activity on Network Structure and Composition
The presence of recent harvesting or reforestation activity is not associated with larger or more diverse social networks. Landowners who had harvested timber had about 17 more social contacts than their coun-terparts, but only one additional alter (Table 4). The test results show no difference in network size and composition between harvesting and non-harvesting forest owners (Table 4). The ego networks of those who harvested timber did not include more experts, either (Table 4). Two measures of reforestation were used: a self-reported increase in forest area (2003-2008), and an analysis of forest cover change (1997-2006).
Table 3. Network size by group and weighted mean (n=42). Network size is weighted by parcel area, forest area, and total land owned anywhere (in acres).
Harvesting Activity
Resource Professionals Mean SD
weighted Mean By
Nparcel area
forest area
total land
Yes Yes 5.3 3.5 6.4 6.9 7.3 11No 2.9 1.6 3.4 4.3 4.0 9
No Yes 3.9 1.4 4.4 3.9 3.8 11No 2.2 2.2 3.1 2.4 1.5 11
Total 3.6 2.6 4.8 4.4 5.3 42
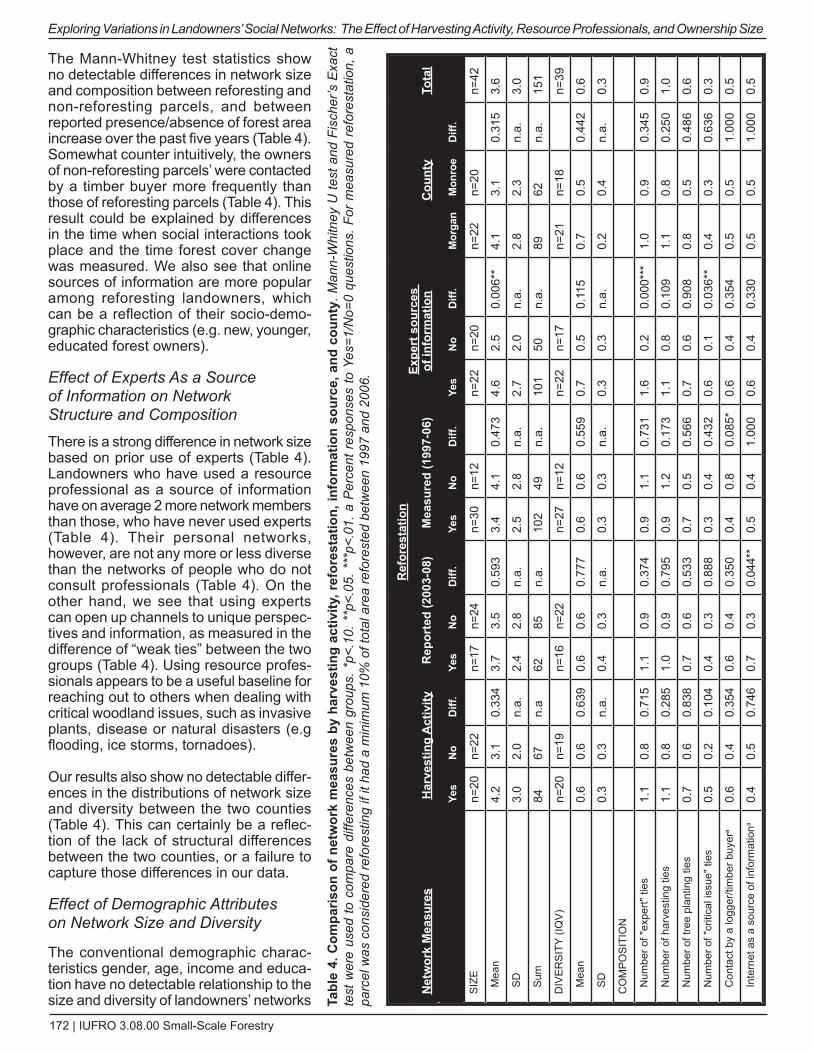
172 | IUFRO 3.08.00 Small-Scale Forestry
Exploring Variations in Landowners’ Social Networks: The Effect of Harvesting Activity, Resource Professionals, and Ownership Size
The Mann-Whitney test statistics show no detectable differences in network size and composition between reforesting and non-reforesting parcels, and between reported presence/absence of forest area increase over the past five years (Table 4). Somewhat counter intuitively, the owners of non-reforesting parcels’ were contacted by a timber buyer more frequently than those of reforesting parcels (Table 4). This result could be explained by differences in the time when social interactions took place and the time forest cover change was measured. We also see that online sources of information are more popular among reforesting landowners, which can be a reflection of their socio-demo-graphic characteristics (e.g. new, younger, educated forest owners).
Effect of Experts As a Source of Information on Network Structure and Composition
There is a strong difference in network size based on prior use of experts (Table 4). Landowners who have used a resource professional as a source of information have on average 2 more network members than those, who have never used experts (Table 4). Their personal networks, however, are not any more or less diverse than the networks of people who do not consult professionals (Table 4). On the other hand, we see that using experts can open up channels to unique perspec-tives and information, as measured in the difference of “weak ties” between the two groups (Table 4). Using resource profes-sionals appears to be a useful baseline for reaching out to others when dealing with critical woodland issues, such as invasive plants, disease or natural disasters (e.g flooding, ice storms, tornadoes).
Our results also show no detectable differ-ences in the distributions of network size and diversity between the two counties (Table 4). This can certainly be a reflec-tion of the lack of structural differences between the two counties, or a failure to capture those differences in our data.
Effect of demographic Attributes on Network Size and diversity
The conventional demographic charac-teristics gender, age, income and educa-tion have no detectable relationship to the size and diversity of landowners’ networks Ta
ble
4. C
ompa
rison
of n
etw
ork
mea
sure
s by
har
vest
ing
activ
ity, r
efor
esta
tion,
info
rmat
ion
sour
ce, a
nd c
ount
y. M
ann-
Whi
tney
U te
st a
nd F
isch
er’s
Exa
ct
test
wer
e us
ed to
com
pare
diff
eren
ces
betw
een
grou
ps. *
p<.1
0. *
*p<.
05. *
**p<
.01.
a P
erce
nt r
espo
nses
to Y
es=1
/No=
0 qu
estio
ns. F
or m
easu
red
refo
rest
atio
n, a
pa
rcel
was
con
side
red
refo
rest
ing
if it
had
a m
inim
um 1
0% o
f tot
al a
rea
refo
rest
ed b
etw
een
1997
and
200
6.
Net
wor
k M
easu
res
Har
vest
ing
Act
ivity
Ref
ores
tatio
nEx
pert
sou
rces
of
info
rmat
ion
Cou
nty
Tota
lR
epor
ted
(200
3-08
)M
easu
red
(199
7-06
)
Ye
sN
oD
iff.
Yes
No
Diff
.Ye
sN
oD
iff.
Yes
No
Diff
.M
orga
nM
onro
eD
iff.
SIZ
En=
20n=
22n=
17n=
24n=
30n=
12n=
22n=
20n=
22n=
20n=
42
Mea
n4.
23.
10.
334
3.7
3.5
0.59
33.
44.
10.
473
4.6
2.5
0.00
6**
4.1
3.1
0.31
53.
6
SD
3.0
2.0
n.a.
2.4
2.8
n.a.
2.5
2.8
n.a.
2.7
2.0
n.a.
2.8
2.3
n.a.
3.0
Sum
84
67n.
a62
85n.
a.10
249
n.a.
101
50n.
a.89
62n.
a.15
1
DIV
ER
SIT
Y (IQ
V)
n=20
n=19
n=16
n=22
n=27
n=12
n=
22n=
17n=
21n=
18
n=39
Mea
n0.
60.
60.
639
0.6
0.6
0.77
70.
60.
60.
559
0.7
0.5
0.11
50.
70.
50.
442
0.6
SD
0.3
0.3
n.a.
0.4
0.3
n.a.
0.3
0.3
n.a.
0.3
0.3
n.a.
0.2
0.4
n.a.
0.3
CO
MP
OS
ITIO
N
Num
ber o
f "ex
pert"
ties
1.1
0.8
0.71
51.
10.
90.
374
0.9
1.1
0.73
11.
60.
20.
000*
**1.
00.
90.
345
0.9
Num
ber o
f har
vest
ing
ties
1.1
0.8
0.28
51.
00.
90.
795
0.9
1.2
0.17
31.
10.
80.
109
1.1
0.8
0.25
01.
0
Num
ber o
f tre
e pl
antin
g tie
s0.
70.
60.
838
0.7
0.6
0.53
30.
70.
50.
566
0.7
0.6
0.90
80.
80.
50.
486
0.6
Num
ber o
f "cr
itica
l iss
ue" t
ies
0.5
0.2
0.10
40.
40.
30.
888
0.3
0.4
0.43
20.
60.
10.
036*
*0.
40.
30.
636
0.3
Con
tact
by
a lo
gger
/tim
ber b
uyer
a0.
60.
40.
354
0.6
0.4
0.35
00.
40.
80.
085*
0.6
0.4
0.35
40.
50.
51.
000
0.5
Inte
rnet
as
a so
urce
of i
nfor
mat
iona
0.4
0.5
0.74
60.
70.
30.
044*
*0.
50.
41.
000
0.6
0.4
0.33
00.
50.
51.
000
0.5
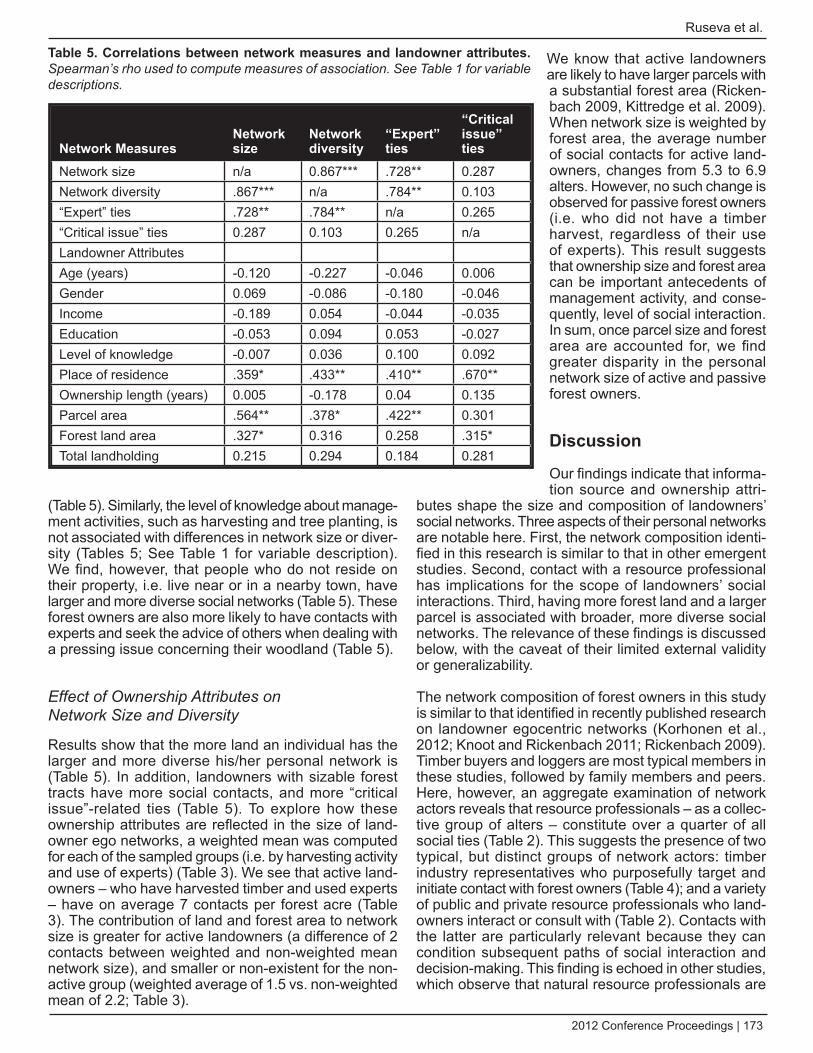
2012 Conference Proceedings | 173
Ruseva et al.
(Table 5). Similarly, the level of knowledge about manage-ment activities, such as harvesting and tree planting, is not associated with differences in network size or diver-sity (Tables 5; See Table 1 for variable description). We find, however, that people who do not reside on their property, i.e. live near or in a nearby town, have larger and more diverse social networks (Table 5). These forest owners are also more likely to have contacts with experts and seek the advice of others when dealing with a pressing issue concerning their woodland (Table 5).
Effect of Ownership Attributes on Network Size and diversity
Results show that the more land an individual has the larger and more diverse his/her personal network is (Table 5). In addition, landowners with sizable forest tracts have more social contacts, and more “critical issue”-related ties (Table 5). To explore how these ownership attributes are reflected in the size of land-owner ego networks, a weighted mean was computed for each of the sampled groups (i.e. by harvesting activity and use of experts) (Table 3). We see that active land-owners – who have harvested timber and used experts – have on average 7 contacts per forest acre (Table 3). The contribution of land and forest area to network size is greater for active landowners (a difference of 2 contacts between weighted and non-weighted mean network size), and smaller or non-existent for the non-active group (weighted average of 1.5 vs. non-weighted mean of 2.2; Table 3).
We know that active landowners are likely to have larger parcels with a substantial forest area (Ricken-bach 2009, Kittredge et al. 2009). When network size is weighted by forest area, the average number of social contacts for active land-owners, changes from 5.3 to 6.9 alters. However, no such change is observed for passive forest owners (i.e. who did not have a timber harvest, regardless of their use of experts). This result suggests that ownership size and forest area can be important antecedents of management activity, and conse-quently, level of social interaction. In sum, once parcel size and forest area are accounted for, we find greater disparity in the personal network size of active and passive forest owners.
Discussion
Our findings indicate that informa-tion source and ownership attri-
butes shape the size and composition of landowners’ social networks. Three aspects of their personal networks are notable here. First, the network composition identi-fied in this research is similar to that in other emergent studies. Second, contact with a resource professional has implications for the scope of landowners’ social interactions. Third, having more forest land and a larger parcel is associated with broader, more diverse social networks. The relevance of these findings is discussed below, with the caveat of their limited external validity or generalizability.
The network composition of forest owners in this study is similar to that identified in recently published research on landowner egocentric networks (Korhonen et al., 2012; Knoot and Rickenbach 2011; Rickenbach 2009). Timber buyers and loggers are most typical members in these studies, followed by family members and peers. Here, however, an aggregate examination of network actors reveals that resource professionals – as a collec-tive group of alters – constitute over a quarter of all social ties (Table 2). This suggests the presence of two typical, but distinct groups of network actors: timber industry representatives who purposefully target and initiate contact with forest owners (Table 4); and a variety of public and private resource professionals who land-owners interact or consult with (Table 2). Contacts with the latter are particularly relevant because they can condition subsequent paths of social interaction and decision-making. This finding is echoed in other studies, which observe that natural resource professionals are
Network Measures Network size
Network diversity
“Expert” ties
“Critical issue” ties
Network size n/a 0.867*** .728** 0.287Network diversity .867*** n/a .784** 0.103“Expert” ties .728** .784** n/a 0.265“Critical issue” ties 0.287 0.103 0.265 n/aLandowner AttributesAge (years) -0.120 -0.227 -0.046 0.006Gender 0.069 -0.086 -0.180 -0.046Income -0.189 0.054 -0.044 -0.035Education -0.053 0.094 0.053 -0.027Level of knowledge -0.007 0.036 0.100 0.092Place of residence .359* .433** .410** .670**Ownership length (years) 0.005 -0.178 0.04 0.135Parcel area .564** .378* .422** 0.301Forest land area .327* 0.316 0.258 .315*Total landholding 0.215 0.294 0.184 0.281
Table 5. Correlations between network measures and landowner attributes. Spearman’s rho used to compute measures of association. See Table 1 for variable descriptions.
174 | IUFRO 3.08.00 Small-Scale Forestry
Exploring Variations in Landowners’ Social Networks: The Effect of Harvesting Activity, Resource Professionals, and Ownership Size
important in forest decision-making and the application of best management practices (Rickenbach 2009; Knoot and Rickenbach 2011; West et al. 1988).
Our findings have relevance for current thinking and policy about the role of experts in private forestry. Previous contact with an expert can shape who else landowners talk to or interact with. In this regard, bringing an expert when making forest management choices matters - regardless of the usefulness or trustworthiness of professionals (an important issue remaining outside of this study; See, Knoot and Rickenbach 2011). Forest owners who use experts are more likely to reach out to others for help and advice in dealing with critical forestry issues, and to also have larger social networks. This is similar to the role forestry experts in mediating infor-mation sources and influencing landowner behavior, discussed by West and colleagues (1988). Neverthe-less, it is conceivable that the effect of experts, observed here, is as a reflection of the type or ownership profile of woodland owners (e.g. how active or passive they are in managing their woodland, how much forest they own, etc.). Similarly, while harvesting activity did not seem to matter for the size and diversity of landowners’ networks, it is possible that its effect is mediated by indi-vidual ownership characteristics.
Related to this is our third finding, which shows that parcel and forest ownership size are positively related to network structure and diversity. These two owner-ship characteristics are likely drivers of landowner propensity to ‘manage’ their woodland, and/or to work with others (Kittredge et al. 2009). Our results seem to reflect this connection and to suggest that land – as a physical boundary (parcel) and as space (residence) – is a bridging factor between landowners and social others. While both forest area and parcel size are asso-ciated with more social contacts, having more land also means more diverse social interactions and more ties to experts. The prominence of “critical issue” ties for larger parcel owners suggests that they have more diverse sources of information (Granovetter 1973). One inter-pretation of weak ties is that they link forest owners to people who are less similar to them and therefore may provide access to unique resources, skills, or assis-tance.
Lastly, our findings show that people who live away from their property, have larger and more heterogeneous social networks. This observation may demand further attention to better understand the role of geographic distance and parcel residence on landowners’ social interactions. The reliability of some of the network measures in this study should also be considered. The process of collecting personal network data poses a significant recall burden on respondents (e.g. in reporting ties to others). In addition, time constraints during the interviews may have exacerbated recall problems and resulted in overlooked or omitted data (McCarty et al. 2007).
Conclusion
By examining variations in landowners’ social contacts, this research found that some ownership attributes are more important than others for the size and diversity of landowners’ ego networks. Our results also show that it is empirically challenging to separate landowners’ characteristics into distinct, analytical groups (e.g. by harvesting activity, location, etc.). Doing so provides only a partial picture of the complex and dynamic set of relationships shaping social interactions on private forest lands. Taken together, out findings indicate that the ego networks of active landowners are larger and more diverse than those of non-active owners, as judged by the size of their ownership parcel, forest area, resi-dence, recent harvesting activity, and use of experts. Studying forest management and decision-making as a socially-embedded process is a promising line of work in private forestry, where a diverse and increasingly growing number of private owners manage a substantial share of the nation’s forest lands (Butler, 2008). Given that most woodland owners in American are passive, small parcel-holders, an important issue (again) is how to reach and engage these landowners who do nothing and interact with no one when it comes to the manage-ment of their woodland.
References
Borgatti, S.P., Mehra, A., Brassm d.J., and Labianca, G. 2009. Network Analysis in the Social Sciences. Science 323(5916), p. 892-895.
Butler, B. J. 2008. Family Forest Owners of the United States, 2006. Newtown Square, PA.
Butler, B.J. and Leatherberry, E.C.2004. Americas Family Forest Owners.Journal of Forestry 102, p.4-14.
Crossley, N. 2010. The Social World of the Network. Combining Qualitative and Quantitative Elements in Social Network Analysis. Sociologica 1, p. 1-34.
deller, S. C., Tsai, T.-H., Marcouiller, d. W., English, d. 2001. The Role of Amenities and Quality of Life in Rural Economic Growth. American Journal of Agricultural Economics 83(2), p.352-65.
Evans, T. P., and Kelley, H. 2008. Assessing the Transition from deforestation to Forest Regrowth with an Agent-Based Model of Land Cover Change for South-Central Indiana. Geoforum, 39(2), 819-32.
Gass, R., Rickenbach, M., Schulte, L. and Zeuli, K. 2009. Cross-Boundary Coordination on Forested Landscapes: Investigating Alternatives for Implementation. Envir. Management 43(1), p. 107-17.
Granovetter, M. S. 1973. The Strength of Weak Ties.The American Journal of Sociology 78(6), p.1360-80.
2012 Conference Proceedings | 175
Ruseva et al.
Hujala, T. and Tikkanen, J. 2008. Boosters of and Barriers to Smooth Communication in Family Forest Owners’ decision Making. Scandinavian Journal of Forest Research 23(5), p. 466-77.
Kauneckis, d.and York, A. 2009. An Empirical Evaluation of Private Landowner Participation in Voluntary Forest Conservation Programs. Environmental Management 44, p. 468-84.
Kendra, A., and Hull, R. B. 2005. Motivations and Behaviors of New Forest Owners in Virginia. Forest Science 51(2), p.142-54.
Kittredge, d. B. 2005. The Cooperation of Private Forest Owners on Scales Larger Than Their Individual Property: International Examples and Potential Application in the United States. Forest Policy and Economics, 7, p. 671-88.
Knoke, d. and Yang, S. 2008. Social Network Analysis. 2nd ed. Sage, Thousand Oaks, CA.
Knoot, T., and Rickenbach, M. 2011. Best Management Prac-tices and Timber Harvesting: The Role of Social Networks in Shaping Landowner decisions. Scand. J. of Forest Research, 26(2), p.171-82.
Knoot, T., Schulte, L. and Rickenbach, M. 2010. Oak Conser-vation and Restoration on Private Forestlands: Negotiating a Social-Ecological Landscape. Environmental Manage-ment 45(1), p. 155-164.
Koontz, T.M. 2001. Money Talks - But to Whom? Financial Versus Nonmonetary Motivations in Land Use decisions. Society and Natural Resources 14, p.51-65.
Korhonen, K., Hujala, T., & Kurttila, M. 2012. Reaching Forest Owners Through Their Social Networks in Timber Sales. Scandinavian Journal of Forest Research, 27(1), p.88-99.
Kueper, A. M. and Sagor, E.S. 2011. Peer Learning and Landowner Networks: Lessons from Five Case Studies. Research Paper, University of Minnesota Extension, St. Paul.
Liao, T.F.2002. Statistical Group Comparison. Wiley Inter-science, NY, New York.
McCarty, C., Killworth, P.d., and Rennell, J. 2007. Impact of Methods for Reducing Respondnet Burden on Personal Network Structural Measures. Social Networks 29, p.300-15.
Mitchell, J.C. 1969. The Concept and Use of Social Networks. Social Networks in Urban Situations. University of Manchester Press, Manchester, UK, p.1-50.
Nybakk, E., Crespell, P., Hansen, E., and Lunnan, A. 2009. Antecedents to Forest Owner Innovativeness: An Investiga-tion of the Non-Timber Forest Products and Services Sector. Forest Ecology & Management 257(2), p. 608-18.
Patton, M.Q. 2002. Qualitative Research & Evaluation Methods. 3rd Ed. Sage, Thousand Oaks.
Pescosolido, B. A. 2006. Sociology of Social Networks. In Bryant, C. d., Peck, d. L. (eds.). The Handbook of 21st Century Sociology. Sage, Thousand Oaks, CA, p. 208-17.
Prell, C. 2011. Social Network Analysis: History, Theroy and Methodology. Sage, Thousand Oaks, CA.
Ragin, C. 1994. Constructing Social Research. Sage, Thousand Oaks, CA.
Rickenbach, M. 2009. Serving Members and Reaching Others: The Performance and Social Networks of a Land-owner Cooperative. Forest Policy and Economics, 11, p. 593-599.
Roberts, S.G.B., dunbar, R.I.M., Pollet, T.V., and Kuppens, T. 2009. Exploring Variation in Active Network Size: Constraints and Ego Characteristics. Social Networks 31(2), p. 138-46.
Schraml, U. 2003. Expectations Towards Fforestry: The Influ-ence of Personal Networks with Forest Owners. Urban Forestry & Urban Greening 1(3), p. 161-170.
Sisock, M. L. 2009. Private Forest Owners’ Communica-tion Networks: Exploring the Structural Basis for Cross-Boundary Cooperation.” Ph.D. Thesis. University of Wisconsin-Madison.
West, P.C., Fly, J.M., Blahna, d.J., and Carpenter, E.M. 1988. The Communication and diffusion of NIPF Management Strategies. Northern Journal of Applied Forestry 5, p.265-70.
176 | IUFRO 3.08.00 Small-Scale Forestry
Introduction
Discussions of tree growing practices in most Asia regions refer to the growing of trees near dwellings that provide products for subsistence and home consumption (Snelder and Lasco, 2008). These practices have had implications for spontaneous forest product diversifica-tion through the implementation of tree growing on farms (agroforestry) by smallholders who have limited access to nearby forest resources. Meyfroidt and Lambin (2011) argued that as implications of human population growth, the forest transition model has shifted from net defor-estation to tree planting practices. Tree species have been re-located from their native habitats to tree-farm systems, through various forms and levels of domes-tication, to meet the diverse needs of smallholders for timber and non-timber forest products, water and soil protection and socio-economic services.
In the livelihood strategies theory, small-scale tree growing farmers are assumed to be “profit-maximisers”, means that the efforts of farmers to maximise their welfare by achieving their multiple household objec-tives, including secure provision of food and essen-
tial of subsistence goods, cash for purchase of outside goods and services, savings to meet future planned or emergencies, and social security to access the subsis-tence goods and productive resources. By selecting their livelihood strategies, farmers may pursue these household objectives to maximise the expected utility of lands, trees, labour, cash and other constraints, while at the same time they attempt to reduce the critical risk factors (Scherr, 1995; Ellis, 2000). Scherr (1995) and Foster and Rosenzweig (1995) added that agroforestry practise objectives for each farmer varies; determined by both their overall livelihood strategies and experience in a long-term experiment. The experiences vary from knowledge incentive assets for farmers to free-ride on the learning of others.
The choice of tree species is one of the most important decisions when an agroforestry system is initiated, influ-encing the multiple household objectives. Smallholders have often found the information regarding manage-ment and end-uses of candidate tree species to be very limited. Smallholders’ choice of tree species depends on four determining factors: (i) the purpose of the planned agroforestry planting, (ii) the availability of the prospec-
The Influence of the household and Farm Attributes on Adoption of Smallholder Timber Production Systems in the Gunungkidul Region, IndonesiaGerhard Sabastian1,3, Peter Kanowski1, Digby Race1, Emlyn Williams2, James Roshetko3
1 Fenner School of Environment & Society2 Statistical Consulting UnitThe Australian National University, Canberra 0200, ACT, Australia3World Agroforestry Centre (ICRAF), Bogor, IndonesiaEmail: [email protected]
Abstract
Agroforestry systems have been recognized as valuable for integrating local economic needs and environmental conservation; however, study on the socio-economic household and biophysical farm factors affecting management adoption of agroforestry by smallholders have not been closely examined in Indonesia, particularly in Gunung-kidul region. This paper investigates the key determinants and the magnitude of the socio-economic household and biophysical farm factors influence for farmers on land and timber tree management; and provide opportunities for farmers to identify management options for their timber-based production systems which enhance household livelihoods. The household condition and composite models only selected the gross income of the on-farm and off-income variables as the determining factor affecting the likelihood of managing land and timber trees; while the farm characteristic model confirms total area managed as the significant variable. Treatments combining wide initial tree spacing at 4.0 x 4.0 m, light pruning of 40% and heavy thinning 75% produced the largest diameter and highest timber volume per stem for teak, and also highest net profits and returns to labour under conditions of increased interest rates and reduced log prices.
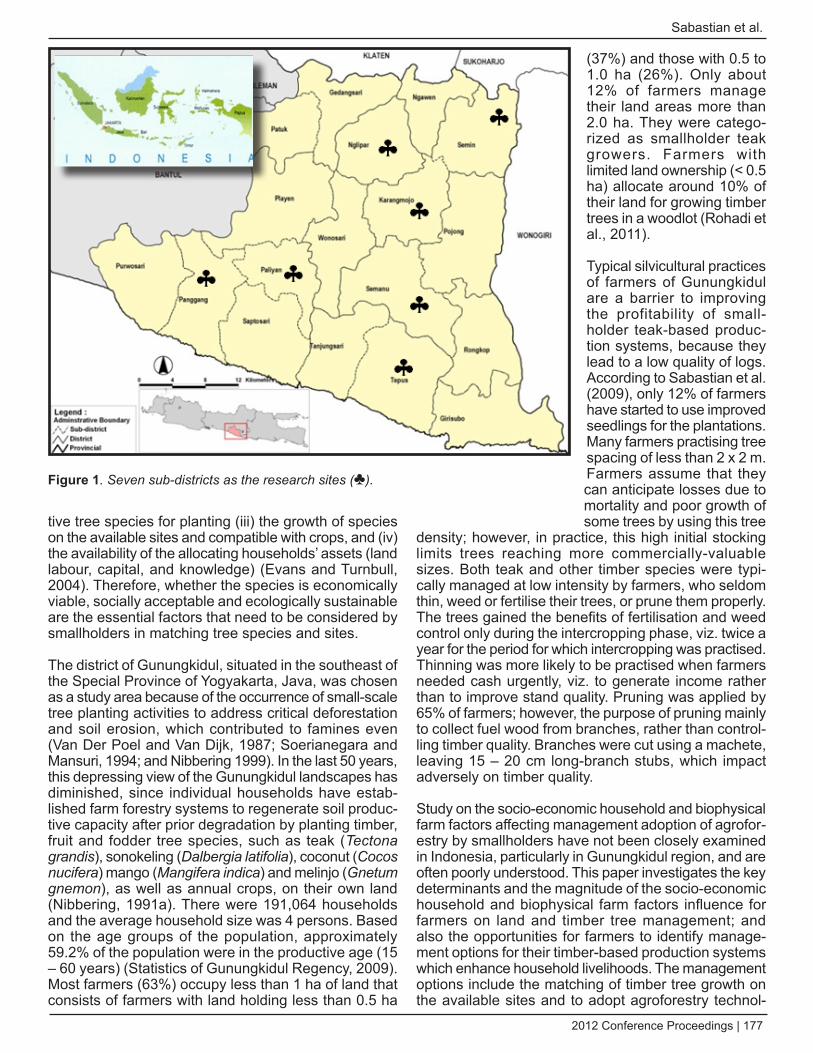
2012 Conference Proceedings | 177
Sabastian et al.
tive tree species for planting (iii) the growth of species on the available sites and compatible with crops, and (iv) the availability of the allocating households’ assets (land labour, capital, and knowledge) (Evans and Turnbull, 2004). Therefore, whether the species is economically viable, socially acceptable and ecologically sustainable are the essential factors that need to be considered by smallholders in matching tree species and sites.
The district of Gunungkidul, situated in the southeast of the Special Province of Yogyakarta, Java, was chosen as a study area because of the occurrence of small-scale tree planting activities to address critical deforestation and soil erosion, which contributed to famines even (Van Der Poel and Van Dijk, 1987; Soerianegara and Mansuri, 1994; and Nibbering 1999). In the last 50 years, this depressing view of the Gunungkidul landscapes has diminished, since individual households have estab-lished farm forestry systems to regenerate soil produc-tive capacity after prior degradation by planting timber, fruit and fodder tree species, such as teak (Tectona grandis), sonokeling (dalbergia latifolia), coconut (Cocos nucifera) mango (Mangifera indica) and melinjo (Gnetum gnemon), as well as annual crops, on their own land (Nibbering, 1991a). There were 191,064 households and the average household size was 4 persons. Based on the age groups of the population, approximately 59.2% of the population were in the productive age (15 – 60 years) (Statistics of Gunungkidul Regency, 2009). Most farmers (63%) occupy less than 1 ha of land that consists of farmers with land holding less than 0.5 ha
(37%) and those with 0.5 to 1.0 ha (26%). Only about 12% of farmers manage their land areas more than 2.0 ha. They were catego-rized as smallholder teak growers. Farmers with limited land ownership (< 0.5 ha) allocate around 10% of their land for growing timber trees in a woodlot (Rohadi et al., 2011).
Typical silvicultural practices of farmers of Gunungkidul are a barrier to improving the profitability of small-holder teak-based produc-tion systems, because they lead to a low quality of logs. According to Sabastian et al. (2009), only 12% of farmers have started to use improved seedlings for the plantations. Many farmers practising tree spacing of less than 2 x 2 m. Farmers assume that they can anticipate losses due to mortality and poor growth of some trees by using this tree
density; however, in practice, this high initial stocking limits trees reaching more commercially-valuable sizes. Both teak and other timber species were typi-cally managed at low intensity by farmers, who seldom thin, weed or fertilise their trees, or prune them properly. The trees gained the benefits of fertilisation and weed control only during the intercropping phase, viz. twice a year for the period for which intercropping was practised. Thinning was more likely to be practised when farmers needed cash urgently, viz. to generate income rather than to improve stand quality. Pruning was applied by 65% of farmers; however, the purpose of pruning mainly to collect fuel wood from branches, rather than control-ling timber quality. Branches were cut using a machete, leaving 15 – 20 cm long-branch stubs, which impact adversely on timber quality.
Study on the socio-economic household and biophysical farm factors affecting management adoption of agrofor-estry by smallholders have not been closely examined in Indonesia, particularly in Gunungkidul region, and are often poorly understood. This paper investigates the key determinants and the magnitude of the socio-economic household and biophysical farm factors influence for farmers on land and timber tree management; and also the opportunities for farmers to identify manage-ment options for their timber-based production systems which enhance household livelihoods. The management options include the matching of timber tree growth on the available sites and to adopt agroforestry technol-
Figure 1. Seven sub-districts as the research sites (♣).
178 | IUFRO 3.08.00 Small-Scale Forestry
The influence of the household and farm attributes on adoption of smallholder timber production systems...
ogies by implementing silvicultural management and intercropping. The research questions of this study are formulated as follows:
How have household and farm circumstances influ-1. enced smallholders on adoption of timber tree-land management?
How have timber trees grown in effects of sites quality 2. across the agricultural landscape?
What are possible management options and financial 3. outcomes for enhancing the sustainability of timber-based production systems?
Methods
Research Question 1
Since the household is the decision-making unit regarding management of land and timber trees on farmer’s own land, primary data were collected through face to face interviews with the 267 household heads from seven villages (Katongan, Candirejo, Bejiharjo, Karangduwet, Dadapayu, Giripurwo, and Giripanggung) in seven sub-districts (Figure 1). All data of the question-naire were collected between May to September 2007 under the 2007 ACIAR Household Socioeconomic study, while data on land biophysical attributes was collected during October 2009 (Nuryartono et al., 2008). This research compared household that participated in land and timber tree management (152 farmers) those that did not participate in timber management (115 farmers). Eighteen explanatory variables representing information on household conditions and farm characteristics and the dependent variable that represented by Land-Timber Management was a binary or categorical (0: no manage-ment farmers, 1: management farmers) were utilized to develop models in the Logistic Regression analysis. The Logistic Regression models have been used in agro-forestry adoption studies for analysing the quantitative importance of each explanatory variable in the models which driving the adoption of agricultural innovations by the households. In Logistic Regression analysis, nine explanatory variables (Number of Household Members, Household Head Age, Household Head Literacy Skills, Timber Tree Planting Experience, Working Household Members, On-Farm Working Members, Gross Income of On-Farm, Gross Income of Off-Farm and Timber Product Specification) were used to develop the house-hold conditions model; while other nine explanatory vari-ables (Total Area Managed, Number of Parcels, Area Owned, Soil Fertility, Farm Surface, Soil Thickness, Land Position, Distance to Nearest Timber Trader and Distance to Farmer House) were employed to develop the farm characteristics model. Then, all explanatory variables were combined to develop a composited logistic regression model.
Research Question 2
Farmer collaborators and sites for this research were selected from those described in Research question 1. The total number of sites sampled was 48. At each of these, a circular plot of 10 m radius, corresponding to an area of 314 m2, was established. A nested sampling technique was employed to select a sample representing each of:
The three principle timber tree species – teak (• Tectona grandis), mahogany (Swietenia macrophylla), and acacia (Acacia auriculiformis) - that are grown in the agroforestry systems;The three slope classes represented in the district, • namely (i) 0 – 15%, (ii) 16 – 30%, and (iii) > 30%); andThe two different soil types (Vertisols and Alfisols) • represented in the district.
Tree biometric information (species, diameter at breast height–DBH, and age), farmland characteristics (slope and elevation), climate conditions (annual rainfall) and soil properties data (clay, sand, silt, pH H2O, C-organic, N, P, K, and Cation Exchange Capacity-CEC) were gathered from the circular plots during a series of field surveys. The process of data analysis and model building was addressed into two steps. The first step identified the individual and interaction effects of slope class, soil type, and average tree age variables on DBH growth of each tree species using the Two-way ANCOVA analysis. In this analysis, the average tree age was employed as covariate to other independent variables. The third step used Multiple Regression analysis to build a model for each tree species to estimate the contribution of both site variables (elevation, slope, bulk density, pH H2O, C-organic, N, P, K, CEC, and annual rainfall) and tree density variables (average tree age and tree density) on diameter growth of the trees.
Research Question 3
In research question 3, the research aims to evaluate the effects of a various silvicultural regimes (initial spacing, pruning and thinning for teak; initial spacing and thinning only for acacia) on tree growth and volume production and to estimate the costs and benefits of silvicultural practices for farmers.
Models are widely used in assessing options for manage-ment of agroforestry and forestry systems. The model-ling of agroforestry systems has also to contend with the interaction between trees and the other elements of the system. Van Noordwijk et al. (2004) describe key features of the WaNuLCAS (Water, Nutrient and Light Capture in Agroforestry Systems) model, formulated in the STELLA research modelling environment. The model is structured to represent a four-layer soil profile with four spatial zones, a water, nitrogen, phosphorus
2012 Conference Proceedings | 179
Sabastian et al.
balance and uptake by a crop (or weed) and up to three types of tree(s). For this research, the WaNuLCAS core module requires a minimum set of input parameters: (i) climate conditions (climate and temperature), (ii) soil profiles (texture, C-organic, bulk density, pH H2O, Cation Exchange Capacity-CEC, nitrogen and phosphorus), (iii) tree functional parameters (biomass equation, phenology, canopy and other support structures), (iv) crop functional parameters (potential growth rates and allocation to harvested organs), and (v) management options (tree species and initial spacing – 2.5 x 2.5 m, 3.0 x 3.0 m, 4.0 x. 4.0 m; timber tree pruning intensities – 40%, 60%, 80% of the total bole height; timber tree thinning intensities – no-thinning, moderate thinning of 50%, and heavy thinning of 75%; crop types and planting schedules; crops harvesting events; use of fertilizer for crops). Data to parameterise the model were available from previous work in the Gunungkidul region, where on-farm trials conducted by ICRAF-Indonesia from 2008 to 2010 in Karangmojo sub-district, Gunungkidul, provided empirical field measurement data of diameter and height growth of teak and acacia trees for valida-tion test purposes.
Benefit-cost analysis was selected as the method for financial comparisons of various silviculture alternatives in this research, and the Net Present Value (NPV) was used as the benefit-cost criterion of the investment at the interest rate (discount rate) considered. The invest-ment is judged profitable and viable when NPV is greater than zero. The second criterion is that of the net returns to labour. Franzel and Scherr (2002) defined returns to labour as earnings that expressed per unit of labour; Tomich et al. (1998) argued that returns to labour can be viewed as the primary indicator of profitability for smallholder production systems. Sensitivity analysis was used here to assess the responsiveness of each simulation scenario (from no-silviculture management system to silviculture-based timber production systems) in response to the three different levels of interest rates - 5%, 10%, and 15% - and to log market price decreases of 25% and 50%, for both NPV and returns to labour criteria.
Results and Discussion
Research Question 1
The household condition model shows the performance of only gross incomes of both on-farm and off-farm signif-icantly influenced land and timber tree management when all household condition variables were considered together; while the farm characteristic model confirms total area managed as the significant variable. The composite model only selected the gross income of the on-farm and off-income variables based on the signifi-cance of improvement as the determining factor affecting the likelihood of managing land and timber trees. Both
the household condition model and the composite model explain that farmers who had on-farm income around 1.8 times more likely to manage their land and timber trees intensively, compared with the farmers who did not manage the land and timber trees. Meanwhile, the probability of applying management principles to land and timber trees increased by enlarging the total area managed for almost two times more.
In Gunungkidul, more intensive management of both agriculture and tree production systems was associ-ated with increasing on-farm and off-farm incomes and greater total farm area. Agroforestry innovations, such as utilizing high quality planting materials and implementing silvicultural practices, can be more easily adopted by farmers when they have greater incomes, from either or both on- and off-farm sources. The total area owned and managed has implications on the proportion of agri-cultural land devoted to growing timber trees, tree crop production on both an annual and longer term basis, and income generation. The area of land owned and managed by a farmer seems very important in deter-mining farming strategies, influencing productivity, input level, tree densities, and livestock densities.
Research Question 2
The selection of teak, mahogany and acacia trees as the main species for smallholder tree growing and refores-tation program in the degraded landscapes of Gunung-kidul is appropriate. Long-term tree growing experi-ence demonstrates that these tree species are well-matched to sites, and can be incorporated in various densities and arrangements in existing farm niches and farm crops. The site matching is shown by diameter growth responding differently to the soil type, slope and soil properties of the site. Diameter growth for all species was faster where trees grown in Alfisols than Vertisols. Sungkar (2008) categorized each of the species as drought resistant, since each have satis-factory growth in shallow soils of Gunungkidul. Results of this research shows teak and acacia grew faster on steeper slopes, while mahogany demonstrated the best growth on slight slopes. Lower levels of soil CEC and bulk density improved the diameter growth of acacia; while mahogany and acacia grew better under lower annual rainfall conditions.
Research Question 3
This research investigated the results of simulations of a range of feasible management options of the production of both timber and maize crops under various tree-row intercropping systems. The growth and yield of two timber tree species in the system, teak and acacia, were estimated under management scenarios that ranged from no-silviculture to the most intensive silviculture likely to be practised by farmers.
180 | IUFRO 3.08.00 Small-Scale Forestry
The influence of the household and farm attributes on adoption of smallholder timber production systems...
The results show that, in the timber tree-row intercrop-ping system, the maize yield decreased considerably after three years cropping period, since tree spacing, tree canopy and root system, and tree growth influ-enced maize growth. Increasing maize yield and the duration of the maize cropping period were possible when the distance between timber trees increased; however, the expected tree wood yield would be reduced as a result.
Initial spacing, pruning and thinning treatments in different intensities and schedules should be combined to manipulate the growth and yield of acacia and teak in the intermediate stages and at the end of rotation. This combination also impacts on the costs and revenues associated with tree growing. In the simulation, there was trade-off between effects of wide spacing at estab-lishment, thinning and pruning. Increasing height of the pruned bole of teak leads to slower diameter and height growth. Within the regimes tested, the wider the initial tree spacing or the heavier the thinning of the initial standing stock, the larger stem diameter and higher timber volume per hectare attained. Therefore, treat-ments combining wide initial spacing at 4.0 x 4.0 m, light pruning of 40% and heavy thinning 75% produced the largest diameter and highest timber volume per stem for teak, and also highest net profits and returns to labour. This relative advantage remained under conditions of increased interest rates and reduced log prices. The sensitivity analysis of reduced log prices and increased interest rates indicated that the silviculture-based timber production systems are still a viable option for farmers in Gunungkidul.
Implications of Results for Smallholder Timber-Based Production Systems in Gunungkidul
The results of research provide a basis for smallholders to move from low-intensity tree growing to more intensi-fied management in Gunungkidul, particularly, and else-where in Indonesia where similar systems are practiced. Pattanayak et al. (2003) review of agroforestry adoption globally concluded that there are five indicators of small-holder adoption of agricultural and forestry innovations: preferences, resource endowments, market incentives, biophysical factors, and risk and uncertainty. It is likely that smallholder farmers in Gunungkidul would consider the results of this research in these terms. The results can be discussed in the context of the five indicators, as follows:
Preferences1.
Treatments that combine wider initial spacing • and different pruning and thinning regimes allow for farmers to intensify their timber tree growing and produce higher yielding trees and less vari-ation in log quality compared to no-silviculture management. This research found that a wide
initial spacing at 4.0 x 4.0 m, light pruning to 40% of bole height, and heavy thinning of 75% produced the greatest timber volume per stem for teak, and highest NPV and returns to labour.
Planting trees at wider spacing in the timber-• based agroforestry system will provide higher economic returns to the farm as a whole because: (i) crops can be planted in the alleys between rows of trees with higher yield, (ii) trees will grow faster because of the more intensive thinning, and (iii) farmers gain more benefits from the lower tree establishment and management costs.
Resource endowments (family labour, land, and on- 2. and off-farm income)
In the silviculture-based timber production system, • farmers with labour constraints will be attracted to the wider spacing of 4.0 x 4.0 m, labour require-ments at establishment are reduced by 50% compared to the standard 2.5 x 2.5 m spacing.
Silvicultural practices in the systems can maximise • land productivity with returns equivalent to a higher wage level.
Market incentives3.
Improved product quality resulting from appli-• cation of wider initial tree spacing and pruning and thinning intensities on teak, and appropriate initial spacing and thinning intensity for acacia, can allow farmers to tap recover higher value and provide more economically attractive returns.
Biophysical factors4.
Information on the existing levels of soil nutrient • and texture, soil type, elevation and slope, and annual rainfall can be used by farmers or those working with them to evaluate soil fertility levels and land productivity. Lower levels of organic carbon and nitrogen, for example, in the soils are associated with poorer diameter growth of trees and less total above-ground tree biomass. This information should be considered in the appli-cation of tree spacing and pruning and thinning intensities. Silvicultural practices in the timber based production systems should optimise impacts on soil fertility, minimise soil erosion, and optimise total above-ground biomass; and ulti-mately optimise benefits for farmer.
Risk and uncertainty5.
The results of sensitivity analysis of log prices • and interest rates should reassure farmers of the levels of risk and uncertainty associated with inte-grated tree-crop systems. The analysis results indicated that silviculture-based timber produc-tion systems remain a viable option for farmers in Gunungkidul even when the log price is reduced by 25% to 50%, and under various interest rate scenarios.
2012 Conference Proceedings | 181
Sabastian et al.
On the basis of the criteria of net present value and • returns to labour, silviculture-based timber produc-tion systems will benefit individual farmers more than no-silviculture management systems.
Acknowledgements
We thank other members of the ACIAR Project FST/2005/177 for their assistance in various ways for this work. We thank small-scale farmers who partici-pated in the research.
References
Ellis, F., 2000. Rural livelihoods and diversity in developing countries. Oxford University Press, Oxford
Evans, J. and J. Turnbull, 2004. Plantation Forestry in the Tropics. The Role, Silviculture and Use of Planted Forests for Industrial, Social, Environmental, and Agrofor-estry Purposes. 3rd Edition. Oxford University Press, pp: 107-130
Foster, A.d. and M.R. Rosenzweig, (1995). Learning by doing and learning from others: Human capital and tech-nical change in agriculture. Journal of Political Economy, Vol. 103, No. 6, pp: 1176-1209
Franzel, S. and S.J. Scherr (Eds), 2002. Trees on the farm: Assessing the adoption potential of agroforestry practices in Africa. CABI Publishing in association with ICRAF, Nairobi, p: 186
Meyfroidt, P. and E.F. Lambin, 2011. Global Forest Transition: Prospects for an End to deforestation. Annual Review of Environment and Resources, 36, pp: 343-371
Nibbering, J.W., 1991a. Hoeing in the Hills: Stress and Resil-ience in an Upland Farming System in Java. Unpublished Phd Thesis, Australian National University, Canberra
Nibbering, J.W., 1999. Tree planting on deforested farmlands, Sewu Hills, Java, Indonesia, Impact of economic and insti-tutional changes, Agroforestry Systems, 57, pp: 173-186
Nuryartono, N., N. Kusumowardani, J. Effendi, and H Hasanah, 2008. Aspek finansial petani jati Gunungkidul. ACIAR Project Report, Improving Economic Outcomes for Smallholders Growing Teak in Agroforestry Systems in Indonesia, Inter-CAFÉ Bogor Agricultural University, Indo-nesia
Pattanayak, S.K., d.E. Mercer, E. Sills, and J.C. Yang, 2003. Taking stock of agroforestry adoption studies. Agroforestry Systems, 57, pp: 173-186
Rohadi, d., J. Roshetko, A. Perdana, M. Blyth, N. Nuryar-tono, N. Kusumowardani, A.A. Pramono, N. Widyani, A. Fauzi, M.J. Sasono, P. Sumardamto, 2011. Improving economic outcomes for smallholder growing teak in agro-forestry systems in Indonesia. Final report of project no. FST.2005/177. Australian Centre for International Agricul-tural Research (ACIAR), Canberra
Sabastian, G.E., J.M. Roshetko, d. Anggakusuma, A.A. Pramono, I. Heriansyah, and A. Fauzi, 2009. Smallholder teak-based farming management in Gunungkidul, Yogya-karta: Current Practice, Obstacles and Improvement Options. ACIAR Project Report, Australian Centre for International Agricultural Research and World Agroforestry Centre
Scherr, S.J., 1995. Economic factors in farmer adoption of agroforestry: Patterns observed in Western Kenya. World development, Vol. 23, No. 5, pp: 787-804
Snelder, d.J. and R.d. Lasco, 2008. Smallholder tree growing in South and Southeast Asia. In: Snelder, d.J. and R.d. Lasco, (Eds) Smallholder tree growing for rural development and environmental services, Lessons from Asia, Advances in Agroforestry. Springer, Vol.5, pp: 11-12
Soerianegara, I. and Mansuri, 1994. Factors which determine the success of regreening in Gunungkidul, Central Java. Journal of Tropical Forest Science, 7(1), pp: 64-75
Statistics of Gunungkidul Regency, 2009. Gunungkidul in Figures 2009, Katalog BPS: 1102001.3403, collaboration between the Regional development Planning Board of Gunungkidul and Statistics of Gunungkidul regency, Yogya-karta, Indonesia
Sunkar, A., 2008. Sustainability in karst resources manage-ment: the case of the Gunung Sewu in Java. A thesis submitted in fulfilment of the requirements for the degree of doctor Philosophy, The University of Aukland, New Zealand
Tomich, T.P., M. van Noordwijk, S.A. Vosti, and J. Witcover, 1998. Agricultural development with rainforest conserva-tion methods for seeking best bet alternatives to slash-and-burn, with applications to Brazil and Indonesia. Agricultural Economics, 19, pp: 159-174
Van der Poel, P. and H. Van dijk, 1987. Household economy and tree growing in upland Central Java, Martinus Nijhoff Publishers, Agroforestry Systems, 5, pp: 169-184
Van Noordwijk, M., B. Lusiana, N. Khasanah, 2004. WaNuLCAS 3.01, Background on a model of Water, Nutrient, and Light Capture in Agroforestry Systems. World Agrofor-estry Centre, Bogor, Indonesia
182 | IUFRO 3.08.00 Small-Scale Forestry
Introduction
In Latvia, the Soviet rule interrupted the traditions in managing private property for nearly a half of century. The Soviet-type collective farms (kolkhozes) were based on joint ownership of resources and on pooling of labour and income in accordance with the Leninist principles of cooperative organizations. They were radically different, based on Soviet ideology and introduced by force under the conditions of no democracy and freedom of speech. Negative experiences from the Soviet-time administra-tive command system in farming are still among the most important obstacles for developing cooperation among the private forest owners (PFO).
Regaining sovereignty in 1990 and a changeover to market economy brought about privatization, accompa-nied by the restitution of property rights, including the right to own forestland, to the former owners or their successors. According to the State Land Service data,
as a result of above processes there are something like 140,000 PFOs who own about 33% of forest-covered lands with woodlands accounting for nearly 52% of the country’s land area. Consequently, small-scale (average forest holding size 8ha) and fragmented holdings, mostly managed as family property, are typical for the private sector in forestry.
The first cooperative society, Latvijas Meža Īpašnieku Asociācija (Latvian Forest Owners Association, - LFOA), was founded in 1994 with the guidance and financial support from abroad. Goals of the organization were ambitious, while in practice its activities were limited to routine services, timber purchase and further sales. Efforts to obtain international recognition were successful and the organization was better known outside rather than inside the country. Initial LFOA activities actually laid the foundation for the development of forest extension system in Latvia. At that time there was no other orga-nization that provided advice and services to the PFOs.
Increasing Role of local Associations in Providing Extension Services to Private Forest OwnersAgnese Trojanovska1 and Lelde Vilkriste2
1 Forest Faculty, Latvia Agriculture University, Akadēmijas iela 11, Jelgava, LV-3001, Latvia; e-mail: [email protected]
2 Latvian State Forest Research Institute „Silava”; Rigas iela 111, Salaspils, LV-2169, Latvia; e-mail: [email protected]
Key words: associations and foundations of private forest owners, forest extension, opinion poll
Abstract
In Latvia the first private forest owner association was established in 1994 with the financial support from abroad, but it failed to meet the expectations of its members as it soon became a kind of business company concerned with timber purchase and further sales. Another cycle in the development of cooperation started in 2004 when 44 private forest owner organizations were established with the support of EU funds. They offered services in forest management, timber market, and extension, organizing seminars for private forest owners and training courses for their members. Currently about 20 of them are still active in the business of forest extension/advisory services.
The given paper presents the results of the 2012 opinion poll among the private forest owner organisations and other forest sector stakeholders. Their views on the current situation in the field of extension/advisory services and the potential for further development of the system of forest extension are discussed, stressing the need for a proactive approach in offering a variety of services to the forest owners. Cash flow analyses of the forest owner organizations for 2005-2009 illustrate the situation with costs/returns in the business of forest extension/advisory services.
Presented are also opinions on the efficiency of investments for the development of private forest owner orga-nizations. The role of local associations in forestry awareness raising among the private owners, introducing the best management practices, and increasing the level of activity of private forestry is widely different in different situations and localities. As long as the paying capacity of the rank-and-file forest owners remains low their orga-nizations can develop with the support of the EU and other funds.
2012 Conference Proceedings | 183
Trojanovska and Vilkriste
At first the LFOA rendered services to its members only. Formally, in a couple of years the numbers of members increased to 4,000, yet the majority of them applied to the organization or used its services on separate occa-sions only. In fact, the number of active members was no higher than 300.
Later on the LFOA promoted development of agencies or local PFO associations. The organization became more interested in timber business and changed its legal status from time to time (Ltd., society, union). Increasing disagreements among the leaders and asso-ciation members resulted in separation of local associa-tions and reduced the number of members. In the last years of its functioning the LFOA acted like a business company and was even reproached of non-transparent business and legally dubious activities. Thus, the first efforts to realize in practice the idea of PFO cooper-ation failed. Actually, the LFOA establishment in the mid-1990s and its functioning should be regarded as a top-down rather than bottom-up attempt to introduce cooperation in private forestry.
In the beginning of 2000 a number of new PFO orga-nizations were established mostly for two reasons – to provide services and organize joint timber trade, or represent the PFO interests on the political scene. Busi-ness-oriented foundations were short-lived, sometimes less than one year, while most of the associations and unions with political ambitions joined together. Today the new Latvian Forest Owners Association (LFOA), founded in 2005, is a non-governmental organization, representing the forest owners’ interests in Latvia and internationally and promoting the PFO awareness and knowledge about forestry and its legal and economical aspects.
Availability of the EU funds for creating private forest owners associations (PFOA) or other foundations initi-ated similar activities already for the third time. According to the Latvian Information Technology Company Lursoft database, before 2004 there were already eight PFOAs and since 2004 the number of PFOAs registered in two years was 41. The Rural Support Service (RRS) data show that in 2004-2006 the EU financial support to the PFO organizations reached LVL 527,8781. As of July 2012, totally 59 PFOAs were on the list of the Lursoft, with only 15-20 of them working actively, providing also extension and advisory services to the local PFOs by organising seminars and other activities. It is to be noted, that the local PFOAs are relatively small with the number of members from 10 to 50. Usually they are active in the local municipality within the radius of some 30-40km. In most cases the PFOAs have good cooperation with the local service providers in forest management and the PFOA leaders act as locally authorized agents for decision making in forestry matters.
1 LVL 1 = EUR 0.7098 (Bank of Latvia)
The first PFO cooperative organisation was established in 2011. It is actually the first attempt to apply the prin-ciples of forest owner cooperation in the forest sector of Latvia.
Materials and Methods
For the purposes of the given study the financial data given in the PFOA Annual Reports (AR) submitted to the RSS between 2004 and 2010 for checking up the use of EU funds were analyzed following the theoret-ical principles of cash flow analysis. A number of posi-tions from the cash flow were selected and analysed in greater detail, for example, costs/returns of the exten-sion activities like informational seminars and work-shops, and services in forest management.
Between 2004 and 2010 totally 59 different PFOAs were registered in the Lursoft data base. In greater detail were analyzed and compared the financial data for the years 2007 (36 ARs) and 2009 (14 ARs) so as to enable eval-uating the PFOA development tendencies, changes in the activities and cash flow. The costs/returns related to extension (consultations, seminars) and forest manage-ment services were analyzed for the years 2005–2009. The forest extension and practical activities of seven most active PFOAs were analyzed separately.
Opinion polls of the PFOAs and other organisations concerned with forest extension were carried out in April – July, 2012. The questionnaire, mailed to 15 most active PFOAs (response rate 73%), was designed so as to obtain information regarding the type of services offered to the PFOs, the number of cases for different types of extension and advisory activities , PFO demands, opinions about the current extension system and the potential trends for its development.
Special questionnaire was designed to find out the views of different forestry professionals on the currently existing forest extension system and the role of PFOAs. Totally 33 questionnaires were mailed: 16 to the State Forest Service (SFS) (7 responses), 12 to the Forest Advisory Consultation Centre (FASC) (10 responses) and 5 to NGOs and other organizations (4 responses). The given paper presents the results of quantitative and qualitative analyses of the data obtained by way of opinion polls.
Results of the Opinion Polls
Priorities for the PFOAs
The PFOA respondents were asked to make a list of priority activities and provided services following the proportion of working hours devoted to one or another activity, evaluating it by a 7-point scale (Table 1). The
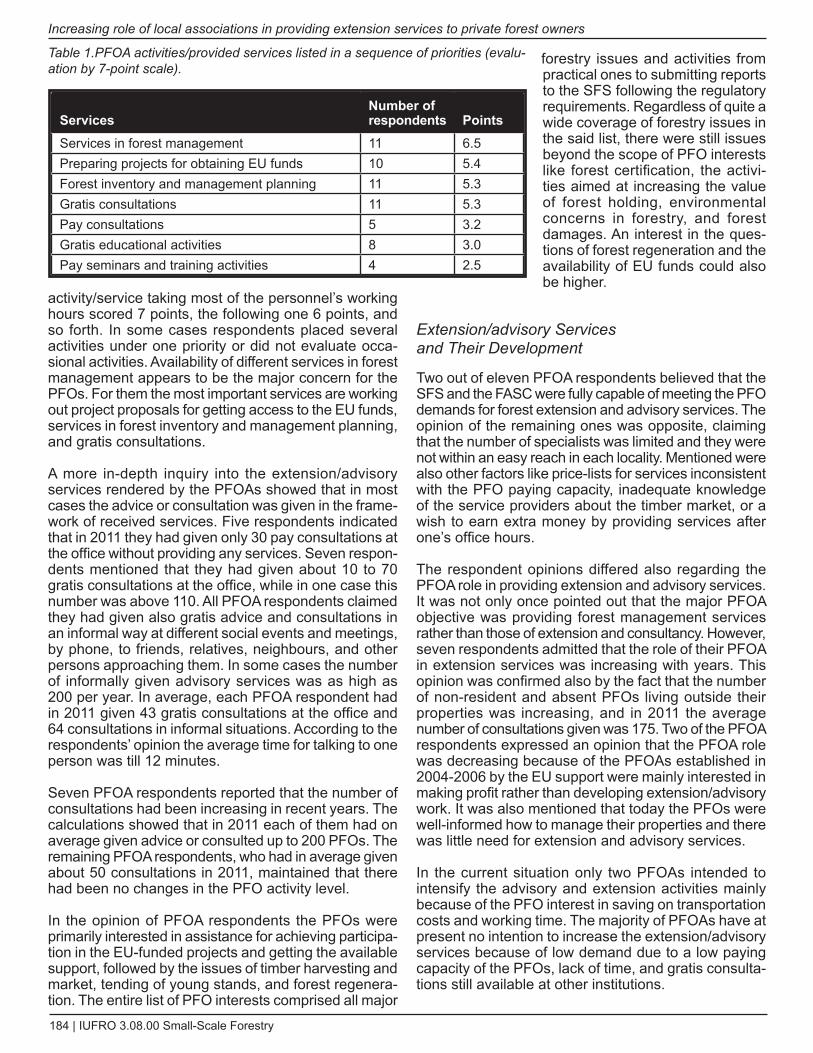
184 | IUFRO 3.08.00 Small-Scale Forestry
Increasing role of local associations in providing extension services to private forest owners
activity/service taking most of the personnel’s working hours scored 7 points, the following one 6 points, and so forth. In some cases respondents placed several activities under one priority or did not evaluate occa-sional activities. Availability of different services in forest management appears to be the major concern for the PFOs. For them the most important services are working out project proposals for getting access to the EU funds, services in forest inventory and management planning, and gratis consultations.
A more in-depth inquiry into the extension/advisory services rendered by the PFOAs showed that in most cases the advice or consultation was given in the frame-work of received services. Five respondents indicated that in 2011 they had given only 30 pay consultations at the office without providing any services. Seven respon-dents mentioned that they had given about 10 to 70 gratis consultations at the office, while in one case this number was above 110. All PFOA respondents claimed they had given also gratis advice and consultations in an informal way at different social events and meetings, by phone, to friends, relatives, neighbours, and other persons approaching them. In some cases the number of informally given advisory services was as high as 200 per year. In average, each PFOA respondent had in 2011 given 43 gratis consultations at the office and 64 consultations in informal situations. According to the respondents’ opinion the average time for talking to one person was till 12 minutes.
Seven PFOA respondents reported that the number of consultations had been increasing in recent years. The calculations showed that in 2011 each of them had on average given advice or consulted up to 200 PFOs. The remaining PFOA respondents, who had in average given about 50 consultations in 2011, maintained that there had been no changes in the PFO activity level.
In the opinion of PFOA respondents the PFOs were primarily interested in assistance for achieving participa-tion in the EU-funded projects and getting the available support, followed by the issues of timber harvesting and market, tending of young stands, and forest regenera-tion. The entire list of PFO interests comprised all major
forestry issues and activities from practical ones to submitting reports to the SFS following the regulatory requirements. Regardless of quite a wide coverage of forestry issues in the said list, there were still issues beyond the scope of PFO interests like forest certification, the activi-ties aimed at increasing the value of forest holding, environmental concerns in forestry, and forest damages. An interest in the ques-tions of forest regeneration and the availability of EU funds could also be higher.
Extension/advisory Services and Their development
Two out of eleven PFOA respondents believed that the SFS and the FASC were fully capable of meeting the PFO demands for forest extension and advisory services. The opinion of the remaining ones was opposite, claiming that the number of specialists was limited and they were not within an easy reach in each locality. Mentioned were also other factors like price-lists for services inconsistent with the PFO paying capacity, inadequate knowledge of the service providers about the timber market, or a wish to earn extra money by providing services after one’s office hours.
The respondent opinions differed also regarding the PFOA role in providing extension and advisory services. It was not only once pointed out that the major PFOA objective was providing forest management services rather than those of extension and consultancy. However, seven respondents admitted that the role of their PFOA in extension services was increasing with years. This opinion was confirmed also by the fact that the number of non-resident and absent PFOs living outside their properties was increasing, and in 2011 the average number of consultations given was 175. Two of the PFOA respondents expressed an opinion that the PFOA role was decreasing because of the PFOAs established in 2004-2006 by the EU support were mainly interested in making profit rather than developing extension/advisory work. It was also mentioned that today the PFOs were well-informed how to manage their properties and there was little need for extension and advisory services.
In the current situation only two PFOAs intended to intensify the advisory and extension activities mainly because of the PFO interest in saving on transportation costs and working time. The majority of PFOAs have at present no intention to increase the extension/advisory services because of low demand due to a low paying capacity of the PFOs, lack of time, and gratis consulta-tions still available at other institutions.
Table 1.PFOA activities/provided services listed in a sequence of priorities (evalu-ation by 7-point scale).
ServicesNumber of respondents Points
Services in forest management 11 6.5Preparing projects for obtaining EU funds 10 5.4Forest inventory and management planning 11 5.3Gratis consultations 11 5.3Pay consultations 5 3.2Gratis educational activities 8 3.0Pay seminars and training activities 4 2.5
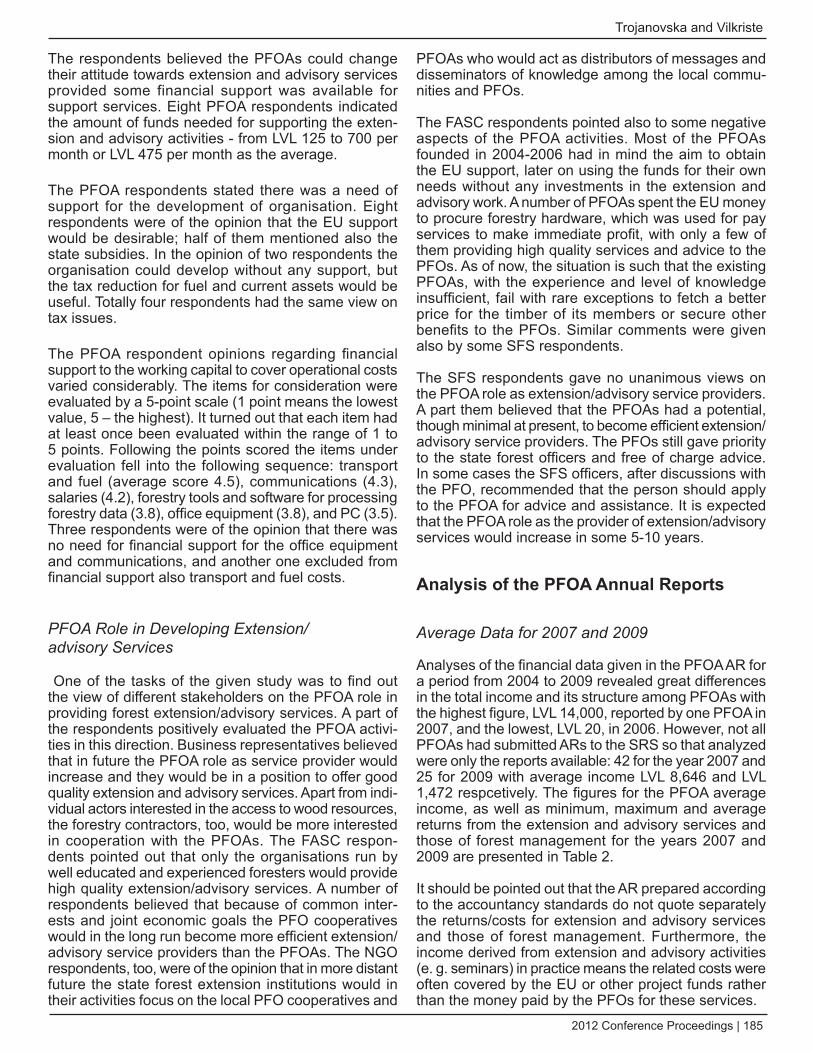
2012 Conference Proceedings | 185
Trojanovska and Vilkriste
The respondents believed the PFOAs could change their attitude towards extension and advisory services provided some financial support was available for support services. Eight PFOA respondents indicated the amount of funds needed for supporting the exten-sion and advisory activities - from LVL 125 to 700 per month or LVL 475 per month as the average.
The PFOA respondents stated there was a need of support for the development of organisation. Eight respondents were of the opinion that the EU support would be desirable; half of them mentioned also the state subsidies. In the opinion of two respondents the organisation could develop without any support, but the tax reduction for fuel and current assets would be useful. Totally four respondents had the same view on tax issues.
The PFOA respondent opinions regarding financial support to the working capital to cover operational costs varied considerably. The items for consideration were evaluated by a 5-point scale (1 point means the lowest value, 5 – the highest). It turned out that each item had at least once been evaluated within the range of 1 to 5 points. Following the points scored the items under evaluation fell into the following sequence: transport and fuel (average score 4.5), communications (4.3), salaries (4.2), forestry tools and software for processing forestry data (3.8), office equipment (3.8), and PC (3.5). Three respondents were of the opinion that there was no need for financial support for the office equipment and communications, and another one excluded from financial support also transport and fuel costs.
PFOA Role in developing Extension/advisory Services
One of the tasks of the given study was to find out the view of different stakeholders on the PFOA role in providing forest extension/advisory services. A part of the respondents positively evaluated the PFOA activi-ties in this direction. Business representatives believed that in future the PFOA role as service provider would increase and they would be in a position to offer good quality extension and advisory services. Apart from indi-vidual actors interested in the access to wood resources, the forestry contractors, too, would be more interested in cooperation with the PFOAs. The FASC respon-dents pointed out that only the organisations run by well educated and experienced foresters would provide high quality extension/advisory services. A number of respondents believed that because of common inter-ests and joint economic goals the PFO cooperatives would in the long run become more efficient extension/advisory service providers than the PFOAs. The NGO respondents, too, were of the opinion that in more distant future the state forest extension institutions would in their activities focus on the local PFO cooperatives and
PFOAs who would act as distributors of messages and disseminators of knowledge among the local commu-nities and PFOs.
The FASC respondents pointed also to some negative aspects of the PFOA activities. Most of the PFOAs founded in 2004-2006 had in mind the aim to obtain the EU support, later on using the funds for their own needs without any investments in the extension and advisory work. A number of PFOAs spent the EU money to procure forestry hardware, which was used for pay services to make immediate profit, with only a few of them providing high quality services and advice to the PFOs. As of now, the situation is such that the existing PFOAs, with the experience and level of knowledge insufficient, fail with rare exceptions to fetch a better price for the timber of its members or secure other benefits to the PFOs. Similar comments were given also by some SFS respondents.
The SFS respondents gave no unanimous views on the PFOA role as extension/advisory service providers. A part them believed that the PFOAs had a potential, though minimal at present, to become efficient extension/advisory service providers. The PFOs still gave priority to the state forest officers and free of charge advice. In some cases the SFS officers, after discussions with the PFO, recommended that the person should apply to the PFOA for advice and assistance. It is expected that the PFOA role as the provider of extension/advisory services would increase in some 5-10 years.
Analysis of the PFOA Annual Reports
Average data for 2007 and 2009
Analyses of the financial data given in the PFOA AR for a period from 2004 to 2009 revealed great differences in the total income and its structure among PFOAs with the highest figure, LVL 14,000, reported by one PFOA in 2007, and the lowest, LVL 20, in 2006. However, not all PFOAs had submitted ARs to the SRS so that analyzed were only the reports available: 42 for the year 2007 and 25 for 2009 with average income LVL 8,646 and LVL 1,472 respcetively. The figures for the PFOA average income, as well as minimum, maximum and average returns from the extension and advisory services and those of forest management for the years 2007 and 2009 are presented in Table 2.
It should be pointed out that the AR prepared according to the accountancy standards do not quote separately the returns/costs for extension and advisory services and those of forest management. Furthermore, the income derived from extension and advisory activities (e. g. seminars) in practice means the related costs were often covered by the EU or other project funds rather than the money paid by the PFOs for these services.
186 | IUFRO 3.08.00 Small-Scale Forestry
Increasing role of local associations in providing extension services to private forest owners
The data analyses show an increase in the average income from extension/advisory activities (consulta-tions, seminars) between 2007 and 2009. In the same years the total average income from forest manage-ment services had decreased greatly due to the fluctua-tions on the timber market. The year 2007 was a peak for wood processing industries and the harvest volume in the private sector reached 5.6 million m3, compared to 3 million m3 in 2009 when the economic crises was already in full swing.
Extension/advisory and Forest Management Services of the PFOAs in 2004-2009
The results of detailed analyses of the PFOA returns from the extension/advisory and forest management services are presented in Table 3. Regarding extension/advisory services (seminars) the highest level of activity was between 2006 and 2009 when 16 PFOAs were engaged in this work. Minimum and maximum returns from consultations varied among the PFOAs from year to year. In 2007 the proportion of income from consulta-tions was less than 5 % of the total returns. It increased starting with 2008, reaching in 2009 19% from the total income of the PFOAs.
As it follows from Table 3, the number of PFOAs orga-nizing seminars was small – only five PFOAs in 2008 out of altogether nine reporting seminar organization in 2004-2009.The minimum returns (costs) per seminar was LVL 120 in 2007, LVL 180 in 2008, and LVL 300 in 2009. The maximum reported returns (costs) from seminars for the above years were LVL 810, LVL 1,700 and LVL 1,135, respectively. The data show that the seminar activities increased in 2008-2009 with avail-ability of EU funds.
For most of the PFOAs services in forest management are the major source income. Because of the global economic crises these activities had also gone down in the period analyzed. In 2005 – 2009, the services in forest management were offered totally by 28 PFOAs out of 44, while seven PFOAs didn’t report any income from forest management services in this period. The minimum and maximum returns from these services reported by the PFOAs illustrate the differences between them
and their orien-tation in one or another direc-tion, indicating the development trends taken by one or another PFOAs.
As to the total costs reported by
PFOAs the highest figure, LVL 4,920, is given in 2008, the lowest, LVL 90, in 2006. The important cost items were transport and fuel, office expenses, and procure-ment of appropriate forestry hardware for providing high quality services. For all above cost items the highest difference in the figures quoted is for the years 2007 and 2009 (Table 4).
For 2008 and 2009, five PFOAs reported expenses for the courses of raising the vocational competence of their staff. In 2009 the maximum expenses for raising qualification reached LVL 2,160. Totally 22 PFOAs reported the costs for extension/advisory services with the highest figure, LVL 4,920, in 2008, the lowest, LVL 90, in 2006.
In the framework of this study seven most active PFOAs having the highest turnover were chosen for a more detailed analysis. According to the ARs their total income for 2004-2009 was LVL 90,632, the costs - LVL 142,179. Services in forest management were the major source of income for them (48% of the total), followed by financial support of the EU funds (27%), and extension/ advisory services (consultations) (13%). The main cost items were the loan payment (27%), followed by the costs of extension/advisory services (15%), procurement of forestry hardware (14%), and the salaries and accoun-tancy services (8%). The returns/costs structure for the most active and development-oriented PFOAs differed from that of other organizations. Personal investments or bank loans for the development indicate that the orga-nization has long term plans and objectives.
Discussion and Conclusions
According to the rules the PFOAs are supposed to submit ARs to the RRS for a five-year period starting from the moment they received the EU funds. However, not all organizations observe this rule. Also the level of details for the cash flow given in the financial state-ments of one or another organization differs. Thus, the available information is insufficient for analyzing in detail the situation with the extension/advisory services, but enough to make conclusions on general trends in the PFOA development:
2007 2009Income positions Max. Min. Av. Total Max. Min. Av. TotalForest managm. 7,500 300 1,535 51,250 2,650 1,100 471 15,217Extension/advice 730 40 441 6,611 960 570 785 4,710Seminars 810 120 378 1,510 1,135 300 718 1,435
Table 2. Maximal, minimal and average PFAO income from extension/advisory and forest manage-ment services in 2007 and 2009, LVL.
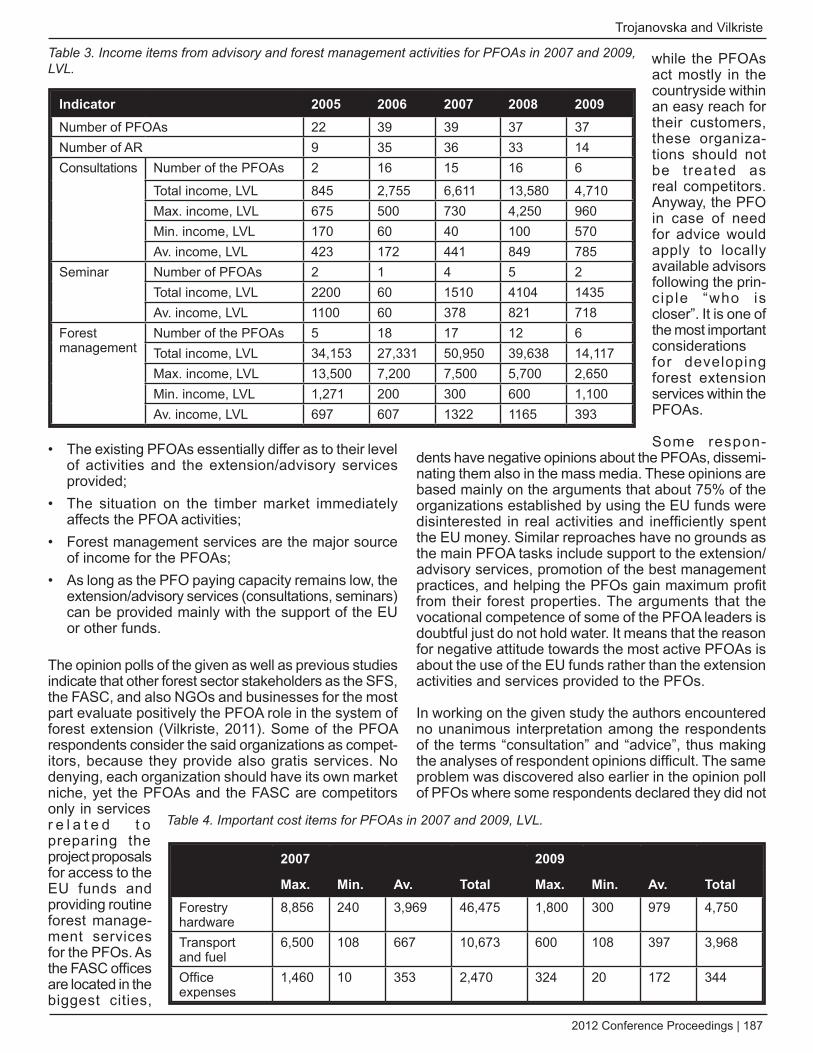
2012 Conference Proceedings | 187
Trojanovska and Vilkriste
The existing PFOAs essentially differ as to their level • of activities and the extension/advisory services provided;The situation on the timber market immediately • affects the PFOA activities;Forest management services are the major source • of income for the PFOAs;As long as the PFO paying capacity remains low, the • extension/advisory services (consultations, seminars) can be provided mainly with the support of the EU or other funds.
The opinion polls of the given as well as previous studies indicate that other forest sector stakeholders as the SFS, the FASC, and also NGOs and businesses for the most part evaluate positively the PFOA role in the system of forest extension (Vilkriste, 2011). Some of the PFOA respondents consider the said organizations as compet-itors, because they provide also gratis services. No denying, each organization should have its own market niche, yet the PFOAs and the FASC are competitors only in services r e l a t e d t o preparing the project proposals for access to the EU funds and providing routine forest manage-ment services for the PFOs. As the FASC offices are located in the biggest cities,
while the PFOAs act mostly in the countryside within an easy reach for their customers, these organiza-tions should not be treated as real competitors. Anyway, the PFO in case of need for advice would apply to locally available advisors following the prin-c ip le “who is closer”. It is one of the most important considerations for developing forest extension services within the PFOAs.
Some respon-dents have negative opinions about the PFOAs, dissemi-nating them also in the mass media. These opinions are based mainly on the arguments that about 75% of the organizations established by using the EU funds were disinterested in real activities and inefficiently spent the EU money. Similar reproaches have no grounds as the main PFOA tasks include support to the extension/advisory services, promotion of the best management practices, and helping the PFOs gain maximum profit from their forest properties. The arguments that the vocational competence of some of the PFOA leaders is doubtful just do not hold water. It means that the reason for negative attitude towards the most active PFOAs is about the use of the EU funds rather than the extension activities and services provided to the PFOs.
In working on the given study the authors encountered no unanimous interpretation among the respondents of the terms “consultation” and “advice”, thus making the analyses of respondent opinions difficult. The same problem was discovered also earlier in the opinion poll of PFOs where some respondents declared they did not
Indicator 2005 2006 2007 2008 2009Number of PFOAs 22 39 39 37 37Number of AR 9 35 36 33 14Consultations Number of the PFOAs 2 16 15 16 6
Total income, LVL 845 2,755 6,611 13,580 4,710Max. income, LVL 675 500 730 4,250 960Min. income, LVL 170 60 40 100 570Av. income, LVL 423 172 441 849 785
Seminar Number of PFOAs 2 1 4 5 2Total income, LVL 2200 60 1510 4104 1435Av. income, LVL 1100 60 378 821 718
Forest management
Number of the PFOAs 5 18 17 12 6Total income, LVL 34,153 27,331 50,950 39,638 14,117Max. income, LVL 13,500 7,200 7,500 5,700 2,650Min. income, LVL 1,271 200 300 600 1,100Av. income, LVL 697 607 1322 1165 393
Table 3. Income items from advisory and forest management activities for PFOAs in 2007 and 2009, LVL.
2007 2009
Max. Min. Av. Total Max. Min. Av. TotalForestry hardware
8,856 240 3,969 46,475 1,800 300 979 4,750
Transport and fuel
6,500 108 667 10,673 600 108 397 3,968
Office expenses
1,460 10 353 2,470 324 20 172 344
Table 4. Important cost items for PFOAs in 2007 and 2009, LVL.
188 | IUFRO 3.08.00 Small-Scale Forestry
Increasing role of local associations in providing extension services to private forest owners
use advisory services and consultations. For example, a number PFOs believed that answers to their questions or information they received when talking to a forest officer or expert was not a consultation. The opinion poll allowed concluding that the PFOA respondents consid-ered as consultation any advice or directions given for payment. Consultations are included in the SFS and also the FASC service price list, but are still missing in the PFOA price lists. For the PFOAs consultations, advice or other guidelines or directions given in informal situ-ations or at the office are not considered as pertaining to forest extension.
Although the PFOAs do not as yet consider themselves as significant providers of extension/advisory services, the answers in the opinion polls of a number of PFOs indirectly suggest that it is just the opposite. An inquiry into the situation in Latvia with peer-to-peer learning in 2011 allows concluding that exactly the PFOAs have the greatest potential in promoting it. There have so far been no studies on informal learning and this concept is still tabula rasa not only for the PFOs, but also for forestry specialists and policy makers. It can be claimed that the support to the PFOAs would be the first step in promoting peer-to peer-learning among the PFO orga-nizations, their members and service users.
References
Nikolajeva, A. 2009. EU Funds financial support for private forest owners. Master Paper. LAU, Jelgava, 85 p.
Vilkriste, L. 2010. Extension service in Latvia – how to meet the needs and wishes of private forest owners. Proceedings of IUFRO Conference. Bled, Slovenia, pp. 836–852.
Vilkriste, L. 2011. Increasing role of informal learning of private forest owners in Latvia. H. Karppinen, T. Hujala and O. Virkkula (eds.). Proceedings of the IUFRO 3.08 Symposium.Working Papers of the Finnish Forest Research Institute 193.FFRI, Vantaa, p. 65-75.
2012 Conference Proceedings | 189
Background
In Ireland, forestry is an expanding and developing sector in the rural economy, with forests now covering just 11% or over 750,000 hectares (ha) of the total land area in 2011, from a low base of one per cent in 1920 (Forest Service, 2012). This increase in forest cover is the direct result of a variety of government afforesta-tion policies and incentives to promote the planting of forests from the early 1920s to the present day. Prior to the 1980’s, virtually all planting was carried out by the State. Since the mid 1980s, through the introduction of a variety of support packages aimed largely at farmers, the government has sought to significantly increase the rate of private planting in order to increase the proportion of land in forestry use (Kearney, 2001). The result has been a dramatic reversal in the balance of afforestation between the state and private forestry sectors. Since 2001, private ownership of forests has increased from 24% of the total forest area in 1980 to 47% (352,000 ha) in 2011 (Forest Service, 2012).
The publication in 1996 of Ireland’s strategic forest policy document, ‘Growing for the Future’, (DAFF, 1996) focused on the expansion of the sector and envisaged an increase in the area under forestry to 17% by 2030.
A review of this strategic plan for forestry (Peter Bacon & Associates, 2004) recommended that a national planting target of 20,000 ha per year was critical to secure a sustainable timber processing sector in Ireland. However, despite the presence of considerable finan-cial support to incentivize landowners to plant forests, the rate of afforestation is currently significantly behind these national targets and uptake rates lag far behind what would be expected from an analysis of economic returns (Behan, 2002). Figure 1 shows a decline from over 14,000 ha per year in 2000 to 6,600 ha in 2011. This is a cause of concern to both policy makers and to the forest sector in general.
Literature Review
Analysing the afforestion subsidy program on private lands in Denmark, Madsen (2003) emphasizes that indi-vidual farms should be considered as rational economic units in the implementation of subsidy programs rather than formulating a subsidy program across all farms. The study found that not all farmers act rationally and that farmers take a wide range of factors into account in decision making. Malone (2008), in the report for the Minister of State with responsibility for Forestry,
Economic and Behavioural Factors Motivating Private Afforestation Decisions in IrelandHerath Vidyaratne1, Mary Ryan2, Stephen O Neill1, Nuala Ni Fhlatharta2,
and Srinivas Raghavendra1
1 National University of Ireland, Galway, Ireland. [email protected]; [email protected]; [email protected] Teagasc, Agriculture and Food Development Authority, Athenry, Co Galway, Ireland. [email protected]; [email protected]: Afforestation, planting decision, farmer behaviour, irreversibility
Abstract
The role of forests in providing timber, sequestering carbon, enhancing the environment and facilitating recre-ational activity is well recognized. Forestry is also recognized for supporting economic development in rural areas. In Ireland, however, the rate of planting in Ireland lags far behind levels that would be expected from a compar-ison of the returns from farm forestry with competing agricultural alternatives. A comprehensive survey of farmers and forest owners in Ireland was undertaken with the aim of better understanding farmers’ behaviour in relation to (a) the decision to enter into forestry and (b) how much land is planted. The evidence presented suggests that farmers consider a broad range of factors other than financial return when making the decision to afforest land. We conclude that the design of policies aimed at encouraging greater rates of private afforestation needs to be guided by a better understanding of both the economic and behavioural factors that influence the decision.
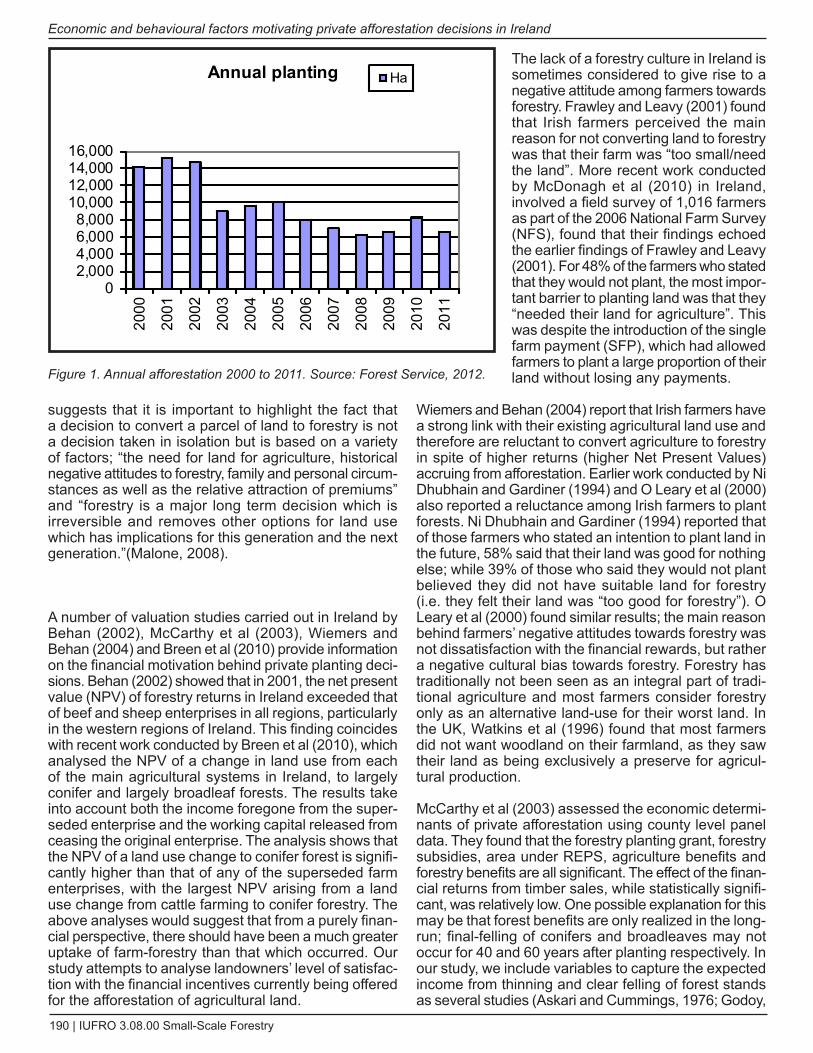
190 | IUFRO 3.08.00 Small-Scale Forestry
Economic and behavioural factors motivating private afforestation decisions in Ireland
suggests that it is important to highlight the fact that a decision to convert a parcel of land to forestry is not a decision taken in isolation but is based on a variety of factors; “the need for land for agriculture, historical negative attitudes to forestry, family and personal circum-stances as well as the relative attraction of premiums” and “forestry is a major long term decision which is irreversible and removes other options for land use which has implications for this generation and the next generation.”(Malone, 2008).
A number of valuation studies carried out in Ireland by Behan (2002), McCarthy et al (2003), Wiemers and Behan (2004) and Breen et al (2010) provide information on the financial motivation behind private planting deci-sions. Behan (2002) showed that in 2001, the net present value (NPV) of forestry returns in Ireland exceeded that of beef and sheep enterprises in all regions, particularly in the western regions of Ireland. This finding coincides with recent work conducted by Breen et al (2010), which analysed the NPV of a change in land use from each of the main agricultural systems in Ireland, to largely conifer and largely broadleaf forests. The results take into account both the income foregone from the super-seded enterprise and the working capital released from ceasing the original enterprise. The analysis shows that the NPV of a land use change to conifer forest is signifi-cantly higher than that of any of the superseded farm enterprises, with the largest NPV arising from a land use change from cattle farming to conifer forestry. The above analyses would suggest that from a purely finan-cial perspective, there should have been a much greater uptake of farm-forestry than that which occurred. Our study attempts to analyse landowners’ level of satisfac-tion with the financial incentives currently being offered for the afforestation of agricultural land.
The lack of a forestry culture in Ireland is sometimes considered to give rise to a negative attitude among farmers towards forestry. Frawley and Leavy (2001) found that Irish farmers perceived the main reason for not converting land to forestry was that their farm was “too small/need the land”. More recent work conducted by McDonagh et al (2010) in Ireland, involved a field survey of 1,016 farmers as part of the 2006 National Farm Survey (NFS), found that their findings echoed the earlier findings of Frawley and Leavy (2001). For 48% of the farmers who stated that they would not plant, the most impor-tant barrier to planting land was that they “needed their land for agriculture”. This was despite the introduction of the single farm payment (SFP), which had allowed farmers to plant a large proportion of their land without losing any payments.
Wiemers and Behan (2004) report that Irish farmers have a strong link with their existing agricultural land use and therefore are reluctant to convert agriculture to forestry in spite of higher returns (higher Net Present Values) accruing from afforestation. Earlier work conducted by Ni Dhubhain and Gardiner (1994) and O Leary et al (2000) also reported a reluctance among Irish farmers to plant forests. Ni Dhubhain and Gardiner (1994) reported that of those farmers who stated an intention to plant land in the future, 58% said that their land was good for nothing else; while 39% of those who said they would not plant believed they did not have suitable land for forestry (i.e. they felt their land was “too good for forestry”). O Leary et al (2000) found similar results; the main reason behind farmers’ negative attitudes towards forestry was not dissatisfaction with the financial rewards, but rather a negative cultural bias towards forestry. Forestry has traditionally not been seen as an integral part of tradi-tional agriculture and most farmers consider forestry only as an alternative land-use for their worst land. In the UK, Watkins et al (1996) found that most farmers did not want woodland on their farmland, as they saw their land as being exclusively a preserve for agricul-tural production.
McCarthy et al (2003) assessed the economic determi-nants of private afforestation using county level panel data. They found that the forestry planting grant, forestry subsidies, area under REPS, agriculture benefits and forestry benefits are all significant. The effect of the finan-cial returns from timber sales, while statistically signifi-cant, was relatively low. One possible explanation for this may be that forest benefits are only realized in the long-run; final-felling of conifers and broadleaves may not occur for 40 and 60 years after planting respectively. In our study, we include variables to capture the expected income from thinning and clear felling of forest stands as several studies (Askari and Cummings, 1976; Godoy,
Figure 1. Annual afforestation 2000 to 2011. Source: Forest Service, 2012.
02,0004,0006,0008,000
10,00012,00014,00016,000
2000
2001
2002
2003
2004
2005
2006
2007
2008
2009
2010
2011
Annual planting Ha
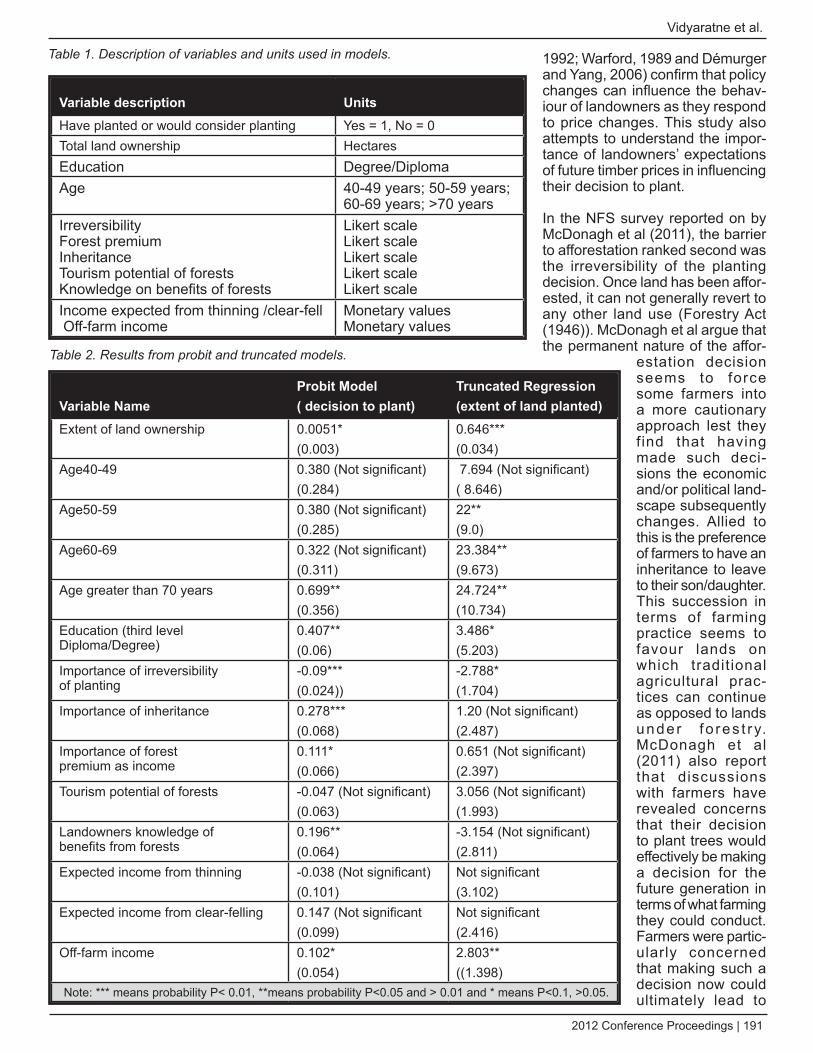
2012 Conference Proceedings | 191
Vidyaratne et al.
1992; Warford, 1989 and Démurger and Yang, 2006) confirm that policy changes can influence the behav-iour of landowners as they respond to price changes. This study also attempts to understand the impor-tance of landowners’ expectations of future timber prices in influencing their decision to plant.
In the NFS survey reported on by McDonagh et al (2011), the barrier to afforestation ranked second was the irreversibility of the planting decision. Once land has been affor-ested, it can not generally revert to any other land use (Forestry Act (1946)). McDonagh et al argue that the permanent nature of the affor-
estation decision seems to force some farmers into a more cautionary approach lest they find that having made such deci-sions the economic and/or political land-scape subsequently changes. Allied to this is the preference of farmers to have an inheritance to leave to their son/daughter. This succession in terms of farming practice seems to favour lands on which traditional agricultural prac-tices can continue as opposed to lands under fo res t ry. McDonagh et al (2011) also report that discussions with farmers have revealed concerns that their decision to plant trees would effectively be making a decision for the future generation in terms of what farming they could conduct. Farmers were partic-ularly concerned that making such a decision now could ultimately lead to
Table 1. description of variables and units used in models.
Variable description UnitsHave planted or would consider planting Yes = 1, No = 0Total land ownership HectaresEducation Degree/DiplomaAge 40-49 years; 50-59 years;
60-69 years; >70 yearsIrreversibilityForest premiumInheritanceTourism potential of forestsKnowledge on benefits of forests
Likert scaleLikert scaleLikert scaleLikert scaleLikert scale
Income expected from thinning /clear-fell Off-farm income
Monetary valuesMonetary values
Variable NameProbit Model( decision to plant)
Truncated Regression(extent of land planted)
Extent of land ownership 0.0051*(0.003)
0.646***(0.034)
Age40-49 0.380 (Not significant)(0.284)
7.694 (Not significant)( 8.646)
Age50-59 0.380 (Not significant)(0.285)
22**(9.0)
Age60-69 0.322 (Not significant)(0.311)
23.384**(9.673)
Age greater than 70 years 0.699**(0.356)
24.724**(10.734)
Education (third level Diploma/Degree)
0.407**(0.06)
3.486*(5.203)
Importance of irreversibility of planting
-0.09***(0.024))
-2.788*(1.704)
Importance of inheritance 0.278***(0.068)
1.20 (Not significant)(2.487)
Importance of forest premium as income
0.111*(0.066)
0.651 (Not significant)(2.397)
Tourism potential of forests -0.047 (Not significant)(0.063)
3.056 (Not significant)(1.993)
Landowners knowledge of benefits from forests
0.196**(0.064)
-3.154 (Not significant)(2.811)
Expected income from thinning -0.038 (Not significant)(0.101)
Not significant(3.102)
Expected income from clear-felling 0.147 (Not significant(0.099)
Not significant(2.416)
Off-farm income 0.102*(0.054)
2.803**((1.398)
Note: *** means probability P< 0.01, **means probability P<0.05 and > 0.01 and * means P<0.1, >0.05.
Table 2. Results from probit and truncated models.
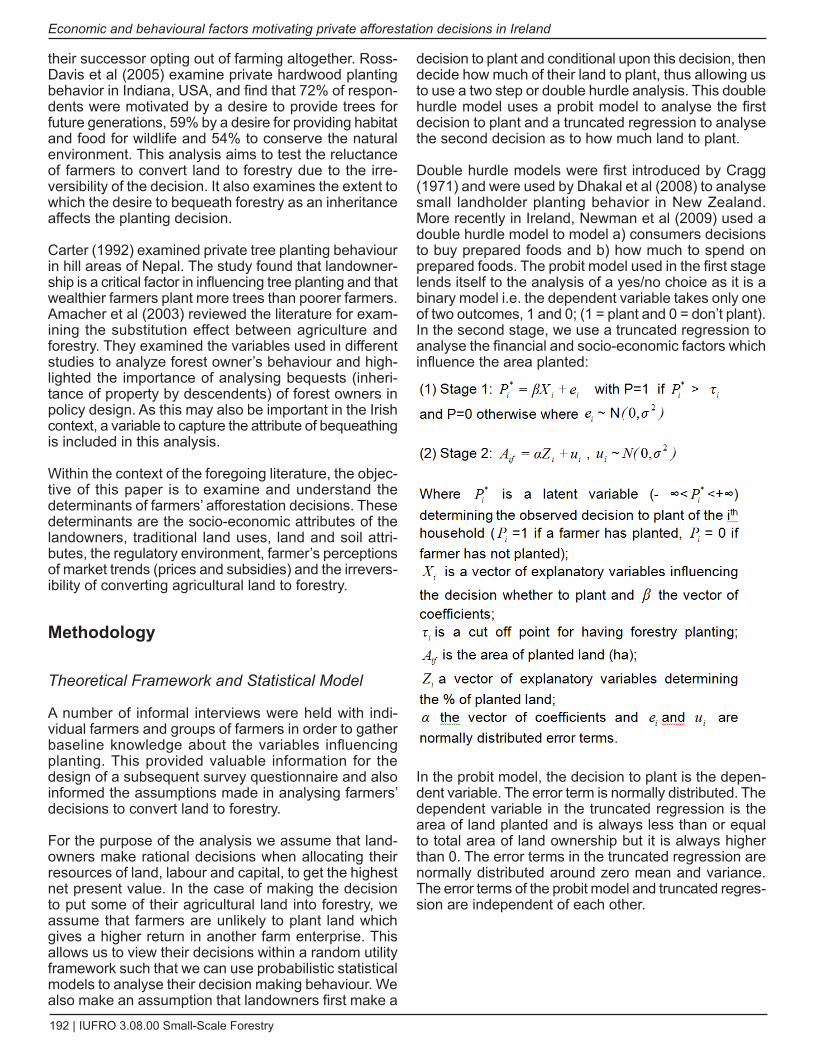
192 | IUFRO 3.08.00 Small-Scale Forestry
Economic and behavioural factors motivating private afforestation decisions in Ireland
their successor opting out of farming altogether. Ross-Davis et al (2005) examine private hardwood planting behavior in Indiana, USA, and find that 72% of respon-dents were motivated by a desire to provide trees for future generations, 59% by a desire for providing habitat and food for wildlife and 54% to conserve the natural environment. This analysis aims to test the reluctance of farmers to convert land to forestry due to the irre-versibility of the decision. It also examines the extent to which the desire to bequeath forestry as an inheritance affects the planting decision.
Carter (1992) examined private tree planting behaviour in hill areas of Nepal. The study found that landowner-ship is a critical factor in influencing tree planting and that wealthier farmers plant more trees than poorer farmers. Amacher et al (2003) reviewed the literature for exam-ining the substitution effect between agriculture and forestry. They examined the variables used in different studies to analyze forest owner’s behaviour and high-lighted the importance of analysing bequests (inheri-tance of property by descendents) of forest owners in policy design. As this may also be important in the Irish context, a variable to capture the attribute of bequeathing is included in this analysis.
Within the context of the foregoing literature, the objec-tive of this paper is to examine and understand the determinants of farmers’ afforestation decisions. These determinants are the socio-economic attributes of the landowners, traditional land uses, land and soil attri-butes, the regulatory environment, farmer’s perceptions of market trends (prices and subsidies) and the irrevers-ibility of converting agricultural land to forestry.
Methodology
Theoretical Framework and Statistical Model
A number of informal interviews were held with indi-vidual farmers and groups of farmers in order to gather baseline knowledge about the variables influencing planting. This provided valuable information for the design of a subsequent survey questionnaire and also informed the assumptions made in analysing farmers’ decisions to convert land to forestry.
For the purpose of the analysis we assume that land-owners make rational decisions when allocating their resources of land, labour and capital, to get the highest net present value. In the case of making the decision to put some of their agricultural land into forestry, we assume that farmers are unlikely to plant land which gives a higher return in another farm enterprise. This allows us to view their decisions within a random utility framework such that we can use probabilistic statistical models to analyse their decision making behaviour. We also make an assumption that landowners first make a
decision to plant and conditional upon this decision, then decide how much of their land to plant, thus allowing us to use a two step or double hurdle analysis. This double hurdle model uses a probit model to analyse the first decision to plant and a truncated regression to analyse the second decision as to how much land to plant.
Double hurdle models were first introduced by Cragg (1971) and were used by Dhakal et al (2008) to analyse small landholder planting behavior in New Zealand. More recently in Ireland, Newman et al (2009) used a double hurdle model to model a) consumers decisions to buy prepared foods and b) how much to spend on prepared foods. The probit model used in the first stage lends itself to the analysis of a yes/no choice as it is a binary model i.e. the dependent variable takes only one of two outcomes, 1 and 0; (1 = plant and 0 = don’t plant). In the second stage, we use a truncated regression to analyse the financial and socio-economic factors which influence the area planted:
In the probit model, the decision to plant is the depen-dent variable. The error term is normally distributed. The dependent variable in the truncated regression is the area of land planted and is always less than or equal to total area of land ownership but it is always higher than 0. The error terms in the truncated regression are normally distributed around zero mean and variance. The error terms of the probit model and truncated regres-sion are independent of each other.
2012 Conference Proceedings | 193
Vidyaratne et al.
data Collection and Analysis
A postal survey of a) farmers in general and b) forest owners was carried out during March and April of 2010. The survey sample for farmers was drawn from an agri-cultural advisory database for counties Galway, Clare, Kilkenny, and West Cork. From our discussions with farmers, we believe these four counties represent climatic conditions, soil fertility and farming systems in areas where the planting of forests is more likely. These farmers may or may not already have forests. Two hundred farmers were selected (every 10th name on county database) from each county giving a total of 800 farmers.
From the Forest Service database of forest owners, 800 forest owners were randomly selected countrywide. We received 225 responses from farmers in general and 250 responses from forest owners, giving an overall response rate of 29% (475/1600*100). However, some questionnaires lacked information on key variables and hence were excluded from the analysis, leaving a total of 345 questionnaires that were analysed.
The questionnaire was divided into two parts. Section one was to be completed by all farmers irrespective of whether they had forestry or not and included land use information such as the extent of the farm, soil types and attitudinal questions regarding the various benefits of forests as well as the irreversibility of conver-sion to forest, and inheritance (bequeathing) concerns. This section also included questions on the reasons for planting; factors limiting planting, measures of forest premium and timber price uncertainty, as well as socio-economic variables. Only forest owners were requested to answer section two which included forestry related questions such as the extent of forest cover and species, age and soil type of afforested land, along with ques-tions regarding respondents’ access to information and expectations of the benefit streams from forestry.
In analysing the data, the total extent of land owned was used as a variable to test the hypothesis that the greater the extent of land owned, the higher the proba-bility of planting some land. Dhakal (2008) found positive effects from the extent of land ownership and off-farm income in relation to the planting decision. Off-farm income was included as a variable in the probit model and the model tested whether the age level of the main decision maker of the household affects the decision to plant and whether landowners with a higher education level are more likely to plant. The model also examined the effect of the irreversibility of conversion to forestry on the decision to plant and on the area planted.
An average forest premium of €430 is paid annually to farmers who plant land as a compensation for loss of agricultural income (Breen et al, 2010). We also included a variable to capture the importance of the level of the forest premium payment to farmers. Farmers’ expecta-
tions of the future value of timber are likely to affect the planting decision, so incomes from thinning and clear felling were included in the model. The expected poten-tial income generation from the use of forests for tourism was also included in the analysis. Summary statistics of the explanatory variables are included in Table 1.
Results and Discussion
The results of both models are presented in Table 2.
The variable representing extent of land is very signifi-cant in both models. This concurs with previous analysis by Ryan et al (2008) who found that farmers who have more land are a) more likely to plant and b) likely to plant more land. The behaviour of age groups is surprising and interesting because only the age group ‘greater than 70 years’ is significant indicating that older land-owners are more likely to have forests and are also more likely to plant larger areas. Education does play a role in decision making to plant and deciding the extent of land to plant, however our analysis shows that only third level education (diploma/degree) is significant.
As expected, irreversibility is a highly significant negative influence on the decision to plant as well as in deciding the extent of planting. The inheritance variable is only significant in the probit model, which means inheritance affects the decision to plant but not the extent of area planted. It could be the case that even small areas of forestry are enough to satisfy the farmer’s desire to leave a forestry inheritance. Landowners’ knowledge of various benefits (monetary and non-monetary) of forestry plays a large role in influencing the decision whether to plant, whereas it does not significantly influ-ence the area to be planted. However, the potential use of forest for tourism for generating some income is not significant. During interviews, landowners were afraid of an increased risk of fire if visitors enter the forest.
The satisfaction of landowners with the level of the forest premium payment has a positive and statistically signifi-cant effect on the decision to plant, but it is not statis-tically significant in deciding how much to plant. In the questionnaire, many forest owners recorded that they planted land to increase the income from their marginal land. It is noteworthy that McCarthy et al (2003) consider the effect of the reducing stock of available marginal land for planting in accounting for the declining rate of afforestation since 1995 in spite of generous premiums and grants.
Off-farm income is positively significant in deciding to plant and deciding how much to plant. Dhakal et al (2008) also found that off-farm income, and expected future timber values have a positive effect on the planting decision. However, the expected incomes from thinning and clear felling are insignificant in this analysis, largely as a result of lack of knowledge. Out of the 345 ques-
194 | IUFRO 3.08.00 Small-Scale Forestry
Economic and behavioural factors motivating private afforestation decisions in Ireland
tionnaires analysed, 185 landowners (52%) answered that they don’t know the value of thinnings. Expected clear-felling income is also insignificant, (63% responded that they didn’t know the expected value of the forest at clear-fell). In their 2003 study, McCarthy et al also found that the effect of financial return from selling timber was significant but only at a low level. This finding has also been recorded in other countries. In a study carried out by Démurger and Yang (2006), profit seeking behavior in making the decision to plant in China was found to be vague in comparison to profit seeking behaviour in making agricultural decisions. Godoy (1992) observed a similar phenomenon; while timber prices played a role in the decision to plant, they were insufficient to induce landowners to undertake planting on a commer-cial scale.
Conclusion
To date a number of studies have examined planting behaviour in Ireland. This paper fills a gap in the liter-ature by considering how key determinants contribute to the dual decisions to plant and to what extent. We included a large number of variables in both the probit and truncated regression models to capture the direc-tion and effect of significant variables influencing the decision to plant and the area of land to be planted.
Surprisingly, while the landowner’s satisfaction around the level of the forest premium payment is significant in positively influencing the decision to plant, the degree of significance is relatively small, indicating that this may not be the most influential variable in the decision making process. Off-farm income is significant in both models, indicating that landowners with off-farm income are more likely to plant.
The other financial variables analysed were the expected incomes from both thinning and clear-felling. Surpris-ingly, the analysis shows both of these to be insignifi-cant which indicates that the long-term value of the timber is not an influencing factor in the decision making process. The effect of landowners’ knowledge of the benefits of forestry also plays a large role in influencing the decision whether to plant, whereas it does not signif-icantly influence the area to be planted. Both of these factors perhaps reflect the lack of a forestry tradition in Ireland and would suggest that forestry advisory and education programmes could have a positive impact on the afforestation decision.
It is perhaps surprising that only the age group greater than 70 years is significant in affecting the decision to plant, indicating that older farmers are more likely to have a forest. It may be the case that older landowners can no longer work their land and are therefore more likely to have planted. Inheritance affects the decision to plant but not the extent of area to be planted. Third level education and off farm income are significant in
both models, while surprisingly all other income vari-ables are insignificant in both the probit and the trun-cated regression models. The only variable analysed which is negatively associated with planting more land is irreversibility.
We found that irreversibility, forest premium, inheri-tance, age, education and land-owners knowledge of forest benefits are critical variables in the afforestation decision-making process. The long-term timber values are not sensitive variables. This analysis clarifies that there is a wide range of influencing factors (behavioural as well as economic) in the decision making process involved in converting land from agriculture to forestry. These factors need to be taken into account in formu-lating policy to incentivise the continued afforestation of agricultural land in Ireland.
References
Amacher, G.S.M., Conway, C., and Sullivan, J. (2003), “Economic analysis of non-industrial forest landowners: Is there anything left to study?”, Journal of Forest Economics, 9, 137-164.
Askari, H. and Cummings, T.J. (1976), “Agricultural Supply Response Survey of Econometric Evidence”, New York: Praeger.
Bacon P. & Associates (2004), “A Review and Appraisal of Ireland’s Forestry Development Strategy”’ Published by Stationary Office, Dublin.
Behan, J. (2002). Returns from Farm Forestry vs Other Farm Enterprises. Paper presented at IFA Farm Forestry Confer-ence, 8 November, Limerick, Ireland.
Breen, J., Clancy, d., Ryan, M. and Wallace, M. (2010). Irish Land Use Change and the decision to Afforest: An Economic Analysis. Irish Forestry 67: 6-20.
Carter, E.J., (1992), “Tree cultivation on Private Lands in the middle of Nepal: Lessons from Dolaka District”, Mountain Research and development, vol.12, No.3 pp.241-255.
Cragg J.G.,(1971), “Some Statistical Models for Limited dependent Variables with Applications to the demand for Durable Goods”, Econometrica, 39, 829-844.
Dhakal, B., Bigsby, H., and Cullent, R.(2008), “Determinants of Forestry investment and extent of forestry expansions by smallholders in New Zealand”, Review of Applied Economic, Vol. 4, No.1-2 (January-december), 65-76.
dAFF (department of Agriculture, Food and Forestry) (1996), “Growing for the Future: Strategic Plan for the Develop-ment of the Forestry Sector in Ireland”, Stationery Office, dublin
Démurger, S. and Yang. W., (2006), “Economic changes and afforestation incentives in rural China”, Environment and development Economics, 11, 629-649.
2012 Conference Proceedings | 195
Vidyaratne et al.
Forest Service (2012) Annual Statistics. department of Agri-culture Food and Marine.
Godoy, R.A.(1992),”Determinants of smallholder Commercial Tree Cultivation”, World Development, l20(55), 713-725.
Forestry Act (1946) Office of the Irish Attorney General (1946) Irish Statute Book http://www.irishstatutebook.ie/1946/en/act/pub/0013/sec0041.html
Frawley, J. and Leavy, A. (2001). Farm forestry: land avail-ability, take-up rates and economics, Project report No. 4256, RERC, Teagasc
Kearney, B. (2001). A Review of Relevant Studies Concerning Farm Forestry Trends and Farmers’ Attitudes to Forestry. COFORd and the National Council for Forest Research and development, dublin.
Madsen, L, M., (2003). New woodlands in denmark: The role of Private Landowners, Urban Forestry. 1, pp.185-195.
Malone, J. (2008). Factors affecting afforestation in Ireland in recent years. Report for the Minister of state with respon-sibility for forestry. Available at http://www.ifa.ie/linkClick.aspx?fileticket=N5243ioVRio%3D&tabid=615
McCarthy, S, Alan Matthews and Brendan Riordan (2003), “Economic Determinants of private afforestation in the Republic of Ireland”, Land Use policy, 20, 51-59.
Mcdonagh, J., Farrell, M., Ryan, M. and Mahon, M. (2010). Missed opportunity or
cautionary steps? Farmers, Forestry and Rural development in Ireland. European Countryside. 4. 2010. p 236-251
Newman, C., Henchion, M. and Keelan, C. (2009) A double-Hurdle Model of Irish Household’s Foodservice Expenditure Patterns.’ Journal of International Food and Agribusiness Management 21(4) (2009) pp. 269-285
Ni dhubhain, A. & Gardiner, J.(1994). Farmers attitudes to forestry. Irish Forestry 51:19-26.
O’Leary, T.N., McCormack, A.G. and Clinch, J.P. (2000), “Afforestation in Ireland –regional differences in attitude”, Land Use Policy, 17, 39-48.
Ross-davis, A. L, Shorna R.Brousard, douglas F.Jacobs, and Anthony S.Davis (2005),” Afforestation Motivations of Private Landowners: An Examination of Hardwood Tree Planting in Indiana”, Northern Journal of Applied Forestry, 22 (3).
Ryan, M., Kinsella, A. and Cushion, M. (2008). An assessment of farmer intentions to plant a forest. Agricultural Research Forum. Teagasc.
Warford, J.J (1989),”Economic incentives for sustainable production”, in G. Schramm and J.J.Warford, eds., Envi-ronment Management and Economic development, Wash-ington, dC:The World Bank.
Watkins, C., Williams, d. and Lloyd, T. (1996). Constraints on farm wood-land planting in England: a study of Notting-hamshire farmers. Forestry 2: 167-176.
Wiemers, E. and Behan, J. (2004), Farm Forestry Investment in Ireland under Uncertainty, The Economic and Social Review, .35(3), 305-320.
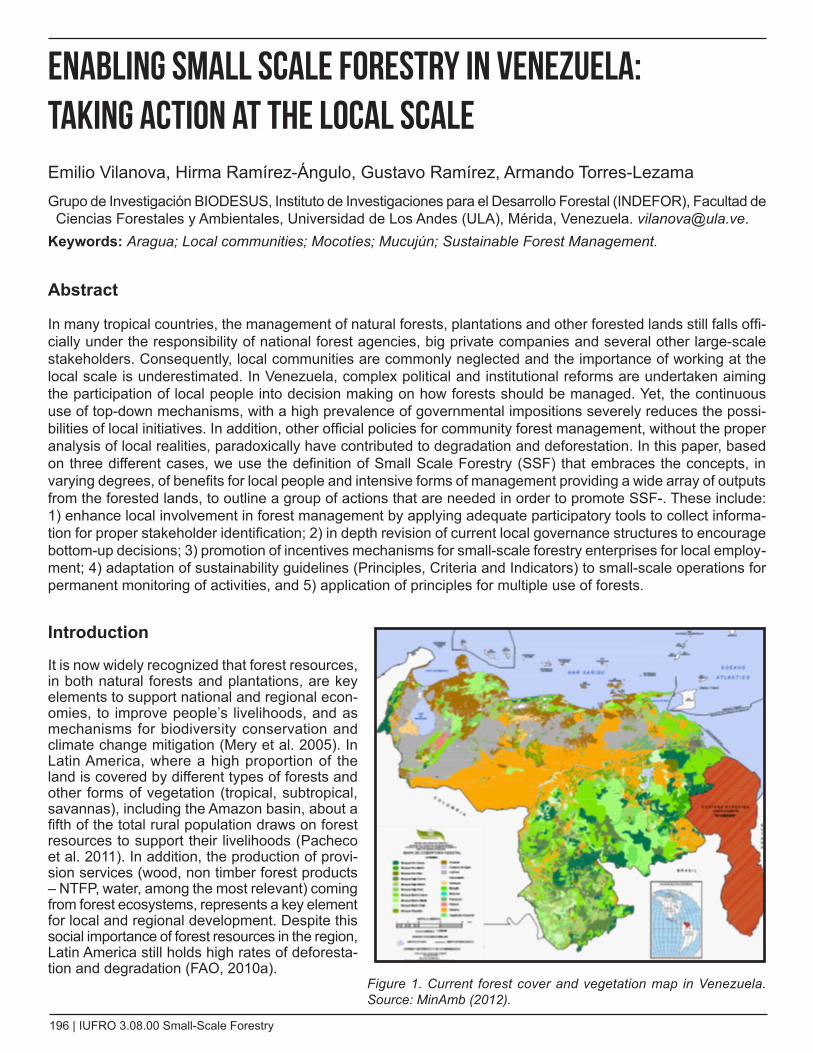
196 | IUFRO 3.08.00 Small-Scale Forestry
Introduction
It is now widely recognized that forest resources, in both natural forests and plantations, are key elements to support national and regional econ-omies, to improve people’s livelihoods, and as mechanisms for biodiversity conservation and climate change mitigation (Mery et al. 2005). In Latin America, where a high proportion of the land is covered by different types of forests and other forms of vegetation (tropical, subtropical, savannas), including the Amazon basin, about a fifth of the total rural population draws on forest resources to support their livelihoods (Pacheco et al. 2011). In addition, the production of provi-sion services (wood, non timber forest products – NTFP, water, among the most relevant) coming from forest ecosystems, represents a key element for local and regional development. Despite this social importance of forest resources in the region, Latin America still holds high rates of deforesta-tion and degradation (FAO, 2010a).
Figure 1. Current forest cover and vegetation map in Venezuela. Source: MinAmb (2012).
Enabling Small Scale Forestry in Venezuela: Taking Action At the local ScaleEmilio Vilanova, Hirma Ramírez-Ángulo, Gustavo Ramírez, Armando Torres-LezamaGrupo de Investigación BIODESUS, Instituto de Investigaciones para el Desarrollo Forestal (INDEFOR), Facultad de Ciencias Forestales y Ambientales, Universidad de Los Andes (ULA), Mérida, Venezuela. [email protected].
Keywords: Aragua; Local communities; Mocotíes; Mucujún; Sustainable Forest Management.
Abstract
In many tropical countries, the management of natural forests, plantations and other forested lands still falls offi-cially under the responsibility of national forest agencies, big private companies and several other large-scale stakeholders. Consequently, local communities are commonly neglected and the importance of working at the local scale is underestimated. In Venezuela, complex political and institutional reforms are undertaken aiming the participation of local people into decision making on how forests should be managed. Yet, the continuous use of top-down mechanisms, with a high prevalence of governmental impositions severely reduces the possi-bilities of local initiatives. In addition, other official policies for community forest management, without the proper analysis of local realities, paradoxically have contributed to degradation and deforestation. In this paper, based on three different cases, we use the definition of Small Scale Forestry (SSF) that embraces the concepts, in varying degrees, of benefits for local people and intensive forms of management providing a wide array of outputs from the forested lands, to outline a group of actions that are needed in order to promote SSF-. These include: 1) enhance local involvement in forest management by applying adequate participatory tools to collect informa-tion for proper stakeholder identification; 2) in depth revision of current local governance structures to encourage bottom-up decisions; 3) promotion of incentives mechanisms for small-scale forestry enterprises for local employ-ment; 4) adaptation of sustainability guidelines (Principles, Criteria and Indicators) to small-scale operations for permanent monitoring of activities, and 5) application of principles for multiple use of forests.
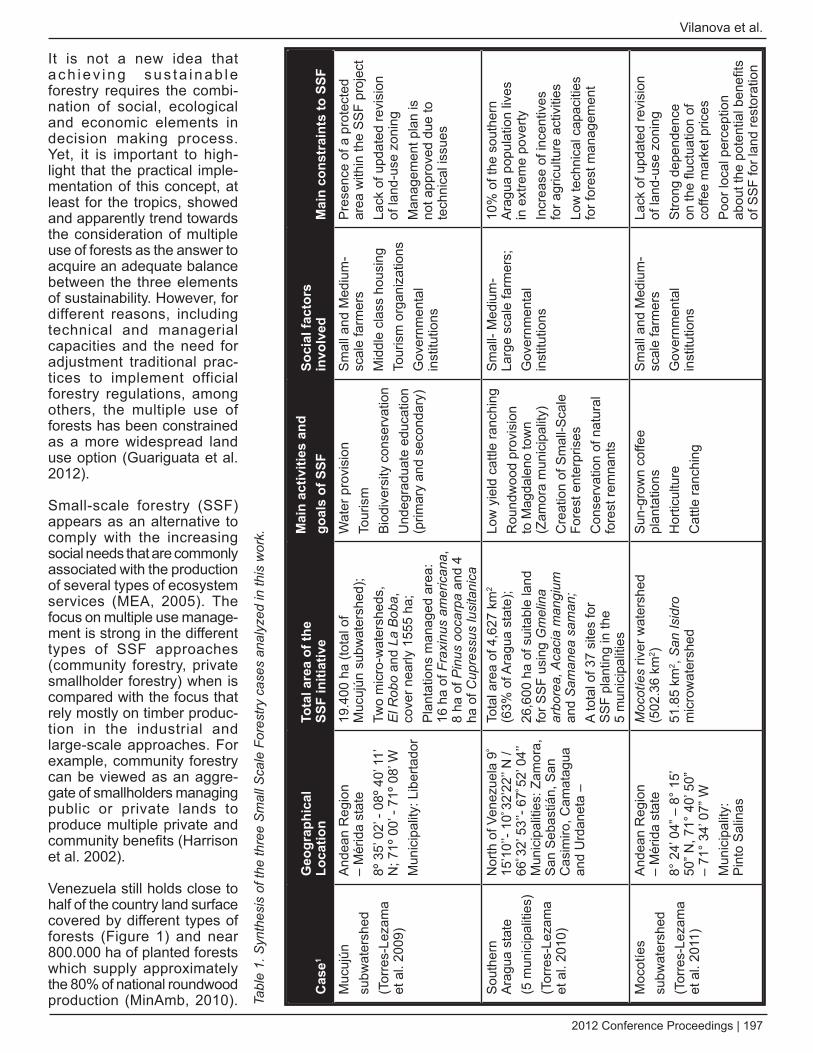
2012 Conference Proceedings | 197
Vilanova et al.
It is not a new idea that ach iev ing sus ta inab le forestry requires the combi-nation of social, ecological and economic elements in decision making process. Yet, it is important to high-light that the practical imple-mentation of this concept, at least for the tropics, showed and apparently trend towards the consideration of multiple use of forests as the answer to acquire an adequate balance between the three elements of sustainability. However, for different reasons, including technical and managerial capacities and the need for adjustment traditional prac-tices to implement official forestry regulations, among others, the multiple use of forests has been constrained as a more widespread land use option (Guariguata et al. 2012).
Small-scale forestry (SSF) appears as an alternative to comply with the increasing social needs that are commonly associated with the production of several types of ecosystem services (MEA, 2005). The focus on multiple use manage-ment is strong in the different types of SSF approaches (community forestry, private smallholder forestry) when is compared with the focus that rely mostly on timber produc-tion in the industrial and large-scale approaches. For example, community forestry can be viewed as an aggre-gate of smallholders managing public or private lands to produce multiple private and community benefits (Harrison et al. 2002).
Venezuela still holds close to half of the country land surface covered by different types of forests (Figure 1) and near 800.000 ha of planted forests which supply approximately the 80% of national roundwood production (MinAmb, 2010). Ta
ble
1. S
ynth
esis
of t
he th
ree
Sm
all S
cale
For
estry
cas
es a
naly
zed
in th
is w
ork.
Cas
e1G
eogr
aphi
cal
Loca
tion
Tota
l are
a of
the
SSF
initi
ativ
eM
ain
activ
ities
and
go
als
of S
SF
Soci
al fa
ctor
s in
volv
edM
ain
cons
trai
nts
to S
SFM
ucuj
únsu
bwat
ersh
ed(T
orre
s-Le
zam
a et
al.
2009
)
And
ean
Reg
ion
– M
érid
a st
ate
8º 3
5’ 0
2’ -
08º 4
0’ 1
1’
N; 7
1º 0
0’ -
71º 0
8’ W
Mun
icip
ality
: Lib
erta
dor
19.4
00 h
a (to
tal o
f M
ucuj
ún s
ubw
ater
shed
);Tw
o m
icro
-wat
ersh
eds,
E
l Rob
o an
d La
Bob
a,
cove
r nea
rly 1
555
ha;
Pla
ntat
ions
man
aged
are
a:
16 h
a of
Fra
xinu
s am
eric
ana,
8
ha o
f Pin
us o
ocar
pa a
nd 4
ha
of C
upre
ssus
lusi
tani
ca
Wat
er p
rovi
sion
Tour
ism
Bio
dive
rsity
con
serv
atio
nU
ndeg
radu
ate
educ
atio
n (p
rimar
y an
d se
cond
ary)
Sm
all a
nd M
ediu
m-
scal
e fa
rmer
sM
iddl
e cl
ass
hous
ing
Tour
ism
org
aniz
atio
nsG
over
nmen
tal
inst
itutio
ns
Pre
senc
e of
a p
rote
cted
ar
ea w
ithin
the
SS
F pr
ojec
tLa
ck o
f upd
ated
revi
sion
of
land
-use
zon
ing
Man
agem
ent p
lan
is
not a
ppro
ved
due
to
tech
nica
l iss
ues
Sou
ther
n A
ragu
a st
ate
(5 m
unic
ipal
ities
)(T
orre
s-Le
zam
a et
al.
2010
)
Nor
th o
f Ven
ezue
la 9
º
15’1
0’’-
10º 3
2’22
’’ N
/ 66
º 32’
53’
’- 67
º 52’
04’
’ M
unic
ipal
ities
: Zam
ora,
S
an S
ebas
tián,
San
C
asim
iro, C
amat
agua
an
d U
rdan
eta
–
Tota
l are
a of
4,6
27 k
m2
(63%
of A
ragu
a st
ate)
;26
,600
ha
of s
uita
ble
land
fo
r SS
F us
ing
Gm
elin
a ar
bore
a, A
caci
a m
angi
um
and
Sam
anea
sam
an;
A to
tal o
f 37
site
s fo
r S
SF
plan
ting
in th
e 5
mun
icip
aliti
es
Low
yie
ld c
attle
ranc
hing
Rou
ndw
ood
prov
isio
n to
Mag
dale
no to
wn
(Zam
ora
mun
icip
ality
)C
reat
ion
of S
mal
l-Sca
le
Fore
st e
nter
pris
esC
onse
rvat
ion
of n
atur
al
fore
st re
mna
nts
Sm
all-
Med
ium
-La
rge
scal
e fa
rmer
s;G
over
nmen
tal
inst
itutio
ns
10%
of t
he s
outh
ern
Ara
gua
popu
latio
n liv
es
in e
xtre
me
pove
rtyIn
crea
se o
f inc
entiv
es
for a
gric
ultu
re a
ctiv
ities
Low
tech
nica
l cap
aciti
es
for f
ores
t man
agem
ent
Moc
otíe
ssu
bwat
ersh
ed(T
orre
s-Le
zam
a et
al.
2011
)
And
ean
Reg
ion
– M
érid
a st
ate
8° 2
4’ 0
4” –
8°
15’
50” N
, 71°
40’
50”
–
71°
34’ 0
7” W
Mun
icip
ality
: P
into
Sal
inas
Moc
otíe
s riv
er w
ater
shed
(5
02.3
6 km
2 )51
.85
km2 ,
San
Isid
ro
mic
row
ater
shed
Sun
-gro
wn
coffe
e pl
anta
tions
Hor
ticul
ture
Cat
tle ra
nchi
ng
Sm
all a
nd M
ediu
m-
scal
e fa
rmer
sG
over
nmen
tal
inst
itutio
ns
Lack
of u
pdat
ed re
visi
on
of la
nd-u
se z
onin
gS
trong
dep
ende
nce
on th
e flu
ctua
tion
of
coffe
e m
arke
t pric
esP
oor l
ocal
per
cept
ion
abou
t the
pot
entia
l ben
efits
of
SS
F fo
r lan
d re
stor
atio
n
198 | IUFRO 3.08.00 Small-Scale Forestry
Enabling Small Scale Forestry in Venezuela: Taking action at the local scale
After more than four decades of natural forest manage-ment in Venezuela, of the 16 million ha of production forests, a very low proportion of close to 3% of perma-nent production forests (PFF) are considered as being sustainably managed (ITTO, 2011a). In addition, a lack of updated management plans and adequate monitoring are also part of the current situation of forest manage-ment in the country. The few community-based efforts to incorporate local people into benefits management resulted in catastrophic ecological effects (cf. Lozada, 2007; Rojas-López, 2007), and there are currently no certified natural forests in Venezuela.
In this country, some informal examples of SSF are taking place with different degrees of development and constraints. This paper presents the main results of three contrasting cases that have been analyzed in detail before in Torres-Lezama et al. (2009, 2010, 2011) to contribute to the discussion about the importance of working at the local scale towards a more far-reaching participation of local stakeholders in forest manage-ment activities. First, we show the main characteris-tics of SSF cases, two located in the Andean region of the country (Torres-Lezama et al. 2009; 2011) and the third one located in the central area of Venezuela (Torres-Lezama et al. 2010). Secondly, a discussion is made regarding the local scale as the fundamental driver to enable SSF including elements of social participa-tion and governance. Finally, we aim to outline a set of learned lessons to move forward in the implementation of SSF options in Venezuelan forestry.
The Context of Small-Scale Forestry in Venezuela
Reliable data on Venezuela’s land and forest areas, their structures and forms of ownership are very scarce. For instance, a recent comparative analysis on forest tenure in the tropics (ITTO, 2011b), indicates that in 2002 close to 49.5 Mha of the country forests were adminis-trated in different ways by the central government and in 2008 this surface was estimated in 47.7 Mha and there is no data about other forms of forest tenure. In addition, in 2005, Venezuela’s legislature passed a new law ensuring the land and property rights of indigenous peoples and communities. One of the effects is that approximately 0.7 Mha has been titled to indigenous communities in agricultural areas throughout the country (Sunderlin et al. 2008). In the practice, governmental organizations are responsible for almost the 100% of the forested land in the country and the participation of other stakeholders is commonly implemented through forest concessions and other forms of permits for the use of a given area for harvesting of timber or other forest resources.
Small scale forestry appears to be an informal tool in many rural communities to gather forest products such as timber and NTFP mostly for subsistence purposes
in several areas of the Bolivar and Amazonas states in the southern part of the country (i.e. MinAmb, 2006; van Looy et al. 2008; Figueroa et al. 2010). In terms of formal implementation of SSF, there has been a remarkable increase in the productive use of Teak (Tectona grandis L.f) plantations in the last five years mostly located in small private lands of the western plains (MPPAT, 2010) which could fall into the category of local scale manage-ment. Reforestation as a conservation practice is also a possible example of SSF being implemented with the involvement of local communities since the launch in 2006 of a national program called “Misión Árbol”. However, the lack of accurate statistics hampers the analysis on how much the SSF approach is being used in Venezuela.
Methodological Approach
Between 2006 and 2009 we performed several field studies in three different parts of the country following SSF principles in order to comply with three goals:
To strengthen the process of forest management at • local scale in planted forests located in a micro-water-shed of the Andean region of Venezuela, a process which has been working in the practice as a way to have a sustainable use for wood production within a multiple use of land which combines agriculture, education and tourism activities (Torres-Lezama et al. 2009);
To promote the use of planted forests in small public • and private lands currently being used for low profit agriculture and cattle ranching, in order to assure wood availability to sustain traditional furniture and woodcraft production in the town of Magdaleno located in the northern-central area of Venezuela (Torres-Lezama et al. 2010);
To increase the use of trees in a severely degraded • watershed in a mountainous region of Mérida state in the Venezuelan Andes, aiming at the progressive incorporation of tree cover within coffee cultivation systems and to contribute to a restoration process in the landscape (Torres-Lezama et al. 2011).
A synthesis of each case is given in Table 1 and their geographical location is showed in Figure 2. In all cases, the collection of primary and secondary data for exam-ining biophysical and socio-economic conditions in each area led us to an overall characterization of the study sites. Furthermore, in terms of research approaches, all selected sites shared the assessment on social aspects to outline people´s behaviour and local perception of forestry elements such as degree of acceptance to work with SSF and awareness of environmental problems. Nevertheless, in this work, it is not our intention to give the details of each research, in which case can be found elsewhere (Torres-Lezama et al. 2009; 2010; 2011).
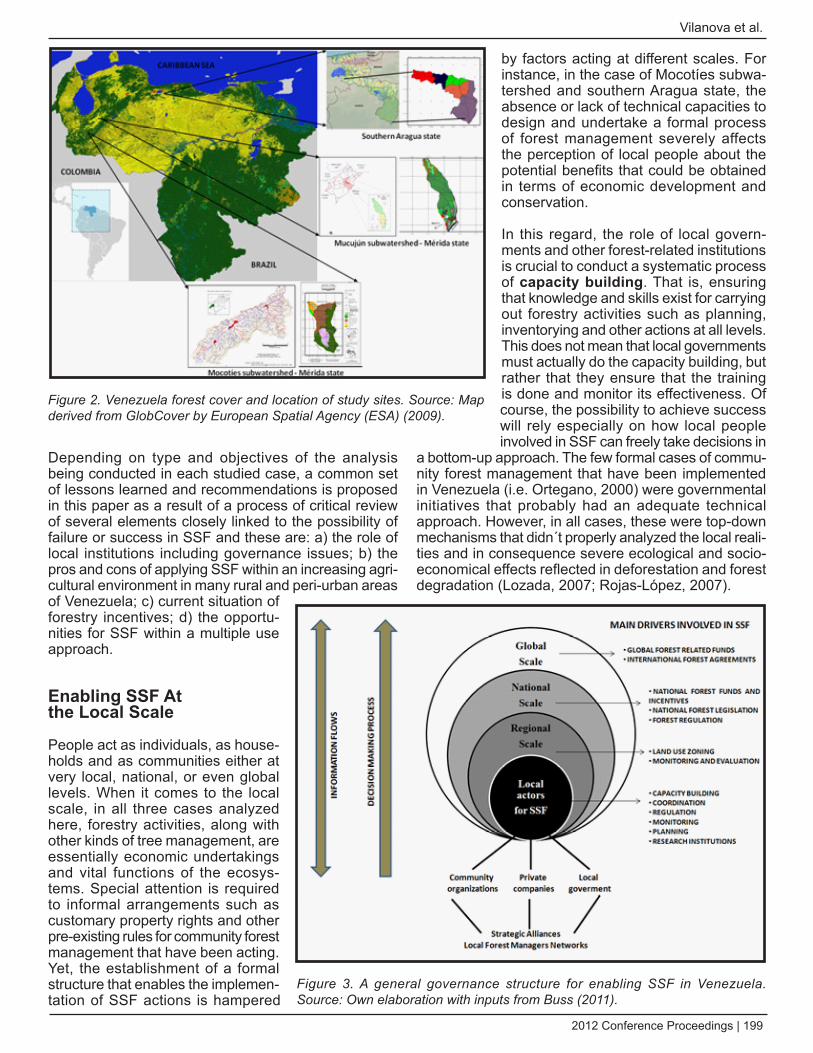
2012 Conference Proceedings | 199
Vilanova et al.
Depending on type and objectives of the analysis being conducted in each studied case, a common set of lessons learned and recommendations is proposed in this paper as a result of a process of critical review of several elements closely linked to the possibility of failure or success in SSF and these are: a) the role of local institutions including governance issues; b) the pros and cons of applying SSF within an increasing agri-cultural environment in many rural and peri-urban areas of Venezuela; c) current situation of forestry incentives; d) the opportu-nities for SSF within a multiple use approach.
Enabling SSF At the Local Scale
People act as individuals, as house-holds and as communities either at very local, national, or even global levels. When it comes to the local scale, in all three cases analyzed here, forestry activities, along with other kinds of tree management, are essentially economic undertakings and vital functions of the ecosys-tems. Special attention is required to informal arrangements such as customary property rights and other pre-existing rules for community forest management that have been acting. Yet, the establishment of a formal structure that enables the implemen-tation of SSF actions is hampered
by factors acting at different scales. For instance, in the case of Mocotíes subwa-tershed and southern Aragua state, the absence or lack of technical capacities to design and undertake a formal process of forest management severely affects the perception of local people about the potential benefits that could be obtained in terms of economic development and conservation.
In this regard, the role of local govern-ments and other forest-related institutions is crucial to conduct a systematic process of capacity building. That is, ensuring that knowledge and skills exist for carrying out forestry activities such as planning, inventorying and other actions at all levels. This does not mean that local governments must actually do the capacity building, but rather that they ensure that the training is done and monitor its effectiveness. Of course, the possibility to achieve success will rely especially on how local people involved in SSF can freely take decisions in
a bottom-up approach. The few formal cases of commu-nity forest management that have been implemented in Venezuela (i.e. Ortegano, 2000) were governmental initiatives that probably had an adequate technical approach. However, in all cases, these were top-down mechanisms that didn´t properly analyzed the local reali-ties and in consequence severe ecological and socio-economical effects reflected in deforestation and forest degradation (Lozada, 2007; Rojas-López, 2007).
Figure 2. Venezuela forest cover and location of study sites. Source: Map derived from GlobCover by European Spatial Agency (ESA) (2009).
Figure 3. A general governance structure for enabling SSF in Venezuela. Source: Own elaboration with inputs from Buss (2011).
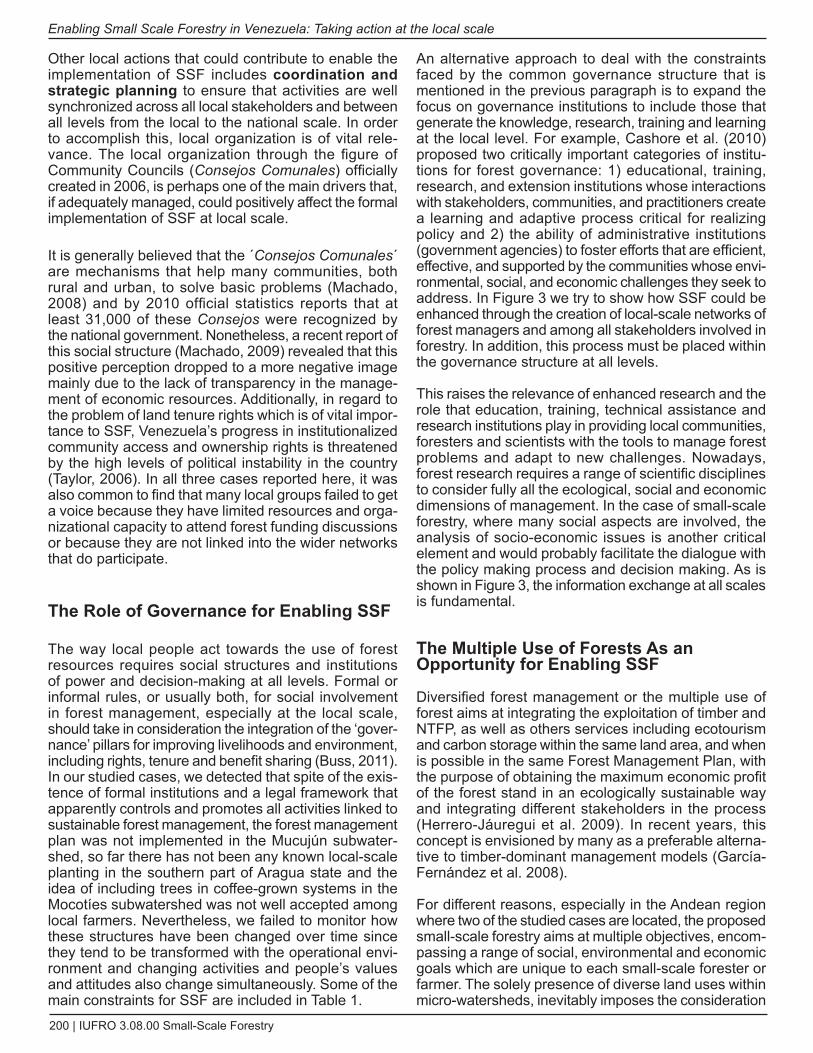
200 | IUFRO 3.08.00 Small-Scale Forestry
Enabling Small Scale Forestry in Venezuela: Taking action at the local scale
Other local actions that could contribute to enable the implementation of SSF includes coordination and strategic planning to ensure that activities are well synchronized across all local stakeholders and between all levels from the local to the national scale. In order to accomplish this, local organization is of vital rele-vance. The local organization through the figure of Community Councils (Consejos Comunales) officially created in 2006, is perhaps one of the main drivers that, if adequately managed, could positively affect the formal implementation of SSF at local scale.
It is generally believed that the ´Consejos Comunales´ are mechanisms that help many communities, both rural and urban, to solve basic problems (Machado, 2008) and by 2010 official statistics reports that at least 31,000 of these Consejos were recognized by the national government. Nonetheless, a recent report of this social structure (Machado, 2009) revealed that this positive perception dropped to a more negative image mainly due to the lack of transparency in the manage-ment of economic resources. Additionally, in regard to the problem of land tenure rights which is of vital impor-tance to SSF, Venezuela’s progress in institutionalized community access and ownership rights is threatened by the high levels of political instability in the country (Taylor, 2006). In all three cases reported here, it was also common to find that many local groups failed to get a voice because they have limited resources and orga-nizational capacity to attend forest funding discussions or because they are not linked into the wider networks that do participate.
The Role of Governance for Enabling SSF
The way local people act towards the use of forest resources requires social structures and institutions of power and decision-making at all levels. Formal or informal rules, or usually both, for social involvement in forest management, especially at the local scale, should take in consideration the integration of the ‘gover-nance’ pillars for improving livelihoods and environment, including rights, tenure and benefit sharing (Buss, 2011). In our studied cases, we detected that spite of the exis-tence of formal institutions and a legal framework that apparently controls and promotes all activities linked to sustainable forest management, the forest management plan was not implemented in the Mucujún subwater-shed, so far there has not been any known local-scale planting in the southern part of Aragua state and the idea of including trees in coffee-grown systems in the Mocotíes subwatershed was not well accepted among local farmers. Nevertheless, we failed to monitor how these structures have been changed over time since they tend to be transformed with the operational envi-ronment and changing activities and people’s values and attitudes also change simultaneously. Some of the main constraints for SSF are included in Table 1.
An alternative approach to deal with the constraints faced by the common governance structure that is mentioned in the previous paragraph is to expand the focus on governance institutions to include those that generate the knowledge, research, training and learning at the local level. For example, Cashore et al. (2010) proposed two critically important categories of institu-tions for forest governance: 1) educational, training, research, and extension institutions whose interactions with stakeholders, communities, and practitioners create a learning and adaptive process critical for realizing policy and 2) the ability of administrative institutions (government agencies) to foster efforts that are efficient, effective, and supported by the communities whose envi-ronmental, social, and economic challenges they seek to address. In Figure 3 we try to show how SSF could be enhanced through the creation of local-scale networks of forest managers and among all stakeholders involved in forestry. In addition, this process must be placed within the governance structure at all levels.
This raises the relevance of enhanced research and the role that education, training, technical assistance and research institutions play in providing local communities, foresters and scientists with the tools to manage forest problems and adapt to new challenges. Nowadays, forest research requires a range of scientific disciplines to consider fully all the ecological, social and economic dimensions of management. In the case of small-scale forestry, where many social aspects are involved, the analysis of socio-economic issues is another critical element and would probably facilitate the dialogue with the policy making process and decision making. As is shown in Figure 3, the information exchange at all scales is fundamental.
The Multiple Use of Forests As an Opportunity for Enabling SSF
Diversified forest management or the multiple use of forest aims at integrating the exploitation of timber and NTFP, as well as others services including ecotourism and carbon storage within the same land area, and when is possible in the same Forest Management Plan, with the purpose of obtaining the maximum economic profit of the forest stand in an ecologically sustainable way and integrating different stakeholders in the process (Herrero-Jáuregui et al. 2009). In recent years, this concept is envisioned by many as a preferable alterna-tive to timber-dominant management models (García-Fernández et al. 2008).
For different reasons, especially in the Andean region where two of the studied cases are located, the proposed small-scale forestry aims at multiple objectives, encom-passing a range of social, environmental and economic goals which are unique to each small-scale forester or farmer. The solely presence of diverse land uses within micro-watersheds, inevitably imposes the consideration
2012 Conference Proceedings | 201
Vilanova et al.
of a multiple-use approach for two reasons: a) SSF could be used for the production of both timber and NTFP and b) SSF interact with other economics activities such as agriculture and those synergies must be considered. In a recent assessment on forest management in Latin America and the Caribbean, only 7 out of 22 cases cata-logued as “exemplary” in achieving sustainable forest management met either “good” or “exceptional” levels of compliance for the criterion of “diversification of uses” (FAO, 2010b). Spite of this apparently low consideration of multiple-use objectives, a great proportion of these exemplary cases could be catalogued as examples of SSF.
One of the basic principles of the novel Forest Law in Venezuela since 2008 is the explicit consideration of multiple use of forests when it comes to the regulation process to access to timber and NTFP. If combined with the fact that community forestry is also mentioned as one of the mechanisms for forest management, this should be seen as an opportunity to enhance the possi-bility of SSF in the three studied cases as well as other areas of the country. Yet, it is important to highlight that since 2010 an official strategy has been implemented with the creation of the National Forest Company, a governmental policy aiming the progressive substitution of private concessions. Updated information indicates that at least 1 million ha have been officially assigned to this enterprise which in theory will be managed under the multiple-use framework and the social participa-tion of local communities. Nevertheless, the practical implementation of the concept is still in debate and the outcomes should be carefully monitored.
Lessons Learned
Spite of being located in the same country or even in the same area (Andes), each one of the cases briefly mentioned here and their results, are unique in terms of specific nature–society interactions and represents a development path rooted in a specific historical and cultural context. In this regard, the critical review of cases led us to propose a set of learned lessons that if carefully discussed at all levels could enable the process of SSF in Venezuela. Yet, the following statements are not exclusive and probably there are other elements for discussion that were not included here unintention-ally:
Land and Forest Tenure Plays a Fundamental Role in determining the Fate of SSF
The country’s current land reform program faces an intense domestic debate and as is expressed in Torres-Lezama et al. (2011), the process of collecting infor-mation about many aspects of land management (e.g. surface, tenure rights) has become a major problem since local communities are hesitant when these issues
are asked during social assessments. This raises the constraint founded in two of our cases (Aragua and Mocotíes) where local people were reluctant to the use of trees or forest plantations when their property rights are not officially recognized.
It is noteworthy that our analysis is mainly based on the assessment of specific cases described here, which makes difficult to determine the overall magnitude of how forest tenure is, as is shown in this paper, a limita-tion rather than an opportunity for SSF in the country. Nevertheless, it is strongly believed that a more clear process of land tenure is needed in order to move forward enabling a more widespread implementation of the SSF in Venezuela.
Capacity Building At Local Scale Is Needed
Although the concept of building capacities for devel-opment applies to all levels and scales, it is especially important that local structures linked to SSF focuses on understanding the obstacles that inhibit people, local governments and other small-scale organizations from realizing developmental goals while enhancing the abilities that will allow them to achieve measur-able and sustainable results. Here, the participation of research and educational institutions is decisive in order to enhance technical and managerial capacities. As is made in this work, capacity-building program should also include a component to share lessons learned and experiences across forest sites.
Economic Incentives to Promote SSF
After our work in the three sites, we think that a well-balanced participation between the public and private sectors and a well-designed policy of incentives is needed to implement SSF management. An opportunity for SSF remains because the current forest law estab-lished a novel incentives policy for new socio-produc-tive mechanisms favouring small-scale operations. This policy also includes the encouragement for social partic-ipation and empowerment through economic incen-tives including tax concessions and financial support. In terms of taxes, national government has focused on the spreading and implementation of land-use systems that are environmental-friendly in which tree planting has an opportunity. For instance, Nawir et al (2007) reports an example of how national forest policy could provide an opening to small farmers by offering tax incentives that are proportionate to the number of trees they plant. Financial support both by private sector or government includes a wide range of packages that can include plantation establishment funds, physical inputs, free seedlings, paid labour for government projects and loan schemes. However, in order to be effective, proposed financial incentives require supporting policies
202 | IUFRO 3.08.00 Small-Scale Forestry
Enabling Small Scale Forestry in Venezuela: Taking action at the local scale
and conditions such as secure tenure of land and clear mechanisms for funding support avoiding discrimination on less favored groups.
A Systematic Process of Information Exchange Is Essential
A proper SSF model should be accompanied by a permanent process of research to produce rapid and accurate information that, for example, reflect the driving forces of small-scale forest owners and other local scale actors and be able to reflect and represent traits related to management activities. An interactive process of infor-mation flow offers a great potential not only for gath-ering data to improve management but also to opening up alternative ways and perspectives for interpreting political institutions, political decision-making processes, as well as policy contents and instruments that for our studied cases were usually the most critical factors to implement SSF.
Conclusions
Without any doubt, SSF faces serious challenges for successfully implementation in Venezuela. Lack of incentives and very weak institutional framework threats potential benefits of the SSF strategies analyzed here for three different areas of the country. The elements discussed in this paper can contribute by offering to deci-sion-makers a range of options for sustainable develop-ment. Social networking and community associations closely linked to research institutions open a promising way to improve local livelihood and ecosystem conser-vation.
Concerning the structural and institutional dimension of new modes of governance that are needed in order to enable SSF in Venezuela, we believe that the establish-ment of integrating mechanisms to give local actors a more leading role is a complex challenge but urgently needed. Furthermore, to accomplish that, a truly polit-ical decentralization is also necessary to enhance trans-parency and improve efficiency to guarantee a more ´open access´ process. For instance, the consideration of multiple actors with a variety of land uses and polit-ical views could ease the dialogue among all stake-holders.
In spite of the fact that in recent years, there have been huge advances in the planting of forestry for multiple uses on farms and, in developing countries, on common property lands or small private areas, there has been very little advance in the case of Venezuela forestry sector. Perhaps the case of Tectona grandis plantations in some private areas is one of the few examples of formal SSF initiatives. In particular, the discussion about the concept
of private property and small owners, which severely affects the outcomes of SSF, has become a sensible topic currently in debate in the national policy.
Acknowledgements
Emilio Vilanova express sincere gratitude to the IUFRO-SPDC Program for financial support to participate in the IUFRO Small Scale Forestry Conference “Science for Solutions”, held at the University of Massachusetts Amherst, Boston, USA between September 24th and 27th, 2012.
References
Buss, C. 2011. Sustainable forestry: connecting local to global and vice versa. Growing Forest Partnerships Briefing, 4 p. Available at: http://www.growingforestpartnerships.org/sustainable-forestry-connecting-local-global-and-vice-versa Accessed July 15 2012.
Cashore, B., Galloway, G., Cubbage,F., Humphreys, d., Katila P., Levin, K., Maryudi, M., Mcdermott, C., McGinley, G., Kengen, S., Medrado, J., Puente,M., Temu, B., Augusto Zanetti, E. 2010. Ability of Institutions to Address New Chal-lenges. In: Mery et al (eds.) Forests and Society – responding to global drivers of change Chapter 23 pp 441-486.
Figueroa, J., Sanoja, E., delgado, L. 2010. Árboles utilizados como productos forestales no maderables en la cuenca alta del río Botanamo, estado Bolívar, Venezuela. Acta Bot. Venez. 33 (1): 119-135.
Food and Agricultural Organization of the United Nations (FAO). 2010a. Forest Resource Assessment FRA 2010: Key findings. Available in: http://www.fao.org/forestry/static/data/fra2010/KeyFindings-en.pdf. Accessed March 25, 2010.
FAO. 2010b. Standing tall: exemplary cases of sustainable forest management in Latin America and the Caribbean. Food and Agriculture Organization of the United Nations and Junta de Castilla y León, España..
García-Fernández, C., Ruiz-Pérez, M., Wunder, S. 2008. Is multiple-use forest management widely implementable in the tropics?. Forest Ecol. Manag. 256(7): 1468-1476.
Guariguata, M., Sist, P., Nasi, R. 2012. Multiple use manage-ment of tropical production forests: How can we move from concept to reality? Forest Ecol. Manag 263: 170-174 http://dx.doi.org/10.1016/j.foreco.2011.09.032
Harrison S, Herborn J, Niskanen A. 2002. Non-industrial, Smallholder, Small-scale and Family Forestry: What’s in a Name?. Small-scale Forest Economics, Management and Policy, 1(1):1–11
Herrero-Jáuregui, C., Garcia-Fernández, P., Sist, P., Casado, M.A. 2009. Conflict of use for multi-purpose tree species in the state of Pará, Eastern Amazonia, Brazil. Biodiversity and Conservation, 18 pp. 1019–1044.
2012 Conference Proceedings | 203
Vilanova et al.
International Tropical Timber Organization (ITTO), 2011a. Status of tropical forest management 2011. ITTO Technical Series No 38, Yokohama, Japan, 420 p.
International Tropical Timber Organization (ITTOb). 2011. Tropical forest tenure assessment: trends, challenges and opportunities. ITTO Technical Series 37, Yokohama, Japan, 48 p.
Lozada J. 2007. Situación actual y perspectivas del manejo de recursos forestales en Venezuela. Revista Forestal Vene-zolana 51(2): 195-218.
Machado, J. 2008 Estudio de los Consejos Comunales en Venezuela. Fundación Centro Gumillas, Caracas, 56 p.
Machado, J. 2009 Estudio cuantitativo de opinión sobre los Consejos Comunales. Fundación Centro Gumillas, Caracas, 30 p.
Mery G, Alfaro R, Kanninen M and Lobovikok M. 2005. Changing Paradigms in Forestry: Repercussions for People and Nature. In Mery G, Alfaro R, Kanninen M and Lobovikok M (2005) eds, Forest in the Global Balance: Changing Para-digms. IUFRO World Series Volume 17. Helsinki.
Millennium Ecosystem Assessment (MEA). 2005. Ecosystems and Human Well Being: Scenarios, Island Press, 155 p.
Ministerio del Ambiente (MinAmb). 2006. Estudio sobre el estado actual y potencial de los productos forestales no maderables (PFNM) en la cuenca del río Cataniapo, estado Amazonas, Venezuela. dirección General de Bosques. Caracas, Venezuela, 82 p.
Ministerio del Poder Popular para el Ambiente (MinAmb). 2010. Estadísticas Forestales. Anuario 2008, Serie 12. Caracas, Venezuela, 179 p.
Ministerio del Poder Popular para el Ambiente (MinAmb). 2012. Mapa de la Vegetación de Venezuela. Material del Taller-Seminario “Manejo Forestal bajo el principio de uso múltiple”, Puerto Ordaz, Julio 2012.
Ministerio del Poder Popular para la Agricultura y Tierras (MPPAT). 2010. Atribuciones y acciones para el fomento y desarrollo de la producción primaria agrícola forestal. Presentación Jornadas sobre Políticas Forestales en Vene-zuela, Centro de Ingenieros del estado Mérida.
Nawir A.A, Kassa H, Sandewall M, dore d, Campbell B, Ohlsson B, Bekele M. 2007. Stimulating smallholder tree planting – lessons from Africa and Asia. Unasylva 228 (58): 53-58
Ortegano, O. 2000. Nueva Política Forestal: El Manejo Integral Comunitario del Bosque. Revista de la direc-ción del Recurso Forestal. Servicio Forestal Venezolano (SEFORVEN), No. 16. Caracas, Venezuela.
Pacheco, P., Aguilar-Støen, M., Börner, J., Etter, A., Putzel, L., Vera diaz, M. 2011. Landscape Transformation in Tropical Latin America: Assessing Trends and Policy Implications for REdd+ Forests (2): 1-29; doi:10.3390/f2010001
Rojas-López, J., 2007. Regulación ambiental y colonización agraria en reservas de bosque. El drama de Ticoporo, estado Barinas-Venezuela. Revista Geográfica Venezo-lana 48(1), 129-141.
Sunderlin, W, Hatcher J, Liddle M. 2008. From Exclusion to Ownership? Challenges and Opportunities in Advancing Forest Tenure Reform. Rights and Resources Initiative, Washington dC.
Taylor, P. 2006. Country Case Study: Forest Tenure and Poverty in Venezuela, R.B.. Report Prepared for the Center for International Forestry Research, Bogor, Indonesia, 14 p.
Torres-Lezama A, Vilanova E. Ramírez-Angulo, H. 2009. Guiding Principles for Small-Scale Forestry in a Watershed of the Venezuelan Andes: Constraints and Opportunities. Small-scale Forestry 8(1):77-93.
Torres-Lezama A, Vilanova E. Ramírez-Angulo, H., 2010. Planning and Policy Issues in Small-scale Forestry devel-opment in Southern Aragua State, Venezuela. Small-scale Forestry 9(3): 281-295, dOI: 10.1007/s11842-010-9116-0 http://www.springerlink.com/content/t4hh32v2705115jp/
Torres-Lezama A, Vilanova E. Ramírez-Angulo, H., Alcia-turi, G. 2011. Socioeconomic and environmental basis for development of Small Scale Forestry in a highly degraded watershed of the Venezuelan Andes. Small Scale Forestry dOI: 10.1007/s11842-011-9186-7 http://www.springerlink.com/content/27217m7588t783n4/
Van Looy, T., Carrero, O., Mathijs, E., Tollens, E. 2008. Under-utilized agroforestry food products in Amazonas (Vene-zuela): a market chain analysis. Agroforest Syst. 74:127–141 dOI 10.1007/s10457-008-9110-0.
204 | IUFRO 3.08.00 Small-Scale Forestry
Private Forest Sector in Latvia
Since the restoration of Latvia’s independence in the early 1990s the forest sector has become one of the key branches of national economy. Both the state and privately owned forests are equally important sources of raw material for the wood processing industry. In the last decade the total average annual volume of fellings has been about 11 million m3. As to the state-owned forests, a fixed annual allowable cut is for a definite period of time established by law, while in private forests the felling volume fluctuates a lot with the minimum of 3 million m3 in 2009 and the maximum of 7.5 million m3 in 2003. Analyses of the State Forest Service (SFS) database showed that as of 2010 timber harvesting was done in about 40% of private forest holdings (Jansons, 2010). Other forest management activities (forest regeneration, tending of young stands, pre-commercial thinnings) were done considerably less, and it is to be pointed out that the principles of sustainability were not always taken into consideration. Access to firewood from one’s own
forest and a possibility to leave heritage to the succes-sors are among the major motives for owning a forest in Latvia (Vilkriste, 2008).
According to the SFS data woodlands cover 51% of the country’s land area.Today about 52% of woodlands belong to the state, 11% are managed by legal persons or companies, 5% are owned by municipalities and other owners, and 32% by about 140,000 PFOs. The privati-zation going hand in hand with the restitution of property rights of the former owners or their successors to the landed properties, including forestlands, owned before the Soviet occupation, have resulted in a high number of small, fragmented forest holdings. However, in the recent years the consolidation of landed properties, including forests, is increasing as the biggest owners and forestry companies are interested in enlarging their properties. Still, small and fragmented holdings are typical for the private sector in forestry. In Latvia, the average size of a forest holding does not exceed 8ha.
What to Put At the Basis of Forest Extension – Forest Owner Needs Or Proactive Approach?Lelde VilkristeLatvian State Forest Research Institute „Silava”; Rigas iela 111, Salaspils, LV-2169, Latvia; e-mail: [email protected]
Keywords: private forest owners, forest extension and consultancy, advisory services, opinion polls, decision making, forest policy
Abstract
In Latvia, about 51% of land area is covered by forests and the forest sector has become one of the key branches of national economy. Both the state- and privately owned forests are equally important sources of raw material for the wood processing industry. About 1/3 of forests belong to about 140,000 family forest owners whose prop-erties are small (in average less than 8 ha) and fragmented. Forest mangement tendencies in the private sector not always correspond to the best management practices, contadicting in some aspects the Forest Policy prin-ciples. The forest extension system was first established in 2000 at the State Forest Service (SFS) and it devel-oped rapidly for some 3 years. As a result of changes in the organizational set-up and downsizing the SFS started six yeras ago the function of forest extension was separated from the SFS and given over to the Forest Advisory Services Centre with the Latvian Rural Advisory and Training Centre.
During the past decade several opinion polls were carried out in order to evaluate and improve the existing forest extension system. The given paper presents in greater detail the results of the 2012 opinion poll where a number of organisations evaluated the currently existing forest extension. The paper describes how the extension system meets the needs of private forest owners and outlines the recent trends in its development. Decisions for improve-ments in the forest extension system should be based on survey results and the lessons learned. The given study shows there is a strong need for novel approach to forest extension and the methods used in it.
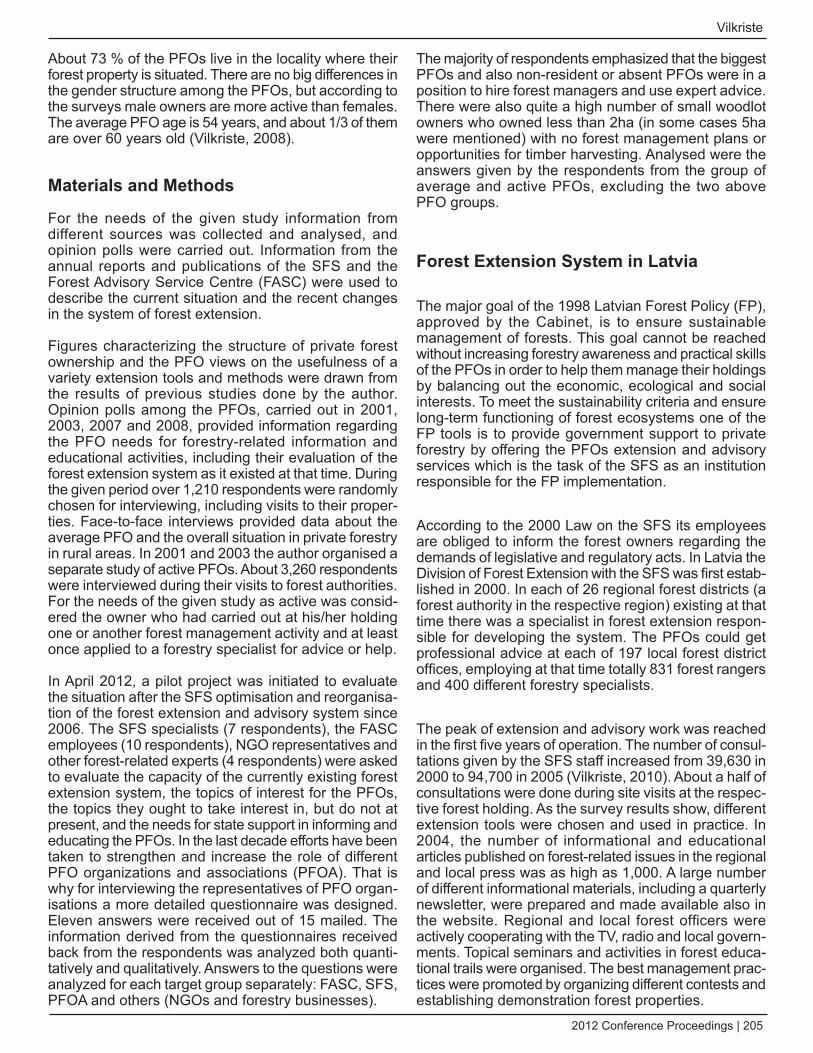
2012 Conference Proceedings | 205
Vilkriste
About 73 % of the PFOs live in the locality where their forest property is situated. There are no big differences in the gender structure among the PFOs, but according to the surveys male owners are more active than females. The average PFO age is 54 years, and about 1/3 of them are over 60 years old (Vilkriste, 2008).
Materials and Methods
For the needs of the given study information from different sources was collected and analysed, and opinion polls were carried out. Information from the annual reports and publications of the SFS and the Forest Advisory Service Centre (FASC) were used to describe the current situation and the recent changes in the system of forest extension.
Figures characterizing the structure of private forest ownership and the PFO views on the usefulness of a variety extension tools and methods were drawn from the results of previous studies done by the author. Opinion polls among the PFOs, carried out in 2001, 2003, 2007 and 2008, provided information regarding the PFO needs for forestry-related information and educational activities, including their evaluation of the forest extension system as it existed at that time. During the given period over 1,210 respondents were randomly chosen for interviewing, including visits to their proper-ties. Face-to-face interviews provided data about the average PFO and the overall situation in private forestry in rural areas. In 2001 and 2003 the author organised a separate study of active PFOs. About 3,260 respondents were interviewed during their visits to forest authorities. For the needs of the given study as active was consid-ered the owner who had carried out at his/her holding one or another forest management activity and at least once applied to a forestry specialist for advice or help.
In April 2012, a pilot project was initiated to evaluate the situation after the SFS optimisation and reorganisa-tion of the forest extension and advisory system since 2006. The SFS specialists (7 respondents), the FASC employees (10 respondents), NGO representatives and other forest-related experts (4 respondents) were asked to evaluate the capacity of the currently existing forest extension system, the topics of interest for the PFOs, the topics they ought to take interest in, but do not at present, and the needs for state support in informing and educating the PFOs. In the last decade efforts have been taken to strengthen and increase the role of different PFO organizations and associations (PFOA). That is why for interviewing the representatives of PFO organ-isations a more detailed questionnaire was designed. Eleven answers were received out of 15 mailed. The information derived from the questionnaires received back from the respondents was analyzed both quanti-tatively and qualitatively. Answers to the questions were analyzed for each target group separately: FASC, SFS, PFOA and others (NGOs and forestry businesses).
The majority of respondents emphasized that the biggest PFOs and also non-resident or absent PFOs were in a position to hire forest managers and use expert advice. There were also quite a high number of small woodlot owners who owned less than 2ha (in some cases 5ha were mentioned) with no forest management plans or opportunities for timber harvesting. Analysed were the answers given by the respondents from the group of average and active PFOs, excluding the two above PFO groups.
Forest Extension System in Latvia
The major goal of the 1998 Latvian Forest Policy (FP), approved by the Cabinet, is to ensure sustainable management of forests. This goal cannot be reached without increasing forestry awareness and practical skills of the PFOs in order to help them manage their holdings by balancing out the economic, ecological and social interests. To meet the sustainability criteria and ensure long-term functioning of forest ecosystems one of the FP tools is to provide government support to private forestry by offering the PFOs extension and advisory services which is the task of the SFS as an institution responsible for the FP implementation.
According to the 2000 Law on the SFS its employees are obliged to inform the forest owners regarding the demands of legislative and regulatory acts. In Latvia the Division of Forest Extension with the SFS was first estab-lished in 2000. In each of 26 regional forest districts (a forest authority in the respective region) existing at that time there was a specialist in forest extension respon-sible for developing the system. The PFOs could get professional advice at each of 197 local forest district offices, employing at that time totally 831 forest rangers and 400 different forestry specialists.
The peak of extension and advisory work was reached in the first five years of operation. The number of consul-tations given by the SFS staff increased from 39,630 in 2000 to 94,700 in 2005 (Vilkriste, 2010). About a half of consultations were done during site visits at the respec-tive forest holding. As the survey results show, different extension tools were chosen and used in practice. In 2004, the number of informational and educational articles published on forest-related issues in the regional and local press was as high as 1,000. A large number of different informational materials, including a quarterly newsletter, were prepared and made available also in the website. Regional and local forest officers were actively cooperating with the TV, radio and local govern-ments. Topical seminars and activities in forest educa-tional trails were organised. The best management prac-tices were promoted by organizing different contests and establishing demonstration forest properties.
206 | IUFRO 3.08.00 Small-Scale Forestry
What to put at the basis of forest extension – forest owner needs or proactive approach
Starting with 2006 the SFS organizational set-up was essentially changed. The organization was downsized; the number of regional forest districts was reduced to 23, with the total number of local forest districts 118, and 8 customer service centres. According to the most recent annual report, as of the beginning of 2012 the SFS comprised 20 regional forest districts and 29 local forest district offices with the total number of employees 689. The forest extension and advisory activities are no more a top priority for the SFS.
In 2006, a new structural subdivision of the SFS, the Consultancy Services Centre (CSC), was established. Compared to the previous system, the PFOs were also offered a number of new pay services. Since March 2010 the function of forest extension and consultancy was separated from the SFS and given over to the Forest Advisory Services Centre (FASC) with the Latvian Rural Advisory and Training Centre. The Cabinet Regula-tions determine the procedure for executing the pay services.
Opinion Poll of Target Groups
demand for and Accessibility of Extension Services
As the 2012 opinion poll shows, all the respondents agreed that there was a need for forest extension and advisory services with the highest demand for gratis services. Some respondents mentioned that a part of PFOs could not afford pay services. In general, all respondents were of the opinion that the government institutions and private sector organisations had enough specialists who could act as advisors for the PFOs. A few believed that nowadays the supply of advisory services already exceeded the demand. Nonetheless, opinions varied among the respondent groups on the capacity of one or another organisation in performing extension and advisory services.
Respondents from the SFS mentioned that today the demand for advice in environmental matters was increasing, but according to the comments the level of PFO activity was in recent years decreasing and continued to decrease, compared with the period five years ago. Some respondents stressed that the SFS specialists had a high level of expertise and could provide good advisory services. A half of respondents negatively evaluated the services offered by the FASC. Among the drawbacks mentioned were high-priced services, inflexible price lists, shortage of specialists who could provide practical help, lack of knowledge, and greater interest in consulting about the EU funds rather than forestry issues; besides, the published informational and promotional materials were not the most topical ones for the PFOs.
The FASC specialists pointed out that they also offered consultations free of charge, but they were supposed to work according to the price list and gain income from the services. The majority mentioned the fact that in case of need the PFOs still preferred contacting locally avail-able SFS employees, both acting and retired, because they trusted them and considered as authority. After a couple of years in the forest extension business the FASC, too, had its own circle of clients. A few respon-dents commented that there were still PFOs who did not know where they could get advice and what official to approach.
Only two PFOA respondents believed that the SFS and FASC capacities were sufficient to meet the PFO demands for advisory services. Nine respondents had a different opinion with some of their arguments as follows: irregular distribution of the SFS and FASC specialists all over the country with the transport costs to reach the specialist in the respective field getting prohibi-tively high; no free-of-charge consultations; because of increasing amount of work for performing the main duties the respective expert can devote less time for advisory services; unfair treatment of PFOs by some of the SFS employees when unofficially acting as middlemen in timber sales or giving pay services after their office hours.
In general, quite a high proportion of other respon-dents positively evaluated the SFS, the FASC and also the PFOA as services providers in forest extension and consultancy. The fact that the FASC can compete with private organisations or individual service providers, who work on their own without fully paying all taxes, was also pointed out. The respondents suggest the FASC not only meet the PFO demands, but also increase the supply of a variety of services in order to promote the use of best management practises.
Topics of Interest for the PFOs
The respondents were asked to point out some three to five questions most frequently asked by the PFOs. The topics mentioned and their priority differed not only among the groups of respondents, but also among the top managers or decision makers and the field personnel contacting the PFOs in their daily work.
Most of the respondents mentioned first of all different questions related to timber harvesting, starting from simple ones like legal provisions for forest utilization to the methods of determining felling volume, information regarding service providers, market prices, taxation and legal exemptions from tax payments, including forest regeneration and other requirements. The comments showed that these questions made about 70-80% of the total number of most frequently asked questions. Besides an interest in the issues of timber harvesting the SFS respondents pointed out also questions about
2012 Conference Proceedings | 207
Vilkriste
forest regeneration, legal constraints, access to the EU funds, and the forest inventory and management planning.
The questions pointed out by the FASC respondents can be divided in three main groups:
Multiform questions regarding access to the EU funds • and possibilities for reducing management costs and increasing the forest value by using these funds;Management of forest property in general and the • recommendations regarding appropriate forest oper-ations;Changes in legislation, compensation for wildlife • damages to forest, calculation of taxes, and expla-nation of the statutory requirements whose obser-vance the SFS controls.
The list of questions given by the PFOA respondents of was wide. For the most part the questions were about forest regeneration and the tending of young stands, timber prices and sales, tax reliefs, EU projects and the available support. The PFOs showed also interest in the forest inventory data and their interpretation, changes in the regulatory acts, environmental concerns in forest operations, protection belts, timber harvesting in general, prevention of wildlife damages, and the preparation of documents and reports for submission to the SFS.
In the opinion of business representatives the PFOs were mainly interested in getting maximum profit from exploiting the forest holding and avoiding breach of law, while the NGO representatives pointed out that the PFOs were also interested in learning about of the best management practices at home and also abroad.
Things the PFOs Ought to Know But Show no Interest in
As to the things the PFOs ought to know but at present show no sufficient interest in, the SFS respondents mentioned forest regeneration, forest biological diver-sity, nature values, identifying ecological trees to be retained in cutovers, protection areas, and the use of EU funds. A number of important issues were mentioned only once: upkeep of forest drainage systems, mainte-nance of holding borders and boarder signs, improve-ment of forest quality, forest regeneration.
The FASC respondents singled out two groups of issues for which the PFO interest was insufficient or missing. The first one refers to forest management: maintenance of forest holding borders, reforestation, and pre-commer-cial and commercial thinnings. As it follows from the comments given, the PFO awareness of these issues was increasing with time, but in general not enough. The second group of issues was related to the understanding of forest management as a process continuous in time and at the same time a kind of business. The NGOs, too, pointed to the need of building awareness among
the PFOs of the continuity in cultivating forest crops and the long-term impacts of management decisions currently taken. The businesses emphasized also the commercial use of non-wood forest products.
The PFOA respondents were of the opinion that the PFOs showed insufficient interest in the questions related to nature values and the actual forest value, including the ways for increasing it. Missing was also interest in forest certification, environment conservation, EU projects and forest damages.
State Support to Forest Extension
The SFS respondents’ views regarding government support to the forest extension system essentially differ. Two respondents believed that the best way was to allocate enough funds to the SFS budget to enable increasing advisory activities, while two other respon-dents expressed an opinion that there was no need for giving additional knowledge to the PFOs or educating them. Among reasons mentioned were excessive activ-ities of different buyers and middlemen on the wood resources and timber market and too frequent changes in legislation. Other respondents pointed to the need of creating a favourable environment in and around forestry that would facilitate the development of forest extension and advisory system. It was suggested that the PFO organisations should receive financial support to involve more PFOs in forest management and utilisation. In allo-cating funds to forest extension the emphasis should be on the activities ensuring sustainable forest manage-ment in the long-term perspective with the educational and awareness raising activities focused on individual owners. In one answer the state support to artificial forest regeneration was mentioned, too.
Most of the FASC respondents stressed that the state had already done a lot to provide extension services and the PFOs had positively evaluated gratis consulta-tions, topical seminars, as well as possibilities of using the EU funds. Still, the state support was necessary for further development and improvement of the forest extension and advisory system. The respondents speci-fied what particular activities could motivate the PFOs, for example, special training courses with a certificate verifying the qualification issued, special bonus systems for the PFOs active in educational programmes, and assistance in forest management (discounts for different services like green forest management plans, imple-menting projects, consultations on-site etc.). The FASC opinion was that in an ideal case the PFOs were to receive free of charge the following three major services: easy-to-reach consultations in forest management, regular information about the topical issues in forestry, and simple management plans for small scale forest holdings. In the opinion of one respondent the state’s prime concern was to create a stable, reliable and fair
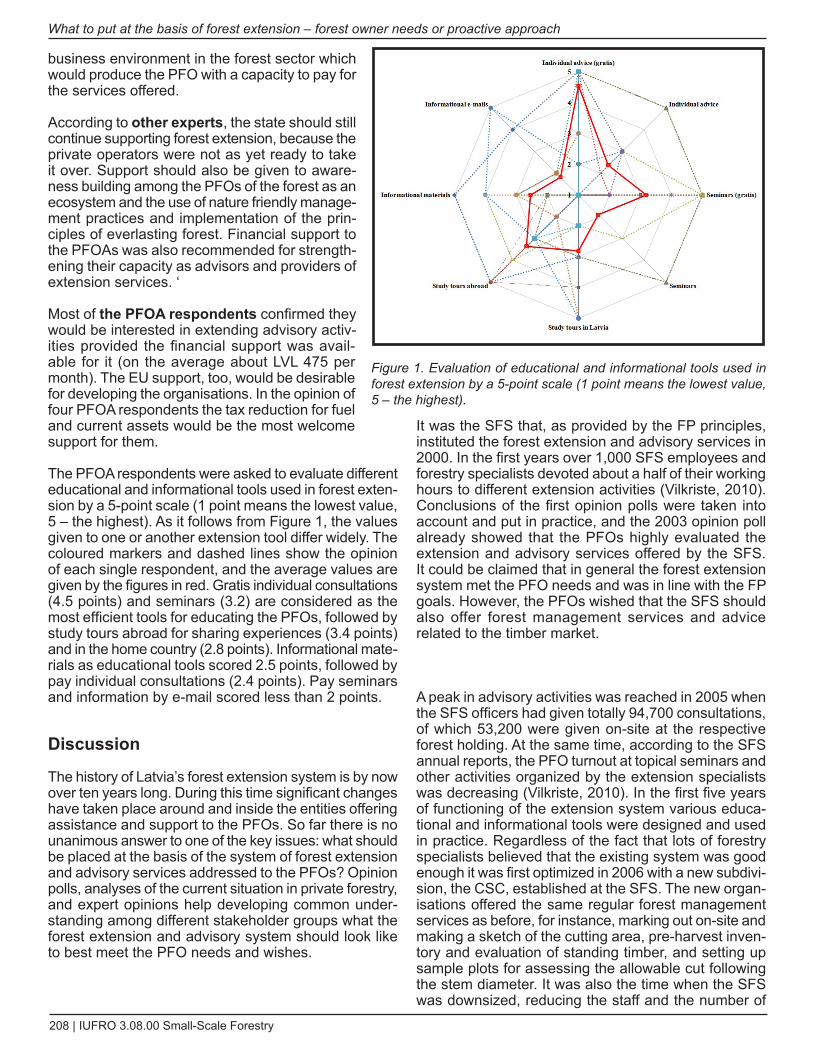
208 | IUFRO 3.08.00 Small-Scale Forestry
What to put at the basis of forest extension – forest owner needs or proactive approach
business environment in the forest sector which would produce the PFO with a capacity to pay for the services offered.
According to other experts, the state should still continue supporting forest extension, because the private operators were not as yet ready to take it over. Support should also be given to aware-ness building among the PFOs of the forest as an ecosystem and the use of nature friendly manage-ment practices and implementation of the prin-ciples of everlasting forest. Financial support to the PFOAs was also recommended for strength-ening their capacity as advisors and providers of extension services. ‘
Most of the PFOA respondents confirmed they would be interested in extending advisory activ-ities provided the financial support was avail-able for it (on the average about LVL 475 per month). The EU support, too, would be desirable for developing the organisations. In the opinion of four PFOA respondents the tax reduction for fuel and current assets would be the most welcome support for them.
The PFOA respondents were asked to evaluate different educational and informational tools used in forest exten-sion by a 5-point scale (1 point means the lowest value, 5 – the highest). As it follows from Figure 1, the values given to one or another extension tool differ widely. The coloured markers and dashed lines show the opinion of each single respondent, and the average values are given by the figures in red. Gratis individual consultations (4.5 points) and seminars (3.2) are considered as the most efficient tools for educating the PFOs, followed by study tours abroad for sharing experiences (3.4 points) and in the home country (2.8 points). Informational mate-rials as educational tools scored 2.5 points, followed by pay individual consultations (2.4 points). Pay seminars and information by e-mail scored less than 2 points.
Discussion
The history of Latvia’s forest extension system is by now over ten years long. During this time significant changes have taken place around and inside the entities offering assistance and support to the PFOs. So far there is no unanimous answer to one of the key issues: what should be placed at the basis of the system of forest extension and advisory services addressed to the PFOs? Opinion polls, analyses of the current situation in private forestry, and expert opinions help developing common under-standing among different stakeholder groups what the forest extension and advisory system should look like to best meet the PFO needs and wishes.
It was the SFS that, as provided by the FP principles, instituted the forest extension and advisory services in 2000. In the first years over 1,000 SFS employees and forestry specialists devoted about a half of their working hours to different extension activities (Vilkriste, 2010). Conclusions of the first opinion polls were taken into account and put in practice, and the 2003 opinion poll already showed that the PFOs highly evaluated the extension and advisory services offered by the SFS. It could be claimed that in general the forest extension system met the PFO needs and was in line with the FP goals. However, the PFOs wished that the SFS should also offer forest management services and advice related to the timber market.
A peak in advisory activities was reached in 2005 when the SFS officers had given totally 94,700 consultations, of which 53,200 were given on-site at the respective forest holding. At the same time, according to the SFS annual reports, the PFO turnout at topical seminars and other activities organized by the extension specialists was decreasing (Vilkriste, 2010). In the first five years of functioning of the extension system various educa-tional and informational tools were designed and used in practice. Regardless of the fact that lots of forestry specialists believed that the existing system was good enough it was first optimized in 2006 with a new subdivi-sion, the CSC, established at the SFS. The new organ-isations offered the same regular forest management services as before, for instance, marking out on-site and making a sketch of the cutting area, pre-harvest inven-tory and evaluation of standing timber, and setting up sample plots for assessing the allowable cut following the stem diameter. It was also the time when the SFS was downsized, reducing the staff and the number of
Figure 1. Evaluation of educational and informational tools used in forest extension by a 5-point scale (1 point means the lowest value, 5 – the highest).
2012 Conference Proceedings | 209
Vilkriste
regional and local forest districts. Yet, the SFS special-ists continued giving gratis consultations and advice on the major management issues.
On the one hand it could be claimed that the SFS set-up was optimized to meet the PFO interests, while on the other hand a part of the foresters’ community showed a negative attitude towards the proposed changes. It took about a year to reorganize the forest extension with the amount of extension activities decreasing. A lot of effort went for communicating the changes and introducing the new system to the PFOs and the general public. Contrary to expectations the PFO demand for exten-sion services was smaller in the first years after optimi-zation. The rank-and-file specialists not fully understood the purpose of optimisation and the negative attitude towards changes was taken over by the PFOs.
It is to be noted that a considerable part of PFOs were elderly people living in the rural areas. They had objec-tions against making longer distances to meet the forest officer and limited opportunities of specialist visits to their holdings. It was hard for them to accept that the habitual and comfortable system had changed. The 2007 opinion poll among the PFOs showed that they did not know and care much of the organisational changes in the exten-sion system and were in favour of the previous system and easy availability of services. Frustration was also in the situations where the pay services were offered by the same person who earlier offered gratis consultations. It could be claimed that the reorganized system of forest extension was more convenient for non-resident and absent PFOs living in urban centres rather than those living in the countryside next to their holdings.
The currently existing forest extension system is a result of the recent changes in the SFS organizational set-up. Forest extension and advisory services are no more a top priority for the SFS and the working hours of staff members for advisory activities is limited. At present the FASC with the Latvian Rural Advisory and Training Centre is the head organisation concerned with forest extension and advisory services. It is to be stressed that neither the SFS nor the CSC and the FASC provided consultations and services related to timber harvesting and trade. The above market niche remained open and it was occupied by the PFOAs established in 2004-2006 with the EU support. Unfortunately, the demand for pay services and consultations was not that high and today about 15-20 small PFOAs are still active on the market of advisory services in timber harvesting and trade.
The 2012 opinion poll presented in this paper revealed the forestry expert views and evaluation of the current situation in forest extension. This respondent group was too small to make general conclusions, yet representa-tive enough to identify the existing tendencies. It is to be noted that the respondents of each group worked with different PFO target groups and, hence, their views on the PFO needs and wishes differed. It should also be
pointed out that the respondent opinions on the activi-ties and capacities of other organisations were to some extent biased and not always fair. For example, the SFS respondents reproached the FASC for placing emphasis on the EU issues rather than forestry ones, declaring at the same time that the access to the EU funds should be a top priority for the PFOs whose understanding of these issues left much to be desired.
Changes in the forest extension system provoked competition among different stakeholders offering advisory services to the PFOs. On the one hand the competition should be looked upon as beneficial as it increases the quality of services, but on the other hand it goes with a number of negative factors. In different opinion polls it was not only once stressed that some extension specialists played a dual role, acting in the office hours as advisors while selling extension services or acting as middlemen in timber trade in their leisure time or combining both. Usually the PFOs pay for such legally dubious services in cash, and it is difficult for the FASC and the PFOAs to compete with similar tax-dodgers who push down the service prices. The law-abiding actors on the market have no opportunities for development as long as there are service providers acting on a legally compromising basis.
As to the currently existing forest extension system the PFOs objected most of all to the fact that the number of specialists offering gratis consultations was too small for demand. The majority of respondents taking part in the recent opinion polls pointed out that PFOs level of knowl-edge on forestry issues had substantially increased due to intensive extension work in the first year of func-tioning of the revised system. It implies that the role of forestry specialists as advisors has decreased in recent years. Regardless of similar developments in the field of advisory services the individual consultations are still regarded as the most efficient extension tool, but there is no reason for demanding state subsidies for them.
According to the 2005 SFS Annual Report the number of consultations given by the SFS staff was close to 100,000. However, at the same time the PFOs lagged behind in such sustainability ensuring management activities as forest regeneration and pre-commercial thinnings. It means that gratis advisory services alone fail to ensure implementation of the FP principles in private forestry. The major role of forest extension is to introduce in forest management the best practices and keep the PFO activity on a high level rather than meet their wishes on gratis services.
Attendance of seminars or training courses is yet another example for illustrating the above statement. In 2000–2003 the SFS organised about 1,760 seminars all over the country, attracting over 23,000 attendants. Topical seminars were evaluated as the most important exten-sion tool. This raises the question why about 20% PFOs in the 2003 opinion poll mentioned they would like to
210 | IUFRO 3.08.00 Small-Scale Forestry
What to put at the basis of forest extension – forest owner needs or proactive approach
attend seminars while in practice they lost interest in them as already in 2005 the average turnout per seminar was no higher than 10 persons. The SFS still continued to invest resources and time in similar extension activi-ties but it was of no avail. Orientation to the target group with no or minimal forestry knowledge could be one of reasons for failure. Rebirth of seminars was in 2008, when the FASC organised in-house seminars on the availability of EU funds for the development of forestry. Today the training courses and seminars are organised on a limited basis only, and the attendance shows that in this respect there is no need to increase the offer.
In the 2010 opinion poll of the forestry specialists indi-cated that the role of local authorities in forestry-related matters was increasing. The active PFOs stated that the forest officers were important advisors in legal issues, but in general their knowledge and skills in practical forestry were considered inadequate (Vilkriste, 2010). In a situation where a study on informal or peer–to-peer learning is in its initial stage, there is evidence suggesting that its role is bigger than currently believed.
Therefore, forestry extension organisations should base their activities not only on the PFO wishes. It is neces-sary to evaluate and analyse the efficiency of each activity, especially gratis services. No denying, the PFO demands act as a driving force for the development of forest extension, yet successful service providers should be proactive and always a step ahead of the PFO demands. Small business organisations can quickly tailor their activities to new demands, but for state insti-tutions it takes longer time and they may lag behind the developments on the services market. Therefore exten-sion systems should be proactive and show initiative in offering different extension activities to various target groups. According to the recent opinion polls forestry specialists have some ideas how to stimulate the activity of PFOs and increase their understanding of the need to take over the best management practices.
Conclusions
Forestry extension system in Latvia:1. First established in 2000 within the SFS and in • three years a wide choice of extension tools were tested in practice;In 2006-2012, after downsizing and staff reduc-• tions extension services are no more a top priority for the SFS (save for advice in legal matters); the function of forest extension is separated from the SFS and given over to the Forest Advisory Services Centre (FASC) with the Latvian Rural Advisory and Training Centre;In 2004 -2006, about 50 PFOAs were established • under EU support. Today about 15-20 of them provide forestry and advisory services.
According to the 2003 opinion poll the PFOs posi-2. tively evaluated the SFS extension services except for advice on market issues and practical help in forest management; the situation changed after the 2006 organizational changes and downsizing. Gratis individual consultations and seminars have 3. been the most demanded extension services; still, gratis advisory services alone fail to fully ensure imple-mentation of the FP principles in private forestry.According to the opinion polls the PFO knowledge and 4. awareness of forestry-related matters has substan-tially increased with the demand for extension and advisory services decreasing in recent years.Lots of organisations can provide extension services, 5. while the PFO paying capacity to make use of them remains low.Forest extension systems should be proactive and 6. show initiative in using different extension tools and offering services to various target groups.
Acknowledgements
The author acknowledges with thanks the input of all respondents participating in the opinion polls and discus-sions carried out for the purposes of the given study. Special thanks to the Baltic American Freedom Foun-dation (BAFF), supporting my visit to the IUFRO Small Scale Forestry conference and providing an opportunity for participation in a year-long research project on forest extension problems in the USA. The author also owes a debt of gratitude to her one-time colleague at the SFS Andrejs Lasmanis for editing the draft of this paper.
References
Jansons, J. 2010. The Assessment of the Potential Contribu-tion of Private Forest Sector to Forest Industry in 2011–2015 (In Latvian). Res. Paper. LFRI „Silava”, Salaspils, 36 .
Vilkriste, L. 2006. Role of private Forest Owners in Latvia – Support or Hindrance to developments. Ed. S. Wall. Proceedings of IUFRO Conference. COFORd & GMIT, Galway, p. 526–538.
Vilkriste, L. 2008. Analyses of factors influencing manage-ment of private forest sector(In Latvian). Research paper. LLU, Jelgava. 50 p.
Vilkriste, L. 2010. Extension service in Latvia – how to meet the needs and wishes of private forest owners. Ed. M. Medvedev. Proceedings of IUFRO Conference. Slovenian Forestry institute, Ljubljana, p. 836–852.
Vilkriste, L. 2011. Increasing role of informal learning of private forest owners in Latvia. H. Karppinen, T. Hujala and O. Virkkula (eds.). Proceedings of the IUFRO 3.08 Symposium.Working Papers of the Finnish Forest Research Institute 193.FFRI, Vantaa, p. 65-75.
2012 Conference Proceedings | 211
Bioenergy Market Development
Environmental and economic concerns about fossil fuel consumption have prompted interest in producing biofuels and bioproducts (plant biomass-derived fuels and chemicals, respectively) as renewable energy sources (von Sivers et al. 1994, Ragauskas et al. 2006, Paula and Birrer 2006). Biomass-derived substitutes for fossil fuel sources of electricity and transportation fuel can be produced with a variety of plant sources.
Forests are attractive feedstocks for biofuels and bioproducts due in part to their propensity to produce high amounts of biomass with relatively low inputs of water and nutrients. Forests cover 4 billion hectares globally and contain an estimated 421 billion Mg of biomass (Food and Agriculture Organization 2011). This abundant biomass can serve as biofuel and bioproduct, feedstocks (raw materials) as by-products from produc-tion of conventional forest products (paper, paneling, lumber, furniture), waste wood from urban settings, woody biomass from logging operations (logging debris, damaged trees), and from trees grown expressly as feedstocks. In the USA, wood residue used for elec-tricity generation is a predominant biofuel; this type of bioenergy currently provides approximately a third of the renewable energy consumed in the USA (Energy Information Administration 2009).
Emerging forest-based biomass biofuel and bioproduct markets are expected to significantly strengthen the demand for wood fiber in the southeastern USA.
Emerging forest biomass demand will be primarily driven by wood-burning power companies that produce and sell electricity to public utilities and wood pellets exported to European energy markets. Conversion of biomass into cellulosic ethanol for transportation fuel may also impact the structure of the forest sector. According to Forest-2Market (2008), USA demand for wood fiber from these emerging biomass markets is expected to rise from 1.8 Tg in 2008 to at least 12.2 Tg in 2020. However, this estimate is conservative and could be higher as more companies move to the sector to build biomass facili-ties (Forest2Market 2008).
Forest Resources of the Southeast USA
Forests of the USA are expanding, with an annual net forest biomass increase of 3% (Kizhakkepurakkal 2008). A national average growth-to-removal ratio of 1.72 and a 9% decrease of forest product manufacturing since 1996 suggest that forests in the USA are not being over-harvested or pushed to their productive limits (Jackson et al. 2010). This forest biomass surplus can foster creation of new forest products such as biofuels and bioproducts. Recent estimates show that USA forests are able to sustainably produce 334 dry Tg of wood for energy generation per year, although this figure is likely an underestimation as it excludes the wood used for pulp and paper, low-value solid products, or wood from fast-growing trees on nonagricultural lands (Richter et al. 2009). Jackson et al. (2010) estimated 129 dry Tg of
Potential for Forest-Based Bioenergy Production for Small and Medium Forest Owners in the Southeast USARichard P. Vlosky1, Michael A. Blazier2, Roger Smithart1, Glenn Hughes3, Paul Darby4,
and Dek Terrell5
1 Louisiana State University Agricultural Center, Louisiana Forest Products Development Center, Room 227, School of Renewable Natural Resources, Baton Rouge, LA, [email protected]
2 Louisiana State University Agricultural Center, Hill Farm Research Station, 11959 Highway 9, Homer, LA, [email protected]
3 Mississippi State University, Department of Forestry, Mail Stop 9397, Mississippi State, MS, [email protected]
4 Louisiana State University, Department of Economics, 2110 Patrick Taylor Hall, Baton Rouge, LA, [email protected]
Keywords: biofuel, landowner survey
212 | IUFRO 3.08.00 Small-Scale Forestry
Potential for Forest-Based Bioenergy Production for Small and Medium Forest Owners in the Southeast USA
wood residues are currently used by the forest industry and that 124 dry Tg of woody biomass is potentially available for energy production.
The southeastern states of the USA have 81 million ha of forest, which is approximately 40% of the nation’s total forestland (Prestemon and Abt 2002). This forested region generally has the highest productivity for forest growth in the USA because of its sub-tropical and temperate climate. Due to this productivity and its well-developed forest products manufacturing infrastuc-ture, there is great potential for producing biofuels and bioproducts from forests of this region.
Role of Landowners in Bioenergy Production
The majority of forestland in the Southeast USA is privately owned by individuals or families (Birch 1994; Conner and Hartsell 2002). If the development of biofuels and bioproducts market gains momentum, these private landowners would be substantial suppliers of woody biomass feedstock. Demand for sustainable supplies of biomass feedstock may require forest landowners to alter their management practices and adopt government programs fostering biofuel production. Understanding the motivations, characteristics, and attitudes of these individuals is essential for bioenergy producers and policymakers to accurately estimate potential feedstock supply and the conditions that foster landowner partici-pation in biofuel and bioproduct markets.
While consistencies appear among landowner charac-teristics such as age, income, education, and owner-ship size, landowner motivations for ownership and management objectives are diverse (Hodgen et al. 2003). Forestland owners are typically well-educated males with an average age greater than 60 and an income higher than the general public (Butler and Leath-erberry 2004; Measells et al. 2005; Perera 2008; Vlosky 2000). Landowners often identify their top reasons for owning forestland as providing their land as an asset to heirs, residing in the forest, recreation, and aesthetics, whereas forest products production is often identified as a relatively low priority (Butler and Leatherberry 2004; Hodgden 2003; Measells et al. 2005). However, studies done within the Southeast USA indicate timber production to be the primary reason for owning forest-land (Perera 2008; Vlosky 2000). Non-industrial private forest (NIPF) landowners often have a low knowledge level of biomass harvesting, production, policies, and economics (Almquist 2006; Oxarart 2008; Shaw 2009). Motivations for management objectives and harvest intensities also vary among determinant factors such as size of ownership, length of ownership, presence of structures, and absenteeism (Conway et al. 2003; Hodgden et al. 2003; Perera 2008). Trends in NIPF ownership over the years include increases in owner-ship numbers, decreases in ownership acreage, and
land disposal (Conner 2002). Given the potential of the Southeast USA to provide forest biomass as biofuel feedstock and its land ownership patterns, it is impera-tive to understand small and medium landowner will-ingness to participate in bio-based product manage-ment activities.
Landowner Perceptions of Bioenergy Markets
Smithhart et al. (in press) conducted a survey of 3,500 small (defined as forestland ownership of 4 to 56 ha) and medium (defined as forestland ownership of 57 to 404 ha) landowners in Louisiana to gauge their knowl-edge of technological, economic, and ecological facets of producing bioenergy from forest biomass and their willingness to participate in such markets. The authors conducted the survey in the state of Louisiana as the intial stage of region-wide assessment of the Southeast USA. Given Louisiana’s similarity in forestland owner-ship patterns relative to other states in the region, their survey’s results may provide indications of landowner’s perceptions of bioenergy in other portions of the South-east USA.
Smithhart et al. (in press) found that landowners gener-ally lacked knowledge about technological aspects of producing biofuels and bioproducts from forest biomass. Majorities (greater than 50%) of landowners believed that economically viable technologies were available for converting wood biomass to bioenergy and that woody biomass could be harvested without extra labor and equipment, transported with conventional equip-ment, and easily converted to bioenergy at existing forest products manufacturing facilities. These percep-tions were counter to research results that demonstrate that harvesting woody biomass for bioenergy is more labor- and equipment-intensive than conventional forest harvesting and that conversion of woody biomass to biofuels and bioproducts requires construction of new manufacturing facilities (Jackson et al. 2010). This gap in landowners’ knowledge about the realities of bioenergy production from forest biomass underscores the need for outreach and extension programming as bioenergy markets emerge.
Landowner age, size of ownership, and type of owner-ship influences their perceptions of facets of biofuel and bioproduct production. Smithhart et al. (in press) found that older landowners believed that harvesting forests for bioenergy production would harm the quality of air, water, soil, and wildlife habitat. Older landowners were also opposed to government providing tax credits, subsidies, and incentive programs to facilitate bioen-ergy production from forest biomass. Landowners with larger landholdings were generally more recep-tive to government provision of tax credits, subsidies, and incentive programs and were less likely to feel that biomass harvesting would harm air, water, soil, and
2012 Conference Proceedings | 213
Vlosky et al.
wildlife habitat. The most common landowner type in the Smithhart et al. (in press) survey was older indi-viduals with smaller (under 56 ha) land area, which suggests the majority of landowners in the region would be opposed to government incentives for bioenergy and more concerned with ecological impacts of harvesting forests for bioenergy. The forest type owned by land-owners affected whether they were willing to manage their forests to produce biomass for bioenergy produc-tion. Forest types revealed in the survey were natural hardwoods, natural southern pine, mixed hardwoods and southern pine, hardwood plantations, and southern pine plantations, with mixed hardwood and pine and southern pine plantations the most common. A slim majority of landowners with natural hardwood forest were opposed to managing their forests to produce biofuels, while a majority of surveyed landowners with southern pine plantations were willing to manage for bioenergy production. These landowner’s perceptions were likely consistent with their management objectives for their forests. Southern pine plantations more readily facilitate pulpwood and sawtimber production, so land-owners with this forest type are likely more utilitarian in the view of their forests. Natural hardwood forests in the southeast USA are generally slower-growing and more difficult to regenerate than southern pine plantations, which would likely make landowners more reluctant to alter their forest. Landowners that maintain naturally regenerated forests are also likely less utilitarian in their forest management.
Overall, Smithhart et al. (in press) found that 51% of survey respondents were willing to manage their forest-land for bioenergy production. The ability to earn a profit on their activities was the top priority for landowners willing to manage their forests for biofuel and bioproduct production. For these landowners, assurance that their management activities for bioenergy production would not harm the environment was nearly equal to their interest in profit.
Conclusions
The Southeast USA has favorable attributes for producing bioenergy from forest biomass because of an abundance of under-utilized forestland and relatively high forest productivity. The majority of this forestland is privately owned, and most private landowners are older individuals with relatively small landholdings. Such owners have been shown to oppose government incen-tives for promoting bioenergy production from forests, and they have high concern about ecological harm from harvesting forests for bioenergy production. Profit poten-tial is the top consideration for small and medium land-owners to be willing to manage forests to produce biofuel feedstock, but ecological concerns were nearly equal to their interests in profit. Small and medium landowners in the region have also been shown to have low knowledge of the technological necessities of producing bioenergy
from forest biomass. To foster small and medium forest owner participation in bioenergy markets as the industry evolves in the Southeast USA, bioenergy producers and policymakers should provide them with information on the technological, economic, and ecological aspects of producing bioenergy from forest biomass to be respon-sive to the lack of knowledge and degree of concern these owners may have for these issues.
References
Almquist, B. 2006. Environmental Group Perspectives on Woody Biomass Utilization Related to Hazardous Fuels Reduction. M.S. thesis. University of Oregon, Eugene, Oregon.
Birch, T.W. 1994. Private Forest Landowners of the Southern United States. In: Radnor, P.A. (ed.). Resource Bulletin NE-138. U.S. department of Agriculture, Forest Service, Northeastern Forest Experiment Station.
Butler, J.B., Leatherberry, C.E. 2004. America’s Family Forest Owners. Journal of Forestry. 102:4-14.
Conner, R. C., Hartsell, A. J. 2002. Forest Area and Condi-tions. P. 357-402 In: Wear, d.N., Greis, J.G. (eds.). Southern Forest Resource Assessment. General Technical Report SRS-53. U.S. department of Agriculture, Forest Service, Southern Research Station.
Conway, M.C., Amacher, G.S., Sullivan, J., Wear, d. 2003. decisions nonindustrial forest landowners make: an empir-ical examination. Journal of Forest Economics 9(3):181-203.
Energy Information Administration. 2012. Most states have Renewable Portfolio Standards. Available online at http://205.254.135.7/todayinenergy/detail.cfm?id=4850
Food and Agriculture Organization. 2011. The state of forest resources: a regional analysis. In: State of the World’s Forests. Food and Agriculture Organization of the United Nations. Available online at: http://www.fao.org/docrep/013/i2000e/i2000e00.htm.
Forest2Market. 2008. Southern Forest Industry Braces for Bioenergy. F2M Newsroom. Available online at: http://www.forest2market.com/opencms/opencms/f2m/newsroom.
Hodgden, B., Cusack, C., Tyrrell, M. 2003. An Annotated Bibli-ography on Family Forest Owners. GISF Research Paper 002-R. School of Forestry, Global Institute of Sustainable Forestry, Yale University, New Haven, Connecticut.
Jackson, S.W., Bozell, J.G., Norris, K.M., Rials, T.G., Taylor, A.M. 2010. Wood2Energy: a state of the science and tech-nology report. Jackson, S.W. (ed.). University of Tennessee, Knoxville, Tennessee. 56 p.
Kizhakkepurakkal, A. 2008. Opportunities and Challenges Associated With development of Wood Biomass Energy Production in Louisiana. M.S. thesis. School of Renewable Natural Resources, Louisiana State University and Agricul-tural and Mechanical College, Baton Rouge, Louisiana.
214 | IUFRO 3.08.00 Small-Scale Forestry
Potential for Forest-Based Bioenergy Production for Small and Medium Forest Owners in the Southeast USA
Measells, M.K., Grado, S.C., Hughes, H.G., dunn, M.A., Idassi, J., Zielinske, B. 2005. Nonindustrial Private Forest Landowner Characteristics and Use of Forestry Services in Four Southern States: Results from a 2002-2003 Mail Survey. Southern Journal of Applied Forestry. 29:194-199.
Oxarart, A. 2008. Exploring Written Communication Tech-niques for Complex Natural Resource Issues. M.S. thesis. University of Florida, Gainsville, FL.
Paula, L., Birrer, F. 2006. Including public perspectives in industrial biotechnology and the biobased economy. Journal of Agricultural and Environmental Ethics. 19(3): 253-267.
Perera, P.K.P. 2008. Non-Industrial Private Forest Landowners and U.S. Home Center Retailers’ Attitudes and Perceptions of Forest Certification. M.S. thesis. School of Renewable Natural Resources, Louisiana State University Agricultural Center, Baton Rouge, Louisiana.
Prestemon, J.P., Abt, R.C. 2002. The Southern Timber Market to 2040. Journal of Forestry. 100(7):16-22.
Ragauskas, A.J., Williams, C.K., davison, B.H., Britovsek, G., Cairney, J., Eckert, C.A., Frederick, W.J., Hallet, J.P., Leak, d.J., Liotta, C.L., Mielenz, J.R., Murphey, R., Templer, R. & Tschaplinski, T. 2006. The path forward for biofuels and biomaterials. Science. 311:484-489.
Richter, d., Jenkins, d.H., Karakash, J.T., Knight, J., McCreery, L.R., and Kasimir P. Nemestothy. 2009. Wood Energy in America. Science 323:1432-1433.
Shaw, d.S. 2009. Landowners’ Knowledge, Attitude, and Aspi-rations towards Woody Biomass Markets in North Carolina. M.S. thesis. North Carolina State University, Raleigh, North Carolina.
Smithhart, R., Vlosky, R.P., Blazier, M.A., darby, P., Hughes, G., Terrell, d. In press. Bio-based paths to prosperity for small and medium forest landowners: a pilot study in south-west Louisiana. Open Journal of Forestry.
Vlosky, R.P. 2000. Certification: Perceptions of Non-Industrial Private Forestland Owners in Louisiana. Baton Rouge, LA: Louisiana State University Agricultural Center. Available online at https://www.lsuagcenter.com/NR/rdonlyres/6F12E24F-610B-4691-A3F6-dd805C6CE582/53451/wp41.pdf.
von Sivers, M., Zacchi, G., Olsson, L., Hahn-Hägerdal, B. 1994. Cost analysis of ethanol production from willow using recombinant Escherichia coli. Biotechnology Progress. 10(5):555-560.
2012 Conference Proceedings | 215
Introduction
The government and the association of wood-based industries in Malaysia have recognized the need to develop forest plantations for the sustenance of timber supply. The increasing import values of logs and sawntimber from neighbouring countries indicates the shortage of raw materials for local consumption needs. And to ensure the continuous availability of raw mate-
rials for future timber industry, the government through the Ministry of Plantation Industries and Commodities (KPPK) and the Malaysian Timber Industry Board has undertaken an aggressive programme in the develop-ment of hardwood forest plantations species and at the same time to reduce pressure on the natural forests. With the allocation of production forests or an annual coupe is slowly decreasing, the role of forest plantations is expected to play a significant contribution in increasing
Study on the Domestication of lesser known Tropical Species Neolamarckia Cadamba Among the Small to Medium Scale Forest Owners in MalaysiaAhmad Zuhaidi Yahya1, Hashim, M. N.1, Sarifah, K.1 and Norhazaedawati, B.2
1 Forest Research Institute Malaysia, 52109 Selangor, Malaysia, [email protected]; [email protected], [email protected]
2 Malaysian Timber Industrial Board, Level 12, PGRM Tower 2, No. 8, Jalan Pudu Ulu, Cheras, P.O.Box 10887, 50728 Kuala Lumpur Malaysia, [email protected]
Keywords: diameter, growth and yield, water source
Abstract
The paper discusses on the domestication of lesser known tropical species Neolamarckia cadamba (formerly known as Anthocephalus cadamba) and the results from compilation of achieved growth and yield from trial planting of 4-year-old stands among the small to medium scale forest owners in Malaysia. The species is an early-succes-sion species, which grows best on deep, moist, alluvial sites, often in secondary forests along riverbanks and in the transitional zone between swampy and periodically flooded areas. It can also be found naturally in low lying areas up to 300 m above sea level, and open sites with deep moist alluvial soils as pioneer species. The naturally regenerated stands were observed having relatively fast diameter and height growth. Its relative abundance in the lowland forests in Sabah and Sarawak, led to the continuous extraction of the logs and being utilized for the manufacture of plywood and veneers. With these favourable characteristics, and declining timber resources for the existing wood-based industries, small to medium scale forest owners have accepted this species and currently trial planting them under normal plantation conditions. The recently collected data obtained from trial planting of 4-year old small scale forest owners in Sabah have an average volume varies with sites, sites experiencing deep, moist alluvial soils are having better growth as compared with inland soils. The achieved volume ranges from 85.59 to 138.97 (average; 119.25 m3 ha-1) with an annual production of 29.87 m3 ha-1 year-1. Studies were conducted by the Forest Research Institute Malaysia (FRIM), on four different sites in Sabah (Sandakan), Sarawak (Sibu) and Peninsular Malaysia (Setul) to verify the suitability of the species if planted outside the normal conditions. The growth and yield performance in Kenangan Manis, Sandakan showed encouraging results as compared with growth from other sites such as Sabah Softwood Sdn Bhd, Tawau (single plot), Immense Fleet, Sibu and Setul Forest Reserve, Mantin. Early results showed that the species has negative relationship (R2= 33 %) between diameter growth and distance from water sources, indicating that moisture or wet soil conditions is one of the requirement for good growth. At four years after planting the achieved annual volume increment of the stands was 29.87 m3 ha-1 (Sabah), 23.25 m3 ha-1 (Sarawak) and 8.44 m3 ha-1 (Peninsular Malaysia).
216 | IUFRO 3.08.00 Small-Scale Forestry
Study on the domestication of Lesser Known Tropical Species Neolamarckia cadamba Among Forest Owners...
the raw materials and investments in forestry sector. At this early stage, a total of 375,000 ha of available land have been identified in various states with major portions in Sabah and Sarawak. The objective (s) of the planting programme is to produce minimum tree size of 30 cm diameter at breast height and production of timber into three main categories for industrial wood, furniture and specialty product between the periods of 15 years.
Among the species listed for large scale planting includes the common indigenous Neolamarckia cadamba. This species belongs to the family Rubiaceae was formerly known as Anthocephalus cadamba and later changed to Anthocephalus chinensis and now renamed again by the botanist community as Neolamarkia cadamba. It is a pioneer tree species with a wide geographical and ecological range. It can be found between latitude 27 º N and latitude 9 º S, from India to Nepal, through Myanmar, Thailand and Indo China and eastward in the Peninsular Malaysia, Island of Borneo to Papua New Guinea. It is known as “Kelempayan” in Peninsular Malaysia, “Laran ” in Sabah, “Jabon ” in Kalimantan and “Kadam” in India.
The species can be found growing in moist, warm type of deciduous and evergreen forests in area below 1300 m altitude with annual rainfall from 1500-5000 mm. It is a light demanding species and grows on a variety of soils commonly grows best on deep, moist alluvial ground, along rivers and swampy areas. The tree is fast growing, reaching up to 45 m in height (Hamami & Ismail 1992), without branches for more than 25 m. The diameter at breast height of 100-160 cm has been recorded for this species, but normally trees have smaller diameter (50-100 cm). The species has been identified as a potential timber species and had been successfully used in reforestation programmes in Sarawak (Joseph 1992), Java and Sumatra, Indonesia since 1933. The creamy-coloured timber is categorized under light heavy hardwood having wood density ranges from 245 to 260 kg m3, and characterized by short fibre length and rather unsuitable for pulp, but acceptable in Indonesia (Sumatra) and cultivated as short-rotation plantation species.
This paper briefly reviews the results after four years of domesticating N. cadamba by planting in various localities in Malaysia from the low lying to hilly site. The comparison is based on the current achieved growth and yield knowing the differences in sites and soil types in each locality. It is anticipated that the results generated from this study may help the potential investors in the future selection and planning of the species.
Materials
Sites
In this study four different stands of N. cadamba were assessed namely in private plantation Sandakan, Sabah Softwood Malaysia in Tawau, private plantations in Kanowit and in Setul Forest Reserve, Negeri Sembilan. The study site in Kenangan Manis, Sandakan, Sabah is located at latitude 5o 54 ‘ N and longitude 118 o 04 ‘ E.
The area experiences a typical equatorial climate, with constant temperature, considerable amount of rain and high humidity. The two prevailing monsoons in Sabah, which characterize the climate in this region are the Northeast Monsoon (November to March) and the Southwest Monsoon (May to September). The daily temperature ranges 26 to 28 o C. The annual rainfall, which markedly influenced by two monsoon seasons, brings considerable amount of rain, varies from 2750 to 2900 mm. The elevation within the study site ranges from 25 to 30 m above sea level. Overall the stand is located along riverine areas.
Subsequently, the study site in Sabah Softwood Berhad, Tawau (single plot) is located at the latitude 4 o 16 ‘ N and longitude 117 o 53 ‘ E slightly below in latitude from Sandakan, experiencing similar weather pattern with temperature ranges from 26 to 27 O C. Being located in the southern tip of Sabah, the annual rainfall received is less than in Sandakan from 1700 to 2040 mm (Meteo-rological Department, Sabah). The areas were formerly poor lowland forests and were later converted with stands of fast-growing native species.
The stand in Kanowit, Sibu started in 2007 was under the Immense Fleet Forest Plantation Programme covers an area of 2,000 hectares of planted N. cadamba. The areas in general are undulating with steep slopes between an elevation of 100 and 180 m above sea level.
The last area being studied was situated in Negeri Sembilan in the western part of Peninsular Malaysia at longitude 2 o 47 ‘, latitude 101 o 55 ‘ E. Located just north of the Equator, the area has a perhumid climate with average daily temperature ranging from 27 to 32 o C. The annual rainfall was between 1900 and 2050 mm indicating that the area receives precipitation at the middle range of rainfall expected in the humid tropics.
The 4-year-old study plots of four different provenances/sources (Ulu Segama, Sibuga, Keningau and Lahad Datu) were established in Setul Forest Reserve, Mantin, Negeri Sembilan. Seedlings were trial planted in 2006 in different sites ranging from low lying to hilly areas. The sites were located at an elevation between 75 and 250 m above sea level on the lower slopes of the Titi-wangsa range, Setul Forest Reserve, Negeri Sembilan.
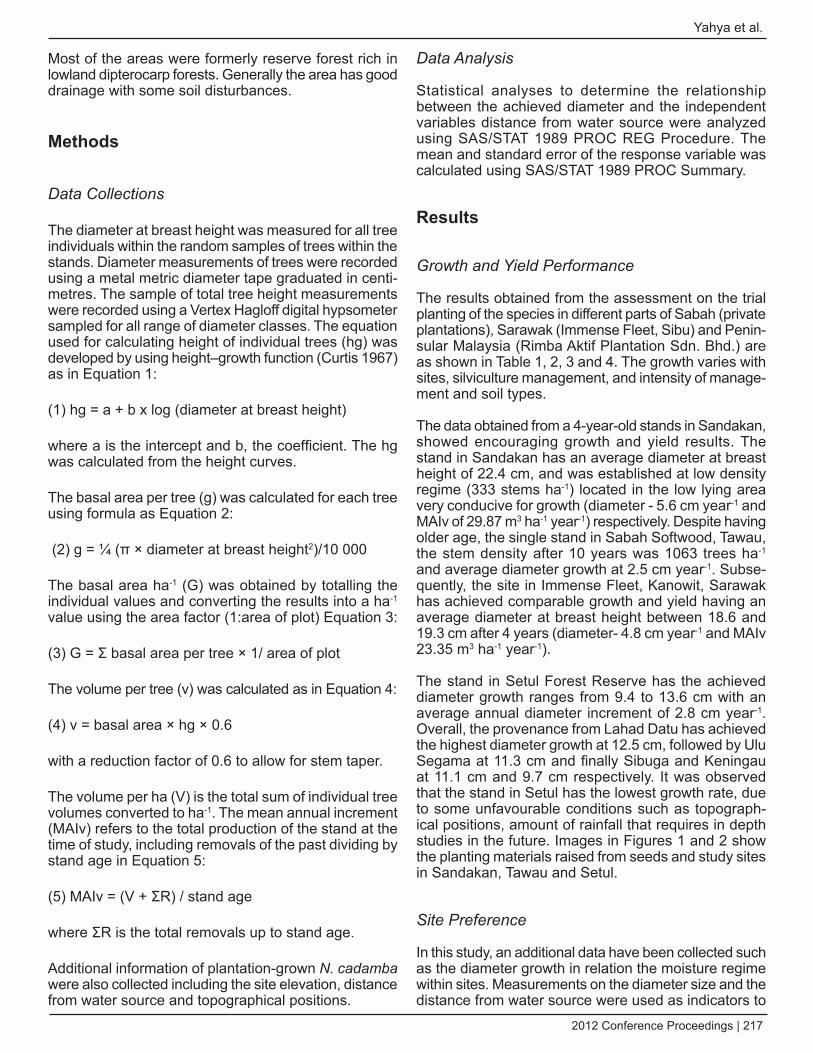
2012 Conference Proceedings | 217
Yahya et al.
Most of the areas were formerly reserve forest rich in lowland dipterocarp forests. Generally the area has good drainage with some soil disturbances.
Methods
data Collections
The diameter at breast height was measured for all tree individuals within the random samples of trees within the stands. Diameter measurements of trees were recorded using a metal metric diameter tape graduated in centi-metres. The sample of total tree height measurements were recorded using a Vertex Hagloff digital hypsometer sampled for all range of diameter classes. The equation used for calculating height of individual trees (hg) was developed by using height–growth function (Curtis 1967) as in Equation 1:
(1) hg = a + b x log (diameter at breast height)
where a is the intercept and b, the coefficient. The hg was calculated from the height curves.
The basal area per tree (g) was calculated for each tree using formula as Equation 2:
(2) g = ¼ (π × diameter at breast height2)/10 000
The basal area ha-1 (G) was obtained by totalling the individual values and converting the results into a ha-1 value using the area factor (1:area of plot) Equation 3:
(3) G = Σ basal area per tree × 1/ area of plot
The volume per tree (v) was calculated as in Equation 4:
(4) v = basal area × hg × 0.6
with a reduction factor of 0.6 to allow for stem taper.
The volume per ha (V) is the total sum of individual tree volumes converted to ha-1. The mean annual increment (MAIv) refers to the total production of the stand at the time of study, including removals of the past dividing by stand age in Equation 5:
(5) MAIv = (V + ΣR) / stand age
where ΣR is the total removals up to stand age.
Additional information of plantation-grown N. cadamba were also collected including the site elevation, distance from water source and topographical positions.
data Analysis
Statistical analyses to determine the relationship between the achieved diameter and the independent variables distance from water source were analyzed using SAS/STAT 1989 PROC REG Procedure. The mean and standard error of the response variable was calculated using SAS/STAT 1989 PROC Summary.
Results
Growth and Yield Performance
The results obtained from the assessment on the trial planting of the species in different parts of Sabah (private plantations), Sarawak (Immense Fleet, Sibu) and Penin-sular Malaysia (Rimba Aktif Plantation Sdn. Bhd.) are as shown in Table 1, 2, 3 and 4. The growth varies with sites, silviculture management, and intensity of manage-ment and soil types.
The data obtained from a 4-year-old stands in Sandakan, showed encouraging growth and yield results. The stand in Sandakan has an average diameter at breast height of 22.4 cm, and was established at low density regime (333 stems ha-1) located in the low lying area very conducive for growth (diameter - 5.6 cm year-1 and MAIv of 29.87 m3 ha-1 year-1) respectively. Despite having older age, the single stand in Sabah Softwood, Tawau, the stem density after 10 years was 1063 trees ha-1 and average diameter growth at 2.5 cm year-1. Subse-quently, the site in Immense Fleet, Kanowit, Sarawak has achieved comparable growth and yield having an average diameter at breast height between 18.6 and 19.3 cm after 4 years (diameter- 4.8 cm year-1 and MAIv 23.35 m3 ha-1 year-1).
The stand in Setul Forest Reserve has the achieved diameter growth ranges from 9.4 to 13.6 cm with an average annual diameter increment of 2.8 cm year-1. Overall, the provenance from Lahad Datu has achieved the highest diameter growth at 12.5 cm, followed by Ulu Segama at 11.3 cm and finally Sibuga and Keningau at 11.1 cm and 9.7 cm respectively. It was observed that the stand in Setul has the lowest growth rate, due to some unfavourable conditions such as topograph-ical positions, amount of rainfall that requires in depth studies in the future. Images in Figures 1 and 2 show the planting materials raised from seeds and study sites in Sandakan, Tawau and Setul.
Site Preference
In this study, an additional data have been collected such as the diameter growth in relation the moisture regime within sites. Measurements on the diameter size and the distance from water source were used as indicators to
218 | IUFRO 3.08.00 Small-Scale Forestry
Study on the domestication of Lesser Known Tropical Species Neolamarckia cadamba Among Forest Owners...
obtain the relationship between both parameters. The results obtained from this study shown that N. cadamba is rather site-specific having diameter size decreases with high moisture regime (coefficient of determination (R2 ) 33.4 percent). The graph in Figure 3 show the direct negative relationship between diameter growth with the distance from water source.
The relationship between growth and elevation has not shown any indication affecting the growth and the species performs well regardless of altitude. However, it is recom-medned that separate study on this matter be conducted.
Discussions and Conclusion
In comparing the performance of the species, the growth and yield from Setul Forest Reserve were the lowest. After 4 years, the N. cadamba stands has reached an average diameter at breast height between 9.4 and 13.6 cm, much lower as compared with similar stands in low lying areas with high moisture regime such as in Sabah and Sarawak. The stands in Sandakan showed encouraging growth and yield results having an average diameter of 5.6 cm year-1. These results have indicated the normal ecolog-ical requirements of the species which, are important for better growth and yield perfor-mance.
Apart on the growth and yield performance, the results showed on the potentials of the species to be domes-ticated from the natu-rally grown trees in the wild. Similar studies
conducted in Indonesia (Tony 2012) have shown planting of the species in the restoration of degraded sites in Riau, Sumatra..
Subsequently on the effects of growth on the topograph-ical position of the species has not provides any conclu-sive results. Despite having similar topographical posi-tions in Setul and Immense Fleet, the average growth and yield in the former was much lower (8.44 m3 ha-1) than in the later (23.25 m3 ha-1). The continuous moni-
Plots Age N dg hg G V MAIv Ele1 4 333 19.9 13.85 10.42 85.59 21.65 25 – 302 4 327 23.7 15.46 14.36 133.20 33.303 4 313 23.6 15.93 14.54 138.97 34.74Average 22.4 119.25 29.87MAI 5.6
Table 1. Private plantations, Kenangan Manis, Sandakan (150 trees).
Plots Age N dg hg G V MAIv Ele.1 10 1063 25.2 17.39 52.83 551.22 55.12 75 MAI 2.5
Table 2. Sabah Softwood Berhad, Tawau, Sabah (75 trees).
Plots Age N dg hg G V MAIv Ele.1 4 437 19.3 14.0 12.82 107.69 31.41 181.62 4 388 19.2 12.9 11.29 87.38 21.84 176.63 4 350 18.6 11.6 9.49 66.05 16.51 99.7Average 19.0 87.04 23.25MAI 4.8
Table 3. Immense Fleet stands, Kanowit, Sarawak (150 trees).
Table 4. Setul Forest Reserve, Negeri Sembilan (400 trees).
Plot/source Age N dg hg G V MAIv Ele.1/Keningau 4 855 9.4 6.56 5.89 23.18 5.79 75 - 2502 882 10.0 7.78 6.93 32.35 8.083/Ulu Segama 4 827 12.2 8.64 9.64 49.97 12.494 782 10.3 7.13 6.52 27.89 6.935/Sibuga 4 418 11.4 8.47 4.26 21.65 5.416 682 10.8 7.97 6.29 30.08 7.527/L. Datu 4 573 13.6 10.25 8.33 51.22 12.818 627 11.4 8.78 6.43 33.87 8.47Average 33.78 8.44MAI 2.8N- number of stems ha-1, dg – average diameter at breast height corresponding to basal area (cm), hg - total tree height (m); G – basal area ha-1, V – volume ha-1 ; MAI – mean annual increment; Ele. – elevation (m)
2012 Conference Proceedings | 219
Yahya et al.
toring on the performance of the species in both sites may help to answer on the importance of sites prior implementation of any planting projects.
Similarly, with the ecolog-ical requirements of the species, observation showed that N. cadamba was rather site-specific naturally growing along riverside areas or in asso-ciation with water. The results relating diameter growth with distance from water source produces an R2 coefficient of 33.4 % (Figure 3), meaning 66.6 % of the variables are unexplained. As such more data are required to improve the relationship affecting diameter growth of the species..
In all the stands observed except in Tawau (single plot), the stands are still at the very early stage of the rotation, and the data obtained is still preliminary and continuous measure-
ments and observations are proposed to obtain more reliable results. More scientific studies should be conducted in particular the spacing and techniques of planting materials production that may provide more reliable information on the silvicultural aspects of the species. However, the results obtained from the domestication study seemed prom-ising and may help in answering questions pertaining the potential and suitability of the species, objectives of planting and restora-tion works in areas having high moisture regime or utilization of inundated areas, and finally on the assessment of any occurrence of potential pests or diseases.
Acknowledgements
We would like to express our sincere thanks to Rimba Aktif Plantation, Sabah State Director of Forestry and Sabah Soft-woods Berhad (SSB) for their permission to conduct this study in the N. cadamba stands in Setul Forest Reserve, Kenangan Manis, Sandakan and Tawau. Our special thanks
Figure 3. Negative relationship between diameter at breast height (dBH) and distance from water source.
Figure 2. Stands in Sabah Softwood and Setul Forest Reserve.
Figure 1. Seedlings of Neolamarckia cadamba and 4-year-old stand in Kenangan Manis, Sandakan, Sabah.
220 | IUFRO 3.08.00 Small-Scale Forestry
Study on the domestication of Lesser Known Tropical Species Neolamarckia cadamba Among Forest Owners...
to the Director-General of the Forestry Research Insti-tute Malaysia (FRIM) and Malaysian Timber Industrial Board (MTIB) as this study was part of the Memorandum of Agreement (2010-2012) between FRIM and MTIB. Special thanks to Ms Maria Ajik, scientist from Forest Research Centre, Sepilok and Ms Yani Japarudin, SSB, staffs of Forest Plantation Programme in FRIM and MTIB for facilitating in the data collection.
References
Curtis, R. O. (1967). Height-diameter age equations for second-growth Douglas fir. Forest Science 3 (4): 365-375.
Hamami, S. & Ismail, J. (1992). Physical Properties of Planted Kelempayan (Anthocephalus chinensis). Pp 77 – 89 in Ahmad Said, S., Razali A. K., Mohd Shahwahid, O., Aminuddin, M., Faridah Hanum, I. & Mohd Hamami, S. (Eds.) Proceedings of a National Seminar Indigenous Species for Forest Plantation, Faculty of Forestry, Univer-sity Pertanian Malaysia, Serdang, Malaysia, 23-24 April 1992..
Joseph, J. K. (1992). Forester’s Perception on Indigenous Species for Forest Plantations in Sarawak. Pp 14 – 23 in Ahmad Said, S., Razali A. K., Mohd Shahwahid, O., Aminuddin, M., Faridah Hanum, I. & Mohd Hamami, S. (Eds.) Proceedings of a National Seminar Indigenous Species for Forest Plantation, Faculty of Forestry, University Pertanian Malaysia, Serdang, Malaysia, 23-24 April 1992.
Tony, W. (2012). Responsibly managed plantations on peatland – A positive story. Paper presented at the Workshop on the Enhanced Sustainability of Forestry Practices on Peatlands, IPB International Convention Centre, Bogor, Indonesia, 27-28 June 2012.
2012 Conference Proceedings | 221
Introduction
Landowner education is an effective tool for improving stewardship on small forest ownerships (Kilgore et al. 2007). Challenges exist in reaching the geographically broad and dispersed audience of small forest land-owners, though. In Washington, for example, there are over 215,000 small forest owners (Rogers and Cooke, 2009). Traditional in-person extension education offer-ings such as workshops, field days, and individual assis-tance can only reach a fraction of this audience.
Expanding audience reach has become even more chal-lenging in recent years due to budget cuts to extension and other service forestry programs. Extension agents may find themselves covering more counties than previ-ously, some counties may not have extension forestry services at all, and extension workshop locations may become more geographically limited. Distance learning through online education has the potential to address these issues by reaching more landowners in more places with lower cost and greater efficiency. Distance education is being adopted by natural resource educa-tors in higher education (Sener 2011), and it is also being used in extension forestry education (e.g. Allred and Smallidge 2010, Jones et al. 2007).
Clientele access to the internet has been a past concern of extension educators (Dromgoole and Boleman 2006). However, home access to high-speed internet has greatly improved, as broadband service has permeated most communities, even in rural areas. In Washington, for example, over 96% of households across the state had access to broadband internet as of 2011 (Washington State Broadband Office, 2011). Landowners are indeed seeking forestry education resources online. In a 2007 survey of small forest landowners in northwest Wash-ington that was conducted by Washington State Univer-sity (WSU) Extension (n=1,053), 43% of respondents reported that they were likely to use online resources for forestry education. This was more than either workshops (37%) or one-on-one assistance (29%), and this number has likely increased since the survey was conducted.
There are two key types of online education delivery: synchronous and asynchronous. Synchronous content is delivered in real time, i.e. a live webinar that is broadcast on a schedule. Asynchronous content is pre-recorded and made available on demand for self-directed learning. Asynchronous content has several advantages. Partici-pants are not tied to a certain schedule, they can work through the material at their own pace, and they can come back to revisit and review the content at a later date. Asynchronous content reduces long term demands on instructor time, as once it is published it requires little maintenance (though occasional revisions may be needed).
WSU Extension has developed a comprehensive asyn-chronous online education program for small forest land-owners called Forest Stewardship University (FSU)1. Our goal was to get our most popular forestry work-shops online to reach new and larger audiences of forest owners at low cost and without significant new time demands on extension agents and partner agency specialists. FSU features a series of online learning modules created and delivered using Adobe Presenter and Adobe Connect. The program successfully launched in 2012 with 25 different modules on topics such as tree and plant identification, stand dynamics, silvicul-ture, forest health, invasive weeds, forest practices, and others.
The development of FSU involved significantly more time and challenges than we initially anticipated. A number of important lessons were learned in the process. This paper reviews the challenges and solutions that we encountered, suggests some best practices for devel-oping successful online content, and reports early obser-vations on the initial public use of the program. The purpose of this paper is to provide guidance to exten-sion or similar programs in other states that may be looking at online education as a way to better reach small forest landowners.
1 http://extension.wsu.edu/forestry/FSU/
Developing An Asynchronous Online Education Program for Small Forest landownersKevin W. Zobrist1
1 Washington State University Extension, 600 128th St SE Everett WA 98208, [email protected]
Keywords: technology, education, extension
222 | IUFRO 3.08.00 Small-Scale Forestry
developing An Asynchronous Online Education Program for Small Forest Landowners
Planning and Pre-Production
designing Content for Online delivery
We faced the biggest challenges in and spent the most time on the planning and pre-production stages. We made the initial mistake, which is not uncommon for insti-tutions when first getting involved with distance learning, which was thinking that we could simply post existing in-person class or workshop content online and call it an online training. The problem is that content designed for in-person delivery often does not make for a good online experience. Unlike an in-person workshop, online participants are not a captive audience, and there may be numerous things competing for a participant’s atten-tion when she or he is at home at the computer (phone, email, TV, children, pets, dinner on the stove, etc.). Online content should be interactive, engaging, and delivered in manageable time chunks in order to keep the audience’s attention. A recorded video of presenters at a live workshop is not likely to accomplish this. Rather, for quality results, online content should be designed for online delivery from the beginning.
In many cases this is going to mean developing new content or making major revisions to existing content. This introduces a major challenge, which is that the instructors, whose tight schedules are part of the ratio-nale for developing asynchronous online learning oppor-tunities, are now tasked with developing new content, which can involve significant time and effort. Finding adequate staff time for instructors to develop new, high-quality online content was perhaps the single biggest challenge we faced in this project.
Image Rights
There are several other considerations when devel-oping online content. Putting content online where it is available to a worldwide audience and may persist indefinitely is very different from a transitory, in-person workshop. Delivering asynchronous education content online is a publishing process, and in many ways an asynchronous online learning module functions more like a multimedia publication than a workshop. As such, the content must meet the standards of a publication, which can be much more rigorous than a presentation given at a workshop.
An example of this higher standard is the issue of copy-right. Workshop presentations often include content (photos, illustrations, diagrams, etc.) that were “begged, stolen, or borrowed” from other sources. In many cases the original source is unknown, as extension presenta-tions are often developed over many years with content swapped multiple times between different professionals. A presenter may get away with that with a transitory workshop, but when the content is published online,
it exposes the institution to a much greater poten-tial liability. Institutional requirements at WSU include obtaining written permission to publish images online that are non-original and not public domain. Other institutions likely have similar policies. It should not be assumed that using an image in an online presentation is exempted as fair use because it is educational, espe-cially if any sort of user fees will be charged to access the content.
The need to document the copyright status and give appropriate credit for each presentation image was a significant setback for us. Many of the images that we had planned to use had to be replaced due to sources that were either unknown or unwilling to provide written permission for use. Finding images that we were free to use was time-consuming and caused consternation among instructors who did not understand why presen-tation content they had used for years was suddenly unacceptable.
Issues with images are further compounded by person-ality rights. As with copyright, institutional requirements at WSU include written permission to use someone’s photographic likeness. Many photos that included recog-nizable images of people had to be scrapped, as the age of the photographs and the anonymous nature of those appearing in them made it impossible to obtain the required permissions. This can be a significant problem, as instructors often use photos of people doing things because they are such engaging images.
Review and Editing Requirements
Other issues around gathering content for online delivery include review and editing. Peer review may be a publi-cation requirement of the institution or otherwise highly desired to help ensure robust, high-quality content. Peer review can add significant value to the online content, but it further increases the time and effort required for publication. Professional copy editing of presentation slides and transcripts should also be considered. This can help ensure consistent formatting and eliminate spelling and typographical errors that could diminish the perceived quality of the content when viewed by the public.
delivery Logistics
The specifics of how completed online modules will be delivered to the public are also important to plan in advance, as these details can impact how modules need to be designed and created. There are several products and platforms available for delivering online content. We used the Adobe Presenter2 software to create the learning modules, which are then streamed
2 http://www.adobe.com/products/presenter.html
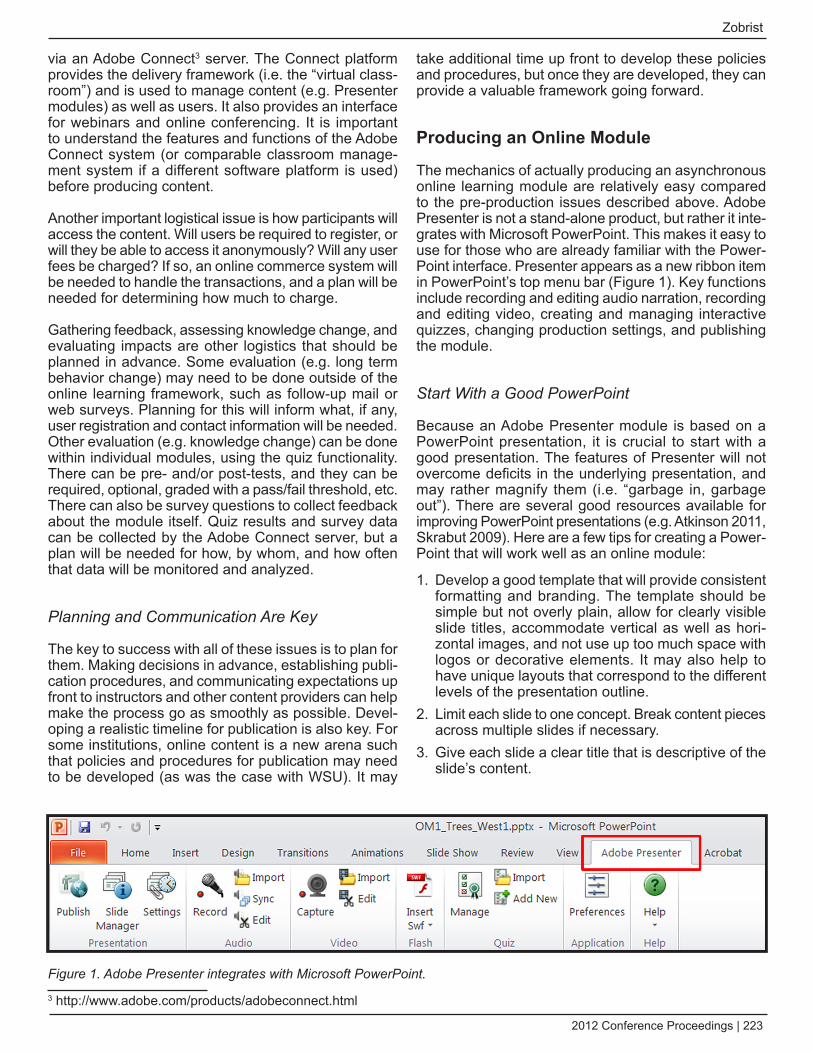
2012 Conference Proceedings | 223
Zobrist
via an Adobe Connect3 server. The Connect platform provides the delivery framework (i.e. the “virtual class-room”) and is used to manage content (e.g. Presenter modules) as well as users. It also provides an interface for webinars and online conferencing. It is important to understand the features and functions of the Adobe Connect system (or comparable classroom manage-ment system if a different software platform is used) before producing content.
Another important logistical issue is how participants will access the content. Will users be required to register, or will they be able to access it anonymously? Will any user fees be charged? If so, an online commerce system will be needed to handle the transactions, and a plan will be needed for determining how much to charge.
Gathering feedback, assessing knowledge change, and evaluating impacts are other logistics that should be planned in advance. Some evaluation (e.g. long term behavior change) may need to be done outside of the online learning framework, such as follow-up mail or web surveys. Planning for this will inform what, if any, user registration and contact information will be needed. Other evaluation (e.g. knowledge change) can be done within individual modules, using the quiz functionality. There can be pre- and/or post-tests, and they can be required, optional, graded with a pass/fail threshold, etc. There can also be survey questions to collect feedback about the module itself. Quiz results and survey data can be collected by the Adobe Connect server, but a plan will be needed for how, by whom, and how often that data will be monitored and analyzed.
Planning and Communication Are Key
The key to success with all of these issues is to plan for them. Making decisions in advance, establishing publi-cation procedures, and communicating expectations up front to instructors and other content providers can help make the process go as smoothly as possible. Devel-oping a realistic timeline for publication is also key. For some institutions, online content is a new arena such that policies and procedures for publication may need to be developed (as was the case with WSU). It may
3 http://www.adobe.com/products/adobeconnect.html
take additional time up front to develop these policies and procedures, but once they are developed, they can provide a valuable framework going forward.
Producing an Online Module
The mechanics of actually producing an asynchronous online learning module are relatively easy compared to the pre-production issues described above. Adobe Presenter is not a stand-alone product, but rather it inte-grates with Microsoft PowerPoint. This makes it easy to use for those who are already familiar with the Power-Point interface. Presenter appears as a new ribbon item in PowerPoint’s top menu bar (Figure 1). Key functions include recording and editing audio narration, recording and editing video, creating and managing interactive quizzes, changing production settings, and publishing the module.
Start With a Good PowerPoint
Because an Adobe Presenter module is based on a PowerPoint presentation, it is crucial to start with a good presentation. The features of Presenter will not overcome deficits in the underlying presentation, and may rather magnify them (i.e. “garbage in, garbage out”). There are several good resources available for improving PowerPoint presentations (e.g. Atkinson 2011, Skrabut 2009). Here are a few tips for creating a Power-Point that will work well as an online module:
Develop a good template that will provide consistent 1. formatting and branding. The template should be simple but not overly plain, allow for clearly visible slide titles, accommodate vertical as well as hori-zontal images, and not use up too much space with logos or decorative elements. It may also help to have unique layouts that correspond to the different levels of the presentation outline.Limit each slide to one concept. Break content pieces 2. across multiple slides if necessary.Give each slide a clear title that is descriptive of the 3. slide’s content.
Figure 1. Adobe Presenter integrates with Microsoft PowerPoint.
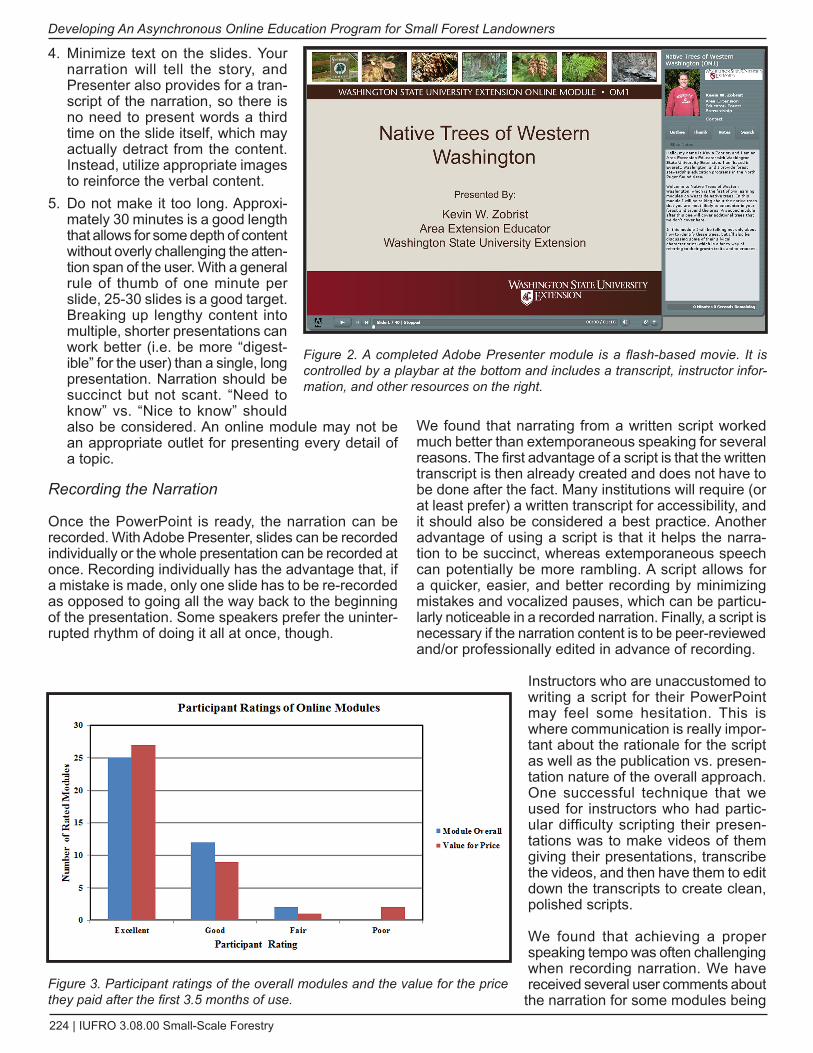
224 | IUFRO 3.08.00 Small-Scale Forestry
developing An Asynchronous Online Education Program for Small Forest Landowners
Minimize text on the slides. Your 4. narration will tell the story, and Presenter also provides for a tran-script of the narration, so there is no need to present words a third time on the slide itself, which may actually detract from the content. Instead, utilize appropriate images to reinforce the verbal content.Do not make it too long. Approxi-5. mately 30 minutes is a good length that allows for some depth of content without overly challenging the atten-tion span of the user. With a general rule of thumb of one minute per slide, 25-30 slides is a good target. Breaking up lengthy content into multiple, shorter presentations can work better (i.e. be more “digest-ible” for the user) than a single, long presentation. Narration should be succinct but not scant. “Need to know” vs. “Nice to know” should also be considered. An online module may not be an appropriate outlet for presenting every detail of a topic.
Recording the Narration
Once the PowerPoint is ready, the narration can be recorded. With Adobe Presenter, slides can be recorded individually or the whole presentation can be recorded at once. Recording individually has the advantage that, if a mistake is made, only one slide has to be re-recorded as opposed to going all the way back to the beginning of the presentation. Some speakers prefer the uninter-rupted rhythm of doing it all at once, though.
We found that narrating from a written script worked much better than extemporaneous speaking for several reasons. The first advantage of a script is that the written transcript is then already created and does not have to be done after the fact. Many institutions will require (or at least prefer) a written transcript for accessibility, and it should also be considered a best practice. Another advantage of using a script is that it helps the narra-tion to be succinct, whereas extemporaneous speech can potentially be more rambling. A script allows for a quicker, easier, and better recording by minimizing mistakes and vocalized pauses, which can be particu-larly noticeable in a recorded narration. Finally, a script is necessary if the narration content is to be peer-reviewed and/or professionally edited in advance of recording.
Instructors who are unaccustomed to writing a script for their PowerPoint may feel some hesitation. This is where communication is really impor-tant about the rationale for the script as well as the publication vs. presen-tation nature of the overall approach. One successful technique that we used for instructors who had partic-ular difficulty scripting their presen-tations was to make videos of them giving their presentations, transcribe the videos, and then have them to edit down the transcripts to create clean, polished scripts.
We found that achieving a proper speaking tempo was often challenging when recording narration. We have received several user comments about the narration for some modules being
Figure 2. A completed Adobe Presenter module is a flash-based movie. It is controlled by a playbar at the bottom and includes a transcript, instructor infor-mation, and other resources on the right.
Figure 3. Participant ratings of the overall modules and the value for the price they paid after the first 3.5 months of use.
2012 Conference Proceedings | 225
Zobrist
either too fast or too slow, suggesting that users may be particularly sensitive to this aspect. Speaking too fast was the initial problem for most instructors (due to nervousness, excitement, etc.), but in some cases this was overcorrected such that it became too slow. Ideally, the pace should not be so fast that users struggle to keep up, but not so slow such that listening becomes tedious. Newscasters are good examples of a desirable speaking tempo for recording modules. Practicing beforehand is helpful, and vocal warm-up exercise before recording may also be beneficial.
Finishing Touches
There are several finishing touches that can be added to a completed presentation. The quiz manager allows inclusion of one or more quizzes or surveys, which can include any number of multiple choice, true/false, fill-in-the-blank, matching, short answer, or rating questions. Instructor information can also be included, such as a photo of the instructor, agency or institution logo, and contact information. This can help users better connect with the instructor.
Interactive and multimedia elements can also be included in the presentation. Video clips can be embedded in a blank slide. Web links can be included on slides, allowing users to click the link in the presentation to open up additional resources in new windows. We found that the best way to incorporate handouts and supplemental readings was to post them on the web and include a hyperlink in the presentation.
Adobe Presenter publishes modules as flash-based video. This allows for cross-platform compatibility with multiple operating systems and web browsers, without the need for users to have special software. The narrated slide presentation plays in the main window, and users can play, pause, advance, or go back using playbar controls at the bottom (Figure 2). A separate area on the right displays the instructor information at the top, and below that users can choose between viewing the narra-tion transcript (as shown in Figure 2), a presentation outline, slide thumb-nails, or a word search function.
Initial Use of the Modules
First Impressions
FSU was launched in mid-February 2012. Its availability was advertised throughout the state by WSU and partner organizations via newslet-ters, websites, social networks, and
flyers. Nominal fees are charged to access each module, ranging from $5.00 to $9.00 depending on the length and scope of the module. Discounted bundles of multiple modules (in topic groups) are also offered.
As of May 31, 2012, 136 modules had been purchased by 33 different users. Most of these users were small forest landowners, though several were from other universities or natural resources organizations who were curious as to what WSU Extension was offering. While we did not have specific expectations, the overall usage has not been as high as we had hoped. The most popular modules have been introductory topics such as tree and plant identification.
From those who have used the modules, the response has been very positive. Of the user ratings of the overall modules, 95% were “Excellent” or “Good” (Figure 3). We also received some helpful comments from early users. For instance, we had initially offered module access for a 30-day period. Participants indicated that it would be a much greater value to have longer-term access for review and reference, especially when multiple modules were purchased. Based on this feedback, we now offer essentially indefinite access, but guaranteed for at least one year. This is another example of how online modules tend to function more as a multimedia publication than a class or workshop.
Module Completion
One of the things that we have observed is that many users do not actually access the modules after purchasing them. After the first 3.5 months, only 62% of purchased modules had even been attempted, and only 44% of purchased modules had been completed. Most of those who completed the modules passed the knowledge test and completed a short evaluation at the
Figure 4. Levels of user completion of online modules after the first 3.5 months of use.
226 | IUFRO 3.08.00 Small-Scale Forestry
developing An Asynchronous Online Education Program for Small Forest Landowners
end (Figure 4). Offering long-term access may contribute to the lack of timely use. Users may view it, like a publi-cation, as something that is available “on the shelf” for reference but with no particular timeline for use. However, we observed that even with the 30-day limited access, many purchased modules were not completed or even attempted.
Is Cost an Issue?
One of the questions we are facing is whether or not cost is a barrier to use. One of the goals for FSU was to be a new source of revenue to support the WSU Extension Forestry Program. If current usage rates are sustained, FSU will generate approximately $2,500 in revenue per year. While not a huge source of revenue, it would help cover system licenses and technical support, essentially making the online system self-sustaining.
Fee-based modules may have difficulty competing with free sources of online information. On the other hand, fees could also increase the perceived value and credibility of the modules. We asked users to rate the value they felt they received for the price they paid, and 92% responded “Excellent” or “Good.” We also offered several promotions, such as a 50% discount for a limited time. While these promotions yielded some additional purchases, there were not many. These factors suggest that, at current pricing, cost is not a significant barrier. A better test, however, would be to experiment with offering some modules for free and comparing usage.
Possible Strategies for Increasing Usage
In order for FSU to be an effective education program in the long term, strategies will be needed to increase use and completion of the online modules. One thing missing is an incentive (other than learning and personal edifi-cation) to successfully complete online modules. This was also suggested by several landowners in response to a question posted via the WSU Extension Forestry Facebook page asking for ideas to increase partici-pation. Some sort of recognition could go a long way toward increasing use. This could be as simple as a certificate of achievement.
Another possibility is to assign modules “credits” that users could accumulate toward an award or recogni-tion. This could be done in collaboration with the state landowner association or state chapter of the American Tree Farm System. Bundled sets of modules may also be eligible for continuing education credits through the Society of American Foresters, International Society of Arboriculture, state pesticide certification program, Master Logger program, teacher clock hours, etc. This could generate interest among forestry professionals looking for quick and affordable opportunities to earn continuing education credits. This deviates from the orig-
inally intended audience of forest landowners, though continuing education for professionals could actually end up being a better target audience for asynchronous online delivery.
Effective advertising and promotion will be an impor-tant part of any strategy to increase use. It is especially important to find ways to reach new audience segments who are not already engaged with service forestry news-letters and such.
Summary
Asynchronous online delivery can be an effective tool to provide outreach and education to small forest landowners. Adobe Presenter is one tool available to produce high-quality online learning modules. Devel-oping online content is not as simple as posting existing educational workshop materials online. Developing an effective asynchronous online program takes signifi-cant preparation and planning, and institutional policies and procedures may need to be created or revised to ensure the quality and integrity of information delivered in this format.
Institutions and organizations looking to undertake a project like this should not underestimate the staff time needed to plan and prepare content. Advance planning should also be done to determine the logistics of delivery, pricing, registration, and evaluation. Good communica-tion with participating instructors about procedures and expectations is crucial, as many instructors will not be accustomed to online teaching techniques. In many ways, asynchronous online learning modules function more like electronic, multi-media extension publica-tions than a presentation or a class. Thus a publication model may be needed to successfully publish online modules.
Online learning modules are unlikely to get a high volume of use without an effective strategy to generate interest. This should include significant advertising effort, as well as an achievement recognition program to encourage users to not only purchase or register for a module, but to actually complete it. Both free and fee-based programs can be effective, but pricing should be carefully considered when charging user fees. Market research may be needed to determine if or how much to charge. Continuing education credits may be an effective tool to generate interest among forestry professionals, depending on who the target audience is.
References
Allred, Shorna B. and Peter J. Smallidge. 2010. An Educa-tional Evaluation of Web-Based Forestry Education. Journal of Extension 48(6). Available online at: http://www.joe.org/joe/2010december/a2.php.
2012 Conference Proceedings | 227
Zobrist
Atkinson, Cliff. 2011. Beyond Bullet Points. Third Edition. Microsoft Press, Redmond, WA.
dromgoole, d.A. and C.T. Boleman. distance Education: Perceived Barriers and Opportunities Related to Extension Program delivery. Journal of Extension 44(5). Available online at: http://www.joe.org/joe/2006october/rb1.php.
Jones, R., A. Goheen, K. dhuyvetter, T. Kastens, and V. Amanor-Boadu. 2007. Using distance Education in Exten-sion Programming. Journal of Agricultural and Applied Economics 39(2):265-274.
Kilgore, M.A., J.L. Greene, M.G. Jacobson, T.J. Straka, and S.E. Daniels. 2007. The influence of financial incentive programs in promoting sustainable forestry on the nation’s family forests. Journal of Forestry 105(4):184-190.
Rogers, Luke, and Andrew Cooke. 2009. The 2007 Wash-ington State Forestland database. Final Report. Univer-sity of Washington College of Forest Resources, Seattle, WA. Available online at: http://www.ruraltech.org/projects/wrl/fldb/pdf/The_2007_Washington_State_Forestland_database.pdf.
Sener, John. 2011. Why Natural Resources Educators Should Welcome Online Education. Journal of Forestry 109(7):392-396.
Skrabut, Stan. 2009. Improving Your PowerPoint Presen-tations. Available online at http://www.slideshare.net/skrabut/improving-your-power-point-presentations-by-stan-skrabut.
Washington State Broadband Office. 2011. 2011 Annual Report on Broadband in Washington. Olympia, WA. Avail-able online at http://broadband.wa.gov/sites/default/files/docs/2011BBAnnualRptFINAL.pdf


Published at the Center for Research on Sustainable Forests,
University of Maine
Related Documents