Asian Development Bank International Telecommunication Union Project on Rural ICT Policy Advocacy, Knowledge Sharing, and Capacity Building Country Case Study Indonesia Draft 1.0 September 09, 2010 prepared by Arif Wismadi and David N. Townsend

Welcome message from author
This document is posted to help you gain knowledge. Please leave a comment to let me know what you think about it! Share it to your friends and learn new things together.
Transcript
8/3/2019 ITU-ADB Interrim Indonesia Country Report
http://slidepdf.com/reader/full/itu-adb-interrim-indonesia-country-report 1/109
Asian Development BankInternational Telecommunication Union
Project on
Rural ICT Policy Advocacy, Knowledge Sharing,and Capacity Building
Country Case Study
Indonesia
Draft 1.0
September 09, 2010
prepared by
Arif Wismadiand
David N. Townsend

8/3/2019 ITU-ADB Interrim Indonesia Country Report
http://slidepdf.com/reader/full/itu-adb-interrim-indonesia-country-report 2/109
ADB Rural ICT Project
Indonesia Country Case Study Report
2
Table of Contents
Chapter 1
Country Overview 7
1.1 National geographic, demographic status 7
1.2 Socio-Economic status and indicators 8
1.3 Scope and status of rural areas, population 8
1.4 Conclusion: 9
Chapter 2 National ICT Industry Status of Indonesia 11
2.1 ICT Market Background of Indonesia 11
2.2 ICT Regulatory Body 14
2.3 ICT Industry Role for Indonesian Economy 15
2.4
Telecommunication Industry Status 16
2.4.1 Network Capacity among Providers 19
2.4.2 Subscriber Growth 25
2.4.3 Tele-density 30
2.4.4 Telecommunication Operators Income 31
2.4.5 Operational Cost of Telecommunication Provider 36
2.4.6 Telecommunication Operator Employment 37
2.5 Computer and Internet in Indonesia 38
2.5.1 Computer Utilization in Indonesia 39
2.5.2 Internet Utilization in Indonesia 41
2.6 Television and Radio 47
2.7 Existing Technology in Indonesia 50
Chapter 3 Status of Rural ICT in Indonesia 55
3.1 Between Rural Area and ICT in Indonesia 55
3.2 ICT Penetration in Rural Area in Indonesia 55
3.3 Technology Utilization of Rural IC in Indonesia 60
Chapter 4 Rural ICT Policies, Programs, Initiatives 64
4.1 Background 64
4.2 Short History in Approaching USO 64
4.3 USO Overview 65
4.4 Legal Reference of USO Program 66
4.5 USO Funding 67
4.6 USO General Scheme 68
8/3/2019 ITU-ADB Interrim Indonesia Country Report
http://slidepdf.com/reader/full/itu-adb-interrim-indonesia-country-report 3/109
ADB Rural ICT Project
Indonesia Country Case Study Report
3
4.6.1 Type of Service 69
4.6.2 USO Operator 69
4.6.3
License 70
4.6.4 USO Criteria 71
4.6.5 Numbering 71
4.6.6 Interconnection 71
4.6.7 Contract 71
4.6.8 Evaluation and Monitoring 72
4.7 Rural ICT Deployment and WPUT area 73
4.8 USO Implementation Challenge 76
Chapter 5 Case Examples of successful and innovative rural ICT projects 80
5.1 Case 1: Local Government Initiative for E-Gov, Regency of Sragen 80
5.1.1 Geographic locations, populations, and politicaldivisions served by the project; 80
5.1.2 Institutional and stakeholder arrangements involved inproject planning, design, financing, implementation,and oversight; 81
5.1.3 Local participation in project development, operation,ownership; 82
5.1.4 Technology platforms, infrastructure, and facilitiesdeployed; quantities and capacity of network andservices provided; 82
5.1.5 Services provided, including public and private access;volumes and capacity of services made available; 82
5.1.6 Degree of demand and utilization, including growthover time; 83
5.1.7 Project financials: investment and operating costs;subsidies (if any); revenues; profit and loss and ROI,as appropriate; 83
5.1.8 Scope and nature of information applications andcontent included in the project, including target users,sources of support and development; 83
5.1.9 Training, public awareness, and other public relationsand support; 83
5.1.10 Ongoing technical assistance, maintenance and repairsupport; 83
8/3/2019 ITU-ADB Interrim Indonesia Country Report
http://slidepdf.com/reader/full/itu-adb-interrim-indonesia-country-report 4/109
ADB Rural ICT Project
Indonesia Country Case Study Report
4
5.1.11 Monitoring and evaluation framework, including anyreports or studies on project effectiveness; 83
5.1.12
Community and user impacts, reactions, perceptionsof the project’s value, sustainability, replicability. 84
5.2 Case 2: Central Government Infrastructure Provision: USO Program 84
5.2.1 Geographic locations, populations, and politicaldivisions served by the project; 84
5.2.2 Institutional and stakeholder arrangements involved inproject planning, design, financing, implementation,and oversight; 85
5.2.3 Local participation in project development, operation,ownership; 85
5.2.4 Technology platforms, infrastructure, and facilitiesdeployed; quantities and capacity of network andservices provided; 85
5.2.5 Services provided, including public and private access;volumes and capacity of services made available; 92
5.2.6 Degree of demand and utilization, including growthover time; 92
5.2.7 Project financials: investment and operating costs;subsidies (if any); revenues; profit and loss and ROI,as appropriate; 96
5.2.8 Scope and nature of information applications andcontent included in the project, including target users,sources of support and development; 96
5.2.9 Training, public awareness, and other public relationsand support; 96
5.2.10 Ongoing technical assistance, maintenance and repairsupport; 96
5.2.11 Monitoring and evaluation framework, including anyreports or studies on project effectiveness; 96
5.2.12
Community and user impacts, reactions, perceptionsof the project’s value, sustainability, replicability. 96
5.3 Case 3: Private Initiative Rural ICT Provision: Community ICT Center 97
5.3.1 Geographic locations, populations, and politicaldivisions served by the project; 97
8/3/2019 ITU-ADB Interrim Indonesia Country Report
http://slidepdf.com/reader/full/itu-adb-interrim-indonesia-country-report 5/109
ADB Rural ICT Project
Indonesia Country Case Study Report
5
5.3.2 Institutional and stakeholder arrangements involved inproject planning, design, financing, implementation,and oversight; 97
5.3.3 Local participation in project development, operation,ownership; 97
5.3.4 Technology platforms, infrastructure, and facilitiesdeployed; quantities and capacity of network andservices provided; 98
5.3.5 Services provided, including public and private access;volumes and capacity of services made available; 101
5.3.6 Degree of demand and utilization, including growthover time; 101
5.3.7
Project financials: investment and operating costs;subsidies (if any); revenues; profit and loss and ROI,as appropriate; 101
5.3.8 Scope and nature of information applications andcontent included in the project, including target users,sources of support and development; 102
5.3.9 Training, public awareness, and other public relationsand support; 102
5.3.10 Ongoing technical assistance, maintenance and repairsupport; 102
5.3.11
Monitoring and evaluation framework, including anyreports or studies on project effectiveness; 103
5.3.12 Community and user impacts, reactions, perceptionsof the project’s value, sustainability, replicability. 103
5.4 Case 4: Central Government Activity Based Infrastructure: E-Learning(Jardiknas) 103
5.4.1 Geographic locations, populations, and politicaldivisions served by the project; 103
5.4.2 Institutional and stakeholder arrangements involved in
project planning, design, financing, implementation,and oversight; 104
5.4.3 Local participation in project development, operation,ownership; 104
5.4.4 Technology platforms, infrastructure, and facilitiesdeployed; quantities and capacity of network andservices provided; 104
8/3/2019 ITU-ADB Interrim Indonesia Country Report
http://slidepdf.com/reader/full/itu-adb-interrim-indonesia-country-report 6/109
ADB Rural ICT Project
Indonesia Country Case Study Report
6
5.4.5 Services provided, including public and private access;volumes and capacity of services made available; 104
5.4.6
Degree of demand and utilization, including growthover time; 106
5.4.7 Project financials: investment and operating costs;subsidies (if any); revenues; profit and loss and ROI,as appropriate; 106
5.4.8 Scope and nature of information applications andcontent included in the project, including target users,sources of support and development; 107
5.4.9 Training, public awareness, and other public relationsand support; 107
5.4.10
Ongoing technical assistance, maintenance and repairsupport; 107
5.4.11 Monitoring and evaluation framework, including anyreports or studies on project effectiveness; 107
5.4.12 Community and user impacts, reactions, perceptionsof the project’s value, sustainabil ity, replicability. 107
Chapter 6 Lessons, Opportunities, Constraints 109
8/3/2019 ITU-ADB Interrim Indonesia Country Report
http://slidepdf.com/reader/full/itu-adb-interrim-indonesia-country-report 7/109
ADB Rural ICT Project
Indonesia Country Case Study Report
7
Chapter 1 Country Overview
This information covers general national statistics and descriptions of the country, insufficient detail to allow for in-depth understanding of the conditions and trends thatmay influence rural ICT development. Information is sought both at the nationallevel, and in particular for regional and rural areas. Official documents and reportsthat cover the key information should also be collected and provided.
1.1 National geographic, demographic status
Provide an overview of the country’s geographic and demographic statusand trends:
Population, by major cities and regions, age, gender, house hold size
Population of Indonesia is concentrated in Java and Western Part of Indonesia). Ingeneral gender proportion in slightly above 100 % (male over female). Average lifeexpectancy is 70.6 year. The pyramid of ages shows that the predominant age ofpopulations are within 15 to 24 year. The household size during past 4 decade hasbeen changes from about 6 to 4. A strict family planning program on eighties stronglyrecommended each parent to have maximum 2 children. After governance andpolitical reforms there is a trend for a middle and high income family for having 3 to 4children. It increased the average of house hold size from 3.9 in 2000 into 4 in 2006.However in general, The population growth in Indonesia is declined rapidly startingfrom year 1980, that is 1,97% during 1980-1990 period and became 1,45% per year
during 1990-2000 period, then declined again to 1,34% per year during 2000-2006.Currently in 2009, the population growth in Indonesia is estimated about 1.136%. .
Maps showing political divisions and topography
After political reform, decentralize process began. It results a growing number ofprovince and regency from 27 in 1998 to 33. Indonesia is country of archipelago with13,000 of island. Population is distributed in big island but mainly concentrated inSumatra, Java and Bali;
Recent trends in population growth, by region, over at least the past 5years.
In general, from the average of household size, the trend of growth is in regionsoutside for Java. Those area commonly has the household size is above 4, while inJava is below 4.

8/3/2019 ITU-ADB Interrim Indonesia Country Report
http://slidepdf.com/reader/full/itu-adb-interrim-indonesia-country-report 8/109
ADB Rural ICT Project
Indonesia Country Case Study Report
8
1.2 Socio-Economic status and indicators
Provide the following socio-economic indicators for the country over at
least the past 5 years:
GDP and GDP per capita (crisis, reforms, decentralized);
The GDP of Indonesia that was considerably stable in several decade before 1998,suddenly hit by crisis and decreased dramatically to 2.76 percent. Fortunately, by2005 the rate of national income growth per household was increase back to 3.76percent, at the level of 11.2 million rupiah per capita.
Employment (and unemployment) (increasing unemployment?);
The unemployment rate is considerably high. In 2006, the estimate number ofpopulation under productive age is about 160.81 million. Most of them were living inJava. Out of ten workforces, only 1 person is under employment.
Household income levels, distribution (Gini?);
Household income level is below 1200 USD/year. The Gini index had been increasefrom 34.3 to 37.4. It indicate that the decentralized policy have not produced moreequitable distribution.
National poverty index;
Since 1976 to 1996, the poverty level reduced from 40,01 % to 11,30 %. Economiccrisis in Asia increased the poverty level to 24,23 % in 1998. In 2008, the povertyincident was15,42% or about 34,96 million population.
Literacy and education levels;
Level of literacy in 2007 was 95.22 and 88.62 for male and female respectively. Theaverage education level on basic education was 8.0 for male and 7.0 for female. Itindicates unequal of opportunity to education between gender in Indonesia.
Structure of the economy: key industries, sectors, exports, resources.
The main industry in Indonesia is manufacturing industry. The share in 2007 was27,01 % followed by agriculture sector with share of 13,83 %.
1.3 Scope and status of rural areas, population
Provide the following information relative to rural areas of the country:
Official Government definition of ―rural‖ areas (if any), by populationdensity or other criteria;
According to Government Regulation Number 72 Year 2005 on Village, stated thatVillage is the unity of legal community who have territorial boundaries and have theauthority to regulate and to manage the interests of local communities, based on the

8/3/2019 ITU-ADB Interrim Indonesia Country Report
http://slidepdf.com/reader/full/itu-adb-interrim-indonesia-country-report 9/109
ADB Rural ICT Project
Indonesia Country Case Study Report
9
origin and local customs recognized and respected in the system of StateGovernment of Republic of Indonesia. Indonesia has 75.666 villages in 33 Provinces;the 33, 24% or 25,154 villages are located in Java Island.
Population, income, poverty, employment, education, and other availabledemographic data for rural regions, including trends for at least the last 5years.
The proportion of poor population between urban and rural areas is relatively stable.In March 2007, the majority (63.52 percent) of poor residents are in rural areas. InMarch 2008 the percentage was almost the same, which is 63.47 percent.
1.4 Conclusion:
Considering to the given research framework, the Indonesian national geographic,demographic, and socio-economic indicates very critical status of future rural ITCdevelopment. With 13.000 islands, and less density and poorer population outsideJava, Indonesia might predominantly by the area of ―access gap‖.

8/3/2019 ITU-ADB Interrim Indonesia Country Report
http://slidepdf.com/reader/full/itu-adb-interrim-indonesia-country-report 10/109
ADB Rural ICT Project
Indonesia Country Case Study Report
10
8/3/2019 ITU-ADB Interrim Indonesia Country Report
http://slidepdf.com/reader/full/itu-adb-interrim-indonesia-country-report 11/109
ADB Rural ICT Project
Indonesia Country Case Study Report
11
Chapter 2 National ICT Industry Status of
Indonesia
2.1 ICT Market Background of Indonesia
Different with several other countries, where liberalization and competition in ICTsector is implemented when telecommunication penetration and coverage is highenough, Indonesian ICT industry competition has been started where penetrationand coverage is still inadequate and small. In this condition, it is very difficult formany companies to compete and somehow a bad competition exists. This conditionis fragile enough that the government has to set the regulatory and the rule morecarefully. 1
Indonesian ICT (Information and Telecommunication Technology) servicedevelopment is put or at least concentrated more in the development ofTelecommunication service in Indonesia. Dominancy of Telecommunication Servicein Indonesia is owned by PT. Telekomunikasi Indonesia as one of State-ownedEnterprise in ICT. That dominancy in telecommunication service existed since theindependent of Indonesia. The dominancy covers many industry related to ICTservice, namely basic wired telephony service (PSTN), internet, wireless telephony,satellite, multimedia, international telephony, etc. PT. Telekomunikasi Indonesia(hereinafter called PT. Telkom) is also dominating by the ownership of stocks inseveral ICT companies including its derivative companies such as PT. Telkomsel,Komselindo, and others.
It was 20 years ago, in 1989. Based on Telecommunication Act No. 3/1989, two maintelecommunication companies in Indonesia were PT. Telkom and PT. Indosat. Thosetwo companies were categorized as State-owned Enterprise. Concisely, that Actregulates several issues on Structure and Scope of Cooperation which are:
Private company may build basic telecommunication services through joint-cooperation, operational cooperation, and management contract with PT. Telkomand PT. Indosat in these several terms 2:
1Source: Cetak Biru Telekomunikasi MASTEL (2005)
2 Source: Paper,”Trend Industri Telekomunikasi Indonesia”, M. Siroth & Nur M. Amin, Fakultas
Ekonomi UI (1998)
8/3/2019 ITU-ADB Interrim Indonesia Country Report
http://slidepdf.com/reader/full/itu-adb-interrim-indonesia-country-report 12/109
ADB Rural ICT Project
Indonesia Country Case Study Report
12
International Telecommunication services which previously weremonopolized by PT. Indosat, it then became a duopoly business betweenPT. Indosat and PT. Satelindo
Domestic telecommunication services which previously were monopolizedby PT. Telkom, it was then divided into 7 areas, where 5 from 7 areaswere operated by private company in Operational Cooperation withPT.Telkom.
For basic telecommunication services, i.e. PSTN (Public SwitchTelephone Network), there were two main business player, Telkom andRetelindo, which was basically dominated by Telkom in its stocks and itsnetworks.
Non-basic services may be completely run by private company. GMPCS (Global mobile personal communication by Satelindo) services
will be well configured so that private companies can also take part on it.
The fundamental reason why the telecommunication development was conducted inmonopoly system is because telecommunication business covers the interest ofmassive people in Indonesia. It is the main belief in Indonesia constitution that allservices which impact massive people of Indonesia must be controlled bygovernment. It is also conducted in electricity and petroleum provision for instance.The main expectation is that all business policy can be controlled in order to prioritizethe society needs instead of the profit orientation. Therefore, under this scheme,responsibility of Universal Service Obligation is completely on the hand of PT.Telkom. Though unfortunately, PT. Telkom can not fulfill a satisfied result incompleting the USO program in this scheme.
Through several study and research, it was concluded that monopoly intelecommunication business did not bring efficiency and enough capability of theincumbent company to fulfill its obligation, such as providing telecommunication forall people, all place, and all condition. Obviously, it did not bring satisfaction tosociety as it was expected before. Under this scheme, there was no differentiationeither in the functional parts necessary in telecommunication business. Function ofpolicy maker, regulatory maker, and operational executor were owned by singleauthorization, i.e. The Government. Therefore, business competition was sounstable, not profitable for both society and company.
Indonesia then realized that telecommunication business needs a naturalcompetition. Even if there will be a monopoly, it is a natural monopoly. After severalyears, the above functions were separated in several bodies. In this situation,
8/3/2019 ITU-ADB Interrim Indonesia Country Report
http://slidepdf.com/reader/full/itu-adb-interrim-indonesia-country-report 13/109
ADB Rural ICT Project
Indonesia Country Case Study Report
13
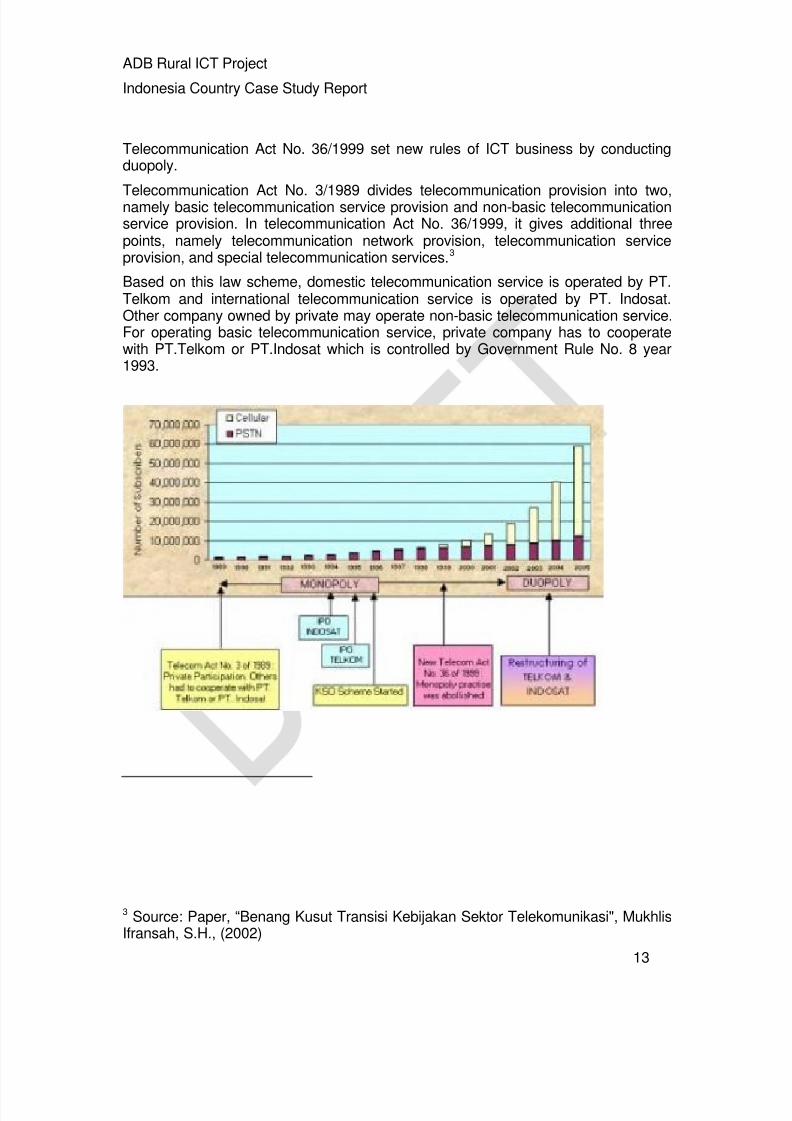
Telecommunication Act No. 36/1999 set new rules of ICT business by conductingduopoly.
Telecommunication Act No. 3/1989 divides telecommunication provision into two,namely basic telecommunication service provision and non-basic telecommunicationservice provision. In telecommunication Act No. 36/1999, it gives additional threepoints, namely telecommunication network provision, telecommunication serviceprovision, and special telecommunication services.3
Based on this law scheme, domestic telecommunication service is operated by PT.Telkom and international telecommunication service is operated by PT. Indosat.Other company owned by private may operate non-basic telecommunication service.For operating basic telecommunication service, private company has to cooperatewith PT.Telkom or PT.Indosat which is controlled by Government Rule No. 8 year1993.
3 Source: Paper, ―Benang Kusut Transisi Kebijakan Sektor Telekomunikasi", MukhlisIfransah, S.H., (2002)
8/3/2019 ITU-ADB Interrim Indonesia Country Report
http://slidepdf.com/reader/full/itu-adb-interrim-indonesia-country-report 14/109
ADB Rural ICT Project
Indonesia Country Case Study Report
14
Figure 2.1 Progression Graph In term of monopoly and duopoly era oftelecommunication.
(Source: Nathan &Atmitra (2006))Telecommunication Act No. 36 year 1999 system is known as the ICT Blueprint of1999. Concisely, the blueprint is assumed to initiate a good market competition intelecommunication business. By this law, opportunity for private company to organizebusiness competitively starts to open widely. Monopoly scheme is substituted withcompetition scheme. The law opens big opportunity for communication, internet,informatics and multimedia business to compete in the market. Through the years,many regulation, law and rule were also set to revise and to complete the wholesystem. The competition brings advantage for the society as the consumer.Competition of quality, price, and work field force the company to innovate more. But,the Blueprint of 1999 does not arrange yet any system about ICT research,education, training and manufacturing industry both for hardware and software. Itfocuses more on ICT services.
2.2 ICT Regulatory Body4
Based on the differentiation of ICT functional bodies, an Independent RegulatoryBody (IRB) is build to protect public right and interest (customer interest), to supportand to protect telecommunication business competition for its efficiency, healthy andstock attraction. In July 2003, Badan Regulasi Telekomunikasi Indonesia(Telecommunication Regulatory Body of Indonesia, BRTI) was built and wasexpected as the independent regulatory body of Indonesia. But actually, BRTI is asemi-independent body, because of the fact that it is still under control of the
government.By the pressure of public to make BRTI independent, government made a new rule inMinistry Resolution No.67 year 2003 which prohibits executive authorization in BRTI.It means that BRTI has to focus on regulation for accompanying the competition ofthe business without any link or pressure to the executive authorization i.e. thegovernment. However, the fact still says that BRTI is still influenced majorly by thegovernment.
4Source: Laporan Tahunan (Annual Report) of BTIP (2008)
8/3/2019 ITU-ADB Interrim Indonesia Country Report
http://slidepdf.com/reader/full/itu-adb-interrim-indonesia-country-report 15/109
ADB Rural ICT Project
Indonesia Country Case Study Report
15
Since telecommunication regulation is the main scope of work of BRTI, BRTI hastasks to trigger telecommunication industry development by a good competition andto protect the needs of public in de facto and de jure way.
2.3 ICT Industry Role for Indonesian Economy
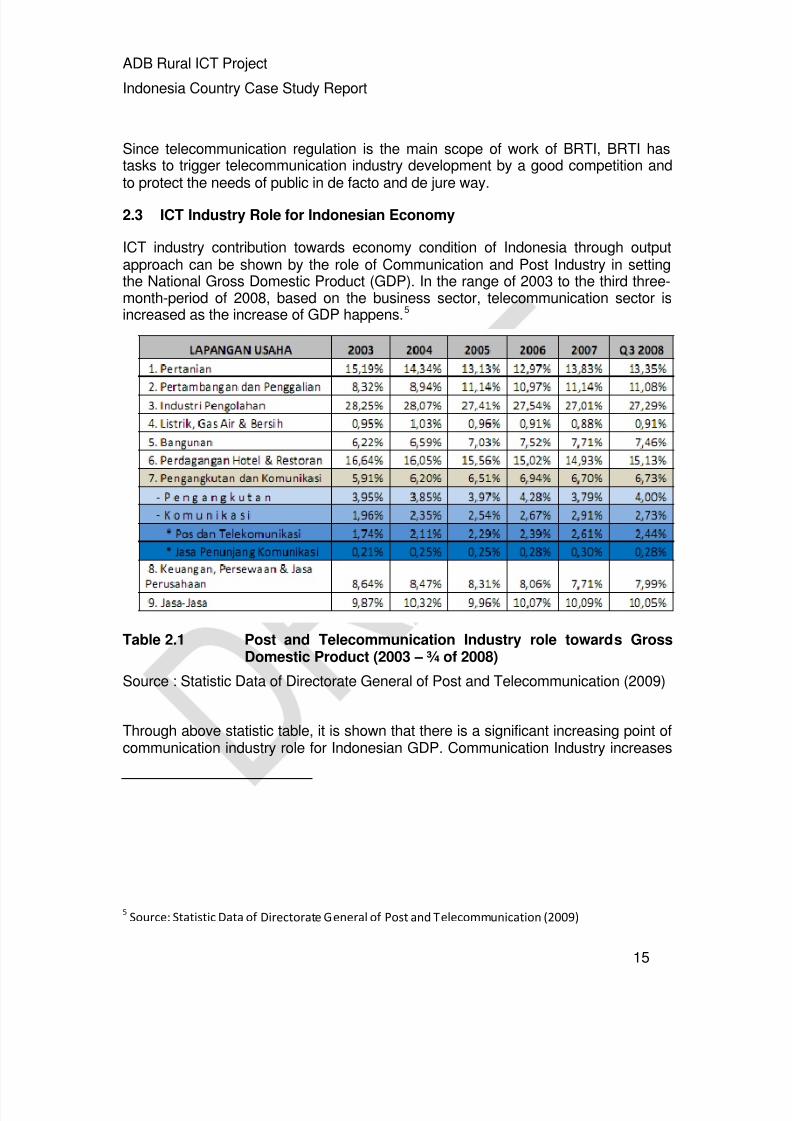
ICT industry contribution towards economy condition of Indonesia through outputapproach can be shown by the role of Communication and Post Industry in settingthe National Gross Domestic Product (GDP). In the range of 2003 to the third three-month-period of 2008, based on the business sector, telecommunication sector isincreased as the increase of GDP happens.5
Table 2.1 Post and Telecommunication Industry role towards GrossDomestic Product (2003 – ¾ of 2008)
Source : Statistic Data of Directorate General of Post and Telecommunication (2009)
Through above statistic table, it is shown that there is a significant increasing point ofcommunication industry role for Indonesian GDP. Communication Industry increases
5Source: Statistic Data of Directorate General of Post and Telecommunication (2009)

8/3/2019 ITU-ADB Interrim Indonesia Country Report
http://slidepdf.com/reader/full/itu-adb-interrim-indonesia-country-report 16/109
ADB Rural ICT Project
Indonesia Country Case Study Report
16
its contribution from 1.96% in 2003 into 2.73% in the third three-month-period of2008.
The other statistic data can show the growth velocity of Telecommunication Sector inIndonesia compared to the other sector’s growth.
Table 2.2 Sector Growth Velocity in Setting PDB Value (2003 – ¾ of2008)
Source : Statistic Data of Directorate General of Post and Telecommunication (2009)
According to table 2302, it is shown that the highest growth velocity is owned bytransportation and communication sector as much as 14.38% where transportationonly owns 2.78% of the growth. It shows that telecommunication sector growth inIndonesia has a good and promising value to be taken care.
2.4 Telecommunication Industry Status
Fact that Indonesia has a big number of people and a very wide area brings apotential market for telecommunication industry. Therefore, number oftelecommunication provider is increasing as well as the increasing support fromgovernment’s policy which stimulates many investments happen intelecommunication sector. The table below shows the number of telecommunicationprovider based on each category. It shows that in every category an increasingnumber of telecommunication provider n exists from 2008 to 2009. Totally, in one lastyear, telecommunication provider number increases as much as 2.2% from 365 into373 providers.

8/3/2019 ITU-ADB Interrim Indonesia Country Report
http://slidepdf.com/reader/full/itu-adb-interrim-indonesia-country-report 17/109
ADB Rural ICT Project
Indonesia Country Case Study Report
17
Table 2.3 Number of Telecommunication Provider (2008-2009)
Source : Statistic Data of Directorate General of Post and Telecommunication (2009)
The highest growth belongs to the fixed network provider which increases its numberas much as 8 from 2008. Service provider has the biggest number than any othertelecommunication provider. From the beginning, mobile telecommunication industry
is different with wire line network i.e. PSTN which is monopolized by PT. Telkom.There is no significant obstacle to enter the mobile telecommunication market ofIndonesia so that the market be very competitive. It is recorded that there are 17providers for mobile telecommunication.
In telephony service provider or telephony service operator, there are 15 operatorsworking in Indonesia where 8 of them belongs to the cellular industry. Based on thetable 2402 below, PT. Telkom and PT. Indosat are still dominating by existing in all 3kinds of telephony services.
8/3/2019 ITU-ADB Interrim Indonesia Country Report
http://slidepdf.com/reader/full/itu-adb-interrim-indonesia-country-report 18/109
ADB Rural ICT Project
Indonesia Country Case Study Report
18
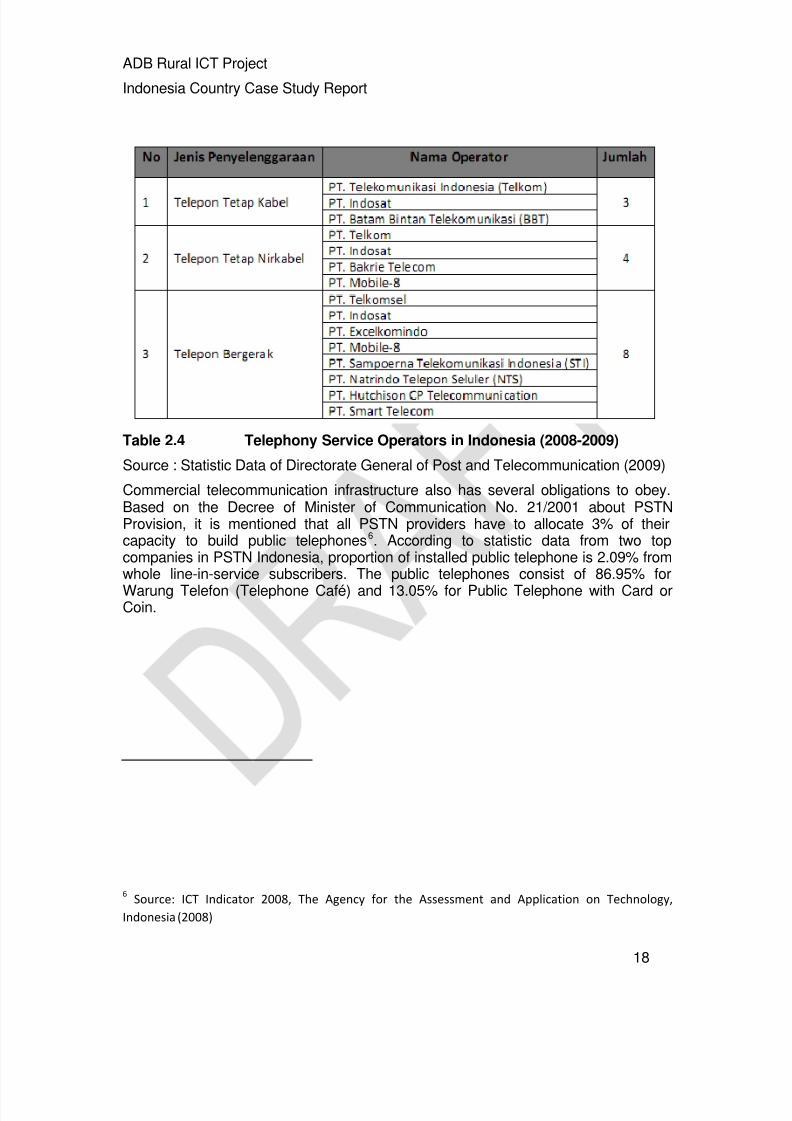
Table 2.4 Telephony Service Operators in Indonesia (2008-2009)
Source : Statistic Data of Directorate General of Post and Telecommunication (2009)
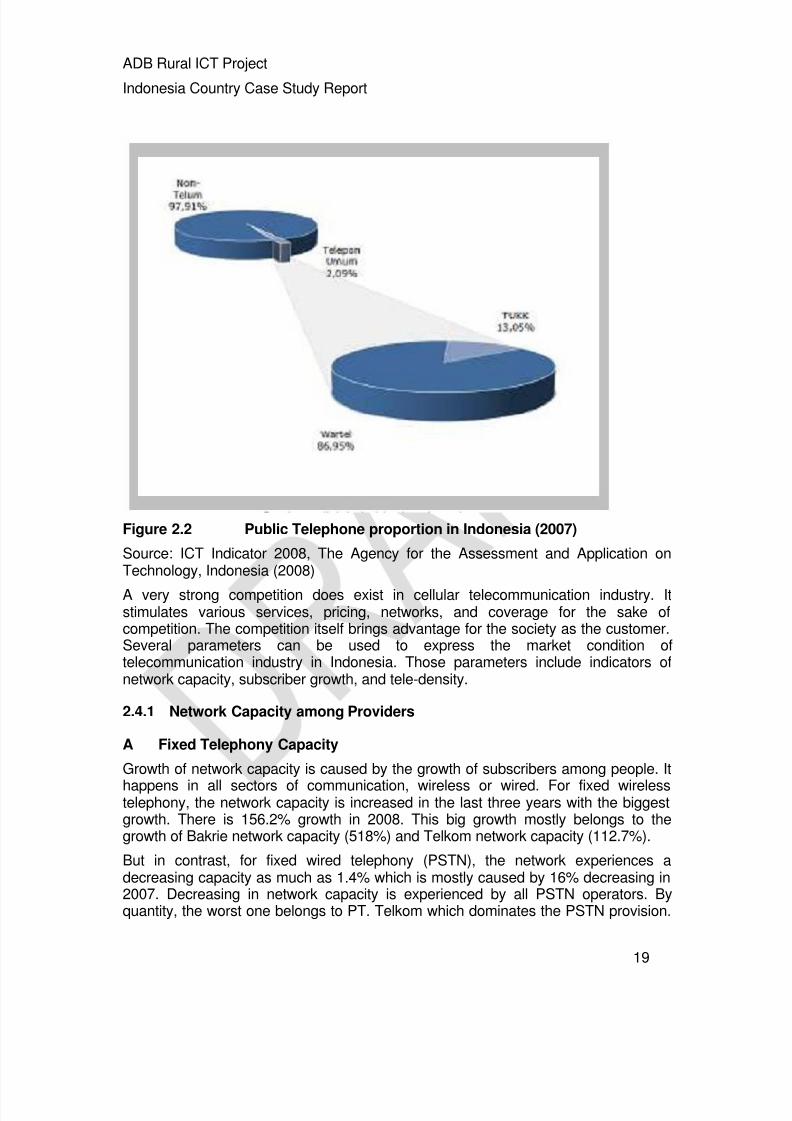
Commercial telecommunication infrastructure also has several obligations to obey.Based on the Decree of Minister of Communication No. 21/2001 about PSTNProvision, it is mentioned that all PSTN providers have to allocate 3% of theircapacity to build public telephones6. According to statistic data from two topcompanies in PSTN Indonesia, proportion of installed public telephone is 2.09% fromwhole line-in-service subscribers. The public telephones consist of 86.95% for
Warung Telefon (Telephone Café) and 13.05% for Public Telephone with Card orCoin.
6Source: ICT Indicator 2008, The Agency for the Assessment and Application on Technology,
Indonesia (2008)
8/3/2019 ITU-ADB Interrim Indonesia Country Report
http://slidepdf.com/reader/full/itu-adb-interrim-indonesia-country-report 19/109
ADB Rural ICT Project
Indonesia Country Case Study Report
19
Figure 2.2 Public Telephone proportion in Indonesia (2007)
Source: ICT Indicator 2008, The Agency for the Assessment and Application onTechnology, Indonesia (2008)
A very strong competition does exist in cellular telecommunication industry. Itstimulates various services, pricing, networks, and coverage for the sake ofcompetition. The competition itself brings advantage for the society as the customer.Several parameters can be used to express the market condition oftelecommunication industry in Indonesia. Those parameters include indicators ofnetwork capacity, subscriber growth, and tele-density.
2.4.1 Network Capacity among Providers
A Fixed Telephony Capacity
Growth of network capacity is caused by the growth of subscribers among people. It
happens in all sectors of communication, wireless or wired. For fixed wirelesstelephony, the network capacity is increased in the last three years with the biggestgrowth. There is 156.2% growth in 2008. This big growth mostly belongs to thegrowth of Bakrie network capacity (518%) and Telkom network capacity (112.7%).
But in contrast, for fixed wired telephony (PSTN), the network experiences adecreasing capacity as much as 1.4% which is mostly caused by 16% decreasing in2007. Decreasing in network capacity is experienced by all PSTN operators. Byquantity, the worst one belongs to PT. Telkom which dominates the PSTN provision.
8/3/2019 ITU-ADB Interrim Indonesia Country Report
http://slidepdf.com/reader/full/itu-adb-interrim-indonesia-country-report 20/109
ADB Rural ICT Project
Indonesia Country Case Study Report
20
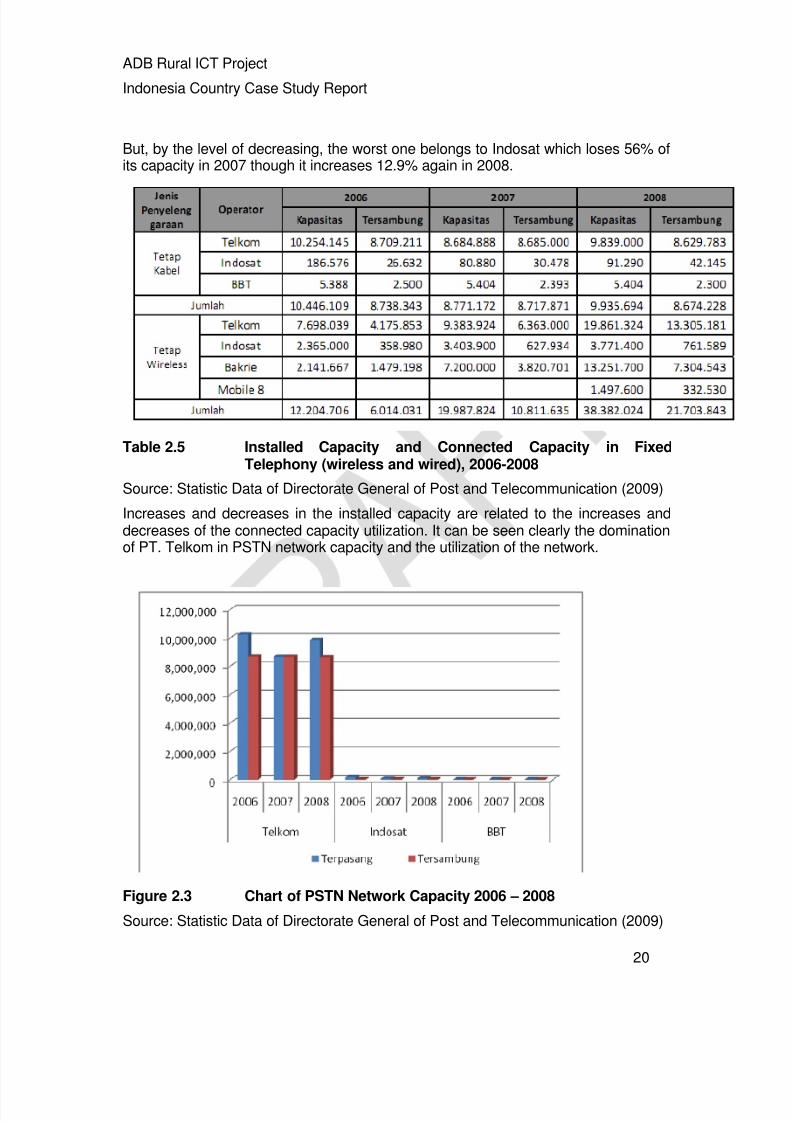
But, by the level of decreasing, the worst one belongs to Indosat which loses 56% ofits capacity in 2007 though it increases 12.9% again in 2008.
Table 2.5 Installed Capacity and Connected Capacity in FixedTelephony (wireless and wired), 2006-2008
Source: Statistic Data of Directorate General of Post and Telecommunication (2009)
Increases and decreases in the installed capacity are related to the increases anddecreases of the connected capacity utilization. It can be seen clearly the dominationof PT. Telkom in PSTN network capacity and the utilization of the network.
Figure 2.3 Chart of PSTN Network Capacity 2006 – 2008
Source: Statistic Data of Directorate General of Post and Telecommunication (2009)

8/3/2019 ITU-ADB Interrim Indonesia Country Report
http://slidepdf.com/reader/full/itu-adb-interrim-indonesia-country-report 21/109
ADB Rural ICT Project
Indonesia Country Case Study Report
21
Picture 2403. Chart of Utilization level of PSTN Network Capacity (2006 – 2008)
Source: Statistic Data of Directorate General of Post and Telecommunication (2009)
The utilization level of network capacity is dominated with PT. Telkom with itsremarkable score. Even in 2007, PT. Telkom can touch 100% of network utilizationlevel. In other hand, PT. Indosat also shows a significant increase of its utilizationlevel from 2006 – 2008.
Then in other hand, in fixed wireless telephony, installed capacity in the network ismuch higher than the connected capacity for every operator of provider. Even theincumbent domination, PT. Telkom can not meet its connected capacity with theinstalled capacity in 2008 when PT. Telkom reaches the high number of connectedcapacity. The same thing is also experienced by PT. Bakrie Telecom as a bigcompetitor for PT. Telkom in Fixed-Wireless-Telephony.
8/3/2019 ITU-ADB Interrim Indonesia Country Report
http://slidepdf.com/reader/full/itu-adb-interrim-indonesia-country-report 22/109
ADB Rural ICT Project
Indonesia Country Case Study Report
22
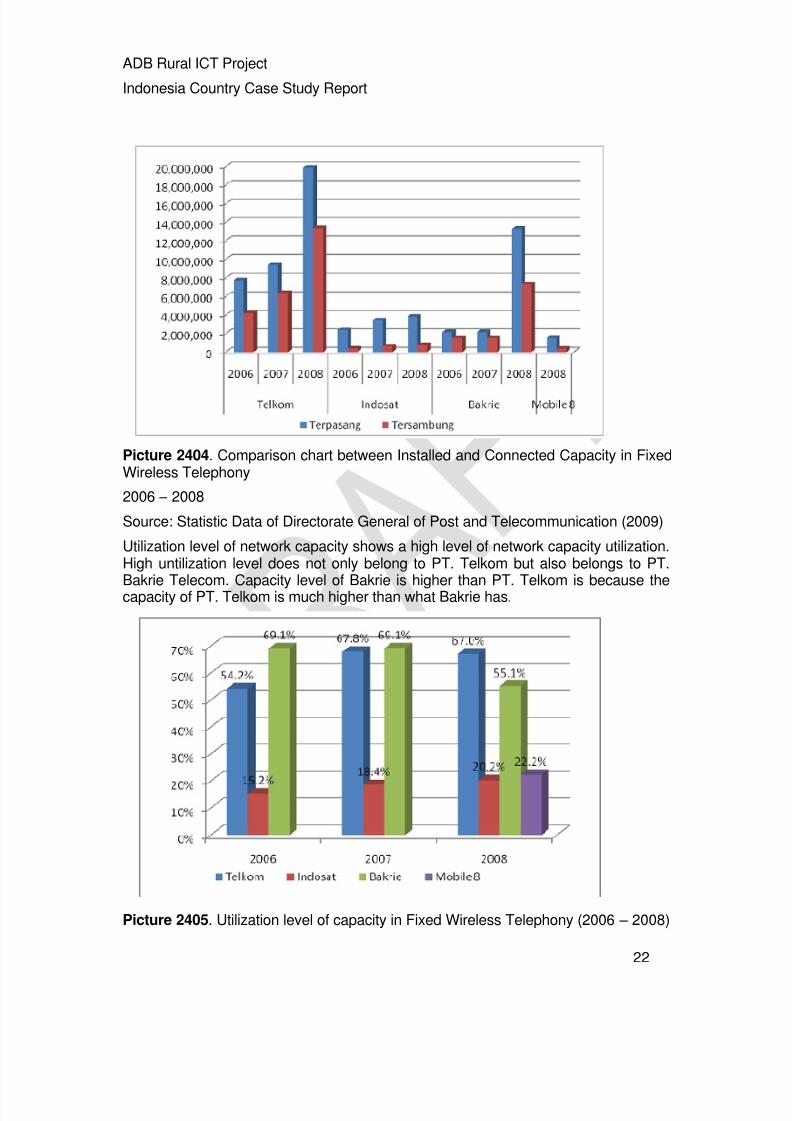
Picture 2404. Comparison chart between Installed and Connected Capacity in FixedWireless Telephony
2006 – 2008
Source: Statistic Data of Directorate General of Post and Telecommunication (2009)
Utilization level of network capacity shows a high level of network capacity utilization.High untilization level does not only belong to PT. Telkom but also belongs to PT.Bakrie Telecom. Capacity level of Bakrie is higher than PT. Telkom is because thecapacity of PT. Telkom is much higher than what Bakrie has.
Picture 2405. Utilization level of capacity in Fixed Wireless Telephony (2006 – 2008)

8/3/2019 ITU-ADB Interrim Indonesia Country Report
http://slidepdf.com/reader/full/itu-adb-interrim-indonesia-country-report 23/109
ADB Rural ICT Project
Indonesia Country Case Study Report
23
Source: Statistic Data of Directorate General of Post and Telecommunication (2009)
B Mobile Wireless Telephony Capacity
For mobile wireless telephony provision, there are 3 main providers which havebigger network capacity than the other providers. Those three providers areTekomsel (derivative of PT. Telkom), Indosat, and Excelcomindo where theircapacity can touch more than 45 thousands connections in 2008. Whereas, theothers providers only touch less than 10 thousands connections.
The growth of network capacity also shows its significant increase, especially bythose three big operators. But, Indosat experiences almost 50% decrease in itscapacity growth from 2007 to 2008. It causes total installed capacity decreases 3.1%in 2008. In average, the installed capacity growth of mobile wireless telephony cantouch 42.5% while its connected capacity growth reaches 48.5%. therefore, it can besaid that there is an increase in capacity utilization.
Table 2404. Installed capacity and Connected capacity growth in Mobile WirelessTelephony (2006 – 2008)
Source: Statistic Data of Directorate General of Post and Telecommunication (2009)

8/3/2019 ITU-ADB Interrim Indonesia Country Report
http://slidepdf.com/reader/full/itu-adb-interrim-indonesia-country-report 24/109
ADB Rural ICT Project
Indonesia Country Case Study Report
24
Picture 2406. Chart of Installed capacity and Connected capacity growth in MobileWireless Telephony (2006 – 2008)
Source: Statistic Data of Directorate General of Post and Telecommunication (2009)
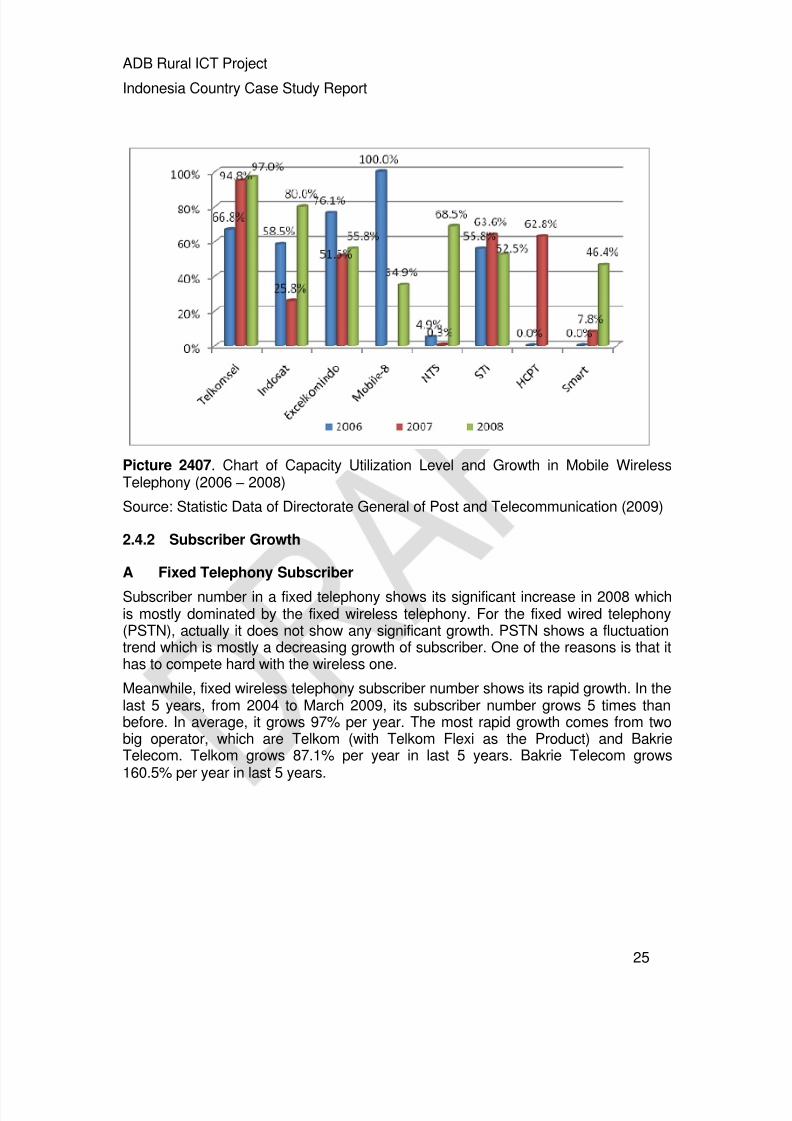
Based on the chart below, it can be seen that capacity utilization of Telkomsel is highenough and increased significantly in 2008. Whereas, Indosat has a very lowcapacity utilization in 2007 which cause Indosat to decrease its capacity in 2008 inorder to correct its capacity utilization. Relatively good capacity utilization is alsoexperienced by Excelcomindo. The other small operators show good utilization levelwhich is more that 60%. Smart Telecom also shows its significant growth from lessthat 10% in 2007 to 46.4% in 2008.
8/3/2019 ITU-ADB Interrim Indonesia Country Report
http://slidepdf.com/reader/full/itu-adb-interrim-indonesia-country-report 25/109
ADB Rural ICT Project
Indonesia Country Case Study Report
25
Picture 2407. Chart of Capacity Utilization Level and Growth in Mobile WirelessTelephony (2006 – 2008)
Source: Statistic Data of Directorate General of Post and Telecommunication (2009)
2.4.2 Subscriber Growth
A Fixed Telephony Subscriber
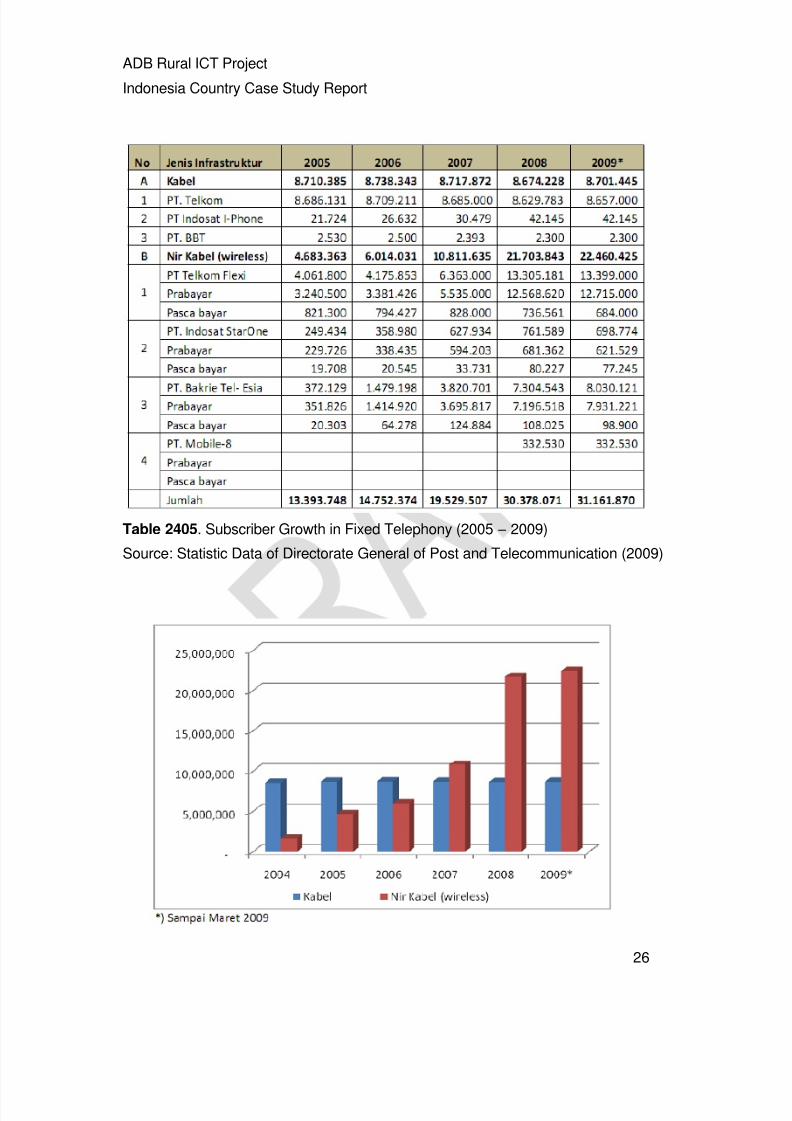
Subscriber number in a fixed telephony shows its significant increase in 2008 whichis mostly dominated by the fixed wireless telephony. For the fixed wired telephony(PSTN), actually it does not show any significant growth. PSTN shows a fluctuationtrend which is mostly a decreasing growth of subscriber. One of the reasons is that ithas to compete hard with the wireless one.
Meanwhile, fixed wireless telephony subscriber number shows its rapid growth. In thelast 5 years, from 2004 to March 2009, its subscriber number grows 5 times thanbefore. In average, it grows 97% per year. The most rapid growth comes from twobig operator, which are Telkom (with Telkom Flexi as the Product) and BakrieTelecom. Telkom grows 87.1% per year in last 5 years. Bakrie Telecom grows160.5% per year in last 5 years.
8/3/2019 ITU-ADB Interrim Indonesia Country Report
http://slidepdf.com/reader/full/itu-adb-interrim-indonesia-country-report 26/109
ADB Rural ICT Project
Indonesia Country Case Study Report
26
Table 2405. Subscriber Growth in Fixed Telephony (2005 – 2009)
Source: Statistic Data of Directorate General of Post and Telecommunication (2009)
8/3/2019 ITU-ADB Interrim Indonesia Country Report
http://slidepdf.com/reader/full/itu-adb-interrim-indonesia-country-report 27/109
ADB Rural ICT Project
Indonesia Country Case Study Report
27
Picture 2408. Comparison of Subscriber Growth in Fixed Telephony (2004 – 2009)
Source: Statistic Data of Directorate General of Post and Telecommunication (2009)
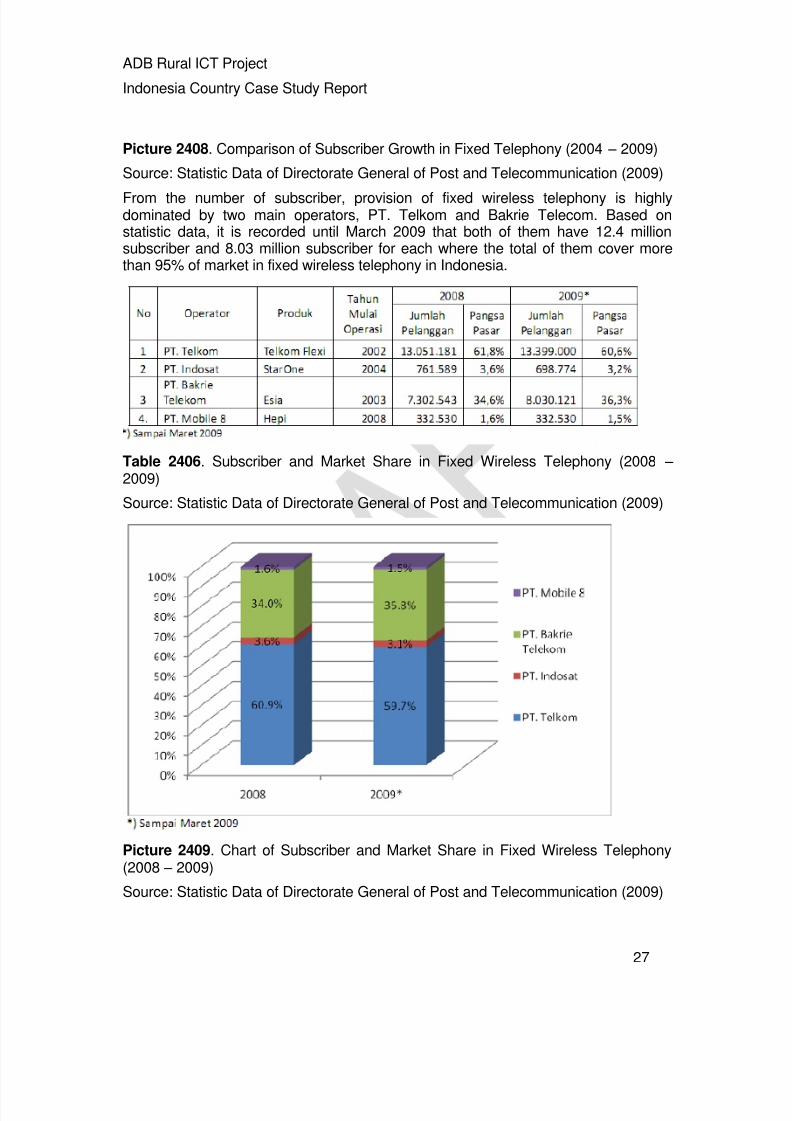
From the number of subscriber, provision of fixed wireless telephony is highlydominated by two main operators, PT. Telkom and Bakrie Telecom. Based onstatistic data, it is recorded until March 2009 that both of them have 12.4 millionsubscriber and 8.03 million subscriber for each where the total of them cover morethan 95% of market in fixed wireless telephony in Indonesia.
Table 2406. Subscriber and Market Share in Fixed Wireless Telephony (2008 – 2009)
Source: Statistic Data of Directorate General of Post and Telecommunication (2009)
Picture 2409. Chart of Subscriber and Market Share in Fixed Wireless Telephony(2008 – 2009)
Source: Statistic Data of Directorate General of Post and Telecommunication (2009)
8/3/2019 ITU-ADB Interrim Indonesia Country Report
http://slidepdf.com/reader/full/itu-adb-interrim-indonesia-country-report 28/109
ADB Rural ICT Project
Indonesia Country Case Study Report
28
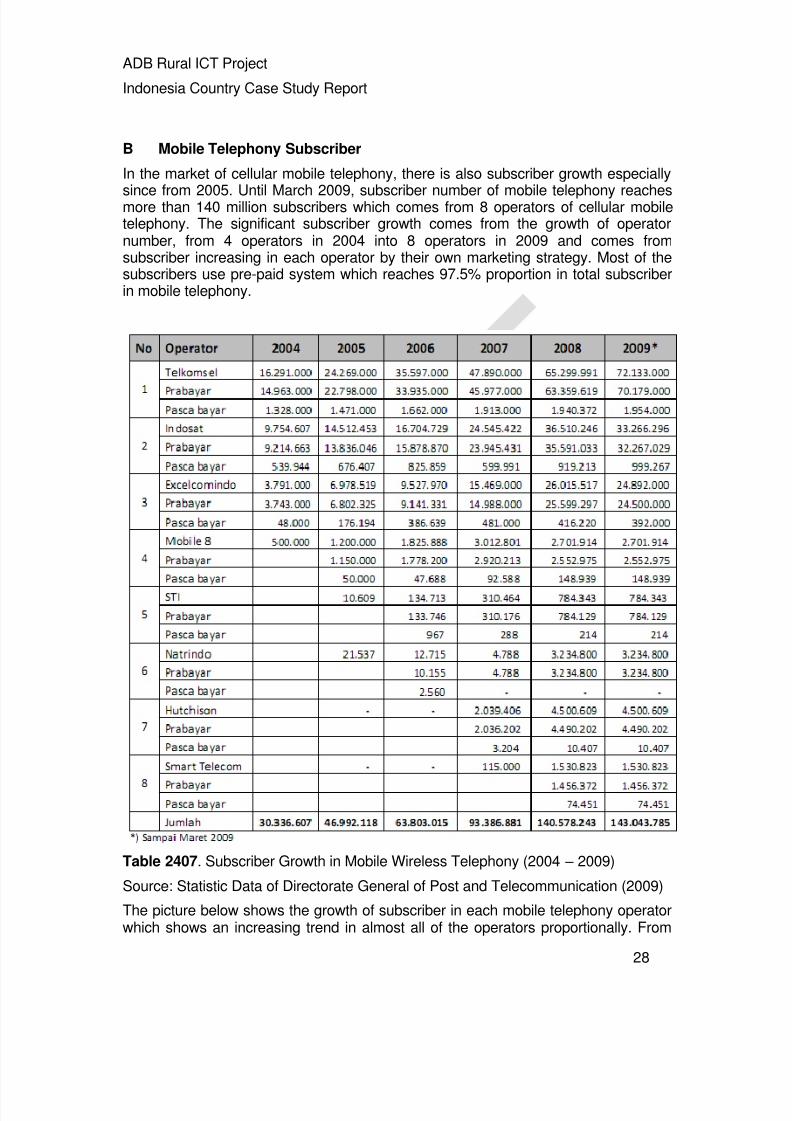
B Mobile Telephony Subscriber
In the market of cellular mobile telephony, there is also subscriber growth especially
since from 2005. Until March 2009, subscriber number of mobile telephony reachesmore than 140 million subscribers which comes from 8 operators of cellular mobiletelephony. The significant subscriber growth comes from the growth of operatornumber, from 4 operators in 2004 into 8 operators in 2009 and comes fromsubscriber increasing in each operator by their own marketing strategy. Most of thesubscribers use pre-paid system which reaches 97.5% proportion in total subscriberin mobile telephony.
Table 2407. Subscriber Growth in Mobile Wireless Telephony (2004 – 2009)
Source: Statistic Data of Directorate General of Post and Telecommunication (2009)
The picture below shows the growth of subscriber in each mobile telephony operatorwhich shows an increasing trend in almost all of the operators proportionally. From

8/3/2019 ITU-ADB Interrim Indonesia Country Report
http://slidepdf.com/reader/full/itu-adb-interrim-indonesia-country-report 29/109
ADB Rural ICT Project
Indonesia Country Case Study Report
29
2004 to March 2009, mobile telephony subscriber increases as much as 371.5% withaverage growth 37.9% per year. The highest subscriber growth is experienced byExcelcomindo and Mobile-8 which grow 49.4% per year. From the chart, it can be
seen that the market is dominated by three main operators, Telkomsel, Indosat, andExcelcomindo which have been existed in the market in the first time.
Picture 2410. Chart of Subscriber Growth in Mobile Wireless Telephony (2005 – 2009)
Source: Statistic Data of Directorate General of Post and Telecommunication (2009)
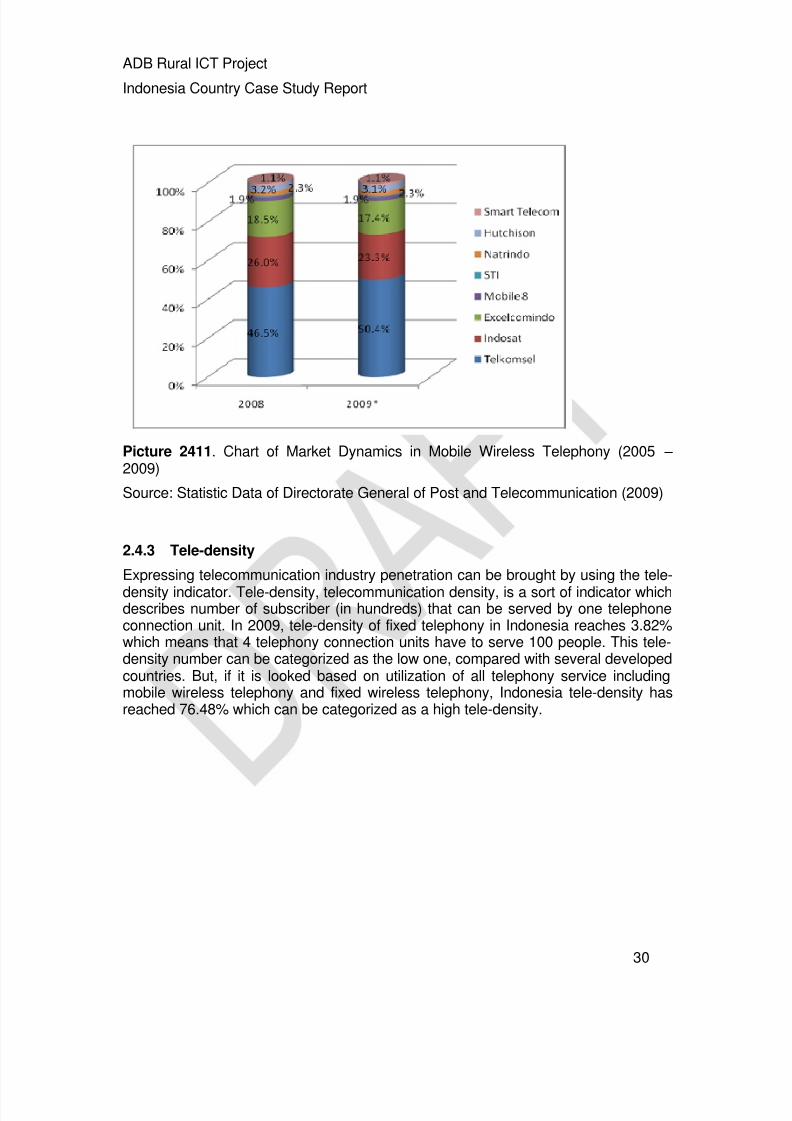
Mobile Telephony market is highly dominated by three main operators, Telkomsel,Indosat and Excelcomindo which cover 91.1% of the whole market. Subscribernumber growth of Telkomsel from 2008 to 2009 causes market change in mobilewireless telephony. Telkomsel market grows from 46.5% into 50.4% in 2009. Thisgrowth is caused by the decrease in the market of Indosat and Excelcomindo from26% and 18.5% into 23.3% and 17.4% in 2009.
The rest market which is less than 10% is shared by the other 5 operators where thebiggest market share is owned by Hutchison which owns 3.1% of the market. Thissubscriber number is phenomenal, since Hutchison is a new operator.
8/3/2019 ITU-ADB Interrim Indonesia Country Report
http://slidepdf.com/reader/full/itu-adb-interrim-indonesia-country-report 30/109
ADB Rural ICT Project
Indonesia Country Case Study Report
30
Picture 2411. Chart of Market Dynamics in Mobile Wireless Telephony (2005 – 2009)
Source: Statistic Data of Directorate General of Post and Telecommunication (2009)
2.4.3 Tele-density
Expressing telecommunication industry penetration can be brought by using the tele-
density indicator. Tele-density, telecommunication density, is a sort of indicator whichdescribes number of subscriber (in hundreds) that can be served by one telephoneconnection unit. In 2009, tele-density of fixed telephony in Indonesia reaches 3.82%which means that 4 telephony connection units have to serve 100 people. This tele-density number can be categorized as the low one, compared with several developedcountries. But, if it is looked based on utilization of all telephony service includingmobile wireless telephony and fixed wireless telephony, Indonesia tele-density hasreached 76.48% which can be categorized as a high tele-density.

8/3/2019 ITU-ADB Interrim Indonesia Country Report
http://slidepdf.com/reader/full/itu-adb-interrim-indonesia-country-report 31/109
ADB Rural ICT Project
Indonesia Country Case Study Report
31
Picture 2412 : Chart of Tele-density Growth in Indonesia (2005 – 2009)
Source: Statistic Data of Directorate General of Post and Telecommunication (2009)
From the chart above, tele-density increases significantly in last 5 years as well asthe growth of mobile wireless telephony tele-density. Tele-density of fixed wirelesstelephony actually does not give any significant growth either. Tele-density in both
fixed-telephony does not have any significant growth as what the mobile telephonyhas. Therefore, it can be said that the total tele-density is mostly influenced by mobiletelephony tele-density.
2.4.4 Telecommunication Operators Income
For assessing the performance of telecommunication operator’s income, 3 indicatorscan be used as well. Those three indicators are :
Operational Income
EBITDA (Earning Before Interest Tax Depreciation and Ammortization)
ARPU (Average Revenue Per Unit)
A Operational Income
Operational income of all telecommunication provider in the last three years isinclined to increase except for Mobile-8. Operator income describes the total incomeearned by each provider in operating its telecommunication service business for theconsumer. The table below shows the growth of wireless telephony operationalincome (both fixed and mobile). The data shows that the bigger its income value thelower its income growth. Telkom Group company (Telkomsel and Telkom Flexi), in2008 records its income more than Rp 60 trillion, with its income growth values only

8/3/2019 ITU-ADB Interrim Indonesia Country Report
http://slidepdf.com/reader/full/itu-adb-interrim-indonesia-country-report 32/109
ADB Rural ICT Project
Indonesia Country Case Study Report
32
2.1%. While Bakrie Telecom which only earns operational income as much as Rp 2.2trillion in 2008, records its income growth values 70.7%.
Table 2408. Wireless cellular telephony operational income for each ompany (2006 – 2008)
Source: Statistic Data of Directorate General of Post and Telecommunication (2009)
Picture 2413. Chart of Wireless cellular telephony operational income growth (2006 – 2008)
Source: Statistic Data of Directorate General of Post and Telecommunication (2009)
Operational income growth shows a declining trend from 2007 to 2008 as what itshows from the chart above. Mobile-8 experiences a declining operational income upto 17.1% after it gets an increase almost 50%. Increase in operational income is onlyexperienced by Excelcomindo which gets 51.2% increase in 2008. Decliningtendency in operational income happens by a threshold phenomenon among themarket which affects the subscriber growth. Moreover, this income growth is reallyinfluenced by the marketing strategy of each operator.
8/3/2019 ITU-ADB Interrim Indonesia Country Report
http://slidepdf.com/reader/full/itu-adb-interrim-indonesia-country-report 33/109
ADB Rural ICT Project
Indonesia Country Case Study Report
33
B EBITDA (Earning Before Interest Tax Depreciation and Ammortization)
EBITDA is income approach which is calculated from operator’s income before it is
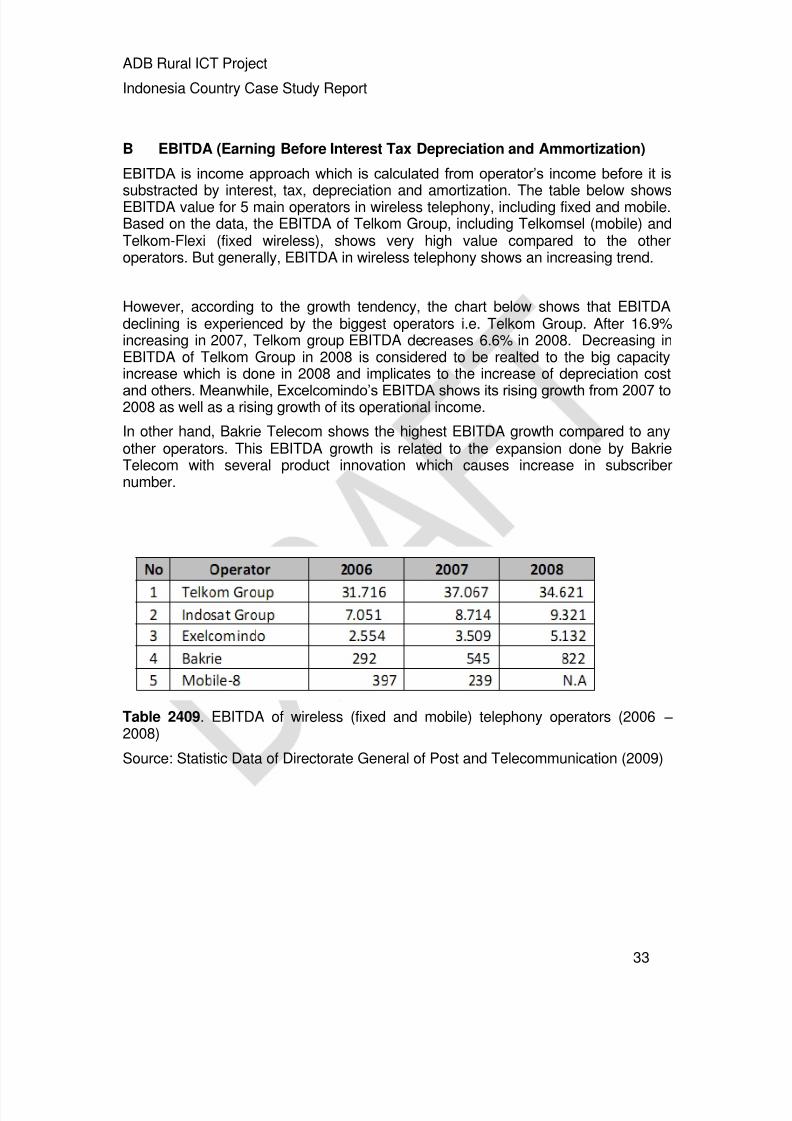
substracted by interest, tax, depreciation and amortization. The table below showsEBITDA value for 5 main operators in wireless telephony, including fixed and mobile.Based on the data, the EBITDA of Telkom Group, including Telkomsel (mobile) andTelkom-Flexi (fixed wireless), shows very high value compared to the otheroperators. But generally, EBITDA in wireless telephony shows an increasing trend.
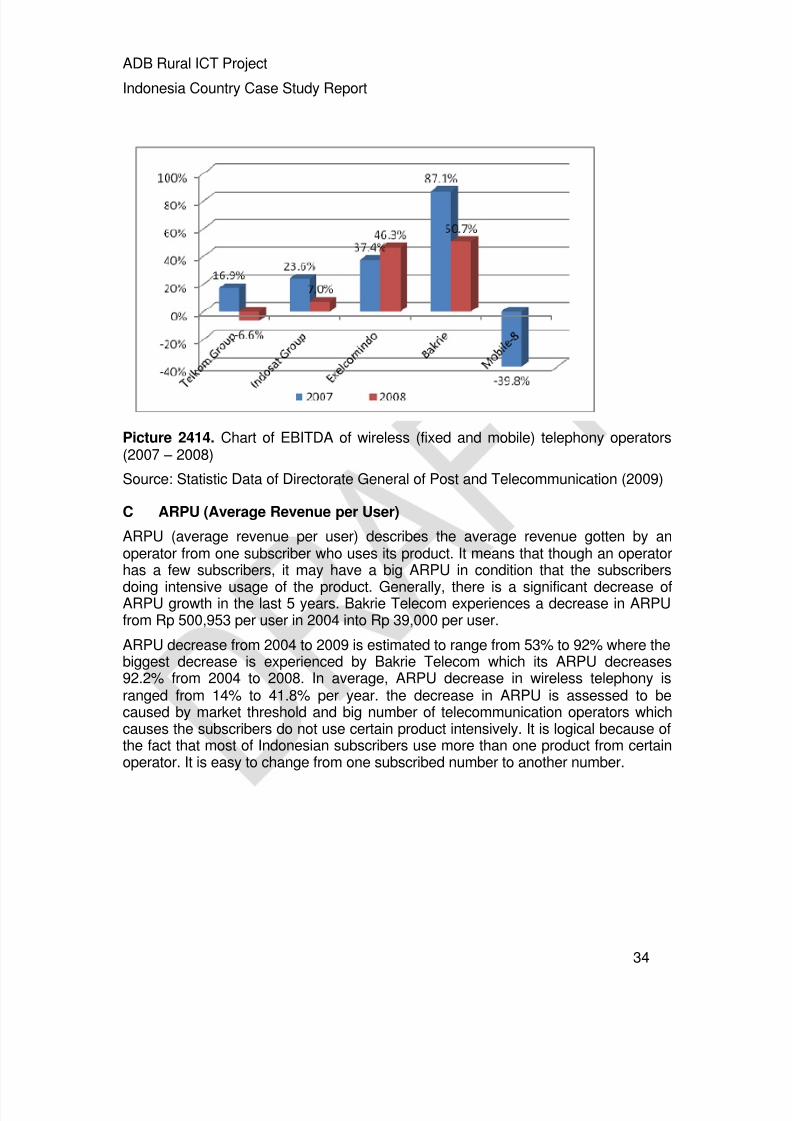
However, according to the growth tendency, the chart below shows that EBITDAdeclining is experienced by the biggest operators i.e. Telkom Group. After 16.9%increasing in 2007, Telkom group EBITDA decreases 6.6% in 2008. Decreasing inEBITDA of Telkom Group in 2008 is considered to be realted to the big capacityincrease which is done in 2008 and implicates to the increase of depreciation cost
and others. Meanwhile, Excelcomindo’s EBITDA shows its rising growth from 2007 to2008 as well as a rising growth of its operational income.
In other hand, Bakrie Telecom shows the highest EBITDA growth compared to anyother operators. This EBITDA growth is related to the expansion done by BakrieTelecom with several product innovation which causes increase in subscribernumber.
Table 2409. EBITDA of wireless (fixed and mobile) telephony operators (2006 – 2008)
Source: Statistic Data of Directorate General of Post and Telecommunication (2009)
8/3/2019 ITU-ADB Interrim Indonesia Country Report
http://slidepdf.com/reader/full/itu-adb-interrim-indonesia-country-report 34/109
ADB Rural ICT Project
Indonesia Country Case Study Report
34
Picture 2414. Chart of EBITDA of wireless (fixed and mobile) telephony operators(2007 – 2008)
Source: Statistic Data of Directorate General of Post and Telecommunication (2009)
C ARPU (Average Revenue per User)
ARPU (average revenue per user) describes the average revenue gotten by anoperator from one subscriber who uses its product. It means that though an operatorhas a few subscribers, it may have a big ARPU in condition that the subscribers
doing intensive usage of the product. Generally, there is a significant decrease ofARPU growth in the last 5 years. Bakrie Telecom experiences a decrease in ARPUfrom Rp 500,953 per user in 2004 into Rp 39,000 per user.
ARPU decrease from 2004 to 2009 is estimated to range from 53% to 92% where thebiggest decrease is experienced by Bakrie Telecom which its ARPU decreases92.2% from 2004 to 2008. In average, ARPU decrease in wireless telephony isranged from 14% to 41.8% per year. the decrease in ARPU is assessed to becaused by market threshold and big number of telecommunication operators whichcauses the subscribers do not use certain product intensively. It is logical because ofthe fact that most of Indonesian subscribers use more than one product from certainoperator. It is easy to change from one subscribed number to another number.
8/3/2019 ITU-ADB Interrim Indonesia Country Report
http://slidepdf.com/reader/full/itu-adb-interrim-indonesia-country-report 35/109
ADB Rural ICT Project
Indonesia Country Case Study Report
35
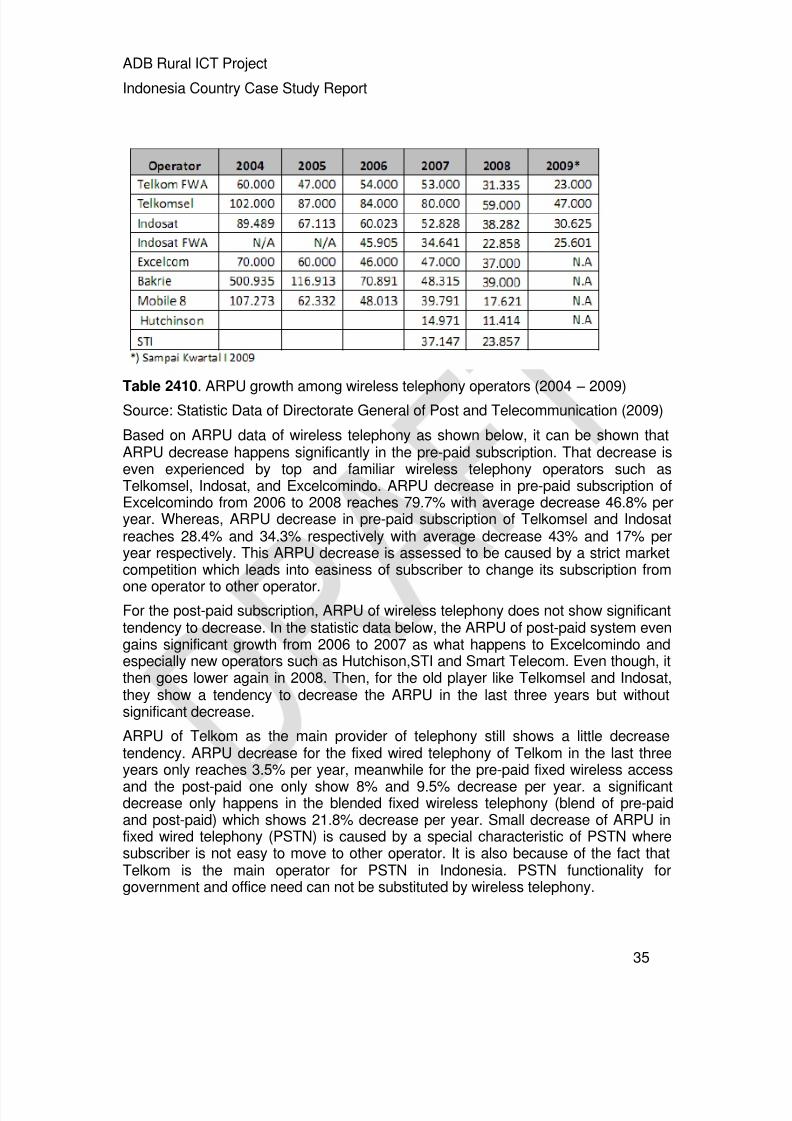
Table 2410. ARPU growth among wireless telephony operators (2004 – 2009)Source: Statistic Data of Directorate General of Post and Telecommunication (2009)
Based on ARPU data of wireless telephony as shown below, it can be shown thatARPU decrease happens significantly in the pre-paid subscription. That decrease iseven experienced by top and familiar wireless telephony operators such asTelkomsel, Indosat, and Excelcomindo. ARPU decrease in pre-paid subscription ofExcelcomindo from 2006 to 2008 reaches 79.7% with average decrease 46.8% peryear. Whereas, ARPU decrease in pre-paid subscription of Telkomsel and Indosatreaches 28.4% and 34.3% respectively with average decrease 43% and 17% peryear respectively. This ARPU decrease is assessed to be caused by a strict marketcompetition which leads into easiness of subscriber to change its subscription from
one operator to other operator.For the post-paid subscription, ARPU of wireless telephony does not show significanttendency to decrease. In the statistic data below, the ARPU of post-paid system evengains significant growth from 2006 to 2007 as what happens to Excelcomindo andespecially new operators such as Hutchison,STI and Smart Telecom. Even though, itthen goes lower again in 2008. Then, for the old player like Telkomsel and Indosat,they show a tendency to decrease the ARPU in the last three years but withoutsignificant decrease.
ARPU of Telkom as the main provider of telephony still shows a little decreasetendency. ARPU decrease for the fixed wired telephony of Telkom in the last threeyears only reaches 3.5% per year, meanwhile for the pre-paid fixed wireless access
and the post-paid one only show 8% and 9.5% decrease per year. a significantdecrease only happens in the blended fixed wireless telephony (blend of pre-paidand post-paid) which shows 21.8% decrease per year. Small decrease of ARPU infixed wired telephony (PSTN) is caused by a special characteristic of PSTN wheresubscriber is not easy to move to other operator. It is also because of the fact thatTelkom is the main operator for PSTN in Indonesia. PSTN functionality forgovernment and office need can not be substituted by wireless telephony.
8/3/2019 ITU-ADB Interrim Indonesia Country Report
http://slidepdf.com/reader/full/itu-adb-interrim-indonesia-country-report 36/109
ADB Rural ICT Project
Indonesia Country Case Study Report
36
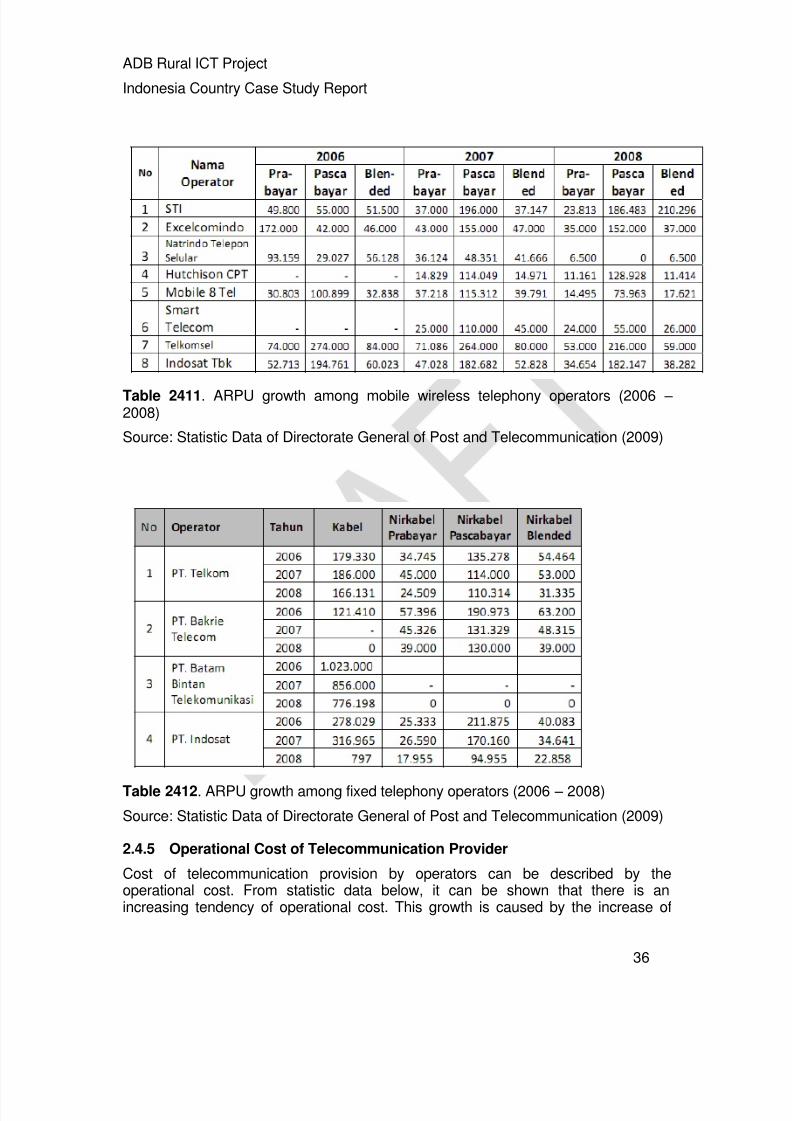
Table 2411. ARPU growth among mobile wireless telephony operators (2006 – 2008)
Source: Statistic Data of Directorate General of Post and Telecommunication (2009)
Table 2412. ARPU growth among fixed telephony operators (2006 – 2008)
Source: Statistic Data of Directorate General of Post and Telecommunication (2009)
2.4.5 Operational Cost of Telecommunication Provider
Cost of telecommunication provision by operators can be described by theoperational cost. From statistic data below, it can be shown that there is anincreasing tendency of operational cost. This growth is caused by the increase of

8/3/2019 ITU-ADB Interrim Indonesia Country Report
http://slidepdf.com/reader/full/itu-adb-interrim-indonesia-country-report 37/109
ADB Rural ICT Project
Indonesia Country Case Study Report
37
network capacity as elaborated before. Operational cost of Telkom group is thehighest compared to the other operators.
Table 2413. Operational cost growth among wireless telephony operators (fixed andmobile) (2006 – 2008)
Source: Statistic Data of Directorate General of Post and Telecommunication (2009)
2.4.6 Telecommunication Operator Employment
Fast subscriber number growth and network capacity increase which are done bytelecommunication operator, in fact, do not actually affect to the growth ofemployment. In the last 5 years, Telkomsel’s employee only increases 5.5% per year. Highest employment growth belongs to Bakrie Telecom which averagelyincreases 43.4% per year. Meanwhile, Telkom employment decreases 14% from2004 to 2008 with average decrease 3.9% per year.
Table 2414. Employee number growth among wireless telephony operators (fixedand mobile) (2004 – 2008)
Source: Statistic Data of Directorate General of Post and Telecommunication (2009)
From the proportion of the employee, almost all operators have more male employeethan the female one. Totally, from 6 main operators, male employee proportionreaches 74.8% and the female one reaches 25.2%. Highest proportion of male
8/3/2019 ITU-ADB Interrim Indonesia Country Report
http://slidepdf.com/reader/full/itu-adb-interrim-indonesia-country-report 38/109
ADB Rural ICT Project
Indonesia Country Case Study Report
38
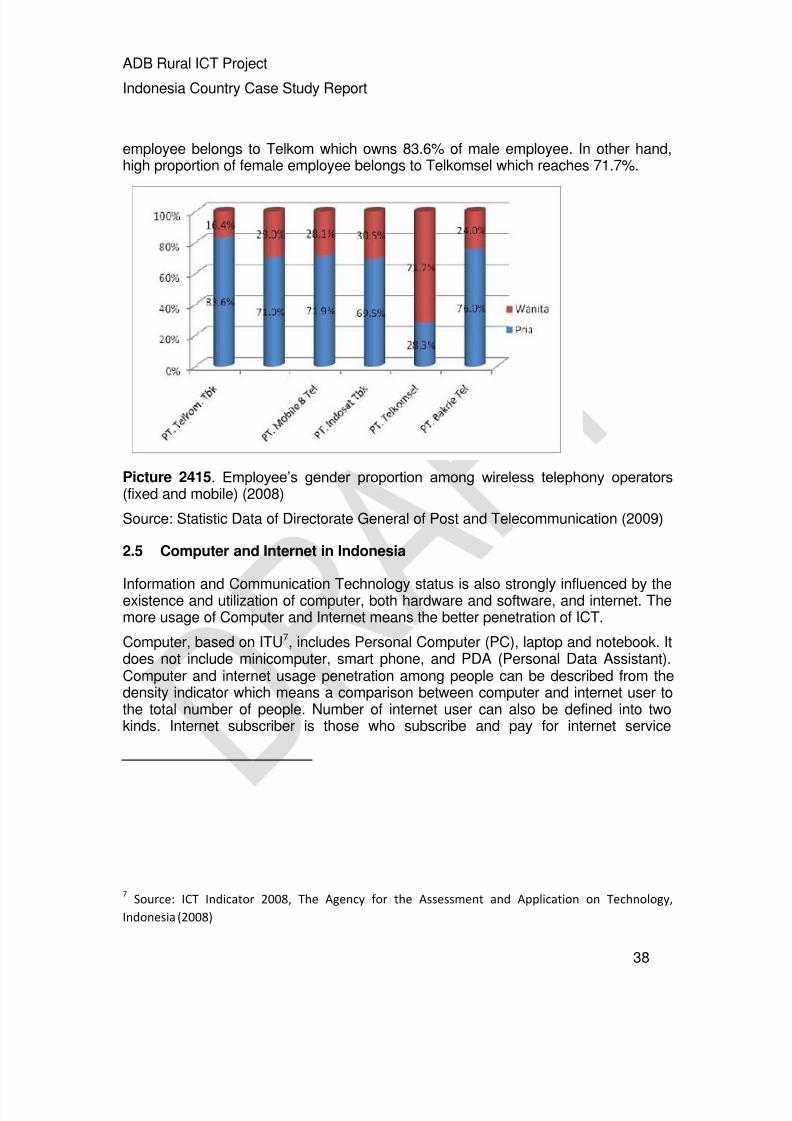
employee belongs to Telkom which owns 83.6% of male employee. In other hand,high proportion of female employee belongs to Telkomsel which reaches 71.7%.
Picture 2415. Employee’s gender proportion among wireless telephony operators(fixed and mobile) (2008)
Source: Statistic Data of Directorate General of Post and Telecommunication (2009)
2.5 Computer and Internet in Indonesia
Information and Communication Technology status is also strongly influenced by theexistence and utilization of computer, both hardware and software, and internet. Themore usage of Computer and Internet means the better penetration of ICT.
Computer, based on ITU7, includes Personal Computer (PC), laptop and notebook. Itdoes not include minicomputer, smart phone, and PDA (Personal Data Assistant).Computer and internet usage penetration among people can be described from thedensity indicator which means a comparison between computer and internet user tothe total number of people. Number of internet user can also be defined into twokinds. Internet subscriber is those who subscribe and pay for internet service
7Source: ICT Indicator 2008, The Agency for the Assessment and Application on Technology,
Indonesia (2008)

8/3/2019 ITU-ADB Interrim Indonesia Country Report
http://slidepdf.com/reader/full/itu-adb-interrim-indonesia-country-report 39/109
ADB Rural ICT Project
Indonesia Country Case Study Report
39
provision. Meanwhile, internet user is those who utilize internet regardless theysubscribe or not.
2.5.1 Computer Utilization in Indonesia
Computer-density, which describes the ratio between computer number to the peoplenumber, in ASEAN is averagely about 5.97% or 5.97 computers per 100 people. Itcan be shown from the graphic below that Singapore has the highest computer-density number as much as 76.80%, meanwhile Indonesia has only 2% computer-density or 2 computers per 100 people. Indonesian computer usage penetration is onthe 7th position among 10 ASEAN countries. The table below shows the computer-density of ASEAN countries based on statistic data compiled from 2005 to 2007.
Picture 2501. Computer-density of ASEAN countries (2007)
Source: ICT Indicator 2008, The Agency for the Assessment and Application onTechnology, Indonesia (2008)
8/3/2019 ITU-ADB Interrim Indonesia Country Report
http://slidepdf.com/reader/full/itu-adb-interrim-indonesia-country-report 40/109
ADB Rural ICT Project
Indonesia Country Case Study Report
40
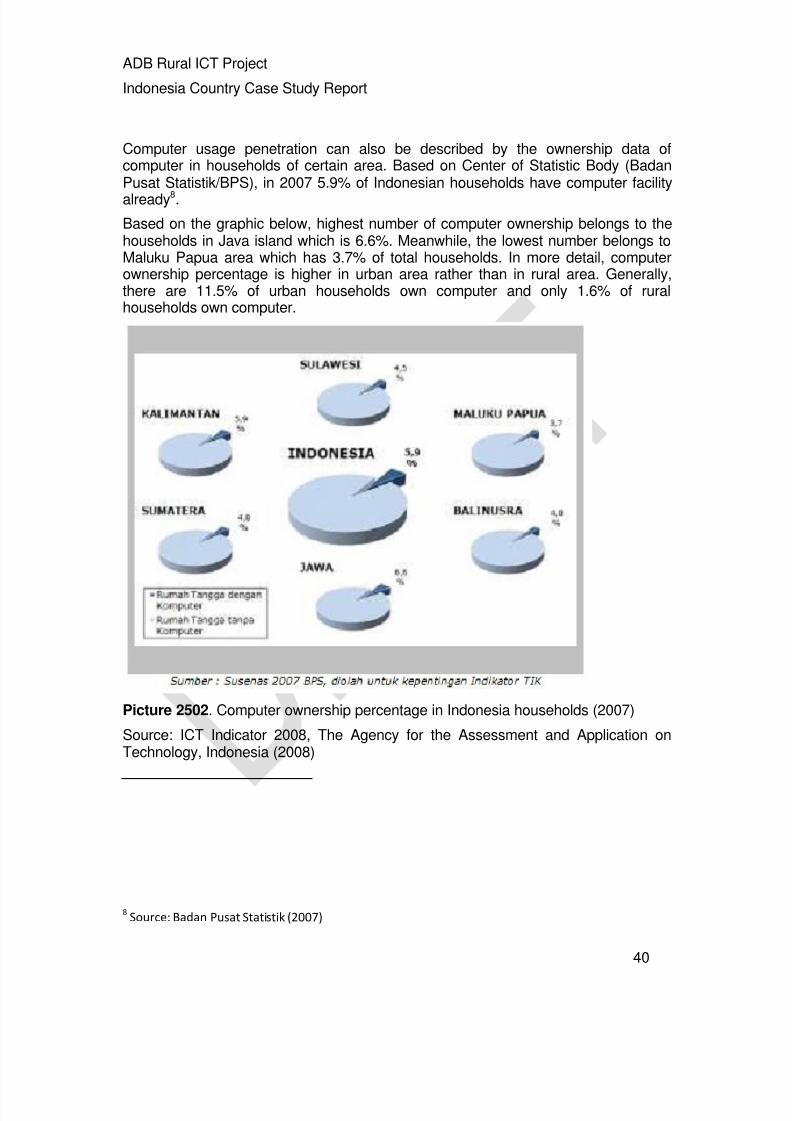
Computer usage penetration can also be described by the ownership data ofcomputer in households of certain area. Based on Center of Statistic Body (BadanPusat Statistik/BPS), in 2007 5.9% of Indonesian households have computer facility
already8.
Based on the graphic below, highest number of computer ownership belongs to thehouseholds in Java island which is 6.6%. Meanwhile, the lowest number belongs toMaluku Papua area which has 3.7% of total households. In more detail, computerownership percentage is higher in urban area rather than in rural area. Generally,there are 11.5% of urban households own computer and only 1.6% of ruralhouseholds own computer.
Picture 2502. Computer ownership percentage in Indonesia households (2007)
Source: ICT Indicator 2008, The Agency for the Assessment and Application onTechnology, Indonesia (2008)
8Source: Badan Pusat Statistik (2007)
8/3/2019 ITU-ADB Interrim Indonesia Country Report
http://slidepdf.com/reader/full/itu-adb-interrim-indonesia-country-report 41/109
ADB Rural ICT Project
Indonesia Country Case Study Report
41
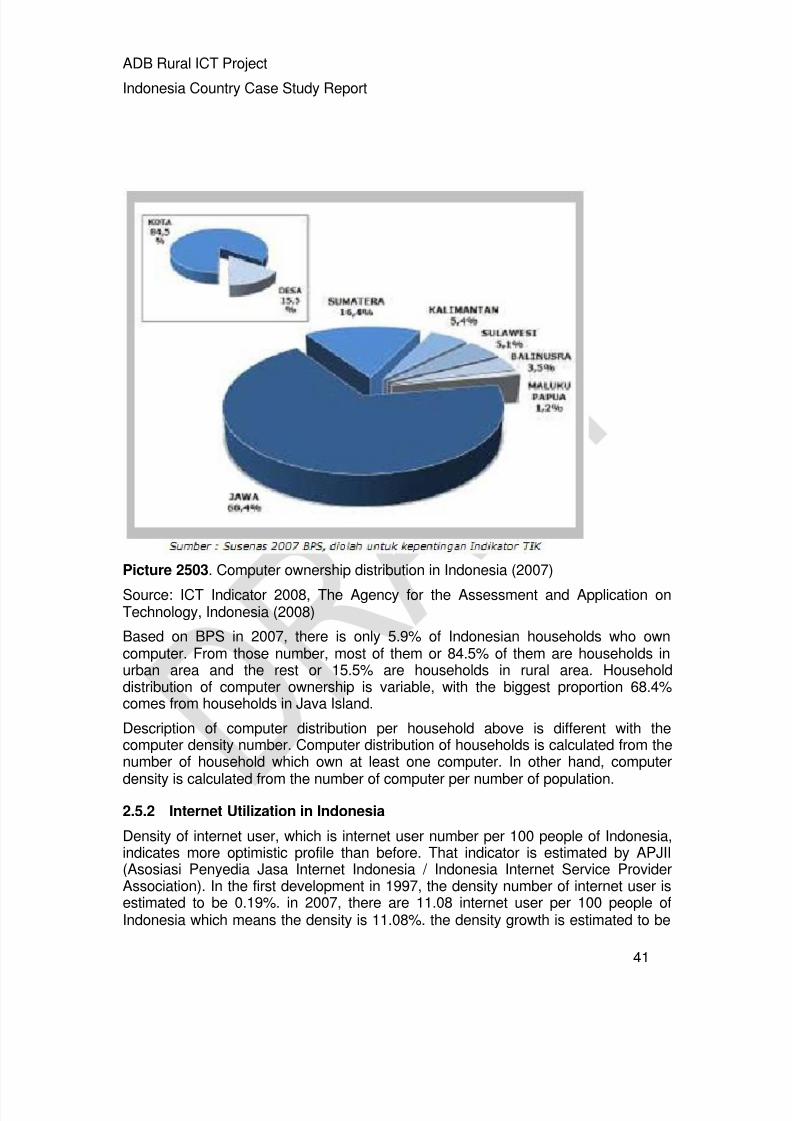
Picture 2503. Computer ownership distribution in Indonesia (2007)
Source: ICT Indicator 2008, The Agency for the Assessment and Application onTechnology, Indonesia (2008)
Based on BPS in 2007, there is only 5.9% of Indonesian households who owncomputer. From those number, most of them or 84.5% of them are households inurban area and the rest or 15.5% are households in rural area. Householddistribution of computer ownership is variable, with the biggest proportion 68.4%comes from households in Java Island.
Description of computer distribution per household above is different with thecomputer density number. Computer distribution of households is calculated from thenumber of household which own at least one computer. In other hand, computer
density is calculated from the number of computer per number of population.
2.5.2 Internet Utilization in Indonesia
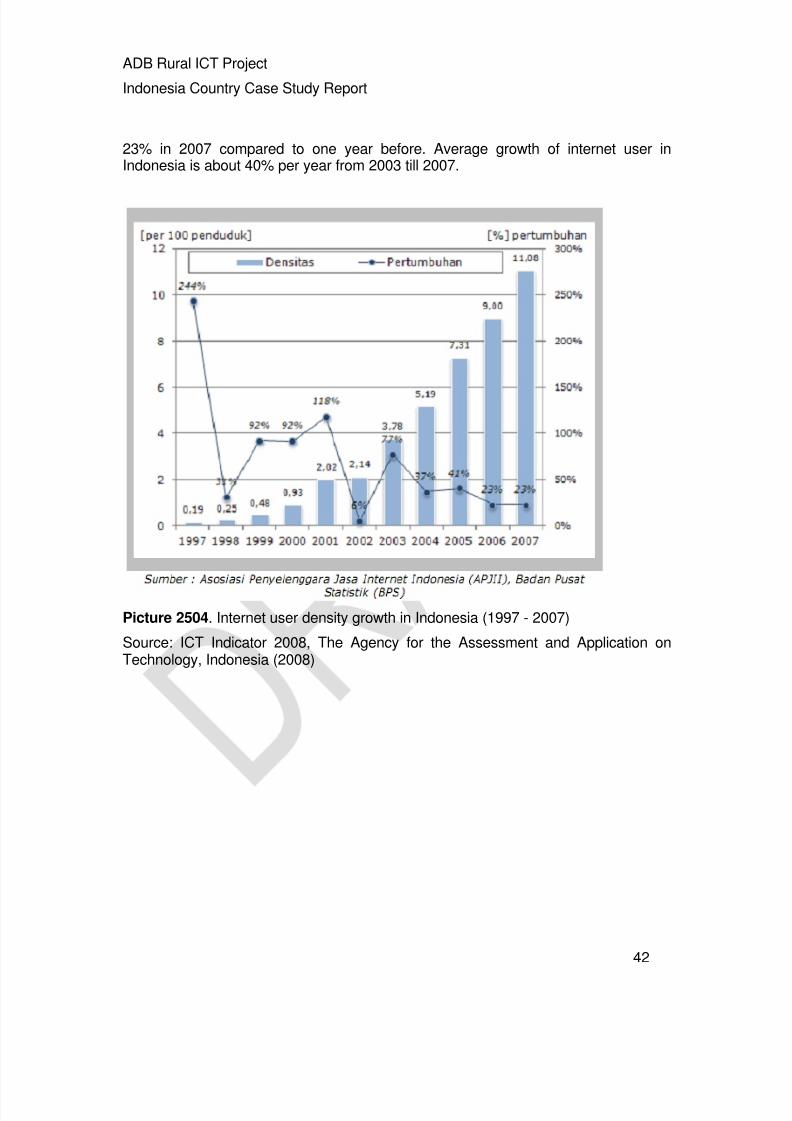
Density of internet user, which is internet user number per 100 people of Indonesia,indicates more optimistic profile than before. That indicator is estimated by APJII(Asosiasi Penyedia Jasa Internet Indonesia / Indonesia Internet Service ProviderAssociation). In the first development in 1997, the density number of internet user isestimated to be 0.19%. in 2007, there are 11.08 internet user per 100 people ofIndonesia which means the density is 11.08%. the density growth is estimated to be
8/3/2019 ITU-ADB Interrim Indonesia Country Report
http://slidepdf.com/reader/full/itu-adb-interrim-indonesia-country-report 42/109
ADB Rural ICT Project
Indonesia Country Case Study Report
42
23% in 2007 compared to one year before. Average growth of internet user inIndonesia is about 40% per year from 2003 till 2007.
Picture 2504. Internet user density growth in Indonesia (1997 - 2007)
Source: ICT Indicator 2008, The Agency for the Assessment and Application onTechnology, Indonesia (2008)
8/3/2019 ITU-ADB Interrim Indonesia Country Report
http://slidepdf.com/reader/full/itu-adb-interrim-indonesia-country-report 43/109
ADB Rural ICT Project
Indonesia Country Case Study Report
43
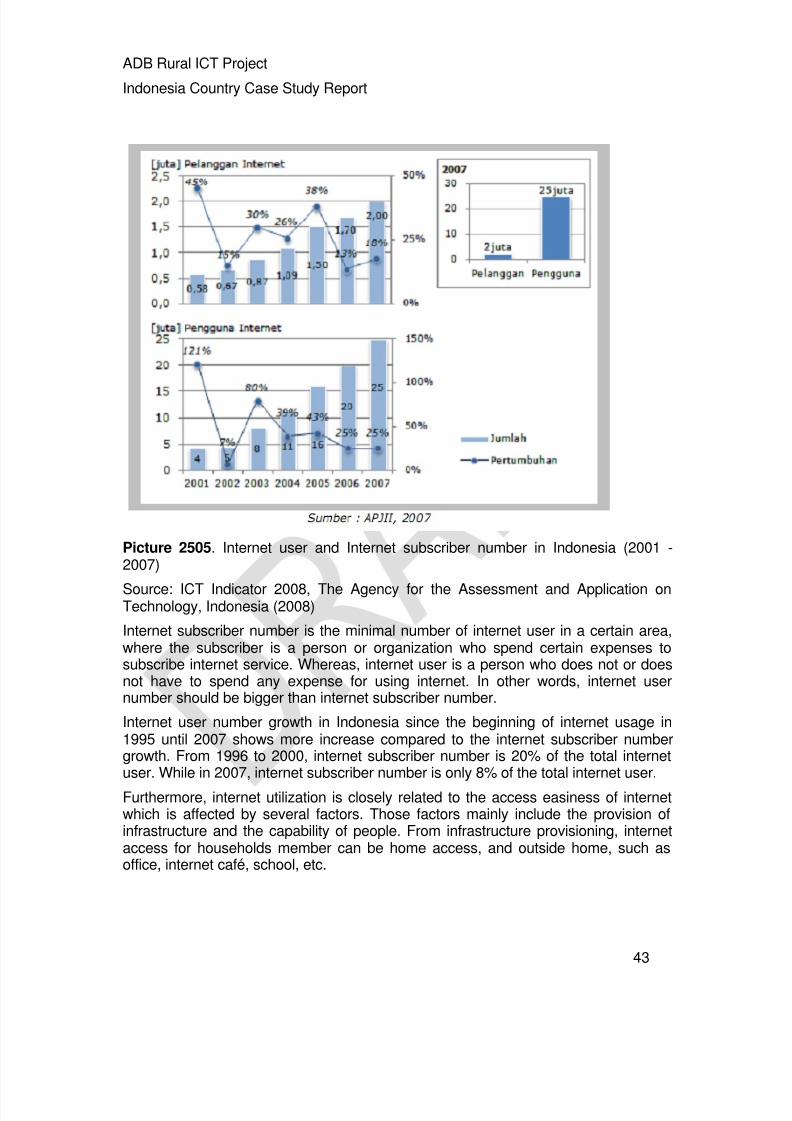
Picture 2505. Internet user and Internet subscriber number in Indonesia (2001 -2007)
Source: ICT Indicator 2008, The Agency for the Assessment and Application onTechnology, Indonesia (2008)
Internet subscriber number is the minimal number of internet user in a certain area,where the subscriber is a person or organization who spend certain expenses tosubscribe internet service. Whereas, internet user is a person who does not or doesnot have to spend any expense for using internet. In other words, internet usernumber should be bigger than internet subscriber number.
Internet user number growth in Indonesia since the beginning of internet usage in1995 until 2007 shows more increase compared to the internet subscriber numbergrowth. From 1996 to 2000, internet subscriber number is 20% of the total internetuser. While in 2007, internet subscriber number is only 8% of the total internet user.
Furthermore, internet utilization is closely related to the access easiness of internetwhich is affected by several factors. Those factors mainly include the provision ofinfrastructure and the capability of people. From infrastructure provisioning, internetaccess for households member can be home access, and outside home, such asoffice, internet café, school, etc.
8/3/2019 ITU-ADB Interrim Indonesia Country Report
http://slidepdf.com/reader/full/itu-adb-interrim-indonesia-country-report 44/109
ADB Rural ICT Project
Indonesia Country Case Study Report
44
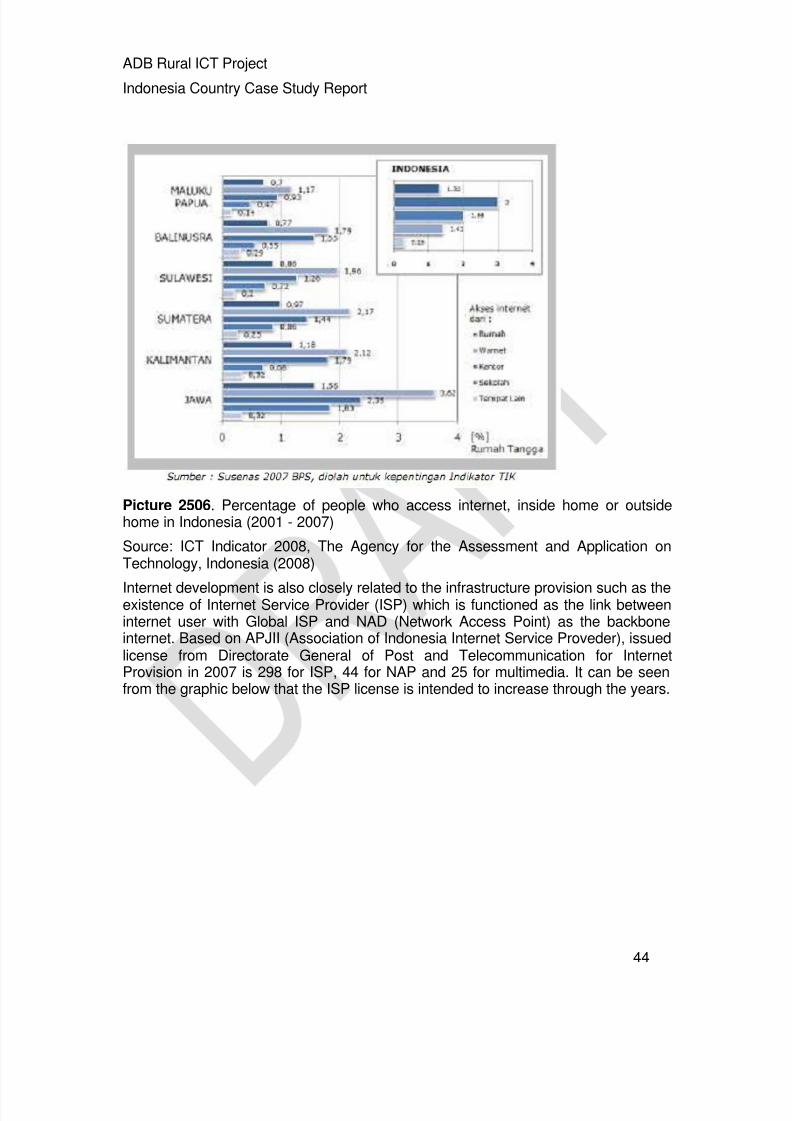
Picture 2506. Percentage of people who access internet, inside home or outsidehome in Indonesia (2001 - 2007)
Source: ICT Indicator 2008, The Agency for the Assessment and Application onTechnology, Indonesia (2008)
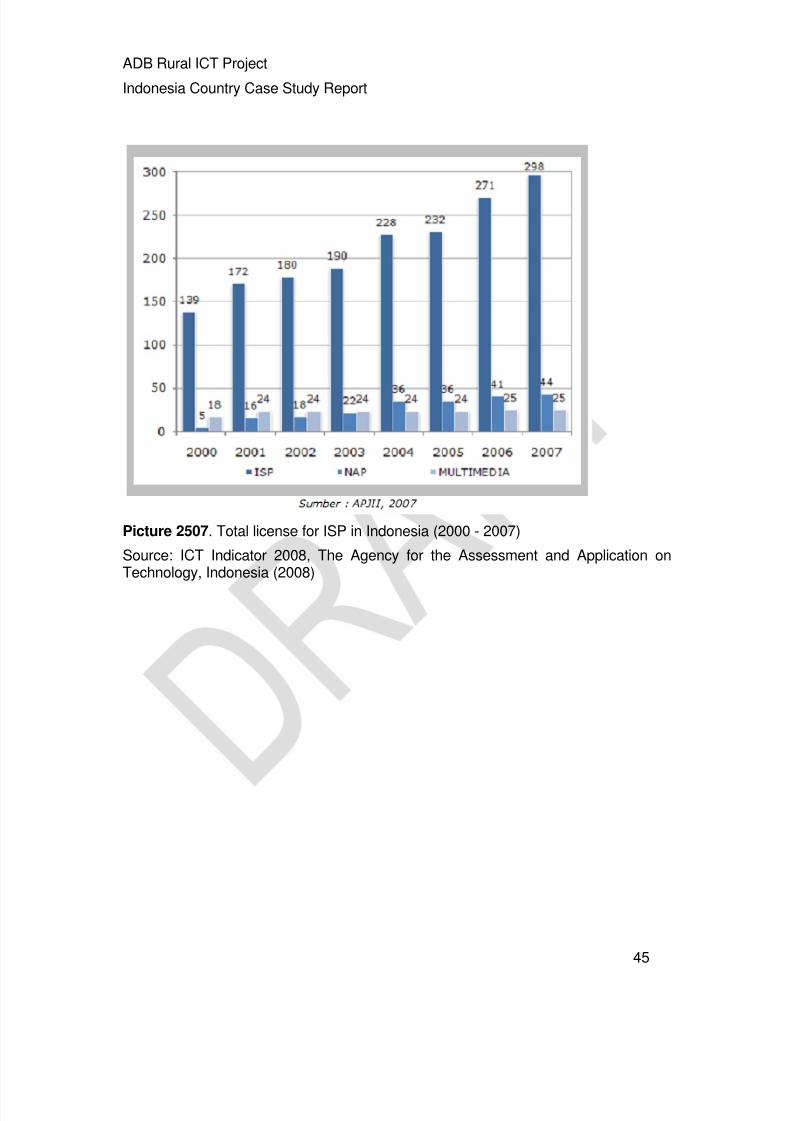
Internet development is also closely related to the infrastructure provision such as theexistence of Internet Service Provider (ISP) which is functioned as the link betweeninternet user with Global ISP and NAD (Network Access Point) as the backboneinternet. Based on APJII (Association of Indonesia Internet Service Proveder), issuedlicense from Directorate General of Post and Telecommunication for InternetProvision in 2007 is 298 for ISP, 44 for NAP and 25 for multimedia. It can be seenfrom the graphic below that the ISP license is intended to increase through the years.
8/3/2019 ITU-ADB Interrim Indonesia Country Report
http://slidepdf.com/reader/full/itu-adb-interrim-indonesia-country-report 45/109
ADB Rural ICT Project
Indonesia Country Case Study Report
45
Picture 2507. Total license for ISP in Indonesia (2000 - 2007)
Source: ICT Indicator 2008, The Agency for the Assessment and Application onTechnology, Indonesia (2008)

8/3/2019 ITU-ADB Interrim Indonesia Country Report
http://slidepdf.com/reader/full/itu-adb-interrim-indonesia-country-report 46/109
ADB Rural ICT Project
Indonesia Country Case Study Report
46
Picture 2508. Percentage of Internet Cafe Total in Indonesa.(2005)
Source: ICT Indicator 2008, The Agency for the Assessment and Application onTechnology, Indonesia (2008)
8/3/2019 ITU-ADB Interrim Indonesia Country Report
http://slidepdf.com/reader/full/itu-adb-interrim-indonesia-country-report 47/109
ADB Rural ICT Project
Indonesia Country Case Study Report
47
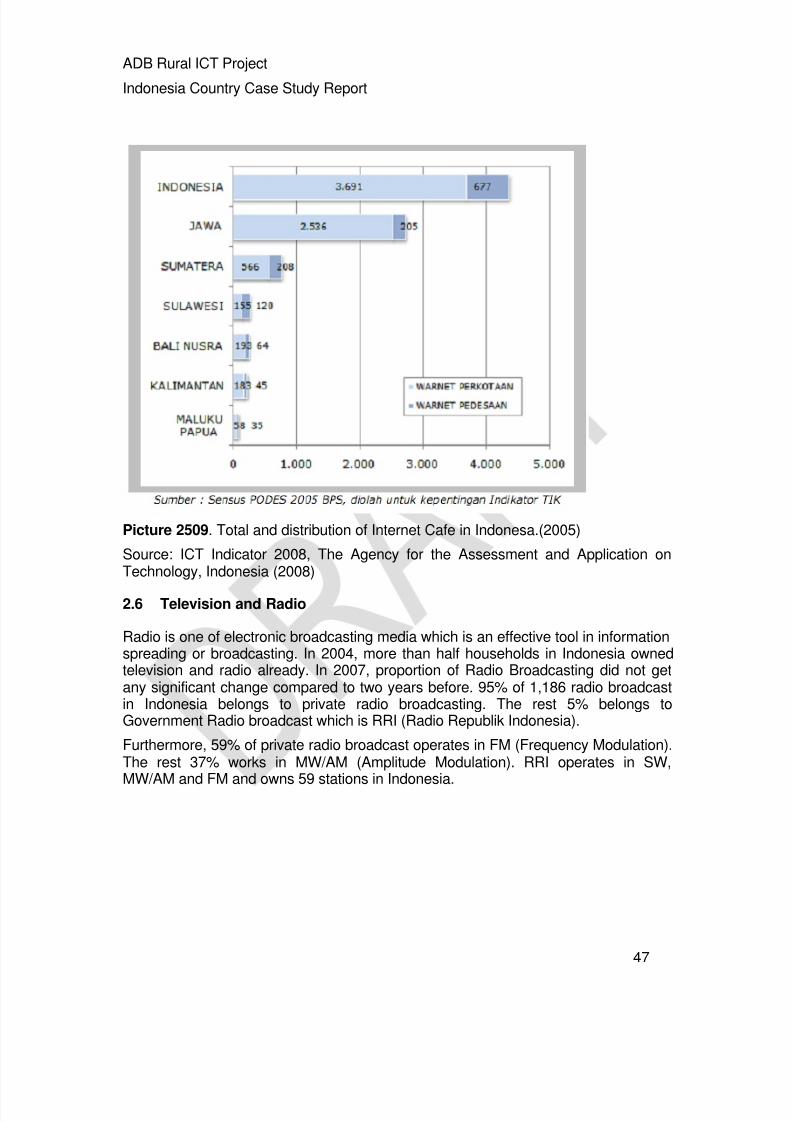
Picture 2509. Total and distribution of Internet Cafe in Indonesa.(2005)
Source: ICT Indicator 2008, The Agency for the Assessment and Application onTechnology, Indonesia (2008)
2.6 Television and Radio
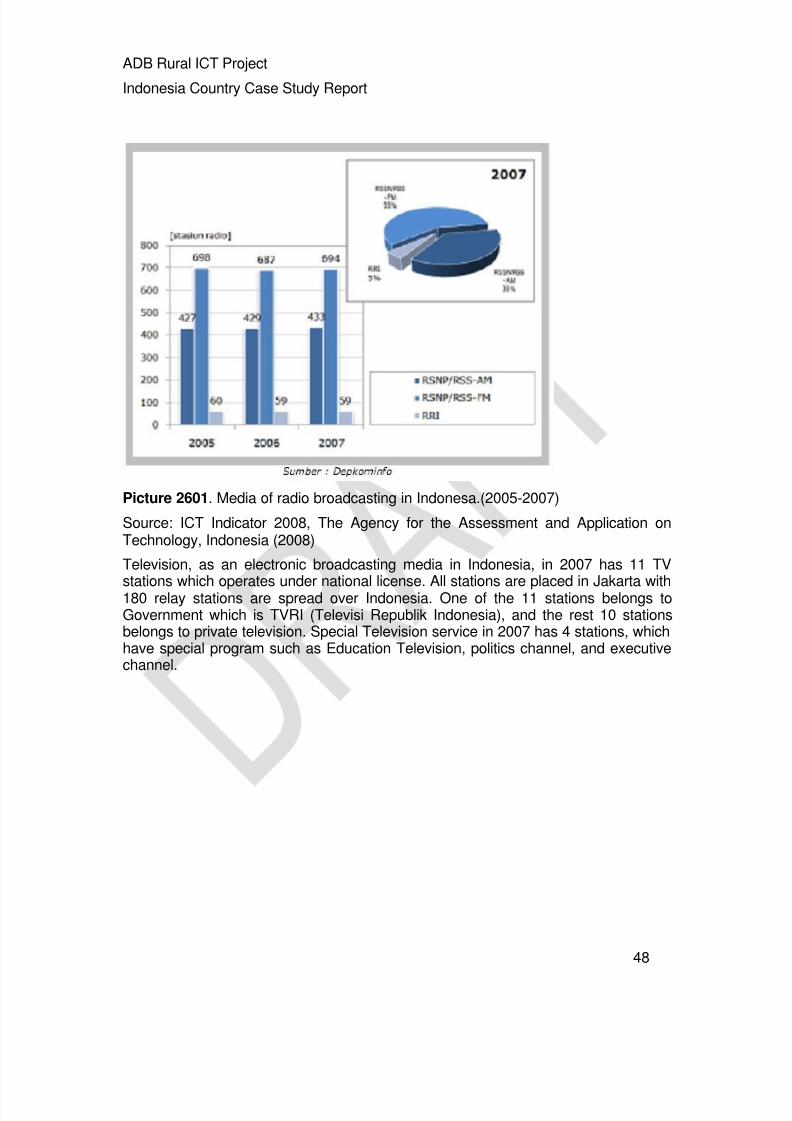
Radio is one of electronic broadcasting media which is an effective tool in informationspreading or broadcasting. In 2004, more than half households in Indonesia ownedtelevision and radio already. In 2007, proportion of Radio Broadcasting did not getany significant change compared to two years before. 95% of 1,186 radio broadcastin Indonesia belongs to private radio broadcasting. The rest 5% belongs toGovernment Radio broadcast which is RRI (Radio Republik Indonesia).
Furthermore, 59% of private radio broadcast operates in FM (Frequency Modulation).The rest 37% works in MW/AM (Amplitude Modulation). RRI operates in SW,
MW/AM and FM and owns 59 stations in Indonesia.
8/3/2019 ITU-ADB Interrim Indonesia Country Report
http://slidepdf.com/reader/full/itu-adb-interrim-indonesia-country-report 48/109
ADB Rural ICT Project
Indonesia Country Case Study Report
48
Picture 2601. Media of radio broadcasting in Indonesa.(2005-2007)
Source: ICT Indicator 2008, The Agency for the Assessment and Application onTechnology, Indonesia (2008)
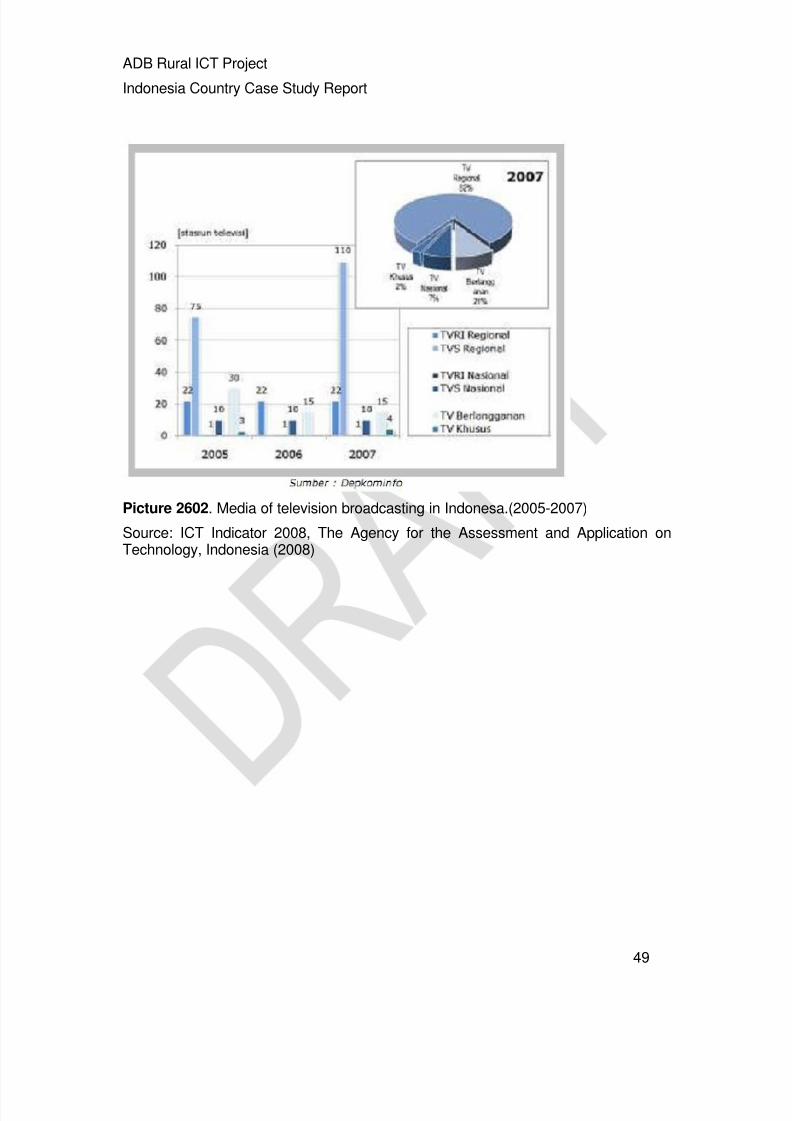
Television, as an electronic broadcasting media in Indonesia, in 2007 has 11 TVstations which operates under national license. All stations are placed in Jakarta with180 relay stations are spread over Indonesia. One of the 11 stations belongs toGovernment which is TVRI (Televisi Republik Indonesia), and the rest 10 stationsbelongs to private television. Special Television service in 2007 has 4 stations, whichhave special program such as Education Television, politics channel, and executivechannel.
8/3/2019 ITU-ADB Interrim Indonesia Country Report
http://slidepdf.com/reader/full/itu-adb-interrim-indonesia-country-report 49/109
ADB Rural ICT Project
Indonesia Country Case Study Report
49
Picture 2602. Media of television broadcasting in Indonesa.(2005-2007)
Source: ICT Indicator 2008, The Agency for the Assessment and Application onTechnology, Indonesia (2008)
8/3/2019 ITU-ADB Interrim Indonesia Country Report
http://slidepdf.com/reader/full/itu-adb-interrim-indonesia-country-report 50/109
ADB Rural ICT Project
Indonesia Country Case Study Report
50
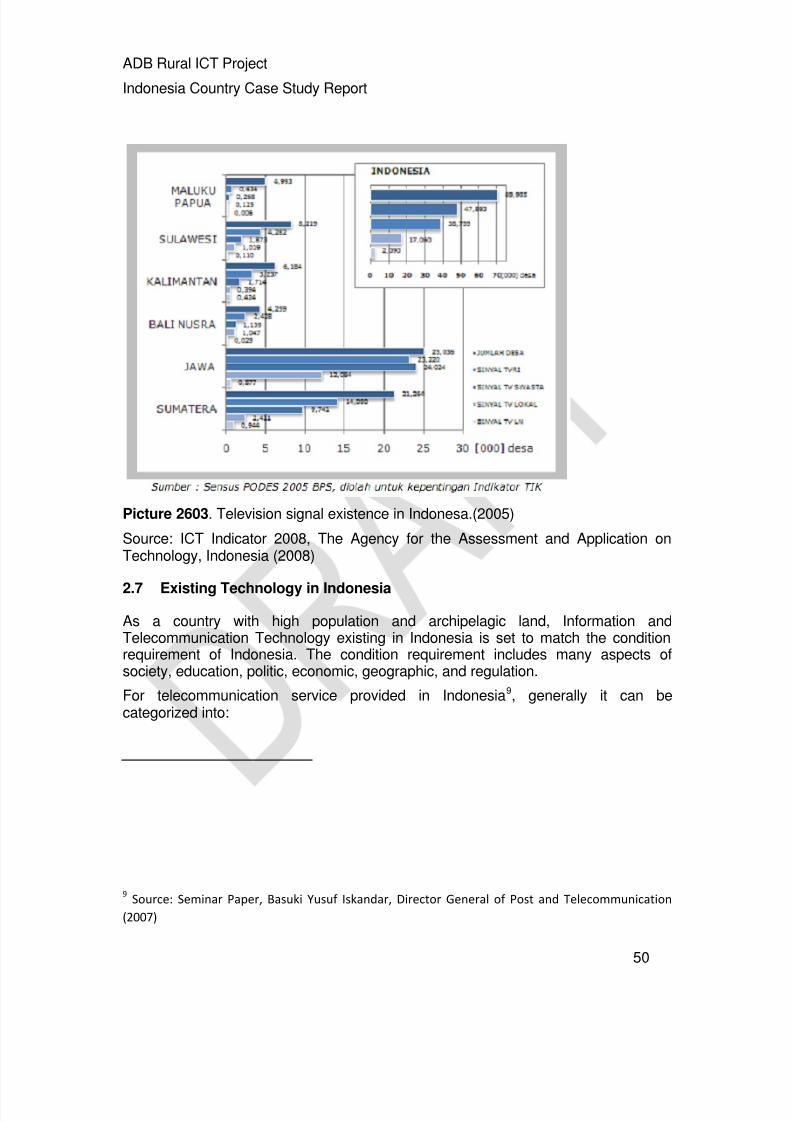
Picture 2603. Television signal existence in Indonesa.(2005)
Source: ICT Indicator 2008, The Agency for the Assessment and Application onTechnology, Indonesia (2008)
2.7 Existing Technology in Indonesia
As a country with high population and archipelagic land, Information andTelecommunication Technology existing in Indonesia is set to match the conditionrequirement of Indonesia. The condition requirement includes many aspects ofsociety, education, politic, economic, geographic, and regulation.
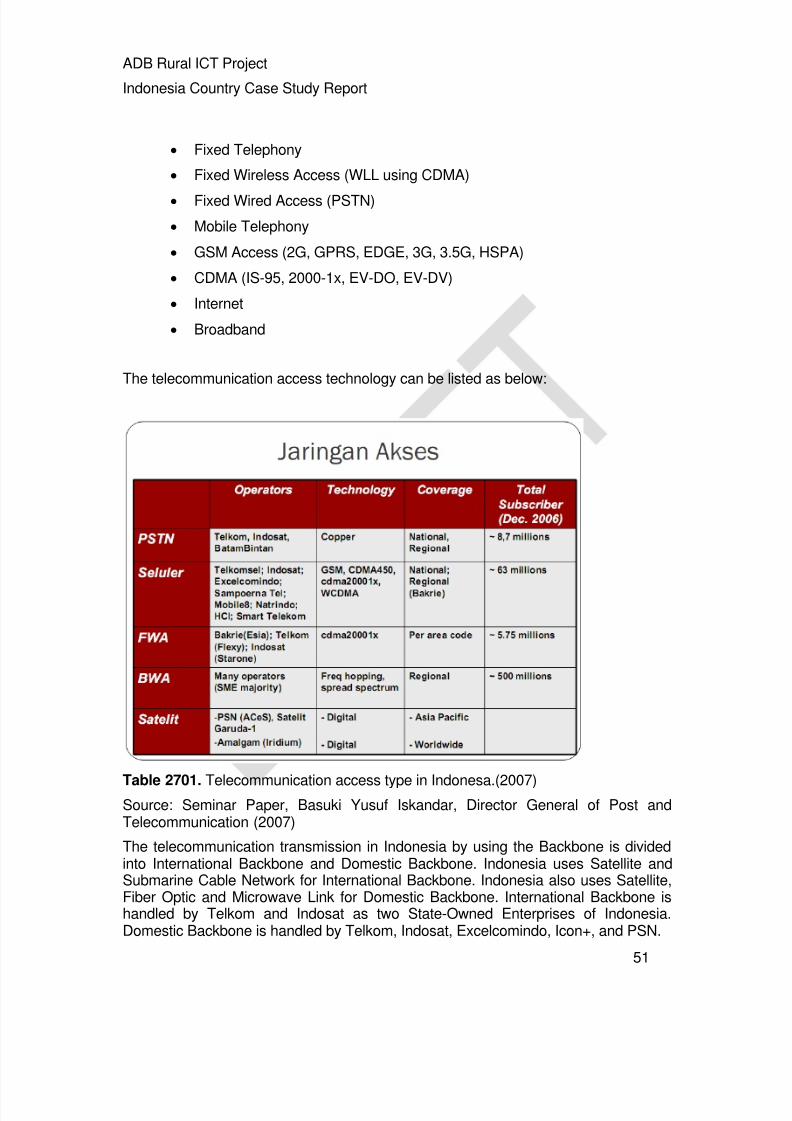
For telecommunication service provided in Indonesia9, generally it can becategorized into:
9Source: Seminar Paper, Basuki Yusuf Iskandar, Director General of Post and Telecommunication
(2007)
8/3/2019 ITU-ADB Interrim Indonesia Country Report
http://slidepdf.com/reader/full/itu-adb-interrim-indonesia-country-report 51/109
ADB Rural ICT Project
Indonesia Country Case Study Report
51
Fixed Telephony
Fixed Wireless Access (WLL using CDMA)
Fixed Wired Access (PSTN)
Mobile Telephony
GSM Access (2G, GPRS, EDGE, 3G, 3.5G, HSPA)
CDMA (IS-95, 2000-1x, EV-DO, EV-DV)
Internet
Broadband
The telecommunication access technology can be listed as below:
Table 2701. Telecommunication access type in Indonesa.(2007)Source: Seminar Paper, Basuki Yusuf Iskandar, Director General of Post andTelecommunication (2007)
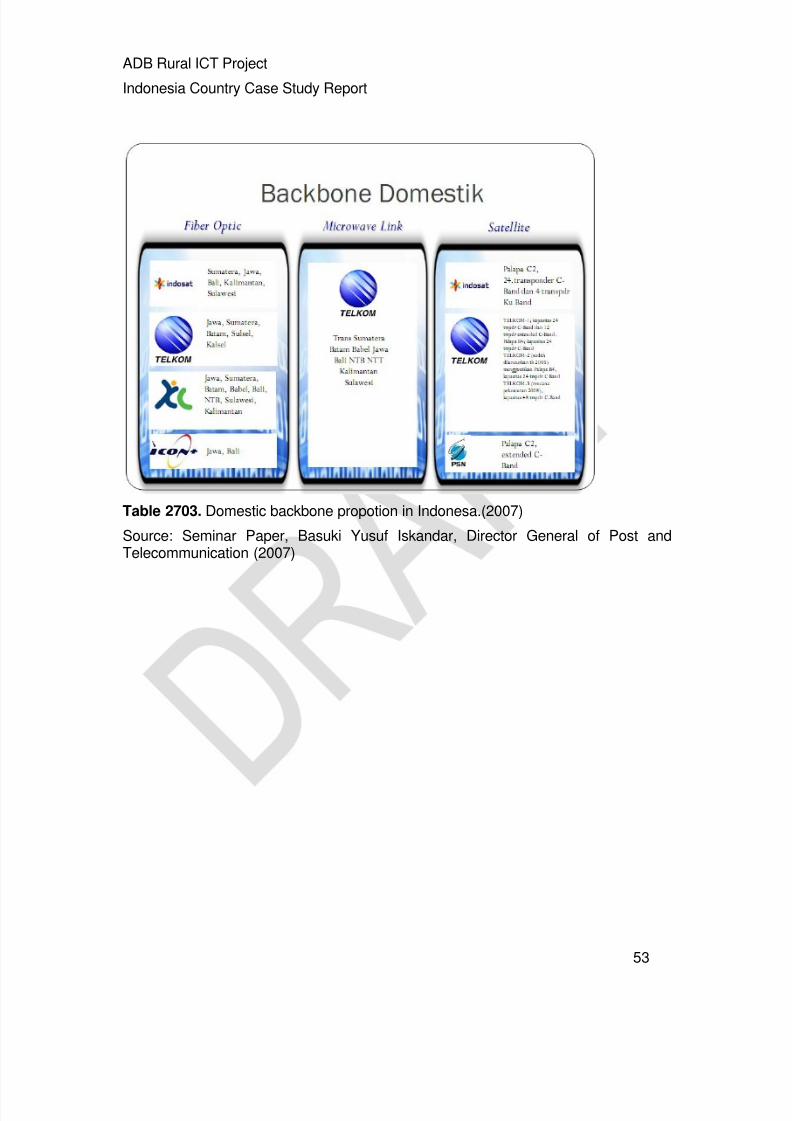
The telecommunication transmission in Indonesia by using the Backbone is dividedinto International Backbone and Domestic Backbone. Indonesia uses Satellite andSubmarine Cable Network for International Backbone. Indonesia also uses Satellite,Fiber Optic and Microwave Link for Domestic Backbone. International Backbone ishandled by Telkom and Indosat as two State-Owned Enterprises of Indonesia.Domestic Backbone is handled by Telkom, Indosat, Excelcomindo, Icon+, and PSN.

8/3/2019 ITU-ADB Interrim Indonesia Country Report
http://slidepdf.com/reader/full/itu-adb-interrim-indonesia-country-report 52/109
ADB Rural ICT Project
Indonesia Country Case Study Report
52
Table 2702. International backbone propotion in Indonesa.(2007)
Source: Seminar Paper, Basuki Yusuf Iskandar, Director General of Post andTelecommunication (2007)
8/3/2019 ITU-ADB Interrim Indonesia Country Report
http://slidepdf.com/reader/full/itu-adb-interrim-indonesia-country-report 53/109
ADB Rural ICT Project
Indonesia Country Case Study Report
53
Table 2703. Domestic backbone propotion in Indonesa.(2007)
Source: Seminar Paper, Basuki Yusuf Iskandar, Director General of Post andTelecommunication (2007)

8/3/2019 ITU-ADB Interrim Indonesia Country Report
http://slidepdf.com/reader/full/itu-adb-interrim-indonesia-country-report 54/109
ADB Rural ICT Project
Indonesia Country Case Study Report
54
8/3/2019 ITU-ADB Interrim Indonesia Country Report
http://slidepdf.com/reader/full/itu-adb-interrim-indonesia-country-report 55/109
ADB Rural ICT Project
Indonesia Country Case Study Report
55
Chapter 3 Status of Rural ICT in Indonesia
3.1 Between Rural Area and ICT in Indonesia
Most of Indonesian people recently live in the rural area. It is about 60% of totalpeople of Indonesia. Rural area is described with its low economic productivity, highpoverty, and low quality of settlement in rural. In other hand, poverty level of in ruralareas is so high based on statistic indicator. In 2003, there are 37.3 million of poorpeople in Indonesia (17.4% of total people). It consists of 20.2% in rural area and13.6% in urban area. It is shown that the rural areas have more percentage ofpoverty than the urban area has. [1]
Through the growth of rural areas, telecommunication industry grows rapidly, but
without equal distribution of infrastructure and services. Thus, there are still so manyrural areas which do not get any telecommunication service yet. In 2009, there arestill 31,824 villages which were not touched yet by any telecommunication service.Telecommunication access demand is going step by step which was firstly focusedon public telephone provision. The growth of the demand is increased as theeconomic condition increases due to telecommunication industry.
Telecommunication gap is really happens among one area to the other areas inIndonesia. Until 2008, most of the telecommunication infrastructure (86%) exists inSumatera, Java and Bali only. Only 14% of total telecommunication infrastructureexists in Eastern Indonesia. Telecommunication gap also exists between rural areaand urban area. Tele-density of Jakarta, Bogor, Tangerang, Depok, Bekasi and otherurban area has reach 35% or at least 11-25%. Meanwhile, tele-density in rural areasonly reaches 0.25%. Until 2009, there were already 43,000 villages (64% of totalvillages) which had telecommunication access at least only one single publictelephone. [2]
Indonesia is an archipelagic country which possesses a very diverse geographiccharacteristic and resources. There are many regions with good economical potencywhich require infrastructure support especially telecommunication infrastructure. Themain problem in establishing rural ICT is the very high cost of investment andoperation. Meanwhile the income earned from the service is low. Therefore,investment in rural areas, isolated areas, and border areas is not commerciallyviable. In this case, government arranges the Universal Service Obligation programto provide rural ICT.[3]
3.2 ICT Penetration in Rural Area in Indonesia
Indonesia is a high populated country which demands a big use of information andcommunication technology. The demand of ICT is massively large already. But incontrast, the economic condition of Indonesia brings limitation of ICT utilization insociety. By the end of 2006, telecommunication access infrastructure in Indonesiaconsisted of 14.6 million fixed lines, where 8.7 million was fixed line and 5.9 millionwas fixed wireless access, and 63 million cellular infrastructures. [4]
8/3/2019 ITU-ADB Interrim Indonesia Country Report
http://slidepdf.com/reader/full/itu-adb-interrim-indonesia-country-report 56/109
ADB Rural ICT Project
Indonesia Country Case Study Report
56
Based on the philosophy of telecommunication, there is such a willing from thegovernment of Indonesia to build ICT infrastructure in the whole area of Indonesia. Itis also encouraged from a fact that ICT provision of information plays a significant
role in educating and enhancing the economical welfare of people. The first approachhas been taken through motivating several remote and rural areas to utilize ICTservice for their life. This approach faced many obstacles where the ICT services arenot affordable enough for the rural people. [2]
In the early condition, rural area in Indonesia almost has not any contact withInformation and Communication Technology. There is not any internet or telephonyservice. The only media people rely on is only postal service. Information andCommunication Technology is only well-penetrating the urban area. A significant gapof information between urban and rural area is so far so that leads more significantgap of economic condition between urban and rural area. As the world biggestarchipelagic country, Indonesia has so many villages, forest, and remotes areas.
Those rural characteristic of Indonesia give certain challenge on how to establishuniversal service of telecommunication.
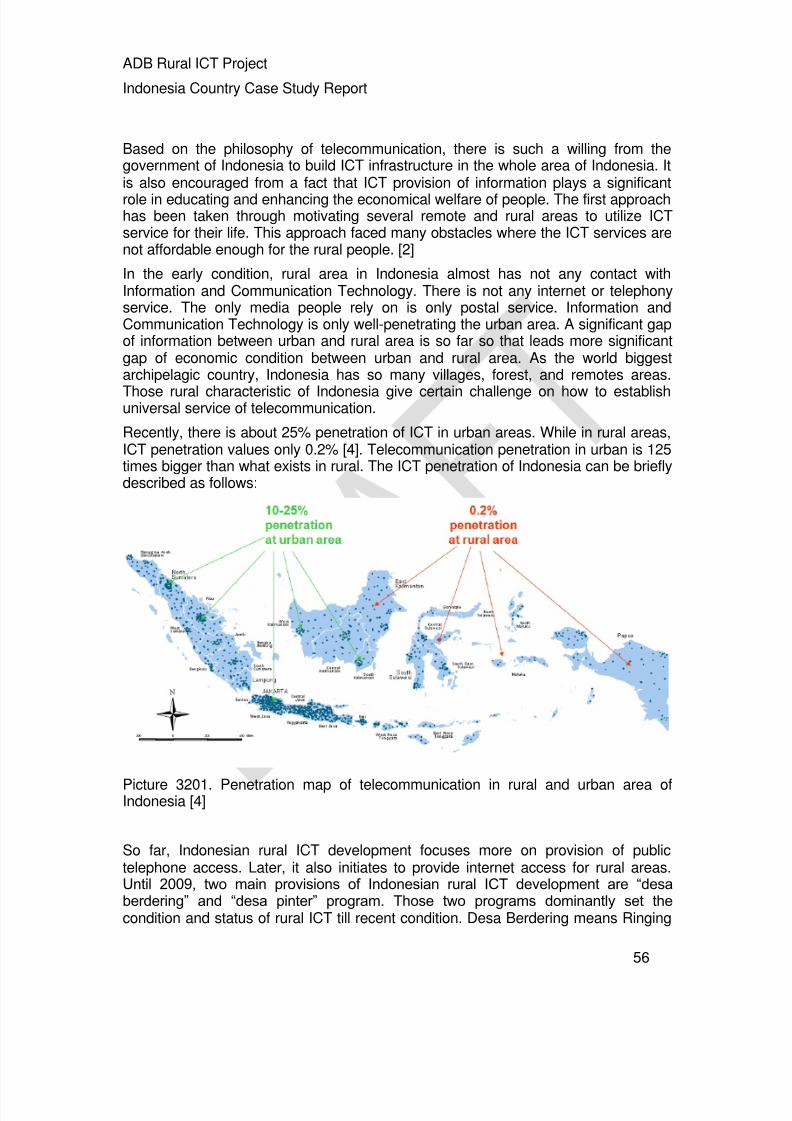
Recently, there is about 25% penetration of ICT in urban areas. While in rural areas,ICT penetration values only 0.2% [4]. Telecommunication penetration in urban is 125times bigger than what exists in rural. The ICT penetration of Indonesia can be brieflydescribed as follows:
Picture 3201. Penetration map of telecommunication in rural and urban area ofIndonesia [4]
So far, Indonesian rural ICT development focuses more on provision of publictelephone access. Later, it also initiates to provide internet access for rural areas.Until 2009, two main provisions of Indonesian rural ICT development are ―desaberdering‖ and ―desa pinter‖ program. Those two programs dominantly set thecondition and status of rural ICT till recent condition. Desa Berdering means Ringing
8/3/2019 ITU-ADB Interrim Indonesia Country Report
http://slidepdf.com/reader/full/itu-adb-interrim-indonesia-country-report 57/109
ADB Rural ICT Project
Indonesia Country Case Study Report
57
Village. This program is about public telephony provision in rural area (the villages).While, Desa Pinter ,which stands for Desa Punya Internet (Village Has Internet),literally means Smart Village. This program is about public internet provision in rural
area (the villages). Therefore, until now, rural ICT status is still about developingtelephony and internet access only. [2]
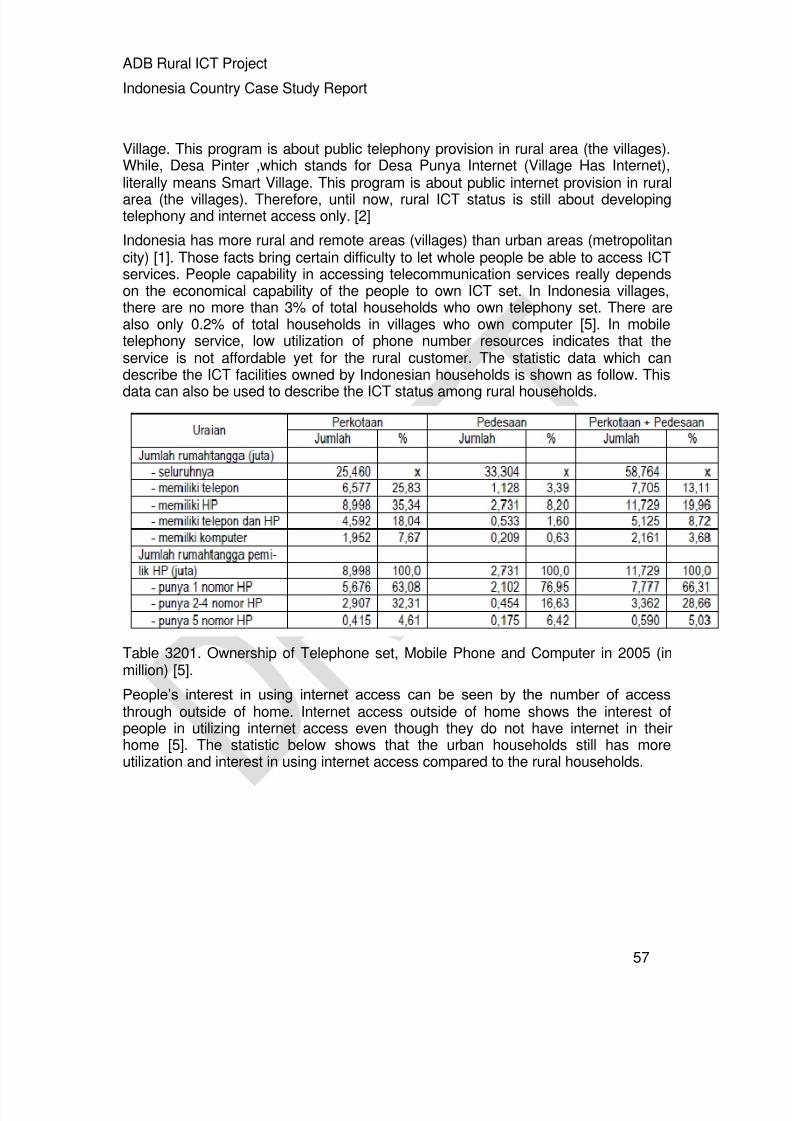
Indonesia has more rural and remote areas (villages) than urban areas (metropolitancity) [1]. Those facts bring certain difficulty to let whole people be able to access ICTservices. People capability in accessing telecommunication services really dependson the economical capability of the people to own ICT set. In Indonesia villages,there are no more than 3% of total households who own telephony set. There arealso only 0.2% of total households in villages who own computer [5]. In mobiletelephony service, low utilization of phone number resources indicates that theservice is not affordable yet for the rural customer. The statistic data which candescribe the ICT facilities owned by Indonesian households is shown as follow. This
data can also be used to describe the ICT status among rural households.
Table 3201. Ownership of Telephone set, Mobile Phone and Computer in 2005 (inmillion) [5].
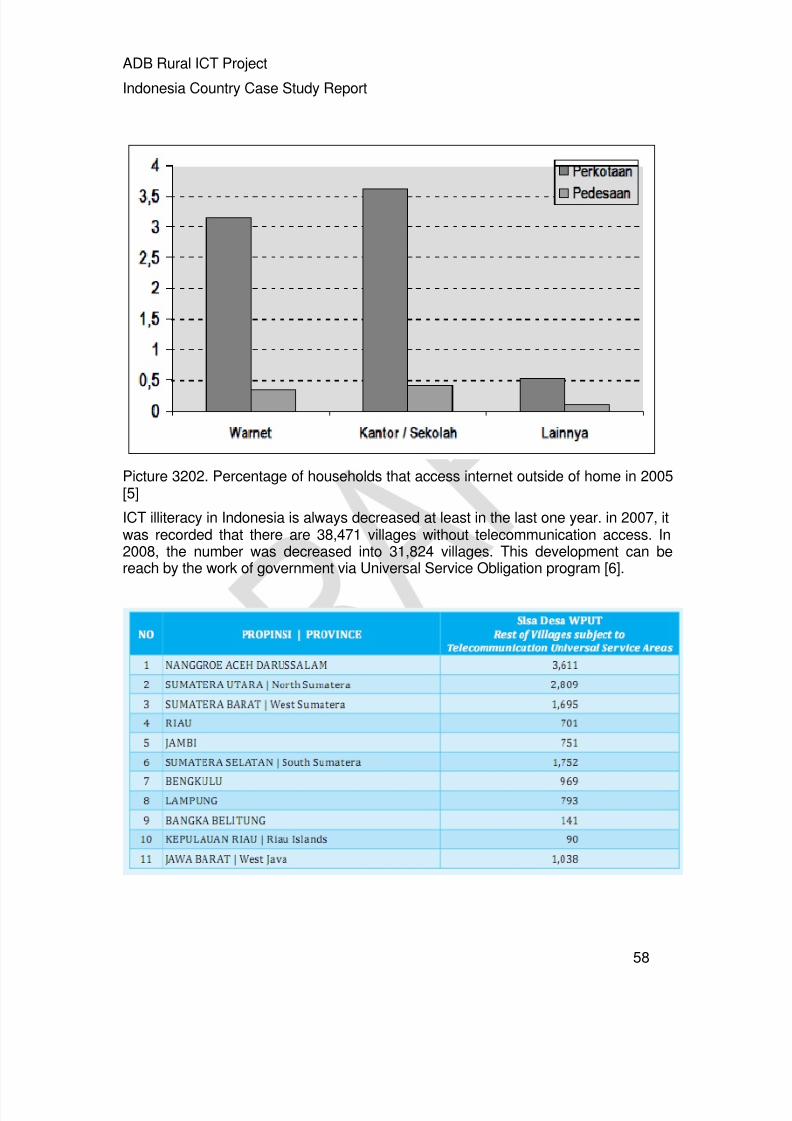
People’s interest in using internet access can be seen by the number of accessthrough outside of home. Internet access outside of home shows the interest ofpeople in utilizing internet access even though they do not have internet in theirhome [5]. The statistic below shows that the urban households still has moreutilization and interest in using internet access compared to the rural households.
8/3/2019 ITU-ADB Interrim Indonesia Country Report
http://slidepdf.com/reader/full/itu-adb-interrim-indonesia-country-report 58/109
ADB Rural ICT Project
Indonesia Country Case Study Report
58
Picture 3202. Percentage of households that access internet outside of home in 2005[5]
ICT illiteracy in Indonesia is always decreased at least in the last one year. in 2007, itwas recorded that there are 38,471 villages without telecommunication access. In2008, the number was decreased into 31,824 villages. This development can bereach by the work of government via Universal Service Obligation program [6].

8/3/2019 ITU-ADB Interrim Indonesia Country Report
http://slidepdf.com/reader/full/itu-adb-interrim-indonesia-country-report 59/109
ADB Rural ICT Project
Indonesia Country Case Study Report
59
Table 3202. Villages without telecommunication access in 2008 [6]
8/3/2019 ITU-ADB Interrim Indonesia Country Report
http://slidepdf.com/reader/full/itu-adb-interrim-indonesia-country-report 60/109
ADB Rural ICT Project
Indonesia Country Case Study Report
60
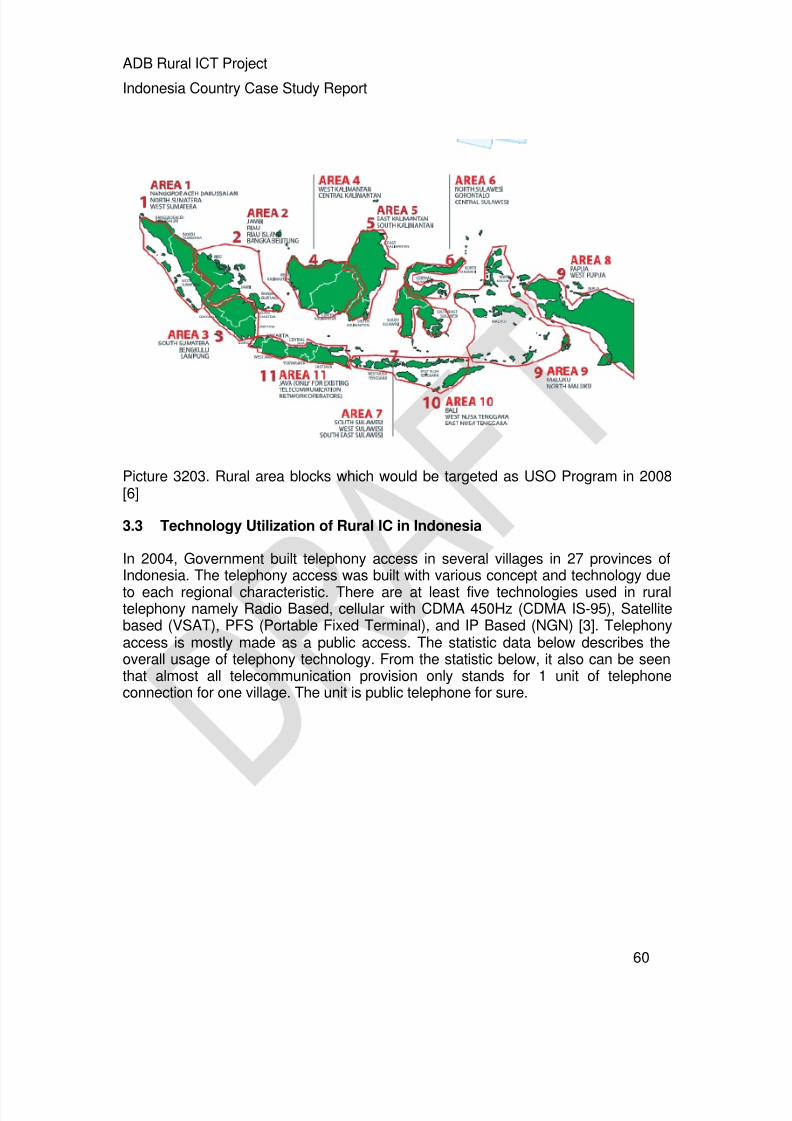
Picture 3203. Rural area blocks which would be targeted as USO Program in 2008[6]
3.3 Technology Utilization of Rural IC in Indonesia
In 2004, Government built telephony access in several villages in 27 provinces ofIndonesia. The telephony access was built with various concept and technology due
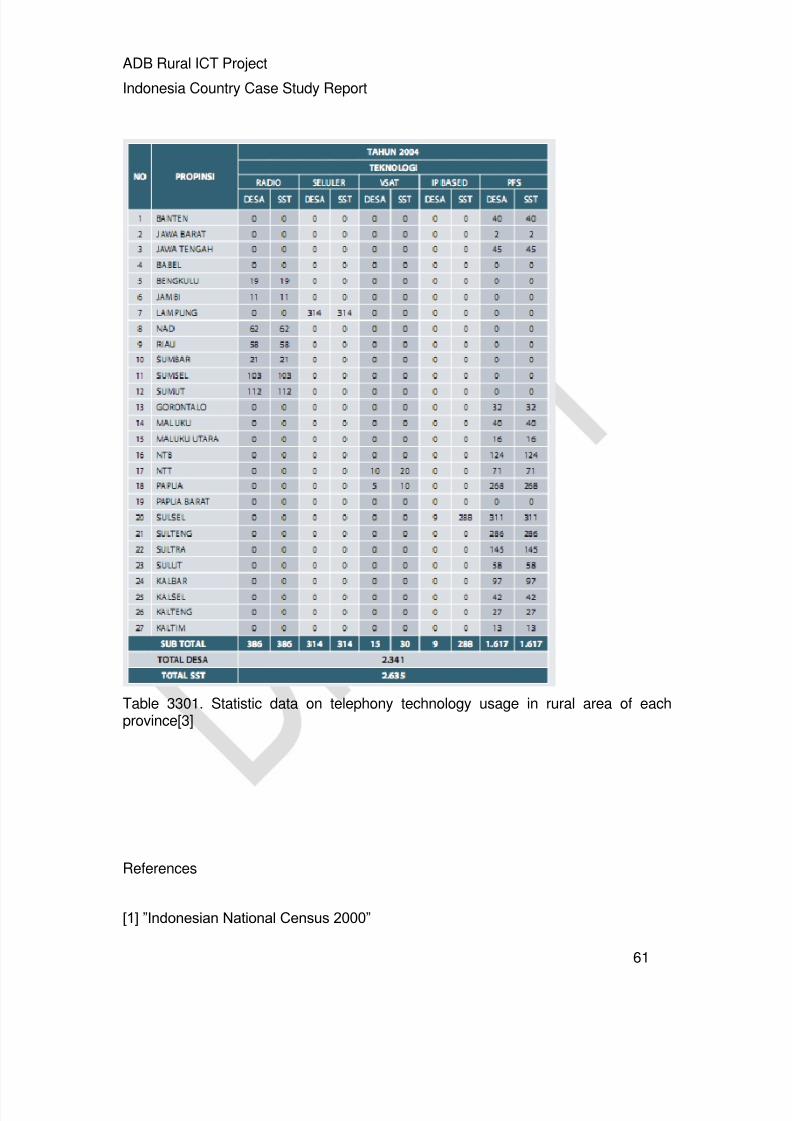
to each regional characteristic. There are at least five technologies used in ruraltelephony namely Radio Based, cellular with CDMA 450Hz (CDMA IS-95), Satellitebased (VSAT), PFS (Portable Fixed Terminal), and IP Based (NGN) [3]. Telephonyaccess is mostly made as a public access. The statistic data below describes theoverall usage of telephony technology. From the statistic below, it also can be seenthat almost all telecommunication provision only stands for 1 unit of telephoneconnection for one village. The unit is public telephone for sure.
8/3/2019 ITU-ADB Interrim Indonesia Country Report
http://slidepdf.com/reader/full/itu-adb-interrim-indonesia-country-report 61/109
ADB Rural ICT Project
Indonesia Country Case Study Report
61
Table 3301. Statistic data on telephony technology usage in rural area of eachprovince[3]
References
[1] ‖Indonesian National Census 2000‖
8/3/2019 ITU-ADB Interrim Indonesia Country Report
http://slidepdf.com/reader/full/itu-adb-interrim-indonesia-country-report 62/109
ADB Rural ICT Project
Indonesia Country Case Study Report
62
[2] Badan Telekomunikasi dan Informatika Pedesaan (BTIP) / RuralTelecommunication and Informatics Body, “BTIP Budget and Busi ness Planning 2008” , 2009
[3] Badan Telekomunikasi dan Informatika Pedesaan (BTIP) / RuralTelecommunication and Informatics Body,” BTIP Annual Report for 2008” , 2009
[4] Sura, Benyamin, Head of BTIP 2007, “Innovative Business Model for USO” Presentation, TAU Project Regional Workshop, Yogyakarta, 2007.
[5] ―Berita Resmi Statistik, Official Statistic Release 2006‖
[6] Department of Communication and Informatics Indonesia, “Annual Report 2008” ,2009.

8/3/2019 ITU-ADB Interrim Indonesia Country Report
http://slidepdf.com/reader/full/itu-adb-interrim-indonesia-country-report 63/109
ADB Rural ICT Project
Indonesia Country Case Study Report
63

8/3/2019 ITU-ADB Interrim Indonesia Country Report
http://slidepdf.com/reader/full/itu-adb-interrim-indonesia-country-report 64/109
ADB Rural ICT Project
Indonesia Country Case Study Report
64
Chapter 4 Rural ICT Policies, Programs,
Initiatives
4.1 Background
In Indonesia the rural ICT policies, programs and initiatives come from manyinstitution. Government, Private and community groups have also intiative forobtaining and providing ICT access for rural area.
This chapter focuses only on the initiative that significant is scale, sustainableorganization and regulatory support. Other initiative who implemented under ad-hoc
basis, pilot project or small scale deployment are discussed in Chapter 5.The initiative that meets the terms is Universal Service Obligation (USO) Programmanaged by Ministry of ICT.
Universal Service Obligation is a scheme that Indonesia runs for providing theuniversal telecommunication access in rural and remote areas. With USO scheme,Indonesia still puts more focus on telephony access and then later also on internetaccess.
USO scheme is intended to answer the challenges of rural ICT development,especially the financial issues as the main challenge. It is a fact that investment onfixed line for rural IC in remote areas needs high capital with low Return ofInvestment (RoI). Development of ICT in rural area is much more expensive. Thatcondition brings very less attraction in business point of view. On the other hand,affordable and user friendly technology and service are also required for thecharacteristic of rural people. Therefore, in order to face those challenges USOscheme is meant to make the efficient ICT development for rural areas where thebusiness and the universal telecommunication philosophy can meet.
4.2 Short History in Approaching USO
Telecommunication sector in Indonesia has been growing rapidly in the last 15 years.There are already numerous policy and regulation to stimulate the growth of tele-density and the telecommunication market. Successful policy reform in stimulating
national tele-density growth was initiated by implementing KSO (OperationalCooperation) strategy in 1994. That success was shown by installing 3.1 milliontelephone connection units in period of 1993 to 1997. That was a great result since in1992 there were only 1.5 million telephone connection units. However, the KSOscheme could not be continued because of economy crisis in 1997/1998 so that theinstallation target cannot be reached. Then, government decides to liberalizetelecommunication sector and accelerate the transition to full competition.[1]. Then,the Government arranged the 1999 Law Number 36 about telecommunication whichone of the contents is to apply new concept of rural telecommunication provision. The

8/3/2019 ITU-ADB Interrim Indonesia Country Report
http://slidepdf.com/reader/full/itu-adb-interrim-indonesia-country-report 65/109
ADB Rural ICT Project
Indonesia Country Case Study Report
65
concept is USO (Universal Service Obligation). It says that USO is the obligation ofall telecommunication providers where the rule is stated by the Government. [2].
Generally, the main problem in telecommunication development of Indonesia is thelimited funding capability of Government and Private. Hence, the infrastructuredevelopment cannot meet the demand. Classical factor why there is unwilling amongtelecommunication industry to provide service access in remote and rural areas isbecause a perception that those areas is not profitable. Actually, market potency inremote and rural area has a big opportunity if it is taken care with universal accessand universal service development strategy. That strategy is implemented throughUSO program.
In principle, USO is program of subsidy. Numerous business players oftelecommunication have been focusing in the urban areas with earning big revenue.In USO scheme, part of urban telecommunication revenue subsidizes the ruraltelecommunication cost with its low revenue. This is to ensure that thetelecommunication service can be universally provided. Practically, at the first timethe USO fund was 0.75% of Telco revenue. [3]
4.3 USO Overview
Based on Government Regulation No.52/2000, it is mentioned that definition of USOin telecommunication sector is accessibility provision for areas or part of peoplewhich are not covered yet by any network or telecommunication service.
USO scheme provides the cost sharing in rural ICT development. Part of urbanrevenues will be used to subsidize in providing the rural ICT. In this scheme, the costsharing exists among the operators and the government.
Till the end of 1990s, in monopoly regime, Indonesia required 20% investment forproviding telecommunication service in rural and remote area. For that reason, theGovernment generated ―KSO‖ (Operational Cooperation) between incumbentoperator (PT.Telkom) and vendor or closed network satellite operator. The maintarget of Indonesia was and is providing basic telephone access to whole area ofIndonesia including the rural and remote ones. But unfortunately, the program failedto accomplish the target due to economic crisis in 1998. [4]
In 2000’s, during the transition period from monopoly to full competition, theGovernment took the necessary actions to strengthen the basis for competition e.g.USO pilot project. In this time, government targeted to reach 1 basic telephone for 1village. [4]
In 2003, Indonesian Government had built initial telecommunication infrastructure atrural areas. 3051 telephone connection units were built in 3013 villages. In 2004,2635 telephone connection units were built in 2341 villages. Based on the fieldevaluation, telecommunication facilities were not well-occupied yet and many aspectsin management policy were not clearly regulated yet by Ministry Decree No.: 34 year2004 about Universal Service Obligation. Therefore, the infrastructure building wasnot to give significant result which can be used sustainably by the society. [4]
8/3/2019 ITU-ADB Interrim Indonesia Country Report
http://slidepdf.com/reader/full/itu-adb-interrim-indonesia-country-report 66/109
ADB Rural ICT Project
Indonesia Country Case Study Report
66
Based on that problem, Ministry of Communication and Informatics has reformed thepolicy for re-designing the planning and scheme of USO development, which are: [4]
Item Procurement Scheme was reformed into Service ProcurementScheme by Rental Concept
Operation and Maintenance was separated and then integrated withFacilities Procurement
There was service sustainability guarantee by the service provider
Operational risk was responsibility of operator
Financing was in earmark concept
Contact period at lasts for 1 year
Contract was changed to Performance Based Contract
Now, rural ICT development program was divided into three terms: [4]
Short term: In 2009, there will be 31,824 ringing villages (villages withtelephone access) in Indonesia.
Middle term: In 2015, there will be smart villages (desa pinter), internet-served villages (desa punya internet) in Indonesia, by providinginformation access in every districts.
Long term: There will be so-called information society in 2025 byorganizing focused-training, information access occupancy, developingTV broadcast based on society needs and any other information services.
4.4 Legal Reference of USO Program
Implementation of USO program in order to provide universal access and service oftelecommunication in rural and remote areas is based on several law and act. Thelegal references in implementing USO program are: [2]
Law Number 36 Year 1999 about Telecommunication
Government Regulation No.53 Year 2000 about TelecommunicationProvision
Ministerial Regulation No.4 Year 2001 about Fundamental NationalTechnical Plan 2000 in National Telecommunication Development
Ministerial Regulation No.34 Year 2004 about USO Implementation
Ministry of Telecommunication and Informatics’ RegulationNo.11/Per/M.Kominfo/04/2007 about Telecommunication USO Provision
Ministry of Telecommunication and Informatics’ RegulationNo.38/Per/M.Kominfo/09/2007 about Revision of RegulationNo.11/Per/M.Kominfo/04/2007
8/3/2019 ITU-ADB Interrim Indonesia Country Report
http://slidepdf.com/reader/full/itu-adb-interrim-indonesia-country-report 67/109
ADB Rural ICT Project
Indonesia Country Case Study Report
67
In this regulation, government gives support for the success of USOprogram through:
Giving permission for Regional Local Fixed Network with frequency 2.3GHz.
Support for Domestic Telecommunication Industry development bydomestic level of 35% for CAPEX and 20% for 2.3 GHz devices
Ministry of Telecommunication and Informatics’ Decree No.145/Kep/M.Kominfo/4/2007 about Determining USO Service Area
Ministry of Telecommunication and Informatics’ Decree No.418/Kep/M.Kominfo/9/2007 about Revision of Annex in Ministry ofTelecommunication and Informatics’ Decree No.145/Kep/M.Kominfo/4/2007
Director General of Post and Telecommunication’s Regulation No. 247/DIRJEN/2008 about Categorizing 31,824 USO Service Areas into 11Blocks in 7 Project Packages.
4.5 USO Funding
Funding in rural ICT development is obtained from Contribution for USO (KKPU) ofall telecommunication operators and service providers which get license formDepartment of Communication and Informatics. Contribution from the operator is0.75% of the company gross revenue, which is collected in the end of every 3months to BTIP Rural Telecommunication and Informatics Body. [3]
Contribution for Universal Service Obligation is based on regulations below: Government Regulation No. 28 year 2005 about tariff for Company’s non-
tax revenue. In this resolution, it is stated that the amount of thecontribution is 0.75% of the revenue.
Ministry of Communication and Informatics’ Regulation No.05/PER/M.KOMIFO/2/2007 about operational guidance of tariffmanagement in USO.
In the process of compiling the government’s regulation which specifically regulatesUSO, several problems in financial substances occured. Due to that problem, in 2006Department of Finance recommended a formation of finance manager body for USO.
Temporary financial body was established by Directorate General of Post andTelecommunication. Several years after it, through Ministerial Regulation No.35/PER/M.Kominfo/11/2006, a financial organization for USO was built with nameBalai Telekomunikasi dan Informatika Perdesaan (BTIP, Rural Telecommunicationand Informatics Body). The task of the body is to manage the flow of USO funding.[3]
The contribution from telecommunication service provider is an obligation which isstated in government law. USO Contribution (hereinafter called KKPU) is paid toBTIP and categorized as the non-tax government income. In this scheme, the
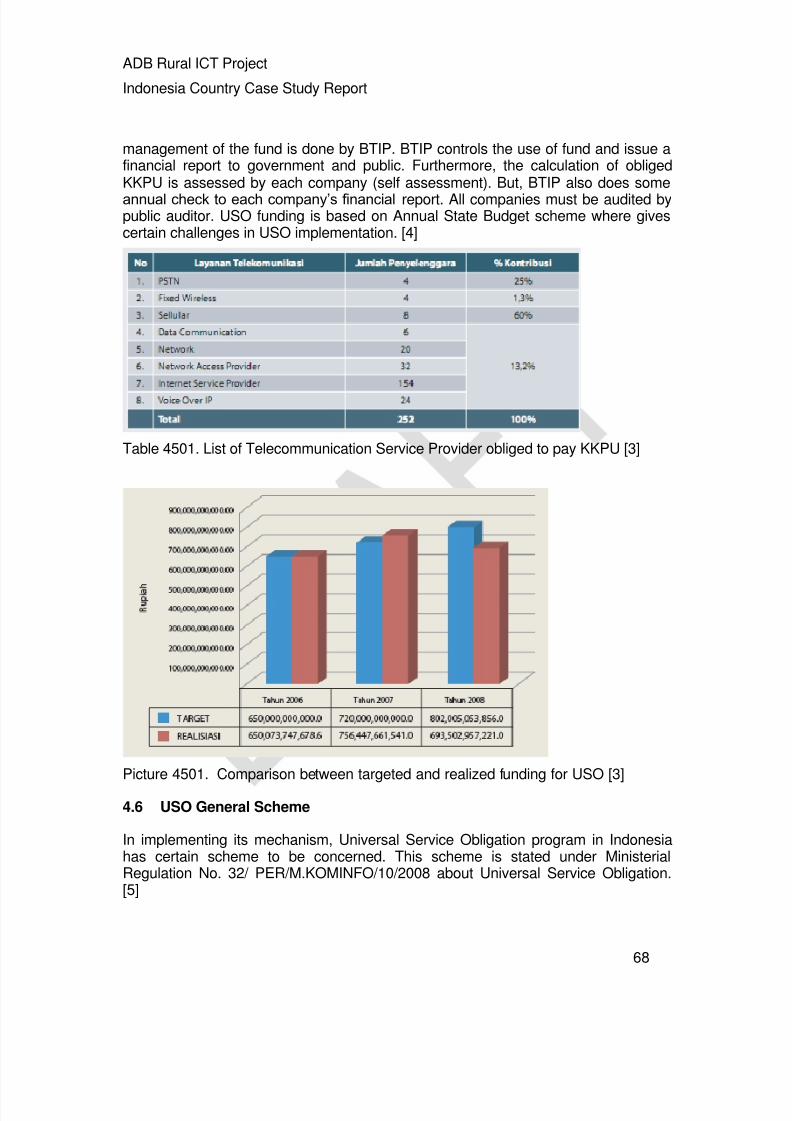
8/3/2019 ITU-ADB Interrim Indonesia Country Report
http://slidepdf.com/reader/full/itu-adb-interrim-indonesia-country-report 68/109
ADB Rural ICT Project
Indonesia Country Case Study Report
68
management of the fund is done by BTIP. BTIP controls the use of fund and issue afinancial report to government and public. Furthermore, the calculation of obligedKKPU is assessed by each company (self assessment). But, BTIP also does some
annual check to each company’s financial report. All companies must be audited bypublic auditor. USO funding is based on Annual State Budget scheme where givescertain challenges in USO implementation. [4]
Table 4501. List of Telecommunication Service Provider obliged to pay KKPU [3]
Picture 4501. Comparison between targeted and realized funding for USO [3]
4.6 USO General Scheme
In implementing its mechanism, Universal Service Obligation program in Indonesiahas certain scheme to be concerned. This scheme is stated under MinisterialRegulation No. 32/ PER/M.KOMINFO/10/2008 about Universal Service Obligation.[5]

8/3/2019 ITU-ADB Interrim Indonesia Country Report
http://slidepdf.com/reader/full/itu-adb-interrim-indonesia-country-report 69/109
ADB Rural ICT Project
Indonesia Country Case Study Report
69
4.6.1 Type of Service
While the funding scheme is already described above, USO Implementation core
business is provision of telecommunication access and service in remote and ruralarea. In Indonesia USO scheme, rural and remote area which must be concerned tobe served with USO is called Wilayah Pelayanan Universal Telekomunikasi (WPUT,Universal Telecommunication Service Area). The telecommunication service meantby the USO program is about giving access and service of basic telephony, shortmessage service (SMS/Text), and internet access.
The basic telephony and SMS provision include in Desa Berdering program (RingingVillage). Then, the internet access provision includes in Desa Pinter program (SmartVillage), where Desa Pinter also stands for Desa Punya Internet (Village havinginternet). For Internet access provision, Government, through USO program, statesseveral requirements to meet, which are:
Minimum data transfer rate is 56 kbps, estimated from CPE to USOdevice.
Maximum Latency is 750 ms, estimated from CPE to Indonesia InternetExchange (IIX)
Maximum Packet loss is 2%, estimated from CPE to Indonesia InternetExchange (IIX)
Any other type of USO service proposed by any institution must meet the criteria ofgovernment regulation. [5]
4.6.2 USO Operator
USO Operator is any Telecommunication Service Operator which is licensed by theGovernment. USO Operator operates the USO service based on contract with BTIP.In this scheme, foreign investment in USO service is limited no more than 49%. USOoperator can only develop the telecommunication access and service in their eachassigned WPUT area. [5]
USO operators have privileges for: [5]
Freedom to choose any telecommunication technology based on itscompatibility to the demand, target and characteristic of area.
Having interconnection with any other network provider
Having Numbering resources as far as it is necessary
Using frequency 2390 MHz – 2400 MHz only in the assigned WPUT area
Continue the telecommunication network service commercially after thecontract period ends (under certain regulation)
Build certain configuration based on the WPUT area’s characteristic
USO operators have obligation for: [5]
Paying Operation Right Cost based on valid government regulation.
8/3/2019 ITU-ADB Interrim Indonesia Country Report
http://slidepdf.com/reader/full/itu-adb-interrim-indonesia-country-report 70/109
ADB Rural ICT Project
Indonesia Country Case Study Report
70
Paying Radio Frequency Spectrum Usage Right Cost based on validgovernment regulation.
Paying KKPU for USO based on valid government regulation. Using tools and devices which are certified already by the government
Issuing maximum USO tariff based on the Ministerial Regulation No. 32/ PER/M.KOMINFO/10/2008 about Universal Service Obligation
Issuing their own Financial Report and Bookkeeping
Using domestic product as stated under Ministerial Regulation
Providing USO quality service as stated on the contract
Assuring interoperability system with any other provider system
Doing bookkeeping for all sales and revenue, then reporting it to BTIPperiodically
Issuing Call Detail Record from each USO terminal to BTIP
Using Capital Expenditure as less as 35% for procuring domestic product
Assuring that at least 20% tools and devices in utilizing 2390 MHz – 2400MHz frequency are domestic product
Providing, Operating and Doing Maintenance the USO network andservice.
Building whole telecommunication network access in the assigned WPUT
area. Assuring to build at least one service connection unit in the assigned area
USO operators are chosen by the government through auction process held by BTIP.USO implementation is divided into 7 project packages which cover 11 WPUTblocks. Each WPUT block covers several villages. In the auction process, eachauction participant can apply more than one project package with each companyfinancial consideration. And one auction participant can win more than one projectpackage. The main basic factor to win the auction are at least: [5]
USO Implementation Cost
Quality of operation and maintenance of USO Network and Service.
4.6.3 License
License for those who win the auction process in order to conduct the USO service isgiven by the Minister of Telecommunication and Informatics Indonesia. The license isgiven by two steps. The first step is Operation Principle License. And the last step isOperation License. Minister issues the Operation Principle License at least 14 daysafter the contract is signed. The Operation Principle License is valid for 6 months.The licensed will be continued based on quality assessment by Directorate Generalof Post and Telecommunication. [5]

8/3/2019 ITU-ADB Interrim Indonesia Country Report
http://slidepdf.com/reader/full/itu-adb-interrim-indonesia-country-report 71/109
ADB Rural ICT Project
Indonesia Country Case Study Report
71
Operation license is issued at least after 10% of service connection units are ready tooperate in each assigned WPUT and after the operator obtains Proper OperationLetter already. The evaluation of the operation can be done by sampling method. The
Operation License is valid until the contract period is over. [5]
4.6.4 USO Criteria
USO Operation has to meet several basic principles:
Neutral Technology
Quality of Service
Affordable tariff for rural
Neutral technology means that in the operation, the USO operators can assure thatthe technology can be sustainably applied to the operation for long time duration.
Quality of service means that the service must meet the quality criteria based on thecontract. Then, the affordable tariff is meant to enable the rural people to use thetelecommunication service. [5]
4.6.5 Numbering
USO service numbering uses numbering system which is allocated already to theassigned operator. For operators which have no numbering allocation yet, numberingscheme is given by Directorate General of Post and Telecommunication. The routingfor numbering has to reach the least cost routing or the most efficient routing. [5]
4.6.6 Interconnection
Every single telecommunication operator has to provide interconnection to the USOoperators. Cooperation treaty in interconnection must be finished in less than 20days since the day interconnection is proposed. USO operator may use internetprotocol (IP) in interconnecting with any other telecommunication operator. [5]
Every single telecommunication operator has to prioritize the interconnection of USOoperator. USO operator has to operate the service for incoming and outgoing not lessthan 8 hours based on the WPUT area’s characteristic.
4.6.7 Contract
USO operation contract is multi-year contract for period of 5 years. The contract canbe continued based on the result of evaluation. The USO operator has right to obtain
the USO fund. The USO fund provided is based on the functional readiness andperformance based of:
Access provision process
Telecommunication service
Operation
Maintenance
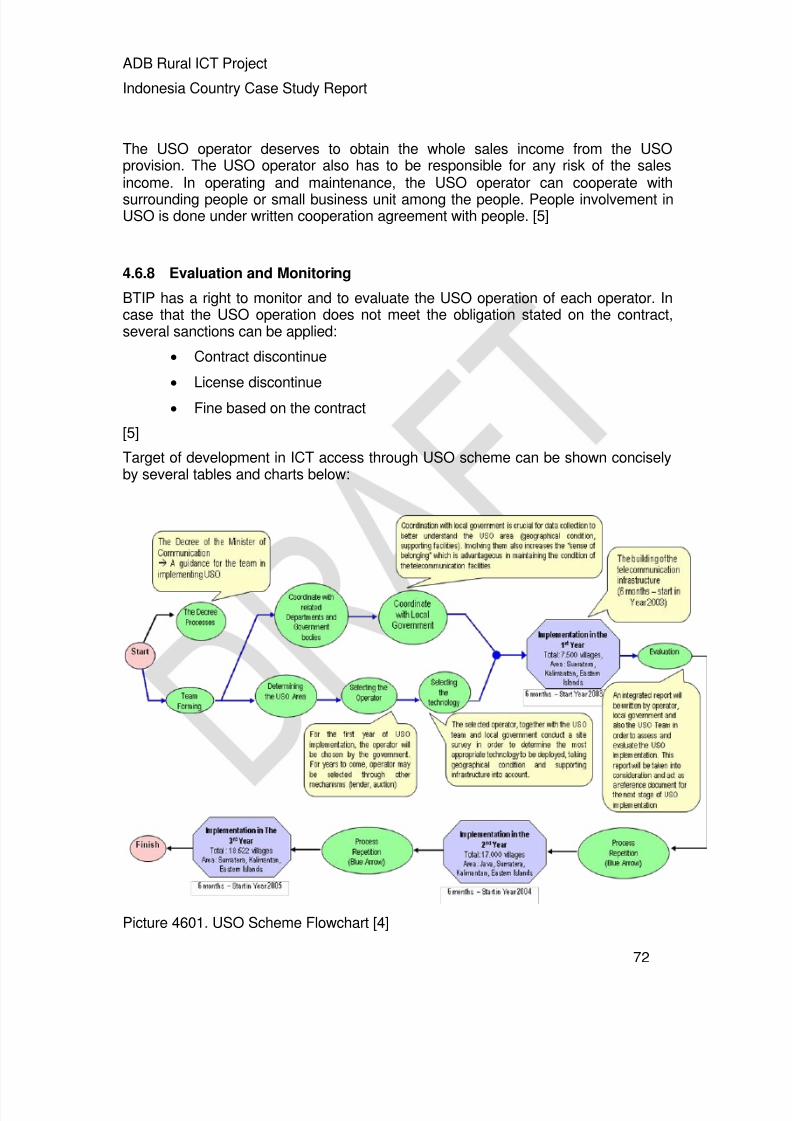
8/3/2019 ITU-ADB Interrim Indonesia Country Report
http://slidepdf.com/reader/full/itu-adb-interrim-indonesia-country-report 72/109
ADB Rural ICT Project
Indonesia Country Case Study Report
72
The USO operator deserves to obtain the whole sales income from the USOprovision. The USO operator also has to be responsible for any risk of the salesincome. In operating and maintenance, the USO operator can cooperate with
surrounding people or small business unit among the people. People involvement inUSO is done under written cooperation agreement with people. [5]
4.6.8 Evaluation and Monitoring
BTIP has a right to monitor and to evaluate the USO operation of each operator. Incase that the USO operation does not meet the obligation stated on the contract,several sanctions can be applied:
Contract discontinue
License discontinue
Fine based on the contract
[5]
Target of development in ICT access through USO scheme can be shown conciselyby several tables and charts below:
Picture 4601. USO Scheme Flowchart [4]

8/3/2019 ITU-ADB Interrim Indonesia Country Report
http://slidepdf.com/reader/full/itu-adb-interrim-indonesia-country-report 73/109
ADB Rural ICT Project
Indonesia Country Case Study Report
73
4.7 Rural ICT Deployment and WPUT area
Indonesia is a big archipelagic country which needs focus share to develop every
single area. This map below describes the USO projects deployment in Indonesiawhich is developed by the government. [3]
Picture 4701. USO Deployment Map of Indonesia [3]The deployment areas are divided into several project packages:
Package 1
WPUT 1 / AREA 1 (NAD, SUMUT DAN SUMBAR)
Package 2
WPUT 2 / AREA 2 (JAMBI, RIAU, KEPRI, KEPALUAN BANGKABELITUNG)
WPUT 3 / AREA 3 ( BENGKULU, SUMATERA SELATAN DANLAMPUNG)
Package 3
WPUT 4 / AREA 4 ( KALBAR DAN KALTENG)
WPUT 5 / AREA 5 (KALTIM DAN KALSEL)
Package 4
WPUT 6 / AREA 6 (SULAWESI UTARA, GORONTALO DAN SULAWESITENGAH)

8/3/2019 ITU-ADB Interrim Indonesia Country Report
http://slidepdf.com/reader/full/itu-adb-interrim-indonesia-country-report 74/109
ADB Rural ICT Project
Indonesia Country Case Study Report
74
WPUT 7 / AREA 7 (SULAWESI BARAT, SULAWESI SEL;ATAN DANSULAWESI TENGGARA)
WPUT 9 / AREA 8 (MALUKU DAN MALUKU UTARA)Package 5
WPUT 8 / AREA 9 (PAPUA DAN IRIAN JAYA BARAT)
Package 6
WPUT 10 / AREA 10 (BALI, NTB DAN NTT)
Package 7
WPUT 11 / AREA 11 (BANTEN, JAWA BARAT, JAWA TENGAH, YOGYADAN JAWA TIMUR)
(WPUT = Wilayah Pelayanan Universal Telekomunikasi, UniversalTelecommunication Service Area)
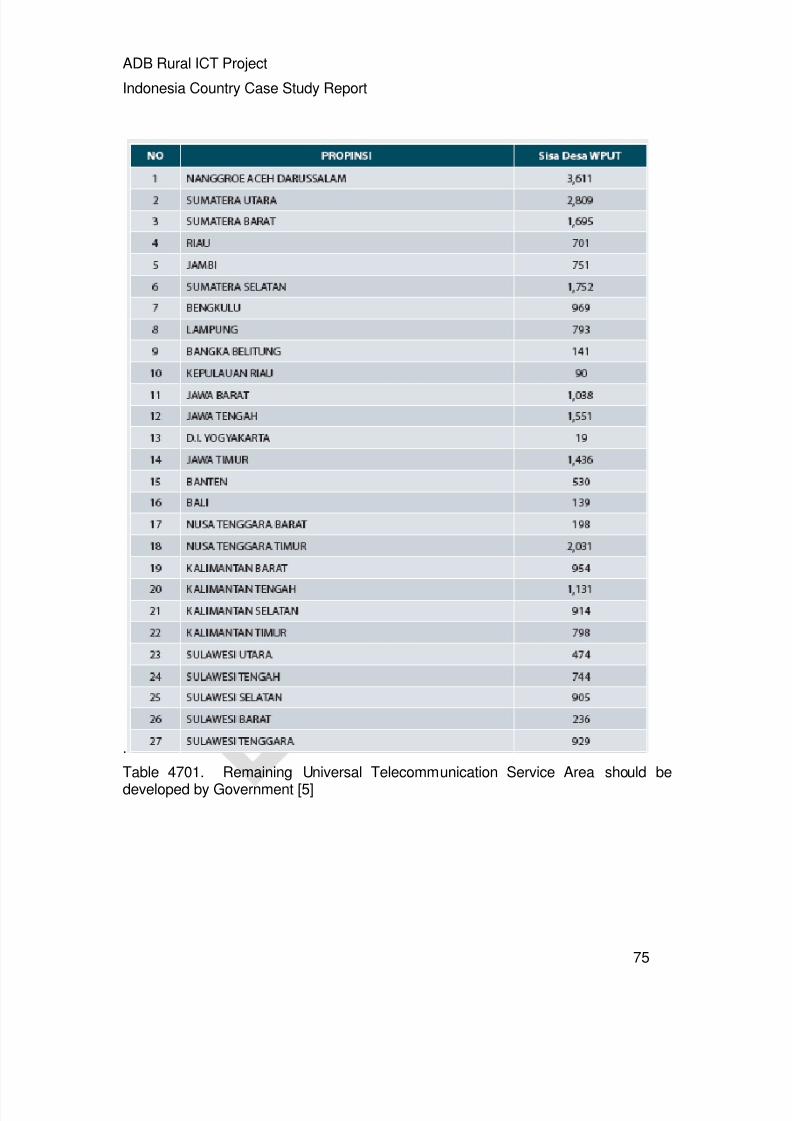
8/3/2019 ITU-ADB Interrim Indonesia Country Report
http://slidepdf.com/reader/full/itu-adb-interrim-indonesia-country-report 75/109
ADB Rural ICT Project
Indonesia Country Case Study Report
75
.
Table 4701. Remaining Universal Telecommunication Service Area should be
developed by Government [5]

8/3/2019 ITU-ADB Interrim Indonesia Country Report
http://slidepdf.com/reader/full/itu-adb-interrim-indonesia-country-report 76/109
ADB Rural ICT Project
Indonesia Country Case Study Report
76
Table 4702. Technology usage and developed villages by USO projects [5]
4.8 USO Implementation Challenge
In implementing USO service, Indonesian Government faces several challenge frommany aspects. The challenges come from the nature of the USO general scheme.[4]
USO Scheme uses open tender in auction for operator. In procurement aspect, thiscase give several challenges. The capex (capital expenditure) given by USO fundsdoes not attract operator. But it more attracts telecommunication vendor or
8/3/2019 ITU-ADB Interrim Indonesia Country Report
http://slidepdf.com/reader/full/itu-adb-interrim-indonesia-country-report 77/109
ADB Rural ICT Project
Indonesia Country Case Study Report
77
contractor. Therefore, in this case the government tries to make join cooperationbetween vendor and operator. The vendor is so attracted bu the profit gained fromequipment procurement. Then, it is often that traffic does not become the main
interest for the bidder in the auction. [4]
Recall the funding scheme of USO which uses the State Budget scheme, in this caseany procured equipment status is government assets. Therefore, the maintenance ofthe equipment has to obey the State Budget system. It limits the access ofmaintenance and brings it to slow maintenance.
Maintenance is also a difficult thing to do. The operator has lack of human resourcesat local level to do maintenance. The condition is more severed by the fact thatcertain level of damaged equipment can only be repaired in the capital city of country(Jakarta). Even for Radio point to point technology, the repaired equipment has to beremoved from both central unit and remote unit.
In finance, it often happens that the generated revenues insufficient to covermaintenance. Maintenance contract from the government only covers the 1st year ofdeployment. Therefore, new maintenance contract has to be created every year. Dueto the Annual State Budget scheme, the allocation for maintenance lead to time lagsbetween the date of fund availability and the required time for repairing theequipment.
In the actual operation, there is a limited access to pre-paid account outlet which leadthe customers often stop to utilize the service. When the post-paid scheme isapplied, bad debt among the customer leads to difficult revenue collection. Fromwhole problem, it is often that the traffic of service usage decreases through the time.Low traffic with same operational cost will not lead into good sales margin. Then
there is no incentive for the operator to sustain the service. Then, the maintenanceproblem above will severe the condition where many telecommunication equipmentscannot run their function.[4]
8/3/2019 ITU-ADB Interrim Indonesia Country Report
http://slidepdf.com/reader/full/itu-adb-interrim-indonesia-country-report 78/109
ADB Rural ICT Project
Indonesia Country Case Study Report
78
References
[1] Wismadi, Arif, ―NGN,Tinjauan Terhadap Kebijakan Telekomunikasi Pedesaan danPerluasan Akses Masyarakat terhadap Sistem Komunikasi‖, PUSTRAL UGM, 2005
[2] Badan Telekomunikasi dan Informatika Pedesaan (BTIP) / RuralTelecommunication and Informatics Body, “BTIP Budget and Business Planning 2008” , 2009
[3] Badan Telekomunikasi dan Informatika Pedesaan (BTIP) / RuralTelecommunication and Informatics Body,” BTIP Annual Report for 2008” , 2009
[4] Sura, Benyamin, Head of BTIP 2007, “Innovative Business Model for USO” Presentation, TAU Project Regional Workshop, Yogyakarta, 2007.
[5] “ Ministerial Regulation No. 32/ PER/M.KOMINFO/10/2008 about UniversalService Obligation”

8/3/2019 ITU-ADB Interrim Indonesia Country Report
http://slidepdf.com/reader/full/itu-adb-interrim-indonesia-country-report 79/109
ADB Rural ICT Project
Indonesia Country Case Study Report
79

8/3/2019 ITU-ADB Interrim Indonesia Country Report
http://slidepdf.com/reader/full/itu-adb-interrim-indonesia-country-report 80/109
ADB Rural ICT Project
Indonesia Country Case Study Report
80
Chapter 5 Case Examples of successful and
innovative rural ICT projects
This aspect of data collection will involve detailed study of at least twospecific rural ICT projects that have been implemented within the country,following one or more of the policies, programs, or other initiatives thathave been identified in the previous sections. The purpose will be todescribe in depth the scope and parameters of the projects, asrepresentative examples of effective practices to promote rural ICTdevelopment. Information on each project case example will be basedupon in-person review of the project operations, as well as study of the
related policy implementation activities, funding and other financial data,and oversight and follow-up by the implementing agency. The nationalconsultant will work closely with the international consultant to select,refine, and execute the case example research. Among the goals forinformation to be collected for each project will be the following:
5.1 Case 1: Local Government Initiative for E-Gov, Regency of Sragen
Regency of Sragen is one of regional government pioneered in the utilization of theInternet to support public service. The Regency of Sragen has famous with itsoptimized using the information of technology in Indonesia and at the same timebecome e-government icon at the national level.
5.1.1 Geographic locations, populations, and political divisions served by theproject;
Sragen region is the third largest district in Solo region, covering an area of 941.55square km. It consist of 20 sub districts, 12 kelurahan (smaller areas within each sub-district), and 196 villages.
The region is bordering Grobogan district in the north, Karanganyar in the south,Boyolali in the west, and Ngawi in the east. It has direct access to East JavaProvince (only 2 km to the east), and Surakarta city in (27 km southeast of Sragen).Its geographic area consists of fertile volcanic soil, particularly in the south of theBengawan Solo River.
Sragen population remained quite constant over the last two years with 855,244inhabitants and the population density of 908 per square km. About 412,206 people(48% of the total population) are employed in agricultural sector (51%), servicessectors (19%), and hotel, trade & restaurants (13%). The education level isapproximately 17.97% graduated from elementary school and 29% graduated fromhigh school. Its population has access to educational institutions of two Universities,27 Senior High Schools and 83 Junior High Schools.
8/3/2019 ITU-ADB Interrim Indonesia Country Report
http://slidepdf.com/reader/full/itu-adb-interrim-indonesia-country-report 81/109
ADB Rural ICT Project
Indonesia Country Case Study Report
81
The regional GDP is IDR 835,005.58 million with per capita income of IDR929,230.79 (constant) with the growth rate of 4.83% (actual) and 10.77% (contrantGDP). The agricultural sector gives a quite high contribution to the total RGDP with
34.46%. Sragen benefits from fertile soils supported by good irrigation which makes ita main producer of wetland rice.
Regency of Sragen is served by infrastructure within and surrounding the region. Theaccess to international airports with flights to Singapore, Kuala Lumpur, Jakarta, etcis about 27 km to Adi Sumarmo Airport, Solo; 100 km to Adi Sucipto Airport,Yogyakarta and 121 km to Ahmad Yani Airport, Semarang.
Access to railway stations connecting the southern part of Central Java with Jakarta,Bandung, Yogyakarta, Surakarta and Surabaya is about 30 km to Balapan TrainStation, Solo and 100 km to Tugu Train Station, Yogyakarta. The access to majorports is 129 km to Tanjung Emas Port, Semarang 291 km to Tanjung Intan Port,Cilacap. The region has 31.15 km of national road, 87.45 km of provincial road, and992.20 km district road. About 90% of them are asphalted.
In telecommunication sector, about 9,000 fixed phone lines are provided by PTTelkom. The mobile line is provided by cellular phone providers such asExcelcomindo, Komselindo, Indosat, Mobisel, Lippo Telecom, PSN, Satelindo, andTelkomsel.
The water service in the region is provided 20.65% by PDAM (local water company),consist of 29,718 customers. The rest of populations (61.15%) obtain the waterthrough drilled wells and 18.2% through pump wells. Total electricity usage160,945,022 kw/h, with 173,207 customers.
Sragen is well known as the pioneer of organic rice in the region and has already
cooperated with domestic and foreign companies for its marketing. The share of theindustrial sector in the RGDP is lower than agriculture; however it demonstratessteadily increasing growth rates over the past 3 years. A high number of businessesare commonly start-ups with dynamic and innovative characteristics. Aside fromtextile, the food and agro-processing industry also remains important and isdominated by SMEs.
The region has one of the most well-known tourism sites in Sragen is theArchaeological Pre-Historic Museum or the Sangiran Museum listed as a UNESCOworld heritage site. Other attractions are the tomb of Prince Samodra in MountKemukus and Kedung Ombo, surrounded by beautiful sceneries offering potentialsfor eco-tourism and outdoor activities. Sragen is also renowned as one of the pioneer
districts in developing the One Stop Services (OSS). This district has received anaward from the Indonesian President for its achievement in efficient public service.The central government has even appointed Sragen as the national best practicemodel.
5.1.2 Institutional and stakeholder arrangements involved in project planning,design, financing, implementation, and oversight;
The ICT implemention in Sragen Regency is a local government initiative, therefore itfinanced by local government budget. The Research and Development & Electronic
8/3/2019 ITU-ADB Interrim Indonesia Country Report
http://slidepdf.com/reader/full/itu-adb-interrim-indonesia-country-report 82/109
ADB Rural ICT Project
Indonesia Country Case Study Report
82
Data Processing Division (Bagian Balitbang & PDE) was the institution responsible todevelop the information technology network based on internet and intranet as thestep toward the Regency of Sragen to become Cyber Regency.
The development stages of the network was begun from the development of theinternal network in the Regional Secretariat’s Office during 2001 as far as externalthat could covered the Agencies during 2002. However it’s finishing just during 2004,including the development of the network in the sub-district offices. All theconstruction activity of the network was just finished during 2005.
In 2010 network utilization will be expanded into the integration of all the informationsystems and the databased, included Geographical Information Systems (GIS),Financial Information Systems (KIK), Regional Asset Information Systems(SIMBADA), the Citizen Information Systems (SIMDUK) and the EmployeeInformation Systems (SIMPEG).
5.1.3 Local participation in project development, operation, ownership;
With the limitation of human resources, Sragen Regency hired profesional(outsource). To manage user or subscriber of the systems, Sragen Regencyestablished memorandum of understanding (MoU) with private company (Time-Exelindo). Re-sales activity in term of ISP co-operation with the school and publiccommunity.
5.1.4 Technology platforms, infrastructure, and facilities deployed; quantitiesand capacity of network and services provided;
The main network development is rely on wireless network on the frequency of 5.8GHz (5,782 Hz) in channel 9. The local area network (LAN) has enabled theRegency of Sragen to apply intranet of the Virtual Office (Kantor Maya/Kantaya). Thecapacity of 3 MBps bandwidth for whole systems was provided.
The Regional Secretariat Office, the Bodies, Offices, Agencies and Regional OwnedEnterprises (BUMD) and the sub-district offices become clients/subscribers to theonline wireless networks.
Every subscriber had the right to manage arrange the LAN in accordance with therequirement with the permission from the Team of the Information TechnologyManagement of the Regencies Government of Sragen. The Team was an ad-hocinstitution under The Research and Development & Electronic Data ProcessingDivision.
5.1.5 Services provided, including public and private access; volumes andcapacity of services made available;
The main service is E-government. Several activities included are the development ofon-line wireless network for office subscriber and public acces via free Wifi service incertain spots, teleconference operation in sub-district office, civil demographic dataelectronics and e-election of head of the village.
8/3/2019 ITU-ADB Interrim Indonesia Country Report
http://slidepdf.com/reader/full/itu-adb-interrim-indonesia-country-report 83/109
ADB Rural ICT Project
Indonesia Country Case Study Report
83
5.1.6 Degree of demand and utilization, including growth over time;
The virtual office application to work efficiently by support of availability of the
electronics offficial letter, the electronics work agenda, the cupboard of the dat of thework unit and personal, project agenda, the address book, the forum and emailfacilities. It enable each work unit to provide report on daily basis quickly.
5.1.7 Project financials: investment and operating costs; subsidies (if any);revenues; profit and loss and ROI, as appropriate;
To obtain additional project financials support in order to cover investment andoperating cost, the Regency of Sragen provides tutorial service for other regions. TheRegency obtained the profit by expanding the cooperation network with the otherregions.
5.1.8 Scope and nature of information applications and content included in
the project, including target users, sources of support and development;
Among other applications, the Electronic Civil Registry Data with Single IdentityNumber (SIN) is considered the widest applications in term of benefit distribution.The success of implementation become a model replicated in other regencies inIndonesia.
5.1.9 Training, public awareness, and other public relations and support;
The Regency of Sragen is considered as unique in a way to operate outsourcebusiness and hire experts. Instead of operating full outsourcing, to get direct benefitof systems developments, the outsouring process requires involvent of in-houseengineer or staff during the project excution.
As the result at the end of the project, capacity building can be held effectively.Currently, with its capacity The Regency of Sragen capable to provide tutorial serviceon E-Government for other regions.
The success story of this regency and its publicity has became indirect activity formany leveraging activity both related with E-Government or other sectors ofdevelopment.
5.1.10 Ongoing technical assistance, maintenance and repair support;
With pioneering E-Government, the Sragen Regency has successfully improve itscapacity to manage technical solution. The capacity of in-house engineer combined
with the unique outsourcing mechanism as well as the cooperation with profesionalenable them not only for self-sustaining suppport but also providing service for otherregions.
5.1.11 Monitoring and evaluation framework, including any reports or studieson project effectiveness;
With it status as national icon of E-Government, many visits, studies and observationhas been conducted. Most of study concluded that region leadership is the most

8/3/2019 ITU-ADB Interrim Indonesia Country Report
http://slidepdf.com/reader/full/itu-adb-interrim-indonesia-country-report 84/109
ADB Rural ICT Project
Indonesia Country Case Study Report
84
important key-success factors comparing with other technical and managerial aspectof E-Government.
5.1.12 Community and user impacts, reactions, perceptions of the project’svalue, sustainability, replicability.
In general, optimistic reaction has been shown by the stakeholder who utilised thesystems. Many other regencies have replicated the systems.
In addition, to understand the equitable distribution impact of the systems to thecommunity, it is still necessary to evaluate the impact and distribution of benefits fordifferent social economic status as sectors of activity.
5.2 Case 2: Central Government Infrastructure Provision: USO Program
This case represents a central government ICT infrastructure provision under USO
Program. The USO program in Indonesia is managed by BTIP. This section explainsthe general information on the national USO program, some finding on visitedlocations, including discussion and lesson learn obtained from relevant documents.
5.2.1 Geographic locations, populations, and political divisions served by theproject;
The geographic location of USO Program is nation wide. In general BTIP categoriesthe targeted villages as (a) villages that have very limited infrastructure (b) villageswith basic infrastructure and potential with economic activity interaction (c) villageswith infrastructure enriched with economic activity interaction and (d) villages whichrelatively mature behavior on telecommunication.
The total number of targeted village is 31,824 villages with 100 villages with Internetconnection. For the field visit, we interested to visit the villages within category (c)and (d). Specific observation was focused on the utilization of the facility for publicaccess and services. The expected lesson-learnt was the use of public access in the―grey-area‖ between commercially feasible and subsidiary-required public-faciilty.
For this purpose we visited three rural villages within Province of Special Region ofYogyakarta. Those villages (Kaligintung, Kalidengen, and Plumbon Village) arecoveraged by mobile signal with limited number of subcriber but have no publicaccess point for ICT service. One of the villages, Kaligintung is provided with publicinternet access.
On the other survey sites, which are Kaligintung, Kalidengen and Plumbon, rural ICTprovisioning is established based on USO Technology Solution or ST. Theconvergences approached on those sites are based on access and networkconvergence. USO programs held on those sites are aimed to provide basictelephony and internet service via cellular access and network. Telephony services ishandled by a wireless fixed phone set with GSM access and internet services ishandled by PC and Modem with 3G access. All CPEs are made to be public CPEs.
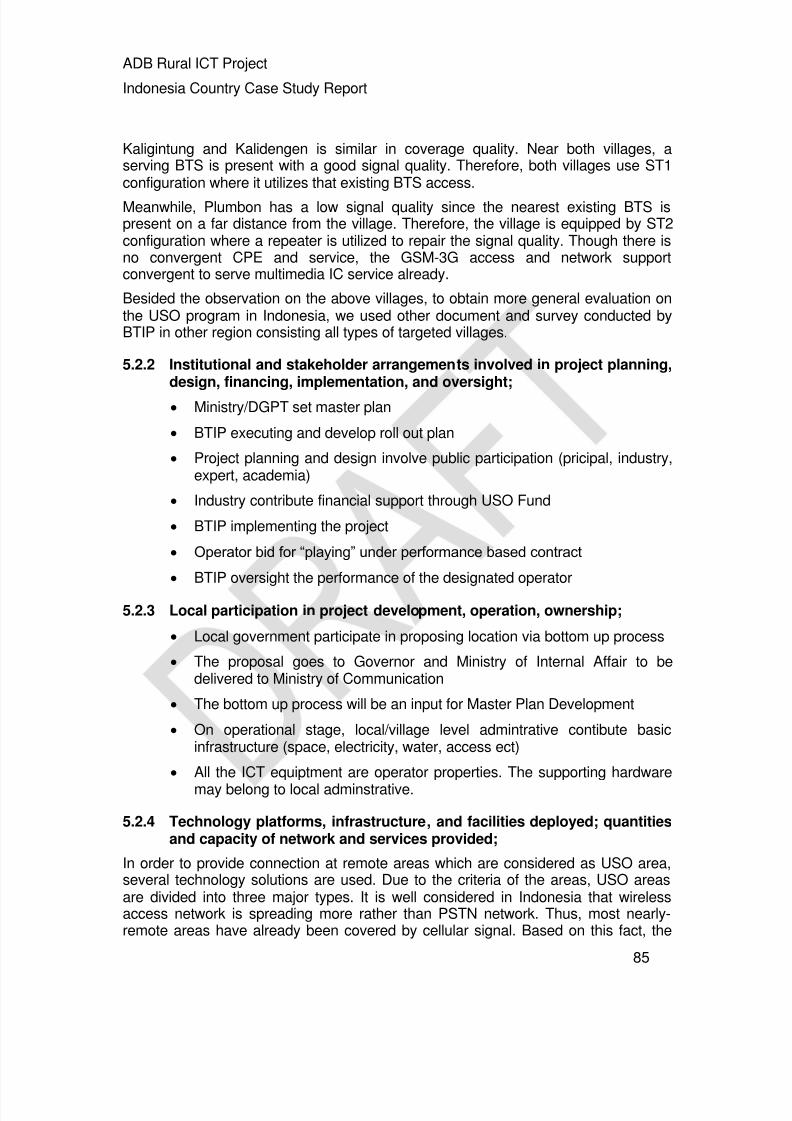
8/3/2019 ITU-ADB Interrim Indonesia Country Report
http://slidepdf.com/reader/full/itu-adb-interrim-indonesia-country-report 85/109
ADB Rural ICT Project
Indonesia Country Case Study Report
85
Kaligintung and Kalidengen is similar in coverage quality. Near both villages, aserving BTS is present with a good signal quality. Therefore, both villages use ST1configuration where it utilizes that existing BTS access.
Meanwhile, Plumbon has a low signal quality since the nearest existing BTS ispresent on a far distance from the village. Therefore, the village is equipped by ST2configuration where a repeater is utilized to repair the signal quality. Though there isno convergent CPE and service, the GSM-3G access and network supportconvergent to serve multimedia IC service already.
Besided the observation on the above villages, to obtain more general evaluation onthe USO program in Indonesia, we used other document and survey conducted byBTIP in other region consisting all types of targeted villages.
5.2.2 Institutional and stakeholder arrangements involved in project planning,design, financing, implementation, and oversight;
Ministry/DGPT set master plan
BTIP executing and develop roll out plan
Project planning and design involve public participation (pricipal, industry,expert, academia)
Industry contribute financial support through USO Fund
BTIP implementing the project
Operator bid for ―playing‖ under performance based contract
BTIP oversight the performance of the designated operator
5.2.3 Local participation in project development, operation, ownership;
Local government participate in proposing location via bottom up process
The proposal goes to Governor and Ministry of Internal Affair to bedelivered to Ministry of Communication
The bottom up process will be an input for Master Plan Development
On operational stage, local/village level admintrative contibute basicinfrastructure (space, electricity, water, access ect)
All the ICT equiptment are operator properties. The supporting hardware
may belong to local adminstrative.
5.2.4 Technology platforms, infrastructure, and facilities deployed; quantitiesand capacity of network and services provided;
In order to provide connection at remote areas which are considered as USO area,several technology solutions are used. Due to the criteria of the areas, USO areasare divided into three major types. It is well considered in Indonesia that wirelessaccess network is spreading more rather than PSTN network. Thus, most nearly-remote areas have already been covered by cellular signal. Based on this fact, the
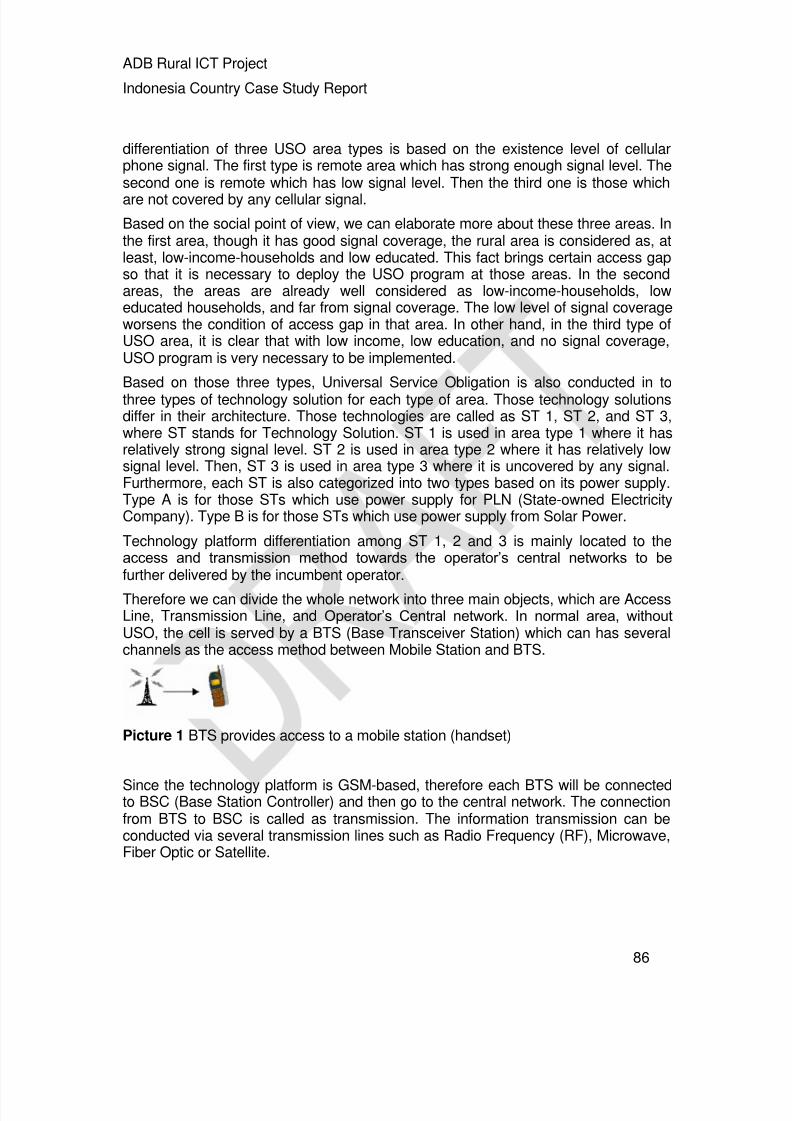
8/3/2019 ITU-ADB Interrim Indonesia Country Report
http://slidepdf.com/reader/full/itu-adb-interrim-indonesia-country-report 86/109
ADB Rural ICT Project
Indonesia Country Case Study Report
86
differentiation of three USO area types is based on the existence level of cellularphone signal. The first type is remote area which has strong enough signal level. Thesecond one is remote which has low signal level. Then the third one is those which
are not covered by any cellular signal.
Based on the social point of view, we can elaborate more about these three areas. Inthe first area, though it has good signal coverage, the rural area is considered as, atleast, low-income-households and low educated. This fact brings certain access gapso that it is necessary to deploy the USO program at those areas. In the secondareas, the areas are already well considered as low-income-households, loweducated households, and far from signal coverage. The low level of signal coverageworsens the condition of access gap in that area. In other hand, in the third type ofUSO area, it is clear that with low income, low education, and no signal coverage,USO program is very necessary to be implemented.
Based on those three types, Universal Service Obligation is also conducted in tothree types of technology solution for each type of area. Those technology solutionsdiffer in their architecture. Those technologies are called as ST 1, ST 2, and ST 3,where ST stands for Technology Solution. ST 1 is used in area type 1 where it hasrelatively strong signal level. ST 2 is used in area type 2 where it has relatively lowsignal level. Then, ST 3 is used in area type 3 where it is uncovered by any signal.Furthermore, each ST is also categorized into two types based on its power supply.Type A is for those STs which use power supply for PLN (State-owned ElectricityCompany). Type B is for those STs which use power supply from Solar Power.
Technology platform differentiation among ST 1, 2 and 3 is mainly located to theaccess and transmission method towards the operator’s central networks to befurther delivered by the incumbent operator.
Therefore we can divide the whole network into three main objects, which are AccessLine, Transmission Line, and Operator’s Central network. In normal area, withoutUSO, the cell is served by a BTS (Base Transceiver Station) which can has severalchannels as the access method between Mobile Station and BTS.
Picture 1 BTS provides access to a mobile station (handset)
Since the technology platform is GSM-based, therefore each BTS will be connectedto BSC (Base Station Controller) and then go to the central network. The connectionfrom BTS to BSC is called as transmission. The information transmission can beconducted via several transmission lines such as Radio Frequency (RF), Microwave,Fiber Optic or Satellite.

8/3/2019 ITU-ADB Interrim Indonesia Country Report
http://slidepdf.com/reader/full/itu-adb-interrim-indonesia-country-report 87/109
ADB Rural ICT Project
Indonesia Country Case Study Report
87
Picture 2 GSM Architecture shows the transmission link among MS-BTS-Operators’Transmission Central Network (BSC-MSC-ISDN, PSTN, IP)
The main problem which exists in the rural and remote areas is located on theexistence access link and transmission link. Therefore, the technology solution is tomeet the problem of access link and transmission link in order to connect the ruralarea to the central network. The differentiation of ST 1,2, and 3 will talk more on theaccess and transmission method. In Summary, the differentiation can be brieflydescribed as follow:
Technology Power SupplySignalLevel Access
ST-1 A PLN Strong Existing BTS
ST-1 B Solar Cell Strong Existing BTSST-2 A PLN Weak Repeater + Nearest BTS
ST-2 B Solar Cell Weak Repeater + Nearest BTS
ST-3 A PLN No Signal VSAT + Pico BTS
ST-3 B Solar Cell No Signal VSAT + Pico BTS
Table 1 Types of Technology Solution
Picture 3 Network diagram of GSM Architecture
end user
equipment
B
T
S
Access Line Transmission Line
Operator’s Network

8/3/2019 ITU-ADB Interrim Indonesia Country Report
http://slidepdf.com/reader/full/itu-adb-interrim-indonesia-country-report 88/109

8/3/2019 ITU-ADB Interrim Indonesia Country Report
http://slidepdf.com/reader/full/itu-adb-interrim-indonesia-country-report 89/109
ADB Rural ICT Project
Indonesia Country Case Study Report
89
Access Technology Max Data Rate
GPRS (General Packet Radio Access) 48 kbps
EDGE (Enhanced Data Rate for GSM Evolution) 384 kbps
UMTS (Universal Mobile TelecommunicationSystem) 2 Mbps
HSPA (High Speed Packet Access)
5.8 Mbps Upload
14 MbpsDownload
Table 2 Offered data rate from various access technology
Generally the ST1 architecture can be described by Picture 4.
Picture 4 General ST 1 Network Configuration
ST 2, Technology Solution 2
It is already known before that ST 2 area has low signal level. It means that the areais relatively far from the operator’s BTS. Therefore actually it has the similar accessand transmission method with ST 1. Access line is depends on the existing BTS’saccess line. It can be GSM 2G for voice traffic and GPRS or EDGE or UMTS orHSPA for data traffic. That dependent access line offers dependence on offeredservice like what already mentioned before. Transmission line from the existing BTSto central networks is also variable. It can be via fiber optic, microwave or satellite.
’

8/3/2019 ITU-ADB Interrim Indonesia Country Report
http://slidepdf.com/reader/full/itu-adb-interrim-indonesia-country-report 90/109
ADB Rural ICT Project
Indonesia Country Case Study Report
90
After its similarity with ST 1 technology, ST 2 use signal repeater as its differencefrom ST 1 technology. Repeater is a tool that can receive and transmit signal, andcapable to amplify the signal. The repeater existence means to amplify the weak
signal in order to be able to be used by the phone in the weak-signal area. ST 2 usesindoor repeater which is yagi antenna. The repeater’s task is just to bring the weakand far signal to come closer and stronger.
In summary, ST 2 provides end-user equipments, which are:
Fixed Wireless Telephone (2 set, one for public and one for village office)
Billing Display set
Power Supply (PLN or Solar Power Supply)
Personal Computer set
Internet modem (GPRS, EDGE (2.5G), UMTS (3G), HSDPA (3.5G) Modem) Indoor repeater (Yagi Antenna)
Billboard sign
Generally, ST 2 architecture can be described by Picture 5.
Picture 5 General ST 2 Network Configuration
ST 3, Technology Solution 3
In ST 3 area, there is no existence of available connection. Even it is has no cellularsignal coverage. In order to overcome this obstacle, ST 3 uses satellite technologyas the substitute the transmission line from BTS to BSC. It provides transmission lineto connect it to nearest BSC (Base Station Controller). BSC is part of network whichcontrols several BTS. BSC is connected to the central network which providesservices (IP, ISDN, PSTN, etc).
’
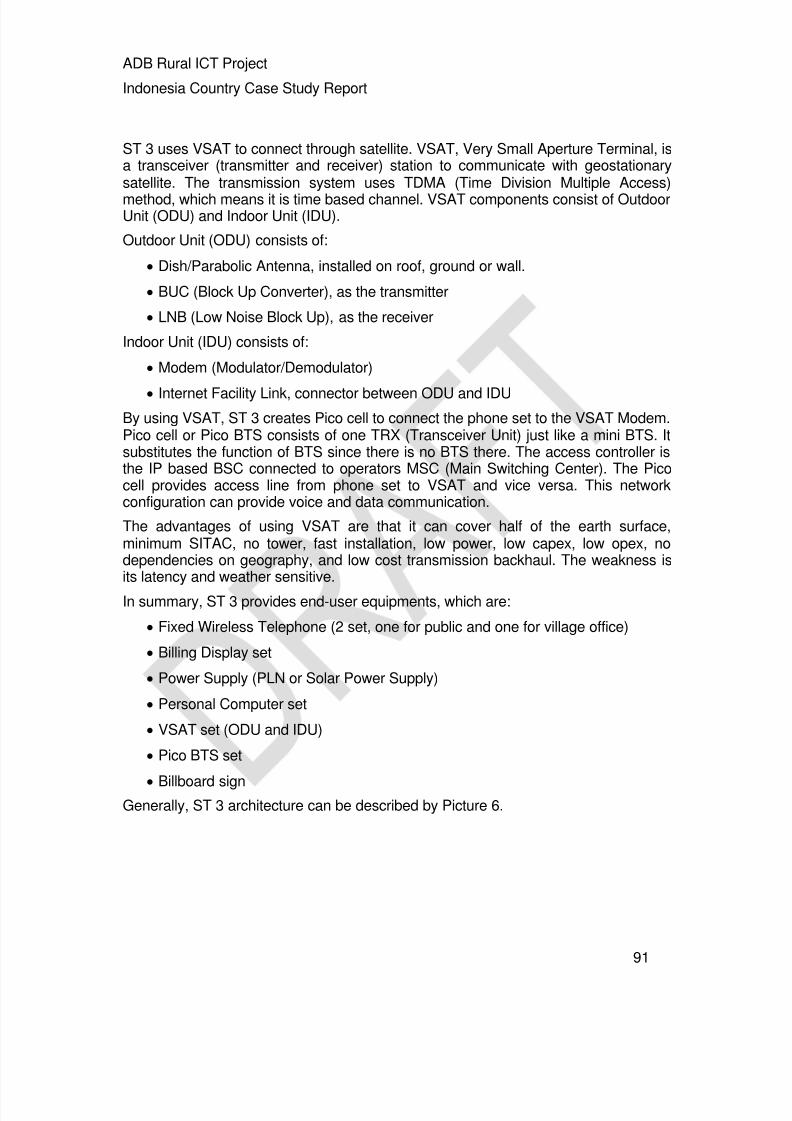
8/3/2019 ITU-ADB Interrim Indonesia Country Report
http://slidepdf.com/reader/full/itu-adb-interrim-indonesia-country-report 91/109
ADB Rural ICT Project
Indonesia Country Case Study Report
91
ST 3 uses VSAT to connect through satellite. VSAT, Very Small Aperture Terminal, isa transceiver (transmitter and receiver) station to communicate with geostationarysatellite. The transmission system uses TDMA (Time Division Multiple Access)
method, which means it is time based channel. VSAT components consist of OutdoorUnit (ODU) and Indoor Unit (IDU).
Outdoor Unit (ODU) consists of:
Dish/Parabolic Antenna, installed on roof, ground or wall.
BUC (Block Up Converter), as the transmitter
LNB (Low Noise Block Up), as the receiver
Indoor Unit (IDU) consists of:
Modem (Modulator/Demodulator)
Internet Facility Link, connector between ODU and IDU
By using VSAT, ST 3 creates Pico cell to connect the phone set to the VSAT Modem.Pico cell or Pico BTS consists of one TRX (Transceiver Unit) just like a mini BTS. Itsubstitutes the function of BTS since there is no BTS there. The access controller isthe IP based BSC connected to operators MSC (Main Switching Center). The Picocell provides access line from phone set to VSAT and vice versa. This networkconfiguration can provide voice and data communication.
The advantages of using VSAT are that it can cover half of the earth surface,minimum SITAC, no tower, fast installation, low power, low capex, low opex, nodependencies on geography, and low cost transmission backhaul. The weakness isits latency and weather sensitive.
In summary, ST 3 provides end-user equipments, which are:
Fixed Wireless Telephone (2 set, one for public and one for village office)
Billing Display set
Power Supply (PLN or Solar Power Supply)
Personal Computer set
VSAT set (ODU and IDU)
Pico BTS set
Billboard signGenerally, ST 3 architecture can be described by Picture 6.

8/3/2019 ITU-ADB Interrim Indonesia Country Report
http://slidepdf.com/reader/full/itu-adb-interrim-indonesia-country-report 92/109
ADB Rural ICT Project
Indonesia Country Case Study Report
92
Picture 6 General ST 3 Network Configuration
5.2.5 Services provided, including public and private access; volumes andcapacity of services made available;
First Stage:
-
Serivice: communal access at village level (ringing village) andbasic internet service (desa pinter)
- Minimum one line at every village (public access within walkingdistance)
On going:
- Internet Service and Point of Presence:
- Villages with internet kiosk with 5 pc
5.2.6 Degree of demand and utilization, including growth over time;
During this study, a survey had been conducted by BTIP to evaluate degree ofdemand and utilization of Rural ICT under USO Program. The survey wereconducted on the deployment periods before official hand-over from the operator toBTIP.
Before the official handover is done between the operator and the government (viaBTIP), several USO projects are done already in some rural and remote area. In thattime, several surveys were accomplished over several project examples in Sumatera,Kalimantan, Java, Bali, Nusa Tenggara Barat, and Nusa Tenggara Timur. Thesummary of finding is described below.
O erators’ Central
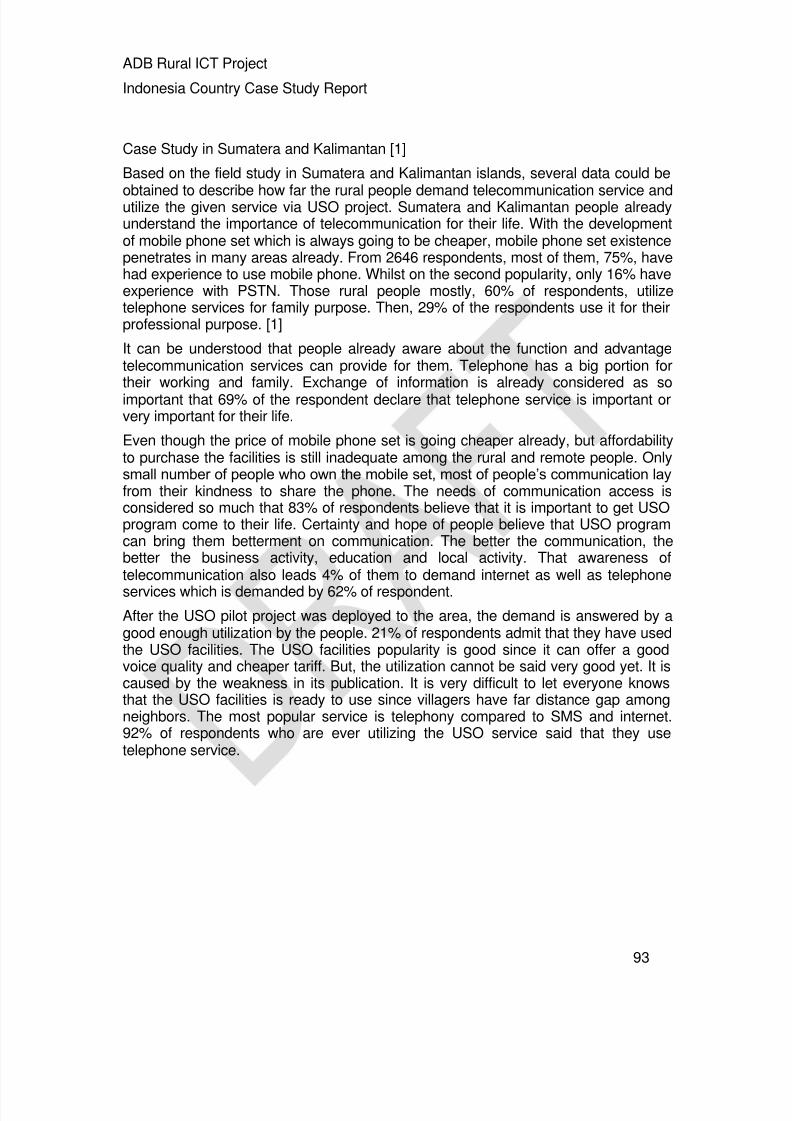
8/3/2019 ITU-ADB Interrim Indonesia Country Report
http://slidepdf.com/reader/full/itu-adb-interrim-indonesia-country-report 93/109
ADB Rural ICT Project
Indonesia Country Case Study Report
93
Case Study in Sumatera and Kalimantan [1]
Based on the field study in Sumatera and Kalimantan islands, several data could be
obtained to describe how far the rural people demand telecommunication service andutilize the given service via USO project. Sumatera and Kalimantan people alreadyunderstand the importance of telecommunication for their life. With the developmentof mobile phone set which is always going to be cheaper, mobile phone set existencepenetrates in many areas already. From 2646 respondents, most of them, 75%, havehad experience to use mobile phone. Whilst on the second popularity, only 16% haveexperience with PSTN. Those rural people mostly, 60% of respondents, utilizetelephone services for family purpose. Then, 29% of the respondents use it for theirprofessional purpose. [1]
It can be understood that people already aware about the function and advantagetelecommunication services can provide for them. Telephone has a big portion fortheir working and family. Exchange of information is already considered as soimportant that 69% of the respondent declare that telephone service is important orvery important for their life.
Even though the price of mobile phone set is going cheaper already, but affordabilityto purchase the facilities is still inadequate among the rural and remote people. Onlysmall number of people who own the mobile set, most of people’s communication layfrom their kindness to share the phone. The needs of communication access isconsidered so much that 83% of respondents believe that it is important to get USOprogram come to their life. Certainty and hope of people believe that USO programcan bring them betterment on communication. The better the communication, thebetter the business activity, education and local activity. That awareness oftelecommunication also leads 4% of them to demand internet as well as telephone
services which is demanded by 62% of respondent.
After the USO pilot project was deployed to the area, the demand is answered by agood enough utilization by the people. 21% of respondents admit that they have usedthe USO facilities. The USO facilities popularity is good since it can offer a goodvoice quality and cheaper tariff. But, the utilization cannot be said very good yet. It iscaused by the weakness in its publication. It is very difficult to let everyone knowsthat the USO facilities is ready to use since villagers have far distance gap amongneighbors. The most popular service is telephony compared to SMS and internet.92% of respondents who are ever utilizing the USO service said that they usetelephone service.

8/3/2019 ITU-ADB Interrim Indonesia Country Report
http://slidepdf.com/reader/full/itu-adb-interrim-indonesia-country-report 94/109
ADB Rural ICT Project
Indonesia Country Case Study Report
94
Picture 1 Percentage of respondent who answer the statement, the diagram can
shows their actual demand of telecommunicationUSO facilities should operate for 8 hours per day. In fact, there are 20% USO stallswhich obey that operational duration. 31% are operating for 5 hours per day. Even,49% or most of them are ready to use for 24 hours per day, since it is made realpublic. Most of the USO stalls have 1-10 users per day who utilize the facilities. Mostof the users use facilities in the weekend and in Monday. People like to use thefacilities while they are enjoying their weekend. They also use the facilities while theyare starting their working and business on Monday. [1]
Picture 2 Percentage of respondent who answer the statement, the diagram canshows their actual utilization of telecommunication
Case Study in Java, Bali, Nusa Tenggara Barat and Nusa Tenggara Timur [2]
Practically, the condition of demand and utilization in Java, Bali, Nusa TenggaraBarat and Nusa Tenggara Timur is quite similar with that in Sumatera andKalimantan. Almost all facts in Sumatera and Kalimantan occur in these areas. The
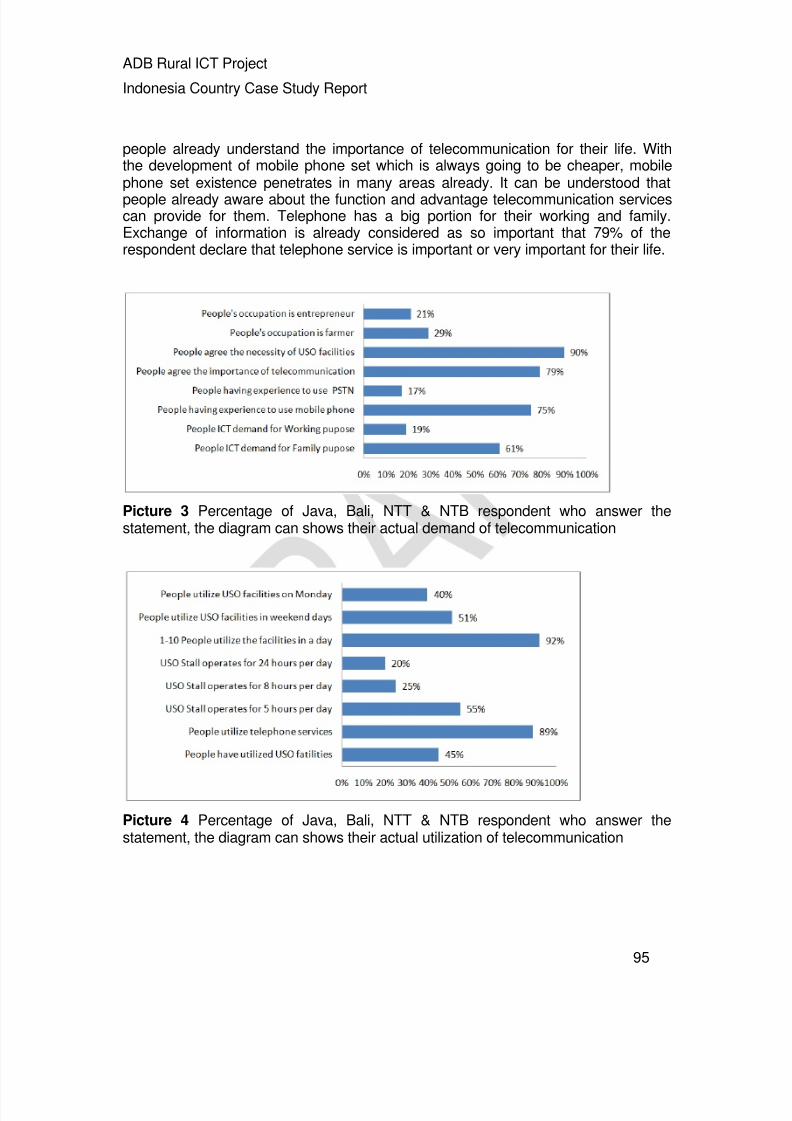
8/3/2019 ITU-ADB Interrim Indonesia Country Report
http://slidepdf.com/reader/full/itu-adb-interrim-indonesia-country-report 95/109
ADB Rural ICT Project
Indonesia Country Case Study Report
95
people already understand the importance of telecommunication for their life. Withthe development of mobile phone set which is always going to be cheaper, mobilephone set existence penetrates in many areas already. It can be understood that
people already aware about the function and advantage telecommunication servicescan provide for them. Telephone has a big portion for their working and family.Exchange of information is already considered as so important that 79% of therespondent declare that telephone service is important or very important for their life.
Picture 3 Percentage of Java, Bali, NTT & NTB respondent who answer thestatement, the diagram can shows their actual demand of telecommunication
Picture 4 Percentage of Java, Bali, NTT & NTB respondent who answer thestatement, the diagram can shows their actual utilization of telecommunication
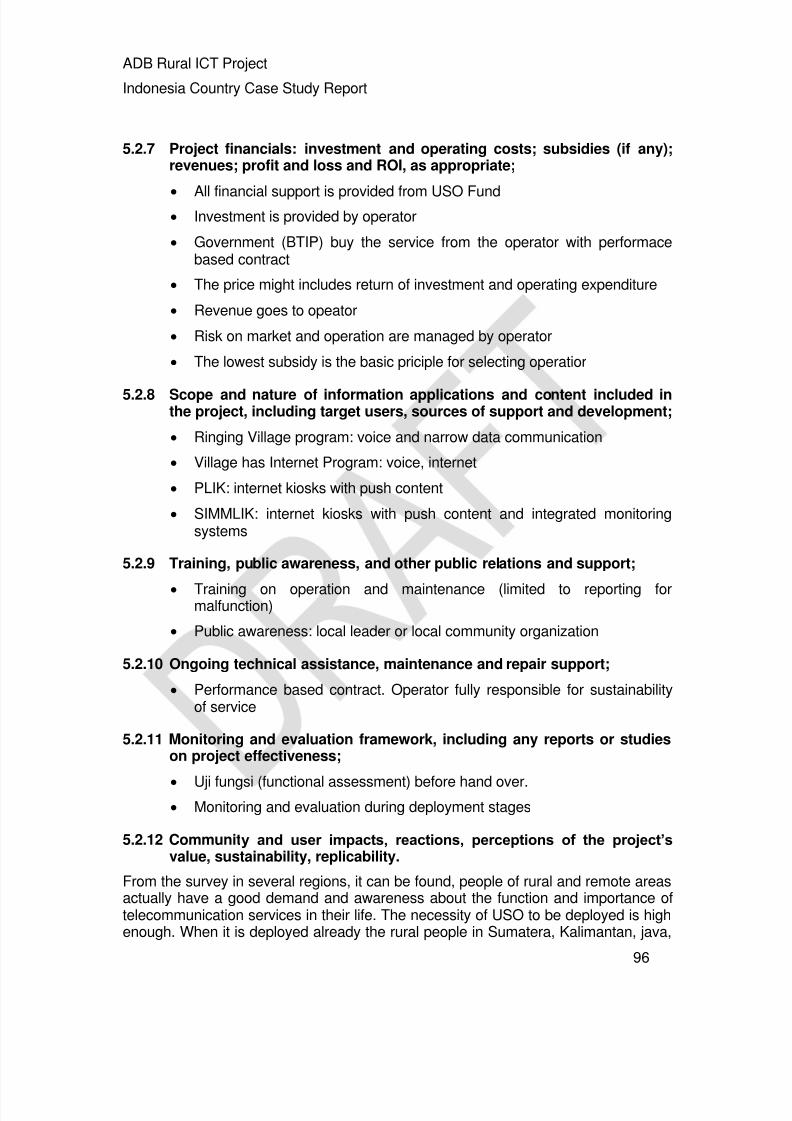
8/3/2019 ITU-ADB Interrim Indonesia Country Report
http://slidepdf.com/reader/full/itu-adb-interrim-indonesia-country-report 96/109
ADB Rural ICT Project
Indonesia Country Case Study Report
96
5.2.7 Project financials: investment and operating costs; subsidies (if any);revenues; profit and loss and ROI, as appropriate;
All financial support is provided from USO Fund Investment is provided by operator
Government (BTIP) buy the service from the operator with performacebased contract
The price might includes return of investment and operating expenditure
Revenue goes to opeator
Risk on market and operation are managed by operator
The lowest subsidy is the basic priciple for selecting operatior
5.2.8 Scope and nature of information applications and content included inthe project, including target users, sources of support and development;
Ringing Village program: voice and narrow data communication
Village has Internet Program: voice, internet
PLIK: internet kiosks with push content
SIMMLIK: internet kiosks with push content and integrated monitoringsystems
5.2.9 Training, public awareness, and other public relations and support;
Training on operation and maintenance (limited to reporting formalfunction)
Public awareness: local leader or local community organization
5.2.10 Ongoing technical assistance, maintenance and repair support;
Performance based contract. Operator fully responsible for sustainabilityof service
5.2.11 Monitoring and evaluation framework, including any reports or studieson project effectiveness;
Uji fungsi (functional assessment) before hand over. Monitoring and evaluation during deployment stages
5.2.12 Community and user impacts, reactions, perceptions of the project’svalue, sustainability, replicability.
From the survey in several regions, it can be found, people of rural and remote areasactually have a good demand and awareness about the function and importance oftelecommunication services in their life. The necessity of USO to be deployed is highenough. When it is deployed already the rural people in Sumatera, Kalimantan, java,
8/3/2019 ITU-ADB Interrim Indonesia Country Report
http://slidepdf.com/reader/full/itu-adb-interrim-indonesia-country-report 97/109
ADB Rural ICT Project
Indonesia Country Case Study Report
97
Bali, Nusa Tenggara Timur and Nusa Tenggara Barat do shows that they utilize itoptimally.
5.3 Case 3: Private Initiative Rural ICT Provision: Community ICT Center
Survey on a site of private initiative rural ICT provision was taken place on JogloAbang community. Joglo Abang, which means The Red House, is a community ofinternet users in a village of Sleman, D.I. Yogyakarta. The community providesinternet service which is used to empower the villagers with information exchange.The convergence of content becomes the main path on the community development.
5.3.1 Geographic locations, populations, and political divisions served by theproject;
One of service convergence development example can be found in Joglo Abang
Indonesia. Joglo Abang is located in a village where most of people are farmers.Microsoft in collaboration with ASEAN, built a CDC (Community DevelopmentCentre) program by providing ICT including CPEs and network connection for thevillage. The CDC has been successfully developing the people especially theteenagers in order to utilize many information resources. The CDC service has beensuccessfully increase the value of information by using service convergence frominternet such as tutorial, training, job vacancy, farming education and others.
5.3.2 Institutional and stakeholder arrangements involved in project planning,design, financing, implementation, and oversight;
Case 3: Private initiative through CSR program
Microsoft in collaboration with ASEAN, built a CDC (CommunityDevelopment Centre). Project design was intended to provide ICT servicefor rural people, specifically farmer.
Microsoft provides main financial support for CAPEX and OPEX forrunning the first year.
The implementation invites NGOs which interested for conductingadvocay service for ICT dissemination for rural people.
The NGO is expected to provide in-kind support including space,electricity, tutor etc.
Microsoft provides monitoring systems to evaluate number of subscriberor user, tutorial sessions, on-line acivities, user management etc.
5.3.3 Local participation in project development, operation, ownership;
Case 3: Private initiative through CSR program: Development: Company+ Community, operation: community, ownership: community
NGOs or other local community organization that applied for CDCprogram is actually the main player of the program. Success and failiure ishighly depend on their involment during operation and maintenance.

8/3/2019 ITU-ADB Interrim Indonesia Country Report
http://slidepdf.com/reader/full/itu-adb-interrim-indonesia-country-report 98/109
ADB Rural ICT Project
Indonesia Country Case Study Report
98
Local community is expected to organized the group of user within itssocial networks
The property of equipment to be transferred to designated NGO at theend of the contract.
5.3.4 Technology platforms, infrastructure, and facilities deployed; quantitiesand capacity of network and services provided;
Case 3: Private initiative through CSR program. Technology platforms:Internet, infrastructure: wireless internet, and facilities deployed: CTC,quantities: one PC for one community, capacity of network: and servicesprovided: community development advocacy
Simply, Joglo Abang is a house having numerous IT CPEs (customer premisesequipment) which can be used by the public. Each CPE is connected in LAN by
cable and Wi-Fi. Thus, It can be seen that LAN and WLAN routers are occupied. TheWLAN utilizes Wi-Fi 802.11 b/g.
For a LAN, the transmission medium can be twisted copper cable, coaxial cable,optical fiber, and radio. The topology, data rates, and medium access protocols willdiffer for the different media.
LANs can be broadly categorized as baseband LANs and broadband LANs.Broadband LANs can span larger distances up to tens of kilometers. Broadband LANuses frequency division multiplexing, in which multiple channels are used for data,voice, and video. RF modems are required for communication. They operate inunidirectional mode because it is difficult to design amplifiers that pass signals of onefrequency in both directions. To achieve full connectivity, two data paths are
required—one frequency to transmit and one to receive.
A LAN can operate in the following topologies: bus, tree, ring, and star, as shown inPicture 1. Generally, Joglo Abang uses star topology. In star topology, there will be acentral hub to which all the nodes are connected. The central node can operate inbroadcast mode or as a switch. In star networks, addition and deletion of nodes isvery easy; however, if the central hub fails, the entire network is down. The hub actsas a repeater—data transmitted by a station is received by all stations. Hencelogically, this topology is equivalent to a bus.

8/3/2019 ITU-ADB Interrim Indonesia Country Report
http://slidepdf.com/reader/full/itu-adb-interrim-indonesia-country-report 99/109
ADB Rural ICT Project
Indonesia Country Case Study Report
99
Picture 1. LAN topologies.
The Institute of Electrical and Electronics Engineers (IEEE) set up a committeeknown as the 802 committee to develop various LAN standards. These standardstogether are known as IEEE 802 standards. These standards address only thephysical and datalink layers of LANs. They specify the protocols to be used in MACand LLC sublayers, the physical layer specifications, and the physical medium to beused.
Based on the popularity of Ethernet, IEEE released a compatible LAN standard thatis specified in IEEE 802.3. LANs based on the 802.3 standard have the followingcharacteristics:
Topology: Bus, tree, or star
MAC sublayer: CSMA/CD
Physical layer can be one of the following:
Baseband coaxial cable operating at 10Mbps
Unshielded twisted pair operating at 10Mbps or 100Mbps
Shielded twisted pair operating at 100Mbps
Broadband coaxial cable operating at 10Mbps
Optical fiber operating at 10Mbps
IEEE 802.3 operating at 10Mbps has six alternatives:
10 BASE 5: 10Mbps baseband 500 meter segment length
10 BASE 2: 10Mbps baseband, 200 meter segment length
10 BASE T: 10Mbps baseband, twisted pair
10 BROAD 36: 10Mbps broadband, 3600 meter end-to-end span (1800meter segment)
10 BASE F: 10Mbps baseband, fiber
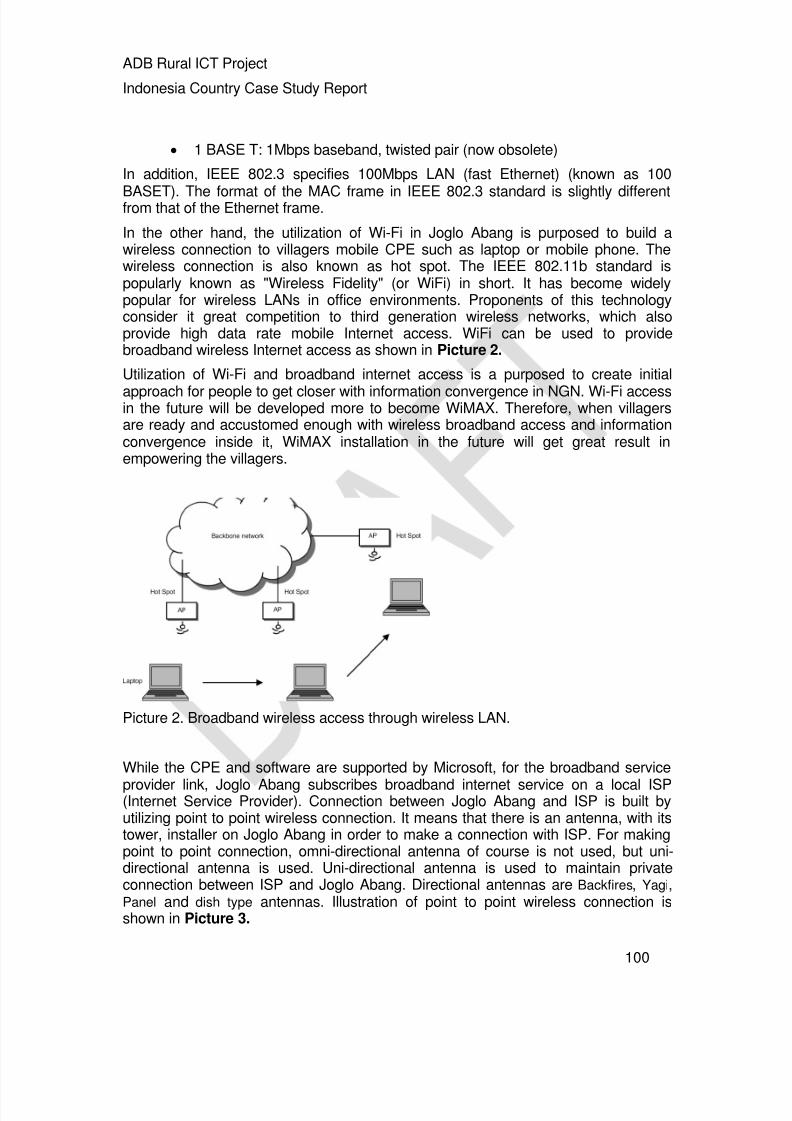
8/3/2019 ITU-ADB Interrim Indonesia Country Report
http://slidepdf.com/reader/full/itu-adb-interrim-indonesia-country-report 100/109
ADB Rural ICT Project
Indonesia Country Case Study Report
100
1 BASE T: 1Mbps baseband, twisted pair (now obsolete)
In addition, IEEE 802.3 specifies 100Mbps LAN (fast Ethernet) (known as 100
BASET). The format of the MAC frame in IEEE 802.3 standard is slightly differentfrom that of the Ethernet frame.
In the other hand, the utilization of Wi-Fi in Joglo Abang is purposed to build awireless connection to villagers mobile CPE such as laptop or mobile phone. Thewireless connection is also known as hot spot. The IEEE 802.11b standard ispopularly known as "Wireless Fidelity" (or WiFi) in short. It has become widelypopular for wireless LANs in office environments. Proponents of this technologyconsider it great competition to third generation wireless networks, which alsoprovide high data rate mobile Internet access. WiFi can be used to providebroadband wireless Internet access as shown in Picture 2.
Utilization of Wi-Fi and broadband internet access is a purposed to create initial
approach for people to get closer with information convergence in NGN. Wi-Fi accessin the future will be developed more to become WiMAX. Therefore, when villagersare ready and accustomed enough with wireless broadband access and informationconvergence inside it, WiMAX installation in the future will get great result inempowering the villagers.
Picture 2. Broadband wireless access through wireless LAN.
While the CPE and software are supported by Microsoft, for the broadband service
provider link, Joglo Abang subscribes broadband internet service on a local ISP(Internet Service Provider). Connection between Joglo Abang and ISP is built byutilizing point to point wireless connection. It means that there is an antenna, with itstower, installer on Joglo Abang in order to make a connection with ISP. For makingpoint to point connection, omni-directional antenna of course is not used, but uni-directional antenna is used. Uni-directional antenna is used to maintain privateconnection between ISP and Joglo Abang. Directional antennas are Backfires, Yagi,Panel and dish type antennas. Illustration of point to point wireless connection isshown in Picture 3.
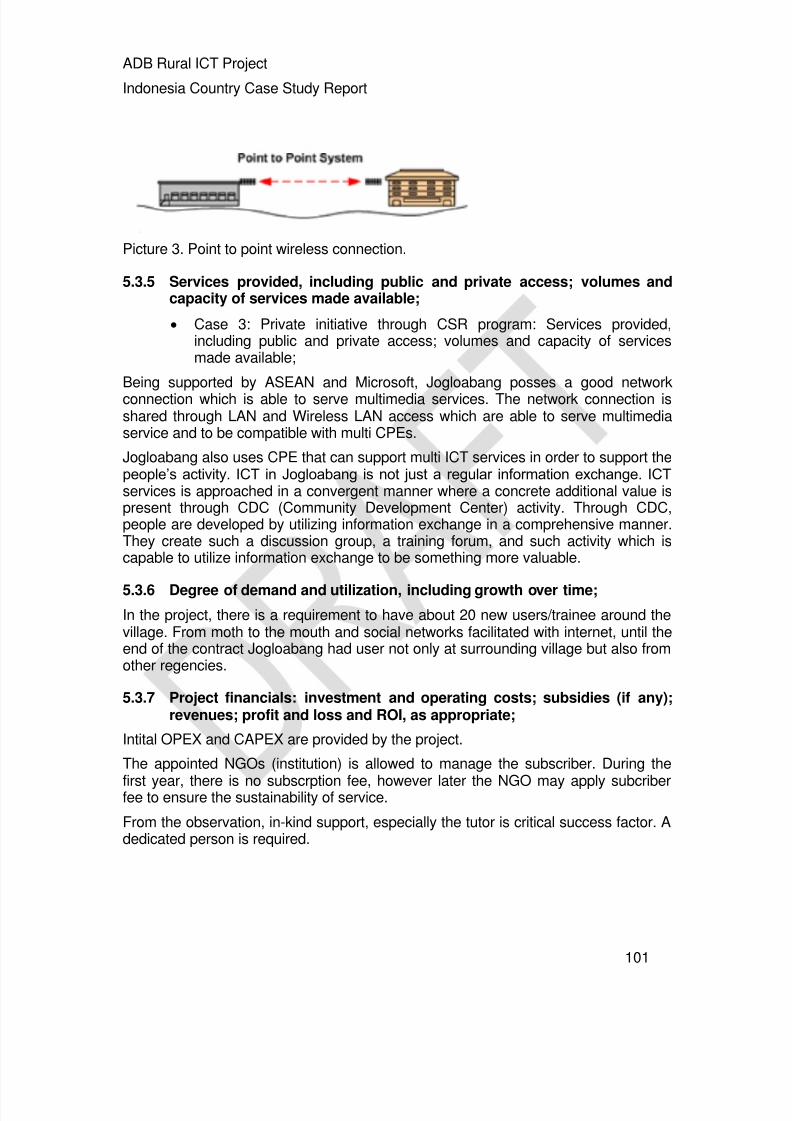
8/3/2019 ITU-ADB Interrim Indonesia Country Report
http://slidepdf.com/reader/full/itu-adb-interrim-indonesia-country-report 101/109
ADB Rural ICT Project
Indonesia Country Case Study Report
101
Picture 3. Point to point wireless connection.
5.3.5 Services provided, including public and private access; volumes andcapacity of services made available;
Case 3: Private initiative through CSR program: Services provided,including public and private access; volumes and capacity of servicesmade available;
Being supported by ASEAN and Microsoft, Jogloabang posses a good networkconnection which is able to serve multimedia services. The network connection isshared through LAN and Wireless LAN access which are able to serve multimediaservice and to be compatible with multi CPEs.
Jogloabang also uses CPE that can support multi ICT services in order to support thepeople’s activity. ICT in Jogloabang is not just a regular information exchange. ICTservices is approached in a convergent manner where a concrete additional value ispresent through CDC (Community Development Center) activity. Through CDC,people are developed by utilizing information exchange in a comprehensive manner.They create such a discussion group, a training forum, and such activity which iscapable to utilize information exchange to be something more valuable.
5.3.6 Degree of demand and utilization, including growth over time;
In the project, there is a requirement to have about 20 new users/trainee around thevillage. From moth to the mouth and social networks facilitated with internet, until theend of the contract Jogloabang had user not only at surrounding village but also fromother regencies.
5.3.7 Project financials: investment and operating costs; subsidies (if any);revenues; profit and loss and ROI, as appropriate;
Intital OPEX and CAPEX are provided by the project.
The appointed NGOs (institution) is allowed to manage the subscriber. During the
first year, there is no subscrption fee, however later the NGO may apply subcriberfee to ensure the sustainability of service.
From the observation, in-kind support, especially the tutor is critical success factor. Adedicated person is required.
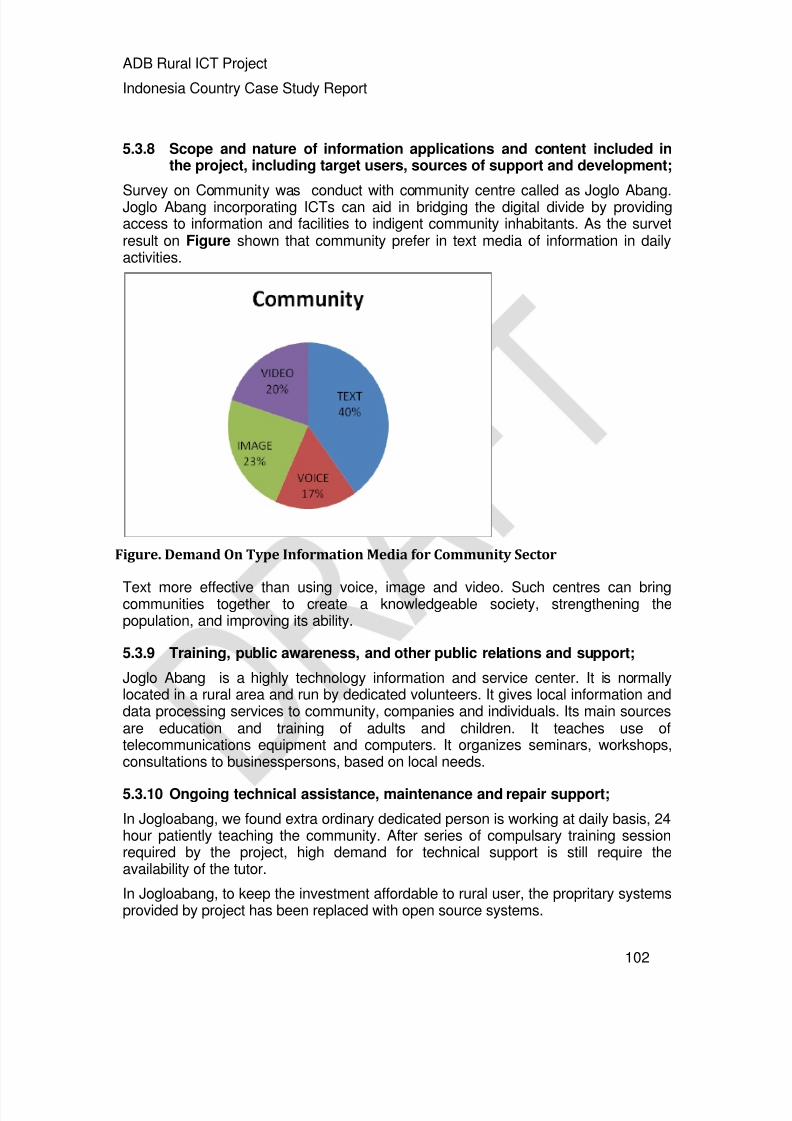
8/3/2019 ITU-ADB Interrim Indonesia Country Report
http://slidepdf.com/reader/full/itu-adb-interrim-indonesia-country-report 102/109
ADB Rural ICT Project
Indonesia Country Case Study Report
102
5.3.8 Scope and nature of information applications and content included inthe project, including target users, sources of support and development;
Survey on Community was conduct with community centre called as Joglo Abang.Joglo Abang incorporating ICTs can aid in bridging the digital divide by providingaccess to information and facilities to indigent community inhabitants. As the survetresult on Figure shown that community prefer in text media of information in dailyactivities.
Figure. Demand On Type Information Media for Community Sector
Text more effective than using voice, image and video. Such centres can bringcommunities together to create a knowledgeable society, strengthening thepopulation, and improving its ability.
5.3.9 Training, public awareness, and other public relations and support;
Joglo Abang is a highly technology information and service center. It is normallylocated in a rural area and run by dedicated volunteers. It gives local information anddata processing services to community, companies and individuals. Its main sourcesare education and training of adults and children. It teaches use oftelecommunications equipment and computers. It organizes seminars, workshops,consultations to businesspersons, based on local needs.
5.3.10 Ongoing technical assistance, maintenance and repair support;
In Jogloabang, we found extra ordinary dedicated person is working at daily basis, 24hour patiently teaching the community. After series of compulsary training sessionrequired by the project, high demand for technical support is still require theavailability of the tutor.
In Jogloabang, to keep the investment affordable to rural user, the propritary systemsprovided by project has been replaced with open source systems.
8/3/2019 ITU-ADB Interrim Indonesia Country Report
http://slidepdf.com/reader/full/itu-adb-interrim-indonesia-country-report 103/109
ADB Rural ICT Project
Indonesia Country Case Study Report
103
5.3.11 Monitoring and evaluation framework, including any reports or studieson project effectiveness;
Microsoft provide on-line system to monitor new users, training sessions, on-lineactivity ect. The appointed istitution is compulsory to update the database duringperiod of project.
5.3.12 Community and user impacts, reactions, perceptions of the project’svalue, sustainability, replicability.
User and trainee are satiffied and provide very positive responses about theprogram. Jogloabang is considered successful to bring the rural community intoglobal ICT society. Success story bring more visitor to Jogloabang. It inspire BTIP todeploy similar systems nation wide.
5.4 Case 4: Central Government Activity Based Infrastructure: E-Learning
(Jardiknas)
The National Education Network (Jardiknas) is an infrastructure developmentprogram on National Wide Area Network which is developed by Ministry of NationalEducation of the Republic of Indonesia in order to connect institutions andeducational community all around Indonesia. Furthermore, Jardiknas is one ofstrategic programs on information and communication technology developmentdedicated for education sector in Indonesia. It is expected that the online networkinfrastructure will accelerate the integration of information and communicationtechnology for government program on education sector.
5.4.1 Geographic locations, populations, and political divisions served by theproject;
Jardiknas program has nation wide coverages. Site visit was conducted at ruralJunior High Schools at rural village in DI Yogjakarta under Jardiknas program
E-education in can be found in SMP 3 Pengasih and SMP 2 Temon, wheregovernment, through Ministry of Education, provides CPE and network connection forrural school. The ICT provision is based on Jardiknas by Ministry of Education. Thetargeted expectation is to establish e-education in order to foster educationdevelopment on rural areas. In this surveyed area, NGN is approached throughpremises convergence, access convergence and service convergence.
Overall, government supplies CPEs, wireless LAN access point, and internet access.
Government has supplied 4-5 units of PC which are capable to provide multimediaservices such as audio, voice, image, video and other internet based services. Byproviding wireless access point, it is expected that access convergence can beestablished where all CPEs inside the school can obtain instant internet connection.That wireless LAN connection is able to provide multimedia service towards any Wi-Fi-equipped-devices and CPEs.
8/3/2019 ITU-ADB Interrim Indonesia Country Report
http://slidepdf.com/reader/full/itu-adb-interrim-indonesia-country-report 104/109
ADB Rural ICT Project
Indonesia Country Case Study Report
104
5.4.2 Institutional and stakeholder arrangements involved in project planning,design, financing, implementation, and oversight;
Case 4: Central Government intiative through multisectoral approachThe main initiator of the project is Ministry of Education. The planning aim to connectall school nation-wide with Internet. It is designed to support e-learning activity withcluster of five multi-media PCs connected to Internet. The main source of fund iscoming from Ministry of Education. The available USO fund is not used for thisproject. Project implementation has been implemented with national procurementprocess, therefore project monitoring rely on national procurement monitoringprocess.
5.4.3 Local participation in project development, operation, ownership;
Case 4: Central Government intiative through multisectoral approach.
Development: Ministry of Education, operation: schools, ownership:school
Local Participation from schools is conducted by providing in-kind support(room space, furniture, electricity etc) to support operation.
The owenership is transferred to schools.
The school provides OPEX.
The school has freedom to use provided Internet connection or changingto other commercial ISP
5.4.4 Technology platforms, infrastructure, and facilities deployed; quantities
and capacity of network and services provided;
5.4.5 Services provided, including public and private access; volumes andcapacity of services made available;
The Jardiknas program covers four zones, i.e. Department Office Zone, HigherEducation Zone, School Zone, and Personal Zone.
Department Office Zone
This zone covers offices of department of education in central, provincial andregional level. The Jardiknas in this zone mainly functions as a media to conductonline data transaction of administration information system and education
management.Higher Education Zone
This zone covers all higher education institutions all over Indonesia, both stateuniversity and private university. The Jardiknas in this zone mainly functions as amedia to conduct research, science and technology development and informationand communication-based electronic learning.
School Zone

8/3/2019 ITU-ADB Interrim Indonesia Country Report
http://slidepdf.com/reader/full/itu-adb-interrim-indonesia-country-report 105/109
ADB Rural ICT Project
Indonesia Country Case Study Report
105
This zone covers all formal and non-formal schools, both state and private schools, inall education level (kindergarten, elementary school, secondary school, high school).The Jardiknas in this zone mainly functions as a media to access information and
knowledge as well as communication and information technology-based electroniclearning.
Personal Zone
This zone will cover personal access for teacher, lecturer, staff, faculty and students.Jardiknas mainly functions as communication media and education informationaccess media.

8/3/2019 ITU-ADB Interrim Indonesia Country Report
http://slidepdf.com/reader/full/itu-adb-interrim-indonesia-country-report 106/109
ADB Rural ICT Project
Indonesia Country Case Study Report
106
Figure . The 2007 Jardiknas Infrastructure Scheme
5.4.6 Degree of demand and utilization, including growth over time;
Related with Jardiknas program, an extensive content development has beenproduced by Ministry of Education. The content is one of main information sourceaccessed by students and teachers. On line content is usefull to support learningprocess, however the proportion of number of accessible PC is still insufficent,especially in rural area where internet at school is only access that they can afford.
5.4.7 Project financials: investment and operating costs; subsidies (if any);revenues; profit and loss and ROI, as appropriate;
ICT related education sector in Indonesia implemented by Ministry of Education,Government of Indonesia. Education sector has funded infrastructure provision, andcontent development for ICT networks connecting all school.
The investment for Jardiknas is about 1% of National Education sector budget. Bylaws, annually minimum allocation for Education Sector is 20% of Indonesia StateBudget. The investment is not the part of USO Fund available for USO program inIndonesia.
USO Fund in Indonesia which has been collected from 0.75 (in 2007) to 1.25 % (in2009) of gross revenue of operators is currently dedicated for rural ICT developmentfor more than 35.000 villages.
8/3/2019 ITU-ADB Interrim Indonesia Country Report
http://slidepdf.com/reader/full/itu-adb-interrim-indonesia-country-report 107/109
ADB Rural ICT Project
Indonesia Country Case Study Report
107
5.4.8 Scope and nature of information applications and content included inthe project, including target users, sources of support and development;
Education essential resources are information. Therefore, Jardiknas programprovides integrated services in convergent manner in order to enhance educationwith internet as a wide information source. There is activity of increasing informationvalue in education by interactive content for training, educate, or giving tutorial. In thispart, service convergence is approached by letting rural school get initiated to blendwith education-related-multimedia service.
5.4.9 Training, public awareness, and other public relations and support;
Since there is no scheme for including long term training program in the procurementprocess, each school should arrange their training activity.
5.4.10 Ongoing technical assistance, maintenance and repair support;
From the field observation in Indonesia, we found that additional support for facilitymaintenance and capacity building program to achieve the best use of ICT in schoolis still necessary to be provided. Currently OPEX is provided from the budget as partof BOS (School Operational Expenditure) scheme.
5.4.11 Monitoring and evaluation framework, including any reports or studieson project effectiveness;
5.4.12 Community and user impacts, reactions, perceptions of the project’svalue, sustainability, replicability.
Target user reacts positively and appreciates the project value as a means forintroducing to knowledge based society. Additional scheme for maintain sustainablity(eg. Training, maintenance, Internet access provision) might necessary to expand thebenefit of the program.

8/3/2019 ITU-ADB Interrim Indonesia Country Report
http://slidepdf.com/reader/full/itu-adb-interrim-indonesia-country-report 108/109
ADB Rural ICT Project
Indonesia Country Case Study Report
108
8/3/2019 ITU-ADB Interrim Indonesia Country Report
http://slidepdf.com/reader/full/itu-adb-interrim-indonesia-country-report 109/109
ADB Rural ICT Project
Indonesia Country Case Study Report
Chapter 6 Lessons, Opportunities,
Constraints
This section will highlight lessons learned, opportunities for furtherdevelopment of national rural ICT policy, and constraints that may impedesuch development. The analysis will be based on both the experiencesand perspectives of stakeholders within the country studied, as well asregional and international experience. For each country, this section ofthe report will provide specific findings that can be transferred to othercountries of the region, and potentially incorporated in toolkits and otherresources.
Related Documents