This journal is c the Owner Societies 2012 Phys. Chem. Chem. Phys., 2012, 14, 5581–5587 5581 Cite this: Phys. Chem. Chem. Phys., 2012, 14, 5581–5587 In situ X-ray Raman spectroscopy of LiBH 4 w Piter S. Miedema,* a Peter Ngene, a Ad M. J. van der Eerden, a Tsu-Chien Weng, b Dennis Nordlund, b Dimosthenis Sokaras, b Roberto Alonso-Mori, c Ame´lie Juhin, a Petra E. de Jongh a and Frank M. F. de Groot* a Received 16th December 2011, Accepted 27th February 2012 DOI: 10.1039/c2cp24025d X-Ray Raman Spectroscopy (XRS) is used to study the electronic properties of bulk lithium borohydride (LiBH 4 ) and LiBH 4 in porous carbon nano-composites (LiBH 4 /C) during dehydrogenation. The lithium (Li), boron (B) and carbon (C) K-edges are studied and compared with calculations of the starting material and intermediate compounds. Comparison of the B and C K-edge XRS spectra of the as-prepared samples with rehydrogenated samples shows that the B and C electronic structure is largely regained after rehydrogenation. Both Li and C K-edge spectra show that during dehydrogenation, part of the Li intercalates into the porous carbon. This study shows that XRS in combination with calculations is a promising tool to study the electronic properties of nano-crystalline light-weight materials for energy storage. 1 Introduction A X-Ray Raman spectroscopy The X-ray spectra of light elements, such as lithium (Li), boron (B) and carbon (C), occur in the soft X-ray energy range at, respectively, 60 eV, 180 eV and 280 eV. X-Ray Absorption Spectroscopy (XAS) can be measured in transmission, electron yield or fluorescence yield. Due to the path lengths of soft X-rays, transmission X-ray absorption measurements in the energy range of 50 to 250 eV are as yet impossible. Above 250 eV, transmission X-ray microscopy can be performed at ambient pressure 1 using specialized nano-reactors. 2 The electron yield mode can as yet only be performed at the mbar pressure range. 3 Fluorescence yield probes deeper into the sample, but this probe has very low yield for soft X-ray energies and suffers from saturation effects in concentrated systems. 4 X-Ray Raman Spectroscopy (XRS) measures the energy loss of a hard X-ray beam and as such it is a technique that can retain the experimental advantages of hard X-ray measurements (deeper probing depth implying more realistic samples, less beam damage, experiments in a gas environment), while revealing the information equivalent to the soft X-ray absorption spectra. 5,6 Thus, XRS on the K-edge of the light-weight elements can circumvent the problems related to soft X-rays. Initially, the low cross-section of XRS made this technique impractical, but intense new X-ray facilities and improvements in X-ray optics helped XRS to become an interesting spectroscopic tool. 7 The difference between XRS and XAS is the transition operator. In XAS the electronic transition can be approximated as a dipole transition, while for XRS also higher order transitions (quadrupole, etc.) are allowed, depending on the q-vector, related to the angle between incident and scattered X-rays. At low values for q as used in our experiment only dipole transitions are allowed. Note that resonant X-ray Raman Spectroscopy, also known as Resonant Inelastic X-ray Scattering (RIXS), would even give more electronic information, but because the B and Li K-edges are at 60 eV and 180 eV soft X-ray edges, in situ RIXS experiments cannot be performed. In this study we show experimental XRS data on the B K-edge and Li K-edge of the hydrogen storage material LiBH 4 and compare the XRS with calculations. B Background on (nanoconfined) LiBH 4 LiBH 4 is a complex metal hydride that has recently attracted much attention as a potential material for onboard hydrogen storage in cars due to its hydrogen content of 18.5 wt%. When heated, it decomposes into LiH and B in three intermediate steps, releasing 13.8 wt% hydrogen. 8 The reaction pathway and intermediate decomposition products have been the subject of a number of recent investigations. 9–11 The intermediate products are generally amorphous and their formation depends on experimental parameters such as temperature, heating rate and the carrier gas. Kang et al. proposed that LiBH and LiB a Department of Inorganic Chemistry and Catalysis, Debye Institute for Nanomaterials Science, Utrecht University, Universiteitsweg 99, 23584 CG Utrecht, The Netherlands. E-mail: [email protected], [email protected] b Stanford Synchrotron Radiation Lightsource, SLAC National Accelerator Laboratory, 2575 Sand Hill Road, Menlo Park, CA 94025, USA c Linear Coherent Light Source, SLAC National Accelerator Laboratory, 2575 Sand Hill Road, Menlo Park, CA 94025, USA w Electronic supplementary information (ESI) available: XRS spectra of Li 4 SiO 4 and BN and calculation details on different studied systems and calculated B and Li K-edges of reference systems and intermediates Li 2 B 12 H 12 , LiB, LiBH and LiH. See DOI: 10.1039/c2cp24025d PCCP Dynamic Article Links www.rsc.org/pccp PAPER Downloaded by Universiteit Utrecht on 24 April 2012 Published on 27 February 2012 on http://pubs.rsc.org | doi:10.1039/C2CP24025D View Online / Journal Homepage / Table of Contents for this issue

Welcome message from author
This document is posted to help you gain knowledge. Please leave a comment to let me know what you think about it! Share it to your friends and learn new things together.
Transcript
This journal is c the Owner Societies 2012 Phys. Chem. Chem. Phys., 2012, 14, 5581–5587 5581
Cite this: Phys. Chem. Chem. Phys., 2012, 14, 5581–5587
In situ X-ray Raman spectroscopy of LiBH4w
Piter S. Miedema,*aPeter Ngene,
aAd M. J. van der Eerden,
aTsu-Chien Weng,
b
Dennis Nordlund,bDimosthenis Sokaras,
bRoberto Alonso-Mori,
cAmelie Juhin,
a
Petra E. de Jonghaand Frank M. F. de Groot*
a
Received 16th December 2011, Accepted 27th February 2012
DOI: 10.1039/c2cp24025d
X-Ray Raman Spectroscopy (XRS) is used to study the electronic properties of bulk lithium
borohydride (LiBH4) and LiBH4 in porous carbon nano-composites (LiBH4/C) during
dehydrogenation. The lithium (Li), boron (B) and carbon (C) K-edges are studied and compared
with calculations of the starting material and intermediate compounds. Comparison of the
B and C K-edge XRS spectra of the as-prepared samples with rehydrogenated samples shows that
the B and C electronic structure is largely regained after rehydrogenation. Both Li and C K-edge
spectra show that during dehydrogenation, part of the Li intercalates into the porous carbon.
This study shows that XRS in combination with calculations is a promising tool to study the
electronic properties of nano-crystalline light-weight materials for energy storage.
1 Introduction
A X-Ray Raman spectroscopy
The X-ray spectra of light elements, such as lithium (Li), boron
(B) and carbon (C), occur in the soft X-ray energy range at,
respectively, 60 eV, 180 eV and 280 eV. X-Ray Absorption
Spectroscopy (XAS) can be measured in transmission, electron
yield or fluorescence yield. Due to the path lengths of soft
X-rays, transmission X-ray absorption measurements in the
energy range of 50 to 250 eV are as yet impossible. Above
250 eV, transmission X-ray microscopy can be performed at
ambient pressure1 using specialized nano-reactors.2 The electron
yield mode can as yet only be performed at the mbar pressure
range.3 Fluorescence yield probes deeper into the sample, but this
probe has very low yield for soft X-ray energies and suffers from
saturation effects in concentrated systems.4
X-Ray Raman Spectroscopy (XRS) measures the energy
loss of a hard X-ray beam and as such it is a technique that can
retain the experimental advantages of hard X-ray measurements
(deeper probing depth implying more realistic samples, less beam
damage, experiments in a gas environment), while revealing
the information equivalent to the soft X-ray absorption spectra.5,6
Thus, XRS on the K-edge of the light-weight elements can
circumvent the problems related to soft X-rays. Initially, the
low cross-section of XRS made this technique impractical, but
intense new X-ray facilities and improvements in X-ray optics
helped XRS to become an interesting spectroscopic tool.7 The
difference between XRS and XAS is the transition operator.
In XAS the electronic transition can be approximated as a
dipole transition, while for XRS also higher order transitions
(quadrupole, etc.) are allowed, depending on the q-vector,
related to the angle between incident and scattered X-rays. At
low values for q as used in our experiment only dipole transitions
are allowed. Note that resonant X-ray Raman Spectroscopy, also
known as Resonant Inelastic X-ray Scattering (RIXS), would
even give more electronic information, but because the B and Li
K-edges are at 60 eV and 180 eV soft X-ray edges, in situ RIXS
experiments cannot be performed.
In this study we show experimental XRS data on the B K-edge
and Li K-edge of the hydrogen storage material LiBH4 and
compare the XRS with calculations.
B Background on (nanoconfined) LiBH4
LiBH4 is a complex metal hydride that has recently attracted
much attention as a potential material for onboard hydrogen
storage in cars due to its hydrogen content of 18.5 wt%. When
heated, it decomposes into LiH and B in three intermediate
steps, releasing 13.8 wt% hydrogen.8 The reaction pathway
and intermediate decomposition products have been the subject
of a number of recent investigations.9–11 The intermediate
products are generally amorphous and their formation depends
on experimental parameters such as temperature, heating rate
and the carrier gas. Kang et al. proposed that LiBH and LiB
aDepartment of Inorganic Chemistry and Catalysis, Debye Institutefor Nanomaterials Science, Utrecht University, Universiteitsweg 99,23584 CG Utrecht, The Netherlands.E-mail: [email protected], [email protected]
b Stanford Synchrotron Radiation Lightsource, SLAC NationalAccelerator Laboratory, 2575 Sand Hill Road, Menlo Park,CA 94025, USA
cLinear Coherent Light Source, SLAC National AcceleratorLaboratory, 2575 Sand Hill Road, Menlo Park, CA 94025, USAw Electronic supplementary information (ESI) available: XRS spectraof Li4SiO4 and BN and calculation details on different studied systemsand calculated B and Li K-edges of reference systems and intermediatesLi2B12H12, LiB, LiBH and LiH. See DOI: 10.1039/c2cp24025d
PCCP Dynamic Article Links
www.rsc.org/pccp PAPER
Dow
nloa
ded
by U
nive
rsite
it U
trec
ht o
n 24
Apr
il 20
12Pu
blis
hed
on 2
7 Fe
brua
ry 2
012
on h
ttp://
pubs
.rsc
.org
| do
i:10.
1039
/C2C
P240
25D
View Online / Journal Homepage / Table of Contents for this issue
5582 Phys. Chem. Chem. Phys., 2012, 14, 5581–5587 This journal is c the Owner Societies 2012
are the intermediate phases.12 The reaction would in that case
proceed according to:
LiBH4 $ LiBH + 3/2H2 $ LiB + 2H2
Ohba et al. predicted from calculations that monoclinic
Li2B12H12 is formed as the intermediate compound during
dehydrogenation of LiBH4 and subsequent rehydrogenation.13
In their search for stable intermediates, no compound or
crystal structure more stable than monoclinic Li2B12H12 was
found.13 They propose the following reaction:
LiBH4 $ 1/12Li2B12H12 + 5/6LiH + 13/12H2
$ LiH + B + 3/2H2
Orimo et al. published experimental XRD andRaman spectra at
different temperatures, which are in agreement with the proposed
intermediate Li2B12H12.9 Nuclear Magnetic Resonance (NMR)
spectroscopy experiments by Hwang et al. gave further confirma-
tion of the formation of Li2B12H12 during the decomposition of
LiBH4.10 Other literature suggests that Li4B4H10 (LiBH2.5) could
be a possible intermediate decomposition product of LiBH4.
Many other stable boron–hydrogen complexes are known,
such as B4H8 and B4H10.11
The rates of hydrogen release and uptake in LiBH4 can be
improved by confinement in nanoporous carbon which some-
times also results in a change in the stability and decomposi-
tion pathway of the compound.14–16 At the moment the exact
role of the nanoconfinement and the carbon in improving the
hydrogen sorption properties of LiBH4 is not well understood.
Nanoconfined LiBH4 and other complex hydrides often lack
long-range crystallinity and therefore cannot be characterized
using conventional techniques like XRD, and due to weak
scattering of electrons by the light elements Li and B, LiBH4
cannot be reliably imaged with TEM.
In this study, we investigate the suitability of XRS as a tool
to study the chemical and structural transformations that
occur in Li, B and C during the dehydrogenation and after
subsequent rehydrogenation of both bulk LiBH4 and nano-
confined LiBH4.
2 Experimental and theoretical section
A Experimental section
A.1. Samples and sample preparation. LiBH4 powder
(95% pure) was purchased from Acros-organics. Lithium
metal foil (99.9% pure) and BN powder (98% pure) were
purchased from Sigma-Aldrich and Li4SiO4 powder (99.9% pure)
was purchased from Alfa Aesar. The graphite and porous
carbon (High surface area graphite: HSAG-500, pore volume
0.65 cm3 g�1, broad pore size distribution but majority pore
size 2–3 nm) were provided by Timcal Switzerland. The
nanoconfined samples were prepared by melt-infiltration of
25 wt% LiBH4 into the porous carbon (LiBH4/C) under a
hydrogen pressure of 100 bar at a temperature of 295 1C.17
Sample preparation and handling was conducted in an argon
filled glove-box (typically o1 ppm of oxygen and moisture) to
avoid contamination. The prepared samples were packaged
and shipped to the USA in an air tight container. This air-
tight container was made of steel and was introduced into
the argon filled glove-box. The samples were put in small
bottles and closed and put in the air-tight container creating a
double protection against oxygen and vapour contamination.
This air tight container was brought in a nitrogen-filled glove
box at the Stanford Synchrotron Radiation Light Source
(SSRL) and opened inside the glove box.
A.2. In situ cell. An in situ XAS cell, developed by our
group for measurements of samples under reaction conditions
at elevated temperatures and flowing or static gas atmospheres,
was used.18,19 This cell was originally developed for transmission
XAS and for fluorescence yield XAS.
In this original reactor cell, the signal was disturbed by
scattered and fluorescence light of the interior wall of the
in situ cell. This disturbance can especially occur for samples
containing iron and other metals from the transition metal
group. To circumvent this disturbance, the application of a
gold coating of B40 micron thickness was used on both the
interior wall of the in situ cell as well as the cylinder with the
sample holder. This created a reactor cell with a completely
covered golden interior. The upper part of the cell accommo-
dates tubes for liquid nitrogen feed to cool the sample,
connections for a furnace and a thermocouple. On top a
reservoir for liquid nitrogen can be placed. The reaction
chamber usually is at ambient pressure and can be flushed
with gases. The cell is double-walled and can be water-cooled
to prevent the windows to be overheated and to prevent
condensation of water vapor on the windows during cooling
of the cell.
The sample holder has a slit (3 � 12 mm) for a pressed
sample wafer. The in situ cell can be used for transmission
measurements, for fluorescence and for XRS. The sample
holder is placed perpendicular or at an angle (351 to 601) to
the incoming beam. The fluorescent radiation emitted by the
sample is measured with a solid state detector perpendicular to
the direction of the incident beam, through the large window
in front. Both the entrance flanges and fluorescence window
are sealed by Kapton foil (25 mm).
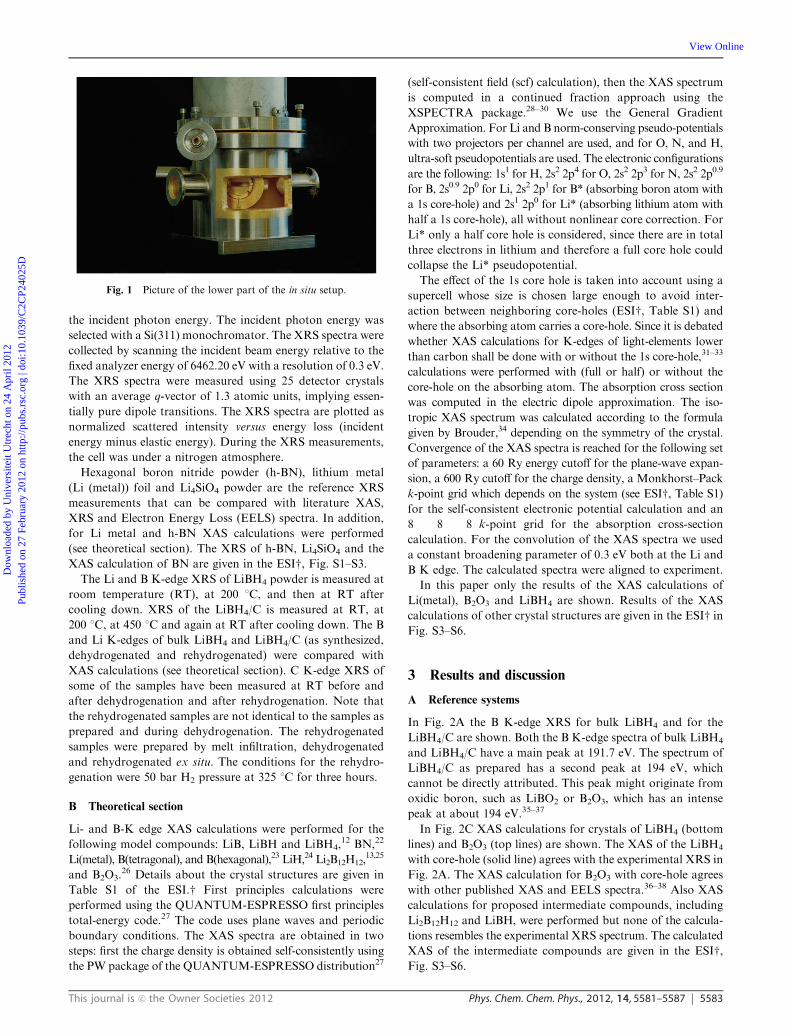
For our purpose of XRS experiments, the position of the
in situ cell has been optimized for a large solid angle of the
(high momentum transfer q) inelastic scattered X-rays through
a large exit window (see Fig. 1). The exit window is wide
enough to record the high and low q inelastic scattered X-rays
without changing the cell position.
For the XRS measurements, the samples were pressed in the
sample holder which was placed in the air tight in situ cell in a
nitrogen filled glove box available at the Stanford Synchrotron
Radiation Light Source (SSRL). The whole in situ cell was
then taken out of the glove box and taken to the beam line for
measurements.
A.3. X-Ray Raman spectroscopy measurements. Lithium
(Li), boron (B) and carbon (C) K-edge XRS spectra were
collected at SSRL beamline BL6-2 ES2. The in situ cell was
mounted on a pre-constructed plate, so that the in situ cell was
every time at exactly the same angle with reference to the
beam. The XRS scans were performed using the inverse energy
scan technique:20,21 the scattered photons are analyzed at
a fixed energy and the energy transfer is controlled by tuning
Dow
nloa
ded
by U
nive
rsite
it U
trec
ht o
n 24
Apr
il 20
12Pu
blis
hed
on 2
7 Fe
brua
ry 2
012
on h
ttp://
pubs
.rsc
.org
| do
i:10.
1039
/C2C
P240
25D
View Online
This journal is c the Owner Societies 2012 Phys. Chem. Chem. Phys., 2012, 14, 5581–5587 5583
the incident photon energy. The incident photon energy was
selected with a Si(311) monochromator. The XRS spectra were
collected by scanning the incident beam energy relative to the
fixed analyzer energy of 6462.20 eV with a resolution of 0.3 eV.
The XRS spectra were measured using 25 detector crystals
with an average q-vector of 1.3 atomic units, implying essen-
tially pure dipole transitions. The XRS spectra are plotted as
normalized scattered intensity versus energy loss (incident
energy minus elastic energy). During the XRS measurements,
the cell was under a nitrogen atmosphere.
Hexagonal boron nitride powder (h-BN), lithium metal
(Li (metal)) foil and Li4SiO4 powder are the reference XRS
measurements that can be compared with literature XAS,
XRS and Electron Energy Loss (EELS) spectra. In addition,
for Li metal and h-BN XAS calculations were performed
(see theoretical section). The XRS of h-BN, Li4SiO4 and the
XAS calculation of BN are given in the ESIw, Fig. S1–S3.The Li and B K-edge XRS of LiBH4 powder is measured at
room temperature (RT), at 200 1C, and then at RT after
cooling down. XRS of the LiBH4/C is measured at RT, at
200 1C, at 450 1C and again at RT after cooling down. The B
and Li K-edges of bulk LiBH4 and LiBH4/C (as synthesized,
dehydrogenated and rehydrogenated) were compared with
XAS calculations (see theoretical section). C K-edge XRS of
some of the samples have been measured at RT before and
after dehydrogenation and after rehydrogenation. Note that
the rehydrogenated samples are not identical to the samples as
prepared and during dehydrogenation. The rehydrogenated
samples were prepared by melt infiltration, dehydrogenated
and rehydrogenated ex situ. The conditions for the rehydro-
genation were 50 bar H2 pressure at 325 1C for three hours.
B Theoretical section
Li- and B-K edge XAS calculations were performed for the
following model compounds: LiB, LiBH and LiBH4,12 BN,22
Li(metal), B(tetragonal), and B(hexagonal),23 LiH,24 Li2B12H12,13,25
and B2O3.26 Details about the crystal structures are given in
Table S1 of the ESI.w First principles calculations were
performed using the QUANTUM-ESPRESSO first principles
total-energy code.27 The code uses plane waves and periodic
boundary conditions. The XAS spectra are obtained in two
steps: first the charge density is obtained self-consistently using
the PW package of the QUANTUM-ESPRESSO distribution27
(self-consistent field (scf) calculation), then the XAS spectrum
is computed in a continued fraction approach using the
XSPECTRA package.28–30 We use the General Gradient
Approximation. For Li and B norm-conserving pseudo-potentials
with two projectors per channel are used, and for O, N, and H,
ultra-soft pseudopotentials are used. The electronic configurations
are the following: 1s1 for H, 2s2 2p4 for O, 2s2 2p3 for N, 2s2 2p0.9
for B, 2s0.9 2p0 for Li, 2s2 2p1 for B* (absorbing boron atom with
a 1s core-hole) and 2s1 2p0 for Li* (absorbing lithium atom with
half a 1s core-hole), all without nonlinear core correction. For
Li* only a half core hole is considered, since there are in total
three electrons in lithium and therefore a full core hole could
collapse the Li* pseudopotential.
The effect of the 1s core hole is taken into account using a
supercell whose size is chosen large enough to avoid inter-
action between neighboring core-holes (ESIw, Table S1) and
where the absorbing atom carries a core-hole. Since it is debated
whether XAS calculations for K-edges of light-elements lower
than carbon shall be done with or without the 1s core-hole,31–33
calculations were performed with (full or half) or without the
core-hole on the absorbing atom. The absorption cross section
was computed in the electric dipole approximation. The iso-
tropic XAS spectrum was calculated according to the formula
given by Brouder,34 depending on the symmetry of the crystal.
Convergence of the XAS spectra is reached for the following set
of parameters: a 60 Ry energy cutoff for the plane-wave expan-
sion, a 600 Ry cutoff for the charge density, a Monkhorst–Pack
k-point grid which depends on the system (see ESIw, Table S1)
for the self-consistent electronic potential calculation and an
8 � 8 � 8 k-point grid for the absorption cross-section
calculation. For the convolution of the XAS spectra we used
a constant broadening parameter of 0.3 eV both at the Li and
B K edge. The calculated spectra were aligned to experiment.
In this paper only the results of the XAS calculations of
Li(metal), B2O3 and LiBH4 are shown. Results of the XAS
calculations of other crystal structures are given in the ESIw in
Fig. S3–S6.
3 Results and discussion
A Reference systems
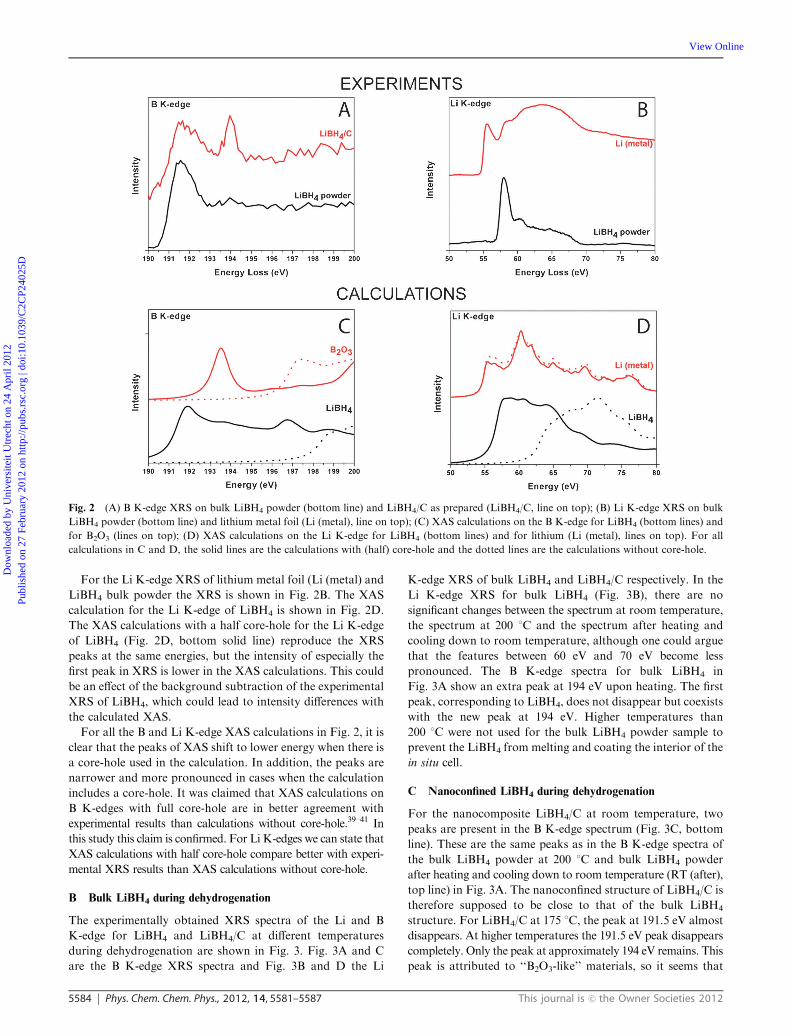
In Fig. 2A the B K-edge XRS for bulk LiBH4 and for the
LiBH4/C are shown. Both the B K-edge spectra of bulk LiBH4
and LiBH4/C have a main peak at 191.7 eV. The spectrum of
LiBH4/C as prepared has a second peak at 194 eV, which
cannot be directly attributed. This peak might originate from
oxidic boron, such as LiBO2 or B2O3, which has an intense
peak at about 194 eV.35–37
In Fig. 2C XAS calculations for crystals of LiBH4 (bottom
lines) and B2O3 (top lines) are shown. The XAS of the LiBH4
with core-hole (solid line) agrees with the experimental XRS in
Fig. 2A. The XAS calculation for B2O3 with core-hole agrees
with other published XAS and EELS spectra.36–38 Also XAS
calculations for proposed intermediate compounds, including
Li2B12H12 and LiBH, were performed but none of the calcula-
tions resembles the experimental XRS spectrum. The calculated
XAS of the intermediate compounds are given in the ESIw,Fig. S3–S6.
Fig. 1 Picture of the lower part of the in situ setup.
Dow
nloa
ded
by U
nive
rsite
it U
trec
ht o
n 24
Apr
il 20
12Pu
blis
hed
on 2
7 Fe
brua
ry 2
012
on h
ttp://
pubs
.rsc
.org
| do
i:10.
1039
/C2C
P240
25D
View Online
5584 Phys. Chem. Chem. Phys., 2012, 14, 5581–5587 This journal is c the Owner Societies 2012
For the Li K-edge XRS of lithium metal foil (Li (metal) and
LiBH4 bulk powder the XRS is shown in Fig. 2B. The XAS
calculation for the Li K-edge of LiBH4 is shown in Fig. 2D.
The XAS calculations with a half core-hole for the Li K-edge
of LiBH4 (Fig. 2D, bottom solid line) reproduce the XRS
peaks at the same energies, but the intensity of especially the
first peak in XRS is lower in the XAS calculations. This could
be an effect of the background subtraction of the experimental
XRS of LiBH4, which could lead to intensity differences with
the calculated XAS.
For all the B and Li K-edge XAS calculations in Fig. 2, it is
clear that the peaks of XAS shift to lower energy when there is
a core-hole used in the calculation. In addition, the peaks are
narrower and more pronounced in cases when the calculation
includes a core-hole. It was claimed that XAS calculations on
B K-edges with full core-hole are in better agreement with
experimental results than calculations without core-hole.39–41 In
this study this claim is confirmed. For Li K-edges we can state that
XAS calculations with half core-hole compare better with experi-
mental XRS results than XAS calculations without core-hole.
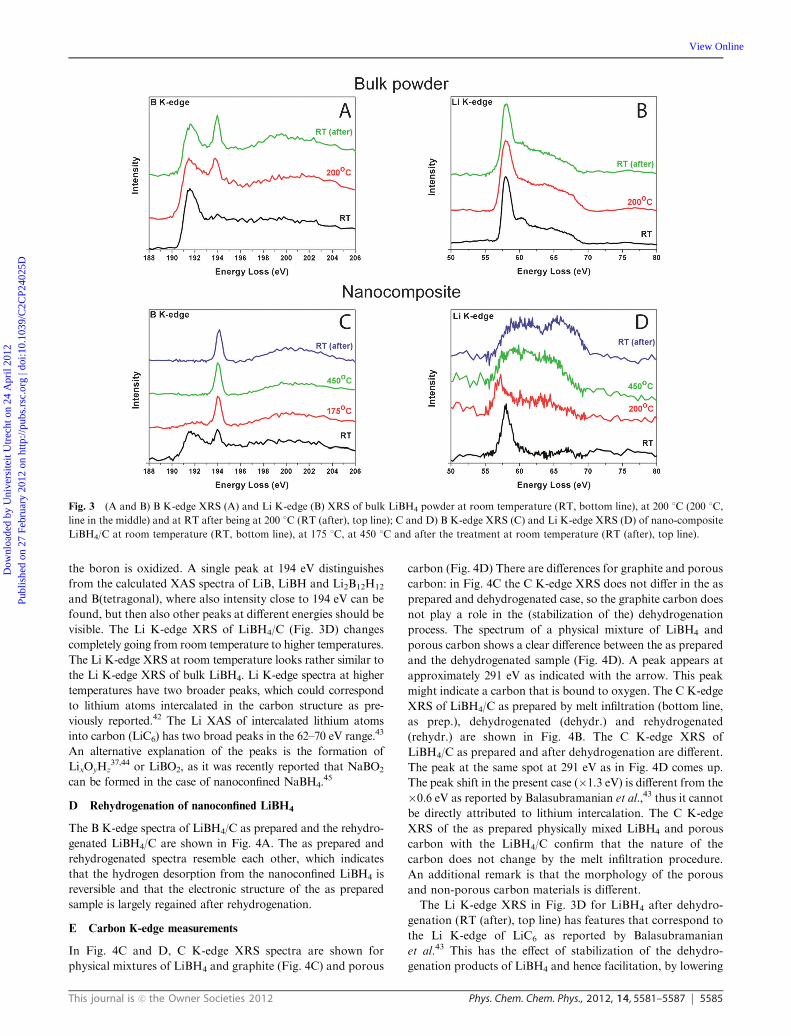
B Bulk LiBH4 during dehydrogenation
The experimentally obtained XRS spectra of the Li and B
K-edge for LiBH4 and LiBH4/C at different temperatures
during dehydrogenation are shown in Fig. 3. Fig. 3A and C
are the B K-edge XRS spectra and Fig. 3B and D the Li
K-edge XRS of bulk LiBH4 and LiBH4/C respectively. In the
Li K-edge XRS for bulk LiBH4 (Fig. 3B), there are no
significant changes between the spectrum at room temperature,
the spectrum at 200 1C and the spectrum after heating and
cooling down to room temperature, although one could argue
that the features between 60 eV and 70 eV become less
pronounced. The B K-edge spectra for bulk LiBH4 in
Fig. 3A show an extra peak at 194 eV upon heating. The first
peak, corresponding to LiBH4, does not disappear but coexists
with the new peak at 194 eV. Higher temperatures than
200 1C were not used for the bulk LiBH4 powder sample to
prevent the LiBH4 from melting and coating the interior of the
in situ cell.
C Nanoconfined LiBH4 during dehydrogenation
For the nanocomposite LiBH4/C at room temperature, two
peaks are present in the B K-edge spectrum (Fig. 3C, bottom
line). These are the same peaks as in the B K-edge spectra of
the bulk LiBH4 powder at 200 1C and bulk LiBH4 powder
after heating and cooling down to room temperature (RT (after),
top line) in Fig. 3A. The nanoconfined structure of LiBH4/C is
therefore supposed to be close to that of the bulk LiBH4
structure. For LiBH4/C at 175 1C, the peak at 191.5 eV almost
disappears. At higher temperatures the 191.5 eV peak disappears
completely. Only the peak at approximately 194 eV remains. This
peak is attributed to ‘‘B2O3-like’’ materials, so it seems that
Fig. 2 (A) B K-edge XRS on bulk LiBH4 powder (bottom line) and LiBH4/C as prepared (LiBH4/C, line on top); (B) Li K-edge XRS on bulk
LiBH4 powder (bottom line) and lithium metal foil (Li (metal), line on top); (C) XAS calculations on the B K-edge for LiBH4 (bottom lines) and
for B2O3 (lines on top); (D) XAS calculations on the Li K-edge for LiBH4 (bottom lines) and for lithium (Li (metal), lines on top). For all
calculations in C and D, the solid lines are the calculations with (half) core-hole and the dotted lines are the calculations without core-hole.
Dow
nloa
ded
by U
nive
rsite
it U
trec
ht o
n 24
Apr
il 20
12Pu
blis
hed
on 2
7 Fe
brua
ry 2
012
on h
ttp://
pubs
.rsc
.org
| do
i:10.
1039
/C2C
P240
25D
View Online
This journal is c the Owner Societies 2012 Phys. Chem. Chem. Phys., 2012, 14, 5581–5587 5585
the boron is oxidized. A single peak at 194 eV distinguishes
from the calculated XAS spectra of LiB, LiBH and Li2B12H12
and B(tetragonal), where also intensity close to 194 eV can be
found, but then also other peaks at different energies should be
visible. The Li K-edge XRS of LiBH4/C (Fig. 3D) changes
completely going from room temperature to higher temperatures.
The Li K-edge XRS at room temperature looks rather similar to
the Li K-edge XRS of bulk LiBH4. Li K-edge spectra at higher
temperatures have two broader peaks, which could correspond
to lithium atoms intercalated in the carbon structure as pre-
viously reported.42 The Li XAS of intercalated lithium atoms
into carbon (LiC6) has two broad peaks in the 62–70 eV range.43
An alternative explanation of the peaks is the formation of
LixOyHz37,44 or LiBO2, as it was recently reported that NaBO2
can be formed in the case of nanoconfined NaBH4.45
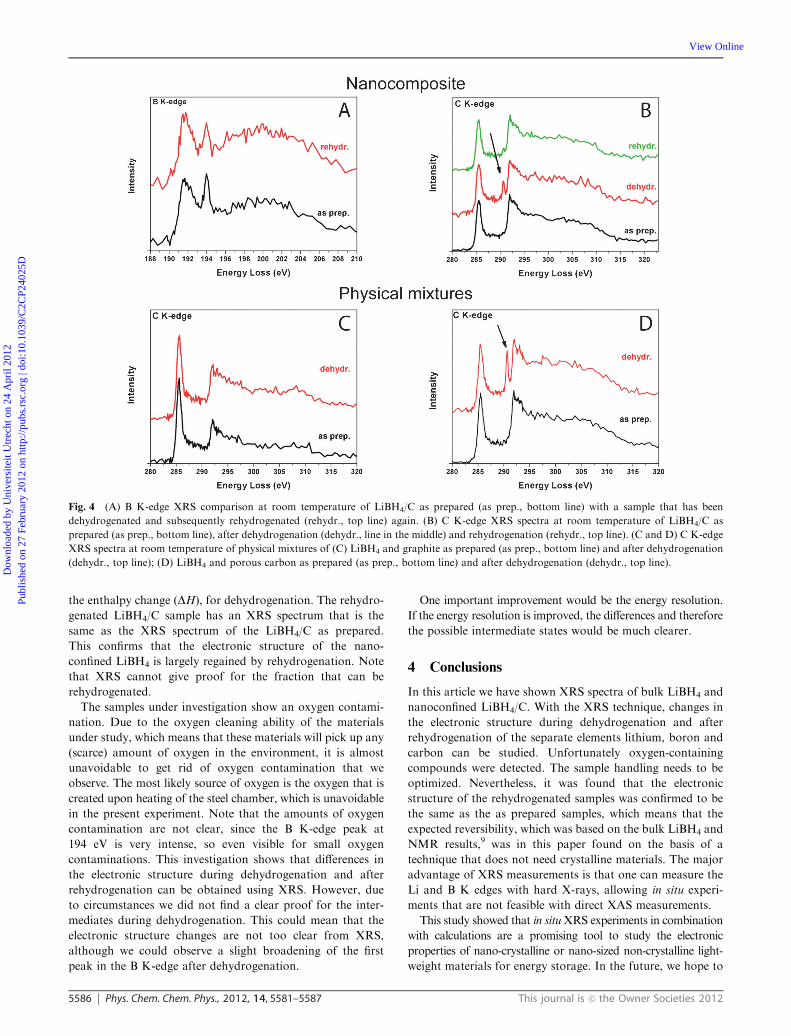
D Rehydrogenation of nanoconfined LiBH4
The B K-edge spectra of LiBH4/C as prepared and the rehydro-
genated LiBH4/C are shown in Fig. 4A. The as prepared and
rehydrogenated spectra resemble each other, which indicates
that the hydrogen desorption from the nanoconfined LiBH4 is
reversible and that the electronic structure of the as prepared
sample is largely regained after rehydrogenation.
E Carbon K-edge measurements
In Fig. 4C and D, C K-edge XRS spectra are shown for
physical mixtures of LiBH4 and graphite (Fig. 4C) and porous
carbon (Fig. 4D) There are differences for graphite and porous
carbon: in Fig. 4C the C K-edge XRS does not differ in the as
prepared and dehydrogenated case, so the graphite carbon does
not play a role in the (stabilization of the) dehydrogenation
process. The spectrum of a physical mixture of LiBH4 and
porous carbon shows a clear difference between the as prepared
and the dehydrogenated sample (Fig. 4D). A peak appears at
approximately 291 eV as indicated with the arrow. This peak
might indicate a carbon that is bound to oxygen. The C K-edge
XRS of LiBH4/C as prepared by melt infiltration (bottom line,
as prep.), dehydrogenated (dehydr.) and rehydrogenated
(rehydr.) are shown in Fig. 4B. The C K-edge XRS of
LiBH4/C as prepared and after dehydrogenation are different.
The peak at the same spot at 291 eV as in Fig. 4D comes up.
The peak shift in the present case (�1.3 eV) is different from the
�0.6 eV as reported by Balasubramanian et al.,43 thus it cannot
be directly attributed to lithium intercalation. The C K-edge
XRS of the as prepared physically mixed LiBH4 and porous
carbon with the LiBH4/C confirm that the nature of the
carbon does not change by the melt infiltration procedure.
An additional remark is that the morphology of the porous
and non-porous carbon materials is different.
The Li K-edge XRS in Fig. 3D for LiBH4 after dehydro-
genation (RT (after), top line) has features that correspond to
the Li K-edge of LiC6 as reported by Balasubramanian
et al.43 This has the effect of stabilization of the dehydro-
genation products of LiBH4 and hence facilitation, by lowering
Fig. 3 (A and B) B K-edge XRS (A) and Li K-edge (B) XRS of bulk LiBH4 powder at room temperature (RT, bottom line), at 200 1C (200 1C,
line in the middle) and at RT after being at 200 1C (RT (after), top line); C and D) B K-edge XRS (C) and Li K-edge XRS (D) of nano-composite
LiBH4/C at room temperature (RT, bottom line), at 175 1C, at 450 1C and after the treatment at room temperature (RT (after), top line).
Dow
nloa
ded
by U
nive
rsite
it U
trec
ht o
n 24
Apr
il 20
12Pu
blis
hed
on 2
7 Fe
brua
ry 2
012
on h
ttp://
pubs
.rsc
.org
| do
i:10.
1039
/C2C
P240
25D
View Online
5586 Phys. Chem. Chem. Phys., 2012, 14, 5581–5587 This journal is c the Owner Societies 2012
the enthalpy change (DH), for dehydrogenation. The rehydro-
genated LiBH4/C sample has an XRS spectrum that is the
same as the XRS spectrum of the LiBH4/C as prepared.
This confirms that the electronic structure of the nano-
confined LiBH4 is largely regained by rehydrogenation. Note
that XRS cannot give proof for the fraction that can be
rehydrogenated.
The samples under investigation show an oxygen contami-
nation. Due to the oxygen cleaning ability of the materials
under study, which means that these materials will pick up any
(scarce) amount of oxygen in the environment, it is almost
unavoidable to get rid of oxygen contamination that we
observe. The most likely source of oxygen is the oxygen that is
created upon heating of the steel chamber, which is unavoidable
in the present experiment. Note that the amounts of oxygen
contamination are not clear, since the B K-edge peak at
194 eV is very intense, so even visible for small oxygen
contaminations. This investigation shows that differences in
the electronic structure during dehydrogenation and after
rehydrogenation can be obtained using XRS. However, due
to circumstances we did not find a clear proof for the inter-
mediates during dehydrogenation. This could mean that the
electronic structure changes are not too clear from XRS,
although we could observe a slight broadening of the first
peak in the B K-edge after dehydrogenation.
One important improvement would be the energy resolution.
If the energy resolution is improved, the differences and therefore
the possible intermediate states would be much clearer.
4 Conclusions
In this article we have shown XRS spectra of bulk LiBH4 and
nanoconfined LiBH4/C. With the XRS technique, changes in
the electronic structure during dehydrogenation and after
rehydrogenation of the separate elements lithium, boron and
carbon can be studied. Unfortunately oxygen-containing
compounds were detected. The sample handling needs to be
optimized. Nevertheless, it was found that the electronic
structure of the rehydrogenated samples was confirmed to be
the same as the as prepared samples, which means that the
expected reversibility, which was based on the bulk LiBH4 and
NMR results,9 was in this paper found on the basis of a
technique that does not need crystalline materials. The major
advantage of XRS measurements is that one can measure the
Li and B K edges with hard X-rays, allowing in situ experi-
ments that are not feasible with direct XAS measurements.
This study showed that in situXRS experiments in combination
with calculations are a promising tool to study the electronic
properties of nano-crystalline or nano-sized non-crystalline light-
weight materials for energy storage. In the future, we hope to
Fig. 4 (A) B K-edge XRS comparison at room temperature of LiBH4/C as prepared (as prep., bottom line) with a sample that has been
dehydrogenated and subsequently rehydrogenated (rehydr., top line) again. (B) C K-edge XRS spectra at room temperature of LiBH4/C as
prepared (as prep., bottom line), after dehydrogenation (dehydr., line in the middle) and rehydrogenation (rehydr., top line). (C and D) C K-edge
XRS spectra at room temperature of physical mixtures of (C) LiBH4 and graphite as prepared (as prep., bottom line) and after dehydrogenation
(dehydr., top line); (D) LiBH4 and porous carbon as prepared (as prep., bottom line) and after dehydrogenation (dehydr., top line).
Dow
nloa
ded
by U
nive
rsite
it U
trec
ht o
n 24
Apr
il 20
12Pu
blis
hed
on 2
7 Fe
brua
ry 2
012
on h
ttp://
pubs
.rsc
.org
| do
i:10.
1039
/C2C
P240
25D
View Online
This journal is c the Owner Societies 2012 Phys. Chem. Chem. Phys., 2012, 14, 5581–5587 5587
study more relevant reference systems and find the route of
de- and re-hydrogenation for both the bulk LiBH4 and nano-
confined LiBH4/C.
Acknowledgements
The Stanford Synchrotron Radiation Lightsource is a National
User Facility operated by Stanford University on behalf of the
U.S. Department of Energy, Office of Basic Energy Sciences.
Matteo Calandra is acknowledged for providing the B and Li
pseudopotentials with and without a (half) core-hole. PSM and
FMFdG acknowledge NWO-CW/Vici for financial support. PN
and PEdJ acknowledge NWO-CW/Vidi 016.072.316 for financial
support. Timcal Switzerland is acknowledged for the provision of
the graphite and porous carbon.
References
1 E. de Smit, I. Swart, J. F. Creemer, G. H. Hoveling, M. K. Gilles,T. Tyliszczak, P. J. Kooyman, H. W. Zandbergen, C. Morin,B. M. Weckhuysen and F. M. F. de Groot, Nature, 2008, 456,222–225.
2 J. F. Creemer, S. Helveg, G. H. Hoveling, S. Ullmann, A. M.Molenbroek, P. M. Sarro and H. W. Zandbergen, Ultramicroscopy,2008, 108, 993–998.
3 A. Knop-Gericke, M. Havecker, T. Neisius and T. Schedel-Niedrig,Nucl. Instrum. Methods Phys. Res., Sect. A, 1998, 406, 311–322.
4 F. M. F. de Groot, M. A. Arrio, P. Sainctavit, C. Cartier andC. T. Chen, Solid State Commun., 1994, 92, 991–995.
5 M. Krisch and F. Sette, Surf. Rev. Lett., 2002, 9, 969–976.6 M. H. Krisch, F. Sette, C. Masciovecchio and R. Verbeni, Phys.Rev. Lett., 1997, 78, 2843–2846.
7 U. Bergmann, P. Glatzel and S. P. Cramer, Microchem. J., 2002,71, 221–230.
8 A. Zuttel, P. Wenger, S. Rentsch, P. Sudan, P. Mauron andC. Emmenegger, J. Power Sources, 2003, 118, 1–7.
9 S.-I. Orimo, Y. Nakamori, N. Ohba, K. Miwa, M. Aoki,S. Towata and A. Zuttel, Appl. Phys. Lett., 2006, 89, 021920.
10 S.-J. Hwang, R. C. Bowman Jr., J. W. Reiter, J. Rijssenbeek,G. L. Soloveichik, J.-C. Zhao, H. Kabbour and C. C. Ahn, J. Phys.Chem. C, 2008, 112, 3164–3169.
11 R. Caputo and A. Zuttel, Mol. Phys., 2010, 108, 1263–1276.12 J. K. Kang, S. Y. Kim, Y. S. Han, R. P. Muller and W. A. Goddard
III, Appl. Phys. Lett., 2005, 87, 1–3.13 N. Ohba, K.Miwa,M. Aoki, T. Noritake, S.-I. Towata, Y. Nakamori,
S.-I. Orimo and A. Zuttel, Phys. Rev. B: Condens. Matter, 2006,74, 075110.
14 P. Adelhelm and P. E. de Jongh, J.Mater. Chem., 2011, 21, 2417–2427.15 P. E. de Jongh and P. Adelhelm, ChemSusChem, 2010, 3, 1332–1348.16 A. F. Gross, J. J. Vajo, S. L. Van Atta and G. L. Olson, J. Phys.
Chem. C, 2008, 112, 5651–5657.17 P. Ngene, R. Van Zwienen and P. E. de Jongh, Chem. Commun.,
2010, 46, 8201–8203.18 M. Vaarkamp, B. L. Mojet, M. J. Kappers, J. T. Miller and
D. C. Koningsberger, J. Phys. Chem., 1995, 99, 16067–16075.19 W. M. Heijboer, D. C. Koningsberger, B. M. Weckhuysen and
F. M. F. de Groot, Catal. Today, 2005, 100, 228.
20 W. Schulke and H. Nagasawa, Nucl. Instrum. Methods Phys. Res.,1984, 222, 203–206.
21 K. Hamalainen, S. Manninen, C.-C. Kao,W. Caliebe, J. B. Hastings,A. Bansil, S. Kaprzyk and P. M. Platzman, Phys. Rev. B: Condens.Matter, 1996, 54, 5453–5459.
22 R. S. Pease, Acta Crystallogr., 1952, 5, 356–361.23 WWW-MINCRYST (2011), http://database.iem.ac.ru/mincryst.24 http://www.oxmat.co.uk/Crysdata/lih.htm.25 J.-H. Her, M. Yousufuddin, W. Zhou, S. S. Jalisatgi, J. G. Kulleck,
J. A. Zan, S.-J. Hwang, R. C. Bowman Jr. and T. J. Udovic, Inorg.Chem., 2008, 47, 9757–9759.
26 H. Effenberger, C. L. Lengauer and E. Parthe, Monatsh. Chem.,2001, 132, 1515–1517.
27 P. Giannozzi, S. Baroni, N. Bonini, M. Calandra, R. Car, C. Cavazzoni,D. Ceresoli, G. L. Chiarotti, M. Cococcioni, I. Dabo, A. Dal Corso,S. De Gironcoli, S. Fabris, G. Fratesi, R. Gebauer, U. Gerstmann,C. Gougoussis, A. Kokalj, M. Lazzeri, L. Martin-Samos, N. Marzari,F. Mauri, R. Mazzarello, S. Paolini, A. Pasquarello, L. Paulatto,C. Sbraccia, S. Scandolo, G. Sclauzero, A. P. Seitsonen,A. Smogunov, P. Umari and R. M. Wentzcovitch, J. Phys.:Condens. Matter, 2009, 21, 395502.
28 C. Gougoussis, M. Calandra, A. Seitsonen, C. Brouder, A. Shukla,F. Mauri, ArXiv:0806.4706v1, 2008.
29 C. Gougoussis, M. Calandra, A. P. Seitsonen and F. Mauri,Phys. Rev. B: Condens. Matter, 2009, 80, 075102.
30 M. Taillefumier, D. Cabaret, A.-M. Flank and F. Mauri, Phys.Rev. B: Condens. Matter, 2002, 66, 1951071–1951078.
31 J. A. McLeod, R. G. Wilks, N. A. Skorikov, L. D. Finkelstein,M. Abu-Samak, E. Z. Kurmaev and A. Moewes, Phys. Rev. B:Condens. Matter, 2010, 81, 245123.
32 V. Mauchamp, M. Jaouen and P. Schattschneider, Phys. Rev. B:Condens. Matter, 2009, 79, 235106.
33 S.-P. Gao, C. J. Pickard, M. C. Payne, J. Zhu and J. Yuan,Phys. Rev. B: Condens. Matter, 2008, 77, 115122.
34 C. Brouder, J. Phys.: Condens. Matter, 1990, 2, 701–738.35 D. Li, G. M. Bancroft, M. E. Fleet, P. C. Hess and Z. F. Yin,
Am. Mineral., 1995, 80, 873–877.36 C.-G. Lee, H.-J. Sohn and M. G. Kim, Solid State Ionics, 2005,
176, 1237–1241.37 S. K. Lee, P. J. Eng, H.-k. Mao, Y. Meng and J. Shu, Phys. Rev. Lett.,
2007, 98, 105502.38 R. Arenal, F. de la Pena, O. Stephan, M. Walls, M. Tence,
A. Loiseau and C. Colliex, Ultramicroscopy, 2008, 109, 32–38.39 S.-P. Gao, C. J. Pickard, A. Perlov and V. Milman, J. Phys.:
Condens. Matter, 2009, 21, 104203.40 D. N. Jayawardane, C. J. Pickard, L. M. Brown and M. C. Payne,
Phys. Rev. B: Condens. Matter, 2001, 64, 1151071–1151074.41 A. Mattila, J. A. Soininen, S. Galambosi, S. Huotari, G. Vanko,
N. D. Zhigadlo, J. Karpinski and K. Hamalainen, Phys. Rev. Lett.,2005, 94, 1–4.
42 P. Ngene, M. H. W. Verkuijlen, Q. Zheng, J. Kragten, P. J. M.van Bentum, J. H. Bitter and P. E. de Jongh, Faraday Discuss.,2011, 151, 47–58.
43 M. Balasubramanian, C. S. Johnson, J. O. Cross, G. T. Seidler,T. T. Fister, E. A. Stern, C. Hamner and S. O. Mariager, Appl.Phys. Lett., 2007, 91, 031904.
44 J. Tsuji, H. Nakamatsu, T. Mukoyama, K. Kojima, S. Ikeda andK. Taniguchi, X-Ray Spectrom., 2002, 31, 319–326.
45 P. Ngene, R. Van Den Berg, M. H. W. Verkuijlen, K. P.De Jong and P. E. de Jongh, Energy Environ. Sci., 2011, 4,4108–4115.
Dow
nloa
ded
by U
nive
rsite
it U
trec
ht o
n 24
Apr
il 20
12Pu
blis
hed
on 2
7 Fe
brua
ry 2
012
on h
ttp://
pubs
.rsc
.org
| do
i:10.
1039
/C2C
P240
25D
View Online
Related Documents