ITER VACUUM VESSEL DYNAMIC STRESS ANALYSIS OF A DISRUPTION* B. W. Riemer, D. L. Conner, D. J. Strickler, D. E. Williamson Oak Ridge National Laboratory, P.O. Box 2008, Oak Ridge, Tennessee, 3783 1-6332, U.S.A. Dynamic stress analysis of the International Thermonuclear Experimental Reactor vacuum vessel load disruption forces was performed. The deformation and stress results showed strong inertial effects when compared to static analyses. Maximum stress predicted dynamically was 300 MPa, but stress shown by static analysis from loads at the same point in time reached only 80 MPa. The analysis also provided a reaction load history in the vessel's supports which is essential in evaluating support design. The disruption forces were estimated by assuming a 25-MA plasma current decaying at 1 MA/ms while moving vertically. In addition to forces developed within the vessel, vertical loadings from the first wall / strong back assemblies and the divertor were applied to the vessel at their attachment points. The first 50 natural modes were also determined. The first mode's frequency was 6.0 Hz, and its shape is characterized by vertical displacement of the vessel inner leg. The predicted deformation of the vessel appeared similar to its first mode shape combined with radial contraction. Kinetic energy history from the analysis also correlated with the first mode frequency. 1. INTRODUCTION Dynamic effects can be very important for estimating stresses in a tokamak's vacuum vessel when loads generated by plasma disruptions are considered. Performing the structural analysis using static methods from loads at apparent maximum load times can give misleading answers. However, greater effort is needed to perform dynamic analysis, both in terms of computation time and work-hours expended in model setup and result postprocessing. As part of Oak Ridge National Laboratory's (ORNL's) role in the International Thermonuclear Experimental Reactor (ITER), dynamic stress analyses of the vacuum vessel were performed. This work has been limited to vertical plasma disruptions with loading that is symmetric with respect to each vessel segment. Disruption loads were estimated with the EDDYCUFF code under related ORNL work for ITER [l]. Loads resulting from a specific plasma disruption based on a vertically displacing, 25-MA initial current decaying at 1 MAIms were used for this stress analysis. No loadings other than disruption loads were applied as part of this task. An initial study was conducted to evaluate the dynamic analysis options of the finite element code being used, ABAQUS. The options were modal superposition, direct integration, and explicit dynamics. Direct integration was ultimately selected for the analysis because of poor results with modal superposition,while the explicit dynamics option was available only for a limited time. 2. MODEL DESCRIPTION AND ASSUMPTIONS The ITER vacuum vessel configuration analyzed is a double-walled structure made from Inconel 625. Inner and outer walls are 30 mm thick, and the space between walls varies from about 500 to 700 mm. Ribs separating the walls have thicknesses of 10 or 15 mm. Inner and outer legs of the vessel lie at machine radii of about 4.0 m and 12.6 m, while vessel height is about 13.8 m. The vessel torus is comprised of 24 identical segments. A large port opening at the top of each segment has a partial cover, a horizontal port *Based on work performed at Oak Ridge National Laboratory, managed for the U.S. Department of Energy under contract DE-AC05-84OR21400 with Martin Marietta Energy Systems, Inc.

Welcome message from author
This document is posted to help you gain knowledge. Please leave a comment to let me know what you think about it! Share it to your friends and learn new things together.
Transcript

ITER VACUUM VESSEL DYNAMIC STRESS ANALYSIS OF A DISRUPTION*
B. W. Riemer, D. L. Conner, D. J. Strickler, D. E. Williamson
Oak Ridge National Laboratory, P.O. Box 2008, Oak Ridge, Tennessee, 3783 1-6332, U.S.A.
Dynamic stress analysis of the International Thermonuclear Experimental Reactor vacuum vessel load disruption forces was performed. The deformation and stress results showed strong inertial effects when compared to static analyses. Maximum stress predicted dynamically was 300 MPa, but stress shown by static analysis from loads at the same point in time reached only 80 MPa. The analysis also provided a reaction load history in the vessel's supports which is essential in evaluating support design. The disruption forces were estimated by assuming a 25-MA plasma current decaying at 1 MA/ms while moving vertically. In addition to forces developed within the vessel, vertical loadings from the first wall / strong back assemblies and the divertor were applied to the vessel at their attachment points.
The first 50 natural modes were also determined. The first mode's frequency was 6.0 Hz, and its shape is characterized by vertical displacement of the vessel inner leg. The predicted deformation of the vessel appeared similar to its first mode shape combined with radial contraction. Kinetic energy history from the analysis also correlated with the first mode frequency.
1. INTRODUCTION
Dynamic effects can be very important for estimating stresses in a tokamak's vacuum vessel when loads generated by plasma disruptions are considered. Performing the structural analysis using static methods from loads at apparent maximum load times can give misleading answers. However, greater effort is needed to perform dynamic analysis, both in terms of computation time and work-hours expended in model setup and result postprocessing. As part of Oak Ridge National Laboratory's (ORNL's) role in the International Thermonuclear Experimental Reactor (ITER), dynamic stress analyses of the vacuum vessel were performed. This work has been limited to vertical plasma disruptions with loading that is symmetric with respect to each vessel segment.
Disruption loads were estimated with the EDDYCUFF code under related ORNL work for ITER [l]. Loads resulting from a specific plasma disruption based on a vertically displacing, 25-MA initial current decaying at 1 MAIms were used for this stress analysis. No loadings other than disruption
loads were applied as part of this task. An initial study was conducted to evaluate the
dynamic analysis options of the finite element code being used, ABAQUS. The options were modal superposition, direct integration, and explicit dynamics. Direct integration was ultimately selected for the analysis because of poor results with modal superposition, while the explicit dynamics option was available only for a limited time.
2. MODEL DESCRIPTION AND ASSUMPTIONS
The ITER vacuum vessel configuration analyzed is a double-walled structure made from Inconel 625. Inner and outer walls are 30 mm thick, and the space between walls varies from about 500 to 700 mm. Ribs separating the walls have thicknesses of 10 or 15 mm. Inner and outer legs of the vessel lie at machine radii of about 4.0 m and 12.6 m, while vessel height is about 13.8 m. The vessel torus is comprised of 24 identical segments. A large port opening at the top of each segment has a partial cover, a horizontal port
*Based on work performed at Oak Ridge National Laboratory, managed for the U.S. Department of Energy under contract DE-AC05-84OR21400 with Martin Marietta Energy Systems, Inc.

extension just above midplane, and an inclined port extension for divertor access.
Shielding material, consisting of steel balls flooded with water, fills the space between vessel walls. Each vessel segment has one lower and two outer supports that attach to the magnet structure. The inner first wall / strong back (FW/SB) component attaches to the base of the inner leg at two points, while the outer component attaches to the outer leg at four points above the divertor port.
A finite element model of a 15" vessel segment was made and is shown in Figure 1. Symmetry was applied by making the appropriate kinematic relationships between corresponding nodes on symmetry faces of the segment. The vessel supports were modelled with shear deformable beam elements pinned at both ends to allow rotation about the toroidal direction. No structure below the supports was modelled. The lower support has a 20 by 40-cm cross section, while the two upper supports are 30 by 40 cm.
Figure 1. Finite element model
All material behavior was assumed linear elastic. Structural damping was implemented by imposing mass and stiffness proportional damping based on an assumed level of 5% of critical over a frequency range from 6 to 500 Hz.
Shielding trapped between vessel walls was accounted for in mass only by adjusting the density of vessel elements. Fluid/structural interaction effects were ignored.
A time history plot of vessel summary loads is shown in Figure 2. Note that local load peaks can be hidden by this type of plot because the vessel can have equal but opposite direction loading. Preprocessing techniques were developed to sum loads over specific regions of the vessel and to calculate moments about arbitrary axes. Region-specific forces and moments can provide better insight into vessel deformation.
0.00 0.03 0.06 0.09 0.12 0.15 0.18 TIME [SI
Figure 2. Vessel forces per segment
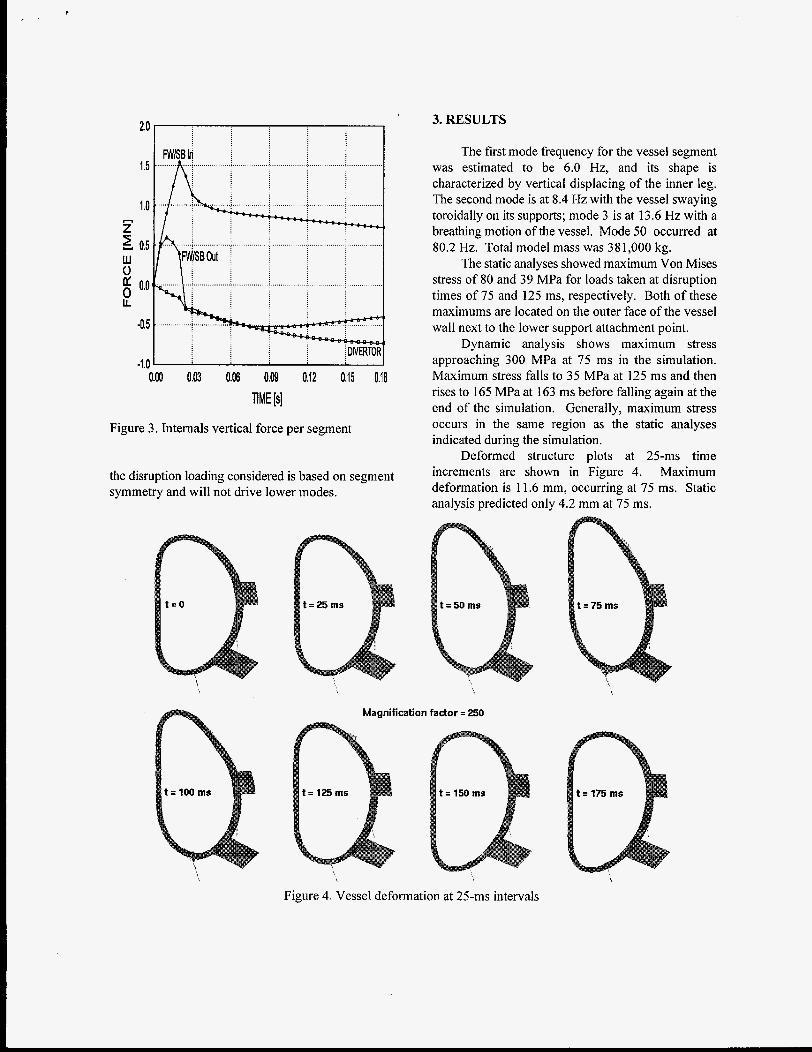
The FW/SB and divertor components were not included in the model, except for mass elements added at the FW/SB attachment points. Estimated mass of a 15 segment of the inboard FW/SB was 40,000 kg, and outboard was 120,000 kg. Vertical loading for the internal components was applied as illustrated in Figure 3.
The dynamic analysis used a time step of 1.25 ms. Result sensitivity to time step was investigated before choosing this step. Two static stress analyses were performed from loads at 75 and 125 ms.
The first 50 natural mode shapes were determined. These are not utilized by the direct integration method but are useful in assessing the deformation of the structure. The fmite element model can predict only modes that follow the segmenting of the vessel. Lower order modes of the torus are not predicted with this model. However,
2.0 I I 3. RESULTS
0.00 0.03 0.06 0.09 0.12 0.15 0.18 TIME [s]
Figure 3. Internals vertical force per segment
the disruption loading considered is based on segment symmetry and will not drive lower modes.
The first mode frequency for the vessel segment was estimated to be 6.0 Hz, and its shape is characterized by vertical displacing of the inner leg. The second mode is at 8.4 Hz with the vessel swaying toroidally on its supports; mode 3 is at 13.6 Hz with a breathing motion of the vessel. Mode 50 occurred at 80.2 Hz. Total model mass was 38 1,000 kg.
The static analyses showed maximum Von Mises stress of 80 and 39 MPa for loads taken at disruption times of 75 and 125 ms, respectively. Both of these maximums are located on the outer face of the vessel wall next to the lower support attachment point.
Dynamic analysis shows maximum stress approaching 300 MPa at 75 ms in the simulation. Maximum stress falls to 35 MPa at 125 ms and then rises to 165 MPa at 163 ms before falling again at the end of the simulation. Generally, maximum stress occurs in the same region as the static analyses indicated during the simulation.
Deformed structure plots at 25-ms time increments are shown in Figure 4. Maximum deformation is 11.6 mm, occurring at 75 ms. Static analysis predicted only 4.2 mm at 75 ms.
Magnification factor = 250
Figure 4. Vessel deformation at 25-ms intervals

An energy history plot is given in Figure 5 . The strain energy curve is similar to the histories of maximum stress and maximum deformation. The plot illustrates that most of the work put into the vessel goes into kinetic and strain energy. Kinetic energy shows a period of 83 ms, or a frequency of 12.1 Hz. This correlates well with the first mode frequency when one considers velocity magnitude peaks twice per displacement cycle. Energy balance gives an indication of solution error.
12
10
8
- 6 &
OI
w
7
G 4 $ 2
0
-2 0.00 0.M 0.04 0.06 0.08 0.10 0.12 0.14 0.16 0.18
TIME [SI Figure 5 . Energy history
Yield strength of annealed Inconel 625 at room temperature is about 4 10 MPa. The maximum stress reached 73% of this, so the assumption of elastic material behavior was reasonable within model limits. How this level compares to a design allowable for ITER was not determined. Peak stress may be overestimated because of the single point attachment of the lower support to the vessel.
An indicator of the poor performance of the static analysis is the ratio of dynamic maximum stress to static. At 75 ms this ratio is 3.74. Another indication is illustrated in Figure 6, which compares total vertical loading to total vertical reaction at the vessel supports. Static analysis would produce reactions that mirror the applied load (reactions are opposite sense of load).
0.00 0.02 0.04 0.06 0.08 0.10 Od2 014 0.16 0.18 TIME [s]
Figure 6. Vertical loading and reaction force
4. CONCLUSION
Dynamic analysis of the ITER vacuum vessel loaded by disruption forces from a I-MA/ms vertical disruption was successfully performed. The deformation and stress results showed strong dynamic effects when compared to static analyses. As an example, dynamic analysis estimated maximum stress to be 300 MPa, while stress shown by static analysis from loads at the same point in time reached only 80 MPa. Reactions at the vessel supports to vertical loading also illustrated the effect.
Although static analysis can be done in a relatively short time, this work verified that ignoring the vessel inertia and the temporal nature of the disruption loading can give poor results.
REFERENCES
1. D. E. Williamson, D. J. Strickler, D. L. Conner, B. E. Nelson, R. 0. Sayer, "Electromagnetic Loads on In-Vessel Components," ITER Report NO. ITER/US/93/INV-VV-04, 1993
DISCLAIMER
This report was prepared as an account of work sponsored by an agency of the United States Government. Neither the United States Government nor any agency thereof, nor any of their employees, makes any warranty, express or implied, or assumes any legal liability or responsi- bility for the accuracy, completeness, or usefulness of any information, apparatus, product, or process disclosed, or represents that its use would not infringe privately owned rights. Refer- ence herein to any specific commercial product, process, or service by trade name, trademark, manufacturer, or otherwise does not necessarily constitute or imply its endorsement, recom- mendation, or favoring by the United States Government or any agency thereof. The views and opinions of authors expressed herein do not necessarily state or reflect those of the United States Government or any agency thereof.
Related Documents