Board Meeting | 26 August 2014 Agenda item no.9 Open Session Public Transport Monthly Patronage – July 2014 Recommendations That the Board: i. Notes the paper. Executive summary Auckland public transport patronage totalled 72,740,387 passengers for the 12 months to Jul- 2014, an increase of +0.5% on the 12 months to Jun-2014 and +5.9% on the 12 months to Jul- 2013. July monthly patronage was 6,268,752, an increase of 343,651 boardings or +5.8% on Jul-2013, normalised to ~ +5.4% accounting for additional special event patronage only, same number of business and weekend days in Jul-2014 compared to Jul-2013. Rail patronage totalled 11,552,643 passengers for the 12 months to Jul-2014, an increase of +1.0% on the 12 months to Jun-2014 and +14.4% on the 12 months to Jul-2013. Patronage for Jul-2014 was 1,089,839, an increase of 117,561 boardings or +12.1% on Jul-2013, normalised to ~ +9.9%. The Northern Express bus service carried 2,460,177 passenger trips for the 12 months to Jul- 2014, an increase of +1.4% on the 12 months to Jun-2014 and +7.6% on the 12 months to Jul- 2013. Northern Express bus service patronage for Jul-2014 was 233,814, an increase of 33,433 boardings or +16.7% on Jul-2013, normalised to ~ +15.2%. Other bus services carried 53,653,594 passenger trips for the 12 months to Jul-2014, an increase of +0.4% on the 12 months to Jun-2014 and +4.6% on the 12 months to Jul-2013. Other bus services patronage for Jul-2014 was 4,578,804, an increase of 228,637 boardings or +5.3% on Jul-2013, normalised to ~ +5.2%. Ferry services carried 5,073,973 passenger trips for the 12 months to Jul-2014, a decrease of - 0.7% on the 12 months to Jun-2014 and an increase +1.6% on the 12 months to Jul-2013. Ferry services patronage for Jul-2014 was 366,295, a decrease of -35,980 boardings or -8.9% on Jul-2013, normalised to ~ -8.9% (no special events).

Welcome message from author
This document is posted to help you gain knowledge. Please leave a comment to let me know what you think about it! Share it to your friends and learn new things together.
Transcript
Board Meeting | 26 August 2014 Agenda item no.9
Open Session
Public Transport Monthly Patronage – July 2014 Recommendations That the Board:
i. Notes the paper.
Executive summary Auckland public transport patronage totalled 72,740,387 passengers for the 12 months to Jul-2014, an increase of +0.5% on the 12 months to Jun-2014 and +5.9% on the 12 months to Jul-2013. July monthly patronage was 6,268,752, an increase of 343,651 boardings or +5.8% on Jul-2013, normalised to ~ +5.4% accounting for additional special event patronage only, same number of business and weekend days in Jul-2014 compared to Jul-2013.
Rail patronage totalled 11,552,643 passengers for the 12 months to Jul-2014, an increase of +1.0% on the 12 months to Jun-2014 and +14.4% on the 12 months to Jul-2013. Patronage for Jul-2014 was 1,089,839, an increase of 117,561 boardings or +12.1% on Jul-2013, normalised to ~ +9.9%.
The Northern Express bus service carried 2,460,177 passenger trips for the 12 months to Jul-2014, an increase of +1.4% on the 12 months to Jun-2014 and +7.6% on the 12 months to Jul-2013. Northern Express bus service patronage for Jul-2014 was 233,814, an increase of 33,433 boardings or +16.7% on Jul-2013, normalised to ~ +15.2%.
Other bus services carried 53,653,594 passenger trips for the 12 months to Jul-2014, an increase of +0.4% on the 12 months to Jun-2014 and +4.6% on the 12 months to Jul-2013. Other bus services patronage for Jul-2014 was 4,578,804, an increase of 228,637 boardings or +5.3% on Jul-2013, normalised to ~ +5.2%.
Ferry services carried 5,073,973 passenger trips for the 12 months to Jul-2014, a decrease of -0.7% on the 12 months to Jun-2014 and an increase +1.6% on the 12 months to Jul-2013. Ferry services patronage for Jul-2014 was 366,295, a decrease of -35,980 boardings or -8.9% on Jul-2013, normalised to ~ -8.9% (no special events).

Board Meeting | 26 August 2014 Agenda item no.9
Open Session Summary performance against SOI targets is provided in Table 1. Table 1. Summary performance against SOI Targets
Alignment with strategy The Integrated Transport Plan identifies public transport growth and development through transformational change, building on the momentum achieved through significant patronage growth in recent years, as a key pillar for Auckland transport in the short to medium term.
The Regional Public Transport Plan (RPTP) sets the policies, objectives and actions over the next ten years for Auckland public transport.
A three year “Next Steps” public transport change programme is being implemented over predominantly years 2013/14 to 2015/16 along with a graduated marketing approach to grow short-term patronage and manage transformational change to the public transport system.
The Next Steps programme will also set the foundation for patronage growth towards the aspirational target of doubling public transport boardings over 10 years. The 10 year plan is currently under review and development following the baseline confirmation of a realistic 95 million passenger boardings confirmed independently by Deloitte.
Background The report is a regular monthly update on annual public transport patronage change in Auckland. This report looks at current patronage, trends and annual forecasts against targets, and provides an overview of initiatives to drive growth over the coming months. Attachment 1 provides detailed patronage levels, trends and initiatives for each transport mode for this financial year 2014/15.
Strategic Context In summary, as communicated in previous Board Papers, the “Next Steps: 3-year Change Programme” is an integrated approach to setting the short term foundation for a transformation
Month Month (normalised) 12 Months End of Year
SOI Target Actual Variance
Rail 12.1% 9.9% 14.4% 3.2% 12.1% 8.9%
NEX 16.7% 15.2% 7.6% 4.8% 16.7% 11.9%
Bus 5.3% 5.2% 4.6% 0.9% 5.3% 4.3%
Ferry -8.9% -8.9% 1.6% 1.9% -8.9% -10.8%
Total 5.8% 5.4% 5.9% 1.5% 5.8% 4.3%
YTD Actual vs YTD SOICurrent vs Last year
July 2014
Board Meeting | 26 August 2014 Agenda item no.9
Open Session of Auckland public transport and commencing the delivery of the Auckland Plan public transport objectives through eight key strategic projects (Figure 1).
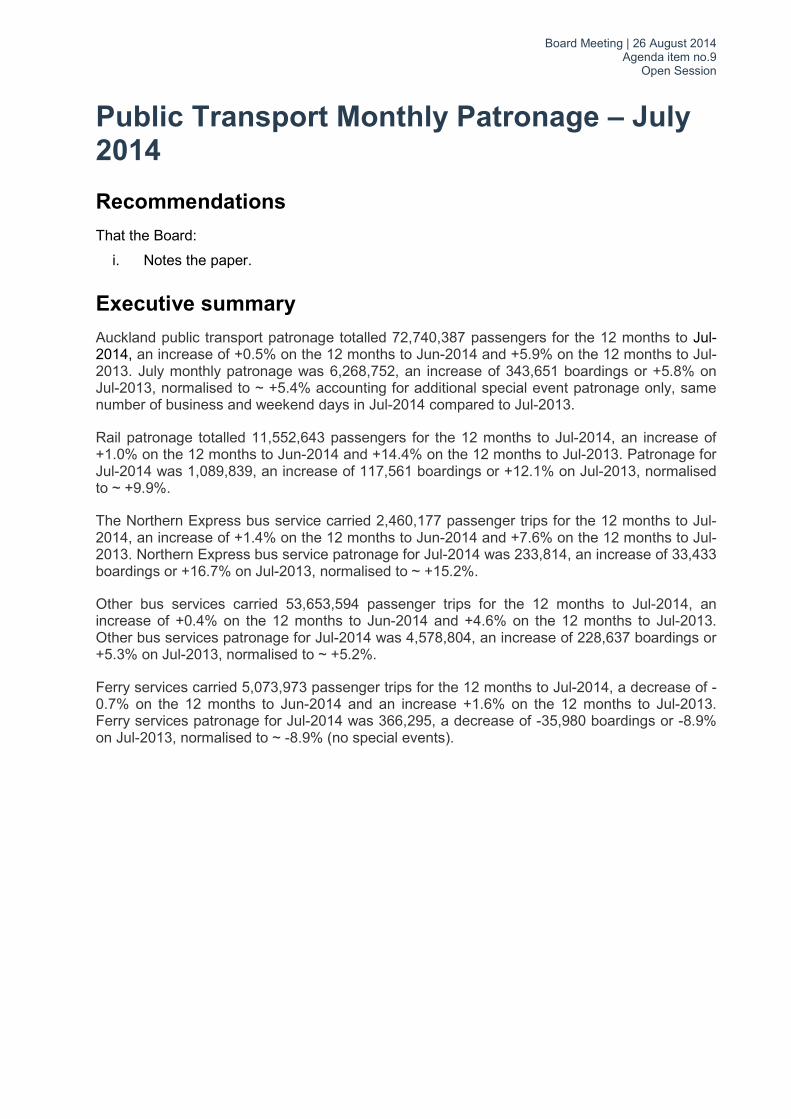
Fig 1. PT “Next Steps” 3 Year Programme Key Strategic Projects A graduated promotional approach (Figure 2) is to be applied as the component projects are rolled out. In parallel, promotional activity will drive customer demand, while setting forth a vision for the future state of public transport in Auckland. The eight strategic projects and graduated promotional approach are designed around the key customer growth attributes summarised at Figure 3.
Fig 2. Graduated Promotional Approach to the PT “Next Steps” Programme
Board Meeting | 26 August 2014 Agenda item no.9
Open Session
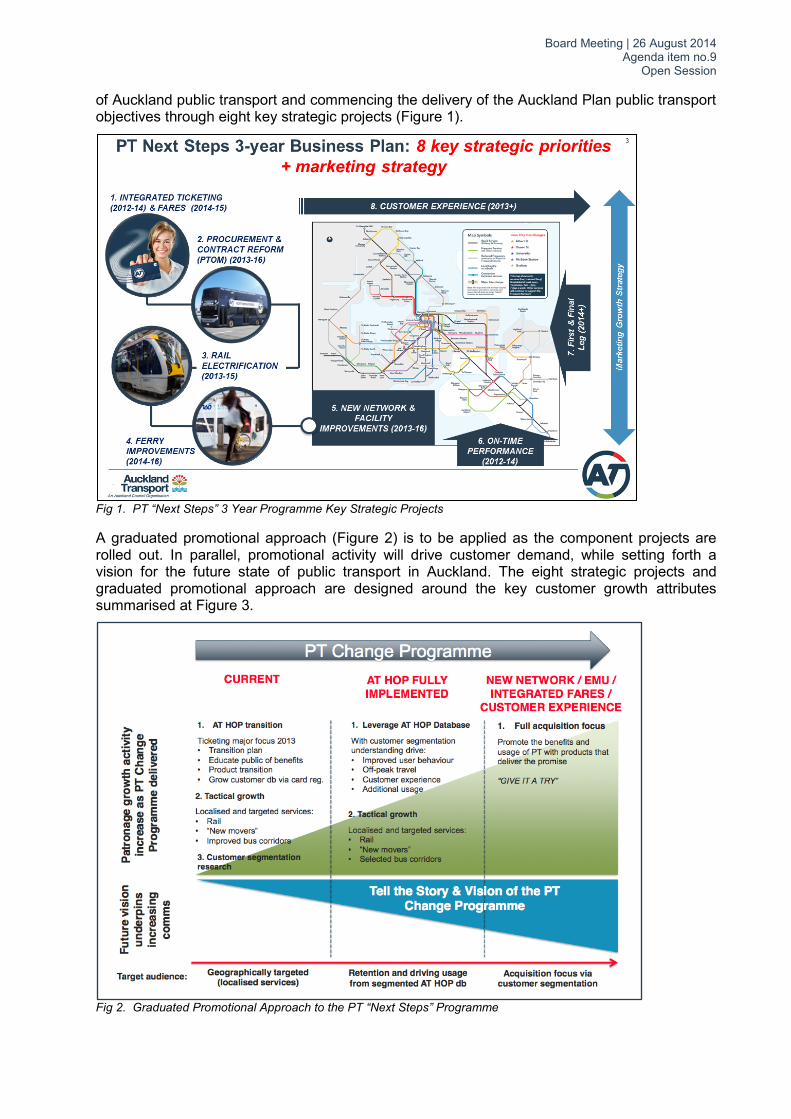
Fig 3. Key Customer Growth Drivers
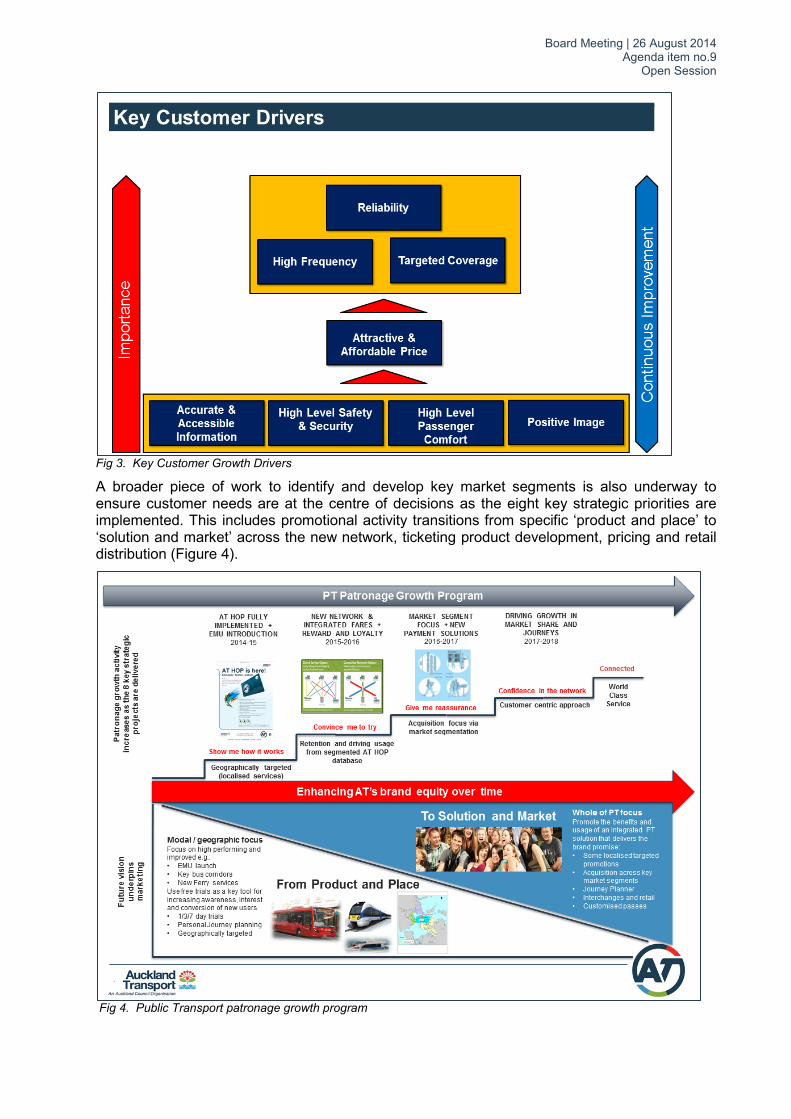
A broader piece of work to identify and develop key market segments is also underway to ensure customer needs are at the centre of decisions as the eight key strategic priorities are implemented. This includes promotional activity transitions from specific ‘product and place’ to ‘solution and market’ across the new network, ticketing product development, pricing and retail distribution (Figure 4).
Fig 4. Public Transport patronage growth program
Board Meeting | 26 August 2014 Agenda item no.9
Open Session Attachments
Number Description 1 Monthly PT Patronage Report – July 2014
Document Ownership Prepared by Ian Robertshaw
Public Transport Business Development Manager John Service Public Transport Reporting Lead
Recommended by Mark Lambert
Group Manager Public Transport Greg Edmonds Chief Operations Officer
Approved for Submission
David Warburton Chief Executive
Glossary
Acronym Description AT Auckland Transport
EMU Electric Multiple Units
MoT Ministry of Transport
PT Public Transport
PTOM Public Transport Operating Model
RPTP Regional Public Transport Plan
RTN Rapid Transit Network
Board Meeting | 26 August 2014 Agenda item no.9
Open Session ATTACHMENT 1:
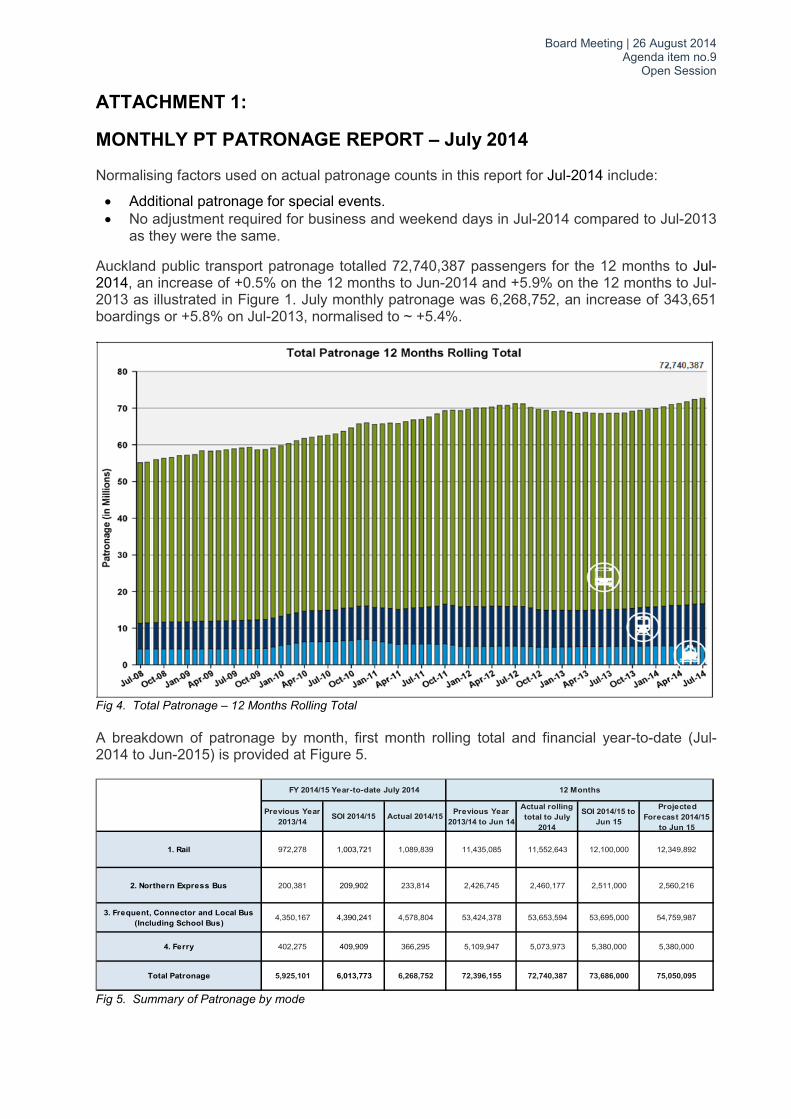
MONTHLY PT PATRONAGE REPORT – July 2014 Normalising factors used on actual patronage counts in this report for Jul-2014 include:
• Additional patronage for special events. • No adjustment required for business and weekend days in Jul-2014 compared to Jul-2013
as they were the same.
Auckland public transport patronage totalled 72,740,387 passengers for the 12 months to Jul-2014, an increase of +0.5% on the 12 months to Jun-2014 and +5.9% on the 12 months to Jul-2013 as illustrated in Figure 1. July monthly patronage was 6,268,752, an increase of 343,651 boardings or +5.8% on Jul-2013, normalised to ~ +5.4%.
Fig 4. Total Patronage – 12 Months Rolling Total A breakdown of patronage by month, first month rolling total and financial year-to-date (Jul-2014 to Jun-2015) is provided at Figure 5.
Fig 5. Summary of Patronage by mode
Previous Year 2013/14
SOI 2014/15 Actual 2014/15 Previous Year 2013/14 to Jun 14
Actual rolling total to July
2014
SOI 2014/15 to Jun 15
Projected Forecast 2014/15
to Jun 15
1. Rail 972,278 1,003,721 1,089,839 11,435,085 11,552,643 12,100,000 12,349,892
2. Northern Express Bus 200,381 209,902 233,814 2,426,745 2,460,177 2,511,000 2,560,216
3. Frequent, Connector and Local Bus (Including School Bus)
4,350,167 4,390,241 4,578,804 53,424,378 53,653,594 53,695,000 54,759,987
4. Ferry 402,275 409,909 366,295 5,109,947 5,073,973 5,380,000 5,380,000
Total Patronage 5,925,101 6,013,773 6,268,752 72,396,155 72,740,387 73,686,000 75,050,095
FY 2014/15 Year-to-date July 2014 12 Months
Board Meeting | 26 August 2014 Agenda item no.9
Open Session 1. Rail
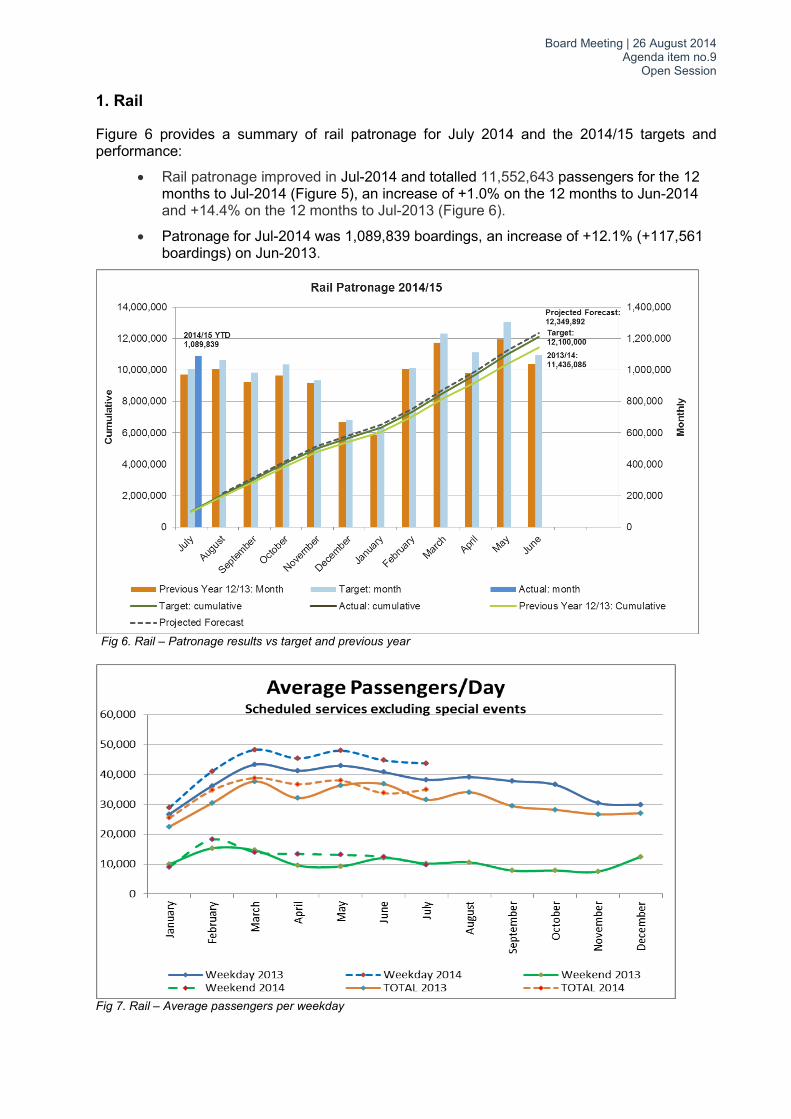
Figure 6 provides a summary of rail patronage for July 2014 and the 2014/15 targets and performance:
• Rail patronage improved in Jul-2014 and totalled 11,552,643 passengers for the 12 months to Jul-2014 (Figure 5), an increase of +1.0% on the 12 months to Jun-2014 and +14.4% on the 12 months to Jul-2013 (Figure 6).
• Patronage for Jul-2014 was 1,089,839 boardings, an increase of +12.1% (+117,561 boardings) on Jun-2013.
Fig 6. Rail – Patronage results vs target and previous year
Fig 7. Rail – Average passengers per weekday

Board Meeting | 26 August 2014 Agenda item no.9
Open Session Activity Summary for July
Patronage impacts include:
• Patronage growth continues to be led by increases on the Onehunga Line (since the introduction of electric trains), Manukau & Eastern Line (with uplift since MIT opened and continued growth in boardings and transfers at Panmure.
• The mailbox drop to Onehunga and Te Papapa suburbs promoting the new electric trains on the Onehunga Line resulted in 1822 trips being made using the free pass.
• Community Transport has been undertaking a programme with Penrose and Onehunga businesses to encourage staff to use public transport / the new electric trains for their commute to work.
• The ‘Watch Out’ safety campaign along the Manukau & Eastern Line as electric trains are being tested and introduced into service. This campaign includes community newspaper advertisements, mail drop to households along the line and radio advertising.
• Over 2000 students started semester 2 at MIT Manukau campus on 28th July. Community transport participated in orientation days, completing personal transport planning for staff and students transferring from Otara campus.
• ‘New Movers’ welcome to the neighbourhood packs were sent to 620 homes during July.
Key Activities for August
• “Is your child getting the best fare?” campaign to encourage HOP usage and online top ups to reduce fare evasion.
• Posters and EDM to advise customers that electric trains are being progressively introduced onto the Manukau & Eastern Line and advise them of the main features as well as the need to push the button to open the doors.
• Billboard advertising to promoting electric trains on the Manukau & Eastern Line once full roll-out is complete
• Rail Safety Week, the annual Australasian-wide campaign, runs this year from 11-17 August.

Board Meeting | 26 August 2014 Agenda item no.9
Open Session 2. Northern Express (RTN Bus)
Figure 8 provides a summary of the Northern Express bus Rapid Transit patronage performance:
• Patronage totalled 2,460,177 passengers for the 12 months to Jul-2014, an increase of +1.4% on the 12 months to Jun-2014 and +7.6% on the 12 months to Jul-2013. (Figure 8).
• Patronage for Jul-2014 was 233,814 boardings, an increase of +16.7% (+33,433 boardings) on Jul-2013.
Fig 8. Northern Express – Patronage results vs target and previous year
Activity Summary for July
Patronage impacts include:
• On-time performance across Ritchies Transport services was once again strong with punctuality reaching 93.4%. The performance of the NEX was exceptional at 98.7%.
• Improved service, frequency and promotional campaigns to build awareness and trial of the NEX such as free weekends have contributed to the continued growth.
• ‘New Movers’ welcome to the neighbourhood packs were sent to 620 homes during July.
Key Activities for Northern Express in August:
• “New Movers” programme continues. • Travel Myths campaign is on-going on North Shore
Board Meeting | 26 August 2014 Agenda item no.9
Open Session 3. Bus (excluding Northern Express)
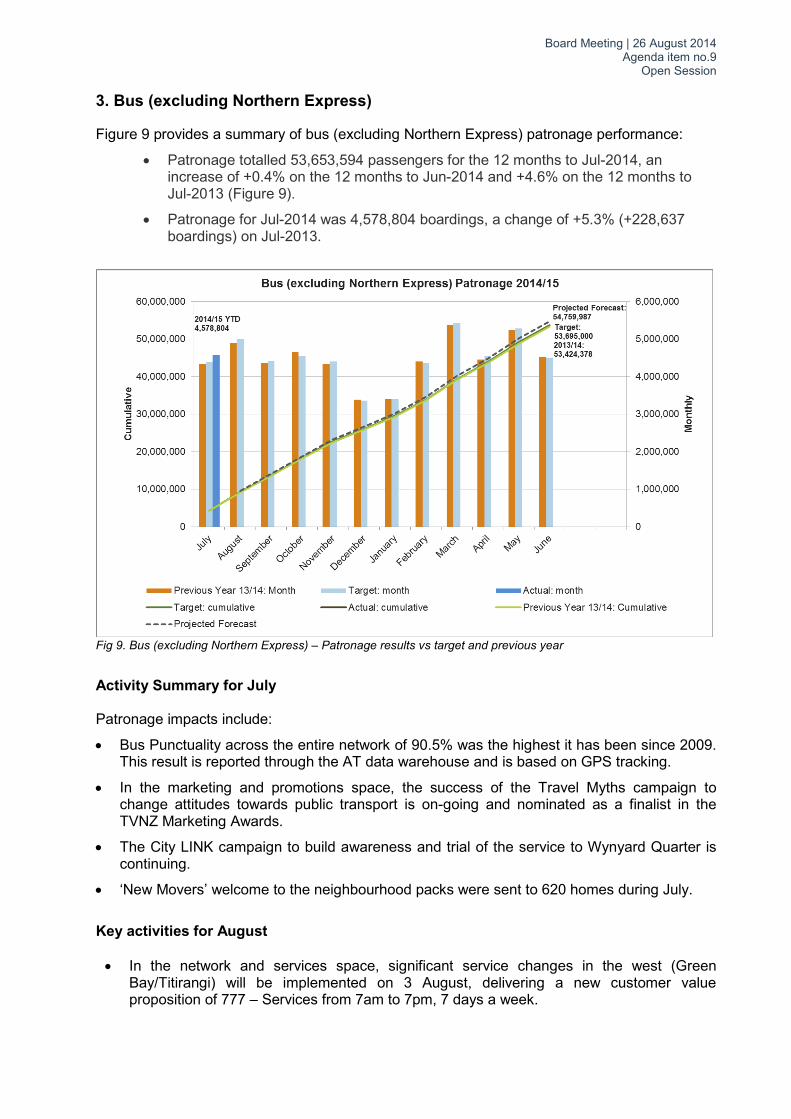
Figure 9 provides a summary of bus (excluding Northern Express) patronage performance:
• Patronage totalled 53,653,594 passengers for the 12 months to Jul-2014, an increase of +0.4% on the 12 months to Jun-2014 and +4.6% on the 12 months to Jul-2013 (Figure 9).
• Patronage for Jul-2014 was 4,578,804 boardings, a change of +5.3% (+228,637 boardings) on Jul-2013.
Fig 9. Bus (excluding Northern Express) – Patronage results vs target and previous year
Activity Summary for July Patronage impacts include:
• Bus Punctuality across the entire network of 90.5% was the highest it has been since 2009. This result is reported through the AT data warehouse and is based on GPS tracking.
• In the marketing and promotions space, the success of the Travel Myths campaign to change attitudes towards public transport is on-going and nominated as a finalist in the TVNZ Marketing Awards.
• The City LINK campaign to build awareness and trial of the service to Wynyard Quarter is continuing.
• ‘New Movers’ welcome to the neighbourhood packs were sent to 620 homes during July.
Key activities for August • In the network and services space, significant service changes in the west (Green
Bay/Titirangi) will be implemented on 3 August, delivering a new customer value proposition of 777 – Services from 7am to 7pm, 7 days a week.

Board Meeting | 26 August 2014 Agenda item no.9
Open Session • Continuation of a major campaign to increase use of bus services in the ‘Central
Corridors’, Mt Eden / Sandringham / Dominion Road / Great North / New North Road. The campaign challenges the “myths” of bus travel, using a ‘pop-art’ art direction
• City LINK campaign continues • “New Movers” programme continues • The infrastructure team is working on a series of bus priority measures, which involve both
quick wins as well as longer term programmes. Preliminary analysis has identified 16 ‘quick win’ and 10 corridors for investigation and is progressing forward with external consultants and internal design team.
4. Ferry Figure 10 provides a summary of ferry patronage performance:
• Ferry patronage totalled 5,073,973 passenger trips for the 12 months to Jul-2014, a decrease of -0.7% on the 12 months to Jun-2014 and an increase +1.6% on the 12 months to Jul-2013 (Figure 10).
• Patronage for Jun-2014 was 366,295, a decrease of -35,980 boardings or -8.9%.
Fig 10. Ferry – Patronage results vs target and previous year
Activity Summary for ferry in July
• Gulf Harbour ferry service introduced new sailings from 28 July 2014. Initial response in the first week has been positive – patronage up 68% on same period last year.
• Storm on 9 July with severe sea conditions led to an unprecedented day where up to 55% of services were cancelled. All services except Waiheke and Half Moon Bay (due to larger vessels being on these runs) were affected.
• ‘New Movers’ welcome to the neighbourhood packs were sent to 620 homes during July.
Key activities for August
• Planning for more capacity on the West Harbour ferry service. • Marketing campaign for Gulf Harbour ferry service starts in earnest for 4 – 6 weeks.


Board Meeting | 26 August 2014 Agenda item no.9
Open Session
Appendix 2. Rail Patronage
Rail FY 2014-2015 July August September October November December January February March April May June
Patronage
Previous Year 12/13: Month 972,278 1,004,630 925,014 964,380 918,708 669,170 588,574 1,005,372 1,174,588 978,839 1,193,702 1,039,830
Previous Year 12/13: Cumulative 972,278 1,976,908 2,901,922 3,866,302 4,785,010 5,454,180 6,042,754 7,048,126 8,222,714 9,201,553 10,395,255 11,435,085
Target: month 1,003,721 1,062,480 982,949 1,033,908 933,092 683,704 639,575 1,013,245 1,232,930 1,113,334 1,306,730 1,094,333
Target: cumulative 1,003,721 2,066,200 3,049,150 4,083,057 5,016,149 5,699,854 6,339,428 7,352,673 8,585,603 9,698,937 11,005,667 12,100,000
Target: cumulative FY grow th to previous year % 3.23% 4.52% 5.07% 5.61% 4.83% 4.50% 4.91% 4.32% 4.41% 5.41% 5.87% 5.81%
Actual: month 1,089,839
Variance: month to target 86,118
Variance: month to previous year 117,561
Actual: cumulative 1,089,839
Variance: cumulative to target 86,118
Variance: cumulative to previous year 117,561
Actual: cumulative FY grow th to previous year 12.09%
% cumulative change to target 8.58%
Reforecast: month 1,089,839 1,078,161 997,457 1,049,167 946,864 693,795 649,014 1,028,200 1,251,127 1,129,766 1,326,017 1,110,485
Reforecast: cumulative 1,089,839 2,168,000 3,165,457 4,214,625 5,161,488 5,855,284 6,504,298 7,532,498 8,783,624 9,913,390 11,239,407 12,349,892
Reforecast: cumulative FY grow th to previous year % 12.09% 9.67% 9.08% 9.01% 7.87% 7.35% 7.64% 6.87% 6.82% 7.74% 8.12% 8.00%
Board Meeting | 26 August 2014 Agenda item no.9
Open Session
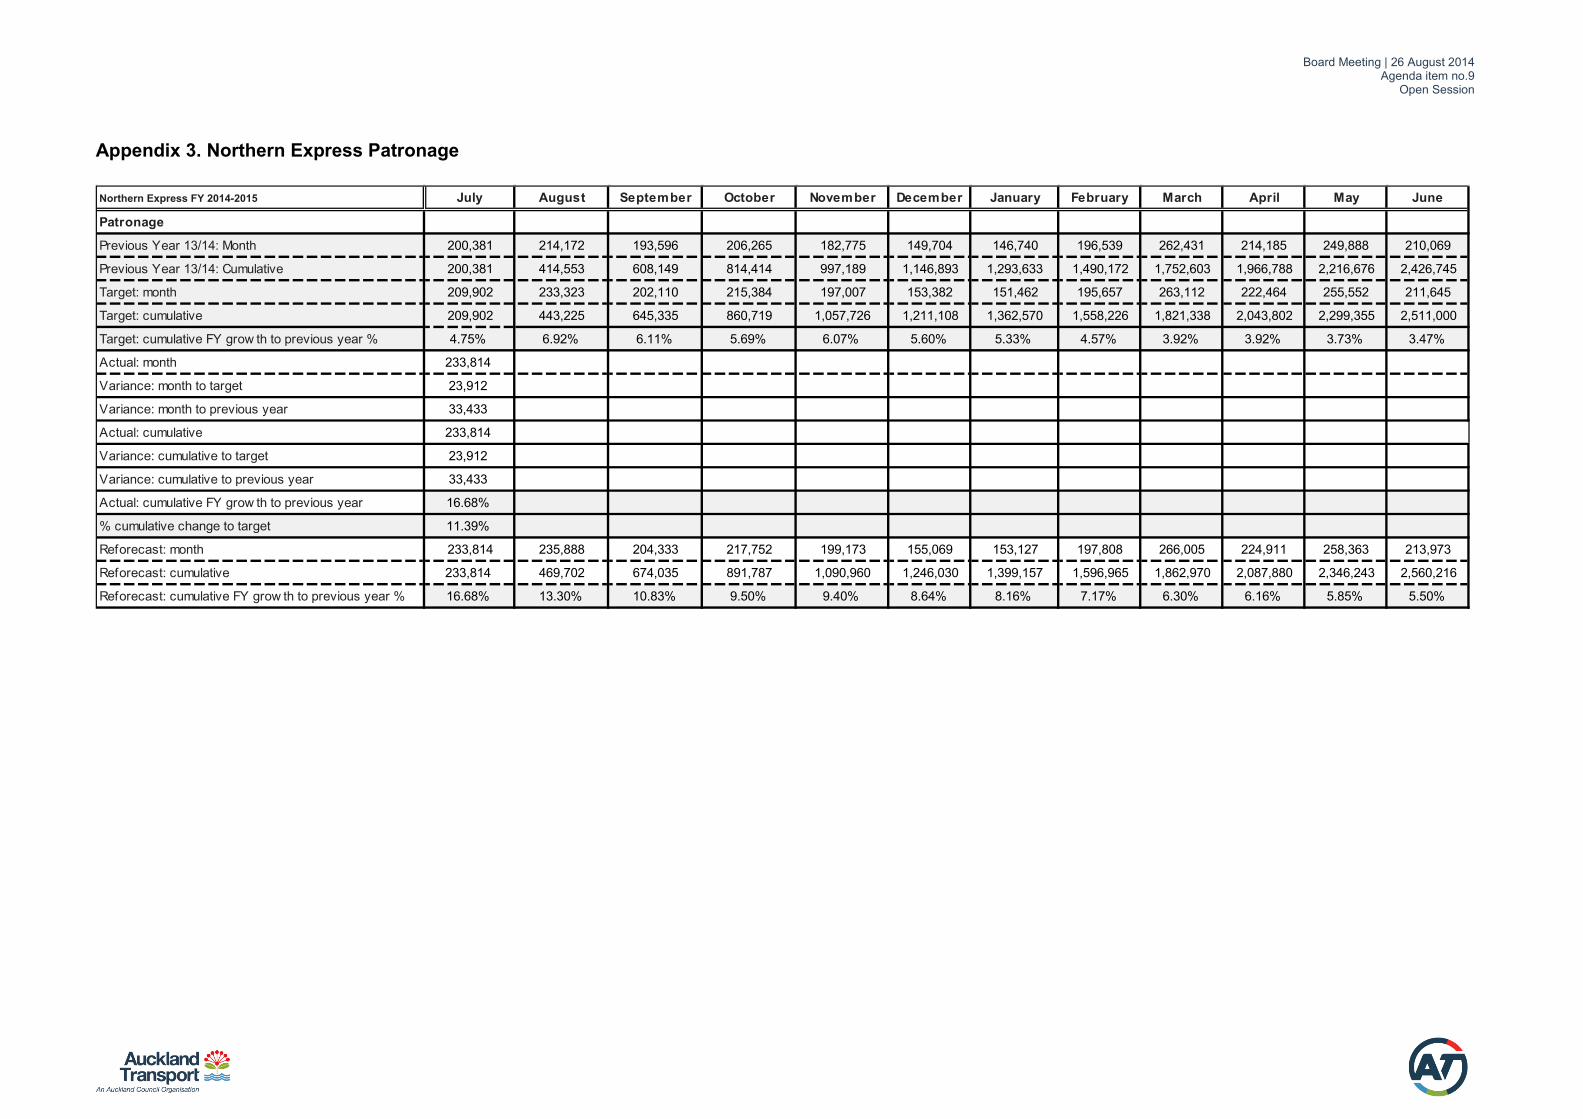
Appendix 3. Northern Express Patronage
Northern Express FY 2014-2015 July August September October November December January February March April May June
Patronage
Previous Year 13/14: Month 200,381 214,172 193,596 206,265 182,775 149,704 146,740 196,539 262,431 214,185 249,888 210,069
Previous Year 13/14: Cumulative 200,381 414,553 608,149 814,414 997,189 1,146,893 1,293,633 1,490,172 1,752,603 1,966,788 2,216,676 2,426,745
Target: month 209,902 233,323 202,110 215,384 197,007 153,382 151,462 195,657 263,112 222,464 255,552 211,645
Target: cumulative 209,902 443,225 645,335 860,719 1,057,726 1,211,108 1,362,570 1,558,226 1,821,338 2,043,802 2,299,355 2,511,000
Target: cumulative FY grow th to previous year % 4.75% 6.92% 6.11% 5.69% 6.07% 5.60% 5.33% 4.57% 3.92% 3.92% 3.73% 3.47%
Actual: month 233,814
Variance: month to target 23,912
Variance: month to previous year 33,433
Actual: cumulative 233,814
Variance: cumulative to target 23,912
Variance: cumulative to previous year 33,433
Actual: cumulative FY grow th to previous year 16.68%
% cumulative change to target 11.39%
Reforecast: month 233,814 235,888 204,333 217,752 199,173 155,069 153,127 197,808 266,005 224,911 258,363 213,973
Reforecast: cumulative 233,814 469,702 674,035 891,787 1,090,960 1,246,030 1,399,157 1,596,965 1,862,970 2,087,880 2,346,243 2,560,216
Reforecast: cumulative FY grow th to previous year % 16.68% 13.30% 10.83% 9.50% 9.40% 8.64% 8.16% 7.17% 6.30% 6.16% 5.85% 5.50%

Board Meeting | 26 August 2014 Agenda item no.9
Open Session
Appendix 4. Bus (excluding Northern Express) Patronage
Bus - excluding Northern Express FY 2014-2015 July August September October November December January February March April May June
Patronage
Previous Year 13/14: Month 4,350,167 4,902,264 4,371,346 4,654,739 4,335,897 3,389,935 3,410,157 4,408,736 5,374,783 4,454,848 5,245,850 4,525,656
Previous Year 13/14: Cumulative 4,350,167 9,252,431 13,623,777 18,278,516 22,614,413 26,004,348 29,414,505 33,823,241 39,198,024 43,652,872 48,898,722 53,424,378
Target: month 4,390,241 4,991,927 4,423,624 4,558,723 4,403,478 3,366,088 3,415,480 4,375,651 5,423,703 4,553,207 5,284,848 4,508,032
Target: cumulative 4,390,241 9,382,168 13,805,792 18,364,515 22,767,993 26,134,081 29,549,560 33,925,211 39,348,914 43,902,121 49,186,968 53,695,000
Target: cumulative FY grow th to previous year % 0.92% 1.40% 1.34% 0.47% 0.68% 0.50% 0.46% 0.30% 0.38% 0.57% 0.59% 0.51%
Actual: month 4,578,804
Variance: month to target 188,563
Variance: month to previous year 228,637
Actual: cumulative 4,578,804
Variance: cumulative to target 188,563
Variance: cumulative to previous year 228,637
Actual: cumulative FY grow th to previous year 5.26%
% cumulative change to target 4.30%
Reforecast: month 4,578,804 5,080,662 4,502,256 4,639,757 4,481,753 3,425,922 3,476,192 4,453,431 5,520,113 4,634,143 5,378,789 4,588,165
Reforecast: cumulative 4,578,804 9,659,466 14,161,723 18,801,480 23,283,233 26,709,155 30,185,347 34,638,777 40,158,890 44,793,033 50,171,822 54,759,987
Reforecast: cumulative FY grow th to previous year % 5.26% 4.40% 3.95% 2.86% 2.96% 2.71% 2.62% 2.41% 2.45% 2.61% 2.60% 2.50%

Board Meeting | 26 August 2014 Agenda item no.9
Open Session
Appendix 5. Ferry Patronage Ferry FY 2014-2015 July August September October November December January February March April May June
Patronage
Previous Year 13/14: Month 402,275 379,465 340,029 450,063 436,875 486,637 501,450 464,205 494,123 415,541 406,874 332,410
Previous Year 13/14: Cumulative 402,275 781,740 1,121,769 1,571,832 2,008,707 2,495,344 2,996,794 3,460,999 3,955,122 4,370,663 4,777,537 5,109,947
Target: month 409,909 399,719 360,769 450,548 449,046 482,209 534,030 509,857 527,449 455,740 436,830 363,894
Target: cumulative 409,909 809,628 1,170,397 1,620,945 2,069,991 2,552,200 3,086,230 3,596,087 4,123,536 4,579,276 5,016,106 5,380,000
Target: cumulative FY grow th to previous year % 1.86% 3.57% 4.33% 3.12% 3.05% 2.28% 2.98% 3.90% 4.26% 4.77% 4.99% 5.28%
Original Target: month
Original Target: cumulative 0 0 0 0 0 0 0 0 0 0 0 0
Actual: month 366,295
Variance: month to target -43,614
Variance: month to previous year -35,980
Actual: cumulative 366,295
Variance: cumulative to target -43,614
Variance: cumulative to previous year -35,980
Actual: cumulative FY grow th to previous year -8.94%
% cumulative change to target -10.64%
Reforecast: month 366,295 403,227 363,934 454,502 452,987 486,440 538,716 514,331 532,078 459,739 440,663 367,087
Reforecast: cumulative 366,295 769,522 1,133,456 1,587,958 2,040,945 2,527,385 3,066,101 3,580,433 4,112,510 4,572,250 5,012,913 5,380,000
Reforecast: cumulative FY grow th to previous year % -8.94% -1.56% 1.04% 1.03% 1.60% 1.28% 2.31% 3.45% 3.98% 4.61% 4.93% 5.28%
Board Meeting | 26 August 2014 Agenda item no.9
Open Session
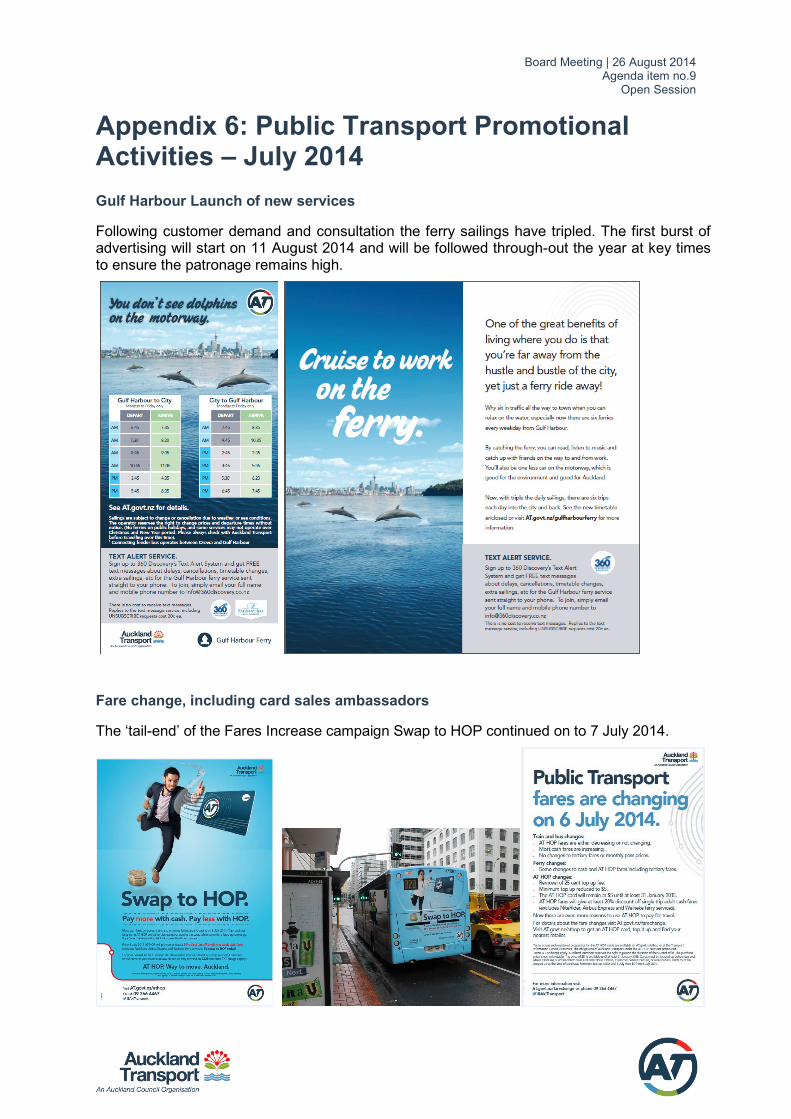
Appendix 6: Public Transport Promotional Activities – July 2014 Gulf Harbour Launch of new services
Following customer demand and consultation the ferry sailings have tripled. The first burst of advertising will start on 11 August 2014 and will be followed through-out the year at key times to ensure the patronage remains high.
Fare change, including card sales ambassadors
The ‘tail-end’ of the Fares Increase campaign Swap to HOP continued on to 7 July 2014.
Board Meeting | 26 August 2014 Agenda item no.9
Open Session
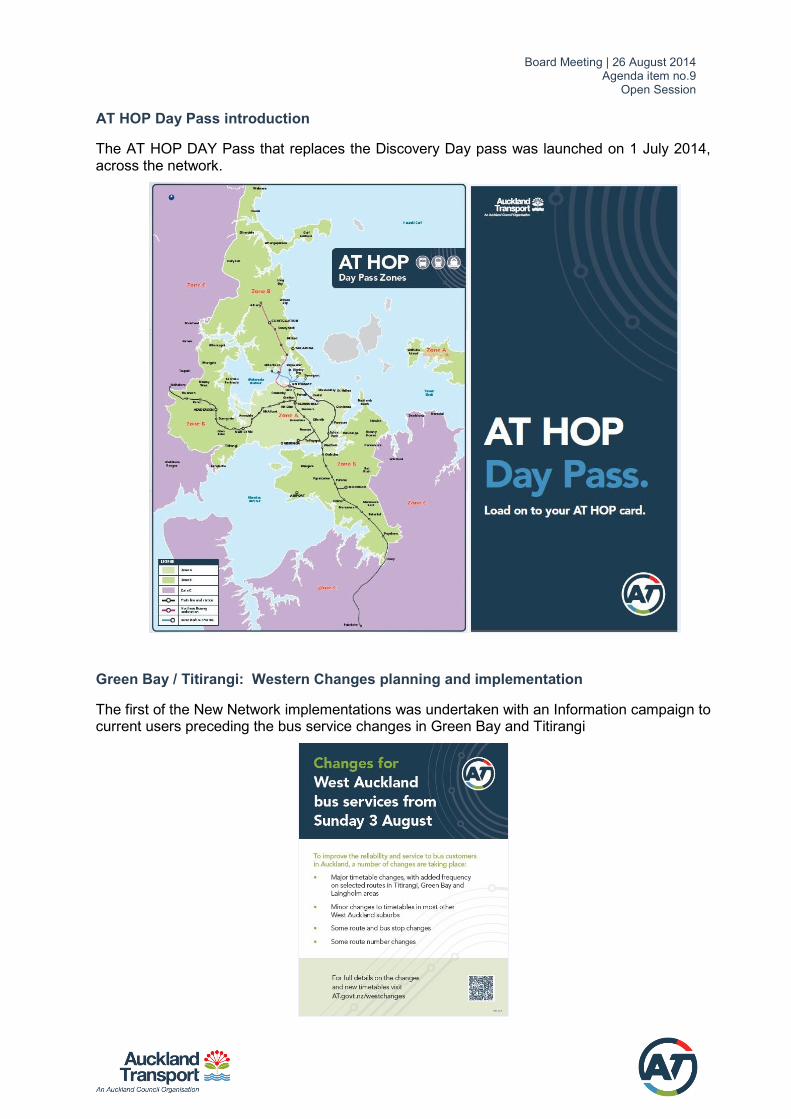
AT HOP Day Pass introduction
The AT HOP DAY Pass that replaces the Discovery Day pass was launched on 1 July 2014, across the network.
Green Bay / Titirangi: Western Changes planning and implementation
The first of the New Network implementations was undertaken with an Information campaign to current users preceding the bus service changes in Green Bay and Titirangi

Board Meeting | 26 August 2014 Agenda item no.9
Open Session
Special Events – Wellington Phoenix vs West Ham United 23 July 2014
Marketing materials in market as of 14 July promoting travel to/from the match on trains and special event bus services.
Onehunga/Te Papapa electric train promotion A free travel offer was delivered to households within a 1km radius of the Onehunga and Te Papapa train stations (approx 2,200 each area) to encourage current car users to use the new electric trains. A pass was provided offering free travel on the trains over a five day.
Board Meeting | 26 August 2014 Agenda item no.9
Open Session
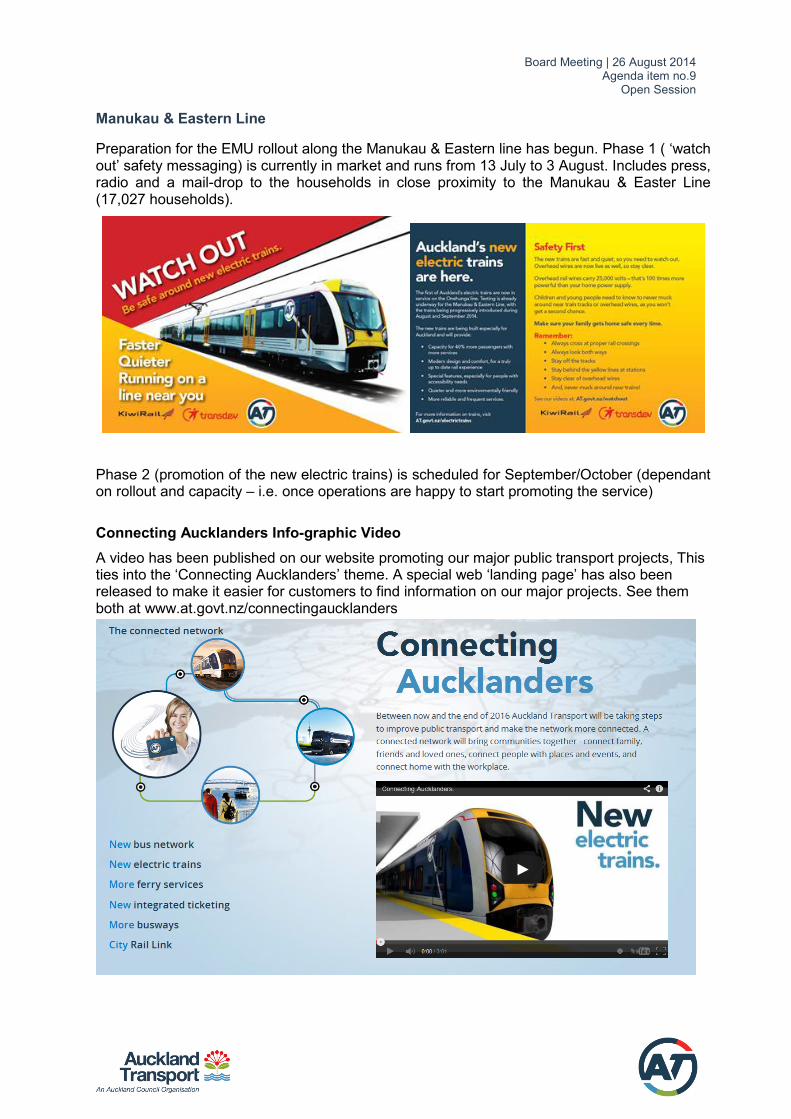
Manukau & Eastern Line
Preparation for the EMU rollout along the Manukau & Eastern line has begun. Phase 1 ( ‘watch out’ safety messaging) is currently in market and runs from 13 July to 3 August. Includes press, radio and a mail-drop to the households in close proximity to the Manukau & Easter Line (17,027 households).
Phase 2 (promotion of the new electric trains) is scheduled for September/October (dependant on rollout and capacity – i.e. once operations are happy to start promoting the service)
Connecting Aucklanders Info-graphic Video A video has been published on our website promoting our major public transport projects, This ties into the ‘Connecting Aucklanders’ theme. A special web ‘landing page’ has also been released to make it easier for customers to find information on our major projects. See them both at www.at.govt.nz/connectingaucklanders
Related Documents