ITED 434 Quality Organization & Management Ch 10 & 11 Ch 10: Basic Concepts of Statistics and Probability Ch 11: Statistical Tools for Analyzing Data

ITED 434 Quality Organization & Management Ch 10 & 11 Ch 10: Basic Concepts of Statistics and Probability Ch 11: Statistical Tools for Analyzing Data.
Dec 18, 2015
Welcome message from author
This document is posted to help you gain knowledge. Please leave a comment to let me know what you think about it! Share it to your friends and learn new things together.
Transcript
ITED 434Quality Organization & Management Ch 10 & 11
Ch 10: Basic Concepts of Statistics and Probability
Ch 11: Statistical Tools for Analyzing Data
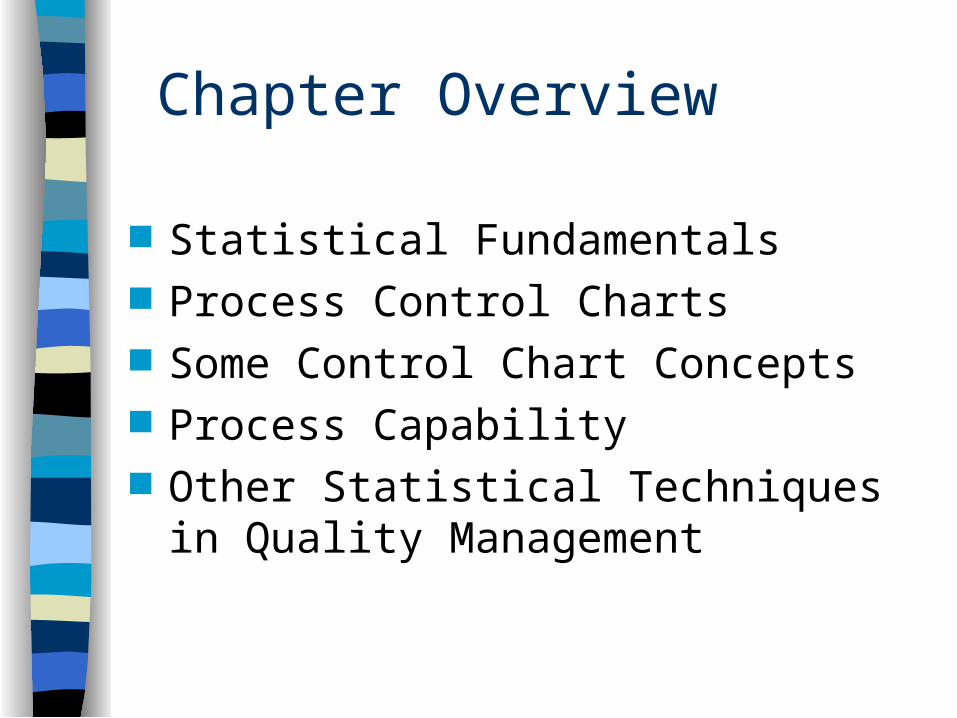
Chapter Overview
Statistical Fundamentals Process Control Charts Some Control Chart Concepts Process Capability Other Statistical Techniques in Quality
Management
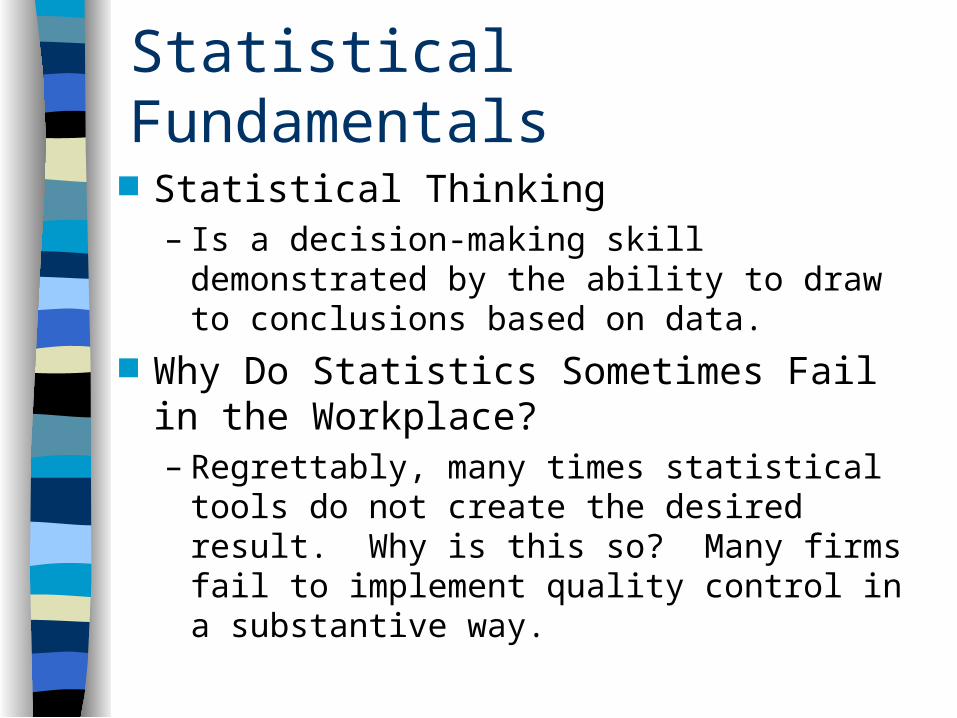
Statistical Fundamentals
Statistical Thinking– Is a decision-making skill demonstrated by
the ability to draw to conclusions based on data.
Why Do Statistics Sometimes Fail in the Workplace?– Regrettably, many times statistical tools do
not create the desired result. Why is this so? Many firms fail to implement quality control in a substantive way.
Statistical Fundamentals Reasons for Failure of Statistical Tools
– Lack of knowledge about the tools; therefore, tools are misapplied.
– General disdain for all things mathematical creates a natural barrier to the use of statistics.
– Cultural barriers in a company make the use of statistics for continual improvement difficult.
– Statistical specialists have trouble communicating with managerial generalists.
Statistical Fundamentals Reasons for Failure of Statistical Tools
(continued)
– Statistics generally are poorly taught, emphasizing mathematical development rather than application.
– People have a poor understanding of the scientific method.
– Organization lack patience in collecting data. All decisions have to be made “yesterday.”
Statistical Fundamentals
Reasons for Failure of Statistical Tools (continued)– Statistics are view as something to buttress
an already-held opinion rather than a method for informing and improving decision making.
– Most people don’t understand random variation resulting in too much process tampering.
Statistical Fundamentals
Understanding Process Variation– Random variation is centered around a
mean and occurs with a consistent amount of dispersion.
– This type of variation cannot be controlled. Hence, we refer to it as “uncontrolled variation.”
– The statistical tools discussed in this chapter are not designed to detect random variation.
Statistical Fundamentals Understanding Process Variation (cont.)
– Nonrandom or “special cause” variation results from some event. The event may be a shift in a process mean or some unexpected occurrence.
Process Stability– Means that the variation we observe in the
process is random variation. To determine process stability we use process charts.
Statistical Fundamentals Sampling Methods
– To ensure that processes are stable, data are gathered in samples.
• Random samples. Randomization is useful because it ensures independence among observations. To randomize means to sample is such a way that every piece of product has an equal chance of being selected for inspection.
• Systematic samples. Systematic samples have some of the benefits of random samples without the difficulty of randomizing.
Sampling Methods– To ensure that processes are stable, data
are gathered in samples (continued)• Sampling by Rational Subgroup. A rational
subgroup is a group of data that is logically homogenous; variation within the data can provide a yardstick for setting limits on the standard variation between subgroups.
Statistical Fundamentals
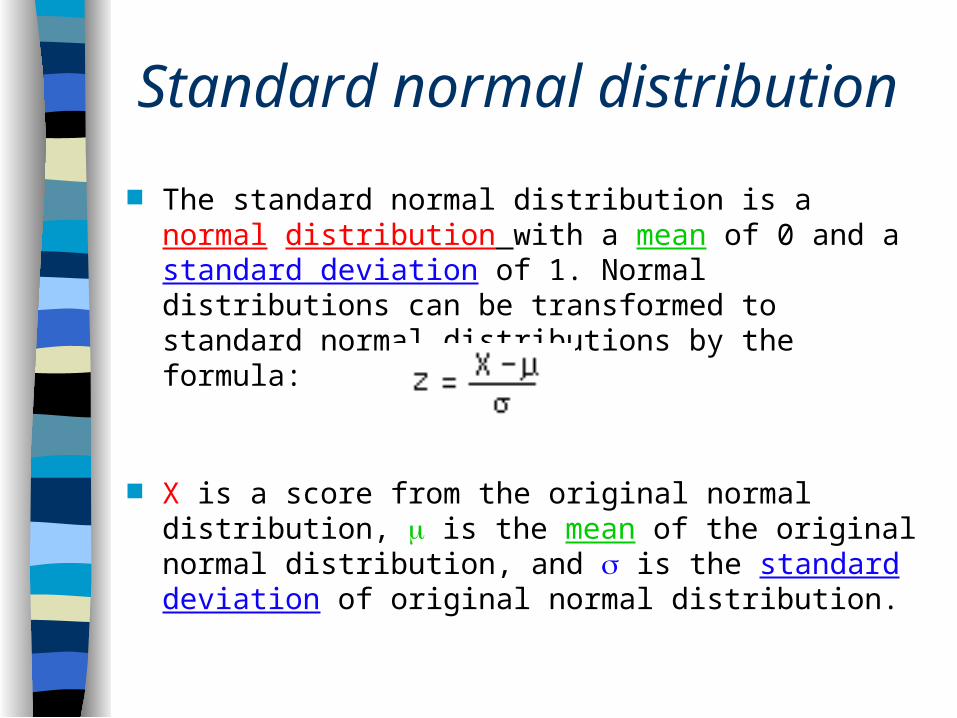
The standard normal distribution is a normal distribution with a mean of 0 and a standard deviation of 1. Normal distributions can be transformed to standard normal distributions by the formula:
X is a score from the original normal distribution, is the mean of the original normal distribution, and is the standard deviation of original normal distribution.
Standard normal distribution
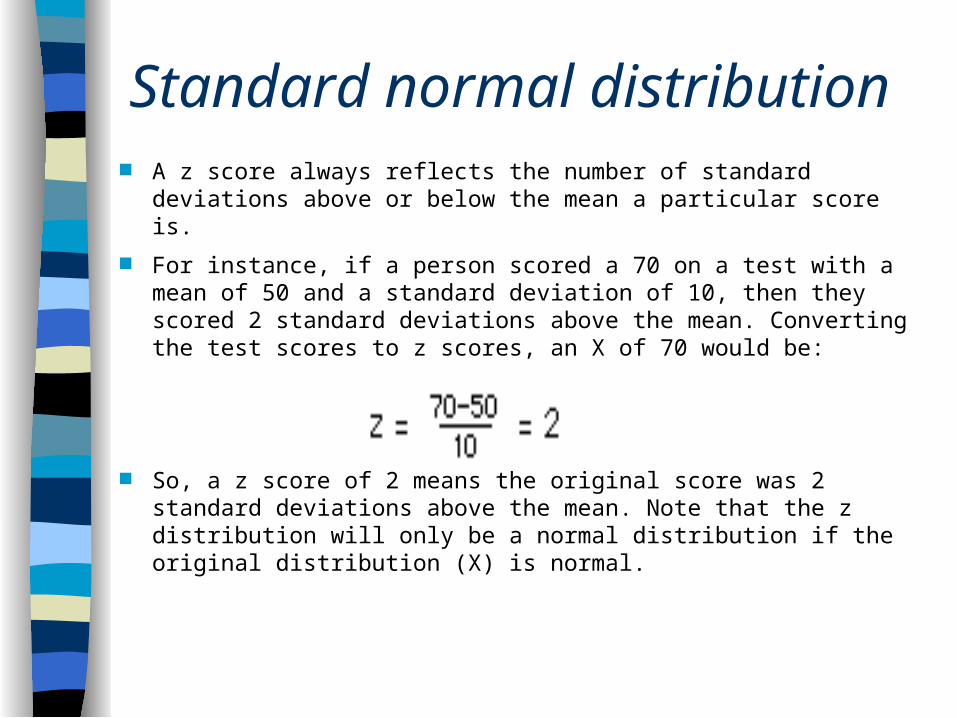
Standard normal distribution A z score always reflects the number of standard deviations
above or below the mean a particular score is.
For instance, if a person scored a 70 on a test with a mean of 50 and a standard deviation of 10, then they scored 2 standard deviations above the mean. Converting the test scores to z scores, an X of 70 would be:
So, a z score of 2 means the original score was 2 standard deviations above the mean. Note that the z distribution will only be a normal distribution if the original distribution (X) is normal.
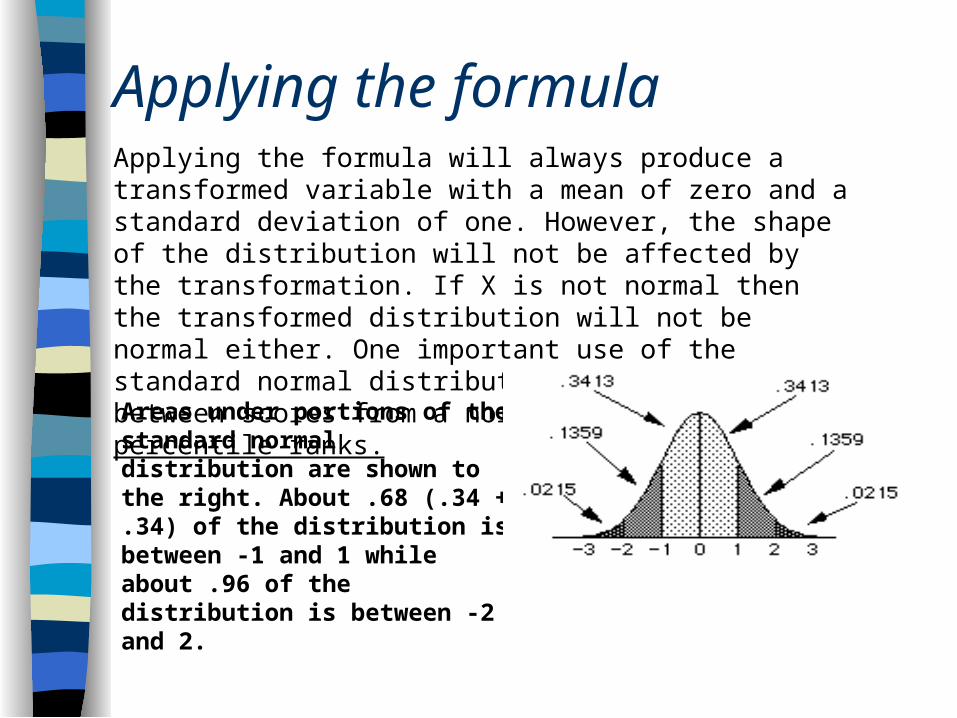
Applying the formulaApplying the formula will always produce a transformed variable with a mean of zero and a standard deviation of one. However, the shape of the distribution will not be affected by the transformation. If X is not normal then the transformed distribution will not be normal either. One important use of the standard normal distribution is for converting between scores from a normal distribution and percentile ranks.
Areas under portions of the standard normal distribution are shown to the right. About .68 (.34 + .34) of the distribution is between -1 and 1 while about .96 of the distribution is between -2 and 2.
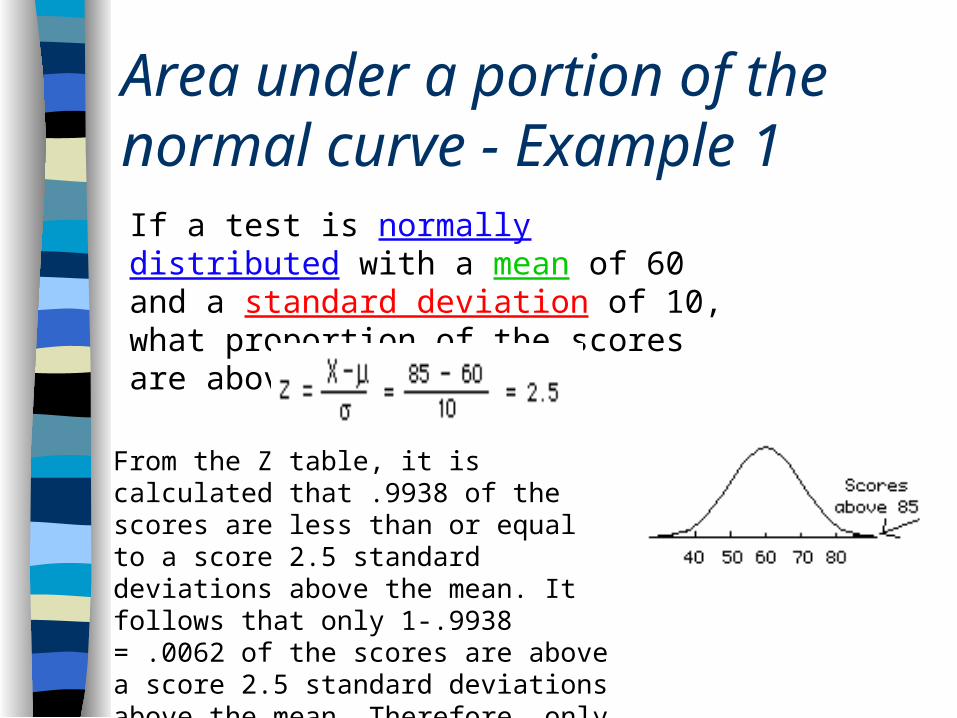
Area under a portion of the normal curve - Example 1If a test is normally distributed with a mean of 60 and a standard deviation of 10, what proportion of the scores are above 85?
From the Z table, it is calculated that .9938 of the scores are less than or equal to a score 2.5 standard deviations above the mean. It follows that only 1-.9938 = .0062 of the scores are above a score 2.5 standard deviations above the mean. Therefore, only .0062 of the scores are above 85.
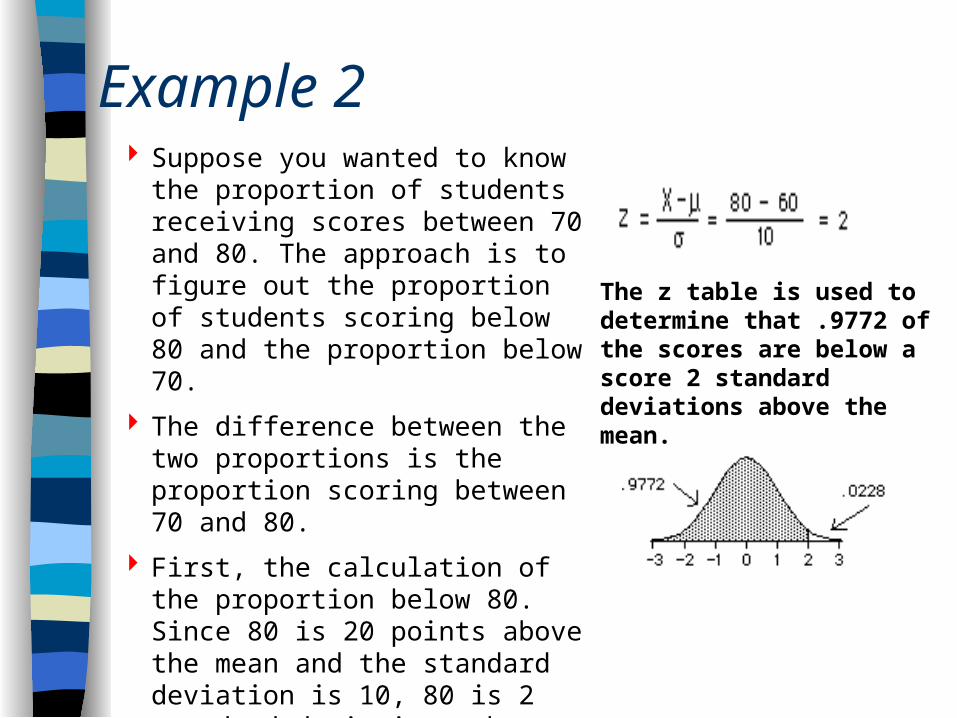
Example 2 Suppose you wanted to know the
proportion of students receiving scores between 70 and 80. The approach is to figure out the proportion of students scoring below 80 and the proportion below 70.
The difference between the two proportions is the proportion scoring between 70 and 80.
First, the calculation of the proportion below 80. Since 80 is 20 points above the mean and the standard deviation is 10, 80 is 2 standard deviations above the mean.
The z table is used to determine that .9772 of the scores are below a score 2 standard deviations above the mean.
Example 2To calculate the proportion below 70:
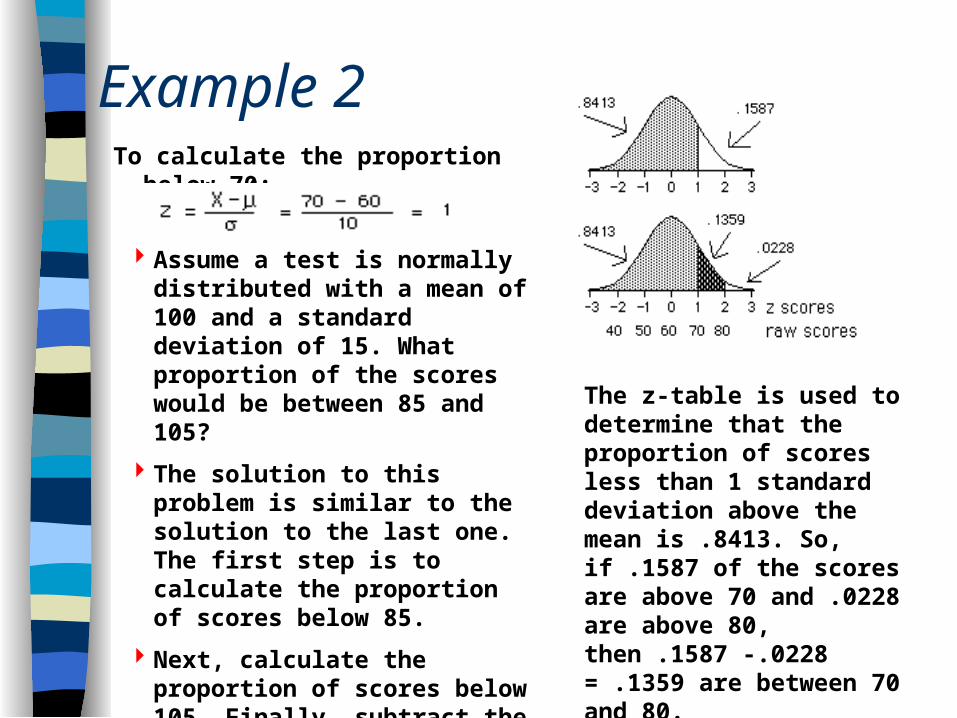
The z-table is used to determine that the proportion of scores less than 1 standard deviation above the mean is .8413. So, if .1587 of the scores are above 70 and .0228 are above 80, then .1587 -.0228 = .1359 are between 70 and 80.
Assume a test is normally distributed with a mean of 100 and a standard deviation of 15. What proportion of the scores would be between 85 and 105?
The solution to this problem is similar to the solution to the last one. The first step is to calculate the proportion of scores below 85.
Next, calculate the proportion of scores below 105. Finally, subtract the first result from the second to find the proportion scoring between 85 and 105.
Example 2
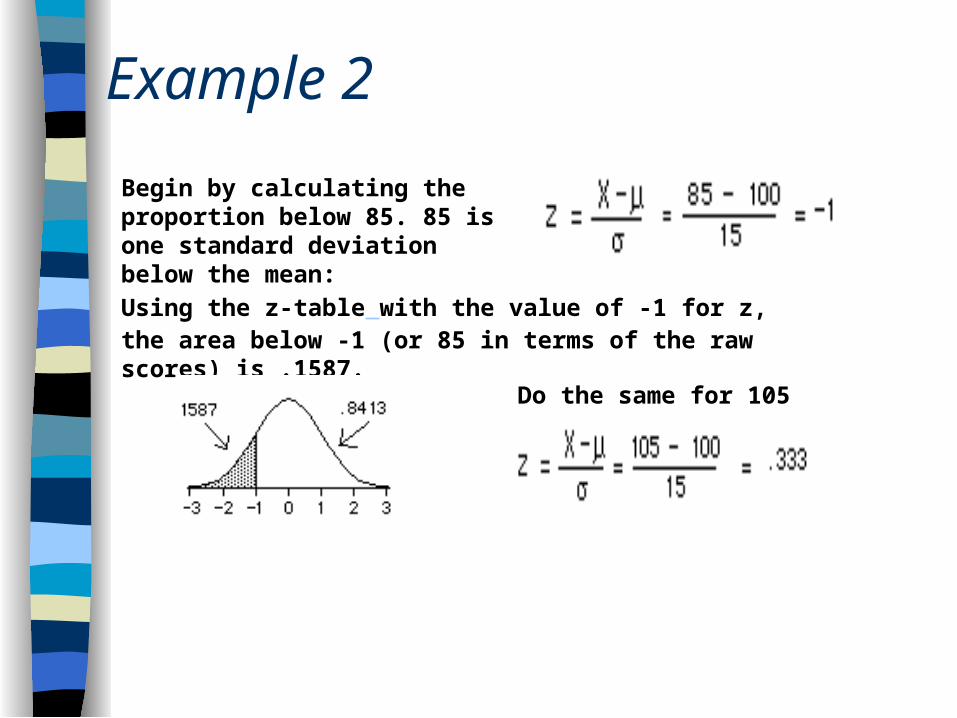
Begin by calculating the proportion below 85. 85 is one standard deviation below the mean:
Using the z-table with the value of -1 for z, the area below -1 (or 85 in terms of the raw scores) is .1587.
Do the same for 105
Example 2
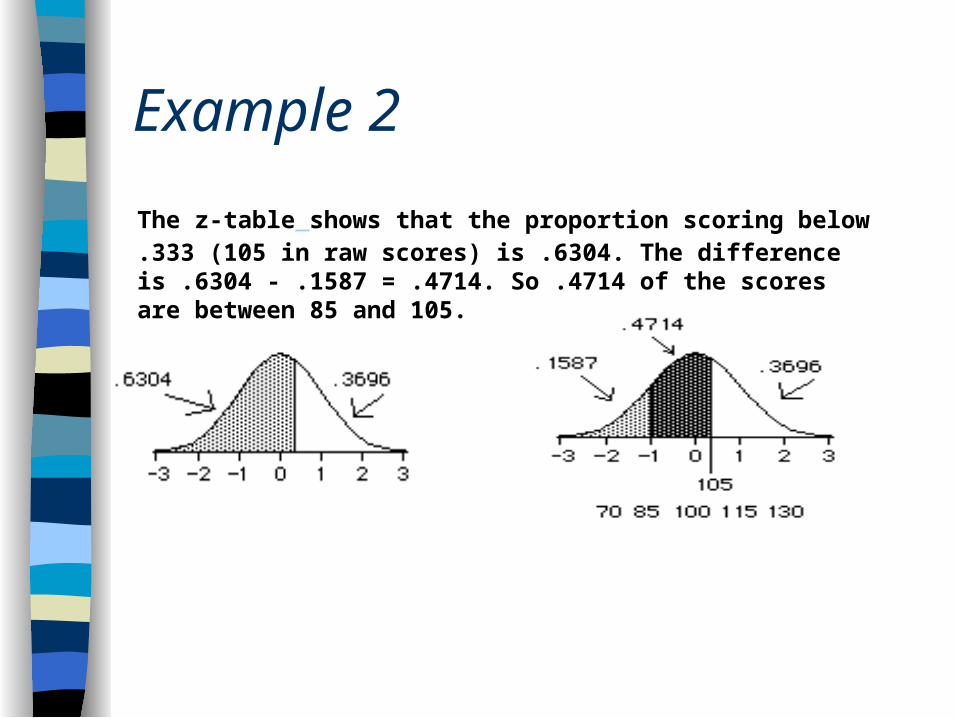
The z-table shows that the proportion scoring below .333 (105 in raw scores) is .6304. The difference is .6304 - .1587 = .4714. So .4714 of the scores are between 85 and 105.
Sampling Distributions
Sampling Distributions If you compute the mean of a sample of 10 numbers, the
value you obtain will not equal the population mean exactly; by chance it will be a little bit higher or a little bit lower.
If you sampled sets of 10 numbers over and over again (computing the mean for each set), you would find that some sample means come much closer to the population mean than others. Some would be higher than the population mean and some would be lower.
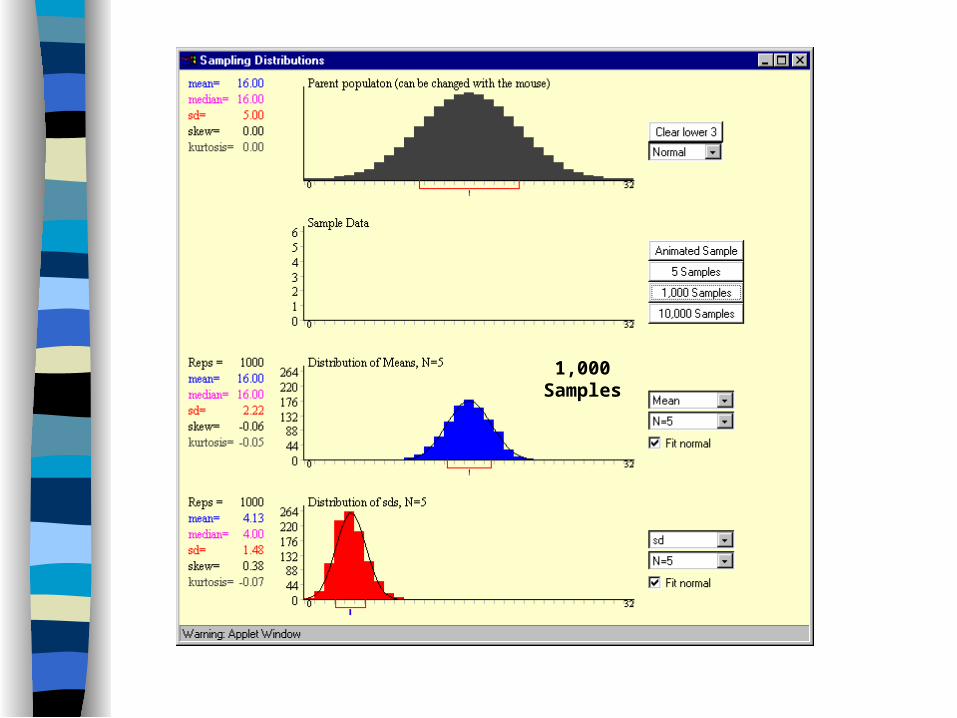
Imagine sampling 10 numbers and computing the mean over and over again, say about 1,000 times, and then constructing a relative frequency distribution of those 1,000 means.
Sampling Distributions
The distribution of means is a very good approximation to the sampling distribution of the mean.
The sampling distribution of the mean is a theoretical distribution that is approached as the number of samples in the relative frequency distribution increases.
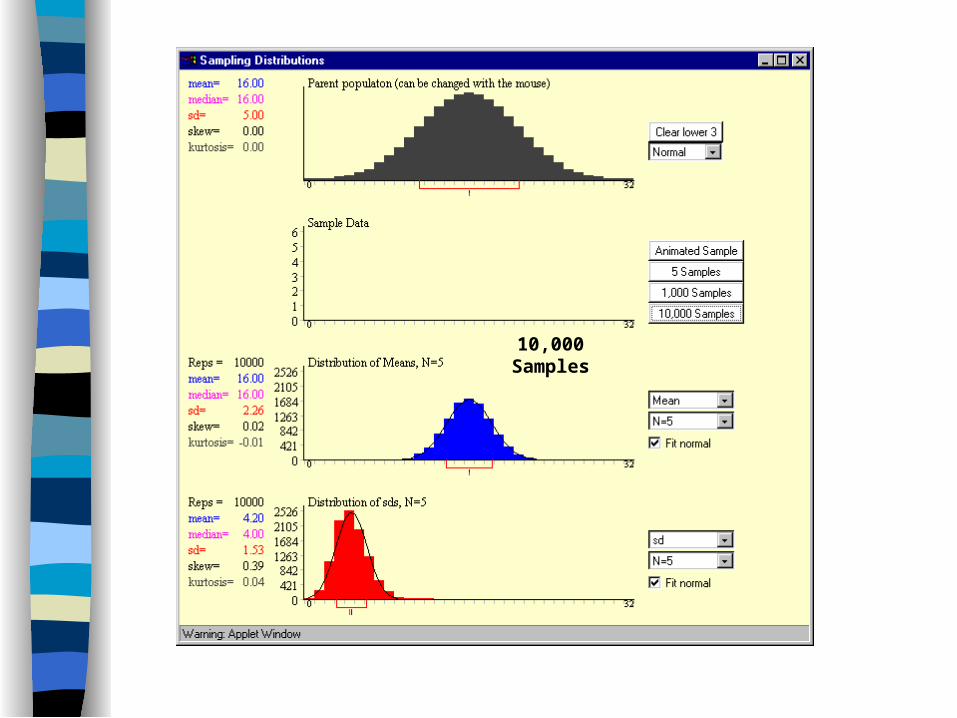
With 1,000 samples, the relative frequency distribution is quite close; with 10,000 it is even closer.
As the number of samples approaches infinity, the relative frequency distribution approaches the sampling distribution
Sampling Distributions
The sampling distribution of the mean for a sample size of 10 was just an example; there is a different sampling distribution for other sample sizes.
Also, keep in mind that the relative frequency distribution approaches a sampling distribution as the number of samples increases, not as the sample size increases since there is a different sampling distribution for each sample size.
Sampling Distributions A sampling distribution can also be defined as the
relative frequency distribution that would be obtained if all possible samples of a particular sample size were taken.
For example, the sampling distribution of the mean for a sample size of 10 would be constructed by computing the mean for each of the possible ways in which 10 scores could be sampled from the population and creating a relative frequency distribution of these means.
Although these two definitions may seem different, they are actually the same: Both procedures produce exactly the same sampling distribution.
Sampling DistributionsStatistics other than the mean have sampling
distributions too. The sampling distribution of the median is the distribution that would result if the median instead of the mean were computed in each sample.
Students often define "sampling distribution" as the sampling distribution of the mean. That is a serious mistake.
Sampling distributions are very important since almost all inferential statistics are based on sampling distributions.
The sampling distribution of the mean is a very important distribution. In later chapters you will see that it is used to construct confidence intervals for the mean and for significance testing.
Given a population with a mean of and a standard deviation of , the sampling distribution of the mean has a mean of and a standard deviation of N , where N is the sample size.
The standard deviation of the sampling distribution of the mean is called the standard error of the mean. It is designated by the symbol .
Sampling Distribution of the mean
Sampling Distribution of the mean
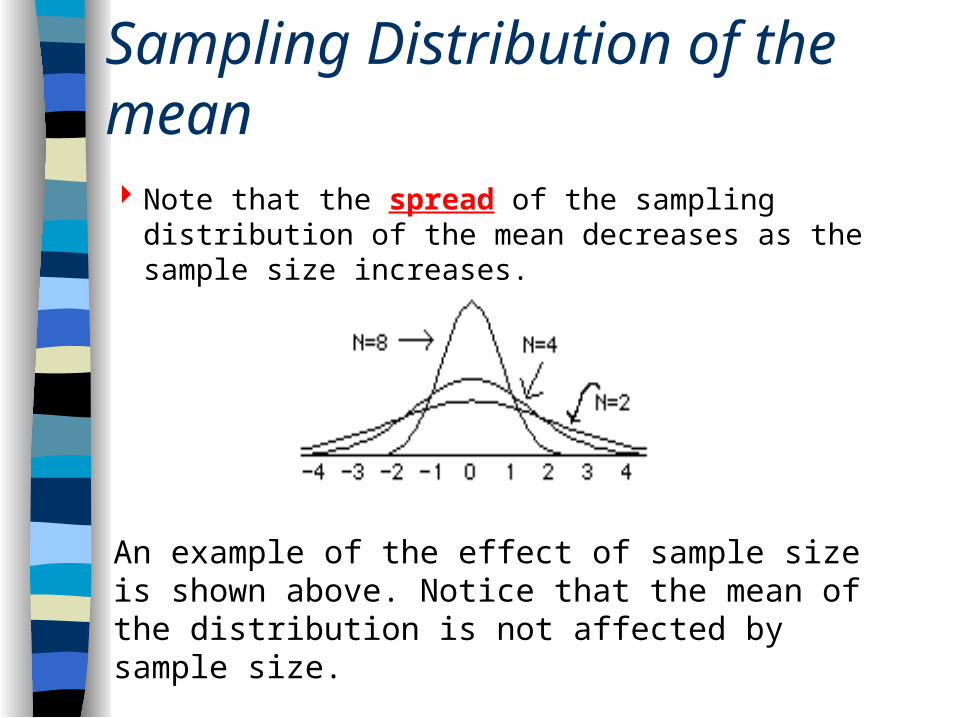
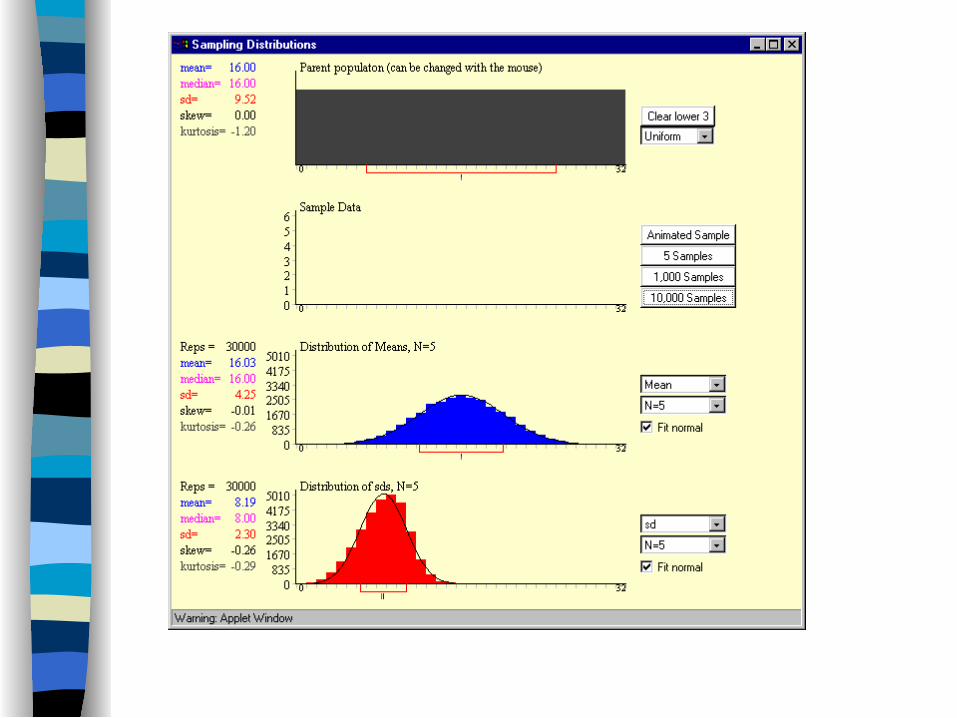
Note that the spread of the sampling distribution of the mean decreases as the sample size increases.
An example of the effect of sample size is shown above. Notice that the mean of the distribution is not affected by sample size.
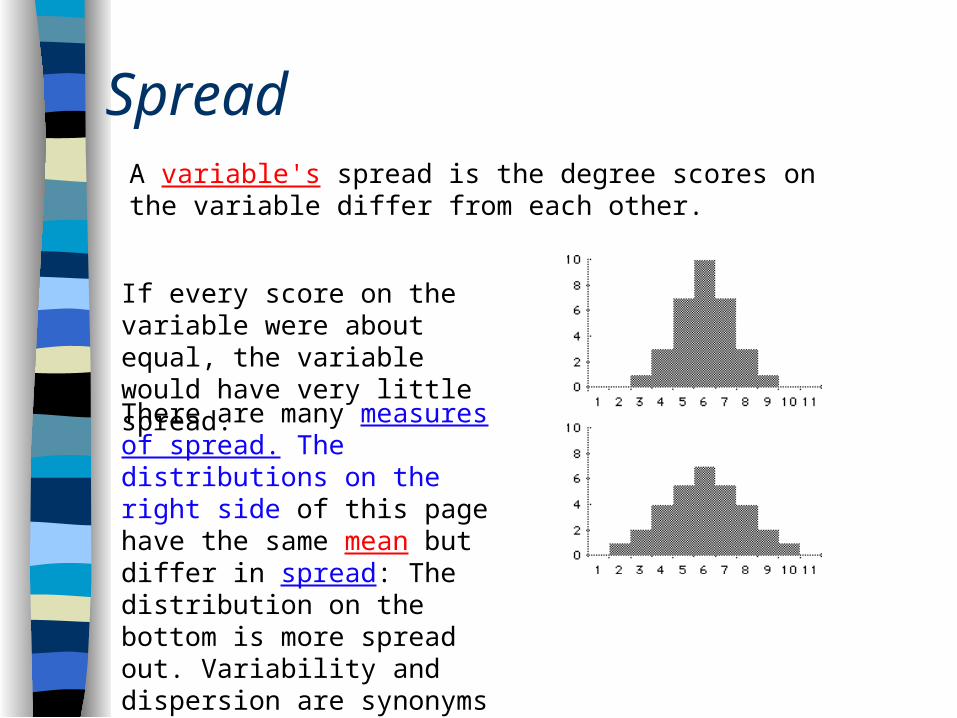
SpreadA variable's spread is the degree scores on the variable differ from each other.
If every score on the variable were about equal, the variable would have very little spread.
There are many measures of spread. The distributions on the right side of this page have the same mean but differ in spread: The distribution on the bottom is more spread out. Variability and dispersion are synonyms for spread.

5 Samples
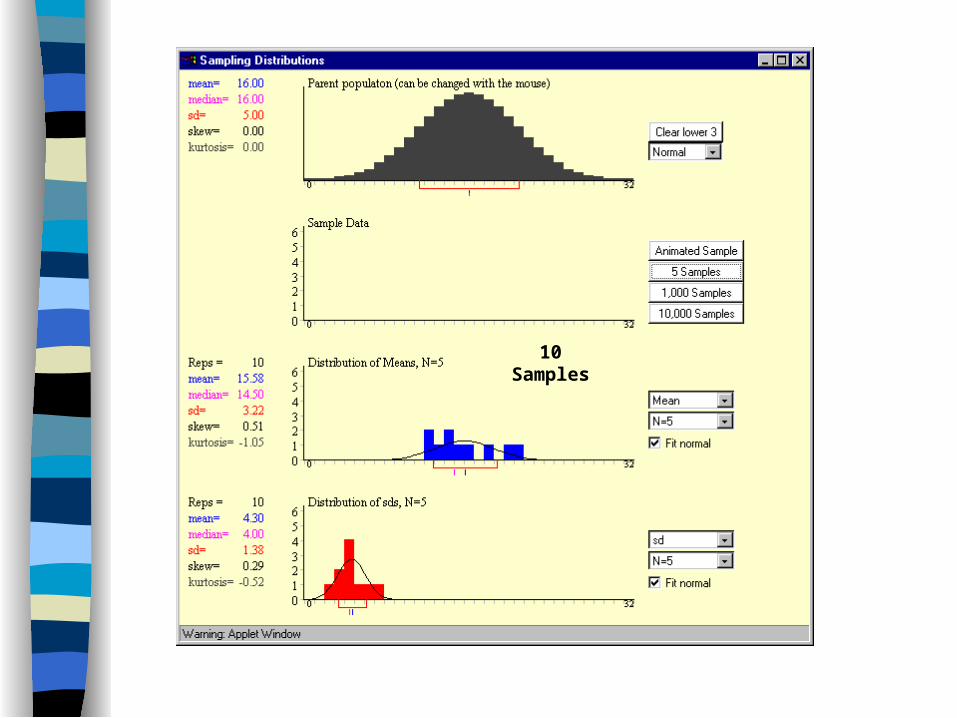
10 Samples
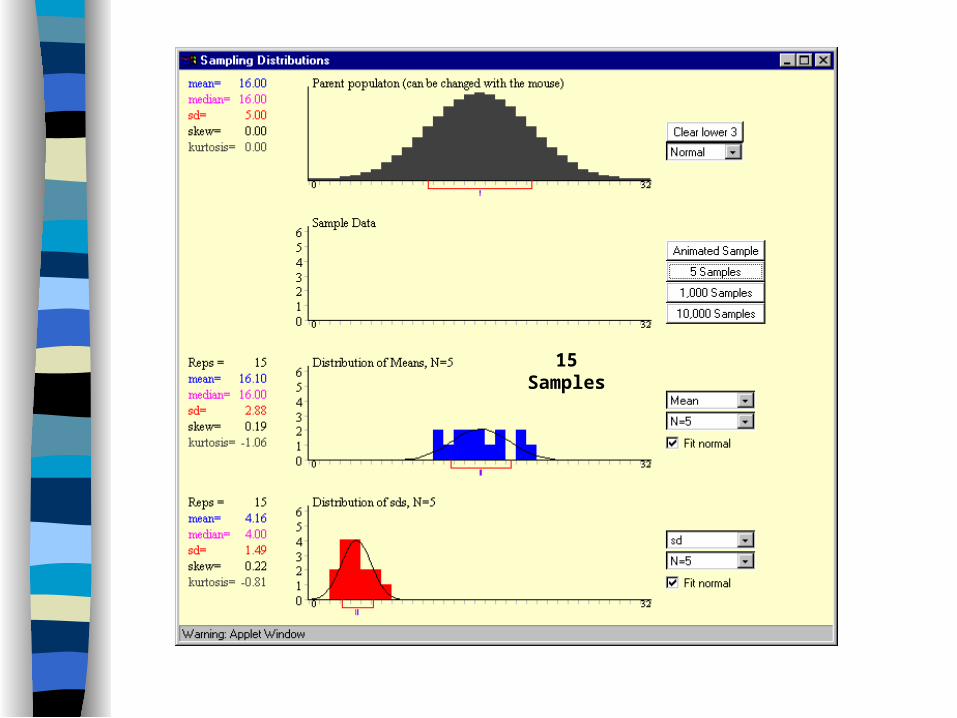
15 Samples
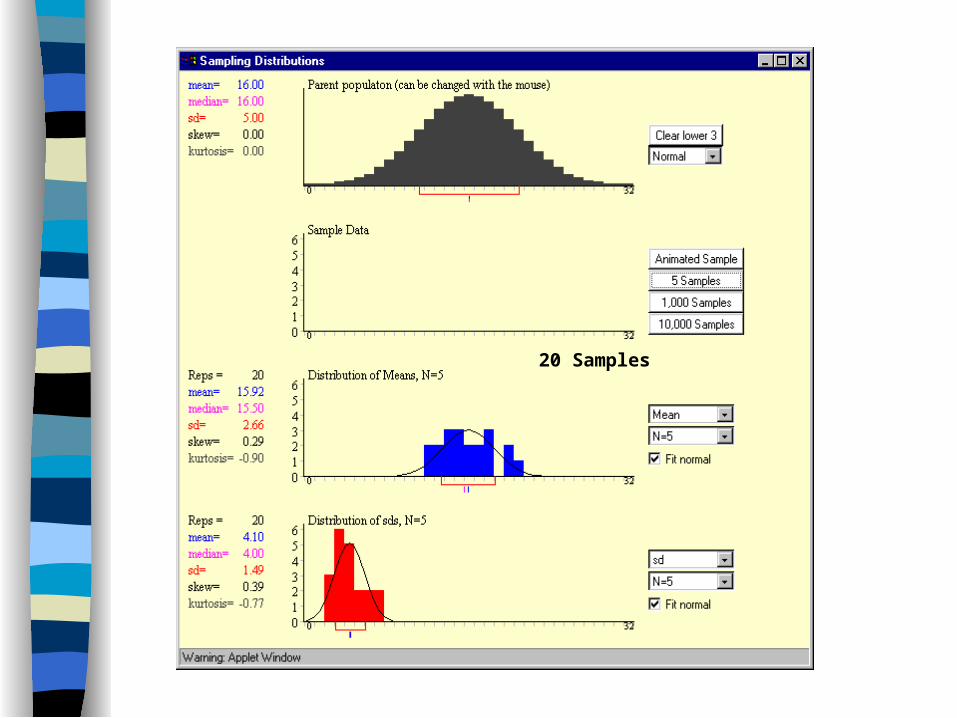
20 Samples
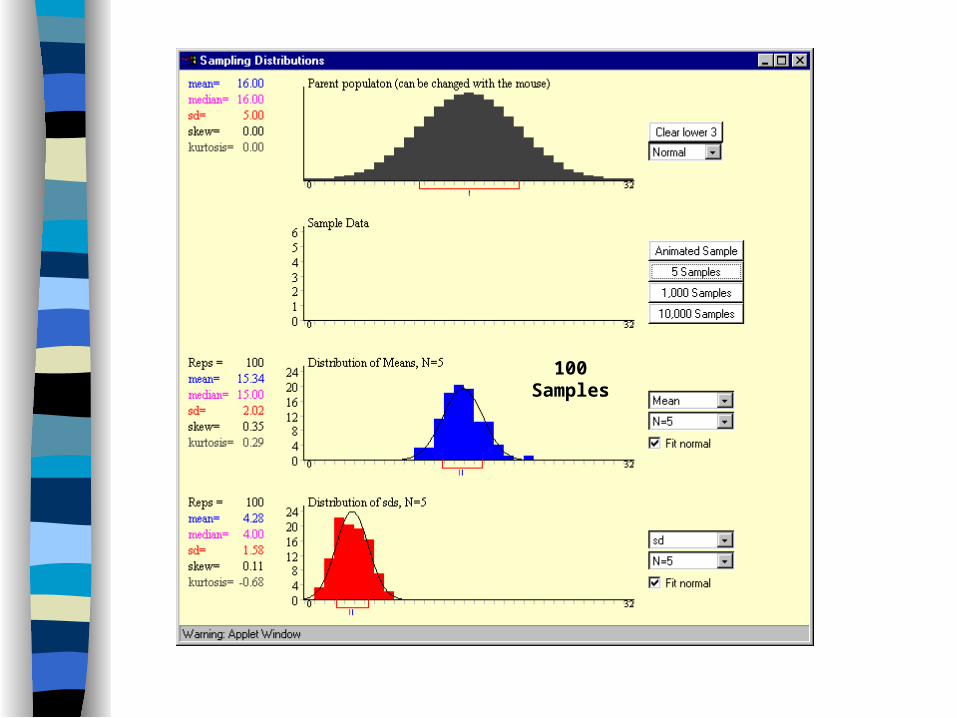
100 Samples
1,000 Samples
10,000 Samples
Hypothesis Testing
Classical Approach The Classical Approach to hypothesis testing is to
compare a test statistic and a critical value. It is best used for distributions which give areas and require you to look up the critical value (like the Student's t distribution) rather than distributions which have you look up a test statistic to find an area (like the normal distribution).
The Classical Approach also has three different decision rules, depending on whether it is a left tail, right tail, or two tail test.
One problem with the Classical Approach is that if a different level of significance is desired, a different critical value must be read from the table.
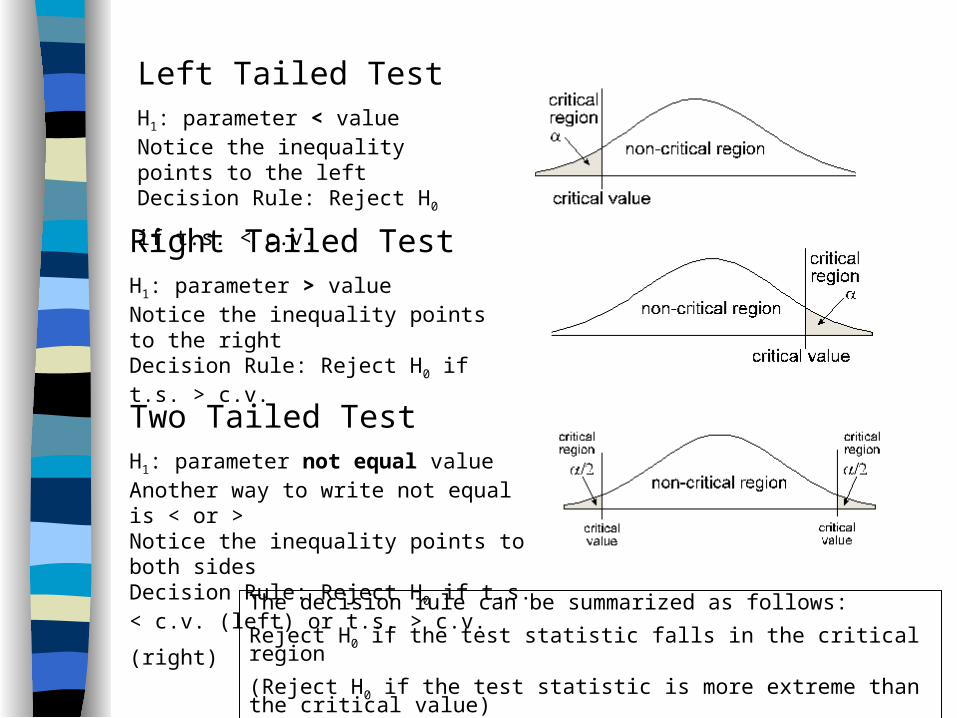
Left Tailed TestH1: parameter < valueNotice the inequality points to the left
Decision Rule: Reject H0 if t.s. < c.v.
Right Tailed TestH1: parameter > valueNotice the inequality points to the right Decision Rule: Reject H0 if t.s. > c.v.
Two Tailed TestH1: parameter not equal valueAnother way to write not equal is < or >Notice the inequality points to both sides Decision Rule: Reject H0 if t.s. < c.v. (left) or
t.s. > c.v. (right) The decision rule can be summarized as follows:
Reject H0 if the test statistic falls in the critical region
(Reject H0 if the test statistic is more extreme than the critical value)
P-Value Approach The P-Value Approach, short for Probability Value, approaches
hypothesis testing from a different manner. Instead of comparing z-scores or t-scores as in the classical approach, you're comparing probabilities, or areas.
The level of significance (alpha) is the area in the critical region. That is, the area in the tails to the right or left of the critical values.
The p-value is the area to the right or left of the test statistic. If it is a two tail test, then look up the probability in one tail and double it.
If the test statistic is in the critical region, then the p-value will be less than the level of significance. It does not matter whether it is a left tail, right tail, or two tail test. This rule always holds.
Reject the null hypothesis if the p-value is less than the level of significance.
P-Value Approach (Cont’d)
You will fail to reject the null hypothesis if the p-value is greater than or equal to the level of significance.
The p-value approach is best suited for the normal distribution when doing calculations by hand. However, many statistical packages will give the p-value but not the critical value. This is because it is easier for a computer or calculator to find the probability than it is to find the critical value.
Another benefit of the p-value is that the statistician immediately knows at what level the testing becomes significant. That is, a p-value of 0.06 would be rejected at an 0.10 level of significance, but it would fail to reject at an 0.05 level of significance. Warning: Do not decide on the level of significance after calculating the test statistic and finding the p-value.
P-Value Approach (Cont’d)
Any proportion equivalent to the following statement is correct:
The test statistic is to the p-value as the critical value is to the level of significance.
Process Control ChartsSlide 1 of 37
Process Charts– Tools for monitoring process variation.– The figure on the following slide shows a
process control chart. It has an upper limit, a center line, and a lower limit.
Process Control ChartsSlide 2 of 37
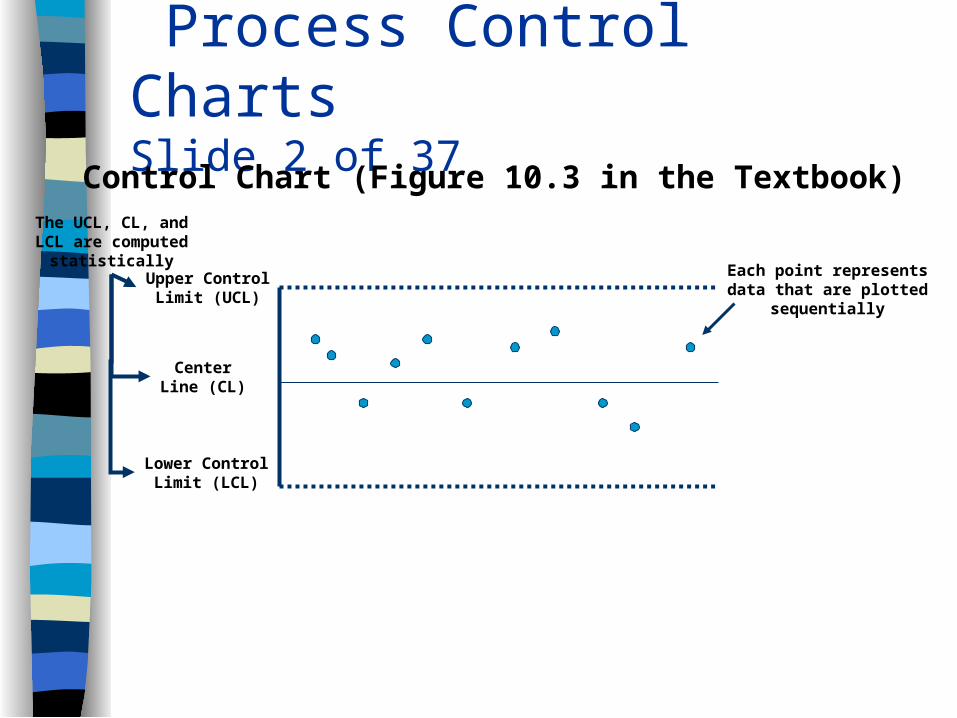
Control Chart (Figure 10.3 in the Textbook)
Upper ControlLimit (UCL)
Lower ControlLimit (LCL)
CenterLine (CL)
The UCL, CL, andLCL are computed
statisticallyEach point representsdata that are plotted
sequentially
Process Control ChartsSlide 3 of 37
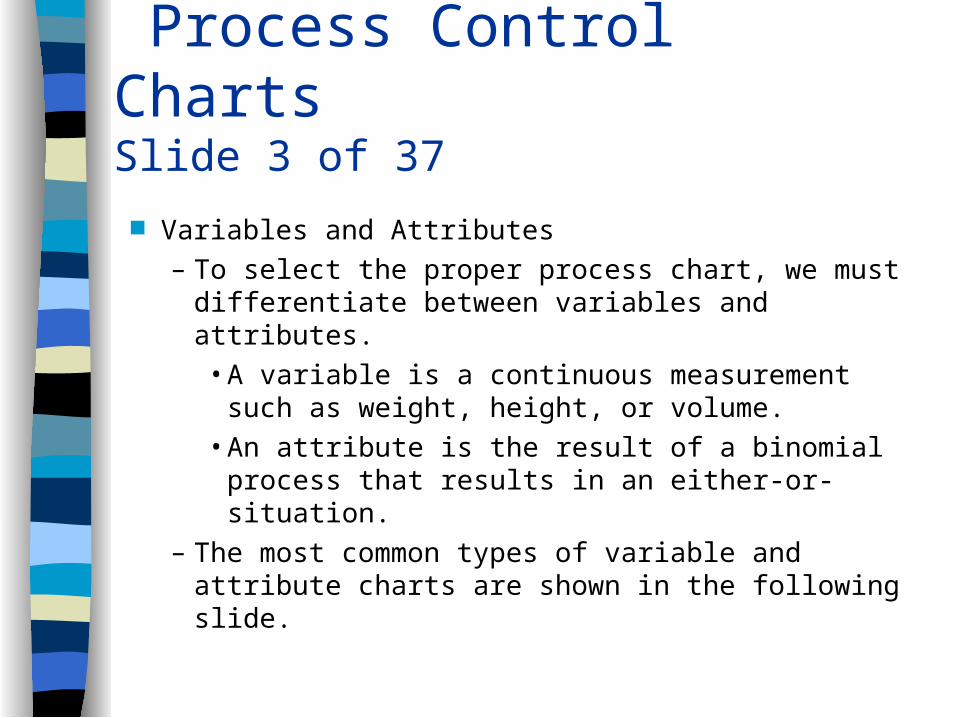
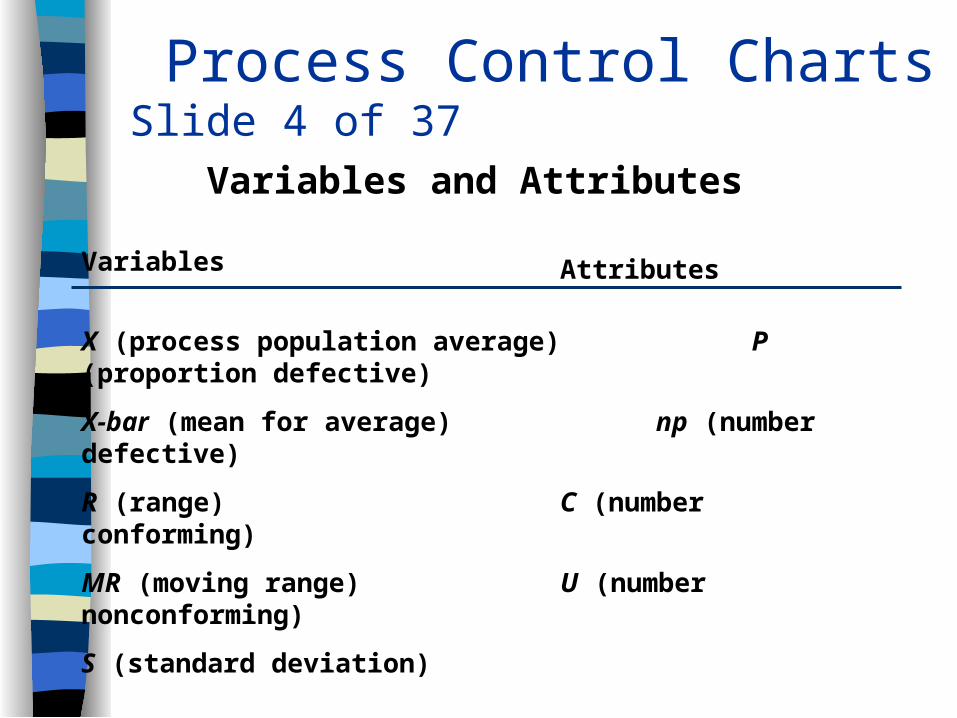
Variables and Attributes
– To select the proper process chart, we must differentiate between variables and attributes.
• A variable is a continuous measurement such as weight, height, or volume.
• An attribute is the result of a binomial process that results in an either-or-situation.
– The most common types of variable and attribute charts are shown in the following slide.
Process Control ChartsSlide 4 of 37
Variables and Attributes
Variables Attributes
X (process population average) P (proportion defective)
X-bar (mean for average) np (number defective)
R (range) C (number conforming)
MR (moving range) U (number nonconforming)
S (standard deviation)
Process Control ChartsSlide 5 of 37
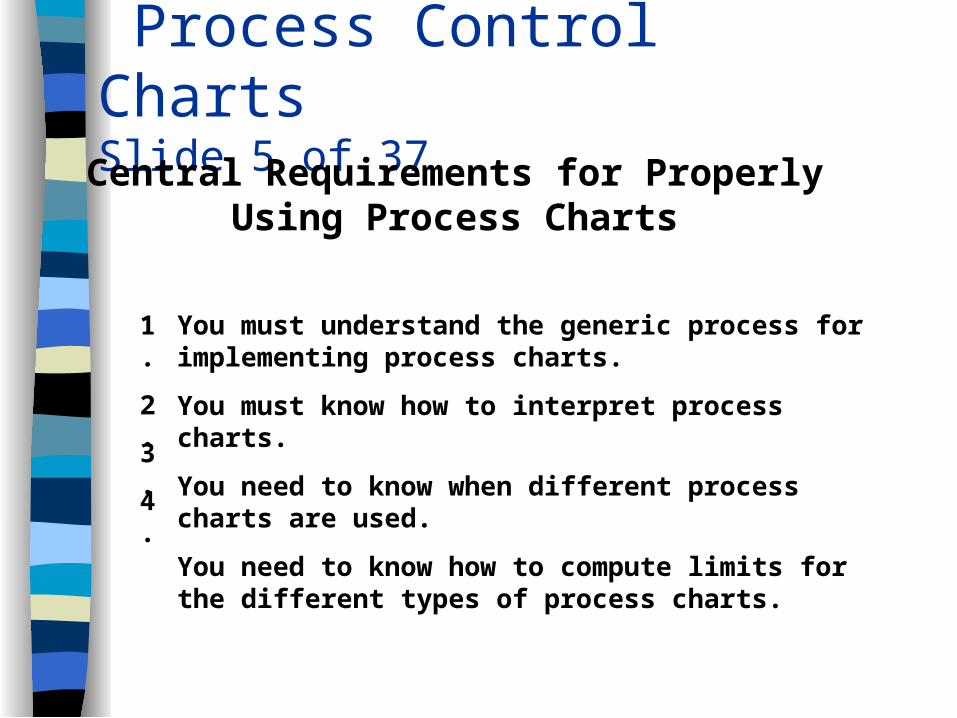
Central Requirements for Properly Using Process Charts
1. You must understand the generic process for implementing process charts.
You must know how to interpret process charts.
You need to know when different process charts are used.
You need to know how to compute limits for the different types of process charts.
4.
3.
2.
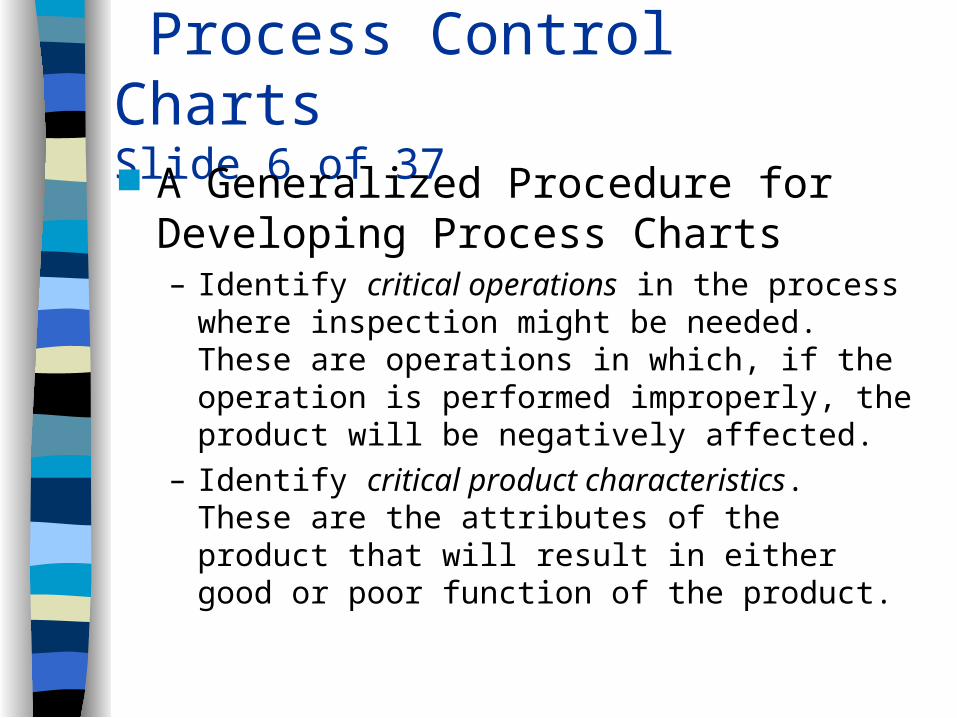
Process Control ChartsSlide 6 of 37 A Generalized Procedure for
Developing Process Charts– Identify critical operations in the process where
inspection might be needed. These are operations in which, if the operation is performed improperly, the product will be negatively affected.
– Identify critical product characteristics. These are the attributes of the product that will result in either good or poor function of the product.
Process Control ChartsSlide 7 of 37
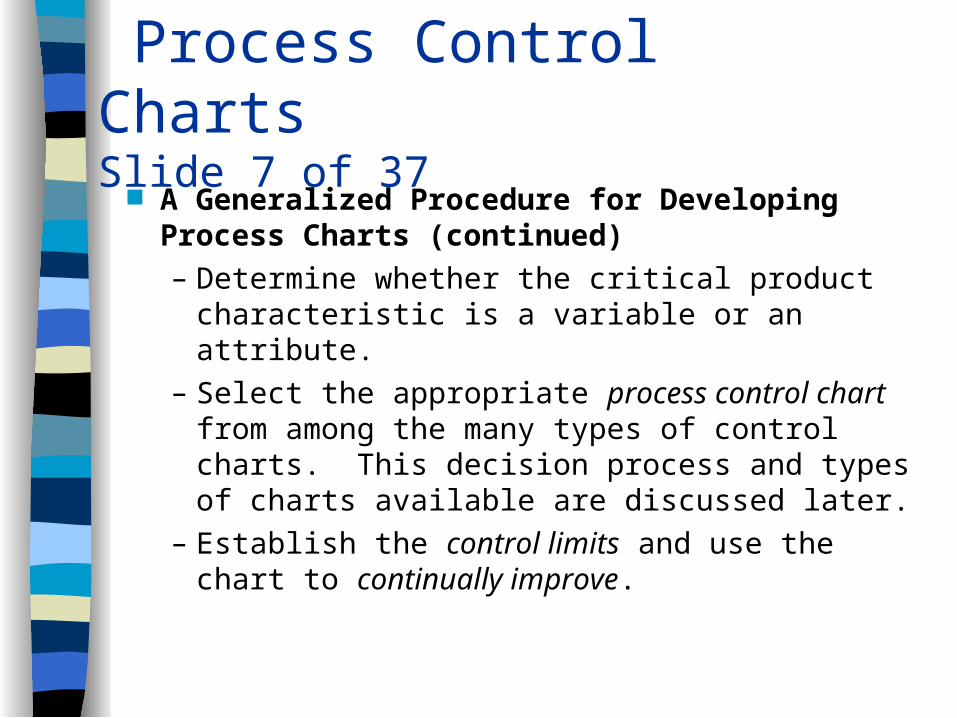
A Generalized Procedure for Developing Process Charts (continued)
– Determine whether the critical product characteristic is a variable or an attribute.
– Select the appropriate process control chart from among the many types of control charts. This decision process and types of charts available are discussed later.
– Establish the control limits and use the chart to continually improve.
Process Control ChartsSlide 8 of 37
A Generalized Procedure for Developing Process Charts (continued)– Update the limits when changes have been
made to the process.
Process Control ChartsSlide 9 of 37 Understanding Control Charts
– A process chart is nothing more than an application of hypothesis testing where the null hypothesis is that the product meets requirements.
• An X-bar chart is a variables chart that monitors average measurement.
• An example of how to best understand control charts is provided under the heading “Understanding Control Charts” in the textbook.
Process Control ChartsSlide 10 of 37 X-bar and R Charts
– The X-bar chart is a process chart used to monitor the average of the characteristics being measured. To set up an X-bar chart select samples from the process for the characteristic being measured. Then form the samples into rational subgroups. Next, find the average value of each sample by dividing the sums of the measurements by the sample size and plot the value on the process control X-bar chart.
Process Control ChartsSlide 11 of 37
X-bar and R Charts (continued)– The R chart is used to monitor the variability or
dispersion of the process. It is used in conjunction with the X-bar chart when the process characteristic is variable. To develop an R chart, collect samples from the process and organize them into subgroups, usually of three to six items. Next, compute the range, R, by taking the difference of the high value in the subgroup minus the low value. Then plot the R values on the R chart.
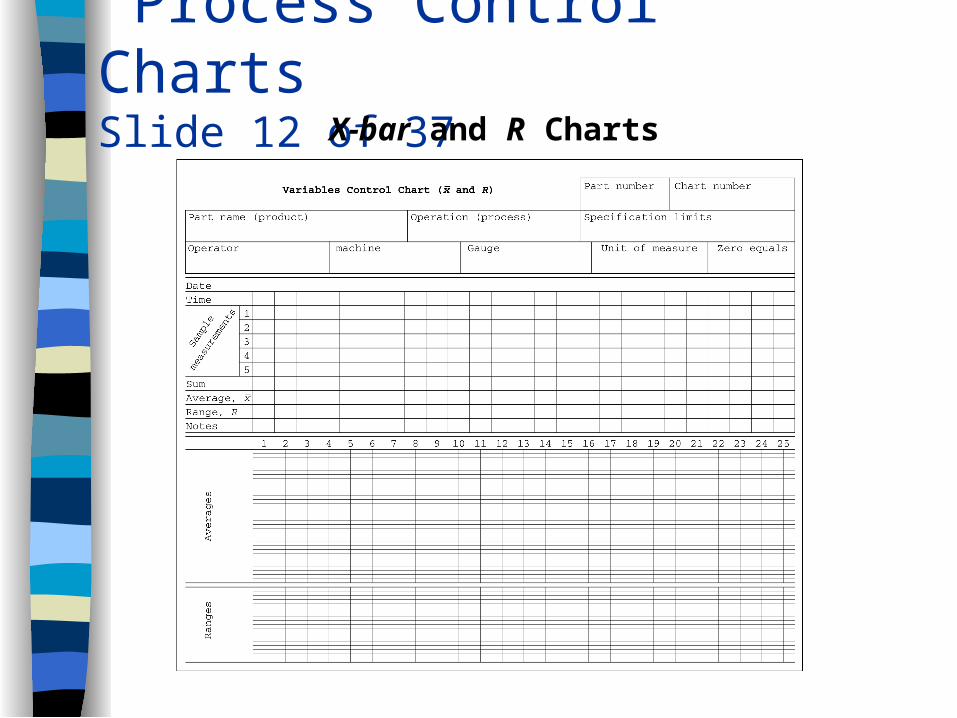
Process Control ChartsSlide 12 of 37
X-bar and R Charts
Process Control ChartsSlide 13 of 37
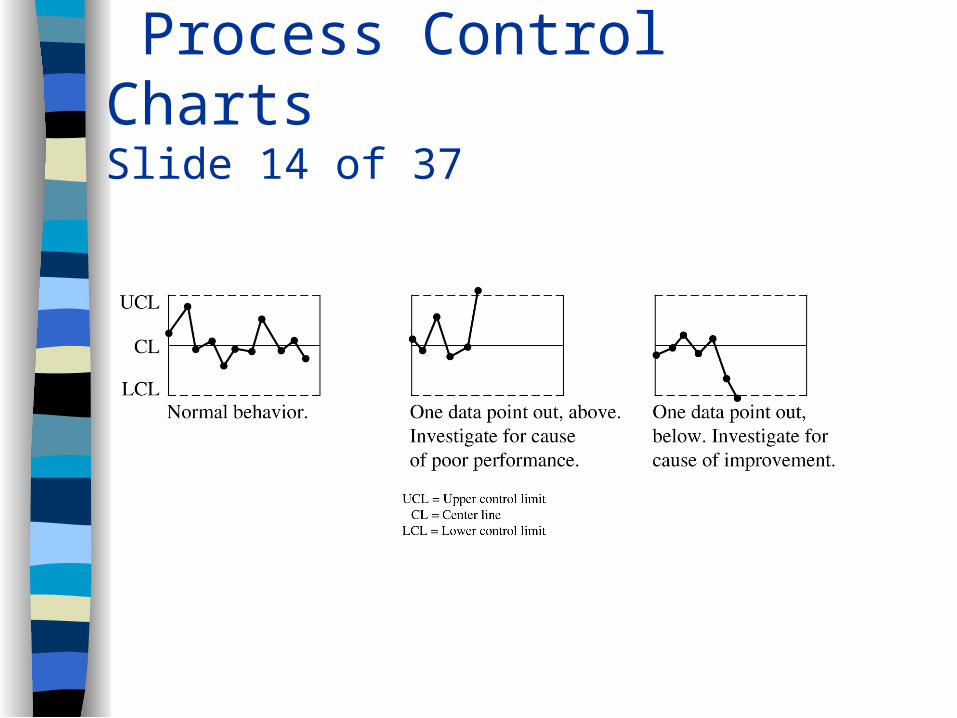
Interpreting Control Charts– Before introducing other types of process charts,
we discuss the interpretation of the charts. – The figures in the next several slides show
different signals for concern that are sent by a control chart, as in the second and third boxes. When a point is found to be outside of the control limits, we call this an “out of control” situation. When a process is out of control, the variation is probably not longer random.
Process Control ChartsSlide 14 of 37
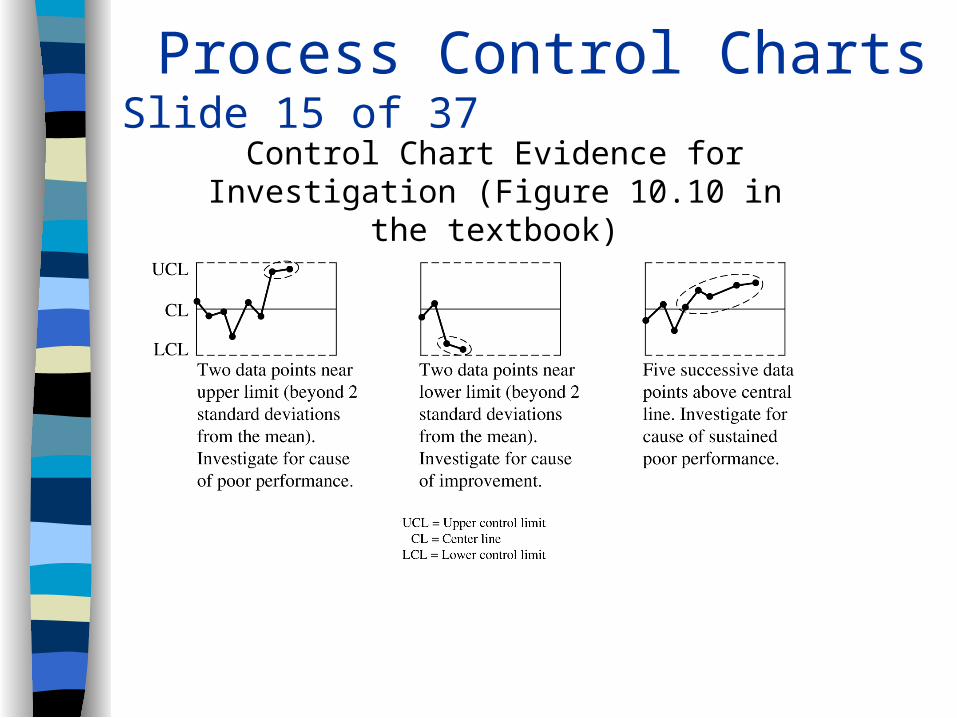
Process Control ChartsSlide 15 of 37
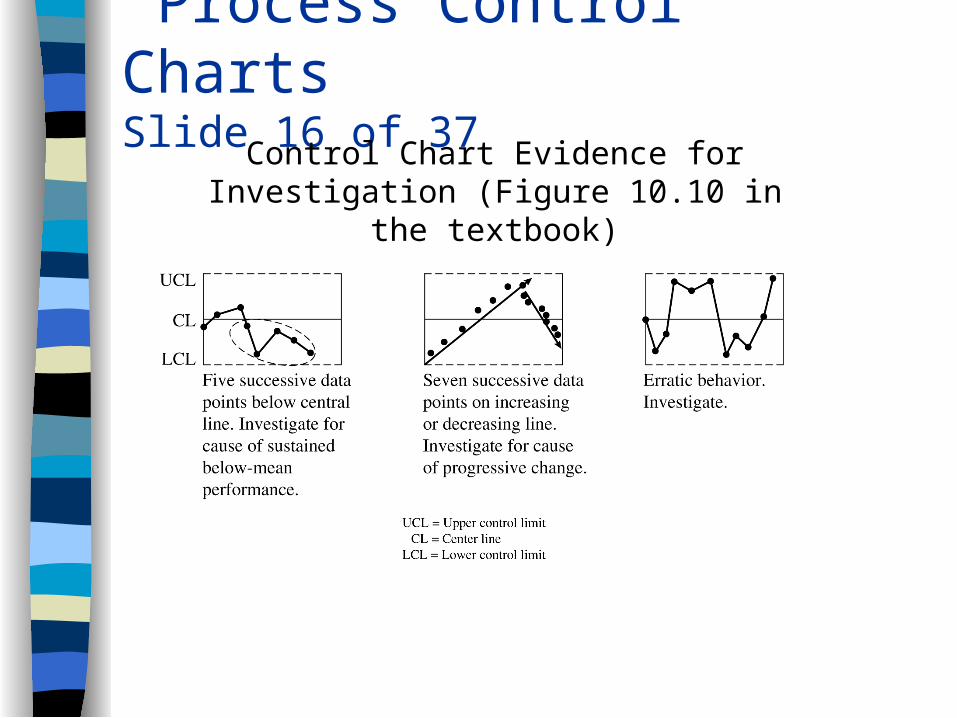
Control Chart Evidence for Investigation (Figure 10.10 in the textbook)
Process Control ChartsSlide 16 of 37
Control Chart Evidence for Investigation (Figure 10.10 in the textbook)
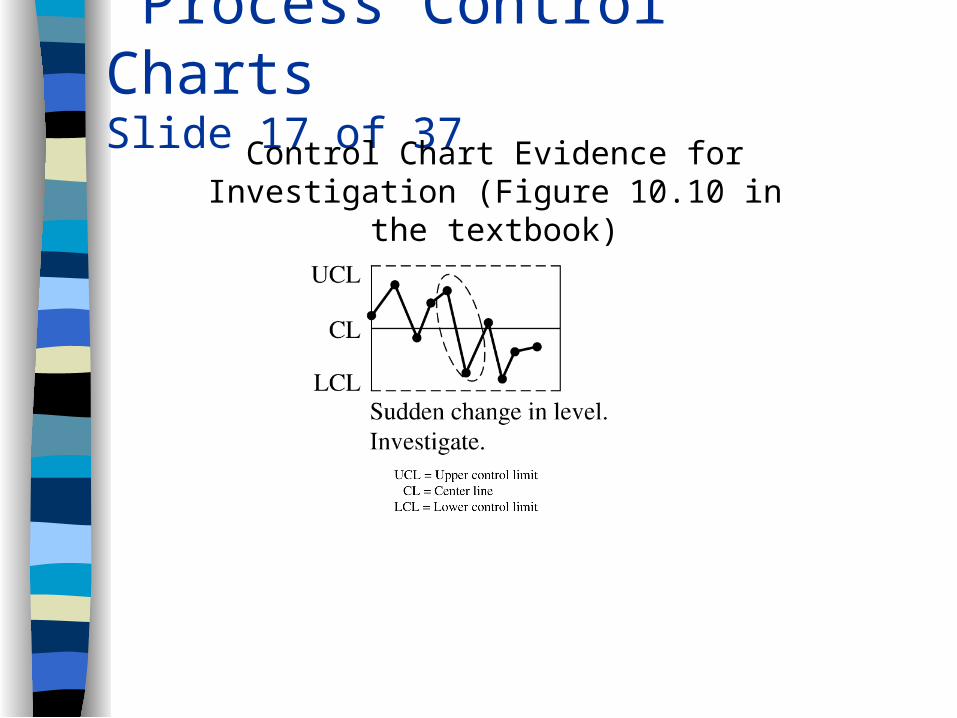
Process Control ChartsSlide 17 of 37
Control Chart Evidence for Investigation (Figure 10.10 in the textbook)
Process Control ChartsSlide 18 of 37 Implications of a Process Out of Control
– If a process loses control and becomes nonrandom, the process should be stopped immediately.
– In many modern process industries where just-in-time is used, this will result in the stoppage of several work stations.
– The team of workers who are to address the problem should use a structured problem solving process.
Process Control ChartsSlide 19 of 37
X and Moving Range (MR) Charts for Population Data– At times, it may not be possible to draw
samples. This may occur because a process is so slow that only one or two units per day are produced.
– If you have a variable measurement that you want to monitor, the X and MR charts might be the thing for you.
Process Control ChartsSlide 20 of 37
X and Moving Range (MR) Charts for Population Data (continued)– X chart. A chart used to monitor the mean
of a process for population values.– MR chart. A chart for plotting variables
when samples are not possible.– If data are not normally distributed, other
charts are available.
Process Control ChartsSlide 21 of 37 g and h Charts
– A g chart is used when data are geometrically distributed, and h charts are useful when data are hypergeometrically distributed.
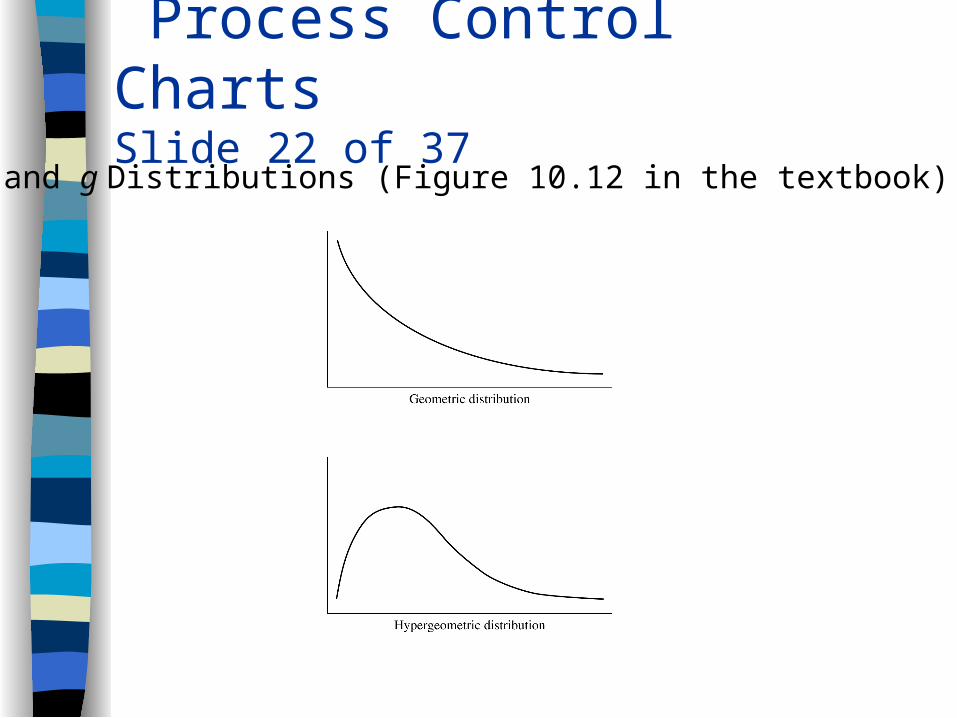
– The next slide presents pictures of geometric and hypergeometric distributions. If you develop a histogram of your data, and it appears like either of these distributions, you may want to use either an h or a g chart instead of an X chart.
Process Control ChartsSlide 22 of 37
h and g Distributions (Figure 10.12 in the textbook)
Process Control ChartsSlide 23 of 37 Control Charts for Attributes
– We now shift to charts for attributes. These charts deal with binomial and Poisson processes that are not measurements.
– We will now be thinking in terms of defects and defectives rather than diameters or widths.
• A defect is an irregularity or problem with a larger unit.
• A defective is a unit that, as a whole, is not acceptable or does not meet specifications.
Process Control ChartsSlide 24 of 37
p Charts for Proportion Defective– The p chart is a process chart that is used to
graph the proportion of items in a sample that are defective (nonconforming to specifications)
– p charts are effectively used to determine when there has been a shift in the proportion defective for a particular product or service.
– Typical applications of the p chart include things like late deliveries, incomplete orders, and clerical errors on written forms.
Process Control ChartsSlide 25 of 37
np Charts– The np chart is a graph of the number of
defectives (or nonconforming units) in a subgroup. The np chart requires that the sample size of each subgroup be the same each time a sample is drawn.
– When subgroup sizes are equal, either the p or np chart can be used. They are essentially the same chart.
Process Control ChartsSlide 26 of 37
np Charts (continued)– Some people find the np chart easier to
use because it reflects integer numbers rather than proportions. The uses for the np chart are essentially the same as the uses for the p chart.
Process Control ChartsSlide 27 of 37
c and u Charts– The c chart is a graph of the number of
defects (nonconformities) per unit. The units must be of the same sample space; this includes size, height, length, volume and so on. This means that the “area of opportunity” for finding defects must be the same for each unit. Several individual unites can comprise the sample but they will be grouped as if they are one unit of a larger size.

Process Control ChartsSlide 28 of 37
c and u Charts (continued)– Like other process charts, the c chart is
used to detect nonrandom events in the life of a production process. Typical applications of the c chart include number of flaws in an auto finish, number of flaws in a standard typed letter, and number of incorrect responses on a standardized test
Process Control ChartsSlide 29 of 37
c and u Charts (continued)– The u chart is a graph of the average number of
defects per unit. This is contrasted with the c chart, which shows the actual number of defects per standardized unit.
– The u chart allows for the units sampled to be different sizes, areas, heights and so on, and allows for different numbers of units in each sample space. The uses for the u chart are the same as the c chart.
Process Control ChartsSlide 30 of 37
Other Control Charts– s Chart. The s (standard deviation) chart is
used in place of the R chart when a more sensitive chart is desired. These charts are commonly used in semiconductor production where process dispersion is watched very closely.
Process Control ChartsSlide 31 of 37
Other Control Charts (continued)– Moving Average Chart. The moving
average chart is an interesting chart that is used for monitoring variables and measurement on a continuous scale.
– The chart uses past information to predict what the next process outcome will be. Using this chart, we can adjust a process in anticipation of its going out of control.
Process Control ChartsSlide 32 of 37
Other Control Charts (continued)– Cusum Chart. The cumulative sum, or
cusum, chart is used to identify slight but sustained shifts in a universe where there is no independence between observations.
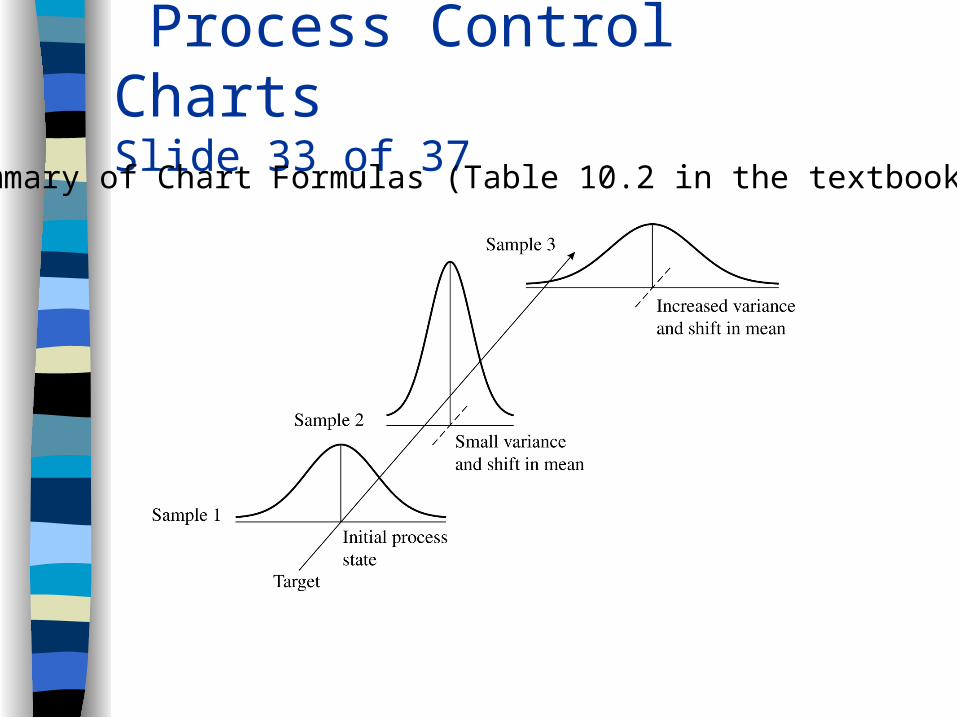
Process Control ChartsSlide 33 of 37
Summary of Chart Formulas (Table 10.2 in the textbook)
Process Control ChartsSlide 34 of 37
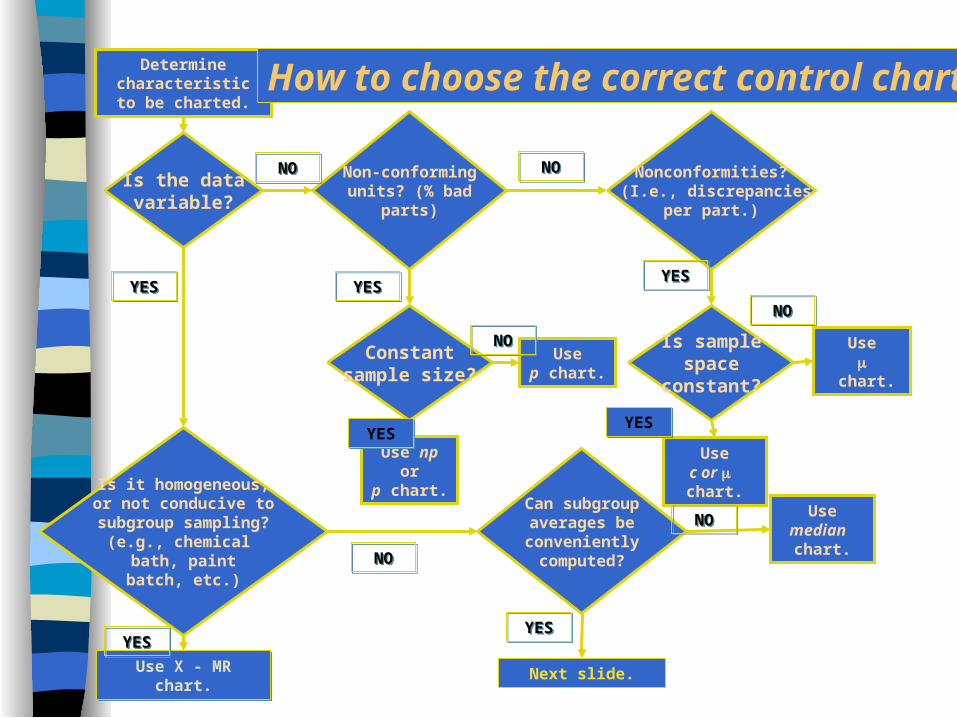
Some Control Chart Concepts– Choosing the Correct Control Chart
• Obviously, it is key to choose the correct control chart. Figure 10.19 in the textbook shows a decision tree for the basic control charts. This flow chart helps to show when certain charts should be selected for use.
Process Control ChartsSlide 35 of 37
Some Control Chart Concepts (continued)– Corrective Action. When a process is out of control,
corrective action is needed. Correction action steps are similar to continuous improvement processes. They are
• Carefully identify the problem.• Form the correct team to evaluate and solve the
problem.• Use structured brainstorming along with fishbone
diagrams or affinity diagrams to identify causes of the problem.
Process Control ChartsSlide 36 of 37
Some Control Chart Concepts (continued)– Corrective Action (continued)
• Brainstorm to identify potential solutions to problems.
• Eliminate the cause.• Restart the process.• Document the problem, root causes, and
solutions.• Communicate the results of the process to all
personnel so that this process becomes reinforced and ingrained in the operations.
Process Control ChartsSlide 37 of 37
Some Control Chart Concepts (continued)– How Do We Use Control Charts to Continuously
Improve?• One of the goals of the control chart user is to
reduce variation. Over time, as processes are improved, control limits are recomputed to show improvements in stability. As upper and lower control limits get closer and closer together, the process improving.
• The focus of control charts should be on continuous improvement and they should be updated only when there is a change in the process.
Process CapabilitySlide 1 of 4
Process Stability and Capability– Once a process is stable, the next emphasis is
to ensure that the process is capable.
– Process capability refers to the ability of a process to produce a product that meets specifications.
– Six-sigma program such as those pioneered by Motorola Corporation result in highly capable processes.
Process CapabilitySlide 2 of 4
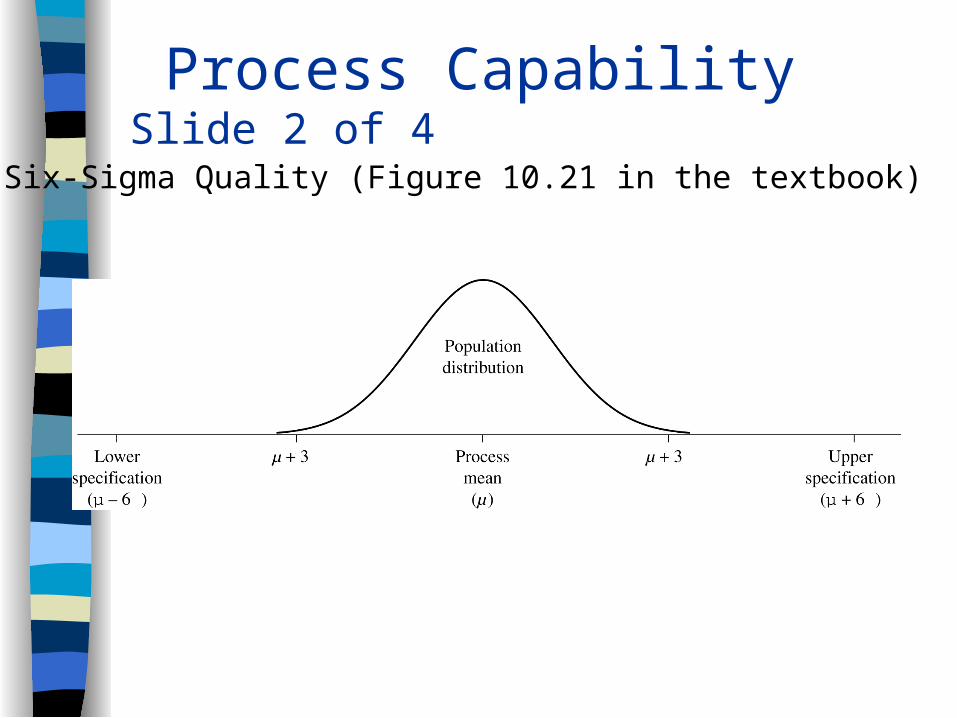
Six-Sigma Quality (Figure 10.21 in the textbook)
Process CapabilitySlide 3 of 4 Process Versus Sampling Distribution
– To understand process capability we must first understand the differences between population and sampling distributions.
• Population distributions are distributions with all the items or observations of interest to a decision maker.
• A population is defined as a collection of all the items or observations of interest to a decision maker.
• A sample is subset of the population. Sampling distributions are distributions that reflect the distributions of sample means.
Process CapabilitySlide 4 of 4
The Difference Between Capability and Stability?– Once again, a process is capable if
individual products consistently meet specifications.
– A process is stable if only common variation is present in the process.
Determine characteristicto be charted.
Is the datavariable?
Is it homogeneous,or not conducive to
subgroup sampling?(e.g., chemical
bath, paintbatch, etc.)
Non-conformingunits? (% bad
parts)
Constantsample size?
Nonconformities? (I.e., discrepancies
per part.)
Use np orp chart.
Usep chart.
Can subgroupaverages beconvenientlycomputed?
Usec or chart.
Is samplespace
constant?
Use
chart.
Usemedian chart.
NONO
NONO
NONO
NONO
NONO
NONO
YESYES YESYES
YESYES
YESYES
YESYES
Next slide.
YESYES
Use X - MR chart.Use X - MR chart.
YESYES
How to choose the correct control chart

Is the subgroupsize < 9?
Can subgroupaverages beconvenientlycomputed?
YESYES
Can s be calculatedfor each group?
Usemedian chart.
Usemedian chart.
Use.
Use. X - R chart
Use.
Use. X - R chart
Use.
Use. X - s chart
YESYES
YESYES
NONO
NONO
NONO
How to choose the correct control chart
(from previous page)
Related Documents


![ขั้นตอนการตรวจสอบการใช้งาน ระบบเครือข่าย [ Workgroup : ITED ]](https://static.cupdf.com/doc/110x72/56815081550346895dbe7ed0/56815081550346895dbe7ed0.jpg)