ITCAM Agents for WebSphere Applications, J2EE, and HTTP Servers Version 7.2 User Guide SC27-2817-03

Welcome message from author
This document is posted to help you gain knowledge. Please leave a comment to let me know what you think about it! Share it to your friends and learn new things together.
Transcript

ITCAM Agents for WebSphere Applications, J2EE, andHTTP ServersVersion 7.2
User Guide
SC27-2817-03
���


ITCAM Agents for WebSphere Applications, J2EE, andHTTP ServersVersion 7.2
User Guide
SC27-2817-03
���

Note
Before using this information and the product it supports, read the information in “Notices” on page 585.

Contents
About this guide . . . . . . . . . . viiWho should read this guide . . . . . . . . . viiPublications . . . . . . . . . . . . . . vii
ITCAM for Applications library for Agents forWebSphere Applications, J2EE, and HTTPServers . . . . . . . . . . . . . . . viiRelated publications . . . . . . . . . . viiiAccessing terminology online . . . . . . . ixAccessing publications online . . . . . . . ixOrdering publications . . . . . . . . . . ix
Accessibility . . . . . . . . . . . . . . xApplication Performance Management community onService Management Connect. . . . . . . . . xTivoli technical training. . . . . . . . . . . xSupporting information. . . . . . . . . . . xConventions used in this guide . . . . . . . . xi
Typeface conventions . . . . . . . . . . xiOperating-system-dependent variables and paths xiTivoli command syntax . . . . . . . . . xi
Part 1. Part 1: Introduction to theagents . . . . . . . . . . . . . . . 1
Chapter 1. Overview of the agents . . . 3Agent functionality . . . . . . . . . . . . 3User interfaces. . . . . . . . . . . . . . 4Components used by the Tivoli Enterprise Portal userinterface . . . . . . . . . . . . . . . . 5
The agents . . . . . . . . . . . . . . 5IBM Tivoli Monitoring components . . . . . . 6
Chapter 2. Scenarios . . . . . . . . . 9Scenario 1: Diagnosing a memory leak. . . . . . 9Scenario 2: Diagnosing hanging transactions . . . 11Scenario 3: Diagnosing a WebSphere servershutdown . . . . . . . . . . . . . . . 15Scenario 4: Determining if the WebSphere clusterneeds to be load balanced . . . . . . . . . 17Scenario 5: Determining the cause of high responsetimes . . . . . . . . . . . . . . . . 19Scenario 6: Determining the cause of connectionproblems . . . . . . . . . . . . . . . 25Scenario 7: Determining if the Garbage Collectionpolicy needs to be adjusted . . . . . . . . . 26Scenario 8: Troubleshooting application responsetime in an XD cell . . . . . . . . . . . . 28Scenario 9: Ensuring that jobs processed byCompute Grid do not execute for longer than onehour . . . . . . . . . . . . . . . . . 31
Part 2. Part 2: Using the agents. . . 35
Chapter 3. ITCAM Agent for WebSphereApplications . . . . . . . . . . . . 37Workspaces for ITCAM Agent for WebSphereApplications . . . . . . . . . . . . . . 39
Organization of the predefined workspaces . . . 39Summary workspaces . . . . . . . . . . 46Summary Workspace Views . . . . . . . . 48WebSphere agent summary workspace . . . . 49WebSphere agent summary status workspace . . 49Application Server Summary and BusinessProcess Manager Summary workspaces . . . . 50Resources and Applications workspaces . . . . 53Situation Mapping and Summary Workspaces . . 53Summary Workspaces error messages . . . . 56Configuration workspaces . . . . . . . . 57Workspace link to managing server visualizationengine . . . . . . . . . . . . . . . 61Workspace link to ITCAM for SOA . . . . . 70Alarm Manager workspace . . . . . . . . 71Allocation Failures workspace . . . . . . . 72Selected Application - Application Trend at L1workspace . . . . . . . . . . . . . . 72Selected Application - Application Trend atL2/L3 workspace . . . . . . . . . . . 73Application Health workspace . . . . . . . 73Application Registry workspace . . . . . . 75Business Process Manager workspace. . . . . 75Cache Analysis workspace . . . . . . . . 76Client Communications workspace . . . . . 77Container Object Pools workspace . . . . . . 78Container Transactions workspace . . . . . . 79Data sources workspace . . . . . . . . . 80DB Connection Pools workspace . . . . . . 82DCS Stacks workspace. . . . . . . . . . 84Destinations workspace . . . . . . . . . 85Durable Subscriptions workspace . . . . . . 86EJB Containers workspace . . . . . . . . 87Enterprise Java Beans workspace . . . . . . 89Garbage Collections - Selected Allocation Failureworkspace . . . . . . . . . . . . . . 90Garbage Collection Analysis workspace . . . . 90High Availability Manager workspace . . . . 92IMAP/POP workspace . . . . . . . . . 93J2C Connection Pools workspace . . . . . . 94JMS Summary workspace . . . . . . . . 96JVM Stack Trend workspace . . . . . . . . 97Log Analysis workspace . . . . . . . . . 98Lotus Workplace Server workspace . . . . . 99Messages Queues workspace . . . . . . . 99Messaging Engine Communications workspace 100Messaging workspace . . . . . . . . . 101OS Stack workspace . . . . . . . . . . 102Pool Analysis workspace . . . . . . . . 103Portal Pages Summary workspace . . . . . 104Portal Summary workspace . . . . . . . 105
© Copyright IBM Corp. 2006, 2014 iii

Portlet Summary and Selected Portlet - Historyworkspaces . . . . . . . . . . . . . 106Request Analysis workspace . . . . . . . 107Request Baseline workspace . . . . . . . 109EJB Tier Analysis workspace . . . . . . . 110Application Configuration workspace . . . . 111Backend Tier Analysis workspace. . . . . . 112Application Health History workspace . . . . 113Web Tier Analysis workspace . . . . . . . 113Selected Datasources - Datasource Trendworkspace . . . . . . . . . . . . . 114Selected Request - Datasources workspace . . . 115Selected Request - JMS Queues workspace. . . 115Selected Request - Portal Processing workspace 116Selected Request - Resource Adapters workspace 116Selected Request - Service Componentsworkspace . . . . . . . . . . . . . 117Service Component Elements workspace . . . 117Selected Request - History workspace . . . . 118Service Components workspace . . . . . . 119Servlets/JSPs - Selected Web Applicationworkspace . . . . . . . . . . . . . 120Scheduler workspace . . . . . . . . . . 121Sessions workspace . . . . . . . . . . 122Thread Pools workspace. . . . . . . . . 123Thread Pool Trend workspace . . . . . . . 124Web Applications workspace . . . . . . . 125Web Services workspace. . . . . . . . . 127WebSphere Agent workspace . . . . . . . 128WebSphere application server workspace . . . 129WebSphere ESB Server workspace . . . . . 130WebSphere Portal Server workspace . . . . . 131WMQ Client Link Communications workspace 132WMQ Link Communications workspace . . . 133Workload Management workspace . . . . . 134Workplace Mail workspace . . . . . . . . 135Region workspaces in a z/OS environment . . 136
Attributes for ITCAM Agent for WebSphereApplications. . . . . . . . . . . . . . 139
Attribute groups used by the predefinedworkspaces . . . . . . . . . . . . . 139Alarm Manager attributes . . . . . . . . 141Allocation Failure attributes . . . . . . . 143Application Health Status attributes . . . . . 145Application Monitoring Configuration attributes 147Application server status attributes . . . . . 150Application server attributes . . . . . . . 152Baseline attributes . . . . . . . . . . . 155Client Communications attributes . . . . . 157Container Object Pools attributes . . . . . . 164Container Transactions attributes . . . . . . 166Data sources attributes . . . . . . . . . 170DB Connection Pools attributes . . . . . . 173DC Messages attributes . . . . . . . . . 176DCS Stack attributes . . . . . . . . . . 178Durable Subscriptions attributes . . . . . . 181Dynamic Cache attributes . . . . . . . . 183Dynamic Cache Templates attributes . . . . 185EJB Containers attributes . . . . . . . . 189Enterprise Java Beans attributes . . . . . . 192Garbage Collection Analysis attributes . . . . 197
Garbage Collection Cycle attributes . . . . . 199High Availability Manager attributes . . . . 202J2C Connection Pools attributes . . . . . . 204JMS Summary attributes. . . . . . . . . 208Log Analysis attributes . . . . . . . . . 210Listener Port attributes . . . . . . . . . 212Messaging Engine Communications attributes 213Messaging Engines attributes . . . . . . . 215Portal Page Summary attributes . . . . . . 216Portal Summary attributes . . . . . . . . 218Portlet Summary attributes . . . . . . . . 220Queue attributes . . . . . . . . . . . 221Remote Configuration Requests attributes . . . 224Request Analysis attributes . . . . . . . . 225Requests Monitoring Configuration attributes 231Request Times and Rates attributes . . . . . 234Selected Request attributes . . . . . . . . 235Servlet Sessions attributes . . . . . . . . 238Servlets JSPs attributes . . . . . . . . . 242Scheduler attributes . . . . . . . . . . 244Service Component Elements attributes. . . . 246Service Components attributes. . . . . . . 248Thread Pools attributes . . . . . . . . . 250Topic Spaces attributes . . . . . . . . . 252Web Applications attributes . . . . . . . 255Web Services attributes . . . . . . . . . 257Web Services Gate Way attributes . . . . . 260WebSphere Agent Events attributes . . . . . 261WMQ Client Link Communications attributes 262WMQ Link Communications attributes . . . . 264Workload Management Client attributes . . . 267Workload Management Server attributes . . . 269Workplace Mail IMAP/POP attributes . . . . 271Workplace Mail Queues attributes . . . . . 273Workplace Mail Service attributes . . . . . 275Agent Configuration attributes . . . . . . 277KYN Command attributes . . . . . . . . 278Server Configuration attributes . . . . . . 278
Situations for ITCAM Agent for WebSphereApplications. . . . . . . . . . . . . . 278
Predefined situations-descriptions and formulas(that run automatically) . . . . . . . . . 279Predefined situations descriptions and formulas(that run manually) . . . . . . . . . . 283
Take Action commands for ITCAM Agent forWebSphere Applications . . . . . . . . . . 290
Add_XD_Cell: Add an XD Cell to a WebSphereagent . . . . . . . . . . . . . . . 290Enable_Auto_Threshold: set thresholdparameters . . . . . . . . . . . . . 290Override_Auto_Threshold: override thresholdvalues . . . . . . . . . . . . . . . 293Remove_WebSphere_SubNode: Remove aninactive WebSphere application server . . . . 293Set_Application_Monitoring: Set monitoring . . 294Set_Completion_Thresholds: Set completionthresholds . . . . . . . . . . . . . 294Set_Request_Sampling_Rate: Set the samplingrate for request data . . . . . . . . . . 295Start_Baselining: Start the baselining process 295
iv ITCAM Agents for WebSphere Applications, J2EE, and HTTP Servers: User Guide

Start_GC_Monitoring: Begin reportinggarbage-collection data . . . . . . . . . 296Start_Request_Monitoring : Begin reportingrequest data . . . . . . . . . . . . . 296Start_Resource_Monitoring: Begin reporting PMIdata . . . . . . . . . . . . . . . 297Start_WebSphere_Server: Start a WebSphereapplication server . . . . . . . . . . . 297Stop_Baselining: stop the baselining process . . 298Stop_GC_Monitoring: Stop reportinggarbage-collection data . . . . . . . . . 298Stop_Request_Monitoring: Stop reportingrequest data . . . . . . . . . . . . . 298Stop_Resource_Monitoring: Stop reporting PMIdata . . . . . . . . . . . . . . . 298Stop_WebSphere_Server: Stop a WebSphereapplication server . . . . . . . . . . . 299Update_Baseline: trigger a baseline update . . 299Threshold calculation detail . . . . . . . 300
WebSphere XD Overview for ITCAM Agent forWebSphere Applications . . . . . . . . . . 301
ITCAM for Application Diagnostics -WebSphere XD Cell workspaces . . . . . . 302WebSphere XD Attributes . . . . . . . . 316ITCAM for Application Diagnostics -WebSphere XD Take Actions . . . . . . . 328ITCAM for Application Diagnostics - XD Agentsituations. . . . . . . . . . . . . . 329
WebSphere Extreme Scale overview for ITCAMAgent for WebSphere Applications . . . . . . 334
WebSphere Extreme Scale prerequisites . . . . 334WebSphere Extreme Scale Workspaces . . . . 334WebSphere Extreme Scale Attributes. . . . . 355Situations for WebSphere Extreme Scale . . . 370WebSphere Extreme Scale Take ActionCommands . . . . . . . . . . . . . 371
WebSphere PMI Attribute Mapping . . . . . . 373Data sources for workspaces . . . . . . . . 391Glossary for ITCAM Agent for WebSphereApplications. . . . . . . . . . . . . . 404
Chapter 4. ITCAM Agent for J2EE. . . 413Workspaces for ITCAM Agent for J2EE . . . . . 415
Organization of the predefined workspaces . . 415Configuration workspaces . . . . . . . . 420Allocation Failures workspace . . . . . . . 424Application Health Summary workspace . . . 425Application Registry workspace . . . . . . 426BEA WebLogic Application Server workspace 427Data sources workspace . . . . . . . . . 427DB Connection Pools workspace . . . . . . 428DC Message Events workspace . . . . . . 429EJB Components workspace . . . . . . . 430Enterprise Java Beans workspace . . . . . . 431EJB Modules workspace . . . . . . . . . 432EJBs - Selected Enterprise Applicationworkspace . . . . . . . . . . . . . 433Garbage Collection Analysis workspace . . . 433Garbage Collections - Selected Allocation Failureworkspace . . . . . . . . . . . . . 434J2EE Agent workspace . . . . . . . . . 435
J2SE Application workspace . . . . . . . 435JBoss App Server workspace . . . . . . . 436JCA Connection Pools workspace. . . . . . 437JDBC Connection Pools workspace . . . . . 438JMS Sessions workspace . . . . . . . . . 439JMS Summary workspace . . . . . . . . 439JTA Resources workspace . . . . . . . . 440JTA Summary workspace . . . . . . . . 441JVM Statistics workspace . . . . . . . . 441Log Analysis workspace . . . . . . . . . 442Oracle App Server workspace . . . . . . . 443Request Analysis workspace . . . . . . . 444Selected Request - Baseline workspace . . . . 445Selected Application - Application Tier Analysisworkspace . . . . . . . . . . . . . 445Selected Application - Configuration workspace 446Selected Application - Backend Tier Analysisworkspace . . . . . . . . . . . . . 447Selected Application - Health History workspace 448Selected Application - Client Tier Analysisworkspace . . . . . . . . . . . . . 448Selected Request - data sources workspace . . 449Selected Request - JMS Queues workspace . . 450Selected Request - Resource Adaptersworkspace . . . . . . . . . . . . . 450SAP NetWeaver Server workspace . . . . . 451Servlets/JSPs - Selected Enterprise Applicationworkspace . . . . . . . . . . . . . 451Servlets/JSPs - Selected Web Applicationworkspace . . . . . . . . . . . . . 452Tomcat Server workspace . . . . . . . . 453Web Applications workspace . . . . . . . 453Web Container workspace . . . . . . . . 454WebSphere App Server CE workspace . . . . 455
Attributes for ITCAM Agent for J2EE . . . . . 456Attribute groups used by the predefinedworkspaces . . . . . . . . . . . . . 456Allocation Failure - J2EE attributes . . . . . 458Application Health Status attributes . . . . . 459Application Monitoring Configuration attributes 462Application Server Status - J2EE attributes. . . 464Application Server - J2EE attributes . . . . . 465Baseline attributes . . . . . . . . . . . 467Data sources - J2EE attributes . . . . . . . 469DB Connection Pools - NetWeaver attributes 472DC Messages - J2EE attributes. . . . . . . 473Enterprise Java Bean Components - WebLogicattributes . . . . . . . . . . . . . . 474Enterprise Java Bean Modules - J2EE attributes 475Enterprise Java Bean Service - NetWeaverattributes . . . . . . . . . . . . . . 477Enterprise Java Beans - WebLogic attributes . . 479Garbage Collection Analysis - J2EE attributes 482Garbage Collection Cycle - J2EE attributes. . . 484J2EE Agent Events attributes . . . . . . . 486J2EE Connector Connection Pools - WebLogicattributes . . . . . . . . . . . . . . 487JCA Connection Pools - J2EE attributes . . . . 489JDBC Connection Pools - WebLogic attributes 491JDK - Operation System attributes . . . . . 493JDK - Memory attributes . . . . . . . . 495
Contents v

JDK - JVM attributes . . . . . . . . . . 496JDK - Threading attributes . . . . . . . . 498JMS Sessions - WebLogic attributes . . . . . 499JMS Summary - J2EE attributes . . . . . . 501Java Transaction Service - WebLogic attributes 503JTA Resources - J2EE attributes . . . . . . 506JTA Summary - NetWeaver attributes . . . . 507Log Analysis - J2EE attributes . . . . . . . 508Request Analysis - J2EE attributes . . . . . 510Requests Monitoring Configuration attributes 515Request Times and Rates - J2EE attributes . . . 517Selected Request - J2EE attributes . . . . . 519Servlets JSPs - J2EE attributes . . . . . . . 521Servlets and JSPs - WebLogic attributes. . . . 523Web Container - NetWeaver attributes . . . . 524Web Applications - J2EE attributes . . . . . 525Web Applications - WebLogic attributes . . . 527
Situations for ITCAM Agent for J2EE . . . . . 528Take Action commands for ITCAM Agent for J2EE 532
Enable_Auto_Threshold: set thresholdparameters . . . . . . . . . . . . . 532Override_Auto_Threshold: override thresholdvalues . . . . . . . . . . . . . . . 534Recycle_Application_Server: Recycle a J2EEapplication . . . . . . . . . . . . . 535Remove_J2EE_Application: Remove a J2EEApplication . . . . . . . . . . . . . 535Remove_J2EE_SubNode: Remove an inactiveJ2EE application server . . . . . . . . . 536Set_Application_Monitoring: Set monitoring . . 536Set_Completion_Thresholds: Set completionthresholds . . . . . . . . . . . . . 537Set_Request_Sampling_Rate: Set the samplingrate for request data . . . . . . . . . . 537Start_Application_Server: Start a J2EEapplication server . . . . . . . . . . . 537Start_Baselining: Start the baselining process 537Start_GC_Monitoring: Begin reportinggarbage-collection data . . . . . . . . . 539Start_Request_Monitoring : Begin reportingrequest data . . . . . . . . . . . . . 539Start_Resource_Monitoring: Begin reporting PMIdata . . . . . . . . . . . . . . . 539Stop_Application_Server: Stop a J2EEapplication server . . . . . . . . . . . 539Stop_Baselining: stop the baselining process . . 540
Stop_GC_Monitoring: Stop reportinggarbage-collection data . . . . . . . . . 540Stop_Request_Monitoring: Stop reportingrequest data . . . . . . . . . . . . . 540Stop_Resource_Monitoring: Stop reporting PMIdata . . . . . . . . . . . . . . . 540Update_Baseline: trigger a baseline update . . 540Threshold calculation detail . . . . . . . 541
Glossary for ITCAM Agent for J2EE . . . . . . 543
Chapter 5. ITCAM Agent for HTTPServers . . . . . . . . . . . . . . 551Workspaces for ITCAM Agent for HTTP Servers 551
Organization of the predefined workspaces . . 551Apache web server workspace . . . . . . 552Apache websites workspace . . . . . . . 553Sun Java System web server workspace . . . 554Sun websites workspace . . . . . . . . . 554web server Agent workspace . . . . . . . 555
Attributes for ITCAM Agent for HTTP Servers . . 556Attribute groups used by the predefinedworkspaces . . . . . . . . . . . . . 556Apache web server attributes . . . . . . . 557Apache websites attributes . . . . . . . . 558Sun web server attributes . . . . . . . . 560Sun websites attributes . . . . . . . . . 563HTTP Servers Agent Events attributes . . . . 566Web Servers Status attributes . . . . . . . 567
Situations for ITCAM Agent for HTTP Servers . . 568Take Action commands for ITCAM Agent forHTTP Servers . . . . . . . . . . . . . 573Glossary for ITCAM Agent for HTTP Servers. . . 574
Part 3. Appendixes . . . . . . . . 577
Appendix. Accessibility . . . . . . . 579
Index . . . . . . . . . . . . . . . 581
Trademarks . . . . . . . . . . . . 583
Notices . . . . . . . . . . . . . . 585Privacy policy considerations . . . . . . . . 586
vi ITCAM Agents for WebSphere Applications, J2EE, and HTTP Servers: User Guide

About this guide
This guide provides a user guide for the following agents included with ITCAMfor Applications 7.2:v Agent for WebSphere® Applications on distributed systemsv Agent for J2EEv Agent for HTTP Servers
The document also mentions the Agent for WebSphere Applications on z/OS® andIBM® i, as well as the Managing Server (deep dive functionality). Thesecomponents are not available in ITCAM for Applications. They are available inITCAM for Application Diagnostics. The agents shipped with ITCAM forApplications will interact with the components shipped in ITCAM for ApplicationDiagnostics .
Who should read this guideThis user guide is intended for users of ITCAM for Application Diagnostics.
PublicationsThis section lists publications in the product library and related documents. It alsodescribes how to access Tivoli® publications online and how to order Tivolipublications.
To access publications in the ITCAM for Applications library, see the ITCAM forApplications information center.
ITCAM for Applications library for Agents for WebSphereApplications, J2EE, and HTTP Servers
The following publications are included in the ITCAM for Applications library,available in the: ITCAM for Applications Information Centerv IBM Tivoli Composite Application Manager: Agents for WebSphere Applications, J2EE,
and HTTP Servers User's Guide
Provides the user overview, user scenarios, and Helps for agents for WebSphereApplications, J2EE, and HTTP Servers.
v IBM Tivoli Composite Application Manager: Agents for WebSphere Applications, J2EE,and HTTP Servers Planning an Installation
Provides the user with a first reference point for installation or upgrade ofagents for WebSphere Applications, J2EE, and HTTP Servers.
v IBM Tivoli Composite Application Manager: Agent for WebSphere ApplicationsInstallation and Configuration Guide
Provides installation instructions for setting up and configuring ITCAM Agentfor WebSphere Applications on distributed systems.
v ITCAM Agent for J2EE Applications Installation and Configuration Guides:– IBM Tivoli Composite Application Manager: Agent for J2EE Data Collector
Installation and Configuration Guide
– IBM Tivoli Composite Application Manager: Agent for J2EE Monitoring AgentInstallation and Configuration Guide
© Copyright IBM Corp. 2006, 2014 vii

Provides installation instructions for setting up and configuring ITCAM Agentfor J2EE.
v IBM Tivoli Composite Application Manager: Agent for HTTP Servers Installation andConfiguration Guide
Provides installation instructions for setting up and configuring ITCAM Agentfor HTTP Servers.
v IBM Tivoli Composite Application Manager: Agents for WebSphere Applications, J2EE,and HTTP Servers Troubleshooting Guide
Provides instructions on problem determination and troubleshooting for agentsfor WebSphere Applications, J2EE, and HTTP Servers.
v IBM Tivoli Composite Application Manager: Agents for WebSphere Applications, J2EE,and HTTP Servers: Messaging Guide
Provides information about system messages received when installing and usingagents for WebSphere Applications, J2EE, and HTTP Servers.
v IBM Tivoli Composite Application Manager: Agent for WebSphere ApplicationsReporting Guide
Provides information about installing Agent for WebSphere Applications Reportsand creating pre-defined and ad-hoc reports.
Related publicationsThe following documentation also provides useful information:v IBM Tivoli Documentation Central:
Information about IBM Tivoli Documentation is provided on the followingwebsite:http://www.ibm.com/tivoli/documentation.html
v IBM WebSphere Application Server:Information about IBM WebSphere Application Server is provided on thefollowing website:http://www.ibm.com/software/webservers/appserv/was/library
v ITCAM for Application Diagnostics library:Information about ITCAM for Application Diagnostics Managing Server isprovided on the following website:http://publib.boulder.ibm.com/infocenter/tivihelp/v24r1/index.jsp?topic=%2Fcom.ibm.itcamfad.doc_7101%2Fic-homepage.html
v IBM DB2®:Information about IBM DB2 is provided on the following website:http://www.ibm.com/software/data/sw-library/
v Tivoli Data WarehouseInformation about Tivoli Data Warehouse is provided on the following website:https://www.ibm.com/developerworks/wikis/display/tivolidoccentral/Tivoli+Data+Warehouse
v IBM Tivoli MonitoringInformation about IBM Tivoli Monitoring is provided on the following website:http://submit.boulder.ibm.com/tividd/td/EnterpriseConsole3.9.html
v IBM Tivoli Information Center:Information about IBM Tivoli products is provided on the following website:http://publib.boulder.ibm.com/infocenter/tivihelp/v3r1/index.jsp?toc=/com.ibm.tivoli.tdwi.doc/toc.xml
viii ITCAM Agents for WebSphere Applications, J2EE, and HTTP Servers: User Guide

v IBM Tivoli Composite Application Manager for WebSphere Application Server7.2 support for WebSphere Application Server 8.5: Installation and User Guide:The guide is available in the Integrated Service Management (ISM) library onthe following website:http://publib.boulder.ibm.com/infocenter/tivihelp/v3r1/index.jsp?toc=/com.ibm.tivoli.tdwi.doc/toc.xml
v ITCAM Diagnostics Tool Installation Guide:The guide is available from the ITCAM for Applications Diagnostics beta. Formore information about how to access the beta site, see the following website:http://publib.boulder.ibm.com/infocenter/tivihelp/v3r1/index.jsp?toc=/com.ibm.tivoli.tdwi.doc/toc.xml
Accessing terminology onlineThe IBM Terminology website consolidates the terminology from IBM productlibraries in one convenient location. You can access the Terminology website athttp://www.ibm.com/software/globalization/terminology .
Accessing publications onlineThe documentation CD contains the publications that are in the product library.The format of the publications is PDF, HTML, or both.
IBM posts publications for this and all other Tivoli products, as they becomeavailable and whenever they are updated, to the Tivoli software information centerwebsite. Access the Tivoli software information center by viewing the Tivolisoftware library at the following web address:
http://www.ibm.com/software/tivoli/library/
Tip: If you print PDF documents on other than letter-sized paper, set the option inthe File > Print window that enables Adobe Reader to print letter-sized pages onyour local paper.
The IBM Software Support website provides the latest information about knownproduct limitations and workarounds in the form of technotes for your product.You can view this information at the following website:
http://www.ibm.com/software/support
Ordering publicationsYou can order many Tivoli publications online at the following website:
http://www.elink.ibmlink.ibm.com/public/applications/ publications/cgibin/pbi.cgi
You can also order by telephone by calling one of these numbers:v In the United States: 800-879-2755v In Canada: 800-426-4968
In other countries, contact your software account representative to order Tivolipublications. To locate the telephone number of your local representative, performthe following steps:1. Go to the following website:
About this guide ix

http://www.elink.ibmlink.ibm.com/public/applications/publications/cgibin/pbi.cgi
2. Select your country from the list and click Go.3. Click About this site in the main panel to see an information page that
includes the telephone number of your local representative.
AccessibilityAccessibility features help users with a physical disability, such as restrictedmobility or limited vision, to use software products successfully. With this product,you can use assistive technologies to hear and navigate the interface. You can alsouse the keyboard instead of the mouse to operate most features of the graphicaluser interface. For more information, see“Accessibility,” on page 579.
Application Performance Management community on ServiceManagement Connect
Connect, learn, and share with Service Management professionals: product supporttechnical experts who provide their perspectives and expertise.
Access Service Management Connect at https://www.ibm.com/developerworks/servicemanagement/apm/index.html. Use Service Management Connect in thefollowing ways:v Become involved with transparent development, an ongoing, open engagement
between other users and IBM developers of Tivoli products. You can access earlydesigns, sprint demonstrations, product roadmaps, and prerelease code.
v Connect one-on-one with the experts to collaborate and network about Tivoliand the (enter your community name here) community.
v Read blogs to benefit from the expertise and experience of others.v Use wikis and forums to collaborate with the broader user community.
Tivoli technical trainingFor Tivoli technical training information, see the following IBM Tivoli Educationwebsite:
http://www.ibm.com/software/tivoli/education/
Supporting informationIf you have a problem with your IBM software, you want to resolve it quickly. IBMprovides the following ways for you to obtain the support you need:v Searching knowledge bases: You can search across a large collection of known
problems and workarounds, Technotes, and other information.v Obtaining fixes: You can locate the latest fixes that are already available for your
product.v Contacting IBM Software Support: If you still cannot solve your problem, and
you need to work with someone from IBM, you can use various ways to contactIBM Software Support.
x ITCAM Agents for WebSphere Applications, J2EE, and HTTP Servers: User Guide

Conventions used in this guideThis guide uses several conventions for special terms and actions, andoperating-system-dependent commands and paths.
Typeface conventionsThis guide uses the following typeface conventions:
Bold
v Lowercase commands and mixed case commands that are otherwisedifficult to distinguish from surrounding text
v Interface controls (check boxes, push buttons, radio buttons, spinbuttons, fields, folders, icons, lists, items inside lists, multicolumn lists,containers, menu choices, menu names, tabs, property sheets), labels(such as Tip, and Operating system considerations)
v Keywords and parameters in text
Italic
v Words defined in textv Emphasis of words (for example, "Use the word that to introduce a
restrictive clause.")v New terms in text (except in a definition list)v Variables and values you must provide
Monospace
v Code and other examplesv File names, programming keywords, and other elements that are difficult
to distinguish from surrounding textv Message text and prompts addressed to the userv Text that the user must typev Values for arguments or command options
Operating-system-dependent variables and pathsThe publications in this library use the UNIX convention for specifyingenvironment variables and for directory notation.
When using the Windows command line, replace $variable with %variable% forenvironment variables and replace each forward slash (/) with a backslash (\) indirectory paths. The names of environment variables are not always the same inWindows and UNIX. For example, %TEMP% in Windows is equivalent to $tmp inUNIX.
Note: If you are using the bash shell on a Windows system, you can use the UNIXconventions.
Tivoli command syntaxThe following special characters define Tivoli command syntax:
[ ] Identifies elements that are optional. Required elements do not havebrackets around them.
... Indicates that you can specify multiple values for the previous element.Separate multiple values by a space, unless otherwise directed bycommand information.
About this guide xi

If the ellipsis for an element follows a closing bracket, use the syntaxwithin the brackets to specify multiple values. For example, to specify twoadministrators for the option [–a admin]..., use –a admin1 –a admin2.
If the ellipsis for an element is within the brackets, use the syntax of thelast element to specify multiple values. For example, to specify two hostsfor the option [–h host...], use –h host1 host2.
| Indicates mutually exclusive information. You can use the element oneither side of the vertical bar.
{ } Delimits a set of mutually exclusive elements when a command requiresone of them. Brackets ([ ]) are around elements that are optional.
In addition to the special characters, Tivoli command syntax uses the typefaceconventions described in “Typeface conventions” on page xi. The followingexamples illustrate the typeface conventions used in Tivoli command syntax:v wcrtpr [–a admin]... [–s region] [–m resource]... name
The name argument is the only required element for the wcrtpr command. Thebrackets around the options indicate they are optional. The ellipses after the –aadmin resource option means that you can specify multiple administratorsmultiple times. The ellipses after the –m resource option means that you canspecify multiple resources multiple times.
v wchkdb [–o outfile] [–u] [–x] {–f infile | –i | object...}The –f, –i, and object elements are mutually exclusive. Braces that surroundelements indicate that you are including a required element. If you specify theobject argument, you can specify more than one object.
xii ITCAM Agents for WebSphere Applications, J2EE, and HTTP Servers: User Guide

Part 1. Part 1: Introduction to the agents
© Copyright IBM Corp. 2006, 2014 1

2 ITCAM Agents for WebSphere Applications, J2EE, and HTTP Servers: User Guide

Chapter 1. Overview of the agents
IBM Tivoli Composite Application Manager (ITCAM) agents for WebSphereApplications, J2EE, and HTTP Servers are a monitoring, diagnostics, andmanagement technology for WebSphere, JEE, and HTTP servers in a distributedenvironment. They also provide enhanced support for monitoring VirtualEnterprise and Compute Grid products from the WebSphere XD suite. They help tomaintain and improve the availability and performance of on-demand applicationsin your environment. It helps you to quickly locate in real time the source ofbottlenecks in application code, server resources, and external systemdependencies.
The agents can monitor application servers and HTTP servers at different levels.Monitoring applications incurs an unavoidable cost in terms of processing time. Tominimize this cost, multiple monitoring levels are available. A minimum amount ofinformation is collected during standard operations. As problems are encountered,the level of information that is collected can be gradually increased until theproblem is located and solved.
Agent functionalityThe agents can perform monitoring, diagnostics, and management functions forWebSphere, JEE, and HTTP servers.
Monitoring
The agents can monitor the following WebSphere, JEE, and HTTP servers:v WebSphere servers
– WebSphere Application Server (Network Deployment)– WebSphere Application Server (Extended Deployment)– WebSphere Process Server– WebSphere Portal Server– WebSphere ESB Server– WebSphere Business Process Manager Server– WebSphere Extreme Scale– WebSphere Virtual Enterprise– WebSphere Compute Grid
v JEE servers– SAP NetWeaver– JBoss Application Server– Apache Tomcat– Oracle/BEA WebLogic Server– Java™ 2, Standard Edition applications
v HTTP servers– Apache Web Server– IBM HTTP Server– Sun Java System Web Server
© Copyright IBM Corp. 2006, 2014 3

Diagnosing
Use the agents to diagnose the following problems in your on-demand applicationenvironment:v Hanging requestsv Lock contention problemsv Malfunctioning applications in a server farmv Memory problems relating to garbage collection and JVM (Java Virtual Machine)
heap size
Managing
Use the agents to perform the following management functions in your on-demandapplication environment:v Start and stop monitored serversv Manage servers using groupsv Configure data collectorv Use roles to restrict access to featuresv Use server groups to grant access to serversv Adjust the monitoring level at specific times based on the current work load of
the server
User interfacesFunctions of the agents can be broadly divided into two areas: monitoring anddiagnostics. Each of these functions uses different combinations of components.Each function also uses a different user interface. The two user interfaces are theTivoli Enterprise Portal and the Managing Server Visualization Engine (MSVE).
The Tivoli Enterprise Portal user interface
The Tivoli Enterprise Portal is part of the IBM Tivoli Monitoring architecture. TheTivoli Enterprise Portal is the user interface into your ITCAM for ApplicationDiagnostics environment site and possibly other IBM Tivoli enterprise applicationsif they are installed in your environment. For further information about the TivoliMonitoring architecture, see “Components used by the Tivoli Enterprise Portal userinterface” on page 5.
Using the Tivoli Enterprise Portal interface, you can easily monitor the health andavailability of production applications and application servers. You can alsoquickly identify and isolate availability and response time problems. The TivoliEnterprise Portal provides monitoring information, such as memory usage,response time, pool analysis, and data source analysis. The Tivoli Enterprise Portalenables you to drill down from server level metrics to specific application andresource level metrics.
MSVE user interface
The MSVE user interface provides users with management and monitoringfunctions for application servers. The MSVE also provides a diagnostic function.Here are some of the diagnostic activities you can perform in MSVE:v Detect transactions failingv Detect memory leaks
4 ITCAM Agents for WebSphere Applications, J2EE, and HTTP Servers: User Guide

v Examine detailed method traces, which help to detect application code hotspotsv Generate reports to analyze historical information, such as application
performance and OS performance
Important: The managing server, providing the MSVE user interface, is notincluded with ITCAM for Applications. It is available with ITCAM for ApplicationDiagnostics. The agents included with ITCAM for Applications can interact withthe ITCAM for Application Diagnostics managing server. For more informationabout the MSVE, see the documentation for ITCAM for Application Diagnostics.
Components used by the Tivoli Enterprise Portal user interfaceA number of components work together to collect, analyze, and display monitoringdata in the Tivoli Enterprise Portal. These components are:1. The Agents2. IBM Tivoli Monitoring components
The agentsThere are separate agents for WebSphere, J2EE, and HTTP servers. The agentsconsist of the following components:v Tivoli Enterprise Monitoring Agent (referred to as the monitoring agent)v Data Collector
Important: The exception is the HTTP servers agent. The HTTP servers agentdoes not contain a data collector. Only the WebSphere and J2EE Agents containdata collector.
The Monitoring Agent: The monitoring agent is a component of the IBM TivoliMonitoring architecture. The purpose of the monitoring agent is to routeinformation to the Tivoli Enterprise Monitoring Server (monitoring server) wherethe information is processed and presented in the Tivoli Enterprise Portal.
The Data Collector: The purpose of the data collector is to collect and route datato the monitoring agent. It is not intended to analyze or interpret data.
On each WebSphere and J2EE server that you monitor, an agent is installed; sothere is a monitoring agent and a data collector running on each server you aremonitoring.
For example, if you are monitoring a Tomcat server, a J2EE Agent is installed onthis server. If you are monitoring a WebSphere Portal server, a WebSphere Agent isinstalled.
For information about software prerequisites, see the Software productcompatibility reports website to generate a variety of reports related to productand component requirements.
Tip: The agents are components of ITCAM for Applications version 7.2.1. To run areport specific to ITCAM for Applications version 7.2.1, specify Tivoli CompositeApplication Manager for Applications as the product name and 7.2.1 as theversion.
Chapter 1. Overview of the agents 5

The WebSphere agent
The WebSphere agent consists of a monitoring agent and a data collector. TheWebSphere monitoring agent works with the WebSphere data collector. TheWebSphere data collector collects monitoring data from WebSphere servers andcommunicates the data to the monitoring agent.
The WebSphere Agent collects data from five primary sources:v Response time data for application service requests from the data collectorv Resource data from the WebSphere Performance Monitoring Infrastructure (PMI)v WebSphere Application Server log messagesv Garbage-collector activity that is recorded in the JVM verbose GC tracev Process data from the operating system
The J2EE agent
The J2EE agent is composed of a monitoring agent and a data collector. The J2EEagent works with the J2EE data collector to collect performance data from J2EEapplication servers. The J2EE data collector collects monitoring data from J2EEservers and communicates the data to the monitoring agent. The J2EE agentcollects data from five main sources:v Response time data for application service requests from the data collectorv J2EE application server log messagesv Garbage collection activity that is recorded in the JVM verbose GC tracev Resource data from the application server mbeanv Process data from the operating system
The HTTP agent
The HTTP agent is composed of a monitoring agent only. The monitoring agentcan monitor the following HTTP servers:v Apache Web Serversv IBM HTTP Web Serversv Sun Web Servers
The HTTP agent collects performance data about the web servers and websites inthe following ways:
Apache Server and HTTP Server: The agent modifies the Apache server and IBMHTTP server configuration files to include the monitoring module. The monitoringmodule is loaded dynamically during web server startup. The module receives allHTTP requests and reports data to the HTTP agent. In addition, the HTTP agentparses static information from the configuration file.
Sun Web Server: The HTTP agent collects monitoring data from Sun Web serversby polling the SNMP service for web server-related statistics. It also parses webserver configuration files to get information that is not provided by the SNMPservice.
IBM Tivoli Monitoring componentsIBM Tivoli Monitoring monitors the performance and availability of distributedoperating systems and applications. IBM Tivoli Monitoring products are based on a
6 ITCAM Agents for WebSphere Applications, J2EE, and HTTP Servers: User Guide

set of common service components. These service components provide security,data transfer and storage, notification mechanisms, user interface presentation, andcommunication services in an agent-server-client architecture. Some of these servicecomponents are shared by other products, including IBM Tivoli OMEGAMON® XEmainframe monitoring products, ITCAM for Application Diagnostics, and ITCAMfor Applications.
The service components shared by ITCAM for Application Diagnostics and IBMTivoli Monitoring are as follows:v Tivoli Enterprise Monitoring Server (referred to as the monitoring server)v Tivoli Enterprise Portal Server (referred to as the Portal Server)v Tivoli Enterprise Portalv Tivoli Enterprise Monitoring Agent (referred to as the monitoring agent)
ITCAM for Application Diagnostics uses the service components of IBM TivoliMonitoring. The ITCAM for Application Diagnostic monitoring agents integratewith components in the IBM Tivoli Monitoring environment by retrieving datafrom the monitoring agents and forwarding it to the Portal Server where it isdisplayed in the Tivoli Enterprise Portal.
Here is some further information regarding the shared service components andhow they integrate with ITCAM for Application Diagnostics:
Tivoli Enterprise Monitoring Server: The Monitoring Server performs thefollowing functions:v Acts as a collection and control point for alerts that are received from the
monitoring agentsv Tracks the heartbeat request interval for all monitoring agents connected to itv Stores, initiates, and tracks all situations and policies, and is the central
repository for storing all active conditions on every monitoring agentv Initiates and tracks all generated actions that start a script or program on the
monitoring agent
Tivoli Enterprise Portal Server: The Portal Server performs the followingfunctions:v Acts as a repository for all graphical presentations of monitoring datav Provides the core presentation layer, which allows for the retrieval,
manipulation, analysis, and reformatting of datav Manages data access through user workspace consoles
Tivoli Enterprise Portal: The Tivoli Enterprise Portal is a Java user interface thatconnects to the monitoring server and displays monitoring data. The TivoliEnterprise Portal can be launched from an Internet Explorer browser, or can beinstalled as a client application on a workstation. The Tivoli Enterprise Portal isone of the user interfaces for ITCAM for Application Diagnostics, the other userinterface is the MSVE.
Tivoli Enterprise Monitoring Agent: The monitoring agents are responsible fordata gathering. The monitoring agents communicate monitoring data to theMonitoring Server and the managing server. In ITCAM for ApplicationDiagnostics, the WebSphere, J2EE, and HTTP agents contain monitoring agents.
Chapter 1. Overview of the agents 7

The following diagram shows the component used by the Tivoli EnterpriseMonitor:
For more information about the ITCAM for Application Diagnostics agents, see“The agents” on page 5. For more information about the IBM Tivoli Monitoring,see IBM Tivoli Monitoring Information Center
8 ITCAM Agents for WebSphere Applications, J2EE, and HTTP Servers: User Guide

Chapter 2. Scenarios
The following scenarios describe how the agents might be used to monitor anddiagnose problems in your application environment.
The following fictitious personas are used in the scenarios to reflect typicalpositions in your organization:
Table 1. Personas
Persona Description
Annette – Level 2 Operator Annette's main focus is to find whichcomponent is down, which components areaffected, and the location of the problem. Inaddition, Annette follows procedures to correctthe problem. If Annette cannot fix the problemwithin a time limit stipulated by her servicelevel agreement (SLA), she produces a troubleticket and escalates the problem.
Jim – Middleware/Application SupportSubject Matter Expert (SME)
Jim's main focus is to ensure that themiddleware applications he is responsible forare functional at all times. If an application goesdown, then a line of business is affected and hasa direct affect on how Jim's team is rated againsttheir SLA. Jim also works with the systemsmonitoring and automation group to define theappropriate monitors and thresholds for hisdomain area of responsibility.
Dave – Application Developer Dave's main focus is to develop in-houseapplications. When a problem arises in aproduction application, he is sent trace files sothat he can analyze the problem, which he thentries to simulate in his environment.
Simon – Operating System Specialist Simon's main focus is to work with the SystemsManagement team to define what the base OSservices/daemons, ports, file systems, and logsare that must be monitored on every computer.He is also a recognized expert in clusterconfigurations.
Scenario 1: Diagnosing a memory leakUsers are reporting slow response times for an application. A user contacts thehelp desk and raises a ticket for slow response time in relation to an application.Annette, the level 2 operator, picks up the ticket.
Important: This scenario assumes that you have ITCAM for ApplicationDiagnostics, which includes the Managing Server.1. Annette navigates to the Tivoli Enterprise Portal and notices that the Resources
icon is displaying a Critical symbol. On the Resources icon flyover, the GCActive Time (ms) metric is displaying a high value and also theWASHighGCTimePercent situation has triggered. This indicates that the JVMgarbage collection is taking too much time.
© Copyright IBM Corp. 2006, 2014 9

2. In the Garbage Collection Analysis workspace, Annette sees that the Percentageof Time Garbage Collector Running - History view displays an increasing trend.The increasing trend suggests that the heap is insufficient for the demand beingput on it by applications. The Running - History graph, which displays thepercentage of real time that the garbage collector was running during thecurrent interval for each server region, shows an increasing trend. This trendsuggests that either the heap size is insufficient for the demand thatapplications are putting on it, or that there is a memory leak.
3. Annette uses an external ticketing tool to route the ticket to Jim, theMiddleware/Application SME, for further observance and investigation.
4. Jim notices a problem ticket from Annette involving excessive garbagecollection times. Jim navigates to the Garbage Collection Analysis workspaceand confirms the problem. He requires more detailed information to diagnosethe cause of the problem. He clicks the Diagnostic Memory Leak link in theGarbage Collection Analysis workspace to open the Memory LeakConfirmation report page in MSVE.
10 ITCAM Agents for WebSphere Applications, J2EE, and HTTP Servers: User Guide

5. From examining the Memory Leak Confirmation report page in MSVE, Jimsuspects that there is a memory leak.
6. To determine if there is a memory leak, Jim sets the monitoring level to L3 andenables memory leak BCI by completing the following steps:v Edits the file: $DC_HOME/runtime/appserver_version.node_name.server_name/
custom/toolkit_custom.properties file and sets the propertycom.ibm.tivoli.itcam.toolkit.ai.enablememoryleakdiagnosis=true.
v Uncomments this line to enable Memory Leak Diagnosis (the path in the linemight be slightly different):am.camtoolkit.gpe.customxml.leak=/opt/IBM/AD710/aix533/yn/wasdc/7.2/itcamdc/etc/memory_leak_diagnosis.xml
v Restarts the data collector.
Jim forwards the problem to Dave, the application developer. Dave works toresolve the problem. This action is outside the scope of ITCAM for ApplicationDiagnostics.
Scenario 2: Diagnosing hanging transactionsAnnette, the level 2 operator, receives an email indicating that a situation triggeredin the Tivoli Enterprise Portal. The situation indicates that response time is slowfor an application.
Important: This scenario assumes that you have ITCAM for ApplicationDiagnostics, which includes the Managing Server.1. In the Tivoli Enterprise Portal, Annette points to the critical icon in the
WebSphere Agent Summary Status workspace. Annette sees in the flyover thatthe WASHighResponseTime situation triggered.
Chapter 2. Scenarios 11

2. Annette double-clicks the critical icon and the Application Server Summaryworkspace opens.
3. Annette double-clicks the critical application icon and the Application Trendworkspace is displayed. In this workspace, the Application Summary reportdisplays information about response time, error rate, and request rate.
12 ITCAM Agents for WebSphere Applications, J2EE, and HTTP Servers: User Guide

4. For a more detailed analysis of requests, Annette navigates to the RequestAnalysis workspace, by using the navigation tree. The Request Analysisworkspace displays information about worst average request response timeand worst average request completion rate. Annette observes that the averagerequest response time is high and that the average request completion rate islow (for some of the requests).
5. Annette uses an external ticketing tool to route the ticket to Jim, theMiddleware/Application Support SME, for further observance andinvestigation.
6. Jim notices a problem ticket from Annette indicating slow response times. Jimnavigates to the Request Analysis workspace in the Tivoli Enterprise Portaland confirms the slow request response time for the application.
7. To see individual hanging transactions, Jim must open MSVE. Jim right-clicksthe chain icon for the request and selects the Diagnostic In-Flight RequestSearch link. This link displays the In-flight Request Search page in the MSVE.
Chapter 2. Scenarios 13

Server and request information is carried over from the Request Analysisworkspace.
8. From here, Jim can diagnose hanging requests and see the stack trace for thatrequest by clicking the server activity display.
14 ITCAM Agents for WebSphere Applications, J2EE, and HTTP Servers: User Guide

9. Jim does not have enough information in the stack trace to debug theproblem, so he enables L3 monitoring. The toolkit_custom.properties filehas already been enabled for method entry/exit trace.
10. Next, Jim enables L3 monitoring by clicking Administration > Monitoring onDemand and clicking Schedule Change/Override.
11. Jim returns to the In-Flight Request Search page and clicks the Thread/TaskID for the request.
12. Jim clicks the Method/Component Trace link to display method trace details.13. Jim then forwards details to Dave, the application developer, by clicking
Email PDF. Dave works to resolve the problem. This action is outside thescope of ITCAM for Application Diagnostics.
14. After collecting the data, Jim returns the data collector to L1 monitoring.
Scenario 3: Diagnosing a WebSphere server shutdownAnnette, the level 2 operator, receives a severity 1 ticket indicating that userscannot access an application.1. Annette navigates to the Tivoli Enterprise Portal where (in the WebSphere
Agent Summary Status workspace) the Applications icon is displaying a criticalsymbol. The flyover on the application icon shows that a WasNotConnectedsituation triggered. The application server summary also shows the serverstatus as “Disconnected.”
Chapter 2. Scenarios 15

2. Annette navigates to the Log Analysis workspace. This workspace reportsapplication server errors and exception conditions that are recorded in theWebSphere Application Server SystemOut.log file log. The information in thisworkspace includes the exception severity of errors, and the ID and text of theassociated message.
3. Annette observes that in the Log Analysis report, the Process ID value isdisplayed as -1. This value indicates that the data collector is disconnected. If aWebSphere server shutdown occurs, the connection between the data collectorand Tivoli Enterprise Monitoring Agent is closed. However, the data collectorcontinues to write to log files and Tivoli Enterprise Monitoring Agent processesthese records but sets the PID value to -1.
4. Annette uses an external ticketing team to forward the ticket to Jim theMiddleware/Application Support SME. Jim investigates the cause of theWebSphere server shutdown and initiates a restart of the WebSphereApplication Server.
16 ITCAM Agents for WebSphere Applications, J2EE, and HTTP Servers: User Guide

Scenario 4: Determining if the WebSphere cluster needs to be loadbalanced
Annette, the level 2 operator, gets a number of tickets relating to slow responsetime for an application. Annette receives an email indicating that theWASHighCPUPercentUsed situation triggered on the WebSphere ApplicationServer where the application is hosted.1. Annette navigates to the Tivoli Enterprise Portal and observes that on the
WebSphere Agent Summary workspace the Application icon is displaying awarning symbol. The Resources icon is displaying the critical symbol. TheResource icon flyover is displaying high JVM CPU%.
2. Annette double-clicks the Resources icon and sees that the OS icon and JVMicon are both displaying the critical symbol. The OS icon flyover is displayingSystem CPU (ms) as high. The JVM icon also displays the JVM CPU% as high.
Chapter 2. Scenarios 17

3. Annette double-clicks the Application icon. The Application Trend at L2/L3workspace is displayed. The Selected Application Summary report displays theapplication name, average request response time, average request completionrate, and error rate. The average request response time is high. The RequestRate Trend chart displays the number of requests that are completed persecond for the application. Again, this value is displaying as high.
4. Before Annette escalates this problem, she must determine if the problem isrecent or if it has been occurring for some time. Annette checks the trend bytaking the following steps in the Request Rate Trend chart:a. In the Application Trend at L2/L3 workspace, she selects the Specify time
span for query icon. The Select the Time Span window is displayed.b. In the Custom Parameters section, she enters the required values in the
Start Time and End Time fields. Then, she clicks OK.
18 ITCAM Agents for WebSphere Applications, J2EE, and HTTP Servers: User Guide

5. Annette observes that there was an increase in client requests a few days agoand that this value has remained high throughout the week. Furtherinvestigation reveals that a surge of new customers caused a large increase innew users on the system. As a result, the load on the system is high.
6. Annette uses an external ticketing tool to forward the ticket with all details toJim, the Middleware/Application Support SME.
7. Jim immediately sees from what Annette has reported that the system isover-burdened because of a significant increase in new users, and that thenumber of servers that are available in the cluster must be increased. Jimforwards the ticket to Simon, the OS SME.
8. Simon must determine if the Application is running on a static or a dynamicWebSphere cluster. If the application is running on a static cluster, he addsadditional application servers. If the application is running on a dynamiccluster, he increases the number of servers allowed. These actions are outsidethe scope of the agents.
Scenario 5: Determining the cause of high response timesAnnette, the level 2 operator, receives an email that indicates that theWASHighResponseTime situation triggered for an application.
Important: This scenario assumes that you have ITCAM for ApplicationDiagnostics, which includes the Managing Server.1. Annette navigates to the Tivoli Enterprise Portal and notices in the Application
Server Summary workspace that the icon for the application is displaying acritical icon. The flyover for the application indicates that the Average Responsetime (ms) is high. Annette must determine for how long the response time hasbeen high.
Chapter 2. Scenarios 19

2. Annette double-clicks the Application icon. The Application Trend at L1workspace is displayed. Annette requests historical data by taking thefollowing steps:a. In the Requests - Current Interval View, she clicks the Specify time span for
query icon. The Select the Time Span window is displayed.b. In the Custom Parameters section, she enters the required values in the
Start Time and End Time fields and she clicks OK.c. She sorts by the Average Response Time column.
20 ITCAM Agents for WebSphere Applications, J2EE, and HTTP Servers: User Guide

3. Annette uses an external ticketing tool to forward the trend details to Jim, theMiddleware/Application Support SME.
4. Jim receives this problem ticket about high response times for a particularapplication. Jim navigates to the Request Analysis workspace and confirms theproblem that Annette described.
5. To further investigate the problem, Jim must open MSVE. Jim clicks theDiagnostic Recent Completed Requests link to open the MSVE Server Activity– Recent Requests page. Only requests that contain the URI information from
Chapter 2. Scenarios 21

the Request Analysis workspace are displayed. Jim notices that there are anumber of client requests with high response times.
6. Jim decides to further analyze the transactions by setting a Resident Time –In-Flight trap. This trap activates the moment an in-flight request takes longerthan a specified amount of time (the minimum is 15 seconds). To set up thistrap, Jim must complete the following steps:a. Select the trap type.
b. Set the trap alerts.
22 ITCAM Agents for WebSphere Applications, J2EE, and HTTP Servers: User Guide

c. Activate the trap.
d. Jim then sets an action type of Stack Trace and waits for a problem requestto trigger the trap.
7. After a while, the problem request triggers the trap.
Chapter 2. Scenarios 23

8. This trap also produces a stack trace.
Jim forwards the trouble ticket to Dave, the application developer. Dave worksto resolve the problem. This action is outside the scope of ITCAM forApplication Diagnostics.
24 ITCAM Agents for WebSphere Applications, J2EE, and HTTP Servers: User Guide

Scenario 6: Determining the cause of connection problemsAnnette, the level 2 operator, receives notification that theWASJ2CCPAvgWaitTimeHigh situation triggered. This error is critical. Thissituation indicates that the average wait time until a connection is granted islonger than 2 seconds.1. Annette navigates to the J2C Connections Pools workspace. This workspace
reports information about resource adapters and connectors that adhere to JEEConnector Architecture (J2C). J2C is the WebSphere Application Serverimplementation of the Java EE Connector Architecture (JCA). Data counters forthis category contain usage information about the J2C connection pools thatenable enterprise beans to connect to, and interact with, Enterprise InformationSystems.
2. In this workspace, Annette observes in the Worst Wait Times view that somewait times for connections are above 2 seconds. The Highest Average Pool Sizesbar chart shows the largest average number of managed connections for eachJ2C connection pool. Typically, a connection takes no longer than 2 seconds.
Chapter 2. Scenarios 25

3. Annette uses an external ticketing tool to forward the ticket with details to Jim,the Middleware/Application Support SME.
4. Jim navigates to the J2C Connections Pools workspace and compares theaverage pools size with the maximum pool size to establish the ideal maximumvalue. Jim establishes that the connection pool size must be adjusted. Theprocedure for making this adjustment is outside the scope of the agents.
Scenario 7: Determining if the Garbage Collection policy needs to beadjusted
Annette, the level 2 operator, is monitoring the Tivoli Enterprise Portal. Annettenotices a critical symbol on the JVM icon in the Application Server Summaryworkspace. The flyover for JVM icons shows a high metric for JVM CPU% and GCActive Time (ms).
26 ITCAM Agents for WebSphere Applications, J2EE, and HTTP Servers: User Guide

1. Annette double-clicks the JVM icon. The JVM Stack Trend workspace isdisplayed. The Percent GC Time Used view displays a high value. The heapusage trend is also high.
2. Annette uses an external ticketing tool to forward the ticket with details to Jim,the Middleware/Application Support SME.
Chapter 2. Scenarios 27

3. Jim reviews the information and determines that the heap size parameters inthe JVM are not set correctly. This incorrect setting affects applicationperformance. Jim sets the appropriate GC policy.
Scenario 8: Troubleshooting application response time in an XD cellDue to external resource, the response time for one of applications in the XD celldegrades below the service policy goal. Annette, the level 2 operator, receives anemail indicating that the Application Requests Above Goal situation triggered. Thissituation triggers when the rate of requests above goal is greater than 0.5%.1. In the Tivoli Enterprise Portal navigation tree, Annette follows the workspace
link for the triggered situation. The XDVEAppReqAboveGoalPercentHighEvent workspace is displayed.
2. Annette navigates by a link from the XDVEAppReqAboveGoalPercentHighEvent workspace to the Application workspace.
3. The Application workspace displays On Demand Router Statistics (ODR) forthe selected application module, transaction, class, and protocol summarizedover all ODRs in the cell.
4. From the Application workspace, Annette observes that the average overallresponse time is 20 seconds and the average server service time is also 20seconds. This indicates that a problem is occurring with the handling requestsby this application.
5. To see the deployment targets hosting the application and to ascertain whichof the deployment targets is contributing to the slow response time, Annettenavigates to the Deployment Targets workspace using the Per DeploymentTargets link.
28 ITCAM Agents for WebSphere Applications, J2EE, and HTTP Servers: User Guide

6. The Deployment Targets workspace displays a single deployment target forthis application: DynCluster. Annette navigates to this dynamic cluster usingthe link and then to servers belonging to the dynamic cluster.
7. The servers for the dynamic cluster performance are displayed. From thisview, Annette observes that both servers in the dynamic cluster have similarloading. Annette navigates to each server and observes that both haverequests higher than the set goal of 10 seconds.
8. Annette navigates to Server Diagnostic for one of the servers using the link,which opens the data collector workspace for that server. Annette observes inthe workspace that the sleeperEAR application is displaying a red critical icon.
Chapter 2. Scenarios 29

9. Annette double-clicks the application to open the Request Analysis workspace.
10. From the Request Analysis workspace, Annette navigates to the MSVE usingthe Diagnostic In-Flight Request Search link. From the MSVE, Annette cannavigate to the thread for the selected request and view the request call stack.
Important: This step is only available if you have ITCAM for ApplicationDiagnostics, which includes the Managing Server.
30 ITCAM Agents for WebSphere Applications, J2EE, and HTTP Servers: User Guide

11. Annette uses an external ticketing tool to forward the ticket with details toJim, the Middleware/Application Support SME.
12. Jim reviews the information and determines that the application waits forresponse from an external system. Jim researches and resolves the externalsystem issue and restores the application response time before it affected mostof the users.
Scenario 9: Ensuring that jobs processed by Compute Grid do notexecute for longer than one hour
Annette, the level 2 operator, must ensure that jobs processed by Compute Grid donot run for a longer period of time than one hour. If a job executes for longer, thenAnnette must capture the job information and forward it to theMiddleware/Application Support SME.1. Middleware/Application Support SME configure jobs as custom requests via
data collector configuration files.2. Annette edits the predefined XDCGJobExcessiveTotalTime situation to trigger if
the total job time is greater than 60 minutes.
Chapter 2. Scenarios 31

3. At some point, Annette observes that the situation triggered.
4. Annette clicks the event link and the Event workspace is displayed.
32 ITCAM Agents for WebSphere Applications, J2EE, and HTTP Servers: User Guide

5. Annette opens the Job workspace by using the link from the Event workspace.
6. The Job workspace shows all the details about the job. From the jobnotifications, Annette observes that the job is running for a long time. She clicksthe Diagnostic in-Flight Request Search link to open the MSVE in-flightworkspace; from here, she clicks the link to see the request call stack.
7. Annette captures the call stack and provides to Jim, the Middleware/Application Support SME.
8. Jim determines that job is waiting for database lock and resolves itappropriately.
Chapter 2. Scenarios 33

34 ITCAM Agents for WebSphere Applications, J2EE, and HTTP Servers: User Guide

Part 2. Part 2: Using the agents
© Copyright IBM Corp. 2006, 2014 35

36 ITCAM Agents for WebSphere Applications, J2EE, and HTTP Servers: User Guide

Chapter 3. ITCAM Agent for WebSphere Applications
IBM Tivoli Composite Application Manager Agent for WebSphere Applicationsprovides a Systems Management solution for the WebSphere application serverVersions 7, 8 and 8.5. Using the agent, you can monitor multiple WebSphereapplication servers running on the same physical node. Each application servermust have been configured with its own ITCAM Data Collector for WebSphere.
IBM Tivoli Composite Application Manager Agent for WebSphere Applications is acomponent of ITCAM for Application Diagnostics Version 7.1 and later. It is also acomponent of ITCAM for Applications Version 7.2. If you are using ITCAM forApplications, the managing server (deep dive) functionality is not available; ignoreall references to this functionality in this document.
The Tivoli Enterprise Monitoring agent collects four types of data through the datacollector embedded in the WebSphere Application server process:v Data for application server requests from the ITCAM Data Collector for
WebSpherev Resource data from WebSphere Performance Monitoring Infrastructure (PMI)v Data from WebSphere log filesv Process data from the operating system
Initiating data collection and the reporting of data
Because of high processor usage, some data items are not automatically collectedand reported. The collection of some data and statistics depends upon the settingof instrumentation levels for certain attributes. If the instrumentation levels are notset appropriately, certain information is not collected and displayed in theworkspaces. Similarly, those attributes that collect request and application tracedata require you to complete several configuration steps. If you need to collectthese data, use one of these methods to reconfigure data collection:v Complete configuration steps (as explained in the ITCAM Agent for WebSphere
Applications installation and customization guide).v Issue Take Action commands to take specific action against your WebSphere
application server or the monitoring product using the Tivoli Enterprise Portal.v Use Manage Tivoli Enterprise Services (as explained in the various IBM Tivoli
Monitoring installation manuals and the ITCAM Agent for WebSphereApplications installation and customization guide).
Automatic baselining
To display application health status, ITCAM monitors request response times(averaged over a sampling interval, by default 60 seconds) for every application.Every top-level request available in an application is monitored separately.
For every request, two thresholds are set, known as fair and bad. Response timebelow both thresholds is considered good. When at least one average requestresponse time for an application rises over the fair threshold, a health warning(indicated with an exclamation mark symbol) for this application is reported. Inthe same way, when at least one average request response time rises over the badthreshold, an application health alarm (indicated with an x symbol ) is reported.
© Copyright IBM Corp. 2006, 2014 37

ITCAM also monitors the "nested" requests (for example, database calls) withinevery top-level request. In the event of a warning or alarm, it checks which of thenested requests is taking more than its usual share of time. Depending on the typeof such nested requests, ITCAM shows whether the client, application, or backendtier is the likely cause of the warning/alarm. Servlet and Portal request types areassigned to the client tier; EJB and User (Custom) request types, to the applicationtier; all other request types (JNDI, JDBC, JCA, JMS) to the backend tier.
Important: Baselining is currently not supported for SCA requests.
When ITCAM starts to monitor a new application, it automatically starts abaselining process. This process normally runs for seven days and provides updatedinformation every hour from the beginning. During the process, ITCAM collectsstatistical data for all requests in this application. Once the data is collected,ITCAM sets the thresholds automatically; it also records the typical share ofresponse time for each nested request type.
In most cases, this automatic setting is adequate. During the baselining process, thebaselines get updated periodically, and the alarms/warnings start to correspond toreal problems. There is no need to adjust baselining settings when things areworking normally. (The automatic thresholds usually become usable earlier, afterthe application has been observed through its typical load patterns). If you need toacquire thresholds, based on whatever data is available, before the hourlyautomatic update, you can manually update baselining.
However, in some situations the threshold levels can become inadequate. Thisresults in either too many false alarms/warnings, or in real problems goingundetected. Such situations can be broadly split into two categories:v If some time has passed since the baselining process for an application, its
response times might have changed because of configuration alteration, databasegrowth, changing load patterns, and so on. In this case, you might need to runthe baselining process again. It is good practice to do it after any configurationor infrastructure change.
v If the thresholds are incorrect immediately after the baselining process has beencompleted, you might have to adjust the auto threshold settings.
As a last resort, you can also override the thresholds with fixed values. However,do not do this unless you know a lot about the monitored application, or unlessinstructed by IBM Level 3 Support.
If you need to have the thresholds set before they are updated automatically forthe first time, you can trigger a baseline update. This immediately sets thethresholds based on the request data collected so far.
Additional information
For additional usage information about this agent, see:v Workspacesv Attributesv Situationsv Take Action commands
38 ITCAM Agents for WebSphere Applications, J2EE, and HTTP Servers: User Guide

Workspaces for ITCAM Agent for WebSphere ApplicationsAs part of the IBM Tivoli Composite Application Manager Agent for WebSphereApplications product integration with the Tivoli Enterprise Portal, workspaces offerviews of monitoring data that provide detailed current data about WebSphereapplication servers running on Linux, UNIX, and Windows and z/OS platforms onyour site. In addition to reports and graphs, a workspace can contain other views(that is, windows), such as a Notepad editor session, a browser session, a telnetsession, an event console, or a Take Action view from which you can issuecommands.
Several views of high-level information
Several workspaces provide high-level information to help you meet themonitoring and administrative needs of your site. These workspaces report onstatus and availability for both the WebSphere administrative server and itsapplication server instances. They allow you to easily monitor the availability ofyour enterprise, the WebSphere application server, and application server instances.
Primary and secondary workspaces
The workspaces listed in the Navigator are directly accessible and are thus termedprimary workspaces. Some of these also contain secondary workspaces, which are notaccessible directly from the Navigator. Instead, you must select and display theprimary workspace. Then, use either a menu option or a special link icon in theprimary workspace views to reach the secondary workspaces (sometimes calledsubsidiary workspaces).
Workspaces with historical data links
Several workspaces provide secondary workspaces that display historical data. Youcan specify a time span over which to collect historical data, which accumulatesand summarizes the data in the primary workspaces that generate them. (Thedefault setting is 15 minutes; you can modify this setting to suit your needs.) Thedescriptions of the historical workspaces follow the descriptions of the primaryworkspaces that generate them in the workspace helps.
Available Tivoli Enterprise Portal workspaces
For an overview of the organization of the available workspaces, see Organizationof the predefined workspaces.
Organization of the predefined workspacesThe IBM Tivoli Composite Application Manager Agent for WebSphere Applicationsworkspaces for the Tivoli Enterprise Portal define data displays that appear in theNavigator Physical view. In addition to the workspaces that the Navigator lists,you can reach their subsidiary (that is, secondary) workspaces from the primaryworkspaces (those listed in the Navigator).
Accessing the subsidiary workspaces
You can access the subsidiary workspaces of a primary workspace by using one ormore of the following methods:
Chapter 3. ITCAM Agent for WebSphere Applications 39

From the Navigator:1. Select the primary workspace.2. Right-click the name of the selected workspace in the Navigator.3. Select Workspaces from the menu.4. Select the desired subsidiary workspace.
From the View menu:1. Select the primary workspace.2. From the menu bar, select View > Workspaces.3. Select the desired subsidiary workspace.
From a report:1. Select the primary workspace.2. If the workspace report contains a link icon, click the icon to navigate to the
default subsidiary workspace pertaining to the selected row or right-click theicon and select a subsidiary workspace from the menu.
From a chart view:
The data displayed in some bar charts and plot charts is linked to subsidiaryworkspaces. To search for a link, right-click a bar or data point in the chart. If Linkto displays in the menu, you can select a subsidiary workspace pertaining to thedata in the chart.
Workspace organization
The hierarchy levels shown in the Navigator depend on how your enterprisecustomizes the Tivoli Enterprise Portal. However, ITCAM Agent for WebSphereApplications does provide a set of predefined workspaces, which do not requirecustomization. The following list shows the order and hierarchy of the predefinedworkspaces provided by the ITCAM Agent for WebSphere Applications. It is arepresentation of how the predefined workspaces are organized in the Navigator.For more detailed information about a workspace, click its name in the table.
Important: Some workspaces are only available when running a monitoring agentin a z/OS environment. For more information, see “Region workspaces in a z/OSenvironment” on page 136.
operating system [for example, Windows]v system [that is, node name]
– WebSphere Agent- “WebSphere agent summary workspace” on page 49- “WebSphere agent summary status workspace” on page 49- “Application Server Summary and Business Process Manager Summary
workspaces” on page 50- “Configuration workspaces” on page 57
40 ITCAM Agents for WebSphere Applications, J2EE, and HTTP Servers: User Guide

v “WebSphere application server workspace” on page 129v “Resources and Applications workspaces” on page 53v “High Availability Manager workspace” on page 92v “DCS Stacks workspace” on page 84v “Configuration workspaces” on page 57
-v Application Health
– Application Registry– Application Trend at L1– Application Trend at L2/L3– OS Stack– JVM Stack Trend– “Web Tier Analysis workspace” on page 113– “Backend Tier Analysis workspace” on page 112– “Request Baseline workspace” on page 109– “Application Configuration workspace” on page 111– “EJB Tier Analysis workspace” on page 110– “Application Health History workspace” on page 113– “Selected Request - Service Components workspace” on page 117
v Request Analysis– Selected Request - Datasources– Selected Request JMS Queues– Selected Request Resource Adapters– Selected Request - History– “Selected Request - Service Components workspace” on page 117– “Service Components workspace” on page 119
v Garbage Collection Analysis– Allocation Failures– Garbage Collections - Selected Allocation Failure
v Log Analysisv Pool Analysisv Datasources
– “Data sources workspace” on page 80– “Selected Datasources - Datasource Trend workspace” on page 114
v JMS Summaryv Web Applications
– Sessions– Servlets / JSPs - Selected Enterprise Application
v EJB Containers– Container Object Pools– Container Transactions– Enterprise Java Beans
v DB Connection Pools– Selected DB Connection Pool - History
v J2C Connection Pools
Chapter 3. ITCAM Agent for WebSphere Applications 41

v Thread Pools– “Thread Pool Trend workspace” on page 124– Alarm Manager
v Cache Analysis– “Thread Pool Trend workspace” on page 124–
v Workload Managementv Schedulerv Web Services
– Selected Web Services - Historyv Messaging Engines
– Client Communications– Messaging Engine Communications– WMQ Client Link Communications– WMQ Link Communications– Destinations
- Durable Subscriptions- WebSphere Portal Server
v “Application Server Summary and Business Process Manager Summaryworkspaces” on page 50
v “Configuration workspaces” on page 57– “WebSphere application server workspace” on page 129– “Resources and Applications workspaces” on page 53– “High Availability Manager workspace” on page 92– “DCS Stacks workspace” on page 84– “Configuration workspaces” on page 57
v Portal Summaryv
– Portlet Summary- Selected Portlet - History
– Portal Pages Summary- Selected Portal Page - History
v Request Analysis– Selected Request - Datasources– Selected Request JMS Queues– Selected Request Resource Adapters– Selected Request - History
v Garbage Collection Analysis– Allocation Failures– Garbage Collections - Selected Allocation Failure–
v Log Analysisv Pool Analysisv Datasources
– “Data sources workspace” on page 80
42 ITCAM Agents for WebSphere Applications, J2EE, and HTTP Servers: User Guide

– “Selected Datasources - Datasource Trend workspace” on page 114v JMS Summaryv Web Applications
– Sessions– Servlets / JSPs - Selected Enterprise Application
v EJB Containers– Container Object Pools– Container Transactions– Enterprise Java Beans
v DB Connection Pools– Selected DB Connection Pool - History
v J2C Connection Poolsv Thread Pools
– Alarm Managerv Cache Analysisv Workload Managementv Schedulerv Web Services
– Selected Web Services - History- WebSphere ESB Server
v Application Health Summary– Selected Application - Application Tier Analysis– Selected Application - Configuration– Selected Application - Backend Tier Analysis– Selected Application - Health History– Selected Application - Client Tier Analysis– Application Registry
- Selected Request - Baselinev High Availability Managerv DCS Stacksv Request Analysis
– Selected Request - Datasources– Selected Request JMS Queues– Selected Request Resource Adapters– Selected Request - History– “Selected Request - Service Components workspace” on page 117– “Service Components workspace” on page 119
v Garbage Collection Analysis– Allocation Failures– Garbage Collections - Selected Allocation Failure
v Log Analysisv Pool Analysisv Datasources
– Selected Datasource - Historyv JMS Summary
Chapter 3. ITCAM Agent for WebSphere Applications 43

v Web Applications– Sessions– Servlets / JSPs - Selected Enterprise Application
v EJB Containers– Container Object Pools– Container Transactions– Enterprise Java Beans
v DB Connection Pools– Selected DB Connection Pool - History
v J2C Connection Poolsv Thread Pools
– Alarm Managerv Cache Analysisv Workload Managementv Schedulerv Web Services
– Selected Web Services - Historyv Messaging Engines
– Client Communications– Messaging Engine Communications– WMQ Client Link Communications– WMQ Link Communications– Destinations
- Durable Subscriptionsv Service Components
– Service Component Elements- WebSphere Process Server
v Application Health Summary– Selected Application - Application Tier Analysis– Selected Application - Configuration– Selected Application - Backend Tier Analysis– Selected Application - Health History– Selected Application - Client Tier Analysis– Application Registry
- Selected Request - Baselinev High Availability Managerv DCS Stacksv Request Analysis
– Selected Request - Datasources– Selected Request JMS Queues– Selected Request Resource Adapters– Selected Request - History– “Selected Request - Service Components workspace” on page 117– “Service Components workspace” on page 119
v Garbage Collection Analysis
44 ITCAM Agents for WebSphere Applications, J2EE, and HTTP Servers: User Guide

– Allocation Failures– Garbage Collections - Selected Allocation Failure
v Log Analysisv Pool Analysisv Datasources
– Selected Datasource - Historyv JMS Summaryv Web Applications
– Sessions– Servlets / JSPs - Selected Enterprise Application
v EJB Containers– Container Object Pools– Container Transactions– Enterprise Java Beans
v DB Connection Pools– Selected DB Connection Pool - History
v J2C Connection Poolsv Thread Pools
– Alarm Managerv Cache Analysisv Workload Managementv Schedulerv Web Services
– Selected Web Services - Historyv Messaging Engines
– Client Communications– Messaging Engine Communications– WMQ Client Link Communications– WMQ Link Communications– Destinations
- Durable Subscriptionsv Service Components
– Service Component Elements- Lotus® Workplace Server
v Application Health Summary– Selected Application - Application Tier Analysis– Selected Application - Configuration– Selected Application - Backend Tier Analysis– Selected Application - Health History– Selected Application - Client Tier Analysis– Application Registry
- Selected Request - Baselinev High Availability Managerv DCS Stacksv Workplace Mail
Chapter 3. ITCAM Agent for WebSphere Applications 45

– IMAP/POP– Messages Queues
v Portal Summary– Portlet Summary
- Selected Portlet - History– Portal Pages Summary
- Selected Portal Page - Historyv Request Analysis
– Selected Request - Datasources– Selected Request JMS Queues– Selected Request Resource Adapters– Selected Request - History
v Garbage Collection Analysis– Allocation Failures– Garbage Collections - Selected Allocation Failure
v Log Analysisv Pool Analysisv Datasources
– Selected Datasource - Historyv JMS Summaryv Web Applications
– Sessions– Servlets / JSPs - Selected Enterprise Application
v EJB Containers– Container Object Pools– Container Transactions– Enterprise Java Beans
v DB Connection Pools– Selected DB Connection Pool - History
v J2C Connection Poolsv Thread Pools
– Alarm Managerv Cache Analysisv Workload Managementv Schedulerv Web Services
– Selected Web Services - History
For additional information, see: Attribute groups used by the predefinedworkspaces
Summary workspacesYou can use summary workspaces to quickly see the status of WebSphereapplication servers and applications in your enterprise.
46 ITCAM Agents for WebSphere Applications, J2EE, and HTTP Servers: User Guide

About Summary Workspaces
Summary workspaces provide a way to quickly monitor the status of applicationservers and applications. ITCAM for Application Diagnostics provides predefinedsituations that you can use to monitor WebSphere application servers in yourenterprise. Summary workspaces enable you to quickly determine the status ofthese situations. User-defined and predefined situations are mapped to variouscolored icons in the summary workspaces. The icon color indicates status whichenables you to quickly determine the overall health of applications servers andapplications. The following organization chart shows the structure of the icons inthe summary workspaces:
Summary Workspace Icons
In summary workspaces, each icon displays as one of the following statuses:Critical, Warning, Normal, or Unknown. The status is calculated based on thestatus of the underlying situations being monitored. Each icon also displays themetrics for the first two situations shown on the flyover. The following table showsthe possible status of icons:
Table 2. Status Icons
Status Icon Status
Critical
Warning
Normal
Unknown or Application Stopped
Chapter 3. ITCAM Agent for WebSphere Applications 47

Summary Workspace Flyovers
The icons indicate the status of the WebSphere application servers and applicationsin your enterprise. To access more detailed information from the summaryworkspaces, point to the icon and a flyover is displayed. The flyover providesrelevant metrics pertaining to the icon. It also shows the top 10 situations that arelinked with the icon. You can go directly to the situation event result workspace byclicking the situation link icon in the flyover.
Drill Down on Summary Workspaces
You can drill down on the icons to see more information. When you double-clickan icon, further workspace views showing more detailed monitoring data aredisplayed.
See also
“Situations for ITCAM Agent for WebSphere Applications” on page 278
Summary Workspace ViewsYou can use summary workspaces to quickly see the status of WebSphereapplication servers and applications in your enterprise. Each workspace cancontain one or more views.
There are five summary workspaces. The following table describes the summaryworkspaces:
Table 3. Summary Workspace Table
Workspace Name Level in TEP Views Available
WebSphere Agent Summary Agent level v Application Servers StatusTable
v Application ServersSummary
WebSphere Agent SummaryStatus
Agent level v Application Servers Status
v Application ServersSummary
application server Summary application server Level v application server -Resources
v application server -Applications
Resources application server Level v application server -Resources
v Situation Event Console
Applications application server Level v application server -Applications
v Situation Event Console
48 ITCAM Agents for WebSphere Applications, J2EE, and HTTP Servers: User Guide

WebSphere agent summary workspaceThe WebSphere Agent Summary Workspace provides summary monitoringinformation for WebSphere application servers in your enterprise. It contains twoviews, the Application Servers Status Table view and the Application ServersSummary view.
Application Servers Status Table view
Two icons are displayed in this view: the Application and the Resources icons.
The flyover for the Applications icon displays the following metrics:v application server Namev Average Response Time (ms)v Request Rate (Req/Sec)v Error Rate (Errors/sec)v Number of problem Situationsv List of top 10 situations
The flyover for the Resources icon displays the following metrics:v application server Namev JVM CPU%v GC Active Time (ms)v Number of problem Situationsv List of top 10 situations
For additional information, see:v Organization of the predefined workspacesv Attribute groups used by the predefined workspaces
WebSphere agent summary status workspaceThe WebSphere Agent Summary Status workspace is an alternative summaryworkspace available at the WebSphere agent level. The WebSphere Agent SummaryStatus workspace provides summary monitoring information for WebSphereApplication servers.
To switch to the WebSphere Agent Summary Status workspace, right-click theWebSphere Agent in the Tivoli Enterprise Portal navigator and select Workspaceand then select WebSphere Agent Summary Status.
The WebSphere Agent Summary Status workspace contains two views, theApplication Servers Status view and Applications Servers Summary view.
Application Servers Status View
In this view, the Server icon indicates the status of both applications and resources.The flyover for the Server icon displays the following metrics:v Average Response Time (ms)v Request Rate (Req/Sec)v Error Rate (Errors/sec)v JVM CPU%v GC Active Time (ms)
Chapter 3. ITCAM Agent for WebSphere Applications 49

v WAS Node Namev WAS Cell Namev WAS Cluster Namev Number of Problem Situationsv List of top 10 situations
For additional information, see:v Organization of the predefined workspacesv Attribute groups used by the predefined workspaces
Application Server Summary and Business Process ManagerSummary workspaces
The Application Server Summary workspace provides summary monitoringinformation for a WebSphere Application Server. The Business Process ManagerSummary workspace provides summary monitoring information for a BusinessProcess Manager Server. These workspaces are identical and contain two views: theApplication Server - Resources view and the Applications Server - Applicationsview.
Application server - Resources View
The Application server - Resources view contains the following icons:v OSv JVMv Datasourcev Threadpoolv Services
If ITCAM for SOA is installed on the monitored Business Process Manager server,right-click any resource and select Operation Flow for Application Server to viewthe Operation Flow for Application Server workspace, provided by ITCAM forSOA. In this workspace, you can see the topology for all components running onthe server.
OS icon
The OS icon provides summary metrics for machine CPU and paging metrics. Theflyover for the OS icon displays the following metrics:v System CPU (ms)v System Paging Rate (Kbytes/sec)v Number of problem situationsv List of top 10 situations
When you double-click the OS icon, the following subsidiary views display in theOS Stack workspace:v Current OS stack summaryv CPU usedv System Paging
For further information about the OS Stack workspace, see OS Stack
50 ITCAM Agents for WebSphere Applications, J2EE, and HTTP Servers: User Guide

JVM icon
The JVM icon flyover provides summary metrics for: CPU for the JVM process,garbage collection, and heap metrics. The flyover information for the JVM icondisplays the following metrics:v JVM CPU%v GC Active Time (ms)v List of top 10 situations
When you double-click the JVM icon, the following subsidiary views display in theJVM Stack Trend workspace:v JVM CPU Trendv Percent GC time usedv Heap Usage trend
For further information about the JVM Stack Trend workspace, see JVM StackTrend
Datasources icon
The Datasources icon flyover provides summary metrics for JDBC, JMS, JCA, andJTA, it also indicates the number of problem situations. When you double-click theDatasource icon, the following subsidiary views display in the Datasourcesworkspace:v Worst Datasource Query Timesv Worst Datasource Update Timesv Datasources - Current Interval
Threadpool icon
The Threadpool icon flyover provides summary metrics for threadpool informationincluding the number of problem situations. When you double-click theThreadpool icon, the following subsidiary views are displayed in the Threadpoolsworkspace:v Highest Average Pool Sizesv Average thread pool usagev Threadpools table
Services icon
The Services icon flyover provides summary metrics for web services, WorkloadManagement, and System Integration Bus. When you double-click the Servicesicon:v for Portal, Services icon takes you to web Services which has the following
views:– Worst Response Times– Most Popular– Web Services– Web Service Gateway
v for Lotus, the Services icon takes you to Workload Management which has theseviews:– WLM Server Incoming Requests
Chapter 3. ITCAM Agent for WebSphere Applications 51

– WLM Client Outgoing Requests– Workload Management Server– Workload Management Client
Application server - Applications View
In this view, there is an icon per application. The flyover for an Application icondisplays the following metrics:v Average Response Time (ms)v Request Rate (Req/Sec)v Error Rate (Errors/sec)v Monitoring Levelv Number of problem Situationsv List of top 10 situations
If ITCAM for SOA version 7.2 is installed on the monitored Business ProcessManager server, right-click any application and select Selected Application -Group Summary to view the Group Summary workspace, provided by ITCAM forSOA. In this workspace, you can see the status of all process groups that includeany components or operations that are a part of the selected application.
When you double click an Application icon, the following subsidiary views aredisplayed in either the Application Trend at L1 or Application Trend at L2/L3workspace:v Response Time Trendv Error Rate Trendv Request Rate Trendv Selected Application Summary: Application Name
For further information about the Application Trend workspace, see “SelectedApplication - Application Trend at L1 workspace” on page 72, and “SelectedApplication - Application Trend at L2/L3 workspace” on page 73
Application Server Summary and Business Process ManagerSummary workspaces
To access the workspaces, complete the following steps:1. Within the Navigator, expand Windows Systems, Linux Systems, z/OS
Systems, or UNIX Systems, as appropriate for the node you are monitoring.2. Within the node list, expand the entry that corresponds to the node that you
want to select.3. Within that node list of monitored applications, expand the list of WebSphere
agents.4. Within the list of available agents, click a WebSphere Application Server or
Business Process Manager entry.
For additional information, see:v Organization of the predefined workspacesv Attribute groups used by the predefined workspaces
52 ITCAM Agents for WebSphere Applications, J2EE, and HTTP Servers: User Guide

Resources and Applications workspacesThe Resources and Applications workspaces provide monitoring data for yourapplication server.
Resources Workspace
To access the Resources workspace, right-click the application server node in theTivoli Enterprise Portal navigator and select Workspace and then select Resources.The Resources workspace contains the following views:v Application Servers Resourcesv Situation Event Console
For information about the Application Servers Resources view, see “ApplicationServer Summary and Business Process Manager Summary workspaces” on page50. The Situation Event Console displays additional detail for all open situations.For details on how to perform filtering on open situations, see Tivoli Monitoringhelp.
If ITCAM for SOA is installed on the monitored Business Process Manager server,right-click any resource and select Operation Flow for Application Server to viewthe Operation Flow for Application Server workspace, provided by ITCAM forSOA. In this workspace, you can see the topology for all components running onthe server.
Applications Workspaces
To access the Applications workspace, right-click the application server node in theTivoli Enterprise Portal navigator and select Workspace and then selectApplications. The Applications workspace contains the following views:v Application Servers Applicationsv Situation Event Console
For information about the Application Servers Applications view, see “ApplicationServer Summary and Business Process Manager Summary workspaces” on page50. The Situation Event Console displays additional detail for all open situations.For details on how to perform filtering on open situations, see Tivoli Monitoringhelp.
If ITCAM for SOA is installed on the monitored Business Process Manager server,right-click any application and select Selected Application - Group Summary toview the Group Summary workspace, provided by ITCAM for SOA. In thisworkspace, you can see the status of all process groups that include anycomponents or operations that are a part of the selected application.
For additional information, see:v Organization of the predefined workspacesv Attribute groups used by the predefined workspaces
Situation Mapping and Summary WorkspacesUser-defined situations are mapped to icons in summary workspaces. When youcreate a situation, if the situation then triggers an alert, detail of the situation isdisplayed in one of the summary workspaces icon flyovers.
Chapter 3. ITCAM Agent for WebSphere Applications 53

When you create a situation, the attribute group you base the situation ondetermines which summary workspace icon flyover the situation displays in. Thefollowing table shows which attribute groups map to which icons and predefinedsituations :
Table 4. Mapping of attribute groups to predefined situations
Tivoli EnterpriseMonitoring AgentAttribute Group Name Icons Predefined Situations
ApplicationsMonitoringConfiguration
N/A WASAppDiscovered
Requests MonitoringConfiguration
N/A
Baseline N/A
Applications HealthStatus
Applications WASApplicationBad, WASApplicationFair,WASApplicationGood
Applications ServerStatus
JVM
Log Analysis JVM WASError
KYN Command N/A
WebSphere AgentEvents
N/A
DC MessagesWebSphere
JVM
Dynamic Cache Services
Dynamic CacheTemplates
Services
Workload ManagementClient
Services
Workload ManagementServer
Services
DB Connection Pools Datasources WASDBConnectionPoolThrdTimeoutWASDBConnectionPoolUsageMaxedWASDBConPAverageUsageTimeHighWASDBConPAvgWaitTimeHigh
Container Object Pools Threadpools
Enterprise Java beans Applications WASEJBCreateTimeHighWASEJBMethodResponseTimeHighWASEJBRemoveTimeHigh
Web Applications Applications WASWebApplicationError
Web Applications -Sessions
Applications WASSrvlSessAvgActiveSessionHighWASSrvlSessExtReadTimeHighWASSrvlSessExtWriteTimeHigh
Applications Server JVM, OS WASHighCPUPercentUsed
EJB Containers Applications
Servlets JSPs Applications WASServletsJSPError
Servlet Sessions Applications
Thread Pools Threadpools WASThreadPoolPercentMaxedWASThreadFreeLow
54 ITCAM Agents for WebSphere Applications, J2EE, and HTTP Servers: User Guide

Table 4. Mapping of attribute groups to predefined situations (continued)
Tivoli EnterpriseMonitoring AgentAttribute Group Name Icons Predefined Situations
Container Transactions Datasources WASContainerTransactionRollbackWASCTGlbTransDurationHighWASCTLclTransDurationHigh
J2C Connection Pools Datasources WASJ2CConnectionPoolUsageMaxedWASJ2CCPAverageUsageTimeHighWASJ2CCPAvgWaitTimeHigh
DCS Stack
High AvailabilityManager
Web Services Gateway
Web Services
Alarm Manager
Scheduler Services
Client Communications Services
Durable Subscriptions Services
Messaging EngineCommunications
Services
Messaging Engines Services
Queue Services
Service ComponentElements
Services
Service Components Services
Topic Spaces Services
WMQ Client LinkCommunications
Services
WMQ LinkCommunications
Services
Workplace Mail Service Datasources
Workplace MailQueues
Datasources
Workplace MailIMAP/POP
Services
Portal Summary Services
Portal Page Summary Services WASPortalPageResponseTime
Portlet Summary Services WASPortletResponseTime
Datasources Services WASDataSrcConWaitTimeHigh
Request Times andRates
Applications WASHighResponseTime
Request Analysis Applications WASReqSQLExecuteTimePercentHighWASReqSQLQueryTimePercentHighWASReqSQLUpdateTimePercentHigh
JMS Summary Datasources
Selected Request Applications
Chapter 3. ITCAM Agent for WebSphere Applications 55

Table 4. Mapping of attribute groups to predefined situations (continued)
Tivoli EnterpriseMonitoring AgentAttribute Group Name Icons Predefined Situations
Garbage CollectionAnalysis
JVM WASHighGCTimePercent
WASAvgHeapSizeAfterGCHigh
Allocation Failure JVM WASOutofHeapSpace
Garbage CollectionCycle
JVM
WebSphere Agent WASNotConnected
WebSphere App Server WASHighCPUPercentUsedWASHighResponseTime
Where NA is indicated for the icon, it means that situations created based on theseattribute groups are not reported in the summary workspaces. This is becausethese tables are strictly related to Tivoli Enterprise Monitoring Agent configurationparameters that do not reflect the application or application server health.
For more information, see:
WebSphere Agent situationsWebSphere Agent attributes
Summary Workspaces error messagesFour possible error messages can be displayed in the summary workspace statusbar.
The following table lists and explains the error messages:
Table 5. Summary Workspaces error messages
Error Message Explanation
InternalCommunicationError
This message indicates a communication problem between thesummary workspaces front end and the summary workspacesback-end code (called evaluator) running inside the embeddedWebSphere server on the Tivoli Enterprise Portal Server server. Thiserror displays for two reasons:
1. If this message is displayed for all the summary workspaces,there is an installation error. Summary workspaces require code torun inside Tivoli Monitoring eWAS. Ensure that Tivoli Monitoring6.2, including eWAS, is installed. Install ITCAM Agent forWebSphere Applications support files. After installation,reconfigure the Tivoli Enterprise Portal Server. If you do notreconfigure the Tivoli Enterprise Portal Server, the SummaryWorkspace status bar displays ''Internal Communication Error".
2. If this error message is displayed for only some of the summaryworkspaces, turn up tracing and send to IBM support for review.
Invalid Data This message indicates that data being sent from the summaryworkspaces back-end code (called evaluator) running inside theembedded WebSphere server on the Tivoli Enterprise Portal Serverserver is malformed. Turn on the tracing, collect the logs, and send toIBM support for further analysis.
56 ITCAM Agents for WebSphere Applications, J2EE, and HTTP Servers: User Guide

Table 5. Summary Workspaces error messages (continued)
Error Message Explanation
No ApplicationsConfigured
This message indicates that no applications are configured on theWebSphere server. This message also displays if the WebSphereserver is not connected to the Tivoli Enterprise Monitoring Agent.The message no longer displays when the WebSphere server is backonline. No user action is needed.
No ApplicationsServers Connected
This message indicates that no WebSphere servers are connected tothe Tivoli Enterprise Monitoring Agent. The message is no longerdisplayed when the WebSphere server is back online. No user actionis needed.
Configuration workspacesMonitoring Agent configuration and tuning is facilitated in the Tivoli EnterprisePortal through configuration workspaces. There are two configuration workspaces:one for the Monitoring Agent level and one for the server level:v WebSphere Agent Configuration workspacev application server Configuration workspace
Both configuration workspaces have the same tabs and configuration settings.
The WebSphere Agent Configuration workspace settings are initial settings appliedto all data collectors managed by the Monitoring Agent. For example, when a datacollector connects to the Monitoring Agent for the first time or if the data collectorconfiguration was deleted. In both these examples, the configuration settingsspecified in the WebSphere Agent Configuration workspace are applied.
The application server Configuration workspace contains individual server settingsand the settings in this workspace override the settings in the WebSphere AgentConfiguration workspace.
Settings for the WebSphere Agent Configuration and application serverConfiguration workspaces are saved in the following files:
Table 6. Workspace configuration files
Workspace Configuration file
WebSphereAgentConfigurationworkspace inwindows:
CANDLE_HOME\TMAITM6\hostname_productcode.xml
applicationserverConfigurationworkspace inwindows:
CANDLE_HOME\TMAITM6\hostname_productcode_servervendor.servernode.server name.xml
WebSphereAgentConfigurationworkspace inother platforms:
CANDLE_HOME/config/hostname_productcode.xml
Chapter 3. ITCAM Agent for WebSphere Applications 57

Table 6. Workspace configuration files (continued)
Workspace Configuration file
applicationserverConfigurationworkspace inother platforms:
CANDLE_HOME/config/hostname_productcode_servervendor.servernode.server name.xml
The WebSphere Agent Configuration workspace configuration settings are initialsettings which are applied to all data collectors managed by the selectedWebSphere agent. The application server Configuration workspace configurationsettings override agent level configuration settings.
Both configuration workspaces have the following two views:v Application Diagnostics Configuration view - this view has the following four
tabs– Collection (Basic)– Collection (Advanced)– Application Dashboard (Basic)– Application Dashboard (Auto Threshold)
v Application Servers view - this view has one tab which lists all applicationservers monitored by the selected WebSphere agent, for each application server,there is a link to application server Configuration workspace.
Application Diagnostics Configuration - Basic TabThe Basic tab contains the following fields:v Request Data Monitoring - in this field, specify the monitoring level for
requesting data from connected data collectors. The following values can beentered into this field:– Disable - request data is not monitored and is not displayed– Level 1 - only monitors edge request data, for example, servlets, JSPs, EJBs,
SCA requests, and web service requests– Level 2 - monitors nested request data in addition to edge request data, for
example, JNDI, JMS, JDBC, and JCA requests
Important: This monitoring level is applied by default to newly discoveredapplications. However, you can set the monitoring level for any operationseparately, using the “Set_Application_Monitoring: Set monitoring” on page 294Take Action command.
v Request Data Monitoring Method - in this field, specify the monitoring methodused by the Monitoring Agent to govern when it uploads request and garbagecollection data from connected data collectors. The following values can beentered into this field:– On Demand - when the monitoring method is set to On Demand, data is
uploaded only when requested by the user. The exception to this is if thecache of data is still current. Whether this data is current is determined by theRequest Data On Demand Maximum Sample Age (sec) field in the CollectionAdvanced tab. With On Demand monitoring, the Tivoli Enterprise Portalresponse time is slower because the data is collected as requested. However,the retrieved data is the most current available. CPU and memory usage onthe monitored systems is lower for On Demand monitoring.
58 ITCAM Agents for WebSphere Applications, J2EE, and HTTP Servers: User Guide

– Fixed Interval - when the monitoring method is set to Fixed Interval, theMonitoring Agent will upload sample data from the data collectors at regularfixed intervals, and respond to a user request using the latest cache of sampledata gathered at the last interval. With Fixed Interval monitoring, CPU andmemory usage can be higher because more data is collected more frequentlybut Tivoli Enterprise Portal response time is faster as the data is more readilyavailable. Data samples are calculated for the same time interval and as aresult are more consistent.
v Resource Data Monitoring - in this field, specify whether resource data ismonitored from connected data collectors. The following values can be enteredin this field:– Disable - resource data is not collected by the Monitoring Agent and is not
displayed in the Tivoli Enterprise Portal.– Enable - resource data is collected by the Monitoring Agent and is displayed
in the Tivoli Enterprise Portal.v Resource Data Monitoring Method - in this field, specify the monitoring
methodology used by the agent to govern when it uploads resource data fromconnected data collectors. The following values can be entered into this field– On Demand - when the monitoring method is set to On Demand, data is
uploaded only when requested by the user. The exception to this is if thecache of data is still current. Whether this data is current is determined by theResource Data On Demand Maximum Sample Age (sec) field in the CollectionAdvanced tab. With On Demand monitoring, the Tivoli Enterprise Portalresponse time is slower as the data is collected as requested. However, theretrieved data is the most current available. CPU and memory usage on themonitored systems is lower for On Demand monitoring.
– Fixed Interval - when the monitoring method is set to Fixed Interval, theMonitoring Agent will upload sample data from the data collectors at regularfixed intervals, and respond to a user request using the latest cache of sampledata gathered at the last interval. With Fixed Interval monitoring, CPU andmemory usage can be higher because more data is collected more frequentlybut Tivoli Enterprise Portal response time is faster as the data is more readilyavailable. Data samples are calculated for the same time interval and as aresult are more consistent.
v Garbage Collection Monitoring - in this field, specify if verbose garbagecollection output monitoring is enabled. The following values can be entered inthis field:– Disable - verbose garbage collection output data is not collected by the
Monitoring Agent and is not displayed in the Tivoli Enterprise Portal.– Enable - verbose garbage collection output data is collected by the
Monitoring Agent and is displayed in the Tivoli Enterprise Portal.
Application Dashboard (Basic) tabThe Application Dashboard (Basic) tab contains the following fields:v Application Fair Completion Rate Threshold (%) - Defines the default
completion percentage for application fair availability threshold.v Application Bad Completion Rate Threshold (%) - Defines the default
completion percentage for application bad availability threshold.v Application Fair Resource Usage Threshold (%) - Defines the threshold
percentage for fair usage level of an application resource.v Application Bad Resource Usage Threshold (%) - Defines the threshold
percentage for bad usage level of an application resource.
Chapter 3. ITCAM Agent for WebSphere Applications 59

v Application Resource Usage Monitoring Cutoff Threshold (%) - Defines thecutoff threshold percentage for application resources usage monitoring.
v Request Monitoring Control Level - Specifies the request monitoring controllevel for the server. The following entries can be entered to this field:– Application Request monitoring settings are defined for each application
independently.– Server Request monitoring settings are defined on the server level
The Request Monitoring Control Level option gives you more control over requestmonitoring settings. In certain sequences, you can benefit from locking the requestmonitoring control on the server level, because you can change data collectormonitoring level in one place.
In ITCAM For Application Diagnostics, the request data monitoring level (Level1or Level2) that displays on the Tivoli Enterprise Portal depends on the RequestMonitoring Control Level setting you choose.v If you select the Request Monitoring Control Level as Application (the default
setting), the monitoring level is set separately for every application. For a newlydiscovered application, the current monitoring level for the agent is applied.Therefore, to display Level2 data for an application in the Tivoli EnterprisePortal, you must set the monitoring level for the application using the“Set_Application_Monitoring: Set monitoring” on page 294 Take Actioncommand.
v If you select the Request Monitoring Control Level as Server, the level is set forthe server and affects all applications. If you set the Request Data MonitoringLevel at Level2 using the “Start_Request_Monitoring : Begin reporting requestdata” on page 296 Take Action command, the Request Data Monitoring Level forall the applications in this server is Level2. While you can still use theSet_Application_Monitoring Take Action command to set the monitoring levelfor an individual application, the level does not apply as a server-wide level isin operation. To apply the levels set for individual applications, change theRequest Monitoring Control Level setting to Application.
Collection Advanced tabThe Collection Advanced tab contains the following fields:v Request Data On Demand Maximum Sample Age (sec) - The maximum
allowed age of sample request data in seconds before collecting a new sample ofdata. If the monitoring method is set to On Demand, when a user request isreceived, and the current sample cache is older than the value specified, then theMonitoring Agent uploads a new sample before servicing the request. Twosuccessive on-demand requests received from users within the period specifiedby the maximum sample age return the same results without incurring the CPUand memory cost of a new data sample.
v Request Data Fixed Interval between Collections (sec) - The amount of time inseconds between uploads of sample request data from the data collectors to theMonitoring Agent when the monitoring method is set to Fixed Interval. When auser request is received, it is serviced from the latest uploaded sample.
v Request Data Sampling Rate (%) - The percentage of requests that are sampledfor request data monitoring.
v Resource Data On Demand Maximum Sample Age (sec) - The maximumallowed age of sample resource data in seconds before collecting a new sampleof data. If the monitoring method is set to On Demand, when a user request isreceived and the current sample cache is older than the value specified in thisfield, then the Monitoring Agent uploads a new sample before servicing the
60 ITCAM Agents for WebSphere Applications, J2EE, and HTTP Servers: User Guide

request. Two successive on-demand requests received from a user within theperiod specified by the maximum sample age return the same results withoutincurring the CPU and memory cost of a new data sample.
v Resource Data Fixed Interval between Collections (sec) - The amount of timein seconds between uploads of sample resource data from the data collectors tothe agent. When a Tivoli Enterprise Portal request is received, it is serviced fromthe latest uploaded sample.
v Garbage Collection Polling Interval (sec) - The interval in seconds between theMonitoring Agent scanning the verbose Garbage Collection output.
v Log Scan Polling Interval (sec) - The interval in seconds between the Agentscanning the application server standard output log for changes.
Application Dashboard (Auto Threshold) tabThe Application Dashboard (Auto Threshold) tab contains the fields:v Response Time Selection (%) - Defines the percentage from baseline to be used
for response time auto-thresholding.v Response Time Deviation (%) - Defines the deviation for baseline selection to
be used for response times auto-thresholding.v Fair Response Time Projection (%) - Defines the percentage to derive the fair
response time threshold from the baseline selection.v Bad Response Time Projection (%) - Defines the percentage to derive the bad
response time threshold from the baseline selection.
Workspace link to managing server visualization engineWith the appropriate configuration and permissions, you can access the managingserver visualization engine from specific workspaces in the WebSphere TivoliEnterprise Portal. Instead of opening another browser and clicking the relevantlink, you can access the managing server visualization engine from TivoliEnterprise Portal using a link called Diagnostic Server Activity Display. Some ofthe workspaces have additional links you can use to access the managing servervisualization engine. All these links begin with the word Diagnostic. When youlog in to the Welcome to the Application Monitor page, the information displayedis specific to the content in the Tivoli Enterprise Portal workspace you selected.You also can manually create your own links to the managing server visualizationengine using the Link Wizard, which is available on all workspaces.
Important: To use this functionality, you need ITCAM for Application DiagnosticsManaging Server.
You can access the managing server visualization engine from the followingworkspaces.v WebSphere Agentv Request Analysisv Garbage Collection Analysisv Datasourcesv JMS Summaryv Web Applicationsv EJB Containersv DB Connection Poolsv J2C Connection Poolsv Thread Pools
Chapter 3. ITCAM Agent for WebSphere Applications 61

Here is a list of the managing server visualization engine links available from theworkspaces:v Diagnostic Server Activity display. Use this link to diagnose application
problems, for example, slow transactions or high response times. This link isavailable from all workspaces except Request Analysis and Garbage CollectionAnalysis.
v Diagnostic In-Flight Request Search. Use this link to identify any hangingtransactions. This feature is only available from the WebSphere Agent andRequest Analysis workspaces.
v Diagnostic Recent Completed Requests. The Recent Requests tab displays dataregarding recently completed server requests. This feature is only available fromthe Request Analysis workspace.
v Diagnostic SMF Data. This feature is only available you are using a z/OS datacollector and in the Request Analysis workspace. The SMF Overview displayssummary information for all the resources on the selected application server.
v Diagnostic JVM Thread Display Use this link to diagnose application problems,for example, slow transactions by examining threads running in JVM. This linkis available from the Thread Pools workspace.
v Diagnostic Memory Leak Use this link to diagnose memory leak problems. Thislink is available from the Garbage Collection Analysis workspace.
For information about accessing workspaces, see “Accessing the managing servervisualization engine from Tivoli Enterprise Portal workspaces” on page 64.
Prerequisites for access
The following conditions must be met to gain access to the managing servervisualization engine through the Tivoli Enterprise Portal.v ITCAM for Application Diagnostics managing server and ITCAM Data Collector
for WebSphere must be installed in your environment.v Tivoli Enterprise Portal users must be members of the Diagnostic Users Group
within the Tivoli Enterprise Portal. For more information, see “Granting usersaccess to managing server visualization engine from Tivoli Enterprise Portal” onpage 63.
v During the installation of the managing server, kernel properties in themanaging server must be set up accordingly with the correct host name andport number. This action is completed by the user installing the managingserver.
You can also create your own links to the managing server visualization engineusing the Link Wizard.
For more information, see “Creating links to the managing server visualizationengine using the Link Wizard” on page 68
Kernel Settings to access the managing server visualizationengine through the Tivoli Enterprise Portal
If users access the managing server visualization engine through the TivoliEnterprise Portal, the kernel properties in the managing server must be set upaccordingly with the correct host name and port number.
62 ITCAM Agents for WebSphere Applications, J2EE, and HTTP Servers: User Guide

The following properties must be added to kl1.properties and kl2.properties(By default, the managing server installer replaces @{HOST_VE} and@{PORT_VE_HTTP} at managing server installation time) :v ve.host=@{HOST_VE}
v ve.port=@{PORT_VE_HTTP}
At kernel startup time, the kernel must read these two properties and set them aspart of properties in PROBE_CONFIG.PROPS. If a user changes the VE host nameor port number, then the kernel needs to be restarted. Use the following steps tostart and stop the kernel In $MS_HOME/bin:1. To start kernel, issue:./amctl.sh wd<kernel count> start
2. To stop kernel, issue: ./amctl.sh wd<kernel count> stop
where <kernel count> is 1 by default.
Granting users access to managing server visualization enginefrom Tivoli Enterprise PortalAs a user, you must be set up as a member of the DIAGNOSTIC USERS group inthe Tivoli Enterprise Portal, otherwise you cannot access the visualization enginefrom the Tivoli Enterprise Portal. The default administration user Sysadmin isautomatically a member of this group. Any user with administrator permissionscan add or remove additional users to the DIAGNOSTIC USERS group.
Before you begin
To complete this task you must be a user with administrator permissions to add orremove additional users to the DIAGNOSTIC USERS group. For moreinformation about access, see “Prerequisites for access” on page 62.
Procedure1. From the Tivoli Enterprise Portal main menu, click Edit > Administer Users.2. In the Administer Users window, click the Users Groups tab.3. Click the group name, in this case DIAGNOSTIC USERS.4. Click the Members tab to view existing members of this group and to assign
additional users.5. To add users, in the Available Members section, select the users that you want
to assign to the Group.6. Click the left arrow to move the selected users to the Assigned Members
section of the window.7. Click Apply and OK to implement the changes.8. To remove a user from the group, click the Assigned Members tab, and select
the users that you want to remove.9. Click the right arrow to move the selected users to the Available Members tab.
Then click Apply and OK.
What to do next
Users who are members of this group can access the managing server visualizationengine from the Tivoli Enterprise Portal. See “Accessing the managing servervisualization engine from Tivoli Enterprise Portal workspaces” on page 64.
Chapter 3. ITCAM Agent for WebSphere Applications 63

Adding the LDAP user to Tivoli Enterprise Portal user accounts:
About this task
To add the LDAP user to Tivoli Enterprise Portal user accounts, use TivoliEnterprise Portal user administration.1. In the Tivoli Enterprise Portal main menu, select Administer Users.2. Click Create New User to create a user profile from defaults, or Create
Another User to create a user profile as a copy of an existing one.3. In the Modify User window, enter the user name for the new user in the User
ID field.4. In the Distinguished Name field, enter the following string:
uid=username,cn=users,dc=ibm,dc=com
This string registers the LDAP user with Tivoli Enterprise Portal. If you areusing an existing LDAP configuration, use the applicable distinguished name.
Tip: For more information about Single sign-on, see Appendix N Setting Upsingle sign on for Tivoli Enterprise Portal Users in the ITCAM for ApplicationDiagnostics managing server Installation and Customization Guide.
Accessing the managing server visualization engine from TivoliEnterprise Portal workspacesUse the following links for information about how to access the managing servervisualization engine from the Tivoli Enterprise Portal workspaces.
To ensure that you have access to the managing server visualization agent, see“Prerequisites for access” on page 62 before you begin.v “Accessing the managing server visualization engine from the WebSphere Agent
workspace” on page 129v “Accessing the managing server visualization engine from the Request Analysis
workspace” on page 108v “Accessing the managing server visualization engine from the Garbage
Collection Analysis workspace” on page 91v “Accessing the managing server visualization engine from the Datasources
workspace” on page 81v “Accessing the managing server visualization engine from the JMS Summary
workspace” on page 96v “Accessing the managing server visualization engine from the Web Applications
workspace” on page 126v “Accessing the managing server visualization engine from the EJB Containers
workspace ” on page 88v “Accessing the managing server visualization engine from the DB Connection
Pools workspace” on page 84v “Accessing the managing server visualization engine from the J2C Connection
Pools workspace” on page 95v “Accessing the managing server visualization engine from the Thread Pools
workspace” on page 124
For additional information, see:v “Workspace link to managing server visualization engine” on page 61
64 ITCAM Agents for WebSphere Applications, J2EE, and HTTP Servers: User Guide

v “Access the managing server visualization engine from the Tivoli EnterprisePortal”
Access the managing server visualization engine from the TivoliEnterprise PortalYou can access the managing server visualization engine from links in the ITCAMAgent for WebSphere Applications workspaces.
When you access the managing server visualization engine in this way, themanaging server visualization engine displays in a browser view in a workspace.The Tivoli Enterprise Portal navigation tree is automatically hidden in theworkspace. To show or hide the Tivoli Enterprise Portal navigation tree, click thesmall black arrow.
The following table displays a list of Tivoli Enterprise Portal workspaces that havelinks to the managing server visualization engine.
Table 7. Tivoli Enterprise Portal workspaces that have links to managing server visualizationagent
Workspace: TableView Name
Number oflinks tomanagingservervisualizationagent Link Name
Link TargetPages managingservervisualizationagent
Pre-populatedinformation in thelink page tomanaging servervisualizationengine
WebSphere AgentSummary Status >Application Servers
WebSphere AgentSummary Status >Application Servers
WebSphere AgentConfiguration >Application Servers
2 v DiagnosticServerActivityDisplay
v DiagnosticIn-FlightRequestSearch
v ServerActivityDisplay –ActiveRequests
v In-FlightRequestSearch
The Group Serverdrop-down menuis pre-populatedbased on datacollectorinformation fromTivoli Enterpriseworkspace.
OS Stack >CurrentOS Stack Summary
3 v DiagnosticServerActivityDisplay
v DiagnosticIn-FlightRequestSearch
v <platformOS><platform>is one ofthefollowingoperatingsystems:Linux,UNIX,Windows orz/OS
v ServerActivityDisplay –ActiveRequests
v In-FlightRequestSearch
v Using thedynamicworkspacelink to thecorrespondingOS agentworkspace.For z/OS, thelink is toOMEGAMONXE for z/OS.
The Group Serverdrop-down menuis pre-populatedbased on datacollectorinformation fromTivoli Enterpriseworkspace.
Chapter 3. ITCAM Agent for WebSphere Applications 65

Table 7. Tivoli Enterprise Portal workspaces that have links to managing server visualizationagent (continued)
Workspace: TableView Name
Number oflinks tomanagingservervisualizationagent Link Name
Link TargetPages managingservervisualizationagent
Pre-populatedinformation in thelink page tomanaging servervisualizationengine
JVM Stack Trend>JVM Stack Trend
1 DiagnosticMemory Leak
Memory LeakAnalysis
The Group Serverdrop-down menuis pre-populatedbased on datacollectorinformation fromTivoli Enterpriseworkspace.
Request Analysis >Requests – CurrentInterval
3 v DiagnosticRecentCompletedRequests
v DiagnosticIn-FlightRequestSearch
v DiagnosticSMF Data(z/OS only)
v ServerActivityDisplay –RecentRequests
v In-FlightRequests
v SMF Data (forz/OS datacollectorsonly)
v The GroupServerdrop-downmenu ispre-populatedbased on datacollectorinformationfrom TivoliEnterpriseworkspace.
v Content inRequest Detailcolumn ofRequests tableview in TivoliEnterprisePortal ispre-populatedin the followingfields:
– RecentRequests:ClientRequest
– In-FlightRequestSearch:SearchRequest/Transactionfield
Garbage CollectionAnalysis >GarbageCollection Analysis
1 DiagnosticMemory Leak
Memory LeakAnalysis
The Group Serverdrop-down menuis pre-populatedbased on datacollectorinformation fromTivoli Enterpriseworkspace.
66 ITCAM Agents for WebSphere Applications, J2EE, and HTTP Servers: User Guide

Table 7. Tivoli Enterprise Portal workspaces that have links to managing server visualizationagent (continued)
Workspace: TableView Name
Number oflinks tomanagingservervisualizationagent Link Name
Link TargetPages managingservervisualizationagent
Pre-populatedinformation in thelink page tomanaging servervisualizationengine
Thread Pools>Thread Pools
1 DiagnosticJVM ThreadDisplay
JVM ThreadDisplay
The Group Serverdrop-down menuis pre-populatedbased on datacollectorinformation fromTivoli Enterpriseworkspace.
Datasources >Datasources –Current Interval
Web Applications>Web Applications
EJB Containers >EJBContainers
JMS Summary >JMSSummary – CurrentInterval
DB Connection Pools> DB ConnectionPools
J2C Connection Pools> J2C ConnectionPools
1 DiagnosticServerActivityDisplay
Server ActivityDisplay – ActiveRequests
The Group Serverdrop-down menuis pre-populatedbased on datacollectorinformation fromTivoli Enterpriseworkspace.
The Server Group feature that displays applies to the managing servervisualization engine. When you access any of these pages from the TivoliEnterprise Portal, the information in the Groups and Servers fields is automaticallypopulated based on the data collector associated with the link and workspace youselected in the Tivoli Enterprise Portal.
Groups are a set of application servers which have similar functionality. Allconfigured data collectors are automatically in the Unassigned Servers Group. Therelationship between Server Group and data collector is many to many. A datacollector can belong to one or more server groups. A server group can have one ormore data collectors. You can add data collectors to groups using the ServerManagement functionality in the managing server visualization engine. For moreinformation about adding data collectors to Server Groups, refer to the CompositeApplication Manager Help in the managing server visualization engine interface.
The Server Activity Display section has three tabs.v Active Requests: provides real-time request or transaction data for an
application server at the time the page displays.
Chapter 3. ITCAM Agent for WebSphere Applications 67

v Recent Requests: displays the last 100 or less completed request or transactiondata for an application server.
v Lock Contentions: displays requests that are hanging because they are waitingon a lock. The data shows data that is currently locked and the item that iswaiting to be locked.
The Active Requests tab and the Recent Requests tab have a toolbox icon .You can click this icon to access direct links to the following features:v JVM Displayv System Resourcesv Monitoring On Demand®
v data collector Propertiesv Trap and Alert Management
When you access the managing server visualization engine in this way, themanaging server visualization engine displays in a browser view in a workspace.The Tivoli Enterprise Portal navigation tree is automatically hidden in theworkspace. To show or hide the Tivoli Enterprise Portal navigation tree, click thesmall black arrow.
Creating links to the managing server visualization engine usingthe Link WizardThroughout the Tivoli Enterprise Portal, you can use the Link Wizard to manuallycreate links to the managing server visualization engine.
Creating links
You can access the Link Wizard feature from other views and workspaces in theTivoli Enterprise Portal.1. To access the Link Wizard, from any of the tables or views, right-click the link
icon and click Link Wizard.2. Follow the steps in the wizard to do one of the following actions:
v Create a link.v Modify an existing link.v Delete one or more links.
3. Type the name and description of the link.4. Choose one to the following options with the aid of the descriptions in the
Link Wizard.v Dynamicv Absolutev Relative
5. Choose the option that you want to use. Follow the instructions in the helpwithin the application until you get to the Workspace Link Wizard Parameterspage.
Adding parameters to the Link Wizard
When you get to the Workspace Link Wizard Parameters page in the Link Wizardyou must manually add these two symbols VEHOSTPORT and VEPATH and addinformation to these parameters. There are two predefined workspaces which havean embedded browser as its only view.
68 ITCAM Agents for WebSphere Applications, J2EE, and HTTP Servers: User Guide

v Diagnostic Link for Agent. Choose this workspace if the link is from the agentlevel workspaces.
v Diagnostic Link. Choose this workspace if the link is from the server levelworkspace.
To add Symbols to the Link Wizard, complete the following steps:1. Click Symbol and type VEHOSTPORT.2. Click OK to add the Symbol.3. To add an expression, select VEHOSTPORT, and click Modify Expression.4. Basic Setup: In the text field, type the expression that you want to add. The
value for the VEHOSTPORT is <your ve host>:<your ve port>. For example,if in your environment, the managing server visualization engine is installed onhost1, with port 9080, then the VEHOSTPORT value is: “host1:9080”.
Important:
v Double quotation marks are required in the expression.v If your managing server visualization engine host or port information
changes, then you must update the link you defined and correct theVEHOSTPORT information manually.
Advanced Setup: In the text field, type the expression that you want to add.The value for the VEHOSTPORT value is CALL(candle.kwj.ve.ITCAMLinkHelper,getVehostportForWASServer, null, null,$kfw.TableRow:ATTRIBUTE.<table_name>.ORIGINNODE$). To get the expression:$kfw.TableRow:ATTRIBUTE.<table_name>.ORIGINNODE$, in the ExpressionEditor, click Symbol.
5. Click Origin Node and click OK to get$kfw.TableRow:ATTRIBUTE.<table_name>.ORIGINNODE$.
When using the Advanced set up option, if your managing server visualizationagent host or port information changes, ITCAM for Application Diagnosticscustom code updates the changes automatically, you do not have to modify thelinks you defined manually to correct the information.
6. To add an expression, Basic Setup: the VEPATH value can be set as“am/ve/sad/threadList?mappingTEPUrl=true”
Important:
v Double quotation marks are required in the expression.v When you use the Basic Setup option, you must select the server group and
the server in the managing server visualization engine yourself when you login to managing server visualization engine.
To add an expression, Advanced Setup: Set the VEPATH value in theExpression Editor as:"am/ve/sad/threadList?mappingTEPUrl=true&server=" +CALL(candle.kwj.ve.ITCAMLinkHelper, getServerIdForWASServer, null, null,$kfw.TableRow:ATTRIBUTE.<table_name>.ORIGINNODE$)
Where the correct expression of$kfw.TableRow:ATTRIBUTE.<table_name>.ORIGINNODE$ can be found by usingSymbols view under Expression Editor:$kfw.TableRow:ATTRIBUTE.<table_name>.ORIGINNODE$ (Symbol: Origin Node).
7. Review the details in the Workspace Link Wizard - Summary. Click Finish.8. If you use the Advanced Setup options in Step 4 and Step 6, modify the
linkIsEnabled parameter in the Workspace Link Wizard Parameters view withexpression: CALL(candle.kwj.ve.ITCAMLinkHelper, isEnabledForWASServer, null,
Chapter 3. ITCAM Agent for WebSphere Applications 69

null, $kfw.TableRow:ATTRIBUTE.<table_name>.ORIGINNODE$) &&$kfw.TableRow:ATTRIBUTE.<table_name>.ASID$ != -3. In the Expression Editor,use the Symbols view to find expressions of$kfw.TableRow:ATTRIBUTE.<table_name>.ORIGINNODE$ (Symbol: OriginNode)and $kfw.TableRow:ATTRIBUTE.<table_name>.ASID$ (Symbol: ASID).
Manually adding your own links to the Link Wizard
The minimum settings are VEHOSTPORT and VEPATH. If you need to link to adifferent page, you must change this value to corresponding URL path. Here is alist of frequently used managing server visualization engine pages and URL paths:v Enterprise Overview: am/homev Server Overview: am/ve/serverOverviewv Server Statistics Overview : am/avm/mainv Server Activity Display: am/ve/sad/threadListv Memory Leak: am/ve/memory/leakReportv JVM Thread Display: am/ve/jtd/threadGroupListv Monitoring On Demand: am/ve/mod/consolev Trap and Alert Management: am/trapv System Resources:am/ve/jmxbrowser
Important: If you change the host port number at any point, you must modifythese two properties again and the kernel properties on the Managing Serverinstallation must be restarted to identify the changes.
Link anchor
You can use the Link anchor option to access the Link anchor properties window.You can use the Link anchor properties window to display visual indicators ontables where customized links have been defined, and to establish a default linkthat opens when the user clicks the indicator.1. From any of the tables, right-click the choose link icon and click Link
Anchor to display the Link anchor properties window.2. Depending on the area of the table item you select, the window displays the
following information:v Default no linkv Show Link indicatorv Link indicator always enabled.
3. For more information about the uses of these items, refer to the help within theLink anchor properties window.
“Workspace link to managing server visualization engine” on page 61
Workspace link to ITCAM for SOAYou can navigate from ITCAM Agent for WebSphere Applicatins workspaces toITCAM for SOA.
If ITCAM for SOA is installed and configured for the same application server, youcan navigate from the “Application Server Summary and Business ProcessManager Summary workspaces” on page 50 and from the “Application Health
70 ITCAM Agents for WebSphere Applications, J2EE, and HTTP Servers: User Guide

workspace” on page 73 to workspaces provided by ITCAM for SOA. ITCAM forSOA is available with ITCAM for Applications. For more information, see theITCAM for SOA User Guide.
A service group is a set of related service operations that collectively mightrepresent or encompass a business function or application in your enterprise. Thiscan consist of a service flow, a subset of a flow, or any collection of operationaggregates that represent something meaningful to you in your monitoredenvironment. A process group is a Business Process Management (BPM)-specificgroup that aggregates elements that are part of a BPM solution, such asapplications, modules, components, or operations. A process group allows themonitoring of interactions between the components of the solution. Thismonitoring provides BPM-specific context information.
Alarm Manager workspaceThis workspace displays aggregated information about the alarms for each workmanager.
This workspace displays data provided by the Alarm Manager attributes.
Important:
v This workspace reports blanks for resource data on the first invocation if PMIdata collection is configured for on-demand sampling (that is, if your site setconfiguration value Resource Data Collection Method to On Demand) or if youhave not yet run applications that generate PMI resource data. To reportresource data in this workspace after installing and configuring the datacollector, use the WebSphere administrative console to set the appropriate PMIinstrumentation level.
v Because of high processor usage, the Tivoli Enterprise Monitoring Agentprovides on-demand sampling by default. To activate PMI monitoring, you mustfirst select this workspace and then select it again later. Each time you select theworkspace, it displays the data collected during the interval between selections.
The predefined workspace contains:v Highest Alarm Rate bar chart, which displays the five highest number of alarms
fired per secondv Work Manager Alarms report, which displays detailed information about the
alarms for each work manager
Accessing the Alarm Manager workspace
To access this workspace from the Thread Pools workspace, use one of thefollowing procedures:v Within the Navigator, right-click the Thread Pools entry; then from the menu
select Workspace > Alarm Manager.v From the primary Tivoli Enterprise Portal menu, expand the View menu, and
select Workspace > Alarm Manager.
For additional information, see:v Organization of the predefined workspacesv Attribute groups used by the predefined workspaces
Chapter 3. ITCAM Agent for WebSphere Applications 71

Allocation Failures workspaceThis workspace summarizes all the heap-allocation failures that occurred withinthe Java Virtual Machine (JVM) over the current interval and that caused the JVMto initiate garbage collection.
This workspace displays data provided by the Allocation Failure attributes.
Note to Solaris and HP-UX users: Allocation-failure information is not recorded onthese platforms; hence this workspace is always empty.
The predefined workspace contains the following items:v Allocation Failure Elapsed Times bar chart, which displays the number of
allocation failures during the current intervalv Heap Usage bar chart, which displays the heap usage for this JVM. The bar's fail
over gives the allocation-failure ID number followed by a range of recordingtimes. This allocation-failure number displays in the Allocation Failures reportand associates each bar with that particular row within the report
v Allocation Failures report, which displays information about the heap-allocationfailure that caused the Java Virtual Machine hosting the application server tostart its garbage-collection routine. The Allocation Failures report includes theASID field.
Accessing the Allocation Failures workspace
To access this workspace from the Garbage Collector Activity workspace, completethe following steps:v From the Garbage Collection Analysis report, right-click the link icon and from
the menu, click Allocation Failures. Note that in the Allocation Failureworkspace, the ASID is displayed in the Allocation Failures report.
For more information, see:v Organization of the predefined workspacesv Attribute groups used by the predefined workspaces
Selected Application - Application Trend at L1 workspaceThis workspace displays access trends for individual applications. It provides trendinformation for request and response times. It also provides trend information forapplication errors. This workspace provides a broad overview of the health of anapplication and draws data from multiple attribute groups.
This workspace displays data provided by the Request Analysis and Request Timesand Rates attribute groups.
The predefined workspace contains:v Selected Application Summary report displays application name, average request
response time, average request completion rate, error rate, and ASID. For TivoliEnterprise Monitoring Agent running on z/OS, region ID can be found in theASID column.
v Response Time Trend chart displays summary trend times for the overallresponse time for the selected application.
v Error Rate Trend chart displays the error rate for the application.
72 ITCAM Agents for WebSphere Applications, J2EE, and HTTP Servers: User Guide

v Request Rate Trend chart displays the number of requests completed per secondfor the application.
Accessing the Selected Application - Configuration workspace
Access this workspace using one of the following methods:v Double click any application in the application server Summary workspace.v Right-click on application icon in the application server Summary workspace
and select Link To, then select Application Trend at L1.
For additional information, see:v application server Summary Workspacev Organization of the predefined workspacesv Attribute groups used by the predefined workspaces
Selected Application - Application Trend at L2/L3 workspaceThis workspace displays access trends for individual applications. It provides trendinformation for request and response times. It also provides trend information forapplication errors. This workspace provides a broad overview of the health of anapplication and draws data from multiple attribute groups.
This workspace displays data provided by the Request Analysis and Request Timesand Rates attribute groups.
The predefined workspace contains:v Selected Application Summary report displays application name, average request
response time, average request completion rate, error rate, and ASID. For TivoliEnterprise Monitoring Agent running on z/OS, region ID can be found in theASID column.
v Response Time Trend chart displays trend times for the following differentelements in milliseconds: JNDI, JMS, Application, JCA, SCA, Servlet, EJB, andweb service requests.
v Error Rate Trend chart displays the error rate for the application.v Request Rate Trend chart displays the number of requests completed per second
for the application.
Accessing the Selected Application - Configuration workspace
Access this workspace using one of the following methods:v Double click any application in the application server Summary workspace.v Right-click on application icon in the application server Summary workspace
and select Link To, then select Application Trend at L2/L3.
For additional information, see:v application server Summary Workspacev Organization of the predefined workspacesv Attribute groups used by the predefined workspaces
Application Health workspaceThe workspace displays the information about the real-time health status ofapplications monitored by the Tivoli Enterprise Monitoring Agent.
Chapter 3. ITCAM Agent for WebSphere Applications 73

The health status information is collected from the following sources.v Request Metrics - performance data that measures request execution time
collected from the ITCAM instrumentation points in the application code.v Resource Metrics - pool usage and container performance statistics collected
from the corresponding PMI modules or MBeans.v GC Metrics - metrics on garbage collection frequency and performance collected
from parsing of the GC verbose log file when it is enabled for the applicationserver JVM.
v OS metrics - metrics collected about the JVM process and the whole systemexecution, such as CPU used percentage, paging rate, and so on.
Additionally, the monitoring agent uses thresholds, called Application HealthIndicators, to determine the quality of the application service. For request responsetimes, thresholds are assigned automatically during baselining. You can alsomanually customize the thresholds. There are three monitored application tiersevaluated for health status.v Client Tier provides performance data and status of application execution in
servlets/JSPs or portal containers as well as corresponding thread poolsservicing these containers.
v Application Tier provides application execution metrics of EJB containers andcustom requests.
v Backend Tier provides application execution in JDBC, JCA, JMS, JNDI API calls.
This workspace displays data provided by the Application Health Status attributes.
By default, the predefined workspace has the following views:v Situation Event console view, which shows the event console with activity
associated with the Application Health Summary Navigator item and any otherworkspaces in the group, as well as linked workspaces. The Navigator displaysan event icon overlaid on the Application Health Summary node when asituation becomes true. The report is useful when multiple alerts are raised asyou can see them all in a single filtered view.
v Application Health Summary report, which shows the report of the applicationname, status, and health indicator for client, application, and backend tiershealth status.
Important: Due to the runtime MBeans configuration, the Tivoli EnterpriseMonitoring Agent (Tivoli Enterprise Monitoring Agent) can find only compositionunits of business-level applications that associate with either web or EJB modules.
If any applications are running on the Business Process Manager server andITCAM for SOA is installed on the server, an additional link is available. In theApplication Health Summary view, right-click any application and select SelectedApplication - Group Summary to view the Group Summary workspace, providedby ITCAM for SOA. In this workspace, you can see the status of all process groupsthat include any components or operations that are a part of the selectedapplication.
Accessing the Application Health Summary workspace
To access this workspace, complete the following steps:1. Within the Navigator, expand Windows Systems, Linux Systems, z/OS Systems
or UNIX Systems, as appropriate for the node you are monitoring.
74 ITCAM Agents for WebSphere Applications, J2EE, and HTTP Servers: User Guide

2. Within the node list, expand the entry that corresponds to the node that youwant to select.
3. Within that node list of monitored applications, expand the list of WebSphereagents.
4. Within the list of available agents, expand the WebSphere Application serverentry of your choice.
5. Within that server list of available WebSphere application server workspaces,click the Application Health entry.
For additional information, see:v Organization of the predefined workspacesv Attribute groups used by the predefined workspaces
Application Registry workspaceThis workspace displays the information about the server configuration for theapplication.
This workspace displays data provided by the Application MonitoringConfiguration attributes.
The predefined workspace contains:v Situation Event Console report, which shows the event activity for situations
associated with the current Navigator item. The Navigator alerts you when asituation becomes true by overlaying the Navigator item with an event indicator.This report is useful when multiple alerts are raised and you might not knownewly arrived alerts just by looking at the indicator.
v Application Configuration report, which shows the configurations that arediscovered, stored and managed for WebSphere applications running within thatapplication server.
Accessing the Application Registry workspace
To access this workspace from the Application Health Summary workspace, useone of the following procedures:v Within the Navigator, right-click the Application Health entry; then, from the
menu, click Workspace > Application Registry.v From the primary Tivoli Enterprise Portal menu, click View > Workspace >
Application Registry.
For additional information, see:v Organization of the predefined workspacesv Attribute groups used by the predefined workspaces
Business Process Manager workspaceThe Business Process Manager workspace displays overall statistics for a BusinessProcess Manager server being monitored by the Tivoli Enterprise MonitoringAgent.
The predefined workspace contains the following items:v Heap Usage - History bar chart, which displays free memory size and used
memory size (in kilo bytes) within the WebSphere application server heap overtime. The chart flyovers display the exact values.
Chapter 3. ITCAM Agent for WebSphere Applications 75

This view displays data provided by the Garbage Collection Analysis attributes.v Response Time - History graph, which shows the server response time to
requests over timeThis view displays data provided by the Request Times and Rates attributes.
v Request Rate - History graph, which shows the rate at which requests have beenreceived by this server over timeThis view displays data provided by the Request Times and Rates attributes.
v Percent CPU Used - History graph, which shows the percentage of the CPU thatthis server consumed over timeThis view displays data provided by the application server attributes.
v Application server summary report, which displays overall information aboutthis WebSphere application server, including JVM statistics and CPU usagestatisticsThis view displays data provided by the application server attributes.
Accessing the Business Process Manager workspace
To access this workspace, complete the following steps:1. Within the Navigator, expand Windows Systems, Linux Systems, z/OS
Systems, or UNIX Systems, as appropriate for the node you are monitoring.2. Within the node list, expand the entry that corresponds to the node that you
want to select.3. Within that node list of monitored applications, expand the list of WebSphere
agents.4. Within the list of available agents, right-click a Business Process Manager
entry, and select Workspaces > Business Process Manager.
For additional information, see:v Organization of the predefined workspacesv Attribute groups used by the predefined workspaces
Cache Analysis workspaceThis workspace reports information about the dynamic cache.
WebSphere application server consolidates several caching activities, includingservlets, web services, and WebSphere commands, into one service called thedynamic cache. These caching activities work together to improve applicationperformance. The activities share many configuration parameters, which are set ina dynamic cache service in an application server. The dynamic cache works within aJava Virtual Machine (JVM) within an application server, intercepting calls tocacheable objects, for example, through a servlet service method or an executemethod on a command. The dynamic cache either stores the object output to orserves the object content from the dynamic cache.
This workspace displays data provided by both the Dynamic Cache attributes andthe Dynamic Cache Templates attributes.
Important:
v This workspace reports blanks for resource data on the first invocation if PMIdata collection is configured for on-demand sampling (that is, if your site setconfiguration value Resource Data Collection Method to On Demand) or if youhave not yet run applications that generate PMI resource data. To report
76 ITCAM Agents for WebSphere Applications, J2EE, and HTTP Servers: User Guide

resource data in this workspace after installing and configuring the datacollector, use the WebSphere administrative console to set the appropriate PMIinstrumentation level.
v Because of high overhead, the Tivoli Enterprise Monitoring Agent provideson-demand sampling by default. To activate PMI monitoring, you must firstselect this workspace and then select it again later. Each time you select theworkspace, it displays the data collected during the interval between selections.
The predefined workspace contains the following items:v In-memory Cache Sizes - History graph, which shows the sizes of in-memory
cache entries for the specified intervalv Highest Miss Rates bar chart, which shows the most frequent cache entry misses
(per second). The Y-axis headings correspond to the row number of the DynamicCache Templates report
v Dynamic Cache report, which displays information about the dynamic cache,including cache sizes and timeout rates
v Dynamic Cache Templates report, which displays information about the cachetemplate data. A cache template is an object type defined by a cache policyspecified in WebSphere application server file cachespec.xml. A cache policyspecifies the caching rules and indicates what is cached, the invalidation andtimeout conditions, and other data
Accessing the Cache Analysis workspace
To access this workspace, complete the following steps:1. Within the Navigator, expand Windows Systems, Linux Systems, z/OS
Systems, or UNIX Systems, as appropriate for the node you are monitoring.2. Within the node list, expand the entry that corresponds to the node that you
want to select.3. Within that node list of monitored applications, expand the list of WebSphere
agents.4. Within the list of available agents, expand the WebSphere application server of
your choice.5. Within that server list of available WebSphere application server workspaces,
click the Cache Analysis entry.
For additional information, see:v Organization of the predefined workspacesv Attribute groups used by the predefined workspaces
Client Communications workspaceThis workspace provides overall Service Integration Bus communicationperformance data and counters for all clients connected to this application server.WebSphere application server 5.1 based products do not support this workspace.
This workspace displays data provided by the Client Communications attributes.
Important:
v This workspace reports blanks for resource data on the first invocation if PMIdata collection is configured for on-demand sampling (that is, if your site setconfiguration value Resource Data Collection Method to On Demand) or if youhave not yet run applications that generate PMI resource data. To report
Chapter 3. ITCAM Agent for WebSphere Applications 77

resource data in this workspace after installing and configuring the datacollector, use the WebSphere administrative console to set the appropriate PMIinstrumentation level.
v Because of high processor usage, the Tivoli Enterprise Monitoring Agentprovides on-demand sampling by default. To activate PMI monitoring, you mustfirst select this workspace and then select it again later. Each time you select theworkspace, it displays the data collected during the interval between selections.
The predefined workspace contains the following items:v Connection Count - History graph, which shows the number of API sessions
used by clients that were network connected to this application serverv Error Count - History graph, which shows the communication errors that
occurred and that resulted in the disconnection of a network connection to aclient
v Communication Statistics report, which displays information about clientcommunications, including API connections, errors, reads, writes, sent priority,received priority, MessageSent priority, and MessageReceived priority
Accessing the Client Communications workspace
To access this workspace from the Platform Messaging workspace, use one of thefollowing procedures:v Within the Navigator, right-click the Platform Messaging entry; then from the
menu, click Workspace > Client Communications.v From the primary Tivoli Enterprise Portal menu, click View > Workspace >
Client Communications.
For additional information, see:v Organization of the predefined workspacesv Attribute groups used by the predefined workspaces
Container Object Pools workspaceThis workspace displays aggregate information about the object pools associatedwith Enterprise Java Beans (EJBs). It provides a view of pool performance for allEnterprise Java Beans deployed to each container.
This workspace displays data provided by the Container Object Pools attributes.
Important:
v This workspace reports blanks for resource data on the first invocation if PMIdata collection is configured for on-demand sampling (that is, if your site setconfiguration value Resource Data Collection Method to On Demand) or if youhave not yet run applications that generate PMI resource data. To reportresource data in this workspace after installing and configuring the datacollector, use the WebSphere administrative console to set the appropriate PMIinstrumentation level.
v Because of high processor usage, the Tivoli Enterprise Monitoring Agentprovides on-demand sampling by default. To activate PMI monitoring, you mustfirst select this workspace and then select it again later. Each time you select theworkspace, it displays the data collected during the interval between selections.
The predefined workspace contains the following items:
78 ITCAM Agents for WebSphere Applications, J2EE, and HTTP Servers: User Guide

v Object Pool Rates - History graphs, which show the retrieval, return, discard,and drain rates for the EJBs in each EJB container
v Container Object Pools report, which displays:– Aggregated information for each defined EJB container that aggregates bean
object pool performance for all Enterprise beans deployed to that container– Aggregated information for the application server that aggregates bean object
pool performance data for all Enterprise beans deployed to the applicationserver
Accessing the Container Object Pools workspace
To access this workspace from the EJB Containers workspace, use one of thefollowing procedures:v From the primary Tivoli Enterprise Portal menu, click View > Workspace >
Container Object Pools.v Within the Navigator, right-click the EJB Containers entry; then, from the menu,
click Workspace > Container Object Pools.
For additional information, see:v Organization of the predefined workspacesv Attribute groups used by the predefined workspaces
Container Transactions workspaceThis workspace displays data about the activities and transactions running in eachapplication server.
This workspace displays data provided by the Container Transactions attributes.
Important:
v This workspace reports blanks for resource data on the first invocation if PMIdata collection is configured for on-demand sampling (that is, if your site setconfiguration value Resource Data Collection Method to On Demand) or if youhave not yet run applications that generate PMI resource data. To reportresource data in this workspace after installing and configuring the datacollector, use the WebSphere administrative console to set the appropriate PMIinstrumentation level.
v Because of high processor usage, the Tivoli Enterprise Monitoring Agentprovides on-demand sampling by default. To activate PMI monitoring, you mustfirst select this workspace and then select it again later. Each time you select theworkspace, it displays the data collected during the interval between selections.
The predefined workspace contains the following items:v Transaction Rates - History graph, which shows the per-second begin, commit,
and rollback rates over time for local and global transactionsv Transaction Durations - History graph, which shows the amount of time it takes
to complete local and global transactionsv Container Transactions report, which displays performance information for
global and local transactions that run in each defined EJB container and anaggregated value for all transactions that run in the application server
Chapter 3. ITCAM Agent for WebSphere Applications 79

Accessing the Container Transactions workspace
To access this workspace from the EJB Containers workspace, use one of thefollowing procedures:v From the primary Tivoli Enterprise Portal menu, click View > Workspace >
Container Transactions.v Within the Navigator, right-click the EJB Containers entry; then, from the menu,
click Workspace > Container Transactions.
For additional information, see:v Organization of the predefined workspacesv Attribute groups used by the predefined workspaces
Data sources workspaceThe data sources workspace displays statistical data for the data sources that yourapplications reference when accessing databases.
This workspace displays data provided by the Datasources attributes.
The predefined workspace contains the following items:v Worst Datasource Query Times bar chart, which shows the longest times (in
milliseconds) the application spent waiting to retrieve data from the databaseduring the specified interval
v Worst Datasource Update Times bar chart, which shows the longest times (inmilliseconds) the application spent updating data within the database during thespecified interval
v Datasources - Current Interval report, which displays database usageinformation. For example, this report shows traffic information such as the timethe application spent trying to connect to the database, and the total and averageprocessing times for database queries and updates.
Accessing the Data sources workspace
To access this workspace, complete the following steps:1. Within the Navigator, expand Windows Systems, Linux Systems, z/OS
Systems, or UNIX Systems, as appropriate for the node you are monitoring.2. Within the node list, expand the entry that corresponds to the node that you
want to select.3. Within that node list of monitored applications, expand the list of WebSphere
agents.4. Within the list of available agents, expand the WebSphere application server of
your choice.5. Within that server list of available WebSphere application server workspaces,
click the Datasources entry.
Selected Data source - History workspace
The Selected Datasource - History workspace displays the historical informationthat corresponds to the information in the Datasource workspace for a selecteddata source. Historical information is collected over a specific time span. See theonline help for Tivoli Enterprise Portal for a detailed explanation of historicalreporting.
80 ITCAM Agents for WebSphere Applications, J2EE, and HTTP Servers: User Guide

Accessing the Selected Data source - History workspace
To access this workspace from the Datasource workspace, use one of the followingprocedures:v From the Datasources - Current Interval report, right-click the link icon and from
the menu, click Selected Datasource - History.v From Worst Datasource Query Times bar chart or the Worst Datasource Update
Times bar chart, right-click any bar; then, from the menu, click Link To >Selected Datasource - History.
Selected Data source - Datasource Trend workspace
The Datasources Trend workspace displays information about datasourceconnections. This workspace displays data provided by the Datasources attributes.
This predefined workspace contains the following items:v Current Datasources report displays datasource name, total wait time,
connection rate, connection average wait time and connection max wait time.For Tivoli Enterprise Monitoring Agent running on z/OS, region ID can befound in the ASID column.
v Total Wait Time chart displays the total time that applications had to wait for aconnection to the data source.
v Connection Rate Trend chart displays the number of connection requests createdfor the data source per second.
v Connection Average and Max Time Trend chart display the average time inmilliseconds and the worst-case time in milliseconds that applications had towait for a connection.
Accessing the Selected Data source - Datasource Trendworkspace
Right-click the Datasources workspace, select Workspace and then DatasourceTrend workspace
For additional information, see:v Organization of the predefined workspacesv Attribute groups used by the predefined workspaces
Accessing the managing server visualization engine from theDatasources workspace
Important: To use this functionality, you need ITCAM for Application DiagnosticsManaging Server.
In the Tivoli Enterprise Portal, access the Datasources workspace. You can use theDiagnostic Server Activity Display link to access the managing servervisualization engine. For information about access requirements, see “Prerequisitesfor access” on page 62.1. In the Datasources - Current Interval window, right-click the choose link icon
then click Diagnostic Server Activity Display.2. If this is your first time to access the Managing server visualization agent
during a session, you see a Welcome to the Application Monitor page.
Chapter 3. ITCAM Agent for WebSphere Applications 81

3. Depending on the user setup configuration in your environment you mighthave to type your managing server visualization engine User Name andPassword. If you do, you need only to log in using your User Name andPassword once per session. Click OK to display the Server Activity Displaypage in the managing server Visualization engine. You can use this page todiagnose application problems, for example, slow transactions or high responsetimes.
4. In a z/OS environment, right-click the link icon on a row where the ASIDcolumn displays Summary.a. Click Selected Datasource- Servant Regions.b. In the Selected Datasource - Servant Regions table, right-click the link icon
on a row.c. Click Diagnostic Server Activity Display.
5. For more information about the options available in a z/OS environment, see“Region workspaces in a z/OS environment” on page 136 and “Accessing aRegion workspace” on page 138.
6. The results in this page relate directly to the context from where you launchedthe link in the Tivoli Enterprise Portal. For more information about using theServer Activity Display page, and additional features refer to the CompositeApplication Manager help within the managing server visualization agentInterface.
7. To return to the previous workspace in the Tivoli Enterprise Portal interface atany time choose from the following options:v From the Tivoli Enterprise Portal desktop client, including WebStart, click the
back arrow on the Portal toolbar.v From the Tivoli Enterprise Portal browser client, click the browser back
arrow.
For additional information, see:v “Workspace link to managing server visualization engine” on page 61.v “Access the managing server visualization engine from the Tivoli Enterprise
Portal” on page 65
DB Connection Pools workspaceThis workspace displays information about the database connection poolsassociated with each application server.
You can use this workspace to monitor Java Database Connectivity (JDBC)performance for WebSphere application server applications. This workspacedisplays data provided by the DB Connection Pools attributes.
Important:
v This workspace reports blanks for resource data on the first invocation if PMIdata collection is configured for on-demand sampling (that is, if your site setconfiguration value Resource Data Collection Method to On Demand) or if youhave not yet run applications that generate PMI resource data. To reportresource data in this workspace after installing and configuring the datacollector, use the WebSphere administrative console to set the appropriate PMIinstrumentation level.
v Because of the high processor usage, the Tivoli Enterprise Monitoring Agentprovides on-demand sampling by default. To activate PMI monitoring, you must
82 ITCAM Agents for WebSphere Applications, J2EE, and HTTP Servers: User Guide

first select this workspace and then select it again later. Each time you select theworkspace, it displays the data collected during the interval between selections.
The predefined workspace contains the following items:v Highest Average Pool Sizes bar chart, which shows the largest average size (that
is, number of connections) for each database connection poolv Worst Wait Times bar chart, which shows the worst wait times (in milliseconds)
for each database connection poolv Highest Allocation Rates bar chart, which shows the rate at which database
connections are being made for each connection poolv DB Connection Pools report, which displays information about the database
connection pool for each defined data source. The report also displays anaggregated value that aggregates over all data sources. For example, this reportdisplays the number of threads waiting for a connection and the number ofconnections created and released
Accessing the DB Connection Pools workspace
To access this workspace, complete the following steps:1. In the Navigator, expand Windows Systems, Linux Systems, z/OS Systems, or
UNIX Systems, as appropriate for the node you are monitoring.2. Within the node list, expand the entry that corresponds to the node that you
want to select.3. Within that node list of monitored applications, expand the list of WebSphere
agents.4. Within the list of available agents, expand the WebSphere application server
entry of your choice.5. Within that server list of available WebSphere application server workspaces,
click the DB Connection Pools entry.
Selected DB Connection Pool - History workspace
The Selected DB Connection Pool - History workspace displays historicalinformation that corresponds to the information in the DB Connection Poolsworkspace for a selected connection pool. Historical information is collected over aspecific time span. See the online help for Tivoli Enterprise Portal for a detailedexplanation of historical reporting.
Accessing the Selected DB Connection Pool - History workspace
To access this workspace from the DB Connection Pools workspace, use one of thefollowing procedures:v From the DB Connection Pools report, right-click the link icon and from the
menu, click Selected DB Connection Pool - History.v From the Highest Average Pool Sizes bar chart, the Worst Wait Times bar chart,
or the Highest Allocation Rates bar chart, right-click any bar; then, from themenu, click Link To > Selected DB Connection Pool - History.
For additional information, see:v Organization of the predefined workspacesv Attribute groups used by the predefined workspaces
Chapter 3. ITCAM Agent for WebSphere Applications 83

Accessing the managing server visualization engine from the DBConnection Pools workspace
Important: To use this functionality, you need ITCAM for Application DiagnosticsManaging Server.
In the Tivoli Enterprise Portal access the DB Connection Pools workspace. You canuse the Diagnostic Server Activity Display link to access the managing servervisualization engine. For information about access requirements, see “Prerequisitesfor access” on page 62.
1. In the DB Connection Pools window, right-click the choose link iconthen click Diagnostic Server Activity Display.
2. If this is your first time accessing the managing server visualization agentduring a session, you see a Welcome to the Application Monitor page.
3. Depending on the user setup configuration in your environment you mighthave to type your managing server visualization engine User Name andPassword. If you do, you need only log in once per session using your UserName and Password.
4. Click OK to display the Server Activity Display page in the managing serverVisualization engine. You can use links to diagnose application problems, forexample, slow transactions or high response times.
5. The results relate directly to the context from where you launched the link inthe Tivoli Enterprise Portal. For more information about using the ServerActivity Display page and additional features, refer to the CompositeApplication Manager help within the managing server visualization agentInterface.
6. To return to the previous workspace in the Tivoli Enterprise Portal interface atany time choose from the following options:v From the Tivoli Enterprise Portal desktop client, including WebStart, click the
back arrow on the Portal toolbar.v From the Tivoli Enterprise Portal browser client, click the browser back
arrow.
For additional information, see:v “Workspace link to managing server visualization engine” on page 61v “Access the managing server visualization engine from the Tivoli Enterprise
Portal” on page 65
DCS Stacks workspaceThis workspace displays aggregated information about each DCS stack within theentire WebSphere application server domain, including multiple nodes and servers.
This workspace displays data provided by the DCS Stack attributes.
Important:
v This workspace reports blanks for resource data on the first invocation if PMIdata collection is configured for on-demand sampling (that is, if your site setconfiguration value Resource Data Collection Method to On Demand) or if youhave not yet run applications that generate PMI resource data. To reportresource data in this workspace after installing and configuring the datacollector, use the WebSphere administrative console to set the appropriate PMIinstrumentation level.
84 ITCAM Agents for WebSphere Applications, J2EE, and HTTP Servers: User Guide

v Because of high processor usage, the Tivoli Enterprise Monitoring Agentprovides on-demand sampling by default. To activate PMI monitoring, you mustfirst select this workspace and then select it again later. Each time you select theworkspace, it displays the data collected during the interval between selections.
The predefined workspace contains the following items:v Highest Message Buffer Reallocations bar chart, which displays the highest
number of message buffer reallocations that occurred as a result of inadequatebuffer size
v Most Sent Messages bar chart, which shows most frequent number of messagebuffer reallocations that occurred as a result of inadequate buffer size
v High Severity Congestion Events bar chart, which shows the number of timesthat a high severity congestion event for outgoing messages was raised
v DCS Statistics report, which displays information for the DCS stack data,including incoming and outgoing message size, sent messages, and high severitycongestion events
Accessing the DCS Stacks workspace
To access this workspace, complete the following steps:1. Within the Navigator, expand Windows Systems, Linux Systems, z/OS
Systems, or UNIX Systems, as appropriate for the node you are monitoring.2. Within the node list, expand the entry that corresponds to the node that you
want to select.3. Within that node list of monitored applications, expand the list of WebSphere
agents.4. Within the list of available agents, expand the WebSphere application server of
your choice.5. Within that server list of available WebSphere application server workspaces,
click the DCS Stacks entry.
For additional information, see:v Organization of the predefined workspacesv Attribute groups used by the predefined workspaces
Destinations workspaceIn this workspace, you can view performance data and counters for thedestinations of a selected messaging engine.
A destination is a virtual location within a service integration bus, to whichapplications attach as producers, consumers, or both, to exchange messages. Thereare two types of destinations, queues and topic spaces. WebSphere applicationserver 5.1 based products do not support this workspace. This workspace displaysdata provided by both the Topic Spaces attributes and the Queue attributes.
Important:
v This workspace reports blanks for resource data on the first invocation if PMIdata collection is configured for on-demand sampling (that is, if your site setconfiguration value Resource Data Collection Method to On Demand) or if youhave not yet run applications that generate PMI resource data. To report
Chapter 3. ITCAM Agent for WebSphere Applications 85

resource data in this workspace after installing and configuring the datacollector, use the WebSphere administrative console to set the appropriate PMIinstrumentation level.
v Because of high processor usage, the Tivoli Enterprise Monitoring Agentprovides on-demand sampling by default. To activate PMI monitoring, you mustfirst select this workspace and then select it again later. Each time you select theworkspace, it displays the data collected during the interval between selections.
The predefined workspace contains:v Queue report, which displays information about the queue data. A queue is a
destination for point-to-point messagingv Topic Spaces report, which displays information about the topic space data. A
topic space is a destination for publish/subscribe messaging
Accessing the Destinations workspace
To access this workspace from the “Messaging workspace” on page 101, completeone of the following steps:v From the Messaging Engines report, right-click the link icon and from the menu,
click Destinations.v From Average Local Wait Time - History graph, Expired Messages - History
graph, Incomplete Topic Publications - History graph, or Total Published -History graph, right-click any bar; then, from the menu, click Link To >Destinations.
For additional information, see:v Organization of the predefined workspacesv Attribute groups used by the predefined workspaces
Durable Subscriptions workspaceIn this workspace, you can view statistic counters for the durable subscriptions ofa selected topic.
The default messaging provider supports the use of durable subscriptions totopics. This enables a subscriber to receive a copy of all messages published to atopic, even messages published during periods of time when the subscriber is notconnected to the server. WebSphere application server 5.1 based products do notsupport this workspace. This workspace displays data provided by the DurableSubscriptions attributes.
Important:
v This workspace reports blanks for resource data on the first invocation if PMIdata collection is configured for on-demand sampling (that is, if your site setconfiguration value Resource Data Collection Method to On Demand) or if youhave not yet run applications that generate PMI resource data. To reportresource data in this workspace after installing and configuring the datacollector, use the WebSphere administrative console to set the appropriate PMIinstrumentation level.
v Because of high processor usage, the Tivoli Enterprise Monitoring Agentprovides on-demand sampling by default. To activate PMI monitoring, you mustfirst select this workspace and then select it again later. Each time you select theworkspace, it displays the data collected during the interval between selections.
86 ITCAM Agents for WebSphere Applications, J2EE, and HTTP Servers: User Guide

The predefined workspace contains the following items:v Durable Subscriptions report, which displays information about durable
subscriptions that pertain to a selected topic, including the number of messagesconsumed, and message wait time
Accessing the Durable Subscriptions workspace
To access this workspace from the Destinations workspace, complete the followingstep:v From the Topic Spaces report, right-click the link icon and from the menu, click
Durable Subscriptions.
For additional information, see:v Organization of the predefined workspacesv Attribute groups used by the predefined workspaces
EJB Containers workspaceThis workspace displays aggregated information about each defined EJB.
This workspace displays aggregated bean performance data for all Enterprisebeans deployed to an EJB container. It also displays aggregated information for theapplication server that aggregates bean performance data for all Enterprise beansdeployed on the application server. This workspace displays data provided by theEJB Containers attributes.
Important:
v This workspace reports blanks for resource data on the first invocation if PMIdata collection is configured for on-demand sampling (that is, if your site setconfiguration value Resource Data Collection Method to On Demand) or if youhave not yet run applications that generate PMI resource data. To reportresource data in this workspace after installing and configuring the datacollector, use the WebSphere administrative console to set the appropriate PMIinstrumentation level.
v Because of high processor usage, the Tivoli Enterprise Monitoring Agentprovides on-demand sampling by default. To activate PMI monitoring, you mustfirst select this workspace and then select it again later. Each time you select theworkspace, it displays the data collected during the interval between selections.
The predefined workspace contains the following items:v Method Average Response Time - History graph, which shows the average
response time for methods invoked by the EJBs in the containerv Method Invocation Rate - History graph, which shows the rate at which the
methods of an EJB container were invokedv EJB Containers report, which displays aggregated information for each defined
EJB container that aggregates bean performance data for all Enterprise beansdeployed to that container. The report also displays aggregated information forthe application server that aggregates bean performance data for all Enterprisebeans deployed to the application server. For example, this report displays loadvalues, response times, and life cycle activities for Enterprise beans
Accessing the EJB Containers workspace
To access this workspace, complete the following steps:
Chapter 3. ITCAM Agent for WebSphere Applications 87

1. Within the Navigator, expand Windows Systems, Linux Systems, z/OSSystems, or UNIX Systems, as appropriate for the node you are monitoring.
2. Within the node list, expand the entry that corresponds to the node that youwant to select.
3. Within that node list of monitored applications, expand the list of WebSphereagents.
4. Within the list of available agents, expand the WebSphere application server ofyour choice.
5. Within that server list of available WebSphere application server workspaces,click the EJB Containers entry.
For additional information, see:v Organization of the predefined workspacesv Attribute groups used by the predefined workspaces
Accessing the managing server visualization engine from theEJB Containers workspace
Important: To use this functionality, you need ITCAM for Application DiagnosticsManaging Server.
In the Tivoli Enterprise Portal access the EJB Containers workspace. You can usethe Diagnostic Server Activity Display link to access the managing servervisualization engine. For information about access requirements, see “Prerequisitesfor access” on page 62.
1. In the EJB Containers window, right-click the choose link icon then clickDiagnostic Server Activity Display.
2. If this is your first time to access the managing server visualization engineduring a session, you see a Welcome to the Application Monitor page.
3. Depending on the user setup configuration in your environment you mighthave to type your managing server visualization engine User Name andPassword. If you do, you need only log in once per session using your UserName and Password.
4. Click OK to display the Server Activity Display page in the managing serverVisualization engine. You can use link to diagnose application problems, forexample, slow transactions or high response times.
5. The results relate directly to the context from where you launched the link inthe Tivoli Enterprise Portal. For more information about using the ServerActivity Display page and additional features, refer to the CompositeApplication Manager help within the managing server visualization agentInterface.
6. To return to the previous workspace in the Tivoli Enterprise Portal interface atany time choose from the following options:v From the Tivoli Enterprise Portal desktop client, including WebStart, click the
back arrow on the Portal toolbar.v From the Tivoli Enterprise Portal browser client, click the browser back
arrow.
For additional information, see:v “Workspace link to managing server visualization engine” on page 61
88 ITCAM Agents for WebSphere Applications, J2EE, and HTTP Servers: User Guide

v “Access the managing server visualization engine from the Tivoli EnterprisePortal” on page 65
Enterprise Java Beans workspaceThis workspace reports information about each Enterprise Java Bean (EJB) definedfor an EJB container.
The workspace provides information about these beans that relates to their identity,instrumentation level settings, creation and destruction of bean objects, responsetimes, invocations, calls, and rates for retrievals, returns, and discards. Thisworkspace displays data provided by the Enterprise Java Beans attributes.
Important:
v This workspace reports blanks for resource data on the first invocation if PMIdata collection is configured for on-demand sampling (that is, if your site setconfiguration value Resource Data Collection Method to On Demand) or if youhave not yet run applications that generate PMI resource data. To reportresource data in this workspace after installing and configuring the datacollector, use the WebSphere administrative console to set the appropriate PMIinstrumentation level.
v Because of high processor usage, the Tivoli Enterprise Monitoring Agentprovides on-demand sampling by default. To activate PMI monitoring, you mustfirst select this workspace and then select it again later. Each time you select theworkspace, it displays the data collected during the interval between selections.
The predefined workspace contains the following items:v Worst Method Response Times bar chart, which shows the worst response times
(in milliseconds) for methods invoked by each bean instancev Highest Method Invocation Rates bar chart, which shows the methods that are
invoked most often by each bean instancev Enterprise Java Beans report, which shows performance information about each
EJB deployed to the application server. This report displays information aboutbean activity, including the rates at which beans are being instantiated anddestroyed
Accessing the Enterprise Java Beans workspace
You access this workspace from the EJB Containers workspace. To list the EJBs forall containers, use one of the following procedures:v From the primary Tivoli Enterprise Portal menu, click View > Workspace >
Enterprise Java Beans.v Within the Navigator, right-click the EJB Containers entry; then, from the menu,
click Workspace > Enterprise Java Beans.
To see the EJBs referenced by a specific EJB container, complete the following step:v From the EJB Containers report, right-click the link icon and from the menu,
click Enterprise Java Beans.
For additional information, see:v Organization of the predefined workspacesv Attribute groups used by the predefined workspaces
Chapter 3. ITCAM Agent for WebSphere Applications 89

Garbage Collections - Selected Allocation Failure workspaceThis workspace provides detailed information about the garbage-collection cyclesthat occurred in response to a specific heap-allocation failure that occurred withinthe Java Virtual Machine.
This workspace displays data provided by the Garbage Collection Cycle attributes.
Note to Solaris and HP-UX users: Allocation-failure information is not recorded onthese platforms. Consequently, this workspace is always empty.
The predefined workspace contains the following items:v GC Elapsed Times bar chart, which breaks down the mark, sweep, and compact
times (in milliseconds) for each garbage-collection cycle that occurred for theselected allocation failure
v Heap Usage bar chart, which displays the JVM heap usage (kilobytes in use,freed, and free at start of garbage collection) for each garbage-collection cycle
v Garbage Collections - Selected Allocation Failure report, which displaysinformation about a single garbage-collection cycle that the JVM hosting theapplication server performed. For example, this report displays the free heapspace both before and after garbage collection, the heap space freed, and thenumber of objects moved during garbage collection. For Tivoli EnterpriseMonitoring Agent running on z/OS, region ID can be found in the ASIDcolumn.
Accessing the Garbage Collections - Selected Allocation Failureworkspace
To access this workspace from the Allocation Failures workspace, use one of thefollowing procedures:v From the Allocation Failures report, right-click the link icon and from the menu,
click Garbage Collections - Selected Allocation Failure.v From the Allocation Failure Elapsed Times bar chart or the Heap Usage -
History bar chart, right-click any bar; then, from the menu, click Link To >Garbage Collections - Selected Allocation Failure.
For more information, see:v Organization of the predefined workspacesv Attribute groups used by the predefined workspaces
Garbage Collection Analysis workspaceThis workspace summarizes all the Java Virtual Machine (JVM) garbage-collectoractivity over a user-defined interval.
The JVM generates detailed garbage collection logs for an application server whenstarted with the verbose:gc runtime parameter. This workspace displays dataprovided by the Garbage Collection Analysis attributes.
The predefined workspace contains the following items:v Garbage Collection Rate - History graph, which displays the rate at which the
garbage-collection algorithm is being invokedv Heap Usage - History bar chart, which displays the high-water mark of free
storage (in kilobytes) available in the heap after each garbage-collector run
90 ITCAM Agents for WebSphere Applications, J2EE, and HTTP Servers: User Guide

v Percentage of Time Garbage Collector Running - History graph, which displaysthe percentage of real time the garbage collector was running during the currentinterval, for each server region
v Garbage Collection Analysis report, which displays information about thegarbage-collection activities within the Java Virtual Machine that is hosting theapplication server. For example, this report displays the number of times thecollector ran during the interval and the resulting number of objects that thecollector freed
Accessing the Garbage Collection Analysis workspace
To access this workspace, complete the following steps:1. Within the Navigator, expand Windows Systems, Linux Systems, z/OS
Systems, or UNIX Systems, as appropriate for the node you are monitoring.2. Within the node list, expand the entry that corresponds to the name of the
node that you want to select.3. Within that node list of monitored applications, expand the list of WebSphere
agents.4. Within the list of available agents, expand the WebSphere application server of
your choice.5. Within that server list of available WebSphere application server workspaces,
click the Garbage Collection Analysis entry.
For additional information, see:v Organization of the predefined workspacesv Attribute groups used by the predefined workspaces
Accessing the managing server visualization engine from theGarbage Collection Analysis workspace
Important: To use this functionality, you need ITCAM for Application DiagnosticsManaging Server.
In the Tivoli Enterprise Portal navigate to the Garbage Collection Analysisworkspace. You can use the Diagnostic Server Activity Display link to access themanaging server visualization engine. For information about access requirements,see “Prerequisites for access” on page 62.1. In the Garbage Collection Analysis window, right-click the choose link icon
then click Diagnostic Memory Leak.2. If this is the first time you access the managing server visualization agent, you
see a Welcome to the Application Monitor page.3. Depending on the user setup configuration in your environment you might
have to type your managing server visualization engine User Name andPassword. If you do, you must log in only once per session using your UserName and Password.
4. Click OK to display the Memory Leak Confirmation report page in themanaging server visualization engine. You can use this page to diagnosememory leak problems.
5. In a z/OS environment, right-click the link icon on a row where the ASIDcolumn displays Summary.a. Click Garbage Collection Analysis Servant Regions.
Chapter 3. ITCAM Agent for WebSphere Applications 91

b. In the Garbage Collection Analysis - Servant Regions table, right-click thelink icon on a row.
c. Click Diagnostic Memory Leak.6. For information about Creating a Memory Leak Confirmation report in this
page, and additional features refer to the Composite Application Manager helpwithin the managing server visualization engine Interface.
7. To return to the previous workspace in the Tivoli Enterprise Portal interface atany time choose from the following options:v From the Tivoli Enterprise Portal desktop client, including WebStart, click the
back arrow on the Portal toolbar.v From the Tivoli Enterprise Portal browser client, click the browser back
arrow.
For additional information, see:v “Workspace link to managing server visualization engine” on page 61.v “Access the managing server visualization engine from the Tivoli Enterprise
Portal” on page 65
High Availability Manager workspaceThe High Availability Manager workspace provides aggregated information abouthigh availability managers.
This workspace displays data provided by the High Availability Managerattributes.
Important:
v This workspace reports blanks for resource data on the first invocation if PMIdata collection is configured for on-demand sampling (that is, if your site set theResource Data Collection Method configuration value to On Demand) or if youhave not yet run applications that generate PMI resource data. To reportresource data in this workspace after installing and configuring the datacollector, use the WebSphere administrative console to set the appropriate PMIinstrumentation level.
v Because of high processor usage, the Tivoli Enterprise Monitoring Agentprovides on-demand sampling by default. To activate PMI monitoring, you mustfirst select this workspace and then select it again later. Each time you select theworkspace, it displays the data collected during the interval between selections.
The predefined workspace contains the following items:v Local Group - History graph, which shows the number of local groups.v Group State Rebuild Time - History graph, which shows the time taken to
rebuild the global group state in milliseconds.v High Availability Manager report, which displays information about the high
availability manager, including group state rebuild time, bulletin-board subjects,bulletin-board subscriptions, bulletin-board rebuild time, and local bulletin-boardsubjects
Accessing the High Availability Manager workspace
To access this workspace, complete the following steps:1. Within the Navigator, expand Windows Systems, Linux Systems, z/OS
Systems, or UNIX Systems, as appropriate for the node you are monitoring.
92 ITCAM Agents for WebSphere Applications, J2EE, and HTTP Servers: User Guide

2. Within the node list, expand the entry that corresponds to the node that youwant to select.
3. Within that node list of monitored applications, expand the list of WebSphereagents.
4. Within the list of available agents, expand the WebSphere application server ofyour choice.
5. Within that server list of available WebSphere application server workspaces,click the High Availability Manager entry.
For additional information, see:v Organization of the predefined workspacesv Attribute groups used by the predefined workspaces
IMAP/POP workspaceThis workspace provides aggregated statistics of the usage information about theIMAP service and the POP3 service connectivity, especially for theperformance-related connectivity.
This workspace displays data provided by the Workplace Mail IMAP/POPattributes.
Important:
v This workspace reports blanks for resource data on the first invocation if PMIdata collection is configured for on-demand sampling (that is, if your site setconfiguration value Resource Data Collection Method to On Demand) or if youhave not yet run applications that generate PMI resource data. To reportresource data in this workspace after installing and configuring the datacollector, use the WebSphere administrative console to set the appropriate PMIinstrumentation level.
v Because of high processor usage, the Tivoli Enterprise Monitoring Agentprovides on-demand sampling by default. To activate PMI monitoring, you mustfirst select this workspace and then select it again later. Each time you select theworkspace, it displays the data collected during the interval between selections.
Important: This workspace does not support linking to ITCAM for ApplicationDiagnostics Managing Server visualization engine.
The predefined workspace contains the following items:v Active Sessions bar chart, which displays the number of active sessions during
the sampling intervalv Authentication Failures bar chart, which displays the number of authentications
failures during the sampling intervalv Workplace Mail report, which displays detailed information about the workplace
mail for each protocol
Accessing the IMAP/POP workspace
To access this workspace from the Workplace Mail workspace, use one of thefollowing procedures:v Within the Navigator, right-click the Workplace Mail entry; then from the menu,
click Workspace > IMAP/POP.
Chapter 3. ITCAM Agent for WebSphere Applications 93

v From the primary Tivoli Enterprise Portal menu, click View > Workspace >IMAP/POP.
For additional information, see:v Organization of the predefined workspacesv Attribute groups used by the predefined workspaces
J2C Connection Pools workspaceThis workspace reports information about resource adapters and connectors thatadhere to J2C, the WebSphere application server implementation of the JEEConnector Architecture (JCA).
Data counters for this category contain usage information about the J2C connectionpools that enable enterprise beans to connect to and interact with systems such asthe Customer Information Control System (CICS®) and the InformationManagement System (IMS™). This workspace displays data provided by the J2CConnection Pools attributes.
Important:
v This workspace reports blanks for resource data on the first invocation if PMIdata collection is configured for on-demand sampling (that is, if your site setconfiguration value Resource Data Collection Method to On Demand) or if youhave not yet run applications that generate PMI resource data. To reportresource data in this workspace after installing and configuring the datacollector, use the WebSphere administrative console to set the appropriate PMIinstrumentation level.
v Because of high processor usage, the Tivoli Enterprise Monitoring Agentprovides on-demand sampling by default. To activate PMI monitoring, you mustfirst select this workspace and then select it again later. Each time you select theworkspace, it displays the data collected during the interval between selections.
The predefined workspace contains the following items:v Highest Average Pool Sizes bar chart, which shows the largest average number
of managed connections for each J2C connection pool. The Y-axis headingscorrespond to the row number of the J2C Connection Pools report
v Worst Wait Times bar chart, which shows the worst wait time (in milliseconds)for each of the J2C connection pools. The y-axis headings correspond to the rownumber of the J2C Connection Pools report
v Highest Allocation Rates bar chart, which displays the highestmanaged-connection creation, destruction, and allocation rates (in events persecond)
v J2C Connection Pools report, which displays information about connectors thatadhere to J2C. For example, this report displays the number of managedconnections or physical connections and the total number of connections orconnection handles
Accessing the J2C Connection Pools workspace
To access this workspace, complete the following steps:1. Within the Navigator, expand Windows Systems, Linux Systems, z/OS
Systems, or UNIX Systems, as appropriate for the node you are monitoring.2. Within the node list, expand the entry that corresponds to the node that you
want to select.
94 ITCAM Agents for WebSphere Applications, J2EE, and HTTP Servers: User Guide

3. Within that node list of monitored applications, expand the list of WebSphereagents.
4. Within the list of available agents, expand the WebSphere application server ofyour choice.
5. Within that server list of available WebSphere application server workspaces,click the J2C Connection Pools entry.
For additional information, see:v Organization of the predefined workspacesv Attribute groups used by the predefined workspaces
Accessing the managing server visualization engine from theJ2C Connection Pools workspace
Important: To use this functionality, you need ITCAM for Application DiagnosticsManaging Server.
In The Tivoli Enterprise Portal access the J2C connection pools workspace. You canuse the Diagnostic Server Activity Display link to access the managing servervisualization engine. For information about access requirements see “Prerequisitesfor access” on page 62.
1. In the J2C connection pools window, right-click the choose link iconthen click Diagnostic Server Activity Display.
2. If this is your first time to access the managing server visualization agentduring a session, you see a Welcome to the Application Monitor page.
3. Depending on the user setup configuration in your environment you mighthave to type your managing server visualization engine User Name andPassword. If you do, you need to log in only once per session using your UserName and Password.
4. Click OK to display the Server Activity Display page in the managing serverVisualization engine. You can use link to diagnose application problems, forexample, slow transactions or high response times.
5. The results relate directly to the context from where you launched the link inthe Tivoli Enterprise Portal. For more information about using the ServerActivity Display page and additional features, refer to the CompositeApplication Manager help within the managing server visualization agentInterface.
6. To return to the previous workspace in the Tivoli Enterprise Portal interface atany time choose from the following options:v From the Tivoli Enterprise Portal desktop client, including WebStart, click the
back arrow on the Portal toolbar.v From the Tivoli Enterprise Portal browser client, click the browser back
arrow.
For additional information, see:v “Workspace link to managing server visualization engine” on page 61v “Access the managing server visualization engine from the Tivoli Enterprise
Portal” on page 65
Chapter 3. ITCAM Agent for WebSphere Applications 95

JMS Summary workspaceThe JMS Summary workspace displays information about queues being used byyour applications using the Java Message Service (JMS) interface.
The JMS Summary workspace also provides information about how WebSphereapplication server applications are using WebSphere MQ. It displays suchinformation as the number of messages read and written and which queuemanagers and queues were used during the interval.
This workspace displays data provided by the JMS Summary attributes.
The predefined workspace contains the following items:v Worst JMS Send Times bar chart, which displays the longest times (in
milliseconds) your application spent putting messages onto a queue during theinterval
v Worst JMS Receive Times bar chart, which displays the longest times (inmilliseconds) your application spent getting messages from a queue during theinterval
v Worst JMS Browse Times bar chart, which displays the longest times (inmilliseconds) your application spent browsing messages on a queue during theinterval
v JMS Summary - Current Interval report, which displays detailed informationabout how the WebSphere application server uses messaging middleware (thatis, WebSphere MQ) using JMS. Details include the send, receive, browse, andpublish times for your application. It also includes such information as, whichqueue managers and queues are being used and how many messages are beingread and written
Accessing the JMS Summary workspace
To access this workspace, complete the following steps:1. Within the Navigator, expand Windows Systems, Linux Systems, z/OS
Systems, or UNIX Systems, as appropriate for the node you are monitoring.2. Within the node list, expand the entry that corresponds to the node that you
want to select.3. Within that node list of monitored applications, expand the list of WebSphere
agents.4. Within the list of available agents, expand the WebSphere application server of
your choice.5. Within that server list of available WebSphere application server workspaces,
click the JMS Summary entry.
For additional information, see:v Organization of the predefined workspacesv Attribute groups used by the predefined workspaces
Accessing the managing server visualization engine from theJMS Summary workspace
Important: To use this functionality, you need ITCAM for Application DiagnosticsManaging Server.
96 ITCAM Agents for WebSphere Applications, J2EE, and HTTP Servers: User Guide

In The Tivoli Enterprise Portal access the JMS Summary workspace. You can usethe Diagnostic Server Activity Display link to access the managing servervisualization engine. For information about access requirements, see “Prerequisitesfor access” on page 62.1. In the JMS Summary - Current interval window, right-click the choose link
icon then click Diagnostic Server Activity Display.2. If this is your first time to access the managing server visualization agent
during a session, you see a Welcome to the Application Monitor page.3. Depending on the user setup configuration in your environment you might
have to type your managing server visualization engine User Name andPassword. If you do, you need to log only once per session using your UserName and Password.
4. Click OK to display the Server Activity Display page in the managing serverVisualization engine. You can use this link to diagnose application problems,for example, slow transactions or high response times.
5. In a z/OS environment, right-click the link icon on a row where the ASIDcolumn displays Summary.a. Click Selected JMS - Servant Regions.b. In the Selected JMS - Servant Regions table, right-click the link icon on a
row.c. Click Diagnostic Server Activity Display.
6. For more information about the options available in a z/OS environment, referto “Region workspaces in a z/OS environment” on page 136 and “Accessing aRegion workspace” on page 138.
7. The results in this page relate directly to the context from where you launchedthe link in the Tivoli Enterprise Portal. For more information about using theServer Activity Display page, and additional features refer to the CompositeApplication Manager help within the managing server visualization agentInterface.
8. To return to the previous workspace in the Tivoli Enterprise Portal interface atany time choose from the following options:v From the Tivoli Enterprise Portal desktop client, including WebStart, click the
back arrow on the Portal toolbar.v From the Tivoli Enterprise Portal browser client, click the browser back
arrow.
For additional information, see:v “Workspace link to managing server visualization engine” on page 61.v “Access the managing server visualization engine from the Tivoli Enterprise
Portal” on page 65
JVM Stack Trend workspaceThis workspace displays trend data regarding JVM CPU usage, JVM garbagecollection, and JVM heap usage.
This workspace displays data provided by the application server and GarbageCollection Analysis attribute groups.
The predefined workspace contains:v JVM CPU Trend chart indicates the percentage of the JVM CPU used.v Percent GC Time Used chart
Chapter 3. ITCAM Agent for WebSphere Applications 97

v Heap Usage Trend chart
Accessing the Selected Application - Configuration workspace
Access this workspace using one of the following methods:v Double click the JVM icon in Resources workspace.v Right-click the JVM icon in the Resources workspace and select Link To, then
select JVM Stack Trend.
For additional information, see:v Resources and Applications workspacesv Organization of the predefined workspacesv Attribute groups used by the predefined workspaces
Log Analysis workspaceThis workspace reports application server error and exception conditions asrecorded in the application server log file.
This workspace displays data provided by both the Log Analysis attributes andDC Messages attributes.
The predefined workspace contains the following items:v DC Message Events, which display aggregated information about the messages
from WebSphere data collectorv Log Analysis report, which displays application server error and exception
conditions as recorded in the application server log file, SystemOut.log. Thisinformation includes the exception severity as well as the ID and text of theassociated message. In the Log Analysis report, if the PID value is displayed as-1, it indicates that the data collector is disconnected. If a WebSphere servershutdown occurs, the connection between the data collector and TivoliEnterprise Monitoring Agent is closed but the data collector continues to writeto log files. Tivoli Enterprise Monitoring Agent processes these records but setsthe PID value to -1.
Accessing the Log Analysis workspace
To access this workspace, complete the following steps:1. Within the Navigator, expand Windows Systems, Linux Systems, z/OS
Systems, or UNIX Systems, as appropriate for the node you are monitoring.2. Within the node list, expand the entry that corresponds to the node that you
want to select.3. Within that node list of monitored applications, expand the list of WebSphere
agents.4. Within the list of available agents, expand the WebSphere application server of
your choice.5. Within that server list of available WebSphere application server workspaces,
click the Log Analysis entry.
For additional information, see:v Organization of the predefined workspacesv Attribute groups used by the predefined workspaces
98 ITCAM Agents for WebSphere Applications, J2EE, and HTTP Servers: User Guide

Lotus Workplace Server workspaceThe Lotus Workplace Server workspace displays overall statistics for each LotusWorkplace application server being monitored by the Tivoli Enterprise MonitoringAgent.
Important: This workspace does not support linking to ITCAM for ApplicationDiagnostics Managing Server visualization engine.
The predefined workspace contains the following items:v Heap Usage - History bar chart, which displays free memory size and used
memory size (in kilo bytes) within the WebSphere application server heap overtime. The chart flyovers display the exact valuesThis view displays data provided by the Garbage Collection Analysis attributes.
v Response Time - History graph, which shows the server response time torequests over timeThis view displays data provided by the Request Times and Rates attributes.
v Request Rate - History graph, which shows the rate at which requests have beenreceived by this server over timeThis view displays data provided by the Request Times and Rates attributes.
v Percent CPU Used - History graph, which shows the percentage of the CPU thatthis server consumed over timeThis view displays data provided by the application server attributes.
v Application server Summary report, which displays overall information aboutthis WebSphere application server, including JVM statistics and CPU usagestatisticsThis view displays data provided by the application server attributes.
Accessing the Lotus Workplace Server workspace
To access this workspace, complete the following steps:1. Within the Navigator, expand Windows Systems, Linux Systems, or UNIX
Systems, as appropriate for the node you are monitoring.2. Within the node list, expand the entry that corresponds to the node that you
want to select.3. Within that node list of monitored applications, expand the list of WebSphere
agents.4. Within the list of available agents, click the Lotus Workplace Server entry of
your choice.
For additional information, see:v Organization of the predefined workspacesv Attribute groups used by the predefined workspaces
Messages Queues workspaceThis workspace provides aggregated statistics about the usage information aboutthe message delivery on Lotus Workplace servers.
This workspace displays data provided by the Workplace Mail Queues attributes.
Note:
Chapter 3. ITCAM Agent for WebSphere Applications 99

v This workspace reports blanks for resource data on the first invocation if PMIdata collection is configured for on-demand sampling (that is, if your site setconfiguration value Resource Data Collection Method to On Demand) or if youhave not yet run applications that generate PMI resource data. To reportresource data in this workspace after installing and configuring the datacollector, use the WebSphere administrative console to set the appropriate PMIinstrumentation level.
v Because of high processor usage, the Tivoli Enterprise Monitoring Agentprovides on-demand sampling by default. To activate PMI monitoring, you mustfirst select this workspace and then select it again later. Each time you select theworkspace, it displays the data collected during the interval between selections.
Important: This workspace does not support linking to ITCAM for ApplicationDiagnostics Managing Server visualization engine.
The predefined workspace contains the following items:v Queue Messages bar chart, which displays the number of messages in the ready,
retry, unprocessed, and dead state in the queue during the sampling intervalv Workplace Mail Message Queues report, which displays detailed information
about the state of messages in each queue
Accessing the Messages Queues workspace
To access this workspace from the Workplace Mail workspace, use one of thefollowing procedures:v Within the Navigator, right-click the Workplace Mail entry; then from the menu,
click Workspace > Messages Queues.v From the primary Tivoli Enterprise Portal menu, click View > Workspace >
Messages Queues.
For additional information, see:v Organization of the predefined workspacesv Attribute groups used by the predefined workspaces
Messaging Engine Communications workspaceThis workspace provides aggregated counter statistics for all the messagingengines being hosted by the current application server. WebSphere applicationserver 5.1 based products do not support this workspace.
This workspace displays data provided by the Messaging Engine Communicationsattributes.
Note:
v This workspace reports blanks for resource data on the first invocation if PMIdata collection is configured for on-demand sampling (that is, if your site setconfiguration value Resource Data Collection Method to On Demand) or if youhave not yet run applications that generate PMI resource data. To reportresource data in this workspace after installing and configuring the datacollector, use the WebSphere administrative console to set the appropriate PMIinstrumentation level.
v Because of high processor usage, the Tivoli Enterprise Monitoring Agentprovides on-demand sampling by default. To activate PMI monitoring, you must
100 ITCAM Agents for WebSphere Applications, J2EE, and HTTP Servers: User Guide

first select this workspace and then select it again later. Each time you select theworkspace, it displays the data collected during the interval between selections.
The predefined workspace contains the following items:v Situation Event Console report, which shows the event activity for situations
associated with the current Navigator item and any items within the branch. TheNavigator alerts you when a situation becomes true by overlaying the Navigatoritem with an event indicator. This report is useful when multiple alerts areraised and you might not know newly arrived alerts just by looking at theindicator.
v Messaging Engine Communications report, which displays information aboutthe messaging engine communications, including API connections, errors, reads,writes, message written and message read.
Accessing the Messaging Engine Communications workspace
To access this workspace from the Platform Messaging workspace, use one of thefollowing procedures:v Within the Navigator, right-click the Platform Messaging entry; then, from the
menu, click Workspace > Messaging Engine Communications.v From the primary Tivoli Enterprise Portal menu, click View >Workspace >
Messaging Engine Communications.
For additional information, see:v Organization of the predefined workspacesv Attribute groups used by the predefined workspaces
Messaging workspaceIn this workspace, you can view of performance counters of the MessagingEngines supported by a server. WebSphere application server 5.1 based productsdo not support this workspace.
This workspace displays data provided by the Messaging Engines attributes.
Note:
v This workspace reports zeros for resource data on the first invocation if PMIdata collection is configured for on-demand sampling (that is, if your site setconfiguration value Resource Data Collection Method to On Demand) or if youhave not yet run applications that generate PMI resource data. To reportresource data in this workspace after installing and configuring the datacollector, use the WebSphere administrative console to set the appropriate PMIinstrumentation level.
v Because of high processor usage, the Tivoli Enterprise Monitoring Agentprovides on-demand sampling by default. To activate PMI monitoring, you mustfirst select this workspace and then select it again later. Each time you select theworkspace, it displays the data collected during the interval between selections.
The predefined workspace contains the following items:v Average Local Wait Time - History graph, which shows the historical time spent
by messages on this durable subscription on consumptionv Expired Messages - History graph, which shows the number of report-enabled
messages that expired while on this queue
Chapter 3. ITCAM Agent for WebSphere Applications 101

v Incomplete Topic Publications - History graph, which shows the number ofpublications not yet received by all historical subscribers.
v Total Published - History graph, which shows the historical number ofpublications to the messaging engines.
v Messaging Engines report, which displays the aggregated information abouteach messaging engine. A messaging engine is a server component that providesthe core messaging functionality of a service integration bus. A messagingengine manages bus resources and provides a connection point for applications
Accessing the Messaging workspace
To access this workspace, complete the following steps:1. Within the Navigator, expand Windows Systems, Linux Systems, z/OS
Systems, or UNIX Systems, as appropriate for the node you are monitoring.2. Within the node list, expand the entry that corresponds to the node that you
want to select.3. Within that node list of monitored applications, expand the list of WebSphere
agents.4. Within the list of available agents, expand the WebSphere application server of
your choice.5. Within that server list of available WebSphere application server workspaces,
click the Platform Messaging entry.
For additional information, see:v Organization of the predefined workspacesv Attribute groups used by the predefined workspaces
OS Stack workspaceThis workspace displays information about the operating system performance.
This workspace displays data provided by the application server attribute group.
The predefined workspace contains:v Current OS Stack Summary report which displays:
– Server name– Platform CPU Used (ms)– System Paging
Important: The feature Platform CPU Used (ms) does not apply the z/OSplatform.
v CPU Used chartv System Paging chart
Accessing the Selected Application - Configuration workspace
Access this workspace using one of the following methods:v Double click the OS icon in Resources workspace.v Right-click the OS icon in the Resources workspace and select Link To, then
select OS Stack Trend.
For additional information, see:
102 ITCAM Agents for WebSphere Applications, J2EE, and HTTP Servers: User Guide

v Resources and Applications workspacesv Organization of the predefined workspacesv Attribute groups used by the predefined workspaces
Pool Analysis workspaceThis workspace displays information about the usage of several types of poolsassociated with each application server, including web container pools, ORB pools,J2C connection pools, and database connection pools. This workspace helps youdetect resource constraints and potential performance congestion.
Important:
v This workspace reports zeros for resource data on the first invocation if PMIdata collection is configured for on-demand sampling (that is, if your site setconfiguration value Resource Data Collection Method to On Demand) or if youhave not yet run applications that generate PMI resource data. To reportresource data in this workspace after installing and configuring the datacollector, use the WebSphere administrative console to set the appropriate PMIinstrumentation level.
v Because of high processor usage, the Tivoli Enterprise Monitoring Agentprovides on-demand sampling by default. To activate PMI monitoring, you mustfirst select this workspace and then select it again later. Each time you select theworkspace, it displays the data collected during the interval between selections.
The predefined workspace contains the following items:v Web Container Pool Usage - History graph, which shows the configured
maximum number of web container pooled threads and the average activethreads in the web container poolThis view displays data provided by the Thread Pools attributes.
v ORB Pool Usage - History graph, which shows the configured maximumnumber of ORB pooled threads and the average active threads in the ORB poolThis view displays data provided by the Thread Pools attributes.
v Web Container Pool % at Max - History bar chart, which shows the maximumusage percentage for the web container pooled threads over timeThis view displays data provided by the Thread Pools attributes.
v ORB Pool % at Max - History bar chart, which shows the maximum usagepercentage for the ORB pooled threads over timeThis view displays data provided by the Thread Pools attributes.
v Percent CPU Used - History graph, which shows the percentage of the CPUused over timeThis view displays data provided by the application server attributes.
v DB Connection % at Max - Current Interval bar chart, which shows themaximum usage percentage for a database connection pool over timeThis view displays data provided by the DB Connection Pools attributes.
v J2C Connection % at Max - Current Interval bar chart, which shows themaximum usage percentage for a J2C connection pool over timeThis view displays data provided by the J2C Connection Pools attributes.
Accessing the Pool Analysis workspace
To access this workspace, complete the following steps:
Chapter 3. ITCAM Agent for WebSphere Applications 103

1. Within the Navigator, expand Windows Systems, Linux Systems, z/OSSystems, or UNIX Systems, as appropriate for the node you are monitoring.
2. Within the node list, expand the entry that corresponds to the node that youwant to select.
3. Within that node list of monitored applications, expand the list of WebSphereagents.
4. Within the list of available agents, expand the WebSphere application server ofyour choice.
5. Within that server list of available WebSphere application server workspaces,click the Pool Analysis entry.
For additional information, see:v Organization of the predefined workspacesv Attribute groups used by the predefined workspaces
Portal Pages Summary workspaceThis workspace reports performances statistics about WebSphere Portal pageresponse times completed on the interval. A historical version of this workspaceprovides a long-term view of a single portal page that you select.
The following workspace displays only if the request monitoring control level,monitoring level is set to Level2. For more information about the requestmonitoring control level, see “Application Dashboard (Basic) tab” on page 59.
This workspace displays data provided by the Portal Page Summary attributes.
The predefined workspace contains the following items:v Worst Response Times bar chart, which displays the worst average response
times (in milliseconds) for portlet during the current intervalv Most Popular Portal Pages bar chart, which shows the number of requests for
portletv Portal Pages report, which displays aggregated information about portal pages,
including average response time and request count
Accessing the Portal Pages Summary workspace
To access this workspace from the Portal Summary workspace, use one of thefollowing procedures:v Within the Navigator, right-click the Portal Summary entry; then, from the
menu, click Workspace > Portal Pages Summary.v From the primary Tivoli Enterprise Portal menu, click View > Workspace >
Portal Pages Summary.
Selected Portal Page - History workspace
The Selected Portal Page - History workspace displays the historical informationthat corresponds to the information in the Portal Pages Summary workspace for aselected portal page. Historical information is collected over a specific time span.See the online help for Tivoli Enterprise Portal for a detailed explanation ofhistorical reporting.
104 ITCAM Agents for WebSphere Applications, J2EE, and HTTP Servers: User Guide

Accessing the Selected Portal Page - History workspace
To access this workspace from the Portal Pages Summary workspace, use one ofthe following procedures:v From the Portal Pages report, right-click the link icon and from the menu, click
Selected Portal Page - History.v From the Worst Response Times bar chart, or the Most Popular Portal Pages bar
chart, right-click any bar; then, from the menu, click Link To > Selected PortalPage - History.
For additional information, see:v Organization of the predefined workspacesv Attribute groups used by the predefined workspaces
Portal Summary workspaceThe workspace reports summarize statistics about response times and functionaldecomposition of additional requests collected for WebSphere Portal applications.These include statistics about Portal Pages/Gateway Servlet aggregated responsetimes collected on the interval. Others find grained statistics about Portlet, ModelBuilding, Page Loading, Authentication, and Authorization requests response timescollected on the same interval. By default, this workspace is configured forlong-term historical interval reporting.
The following workspace displays only if the request monitoring control level,monitoring level is set to Level2. For more information about the requestmonitoring control level, see “Application Dashboard (Basic) tab” on page 59.
This workspace displays data provided by the Portal Summary attributes.
The predefined workspace contains the following items:v Portal Pages/Gateway Servlet - History graph, which shows the historical
average response time (in milliseconds) of portal pages/Gateway Servletv Portlet - History graph, which shows the historical average response time (in
milliseconds) of portletsv Model Building - History graph, which shows the historical response time (in
milliseconds) of model buildingv Page Loading - History graph, which shows the historical response time (in
milliseconds) of page loadingv Authentication - History graph, which shows the historical response time (in
milliseconds) of authenticationv Authorization - History graph, which shows the historical response time (in
Milliseconds) of authorization
Accessing the Portal Summary workspace
To access this workspace, complete the following steps:1. Within the Navigator, expand Windows Systems, Linux Systems, z/OS
Systems, or UNIX Systems, as appropriate for the node you are monitoring.2. Within the node list, expand the entry that corresponds to the node that you
want to select.3. Within that node list of monitored applications, expand the list of WebSphere
agents.
Chapter 3. ITCAM Agent for WebSphere Applications 105

4. Within the list of available agents, expand the WebSphere Portal server of yourchoice.
5. Within that server list of available WebSphere Portal Server workspaces, clickthe Portal Summary entry.
For additional information, see:v Organization of the predefined workspacesv Attribute groups used by the predefined workspaces
Portlet Summary and Selected Portlet - History workspacesThese workspaces reports performances statistics about WebSphere Portal portletresponse times completed on the interval.
Portlet Summary workspace
The Portlet Summary workspace displays only if the request monitoring controllevel, monitoring level is set to Level2. For more information about the requestmonitoring control level, see “Application Dashboard (Basic) tab” on page 59.
A historical version of this workspace provides a long-term view of a single portletthat you select. This workspace displays data provided by the Portlet Summaryattributes.
The predefined workspace contains the following items:v Worst Response Times bar chart, which displays the worst average response
times (in milliseconds) for portlet in the current intervalv Most Popular Portlets bar chart, which shows the exception and request rates (in
events per second) for portletv Portlets report, which displays aggregated information about portlets, including
average response time, request count and request rate
Accessing the Portlet Summary workspace
To access this workspace from the Portal Summary workspace, use one of thefollowing procedures:v Within the Navigator, right-click the Portal Summary entry; then, from the
menu, click Workspace > Portlet Summary.v From the primary Tivoli Enterprise Portal menu, click View > Workspace >
Portlet Summary.
Selected Portlet - History workspace
The Selected Portlet - History workspace displays the historical information thatcorresponds to the information in the Portal Summary workspace for a selectedportlet. Historical information is collected over a particular measured time span.See the online help for Tivoli Enterprise Portal for a detailed explanation ofhistorical reporting.
Accessing the Selected Portlet - History workspace
To access this workspace from the Portlet Summary workspace, use one of thefollowing procedures:
106 ITCAM Agents for WebSphere Applications, J2EE, and HTTP Servers: User Guide

v From the Portlets report, right-click the link icon and from the menu, clickSelected Portlet - History.
v From the Worst Response Time bar chart, or the Most Popular Portlets bar chart,right-click any bar; then, from the menu, click Link To > Selected Portlet -History.
For more information, see:v Organization of the predefined workspacesv Attribute groups used by the predefined workspaces
Request Analysis workspaceThe workspace reports response times and functional decomposition informationabout requests (including servlets, JSPs, and EJB methods) that completed duringthe interval.
A historical version of this workspace provides a long-term view of a singlerequest that you select. This workspace displays data provided by the RequestAnalysis attributes.
The predefined workspace contains the following items:v Worst Average Response Times bar chart, which displays the five worst response
times for requests processed during the current intervalv Worst Completion Rates bar chart, which displays the 11 requests that have the
worst completion ratesv Requests - Current Interval report, which displays detailed information about
the response times recorded for each request
Accessing the Request Analysis workspace
To access this workspace, complete the following steps:1. Within the Navigator, expand Windows Systems, Linux Systems, z/OS
Systems, or UNIX Systems, as appropriate for the node you are monitoring.2. Within the node list, expand the entry that corresponds to the node that you
want to select.3. Within that node list of monitored applications, expand the list of WebSphere
agents.4. Within the list of available agents, expand the WebSphere application server of
your choice.5. Within that server list of available WebSphere application server workspaces,
click the Request Analysis entry.
Selected Request - History workspace
The Selected Request - History workspace displays the historical information thatcorresponds to the information in the Request Analysis workspace for a singlerequest type that you select. Historical information is collected over a specific timespan. See the online help for Tivoli Enterprise Portal for a detailed explanation ofhistorical reporting.
Accessing the Selected Request - History workspace
To access this workspace from the Request Analysis workspace, use one of thefollowing procedures:
Chapter 3. ITCAM Agent for WebSphere Applications 107

v From the Requests - Current Interval report, right-click the link icon and fromthe menu, click Selected Request - History.
v From the Worst Average Response Times bar chart, right-click any bar; then,from the menu, click Link To > Selected Request - History.
For additional information, see:v Organization of the predefined workspacesv Attribute groups used by the predefined workspaces
The following workspaces are displayed only if the request monitoring controllevel, monitoring level is set to Level2. For more information about the requestmonitoring control level, see “Application Dashboard (Basic) tab” on page 59.v Selected Request - Datasourcev Selected Request - JMS Queuesv Selected Request - Resource Adaptersv Selected Request - Service Components
Accessing the managing server visualization engine from theRequest Analysis workspace
Important: To use this functionality, you need ITCAM for Application DiagnosticsManaging Server.
In the Tivoli Enterprise Portal access the request analysis workspace, see“Accessing the Request Analysis workspace” on page 107. You can use you can usethe following links to access the managing server visualization engine.v Diagnostic Recent Completed Requests
v Diagnostic In-flight Request Search
v Diagnostic SMF Data (This option is only available if the Tivoli EnterprisePortal is connected to a z/OS data controller.)
For information about access requirements, see “Prerequisites for access” on page62.1. In the Requests - Current Interval window, right-click the choose link icon
then click one of the following options:v Diagnostic Recent Completed Requests
v Diagnostic In-flight Request Search
2. To view Diagnostic Recent Completed Requests or Diagnostic In-flight RequestSearch in a z/OS environment, right click the link icon on a row where theASID column displays Summary.a. Click Selected Request Servant Regions .b. In the Selected Requests - Servant Regions Current Interval table,
right-click the link icon on a row.c. Click Diagnostic Recent Completed Requests or Diagnostic In-flight
Request Search.3. To view Diagnostic SMF Data (z/OS data collector only) right-click the link
icon on a row where the ASID column displays Summary.a. Click Selected Request Servant Regions.b. In the Selected Requests - Servant Regions Current Interval table,
right-click the link icon on a row.c. Click Diagnostic SMF.
108 ITCAM Agents for WebSphere Applications, J2EE, and HTTP Servers: User Guide

For information about the options available in a z/OS environment, refer to“Region workspaces in a z/OS environment” on page 136 and “Accessing aRegion workspace” on page 138
4. If this is your first time to access the managing server visualization agentduring the session, you see a Welcome to the Application Monitor page.
5. Depending on the user setup configuration in your environment you mighthave to type your managing server visualization engine User Name andPassword. If you do, you need to log in only once per session using your UserName and Password.
6. Click OK to display the relevant page in the managing server visualizationengine.v If you click Diagnostic Recent Completed Requests you see the Server
Activity Display page.v If you click Diagnostic In-flight Request Search you see the In-Flight
Request Search page.v If you click Diagnostic SMF Data you see the SMF Overview page.
7. The information in these pages relates directly to the context from where youlaunched the link in the Tivoli Enterprise Portal.
8. To return to the previous workspace in the Tivoli Enterprise Portal interface atany time choose from the following options:v From the Tivoli Enterprise Portal desktop client, including WebStart, click the
back arrow on the Portal toolbar.v From the Tivoli Enterprise Portal browser client, click the browser back
arrow.
For additional information, see:v “Workspace link to managing server visualization engine” on page 61.v “Access the managing server visualization engine from the Tivoli Enterprise
Portal” on page 65
Request Baseline workspaceThis workspace displays aggregated information about the request baseline.
The baselining collects statistical information about an application requestscompletion times and uses this information to assign fair and bad thresholds onthe application requests. The product divides the whole request response timesinto buckets and collects individual hits into each bucket. Use these attributes toget statistics from individual requests collected during baselining interval.
This workspace displays data provided by the Baseline attributes.
The predefined workspace contains:v Baseline Data report, which shows lower and upper boundaries for each bucket
request as well as the breakdown of nested request types in percentage.v Request Label report, which shows the monitoring configuration settings for
selected requests, including auto-threshold settings and actual thresholdscalculated from the baseline data.
v Nested Delays Distribution bar chart, which displays a bar for each bucket ofresponse times across the different nested types (JDBC, JCA, JMS, and so on).This chart provides you with additional hints and insight about how to interpretresponse times distribution displayed in the distribution chart.
Chapter 3. ITCAM Agent for WebSphere Applications 109

v Response Time Distribution bar chart, which displays the distribution of theservlet response times on the baselining interval, also called zones.
You can use the bar charts to customize automatic request time thresholds. See“Enable_Auto_Threshold: set threshold parameters” on page 290.
Accessing the Request Baseline workspace
Complete the following steps to access this workspace: :1. Access the “Application Configuration workspace” on page 111.2. In the Application Requests table, right-click the link icon and click Request
Baseline.
For additional information, see:v Organization of the predefined workspacesv Attribute groups used by the predefined workspaces
EJB Tier Analysis workspaceThe workspace displays detailed information about application tier health for aselected WebSphere application.
The application tier health is derived from the following performance statistics:v Calculated application request delays in EJB container or custom requests delays
compared against corresponding thresholds assigned in applicationconfiguration.
v Completion rates for application edge EJB requests.v Application server ORB thread pool utilization level.v PMI statistics for application EJB container transactions begin, commit, and
rollback rates.
This workspace displays data provided by the Application Health Status attributes.
The predefined workspace contains:v Application Tier Analysis report, which shows the overall health status of the
Application tier for a selected application. For Tivoli Enterprise MonitoringAgent running on z/OS, region ID can be found in the ASID column.
v Container Pool Usage bar chart, which displays the average number ofconcurrently active threads and the average number of free threads in the pool.This view displays data provided by the Thread Pools attributes.
v Worst Application Tier Delays bar chart, which displays the top 10 delayedrequests in the application tier. This view displays data provided by the RequestAnalysis attributes.
v Worst Application Tier Completion Rates bar chart, which displays the top 10worst requests in the application tier. This view displays data provided by theRequest Analysis attributes.
v Container Transactions - Rates bar chart, which displays the counts of global andlocal transactions that were started, committed, and undone during the interval.This view displays data provided by the Container Transactions attributes.
v JVM Health - CPU Used % graph, which displays the percentage of the CPUused by the Java Virtual Machine (JVM) during the interval. This view displaysdata provided by the application server attributes.
110 ITCAM Agents for WebSphere Applications, J2EE, and HTTP Servers: User Guide

v JVM Health - Heap Used % graph, which displays the current heap usage forthe monitored JVM. This view displays data provided by the Garbage CollectionAnalysis attributes.
v JVM Health - GC Active Time % graph, which displays the percentage of realtime that the garbage collector was active during the interval. This view displaysdata provided by the Garbage Collection Analysis attributes.
Accessing the EJB Tier Analysis workspace
To access this workspace from the Application Health Summary workspace, usethe following procedures:v From the Application Health Summary report, right-click the link icon and, from
the menu, click Selected Application - EJB Tier Analysis.
For additional information, see:v Organization of the predefined workspacesv Attribute groups used by the predefined workspaces
Application Configuration workspaceThis workspace displays the information about the configuration details of theselected application.
The workspace contains information about application requests and thecorresponding thresholds assigned to them, as well as about status andconfiguration for application baselining activity. An entry is created for eachapplication in the configuration report when a WebSphere application is discoveredby the monitoring agent. The data is also stored in a context file local tomonitoring agent where it can persist between monitoring agent restarts.
This workspace displays data provided by the Application MonitoringConfiguration attributes.
The predefined workspace contains:v Longest Request Thresholds - Top 10 bar chart, which displays the 10 longest (in
time) request thresholds configured for the given application (Servlet/JSP URLor EJB class/method call).
v Application Requests report, which shows the discovered application requestsand thresholds assigned to them. Click the link in the Application RequestConfiguration report or right-click and select Selected Request - Baseline to go tothe Request Baseline Workspace. The link to the Selected Request - Baseline isdisabled when the baseline request count is less than or equal to 0.
v Application report, which shows the common details about applicationconfiguration, including custom requests monitoring levels for application andcurrent baselining status.
Accessing the Application Configuration workspace
To access this workspace from the Application Health Summary workspace, usethe following procedures:v From the Application Health Summary report, right-click the link icon and from
the menu, click Application Configuration.
For additional information, see:
Chapter 3. ITCAM Agent for WebSphere Applications 111

v Organization of the predefined workspacesv Attribute groups used by the predefined workspaces
Backend Tier Analysis workspaceThis workspace displays information about the details of the backend tier for aselected application.
This workspace displays data provided by the Application Health Status attributes.
The predefined workspace contains:v Backend Tier Analysis report, which shows the overall health status of the
backend tier for a selected application. For Tivoli Enterprise Monitoring Agentrunning on z/OS, region ID can be found in the ASID column.
v Worst Backend Tier Delays bar chart, which displays the top 10 delayed requestsin the backend tier. This view displays data provided by the Request Analysisattributes.
v Most Used JDBC resources bar chart, which displays the average time perrequest used by queries and updates to the data source. This view displays dataprovided by the Datasources attributes.
v Most Used JMS Resources bar chart, which displays the longest times yourapplication spent in getting messages from a queue, putting messages onto aqueue, publishing messages to a queue, or browsing messages on a queueduring the interval. This view displays data provided by the JMS Summaryattributes.
v Most Used JDBC Pools bar chart, which displays the average percentage of theconnection pool in use during the interval. This view displays data provided bythe DB Connection Pools attributes.
v Most Used JCA Pools bar chart, which displays the average percent of the poolthat is in use for the interval. This view displays data provided by the J2CConnection Pools attributes.
v JVM Health - CPU Used % graph, which displays the percentage of the CPUused by the Java Virtual Machine (JVM) during the interval. This view displaysdata provided by the application server attributes.
v JVM Health - Heap Used % graph, which displays the current heap usage forthe monitored JVM. This view displays data provided by the Garbage CollectionAnalysis attributes.
v JVM Health - GC Active Time % graph, which displays the percentage of realtime that the garbage collector was active during the interval. This view displaysdata provided by the Garbage Collection Analysis attributes.
Accessing the Backend Tier Analysis workspace
To access this workspace from the Application Health Summary workspace, usethe following procedures:v From the Application Health Summary report, right-click the link icon and from
the pop-up menu, click Backend Tier Analysis.
For additional information, see:v Organization of the predefined workspacesv Attribute groups used by the predefined workspaces
112 ITCAM Agents for WebSphere Applications, J2EE, and HTTP Servers: User Guide

Application Health History workspaceThe workspace displays the information about the historical health status of aselected application. By default, the history data is collected for the last 24 hours.
The workspace displays data provided by the Application Health Status attributes.
The predefined workspace contains:v Availability/Throughput - History graph, which displays average request
processing rate by application over the time. This view displays data providedby the Request Times and Rates attributes.
v Availability/Completion Rate - History graph, which displays the averagerequest completion rate by application over the time; Completion rate is definedas ratio of successfully completed requests count to the total count of requestsprocessed by application on the interval. This view displays data provided bythe Request Times and Rates attributes.
v Availability/Average Load- History graph, which displays the average numberof concurrent application requests over the time. This view displays dataprovided by the Request Times and Rates attributes.
v Response Time - History graph, which displays the average application responsetime over the time. This view displays data provided by the Request Times andRates attributes.
v Server Resources/CPU Used - History graph, which displays the percent of CPUtime used by the application JVM process over the time. This view displays dataprovided by the application server attributes.
v Server Resources/Paging Rate - History graph, which displays the systempaging rate in kilobytes per second over the time. This view displays dataprovided by the application server attributes.
v Server Resources/GC Active Time - History graph, which displays thepercentage of total CPU time for which the garbage collector was active over thetime. This view displays data provided by the Garbage Collection Analysisattributes.
Accessing the Application Health History workspace
Complete the following steps to access this workspace from the Application HealthSummary:1. Click Application Health Summary report.2. Right-click the link icon to display the pop-up menu.3. Click Application Health history.
For additional information, see:v Organization of the predefined workspacesv Attribute groups used by the predefined workspaces
Web Tier Analysis workspaceThis workspace displays detailed information about the client tier health for aselected WebSphere application.
The client tier health indicator is derived from the following performance statistics:v Calculated application request delays inside Servlet/JSP or Portal container
compared against corresponding thresholds assigned in applicationconfiguration.
Chapter 3. ITCAM Agent for WebSphere Applications 113

v Completion rates for edge Servlet/JSP and Portal application requests.v Application server WebContainer thread pool utilization level.v PMI statistics for HTTP session counts by application.
This workspace displays data provided by the Application Health Status attributes.
The predefined workspace contains:v Web Tier Analysis report, which shows the overall health status of application
execution in web or portal containers. For Tivoli Enterprise Monitoring Agentrunning on z/OS, region ID can be found in the ASID column.
v Web Contain bar chart, which displays the current utilization level of the webContainer thread pool. This view displays data provided by the Thread Poolsattributes.
v HTTP Sessions - Average bar chart, which displays the average number ofconcurrently active and live HTTP session numbers for the selected applicationduring the interval. This view displays data provided by the Servlet Sessionsattributes.
v Worst Web Tier Delays bar chart, which displays the top 10 requests withbiggest delays (threshold violations) in the client tier. This view displays dataprovided by the Request Analysis attributes.
v Worst Web Tier Completion Rates bar chart, which displays the top 10Servlet/JSP/Portal edge requests with the worst completion rates. This viewdisplays data provided by the Request Analysis attributes.
v JVM Health - CPU Used % graph, which displays the percentage of the hostCPU used by the Java Virtual Machine (JVM) during the interval. This viewdisplays data provided by the application server attributes.
v JVM Health - Heap Used % graph, which displays the current heap usage forthe monitored JVM. This view displays data provided by the Garbage CollectionAnalysis attributes.
v JVM Health - GC Time % graph, which displays the percentage of real time thatthe garbage collector was active during the interval. This view displays dataprovided by the Garbage Collection Analysis attributes.
Accessing the Web Tier Analysis workspace
Complete the following steps to access this workspace from the Application HealthSummary:1. Click Application Health Summary report.2. Right-click the link icon and from the menu click Web Tier Analysis.
For additional information, see:v Organization of the predefined workspacesv Attribute groups used by the predefined workspaces
Selected Datasources - Datasource Trend workspaceThe Datasources Trend workspace displays information about datasourceconnections.
This workspace displays data provided by the Datasources attributes.
The predefined workspace contains the following items:
114 ITCAM Agents for WebSphere Applications, J2EE, and HTTP Servers: User Guide

v Current Datasources report displays datasource name, total wait time,connection rate, connection average wait time and connection max wait time.
v Total Wait Time Trend line chart displays the total time that applications had towait for a connection to the data source.
v Connection Rate Trend bar chart displays the number of connection requests(per second) created for the data source.
v Connection Average and Max Time Trend line chart displays the average time(in milliseconds) and the worst-case time (in milliseconds) that applications hadto wait for a connection.
Selected Request - Datasources workspaceThe Selected Request - Datasources workspace displays information about JDBCactivity performed by the request you selected in the primary Request Analysisworkspace.
This workspace displays data provided by the Selected Request attributes.
The predefined workspace contains the following items:v Worst Datasources Response Times bar chart, which shows the worst response
times (in milliseconds) for data sources accessed by this requestv Selected Request - Datasources report, which displays detailed information about
the data sources accessed for the selected request. For Tivoli EnterpriseMonitoring Agent running on z/OS, region ID can be found in the ASIDcolumn.
Accessing the Selected Request - Datasources workspace
To access this workspace from the Request Analysis workspace, use one of thefollowing procedures:v From the Requests - Current Interval report, right-click the link icon and from
the menu, click Selected Request - Datasources.v From Worst Average Response Times bar chart, right-click any bar; then, from
the menu, click Link To > Selected Request - Datasources.
For additional information, see:v Organization of the predefined workspacesv Attribute groups used by the predefined workspaces
Selected Request - JMS Queues workspaceThe Selected Request - JMS Queues workspace displays information about messagequeues owned by messaging middleware and accessed by the request that youselected in the primary Request Analysis workspace.
This workspace displays data provided by the Selected Request attributes.
The predefined workspace contains the following items:v Worst JMS Queues Response Times bar chart, which shows the worst response
times (in milliseconds) for JMS resources accessed by this requestv Selected Request - JMS Queues report, which displays detailed information
about the JMS resources accessed by the selected request. For Tivoli EnterpriseMonitoring Agent running on z/OS, region ID can be found in the ASIDcolumn.
Chapter 3. ITCAM Agent for WebSphere Applications 115

Accessing the Selected Request - JMS Queues workspace
To access this workspace from the Request Analysis workspace, use one of thefollowing procedures:v From the Requests - Current Interval report, right-click the link icon and from
the menu, click Selected Request - JMS Queues.v From Worst Average Response Times bar chart, right-click any bar; then, from
the menu, click Link To > Selected Request - JMS Queues.
For additional information, see:v Organization of the predefined workspacesv Attribute groups used by the predefined workspaces
Selected Request - Portal Processing workspaceThe Selected Request - Portal Processing workspace displays information aboutportlet, or portal page response times, or both, referenced by the request youselected in the primary Request Analysis workspace.
This workspace displays data provided by the Selected Request attributes.
Note: This workspace appears under all WebSphere application servers, but it hasdata only under the WebSphere Portal Server.
The predefined workspace contains the following items:v Worst Portal Processing Response Times bar chart, which shows the worst
response times (in milliseconds) for portal sources accessed by this requestv Selected Request - Portal Processing report, which displays detailed information
about the portal sources accessed for the selected request. For Tivoli EnterpriseMonitoring Agent running on z/OS, region ID can be found in the ASIDcolumn.
Accessing the Selected Request - Portal Processing workspace
To access this workspace from the Request Analysis workspace, use one of thefollowing procedures:v From the Requests - Current Interval report, right-click the link and from the
menu, click Selected Request - Portal Processing.v From Worst Average Response Times bar chart, right-click any bar; then, from
the menu, click Link To > Selected Request - Portal Processing.
For additional information, see:v Organization of the predefined workspacesv Attribute groups used by the predefined workspaces
Selected Request - Resource Adapters workspaceThe Selected Request - Resource Adapters workspace displays response-timeinformation about the J2C resources adapters referenced by the request youselected in the primary Request Analysis workspace.
This workspace displays data provided by the Selected Request attributes.
The predefined workspace contains the following items:
116 ITCAM Agents for WebSphere Applications, J2EE, and HTTP Servers: User Guide

v Worst Average Response Times bar chart, which shows the worst-performing J2Cresource adapter nested requests, in milliseconds
v Selected Request - Resource Adapters report, which displays detailedinformation about each J2C resource adapter that was accessed by the selectedrequest. For Tivoli Enterprise Monitoring Agent running on z/OS, region ID canbe found in the ASID column.
Accessing the Selected Request - Resource Adapters workspace
To access this workspace from the Request Analysis workspace, use one of thefollowing procedures:v From the Requests - Current Interval report, right-click the link icon and from
the menu, click Selected Request - Resource Adapters.v From Worst Average Response Times bar chart, right-click any bar; then, from
the menu, click Link To > Selected Request - Resource Adapters.
For additional information, see:v Organization of the predefined workspacesv Attribute groups used by the predefined workspaces
Selected Request - Service Components workspaceThe Selected Request - Service Components workspace displays information aboutService Component Architecture (SCA) activity performed by the request youselected in the primary Request Analysis workspace.
This workspace displays data provided by the Selected Request attributes.
The predefined workspace contains the following items:v Worst Service Components Response Times bar chart, which shows the worst
response times (in milliseconds) for data sources accessed by this requestv Selected Request - Service Components report, which displays detailed
information about the data sources accessed for the selected request. For TivoliEnterprise Monitoring Agent running on z/OS, region ID can be found in theASID column.
Accessing the Selected Request - Service Componentsworkspace
To access this workspace from the Request Analysis workspace, use one of thefollowing procedures:v From the Requests - Current Interval report, right-click the link icon and from
the menu, click Selected Request - Service Components.v From Worst Average Response Times bar chart, right-click any bar; then, from
the menu, click Link To > Selected Request - Service Components.
For additional information, see:v Organization of the predefined workspacesv Attribute groups used by the predefined workspaces
Service Component Elements workspaceThis workspace lists performance metrics for all the service components and theirelements. Service components contain one or more elements, which are sets of
Chapter 3. ITCAM Agent for WebSphere Applications 117

different steps processed in each service component. In turn, each element has itsown set of event natures, which are key points that are reached when processing aservice component element.
This workspace displays data provided by the Service Component Elementsattributes.
Note:
v This workspace reports blanks for resource data on the first invocation if PMIdata collection is configured for on-demand sampling (that is, if your site setconfiguration value Resource Data Collection Method to On Demand) or if youhave not yet run applications that generate PMI resource data. To reportresource data in this workspace after installing and configuring the datacollector, use the WebSphere administrative console to set the appropriate PMIinstrumentation level.
v Because of high processor usage, the Tivoli Enterprise Monitoring Agentprovides on-demand sampling by default. To activate PMI monitoring, you mustfirst select this workspace and then select it again later. Each time you select theworkspace, it displays the data collected during the interval between selections.
The predefined workspace contains the following items:v Worst Service Times bar chart, which shows the numbers of the Average
Response Time in millisecondsv Most Invocations bar chart, which shows the numbers of the invocations per
secondv Most Failures bar chart, which shows the numbers of the failed invocation
countsv Service Component Elements report, which shows aggregated data about the
average response time, failed count, success count, error rate, and request rate.
Accessing the Service Component Elements workspace
To access this workspace from the Service Components workspace, use one of thefollowing procedures:v Within the Navigator, right-click the Service Components entry; then, from the
menu, click Workspace > Service Component Elements.v From the primary Tivoli Enterprise Portal menu, click View > Workspace >
Service Component Elements.
For additional information, see:v Organization of the predefined workspacesv Attribute groups used by the predefined workspaces
Selected Request - History workspaceThe Selected Request - History workspace displays information about historicalrequest instances for the named request you selected in the primary RequestAnalysis workspace.
This workspace displays data provided by the Selected Request attributes.
The predefined workspace contains the following items:
118 ITCAM Agents for WebSphere Applications, J2EE, and HTTP Servers: User Guide

v Selected Request Response Times - History bar chart, which shows the averageresponse times (in milliseconds) spent within various request types in instancesof this named request.
v Selected Request - History sources report, which displays detailed informationabout historical request instances for the selected request.
Click the icon to select a time span. The item displays the data for the selectedtime span.
Accessing the Selected Request - data sources workspace
To access this workspace from the Request Analysis workspace, use one of thefollowing procedures:v From the Requests - Current Interval report, right-click the link icon and select
Selected Request - History.v From Worst Average Response Times bar chart, right-click any bar and select
Link To > Selected Request - History.
For additional information, see:v Organization of the predefined workspacesv Attribute groups used by the predefined workspaces
Service Components workspaceThis workspace provides overview performance of the key service components.WebSphere servers feature their own service components, and each of thesecomponents has its own set of event points that can be monitored.
This workspace displays data provided by both the Service Components attributes.This workspace is available only for WebSphere Process Server and WebSphereESB Server.
Note:
v This workspace reports blanks for resource data on the first invocation if PMIdata collection is configured for on-demand sampling (that is, if your site setconfiguration value Resource Data Collection Method to On Demand) or if youhave not yet run applications that generate PMI resource data. To reportresource data in this workspace after installing and configuring the datacollector, use the WebSphere administrative console to set the appropriate PMIinstrumentation level.
v Because of high processor usage, the Tivoli Enterprise Monitoring Agentprovides on-demand sampling by default. To activate PMI monitoring, you mustfirst select this workspace and then select it again later. Each time you select theworkspace, it displays the data collected during the interval between selections.
The predefined workspace contains the following items:v Service Component Architecture - History graph, which shows historical bad
request count, the instrumentation level, set instrumentation level type, andsummary, when the component name of the service is Service ComponentArchitecture
v Business Rules - History graph, which shows historical bad request count, theinstrumentation level, set instrumentation level type, and summary, when thename is Business Rules
Chapter 3. ITCAM Agent for WebSphere Applications 119

v Map - History graph, which shows historical bad request count, theinstrumentation level, set instrumentation level type, and summary, when thename is Map
v Mediation - History graph, which shows historical bad request count, theinstrumentation level, set instrumentation level type, and summary, when thename is Mediation
v Business State Machine - History graph, which shows historical bad requestcount, the instrumentation level, set instrumentation level type, and summary,when the name is Business State Machine
v Selector - History graph, which shows historical bad request count, theinstrumentation level, set instrumentation level type, and summary, when thename is Selector
v Bad Requests report, which displays a summary of the bad request counts
Accessing the Service Components workspace
To access this workspace, complete the following steps:1. Within the Navigator, expand Windows Systems, Linux Systems, z/OS
Systems, or UNIX Systems, as appropriate for the node you are monitoring.2. Within the node list, expand the entry that corresponds to the node that you
want to select.3. Within that node list of monitored applications, expand the list of WebSphere
agents.4. Within the list of available agents, expand the WebSphere application server of
your choice.5. Within that server list of available WebSphere application server workspaces,
click the Service Components entry.
For additional information, see:v Organization of the predefined workspacesv Attribute groups used by the predefined workspaces
Servlets/JSPs - Selected Web Application workspaceThis workspace displays statistical data regarding the servlets and JSPs invoked bya single Web application.
This workspace displays data provided by the Servlets JSPs attributes.
Note:
v This workspace reports blanks for resource data on the first invocation if PMIdata collection is configured for on-demand sampling (that is, if your site setconfiguration value Resource Data Collection Method to On Demand) or if youhave not yet run applications that generate PMI resource data. To reportresource data in this workspace after installing and configuring the datacollector, use the WebSphere administrative console to set the appropriate PMIinstrumentation level.
v Because of high processor usage, the Tivoli Enterprise Monitoring Agentprovides on-demand sampling by default. To activate PMI monitoring, you mustfirst select this workspace and then select it again later. Each time you select theworkspace, it displays the data collected during the interval between selections.
The predefined workspace contains the following items:
120 ITCAM Agents for WebSphere Applications, J2EE, and HTTP Servers: User Guide

v Worst Servlet/JSP Response Times bar chart, which displays the worst averageresponse times (in milliseconds) for servlets and JSP invoked by the selectedweb application
v Most Popular Servlet/JSP bar chart, which shows the servlet and JSP exceptionand request rates (in events per second) for the selected application
v Worst Servlet/JSP Error Rates bar chart, which shows the worst servlet and JSPerror rates for the selected application during the interval
v Servlets/JSPs - Selected Web Application report, which displays performanceinformation about the servlets and JSPs invoked by the application. For example,this report displays the average number of concurrent requests for a servlet andthe amount of time it takes a servlet to respond to a request
Accessing the Servlets/JSPs - Selected Web Applicationworkspace
To access this workspace from the Web Applications workspace, use one of thefollowing procedures:v From the Web Applications report, right-click the link icon and from the menu,
click Servlets/JSPs - Selected Web Application.v From the Worst Response Times bar chart, the Most Popular Web Applications
bar chart, or the Worst Error Rates bar chart, right-click any bar; then, from themenu, click Link To > Servlets/JSPs - Selected Enterprise Application.
For additional information, see:v Organization of the predefined workspacesv Attribute groups used by the predefined workspaces
Scheduler workspaceThe Scheduler workspace contains data for the Scheduler service. The schedulerservice schedules and tracks the starting and stopping of applications.
This workspace displays data provided by the Scheduler attributes.
Note:
v This workspace reports blanks for resource data on the first invocation if PMIdata collection is configured for on-demand sampling (that is, if your site setconfiguration value Resource Data Collection Method to On Demand) or if youhave not yet run applications that generate PMI resource data. To reportresource data in this workspace after installing and configuring the datacollector, use the WebSphere administrative console to set the appropriate PMIinstrumentation level.
v Because of high processor usage, the Tivoli Enterprise Monitoring Agentprovides on-demand sampling by default. To activate PMI monitoring, you mustfirst select this workspace and then select it again later. Each time you select theworkspace, it displays the data collected during the interval between selections.
The predefined workspace contains the following items:v Highest Task Failures bar chart, which shows the number of the task failure
count. The y-axis headings correspond to the row number of the Schedulerreport
v Highest Completed Tasks bar chart, which shows the number of the taskfinished count. The y-axis headings correspond to the row number of theScheduler report
Chapter 3. ITCAM Agent for WebSphere Applications 121

v Schedulers report, which displays information about the scheduler data,including task finish count, task failure count, task expiration rate, task finishrate, and task run rate
Accessing the Scheduler workspace
To access this workspace, complete the following steps:1. Within the Navigator, expand Windows Systems, Linux Systems, z/OS
Systems, or UNIX Systems, as appropriate for the node you are monitoring.2. Within the node list, expand the entry that corresponds to the node that you
want to select.3. Within that node list of monitored applications, expand the list of WebSphere
agents.4. Within the list of available agents, expand the WebSphere application server of
your choice.5. Within that server list of available WebSphere application server workspaces,
click the Scheduler entry.
For additional information, see:v Organization of the predefined workspacesv Attribute groups used by the predefined workspaces
Sessions workspaceThis workspace displays information about servlet sessions.
A session is a series of requests to a servlet, originating from the same user at thesame browser. Applications running in a web container can use these sessions totrack individual users. This workspace displays data provided by the ServletSessions attributes.
Note:
v This workspace reports blanks for resource data on the first invocation if PMIdata collection is configured for on-demand sampling (that is, if your site setconfiguration value Resource Data Collection Method to On Demand) or if youhave not yet run applications that generate PMI resource data. To reportresource data in this workspace after installing and configuring the datacollector, use the WebSphere administrative console to set the appropriate PMIinstrumentation level.
v Because of high processor usage, the Tivoli Enterprise Monitoring Agentprovides on-demand sampling by default. To activate PMI monitoring, you mustfirst select this workspace and then select it again later. Each time you select theworkspace, it displays the data collected during the interval between selections.
The predefined workspace contains the following items:v Most Active Sessions bar chart, which shows the most frequently referenced
servlet sessions for each listed web applicationv Largest Total Session Object Sizes bar chart, which shows the total session object
sizes (in bytes) and the associated web applicationsv Servlet Sessions report, which shows usage data about the servlet sessions,
including the rates as which sessions are created and destroyed and their readand write times
122 ITCAM Agents for WebSphere Applications, J2EE, and HTTP Servers: User Guide

Accessing the Sessions workspace
To access this workspace from the Web Applications workspace, use one of thefollowing procedures:v Within the Navigator, right-click the Web Applications entry; then, from the
menu, click Workspace > Servlet Sessions.v From the primary Tivoli Enterprise Portal menu, click View > Workspace >
Servlet Sessions.
For additional information, see:v Organization of the predefined workspacesv Attribute groups used by the predefined workspaces
Thread Pools workspaceThis workspace reports information about the various thread pools that supportthe applications running in your Java Virtual Machine (JVM).
This workspace displays data provided by the Thread Pools attributes.
Note:
v This workspace reports blanks for resource data on the first invocation if PMIdata collection is configured for on-demand sampling (that is, if your site setconfiguration value Resource Data Collection Method to On Demand) or if youhave not yet run applications that generate PMI resource data. To reportresource data in this workspace after installing and configuring the datacollector, use the WebSphere administrative console to set the appropriate PMIinstrumentation level.
v Because of high processor usage, the Tivoli Enterprise Monitoring Agentprovides on-demand sampling by default. To activate PMI monitoring, you mustfirst select this workspace and then select it again later. Each time you select theworkspace, it displays the data collected during the interval between selections.
The predefined workspace contains the following items:v Highest Average Pool Sizes bar chart, which shows the largest thread pools in
the JVMv Average Thread Pool Usage bar chart, which shows the average active and free
threads for each thread poolv Thread Pools report, which shows information about the usage statistics for
thread pools that belong to a WebSphere application server, such as average andmaximum pool sizes and creation and destruction rates
Accessing the Thread Pools workspace
To access this workspace, complete the following steps:1. Within the Navigator, expand Windows Systems, Linux Systems, z/OS
Systems, or UNIX Systems, as appropriate for the node you are monitoring.2. Within the node list, expand the entry that corresponds to the node that you
want to select.3. Within that node list of monitored applications, expand the list of WebSphere
agents.4. Within the list of available agents, expand the WebSphere application server of
your choice.
Chapter 3. ITCAM Agent for WebSphere Applications 123

5. Within that server list of available WebSphere application server workspaces,click the Thread Pools entry.
For additional information, see:v Organization of the predefined workspacesv Attribute groups used by the predefined workspaces
Accessing the managing server visualization engine from theThread Pools workspace
Important: To use this functionality, you need ITCAM for Application DiagnosticsManaging Server.
In The Tivoli Enterprise Portal access the Thread Pools workspace. You can use theDiagnostic Server Activity Display link to access the managing servervisualization engine. For information about access requirements see “Prerequisitesfor access” on page 62.
1. In the Thread Pools window, right-click the choose link icon then clickDiagnostic JVM Thread Display.
2. If this is your first time to access the managing server visualization agentduring a session, you see a Welcome to the Application Monitor page.
3. Depending on the user setup configuration in your environment you mighthave to type your managing server visualization engine User Name andPassword. If you do, you need only to log in using your User Name andPassword once per session.
4. Click OK to display the Diagnostic JVM Thread Display page in themanaging server Visualization engine. You can use link to diagnose applicationproblems, for example, slow transactions or high response times.
5. The results relate directly to the context from where you launched the link inthe Tivoli Enterprise Portal. For more information about using the DiagnosticJVM Thread Display page and additional features, refer to the CompositeApplication Manager help within the managing server visualization engineInterface.
6. To return to the previous workspace in the Tivoli Enterprise Portal interface atany time choose from the following options:v From the Tivoli Enterprise Portal desktop client, including WebStart, click the
back arrow on the Portal toolbar.v From the Tivoli Enterprise Portal browser client, click the browser back
arrow.
For additional information, see:v “Workspace link to managing server visualization engine” on page 61v “Access the managing server visualization engine from the Tivoli Enterprise
Portal” on page 65
Thread Pool Trend workspaceThe Thread Pool Trend workspace displays information about thread pool size andusage.
This workspace displays data provided by the Selected Request attributes.
This predefined workspace contains the following items:
124 ITCAM Agents for WebSphere Applications, J2EE, and HTTP Servers: User Guide

v Current Thread Pool report displays thread pool name, average active threads,average pool size, percentage of time pool at max and average free threads.
v Average Pool Size Trend bar chart displays the average number of threads in thepool.
v Average Thread Pool Usage Trend bar chart displays the average percentage oftime that all threads were in use during the sampling interval.
v Percent of Time Pool Size at Max Trend bar chart displays the percentage of timethe pool size is running at the maximum value.
Accessing the Threadpool Trend workspace
Select the Thread Pools workspace, in the Thread Pools report, click the link icon,and select Thread Pool Trend.
For additional information, see:v Organization of the predefined workspacesv Attribute groups used by the predefined workspaces
Web Applications workspaceThis workspace displays information about the web applications running in JEEapplication servers.
This workspace displays data provided by the Web Applications attributes.
Note:
v The Web Applications workspace reports blanks for resource data on the firstinvocation if PMI data collection is configured for on-demand sampling (that is,if your site set configuration value Resource Data Collection Method to OnDemand) or if you have not yet run applications that generate PMI resourcedata. To report resource data in this workspace after installing and configuringthe data collector, use the WebSphere administrative console to set theappropriate PMI instrumentation level.
v Because of high processor usage, the Tivoli Enterprise Monitoring Agentprovides on-demand sampling by default. To activate PMI monitoring, you mustfirst select this workspace and then select it again later. Each time you select theworkspace, it displays the data collected during the interval between selections.
The predefined workspace contains the following items:v Worse Response Times bar chart, which shows the worst servlet response times
(in milliseconds) during the intervalv Most Popular Web Applications bar chart, which shows the servlet exception
and request rates (in events per second)v Worse Error Rates bar chart, which shows the worst servlet error rates during
the intervalv Web Applications report, which displays aggregated performance data for each
web application, about all servlets and JSPs deployed to that web application,including response and error rates, and response times.
Accessing the Web Applications workspace
To access this workspace, complete the following steps:
Chapter 3. ITCAM Agent for WebSphere Applications 125

1. Within the Navigator, expand Windows Systems, Linux Systems, z/OSSystems, or UNIX Systems, as appropriate for the node you are monitoring.
2. Within the node list, expand the entry that corresponds to the node that youwant to select.
3. Within that node list of monitored applications, expand the list of WebSphereagents.
4. Within the list of available agents, expand the WebSphere application server ofyour choice.
5. Within that server list of available WebSphere application server workspaces,click the Web Applications entry.
For additional information, see:v Organization of the predefined workspacesv Attribute groups used by the predefined workspaces
Accessing the managing server visualization engine from theWeb Applications workspace
Important: To use this functionality, you need ITCAM for Application DiagnosticsManaging Server.
In the Tivoli Enterprise Portal access the WebSphere Agent workspace. You canuse the Diagnostic Server Activity Display link to access the managing servervisualization engine. For information about access requirements, see “Prerequisitesfor access” on page 62.
1. In the Web Applications window, right-click the choose link icon thenclick Diagnostic Server Activity Display.
2. If this is your first time to access the managing server visualization agentduring a session, you see a Welcome to the Application Monitor page.
3. Depending on the user setup configuration in your environment you mighthave to type your managing server visualization engine User Name andPassword. If you do, you need to log in only once per session using your UserName and Password.
4. Click OK to display the Server Activity Display page in the managing serverVisualization engine. You can use link to diagnose application problems, forexample, slow transactions or high response times.
5. The results in this page relate directly to the context from where you launchedthe link in the Tivoli Enterprise Portal. For more information about using theServer Activity Display page and additional features, refer to the CompositeApplication Manager help within the managing server visualization agentInterface.
6. To return to the previous workspace in the Tivoli Enterprise Portal interface atany time choose from the following options:v From the Tivoli Enterprise Portal desktop client, including WebStart, click the
back arrow on the Portal toolbar.v From the Tivoli Enterprise Portal browser client, click the browser back
arrow.
For additional information, see:v “Workspace link to managing server visualization engine” on page 61
126 ITCAM Agents for WebSphere Applications, J2EE, and HTTP Servers: User Guide

v “Access the managing server visualization engine from the Tivoli EnterprisePortal” on page 65
Web Services workspaceThe Web Services workspace displays information about the data counters of theweb services.
The examples of the information include the number of loaded web services, thenumber of requests delivered and processed, the request response time, and theaverage size of requests. This workspace displays data provided by both the WebServices attributes and the Web Services Gateway attributes.
Note:
v This workspace reports blanks for resource data on the first invocation if PMIdata collection is configured for on-demand sampling (that is, if your site setconfiguration value Resource Data Collection Method to On Demand) or if youhave not yet run applications that generate PMI resource data. To reportresource data in this workspace after installing and configuring the datacollector, use the WebSphere administrative console to set the appropriate PMIinstrumentation level.
v Because of high processor usage, the Tivoli Enterprise Monitoring Agentprovides on-demand sampling by default. To activate PMI monitoring, you mustfirst select this workspace and then select it again later. Each time you select theworkspace, it displays the data collected during the interval between selections.
The predefined workspace contains:v Worst Response Times bar chart, which displays the worst average response
times (in milliseconds) for the selected web servicesv Most Popular bar chart, which shows the exception and request rates (in events
per second) for the selected servicesv Web Services report, which displays aggregated performance data for each web
service, including requests, response times, and payload sizesv Web Service Gateway report, which displays aggregated performance data for
each Web service gateway, including the number of synchronous andasynchronous requests and responses
Accessing the Web Services workspace
To access this workspace, complete the following steps:1. Within the Navigator, expand Windows Systems, Linux Systems, z/OS
Systems, or UNIX Systems, as appropriate for the node you are monitoring.2. Within the node list, expand the entry that corresponds to the node that you
want to select.3. Within that node list of monitored applications, expand the list of WebSphere
agents.4. Within the list of available agents, expand the WebSphere application server of
your choice.5. Within that server list of available WebSphere application server workspaces,
click the Web Services entry.
Chapter 3. ITCAM Agent for WebSphere Applications 127

Selected Web Services - History workspace
The Selected Web Services - History workspace displays the historical informationthat corresponds to the information in the Web Services workspace for a selectedweb service. Historical information is collected over a particular measured timespan. See the online help for Tivoli Enterprise Portal for a detailed explanation ofhistorical reporting.
Accessing the Selected Web Services - History workspace
To access this workspace from the Web Services workspace, use one of thefollowing procedures:v From the Web Services report, right-click the link icon and from the menu, click
Selected Web Services - History.v From the Worst Response Times bar chart, or the Most Popular bar chart,
right-click any bar; then, from the menu, click Link To > Selected Web Services- History.
For additional information, see:v Organization of the predefined workspacesv Attribute groups used by the predefined workspaces
WebSphere Agent workspaceThis workspace displays product events that affect the ability of the WebSphereapplication server agent to collect data.
This workspace displays events occurring within the WebSphere application serveragent and WebSphere application servers that are installed on the host computer. Italso displays the status of the Tivoli Enterprise Monitoring Agent. The predefinedworkspace contains the following items:v Agent Events report, which displays information about agent-level events that
affect the ability of the Tivoli Enterprise Monitoring Agent to collect data for theWebSphere application server. You can use this view to see exception and errormessages, their IDs, and their severity.The Agent Events report also shows the result of issuing a Take Actioncommand. Place your cursor over a truncated message to display the text of thecomplete messageThis report displays data reported by the WebSphere Agent Events attributes.
v Application Servers Summary report displays information about status of theWebSphere server.This report displays data reported by the application server Status attributes.
Accessing the WebSphere Agent workspace
To access this workspace, complete the following steps:1. Within the Navigator, expand Windows Systems, Linux Systems, z/OS
Systems, or UNIX Systems, as appropriate for the node you are monitoring.2. Within the node list, expand the entry that corresponds to the node that you
want to select.
128 ITCAM Agents for WebSphere Applications, J2EE, and HTTP Servers: User Guide

3. Within that node list of available Tivoli Enterprise Monitoring Agents, if theWebSphere Agent entry has a name next to it (for example, WebSphere Agent- Primary), click the entry. Otherwise, expand the entry and click one of theagent names.
For additional information, see:v Organization of the predefined workspacesv Attribute groups used by the predefined workspaces
Accessing the managing server visualization engine from theWebSphere Agent workspace
Important: To use this functionality, you need ITCAM for Application DiagnosticsManaging Server.
In the Tivoli Enterprise Portal access the WebSphere agent workspace. You can usethe Diagnostic Server Activity Display or the Diagnostic In-flight RequestSearch link to access the managing server visualization engine. For informationabout access requirements, see “Prerequisites for access” on page 62.1. In the Applications Server Summary window, right-click the choose link icon
then click Diagnostic Server Activity Display or Diagnostic In-flightRequest Search.
2. If this is your first time to access the managing server visualization agent,during the session you see a Welcome to the Application Monitor page.
3. Depending on the user setup configuration in your environment, you mighthave to type your managing server visualization engine User Name andPassword. If you do, you need to log in only once per session using your UserName and Password.
4. Click OK to display the relevant page in the managing server Visualizationengine.v If you click Diagnostic In-flight Request Search you see the In-Flight
Request Search page in managing server visualization engine.v If you click Diagnostic Server Activity Display you see the Server Activity
Display page in the managing server visualization engine.5. The information in both of these pages relates directly to the context from
where you launched the link in the Tivoli Enterprise Portal.6. To return to the previous workspace in the Tivoli Enterprise Portal interface at
any time choose from the following options:v From the Tivoli Enterprise Portal desktop client, including WebStart, click the
back arrow on the Portal toolbar.v From the Tivoli Enterprise Portal browser client, click the browser back
arrow.
For additional information, see:v “Workspace link to managing server visualization engine” on page 61v “Access the managing server visualization engine from the Tivoli Enterprise
Portal” on page 65
WebSphere application server workspaceThe WebSphere application server workspace displays overall statistics for eachapplication server being monitored by the Tivoli Enterprise Monitoring Agent.
Chapter 3. ITCAM Agent for WebSphere Applications 129

The predefined workspace contains the following items:v Heap Usage - History bar chart, which displays free memory size and used
memory size (in kilobytes) within the WebSphere application server heap overtime. The chart flyovers display the exact valuesThis view displays data provided by the Garbage Collection Analysis attributes.
v Response Time - History graph, which shows the server response time torequests over timeThis view displays data provided by the Request Times and Rates attributes.
v Request Rate - History graph, which shows the rate at which requests have beenreceived by this server over timeThis view displays data provided by the Request Times and Rates attributes.
v Percent CPU Used - History graph, which shows the percentage of the CPU thatthis server used over timeThis view displays data provided by the application server attributes.
v Application server Summary report, which displays overall information aboutthis WebSphere application server, including JVM statistics and CPU usagestatisticsThis view displays data provided by the application server attributes. In theapplication server summary report, each row represents a different region. Whenyou right-click the link for a row, you can choose to go to Selected Region -application server Summary, Selected Region - Request Analysis, Selected Region- Application Health Status, Selected Region - Datasources, Selected Region - LogAnalysis or Selected Region - JMS Summary. All these links are disabled whenTivoli Enterprise Monitoring Agent is running on Distributed data collector andenabled when Tivoli Enterprise Monitoring Agent is running on z/OS datacollector.
Accessing the WebSphere application server workspace
Complete the following steps to access this workspace:1. Within the Navigator, expand Windows Systems, Linux Systems, z/OS
Systems, or UNIX Systems, as appropriate for the node you are monitoring.2. Within the node list, expand the entry that corresponds to the node that you
want to select.3. Within that node list of monitored applications, expand the list of WebSphere
agents.4. Within the list of available agents, click the WebSphere App Server entry of
your choice.
For more information, see:v Organization of the predefined workspacesv Attribute groups used by the predefined workspaces
WebSphere ESB Server workspaceThe WebSphere ESB Server workspace displays overall statistics for eachapplication server being monitored by the Tivoli Enterprise Monitoring Agent.
The predefined workspace contains the following items:v Heap Usage - History bar chart, which displays free memory size and used
memory size (in kilo bytes) within the WebSphere application server heap overtime. The chart flyovers display the exact values
130 ITCAM Agents for WebSphere Applications, J2EE, and HTTP Servers: User Guide

This view displays data provided by the Garbage Collection Analysis attributes.v Response Time - History graph, which shows the server response time to
requests over timeThis view displays data provided by the Request Times and Rates attributes.
v Request Rate - History graph, which shows the rate at which requests have beenreceived by this server over timeThis view displays data provided by the Request Times and Rates attributes.
v Percent CPU Used - History graph, which shows the percentage of the CPU thatthis server consumed over timeThis view displays data provided by the application server attributes.
v Application server summary report, which displays overall information aboutthis WebSphere application server, including JVM statistics and CPU usagestatisticsThis view displays data provided by the application server attributes.
Accessing the WebSphere ESB Server workspace
To access this workspace, complete the following steps:1. Within the Navigator, expand Windows Systems, Linux Systems, z/OS
Systems, or UNIX Systems, as appropriate for the node you are monitoring.2. Within the node list, expand the entry that corresponds to the node that you
want to select.3. Within that node list of monitored applications, expand the list of WebSphere
agents.4. Within the list of available agents, click the WebSphere ESB Server entry of
your choice.
For more information, see:v Organization of the predefined workspacesv Attribute groups used by the predefined workspaces
WebSphere Portal Server workspaceThe WebSphere Portal Server workspace displays overall statistics for eachapplication server being monitored by the Tivoli Enterprise Monitoring Agent.
The predefined workspace contains the following items:v Heap Usage - History bar chart, which displays free memory size and used
memory size (in kilo bytes) within the WebSphere application server heap overtime. The chart flyovers display the exact valuesThis view displays data provided by the Garbage Collection Analysis attributes.
v Response Time - History graph, which shows the server response time torequests over timeThis view displays data provided by the Request Times and Rates attributes.
v Request Rate - History graph, which shows the rate at which requests have beenreceived by this server over timeThis view displays data provided by the Request Times and Rates attributes.
v Percent CPU Used - History graph, which shows the percentage of the CPU thatthis server consumed over timeThis view displays data provided by the application server attributes.
Chapter 3. ITCAM Agent for WebSphere Applications 131

v Application server summary report, which displays overall information aboutthis WebSphere application server, including JVM statistics and CPU usagestatisticsThis view displays data provided by the application server attributes. In theapplication server summary report, each row represents a different region. Whenyou right-click the link for a row, you can choose to go to Selected Region -application server Summary, Selected Region - Request Analysis, Selected Region- Application Health Status, Selected Region - Datasources, Selected Region - LogAnalysis, Selected Region - JMS Summary, Selected Region - Portal Summary,Selected Region - Portlet Summary. All these links are disabled when TivoliEnterprise Monitoring Agent is running on Distributed data collector andenabled when Tivoli Enterprise Monitoring Agent is running on z/OS datacollector.
Accessing the WebSphere Portal Server workspace
To access this workspace, complete the following steps:1. Within the Navigator, expand Windows Systems, Linux Systems, z/OS Systems
or UNIX Systems, as appropriate for the node you are monitoring.2. Within the node list, expand the entry that corresponds to the node that you
want to select.3. Within that node list of monitored applications, expand the list of WebSphere
agents.4. Within the list of available agents, click the WebSphere Portal Server entry of
your choice.
For more information, see:v Organization of the predefined workspacesv Attribute groups used by the predefined workspaces
WMQ Client Link Communications workspaceThis workspace provides aggregated counter statistics for all of the clients of WMQQueue Managers that are or have been connected to this application server.WebSphere application server 5.1 based products do not support this workspace.
This workspace displays data provided by the WMQ Client Link Communicationsattributes.
Important:
v This workspace reports blanks for resource data on the first invocation if PMIdata collection is configured for on-demand sampling (that is, if your site setconfiguration value Resource Data Collection Method to On Demand) or if youhave not yet run applications that generate PMI resource data. To reportresource data in this workspace after installing and configuring the datacollector, use the WebSphere administrative console to set the appropriate PMIinstrumentation level.
v Because of high processor usage, the Tivoli Enterprise Monitoring Agentprovides on-demand sampling by default. To activate PMI monitoring, you mustfirst select this workspace and then select it later. Each time you select theworkspace, it displays the data collected during the interval between selections.
The predefined workspace contains the following items:
132 ITCAM Agents for WebSphere Applications, J2EE, and HTTP Servers: User Guide

v WMQ Client Link Communication Errors - History graph, which shows thenumber of errors that have caused connections to WMQ JMS clients to bedropped
v WMQ Client Link Statistics report, which displays information about themessaging engine communications, including batch sent, message sent, messagereceived, comm errors, writes blocked, and reads blocked
Accessing the WMQ Client Link Communications workspace
To access this workspace from the Platform Messaging workspace, use one of thefollowing procedures:v Within the Navigator, right-click the Platform Messaging entry; then, from the
menu, click Workspace > WMQ Client Link Communications.v From the primary Tivoli Enterprise Portal menu, click View > Workspace >
WMQ Client Link Communications.
For additional information, see:v Organization of the predefined workspacesv Attribute groups used by the predefined workspaces
WMQ Link Communications workspaceThis workspace provides aggregated counter statistics for all of the WMQ QueueManagers that are or have been connected to this application server. WebSphereapplication server 5.1 based products do not support this workspace.
This workspace displays data provided by the WMQ Link Communicationsattributes.
Important:
v This workspace reports blanks for resource data on the first invocation if PMIdata collection is configured for on-demand sampling (that is, if your site setconfiguration value Resource Data Collection Method to On Demand) or if youhave not yet run applications that generate PMI resource data. To reportresource data in this workspace after installing and configuring the datacollector, use the WebSphere administrative console to set the appropriate PMIinstrumentation level.
v Because of high processor usage, the Tivoli Enterprise Monitoring Agentprovides on-demand sampling by default. To activate PMI monitoring, you mustfirst select this workspace and then select it again later. Each time you select theworkspace, it displays the data collected during the interval between selections.
The predefined workspace contains the following items:v WMQ Link Communication Errors - History graph, which shows the historical
number of communication errors that resulted in the disconnection of a networkconnection to a WMQ Queue Manager
v WMQ Link Statistics report, which displays information about the messagingengine communications, including batches sent, batches received, message sent,message received, and comm errors
Accessing the WMQ Link Communications workspace
To access this workspace from the Platform Messaging workspace, use one of thefollowing procedures:
Chapter 3. ITCAM Agent for WebSphere Applications 133

v Within the Navigator, right-click the Platform Messaging entry; then, from themenu, click Workspace > WMQ Link Communications.
v From the primary Tivoli Enterprise Portal menu, click View > Workspace >WMQ Link Communications.
For additional information, see:v Organization of the predefined workspacesv Attribute groups used by the predefined workspaces
Workload Management workspaceThis workspace displays information about the Workload Management (WLM)server and about the WLM client that initiates workload requests to that server.
Workload management optimizes the distribution of client processing tasks.Incoming work requests are distributed to the application servers, enterprise beans,servlets, and other objects that can most effectively process the requests. Workloadmanagement also provides failover protection when servers are not available,improving application availability. In a WebSphere application server environment,you implement workload management using clusters, transports, and replicationdomains.
This workspace displays data provided by both the Workload Management Serverattributes and the Workload Management Client attributes.
Important:
v This workspace reports blanks for resource data on the first invocation if PMIdata collection is configured for on-demand sampling (that is, if your site setconfiguration value Resource Data Collection Method to On Demand) or if youhave not yet run applications that generate PMI resource data. To reportresource data in this workspace after installing and configuring the datacollector, use the WebSphere administrative console to set the appropriate PMIinstrumentation level.
v Because of high processor usage, the Tivoli Enterprise Monitoring Agentprovides on-demand sampling by default. To activate PMI monitoring, you mustfirst select this workspace and then select it again later. Each time you select theworkspace, it displays the data collected during the interval between selections.
The predefined workspace contains the following items:v WLM Server Incoming Requests bar chart, which shows the incoming strong
affinity requests and the incoming nonaffinity requests (per second)v WLM Client Outgoing Requests bar chart, which shows the outgoing requests
(per second)v Workload Management Server report, which shows detailed information about
the WLM server, such as incoming requests and clients servedv Workload Management Client report, which shows information about the clients
that initiate workload requests, such as outgoing requests and response times
Accessing the Workload Management workspace
To access this workspace, complete the following steps:1. Within the Navigator, expand Windows Systems, Linux Systems, or UNIX
Systems, as appropriate for the node you are monitoring.
134 ITCAM Agents for WebSphere Applications, J2EE, and HTTP Servers: User Guide

2. Within the node list, expand the entry that corresponds to the node that youwant to select.
3. Within that node list of monitored applications, expand the list of WebSphereagents.
4. Within the list of available agents, expand the WebSphere application server ofyour choice.
5. Within that server list of available WebSphere application server workspaces,click the Workload Management entry.
For additional information, see:v Organization of the predefined workspacesv Attribute groups used by the predefined workspaces
Workplace Mail workspaceThis workspace provides aggregated statistics of the usage information about theincoming message traffic.
This workspace displays data provided by the Workplace Mail Service attributes.
Important:
v This workspace reports blanks for resource data on the first invocation if PMIdata collection is configured for on-demand sampling (that is, if your site setconfiguration value Resource Data Collection Method to On Demand) or if youhave not yet run applications that generate PMI resource data. To reportresource data in this workspace after installing and configuring the datacollector, use the WebSphere administrative console to set the appropriate PMIinstrumentation level.
v Because of high processor usage, the Tivoli Enterprise Monitoring Agentprovides on-demand sampling by default. To activate PMI monitoring, you mustfirst select this workspace and then select it again later. Each time you select theworkspace, it displays the data collected during the interval between selections.
Important: This workspace does not support linking to ITCAM for ApplicationDiagnostics Managing Server visualization engine.
The predefined workspace contains the following items:v Connections bar chart, which displays the number of connections to the SMTP
server, SMTP client connections, and the maximum number of concurrent LDAPconnections during the sampling interval
v Workplace Mail report, which displays detailed information about the workplacemail connections
Accessing the Workplace Mail workspace
To access this workspace, complete the following steps:1. Within the Navigator, expand Windows Systems, Linux Systems, or UNIX
Systems, as appropriate for the node you are monitoring.2. Within the node list, expand the entry that corresponds to the node that you
want to select.3. Within that node list of monitored applications, expand the list of WebSphere
agents.
Chapter 3. ITCAM Agent for WebSphere Applications 135

4. Within the list of available agents, expand the WebSphere application server ofyour choice.
5. Within that server list of available WebSphere application server workspaces,click the Workplace Mail entry.
For additional information, see:v Organization of the predefined workspacesv Attribute groups used by the predefined workspaces
Region workspaces in a z/OS environmentFor z/OS installations, workspace tables report data at both a region and serverinstance level.
Important: ITCAM Agent for WebSphere Applications on z/OS is available inseparate product packages.
Note: ITCAM Agent for WebSphere Applications 7.2 is not available on z/OSThe advantage is that you can view metrics collected at both levels and switchbetween server instance level and region level. The following table lists theworkspaces that show information at both a region and server level.
All workspaces except the Garbage Collection Analysis workspace report data onboth levels. The Garbage collection analysis workspace does not have links to thetop-level workspaces.
Table 8. Workspaces and the Servant and Selected Regions in a z/OS environment
Workspace Table Name Link Name Description
WebSphere App Server -application serverSummary
WebSphere App Server -application serverSummary - SelectedRegion - application serverSummary
Selected Region -Application Health Status
Selected Region - RequestAnalysis
Selected Region - LogAnalysis
Selected Region - DataSources
Selected Region - JMS -Summary
This workspace displays data atregional level. Click the SelectedRegion links to accessregion-specific links to othertop-level workspaces. When aworkspace is linked from theapplication server summary youcan view specific drill-downmetrics. To view a report for anindividual region, see “Accessing aRegion workspace” on page 138
136 ITCAM Agents for WebSphere Applications, J2EE, and HTTP Servers: User Guide

Table 8. Workspaces and the Servant and Selected Regions in a z/OSenvironment (continued)
Workspace Table Name Link Name Description
Application Health -Application HealthSummary
Selected Application -Servant regions
Selected Application -Health History
Selected Application- WebTier Analysis
Selected Application - EJBTier Analysis
Selected Application -Backend Tier Analysis
Selected Application -Request Analysis
Selected Application -Configuration
In an z/OS environment, theApplication Health Summaryreport displays the total results forthe server instances. To viewreport results by region, click theWebSphere App Server -application server Summary tableand right-click a link icon in thetable to view the available options.
Request Analysis -Requests Current Interval
Selected Request -Datasource
Selected Request - JMSQueues
Selected Request -Resource Adaptors
Selected Request - History
Selected Request - ServantRegions
In an z/OS environment, whenyou select Request Analysis -Requests Current Interval, thisreport displays the total results forthe server instances. To view areport for an individual RequestAnalysis region, see “Accessing aRegion workspace” on page 138.
Garbage CollectionAnalysis - GarbageCollection Analysis
Selected Region - History
Garbage CollectionAnalysis - Servant Region(only available when youclick a [Summary] row)
For Garbage Collection Analysis,there is a summary report of allregions and there are also reportsby individual region.
Log Analysis - LogAnalysis
Selected Region - LogAnalysis
Log Analysis workspace. In az/OS environment, the log analysisworkspace reports data in twoways. When you select the Loganalysis workspace the reportdisplays JVM Log Analysis andDC message events from allregions. To view a report for anindividual log analysis region, see“Accessing a Region workspace”on page 138.
Data sources - Datasources - Current Interval
Selected Datasource
Selected Datasource -History
In an z/OS environment, thisreport displays the total results forthe server instances. To view areport for an individual Datasource region, see “Accessing aRegion workspace” on page 138.
Chapter 3. ITCAM Agent for WebSphere Applications 137

Table 8. Workspaces and the Servant and Selected Regions in a z/OSenvironment (continued)
Workspace Table Name Link Name Description
JMS Summary - JMSSummary - CurrentInterval JMS
Selected JMS - ServantRegions
In an z/OS environment, thisreport displays the total results forthe server instances. To view areport for an individual JMSSummary region, see“Accessing aRegion workspace.”
WebSphere Portal Server Selected Region - PortalServer Summary
In an z/OS environment, thisreport displays the total results forthe server instances. To view areport for an individual PortalServer summary, see “Accessing aRegion workspace”
Portal Summary Selected Region - PortalSummary
Selected Region - PortletSummary
Selected Portal Page -History
Selected Portlet - History
Selected Region - PortalPage Summary
In an z/OS environment reportdisplays the total results for theserver instances. To view a reportfor an individual region see“Accessing a Region workspace”
Accessing a Region workspace
To access this workspace, complete the following steps:1. In the Navigator, expand z/OS system, as appropriate for the node you are
monitoring.2. In the node list, expand the entry that corresponds to the node that you want
to select.3. In that node list of monitored agents, expand the list of the servers.4. In the list of available servers, click the WebSphere agent of your choice.5. In the list of available servers, select the Server of your choice.6. Right-click the selected Server node and select WebSphere App Server
workspace.7. Right-click a link icon in the application server Summary table to display
workspaces connected with the current region.8. Select the workspace of your choice from the following list:
v Selected Region application server Summaryv Selected Region - Application Health Statusv Selected Region - Request Analysisv Selected Region - Log Analysisv Selected Region - Data Sourcesv Selected Region - JMS - Summary
For additional information, see:
138 ITCAM Agents for WebSphere Applications, J2EE, and HTTP Servers: User Guide

v Organization of the predefined workspacesv Attribute groups used by the predefined workspaces
Attributes for ITCAM Agent for WebSphere ApplicationsIBM Tivoli Composite Application Manager Agent for WebSphere Applications is aTivoli Enterprise Monitoring Agent that resides within your distributed systems.This agent gathers data about running WebSphere application server processes thathave been collected and stored by the ITCAM Data Collector for WebSphere, andstores those data in elements called attributes. Each attribute is a characteristic ofan object. For example, the Receive Count attribute in the JMS Summary attributegroup counts the number of messages your applications have retrieved from JMSmessages queues.
Attribute groups
The IBM Tivoli Composite Application Manager Agent for WebSphere Applicationsattributes are organized into groups of related items. These attribute groupscomprise the attribute tables for this agent. For example, the Garbage CollectionAnalysis attribute group provides information about the frequency with which theJava Virtual Machine (JVM) invokes its garbage collector.
Attributes and workspaces
Within the Tivoli Enterprise Portal workspaces, these attributes are displayed in,and correspond to, the columns in the reports and the items in the graphicdisplays for charts and graphs. You can use the collected data to analyze andmonitor the performance of your WebSphere application servers and theapplications running within them. For an overview of the correlations between thepredefined workspaces and the attribute groups, see Attribute Groups Used by thePredefined Workspaces.
Attributes and situations
Various attributes are referenced by the predefined situations of the product. Youcan also use the IBM Tivoli Composite Application Manager Agent for WebSphereApplications attributes to create your own situations to monitor the performance ofyour WebSphere application servers and their applications. These situations canmonitor your WebSphere application server resources or correlate multipleconditions to alert you to problems that might have occurred when attribute valuesexceed defined thresholds.
Attribute groups used by the predefined workspacesA workspace contains graphical data or report columns that correspond directly toparticular attributes in an attribute group. The following table shows thecorrelations between the predefined workspaces and the attribute groups. Theprimary and secondary workspaces, are listed alphabetically, not in the order inwhich they appear in the Navigator.
Table 9. Workspaces and the attribute groups they reference
Workspace Related Attribute Groups
Application Health Summary Application Health Status
Application Registry Application Monitoring Configuration
Allocation Failures Allocation Failure
Chapter 3. ITCAM Agent for WebSphere Applications 139

Table 9. Workspaces and the attribute groups they reference (continued)
Workspace Related Attribute Groups
Cache Analysis Dynamic CacheDynamic Cache Templates
Client Communications Client Communications
Container Object Pools Container Object Pools
Container Transactions Container Transactions
DatasourcesSelected Datasource - History
Datasources
DB Connection PoolsSelected DB Connection Pool - History
DB Connection Pools
DCS Stacks DCS Stack Counter
Destinations Topic SpacesQueue
Durable Subscriptions Durable Subscriptions
EJB Containers EJB Containers
Enterprise Java Beans Enterprise Java Beans
Garbage Collections - Selected AllocationFailure
Garbage Collection Cycle
Garbage Collector Analysis Garbage Collection Analysis
High Availability Manager High Availability Manager
IMAP/POP Workplace Mail IMAP/POP
J2C Connection Pools J2C Connection Pools
JMS Summary JMS Summary
Log Analysis Log Analysis
Lotus application serverRequest Times and RatesGarbage Collection Analysis
Messages Queues Workplace Mail Queues
Messaging Engine Communications Messaging Engine Communications
Platform Messaging Messaging Engines
Pool Analysis Thread PoolsDB Connection PoolsJ2C Connection Poolsapplication server
Portal Pages SummarySelected Portal Page - History
Portal Page Summary
Portal Summary Portal Summary
Portlet SummarySelected Portlet - History
Portlet Summary
Request AnalysisSelected Request - History
Request Analysis
Selected Request - Baseline Baseline
“Selected Request - Service Componentsworkspace” on page 117
Selected Request
Scheduler Scheduler
140 ITCAM Agents for WebSphere Applications, J2EE, and HTTP Servers: User Guide

Table 9. Workspaces and the attribute groups they reference (continued)
Workspace Related Attribute Groups
Selected Application - Application TierAnalysisSelected Application - Backend TierAnalysisSelected Application - Health HistorySelected Application - Client TierAnalysis
Application Health Status
Selected Application - Configuration Application Monitoring Configuration
Selected Request - Datasources Selected Request
Selected Request - JMS Queues Selected Request
Selected Request - Resource Adapters Selected Request
Servlets/JSPs - Selected Web Application Servlets JSPs
Sessions Servlet Sessions
Thread Pools Thread Pools
Web Applications Web Applications
Web ServicesSelected Web Services - History
Web Services CountersWeb Services Gateway Counters
WebSphere Agent WebSphere Agent Eventsapplication server Status“Remote Configuration Requests attributes” onpage 224
WebSphere App Server application serverRequest Times and RatesGarbage Collection Analysis
WebSphere ESB Server application serverRequest Times and RatesGarbage Collection Analysis
WebSphere Portal Server application serverRequest Times and RatesGarbage Collection Analysis
WebSphere Process Server application serverRequest Times and RatesGarbage Collection Analysis
WMQ Client Link Communications WMQ Client Link Communications
WMQ Link Communications WMQ Link Communications
Workload Management Workload Management ClientWorkload Management Server
Workplace Mail Workplace Mail Service
Alarm Manager attributesThe Alarm Manager attributes provide information for the alarm management.Use these attributes to manage alarms fired by the application for each workmanager.
The attributes within this group are used to build the Alarm Manager workspace.
Important:
Chapter 3. ITCAM Agent for WebSphere Applications 141

v The attributes within this attribute group contain zeros for performance data ifyour site has set configuration value Resource Data Collection Method to OnDemand (for on-demand sampling) and if you have not yet run applications thatgenerate performance data. To report performance data in these attributes afterinstalling and configuring the data collector, use the WebSphere administrativeconsole to set the appropriate PMI instrumentation level.
v The Tivoli Enterprise Monitoring Agent is set by default to provide on-demandsampling; thus the attributes within this attribute group initially contain zerosuntil you select the workspace and then select it again later. Each time you selectthe workspace, these attributes are updated with the latest data.
Tip: For information about WebSphere PMI metrics, see “WebSphere PMI AttributeMapping” on page 373.
Alarms Canceled The number of alarms canceled by the application. The validformat is a positive integer.
Alarms Created The total number of alarms created by all asynchronous scopes forthe current Work Manager. The valid format is a positive integer.
Alarms Fired The number of alarms fired. The valid format is a decimal (formattedto three decimal places).
Alarms Latency Duration The latency of alarms fired in milliseconds. The validformat is a decimal (formatted to three decimal places). This value is an average ofseveral values collected over an interval. The interval can be either between thistime and the previous time you activated this workspace, or fixed (normally 60seconds), depending on the configuration of the Monitoring Agent.
Alarms Pending Size The number of alarms waiting to fire. The valid format is adecimal (formatted to three decimal places). This value is an average of severalvalues collected over an interval. The interval can be either between this time andthe previous time you activated this workspace, or fixed (normally 60 seconds),depending on the configuration of the Monitoring Agent.
Alarms Rate The number of alarms firing per second. The valid format is adecimal (formatted to three decimal places). This value is an average of severalvalues collected over an interval. The interval can be either between this time andthe previous time you activated this workspace, or fixed (normally 60 seconds),depending on the configuration of the Monitoring Agent.
Instrumentation Level For WebSphere 6 or higher, the valid values are None,Basic, Extended, All, Custom. Blank if no instrumentation level is set.
Interval (sec) The length (in seconds) of the sampling interval. The valid format isa positive integer.
Node Name The name of the system on which the server is running. The valueformat is an alphanumeric string, with a maximum of 256 characters.
Origin Node The name of the server subnode. The valid format is analphanumeric string, with a maximum of 128 characters.
Row Number The row number. The valid format is a positive integer.
142 ITCAM Agents for WebSphere Applications, J2EE, and HTTP Servers: User Guide

Sample Date and Time The date and time the Tivoli Enterprise Monitoring Agentcollected the data. The valid format is a 12-character timestamp. For the STR andSCAN functions, the format is MM/DD/YY HH:MM:SS; the following table showsthe values contained in this character string:
Table 10. Format of the 12-character timestamp
Character String Meaning
MM Month
DD Day
YY Year
HH Hour
MM Minute
SS Second
Example: 09/13/06 18:32:03 indicates the data was collected on September 13 2006,at 18:32:03.
This attribute was designed for logging and reporting data-collection times ratherthan for creating situations. To specify a time and date for comparison and testing,use attributes from the Universal Time or Local Time groups.
Server Name The name of the application server. The valid format is analphanumeric string, with a maximum of 256 characters.
Summary Whether this row is a summary row of statistical totals for all rows.Valid values are No and Yes.
Work Manager Name The name of the work manager. The value format is analphanumeric string, with a maximum of 256 characters.
For additional information, see:v Organization of the predefined workspacesv Attribute groups used by the predefined workspaces
Allocation Failure attributesThe Allocation Failure attribute group provides information about theheap-allocation failure that caused the Java Virtual Machine hosting the applicationserver to start its garbage-collection routine.
You can use the Allocation Failure attributes in situations to determine the eventsthat caused the JVM to start garbage collection. The attributes within this groupare used to build the Allocation Failures workspace.
Allocation Failure Number The identifier assigned to the current allocation-failureblock, which is associated with a bar in the Heap Usage - History bar chart. Thevalid format is a positive integer.
ASID The identifier (decimal) assigned to the address space running this servantregion.
Bytes Needed The number of bytes needed on the heap when this allocationfailure occurred. The valid format is a positive integer.
Chapter 3. ITCAM Agent for WebSphere Applications 143

GC Cycle Count The number of garbage-collection cycles caused by this allocationfailure. The valid format is a positive integer.
Heap Expanded The total number of kilobytes by which the heap expanded orcontracted as a result of garbage collection. The valid format is a positive integer.
Heap Free (%) after GC The percentage of heap space that is available aftergarbage collection. The valid format is a positive integer.
Heap Status Whether the out-of-heap-space alert has been raised. Valid values areNormal and Out_of_heap_space.
Interval (sec) The length (in seconds) of the sampling interval. The valid format isa positive integer.
Kbytes Free at Start of GC The number of kilobytes available in the heap beforegarbage collection began in response to this allocation failure. The valid format is apositive integer.
Kbytes Freed by GC The number of kilobytes freed by the garbage collector forthis allocation failure. The valid format is a positive integer.
Kbytes Used The number of kilobytes in the heap that were in use when thisallocation failure occurred. The valid format is a positive integer.
Node Name The name of the system on which the server is running. The validformat is an alphanumeric string, with a maximum of 128 characters.
Objects Moved The number of objects the garbage collector moved duringcompaction. The valid format is a positive integer.
Origin Node The name of the server subnode. The valid format is analphanumeric string, with a maximum of 128 characters.
Process ID The unique identifier of the JVM process (the class ID of the JVM). Thevalid format is a positive integer.
Sample Date and Time The date and time the Tivoli Enterprise Monitoring Agentcollected the data. The valid format is a 12-character timestamp. For the STR andSCAN functions, the format is MM/DD/YY HH:MM:SS; the following table showsthe values contained in this character string:
Table 11. Format of the 12-character timestamp
Character String Meaning
MM Month
DD Day
YY Year
HH Hour
MM Minute
SS Second
Example: 09/13/06 18:32:03 indicates the data was collected on September 13 2006,at 18:32:03.
144 ITCAM Agents for WebSphere Applications, J2EE, and HTTP Servers: User Guide

This attribute was designed for logging and reporting data-collection times ratherthan for creating situations. To specify a time and date for comparison and testing,use attributes from the Universal Time or Local Time groups.
Server Name The name of the WebSphere application server. The valid format isan alphanumeric string, with a maximum of 256 characters.
Time since Last Failure (ms) The time (in milliseconds) since the previousallocation failure. The valid format is a positive integer.
Time to Complete (ms) The time (in milliseconds) required to complete the actionthat resulted from this allocation failure. The valid format is a positive integer.
Total Kbytes Freed by GC The total number of kilobytes freed by the garbagecollector in response to this allocation failure. The valid format is a positive integer.
For additional information, see:v Organization of the predefined workspacesv Attribute groups used by the predefined workspaces
Application Health Status attributesThe Application Health Status attributes provide information for real-time andhistorical application health status.
The attributes within this group are used to build the Application Health Summaryworkspace.
Application Health The combined application health level. Valid values areUnknown, Good, Fair, and Bad.
Application ID The unique identifier that is assigned automatically when theapplication is first configured and is preserved during the whole application lifecycle. The valid format is a positive integer or -1 which means that Application IDis an aggregated statistic for all applications.
Application Name The name of the application to which the request belongs. Thevalid format is an alphanumeric string, with a maximum of 256 characters.
Application Status The status of the monitored application. Valid values areStandby, Discovered, Unknown, Starting, Running, Stopping, Stopped, and Failed.
Application Tier Health The health level of the application tier. Valid values areUnknown, Good, Fair, and Bad. Application tier health indicator is determinedfrom EJB or custom request delays collected on the interval and compared againstthresholds configured for application requests.
ASID The identifier (decimal) assigned to the address space running this servantregion.
Backend Tier Health The health level of the backend tier. Backend tier healthindicator is determined from JDBC, JCA, JNDI, JMS delays collected on the intervaland compared against thresholds configured for application requests. Valid valuesare Unknown, Good, Fair, and Bad.
Chapter 3. ITCAM Agent for WebSphere Applications 145

Client Tier Health The health level of the client tier. Valid values are Unknown,Good, Fair, and Bad. Client tier health indicator is determined from servlet/JSP orportal delays collected on the interval and compared against thresholds configuredfor application requests.
Completion Level The completion level of the requests during the interval. Validvalues are Unknown, Good, Fair, and Bad. This attribute is determined fromrequest data as the percentage of number of failed requests to the total number ofapplication requests on the interval.
Custom Requests The availability indicator of the custom requests. Valid valuesare Unknown, Good, Fair, and Bad.
EJB Container The health level of the EJB container. Valid values are Unknown,Good, Fair, and Bad. This attribute is determined from EJB delay types collectedduring the interval and compared against application thresholds.
Interval (sec) The length (in seconds) of the sampling interval. The valid format isa positive integer.
JCA The overall health status of JEE Connector Architecture (JCA) resources usedby applications. Valid values are Unknown, Good, Fair, and Bad. This attribute isdetermined from JCA delay types collected during the interval and comparedagainst application thresholds.
JDBC The overall health status of Java DataBase Connectivity (JDBC) resourcesused by applications. Valid values are Unknown, Good, Fair, and Bad. Thisattribute is determined from JDBC delay types collected during the interval andcompared against application thresholds.
JNDI The overall health status of Java Naming and Directory Interface (JNDI)resources used by applications. Valid values are Unknown, Good, Fair, and Bad.This attribute is determined from JNDI delay types collected during the intervaland compared against application thresholds.
JMS The overall health status of Java Message Service (JMS) resources used byapplications. Valid values are Unknown, Good, Fair, and Bad. This attribute isdetermined from JMS delay types collected during the interval and comparedagainst application thresholds.
Node Name The name of the system on which the server is running. The validformat is an alphanumeric string, with a maximum of 256 characters.
Origin Node The name of the server subnode. The valid format is analphanumeric string, with a maximum of 128 characters.
Portal Container The health level of the portal container. Valid values areUnknown, Good, Fair, and Bad. This attribute is determined from portal delaytypes collected during the interval and compared against application thresholds.
Response Level The health level of the response time for the requests. Valid valuesare Unknown, Good, Fair, and Bad. This attribute is determined from applicationrequests response times collected during the interval and compared againstapplication thresholds.
146 ITCAM Agents for WebSphere Applications, J2EE, and HTTP Servers: User Guide

Sample Date and Time The date and time the Tivoli Enterprise Monitoring Agentcollected the data. The valid format is a 12-character timestamp. For the STR andSCAN functions, the format is MM/DD/YY HH:MM:SS; the following table showsthe values contained in this character string:
Table 12. Format of the 12-character timestamp
Character String Meaning
MM Month
DD Day
YY Year
HH Hour
MM Minute
SS Second
Example: 09/13/06 18:32:03 indicates the data was collected on September 13 2006,at 18:32:03.
This attribute was designed for logging and reporting data-collection times ratherthan for creating situations. To specify a time and date for comparison and testing,use attributes from the Universal Time or Local Time groups.
Server Name The name of the application server. The valid format is analphanumeric string, with a maximum of 256 characters.
Summary Indicates that this row is a summary row of statistical totals for all rows.
Web Container The health level of the web container. Valid values are Unknown,Good, Fair, and Bad.
SCA The health level of application SCA access. Valid values are Unknown, Good,Fair, and Bad.
WAS Node Name The name of the WebSphere Application Server node group towhich the application server belongs. The valid format is an alphanumeric string,with a maximum of 64 characters.
WAS Cell Name The name of the WebSphere Application Server cell to which theapplication server belongs. The valid format is an alphanumeric string, with amaximum of 64 characters.
Process ID The process ID for the application server. The valid format is a 4-byteinteger.
For additional information, see:v Organization of the predefined workspacesv Attribute groups used by the predefined workspaces
Application Monitoring Configuration attributesThe Application Monitoring Configuration attributes provide information for theApplication Monitoring Configuration.
Chapter 3. ITCAM Agent for WebSphere Applications 147

Use these attributes to monitor different WebSphere applications running within anapplication server. The attributes within this group are used to build the SelectedApplication - Configuration workspace.
Application Alias The alias name that you can optionally assign for theapplication. In practice, this attribute enables you to combine multiple applicationsunder the same common alias and report their request in the Tivoli EnterprisePortal as it would come from same application. This attribute is blank by default.You can assign the value to it from Take Actions at any time in the applicationmonitoring life cycle. The valid format is an alphanumeric string, with a maximumof 256 characters.
App ID The unique identifier that is assigned automatically when the applicationis first configured and is preserved during the whole application life cycle. Thevalid format is a positive integer.
Application Name The name of the application to which the request belongs. Youcan define the pattern of this name in the Application Registry workspace. Thevalid format is an alphanumeric string, with a maximum of 256 characters.
Bad Completion Rate (%) The bad completion rate threshold for the requests. Thevalid format is an alphanumeric string, with a maximum of 256 characters.
Baselining Elapsed Time The number of seconds during which the applicationbaselining has been running. The valid format is a positive integer.
Baselining Status The status of the application baselining process. Valid values areIdle, Running, and Standby.
Baselining Scheduled Stop Time The date and time baselining is scheduled tofinish. The valid format is a 12-character timestamp. For the STR and SCANfunctions, the format is MM/DD/YY HH:MM:SS; the following table shows thevalues contained in this character string:
Table 13. Format of the 12-character timestamp
Character String Meaning
MM Month
DD Day
YY Year
HH Hour
MM Minute
SS Second
Baselining Start Time The date and time when the application baselining wasstarted. The valid format is a 12-character timestamp. For the STR and SCANfunctions, the format is MM/DD/YY HH:MM:SS; the following table shows thevalues contained in this character string:
Table 14. Format of the 12-character timestamp
Character String Meaning
MM Month
DD Day
148 ITCAM Agents for WebSphere Applications, J2EE, and HTTP Servers: User Guide

Table 14. Format of the 12-character timestamp (continued)
Character String Meaning
YY Year
HH Hour
MM Minute
SS Second
Baselining Update Interval The number of seconds that defines how often activebaselining data is incrementally updated to the monitoring agent. The valid formatis a positive integer.
Fair Completion Rate (%) The fair completion rate threshold for the requests. Thevalid format is an alphanumeric string, with a maximum of 256 characters.
Interval (sec) The length (in seconds) of the sampling interval. The valid format isa positive integer.
Monitoring Status The current application monitoring status. Valid values areDiscovered, Enabled, Disabled, and Standby.
Node Name The name of the system on which the server is running. The validformat is an alphanumeric string, with a maximum of 256 characters.
Origin Node The name of the server subnode. The valid format is analphanumeric string, with a maximum of 128 characters.
Request Data Monitoring Level The custom request aggregation level for allapplication requests. Valid values are Default, Disabled, Level1, and Level2. Thisattribute is set to Default when the application is first discovered.
Request Data Sampling Rate The custom request aggregation rate for allapplication requests. The valid format is a positive integer.
Reflex Automation Mode When reflex automation mode is enabled, applicationmonitoring level is automatically updated on WASAppHealth* situation event.
Sample Date and Time The date and time the Tivoli Enterprise Monitoring Agentcollected the data. The valid format is a 12-character timestamp. For the STR andSCAN functions, the format is MM/DD/YY HH:MM:SS; the following table showsthe values contained in this character string:
Table 15. Format of the 12-character timestamp
Character String Meaning
MM Month
DD Day
YY Year
HH Hour
MM Minute
SS Second
Chapter 3. ITCAM Agent for WebSphere Applications 149

Example: 09/13/06 18:32:03 indicates the data was collected on September 13 2006,at 18:32:03.
This attribute was designed for logging and reporting data-collection times ratherthan for creating situations. To specify a time and date for comparison and testing,use attributes from the Universal Time or Local Time groups.
Server Name The name of the application server. The valid format is analphanumeric string, with a maximum of 256 characters.
For additional information, see:v Organization of the predefined workspacesv Attribute groups used by the predefined workspaces
Application server status attributesThe application server Status attributes provide status information for allWebSphere application servers (and the WebSphere administrative server) beingmonitored by the agent.
The attributes within this group are used to build the WebSphere Agentworkspace.
Important:
v The attributes within this attribute group contain zeros for performance data ifyour site has set configuration value Resource Data Collection Method to OnDemand (for on-demand sampling) and if you have not yet run applications thatgenerate performance data. To report performance data in these attributes afterinstalling and configuring the data collector, use the WebSphere administrativeconsole to set the appropriate PMI instrumentation level.
v The Tivoli Enterprise Monitoring Agent is set by default to provide on-demandsampling; thus the attributes within this attribute group initially contain zerosuntil you select the workspace and then select it again later. Each time you selectthe workspace, these attributes are updated with the latest data.
Origin Node The server name subnode. The valid format is an alphanumericstring, with a maximum of 128 characters.
Cluster Name The name of the server group (cluster) that this application serverbelongs to. The valid format is an alphanumeric string, with a maximum of 128characters.
Cluster Type Indicates the type of the server group (cluster) the application serverbelongs to.
Node Name The name of the system on which the server is running. The valueformat is an alphanumeric string, with a maximum of 128 characters.
Process ID The process identifier of the Java virtual machine. The valid format is apositive integer.
Regions Number The number of z/OS regions connected. This applies to z/OSenvironments only.
150 ITCAM Agents for WebSphere Applications, J2EE, and HTTP Servers: User Guide

Sample Date and Time The date and time the Tivoli Enterprise Monitoring Agentcollected the data. The valid format is a 12-character timestamp. For the STR andSCAN functions, the format is MM/DD/YY HH:MM:SS; the following table showsthe values contained in this character string:
Table 16. Format of the 12-character timestamp
Character String Meaning
MM Month
DD Day
YY Year
HH Hour
MM Minute
SS Second
Example: 09/13/06 18:32:03 indicates the data was collected on September 13 2006,at 18:32:03.
This attribute was designed for logging and reporting data-collection times ratherthan for creating situations. To specify a time and date for comparison and testing,use attributes from the Universal Time or Local Time groups.
Server Mode The mode of the WebSphere application server.
Server Name The name of the application server. The valid format is analphanumeric string, with a maximum of 256 characters.
Server Origin Node Name Indicates the origin node name of the serversubnode.The valid format is an alphanumeric string, with a maximum of 128characters.
Server Subnode Name The name of the server node in the navigation tree. Thevalid format is an alphanumeric string, with a maximum of 32 characters.
Server Type The type of server process. The valid values are:
Table 17. Types of server processes
Server Type Definition
Unknown The server type cannot be determined
AppServer A process that executes applications
AdminServer The administrative server you use when configuringWebSphere application server environments
NodeAgent The WebSphere application server node agent
JMSServer The WebSphere application server JMS server
DeploymentMgr The WebSphere application server deployment (cell)manager
ManagedProcess A stand-alone WebSphere application server process
UnManagedProcess A WebSphere application server process that is managedby a WebSphere application server deployment managerthrough a node agent
Chapter 3. ITCAM Agent for WebSphere Applications 151

Start Date and Time The date and time when the WebSphere application serverstarted. The valid format is a timestamp. This attribute was designed for loggingand reporting data-collection times rather than for creating situations. To specify atime and date for comparison and testing, use attributes from the Universal Timeor Local Time groups.
Status The status of the WebSphere application server. Valid values are Connectedand Disconnected.
WAS Cell Name The name of the WebSphere application server cell to which thisapplication server belongs. The valid format is an alphanumeric string, with amaximum of 64 characters.
WAS Configuration Repository Directory Name The name of the WebSphereapplication server configuration repository directory, which normally resides in theconfig subdirectory of the product installation root directory. The valid format is analphanumeric string, with a maximum of 128 characters.
WAS Node Name The name of the WebSphere application server node group towhich this application server belongs. The valid format is an alphanumeric string,with a maximum of 64 characters.
VE Host/port The valid format is an alphanumeric string, with a maximum of 256characters.
Probe ID The valid format is an alphanumeric string, with a maximum of 128characters.
For additional information, see:v Organization of the predefined workspacesv Attribute groups used by the predefined workspaces
Application server attributesThe application server attributes provide the status and summary data for aspecific WebSphere application server instance.
The attributes provide performance data for the WebSphere application serverruntime (JVM memory), thread pools, HTTP sessions, and configurationparameters. They also provide some information from other attribute groups togive an overall view of the WebSphere application server. Use the applicationserver attributes in situations to monitor the health and performance of aWebSphere application server.
The attributes within this group are used to build the WebSphere applicationserver and the Pool Analysis Workspace workspaces.
Important:
v The attributes in this attribute group contain zeros for performance data if yoursite sets the configuration value Resource Data Collection Method to OnDemand (for on-demand sampling) and you have not yet run applications thatgenerate performance data. To report performance data in these attributes whenyou have installed and configured the data collector, use the WebSphereadministrative console to set the appropriate PMI instrumentation level.
152 ITCAM Agents for WebSphere Applications, J2EE, and HTTP Servers: User Guide

v The Tivoli Enterprise Monitoring Agent is set by default to provide on-demandsampling; this means the attributes in this attribute group initially contain zerosuntil you select the workspace and then select it again later. Each time you selectthe workspace, these attributes are updated with the latest data.
Tip: For information about WebSphere PMI metrics, see “WebSphere PMI AttributeMapping” on page 373.
ASID The identifier (decimal) assigned to the address space running this servantregion.
CPU Used (ms) Indicates the number of milliseconds the JVM CPU used duringthe interval. The valid format is a positive integer.
CPU Used (%) Indicates the percentage of the JVM CPU used during the interval.For UNIX users, this attribute has a meaningful value only if the Tivoli EnterpriseMonitoring Agent is running with superuser authority. The valid format is adecimal (formatted to one decimal place).
Platform CPU Used (ms) Indicates the number of milliseconds the host platform(OS) CPU used during the interval. This feature does not apply to the z/OSplatform.
Garbage Collection Monitoring The monitoring level for garbage-collection data.Valid values are Disabled and Enabled.
Instrumentation Level The JVM instrumentation level. For WebSphere 6 or higher,the valid values are None, Basic, Extended, All, Custom. Blank if noinstrumentation level is set.
Interval (sec) The length (in seconds) of the sampling interval. The valid format isa positive integer.
Hung Threads Total Total number of detected hung threads. The valid format is apositive integer.
Hung Threads Blocked Number of hung threads detected in the BLOCKED state.The valid format is a positive integer.
Hung Threads Waiting Number of hung threads detected in the WAITING state.The valid format is a positive integer.
Hung Threads Timed Waiting Number of hung threads detected in theTIMED_WAITING state. The valid format is a positive integer.
JVM Memory Free (Kbytes) The JVM free memory size in Kbytes.
JVM Memory Total (Kbytes) The JVM total memory size in Kbytes.
JVM Memory Used (Kbytes) The JVM used memory size in Kbytes.
JVM Memory Free (bytes) The JVM free memory size (in bytes). The valid formatis a positive integer.
JVM Memory Total (bytes) The JVM total memory size (in bytes). The validformat is a positive integer.
Chapter 3. ITCAM Agent for WebSphere Applications 153

JVM Memory Used (bytes) The JVM used memory size (in bytes). The validformat is a positive integer.
Node Name The name of the system on which the server is running. The valueformat is an alphanumeric string, with a maximum of 256 characters.
Origin Node The name of the server subnode. The valid format is analphanumeric string, with a maximum of 128 characters.
Process ID The process identifier of the Java virtual machine. The valid format is apositive integer.
Probe ID The valid format is an alphanumeric string, with a maximum of 128characters.
Request Data Monitoring Level The monitoring level for request data stored bythe data collector. Valid values are Disabled, Level1 edge request data, such asservlets and JSPs are displayed), and Level2 (nested request data such as JDBC andJMS requests are also displayed).
Request Data Sampling Rate (%) The percentage of Level1 requests (that is, edgerequests) being sampled. The valid format is a positive integer.
Resource Data Monitoring The monitoring level for resource (that is, PMI) datastored by the data collector. Valid values are Disabled and Enabled.
Sample Date and Time The date and time the Tivoli Enterprise Monitoring Agentcollected the data. The valid format is a 12 character timestamp. For the STR andSCAN functions, the format is MM/DD/YY HH:MM:SS; the following table showsthe values contained in this character string:
Table 18. Format of the 12 character timestamp
Character String Meaning
MM Month
DD Day
YY Year
HH Hour
MM Minute
SS Second
Example: 09/13/06 18:32:03 indicates the data was collected on September 13 2006,at 18:32:03.
This attribute was designed for logging and reporting data-collection times ratherthan for creating situations. To specify a time and date for comparison and testing,use attributes from the Universal Time or Local Time groups.
Server Instance Name The name of the WebSphere application server. This is alogical grouping of one or more server instances (called a "generic server" or"cluster") any one of which can run an application. The valid format is analphanumeric string, with a maximum of eight characters.
Server Mode Indicates the mode of the WebSphere application server.
154 ITCAM Agents for WebSphere Applications, J2EE, and HTTP Servers: User Guide

Server Name The name of the application server. The valid format is analphanumeric string, with a maximum of 256 characters.
Server Type The type of the WebSphere application server. Valid values areUnknown, AppServer, AdminServer, NodeAgent, JMSServer, DeploymentManager,ManagedProcess, and UnManagedProcess.
Server Subnode Name Indicates the sub node name of the application server.
Start Date and Time The date and time when the WebSphere application serverstarted. The valid format is a timestamp. This attribute was designed for loggingand reporting data-collection times rather than for creating situations. To specify atime and date for comparison and testing, use attributes from the Universal Timeor Local Time groups.
Status The status of the WebSphere application server. Valid values are Connectedand Disconnected.
Summary Indicates that this row is a summary row of statistical totals for all rows.
System Paging Rate (Kbytes/sec) The system paging rate in kilobytes per secondduring the interval. The valid format is a positive integer.
WAS Node Name The name of the WebSphere Application Server node group towhich the application server belongs. The valid format is an alphanumeric string,with a maximum of 64 characters.
WAS Cell Name The name of the WebSphere Application Server cell to which theapplication server belongs. The valid format is an alphanumeric string, with amaximum of 64 characters.
Version The version of WebSphere application server. The valid format is analphanumeric string, with a maximum of eight characters.
VE Host/port The valid format is an alphanumeric string, with a maximum of 256characters.
For additional information, see:v Organization of the predefined workspacesv Attribute groups used by the predefined workspaces
Baseline attributesThe Baseline attributes provide information for baseline extract data for the givenapplication.
The baselining collects statistical information about an application requestscompletion times and uses this information to assign fair and bad thresholds onthe application requests. The product divides the whole request response timesinto buckets and collects individual hits into each bucket. Use these attributes toget statistics from individual requests collected during baselining interval.
The attributes within this group are used to build the Selected Request - Baselineworkspace.
Chapter 3. ITCAM Agent for WebSphere Applications 155

Application ID The unique identifier that is assigned automatically when theapplication is first configured and is preserved during the whole application lifecycle. The valid format is a positive integer.
Bad Hits Percentage The percentage of bucket hits in the metric bad value zone.The valid format is a positive integer.
Bucket Number The bucket number of the baselining data. The valid format is apositive integer.
EJB Container Percent The average percent of time that bucket requests wereexecuted inside EJB container. The valid format is a positive integer.
Fair Hits Percentage The percentage of bucket hits in the metric fair value zone.The valid format is a positive integer.
Good Hits Percentage The percentage of bucket hits in the metric good valuezone. The valid format is a positive integer.
Hits Percentage The percentage of hits for the bucket during the baselining. Thevalid format is a positive integer.
Interval (sec) The length (in seconds) of the sampling interval. The valid format isa positive integer.
JCA Percent The average percent of time that bucket requests spent for JCA access.The valid format is a positive integer.
JDBC Percent The average percent of time that bucket requests spent for JDBCaccess. The valid format is a positive integer.
JMS Percent The average percent of time that bucket requests spent for JMSaccess. The valid format is a positive integer.
JNDI Percent The average percent of time that bucket requests spent for JNDIaccess. The valid format is a positive integer.
Lower Boundary (msec) The lower boundary of bucket response times inmilliseconds. The valid format is a positive integer.
Metric ID The metric identifier of the baselining data. The valid format is apositive integer.
Metric Type The metric type of the baselining data. Valid formats are Request,Error, and Resource.
Node Name The name of the system on which the server is running. The validformat is an alphanumeric string, with a maximum of 256 characters.
Origin Node The name of the server subnode. The valid format is analphanumeric string, with a maximum of 128 characters.
Portal Percent The average percent of time that bucket requests were executedinside portal container. The valid format is a positive integer.
156 ITCAM Agents for WebSphere Applications, J2EE, and HTTP Servers: User Guide

Response Time Mean (msec) The mean time of bucket response times. The validformat is a positive integer.
SCA Percent The average percent of time that bucket requests spent for SCAaccess. The valid format is a positive integer.
Sample Date and Time The date and time the Tivoli Enterprise Monitoring Agentcollected the data. The valid format is a 12-character timestamp. For the STR andSCAN functions, the format is MM/DD/YY HH:MM:SS; the following table showsthe values contained in this character string:
Table 19. Format of the 12-character timestamp
Character String Meaning
MM Month
DD Day
YY Year
HH Hour
MM Minute
SS Second
Example: 09/13/06 18:32:03 indicates the data was collected on September 13 2006,at 18:32:03.
This attribute was designed for logging and reporting data-collection times ratherthan for creating situations. To specify a time and date for comparison and testing,use attributes from the Universal Time or Local Time groups.
Hits Percentage The percentage of bucket hits in the metric selection value zone.The valid format is a positive integer.
Server Name The name of the application server. The valid format is analphanumeric string, with a maximum of 256 characters.
Servlet Container Percent The average percent of time that bucket requests wereexecuted inside the servlet container. The valid format is a positive integer.
Total Hits The total hits number for the bucket during the baselining. The validformat is a positive integer.
Upper Boundary (msec) The upper boundary of bucket response times. The validformat is a positive integer.
For additional information, see:v Organization of the predefined workspacesv Attribute groups used by the predefined workspaces
Client Communications attributesThe Client Communications attributes display overall statistics about server-sidemonitoring and a client-side API to retrieve performance data.
The attributes within this group are used to build the Client Communicationsworkspace.
Chapter 3. ITCAM Agent for WebSphere Applications 157

Restriction: Attributes in this group are only provided for IBM WebSphereapplication server version 6.0 or later.
Tip: For information about WebSphere PMI metrics, see “WebSphere PMI AttributeMapping” on page 373.
API Connections The number of API sessions being used by clients that arecurrently network connected to this application server. Some of these APIconnections might be being used by internal system processes on behalf of a client.The valid format is a positive integer.
Buffered Read (bytes) The number of bytes of data that have been received fromthe network and are held pending further processing. Large values might indicatethat the application server is unable to process data fast enough to keep up withthe clients attached. The valid format is a positive integer.
Buffered Write (bytes) The number of bytes of data being held pendingtransmission. Large values might indicate network congestion or clients which areunable to process data fast enough to keep up with the application server. Thevalid format is a positive integer.
Clients Attached The number of distinct client processes currently networkconnected to this application server. The valid format is a positive integer.
Errors The communication errors that have occurred and resulted in a networkconnection to a client being disconnected. The valid format is a positive integer.
Instrumentation Level The instrumentation level for the client communications.For WebSphere 5, the valid values are None, Low, Medium, High, and Maximum;for WebSphere 6 or higher, the valid values are None, Basic, Extended, All,Custom. Blank if no instrumentation level is set.
Interval (sec) The length (in seconds) of the sampling interval. The valid format isa positive integer.
Message Read (bytes) The number of bytes of message data received from clientprocesses over network connections. This does not include data used to negotiatethe transmission of messages. The valid format is a positive integer.
Messages Received at JMS 0 Priority (bytes) The number of messages received atJMS priority 0. The valid format is a positive integer.
Messages Received at JMS 1 Priority (bytes) The number of messages received atJMS priority 1. The valid format is a positive integer.
Messages Received at JMS 2 Priority (bytes) The number of messages received atJMS priority 2. The valid format is a positive integer.
Messages Received at JMS 3 Priority (bytes) The number of messages received atJMS priority 3. The valid format is a positive integer.
Messages Received at JMS 4 Priority (bytes) The number of messages received atJMS priority 4. The valid format is a positive integer.
Messages Received at JMS 5 Priority (bytes) The number of messages received atJMS priority 5. The valid format is a positive integer.
158 ITCAM Agents for WebSphere Applications, J2EE, and HTTP Servers: User Guide

Messages Received at JMS 6 Priority (bytes) The number of messages received atJMS priority 6. The valid format is a positive integer.
Messages Received at JMS 7 Priority (bytes) The number of messages received atJMS priority 7. The valid format is a positive integer.
Messages Received at JMS 8 Priority (bytes) The number of messages received atJMS priority 8. The valid format is a positive integer.
Messages Received at JMS 9 Priority (bytes) The number of messages received atJMS priority 9. The valid format is a positive integer.
Messages Sent at JMS 0 Priority (bytes) The number of messages transmitted atJMS priority 0. The valid format is a positive integer.
Messages Sent at JMS 1 Priority (bytes) The number of messages transmitted atJMS priority 1. The valid format is a positive integer.
Messages Sent at JMS 2 Priority (bytes) The number of messages transmitted atJMS priority 2. The valid format is a positive integer.
Messages Sent at JMS 3 Priority (bytes) The number of messages transmitted atJMS priority 3. The valid format is a positive integer.
Messages Sent at JMS 4 Priority (bytes) The number of messages transmitted atJMS priority 4. The valid format is a positive integer.
Messages Sent at JMS 5 Priority (bytes) The number of messages transmitted atJMS priority 5. The valid format is a positive integer.
Messages Sent at JMS 6 Priority (bytes) The number of messages transmitted atJMS priority 6. The valid format is a positive integer.
Messages Sent at JMS 7 Priority (bytes) The number of messages transmitted atJMS priority 7. The valid format is a positive integer.
Messages Sent at JMS 8 Priority (bytes) The number of messages transmitted atJMS priority 8. The valid format is a positive integer.
Messages Sent at JMS 9 Priority (bytes) The number of messages transmitted atJMS priority 9. The valid format is a positive integer.
Message Written (bytes) The number of bytes of message data sent to clientprocesses over network connections. This does not include data used to negotiatethe transmission of messages. The valid format is a positive integer.
Messaging Engine Name The name of the message engine. The value format is analphanumeric string, with a maximum of 256 characters.
Multicast Send Messages The number of messages transmitted using multicastprotocols. The valid format is a positive integer.
Multicast Write The number of bytes transmitted using multicast protocols. Thevalid format is a positive integer.
Chapter 3. ITCAM Agent for WebSphere Applications 159

Node Name The name of the system on which the server is running. The valueformat is an alphanumeric string, with a maximum of 256 characters.
Origin Node The name of the server subnode. The valid format is analphanumeric string, with a maximum of 128 characters.
Reads The number of read operations used to receive data from client processesthrough network connections. The valid format is a positive integer.
Reads Blocked The number of read operations that could not be completedimmediately. This number can be used as an indicator of network congestion whencommunicating with client processes. The valid format is a positive integer.
Received at High Priority (bytes) The number of bytes of data received at a highpriority. Message data cannot be transmitted with this priority, so typically thesebytes of data comprise control transmissions used to negotiate the flow ofmessages. The valid format is a positive integer.
Received at Highest Priority (bytes) The number of bytes of data received at thehighest possible priority. Message data cannot be transmitted with this priority, sotypically these bytes of data comprise control transmissions used to negotiate theflow of messages. The valid format is a positive integer.
Received at JMS 0 Priority (bytes) The number of bytes of data received at thepriority used by JMS priority 0 messages. Typically this is an accurate measure ofthe number of bytes of message data received at this priority level. However, fromtime to time, control transmissions used to negotiate the flow of messages might betransmitted at this priority level. The valid format is a positive integer.
Received at JMS 1 Priority (bytes) The number of bytes of data received at thepriority used by JMS priority 1 messages. Typically this is an accurate measure ofthe number of bytes of message data received at this priority level. However, fromtime to time, control transmissions used to negotiate the flow of messages might betransmitted at this priority level. The valid format is a positive integer.
Received at JMS 2 Priority (bytes) The number of bytes of data received at thepriority used by JMS priority 2 messages. Typically this is an accurate measure ofthe number of bytes of message data received at this priority level. However, fromtime to time, control transmissions used to negotiate the flow of messages might betransmitted at this priority level. The valid format is a positive integer.
Received at JMS 3 Priority (bytes) The number of bytes of data received at thepriority used by JMS priority 3 messages. Typically this is an accurate measure ofthe number of bytes of message data received at this priority level. However, fromtime to time, control transmissions used to negotiate the flow of messages might betransmitted at this priority level. The valid format is a positive integer.
Received at JMS 4 Priority (bytes) The number of bytes of data received at thepriority used by JMS priority 4 messages. Typically this is an accurate measure ofthe number of bytes of message data received at this priority level. However, fromtime to time, control transmissions used to negotiate the flow of messages might betransmitted at this priority level. The valid format is a positive integer.
Received at JMS 5 Priority (bytes) The number of bytes of data received at thepriority used by JMS priority 5 messages. Typically this is an accurate measure ofthe number of bytes of message data received at this priority level. However, from
160 ITCAM Agents for WebSphere Applications, J2EE, and HTTP Servers: User Guide

time to time, control transmissions used to negotiate the flow of messages might betransmitted at this priority level. The valid format is a positive integer.
Received at JMS 6 Priority (bytes) The number of bytes of data received at thepriority used by JMS priority 6 messages. Typically this is an accurate measure ofthe number of bytes of message data received at this priority level. However, fromtime to time, control transmissions used to negotiate the flow of messages might betransmitted at this priority level. The valid format is a positive integer.
Received at JMS 7 Priority (bytes) The number of bytes of data received at thepriority used by JMS priority 7 messages. Typically this is an accurate measure ofthe number of bytes of message data received at this priority level. However, fromtime to time, control transmissions used to negotiate the flow of messages might betransmitted at this priority level. The valid format is a positive integer.
Received at JMS 8 Priority (bytes) The number of bytes of data received at thepriority used by JMS priority 8 messages. Typically this is an accurate measure ofthe number of bytes of message data received at this priority level. However, fromtime to time, control transmissions used to negotiate the flow of messages might betransmitted at this priority level. The valid format is a positive integer.
Received at JMS 9 Priority (bytes) The number of bytes of data received at thepriority used by JMS priority 9 messages. Typically this is an accurate measure ofthe number of bytes of message data received at this priority level. However, fromtime to time, control transmissions used to negotiate the flow of messages might betransmitted at this priority level. The valid format is a positive integer.
Received at Low Priority (bytes) The number of bytes of data received at a lowpriority. Message data cannot be transmitted with this priority, so typically thesebytes of data comprise control transmissions used to negotiate the flow ofmessages. The valid format is a positive integer.
Received at Lowest Priority (bytes) The number of bytes of data received at thelowest possible priority. Message data cannot be transmitted with this priority, sotypically these bytes of data comprise control transmissions used to negotiate theflow of messages. The valid format is a positive integer.
Received at Very High Priority (bytes) The number of bytes of data received at ahigh priority. Message data cannot be transmitted with this priority, so typicallythese bytes of data comprise control transmissions used to negotiate the flow ofmessages. The valid format is a positive integer.
Received at Very Low Priority (bytes) The number of bytes of data received at alow priority. Message data cannot be transmitted with this priority, so typicallythese bytes of data comprise control transmissions used to negotiate the flow ofmessages. The valid format is a positive integer.
Sample Date and Time The date and time the Tivoli Enterprise Monitoring Agentcollected the data. The valid format is a 12-character timestamp. For the STR andSCAN functions, the format is MM/DD/YY HH:MM:SS; the following table showsthe values contained in this character string:
Table 20. Format of the 12-character timestamp
Character String Meaning
MM Month
Chapter 3. ITCAM Agent for WebSphere Applications 161

Table 20. Format of the 12-character timestamp (continued)
Character String Meaning
DD Day
YY Year
HH Hour
MM Minute
SS Second
Example: 09/13/06 18:32:03 indicates the data was collected on September 13 2006,at 18:32:03.
This attribute was designed for logging and reporting data-collection times ratherthan for creating situations. To specify a time and date for comparison and testing,use attributes from the Universal Time or Local Time groups.
Sent at High Priority (bytes) The number of bytes of data transmitted at a highpriority. Message data cannot be transmitted with this priority, so typically thesebytes of data comprise control transmissions used to negotiate the flow ofmessages. The valid format is a positive integer.
Sent at Highest Priority (bytes) The number of bytes of data transmitted at thehighest possible priority for transmission. Message data cannot be transmitted withthis priority, so typically these bytes of data comprise control transmissions used tonegotiate the flow of messages. The valid format is a positive integer.
Sent at JMS 0 Priority (bytes) The number of bytes of data transmitted at thepriority used by JMS priority 0 messages. Typically this is an accurate measure ofthe number of bytes of message data transmitted at this priority level. However,from time to time, control transmissions used to negotiate the flow of messagesmight be transmitted at this priority level. The valid format is a positive integer.
Sent at JMS 1 Priority (bytes) The number of bytes of data transmitted at thepriority used by JMS priority 1 messages. Typically this is an accurate measure ofthe number of bytes of message data transmitted at this priority level. However,from time to time, control transmissions used to negotiate the flow of messagesmight be transmitted at this priority level. The valid format is a positive integer.
Sent at JMS 2 Priority (bytes) The number of bytes of data transmitted at thepriority used by JMS priority 2 messages. Typically this is an accurate measure ofthe number of bytes of message data transmitted at this priority level. However,from time to time, control transmissions used to negotiate the flow of messagesmight be transmitted at this priority level. The valid format is a positive integer.
Sent at JMS 3 Priority (bytes) The number of bytes of data transmitted at thepriority used by JMS priority 3 messages. Typically this is an accurate measure ofthe number of bytes of message data transmitted at this priority level. However,from time to time, control transmissions used to negotiate the flow of messagesmight be transmitted at this priority level. The valid format is a positive integer.
Sent at JMS 4 Priority (bytes) The number of bytes of data transmitted at thepriority used by JMS priority 4 messages. Typically this is an accurate measure ofthe number of bytes of message data transmitted at this priority level. However,
162 ITCAM Agents for WebSphere Applications, J2EE, and HTTP Servers: User Guide

from time to time, control transmissions used to negotiate the flow of messagesmight be transmitted at this priority level. The valid format is a positive integer.
Sent at JMS 5 Priority (bytes) The number of bytes of data transmitted at thepriority used by JMS priority 5 messages. Typically this is an accurate measure ofthe number of bytes of message data transmitted at this priority level. However,from time to time, control transmissions used to negotiate the flow of messagesmight be transmitted at this priority level. The valid format is a positive integer.
Sent at JMS 6 Priority (bytes) The number of bytes of data transmitted at thepriority used by JMS priority 6 messages. Typically this is an accurate measure ofthe number of bytes of message data transmitted at this priority level. However,from time to time, control transmissions used to negotiate the flow of messagesmight be transmitted at this priority level. The valid format is a positive integer.
Sent at JMS 7 Priority (bytes) The number of bytes of data transmitted at thepriority used by JMS priority 7 messages. Typically this is an accurate measure ofthe number of bytes of message data transmitted at this priority level. However,from time to time, control transmissions used to negotiate the flow of messagesmight be transmitted at this priority level. The valid format is a positive integer.
Sent at JMS 8 Priority (bytes) The number of bytes of data transmitted at thepriority used by JMS priority 8 messages. Typically this is an accurate measure ofthe number of bytes of message data transmitted at this priority level. However,from time to time, control transmissions used to negotiate the flow of messagesmight be transmitted at this priority level. The valid format is a positive integer.
Sent at JMS 9 Priority (bytes) The number of bytes of data transmitted at thepriority used by JMS priority 9 messages. Typically this is an accurate measure ofthe number of bytes of message data transmitted at this priority level. However,from time to time, control transmissions used to negotiate the flow of messagesmight be transmitted at this priority level. The valid format is a positive integer.
Sent at Low Priority (bytes) The number of bytes of data transmitted at a lowpriority. Message data cannot be transmitted with this priority, so typically thesebytes of data comprise control transmissions used to negotiate the flow ofmessages. The valid format is a positive integer.
Sent at Lowest Priority (bytes) The number of bytes of data transmitted at thelowest priority. Message data cannot be transmitted with this priority, so typicallythese bytes of data comprise control transmissions used to negotiate the flow ofmessages. The valid format is a positive integer.
Sent at Very High Priority (bytes) The number of bytes of data transmitted at ahigh priority. Message data cannot be transmitted with this priority, so typicallythese bytes of data comprise control transmissions used to negotiate the flow ofmessages. The valid format is a positive integer.
Sent at Very Low Priority (bytes) The number of bytes of data transmitted at alow priority. Message data cannot be transmitted with this priority, so typicallythese bytes of data comprise control transmissions used to negotiate the flow ofmessages. The valid format is a positive integer.
Server Name The name of the application server. The valid format is analphanumeric string, with a maximum of 256 characters.
Chapter 3. ITCAM Agent for WebSphere Applications 163

Summary Whether this row is a summary row of statistical totals for all messagingengines. Valid values are No and Yes.
Total Read (bytes) The number of bytes of data received from client processes.This includes both message data and data used to negotiate the transmission ofmessages. The valid format is a positive integer.
Total Written (bytes) The number of bytes of data sent to client processes. Thisincludes both message data and data used to negotiate the transmission ofmessages. The valid format is a positive integer.
Writes The number of write operations used to transmit data to client processesvia network connections. The valid format is a positive integer.
Writes Blocked The number of write operations that could not be completedimmediately. This number can be used as an indicator of network congestion whencommunicating with client processes. The valid format is a positive integer.
For additional information, see:v Organization of the predefined workspacesv Attribute groups used by the predefined workspaces
Container Object Pools attributesUse the Container Object Pools attributes in situations to monitor the effectivenessof the object cache and of resource usage.
These attributes provide aggregated information for each defined EJB containerthat aggregates bean object pool performance for all Enterprise beans deployed tothat container and aggregated information for the application server thataggregates bean object pool performance data for all Enterprise beans deployed tothe application server. The attributes within this group are used to build theContainer Object Pools workspace.
Important:
v The attributes within this attribute group contain zeros for performance data ifyour site set configuration value Resource Data Collection Method to OnDemand (for on-demand sampling) and you have not yet run applications thatgenerate performance data. To report performance data in these attributes afterinstalling and configuring the data collector, use the WebSphere administrativeconsole to set the appropriate PMI instrumentation level.
v The Tivoli Enterprise Monitoring Agent is set by default to provide on-demandsampling; thus the attributes within this attribute group initially contain zerosuntil you select the workspace and select it again later. Each time you select theworkspace, these attributes are updated with the latest data.
Tip: For information about WebSphere PMI metrics, see “WebSphere PMI AttributeMapping” on page 373.
Average Objects Discarded The average number of objects discarded each time thebean object pool was emptied of idle objects during the interval. The valid formatis a decimal (formatted to three decimal places).
164 ITCAM Agents for WebSphere Applications, J2EE, and HTTP Servers: User Guide

Objects Discarded Count The number of objects joined in Average ObjectsDiscarded. The valid format is a 4-byte integer. If the number is too big to bestored, the value -2 is used.
Average Objects in Pool The average number of objects in the bean object poolduring the interval. The valid format is a decimal (formatted to three decimalplaces). This value is an average of several values collected over an interval. Theinterval can be either between this time and the previous time you activated thisworkspace, or fixed (normally 60 seconds), depending on the configuration of theMonitoring Agent.
Discard Count The number of times the object returned to the bean-object poolwas discarded because the bean object pool was already full during the interval.The valid format is a positive integer.
Discard Rate (per sec) The bean object pool discard rate (per second) for theinterval since the previous sample. The valid format is a decimal (formatted tothree decimal places).
Drain Count The number of times the bean object pool was found idle and anattempt was made to remove idle objects during the interval. The valid format is apositive integer.
Drain Rate (per sec) The number of times (per second) that the bean object poolwas found idle during the interval since the previous sample. The valid format is adecimal (formatted to three decimal places).
Find Count The number of times a retrieval call found an available object in thebean object pool during the interval. The valid format is a positive integer.
Find Rate (per sec) The availability of bean object pool retrievals (per second) forthe interval since the previous sample. The valid format is a decimal (formatted tothree decimal places).
Get Count The number of calls retrieving an object from the bean object poolduring the interval. The valid format is a positive integer.
Get Rate (per sec) The number of bean objects retrieved (per second) for theinterval since the previous sample. The valid format is a decimal (formatted tothree decimal places).
Interval (sec) The length (in seconds) of the interval. The valid format is a positiveinteger.
Instrumentation Level The instrumentation level for this container. For WebSphere6 or higher, the valid values are None, Basic, Extended, All, Custom. Blank if noinstrumentation level is set.
Node Name The name of the system on which the server is running. The valueformat is an alphanumeric string, with a maximum of 256 characters.
Origin Node The name of the server subnode. The valid format is analphanumeric string, with a maximum of 128 characters.
Container Name The name of the container. The valid format is an alphanumericstring, with a maximum of 64 characters.
Chapter 3. ITCAM Agent for WebSphere Applications 165

Return Count The number of calls returning an object to the bean object poolduring the interval. The valid format is a positive integer.
Return Rate (per sec) The bean objects returned (per second) for the interval sincethe previous sample. The valid format is a decimal (formatted to three decimalplaces).
Sample Date and Time The date and time the Tivoli Enterprise Monitoring Agentcollected the data. The valid format is a 12-character timestamp. For the STR andSCAN functions, the format is MM/DD/YY HH:MM:SS; the following table showsthe values contained in this character string:
Table 21. Format of the 12-character timestamp
Character String Meaning
MM Month
DD Day
YY Year
HH Hour
MM Minute
SS Second
Example: 09/13/06 18:32:03 indicates the data was collected on September 13 2006,at 18:32:03.
This attribute was designed for logging and reporting data-collection times ratherthan for creating situations. To specify a time and date for comparison and testing,use attributes from the Universal Time or Local Time groups.
Server Name The name of the WebSphere application server. The valid format isan alphanumeric string, with a maximum of 256 characters.
Set Instrumentation Level Type Indicates the WebSphere resource category, whichis used by the agent to modify the Instrumentation Level for transaction datacollection.
Summary of All Containers Whether this row is a summary row of statisticaltotals aggregated over all bean object pools in the application server. Valid valuesare No and Yes.
For additional information, see:v Organization of the predefined workspacesv Attribute groups used by the predefined workspaces
Container Transactions attributesThe Container Transactions attribute group provides performance informationabout transactions that run in each defined EJB container and an aggregated valuefor all transactions that run in the application server.
Use the Container Transactions attributes in situations to monitor transactionactivity for each EJB container and for the application server. The attributes withinthis group are used to build the Container Transactions workspace.
166 ITCAM Agents for WebSphere Applications, J2EE, and HTTP Servers: User Guide

Important:
v The attributes within this attribute group contain zeros for performance data ifyour site set configuration value Resource Data Collection Method to OnDemand (for on-demand sampling) and you have not yet run applications thatgenerate performance data. To report performance data in these attributes afterinstalling and configuring the data collector, use the WebSphere administrativeconsole to set the appropriate PMI instrumentation level.
v The Tivoli Enterprise Monitoring Agent is set by default to provide on-demandsampling; thus the attributes within this attribute group initially contain zerosuntil you select the workspace and select it again later. Each time you select theworkspace, these attributes are updated with the latest data.
Tip: For information about WebSphere PMI metrics, see “WebSphere PMI AttributeMapping” on page 373.
Global Transaction before Completion Duration (ms) The average duration beforecompletion for global transactions during the interval. The valid format is adecimal (formatted to three decimal places).
Global Transaction before Completion Duration Count The count of times thatwere averaged for Global Transaction before Completion Duration. The validformat is a 4-byte integer. If the number is too big to be stored, a value of -2 isused.
Global Transaction Commit Duration (ms) The time (in milliseconds) that thetransaction required for its resolution phase during the interval. The valid format isa decimal (formatted to three decimal places).
Global Transaction Commit Duration Count The count of times that wereaveraged for Global Transaction Commit Duration. The valid format is a 4-byteinteger. If the number is too big to be stored, a value of -2 is used.
Global Transaction Commit Rate (per sec) The number of times (per second)global transactions were committed during the interval. The valid format is adecimal (formatted to three decimal places).
Global Transaction Duration (ms) The average duration (in milliseconds) forglobal transactions during the interval. The valid format is a decimal (formatted tothree decimal places).
Global Transaction Duration Count The count of times that were averaged forGlobal Transaction Duration. The valid format is a 4-byte integer. If the number istoo big to be stored, a value of -2 is used.
Global Transaction Optimize Rate (per sec) The number of times (per second) thatglobal transactions were converted to single phase since the previous sample. Thevalid format is a decimal (formatted to three decimal places).
Global Transaction Prepare Duration (ms) The average preparation duration (inmilliseconds) for global transactions during the interval. The valid format is adecimal (formatted to three decimal places).
Global Transaction Prepare Duration Count The count of times that wereaveraged for Global Transaction Prepare Duration. The valid format is a 4-byteinteger. If the number is too big to be stored, a value of -2 is used.
Chapter 3. ITCAM Agent for WebSphere Applications 167

Global Transaction Rollback Rate (per sec) The number of times (per second) thatglobal transactions were undone because they could not complete during theinterval. The valid format is a decimal (formatted to three decimal places).
Global Transaction Timeout Rate (per sec) The number of global transactiontimeouts (per second) since the previous sample. The valid format is a decimal(formatted to three decimal places).
Global Transaction Timeouts The number of global transactions that timed outduring the interval. The valid format is a positive integer.
Global Transactions Active The number of concurrently active global transactionsrunning in the container during the interval. Global transactions involve multipleresource managers. The valid format is a decimal (formatted to three decimalplaces).
Global Transactions Begin Rate (per sec) The number of times global transactionswere started (per second) during the interval. The valid format is a decimal(formatted to three decimal places).
Global Transactions Begun The total number of global transactions that the serverbegan during the interval. The valid format is a positive integer.
Global Transactions Committed The number of global transactions that werecompleted during the interval. The valid format is a positive integer.
Global Transactions Involve Rate (per sec) The number of times (per second)global transactions were involved during the interval. The valid format is apositive integer.
Global Transactions Involved The number of global transactions that wereinvolved at the server during the interval, including transactions that were begunor imported. The valid format is a positive integer.
Global Transactions Rolled Back The total number of global transactions thatwere undone because they could not complete during the interval. The validformat is a positive integer.
Global Transactions Optimized The number of global transactions converted tosingle phase for optimization since the previous sample. The valid format is apositive integer.
Instrumentation Level The instrumentation level for this container. For WebSphere6 or higher, the valid values are None, Basic, Extended, All, Custom. Blank if noinstrumentation level is set.
Interval (sec) The length (in seconds) of the interval. The valid format is a positiveinteger.
Local Transaction before Completion Duration (ms) The average duration beforecompletion for local transactions during the interval. The valid format is a decimal(formatted to three decimal places).
Local Transaction before Completion Duration Count The count of times thatwere averaged for Local Transaction before Completion Duration. The valid formatis a 4-byte integer. If the number is too big to be stored, a value of -2 is used.
168 ITCAM Agents for WebSphere Applications, J2EE, and HTTP Servers: User Guide

Local Transaction Commit Duration (ms) The average duration for commit forlocal transactions during the interval. The valid format is a decimal (formatted tothree decimal places).
Local Transaction Commit Duration Count The count of times that were averagedfor Local Transaction Commit Duration. The valid format is a 4-byte integer. If thenumber is too big to be stored, a value of -2 is used.
Local Transaction Commit Rate (per sec) The number of local transactions (persecond) committed during the interval. The valid format is a decimal (formatted tothree decimal places).
Local Transaction Duration (ms) The average duration (in milliseconds) of localtransactions during the interval. The valid format is a decimal (formatted to threedecimal places).
Local Transaction Duration Count The count of times that were averaged forLocal Transaction Duration. The valid format is a 4-byte integer. If the number istoo big to be stored, a value of -2 is used.
Local Transaction Rollback Rate (per sec) The number of times (per second) thatlocal transactions were undone because they could not be completed during theinterval. The valid format is a decimal (formatted to three decimal places).
Local Transaction Timeout Rate (per sec) The number of local transactions thattimed out per second during the interval. The valid format is a decimal (formattedto three decimal places).
Local Transaction Timeouts The number of local transactions that timed outduring the interval. The valid format is a positive integer.
Local Transactions Active The number of concurrently active local transactionsrunning in the container during the interval. Local transactions involve a singleresource manager. The valid format is a decimal (formatted to three decimalplaces).
Local Transactions Begin Rate (per sec) The number of times (per second) localtransactions were started during the interval. The valid format is a positive integer.
Local Transactions Begun The number of local transactions begun at the serversince the previous sample. The valid format is a positive integer.
Local Transactions Committed The number of local transactions committed duringthe interval. The valid format is a positive integer.
Local Transactions Rolled Back The number of local transactions that wereundone during the interval. The valid format is a positive integer.
Node Name The name of the system on which the server is running. The validformat is an alphanumeric string, with a maximum of 256 characters.
Origin Node The name of the server subnode. The valid format is analphanumeric string, with a maximum of 128 characters.
Sample Date and Time The date and time the Tivoli Enterprise Monitoring Agentcollected the data. The valid format is a 12-character timestamp. For the STR and
Chapter 3. ITCAM Agent for WebSphere Applications 169

SCAN functions, the format is MM/DD/YY HH:MM:SS; the following table showsthe values contained in this character string:
Table 22. Format of the 12-character timestamp
Character String Meaning
MM Month
DD Day
YY Year
HH Hour
MM Minute
SS Second
Example: 09/13/06 18:32:03 indicates the data was collected on September 13 2006,at 18:32:03.
This attribute was designed for logging and reporting data-collection times ratherthan for creating situations. To specify a time and date for comparison and testing,use attributes from the Universal Time or Local Time groups.
Server Name The name of the application server. The valid format is analphanumeric string, with a maximum of 256 characters.
Set Instrumentation Level Type Indicates the WebSphere resource category, whichis used by the agent to modify the Instrumentation Level for transaction datacollection.
For more information, see:v Organization of the predefined workspacesv Attribute groups used by the predefined workspaces
Data sources attributesThe Data sources attributes provide database usage information.
These attributes provide traffic information such as, response times for databaserequests, the frequencies at which database connections are created and destroyed,and how often databases are accessed. The attributes within this group are used tobuild the Datasources workspace.
Important: The attributes within this attribute group contain meaningful valuesonly if your site has set the request data monitoring level to Level2 to collect dataon data source requests.
Application ID The unique identifier that is assigned automatically when theapplication is first configured and is preserved during the whole application lifecycle. The valid format is a positive integer or -1 which means that Application IDis aggregated statistic for all applications.
ASID The identifier (decimal) assigned to the address space running this servantregion.
170 ITCAM Agents for WebSphere Applications, J2EE, and HTTP Servers: User Guide

Average Processing Time (ms) The total average processing time (in milliseconds)that the data source is used by an application. The valid format is a decimal(formatted to three decimal places).
Processing Time Count The count of times that were averaged for AverageProcessing Time. The valid format is a 4-byte integer. If the number is too big to bestored, a value of -2 is used.
Average Query Processing Time (ms) The average time (in milliseconds) perrequest used by queries to the data source. The valid format is a decimal(formatted to three decimal places).
Average Update Processing Time (ms) The average time (in milliseconds) perrequest used by updates to the data source. The valid format is a decimal(formatted to three decimal places).
Connection Average Wait Time (ms) The average time (in milliseconds) thatapplications had to wait for a connection. The valid format is a decimal (formattedto three decimal places).
Connection Count The number of connections to the data source. The valid formatis a positive integer.
Connection Max Wait Time (ms) The worst-case time (in milliseconds) thatapplications had to wait for a connection. The valid format is a positive integer.
Connection Rate (per sec) The number of connection requests (per second) createdfor the data source. The valid format is a decimal (formatted to three decimalplaces).
Connection Total Wait Time (ms) The total time (in milliseconds) that applicationshad to wait for a connection to the data source. The valid format is a positiveinteger.
Database Product The name of the database product. The valid format is analphanumeric string, with a maximum of 128 characters.
Database Product Version The version of the database product. The valid format isan alphanumeric string, with a maximum of 128 characters.
Datasource Name The name of the data source. The valid format is analphanumeric string, with a maximum of 256 characters.
Datasource Label A shortened version of Datasource Name, used to display thedata source name in the chart view. The valid format is an alphanumeric string,with a maximum of 12 characters.
Interval (sec) The length (in seconds) of the interval. The valid format is a positiveinteger.
Node Name The name of the system on which the server is running. The validformat is an alphanumeric string, with a maximum of 128 characters.
Origin Node The name of the application server subnode. The valid format is analphanumeric string, with a maximum of 128 characters.
Chapter 3. ITCAM Agent for WebSphere Applications 171

Process ID The unique identifier of the process running the Java Virtual Machine(JVM). The valid format is a positive integer.
Query Count The number of queries performed against the data source. The validformat is a positive integer.
Query Rate (per sec) The number of queries (per second) being made to the datasource. The valid format is a decimal (formatted to three decimal places).
Sample Date and Time The date and time the Tivoli Enterprise Monitoring Agentcollected the data. The valid format is a 12-character timestamp. For the STR andSCAN functions, the format is MM/DD/YY HH:MM:SS; the following table showsthe values contained in this character string:
Table 23. Format of the 12-character timestamp
Character String Meaning
MM Month
DD Day
YY Year
HH Hour
MM Minute
SS Second
Example: 09/13/06 18:32:03 indicates the data was collected on September 13 2006,at 18:32:03.
This attribute was designed for logging and reporting data-collection times ratherthan for creating situations. To specify a time and date for comparison and testing,use attributes from the Universal Time or Local Time groups.
Sampling Rate (%) The percentage of edge requests-such as servlets and JSPs-thatwere sampled for data source requests during the interval. The valid format is apositive integer.
Server Name The name of the WebSphere application server. The valid format isan alphanumeric string, with a maximum of 256 characters.
Summary Indicates that this row is a summary row of statistical totals for all rows.
Total Query Processing Time (ms) The total time (in milliseconds) used to processqueries made to the data source. The valid format is a positive integer.
Total Update Processing Time (ms) The total time (in milliseconds) used to updatethe data source. The valid format is a positive integer.
Total Wait Time (ms) The time (in milliseconds) that applications had to wait forconnections to the data source. The valid format is a positive integer.
Update Count The number of updates performed against the data source. Thevalid format is a positive integer.
Update Rate (per sec) The number of updates (per second) made to the datasource. The valid format is a decimal (formatted to three decimal places).
172 ITCAM Agents for WebSphere Applications, J2EE, and HTTP Servers: User Guide

For additional information, see:v Organization of the predefined workspacesv Attribute groups used by the predefined workspaces
DB Connection Pools attributesThe DB Connection Pools attributes provide information about the databaseconnection pool for each defined data source, and an aggregated value thataggregates over all data sources.
Examples of DB Connection Pools include; the number of threads waiting for aconnection and the number of connections created and released. Use the DBConnection Pools attributes to analyze JDBC performance for WebSphereapplication server applications. The attributes within this group are used to buildthe DB Connection Pools and the Pool Analysis workspaces.
Important:
v The attributes within this attribute group contain zeros for performance data ifyour site set configuration value Resource Data Collection Method to OnDemand (for on-demand sampling) and you have not yet run applications thatgenerate performance data. To report performance data in these attributes afterinstalling and configuring the data collector, use the WebSphere administrativeconsole to set the appropriate PMI instrumentation level.
v The Tivoli Enterprise Monitoring Agent is set by default to provide on-demandsampling; thus the attributes within this attribute group initially contain zerosuntil you select the workspace and then select it again later. Each time you selectthe workspace, these attributes are updated with the latest data.
Tip: For information about WebSphere PMI metrics, see “WebSphere PMI AttributeMapping” on page 373.
Application ID Indicates JEE application ID.
Average Free Pool Size Indicates the average size of the pool based upon thenumber of free connections.
Average Pool Size The average size of the pool (based upon the number ofconnections) during the interval. The valid format is a decimal (formatted to threedecimal places). This value is an average of several values collected over aninterval. The interval can be either between this time and the previous time youactivated this workspace, or fixed (normally 60 seconds), depending on theconfiguration of the Monitoring Agent.
Average Usage Time (ms) The average time (in milliseconds) a connection was inuse; blank if no transactions are completed during the interval. The valid format isa decimal (formatted to three decimal places).
Usage Time Count The count of times that were averaged for Average UsageTime. The valid format is a 4-byte integer. If the number is too big to be stored, avalue of -2 is used.
Average Wait Time (ms) The average time (in milliseconds) a client waited for aconnection; blank if no transactions are completed during the interval. The validformat is a decimal (formatted to three decimal places).
Chapter 3. ITCAM Agent for WebSphere Applications 173

Wait Time Count The count of times that were averaged for Average Wait Time.The valid format is a 4-byte integer. If the number is too big to be stored, a valueof -2 is used.
Average Waiting Threads The average number of threads waiting for a connectionduring the interval. The valid format is a decimal (formatted to three decimalplaces). This value is an average of several values collected over an interval. Theinterval can be either between this time and the previous time you activated thisworkspace, or fixed (normally 60 seconds), depending on the configuration of theMonitoring Agent.
Connection Allocation Rate (per sec) The connections allocated (per second) forthe interval since the previous sample. The valid format is a decimal (formatted tothree decimal places).
Connection Creation Rate (per sec) The connections created (per second) duringthe interval. The valid format is a decimal (formatted to three decimal places).
Connection Destruction Rate (per sec) The connections released (per second)during the interval. The valid format is a positive integer.
Connection Handle Indicates the number of Connection objects in use for aparticular connection pool.
Connection Used The number of managed connection objects in use for aparticular EIS product name. The valid format is a positive integer.
Connections Allocated The number of connections allocated during the interval.The valid format is a positive integer.
Connections Created The number of connections created during the interval. Thevalid format is a positive integer.
Connections Destroyed The number of connections released during the interval.The valid format is a positive integer.
Connections Granted The sum of connections allocated and connections createdduring the interval. The valid format is a positive integer.
Datasource Label The abbreviated name of the data source. The valid format is analphanumeric string, with a maximum of 32 characters.
Datasource Name The name of the data source. The valid format is analphanumeric string, with a maximum of 256 characters.
Instrumentation Level The instrumentation level for the database connection poolfor the data source. For WebSphere 5, the valid values are None, Low, Medium,High, and Maximum; for WebSphere 6 or higher, the valid values are None, Basic,Extended, All, Custom. Blank if no instrumentation level is set.
Interval (sec) The length (in seconds) of the interval. The valid format is a positiveinteger.
JDBC Time (ms) Indicates the amount of time spent running in the JDBC driverwhich includes time spent in the JDBC driver, network, and database.
174 ITCAM Agents for WebSphere Applications, J2EE, and HTTP Servers: User Guide

JDBC Time Count The count of times that were used for JDBC Time. The validformat is a 4-byte integer. If the number is too big to be stored, a value of -2 isused.
Maximum Pool Size The maximum number of connections that can be created inthis connection pool. The valid format is a positive integer.
Node Name The name of the system on which the server is running. The valueformat is an alphanumeric string, with a maximum of 256 characters.
Origin Node The name of the server subnode. The valid format is analphanumeric string, with a maximum of 128 characters.
Pool Size Indicates the size of the connection pool.
Percent of Time Pool at Max The average percentage of time the number ofconnections in the pool reached the maximum number during the interval. Thevalid format is a decimal (formatted to three decimal places). This value is anaverage of several values collected over an interval. The interval can be eitherbetween this time and the previous time you activated this workspace, or fixed(normally 60 seconds), depending on the configuration of the Monitoring Agent.
Percent Used The average percentage of the connection pool in use during theinterval. The valid format is a decimal (formatted to three decimal places). Thisvalue is an average of several values collected over an interval. The interval can beeither between this time and the previous time you activated this workspace, orfixed (normally 60 seconds), depending on the configuration of the MonitoringAgent.
Percent Used Bad The bad percent of pool usage by application. The valid formatis a positive integer.
Percent Used Fair The fair percent of pool usage by application. The valid formatis a positive integer.
Percent Used Good The good percent of pool usage by application. The validformat is a positive integer.
Prep Statement Cache Discard Rate (per sec) The cache discards (per second) ofprepared statements during the interval. The valid format is a decimal (formattedto three decimal places).
Prep Statement Cache Discards The number of prepared statements discardedfrom the cache during the interval. The valid format is a positive integer.
Pool Size Indicates the size of the connection pool.
Return Count The number of connections that applications returned to the poolduring the interval. The valid format is a positive integer.
Return Rate (per sec) The number of connections (per second) returned since theprevious sample. The valid format is a decimal (formatted to three decimal places).
Sample Date and Time The date and time the Tivoli Enterprise Monitoring Agentcollected the data. The valid format is a 12-character timestamp. For the STR and
Chapter 3. ITCAM Agent for WebSphere Applications 175

SCAN functions, the format is MM/DD/YY HH:MM:SS; the following table showsthe values contained in this character string:
Table 24. Format of the 12-character timestamp
Character String Meaning
MM Month
DD Day
YY Year
HH Hour
MM Minute
SS Second
Example: 09/13/06 18:32:03 indicates the data was collected on September 13 2006,at 18:32:03.
This attribute was designed for logging and reporting data-collection times ratherthan for creating situations. To specify a time and date for comparison and testing,use attributes from the Universal Time or Local Time groups.
Server Name The name of the application server. The valid format is analphanumeric string, with a maximum of 256 characters.
Set Instrumentation Level Type Indicates the WebSphere resource category, whichis used by the agent to modify the Instrumentation Level for transaction datacollection.
Summary of All DB Connections Whether this row is a summary row ofstatistical totals collected for all the DB connection pools. Valid values are No andYes.
Thread Timeout Rate (per sec) The number of threads (per second) that timed outduring the interval. The valid format is a decimal (formatted to three decimalplaces).
Threads Timed Out The number of threads that timed out while waiting for aconnection during the interval. The valid format is a positive integer.
Total Usage (ms) The total time (in milliseconds) the connection object used. Thevalid format is a decimal (formatted to three decimal places).
Total Wait (ms) The total time (in milliseconds) the connection object waited. Thevalid format is a decimal (formatted to three decimal places).
For additional information, see:v Organization of the predefined workspacesv Attribute groups used by the predefined workspaces
DC Messages attributesThe DC Messages attributes provide message information from WebSphere datacollector.
The attributes within this group are used to build the Log Analysis workspace.
176 ITCAM Agents for WebSphere Applications, J2EE, and HTTP Servers: User Guide

ASID The identifier (decimal) assigned to the address space running this servantregion.
Component The name of the component that caused the error. The value format isan alphanumeric string, with a maximum of 32 characters.
Event Date and Time The date and time the event occurred. The valid format is a12-character timestamp. For the STR and SCAN functions, the format isMM/DD/YY HH:MM:SS; the following table shows the values contained in thischaracter string:
Table 25. Format of the 12-character timestamp
Character String Meaning
MM Month
DD Day
YY Year
HH Hour
MM Minute
SS Second
Example: 09/13/06 18:32:03 indicates the data was collected on September 13 2006,at 18:32:03.
This attribute was designed for logging and reporting data-collection times ratherthan for creating situations. To specify a time and date for comparison and testing,use attributes from the Universal Time or Local Time groups.
File Name The name of the file. The valid format is an alphanumeric string, with amaximum of 256 characters.
Message Description The description of the message. The valid format is analphanumeric string, with a maximum of 256 characters.
Message ID The unique identifier of the message. The valid format is analphanumeric string, with a maximum of eight characters.
Method Name The name of the method. The valid format is an alphanumericstring, with a maximum of 256 characters.
Node Name The name of the system on which the server is running. The valueformat is an alphanumeric string, with a maximum of 128 characters.
Origin Node The name of the server subnode. The valid format is analphanumeric string, with a maximum of 128 characters.
Process ID Indicates the process ID of the JVM.
Sequence Number The sequence number in the JMX notifications stream. Thevalid format is a positive integer.
Server Name The name of the application server. The valid format is analphanumeric string, with a maximum of 256 characters.
Chapter 3. ITCAM Agent for WebSphere Applications 177

Severity The severity of the message. Valid values are Info, Warning, Error, andSevere.
Thread ID The identifier of the thread where the event occurred. The valid formatis an alphanumeric string, with a maximum of 16 characters.
For additional information, see:v Organization of the predefined workspacesv Attribute groups used by the predefined workspaces
DCS Stack attributesThe DCS Stack attributes reports information about the statistical data within theentire WebSphere application server domain, including multiple nodes and servers.
Examples of DCS Stack attributes include; the incoming and outgoing messagesize, the number of incoming and outgoing messages, congestion events, andmessage buffer reallocations. The attributes within this group are used to build theDCS Stacks workspace.
Important:
v The attributes within this attribute group contain zeros for performance data ifyour site has set configuration value Resource Data Collection Method to OnDemand (for on-demand sampling) and if you have not yet run applications thatgenerate performance data. To report performance data in these attributes afterinstalling and configuring the data collector, use the WebSphere administrativeconsole to set the appropriate PMI instrumentation level.
v The Tivoli Enterprise Monitoring Agent is set by default to provide on-demandsampling; thus the attributes within this attribute group initially contain zerosuntil you select the workspace and select it again later. Each time you select theworkspace, these attributes are updated with the latest data.
Tip: For information about WebSphere PMI metrics, see “WebSphere PMI AttributeMapping” on page 373.
Average Incoming Message Size The average size (in bytes) of the messages thatwere received by the DCS stack. The valid format is a positive integer.
Average Incoming Message Size Count The count of individual message sizes thatwere averaged for Average Incoming Message Size. The valid format is a 4-byteinteger. If the number is too big to be stored, a value of -2 is used.
Average Outgoing Message Size The average size (in bytes) of the messages thatwere sent through the DCS stack. The valid format is a positive integer.
Average Outgoing Message Size Count The count of individual message sizes thatwere averaged for Average Outgoing Message Size. The valid format is a 4-byteinteger. If the number is too big to be stored, a value of -2 is used.
Coalesce Time The amount of time it actually takes to coalesce a view. The validformat is a decimal (formatted to three decimal places).
Coalesce Time Count The count of times that were used for Coalesce Time. Thevalid format is a 4-byte integer. If the number is too big to be stored, a value of -2is used.
178 ITCAM Agents for WebSphere Applications, J2EE, and HTTP Servers: User Guide

DCS Stack Name The name of the Topic Space. The value format is analphanumeric string, with a maximum of 256 characters.
Group Size The size of the group the local member belongs to. The valid format isa positive integer.
High Severity Congestion Events The number of times that a high severitycongestion event for outgoing messages was raised. The valid format is a positiveinteger.
Incoming Messages The number of messages received by the DCS stack. The validformat is a decimal (formatted to three decimal places).
Instrumentation Level The instrumentation level for the DCS stack. ForWebSphere 6 or higher, the valid values are None, Basic, Extended, All, Custom.Blank if no instrumentation level is set.
Interval (sec) The length (in seconds) of the sampling interval. The valid format isa positive integer.
Join View Change Time The time to do a merge view change. The DCS stack isblocked during this time. The valid format is a decimal (formatted to three decimalplaces).
Join View Change Time Count The count of times that were used for Join ViewChange Time. The valid format is a 4-byte integer. If the number is too big to bestored, a value of -2 is used.
Maximum Incoming Message Size The maximal size (in bytes) of the messagesthat were received by the DCS stack. The valid format is a positive integer.
Maximum Outgoing Message Size The maximal size (in bytes) of the messagesthat were sent through the DCS stack. The valid format is a positive integer.
Message Buffer Reallocations The number of message buffer reallocations due toinadequate buffer size. If this number is larger than 20 percent of the number ofsent messages, contact IBM Support. The valid format is a positive integer.
Minimum Incoming Message Size The minimal size (in bytes) of the messagesthat were received by the DCS stack. The valid format is a positive integer.
Minimum Outgoing Message Size The minimal size (in bytes) of the messagesthat were sent through the DCS stack. The valid format is a positive integer.
Node Name The name of the system on which the server is running. The valueformat is an alphanumeric string, with a maximum of 256 characters.
Origin Node The name of the server subnode. The valid format is analphanumeric string, with a maximum of 128 characters.
Outgoing Messages The number of messages sent through the DCS stack. Thevalid format is a positive integer.
Remove View Change Time The time to do a split view change. The DCS stack isblocked during this time. The valid format is a decimal (formatted to 3 decimalplaces).
Chapter 3. ITCAM Agent for WebSphere Applications 179

Remove View Change Time Count The count of times that were used for RemoveView Change Time. The valid format is a 4-byte integer. If the number is too big tobe stored, a value of -2 is used.
Row Number The row number. The valid format is a positive integer.
Sample Date and Time The date and time the Tivoli Enterprise Monitoring Agentcollected the data. The valid format is a 12-character timestamp. For the STR andSCAN functions, the format is MM/DD/YY HH:MM:SS; the following table showsthe values contained in this character string:
Table 26. Format of the 12-character timestamp
Character String Meaning
MM Month
DD Day
YY Year
HH Hour
MM Minute
SS Second
Example: 09/13/06 18:32:03 indicates the data was collected on September 13 2006,at 18:32:03.
This attribute was designed for logging and reporting data-collection times ratherthan for creating situations. To specify a time and date for comparison and testing,use attributes from the Universal Time or Local Time groups.
Server Name The name of the application server. The valid format is analphanumeric string, with a maximum of 256 characters.
Sent Messages The number of messages sent through the DCS stack. The validformat is a positive integer.
Summary Whether this row is a summary row of statistical totals for all rows.Valid values are No and Yes.
Suspicions The number of times that the local member suspected other members.The valid format is a positive integer.
Synchronization Completion Time The amount of time needed to guarantee thatall view members are synchronized. The valid format is a decimal (formatted tothree decimal places).
Synchronization Completion Time Count The count of times that were used forSynchronization Completion Time. The valid format is a 4-byte integer. If thenumber is too big to be stored, a value of -2 is used.
Synchronization Timeouts The number of times that the synchronizationprocedure timed out. The valid format is a positive integer.
View Changes The number of times that this member underwent view changes.The valid format is a positive integer.
180 ITCAM Agents for WebSphere Applications, J2EE, and HTTP Servers: User Guide

For additional information, see:v Organization of the predefined workspacesv Attribute groups used by the predefined workspaces
Durable Subscriptions attributesThe Durable Subscriptions attributes display overall statistics about the durablesubscriptions of a selected topic.
A durable subscription can be used to preserve messages published on a topicwhile the subscriber is not active. The attributes within this group are used tobuild the Durable Subscriptions workspace.
Important:
v The attributes in this attribute group contain zeros for performance data if yoursite has set configuration value Resource Data Collection Method to On Demand(for on-demand sampling) and if you have not yet run applications that generateperformance data. To report performance data in these attributes after installingand configuring the data collector, use the WebSphere administrative console toset the appropriate PMI instrumentation level.
v The Tivoli Enterprise Monitoring Agent is set by default to provide on-demandsampling; thus the attributes within this attribute group initially contain zerosuntil you select the workspace and select it again later. Each time you select theworkspace, these attributes are updated with the latest data.
v Attributes in this group are only provided for IBM WebSphere application serverversion 6.0 or later.
Tip: For information about WebSphere PMI metrics, see “WebSphere PMI AttributeMapping” on page 373.
Aggregate Message Wait Time The time spent by messages in the bus atconsumption. If this time is not what was expected, view the message using theadmin console to decide what action needs to be taken. The valid format is apositive integer.
Aggregate Message Wait Time Count The count of times that were used forAggregate Message Wait Time. The valid format is a 4-byte integer. If the numberis too big to be stored, a value of -2 is used.
Assured Persistent Messages Consumed The number of Assured Persistentmessages consumed, for the lifetime of this messaging engine. The valid format isa positive integer.
Available Message The number of messages waiting to be consumed. The validformat is a positive integer.
Best Effort Non-persistent Messages Consumed The number of best effortnon-persistent messages consumed, for the lifetime of this messaging engine. Thevalid format is a positive integer.
Express® Non-persistent Messages Consumed The number of expressnon-persistent messages consumed, for the lifetime of this messaging engine. Thevalid format is a positive integer.
Chapter 3. ITCAM Agent for WebSphere Applications 181

Instrumentation Level The instrumentation level for the Durable Subscriptions.For WebSphere 6 or higher, the valid values are None, Basic, Extended, All,Custom. Blank if no instrumentation level is set.
Interval (sec) The length (in seconds) of the sampling interval. The valid format isa positive integer.
Local Oldest Message Age The longest time any message has spent on thissubscription. If this time is not what was expected, view the message using theadmin console to decide what action needs to be taken. The valid format is apositive integer.
Local Oldest Message Age Count The count of individual message ages that wereused for Local Oldest Message Age. The valid format is a 4-byte integer. If thenumber is too big to be stored, a value of -2 is used.
Local Message Wait Time The time spent by messages on this durablesubscription at consumption. If this time is not what was expected, view themessage using the admin console to decide what action needs to be taken. Thevalid format is a positive integer.
Local Message Wait Time Count The count of times that were used for LocalMessage Wait Time. The valid format is a 4-byte integer. If the number is too big tobe stored, a value of -2 is used.
Messaging Engine Name The name of the message engine. The value format is analphanumeric string, with a maximum of 256 characters.
Node Name The name of the system on which the server is running. The valueformat is an alphanumeric string, with a maximum of 256 characters.
Origin Node The name of the server subnode. The valid format is analphanumeric string, with a maximum of 128 characters.
Reliable Non-persistent Messages Consumed The number of reliablenon-persistent messages consumed, for the lifetime of this messaging engine. Thevalid format is a positive integer.
Reliable Persistent Messages Consumed The number of Reliable Persistentmessages consumed, for the lifetime of this messaging engine. The valid format isa positive integer.
Sample Date and Time The date and time the Tivoli Enterprise Monitoring Agentcollected the data. The valid format is a 12-character timestamp. For the STR andSCAN functions, the format is MM/DD/YY HH:MM:SS; the following table showsthe values contained in this character string:
Table 27. Format of the 12-character timestamp
Character String Meaning
MM Month
DD Day
YY Year
HH Hour
MM Minute
182 ITCAM Agents for WebSphere Applications, J2EE, and HTTP Servers: User Guide

Table 27. Format of the 12-character timestamp (continued)
Character String Meaning
SS Second
Example: 09/13/06 18:32:03 indicates the data was collected on September 13 2006,at 18:32:03.
This attribute was designed for logging and reporting data-collection times ratherthan for creating situations. To specify a time and date for comparison and testing,use attributes from the Universal Time or Local Time groups.
Server Name The name of the application server. The valid format is analphanumeric string, with a maximum of 256 characters.
Subscription Name The name of the subscriptions. The valid format is analphanumeric string, with a maximum of 256 characters.
Summary Whether this row is a summary row of statistical totals for all rows.Valid values are No and Yes.
Topic Space Name The name of the topic space. The valid format is analphanumeric string, with a maximum of 256 characters.
Total Messages Consumed The total number of messages consumed from thisdurable subscription. The valid format is a positive integer.
For additional information, see:v Organization of the predefined workspacesv Attribute groups used by the predefined workspaces
Dynamic Cache attributesThe Dynamic Cache attribute group provides information about the dynamiccache.
WebSphere application server consolidates several caching activities, includingservlets, web services, and WebSphere commands, into one service called thedynamic cache. These caching activities work together to improve applicationperformance and share many configuration parameters, which are set in anapplication server dynamic cache service. The dynamic cache works within anapplication server Java Virtual Machine (JVM), intercepting calls to cacheableobjects, for example, through a servlet service method or an execute method of acommand. It either stores the object output to, or serves the object content from,the dynamic cache.
The attributes within this group are used to build the Cache Analysis workspace.
Important:
v The attributes within this attribute group contain zeros for performance data ifyour site has set configuration value Resource Data Collection Method to OnDemand (for on-demand sampling) and if you have not yet run applications thatgenerate performance data. To report performance data in these attributes afterinstalling and configuring the data collector, use the WebSphere administrativeconsole to set the appropriate PMI instrumentation level.
Chapter 3. ITCAM Agent for WebSphere Applications 183

v The Tivoli Enterprise Monitoring Agent is set by default to provide on-demandsampling; thus the attributes within this attribute group initially contain zerosuntil you select the workspace and select it again later. Each time you select theworkspace, these attributes are updated with the latest data.
Tip: For information about WebSphere PMI metrics, see “WebSphere PMI AttributeMapping” on page 373.
Cache Instance Name Indicates the cache instance name.
Cache Instance Type Indicates Cache instance type.
Current In-Memory Cache Size The number of cache entries currently in memory.The valid format is a positive integer.
In-Memory and Disk Timeout Rate (per sec) The rate (per second) of totalin-memory and disk timeouts for the sampling interval. The valid format is adecimal (formatted to three decimal places).
In-Memory and Disk Timeouts The total number of in-memory and disk timeoutsduring the sampling interval. The valid format is a positive integer.
Instrumentation Level The instrumentation level for the dynamic cache. ForWebSphere 6 or higher, the valid values are None, Basic, Extended, All, Custom.Blank if no instrumentation level is set.
Interval (sec) The length (in seconds) of the sampling interval. The valid format isa positive integer.
Maximum In-Memory Cache Size The maximum number of cache entries inmemory. The valid format is a positive integer.
Node Name The name of the system on which the server is running. The validformat is an alphanumeric string, with a maximum of 128 characters.
Origin Node The name of the server subnode. The valid format is analphanumeric string, with a maximum of 128 characters.
Sample Date and Time The date and time the Tivoli Enterprise Monitoring Agentcollected the data. The valid format is a 12-character timestamp. For the STR andSCAN functions, the format is MM/DD/YY HH:MM:SS; the following table showsthe values contained in this character string:
Table 28. Format of the 12-character timestamp
Character String Meaning
MM Month
DD Day
YY Year
HH Hour
MM Minute
SS Second
184 ITCAM Agents for WebSphere Applications, J2EE, and HTTP Servers: User Guide

Example: 09/13/06 18:32:03 indicates the data was collected on September 13 2006,at 18:32:03.
This attribute was designed for logging and reporting data-collection times ratherthan for creating situations. To specify a time and date for comparison and testing,use attributes from the Universal Time or Local Time groups.
Server Name The name of the WebSphere application server. The valid format isan alphanumeric string, with a maximum of 256 characters.
Set Instrumentation Level Type Indicates the WebSphere resource category, whichis used by the agent to modify the Instrumentation Level for transaction datacollection.
Summary of Cache Indicates that this row is a summary row of statistical totalscollected for all the cache object types.
PMI Enable The valid format is a 4-byte integer.
For additional information, see:v Organization of the predefined workspacesv Attribute groups used by the predefined workspaces
Dynamic Cache Templates attributesThe Dynamic Cache Templates attribute group provides information about thecache template data.
A cache template is an object type defined by a cache policy specified in theWebSphere application server cachespec.xml file. A cache policy specifies the cacherules indicating what is cached, the invalidation, timeout conditions, and otherdata. The attributes within this group are used to build the Cache Analysisworkspace.
Important:
v The attributes within this attribute group contain zeros for performance data ifyour site has set configuration value Resource Data Collection Method to OnDemand (for on-demand sampling) and if you have not yet run applications thatgenerate performance data. To report performance data in these attributes afterinstalling and configuring the data collector, use the WebSphere administrativeconsole to set the appropriate PMI instrumentation level.
v The Tivoli Enterprise Monitoring Agent is set by default to provide on-demandsampling; thus the attributes within this attribute group initially contain zerosuntil you select the workspace and select it again later. Each time you select theworkspace, these attributes are updated with the latest data.
Tip: For information about WebSphere PMI metrics, see “WebSphere PMI AttributeMapping” on page 373.
Cache Instance Name The cache instance name.
Cache Instance Type The cache instance type.
Chapter 3. ITCAM Agent for WebSphere Applications 185

Cache Miss Rate (per sec) The rate (per second) of requests for this cacheableobject type that were not found in the cache during the sampling interval. Thevalid format is a decimal (formatted to three decimal places).
Cache Misses The number of requests for this cacheable object type that were notfound in the cache (in memory, on disk or on other cooperating caches). Thiswould have caused the underlying servlet or command to be executed in order toobtain the results. The valid format is a positive integer.
Cache Object Type The name of the object type specified in the cache policy of thecache spec XML file. The valid format is an alphanumeric string, with a maximumof 256 characters.
Client Request Rate (per sec) The request rate (per second) for this cacheableobject type made by clients directly accessing this application server. The validformat is a decimal (formatted to three decimal places).
Client Requests The number of requests for this cacheable object type made byclients directly accessing this application server. The valid format is a positiveinteger.
Cluster Request Rate (per sec) The request rate (per second) for this cacheableobject type made by cooperating caches in this cluster. The valid format is adecimal (formatted to three decimal places).
Cluster Requests The number of requests for this cacheable object type made bycooperating caches in this cluster. The valid format is a positive integer.
Current Cache Size The current number of entries for this cacheable object typepresent in the dynamic cache. The valid format is a positive integer.
Disk Hit Rate (per sec) The rate (per second) of the requests for this cacheableobject type served from disk during the sampling interval. The valid format is adecimal (formatted to three decimal places).
Disk Hits The number of requests for this cacheable object type that were servedfrom disk. This applies only when the disk offload is turned on for the dynamiccache. The valid format is a positive integer.
Explicit Disk Invalidations Rate (per sec) The rate at which the entries of thiscacheable object type were removed from disk due to explicit invalidations issuedby the clients. The valid format is a decimal (formatted to three decimal places).
Explicit Disk Invalidations The number of entries of this cacheable object typethat were removed from disk due to explicit invalidations issued by the clients(directly accessing the application server and by remote JVMs in the cluster). Thevalid format is a positive integer.
Explicit Local Invalidation Rate (per sec) The rate at which the explicitinvalidations were received for this cacheable object type from clients accessing theapplication server directly, either programmatically or by a cache policy. The validformat is a decimal (formatted to three decimal places).
Explicit Local Invalidations The number of explicit invalidations received for thiscacheable object type from clients accessing the application server directly, eitherprogrammatically or by a cache policy. The valid format is a positive integer.
186 ITCAM Agents for WebSphere Applications, J2EE, and HTTP Servers: User Guide

Explicit Memory Invalidation Rate (per sec) The rate at which the entries of thiscacheable object type were removed from memory due to explicit invalidationsissued by the clients. The valid format is a decimal (formatted to three decimalplaces).
Explicit Memory Invalidations The number of entries of this cacheable object typethat were removed from memory due to explicit invalidations issued by the clients(directly accessing the application server and by remote JVMs in the cluster). Thevalid format is a positive integer.
Explicit Remote Invalidation Rate (per sec) The rate at which explicitinvalidations were received for this cacheable object type from cooperating JVMs inthe cluster. The valid format is a decimal (formatted to three decimal places).
Explicit Remote Invalidations The number of explicit invalidations received forthis cacheable object type from cooperating JVMs in the cluster. The valid format isa positive integer.
Instrumentation Level The PMI instrumentation level set for collecting dynamiccache data. For WebSphere 6 or higher, the valid values are None, Basic, Extended,All, Custom. Blank if no instrumentation level is set.
Interval (sec) The length (in seconds) of the sampling interval. The valid format isa positive integer.
Least Recently Used Invalidation Rate (per sec) The rate (per second) at whichentries of this cacheable object type were evicted from memory by a least-recentlyused algorithm. The valid format is a decimal (formatted to three decimal places).
Least Recently Used Invalidations The number of entries of this cacheable objecttype that were evicted from memory by a least-recently-used algorithm. Thishappens when the in-memory cache becomes full and subsequent requests for newentries must be accommodated. The entries removed from memory are passivatedto disk if disk overflow is enabled. If this number is high, consider increasing thein-memory cache size. The valid format is a positive integer.
Memory Hit Rate (per sec) The rate (per second) of the requests for this cacheableobject type served from memory during the sampling interval. The valid format isa decimal (formatted to three decimal places).
Memory Hits The number of requests for this cacheable object type served frommemory. The valid format is a positive integer.
Node Name The name of the system on which the server is running. The validformat is an alphanumeric string, with a maximum of 128 characters.
Origin Node The name of the server subnode. The valid format is analphanumeric string, with a maximum of 128 characters.
Remote Cache Entries Received The number of entries received from cooperatingdynamic caches in this cluster. The valid format is a positive integer.
Remote Cache Entry Receive Rate (per sec) The rate (per second) of entriesreceived from cooperating dynamic caches in this cluster for the sampling interval.The valid format is a decimal (formatted to three decimal places).
Chapter 3. ITCAM Agent for WebSphere Applications 187

Remote Hit Rate (per sec) The rate (per second) of the requests for this cacheableobject type served from other JVMs in the cluster during the sampling interval.The valid format is a decimal (formatted to three decimal places).
Remote Hits The requests for this cacheable object type served from other JVMs inthe cluster. The valid format is a positive integer.
Sample Date and Time The date and time the Tivoli Enterprise Monitoring Agentcollected the data. The valid format is a 12-character timestamp. For the STR andSCAN functions, the format is MM/DD/YY HH:MM:SS; the following table showsthe values contained in this character string:
Table 29. Format of the 12-character timestamp
Character String Meaning
MM Month
DD Day
YY Year
HH Hour
MM Minute
SS Second
Example: 09/13/06 18:32:03 indicates the data was collected on September 13 2006,at 18:32:03.
This attribute was designed for logging and reporting data-collection times ratherthan for creating situations. To specify a time and date for comparison and testing,use attributes from the Universal Time or Local Time groups.
Server Name The name of the WebSphere application server. The valid format isan alphanumeric string, with a maximum of 256 characters.
Set Instrumentation Level Type Indicates the WebSphere resource category, whichis used by the agent to modify the Instrumentation Level for transaction datacollection.
Summary of Cache Templates Whether this row is a summary row of statisticaltotals collected for all the cache object types. The valid values are No and Yes.
Template Row Number The number of the row in the report that displays in theworkspace, which is associated with a bar in the Ten Worst Hits Rate bar chart.The valid format is an integer.
Timeout Invalidation Rate (per sec) The rate (per second) at which entries areremoved from the cache (memory or disk) because their timeout has expired. Thevalid format is a decimal (formatted to three decimal places).
Timeout Invalidations The number of entries of this cacheable object type thatwere removed from memory or disk because their timeout (as specified in thecache spec XML file) has expired. The valid format is a positive integer.
Total Explicit Invalidation Rate (per sec) The rate at which invalidations wereissued for entries for this cacheable object type explicitly by the clients. The validformat is a decimal (formatted to three decimal places).
188 ITCAM Agents for WebSphere Applications, J2EE, and HTTP Servers: User Guide

Total Explicit Invalidations The number of invalidations issued for entries of thiscacheable object type explicitly by the clients (directly accessing the applicationserver and by remote JVMs in this cluster). The valid format is a positive integer.
Total Hit Rate (per sec) The total hit rate per second. The valid format is a decimal(formatted to three decimal places).
For additional information, see:v Organization of the predefined workspacesv Attribute groups used by the predefined workspaces
EJB Containers attributesThe EJB Containers attributes provide aggregated information for each defined EJBcontainer that aggregates bean performance data for all Enterprise beans deployedto that container.
The attributes also provide aggregated information for the application server thataggregates bean performance data for all Enterprise beans deployed to theapplication server. These attributes provide load values, response times, andlifecycle activities for Enterprise beans. Use the EJB Containers attributes insituations to monitor application server load and resource usage.
The attributes within this group are used to build the EJB Containers workspace.
Important:
v The attributes within this attribute group contain zeros for performance data ifyour site has set configuration value Resource Data Collection Method to OnDemand (for on-demand sampling) and if you have not yet run applications thatgenerate performance data. To report performance data in these attributes afterinstalling and configuring the data collector, use the WebSphere administrativeconsole to set the appropriate PMI instrumentation level.
v The Tivoli Enterprise Monitoring Agent is set by default to provide on-demandsampling; thus the attributes within this attribute group initially contain zerosuntil you select the workspace and select it again later. Each time you select theworkspace, these attributes are updated with the latest data.
Tip: For information about WebSphere PMI metrics, see “WebSphere PMI AttributeMapping” on page 373.
Activate Count The number of times a bean instance was activated during theinterval. The valid format is a positive integer.
Activation Rate (per sec) The bean activations (per second) during the interval.The valid format is a decimal (formatted to three decimal places).
Active Method Count The average number of bean methods concurrently activeduring the interval. The valid format is a decimal (formatted to three decimalplaces). This value is an average of several values collected over an interval. Theinterval can be either between this time and the previous time you activated thisworkspace, or fixed (normally 60 seconds), depending on the configuration of theMonitoring Agent.
Average Concurrently Live Beans The average number of bean objectsconcurrently live during the sampling interval. The valid format is a decimal
Chapter 3. ITCAM Agent for WebSphere Applications 189

(formatted to three decimal places). This value is an average of several valuescollected over an interval. The interval can be either between this time and theprevious time you activated this workspace, or fixed (normally 60 seconds),depending on the configuration of the Monitoring Agent.
Average Concurrently Ready Beans The average number of beans concurrentlyactive during the last interval. The valid format is a decimal (formatted to threedecimal places). This value is an average of several values collected over aninterval. The interval can be either between this time and the previous time youactivated this workspace, or fixed (normally 60 seconds), depending on theconfiguration of the Monitoring Agent.
Container Name The name of the container. The valid format is an alphanumericstring, with a maximum of 64 characters.
Create Average Time (ms) The average method response time for creates duringthe interval. The valid format is a decimal (formatted to three decimal places).
Create Time Count The count of times that were averaged for Create AverageTime. The valid format is a 4-byte integer. If the number is too big to be stored, avalue of -2 is used.
Create Count The number of bean create calls during the interval. The validformat is a positive integer.
Creation Rate (per sec) The bean create calls (per second) during the interval. Thevalid format is a decimal (formatted to three decimal places).
Destroy Count The number of times bean objects were destroyed by garbagecollection during the interval. The valid format is a positive integer.
Destruction Rate (per sec) The rate at which the beans are destroyed by garbagecollection (per second) during the interval. The valid format is a decimal(formatted to three decimal places).
Entity Bean Load Count The number of times an entity bean data was loadedduring the interval. The valid format is a positive integer.
Entity Bean Load Rate (per sec) The number of entity beans (per second) thatwere loaded during the interval. The valid format is a decimal (formatted to threedecimal places).
Entity Bean Store Count The number of times entity bean data was written to thedatabase during the interval. The valid format is a positive integer.
Entity Bean Store Rate (per sec) The entity bean stores (per second) during theinterval. The valid format is a decimal (formatted to three decimal places).
Instantiate Count The number of times bean objects were instantiated during theinterval. The valid format is a positive integer.
Instantiation Rate (per sec) The number of times bean objects were instantiated(per second) during the interval. The valid format is a decimal (formatted to threedecimal places).
190 ITCAM Agents for WebSphere Applications, J2EE, and HTTP Servers: User Guide

Instrumentation Level The instrumentation level for this EJB container. ForWebSphere 6 or higher, the valid values are None, Basic, Extended, All, Custom.Blank if no instrumentation level is set.
Interval (sec) The length (in seconds) of the interval. The valid format is a positiveinteger.
Method Average Response Time (ms) The average response time (in milliseconds)on remote interface methods for all beans during the interval. The valid format is adecimal (formatted to three decimal places).
Method Response Time Count The count of bean response times averaged forMethod Average Response Time. The valid format is a 4-byte integer. If thenumber is too big to be stored, a value of -2 is used.
Method Invocation Count The number of method invocations during the interval.The valid format is a positive integer.
Method Invocation Rate (per sec) The rate of invocations (per second) during theinterval. The valid format is a decimal (formatted to three decimal places).
Node Name The name of the system on which the server is running. The valueformat is an alphanumeric string, with a maximum of 256 characters.
Origin Node The name of the server subnode. The valid format is analphanumeric string, with a maximum of 128 characters.
Passivate Count The number of times a bean instance was passivated during theinterval. The valid format is a positive integer.
Passivation Rate (per sec) The bean passivations (per second) during the interval.The valid format is a decimal (formatted to three decimal places).
Removal Rate (per sec) The bean remove calls (per second) during the interval.The valid format is a decimal (formatted to three decimal places).
Remove Average Time (ms) The average method response time for removesduring the interval. The valid format is a decimal (formatted to three decimalplaces).
Remove Time Count The count of times that were averaged for Remove AverageTime. The valid format is a 4-byte integer. If the number is too big to be stored, avalue of -2 is used.
Remove Count The number of bean remove calls during the interval. The validformat is a positive integer.
Request Count The number of requests during the interval. The valid format is apositive integer.
Sample Date and Time The date and time the Tivoli Enterprise Monitoring Agentcollected the data. The valid format is a 12-character timestamp. For the STR andSCAN functions, the format is MM/DD/YY HH:MM:SS; the following table showsthe values contained in this character string:
Chapter 3. ITCAM Agent for WebSphere Applications 191

Table 30. Format of the 12-character timestamp
Character String Meaning
MM Month
DD Day
YY Year
HH Hour
MM Minute
SS Second
Example: 09/13/06 18:32:03 indicates the data was collected on September 13 2006,at 18:32:03.
This attribute was designed for logging and reporting data-collection times ratherthan for creating situations. To specify a time and date for comparison and testing,use attributes from the Universal Time or Local Time groups.
Server Name The name of the application server. The valid format is analphanumeric string, with a maximum of 256 characters.
Set Instrumentation Level Type Indicates the WebSphere resource category, whichis used by the agent to modify the Instrumentation Level for transaction datacollection.
Summary of All Containers Whether this row is a summary row of statisticaltotals collected for all EJB containers. The valid values are No and Yes.
Total (ms) The total time used during the interval. The valid format is a decimal(formatted to three decimal places).
Total Create (ms) The total time (in milliseconds) of bean create calls during theinterval. The valid format is a decimal (formatted to three decimal places).
Total Method Invocation (ms) The total time (in milliseconds) of methodinvocations during the interval. The valid format is a decimal (formatted to threedecimal places).
Total Remove (ms) The total time (in milliseconds) of bean remove calls during theinterval. The valid format is a decimal (formatted to three decimal places).
For additional information, see:v Organization of the predefined workspacesv Attribute groups used by the predefined workspaces
Enterprise Java Beans attributesThe Enterprise Java Beans attributes provide performance information about eachEnterprise Java Bean (EJB) deployed to the application server.
These attributes provide information about bean activity and bean object poolactivity. Use the Enterprise Java Beans attributes in situations to monitorperformance and problems for an individual bean. The attributes within this groupare used to build the Enterprise Java Beans workspace.
192 ITCAM Agents for WebSphere Applications, J2EE, and HTTP Servers: User Guide

Important:
v The attributes within this attribute group contain zeros for performance data ifyour site has set configuration value Resource Data Collection Method to OnDemand (for on-demand sampling) and if you have not yet run applications thatgenerate performance data. To report performance data in these attributes afterinstalling and configuring the data collector, use the WebSphere administrativeconsole to set the appropriate PMI instrumentation level.
v The Tivoli Enterprise Monitoring Agent is set by default to provide on-demandsampling; thus the attributes within this attribute group initially contain zerosuntil you select the workspace and reselect it later. Each time you reselect theworkspace, these attributes are updated with the latest data.
Tip: For information about WebSphere PMI metrics, see “WebSphere PMI AttributeMapping” on page 373.
Activate Count The number of times a bean instance was activated during theinterval. The valid format is a positive integer.
Activation Rate (per sec) The bean instance activations (per second) during theinterval. The valid format is a decimal (formatted to three decimal places).
Active Method Count The average number of invocations being processedconcurrently for all the methods during the interval. The valid format is a decimal(formatted to three decimal places). This value is an average of several valuescollected over an interval. The interval can be either between this time and theprevious time you activated this workspace, or fixed (normally 60 seconds),depending on the configuration of the Monitoring Agent.
Application EJB Module Name The name of the Web Application or EJB Module.The valid format is an alphanumeric string, with a maximum of 64 characters.
Average Concurrently Live Beans The average number of live bean objects duringthe interval, which include objects that were instantiated but not yet destroyed.This is a load value providing data on the average level as a function of time. It isthe average number of bean objects that exist in the run time, whether active orpooled. This is a measure of how many resources the home interface is consuming.The valid format is a decimal (formatted to three decimal places). This value is anaverage of several values collected over an interval. The interval can be eitherbetween this time and the previous time you activated this workspace, or fixed(normally 60 seconds), depending on the configuration of the Monitoring Agent.
Average Concurrently Ready Beans The average number of active beans duringthe interval. This is a load value providing data on the average level as a functionof time. It is the average number of bean instances of the home that are in theready state. This is a measure of how busy the server is. The valid format is adecimal (formatted to three decimal places). This value is an average of severalvalues collected over an interval. The interval can be either between this time andthe previous time you activated this workspace, or fixed (normally 60 seconds),depending on the configuration of the Monitoring Agent.
Average Objects Discarded The average number of objects that were discardedeach time the bean object pool was emptied of idle objects during the interval. Thevalid format is a decimal (formatted to three decimal places).
Chapter 3. ITCAM Agent for WebSphere Applications 193

Objects Discarded Count The count of objects used for Average Objects Discarded.The valid format is a 4-byte integer. If the number is too big to be stored, a valueof -2 is used.
Average Objects in Pool The average number of objects in the bean object poolduring the interval. The valid format is a decimal (formatted to three decimalplaces). This value is an average of several values collected over an interval. Theinterval can be either between this time and the previous time you activated thisworkspace, or fixed (normally 60 seconds), depending on the configuration of theMonitoring Agent.
Bean Name The name of the Enterprise JavaBean (EJB). This name prefixes theapplication name and the EJB compress name. The valid format is an alphanumericstring, with a maximum of 128 characters.
Bean Type The type of bean. Valid values are Stateless, Stateful, Entity, andMessage Driven.
Create Average Time (ms) The average method response time to create beanobjects during the interval. The valid format is a decimal (formatted to threedecimal places).
Create Time Count The count of times that were averaged for Create AverageTime. The valid format is a 4-byte integer. If the number is too big to be stored, avalue of -2 is used.
Create Count The number of create calls during the interval. The valid format is apositive integer.
Creation Rate (per sec) The create calls (per second) during the interval. The validformat is a decimal (formatted to three decimal places).
Destroy Count The average number of times bean objects were destroyed bygarbage collection during the interval. The valid format is a positive integer.
Destruction Rate The rate of destructions (per second) for bean objects by thegarbage collector during the interval. The valid format is a decimal (formatted tothree decimal places).
Discard Count The number of times the returned object to the bean object poolwas discarded because the bean object pool was already full during the interval.The valid format is a positive integer.
Discard Rate (per sec) The bean object pool discards (per second) during theinterval. The valid format is a decimal (formatted to three decimal places).
Drain Count The number of times the bean object pool was found idle and anattempt was made to remove idle objects during the interval. The valid format is apositive integer.
Drain Rate (per sec) The drain rate (per second) for the bean object pool duringthe interval. The valid format is a decimal (formatted to three decimal places).
Entity Bean Load Count The number of times bean data was loaded during theinterval. The valid format is a positive integer.
194 ITCAM Agents for WebSphere Applications, J2EE, and HTTP Servers: User Guide

Entity Bean Load Rate (per sec) The bean data loads (per second) during theinterval. The valid format is a decimal (formatted to three decimal places).
Entity Bean Store Count The number of times bean data was written to thedatabase during the interval. The valid format is a positive integer.
Entity Bean Store Rate (per sec) The rate at which data was written (per second)to the database for the interval since the previous sample. The valid format is adecimal (formatted to three decimal places).
Find Count The number of times a retrieval call found an object available in thebean object pool during the interval. The valid format is a positive integer.
Find Rate (per sec) The bean object pool retrieve availability (per second) for theinterval since the previous sample. The valid format is a decimal (formatted tothree decimal places).
Get Count The number of calls that retrieved an object from the bean object poolduring the interval. The valid format is a positive integer.
Get Rate (per sec) The number of times bean objects were retrieved (per second)during the interval. The valid format is a decimal (formatted to three decimalplaces).
Instantiate Count The number of times bean objects were created during theinterval. The valid format is a positive integer.
Instantiation Rate (per sec) The bean objects created (per second) for the intervalsince the previous sample. The valid format is a decimal (formatted to threedecimal places).
Instrumentation Level The instrumentation level of this enterprise bean. The validvalues are None, Basic, Extended, All, Custom. Blank if no instrumentation level isset.
Bean Object Pool Instrumentation Level The instrumentation level of the objectpool for this enterprise bean. The valid values are None, Low, Medium, High,Basic, Extended, All, Custom, Maximum.
Interval (sec) The length (in seconds) of the interval. The valid format is a positiveinteger.
Method Average Response Time (ms) The average response time (in milliseconds)for all methods of the remote interface for this bean during the interval. The validformat is a decimal (formatted to three decimal places).
Method Response Time Count The count of times that were averaged for MethodAverage Response Time. The valid format is a 4-byte integer. If the number is toobig to be stored, a value of -2 is used.
Method Invocation Rate (per sec) The invocations (per second) for all methodsduring the sampling interval. The Method Invocation Rate (per sec) is a load valuethat provides data on the average level as a function of time. This is a measure ofhow busy the server is. The valid format is a decimal (formatted to three decimalplaces).
Chapter 3. ITCAM Agent for WebSphere Applications 195

Method Invocations The total number of remote interface method invocationsduring the interval. The valid format is a positive integer.
Node Name The name of the system on which the server is running. The valueformat is an alphanumeric string, with a maximum of 256 characters.
Origin Node The name of the server subnode. The valid format is analphanumeric string, with a maximum of 128 characters.
Passivate Count The average number of bean objects passivated during thesampling interval. Minimum instrumentation level required to collect these data:Extended. The valid format is a decimal (formatted to three decimal places). Thisvalue is an average of several values collected over an interval. The interval can beeither between this time and the previous time you activated this workspace, orfixed (normally 60 seconds), depending on the configuration of the MonitoringAgent.
Passivation Rate (per sec) The number of passivations (per second) during theinterval since the previous sample. The valid format is a decimal (formatted tothree decimal places).
Removal Rate (per sec) The remove calls (per second) for the interval since theprevious sample. The valid format is a decimal (formatted to three decimal places).
Remove Average Time (ms) The average method response time to remove beanobjects during the interval. The valid format is a decimal (formatted to threedecimal places).
Remove Time Count The count of times that were averaged for Remove AverageTime. The valid format is a 4-byte integer. If the number is too big to be stored, avalue of -2 is used.
Remove Count The number of remove calls during the interval. The valid formatis a positive integer.
Return Count The number of calls that returned an object to the bean object poolduring the interval. The valid format is a positive integer.
Return Rate (per sec) The bean object pool returns (per second) for the intervalsince the previous sample. The valid format is a decimal (formatted to threedecimal places).
Sample Date and Time The date and time the Tivoli Enterprise Monitoring Agentcollected the data. The valid format is a 12-character timestamp. For the STR andSCAN functions, the format is MM/DD/YY HH:MM:SS; the following table showsthe values contained in this character string:
Table 31. Format of the 12-character timestamp
Character String Meaning
MM Month
DD Day
YY Year
HH Hour
MM Minute
196 ITCAM Agents for WebSphere Applications, J2EE, and HTTP Servers: User Guide

Table 31. Format of the 12-character timestamp (continued)
Character String Meaning
SS Second
Example: 09/13/06 18:32:03 indicates the data was collected on September 13 2006,at 18:32:03.
This attribute was designed for logging and reporting data-collection times ratherthan for creating situations. To specify a time and date for comparison and testing,use attributes from the Universal Time or Local Time groups.
Server Name The name of the application server. The valid format is analphanumeric string, with a maximum of 256 characters.
Set Instrumentation Level Type Indicates the WebSphere resource category, whichis used by the agent to modify the Instrumentation Level for transaction datacollection.
For additional information, see:v Organization of the predefined workspacesv Attribute groups used by the predefined workspaces
Garbage Collection Analysis attributesThe Garbage Collection Analysis attribute group provides information about thegarbage collector in the Java Virtual Machine that is hosting the application server.
The garbage collection attributes report the number of times the collector randuring the interval and the resulting number of objects that the collector freed. Usethe Garbage Collection Analysis attributes in situations to monitorgarbage-collection performance and possible problems. The attributes within thisgroup are used to build the Garbage Collection Analysis and the WebSphereapplication server workspaces.
ASID The identifier (decimal) assigned to the address space running this servantregion.
GC Rate (per min) The rate (per minute) at which the Java Virtual Machine isinvoking its garbage-collection routine. The valid format is a decimal (formatted tothree decimal places).
Heap Used (%) The percentage of heap used at the end of the interval. The validformat is a decimal (formatted to one decimal place).
Max Heap KBytes The maximum heap size for the JVM (the -Xmx parameter, ifspecified) The valid format is a 4-byte integer.
Interval (sec) The length (in seconds) of the sampling interval. The valid format isa positive integer.
Kbytes Free The total number of free kilobytes in the heap at the end of the lastgarbage-collection cycle during the interval. The valid format is a positive integer.
Chapter 3. ITCAM Agent for WebSphere Applications 197

Kbytes Total Freed by GC The total number of kilobytes freed by the garbagecollector during the interval. The valid format is a positive integer.
Kbytes Used The number of kilobytes in the heap that were in use at the end ofthe last garbage collection cycle during the interval. The valid format is a positiveinteger.
Kbytes Used Delta The difference between the Kbytes Used value for this intervaland the Kbytes Used value for the prior interval. The valid format is a positive ornegative integer.
Node Name The name of the system on which the server is running. The validformat is an alphanumeric string, with a maximum of 256 characters.
Objects Freed The number of objects the garbage collector freed during theinterval (only supported for IBM JDK). The valid format is a positive integer. Notmonitored on non-IBM Java Virtual Machines, including objects commonly used onHP-UX and Solaris platforms.
Objects Moved The number of objects the garbage collector moved during theinterval (only supported for IBM JDK). The valid format is a positive integer. Notmonitored on non-IBM Java Virtual Machines, including objects commonly used onHP-UX and Solaris platforms.
Origin Node The name of the server subnode. The valid format is analphanumeric string, with a maximum of 128 characters.
Process ID The unique identifier of the JVM process (the class ID of the JVM). Thevalid format is a positive integer.
Real Time (ms) The total real time (in milliseconds) the garbage collector requiredduring the most recent cycle. The valid format is a positive integer.
Real Time (%) The percentage of real time that the garbage collector was activeduring the interval. The valid format is a decimal (formatted to one decimal place).
Sample Date and Time The date and time the Tivoli Enterprise Monitoring Agentcollected the data. The valid format is a 12-character timestamp. For the STR andSCAN functions, the format is MM/DD/YY HH:MM:SS; the following table showsthe values contained in this character string:
Table 32. Format of the 12-character timestamp
Character String Meaning
MM Month
DD Day
YY Year
HH Hour
MM Minute
SS Second
Example: 09/13/06 18:32:03 indicates the data was collected on September 13 2006,at 18:32:03.
198 ITCAM Agents for WebSphere Applications, J2EE, and HTTP Servers: User Guide

This attribute was designed for logging and reporting data-collection times ratherthan for creating situations. To specify a time and date for comparison and testing,use attributes from the Universal Time or Local Time groups.
Server Name The name of the WebSphere application server. The valid format isan alphanumeric string, with a maximum of 256 characters.
Summary Indicates that this row is a summary row of statistical totals for all rows.
Times Run The number of times the garbage collector ran during the interval. Thevalid format is a positive integer.
For additional information, see:v Organization of the predefined workspacesv Attribute groups used by the predefined workspaces
Garbage Collection Cycle attributesThe Garbage Collection Cycle attribute group provides information about a singlegarbage-collection cycle that the Java Virtual Machine hosting the applicationserver performed.
The Garbage Collection Cycle attributes report the free heap space both before andafter garbage collection, the heap space freed, and the number of objects movedduring garbage collection. Use the Garbage Collection Cycle attributes in situationsto examine the results of a particular garbage collection.
The attributes within this group are used to build the Garbage Collections -Selected Allocation Failure workspace.
Important: This information is only collected for systems using an IBM JVM.
Allocation Failure Number The identifier assigned to the allocation-failure blockfor which the JVM ran the current garbage-collection cycle, which is associatedwith a bar in the Heap Usage - History bar chart. If your Java code calledSystem.gc to start garbage collection, this number is 0. The valid format is apositive integer.
ASID The identifier (decimal) assigned to the address space running this servantregion.
Compact (ms) The time (in milliseconds) required for the compaction phase of thegarbage-collection cycle. The valid format is a positive integer.
Compaction Reason The code describing the reason garbage collection wasinitiated. The valid format is a positive integer. The compaction codes are:
Table 33. Reasons for initiating garbage collection
Compaction Code Definition
1Insufficient free space for the allocation request followingthe mark and sweep phases.
2 The heap is fragmented and benefits from a compaction.
3 Less than 15% free space available.
4 A call to System.gc requested garbage collection.
Chapter 3. ITCAM Agent for WebSphere Applications 199

Table 33. Reasons for initiating garbage collection (continued)
Compaction Code Definition
5 Less than 5% free space available.
6 Less than 128 K free space available.
7 Parameter Xcompactgc specified.
8 The transient heap has less than 5% free space available.
9The heap is fragmented (this code marks additionalreasons for compaction apart from compaction code 2).
Final References The number of final reference objects collected during thisgarbage-collection cycle. The valid format is a positive integer.
Garbage Collection Date and Time The date and time the Java Virtual Machineinvoked the garbage collector. The valid format is a 16-character timestamp. Thisattribute was designed for logging and reporting data-collection times rather thanfor creating situations. To specify a time and date for comparison and testing, useattributes from the Universal Time or Local Time groups.
Note to Solaris and HP-UX users: Since allocation-failure information is not recordedon these platforms, this column is always empty on these platforms.
Garbage Collection Number The number of this garbage-collection cycle. Thevalid format is a positive integer.
Heap Capacity (Kbytes) The total number of kilobytes allocated to the main heapafter this garbage-collection cycle. The valid format is a positive integer.
Heap Free (%) after GC The percentage of heap space that is available after thisgarbage-collection cycle. The valid format is a decimal (formatted to one decimalplace).
Heap Space Free (Kbytes) The number of kilobytes available within the heap afterthis garbage-collection cycle. The valid format is a positive integer.
Interval (sec) The length (in seconds) of the sampling interval. The valid format isa positive integer.
KBytes Free at Start of GC The number of kilobytes available in the heap beforegarbage collection began. The valid format is a positive integer.
Kbytes Freed The number of kilobytes freed by the garbage collector. The validformat is a positive integer.
Kbytes Moved The number of kilobytes moved on the heap during thiscompaction. The valid format is a positive integer.
Kbytes Used The number of kilobytes in the heap that were in use after thisgarbage-collection cycle. The valid format is a positive integer.
Mark (ms) The time (in milliseconds) required for the mark phase of thegarbage-collection cycle. The valid format is a positive integer.
200 ITCAM Agents for WebSphere Applications, J2EE, and HTTP Servers: User Guide

Node Name The name of the system on which the server is running. The validformat is an alphanumeric string, with a maximum of 128 characters.
Objects Moved The number of objects the garbage collector moved during thiscompaction. The valid format is a positive integer.
Origin Node The name of the server subnode. The valid format is analphanumeric string, with a maximum of 128 characters.
Phantom References The number of phantom reference objects collected duringthis garbage-collection cycle. "Phantom" refers to a specific Java class that definesobject reachability. The valid format is a positive integer.
Process ID The unique identifier of the JVM process (the class ID of the JVM). Thevalid format is a positive integer.
Sample Date and Time The date and time the Tivoli Enterprise Monitoring Agentcollected the data. The valid format is a 12-character timestamp. For the STR andSCAN functions, the format is MM/DD/YY HH:MM:SS; the following table showsthe values contained in this character string:
Table 34. Format of the 12-character timestamp
Character String Meaning
MM Month
DD Day
YY Year
HH Hour
MM Minute
SS Second
Example: 09/13/06 18:32:03 indicates the data was collected on September 13 2006,at 18:32:03.
This attribute was designed for logging and reporting data-collection times ratherthan for creating situations. To specify a time and date for comparison and testing,use attributes from the Universal Time or Local Time groups.
Server Name The name of the WebSphere application server. The valid format isan alphanumeric string, with a maximum of 256 characters.
Soft References The number of soft reference objects collected during thisgarbage-collection cycle. "Soft" refers to a specific Java class that defines objectreachability. The valid format is a positive integer.
Sweep (ms) The time (in milliseconds) required for the sweep phase of thegarbage-collection cycle. The valid format is a positive integer.
Time to Complete (ms) The time (in milliseconds) required to complete thisgarbage-collection cycle. The valid format is a positive integer.
Weak References The number of weak reference objects collected during thisgarbage-collection cycle. "Weak" refers to a specific Java class that defines objectreachability. The valid format is a positive integer.
Chapter 3. ITCAM Agent for WebSphere Applications 201

For more information, see:v Organization of the predefined workspacesv Attribute groups used by the predefined workspaces
High Availability Manager attributesThe High Availability Manager attributes provide aggregated information aboutthe high availability managers.
The attributes within this group are used to build the High Availability Managerworkspace.
Important:
v The attributes within this attribute group contain zeros for performance data ifyour site has set configuration value Resource Data Collection Method to OnDemand (for on-demand sampling) and if you have not yet run applications thatgenerate performance data. To report performance data in these attributes afterinstalling and configuring the data collector, use the WebSphere administrativeconsole to set the appropriate PMI instrumentation level.
v The Tivoli Enterprise Monitoring Agent is set by default to provide on-demandsampling; thus the attributes within this attribute group initially contain zerosuntil you select the workspace and then select it again later. Each time you selectthe workspace, these attributes are updated with the latest data.
Tip: For information about WebSphere PMI metrics, see “WebSphere PMI AttributeMapping” on page 373.
Bulletin-Board Rebuild Time The time taken (in milliseconds) to rebuild theglobal state of the bulletin-board. During this time no messages are received by thesubscribers. If this time is too high, and is unacceptable, you might want toincrease the number of coordinators. The valid format is a decimal (formatted tothree decimal places).
Bulletin-Board Rebuild Time Count The count of times that were used forBulletin-Board Rebuild Time. The valid format is a 4-byte integer. If the number istoo big to be stored, a value of -2 is used.
Bulletin-Board Subjects The total number of subjects managed. The valid formatis a positive integer. This value is an average of several values collected over aninterval. The interval can be either between this time and the previous time youactivated this workspace, or fixed (normally 60 seconds), depending on theconfiguration of the Monitoring Agent.
Bulletin-Board Subscriptions The total number of bulletin-board subscriptions.The valid format is a positive integer. This value is an average of several valuescollected over an interval. The interval can be either between this time and theprevious time you activated this workspace, or fixed (normally 60 seconds),depending on the configuration of the Monitoring Agent.
Group State Rebuild Time The time taken (in milliseconds) to rebuild the globalgroup state. During the rebuild time, no fail-over can happen. If this time is toohigh and is unacceptable for the desired availability, you might want to increasethe number of coordinators. For proper operation of this counter, you must hostthe active coordinator in an application server other than the deployment manager.The valid format is a decimal (formatted to three decimal places).
202 ITCAM Agents for WebSphere Applications, J2EE, and HTTP Servers: User Guide

Group State Rebuild Time Count The count of times that were used for GroupState Rebuild Time. The valid format is a 4-byte integer. If the number is too big tobe stored, a value of -2 is used.
Instrumentation Level The instrumentation level for availability manager counters.For WebSphere 5, the valid values are None, Low, Medium, High, and Maximum;for WebSphere 6 or higher, the valid values are None, Basic, Extended, All,Custom. Blank if no instrumentation level is set.
Interval (sec) The length (in seconds) of the sampling interval. The valid format isa positive integer.
Local Bulletin-Board Subjects The total number of subjects being posted locally.The number includes the proxy postings (if any) done by the core group bridgeservice on behalf of servers belonging to different WebSphere cells. The validformat is a positive integer. This value is an average of several values collectedover an interval. The interval can be either between this time and the previoustime you activated this workspace, or fixed (normally 60 seconds), depending onthe configuration of the Monitoring Agent.
Local Bulletin-Board Subscriptions Indicates the total number of bulletin-boardsubscriptions being posted locally.
Local Groups The total number of local groups. The valid format is a positiveinteger. This value is an average of several values collected over an interval. Theinterval can be either between this time and the previous time you activated thisworkspace, or fixed (normally 60 seconds), depending on the configuration of theMonitoring Agent.
Node Name The name of the system on which the server is running. The valueformat is an alphanumeric string, with a maximum of 256 characters.
Origin Node The name of the server subnode. The valid format is analphanumeric string, with a maximum of 128 characters.
Row Number The row number. The valid format is a positive integer.
Sample Date and Time The date and time the Tivoli Enterprise Monitoring Agentcollected the data. The valid format is a 12-character timestamp. For the STR andSCAN functions, the format is MM/DD/YY HH:MM:SS; the following table showsthe values contained in this character string:
Table 35. Format of the 12-character timestamp
Character String Meaning
MM Month
DD Day
YY Year
HH Hour
MM Minute
SS Second
Example: 09/13/06 18:32:03 indicates the data was collected on September 13 2006,at 18:32:03.
Chapter 3. ITCAM Agent for WebSphere Applications 203

This attribute was designed for logging and reporting data-collection times ratherthan for creating situations. To specify a time and date for comparison and testing,use attributes from the Universal Time or Local Time groups.
Server Name The name of the application server. The valid format is analphanumeric string, with a maximum of 256 characters.
Summary Whether this row is a summary row of statistical totals for all rows.Valid values are No and Yes.
For additional information, see:v Organization of the predefined workspacesv Attribute groups used by the predefined workspaces
J2C Connection Pools attributesThe J2C Connection Pools attribute group provides information about connectorsthat adhere to J2C, the WebSphere application server implementation of the J2Carchitecture.
Data counters for this category contain usage information about the J2Carchitecture that enables enterprise beans to connect and interact with proceduralbackend systems, such as Customer Information Control System (CICS) andInformation Management System (IMS). Examples include the number of managedconnections or physical connections and the total number of connections orconnection handles.
The attributes within this group are used to build the J2C Connection Poolsworkspace.
Important:
v The attributes within this attribute group contain zeros for performance data ifyour site has set configuration value Resource Data Collection Method to OnDemand (for on-demand sampling) and if you have not yet run applications thatgenerate performance data. To report performance data in these attributes afterinstalling and configuring the data collector, use the WebSphere administrativeconsole to set the appropriate PMI instrumentation level.
v The Tivoli Enterprise Monitoring Agent is set by default to provide on-demandsampling; thus the attributes within this attribute group initially contain zerosuntil you select the workspace and select it again later. Each time you select theworkspace, these attributes are updated with the latest data.
Tip: For information about WebSphere PMI metrics, see “WebSphere PMI AttributeMapping” on page 373.
Application ID Indicates JEE application ID.
Average Free Connections The average number of free Managed Connections forthe interval. The valid format is a decimal (formatted to three decimal places). Thisvalue is an average of several values collected over an interval. The interval can beeither between this time and the previous time you activated this workspace, orfixed (normally 60 seconds), depending on the configuration of the MonitoringAgent.
204 ITCAM Agents for WebSphere Applications, J2EE, and HTTP Servers: User Guide

Average Pool Size The average number of Managed Connections for the interval.The valid format is a decimal (formatted to three decimal places). This value is anaverage of several values collected over an interval. The interval can be eitherbetween this time and the previous time you activated this workspace, or fixed(normally 60 seconds), depending on the configuration of the Monitoring Agent.
Average Usage Time (ms) The average time (in milliseconds) that connections arein use (measured from when the connection is allocated to when it is returned).The valid format is a decimal (formatted to three decimal places).
Usage Time Count The count of times that were averaged for Average UsageTime. The valid format is a 4-byte integer. If the number is too big to be stored, avalue of -2 is used.
Average Wait Time (ms) The average waiting time (in milliseconds) until aconnection is granted for the interval. The valid format is a decimal (formatted tothree decimal places).
Wait Time Count The count of times that were averaged for Average Wait Time.The valid format is a 4-byte integer. If the number is too big to be stored, a valueof -2 is used.
Concurrent Waiting Threads The average number of threads concurrently waitingfor a connection for the interval. The valid format is a positive integer. This valueis an average of several values collected over an interval. The interval can be eitherbetween this time and the previous time you activated this workspace, or fixed(normally 60 seconds), depending on the configuration of the Monitoring Agent.
Connection Allocation Rate (per sec) The rate (per second) of applicationconnections allocated from Managed Connections for the sampling interval. Thevalid format is a decimal (formatted to three decimal places).
Connection Creation Rate (per sec) The rate (per second) of Managed Connectionscreated for the sampling interval. The valid format is a decimal (formatted to threedecimal places).
Connection Destruction Rate (per sec) The rate (per second) of ManagedConnections destroyed for the sampling interval. The valid format is a decimal(formatted to three decimal places).
Connection Factory Name The name of the connection factory. The valid format isan alphanumeric string, with a maximum of 256 characters.
Connection Handles The number of open application connections that have beenallocated from the managed connections. The valid format is a positive integer.
Connection Pool Timeout Rate (per sec) The rate (per second) of connection pooltimeouts for the sampling interval. The valid format is a decimal (formatted tothree decimal places).
Connection Pool Timeouts The number of faults, such as timeouts, in connectionpools for the sampling interval. The valid format is a positive integer.
Connection Return Rate (per sec) The rate (per second) of allocated applicationconnections that have been returned for the sampling interval. The valid format isa decimal (formatted to three decimal places).
Chapter 3. ITCAM Agent for WebSphere Applications 205

Connection Type The J2C connection type. The valid format is an alphanumericstring, with a maximum of 32 characters.
Connections Allocated The number of application connections allocated fromManaged Connections. The valid format is a positive integer.
Connections Created The total number of Managed Connections created duringthe sampling interval. The valid format is a positive integer.
Connections Destroyed The number of Managed Connections destroyed duringthe sampling interval. The valid format is a positive integer.
Connections Granted The number of Managed Connections granted during theinterval. The valid format is a positive integer.
Connections Returned The number of allocated application connections that havebeen returned (closed) during the sampling interval. The valid format is a positiveinteger.
Connections Used The number of Managed Connection objects available in aparticular connection pool. This number includes all Managed Connection objectsthat have been created but not destroyed. The valid format is a positive integer.
Factory Label The abbreviated name of the connection factory. The valid format isan alphanumeric string, with a maximum of 32 characters.
Instrumentation Level The instrumentation level for the J2C connection pools. ForWebSphere 5, the valid values are None, Low, Medium, High, and Maximum; forWebSphere 6 or higher, the valid values are None, Basic, Extended, All, Custom.Blank if no instrumentation level is set.
Interval Time The length (in seconds) of the sampling interval. The valid format isa positive integer.
Maximum Pool Size The maximum number of managed connections that can becreated in this connection pool (blank for each individual managed connection).The valid format is a positive integer.
Node Name The name of the system on which the server is running. The validformat is an alphanumeric string, with a maximum of 128 characters.
Origin Node The name of the server subnode. The valid format is analphanumeric string, with a maximum of 128 characters.
Percent of Time Pool at Max The average percent of the time that all connectionsare in use for the interval. The valid format is a decimal (formatted to threedecimal places). This value is an average of several values collected over aninterval. The interval can be either between this time and the previous time youactivated this workspace, or fixed (normally 60 seconds), depending on theconfiguration of the Monitoring Agent.
Percent Used Bad The bad percent of pool usage by application. The valid formatis a positive integer.
Percent Used Fair The fair percent of pool usage by application. The valid formatis a positive integer.
206 ITCAM Agents for WebSphere Applications, J2EE, and HTTP Servers: User Guide

Percent Used Good The good percent of pool usage by application. The validformat is a positive integer.
Pool Used (%) The average percent of the pool that is in use for the interval. Thevalid format is a decimal (formatted to three decimal places). This value is anaverage of several values collected over an interval. The interval can be eitherbetween this time and the previous time you activated this workspace, or fixed(normally 60 seconds), depending on the configuration of the Monitoring Agent.
Row Number The number of the row within the report, which corresponds to abar in the Highest Miss Rates bar chart. The valid format is a positive integer.
Sample Date and Time The date and time the Tivoli Enterprise Monitoring Agentcollected the data. The valid format is a 12-character timestamp. For the STR andSCAN functions, the format is MM/DD/YY HH:MM:SS; the following table showsthe values contained in this character string:
Table 36. Format of the 12-character timestamp
Character String Meaning
MM Month
DD Day
YY Year
HH Hour
MM Minute
SS Second
Example: 09/13/06 18:32:03 indicates the data was collected on September 13 2006,at 18:32:03.
This attribute was designed for logging and reporting data-collection times ratherthan for creating situations. To specify a time and date for comparison and testing,use attributes from the Universal Time or Local Time groups.
Server Name The name of the WebSphere application server. The valid format isan alphanumeric string, with a maximum of 256 characters.
Set Instrumentation Level Type Indicates the WebSphere resource category, whichis used by the agent to modify the Instrumentation Level for transaction datacollection.
Summary of J2C Connections Whether this row is a summary row of statisticaltotals collected for all the J2C connection pools. Valid values are No and Yes.
Total Usage (ms) The total time (in milliseconds) the connection object used. Thevalid format is a decimal (formatted to three decimal places).
Total Wait (ms) The total time (in milliseconds) the connection object waited. Thevalid format is a decimal (formatted to three decimal places).
For more information, see:v Organization of the predefined workspacesv Attribute groups used by the predefined workspaces
Chapter 3. ITCAM Agent for WebSphere Applications 207

JMS Summary attributesThe JMS Summary attributes provide information about how WebSphereapplication server applications are interacting with messaging middleware(WebSphere MQ) using the Java Messaging Service (JMS). It provides suchinformation as which queue managers and queues are being used and how manymessages are being read and written.
The attributes within this group are used to build the JMS Summary workspace.
Important: The attributes within this attribute group contain meaningful valuesonly if your site has set the request data monitoring level to Level2 to collect dataon JMS requests.
Application ID The unique identifier that is assigned automatically when theapplication is first configured and is preserved during the whole application lifecycle. The valid format is a positive integer or -1 which means that Application IDis aggregated statistic for all applications.
ASID The identifier (decimal) assigned to the address space running this servantregion.
Average Processing Time (ms) The average time (in milliseconds) per requestusing the JMS. The valid format is a decimal (formatted to three decimal places).
Processing Time Count The count of times that were averaged for AverageProcessing Time. The valid format is a 4-byte integer. If the number is too big to bestored, a value of -2 is used.
Browse Average Time (ms) The average time (in milliseconds) for each browserequest from the queue. The valid format is a decimal (formatted to three decimalplaces).
Browse Count The number of messages browsed from the queue. The valid formatis a positive integer.
Browse Rate (per sec) The number of messages (per second) browsed from a JMSqueue. The valid format is a decimal (formatted to three decimal places).
Browse Total Time (ms) The total time (in milliseconds) consumed by browserequests from the queue. The valid format is a positive integer.
Full Name The complete name of the message queue, which consists of the queuemanager name concatenated to the queue name and separated by a slash. Thevalid format is an alphanumeric string, with a maximum of 100 characters.
Interval (sec) The length (in seconds) of the interval. The valid format is a positiveinteger.
JMS Connection Label A shortened version of the full name. The valid format isan alphanumeric string, with a maximum of 12 characters.
Manager Name The name of the WebSphere MQ queue manager (not availablecurrently). This attribute is blank if WebSphere MQ is not being used. The validformat is an alphanumeric string, with a maximum of 48 characters.
208 ITCAM Agents for WebSphere Applications, J2EE, and HTTP Servers: User Guide

Name The name of the WebSphere MQ queue. The valid format is analphanumeric string, with a maximum of 48 characters.
Node Name The name of the system on which the server is running. The validformat is an alphanumeric string, with a maximum of 128 characters.
Origin Node The name of the application server subnode. The valid format is analphanumeric string, with a maximum of 128 characters.
Process ID The unique identifier of the JVM process (the class ID of the JVM). Thevalid format is a positive integer.
Publish Average Time (ms) The average time (in milliseconds) for each publishrequest to be sent to the queue. The valid format is a decimal (formatted to threedecimal places).
Publish Count The number of publish requests sent to the queue. The valid formatis a positive integer.
Publish Rate (per sec) The number of publish requests (per second) sent to a JMSqueue. The valid format is a decimal (formatted to three decimal places).
Publish Total Time (ms) The total time (in milliseconds) consumed by all publishrequests for the queue. The valid format is a positive integer.
Receive Average Time (ms) The average time (in milliseconds) for each get fromthe queue. The valid format is a decimal (formatted to three decimal places).
Receive Count The number of destructive gets from the queue. The valid format isa positive integer.
Receive Rate (per sec) The number of destructive gets (per second) made from thequeue. The valid format is a decimal (formatted to three decimal places).
Receive Total Time (ms) The total time (in milliseconds) consumed by gets fromthe queue. The valid format is a positive integer.
Sample Date and Time The date and time the Tivoli Enterprise Monitoring Agentcollected the data. The valid format is a 12-character timestamp. For the STR andSCAN functions, the format is MM/DD/YY HH:MM:SS; the following table showsthe values contained in this character string:
Table 37. Format of the 12-character timestamp
Character String Meaning
MM Month
DD Day
YY Year
HH Hour
MM Minute
SS Second
Example: 09/13/06 18:32:03 indicates the data was collected on September 13 2006,at 18:32:03.
Chapter 3. ITCAM Agent for WebSphere Applications 209

This attribute was designed for logging and reporting data-collection times ratherthan for creating situations. To specify a time and date for comparison and testing,use attributes from the Universal Time or Local Time groups.
Send Average Time (ms) The average time (in milliseconds) for each put to thequeue. The valid format is a decimal (formatted to three decimal places).
Send Count The number of messages put to the queue. The valid format is apositive integer.
Send Rate (per sec) The number of messages (per second) put to the queue. Thevalid format is a decimal (formatted to three decimal places).
Send Total Time (ms) The total time (in milliseconds) consumed by puts to thequeue. The valid format is a positive integer.
Server Name The name of the WebSphere application server. The valid format isan alphanumeric string, with a maximum of 256 characters.
Summary Indicates that this row is a summary row of statistical totals for all rows.
Total Time (ms) The total time (in milliseconds) spent accessing the queue. Thevalid format is a positive integer.
Type The type of message manager. The valid values are Queue and Topic.
For more information, see:v Organization of the predefined workspacesv Attribute groups used by the predefined workspaces
Log Analysis attributesThe Log Analysis attributes provide application server error and exceptionconditions which are recorded in the application server log files.
The log files are SystemOut.log and SystemErr.log. Use the Log Analysis attributesin situations to monitor errors and exception conditions and their severity.
The attributes within this group are used to build the Log Analysis workspace.
ASID The identifier (decimal) assigned to the address space running this servantregion.
Component The name of the component that caused the error. The valid format isan alphanumeric string, with a maximum of 32 characters.
Error Date and Time The date and time the event occurred. The valid format is atimestamp. This attribute was designed for logging and reporting data-collectiontimes rather than for creating situations. To specify a time and date for comparisonand testing, use attributes from the Universal Time or Local Time groups.
Job ASID The identifier (hexadecimal) assigned to the address space running thisservant region. The valid format is an alphanumeric string, with a maximum offour characters.
210 ITCAM Agents for WebSphere Applications, J2EE, and HTTP Servers: User Guide

Job Name The job name assigned to this servant region. The valid format is analphanumeric string, with a maximum of eight characters.
Message ID The identifier assigned to the message. The valid format is analphanumeric string, with a maximum of 12 characters.
Message Origin Where the message originates; that is, the log file name and linenumber. The valid format is an alphanumeric string, with a maximum of 32characters. This field is not empty only on the z/OS system.
Message Text The text of the message. The valid format is alphanumeric string,with a maximum of 256 characters. All error message text data that goes beyond256 characters are truncated and are not shown in the portal.
Node Name The name of the system on which the server is running. The valueformat is an alphanumeric string, with a maximum of 256 characters.
Origin Node The name of the server subnode. The valid format is analphanumeric string, with a maximum of 128 characters.
Process ID The process identifier of the Java virtual machine. The valid format isan alphanumeric string, with a maximum of eight characters. In a z/OS system,this field displays in hexadecimal format.
Sequence Number The sequence number in the JMX notifications stream. Thevalid format is positive integer.
Server Instance Name The name of the application server instance. This is thename of a single address space that can run application code (called a "specificserver" or simply a "server"). The valid format is an alphanumeric string, with amaximum of eight characters.
Server Name The name of the application server. The valid format is analphanumeric string, with a maximum of 256 characters.
Severity The severity of the message. The valid values are:
Table 38. Message severities and their meanings
Severity Definition
Informational A message intended to convey only user information
Unconditional A message of type Unconditional
Dump A message of type Dump
SystemOut A message written directly to System.out by the userapplication or internal components
SystemError A message written directly to System.err by the userapplication or internal components
User A message of type User
EntryMethod A message written upon entry to a method
ExitMethod A message written upon exit from a method
Event A message of type Event
Debug A message of type Debug
Audit An audit message
Chapter 3. ITCAM Agent for WebSphere Applications 211

Table 38. Message severities and their meanings (continued)
Severity Definition
Warning A warning message
Error An error message
Terminate A message of type Terminate (exit process)
Fatal A fatal message
Unknown A placeholder that indicates the message type was notrecognized
Thread ID The unique identifier of the thread where the event occurred. The validformat is an alphanumeric string, with a maximum of 16 characters.
For additional information, see:v Organization of the predefined workspacesv Attribute groups used by the predefined workspaces
Listener Port attributesOrigin Node The server name subnode. The valid format is an alphanumericstring, with a maximum of 128 characters.
Server Name The name of the application server. The valid format is analphanumeric string, with a maximum of 256 characters.
Node Name The name of the system on which the server is running. The validformat is an alphanumeric string, with a maximum of 256 characters.
Sample Date and Time The date and time at which the agent has collected data.
Interval Time Indicates the length of the interval in seconds. The valid format is a4-byte integer.
Name Name of the Listener Port. The valid format is an alphanumeric string, witha maximum of 256 characters.
Status The status of the Listener Port: Started or Stopped.
JMS Connection Factory The JNDI name for the JMS ConnectionFactory in use bythis Listener Port. The valid format is an alphanumeric string, with a maximum of256 characters.
JMS Destination The JNDI name for the JMS Queue or Topic in use by thisListener Port. The valid format is an alphanumeric string, with a maximum of 256characters.
Max Sessions The value of max sessions in use by this Listener Port. The validformat is a 4-byte integer.
Max Retries The value of max retries in use by this Listener Port. The valid formatis a 4-byte integer.
Max Messages The value of max messages in use by this Listener Port. The validformat is a 4-byte integer.
212 ITCAM Agents for WebSphere Applications, J2EE, and HTTP Servers: User Guide

Messaging Engine Communications attributesThe Messaging Engine Communications attributes display statistics for all themessaging engines being hosted by the current application server.
The attributes within this group are used to build the Messaging EngineCommunications workspace.
Important:
v The attributes within this attribute group contain zeros for performance data ifyour site has set configuration value Resource Data Collection Method to OnDemand (for on-demand sampling) and if you have not yet run applications thatgenerate performance data. To report performance data in these attributes afterinstalling and configuring the data collector, use the WebSphere administrativeconsole to set the appropriate PMI instrumentation level.
v The Tivoli Enterprise Monitoring Agent is set by default to provide on-demandsampling; thus the attributes within this attribute group initially contain zerosuntil you select the workspace and select it again later. Each time you select theworkspace, these attributes are updated with the latest data.
v Attributes in this group are only provided for IBM WebSphere application serverversion 6.0 or later.
Tip: For information about WebSphere PMI metrics, see “WebSphere PMI AttributeMapping” on page 373.
API Connections The number of sessions being used by messaging engines thatare currently network connected to this application server. The valid format is apositive integer.
Buffered Reads (bytes) The number of bytes of data that have been received fromthe network and are held pending further processing. Large values might indicatethat the application server is unable to process data fast enough to keep up withthe other application server processes hosting messaging engines. The valid formatis a positive integer.
Buffered Writes (bytes) The number of bytes of data being held pendingtransmission. Large values might indicate network congestion or application serverprocesses hosting messaging engines which are unable to process data fast enoughto keep up with the application server. The valid format is a positive integer.
Errors The communication errors that have occurred and resulted in a networkconnection to a messaging engine being disconnected. The valid format is apositive integer.
Instrumentation Level The instrumentation level for the Messaging EngineCommunications. For WebSphere 6 or higher, the valid values are None, Basic,Extended, All, Custom. Blank if no instrumentation level is set.
Interval (sec) The length (in seconds) of the sampling interval. The valid format isa positive integer.
Message Read (bytes) The number of bytes of message data received fromapplication server processes hosting messaging engines over network connections.This does not include data used to negotiate the transmission of messages. Thevalid format is a positive integer.
Chapter 3. ITCAM Agent for WebSphere Applications 213

Message Written (bytes) The number of bytes of message data sent to applicationserver processes hosting messaging engines over network connections. This doesnot include data used to negotiate the transmission of messages. The valid formatis a positive integer.
Messaging Engine Attached The number of distinct application server processeshosting messaging engines currently network connected to this application server.The valid format is a positive integer.
Messaging Engine Name The name of the message engine. The value format is analphanumeric string, with a maximum of 256 characters.
Node Name The name of the system on which the server is running. The valueformat is an alphanumeric string, with a maximum of 256 characters.
Origin Node The name of the server subnode. The valid format is analphanumeric string, with a maximum of 128 characters.
Reads The number of read operations used to receive data from application serverprocesses hosting messaging engines via network connections. The valid format isa positive integer.
Reads Blocked The number of read operations that could not be completedimmediately. This number can be used as an indicator of network congestion whencommunicating with application server processes hosting messaging engines. Thevalid format is a positive integer.
Sample Date and Time The date and time the Tivoli Enterprise Monitoring Agentcollected the data. The valid format is a 12-character timestamp. For the STR andSCAN functions, the format is MM/DD/YY HH:MM:SS; the following table showsthe values contained in this character string:
Table 39. Format of the 12-character timestamp
Character String Meaning
MM Month
DD Day
YY Year
HH Hour
MM Minute
SS Second
Example: 09/13/06 18:32:03 indicates the data was collected on September 13 2006,at 18:32:03.
This attribute was designed for logging and reporting data-collection times ratherthan for creating situations. To specify a time and date for comparison and testing,use attributes from the Universal Time or Local Time groups.
Server Name The name of the application server. The valid format is analphanumeric string, with a maximum of 256 characters.
Summary Whether this row is a summary row of statistical totals for all messagingengine communications. Valid values are No and Yes.
214 ITCAM Agents for WebSphere Applications, J2EE, and HTTP Servers: User Guide

Total Read (bytes) The Number of bytes of data received from application serverprocesses hosting messaging engines. The valid format is a positive integer.
Total Written (bytes) The Number of bytes of data sent to application serverprocesses hosting messaging engines. The valid format is a positive integer.
Writes The number of write operations used to transmit data to application serverprocesses hosting messaging engines via network connections. The valid format isa positive integer.
Writes Blocked The number of write operations that could not be completedimmediately. This number can be used as an indicator of network congestion whencommunicating with application server processes hosting messaging engines. Thevalid format is a positive integer.
For additional information, see:v Organization of the predefined workspacesv Attribute groups used by the predefined workspaces
Messaging Engines attributesThe Messaging Engines attributes display aggregated information about theperformance of the messaging engines supported by WebSphere server.
The attributes within this group are used to build the Messaging Enginesworkspace.
Tip: For information about WebSphere PMI metrics, see “WebSphere PMI AttributeMapping” on page 373.
Important: Attributes in this group are only provided for IBM WebSphereapplication server version 6.0 or later.
Average Local Wait Time (ms) The time spent by messages on this durablesubscription at consumption. If this time is not what was expected, view themessage using the admin console to decide what action needs to be taken. Thevalid format is a positive integer.
Local Wait Time Count The count of times that were averaged for Average LocalWait Time. The valid format is a 4-byte integer. If the number is too big to bestored, a value of -2 is used.
Expired Messages The number of report enabled messages that expired while onthis queue. The valid format is a positive integer.
Incomplete Topic Publications The number of publications not yet received by allcurrent subscribers. If this number is unexpected, view the publication using theadmin console to take action. The valid format is a positive integer.
Instrumentation Level The instrumentation level for the messaging engines. ForWebSphere 6 or higher, the valid values are None, Basic, Extended, All, Custom.Blank if no instrumentation level is set.
Interval (sec) The length (in seconds) of the sampling interval. The valid format isa positive integer.
Chapter 3. ITCAM Agent for WebSphere Applications 215

Messaging Engine Name The name of the messaging engine. The valid format isan alphanumeric string, with a maximum of 256 characters.
Node Name The name of the system on which the server is running. The valueformat is an alphanumeric string, with a maximum of 256 characters.
Origin Node The name of the server subnode. The valid format is analphanumeric string, with a maximum of 128 characters.
Sample Date and Time The date and time the Tivoli Enterprise Monitoring Agentcollected the data. The valid format is a 12-character timestamp. For the STR andSCAN functions, the format is MM/DD/YY HH:MM:SS; the following table showsthe values contained in this character string:
Table 40. Format of the 12-character timestamp
Character String Meaning
MM Month
DD Day
YY Year
HH Hour
MM Minute
SS Second
Example: 09/13/06 18:32:03 indicates the data was collected on September 13 2006,at 18:32:03.
This attribute was designed for logging and reporting data-collection times ratherthan for creating situations. To specify a time and date for comparison and testing,use attributes from the Universal Time or Local Time groups.
Server Name The name of the application server. The valid format is analphanumeric string, with a maximum of 256 characters.
Status The status of the messaging engine. The valid format is a positive integer.
Summary of All Applications Whether this row is a summary row of statisticaltotals for all messaging engines. Valid values are No and Yes.
Total Published The total number of publications to the messaging engines. Thevalid format is a positive integer.
For more information, see:v Organization of the predefined workspacesv Attribute groups used by the predefined workspaces
Portal Page Summary attributesThe Portal Page Summary attributes provide information about response timesstatistics for all portal page requests that completed on monitored WebSpherePortal server during the interval.
The attributes within this group are used to build the Portal Pages Summaryworkspace.
216 ITCAM Agents for WebSphere Applications, J2EE, and HTTP Servers: User Guide

ASID The identifier (decimal) assigned to the address space running this servantregion.
Average Response Time (ms) The average response time (in milliseconds) ofrequests are processed by the portal pages during the current interval. The validformat is a decimal (formatted to three decimal places).
Interval (sec) The length (in seconds) of the sampling interval. The valid format isa positive integer.
Node Name The name of the system on which the server is running. The valueformat is an alphanumeric string, with a maximum of 256 characters.
Origin Node The name of the server subnode. The valid format is analphanumeric string, with a maximum of 128 characters.
Process ID The unique identifier of the JVM process (the class ID of the JVM). Thevalid format is a positive integer.
Portal Page Name The name of the portal page. The value format is analphanumeric string, with a maximum of 128 characters.
Request Count The count of requests processed by the portlet page during thecurrent interval. The valid format is a positive integer.
Row Number The number of the row. The valid format is a positive integer.
Sample Date and Time The date and time the Tivoli Enterprise Monitoring Agentcollected the data. The valid format is a 12-character timestamp. For the STR andSCAN functions, the format is MM/DD/YY HH:MM:SS; the following table showsthe values contained in this character string:
Table 41. Format of the 12-character timestamp
Character String Meaning
MM Month
DD Day
YY Year
HH Hour
MM Minute
SS Second
Example: 09/13/06 18:32:03 indicates the data was collected on September 13 2006,at 18:32:03.
This attribute was designed for logging and reporting data-collection times ratherthan for creating situations. To specify a time and date for comparison and testing,use attributes from the Universal Time or Local Time groups.
Server Name The name of the application server. The valid format is analphanumeric string, with a maximum of 256 characters.
Summary Indicates that this row is a summary row of statistical totals for all rows.
Chapter 3. ITCAM Agent for WebSphere Applications 217

Total Response (ms) The total time (in milliseconds) of responses. The valid formatis a decimal (formatted to three decimal places).
For more information, see:v Organization of the predefined workspacesv Attribute groups used by the predefined workspaces
Portal Summary attributesThe Portal Summary attributes provide aggregated response times statistics aboutall portal pages and portlet requests that completed on monitored WebSpherePortal server during the interval.
The attributes within this group are used to build the Portal Summary workspace.
ASID The identifier (decimal) assigned to the address space running this servantregion.
Authentication Request Count The number of authentication requests during theinterval. The valid format is a positive integer.
Authentication Total (ms) The total time (in milliseconds) of authenticationrequests completed during the interval. The valid format is a decimal (formatted tothree decimal places).
Authorization Request Count The number of authorization requests during theinterval. The valid format is a positive integer.
Authorization Total (ms) The total time (in milliseconds) of authorization requestscompleted during the interval. The valid format is a decimal (formatted to threedecimal places).
Average Response Time of Portal Pages (ms) The average response time (inmilliseconds) of all portal pages/Gateway Servlet requests completed during theinterval. The valid format is a decimal (formatted to three decimal places).
Average Response Time of Portlets (ms) The average response time (inmilliseconds) of all portlets requests completed during the interval. The validformat is a decimal (formatted to three decimal places).
Interval (sec) The length (in seconds) of the sampling interval. The valid format isa positive integer.
Model Building Request Count The number of model building requests duringthe interval. The valid format is a positive integer.
Model Building Total (ms) The total time (in milliseconds) of model buildingrequests completed during the interval. The valid format is a decimal (formatted tothree decimal places).
Node Name The name of the system on which the server is running. The valueformat is an alphanumeric string, with a maximum of 256 characters.
Origin Node The name of the server subnode. The valid format is analphanumeric string, with a maximum of 128 characters.
218 ITCAM Agents for WebSphere Applications, J2EE, and HTTP Servers: User Guide

Page Loading Request Count The number of page loading requests during theinterval. The valid format is a positive integer.
Page Loading Total (ms) The total time (in milliseconds) of page loading requestscompleted during the interval. The valid format is a decimal (formatted to threedecimal places).
Portal Page Request Count The number of portal page requests during theinterval. The valid format is a positive integer.
Portal Pages Total Response (ms) The total response time (in milliseconds) of allportal pages/Gateway Servlet requests completed during the interval. The validformat is a decimal (formatted to three decimal places).
Portlets Request Count The number of portlets requests during the interval. Thevalid format is a positive integer.
Process ID The unique identifier of the JVM process (the class ID of the JVM). Thevalid format is a positive integer.
Portlets Total Response(ms) The total response time (in milliseconds) of allportlets requests completed during the interval. The valid format is a decimal(formatted to three decimal places).
Response Time of Authentication (ms) The response time (in milliseconds) ofauthentication. The valid format is a positive integer.
Response Time of Authorization (ms) The response time (in milliseconds) ofauthorization. The valid format is a positive integer.
Response Time of Model Building (ms) The response time (in milliseconds) ofmodel building. The valid format is a positive integer.
Response Time of Page loading (ms) The response time (in milliseconds) of pageloading. The valid format is a positive integer.
Sample Date and Time The date and time the Tivoli Enterprise Monitoring Agentcollected the data. The valid format is a 12-character timestamp. For the STR andSCAN functions, the format is MM/DD/YY HH:MM:SS; the following table showsthe values contained in this character string:
Table 42. Format of the 12-character timestamp
Character String Meaning
MM Month
DD Day
YY Year
HH Hour
MM Minute
SS Second
Example: 09/13/06 18:32:03 indicates the data was collected on September 13 2006,at 18:32:03.
Chapter 3. ITCAM Agent for WebSphere Applications 219

This attribute was designed for logging and reporting data-collection times ratherthan for creating situations. To specify a time and date for comparison and testing,use attributes from the Universal Time or Local Time groups.
Server Name The name of the application server. The valid format is analphanumeric string, with a maximum of 256 characters.
Summary Indicates that this row is a summary row of statistical totals for all rows.
For more information, see:v Organization of the predefined workspacesv Attribute groups used by the predefined workspaces
Portlet Summary attributesThe Portlet Summary attributes provide information about response times of allportlet requests that completed on monitored WebSphere Portal.
The attributes within this group are used to build the Portlet Summary workspace.
ASID The identifier (decimal) assigned to the address space running this servantregion.
Average Response Time (ms) The average response time for portlet during thecurrent interval. The valid format is a decimal (formatted to three decimal places).
Interval (sec) The length (in seconds) of the sampling interval. The valid format isa positive integer.
Node Name The name of the system on which the server is running. The valueformat is an alphanumeric string, with a maximum of 256 characters.
Origin Node The name of the server subnode. The valid format is analphanumeric string, with a maximum of 128 characters.
Portlet Name The name of the portlet. The value format is an alphanumeric string,with a maximum of 256 characters.
Process ID The unique identifier of the JVM process (the class ID of the JVM). Thevalid format is a positive integer.
Request Count The count of requests for portlet during the current interval. Thevalid format is a positive integer.
Request Rate The rate at which the requests processed by portlet during thecurrent interval. The valid format is a decimal (formatted to three decimal places).
Row Number The number of the row. The valid format is a positive integer.
Sample Date and Time The date and time the Tivoli Enterprise Monitoring Agentcollected the data. The valid format is a 12-character timestamp. For the STR andSCAN functions, the format is MM/DD/YY HH:MM:SS; the following table showsthe values contained in this character string:
220 ITCAM Agents for WebSphere Applications, J2EE, and HTTP Servers: User Guide

Table 43. Format of the 12-character timestamp
Character String Meaning
MM Month
DD Day
YY Year
HH Hour
MM Minute
SS Second
Example: 09/13/06 18:32:03 indicates the data was collected on September 13 2006,at 18:32:03.
This attribute was designed for logging and reporting data-collection times ratherthan for creating situations. To specify a time and date for comparison and testing,use attributes from the Universal Time or Local Time groups.
Server Name The name of the application server. The valid format is analphanumeric string, with a maximum of 256 characters.
Summary Indicates that this row is a summary row of statistical totals for all rows.
Total Response (ms) The total response time for portlet during the current interval.The valid format is a decimal (formatted to three decimal places).
For more information, see:v Organization of the predefined workspacesv Attribute groups used by the predefined workspaces
Queue attributesThe Queue attributes provide aggregated information about the point to pointmessaging.
The attributes within this group are used to build the Destinations workspace.
Important:
v The attributes within this attribute group contain zeros for performance data ifyour site has set configuration value Resource Data Collection Method to OnDemand (for on-demand sampling) and if you have not yet run applications thatgenerate performance data. To report performance data in these attributes afterinstalling and configuring the data collector, use the WebSphere administrativeconsole to set the appropriate PMI instrumentation level.
v The Tivoli Enterprise Monitoring Agent is set by default to provide on-demandsampling; thus the attributes within this attribute group initially contain zerosuntil you select the workspace and select it again later. Each time you select theworkspace, these attributes are updated with the latest data.
v Attributes in this group are only provided for IBM WebSphere application serverversion 6.0 or later.
Chapter 3. ITCAM Agent for WebSphere Applications 221

Aggregate Message Wait Time The time spent by messages in the bus atconsumption. If this time is not what was expected, view the message using theadmin console to decide what action needs to be taken. The valid format is apositive integer.
Aggregate Message Wait Time Count The count of times that were used forAggregate Message Wait Time. The valid format is a 4-byte integer. If the numberis too big to be stored, a value of -2 is used.
Assured Persistent Messages Consumed The number of assured persistentmessages consumed, for the lifetime of this messaging engine. The valid format isa positive integer.
Assured Persistent Messages Produced The number of assured persistentmessages produced, for the lifetime of this messaging engine. The valid format is apositive integer.
Available Message The number of messages available for a queue forconsumption. If this number is close to the destination high messages value,review the high messages value. The valid format is a positive integer.
Best Effort Non-persistent Messages Consumed The number of best effortnon-persistent messages consumed, for the lifetime of this messaging engine. Thevalid format is a positive integer.
Best Effort Non-persistent Messages Produced The number of best effortnon-persistent messages produced, for the lifetime of this messaging engine. Thevalid format is a positive integer.
Express Non-persistent Messages Consumed The number of expressnon-persistent messages consumed, for the lifetime of this messaging engine. Thevalid format is a positive integer.
Express Non-persistent Messages Produced The number of express non-persistentmessages produced, for the lifetime of this messaging engine. The valid format is apositive integer.
Instrumentation Level The instrumentation level for the database connection poolfor the data source. Valid values are None, Low, Medium, High, Basic, Extended,All, Custom, and Maximum. Blank if no instrumentation level is set.
Interval (sec) The length (in seconds) of the sampling interval. The valid format isa positive integer.
Local Consumer The number of currently attached local consumers. The validformat is a positive integer.
Local Consumer Attaches The number of times an attachment has been made tothis queue by local consumers. The lifetime of this value is the lifetime of themessaging engine. The valid format is a positive integer.
Local Message Wait Time The time spent by messages on this queue atconsumption. If this time is not what was expected, view the message using theadmin console to decide what action needs to be taken. The valid format is apositive integer.
222 ITCAM Agents for WebSphere Applications, J2EE, and HTTP Servers: User Guide
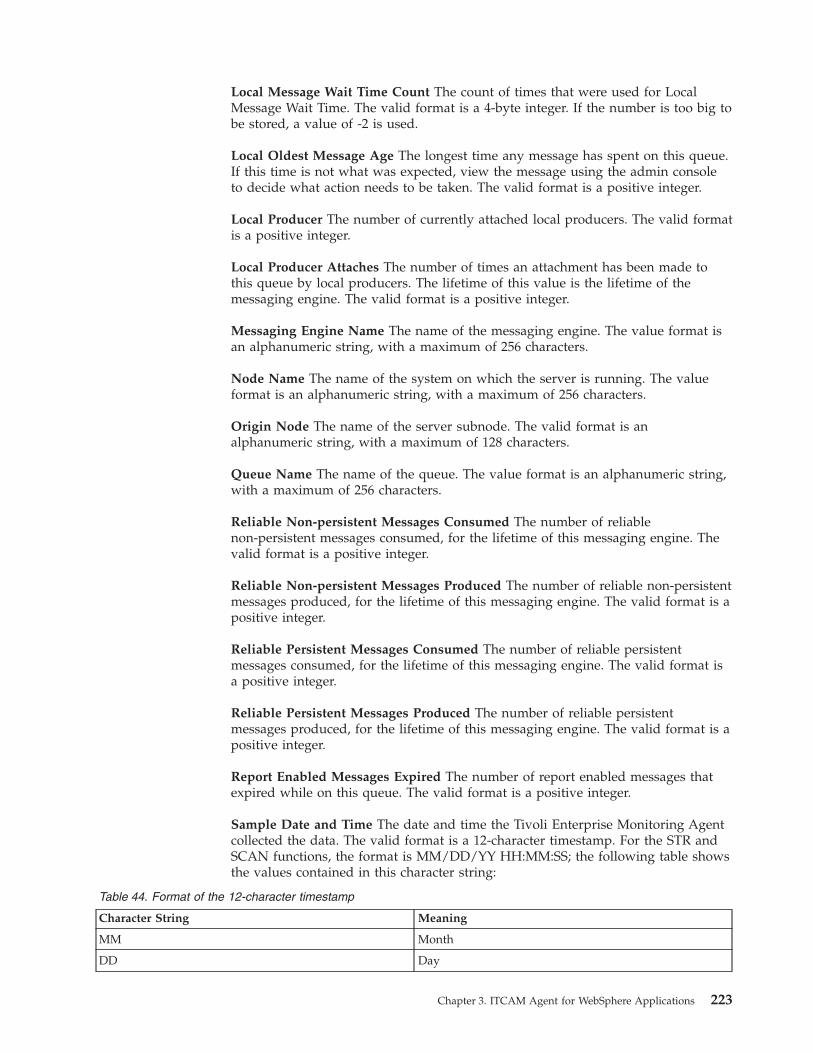
Local Message Wait Time Count The count of times that were used for LocalMessage Wait Time. The valid format is a 4-byte integer. If the number is too big tobe stored, a value of -2 is used.
Local Oldest Message Age The longest time any message has spent on this queue.If this time is not what was expected, view the message using the admin consoleto decide what action needs to be taken. The valid format is a positive integer.
Local Producer The number of currently attached local producers. The valid formatis a positive integer.
Local Producer Attaches The number of times an attachment has been made tothis queue by local producers. The lifetime of this value is the lifetime of themessaging engine. The valid format is a positive integer.
Messaging Engine Name The name of the messaging engine. The value format isan alphanumeric string, with a maximum of 256 characters.
Node Name The name of the system on which the server is running. The valueformat is an alphanumeric string, with a maximum of 256 characters.
Origin Node The name of the server subnode. The valid format is analphanumeric string, with a maximum of 128 characters.
Queue Name The name of the queue. The value format is an alphanumeric string,with a maximum of 256 characters.
Reliable Non-persistent Messages Consumed The number of reliablenon-persistent messages consumed, for the lifetime of this messaging engine. Thevalid format is a positive integer.
Reliable Non-persistent Messages Produced The number of reliable non-persistentmessages produced, for the lifetime of this messaging engine. The valid format is apositive integer.
Reliable Persistent Messages Consumed The number of reliable persistentmessages consumed, for the lifetime of this messaging engine. The valid format isa positive integer.
Reliable Persistent Messages Produced The number of reliable persistentmessages produced, for the lifetime of this messaging engine. The valid format is apositive integer.
Report Enabled Messages Expired The number of report enabled messages thatexpired while on this queue. The valid format is a positive integer.
Sample Date and Time The date and time the Tivoli Enterprise Monitoring Agentcollected the data. The valid format is a 12-character timestamp. For the STR andSCAN functions, the format is MM/DD/YY HH:MM:SS; the following table showsthe values contained in this character string:
Table 44. Format of the 12-character timestamp
Character String Meaning
MM Month
DD Day
Chapter 3. ITCAM Agent for WebSphere Applications 223

Table 44. Format of the 12-character timestamp (continued)
Character String Meaning
YY Year
HH Hour
MM Minute
SS Second
Example: 09/13/06 18:32:03 indicates the data was collected on September 13 2006,at 18:32:03.
This attribute was designed for logging and reporting data-collection times ratherthan for creating situations. To specify a time and date for comparison and testing,use attributes from the Universal Time or Local Time groups.
Server Name The name of the application server. The valid format is analphanumeric string, with a maximum of 256 characters.
Summary Whether this row is a summary row of statistical totals for all rows.Valid values are No and Yes.
Total Messages Consumed The total number of messages consumed from thisqueue, for the lifetime of this messaging engine. The valid format is a positiveinteger.
Total Messages Produced The total number of messages produced to this queue,for the lifetime of this messaging engine. The valid format is a positive integer.
Unavailable Message The number of messages locked or uncommitted. Thismeans messages that have been added or removed but the transaction has notbeen committed yet. If this number is high, check which messages are locked andwhy.
For more information, see:v Organization of the predefined workspacesv Attribute groups used by the predefined workspaces
Remote Configuration Requests attributesThe Remote Configuration Requests attributes provide information about remoteconfiguration.
The attributes within this group are used to build the WebSphere Agentworkspace.
Command Indicates the Command of the request.
Node Name The system on which the server is running. The valid format is analphanumeric string, with a maximum of 128 characters.
Origin Node The server name subnode. The valid format is an alphanumericstring, with a maximum of 128 characters.
224 ITCAM Agents for WebSphere Applications, J2EE, and HTTP Servers: User Guide

Request Identifier The Request ID. The valid format is an alphanumeric string,with a maximum of 48 characters.
Package Count Indicates the package count for this request/response.
Package Index Indicates the current index of the packages.
Request Context Indicates the request context.
Response Context Indicates the response context.
Return Value Indicates the return value of the request.
Target Agent Code Two-letter agent product code that specifies information aboutthe product being configured.
For more information, see:v Organization of the predefined workspacesv Attribute groups used by the predefined workspaces
Request Analysis attributesThe Request Analysis attributes provide response times and functionaldecomposition information about requests (servlets, JSPs, SCA requests, Portalrequests, EJB methods, and web services) that ran on the application server.
The attributes within this group are used to build the Request Analysis workspace.
Application Name The name of the application to which the request belongs. Thevalid format is an alphanumeric string, with a maximum of 256 characters.
Important: The application name is, in the present version, not provided for SCArequests.
Application Time (ms) On monitoring level 1, the average time (in milliseconds)this request spent processing application requests other than JCA, JMS, JNDI,JDBC, web service, and SCA requests. This field can have a zero value if the totaltime is less than the number of requests, due to truncation. On monitoring level 2,the average time (in milliseconds) this request spent processing Servlet and EJBrequests. The valid format is a positive integer.
Application Time Count The count of times that were averaged for ApplicationTime. The valid format is a 4-byte integer. If the number is too big to be stored, avalue of -2 is used.
Application Time Percent The percentage of time this request spent processingapplication requests other than JCA, JMS, JNDI, JDBC requests, web services, andSCA. The valid format is a decimal (formatted to one decimal place).
Application Time Percent Count The count of individual percentages that wereaveraged for Application Time Percent. The valid format is a 4-byte integer. If thenumber is too big to be stored, a value of -2 is used.
Chapter 3. ITCAM Agent for WebSphere Applications 225

Application Bad Delay (msec) The delay time (in milliseconds) in the applicationtier collected during the interval. This column is non-zero value when applicationdelay exceeds the bad threshold configured for it. The valid format is a positiveinteger.
Application Fair Delay (msec) The delay time (in milliseconds) in the applicationtier collected during the interval. This column is non-zero value when applicationdelay exceeds the fair threshold configured for it. The valid format is a positiveinteger.
Application Good Delay (msec) The delay time (in milliseconds) in the applicationtier collected during the interval. This column is non-zero when application delayis less than fair threshold configured for it. The valid format is a positive integer.
Application Tier Delay Type This attribute defines the request type based on itsdelay time in the application tier. Valid values are Unknown, Good, Fair, and Bad.
Application Tier Response (msec) The actual response time in milliseconds in theapplication tier collected during the interval. The valid format is a positive integer.
Average Response (ms) The average time (in milliseconds) required each time thisrequest ran during the interval. The valid format is a positive integer.
ASID The identifier (decimal) assigned to the address space running this servantregion.
Backend Bad Delay (msec) The delay time (in milliseconds) in the backend tiercollected during the interval. This column is non-zero value when backend delayexceeds the bad threshold configured for it. The valid format is a positive integer.
Backend Fair Delay (msec) The delay time (in milliseconds) in the backend tiercollected during the interval. This column is non-zero value when backend delayexceeds the fair threshold configured for it. The valid format is a positive integer.
Backend Good Delay (msec) The delay time (in milliseconds) in the backend tiercollected during the interval. This column is non-zero when backend delay is lessthan fair threshold configured for it. The valid format is a positive integer.
Backend Tier Delay Type This attribute defines the request type based on its delaytime in the backend tier. Valid values are Unknown, Good, Fair, and Bad.
Backend Tier Response (msec) The actual response time in milliseconds in thebackend tier collected during the interval. The valid format is a positive integer.
Client Bad Delay (msec) The delay time (in milliseconds) in the client tiercollected during the interval. This column is non-zero value when client delayexceeds the bad threshold configured for it. The valid format is a positive integer.
Client Fair Delay (msec) The delay time (in milliseconds) in the client tiercollected during the interval. This column is non-zero value when client delayexceeds the fair threshold configured for it. The valid format is a positive integer.
Client Good Delay (msec) The delay time (in milliseconds) in the client tiercollected during the interval. This column is non-zero when client delay is lessthan fair threshold configured for it. The valid format is a positive integer.
226 ITCAM Agents for WebSphere Applications, J2EE, and HTTP Servers: User Guide

Client Tier Delay Type This attribute defines the request type based on its delaytime in the client tier. Valid values are Unknown, Good, Fair, and Bad.
Client Tier Response (msec) The actual response time in milliseconds in the clienttier collected during the interval. The valid format is a positive integer.
Completion Count The number of requests that successfully completed during theinterval. The valid format is a positive integer.
Custom Request Count The number of custom requests. The valid format is apositive integer.
Custom Request Time (ms) The average time (in milliseconds) the custom requestsspent. The valid format is a positive integer.
Custom Request Time (%) The percentage of time the custom requests spent. Thevalid format is a decimal (formatted to one decimal place).
EJB Count The number of times this request invoked an Enterprise Java Bean (EJB)request. The valid format is a positive integer.
EJB Time (ms) The average time (in milliseconds) this request spent processingEnterprise Java Bean (EJB) requests. This field can have a zero value if the totaltime is less than the number of requests, due to truncation. The valid format is apositive integer.
EJB Time (%) The percentage of time this request spent processing Enterprise JavaBean (EJB) requests. The valid format is a decimal (formatted to one decimalplace).
Interval (sec) The length (in seconds) of the sampling interval. The valid format isa positive integer.
JCA Count The number of times this request invoked a JEE Connector Architecture(JCA) request. The valid format is a positive integer.
JCA Time (ms) The average time (in milliseconds) this request spent processingJEE Connector Architecture (JCA) requests. This field can have a zero value if thetotal time is less than the number of requests, due to truncation. The valid formatis a positive integer.
JCA Time (%) The percentage of time this request spent processing JEE ConnectorArchitecture (JCA) requests. The valid format is a decimal (formatted to onedecimal place).
JMS Count The number of times this request invoked a Java Message Service(JMS) request. The valid format is a positive integer.
JMS Time (ms) The average time (in milliseconds) this request spent processingJava Message Service (JMS) requests. This field can have a zero value if the totaltime is less than the number of requests, due to truncation. The valid format is apositive integer.
JMS Time (%) The percentage of time this request spent processing Java MessageService (JMS) requests. The valid format is a decimal (formatted to one decimalplace).
Chapter 3. ITCAM Agent for WebSphere Applications 227

JNDI Count The number of times this request invoked a Java Naming andDirectory Interface (JNDI) request. The valid format is a positive integer.
JNDI Time (ms) The average time (in milliseconds) this request spent processingJava Naming and Directory Interface (JNDI) requests. This field can have a zerovalue if the total time is less than the number of requests, due to truncation. Thevalid format is a positive integer.
JNDI Time (%) The percentage of time this request spent processing Java Namingand Directory Interface (JNDI) requests. The valid format is a decimal (formattedto one decimal place).
Level 2 Request Count The number of times this request was run with Mod Level2 turned on. The valid format is a positive integer.
Level 2 Total Time (ms) The total time (in milliseconds) this request was run withMod Level 2 turned on. The valid format is a positive integer.
Longest Response (ms) The maximum time (in milliseconds) it took this request torun during the interval. The valid format is a positive integer.
Node Name The name of the system on which the server is running. The validformat is an alphanumeric string, with a maximum of 128 characters.
Origin Node The name of the application server subnode. The valid format is analphanumeric string, with a maximum of 128 characters.
Portal Processing Count The number of times the request invoked a WebSpherePortal page or portlet request. The valid format is a positive integer.
Portal Processing Time (ms) The average time (in milliseconds) the request spentin processing WebSphere Portal page or portlet requests. This field can have a zerovalue if the total time is less than the number of requests. The valid format is apositive integer.
Portal Processing Time (%) The percentage of time the request spent in processingWebSphere Portal page or portlet requests. The valid format is a decimal(formatted to one decimal place).
Process ID The process identifier of the Java virtual machine. The valid format is apositive integer.
Request Bad Response Threshold (msec) The threshold that defines the badrequests. A request that spends more time to complete than this threshold tocomplete is a bad request. The valid format is a positive integer.
Request Completion (%) The percentage of the requests that completedsuccessfully during the interval. The valid format is a positive integer.
Request Completion Level The completion level of the requests during theinterval. Valid values are Unknown, Good, Fair, and Bad.
Request Count The number of times this request ran during the interval. The validformat is a positive integer.
228 ITCAM Agents for WebSphere Applications, J2EE, and HTTP Servers: User Guide

Request Detail The URI for servlet requests, or the method name for EJBs. Thevalid format is an alphanumeric string, with a maximum of 128 characters.
Request Fair Response Threshold (msec) The threshold that defines the fairrequests. A request that spends more time than this threshold and less time thanthe Request Bad Response Threshold (msec) attribute to complete is a fair request. Thevalid format is a positive integer.
Request Bad Delay (msec) The delay time (in milliseconds) collected during theinterval. This column is non-zero value when the whole request response timeexceeds the bad threshold configured for it. The valid format is a positive integer.
Request Fair Delay (msec) The delay time (in milliseconds) collected during theinterval. This column is non-zero value when the whole request response timeexceeds the fair threshold configured for it. The valid format is a positive integer.
Request Good Delay (msec) The delay time (in milliseconds) collected during theinterval. This column is non-zero value when the whole request response time isless than fair threshold configured for it. The valid format is a positive integer.
Request Delay Type The type of the request delay. Valid values are Unknown,Good, Fair, and Bad.
Request Label A shortened version of Request Name, used to display the requestname in the chart view. The valid format is an alphanumeric string, with amaximum of 32 characters.
Request Name The URL for servlet requests, or the fully qualified class name forEJBs. The valid format is an alphanumeric string, with a maximum of 128characters.
Request Rate (per sec) The number of requests completed per second during theinterval. If the sampling rate is less than 100%, this number is extrapolated toestimate 100% of completed requests. The valid format is a decimal (formatted tothree decimal places).
Request Type The type of request being run. Valid values are Servlet, EJB_Method,Custom, All_Workloads, Unknown, Portlet, SCA, web service provider, and webservice client.
Sample Date and Time The date and time the Tivoli Enterprise Monitoring Agentcollected the data. The valid format is a 12-character timestamp. For the STR andSCAN functions, the format is MM/DD/YY HH:MM:SS; the following table showsthe values contained in this character string:
Table 45. Format of the 12-character timestamp
Character String Meaning
MM Month
DD Day
YY Year
HH Hour
MM Minute
SS Second
Chapter 3. ITCAM Agent for WebSphere Applications 229

Example: 09/13/06 18:32:03 indicates the data was collected on September 13 2006,at 18:32:03.
This attribute was designed for logging and reporting data-collection times ratherthan for creating situations. To specify a time and date for comparison and testing,use attributes from the Universal Time or Local Time groups.
Sampling Rate (%) The percentage of requests being sampled. The valid format isa positive integer.
SCA Count The number of times this request invoked a Service ComponentArchitecture (SCA) request. The valid format is a positive integer.
SCA Time (ms) The average time (in milliseconds) this request spent processingService Component Architecture (SCA) requests. This field can have a zero value ifthe total time is less than the number of requests, due to truncation. The validformat is a positive integer.
SCA Time (%) The percentage of time this request spent processing ServiceComponent Architecture (SCA) requests. The valid format is a decimal (formattedto one decimal place).
Server Name The name of the WebSphere application server. The valid format isan alphanumeric string, with a maximum of 256 characters.
Servlet Count The number of times this request invoked a Servlet request. Thevalid format is a positive integer.
Servlet Time (ms) The average time (in milliseconds) this request spent processingServlet requests. This field can have a zero value if the total time is less than thenumber of requests, due to truncation. The valid format is a positive integer.
Servlet Time (%) The percentage of time this request spent processing Servletrequests. The valid format is a decimal (formatted to one decimal place).
SQL Connect Count The number of times this request connected to a JDBCdatabase. The valid format is a positive integer.
SQL Connect Time (ms) The average time (in milliseconds) this request spentconnecting to a JDBC database. This field can have a zero value if the total time isless than the number of requests, due to truncation. The valid format is a positiveinteger.
SQL Connect Time (%) The percentage of time this request spent connecting to aJDBC database. The valid format is a decimal (formatted to one decimal place).
SQL Execute Count The number of times this request executed a JDBC database.The valid format is a positive integer.
SQL Execute Time (ms) The average time (in milliseconds) this request spentexecuting a JDBC database. This field can have a zero value if the total time is lessthan the number of requests, due to truncation. The valid format is a positiveinteger.
SQL Execute Time (%) The percentage of time this request spent executing a JDBCdatabase. The valid format is a decimal (formatted to one decimal place).
230 ITCAM Agents for WebSphere Applications, J2EE, and HTTP Servers: User Guide

SQL Query Count The number of times this request queried a JDBC database. Thevalid format is a positive integer.
SQL Query Time (ms) The average time (in milliseconds) this request spentquerying a JDBC database. This field can have a zero value if the total time is lessthan the number of requests, due to truncation. The valid format is a positiveinteger.
SQL Query Time (%) The percentage of time this request spent querying a JDBCdatabase. The valid format is a decimal (formatted to one decimal place).
SQL Update Count The number of times this request updated a JDBC database.The valid format is a positive integer.
SQL Update Time (ms) The average time (in milliseconds) this request spentupdating a JDBC database. This field can have a zero value if the total time is lessthan the number of requests, due to truncation. The valid format is a positiveinteger.
SQL Update Time (%) The percentage of time this request spent updating a JDBCdatabase. The valid format is a decimal (formatted to one decimal place).
Summary Indicates that this row is a summary row of statistical totals for all rows.
Total Time (ms) The total CPU time (in milliseconds) this request consumedduring the interval. The valid format is a positive integer.
Web Service Count The number of times this request invoked a Web Servicerequest. The valid format is a positive integer.
Web Service Time (ms) The average time (in milliseconds) this request spentprocessing Web Service requests. This field can have a zero value if the total timeis less than the number of requests. The valid format is a positive integer.
Web Service Time (%) The percentage of time this request spent processing WebService requests. The valid format is a decimal (formatted to one decimal place).
For additional information, see:v Organization of the predefined workspacesv Attribute groups used by the predefined workspaces
Requests Monitoring Configuration attributesThe Requests Monitoring Configuration attributes provide information for allrequests monitored in application. Use these attributes to monitor application edgerequests. The agent supports three types of edge requests, Servlet/JSP, EJB, andPortal.
The attributes within this group are used to build the Request Baseline workspace.
Application Name The name of the application to which the request belongs. Thevalid format is an alphanumeric string, with a maximum of 256 characters.
Application ID The unique identifier that is assigned automatically when theapplication is first configured and is preserved during the whole application lifecycle. The valid format is a positive integer.
Chapter 3. ITCAM Agent for WebSphere Applications 231

Application Tier Threshold (msec) The response time threshold in the applicationtier in milliseconds. The valid format is a positive integer.
Auto Threshold Bad Projection (%) The bad response time projection used forauto threshold. The valid format is a positive integer.
Auto Threshold Fair Ratio The percentage to derive the fair response timethreshold from the baseline selection. The valid format is a positive integer.
Auto Threshold Fair Projection (%) The fair response time projection used forauto threshold. The valid format is a positive integer.
Auto Threshold Mode The request auto threshold mode. Valid values are Default,Custom, and Disabled.
Auto Threshold Deviation (%) The maximum allowed deviation of requestsbaseline data used for auto threshold. The valid format is a positive integer.
Auto Threshold Percent (%) The minimum percent of requests baseline data usedfor auto threshold. The valid format is a positive integer.
Backend Tier Threshold (msec) The response time threshold in the backend tier inmilliseconds. The valid format is a positive integer.
Bad Response Threshold (msec) The time (in milliseconds) that defines the badrequests. A request that spends more time than this threshold to complete is a badrequest. Use this attribute with Fair Response Threshold (msec) attribute and FairResponse Zone (msec) attribute. The valid format is a positive integer.
Bad Errors Rate Threshold The value of bad error rate percentage. The validformat is a positive integer.
Baselined Request Count The total number of requests accumulated in thebaseline. This counter shows the data since the baseline starts. The valid format isa positive integer.
Client Tier Threshold (msec) The response time threshold in the client tier inmilliseconds. The valid format is a positive integer.
Fair Response Threshold (msec) The time (in milliseconds) that defines the fairrequests. A request that spends less time than this threshold to complete is a goodrequest. Use this attribute with Fair Response Zone (msec) attribute and BadResponse Threshold (msec) attribute. The valid format is a positive integer.
Fair Response Zone (msec) The time span (in milliseconds) that defines the fairrequests. This time span is between the fair response time threshold and the badresponse time threshold. If the response time of a request falls into this time span,the request is a fair request. Use this attribute with Fair Response Threshold(msec) attribute and Bad Response Threshold (msec) attribute. The valid format isa positive integer.
Fair Errors Rate Threshold The value of fair error rate percentage. The validformat is a positive integer.
Interval (sec) The length (in seconds) of the sampling interval. The valid format isa positive integer.
232 ITCAM Agents for WebSphere Applications, J2EE, and HTTP Servers: User Guide

Node Name The name of the system on which the server is running. The validformat is an alphanumeric string, with a maximum of 256 characters.
Origin Node The name of the server subnode. The valid format is analphanumeric string, with a maximum of 128 characters.
Request Detail The request detail name. The valid format is an alphanumericstring, with a maximum of 256 characters.
Request ID The unique identifier of the request that belongs to the application.The valid format is a positive integer.
Request Label A shortened version of Request Name, used to display the requestname in the chart view. The valid format is an alphanumeric string, with amaximum of 24 characters.
Request Name The URL for servlet requests, or the fully qualified class name forEJBs. The valid format is an alphanumeric string, with a maximum of 256characters.
Request Type The type of request being run. Valid values are All, Servlet/JSP, EJB,Portal, SCA Target, Web Service Provider, and Web Service Client.
Sample Date and Time The date and time the Tivoli Enterprise Monitoring Agentcollected the data. The valid format is a 12-character timestamp. For the STR andSCAN functions, the format is MM/DD/YY HH:MM:SS; the following table showsthe values contained in this character string:
Table 46. Format of the 12-character timestamp
Character String Meaning
MM Month
DD Day
YY Year
HH Hour
MM Minute
SS Second
Example: 09/13/06 18:32:03 indicates the data was collected on September 13 2006,at 18:32:03.
This attribute was designed for logging and reporting data-collection times ratherthan for creating situations. To specify a time and date for comparison and testing,use attributes from the Universal Time or Local Time groups.
Server Name The name of the application server. The valid format is analphanumeric string, with a maximum of 256 characters.
For more information, see:v Organization of the predefined workspacesv Attribute groups used by the predefined workspaces
Chapter 3. ITCAM Agent for WebSphere Applications 233

Request Times and Rates attributesThe Request Times and Rates attribute group provides information abouthistorical request throughput and average response time for a particularapplication server.
The attributes within this group are used to build the WebSphere App Serverworkspace.
Application Name The name of the application to which the request belongs. Thevalid formats are as follows:v An alphanumeric string, with a maximum of 256 characters.v An empty string means that this sample is aggregated data for all applications
ASID The identifier (decimal) assigned to the address space running this servantregion.
Average Load The average number of concurrent requests during the interval. Thevalid format is a decimal (formatted to three decimal places).
Average Request Completion Rate The average request completion rate (that is,the request throughput). If the sampling rate is less than 100%, this number isextrapolated to estimate 100% of completed requests. The valid format is a positiveinteger.
Average Request Response Time The average request response time, inmilliseconds. The valid format is a positive integer.
Error Rate (%) The error rate of the request during the interval. The valid format isa decimal (formatted to three decimal places).
Interval (sec) The length (in seconds) of the sampling interval. The valid format isa positive integer.
Node Name The name of the system on which the server is running. The valueformat is an alphanumeric string, with a maximum of 256 characters.
Origin Node The name of the server subnode. The valid format is analphanumeric string, with a maximum of 128 characters.
Process ID Indicates the process ID of the JVM.
Request Count The number of requests processed during the current interval. Thevalid format is a positive integer.
Request Data Monitoring Level Indicates request data monitoring level forapplication.
Request Type The type of request being run. Valid values are Servlet, EJB_Method,Custom, All_Workloads, Unknown, Portlet, SCA Target, Web Service Provider, andWeb Service Client.
Sample Date and Time The date and time the Tivoli Enterprise Monitoring Agentcollected the data. The valid format is a 12-character timestamp. For the STR andSCAN functions, the format is MM/DD/YY HH:MM:SS; the following table showsthe values contained in this character string:
234 ITCAM Agents for WebSphere Applications, J2EE, and HTTP Servers: User Guide

Table 47. Format of the 12-character timestamp
Character String Meaning
MM Month
DD Day
YY Year
HH Hour
MM Minute
SS Second
Example: 09/13/06 18:32:03 indicates the data was collected on September 13 2006,at 18:32:03.
This attribute was designed for logging and reporting data-collection times ratherthan for creating situations. To specify a time and date for comparison and testing,use attributes from the Universal Time or Local Time groups.
Sampling Rate (%) The percentage of edge requests-such as servlets and JSPs-thatwere sampled during the interval. The valid format is a positive integer.
Server Name The name of the application server. The valid format is analphanumeric string, with a maximum of 256 characters.
Summary Indicates that this row is a summary row of statistical totals for all rows.
Total (ms) The total time used (in milliseconds) during the interval. The validformat is a decimal (formatted to three decimal places).
For additional information, see:v Organization of the predefined workspacesv Attribute groups used by the predefined workspaces
Selected Request attributesThe Selected Request attribute group provides detailed information about requestsfor database (that is, JDBC), messaging (that is, JMS), or EIS (that is, J2C) servicesby transactions.
The attributes within this group are used to build these workspaces:v Selected Request - Datasourcesv Selected Request - JMS Queuesv Selected Request - Resource Adaptersv Selected Request - Portal Processingv “Selected Request - Service Components workspace” on page 117
Important: The attributes within this attribute group contain meaningful valuesonly if your site has set the request data monitoring level to Level2 to collect dataon nested requests.
Activity Category The type of request. Valid values are n/a (not applicable), JDBC,JMS, JCA, and Unknown.
Chapter 3. ITCAM Agent for WebSphere Applications 235

Activity Detail Detailed information about the activity performed by the selectedrequest, for example, the SQL statement being processed. The valid format is analphanumeric string, with a maximum of 128 characters.
Activity Label An abbreviated version of Activity Name, used to display theactivity name in the chart view. The valid format is an alphanumeric string, with amaximum of 32 characters.
Activity Name The resource that the request is accessing, for example, the datasource name. The valid format is an alphanumeric string, with a maximum of 128characters.
Activity Type The type of the resource being requested. Valid values are:
Table 48. Activity types
Type Definition
n/a not applicable
Servlet A call to a doGet or doPost methods of a servlet
EJB_Method_Call A call to a business method for an EJB class
Obtain_SQL_Connection_from_Datasource A call to obtain a connection from a JDBC data source
SQL_Query A Query request to a JDBC data source
SQL_Update An Update request to a JDBC data source
SQL_Other Any other request to a JDBC data source
JMS_Message_Browse A call to browse a message from a JMS queue
JMS_Message_Get A call to receive a message from a JMS queue (that is, adestructive get)
JMS_Message_Put A call to put a message from a JMS queue
JMS_Publish_Message A call to publish a publication to a JMS queue
JCA_CCI_Execute_interaction A request by a JEE application to execute a JCAinteraction (a JDBC, JMS, or other JCA-supportedoperation) against a backend system
JNDI_Lookup A call to JNDI to build an InitialContext or to perform alookup
Unknown The activity type cannot be determined
Portlet_Processing A call for portlet processing request
Portlet_Authorization A call for portlet authorization request
Portal_Authentication A call for portal authentication request
Portal_Model_Building A call for portal page model building request
Portal_Page_Loading A call for portal page loading request
Portal_Page_Rendering A call for portal page rendering request
Portal_Legacy_Action A call for portal legacy action request
Portal_Standard_Action A call for portal standard action (JSR-88) request
SCA A call for Service Component Architecture (SCA) request
Web Service Provider A call to a web service provide
Web Service Client A call to a web service client
236 ITCAM Agents for WebSphere Applications, J2EE, and HTTP Servers: User Guide

ASID The identifier (decimal) assigned to the address space running this servantregion.
Average Response (ms) The average time (in milliseconds) executing this request,per occurrence. The valid format is a decimal (formatted to one decimal place).
Delay Percent The percentage of execution time this activity consumed on averagewhen processing this request. The valid format is a decimal (formatted to onedecimal place).
Delay Percent Count The count of individual delays used for Delay Percent. Thevalid format is a 4-byte integer. If the number is too big to be stored, a value of -2is used.
Interval (sec) The length (in seconds) of the interval. The valid format is a positiveinteger.
Longest Response (ms) The worst-case response time (in milliseconds) experiencedby this request. The valid format is a positive integer.
Node Name The name of the system on which the server is running. The validformat is an alphanumeric string, with a maximum of 128 characters.
Occurrences The number of times this request was executing during the interval.The valid format is a positive integer.
Origin Node The name of the application server subnode. The valid format is analphanumeric string, with a maximum of 128 characters.
Process ID The unique identifier of the JVM process (the class ID of the JVM). Thevalid format is a positive integer.
Request Detail The URI for servlet requests, or the method name for EJBs. Thevalid format is an alphanumeric string, with a maximum of 128 characters.
Request Name The URL for servlet requests, or the fully qualified class name forEJBs. The valid format is an alphanumeric string, with a maximum of 128characters.
Request Type The type of transaction being run. Valid values are Servlet,EJB_Method, Custom, All_Workloads, Unknown, and Portlet.
Sample Date and Time The date and time the Tivoli Enterprise Monitoring Agentcollected the data. The valid format is a 12-character timestamp. For the STR andSCAN functions, the format is MM/DD/YY HH:MM:SS; the following table showsthe values contained in this character string:
Table 49. Format of the 12-character timestamp
Character String Meaning
MM Month
DD Day
YY Year
HH Hour
MM Minute
Chapter 3. ITCAM Agent for WebSphere Applications 237

Table 49. Format of the 12-character timestamp (continued)
Character String Meaning
SS Second
Example: 09/13/06 18:32:03 indicates the data was collected on September 13 2006,at 18:32:03.
This attribute was designed for logging and reporting data-collection times ratherthan for creating situations. To specify a time and date for comparison and testing,use attributes from the Universal Time or Local Time groups.
Sampling Rate (%) The percentage of edge requests-such as servlets and JSPs-thatwere sampled for nested requests during the interval. The valid format is apositive integer.
Server Name The name of the WebSphere application server. The valid format isan alphanumeric string, with a maximum of 256 characters.
Summary Indicates that this row is a summary row of statistical totals for all rows.
Total Time (ms) The total CPU time (in milliseconds) consumed by this request.The valid format is a positive integer.
For more information, see:v Organization of the predefined workspacesv Attribute groups used by the predefined workspaces
Servlet Sessions attributesThe Servlet Sessions attribute group provides information about servlet sessions.
A session is a series of requests to a servlet, originating from the same user at thesame browser. Applications running in a Web container use Sessions to monitor theactions of individual users. The attributes within this group are used to build theSessions workspace.
Important:
v The attributes within this attribute group contain zeros for performance data ifyour site has set configuration value Resource Data Collection Method to OnDemand (for on-demand sampling) and if you have not yet run applications thatgenerate performance data. To report performance data in these attributes afterinstalling and configuring the data collector, use the WebSphere administrativeconsole to set the appropriate PMI instrumentation level.
v The Tivoli Enterprise Monitoring Agent is set by default to provide on-demandsampling; thus the attributes within this attribute group initially contain zerosuntil you select the workspace and select it again later. Each time you select theworkspace, these attributes are updated with the latest data.
Tip: For information about WebSphere PMI metrics, see “WebSphere PMI AttributeMapping” on page 373.
Average Concurrently Active Sessions The average number of concurrently activesessions during the sampling interval. A session is active if WebSphere applicationserver is currently processing a request that uses the session. The valid format is a
238 ITCAM Agents for WebSphere Applications, J2EE, and HTTP Servers: User Guide

decimal (formatted to three decimal places). This value is an average of severalvalues collected over an interval. The interval can be either between this time andthe previous time you activated this workspace, or fixed (normally 60 seconds),depending on the configuration of the Monitoring Agent.
Average Concurrently Live Sessions The average number of sessions cached inmemory during the sampling interval. The valid format is a decimal (formatted tothree decimal places). This value is an average of several values collected over aninterval. The interval can be either between this time and the previous time youactivated this workspace, or fixed (normally 60 seconds), depending on theconfiguration of the Monitoring Agent.
Average Serializable Session Object Size (bytes) The average size (in bytes) of theserializable attributes of in-memory sessions. This number is at a session level onlyand includes only session objects that contain at least one serializable attributeobject (a session can contain some attributes that are serializable and some that arenot). This value is a measurement of the data at the end of the PMI samplinginterval, not of the data in the entire sampling interval. The valid format is apositive integer.
Average Session Lifetime (ms) The average session lifetime (in milliseconds),calculated by subtracting the time the session was created from the time it wasinvalidated. The valid format is a decimal (formatted to three decimal places).
Session Lifetime Count The count of times that were averaged for AverageSession Lifetime . The valid format is a 4-byte integer. If the number is too big tobe stored, a value of -2 is used.
Broken Session Affinities The number of HTTP session affinities that broke, notcounting WebSphere application server intentional breaks of session affinity. This isthe number of requests received for sessions that were last accessed from anotherweb application and can indicate failover processing or a corrupted plug-inconfiguration. The valid format is a positive integer.
Broken Session Affinity Rate (per sec) The rate (per second) of the number ofHTTP session affinities that break, not counting the WebSphere application serverintentional breaks of session affinity, during the sampling interval. The validformat is a decimal (formatted to three decimal places).
Cache Discard Rate (per sec) The rate (per second) at which session objects havebeen forced out of the cache during the sampling interval. The valid format is adecimal (formatted to three decimal places).
Cache Discards The number of session objects that have been forced out of thecache. An LRU algorithm removes old entries to make room for new sessions andcache misses (this applies only to persistent sessions). The valid format is apositive integer.
Enterprise Application Name The name of the Enterprise application running theservlet. The valid format is an alphanumeric string, with a maximum of 256characters.
External Read Size (bytes) The size (in bytes) of the session data read from thepersistent store (applicable only to serialized, persistent sessions). The valid formatis a decimal (formatted to three decimal places).
Chapter 3. ITCAM Agent for WebSphere Applications 239

External Read Time (ms) The time (in milliseconds) taken to read the session datafrom the persistent store (applicable only to persistent sessions). For multirowsessions, the metrics are for the attributes; for single-row sessions, the metrics arefor the whole session. When using a JMS persistent store, the user has the choice ofwhether to serialize the data being replicated; if the data are not serialized, thiscounter is not available. The valid format is a decimal (formatted to three decimalplaces).
External Write Size (bytes) The size (in bytes) of session data written to thepersistent store (applicable only to serialized, persistent sessions). The valid formatis a decimal (formatted to three decimal places).
External Write Time (ms) The time (in milliseconds) taken to write the session datafrom the persistent store (applicable only to serialized, persistent sessions). Thevalid format is a decimal (formatted to three decimal places).
Failed Session Request Rate (per sec) The rate (per second) that a request for anew session could not be handled because it would exceed the maximum sessioncount for the sampling interval. The valid format is a decimal (formatted to threedecimal places).
Failed Session Requests This attribute collects data from theNoRoomForNewSessionCount metric in the Servlet Sessions Counters PMI module.The number of times a request for a new session could not be handled because itwould exceed the maximum session count; this applies only to a session inmemory with AllowOverflow=false. The valid format is a positive integer.
Instrumentation Level The web instrumentation level for this web application. ForWebSphere 5, the valid values are None, Low, Medium, High, and Maximum; forWebSphere 6 or higher, the valid values are None, Basic, Extended, All, Custom.Blank if no instrumentation level is set.
Interval (sec) The length (in seconds) of the sampling interval. The valid format isa positive integer.
Max Serializable Session Object Size (bytes) The maximum size (in bytes) of theserializable attributes of in-memory sessions. This number is at a session level onlyand includes only session objects that contain at least one serializable attributeobject (a session can contain some attributes that are serializable and some that arenot). This value is a measurement of the data at the end of the PMI samplinginterval, not of the data in the entire sampling interval. The valid format is apositive integer.
Min Serializable Session Object Size (bytes) The minimum size (in bytes) of theserializable attributes of in-memory sessions. This number is at a session level andincludes only session objects that contain at least one serializable attribute object (asession can contain some attributes that are serializable and some that are not).This value is a measurement of the data at the end of the PMI sampling interval,not of the data in the entire sampling interval. The valid format is a positiveinteger.
Node Name The name of the system on which the server is running. The validformat is an alphanumeric string, with a maximum of 128 characters.
240 ITCAM Agents for WebSphere Applications, J2EE, and HTTP Servers: User Guide

Nonexistent Session Request Rate (per sec) The rate (per second) of requests for asession that no longer exists (presumably because the session timed out) during thesampling interval. The valid format is a decimal (formatted to three decimalplaces).
Nonexistent Session Requests The number of requests for a session that no longerexists (presumably because the session timed out). Use this counter to determine ifthe timeout is too short. The valid format is a positive integer.
Origin Node The name of the server subnode. The valid format is analphanumeric string, with a maximum of 128 characters.
Sample Date and Time The date and time the Tivoli Enterprise Monitoring Agentcollected the data. The valid format is a 12-character timestamp. For the STR andSCAN functions, the format is MM/DD/YY HH:MM:SS; the following table showsthe values contained in this character string:
Table 50. Format of the 12-character timestamp
Character String Meaning
MM Month
DD Day
YY Year
HH Hour
MM Minute
SS Second
Example: 09/13/06 18:32:03 indicates the data was collected on September 13 2006,at 18:32:03.
This attribute was designed for logging and reporting data-collection times ratherthan for creating situations. To specify a time and date for comparison and testing,use attributes from the Universal Time or Local Time groups.
Server Name The name of the WebSphere application server. The valid format isan alphanumeric string, with a maximum of 256 characters.
Session Creation Rate (per sec) The rate (per second) of sessions created duringthe sampling interval. The valid format is a decimal (formatted to three decimalplaces).
Session Invalidation Rate (per sec) The rate (per second) at which sessions wereinvalidated during the sampling interval. The valid format is a decimal (formattedto three decimal places).
Sessions Created The number of sessions created during the sampling interval.The valid format is a positive integer.
Sessions Invalidated The number of sessions invalidated during the samplinginterval. The valid format is a positive integer.
Set Instrumentation Level Type Indicates the WebSphere resource category, whichis used by the agent to modify the Instrumentation Level for transaction datacollection.
Chapter 3. ITCAM Agent for WebSphere Applications 241

Summary of Servlet Sessions Whether this row is a summary row of statisticaltotals collected for the servlet sessions. The valid values are No and Yes.
Time since Last Activated The time difference (in the locale-specific format, forexample hh:mm:ss.msecs) between the previous and current access timestamps.Does not include session timeouts. The valid format is a timestamp.
Total Serializable Session Object Size (bytes) The total size (in bytes) of all thein-memory session objects. This includes only the serializable attributes in thesession object; at least one such attribute must be present to be included in thistotal. This value is a measurement of the data at the end of the PMI samplinginterval, not of the data in the entire sampling interval. The valid format is apositive integer.
Serializable Session Object Size Count The count of object sizes that were usedfor Total Serializable Session Object Size. The valid format is a 4-byte integer. If thenumber is too big to be stored, a value of -2 is used.
Web Application Archive The name of the web application WAR file. The validformat is an alphanumeric string, with a maximum of 128 characters.
For more information, see:v Organization of the predefined workspacesv Attribute groups used by the predefined workspaces
Servlets JSPs attributesThe Servlets JSPs attributes provide performance information for servlets and Javaserver pages (JSPs).
Examples of Servlets JSPs attributes include the average number of concurrentrequests for a servlet and the amount of time it takes for a servlet to complete arequest. Use the Servlets JSPs attributes in situations to monitor performance andthe usage of servlets and JSPs.
The attributes within this group are used to build the Servlets/JSPs - Selected WebApplication workspace.
Important:
v The attributes within this attribute group contain zeros for performance data ifyour site set configuration value Resource Data Collection Method to OnDemand (for on-demand sampling) and you have not yet run applications thatgenerate performance data. To report performance data in these attributes afterinstalling and configuring the data collector, use the WebSphere administrativeconsole to set the appropriate PMI instrumentation level.
v The Tivoli Enterprise Monitoring Agent is set by default to provide on-demandsampling; thus the attributes within this attribute group initially contain zerosuntil you select the workspace and then select it again later. Each time you selectthe workspace, these attributes are updated with the latest data.
Tip: For information about WebSphere PMI metrics, see “WebSphere PMI AttributeMapping” on page 373.
Average Concurrent Requests The average number of concurrent requests for theservlet or JSP during the interval. The valid format is a decimal (formatted to three
242 ITCAM Agents for WebSphere Applications, J2EE, and HTTP Servers: User Guide

decimal places). This value is an average of several values collected over aninterval. The interval can be either between this time and the previous time youactivated this workspace, or fixed (normally 60 seconds), depending on theconfiguration of the Monitoring Agent.
Average Response Time (ms) The time (in milliseconds) it took the servlet toperform a task during the interval. The valid format is a decimal (formatted tothree decimal places).
Response Time Count The count of times that were averaged for AverageResponse Time. The valid format is a 4-byte integer. If the number is too big to bestored, a value of -2 is used.
Enterprise Application Name The name of the Enterprise application. The validformat is an alphanumeric string, with a maximum of 128 characters.
Error Count The number of errors or exceptions that have occurred in the servletduring the interval. The valid format is a positive integer.
Error Rate (per sec) The servlet exceptions or errors (per second) since theprevious sample. The valid format is a decimal (formatted to three decimal places).
Instrumentation Level The instrumentation level for this servlet. For WebSphere 6or higher, the valid values are None, Basic, Extended, All, Custom. Blank if noinstrumentation level is set.
Interval (sec) The length (in seconds) of the sampling interval. The valid format isa positive integer.
Node Name The name of the system on which the server is running. The valueformat is an alphanumeric string, with a maximum of 256 characters.
Origin Node The name of the server subnode. The valid format is analphanumeric string, with a maximum of 128 characters.
Request Count The number of total requests for the servlet during the interval.The valid format is a positive integer.
Request Rate (per sec) The servlet requests (per second) since the previous sample.The valid format is a decimal (formatted to three decimal places).
Sample Date and Time The date and time the Tivoli Enterprise Monitoring Agentcollected the data. The valid format is a 12-character timestamp. For the STR andSCAN functions, the format is MM/DD/YY HH:MM:SS; the following table showsthe values contained in this character string:
Table 51. Format of the 12-character timestamp
Character String Meaning
MM Month
DD Day
YY Year
HH Hour
MM Minute
SS Second
Chapter 3. ITCAM Agent for WebSphere Applications 243

Example: 09/13/06 18:32:03 indicates the data was collected on September 13 2006,at 18:32:03.
This attribute was designed for logging and reporting data-collection times ratherthan for creating situations. To specify a time and date for comparison and testing,use attributes from the Universal Time or Local Time groups.
Server Name The name of the application server. The valid format is analphanumeric string, with a maximum of 256 characters.
Virtual Host Name The name of the virtual host. The valid format is analphanumeric string, with a maximum of 64 characters.
Servlet/JSP Name The name of the current servlet or JSP. The valid format is analphanumeric string, with a maximum of 128 characters.
Date and Time the Servlet Was Loaded The date and time when the servlet wasloaded.
JSP Path Name The name of the JSP path. The valid format is an alphanumericstring, with a maximum of 128 characters.
Total (ms) The total time (in milliseconds) used during the interval. The validformat is a decimal (formatted to three decimal places).
Type Whether this entry represents a servlet or Java server page (JSP). The validvalues are Servlet and JSP.
Web Application Archive The name of the web application WAR file. The validformat is an alphanumeric string, with a maximum of 128 characters.
Set Instrumentation Level Type The WebSphere resource category, which is usedby the agent to modify the Instrumentation Level for transaction data collection.Valid values are: ORBThreadPool, HTTPSession, DBPool, Servlet, Transaction,ObjectPool, EJB, EJBMethod, AllResources, JVMMemory, ThreadPool,WCThreadPool, WebApplicationSubModule, DynamicCache, J2CPool, ORB, WLM,ServletSessions.
For additional information, see:v Organization of the predefined workspacesv Attribute groups used by the predefined workspaces
Scheduler attributesThe Scheduler attributes display data for the Scheduler service.
The attributes within this group are used to build the Scheduler workspace.
Instrumentation Level The instrumentation level for the Scheduler. For WebSphere6 or higher, the valid values are None, Basic, Extended, All, Custom. Blank if noinstrumentation level is set.
Interval (sec) The length (in seconds) of the sampling interval. The valid format isa positive integer.
244 ITCAM Agents for WebSphere Applications, J2EE, and HTTP Servers: User Guide

Node Name The name of the system on which the server is running. The valueformat is an alphanumeric string, with a maximum of 256 characters.
Origin Node The name of the server subnode. The valid format is analphanumeric string, with a maximum of 128 characters.
Poll Count The number of polls which are collected on the intervals. The validformat is a positive integer.
Poll Duration The average alarms during the latency. The valid format is adecimal (formatted to three decimal places). This value is an average of severalvalues collected over an interval. The interval can be either between this time andthe previous time you activated this workspace, or fixed (normally 60 seconds),depending on the configuration of the Monitoring Agent.
Poll Query Duration The duration of poll query. The valid format is a decimal(formatted to three decimal places). This value is an average of several valuescollected over an interval. The interval can be either between this time and theprevious time you activated this workspace, or fixed (normally 60 seconds),depending on the configuration of the Monitoring Agent.
Row Number The row number. The valid format is a positive integer.
Run Duration The run duration. The valid format is a decimal (formatted to threedecimal places). This value is an average of several values collected over aninterval. The interval can be either between this time and the previous time youactivated this workspace, or fixed (normally 60 seconds), depending on theconfiguration of the Monitoring Agent.
Sample Date and Time The date and time the Tivoli Enterprise Monitoring Agentcollected the data. The valid format is a 12-character timestamp. For the STR andSCAN functions, the format is MM/DD/YY HH:MM:SS; the following table showsthe values contained in this character string:
Table 52. Format of the 12-character timestamp
Character String Meaning
MM Month
DD Day
YY Year
HH Hour
MM Minute
SS Second
Example: 09/13/06 18:32:03 indicates the data was collected on September 13 2006,at 18:32:03.
This attribute was designed for logging and reporting data-collection times ratherthan for creating situations. To specify a time and date for comparison and testing,use attributes from the Universal Time or Local Time groups.
Scheduler Name The name of the scheduler. The valid format is an alphanumericstring, with a maximum of 256 characters.
Chapter 3. ITCAM Agent for WebSphere Applications 245

Server Name The name of the application server. The valid format is analphanumeric string, with a maximum of 256 characters.
Summary Whether this row is a summary row of statistical totals for all rows.Valid values are No and Yes.
Task Collision Rate The rate of the task collision. The valid format is a decimal(formatted to three decimal places). This value is an average of several valuescollected over an interval. The interval can be either between this time and theprevious time you activated this workspace, or fixed (normally 60 seconds),depending on the configuration of the Monitoring Agent.
Task Delay Duration The duration of the task delay. The valid format is a decimal(formatted to three decimal places). This value is an average of several valuescollected over an interval. The interval can be either between this time and theprevious time you activated this workspace, or fixed (normally 60 seconds),depending on the configuration of the Monitoring Agent.
Task Expiration Rate The rate of the task expiration. The valid format is a decimal(formatted to three decimal places). This value is an average of several valuescollected over an interval. The interval can be either between this time and theprevious time you activated this workspace, or fixed (normally 60 seconds),depending on the configuration of the Monitoring Agent.
Task Failure Count The number of the failed tasks. The valid format is a positiveinteger.
Task Finish Count The number of the finished tasks which are collected on theintervals. The valid format is a positive integer.
Task Finish Rate The rate of the finished tasks. The valid format is a decimal(formatted to three decimal places). This value is an average of several valuescollected over an interval. The interval can be either between this time and theprevious time you activated this workspace, or fixed (normally 60 seconds),depending on the configuration of the Monitoring Agent.
Task Run Rate The rate of the run tasks. The valid format is a decimal (formattedto three decimal places). This value is an average of several values collected overan interval. The interval can be either between this time and the previous time youactivated this workspace, or fixed (normally 60 seconds), depending on theconfiguration of the Monitoring Agent.
For more information, see:v Organization of the predefined workspacesv Attribute groups used by the predefined workspaces
Service Component Elements attributesThe Service Component Elements attributes provide aggregated information aboutthe performance data for all the service components and their elements.
The attributes within this group are used to build the Service Component Elementsworkspace.
Important:
246 ITCAM Agents for WebSphere Applications, J2EE, and HTTP Servers: User Guide

v The attributes within this attribute group contain zeros for performance data ifyour site set configuration value Resource Data Collection Method to OnDemand (for on-demand sampling) and you have not yet run applications thatgenerate performance data. To report performance data in these attributes afterinstalling and configuring the data collector, use the WebSphere administrativeconsole to set the appropriate PMI instrumentation level.
v The Tivoli Enterprise Monitoring Agent is set by default to provide on-demandsampling; thus the attributes within this attribute group initially contain zerosuntil you select the workspace and then select it again later. Each time you selectthe workspace, these attributes are updated with the latest data.
v Attributes in this group are only provided for IBM WebSphere application serverversion 6.0 or later.
Tip: For information about WebSphere PMI metrics, see “WebSphere PMI AttributeMapping” on page 373.
Average Response Time (ms) The average response time (in milliseconds) in thecurrent interval. The valid format is a decimal (formatted to three decimal places).
Component The type of the component. The value format is an alphanumericstring, with a maximum of 256 characters.
Component Name The component name of the service. The value format is analphanumeric string, with a maximum of 256 characters.
Element The type of the element. The valid format is a positive integer.
Element Name The name of the element. The value format is an alphanumericstring, with a maximum of 256 characters.
Error Rate (per sec) The computed error rate. The valid format is a decimal(formatted to three decimal places).
Failed Count The failed invocations. The valid format is a positive integer.
Instrumentation Level The instrumentation level for the service componentelements. For WebSphere 6 or higher, the valid values are None, Basic, Extended,All, Custom. Blank if no instrumentation level is set.
Interval (sec) The length (in seconds) of the sampling interval. The valid format isa positive integer.
Node Name The name of the system on which the server is running. The valueformat is an alphanumeric string, with a maximum of 256 characters.
Origin Node The name of the server subnode. The valid format is analphanumeric string, with a maximum of 128 characters.
Request Count The number of requests during the interval. The valid format is apositive integer.
Request Rate (per sec) The rate of requests during the interval per second. Thevalid format is a decimal (formatted to three decimal places).
Row Number The row number. The valid format is a positive integer.
Chapter 3. ITCAM Agent for WebSphere Applications 247

Sample Date and Time The date and time the Tivoli Enterprise Monitoring Agentcollected the data. The valid format is a 12-character timestamp. For the STR andSCAN functions, the format is MM/DD/YY HH:MM:SS; the following table showsthe values contained in this character string:
Table 53. Format of the 12-character timestamp
Character String Meaning
MM Month
DD Day
YY Year
HH Hour
MM Minute
SS Second
Example: 09/13/06 18:32:03 indicates the data was collected on September 13 2006,at 18:32:03.
This attribute was designed for logging and reporting data-collection times ratherthan for creating situations. To specify a time and date for comparison and testing,use attributes from the Universal Time or Local Time groups.
Server Name The name of the application server. The valid format is analphanumeric string, with a maximum of 256 characters.
Success Count The successful invocations. The valid format is a positive integer.
Summary Whether this row is a summary row of statistical totals for all rows.Valid values are No and Yes.
Total (ms) The total time used (in milliseconds) during the interval. The validformat is a decimal (formatted to three decimal places).
For more information, see:v Organization of the predefined workspacesv Attribute groups used by the predefined workspaces
Service Components attributesThe Service Components attributes provide aggregated information about theoverview performance of the key service components.
The attributes within this group are used to build the Service Componentsworkspace.
Important:
v The attributes within this attribute group contain zeros for performance data ifyour site has set configuration value Resource Data Collection Method to OnDemand (for on-demand sampling) and if you have not yet run applications thatgenerate performance data. To report performance data in these attributes afterinstalling and configuring the data collector, use the WebSphere administrativeconsole to set the appropriate PMI instrumentation level.
v The Tivoli Enterprise Monitoring Agent is set by default to provide on-demandsampling. Thus the attributes within this attribute group initially contain zeros
248 ITCAM Agents for WebSphere Applications, J2EE, and HTTP Servers: User Guide

until you select the workspace and select it again later. Each time you select theworkspace, these attributes are updated with the latest data.
v Attributes in this group are only provided for IBM WebSphere application serverversion 6.0 or later.
Tip: For information about WebSphere PMI metrics, see “WebSphere PMI AttributeMapping” on page 373.
Count The bad request count. The valid format is a positive integer.
Instrumentation Level The instrumentation level for the service components. ForWebSphere 6 or higher, the valid values are None, Basic, Extended, All, Custom.Blank if no instrumentation level is set.
Interval (sec) The length (in seconds) of the sampling interval. The valid format isa positive integer.
Name The type of the component. Valid values areService_Component_Architecture, Business Rules, Map, Mediation, Business StateMachine, and Selector.
Node Name The name of the system on which the server is running. The valueformat is an alphanumeric string, with a maximum of 256 characters.
Origin Node The name of the server subnode. The valid format is analphanumeric string, with a maximum of 128 characters.
Sample Date and Time The date and time the Tivoli Enterprise Monitoring Agentcollected the data. The valid format is a 12-character timestamp. For the STR andSCAN functions, the format is MM/DD/YY HH:MM:SS; the following table showsthe values contained in this character string:
Table 54. Format of the 12-character timestamp
Character String Meaning
MM Month
DD Day
YY Year
HH Hour
MM Minute
SS Second
Example: 09/13/06 18:32:03 indicates the data was collected on September 13 2006,at 18:32:03.
This attribute was designed for logging and reporting data-collection times ratherthan for creating situations. To specify a time and date for comparison and testing,use attributes from the Universal Time or Local Time groups.
Server Name The name of the application server. The valid format is analphanumeric string, with a maximum of 256 characters.
Summary Whether this row is a summary row of statistical totals for all rows.Valid values are No and Yes.
Chapter 3. ITCAM Agent for WebSphere Applications 249

For additional information, see:v Organization of the predefined workspacesv Attribute groups used by the predefined workspaces
Thread Pools attributesThe Thread Pools attribute group provides information about the data source, aswell as connection statistics, for database connection pools in a WebSphereapplication server. Use it to monitor pools activity and to spot potential throttling.
The attributes within this group are used to build the Pool Analysis and ThreadPools workspaces.
Important:
v The attributes within this attribute group contain zeros for performance data ifyour site set configuration value Resource Data Collection Method to OnDemand (for on-demand sampling) and you have not yet run applications thatgenerate performance data. To report performance data in these attributes afterinstalling and configuring the data collector, use the WebSphere administrativeconsole to set the appropriate PMI instrumentation level.
v The Tivoli Enterprise Monitoring Agent is set by default to provide on-demandsampling; thus the attributes within this attribute group initially contain zerosuntil you select the workspace and then select it again later. Each time you selectthe workspace, these attributes are updated with the latest data.
Tip: For information about WebSphere PMI metrics, see “WebSphere PMI AttributeMapping” on page 373.
Application ID Indicates JEE application ID.
Average Active Threads The average number of concurrently active threads duringthe sampling interval. The valid format is a decimal (formatted to three decimalplaces). This value is an average of several values collected over an interval. Theinterval can be either between this time and the previous time you activated thisworkspace, or fixed (normally 60 seconds), depending on the configuration of theMonitoring Agent.
Average Free Threads The average number of free threads in the pool. The validformat is a decimal (formatted to three decimal places). This value is an average ofseveral values collected over an interval. The interval can be either between thistime and the previous time you activated this workspace, or fixed (normally 60seconds), depending on the configuration of the Monitoring Agent.
Average Pool Size The average number of threads in the pool. The valid format isa decimal (formatted to three decimal places). This value is an average of severalvalues collected over an interval. The interval can be either between this time andthe previous time you activated this workspace, or fixed (normally 60 seconds),depending on the configuration of the Monitoring Agent.
Important: This value might exceed Maximum Pool Size in certain configurationswhere the pool is enabled to grow beyond the specified maximum size.
Instrumentation Level The instrumentation level for the thread pools. ForWebSphere 6 or higher, the valid values are None, Basic, Extended, All, Custom.Blank if no instrumentation level is set.
250 ITCAM Agents for WebSphere Applications, J2EE, and HTTP Servers: User Guide

Interval (sec) The length (in seconds) of the sampling interval. The valid format isa positive integer.
Maximum Pool Size The configured maximum number of threads allowed in thepool. The valid format is a positive integer.
Node Name The name of the system on which the server is running. The validformat is an alphanumeric string, with a maximum of 128 characters.
Origin Node The name of the server subnode. The valid format is analphanumeric string, with a maximum of 128 characters.
Percent of Time Pool at Max The average percentage of time that all threads werein use during the sampling interval. The valid format is a decimal (formatted tothree decimal places). This value is an average of several values collected over aninterval. The interval can be either between this time and the previous time youactivated this workspace, or fixed (normally 60 seconds), depending on theconfiguration of the Monitoring Agent.
Percent Used Bad The bad percent of pool usage by application. The valid formatis a positive integer.
Percent Used Fair The fair percent of pool usage by application. The valid formatis a positive integer.
Percent Used Good The good percent of pool usage by application. The validformat is a positive integer.
Sample Date and Time The date and time the Tivoli Enterprise Monitoring Agentcollected the data. The valid format is a 12-character timestamp. For the STR andSCAN functions, the format is MM/DD/YY HH:MM:SS; the following table showsthe values contained in this character string:
Table 55. Format of the 12-character timestamp
Character String Meaning
MM Month
DD Day
YY Year
HH Hour
MM Minute
SS Second
Example: 09/13/06 18:32:03 indicates the data was collected on September 13 2006,at 18:32:03.
This attribute was designed for logging and reporting data-collection times ratherthan for creating situations. To specify a time and date for comparison and testing,use attributes from the Universal Time or Local Time groups.
Server Name The name of the WebSphere application server. The valid format isan alphanumeric string, with a maximum of 256 characters.
Chapter 3. ITCAM Agent for WebSphere Applications 251

Set Instrumentation Level Type Indicates the WebSphere resource category, whichis used by the agent to modify the Instrumentation Level for transaction datacollection.
Summary of Thread Pools Whether this row is a summary row of statistical totalscollected for all thread pools. The valid values are No and Yes.
Thread Creation Rate (per sec) The rate (per second) at which threads werecreated during the sampling interval. The valid format is a decimal (formatted tothree decimal places).
Thread Destruction Rate (per sec) The rate (per second) at which threads weredestroyed during the sampling interval. The valid format is a decimal (formattedto three decimal places).
Thread Pool Name The name of the thread pool. The valid format is analphanumeric string, with a maximum of 256 characters.
Threads Created The number of threads created during the sampling interval. Thevalid format is a positive integer.
Threads Destroyed The number of threads destroyed during the sampling interval.The valid format is a positive integer.
For more information, see:v Organization of the predefined workspacesv Attribute groups used by the predefined workspaces
Topic Spaces attributesThe Topic Spaces attributes provide aggregated information aboutpublish/subscribe messaging.
The attributes within this group are used to build the Destinations workspace.
Important:
v The attributes within this attribute group contain zeros for performance data ifyour site has set configuration value Resource Data Collection Method to OnDemand (for on-demand sampling) and you have not yet run applications thatgenerate performance data. To report performance data in these attributes afterinstalling and configuring the data collector, use the WebSphere administrativeconsole to set the appropriate PMI instrumentation level.
v The Tivoli Enterprise Monitoring Agent is set by default to provide on-demandsampling; thus the attributes within this attribute group initially contain zerosuntil you select the workspace and select it again later. Each time you select theworkspace, these attributes are updated with the latest data.
v Attributes in this group are only provided for IBM WebSphere application serverversion 6.0 or later.
Tip: For information about WebSphere PMI metrics, see “WebSphere PMI AttributeMapping” on page 373.
Assured Persistent Local Subscription Hits The cumulative total of subscriptionswhich have matched assured persistent publications. The valid format is a positiveinteger.
252 ITCAM Agents for WebSphere Applications, J2EE, and HTTP Servers: User Guide

Assured Persistent Messages Published The number of Assured Persistentmessages published. The valid format is a positive integer.
Best Effort Non-persistent Local Subscription Hits The cumulative total ofsubscriptions which have matched best effort non-persistent publications. The validformat is a positive integer.
Best Effort Non-persistent Messages Published The number of best effortnon-persistent messages published. The valid format is a positive integer.
Durable Local Subscription The number of durable subscriptions. The validformat is a positive integer.
Express Non-persistent Local Subscription Hits The cumulative total ofsubscriptions which have matched express non-persistent publications. The validformat is a positive integer.
Express Non-persistent Messages Published The number of express non-persistentmessages published. The valid format is a positive integer.
Incomplete Publication The number of publications not yet received by all currentsubscribers. If this number is unexpected, view the publication using the adminconsole to take actions. The valid format is a positive integer.
Instrumentation Level The instrumentation level for the topic spaces. ForWebSphere 6 or higher, the valid values are None, Basic, Extended, All, Custom.Blank if no instrumentation level is set.
Interval (sec) The length (in seconds) of the sampling interval. The valid format isa positive integer.
Local Oldest Publication The longest time any publication has spent on this topicspace. If this time is not what was expected, view the message using the adminconsole to decide what action needs to be taken. The valid format is a positiveinteger.
Local Publisher The number of local publishers to topics in this topic space. Thevalid format is a positive integer.
Local Publisher Attaches The number of times an attachment has been made tothis topic space by local producers. The lifetime of this value is the lifetime of themessaging engine. The valid format is a positive integer.
Messaging Engine Name The name of the message engine. The value format is analphanumeric string, with a maximum of 256 characters.
Node Name The name of the system on which the server is running. The valueformat is an alphanumeric string, with a maximum of 256 characters.
Non-Durable Local Subscription The number of non-durable subscriptions. Thevalid format is a positive integer.
Origin Node The name of the server subnode. The valid format is analphanumeric string, with a maximum of 128 characters.
Chapter 3. ITCAM Agent for WebSphere Applications 253

Reliable Non-persistent Local Subscription Hits The cumulative total ofsubscriptions which have matched reliable non-persistent publications. The validformat is a positive integer.
Reliable Non-persistent Messages Published The number of reliablenon-persistent messages published. The valid format is a positive integer.
Reliable Persistent Local Subscription Hits The cumulative total of subscriptionswhich have matched reliable persistent publications. The valid format is a positiveinteger.
Reliable Persistent Messages Published The number of reliable persistentmessages published. The valid format is a positive integer.
Report Enabled Publication Expired The number of report-enabled incompletepublications that expired while on this topic space. The valid format is a positiveinteger.
Sample Date and Time The date and time the Tivoli Enterprise Monitoring Agentcollected the data. The valid format is a 12-character timestamp. For the STR andSCAN functions, the format is MM/DD/YY HH:MM:SS; the following table showsthe values contained in this character string:
Table 56. Format of the 12-character timestamp
Character String Meaning
MM Month
DD Day
YY Year
HH Hour
MM Minute
SS Second
Example: 09/13/06 18:32:03 indicates the data was collected on September 13 2006,at 18:32:03.
This attribute was designed for logging and reporting data-collection times ratherthan for creating situations. To specify a time and date for comparison and testing,use attributes from the Universal Time or Local Time groups.
Server Name The name of the application server. The valid format is analphanumeric string, with a maximum of 256 characters.
Summary Whether this row is a summary row of statistical totals for all rows.Valid values are No and Yes.
Topic Space Name The name of the topic space. The valid format is analphanumeric string, with a maximum of 256 characters.
Total Local Subscription The number of local subscriptions to topics in this topicspace. The valid format is a positive integer.
Total Local Subscription Hits The cumulative total of subscriptions which havematched topic space publications. The valid format is a positive integer.
254 ITCAM Agents for WebSphere Applications, J2EE, and HTTP Servers: User Guide

Total Messages Published The total number of publications to this topic space.The valid format is a positive integer.
For more information, see:v Organization of the predefined workspacesv Attribute groups used by the predefined workspaces
Web Applications attributesUse the Web Applications attributes to create situations that monitor webapplication performance and application server loads.
The Web Applications attributes provide aggregated information for each webapplication and for the application server running that application. Theseperformance data describe all servlets and JSPs deployed to that web applicationas well as performance data for all servlets and JSPs running in the applicationserver. Examples include the number of loaded servlets and JSPs and totalrequests. The attributes within this group are used to build the Web Applicationsworkspace.
Important:
v The attributes within this attribute group contain zeros for performance data ifyour site has set configuration value Resource Data Collection Method to OnDemand (for on-demand sampling) and if you have not yet run applications thatgenerate performance data. To report performance data in these attributes afterinstalling and configuring the data collector, use the WebSphere administrativeconsole to set the appropriate PMI instrumentation level.
v The Tivoli Enterprise Monitoring Agent is set by default to provide on-demandsampling; thus the attributes within this attribute group initially contain zerosuntil you select the workspace and select it again later. Each time you select theworkspace, these attributes are updated with the latest data.
Tip: For information about WebSphere PMI metrics, see “WebSphere PMI AttributeMapping” on page 373.
Average Concurrent Requests The average number of concurrent requests forservlets and JSPs during the interval. The valid format is a decimal (formatted tothree decimal places). This value is an average of several values collected over aninterval. The interval can be either between this time and the previous time youactivated this workspace, or fixed (normally 60 seconds), depending on theconfiguration of the Monitoring Agent.
Average Response Time (ms) The average time (in milliseconds) required for aservlet to perform a task during the interval. Calculated by dividing the totalresponses by Request Count; if Request Count is zero, this value is set to blank.The valid format is a decimal (formatted to three decimal places).
Virtual Host Name The name of the virtual host. The valid format is analphanumeric string, with a maximum of 64 characters.
Enterprise Application Name The name of the Enterprise application. The validformat is an alphanumeric string, with a maximum of 128 characters.
Error Count The number of errors or exceptions that have occurred in the servlet.The valid format is a positive integer.
Chapter 3. ITCAM Agent for WebSphere Applications 255

Error Rate (per sec) The servlet exceptions or errors (per second) for the intervalsince the previous sample. The valid format is a decimal (formatted to threedecimal places).
Instrumentation Level The web instrumentation level for this web application. ForWebSphere 5, the valid values are None, Low, Medium, High, and Maximum. ForWebSphere 6 or higher, the valid values are None, Basic, Extended, All, Custom.Blank if no instrumentation level is set.
Interval (sec) The length (in seconds) of the sampling interval. The valid format isa positive integer.
Node Name The name of the system on which the server is running. The validformat is an alphanumeric string, with a maximum of 256 characters.
Origin Node The name of the server subnode. The valid format is analphanumeric string, with a maximum of 128 characters.
Request Count The number of total requests for the servlet during the interval.The valid format is a positive integer.
Request Rate (per sec) The servlet requests (per second) for the interval since theprevious sample. The valid format is a decimal (formatted to three decimal places).
Sample Date and Time The date and time the Tivoli Enterprise Monitoring Agentcollected the data. The valid format is a 12-character timestamp. For the STR andSCAN functions, the format is MM/DD/YY HH:MM:SS; the following table showsthe values contained in this character string:
Table 57. Format of the 12-character timestamp
Character String Meaning
MM Month
DD Day
YY Year
HH Hour
MM Minute
SS Second
Example: 09/13/06 18:32:03 indicates the data was collected on September 13 2006,at 18:32:03.
This attribute was designed for logging and reporting data-collection times ratherthan for creating situations. To specify a time and date for comparison and testing,use attributes from the Universal Time or Local Time groups.
Server Name The name of the application server. The valid format is analphanumeric string, with a maximum of 256 characters.
Servlets Loaded The number of servlets loaded during the interval. The validformat is a positive integer.
Servlets Reloaded The number of servlets reloaded during the interval. The validformat a positive integer.
256 ITCAM Agents for WebSphere Applications, J2EE, and HTTP Servers: User Guide

Set Instrumentation Level Type Indicates the WebSphere resource category, whichis used by the agent to modify the Instrumentation Level for transaction datacollection.
Subinstrumentation Level The subinstrumentation level for the web applicationservlet submodule. For WebSphere application server 5 the valid values are None,Low, Medium, High, and Maximum.
Note: Subinstrumentation Level is not supported in WebSphere application server6.0 or higher. The Tivoli Enterprise Monitoring agent uses the InstrumentationLevel instead.
Summary of All Applications Whether this row is a summary row of statisticaltotals for all web applications executed during the interval. The valid values areYes and No.
Total (ms) The total time used during the interval. The valid format is a decimal(formatted to three decimal places).
Response Time Count The number of calls for which the response times areaveraged in the Average Response Time field. The valid format is a 4-byte integer.The value -2 is used if the number is very large and can not be provided.
Web Application Archive The name of the web application WAR file. The validformat is an alphanumeric string, with a maximum of 128 characters.
For additional information, see:v Organization of the predefined workspacesv Attribute groups used by the predefined workspaces
Web Services attributesThe Web Services attributes display aggregated information about the webservices, including the number of loaded web services, the number of requestsdelivered and processed, the request response time, and the average size ofrequests.
The attributes within this group are used to build the Web Services workspace.
Important:
v The attributes within this attribute group contain zeros for performance data ifyour site has set configuration value Resource Data Collection Method to OnDemand (for on-demand sampling) and if you have not yet run applications thatgenerate performance data. To report performance data in these attributes afterinstalling and configuring the data collector, use the WebSphere administrativeconsole to set the appropriate PMI instrumentation level.
v The Tivoli Enterprise Monitoring Agent is set by default to provide on-demandsampling. Thus the attributes within this attribute group initially contain zerosuntil you select the workspace and select it again later. Each time you select theworkspace, these attributes are updated with the latest data.
Tip: For information about WebSphere PMI metrics, see “WebSphere PMI AttributeMapping” on page 373.
Chapter 3. ITCAM Agent for WebSphere Applications 257

Dispatched Requests The number of requests the service dispatched or delivered.The valid format is a positive integer.
Dispatch Response Time The average response time, in milliseconds, to dispatch arequest. The valid format is a decimal (formatted to three decimal places).
Dispatch Response Time Count The count of times that were averaged forDispatch Response Time. The valid format is a 4-byte integer. If the number is toobig to be stored, a value of -2 is used.
Instrumentation Level The instrumentation level for the web services counters. ForWebSphere 6 or higher, the valid values are None, Basic, Extended, All, Custom.Blank if no instrumentation level is set.
Interval (sec) The length (in seconds) of the sampling interval. The valid format isa positive integer.
Node Name The name of the system on which the server is running. The valueformat is an alphanumeric string, with a maximum of 256 characters.
Origin Node The name of the server subnode. The valid format is analphanumeric string, with a maximum of 128 characters.
Payload Size The average payload size in bytes of a received request or reply. Thevalid format is a positive integer.
Payload Size Count The count of sizes that were averaged for Payload Size. Thevalid format is a 4-byte integer. If the number is too big to be stored, a value of -2is used.
Processed Requests The number of requests the service successfully processed.Valid format is a positive integer.
Received Requests The number of requests the service received. The valid formatis a positive integer.
Reply Payload Size The average payload size (in bytes) of a reply. The validformat is a positive integer.
Reply Payload Size Count The count of sizes that were averaged for ReplyPayload Size. The valid format is a 4-byte integer. If the number is too big to bestored, a value of -2 is used.
Reply Response Time The average response time, in milliseconds, to prepare areply after dispatch. The valid format is a decimal (formatted to three decimalplaces).
Reply Response Time Count The count of times that were averaged for ReplyResponse Time. The valid format is a 4-byte integer. If the number is too big to bestored, a value of -2 is used.
Request Payload Size The average payload size, in bytes, of a request. The validformat is a positive integer.
258 ITCAM Agents for WebSphere Applications, J2EE, and HTTP Servers: User Guide

Request Payload Size Count The count of sizes that were averaged for RequestPayload Size. The valid format is a 4-byte integer. If the number is too big to bestored, a value of -2 is used.
Request Response Time The average response time, in milliseconds, to prepare arequest for dispatch. The valid format is a decimal (formatted to three decimalplaces).
Request Response Time Count The count of times that were averaged for RequestResponse Time. The valid format is a 4-byte integer. If the number is too big to bestored, a value of -2 is used.
Response Time The average response time (in milliseconds) for a successfulrequest. The valid format is a decimal (formatted to three decimal places).
Response Time Count The count of times that were averaged for Response Time.The valid format is a 4-byte integer. If the number is too big to be stored, a valueof -2 is used.
Sample Date and Time The date and time the Tivoli Enterprise Monitoring Agentcollected the data. The valid format is a 12-character timestamp. For the STR andSCAN functions, the format is MM/DD/YY HH:MM:SS; the following table showsthe values contained in this character string:
Table 58. Format of the 12-character timestamp
Character String Meaning
MM Month
DD Day
YY Year
HH Hour
MM Minute
SS Second
Example: 09/13/06 18:32:03 indicates the data was collected on September 13 2006,at 18:32:03.
This attribute was designed for logging and reporting data-collection times ratherthan for creating situations. To specify a time and date for comparison and testing,use attributes from the Universal Time or Local Time groups.
Server Name The name of the application server. The valid format is analphanumeric string, with a maximum of 256 characters.
Summary Whether this row is a summary row of statistical totals for all rows.Valid values are No and Yes.
Total Dispatch (ms) The total time (in milliseconds) the service dispatchesrequests. The valid format is a decimal (formatted to three decimal places).
Total Prepare (ms) The total time (in milliseconds) the service prepares requests.The valid format is a decimal (formatted to three decimal places).
Chapter 3. ITCAM Agent for WebSphere Applications 259

Total Processing (ms) The total time (in milliseconds) the service processesrequests. The valid format is a decimal (formatted to three decimal places).
Web Service The name of the web service. The valid format is an alphanumericstring, with a maximum of 256 characters.
For additional information, see:v Organization of the predefined workspacesv Attribute groups used by the predefined workspaces
Web Services Gate Way attributesThe Web Services Gate Way attributes display aggregated information about theWeb Services Gateway, including synchronous requests, asynchronous requests,synchronous responses, and asynchronous responses.
The attributes within this group are used to build the Web Services workspace.
Important:
v The attributes within this attribute group contain zeros for performance data ifyour site has set configuration value Resource Data Collection Method to OnDemand (for on-demand sampling) and if you have not yet run applications thatgenerate performance data. To report performance data in these attributes afterinstalling and configuring the data collector, use the WebSphere administrativeconsole to set the appropriate PMI instrumentation level.
v The Tivoli Enterprise Monitoring Agent is set by default to provide on-demandsampling; thus the attributes within this attribute group initially contain zerosuntil you select the workspace and select it again later. Each time you select theworkspace, these attributes are updated with the latest data.
Tip: For information about WebSphere PMI metrics, see “WebSphere PMI AttributeMapping” on page 373.
Asynchronous Requests The number of asynchronous requests made. The validformat is a positive integer.
Asynchronous Responses The number of asynchronous responses made. The validformat is a positive integer.
Instrumentation Level The instrumentation level for the Web Services Gatewaycounters. For WebSphere 6 or higher, the valid values are None, Basic, Extended,All, Custom. Blank if no instrumentation level is set.
Interval (sec) The length (in seconds) of the sampling interval. The valid format isa positive integer.
Node Name The name of the system on which the server is running. The valueformat is an alphanumeric string, with a maximum of 256 characters.
Origin Node The name of the server subnode. The valid format is analphanumeric string, with a maximum of 128 characters.
Sample Date and Time The date and time the Tivoli Enterprise Monitoring Agentcollected the data. The valid format is a 12-character timestamp. For the STR and
260 ITCAM Agents for WebSphere Applications, J2EE, and HTTP Servers: User Guide

SCAN functions, the format is MM/DD/YY HH:MM:SS; the following table showsthe values contained in this character string:
Table 59. Format of the 12-character timestamp
Character String Meaning
MM Month
DD Day
YY Year
HH Hour
MM Minute
SS Second
Example: 09/13/06 18:32:03 indicates the data was collected on September 13 2006,at 18:32:03.
This attribute was designed for logging and reporting data-collection times ratherthan for creating situations. To specify a time and date for comparison and testing,use attributes from the Universal Time or Local Time groups.
Server Name The name of the application server. The valid format is analphanumeric string, with a maximum of 256 characters.
Summary Whether this row is a summary row of statistical totals for all rows.Valid values are No and Yes.
Synchronous Requests The number of synchronous requests made. The validformat is a positive integer.
Synchronous Responses The number of synchronous responses made. The validformat is a positive integer.
Web Service The name of the web service. The valid format is an alphanumericstring, with a maximum of 256 characters.
For more information, see:v Organization of the predefined workspacesv Attribute groups used by the predefined workspaces
WebSphere Agent Events attributesThe WebSphere Agent Events attributes provide information about agent-levelevents that affect the ability of the Tivoli Enterprise Monitoring Agent to collectdata about WebSphere application server. These attributes provide exception anderror messages, their IDs, and their severities.
The attributes within this group are used to build the WebSphere Agentworkspace.
Event Date and Time The date and time the event occurred. The valid format is a12-character timestamp. For the STR and SCAN functions, the format isMM/DD/YY HH:MM:SS; the following table shows the values contained in thischaracter string:
Chapter 3. ITCAM Agent for WebSphere Applications 261

Table 60. Format of the 12-character timestamp
Character String Meaning
MM Month
DD Day
YY Year
HH Hour
MM Minute
SS Second
Example: 09/13/06 18:32:03 indicates the data was collected on September 13 2006,at 18:32:03.
This attribute was designed for logging and reporting data-collection times ratherthan for creating situations. To specify a time and date for comparison and testing,use attributes from the Universal Time or Local Time groups.
Message Description The message description. The valid format is analphanumeric string, with a maximum of 256 characters.
Message ID The message ID. The valid format is an alphanumeric string, with amaximum of eight characters.
Node Name The system on which the server is running. The valid format is analphanumeric string, with a maximum of 128 characters.
Origin Node The name of the server subnode. The valid format is analphanumeric string, with a maximum of 128 characters.
Sequence Number The sequence number of the message. The valid format is apositive integer.
Severity The severity of the event. Valid values are Info, Warning, Error, andSevere.
Function The valid format is an alphanumeric string, with a maximum of 32characters.
File Name The name of the file. The valid format is an alphanumeric string, with amaximum of 8 characters.
Line Number The number of the line. The valid format is a 4-byte integer.
For additional information, see:v Organization of the predefined workspacesv Attribute groups used by the predefined workspaces
WMQ Client Link Communications attributesThe WMQ Client Link Communications attributes display aggregated informationfor all the clients of WMQ Queue Managers that are or have been connected to thisapplication server.
262 ITCAM Agents for WebSphere Applications, J2EE, and HTTP Servers: User Guide

The attributes within this group are used to build the WMQ Client LinkCommunications workspace.
Important:
v The attributes within this attribute group contain zeros for performance data ifyour site has set configuration value Resource Data Collection Method to OnDemand (for on-demand sampling) and if you have not yet run applications thatgenerate performance data. To report performance data in these attributes afterinstalling and configuring the data collector, use the WebSphere administrativeconsole to set the appropriate PMI instrumentation level.
v The Tivoli Enterprise Monitoring Agent is set by default to provide on-demandsampling. Thus the attributes within this attribute group initially contain zerosuntil you select the workspace and reselect it later. Each time you reselect theworkspace, these attributes are updated with the latest data.
v Attributes in this group are only provided for IBM WebSphere application serverversion 6.0 or later.
Tip: For information about WebSphere PMI metrics, see “WebSphere PMI AttributeMapping” on page 373.
API Calls Serviced The number of MQ API call requests serviced on behalf ofWMQ JMS clients. The valid format is a positive integer.
Batches Sent The number of batches of messages sent to network attached WMQJMS clients. The valid format is a positive integer.
Clients Attached The current number of WMQ JMS clients attached to thisapplication server. The valid format is a positive integer.
Comms Errors The number of errors that have caused connections to WMQ JMSclients to be dropped. The valid format is a positive integer.
Instrumentation Level The instrumentation level for the WMQ client linkcommunications. For WebSphere 6 or higher, the valid values are None, Basic,Extended, All, Custom. Blank if no instrumentation level is set.
Interval (sec) The length (in seconds) of the sampling interval. The valid format isa positive integer.
Messages Received The number of messages received from network attachedWMQ JMS clients. The valid format is a positive integer.
Messages Sent The number of messages sent to network attached WMQ JMSclients. The valid format is a positive integer.
Messaging Engine Name The name of the message engine. The value format is analphanumeric string, with a maximum of 256 characters.
Node Name The name of the system on which the server is running. The valueformat is an alphanumeric string, with a maximum of 256 characters.
Origin Node The name of the server subnode. The valid format is analphanumeric string, with a maximum of 128 characters.
Chapter 3. ITCAM Agent for WebSphere Applications 263

Reads Blocked The number of read operations that could not be completedimmediately. This number can be used as an indicator of network congestion whencommunicating with WMQ JMS clients. The valid format is a positive integer.
Received (bytes) The number of bytes of data received from network attachedWMQ JMS clients. This includes bytes of message data as well as bytes of dataused to control the flow of messages. The valid format is a positive integer.
Sample Date and Time The date and time the Tivoli Enterprise Monitoring Agentcollected the data. The valid format is a 12-character timestamp. For the STR andSCAN functions, the format is MM/DD/YY HH:MM:SS; the following table showsthe values contained in this character string:
Table 61. Format of the 12-character timestamp
Character String Meaning
MM Month
DD Day
YY Year
HH Hour
MM Minute
SS Second
Example: 09/13/06 18:32:03 indicates the data was collected on September 13 2006,at 18:32:03.
This attribute was designed for logging and reporting data-collection times ratherthan for creating situations. To specify a time and date for comparison and testing,use attributes from the Universal Time or Local Time groups.
Sent (bytes) The number of bytes of data sent to network attached WMQ JMSclients. This includes bytes of message data as well as bytes of data used to controlthe flow of messages. The valid format is a positive integer.
Server Name The name of the application server. The valid format is analphanumeric string, with a maximum of 256 characters.
Writes Blocked The number of write operations that could not be completedimmediately. This number can be used as an indicator of network congestion whencommunicating with WMQ JMS clients. The valid format is a positive integer.
For additional information, see:v Organization of the predefined workspacesv Attribute groups used by the predefined workspaces
WMQ Link Communications attributesThe WMQ Link Communications attributes display aggregated information for allthe WMQ Queue Managers that are or have been connected to this applicationserver.
The attributes within this group are used to build the WMQ Link Communicationsworkspace.
264 ITCAM Agents for WebSphere Applications, J2EE, and HTTP Servers: User Guide

Important:
v The attributes within this attribute group contain zeros for performance data ifyour site has set configuration value Resource Data Collection Method to OnDemand (for on-demand sampling) and if you have not yet run applications thatgenerate performance data. To report performance data in these attributes afterinstalling and configuring the data collector, use the WebSphere administrativeconsole to set the appropriate PMI instrumentation level.
v The Tivoli Enterprise Monitoring Agent is set by default to provide on-demandsampling. Thus the attributes within this attribute group initially contain zerosuntil you select the workspace and then select it again later. Each time you selectthe workspace, these attributes are updated with the latest data.
v Attributes in this group are only provided for IBM WebSphere application serverversion 6.0 or later.
Tip: For information about WebSphere PMI metrics, see “WebSphere PMI AttributeMapping” on page 373.
Batches Received The number of batches of messages received from networkattached WMQ Queue Managers. The valid format is a positive integer.
Batches Sent The number of batches of messages sent to network attached WMQQueue Managers. The valid format is a positive integer.
Comms Errors The number of communication errors that resulted in a networkconnection to a WMQ Queue Manager being disconnected. The valid format is apositive integer.
Instrumentation Level The instrumentation level for the WMQ linkcommunications. For WebSphere 6 or higher, the valid values are None, Basic,Extended, All, Custom. Blank if no instrumentation level is set.
Interval (sec) The length (in seconds) of the sampling interval. The valid format isa positive integer.
Long Retries The number of long retries. This indicates the number of timeschannels were disconnected and could not be re-established for longer periods oftime. The valid format is a positive integer.
Messages Received The number of messages received from network attachedWMQ Queue Managers. The valid format is a positive integer.
Messages Sent The number of messages sent to network attached WMQ QueueManagers. The valid format is a positive integer.
Messaging Engine Name The name of the message engine. The value format is analphanumeric string, with a maximum of 256 characters.
Node Name The name of the system on which the server is running. The valueformat is an alphanumeric string, with a maximum of 256 characters.
Origin Node The name of the server subnode. The valid format is analphanumeric string, with a maximum of 128 characters.
QM Attached The total number of WMQ Queue Managers currently networkattached to this application server. The valid format is a positive integer.
Chapter 3. ITCAM Agent for WebSphere Applications 265

Reads Blocked The number of read operations that could not be completedimmediately. This number can be used as an indicator of network congestion whencommunicating with WMQ Queue Managers. The valid format is a positiveinteger.
Receiver Received (bytes) The number of bytes of data received by receiverchannels from network attached WMQ Queue Managers. The valid format is apositive integer.
Receiver Sent (bytes) The number of bytes data sent by receiver channels tonetwork attached WMQ Queue Managers. The valid format is a positive integer.
Sample Date and Time The date and time the Tivoli Enterprise Monitoring Agentcollected the data. The valid format is a 12-character timestamp. For the STR andSCAN functions, the format is MM/DD/YY HH:MM:SS; the following table showsthe values contained in this character string:
Table 62. Format of the 12-character timestamp
Character String Meaning
MM Month
DD Day
YY Year
HH Hour
MM Minute
SS Second
Example: 09/13/06 18:32:03 indicates the data was collected on September 13 2006,at 18:32:03.
This attribute was designed for logging and reporting data-collection times ratherthan for creating situations. To specify a time and date for comparison and testing,use attributes from the Universal Time or Local Time groups.
Sender Received (bytes) The number of bytes of data received by sender channelsfrom network attached WMQ Queue Managers. The valid format is a positiveinteger.
Sender Sent (bytes) The number of bytes of data sent by sender channels tonetwork attached WMQ Queue Managers. The valid format is a positive integer.
Server Name The name of the application server. The valid format is analphanumeric string, with a maximum of 256 characters.
Short Retries The number of short retries. This indicates the number of timeschannels were disconnected and could not be re-established for short periods oftime. The valid format is a positive integer.
Writes Blocked The number of write operations that could not be completedimmediately. This number can be used as an indicator of network congestion whencommunicating with WMQ Queue Managers. The valid format is a positiveinteger.
For more information, see:
266 ITCAM Agents for WebSphere Applications, J2EE, and HTTP Servers: User Guide

v Organization of the predefined workspacesv Attribute groups used by the predefined workspaces
Workload Management Client attributesThe Workload Management Client attribute group provides information about theclient that initiates workload requests.
Workload management (WLM) optimizes the distribution of client processing tasks.Incoming work requests are distributed to the application servers, enterprise beans,servlets, and other objects that can most effectively process their requests.Workload management also provides failover when servers are not available,improving application availability. In a WebSphere application server environment,you implement workload management by using clusters, transports, andreplication domains.
The attributes within this group are used to build the Workload Managementworkspace.
Important:
v The attributes within this attribute group contain zeros for performance data ifyour site has set configuration value Resource Data Collection Method to OnDemand (for on-demand sampling) and if you have not yet run applications thatgenerate performance data. To report performance data in these attributes afterinstalling and configuring the data collector, use the WebSphere administrativeconsole to set the appropriate PMI instrumentation level.
v The Tivoli Enterprise Monitoring Agent is set by default to provide on-demandsampling. Thus the attributes within this attribute group initially contain zerosuntil you select the workspace and then select it again later. Each time you selectthe workspace, these attributes are updated with the latest data.
Tip: For information about WebSphere PMI metrics, see “WebSphere PMI AttributeMapping” on page 373.
Client Cluster Update Rate (per sec) The rate (per second) at which times thisclient has received new server cluster information during the sampling interval.Use this metric to determine how often cluster information is being propagated.The valid format is a decimal (formatted to three decimal places).
Client Cluster Updates The number of times initial or updated server cluster datais sent to a WLM-enabled client from a server cluster member. Use this metric todetermine how often cluster information is being propagated. The valid format is apositive integer.
Client Response Time (ms) The response time (in milliseconds) for IIOP requestssent by a client. This response time is calculated based on the time the client sendsthe request to the time the server sends the reply. The valid format is a decimal(formatted to three decimal places).
Client Response Time Count The count of times that were used for ClientResponse Time. The valid format is a 4-byte integer. If the number is too big to bestored, a value of -2 is used.
Instrumentation Level The instrumentation level for the WLM client. ForWebSphere 6 or higher, the valid values are None, Basic, Extended, All, Custom.Blank if no instrumentation level is set.
Chapter 3. ITCAM Agent for WebSphere Applications 267

Interval (sec) The length (in seconds) of the sampling interval. The valid format isa positive integer.
Node Name The name of the system on which the server is running. The validformat is an alphanumeric string, with a maximum of 128 characters.
Origin Node The name of the server subnode. The valid format is analphanumeric string, with a maximum of 128 characters.
Outgoing Request Rate (per sec) The rate (per second) at which outgoing IIOPrequests were being sent from this client to an application server during thesampling interval. The valid format is a decimal (formatted to three decimalplaces).
Outgoing Requests The number of outgoing IIOP requests being sent from thisclient to an application server. The valid format is a positive integer.
Sample Date and Time The date and time the Tivoli Enterprise Monitoring Agentcollected the data. The valid format is a 12-character timestamp. For the STR andSCAN functions, the format is MM/DD/YY HH:MM:SS; the following table showsthe values contained in this character string:
Table 63. Format of the 12-character timestamp
Character String Meaning
MM Month
DD Day
YY Year
HH Hour
MM Minute
SS Second
Example: 09/13/06 18:32:03 indicates the data was collected on September 13 2006,at 18:32:03.
This attribute was designed for logging and reporting data-collection times ratherthan for creating situations. To specify a time and date for comparison and testing,use attributes from the Universal Time or Local Time groups.
Server Name The name of the WebSphere application server. The valid format isan alphanumeric string, with a maximum of 256 characters.
Set Instrumentation Level Type Indicates the WebSphere resource category, whichis used by the agent to modify the Instrumentation Level for transaction datacollection.
Total Client Response (ms) The total response time (in milliseconds) for IIOPrequests sent by a client. The valid format is a decimal (formatted to three decimalplaces).
For more information, see:v Organization of the predefined workspacesv Attribute groups used by the predefined workspaces
268 ITCAM Agents for WebSphere Applications, J2EE, and HTTP Servers: User Guide

Workload Management Server attributesThe Workload Management Server attribute group provides information about theworkload management server.
Workload management (WLM) optimizes the distribution of client processing tasks.Incoming work requests are distributed to the application servers, enterprise beans,servlets, and other objects that can most effectively process those requests.Workload management also provides failover when servers are not available,improving application availability. In a WebSphere application server environment,you implement workload management by using clusters, transports, andreplication domains.
The attributes within this group are used to build the Workload Managementworkspace.
Important:
v The attributes within this attribute group contain zeros for performance data ifyour site has set configuration value Resource Data Collection Method to OnDemand (for on-demand sampling) and if you have not yet run applications thatgenerate performance data. To report performance data in these attributes afterinstalling and configuring the data collector, use the WebSphere administrativeconsole to set the appropriate PMI instrumentation level.
v The Tivoli Enterprise Monitoring Agent is set by default to provide on-demandsampling. Thus the attributes within this attribute group initially contain zerosuntil you select the workspace and select it again later. Each time you select theworkspace, these attributes are updated with the latest data.
Tip: For information about WebSphere PMI metrics, see “WebSphere PMI AttributeMapping” on page 373.
Concurrent Requests The number of remote IIOP requests being processed by thisserver. The valid format is a decimal (formatted to three decimal places). Thisvalue is an average of several values collected over an interval. The interval can beeither between this time and the previous time you activated this workspace, orfixed (normally 60 seconds), depending on the configuration of the MonitoringAgent.
Incoming Non-WLM Object Request Rate (per sec) The rate (per second) ofincoming IIOP requests from an application running on a non-WLM client duringthe sampling interval. This type of client either does not have the WLM runtimepresent, or the client object reference was flagged not to participate in workloadmanagement. The valid format is a decimal (formatted to three decimal places).
Incoming Non-WLM Object Requests The number of incoming IIOP requests toan application from a client that does not have the WLM runtime present or whoseobject reference was flagged not to participate in workload management. The validformat is a positive integer.
Incoming Nonaffinity Request Rate (per sec) The rate (per second) of incomingIIOP requests to an application server based on no affinity during the samplinginterval. The valid format is a decimal (formatted to three decimal places).
Incoming Nonaffinity Requests The number of incoming IIOP requests to anapplication server based on no affinity. This request was sent to this server based
Chapter 3. ITCAM Agent for WebSphere Applications 269

on workload management selection policies that were decided in the client WLMrun time. The valid format is a positive integer.
Incoming Request Rate (per sec) The rate (per second) of incoming IIOP requeststo an application server during the sampling interval. The valid format is adecimal (formatted to three decimal places).
Incoming Requests The number of incoming IIOP requests to an applicationserver during the sampling interval. The valid format is a positive integer.
Incoming Strong Affinity Request Rate (per sec) The rate (per second) ofincoming IIOP requests to an application server that are based on a strong affinityduring the sampling interval. The valid format is a decimal (formatted to threedecimal places).
Incoming Strong Affinity Requests The number of incoming IIOP requests to anapplication server that are based on a strong affinity. A strong affinity request isone that must be serviced by this application server because of a dependency thatresides on the server. This request could not successfully be serviced by anothermember of the server cluster. The valid format is a positive integer.
Instrumentation Level The instrumentation level for the WLM server. ForWebSphere 6 or higher, the valid values are None, Basic, Extended, All, Custom.Blank if no instrumentation level is set.
Interval (sec) The length (in seconds) of the sampling interval. The valid format isa positive integer.
Node Name The name of the system on which the server is running. The validformat is an alphanumeric string, with a maximum of 128 characters.
Origin Node The name of the server subnode. The valid format is analphanumeric string, with a maximum of 128 characters.
Sample Date and Time The date and time the Tivoli Enterprise Monitoring Agentcollected the data. The valid format is a 12-character timestamp. For the STR andSCAN functions, the format is MM/DD/YY HH:MM:SS; the following table showsthe values contained in this character string:
Table 64. Format of the 12-character timestamp
Character String Meaning
MM Month
DD Day
YY Year
HH Hour
MM Minute
SS Second
Example: 09/13/06 18:32:03 indicates the data was collected on September 13 2006,at 18:32:03.
270 ITCAM Agents for WebSphere Applications, J2EE, and HTTP Servers: User Guide

This attribute was designed for logging and reporting data-collection times ratherthan for creating situations. To specify a time and date for comparison and testing,use attributes from the Universal Time or Local Time groups.
Server Cluster Update Rate (per sec) The rate (per second) at which this serverreceived new server cluster information during the sampling interval. The validformat is a decimal (formatted to three decimal places).
Server Cluster Updates The number of times initial or updated server cluster dataare sent to a server member from the deployment manager. This metric determineshow often cluster information is being propagated. The valid format is a positiveinteger.
Server Name The name of the WebSphere application server. The valid format isan alphanumeric string, with a maximum of 256 characters.
Server Response Time (ms) The response time (in milliseconds) at which IIOPrequests were serviced by an application server, calculated based on the time therequest is received versus the time the reply is sent. The valid format is a decimal(formatted to three decimal places).
Server Response Time Count The count of times that were used for ServerResponse Time. The valid format is a 4-byte integer. If the number is too big to bestored, a value of -2 is used.
Total Server Response (ms) The total response time (in milliseconds) at whichIIOP requests were serviced by an application server. The valid format is a decimal(formatted to three decimal places).
Set Instrumentation Level Type Indicates the WebSphere resource category, whichis used by the agent to modify the Instrumentation Level for transaction datacollection.
WLM Clients Serviced The number of WLM-enabled clients this application serverhas serviced during the interval. The valid format is a positive integer.
WLM Clients Serviced Rate (per sec) The rate (per second) at which this serverhas serviced WLM-enabled clients during the sampling interval. The valid formatis a decimal (formatted to three decimal places).
WLM Server Weight A control for work directed to the application server. If theserver weight value is greater than the weight values assigned to other servers inthe cluster, then the server receives a larger share of the cluster workload. Thevalid format is a positive integer.
For more information, see:v Organization of the predefined workspacesv Attribute groups used by the predefined workspaces
Workplace Mail IMAP/POP attributesThe Workplace Mail IMAP/POP attributes displays the usage information for theIMAP service and POP3 service connectivity.
The attributes within this group are used to build the IMAP/POP workspace.
Chapter 3. ITCAM Agent for WebSphere Applications 271

Important:
v The attributes within this attribute group contain zeros for performance data ifyour site has set configuration value Resource Data Collection Method to OnDemand (for on-demand sampling) and if you have not yet run applications thatgenerate performance data. To report performance data in these attributes afterinstalling and configuring the data collector, use the WebSphere administrativeconsole to set the appropriate PMI instrumentation level.
v The Tivoli Enterprise Monitoring Agent is set by default to provide on-demandsampling. Thus the attributes within this attribute group initially contain zerosuntil you select the workspace and then select it again later. Each time you selectthe workspace, these attributes are updated with the latest data.
Important: This workspace does not support linking to ITCAM for ApplicationDiagnostics Managing Server visualization engine.
Tip: For information about WebSphere PMI metrics, see “WebSphere PMI AttributeMapping” on page 373.
Active Sessions The number of active sessions during the sampling interval. Thevalid format is a positive integer.
Active SSL Sessions The number of active, secure sessions during the samplinginterval. The valid format is a positive integer.
Authentication Failures The number of authentications failures during thesampling interval. The valid format is a positive integer.
Connection (ms) The time (in milliseconds) spent connected to clients during thesampling interval. The valid format is a positive integer.
IMAP Instrumentation Level The instrumentation level for IMAP PMI module.Valid values are None, Low, Medium, High, Basic, Extended, All, Custom, andMaximum. Blank if no instrumentation level is set.
Interval (sec) The length (in seconds) of the sampling interval. The valid format isa positive integer.
Node Name The name of the system on which the server is running. The valueformat is an alphanumeric string, with a maximum of 256 characters.
Origin Node The name of the server subnode. The valid format is analphanumeric string, with a maximum of 128 characters.
Peak Session load The maximum number of concurrent sessions during thesampling interval. The valid format is a positive integer.
POP Instrumentation Level The instrumentation level for POP PMI module. Validvalues are None, Low, Medium, High, Basic, Extended, All, Custom, andMaximum. Blank if no instrumentation level is set.
Protocol The protocol type of the workplace mail. Valid values are IMAP and POP.
Sample Date and Time The date and time the Tivoli Enterprise Monitoring Agentcollected the data. The valid format is a 12-character timestamp. For the STR and
272 ITCAM Agents for WebSphere Applications, J2EE, and HTTP Servers: User Guide

SCAN functions, the format is MM/DD/YY HH:MM:SS; the following table showsthe values contained in this character string:
Table 65. Format of the 12-character timestamp
Character String Meaning
MM Month
DD Day
YY Year
HH Hour
MM Minute
SS Second
Example: 09/13/06 18:32:03 indicates the data was collected on September 13 2006,at 18:32:03.
This attribute was designed for logging and reporting data-collection times ratherthan for creating situations. To specify a time and date for comparison and testing,use attributes from the Universal Time or Local Time groups.
Server Name The name of the application server. The valid format is analphanumeric string, with a maximum of 256 characters.
Successful Authentications The number of successful authentications during thesampling interval. The valid format is a positive integer.
Instrumentation Level The Instrumentation Level for this container. Valid fixedvalues None, Low, Medium, High, Basic, Extended, All, Custom, Maximum.
For more information, see:v Organization of the predefined workspacesv Attribute groups used by the predefined workspaces
Workplace Mail Queues attributesThe Workplace Mail Queues attributes display information about the messagedelivery state, including ready, retry, unprocessed, and dead.
The attributes within this group are used to build the Messages Queuesworkspace.
Important:
v The attributes within this attribute group contain zeros for performance data ifyour site has set configuration value Resource Data Collection Method to OnDemand (for on-demand sampling) and if you have not yet run applications thatgenerate performance data. To report performance data in these attributes afterinstalling and configuring the data collector, use the WebSphere administrativeconsole to set the appropriate PMI instrumentation level.
v The Tivoli Enterprise Monitoring Agent is set by default to provide on-demandsampling. Thus the attributes within this attribute group initially contain zerosuntil you select the workspace and select again it later. Each time you select theworkspace, these attributes are updated with the latest data.
Chapter 3. ITCAM Agent for WebSphere Applications 273

Important: This workspace does not support linking to ITCAM for ApplicationDiagnostics Managing Server visualization engine.
Tip: For information about WebSphere PMI metrics, see “WebSphere PMI AttributeMapping” on page 373.
Dead The number of messages in the dead state in the queue during the samplinginterval. The valid format is a positive integer.
Instrumentation Level The instrumentation level for the service components. ForWebSphere 6 or higher, the valid values are None, Basic, Extended, All, Custom.Blank if no instrumentation level is set.
Interval (sec) The length (in seconds) of the sampling interval. The valid format isa positive integer.
Node Name The name of the system on which the server is running. The valueformat is an alphanumeric string, with a maximum of 256 characters.
Origin Node The name of the server subnode. The valid format is analphanumeric string, with a maximum of 128 characters.
Queue The Lotus Workplace Mail queue name. Valid values are A, B, C, D, E, F, G,H, and Summary.
Ready The number of messages in the ready state in the queue during thesampling interval. The valid format is a positive integer.
Retry The number of messages in the retry state in the queue during the samplinginterval. The valid format is a positive integer.
Sample Date and Time The date and time the Tivoli Enterprise Monitoring Agentcollected the data. The valid format is a 12-character timestamp. For the STR andSCAN functions, the format is MM/DD/YY HH:MM:SS; the following table showsthe values contained in this character string:
Table 66. Format of the 12-character timestamp
Character String Meaning
MM Month
DD Day
YY Year
HH Hour
MM Minute
SS Second
Example: 09/13/06 18:32:03 indicates the data was collected on September 13 2006,at 18:32:03.
This attribute was designed for logging and reporting data-collection times ratherthan for creating situations. To specify a time and date for comparison and testing,use attributes from the Universal Time or Local Time groups.
274 ITCAM Agents for WebSphere Applications, J2EE, and HTTP Servers: User Guide

Server Name The name of the application server. The valid format is analphanumeric string, with a maximum of 256 characters.
Unprocessed The number of messages in the unprocessed state in the queueduring the sampling interval. The valid format is a positive integer.
For additional information, see:v Organization of the predefined workspacesv Attribute groups used by the predefined workspaces
Workplace Mail Service attributesThe Workplace Mail Service attributes display aggregated usage informationabout the incoming mail message traffic.
The attributes within this group are used to build the Workplace Mail workspace.
Important:
v The attributes within this attribute group contain zeros for performance data ifyour site has set configuration value Resource Data Collection Method to OnDemand (for on-demand sampling) and if you have not yet run applications thatgenerate performance data. To report performance data in these attributes afterinstalling and configuring the data collector, use the WebSphere administrativeconsole to set the appropriate PMI instrumentation level.
v The Tivoli Enterprise Monitoring Agent is set by default to provide on-demandsampling. Thus the attributes within this attribute group initially contain zerosuntil you select the workspace and select it again later. Each time you select theworkspace, these attributes are updated with the latest data.
Important: This workspace does not support linking to ITCAM for ApplicationDiagnostics Managing Server visualization engine.
Tip: For information about WebSphere PMI metrics, see “WebSphere PMI AttributeMapping” on page 373.
Active LDAP Connections The number of active LDAP connections during thesampling interval. The valid format is a positive integer.
Delivered Messages The total number of delivered messages during the samplinginterval. The valid format is a positive integer.
Deliverer Dropped Messages The total number of messages rejected by the SMTPoutbound server during the sampling interval. The valid format is a positiveinteger.
Deliverer Message (ms) The total time in milliseconds taken by SMTP outboundserver to process messages during the sampling interval. The valid format is adecimal (formatted to three decimal places).
Dropped SMTP Connections The total number of the dropped SMTP connectionsduring the sampling interval. The valid format is a positive integer.
DSN Failure Messages The total number of failure DSNs sent during the samplinginterval. The valid format is a positive integer.
Chapter 3. ITCAM Agent for WebSphere Applications 275

Handled Messages The total number of messages processed by the mail handlerserver during the sampling interval. The valid format is a positive integer.
Handler Dropped Messages The total number of messages rejected by the mailhandler server during the sampling interval. The valid format is a positive integer.
Instrumentation Level The instrumentation level for the service components. ForWebSphere 6 or higher, the valid values are None, Basic, Extended, All, Custom.Blank if no instrumentation level is set.
Interval (sec) The length (in seconds) of the sampling interval. The valid format isa positive integer.
Live SMTP Server Connections The number of live SMTP server connectionsduring the sampling interval. The valid format is a positive integer.
Live SMTP Client Connections The number of live SMTP client connectionsduring the sampling interval. The valid format is a positive integer.
Lost SMTP Client Connections The total number of lost SMTP client connectionsduring the sampling interval. The valid format is a positive integer.
Lost SMTP Connections The total number of the lost SMTP connections duringthe sampling interval. The valid format is a positive integer.
Message Delivery (ms) The total time in milliseconds taken to deliver messagesduring the sampling interval. The valid format is a decimal (formatted to threedecimal places).
Messages Handling (ms) The total time in milliseconds taken to handle messagesduring the sampling interval. The valid format is a decimal (formatted to threedecimal places).
Node Name The name of the system on which the server is running. The valueformat is an alphanumeric string, with a maximum of 256 characters.
Origin Node The name of the server subnode. The valid format is analphanumeric string, with a maximum of 128 characters.
Peak LDAP Connections The maximum number of concurrent LDAP connectionsduring the sampling interval. The valid format is a positive integer.
Sample Date and Time The date and time the Tivoli Enterprise Monitoring Agentcollected the data. The valid format is a 12-character timestamp. For the STR andSCAN functions, the format is MM/DD/YY HH:MM:SS; the following table showsthe values contained in this character string:
Table 67. Format of the 12-character timestamp
Character String Meaning
MM Month
DD Day
YY Year
HH Hour
MM Minute
276 ITCAM Agents for WebSphere Applications, J2EE, and HTTP Servers: User Guide

Table 67. Format of the 12-character timestamp (continued)
Character String Meaning
SS Second
Example: 09/13/06 18:32:03 indicates the data was collected on September 13 2006,at 18:32:03.
This attribute was designed for logging and reporting data-collection times ratherthan for creating situations. To specify a time and date for comparison and testing,use attributes from the Universal Time or Local Time groups.
Server Name The name of the application server. The valid format is analphanumeric string, with a maximum of 256 characters.
Smarthost Messages The total number of messages sent to the Smarthost duringthe sampling interval. The valid format is a positive integer.
SMTP Client Connections The total number of SMTP client connections duringthe sampling interval. The valid format is a positive integer.
SMTP Client (ms) The total time in milliseconds taken to deliver messages duringthe sampling interval. The valid format is a decimal (formatted to three decimalplaces).
SMTP Connections The total number of connections to the SMTP server duringthe sampling interval. The valid format is a positive integer.
SMTP (ms) The total time in milliseconds that SMTP has conversed during thesampling interval. The valid format is a decimal (formatted to three decimalplaces).
SMTP Server Threads The number of active SMTP outbound server threadsduring the sampling interval. The valid format is a positive integer.
For more information, see:v Organization of the predefined workspacesv Attribute groups used by the predefined workspaces
Agent Configuration attributesThe attributes in the Agent Configuration table are for internal use only.
Origin Node The server name subnode. The valid format is an alphanumericstring, with a maximum of 128 characters.
Row Id The row identifier. The valid format is a 2-byte integer.
View Id The view identifier. The valid format is a 2-byte integer.
Act Id The act identifier. The valid format is a 2-byte integer.
Data The data string. The valid format is an alphanumeric string, with a maximumof 4096 characters.
Chapter 3. ITCAM Agent for WebSphere Applications 277

KYN Command attributesThe attributes in the KYN command table are for internal use only.
Origin Node The origin node. The valid format is an alphanumeric string, with amaximum of 128 characters.
Command The command string. The valid format is an alphanumeric string, witha maximum of 256 characters.
User ID The user ID. The valid format is an alphanumeric string, with a maximumof 16 characters.
Result Status The result status code. The valid format is a 4-byte integer.
Server Configuration attributesThe attributes in the Server Configuration table are for internal use only.
Origin Node The server name subnode. The valid format is an alphanumericstring, with a maximum of 128 characters.
Row Id The row identifier. The valid format is a 2-byte integer.
View Id The view identifier. The valid format is a 2-byte integer.
Act Id The act identifier. The valid format is a 2-byte integer.
Data The data string. The valid format is an alphanumeric string, with a maximumof 4096 characters.
Situations for ITCAM Agent for WebSphere ApplicationsIBM Tivoli Composite Application Manager Agent for WebSphere Applications hasa number of predefined situations that you can use to complete the followingtasks:v Monitor your WebSphere application serversv Monitor and manage widely dispersed WebSphere application server resources
through localized automationv Create your own situations using the predefined situations as examples
These predefined situations display an alert status. When these situations triggeran alert, you can investigate the event by opening its workspace. For example, youcan use these situations to monitor a WebSphere application server for errorsoccurring within it or web applications based at your site.
How the situations work
Situations are tests expressed in IF-TRUE format of system conditions that youwant to monitor; the tested value is an ITCAM Agent for WebSphere Applicationsattribute expressed in the form attribute-group.attribute-name. If the specifiedcondition occurs or exists, the situation is true, and an alert is issued.
278 ITCAM Agents for WebSphere Applications, J2EE, and HTTP Servers: User Guide

Avoid using negative values
If you define situations that use a counter or a range of numbers, always provide athreshold or use values in a positive range of numbers. For example, use agreater-than-or-equal-to-zero expression as shown in some of the followingpredefined situations. This practice prevents a situation from falsely tripping. If theITCAM Agent for WebSphere Applications Tivoli Enterprise Monitoring Agentencounters an undefined attribute value, it interprets this value as a negativenumber and erroneously fires a situation that specifies a negative number.
Important: For the following situations:WASDBConPAvgWaitTimeHighDB_Connection_Pools,J2C_Connection_Pools and Thread_PoolsApplication theApplication ID column is not supported and always displays -1 by default.
Accessing the situations
Some of the predefined situations run by default from the WebSphere Agent. Forthe situations that do not run automatically, you must start these situationsmanually. To start these situations, access the situations in the Tivoli EnterprisePortal using one of the following methods:v In the WebSphere agent, right-click the specific server. Right-click Enterprise
then, click Manage Situations to display all the managed situations available onthe server. If you want to start, stop, edit, or model a situation, right-click thesituation and select the option you want.
v From the toolbar on the main menu, click the Situation Editor icon andscroll to the situation that you want to view.
For information about predefined situations and formulas see “Predefinedsituations-descriptions and formulas (that run automatically)” and “Predefinedsituations descriptions and formulas (that run manually)” on page 283. See also“Attributes for ITCAM Agent for WebSphere Applications” on page 139.
Predefined situations-descriptions and formulas (that runautomatically)
The following predefined situations run automatically from the WebSphere Agentand support the following applications servers unless stated otherwise.v WebSphere application serverv WebSphere application server portalv WebSphere application server Processv WebSphere application server ESBv Lotus Workplace server
Tip:
v To start, stop, or edit any of these situations, see “Accessing the situations.”v For information about situations that run manually, see “Predefined situations
descriptions and formulas (that run manually)” on page 283.
WASAppDiscovered monitors WebSphere applications deployed in the applicationserver and issues an Informational alert when a new application is discovered. Themonitoring agent checks for new applications each time it connects to the datacollector or when an application is deployed when the data collector is alreadyactive. The formula is:
Chapter 3. ITCAM Agent for WebSphere Applications 279

If
Application_Monitoring_Configuration.Monitoring_Status equals Discovered
then
the situation WASAppDiscovered is true.
Important: This situation does not support Lotus Workplace server.
The predefined Take Action command Start_Baselining associated with theWASAppDiscovered situation enables you to automate the baselining of newlydiscovered applications.
WASAppHealthBad monitors the overall application health and issues a Criticalalert when the application health is bad. The formula is:
If
Application_Health_Status.Web_Tier_Health equals Bad
then
the situation WASAppHealthBad is true.
The predefined Take Action command Set_Appliction_Monitoring associatedwith WASAppHealthBad situation increases the request monitoring rate forapplications generated alert. This command enables you to collect more detailedperformance data and helps to collect the most precise data about each applicationtier health level.
WASAppHealthFair monitors the overall application health and issues a warningalert when application health is fair. The formula is:
If
Application_Health_Status.Application_Health equals Fair
then
the situation WASAppHealthFair is true.
The predefined Take Action command Set_Appliction_Monitoring associated withWASAppHealthFair situation raises the request monitoring level for applicationsgenerated alert. This command enables you to collect detailed performance datathat helps to pinpoint a bottleneck down to particular application tiers.
WASAppHealthGood monitors the overall application health and issues anInformational alert when application health is good. The formula is:
If
Application_Health_Status.Application_Health equals Good
then
280 ITCAM Agents for WebSphere Applications, J2EE, and HTTP Servers: User Guide

the situation WASAppHealthGood is true.
The predefined Take Action command Set_Appliction_Monitoring associated withthe WASAppHealthGood situation lowers the request monitoring level forapplications generated alert, and reduces the monitoring workload.
WASError monitors the error severity for a single WebSphere application serverand issues a Critical condition whenever that severity is greater than 21. Itsformula is:
If
Log_Analysis.Severity is greater than Warning
then
the situation WASError is true.
WASHighCPUPercentUsed monitors the percentage of the CPU being consumedand issues a Critical condition whenever that time exceeds 80%. The formula is:
If
Application_Server.CPU_Used_Percent is greater than 80
then
the situation WASHighCPUPercentUsed is true.
WASHighGCTimePercent monitors the percentage of time being spent by thegarage collector and issues a Critical condition whenever that time exceeds 80%.The formula is:
If
Garbage_Collection_Analysis.Real_Time_Percent is greater than 80
then
the situation WASHighGCTimePercent is true.
WASHighResponseTime monitors the average request response time and issues aCritical condition whenever that time exceeds 2 seconds. The formula is:
If
Request_Times_and_Rates.Average_Request_Response_Time is greater than 2000
then
the situation WASHighResponseTime is true.
WASNotConnected monitors the connection between the ITCAM for DataCollector WebSphere running in an application server and the ITCAM Agent forWebSphere Applications monitoring agent to ensure that the monitoring agent isconnected and issues a Critical condition whenever it is not. Its formula is:
Chapter 3. ITCAM Agent for WebSphere Applications 281

If
Application_Server_Status.Status equals Disconnected
then
the situation WASNotConnected is true.
WASOutofHeapSpace monitors the heap allocation status and issues a Criticalcondition whenever heap space is exhausted. The formula is:
If
Allocation_Failure.Heap_Status equals Out of heap space or Insufficient space
then
the situation WASOutofHeapSpace is true.
Important: This situation is not available when monitoring non-IBM Java VirtualMachines, including machines commonly used on HP-UX and Solaris platforms.
WASAvgHeapSizeAfterGCHigh monitors the average heap size free percentageafter garbage collection. This situation issues a Critical alert if the average heapsize free percentage after garbage collection is greater than 80%. Its formula is:
If
Garbage_Collection_Cycle.Heap_Free_Percent_after_GC is greater than 80
then
the situation WASAvgHeapSizeAfterGCHigh is true.
Important: This situation does not support Lotus Workplace server.
WASJ2CConnectionPoolUsageMaxed monitors the J2C pool percentage usage andissues a Warning alert if the pool usage is greater than or equal to 100%. Itsformula is:
If
J2C_Connection_Pools.Pool_Used_Percent is greater than or equal to 100%
then
the situation WASJ2CConnectionPoolUsageMaxed is true.
Important: This situation does not support Lotus Workplace server.
WASDBConnectionPoolUsageMaxed monitors the JDBC pool usage and issues aCritical alert if the pool usage is greater than or equal to 100%. Its formula is:
If
DB_Connection_Pools.Percent_Used is greater than or equal to 100%
282 ITCAM Agents for WebSphere Applications, J2EE, and HTTP Servers: User Guide

then
the situation WASDBConnectionPoolUsageMaxed is true.
Important: This situation does not support Lotus Workplace server.
WASHungThreadsDetected monitors hung threads and issues a Critical alert ifany thread is hung. Its formula is:
If
Application_Server.Hung_Threads_Total is greater than 0
then
the situation WASHungThreadsDetected is true.
WASListenerPortStarted monitors starting of the WAS listener port. Its formula is:
If
Listener_Port.Status equals Started
then
the situation WASListenerPortStarted is true.
WASListenerPortStopped monitors stopping of the WAS listener port and issues aCritical alert if the port is stopped. Its formula is:
If
Listener_Port.Status equals Stopped
then
the situation WASListenerPortStopped is true.
See also “Attributes for ITCAM Agent for WebSphere Applications” on page 139.
Predefined situations descriptions and formulas (that runmanually)
Situations that are run manually
The following situations do not run automatically. To run them you must accessthem from the Manage Situations view. These situations support the followingapplication servers unless stated otherwise:v WebSphere application serverv WebSphere application server portalv WebSphere application server Processv WebSphere application server ESBv Lotus Workplace server
Tip:
Chapter 3. ITCAM Agent for WebSphere Applications 283

v To start, stop, or edit any of these situations, see “Accessing the situations” onpage 279.
v For information about situations that run automatically, see “Predefinedsituations-descriptions and formulas (that run automatically)” on page 279.
WASDBConnectionPoolThrdTimeout monitors the thread timeout count. Thissituation issues a Critical condition whenever the timeout count is greater thanzero. Its formula is:
If
DB_Connection_Pools.Threads_Timed_Out is greater than 0
then
the situation WASDBConnectionPoolThreadTimeout is true.
WASContainerTransactionRollback monitors the rollback count of the WebSphereapplication server. This situation issues a Critical alert whenever the countbecomes nonzero. Its formula is:
If
Container_Transactions.Global_Transactions_Rolled_Back is greater than 0
or
Container_Transactions.Local_Transactions_Rolled_Back is greater than 0
then
the situation WASContainerTransactionRollBack is true.
WASEJBCreateTimeHigh monitors the average time of a bean create call andissues a Critical alert when the time is longer than 2 seconds. Its formula is:
If
Enterprise_Java_Beans.Create_Average_Time is greater than 2000
then
the situation WASEJBCreateTimeHigh is true.
Important: This situation does not support Lotus Workplace server.
WASEJBRemoveTimeHigh monitors the average time of a bean remove call andissues a Critical alert when the time is longer than 2 seconds. Its formula is:
If
Enterprise_Java_Beans.Remove_Average_Time is greater than 2000
then
the situation WASEJBRemoveTimeHigh is true.
284 ITCAM Agents for WebSphere Applications, J2EE, and HTTP Servers: User Guide

Important: This situation does not support Lotus Workplace server.
WASEJBMethodResponseTimeHigh monitors the average response time onremote interface methods for all beans. This situation issues a Critical alert if theresponse time is longer than 2 seconds. Its formula is:
If
Enterprise_Java_Beans.Method_Average_Response_Time is greater than 2000
then
the situation WASEJBMethodResponseTimeHigh is true.
Important: This situation does not support Lotus Workplace server.
WASThreadFreeLow monitors the average free threads in the pool and issues aCritical alert if the number of threads is less than 200. Its formula is:
If
Thread_Pools.Average_Free_Threads is greater than or equal to 0
and
Thread_Pools.Average_Free_Threads is less than 200
and
Thread_Pools.Average_Active_Threads is greater than or equal to 0
then
the situation WASThreadFreeLow is true.
Important: This situation does not support Lotus Workplace server.
WASDataSrcConWaitTimeHigh monitors the average time an application has towait for a connection. This situation issues a Critical alert if the wait time is longerthan 2 seconds. Its formula is:
If
Datasources_Connection_Average_Wait_Time is greater than 2000
then
the situation WASDataSrcConWaitTimeHigh is true.
Important: This situation does not support Lotus Workplace server.
WASReqSQLExecuteTimePercentHigh monitors the percentage of time the requestspends executing a JDBC database. This situation issues a Critical alert if thepercentage of time is higher than 80%. Its formula is:
If
Chapter 3. ITCAM Agent for WebSphere Applications 285

Request_Analysis.SQL_Execute_Time_Percent is greater than 80
then
the situation WASReqSQLExecuteTimePercentHigh is true.
Important: This situation does not support Lotus Workplace server.
WASReqSQLQueryTimePercentHigh monitors the percentage of time the requestspends querying a JDBC database. This situation issues a Critical Alert if thepercentage of time is higher than 80%. Its formula is:
If
Request_Analysis.SQL_Query_Time_Percent is greater than 80
then
the situation WASReqSQLQueryTimePercentHigh is true.
Important: This situation does not support Lotus Workplace server.
WASReqSQLUpdateTimePercentHigh monitors the percentage of time the requestspends updating a JDBC database. This situation issues a Critical Alert if thepercentage of time is higher than 80%. Its formula is:
If
Request_Analysis.SQL_Update_Time_Percent is greater than 80
then
the situation WASReqSQLUpdateTimePercentHigh is true.
Important: This situation does not support Lotus Workplace server.
WASDBConPAverageUsageTimeHigh monitors the average time that a connectionin use is high. This situation issues a Critical alert if the average time theconnection in use is longer than 2 seconds. Its formula is:
If
DB_Connection_Pools.Average_Usage_Time is greater than 2000
then
the situation WASDBConPAverageTimeHigh is true.
Important: This situation does not support Lotus Workplace server.
If
DB_Connection_Pools.Percent_Used is greater than 80
then
286 ITCAM Agents for WebSphere Applications, J2EE, and HTTP Servers: User Guide

the situation WASDBConPPercentUsedTimeHigh is true.
Important: This situation does not support Lotus Workplace server.
WASDBConPAvgWaitTimeHigh monitors the average time that a client has towait for a connection. This situation issues a Critical alert when the time period islonger than 2 seconds. Its formula is:
If
DB_Connection_Pools.Average_Wait_Time is greater than 2000
then
the situation WASDBConPAvgWaitTimeHigh is true.
Important: This situation does not support Lotus Workplace server.
WASJ2CCPAverageUsageTimeHigh monitors the average time that connectionsare in use (it measures from when the connection is allocated to when it isreturned). This situation issues a Critical alert when the combined connectionallocation and return time are longer than 2 seconds. Its formula is:
If
J2C_Connection_Pools.Average_Usage_Time is greater than 2000
then
the situation WASJ2CCPAverageUsageTimeHigh is true.
Important: This situation does not support Lotus Workplace server.
WASJ2CCPAvgWaitTimeHigh monitors the average wait time until a connection isgranted. This situation issues a Critical alert if the time period is longer than 2seconds. Its formula is:
If
J2C_Connection_Pools.Average_Wait_Time is greater than 2000
then
the situation WASJ2CCPAvgWaitTimeHigh is true.
Important: This situation does not support Lotus Workplace server.
WASCTGlbTransDurationHigh monitors the average duration of globaltransactions. This situation issues a Critical alert if the time period is longer than 2seconds. Its formula is:
If
Container_Transactions.Global_Transaction_Duration is greater than 2000
then
Chapter 3. ITCAM Agent for WebSphere Applications 287

the situation WASCTGlbTransDurationHigh is true.
Important: This situation does not support Lotus Workplace server.
WASCTLclTransDurationHigh monitors the average duration of local transactions.This situation issues a Critical alert if the time period is longer than 2 seconds. Itsformula is:
If
Container_Transactions.Local_Transaction_Duration is greater than 2000
then
the situation WASCTLclTransDurationHigh is true.
Important: This situation does not support Lotus Workplace server.
WASPortalPageResponseTime monitors the portal page response time and issuesa Critical alert when the average request response time is higher than 2 seconds.The formula is:
If
Portal_Page_Summary.Average_Response_Time is greater than 2000
then
the situation WASPortalPageResponseTime is true.
WASPortletResponseTime monitors the portlet response time and issues a Criticalalert when the average request response time is higher than 2 seconds. Theformula is:
If
Portlet_Summary.Average_Response_Time is greater than 2000
then
the situation WASPortletResponseTime is true.
WASServletsJSPsError monitors the error count for servlets and JSPs invoked by aWebSphere application server application. This situation issues a Critical conditionwhenever the count becomes nonzero. Its formula is:
If
Servlets_JSPs.Error_Count is greater than 0
then
the situation WASServletsJSPsError is true.
Important: This situation does not support Lotus Workplace Server.
288 ITCAM Agents for WebSphere Applications, J2EE, and HTTP Servers: User Guide

WASSrvlSessAvgActiveSessionHigh monitors the average number of concurrentlyactive sessions. This situation issues a Critical alert if the average number ofconcurrently active sessions is greater than 100. Its formula is:
If
Servlet_Sessions.Average_Concurrently_Active_Sessions is greater than 100
then
the situation WASSrvlSessAvgActiveSessionHigh is true.
The following situations are configured to run automatically.
Important: This situation does not support Lotus Workplace server.
WASSrvlSessExtReadTimeHigh monitors the time it takes to read the session datafrom the persistent store. This situation issues a Critical alert if the time period islonger than 2 seconds. Its formula is:
If
Servlet_Sessions.External_Read_Time is greater than 2000
then
the situation WASSrvlSessExtReadTimeHigh is true.
Important: This situation does not support Lotus Workplace server.
WASSrvlSessExtWriteTimeHigh monitors the time it takes to write session data topersistent store. This situation issues a Critical alert if the time period is longerthan 2 seconds. Its formula is:
If
Servlet_Sessions.External_Write_Time is greater than 2000
then
the situation WASSrvlSessExtReadTimeHigh is true.
Important: This situation does not support Lotus Workplace server.
WASThreadPoolPercentMaxed monitors the average usage time of all threads, andissues a Critical condition whenever that time exceeds 100%. The formula is:
If
Thread_Pools.Percent_of_Time_Pool_at_Max is greater than 100
then
the situation WASThreadPoolPercentMaxed is true.
Chapter 3. ITCAM Agent for WebSphere Applications 289

WASWebApplicationError monitors the error log status of the WebSphere serverand issues a Critical condition when an error occurs. Its formula is:
If
Web_Applications.Error_Count is greater than 0
then
the situation WASWebApplicationError is true.
Important: This situation does not support Lotus Workplace Server.
See also “Attributes for ITCAM Agent for WebSphere Applications” on page 139.
Take Action commands for ITCAM Agent for WebSphere ApplicationsThe Take Action feature lets your interactive Tivoli Enterprise Portal users enter acommand or stop or start a process at any system in your network where one ormore Tivoli Enterprise Monitoring Agents are installed. The ITCAM Agent forWebSphere Applications Take Action commands enable you use the TivoliEnterprise Portal interface to start, stop, or recycle a WebSphere application serveror to control the level of monitoring for the current server.
Users can start a Take Action command from a workspace, from the Navigator,from a situation that you create, on demand, or by recalling a saved Take Actioncommand.
Note:
The following take action commands are for internal use only and are not for usein the Tivoli Enterprise Portal. The configuration workspaces use these take actioncommands to communicate internally with the monitoring agent.v Configure
v ConfigureCancel
v ConfigurePing
Add_XD_Cell: Add an XD Cell to a WebSphere agentUse the Add_XD_Cell command to add an XD cell to the WebSphere Agent. Thistake action task is used to configure XD Cell monitoring.
Command syntax
YN:AddXDCell cellName
where cellName is the name of the XD cell.
Enable_Auto_Threshold: set threshold parametersUse the Enable_Auto_Threshold Take Action to set automatic threshold parametersand remove any overrides of the thresholds.
The baselining process supplies statistical information about request responsetimes. ITCAM interprets this information to set automatic thresholds. Severalparameters control this interpretation.
290 ITCAM Agents for WebSphere Applications, J2EE, and HTTP Servers: User Guide

The default values for these parameters are sufficient for most cases. However, ifthe thresholds are not adequate and the baselining process was run recently, youmight have to change these parameters. If there are many false alarms or warnings,you must raise the bad or fair threshold; if alarms or warnings are not triggeredwhen needed, you must lower the bad or fair threshold.
Although you can change the parameters for the entire application or for allrequests of a given type, most likely you do this only for an individual request.v To set threshold parameters for all requests in the application, select this
application in the “Application Health workspace” on page 73 or “ApplicationRegistry workspace” on page 75, and select the Enable_Auto_Threshold takeaction command.
v To set threshold parameters for all requests of a given type in the application,select this request type in the Application Request Configuration table of the“Application Configuration workspace” on page 111, and select theEnable_Auto_Threshold take action command.
v To set threshold parameters for an individual request, select this request in the“Request Baseline workspace” on page 109, and select theEnable_Auto_Threshold take action command.
In the “Request Baseline workspace” on page 109, when you select a linerepresenting a request, you can see the bar charts representing statistical data forthis request. This data was gathered during the baselining process. Colors on thebar charts show the way in which the parameters are applied. You can change theparameters using the Enable_Auto_Threshold take action command, andimmediately see the effects on the bar charts.
The Response Times Distribution chart shows the statistical distribution ofresponse times for this request. The height of every bar shows the percentage ofrequests that had the indicated response time during the baselining period.
Some bars represent bigger time intervals than others; more bars are devoted tomost common response times. For example, if the maximum encountered time is1000 ms but most response times are 300 - 500 ms, then the first bar can be 0 - 50ms, but there can also be bars of 305 - 310 ms and 400 - 402 ms.
The bars colored blue show the zone into which the "typical" response times forthis application fall. The green bars show response times that are not "typical", but
Chapter 3. ITCAM Agent for WebSphere Applications 291

are below the fair threshold. Response times above the fair threshold but below thebad threshold are shown as yellow bars; for those above the bad threshold, thebars are red.
Use the Enable_Auto_Threshold take action command to set the parameters thataffect both the position of the "typical" zone and the way the thresholds arederived from this zone.
For more information about how the bar chart and parameters work, see“Threshold calculation detail” on page 300.
The Level2 Delays Distribution chart shows the distribution of time spent in"nested requests" within the requests that had this response time range. Each barrepresents a response time of the top-level request . Within this bar, coloredsections show how much time is spent within nested requests of different types;the color legend is shown on the bar. ITCAM uses this distribution within theselection zone (that is for typical overall request types) to work out the averageshare of time that each nested request type takes. When an error or warning arises,ITCAM checks which of the request types takes more than its usual share of time;based on this, it displays whether the likely cause is the application, backend, orserver.
Command syntax
YN:Enable_Auto_Threshold App_Id Request_Id Auto_Threshold_PercentAuto_Threshold_Deviation Auto_Threshold_Fair_ProjectionAuto_Threshold_Bad_Projection Use_Default
Parameters:
App_IdThe application ID, automatically assigned in the portal from the selectioncontext when Take Action was invoked.
Request_IdThe request ID, automatically assigned in the portal from the selection contextwhen Take Action was invoked.
Auto_Threshold_PercentAuto_Threshold_Deviation
ITCAM uses these two parameters to calculate the borders of the "typicalzone". See “Threshold calculation detail” on page 300.
Auto_Threshold_Fair_ProjectionThis determines the position of the fair threshold. Increase this parameter toincrease the fair threshold; decrease the parameter to decrease the fairthreshold. For details, see “Threshold calculation detail” on page 300. The badthreshold is not affected.
Auto_Threshold_Bad_ProjectionThis determines the position of the bad threshold. Increase this parameter toincrease the bad threshold; decrease the parameter to decrease the badthreshold.For details, see “Threshold calculation detail” on page 300. The fairthreshold is not affected.
Use_DefaultIf set to 0, the auto threshold settings are modified according to the otherparameters in this Take Action. If set to 1, the value of the auto threshold
292 ITCAM Agents for WebSphere Applications, J2EE, and HTTP Servers: User Guide
settings for this request are taken from the "parent": the values that have beenset for the request type, for the entire application, or the ITCAM defaultvalues.
Example: YN:Enable_Auto_Threshold 1 12 50 200 150 300 0
Override_Auto_Threshold: override threshold valuesUse the Override_Auto_Threshold Take Action to override fair and bad responsetime threshold values for any request in the application. In this case, while thebaselining statistical data is still preserved, ITCAM does not use automaticallycalculated thresholds.
Do not override threshold values unless you have analyzed the applicationperformance in detail (or were instructed to override threshold values by IBMLevel 3 Support). To adjust threshold values without manually overriding them,see “Enable_Auto_Threshold: set threshold parameters” on page 290.
To remove an override, select a request in the “Request Baseline workspace” onpage 109, and select the Enable_Auto_Threshold take action command. Leave allparameters as they are, in order to use the same auto threshold parameters as wereused before the override. If you need to change these parameters, see“Enable_Auto_Threshold: set threshold parameters” on page 290.
Command syntax
YN:Override_Auto_Threshold App_Id Request_Id Fair_Response_ThresholdBad_Response_Threshold
Parameters:
App_IdThe application ID, automatically assigned in the portal from the selectioncontext when Take Action was invoked.
Request_IdThe request ID, automatically assigned in the portal from the selection contextwhen Take Action was invoked.
Fair_Response_ThresholdThe fair response time threshold, in milliseconds.
Bad_Response_ThresholdThe bad response time threshold, in milliseconds.
Remove_WebSphere_SubNode: Remove an inactiveWebSphere application server
Use the Remove_WebSphere_SubNode command to remove a no-longer-activeWebSphere application server from the Navigator tree.
Command syntax
If invoked from the Navigator WebSphere Agent entry, the syntax is:
YN:RemSubNode server_name
where server_name is the WebSphere server-that is, subnode-name.
Chapter 3. ITCAM Agent for WebSphere Applications 293

If, however, this command is invoked from a subnode of the Navigator WebSphereAgent entry, the syntax is:
YN:RemSubNode
In this case, server_name is not required because the subnode name-that is, theserver name-is already known.
Set_Application_Monitoring: Set monitoringUse the Set_Application_Monitoring command to set monitoring of the WebSphereapplication.
Command syntax
YN:Set_Application_Monitoring App_Id Monitoring_EnabledRequest_Data_Monitoring_Level Request_Data_Sampling_Rate
where App_Id is the application ID which is automatically assigned in the portalfrom the selection context when Take Action was invoked.
Monitoring_Enabled is a boolean value and the valid values are 0 and 1. It defineswhether the monitoring agent application dashboard monitoring feature is enabledfor the given application.
Request_Data_Monitoring_Level is an integer value that defines custom requestmonitoring level for the given application. Valid values are 0 (DISABLE), 1(LEVEL1), and 2 (LEVEL2). If the Request Monitoring Control Level (see“Application Dashboard (Basic) tab” on page 59) is set to Application, this leveloverrides any level that the user might set for the entire monitoring agent.
Important: If the Request Monitoring Control Level is set to Server, this TakeAction command has no effect on the actual monitoring level. The new level isrecorded, but the server-wide setting is applied. If you change the RequestMonitoring Control Level to Application, the recorded application monitoring leveltakes effect.
Request_Data_Sampling_Rate is an integer value that defines custom requestmonitoring rate (in percentage) for the given application. Valid values range from 0to 100.
Important: When this Take Action is selected for a node representing a z/OSservant region, it applies to all servant regions in the same managed system (IBMWebSphere application server instance).
Reflex _Automation_Mode is a boolean value and the valid values are 0 and 1. Whenyou select 1, WR application health monitoring accepts reflex automationcommands from WASAppHealthGood/Fair/Bad situations and adjusts themonitoring level automatically based on the current application health status. Formore information about Tivoli Monitoring (ITM) reflex automation, search for’reflex automation’ in the IBM Tivoli Monitoring Version 6.2.3 info center
Set_Completion_Thresholds: Set completion thresholdsUse the Set_Completion_Thresholds command to define the thresholds of the errorrate for the WebSphere application.
294 ITCAM Agents for WebSphere Applications, J2EE, and HTTP Servers: User Guide

Command syntax
YN:Set_Completion_Thresholds App_Id Fair_Completion_Rate Bad_Completion_Rate
where App_Id is the application ID which is automatically assigned in the portalfrom the selection context when Take Action was invoked.
Fair_Completion_Rate and Bad_Completion_Rate are the values in percentage thatdefine thresholds for fair and bad requests completion rates.
Set_Request_Sampling_Rate: Set the sampling rate forrequest data
Use the Set_Request_Sampling_Rate command to define the percentage of requeststo monitor.
Command syntax
YN:SetRequestSamplingRate percent
where percent is the percentage of requests you want sampled, an integer from 1 to100.
Important: This command sets the default sampling rate for a server. This rate isapplied to new applications that are detected on this server after you run thecommand. To change the sampling rate for an existing application, use thecommand “Set_Application_Monitoring: Set monitoring” on page 294.
Start_Baselining: Start the baselining processITCAM can run a baselining process for every application. During this process,which runs for a preset period, the data collector collects statistical data on metricvalues for a given period. Based on this statistical data, the monitoring agent canautomatically set the fair and bad thresholds, as well as the typical breakdown ofresponse times for nested requests. Use the Start_Baselining Take Action to startthe baselining process.
When ITCAM begins monitoring an application for the first time, it automaticallystarts this process for the application. However, with time, average response timescan change because of configuration, load pattern, database size, and other issues.You can manually start the baselining process again to take these changes intoaccount. You can also use IBM Tivoli Monitoring (ITM) policies and workflowmanagement to run the baselining process every few months.
As soon as you take the Start Baselining action, the baselining process begins. Thethresholds are updated when either the Period or the Update Interval passes.
While the baselining process is running, you can trigger a baseline update toimmediately set the thresholds based on the information collected so far.
Command syntax
YN:Start_Baselining App_Id Period Update_Interval Run_Clean
Parameters:
Chapter 3. ITCAM Agent for WebSphere Applications 295

App_IdThe application ID, automatically assigned in the portal from the selectioncontext when Take Action was invoked.
PeriodThe time for which the baselining process runs. The data collector collects thenecessary statistical information for this entire period. When ITCAM starts thebaselining process automatically, it sets the period to seven days. The format isddd/hh:mm:ss.
Update_IntervalIf you set this parameter to a time interval, ITCAM updates the thresholdsaccording to the information already collected every time this interval passes.For example, when ITCAM starts the baselining process automatically, it setsthe update interval to 1 hour. During the seven days that the initial baseliningruns, every hour the thresholds are updated according to the statistical datacollected so far (for all request types where at least one request was receivedduring the baselining process). The format is ddd/hh:mm:ss.
Run_CleanSet to either 0 or 1. If set to 0, statistical data collected in any previousbaselining for the same requests are kept and "amalgamated" with the newdata. If set to 1, only the new data are used for setting the thresholds.Normally, you set this to 1.
Note: When this Take Action command is selected for a node representing a z/OSservant region, it applies to all servant regions in the same managed system (IBMWebSphere application server instance).
Start_GC_Monitoring: Begin reporting garbage-collection dataUse the Start_GC_Monitoring command to activate the display ofgarbage-collection statistics. This setting is in addition to the WebSphereapplication server Verbose Garbage Collection value, which must also be active forgarbage-collection data to be reported.
Command syntax
YN:StartGCMonitor
Important: When this Take Action command is selected for a node representing az/OS servant region, it applies to all servant regions in the same managed system(IBM WebSphere application server instance).
Start_Request_Monitoring : Begin reporting request dataUse the Start_Request_Monitoring command to activate the display of request data.
Command syntax
YN:StartRequestMonitor level
where level is the resource-data collection level, either Level1 or Level2. When thecollection level is set to Level1, only edge request data-such as servlets andJSPs-are collected. When set to Level2, nested request data, such as JDBC and JMSrequests, are also collected.
296 ITCAM Agents for WebSphere Applications, J2EE, and HTTP Servers: User Guide

If the Request Monitoring Control Level (see “Application Dashboard (Basic) tab”on page 59) is set to Server, this level applies to all applications monitored on theserver.
Important: If the Request Monitoring Control Level is set to Application, you canset the monitoring level for any operation separately, using the“Set_Application_Monitoring: Set monitoring” on page 294 Take Action command.The monitoring level from the Start_Request_Monitoring Take Action command isapplied by default to newly discovered applications.
Important: When this Take Action command is selected for a node representing az/OS servant region, it applies to all servant regions in the same managed system(IBM WebSphere application server instance).
Start_Resource_Monitoring: Begin reporting PMI dataUse the Start_Resource_Monitoring command to activate the display of resource(that is, PMI) data. This setting is in addition to the WebSphere application serverPMI instrumentation levels, which must also be set for resource data to bereported.
Command syntax
YN:StartResourceMonitor
Important: When this Take Action command is selected for a node representing az/OS servant region, it applies to all servant regions in the same managed system(IBM WebSphere application server instance).
Start_WebSphere_Server: Start a WebSphere applicationserver
Use the Start_WebSphere_Server command to start a WebSphere application server.
Command syntax
If invoked from the Navigator WebSphere Agent entry, the syntax is:
YN:StartAppSvr server_name user password
where server_name is the WebSphere server name, and user and password are yourown WebSphere application server identifiers set via the WebSphere administrativeconsole (required only if WebSphere global security is enabled).
If, however, this command is invoked from a subnode of the Navigator WebSphereAgent entry, the syntax is:
YN:StartAppSvr user password
where user and password are your own WebSphere application server identifiers setvia the WebSphere administrative console; these are required only if WebSphereglobal security is enabled. (In this case, server_name is not required because thesubnode name-that is, the server name-is already known.)
Chapter 3. ITCAM Agent for WebSphere Applications 297

Stop_Baselining: stop the baselining processUse the Stop_Baselining Take Action command to immediately stop the baseliningprocess for an application, and recalculate the thresholds based on the request dataavailable up to this point.
Normally you do not have to complete this action. To recalculate the thresholdsbased on the request data available up to this point, without stopping thebaselining process, see “Update_Baseline: trigger a baseline update” on page 299.
Command syntax
YN:Stop_Baselining App_Id
Parameters:
App_IdThe application ID, automatically assigned in the portal from the selectioncontext when Take Action was invoked.
Important: When this Take Action command is selected for a node representing az/OS servant region, it applies to all servant regions in the same managed system(IBM WebSphere application server instance).
Stop_GC_Monitoring: Stop reporting garbage-collection dataUse the Stop_GC_Monitoring command to end the display of garbage-collectionstatistics.
Command syntax
YN:StopGCMonitor
Important: When this Take Action command is selected for a node representing az/OS servant region, it applies to all servant regions in the same managed system(IBM WebSphere application server instance).
Stop_Request_Monitoring: Stop reporting request dataUse the Stop_Request_Monitoring command to end the display of request data.
Command syntax
YN:StopRequestMonitor
Important: When this Take Action command is selected for a node representing az/OS servant region, it applies to all servant regions in the same managed system(IBM WebSphere application server instance).
Stop_Resource_Monitoring: Stop reporting PMI dataUse the Stop_Resource_Monitoring command to end the display of resource (thatis, PMI) data.
Command syntax
YN:StopResourceMonitor
298 ITCAM Agents for WebSphere Applications, J2EE, and HTTP Servers: User Guide

Important: When this Take Action command is selected for a node representing az/OS servant region, it applies to all servant regions in the same managed system(IBM WebSphere application server instance).
Stop_WebSphere_Server: Stop a WebSphere applicationserver
Use the Stop_WebSphere_Server command to stop an application server.
Command syntax
If invoked from the Navigator WebSphere Agent entry, the syntax is:
YN:StopAppSvr server_name user password
where server_name is the WebSphere server name, and user and password are yourown WebSphere application server identifiers set through the WebSphereadministrative console (required only if WebSphere global security is enabled).
If, however, this command is invoked from a subnode of the Navigator WebSphereAgent entry, the syntax is:
YN:StopAppSvr user password
where user and password are your own WebSphere application server identifiers setthrough the WebSphere administrative console; these are required only ifWebSphere global security is enabled. (In this case, server_name is not requiredbecause the subnode name-that is, the server name-is already known.)
Update_Baseline: trigger a baseline updateIf the baselining process is running, the thresholds are set automatically wheneither the Period or the Update Interval passes. For the initial baselining process,the first automatic update happens after one hour. With the Update_Baseline TakeAction, you can force ITCAM to update the thresholds immediately, based on theinformation collected so far. This can be useful if you do not want to wait for theperiodic automatic update. When the automatic update time comes, the thresholdis updated again.
If a baselining process is not running for the application, an error is raised. If norequests of a given request type have been received since the baselining processhas started, the update has no effect for this request type.
Command syntax
YN:Update_Baseline App_Id
Parameters:
App_IdThe application ID, automatically assigned in the portal from the selectioncontext when Take Action was invoked.
Important: When this Take Action command is selected for a node representing az/OS servant region, it applies to all servant regions in the same managed system(IBM WebSphere application server instance).
Chapter 3. ITCAM Agent for WebSphere Applications 299

Threshold calculation detailIf you want to set parameters that affect the calculation of the automatic responsetime thresholds, you might need to know the details of this calculation.
ITCAM processes the baselining statistical data and applies the auto thresholdparameters in the following way. The parameters are set in theEnable_Auto_Threshold take action command, see “Enable_Auto_Threshold: setthreshold parameters” on page 290.1. The response time results are sorted into up to 64 "buckets", from zero to the
maximum response time encountered for this request. The buckets do notrepresent equal time intervals; for response time regions where most of the"hits" fall, the buckets represent smaller intervals. For example, if the maximumencountered time is 1000 ms but most response times are 300 - 500 ms, then thefirst bucket might be 0 - 50 ms, but there can also be buckets representingresponse times of 305 - 310 ms and 400 - 402 ms. ITCAM distributes the bucketborders so that the largest number of hits in any one bucket is not more thanthree times the number of hits in the smallest bucket.ITCAM calculates the percentage of the total amount of requests that fall intoeach response time bucket. ITCAM then divides it by the time interval widthrepresented by the bucket. This is shown on the Response Times Distributionbar chart in the “Request Baseline workspace” on page 109.
Each bar represents a bucket, and the bar height shows the percentage of therequests in this bucket. All the subsequent calculations are rounded up tobuckets.
2. ITCAM determines the selection zone, which contains the "typical" responsetime values. This zone is represented by the bars colored blue on the chart.ITCAM finds the response time interval (left border L to right border R) wherethe following statements are true:v The percentage of hits that fall into this interval is no less than the
Auto_Threshold_Percent parameter.v The spread of the time interval, calculated as (R/L)*100 - 100, is not greater
than the Auto_Threshold_Deviation parameter.
Important: The Auto_Threshold_Deviation parameter does not denote thestatistical definition of deviation.
300 ITCAM Agents for WebSphere Applications, J2EE, and HTTP Servers: User Guide

If several zones match these criteria, ITCAM chooses the one where thefollowing value is the greatest: S/(R-L), where S is the total number of hits thatfell into this zone.If a zone where both requirements are true cannot be found at all, ITCAM firstdetermines the interval where the percentage of hits is not less than theAuto_Threshold_Percent parameter while the spread is as little as possible.Then, within this interval, it finds a zone where the spread is not greater thanthe Auto_Threshold_Deviation parameter and the percentage of hits is as largeas possible.ITCAM determines the typical nested request times from the nested requesttimes in this zone, shown on the Level2 Delays Distribution chart.
3. Finally, ITCAM calculates the thresholds.The fair threshold is determined using the left and right borders of the selectionzone and the Auto_Threshold_Fair_Projection parameter:F = L + ((R-L) * Auto_Threshold_Fair_Projection / 100)The bad threshold is calculated in the same way, using theAuto_Threshold_Bad_Projection parameter:B = L + ((R-L) * Auto_Threshold_Bad_Projection / 100)Example: the left border of the selection zone might be L=1450 ms, and theright border R=3000 ms. By default, Auto_Threshold_Fair_Projection=150, andAuto_Threshold_Bad_Projection=300. In this case:v The fair response threshold is F = 1450 + ((3000-1450) * 150 / 100) = 3775 msv The bad response threshold is B = 1450 + ((3000-1450) * 300 / 100) = 6100 ms
WebSphere XD Overview for ITCAM Agent for WebSphere ApplicationsITCAM for Application Diagnostics provides enhanced support for monitoringVirtual Enterprise and Compute Grid products, as well as the IntelligentManagement and Batch features of WebSphere Application Server 8.5. The cellsmanaged by these products or features are called WebSphere XD (ExtendedDeployment) cells. For each XD cell, configured for monitoring by the WebSphereagent, the Tivoli Enterprise Portal shows the subnode under the agent node in thenavigation tree. The workspaces under the XD cell subnode show the XDmonitoring information.
The XD monitoring data is collected through a JMX connection to the deploymentmanager server and does not require a data collector. However, if a data collectoris installed on any WebSphere XD server, it is possible to drill down to moredetailed information.
ITCAM provides the following Virtual Enterprise monitoring features:
Monitors the status and metrics of the ODR (On Demand Router) server:v ODR server status – running, not running, number of running ODR servers in
the cell.v ODR server process JVM and OS metrics.v Collects requests metrics from ODR servers in the cell and provides summarized
statistics over cell, cluster, server, and application.
Monitors the status and metrics of dynamic clustersv Dynamic clusters topologyv Cluster configuration and state
Chapter 3. ITCAM Agent for WebSphere Applications 301

v Application servers in clusterv Current number of servers running in clusterv Max number of servers in clusterv Dynamic WLM Weightv ODR server process JVM and OS metrics
Monitors XD application servers JVM informationv Server process JVM and OS metrics
ITCAM provides the following Compute Grid monitoring features:
Monitors Job Scheduler serversv Job Scheduler server status – running, not running, number of running Job
Scheduler servers.v Job performance metrics reported by job scheduler servers, summarized over cell
and per job scheduler.v Details on queued and executing jobs, including notifications and job steps.v Job Scheduler server process JVM and OS metrics.
Monitors Grid Endpoint serversv Grid Endpoint server status – running, not running.v Job performance metrics reported by grid endpoint servers, summarized over
cell, service policy, and application.v Grid endpoint server process JVM and OS metrics.
There are a number of situations provided to detect problems in the XDenvironment and to open Tivoli Enterprise Portal events.
ITCAM for Application Diagnostics - WebSphere XD Cellworkspaces
The Tivoli Enterprise Portal XD component has the following workspaces:
Table 68. WebSphere XD Cell Workspaces
Navigation tree andWorkspaces
SecondaryWorkspaces (not intree) Description
WebSphere Agent Displays the overall summary informationabout the XD Cell.
XD Cell XD Cell Subnode that contains all theworkspaces associated with WebSphere XD.
Configuration Used to configure XD connection settings
Virtual Enterprise Displays ODR Summary Statistics.
Service policies Displays ODR Statistics for each servicepolicy.
Service policyviolations
Displays a list of service policy violationtasks.
Service policy Displays ODR Statistics for the selectedpolicy.
Applications Displays ODR statistics for each transactionclass, application, and module.
302 ITCAM Agents for WebSphere Applications, J2EE, and HTTP Servers: User Guide

Table 68. WebSphere XD Cell Workspaces (continued)
Navigation tree andWorkspaces
SecondaryWorkspaces (not intree) Description
Application Displays ODR statistics for each transactionclass, application, and module for theselected application.
Deployment Targets Displays ODR statistics for deploymenttargets.
Static Cluster Displays ODR statistics for and individualstatic cluster.
Servers Displays ODR and JVM operating systemstatistics.
Server Displays ODR and JVM operating systemstatistics for the selected server.
ODRs Displays Statistics for ODRs.
ODR Displays Statistics for ODRs for theselected ODR server.
Dynamic Clusters Displays dynamic clusters statistics.
Dynamic Cluster Displays dynamic clusters statistics for theselected cluster.
Compute Grid Displays overall performance, loading, andhealth statistics on the compute grid.
Job Service Policies Displays Job Statistics per service policyand summarizes all transactions classesthat belong to the service policy.
Job Service Policy Displays Job Statistics per service policyand summarizes all transactions classesthat belong to the service policy.
Job Applications Displays Job statistics by transaction classfor applications and modules.
Job Application Displays Job statistics by transaction classfor applications and modules for theselected job application.
Grid Endpoints Displays total statistics on grid endpoints.
Grid Endpoint Displays total statistics for the selected gridendpoint.
Job SchedulerServers
Displays job scheduler statistics.
Job Scheduler Server Displays job scheduler statistics for theselected server.
Jobs Displays running jobs.
Job Displays running jobs for the selected job.
WebSphere XD Cell subnode workspaceThe XD Cell subnode displays overall request rates, job execution rates, andservice policy violations.
This workspace displays data provided by the “XD Cell attributes” on page 328.
Chapter 3. ITCAM Agent for WebSphere Applications 303

The predefined workspace contains the following items:v Situation Event Console view displays all situation events for the XD Cell.v The Cell Summary table displays connections settings and versions for the cell.
You can click the link icon in any table row to click the Configuration link toaccess the XD Configuration workspace.
Accessing the XD Cell Subnode workspace1. In the Navigator, expand Windows Systems, Linux Systems, or UNIX Systems,
as appropriate for the node you are monitoring.2. In the node list, expand the entry that corresponds to the node that you want
to select.3. In that node list of monitored applications, expand the list of WebSphere
agents.4. Expand the WebSphere XD Cell.5. Click XD Cell.
Applications workspaceThe applications workspace displays (On Demand Router) ODR Statistics for eachunique application, module, transaction, class, and protocol combinationsummarized over all ODRs in the cell.
All statistics that display are the same as the Virtual Enterprise workspace. You canview more detailed information about the selected combination by clicking the linkin the Applications table
This workspace displays data provided by the “ODRs attributes” on page 320.
The predefined workspace contains the following items:v Arrived Request Rate - History chart displays the same information as the ODR
request rate on the cell subnode. Rates display per second for each request.– Request Arrived Rate
v Average Response Time - History displays information about response timingsin milliseconds:– Average Response Time gives ODR end to end request time
v The Applications table displays the latest status of each application
Accessing the Applications workspace1. In the Navigator, expand Windows Systems, Linux Systems, or UNIX Systems,
as appropriate for the node you are monitoring.2. In the node list, expand the entry that corresponds to the node that you want
to select.3. In that node list of monitored applications, expand the WebSphere agent node.4. Expand the XD Cell.5. Click the Applications workspace.
Accessing the Application workspace for a specific applicationv Click the link icon to view details for a specific application.v In the Applications report, right-click the link icon and from the menu, click
Application to display details about a specific application.– Service Policy Click this link to view specific server policies related to the
server in the Service Policy workspace.
304 ITCAM Agents for WebSphere Applications, J2EE, and HTTP Servers: User Guide

– Per ODRS Click this link to view the ODRS specific to the server in theODRS workspace.
– Per Deployment Target Click this link to access Dynamic clusters specific tothe server in the Deployment Target workspace.
– Applications
– Link Wizard Click to create links to workspaces.– Link Anchor Click to display visual indicators on tables where customized
links have been defined.
Note: Only applications that have some loading through the On Demand Router(ODR) display in the Applications workspace.
The application workspace displays Request Rate History and Average RequestTime History as well as the following charts Request percent History and RequestTime Deviation history.
Compute Grid workspaceThe Compute Grid workspace displays Job Statistics for the cell. Informationincludes overall performance, loading, and health statistics of the compute grid forthe cell.
This workspace displays data provided by the “Compute Grid Attributes” on page316.
The predefined workspace contains the following items:v Job Rate History chart: displays the overall job rates for the cell in minutes. The
rates are Dispatched, Dispatch Error, Started and Completed.v Average Job Time - History chart: displays the average job timings for the cell in
seconds. The values are Queue, Dispatch, Dispatch Error, and Execute.v Job Count - History displays the job count for the cell. The chart displays the
status as either Queued or Running.v Compute Grid table displays the current job statistics for the cell.
Accessing the Compute Grid workspace
To access this workspace, complete the following steps:1. In the Navigator, expand Windows Systems, Linux Systems, or UNIX Systems,
as appropriate for the node you are monitoring.2. In the node list, expand the entry that corresponds to the node that you want
to select.3. In that node list of monitored applications, expand the WebSphere agent.4. Expand the XD Cell.5. Click the Compute Grid workspace.
The Compute Grid table displays details on job performance. In the table,right-click the link icon and from the menu, click Service Policies to view the JobService Policies workspace.
Deployment Targets workspaceThe deployment targets workspace displays ODR statistics per deployment targetand per protocol.
This workspace displays data provided by the “ODRs attributes” on page 320.
Chapter 3. ITCAM Agent for WebSphere Applications 305

The predefined workspace contains the following items:v Arrived Request Rate History displays the arrived request rate history for each
deployment target.v Average Response Time History displays the average response time history for
each deployment target.v Deployment Targets displays the latest status of each deployment target.
Accessing the Deployment Targets workspace
To access this workspace, complete the following steps:1. In the Navigator, expand Windows Systems, Linux Systems, or UNIX Systems,
as appropriate for the node you are monitoring.2. In the node list, expand the entry that corresponds to the node that you want
to select.3. In that node list of monitored applications, expand the WebSphere agent.4. Expand the XD Cell.5. Click the Deployment Targets workspace.
Accessing the specific information from the Deployment targets table
You can view more detailed information from the Deployment targets table.v From the Deployments Target report, right-click the link icon and from the
pop-up menu, click one of the following options to move to the relevantworkspace.
Important: Dynamic cluster and Static cluster and Server workspace linksdisplay only for the corresponding deployment target types.– Server Click this link to view the Server workspace.– Dynamic Cluster Click this link to view the Dynamic Cluster workspace.
Dynamic Cluster can start, stop, and, create servers on demand.– Static Cluster Click this link to view the Static Cluster workspace. Static
cluster servers are created and started by users.– Per Service Policies: Click this link to view the service policies specific to the
selected deployment target.– Per Applications Click this link to view the applications specific to the
selected deployment target.– Per ODRs Click this link to view the deployment target statistics for each
ODR server that routes requests to the selected deployment target.
Dynamic Clusters workspaceThe Dynamic Clusters workspace displays the topology of the dynamic clusters,servers, nodes, and node groups in your environment.
This workspace displays data provided by the “Dynamic Clusters attributes” onpage 318 and the “Dynamic Cluster Topology attributes” on page 318.
The predefined workspace contains the following items:v Dynamic Cluster Topology displays visual representation of the dynamic clusters
and servers that belong to them with the corresponding nodes. You can point toeach item for details.
v Dynamic Clusters table displays the latest information about the dynamicclusters in the cell.
306 ITCAM Agents for WebSphere Applications, J2EE, and HTTP Servers: User Guide

Accessing the Dynamic Clusters workspace
To access this workspace, complete the following steps:1. In the Navigator, expand Windows Systems, Linux Systems, or UNIX Systems,
as appropriate for the node you are monitoring.2. In the node list, expand the entry that corresponds to the node that you want
to select.3. In that node list of monitored applications, expand the WebSphere agent.4. Expand the XD Cell.5. Click the Dynamic Clusters workspace.
Accessing a specific Dynamic Cluster workspace
To access this workspace from the dynamic clusters workspace, use one of thefollowing procedures:v From the Dynamic Clusters table, click the link icon and select Dynamic Cluster.
When you click Dynamic Clusters the following information displays:v Topology displays the selected dynamic cluster with its servers and
corresponding nodes, and node groups. Point to the items to view additionalinformation.
v Request Rate History chart displays the arrived request rate history in requestsper second for the selected dynamic cluster.
v Average Request Time History chart displays the average request time historyin milliseconds for the selected dynamic cluster.
v Dynamic Cluster table displays configuration and status data specific to theselected dynamic cluster.
v ODR statistics table displays ODR data specific to the selected dynamic cluster.
Grid Endpoints workspaceThe Grid Endpoints workspace displays job statistics for each grid endpoint, that isfor each WebSphere server that runs jobs.
This workspace displays data provided by the “Grid Endpoint attributes” on page319.
The predefined workspace contains the following items:v Job Started Rate - History chart displays the Job Started rate per minute.v Average Completion Time- History chart displays the Average Job Completion
Time in minutes.v The Grid Endpoints table that displays statistics for the server.
Accessing the Grid Endpoints workspace
To access this workspace, complete the following steps:1. In the Navigator, expand Windows Systems, Linux Systems, or UNIX Systems,
as appropriate for the node you are monitoring.2. In the node list, expand the entry that corresponds to the node that you want
to select.3. In that node list of monitored applications, expand the WebSphere agent.4. Expand the XD Cell.
Chapter 3. ITCAM Agent for WebSphere Applications 307

5. Click the Grid Endpoints workspace.
Accessing a specific Grid Endpoint workspacev From the Grid Endpoints table, right-click the link icon and from the menu, click
Grid Endpoint.
When you click Grid Endpoint the following information displays:v Average Completion Time - History chart displays the average job completion
time in minutes.v Job Rate - History chart displays the job rate per minute. The status is Started
or Completed.v JVM Heap Size chart displays the amount of heap size in MB, the status is
Used or Free.v CPU Used - History displays the percentage of the host CPU used by the JVM.v The Grid Endpoint table displays the job statistics for the selected policy.v It is also possible that other workspace links that are available depending on the
configuration. Click the relevant link to view the workspace of your choice:v Server Diagnostic Click to view the WebSphere application server.v Per Job Service Policies Click to view the Job Service Policies workspacev Per Applications Click to view the Job Applications workspace.v Grid Endpoint Click to view details of a specific grid endpoint.v Link Wizard Click to create links to workspaces.v Link Anchor Click to display visual indicators on tables where customized links
have been defined.
Job Applications workspaceThe Job Applications workspace displays job statistics for each application,module, and transaction class combination.
The predefined workspace contains the following items:v Job Started Rate - History chart displays the Job Started rate per minute.v Average Completion Time- History chart displays the Average Job Completion
Time in minutes.v The Job Applications table displays job statistics for each job application.
Accessing the Job Applications workspace
To access this workspace, complete the following steps:1. In the Navigator, expand Windows Systems, Linux Systems, or UNIX Systems,
as appropriate for the node you are monitoring.2. In the node list, expand the entry that corresponds to the node that you want
to select.3. In that node list of monitored applications, expand the WebSphere agent.4. Expand the XD Cell.5. Click the Job Applications workspace.
Accessing a specific Job Application workspacev From the Job Applications table, right-click the link icon and from the menu,
click Job Application.
When you click Job Application the following information displays:
308 ITCAM Agents for WebSphere Applications, J2EE, and HTTP Servers: User Guide

v Jobs Running - History chart displays the jobs running per minute.v Average Completion Time - History chart displays the average job completion
time in minutes.v Job Started Rate - History chart displays the job rate per minute. The status is
Started or Completed.v The Job Application table displays the job statistics for the selected policy.
Job Scheduler Servers workspaceThe Job Scheduler Servers workspace displays job statistics for each WebSphereapplication server server where Job Scheduler is running.
This workspace displays data provided by the “Compute Grid Attributes” on page316 attributes.
The predefined workspace contains the following items:v Job Dispatched Rate - History chart displays the Job Dispatched rate per minute.v Average Queue Time- History chart displays the Average Job Queue Time in
minutes.v The Job Scheduler Servers table displays job statistics for each Job Scheduler.
Accessing the Job Scheduler Servers workspace
To access this workspace, complete the following steps:1. In the Navigator, expand Windows Systems, Linux Systems, or UNIX Systems,
as appropriate for the node you are monitoring.2. In the node list, expand the entry that corresponds to the node that you want
to select.3. In that node list of monitored applications, expand the WebSphere agent.4. Expand the XD Cell.5. Click the Job Scheduler Servers workspace.
Accessing a specific Job Scheduler Servers workspacev From the Job Scheduler Servers table, right-click the link icon and from the
menu, click Job Scheduler Server.
When you click Job Scheduler Server the following information displays:v Job Rate - History chart displays the job rate per minute. The statuses are
Dispatched, Dispatched Error, or Completed.v Job Average Time - History chart displays the average job completion time in
seconds. The status is Queue, Dispatched, or Dispatched Error.v JVM Heap Size chart displays the amount of heap size in MB, the status is Used
or Free.v CPU Used - History displays the percentage of the host CPU used by the JVM.v The Job Scheduler Server table displays the job statistics for the selected policy.v Link Wizard Click to manually add links to other workspaces.v Link Anchor Click to display visual indicators on tables where customized links
have been defined
Job Service Policies workspaceThe Job Service Policies workspace displays jobs statistics for each service policy.
Chapter 3. ITCAM Agent for WebSphere Applications 309

This workspace displays data provided by the “Service Policy Violationsattributes” on page 326 attributes.
The predefined workspace contains the following items:v Job Started Rate - History chart displays the Job Started rate per minute.v Average Completion Time- History chart displays the Average Job Completion
Time in minutes.v The Job Service Policies table displays job statistics for each job service policy.
Accessing the Job Service Policies workspace
To access this workspace, complete the following steps:1. In the Navigator, expand Windows Systems, Linux Systems, or UNIX Systems,
as appropriate for the node you are monitoring.2. In the node list, expand the entry that corresponds to the node that you want
to select.3. In that node list of monitored applications, expand the WebSphere agent.4. Expand the XD Cell.5. Click the Job Service Policies workspace.
Accessing a specific Job Service policy workspacev From the Job Service Policies table, right-click the link icon and from the menu,
click Job Service Policy.
When you click Job Service Policy the following information displays:v Jobs Running - History chart displays the jobs running per minute.v Average Completion Time - History chart displays the average job completion
time in minutes.v Job Rate - History chart displays the job rate per minute. The status is Started or
Completed.v The Service Policy table displays the job statistics for the selected policy.v It is also possible that other workspace links that are available depending on the
configuration. Click the relevant link to view the workspace of your choice:v Job Applications Click this link to view the Job Applications workspacev Job Service Policy Click to view details of a specific job service policy.v Link Wizard Click to manually add links to other workspaces.v Link Anchor Click to display visual indicators on tables where customized links
have been defined
The Service Policy table displays information about jobs and the service policygoal.
Jobs workspaceThe Jobs workspace displays scheduled and running jobs.
This workspace displays data provided by the “Jobs attributes” on page 323 and“WebSphere XD Job Filter attributes” on page 323.
The predefined workspace contains the following items:v Job Filter - right-click the link to access the Set Job Filter where you can modify
the filter display fields.
310 ITCAM Agents for WebSphere Applications, J2EE, and HTTP Servers: User Guide

v Job Topology - displays the submitted jobs that have passed through the filter.You can point to each item to view the details.
v The Jobs Instances table displays the status of each job.
Accessing the Jobs workspace
To access this workspace, complete the following steps:1. In the Navigator, expand Windows Systems, Linux Systems, or UNIX Systems,
as appropriate for the node you are monitoring.2. In the node list, expand the entry that corresponds to the node that you want
to select.3. In that node list of monitored applications, expand the WebSphere agent.4. Expand the XD Cell.5. Click the Jobs workspace.
Setting the Job Filterv From the Job Filter table, right-click the link icon and from the menu, click Set
Job Filter.
You can add information to the following fields to change how the job filter tabledisplays:v Grid Endpoint
v Job Scheduler
v Total Time Greater
v Queue Time Greater
v Job Name
v Maximum Jobs
v Sort Order The options are Ascending or Descendingv Sort By The options are Total Time and Queue Timev Job ID
When you click OK to implement the changes, the changes display in the Job Filterview. Once you move to another workspace the Job Filter settings revert to thedefault settings. If you want the Job Filter to retain the changes, edit the AgentConfiguration workspace, Job Filter Settings tab.
Accessing the Job Instances workspacev From the Job Instances table, right-click the link icon and from the menu, click
Job Instance.
When you click Job Instance the following information displays and relatesdirectly to the job you selected.v Topology displays details relating to the selected job. You can point to each item
to view the details.v Job Notifications chart displays the notifications received for the selected job.v Job Steps chart displays executed and executing job steps.v The Job table displays the job statistics for the selected job.
Chapter 3. ITCAM Agent for WebSphere Applications 311

ODRs workspaceThe ODRs workspace displays request statistics for each ODR server (per protocol).
This workspace displays data provided by the “ODRs attributes” on page 320.
The predefined workspace contains the following items:v Arrived Request Rate - History Chart displays the arrived request rate history
in requests per second for each ODR server (per protocol).v Average Response Time - History Chart displays the average response time
history in milliseconds for each ODR server (per protocol).v The ODRs table shows the status and statistics for each ODR server (per
protocol for the last interval).
Accessing the ODRs workspace1. In the Navigator, expand Windows Systems, Linux Systems, or UNIX Systems,
as appropriate for the node you are monitoring.2. In the node list, expand the entry that corresponds to the node that you want
to select.3. In that node list of monitored applications, expand the WebSphere agent.4. Expand the XD Cell.5. Click the ODRs workspace
Viewing an individual ODR workspace
Use the following instructions to view specific details on an individual ODRserver.v From the ODRs table report, click the link icon and select ODR.
The following links are available for detailed request statistics as routed by theselected ODR:v Per Service Policies Click to view the service policy request statistics.v When you click ODR (the default link) the following charts display:
– Request Rate History– Average Request Time History– JVM Heap Size History Displays the heap size used and free.– CPU Used History displays the percentage of the host CPU used by JVM.
Servers workspaceThe servers workspace displays ODR statistics for each server and protocol.
This workspace displays data provided by the “Servers attributes” on page 325.
The predefined workspace contains the following items:v Arrived Request Rate - History Chart displays the arrived request rate history
in requests per second for each server (per protocol).v Average Response Time - History Chart displays the average response time
history in milliseconds for each ODR server (per protocol).v The Servers table shows current server status and statistics for each server.
312 ITCAM Agents for WebSphere Applications, J2EE, and HTTP Servers: User Guide

Accessing the Servers workspace
To access this workspace, complete the following steps:1. In the Navigator, expand Windows Systems, Linux Systems, or UNIX Systems,
as appropriate for the node you are monitoring.2. In the node list, expand the entry that corresponds to the node that you want
to select.3. In that node list of monitored applications, expand the WebSphere agent.4. Expand the XD Cell.5. Click the Servers workspace
Viewing server detailsv From the Servers report, click the link icon.v If the server you select is monitored by a data collector, you can also see a
Server Diagnostics link. Click this link to access the application server datacollector workspaces.
v Click Server to view details relating to a specific server.
When you click Server the following charts display:v Request Rate Historyv Average Request Time Historyv JVM Heap Size History: displays the heap size used and free.v CPU Used History: displays the percentage of CPU used by JVM.
A Server table is also displayed. The table contains a single row that showsperformance information for the server.
Service Policies workspaceThe Service policies workspace displays (On Demand Router) ODR statistics forservice policies and protocol, summarized over all the ODRs in the XD Cell.
The statistics that display are the same as the statistics in the virtual enterpriseworkspace. You can view more detailed information about the selected servicepolicy by clicking the link in the policies table.
Accessing the Service policies workspace1. In the Navigator, expand Windows Systems, Linux Systems, or UNIX Systems,
as appropriate for the node you are monitoring.2. In the node list, expand the entry that corresponds to the node that you want
to select.3. In that node list of monitored applications, expand the WebSphere agent.4. Expand the XD Cell.5. Click the Service Policies workspace
This workspace displays data provided by the “Service Policy Violationsattributes” on page 326.
The predefined workspace contains the following items:v Arrived Request Rate - History Chart displays the arrived request rate history
in requests per second for each server (per protocol).v Average Response Time - History Chart displays the average response time
history in milliseconds for each ODR server (per protocol).
Chapter 3. ITCAM Agent for WebSphere Applications 313

v The Service Policies table shows a current sample of the workplace statistics.Click the link in a table row to view details of individual service policies.
Accessing the Service policy violations workspace
The Service Policy violations workspace displays a list of service policy violationtasks.1. To access this workspace, from the XD Cell, select the Service Policies node.2. Right-clickService Policies > Workspaces > Service Policy Violations.3. The Open Service Policy Violation Tasks report displays a list of all open
tasks.4. You can sort the report according to the columns displayed. Click the column
that you want to sort by to display the filter arrow in the column, then click thearrow up or down to sort.
5. Click the link arrow for a row to view a specific service policy violation.
Accessing the Service policies workspace1. In the Navigator, expand Windows Systems, Linux Systems, or UNIX Systems,
as appropriate for the node you are monitoring.2. In the node list, expand the entry that corresponds to the node that you want
to select.3. In that node list of monitored applications, expand the WebSphere agent.4. Expand the XD Cell.5. Click the Service Policies workspace.
This workspace displays data provided by the “Service Policy Violationsattributes” on page 326.
The predefined workspace contains the following items:v Arrived Request Rate - History Chart displays the arrived request rate history
in requests per second for each server (per protocol).v Average Response Time - History Chart displays the average response time
history in milliseconds for each ODR server (per protocol).v The Service Policies table shows a current sample of the workplace statistics.
Click the link in a table row to view details of individual service policies.v From the Service policies report, click the link icon for a row.v Right-click the link icon to view the following menu options:
– Service Policy (default) displays details of the selected policy– Per ODRs Click this link to view the service policy request statistics per ODR
server.– Per Deployment Target Click this link to view the service policy request
statistics per deployment target.– Applications Click this link to access the applications specific to the service
policy in the Applications workspace.
This Service policy workspace displays the charts for the following information:v Request Rate History Chart displays request rates in requests per second.
– Request Arrived Rate displays the rate per second of requests arrived atODR during the sampling interval.
314 ITCAM Agents for WebSphere Applications, J2EE, and HTTP Servers: User Guide

– Request Dispatched Rate displays the rate per second of the requestsdispatched from ODR to server during the sampling interval.
– Request Serviced Rate displays the rate per second of requests returned fromserver to ODR during the sampling interval.
v Average Request Time - History displays information about request timings inmilliseconds.– Average Wait Time the average wait time of the request in the queue.– Average Response Time the average response time of the request.– Average Service Time the average service time of the request.– Average Service Time out The average service time of the requests completed
due to timeout during the sampling interval.– Average Response Time out The average response time of the requests
completed due to timeout during the sampling interval.– Average Dequeue Time The average dequeue time of the requests dequeued
during the sampling interval.v Request Percent History Chart displays miscellaneous request percents.
– Failed
– Dropped
– Above Goal
– Timed Out
v Average ODR Queue Length Chart displays average number of requests inODR queue for the selected service policy.
Virtual Enterprise workspaceThe virtual enterprise workspace displays ODR statistics by protocol summarizedover all the ODRs in the cell.
If you are using simple setup only the HTTP/S protocol is present.
This workspace displays data provided by the “ODRs attributes” on page 320.
The predefined workspace contains the following items:v Request Rate History displays the same information as the ODR request rate on
the cell subnode. Rates are displayed per second for each request.– Request Failed Rate displays the rate per second of requests returned with an
error indicator during the sampling interval.– Request Arrived Rate displays the rate per second of requests arrived at
ODR during the sampling interval.– Request Dropped Rate Displays the rate per second of requests dropped by
ODR after arrival or later from the queue during the sampling interval.– Request Dispatched Rate displays the rate per second of the requests
dispatched from ODR to server during the sampling interval.– Request Serviced Rate displays the rate per second of requests returned from
server to ODR during the sampling interval.– Request Above Goal Rate displays the rate per second of requests above
response time threshold during the sampling interval.v Average Request Time - History displays information about request timings in
milliseconds.– Average Wait Time displays the average wait time of the request in the
queue.
Chapter 3. ITCAM Agent for WebSphere Applications 315

– Average Response Time displays the average response time of the request.– Average Service Time displays the average service time of the request.– Average Service Time out Displays the average service time of the requests
completed due to timeout during the sampling interval.– Average Response Time out Displays the average response time of the
requests completed due to timeout during the sampling interval.– Average Dequeue Time Displays the average dequeue time of the requests
dequeued during the sampling interval.– Average Queue Length Displays this as zero in a simple setup.– Average Request Time Deviation History Displays is the average response
time in milliseconds.– Response Time Deviation displays the response time deviation.– Service Time Deviation displays the average service time deviation during
the sampling interval.v The Virtual Enterprise table shows a current sample of the workplace statistics.v You can also access the Service Policies workspace from this table.
Accessing the Virtual Enterprise workspace1. In the Navigator, expand Windows Systems, Linux Systems, or UNIX Systems,
as appropriate for the node you are monitoring.2. In the node list, expand the entry that corresponds to the node that you want
to select.3. In that node list of monitored applications, expand the WebSphere agent.4. Expand the XD Cell.5. Click the Virtual Enterprises workspace.
Accessing the service policy workspace
From the Virtual Enterprise report, click the link icon and then click Service Policyto access the Service Policy workspace.
WebSphere XD AttributesIBM Tivoli Composite Application Manager Agent for WebSphere Applicationsuses several attribute groups to store data for WebSphere XD monitoring.
Compute Grid AttributesThe Compute Grid attributes provide information and statistics about theWebSphere XD Compute Grid.
The attributes within this group are used to build the “Compute Grid workspace”on page 305 and the “Job Scheduler Servers workspace” on page 309.
Average Job Dispatch Time (min) Indicates the average time spent to dispatchjobs during the sampling interval.
Average Dispatch Error Time (min) Indicates the average time spent for the failedjob dispatches during the sampling interval.
Average Job Execution Time (min) Indicates the average job execution time duringthe sampling interval.
316 ITCAM Agents for WebSphere Applications, J2EE, and HTTP Servers: User Guide

Average Job Queue Time (min) Indicates the average time jobs spent in queueduring the sampling interval.
Cell Name Indicates the WebSphere XD Cell name.
Interval (sec) The length (in seconds) of the interval. The valid format is a positiveinteger.
Job Completed Count Indicates the number of jobs completed during thesampling interval.
Job Completed Rate (per min) Indicates the rate per minute of the jobs completedduring the sampling interval.
Job Dispatch Error Count Indicates the number of job dispatch errors during thesampling interval.
Job Dispatch Error Rate (per min) Indicates the rate per minute of the jobdispatch errors during the sampling interval.
Job Dispatched Count Indicates the number of jobs dispatched during thesampling interval.
Jobs Dispatched Rate (per min) Indicates the rate per minute of the jobsdispatched during the sampling interval.
Jobs In Queue Indicates the current number of jobs in Job Scheduler queue.
Jobs Running Indicates the current number of running jobs.
Job Scheduler Server Name Indicates the WebSphere server name of the JobScheduler.
Job Scheduler Server Node Indicates the WebSphere node name of the JobScheduler.
Job Scheduler Servers Running Indicates the current number of running JobScheduler servers.
Job Scheduler Deployment Target Name The deployment target name of the JobScheduler.
Job Scheduler Deployment Target Type The deployment target type of the JobScheduler.
Job Started Count Indicates the number of jobs started during the sample interval.
Job Started Rate (per min) Indicates the rate per minute of the jobs started duringthe sampling interval.
Label Indicates the row label.
Origin Node Indicates the XD Cell subnode.
Row Type Indicates the row type.
Chapter 3. ITCAM Agent for WebSphere Applications 317

Sample Date and Time The date and time the Tivoli Enterprise Monitoring Agentcollected the data. The valid format is a 12-character timestamp. For the STR andSCAN functions, the format is MM/DD/YY HH:MM:SS; Example: 09/25/0916:20:46 indicates the data was collected on September 25 2009, at 14:20:46.
Server State Indicates the WebSphere server state of the Job Scheduler. The statecan be Running, Stopped, Starting, Stopping, or Maintenance.
Dynamic Clusters attributesThe Dynamic Clusters attributes provide information about WebSphere XDdynamic clusters.
The attributes within this group are used to build the “Dynamic Clustersworkspace” on page 306
Cell Name Indicates the WebSphere XD Cell name.
Cluster Member Type Indicates the cluster member type.
Cluster Name Indicates the cluster name.
Cluster State Indicates the cluster state.
Configured Servers Indicates the configured number of servers in the dynamiccluster.
Interval (sec) Indicates the length of the sample interval in seconds.
Maximum Servers Indicates the maximum number of servers in the dynamiccluster.
Minimum Servers Indicates the minimum number of servers in the dynamiccluster.
Origin Node Indicates the XD Cell subnode.
Running Servers Indicates the current number of running servers in the dynamiccluster.
Sample Date and Time The date and time the Tivoli Enterprise Monitoring Agentcollected the data. The valid format is a 12-character timestamp. For the STR andSCAN functions, the format is MM/DD/YY HH:MM:SS; Example: 09/25/0916:20:46 indicates the data was collected on September 25 2009, at 14:20:46.
Dynamic Cluster Topology attributesThe WebSphere XD Dynamic Cluster Topology attributes provide topologyinformation about the dynamic clusters.
The attributes within this group are used to build the “Dynamic Clustersworkspace” on page 306.
Cell Name Indicates the WebSphere XD Cell name.
Filter Indicates the filter which is applied to the topology view.
From Node ID Indicates the incoming link topology node ID.
318 ITCAM Agents for WebSphere Applications, J2EE, and HTTP Servers: User Guide

ID Indicates the topology node ID.
Interval (sec) The length (in seconds) of the interval. The valid format is a positiveinteger.
Name Indicates the topology node name.
Origin Node Indicates the XD Cell subnode.
Sample Date and Time The date and time the Tivoli Enterprise Monitoring Agentcollected the data. The valid format is a 12-character timestamp. For the STR andSCAN functions, the format is MM/DD/YY HH:MM:SS; Example: 09/25/0916:20:46 indicates the data was collected on September 25 2009, at 14:20:46.
State Indicates the topology node state.
To Node ID Indicates the outgoing link topology node ID.
Type Indicates the topology node type.
Grid Endpoint attributesThe WebSphere XD Grid Endpoint attributes provide information about computegrid endpoint servers.
The attributes within this group are used to build the “Grid Endpoints workspace”on page 307, “Job Applications workspace” on page 308 and,“Job Service Policiesworkspace” on page 309
Application Indicates the job application name.
Application Label Indicates the application label.
Average Job Completion Time (min) Indicates the average job execution timeduring the sampling interval.
Cell Name Indicates the WebSphere XD Cell name.
Interval (sec) The length (in seconds) of the interval. The valid format is a positiveinteger.
Job Completed Count Indicates the number of jobs completed during thesampling interval.
Job Completed Rate (per min) Indicates the rate per minute of the jobs completedduring the sampling interval.
Jobs Running Indicates the average job execution time during the samplinginterval.
Job Started Count Indicates the number of jobs started during the samplinginterval.
Job Started Rate (per min) Indicates the rate per minute of the jobs started duringthe sampling interval.
Label Indicates the row label.
Chapter 3. ITCAM Agent for WebSphere Applications 319

Module Indicates the job module name.
Node Name The name of the Grid Endpoint server node.
Origin Node Indicates the XD Cell subnode.
Row Type Indicates the row type.
Sample Date and Time The date and time the Tivoli Enterprise Monitoring Agentcollected the data. The valid format is a 12-character timestamp. For the STR andSCAN functions, the format is MM/DD/YY HH:MM:SS; Example: 09/25/0916:20:46 indicates the data was collected on September 25 2009, at 14:20:46.
Server Name The name of the Grid Endpoint server.
Service Policy Indicates the job service policy name.
Service Policy Goal Value (min) Indicates the service policy goal value.
Service Policy Goal Type Indicates the service policy goal type.
Service Policy Importance Indicates the service policy importance.
Transaction Class Indicates the job transaction class name.
ODRs attributesThe ODRs (On Demand Routers) attributes provide information about theWebSphere XD On Demand Routers.
The attributes within this group are used to build the “ODRs workspace” on page312.
Average Dequeue Time (msec) The average dequeue time of the requestsdequeued during the sampling interval.
Average Queue Length The average ODR queue length.
Average Response Time (msec) The average response time of the request.
Average Response Timeout (msec) The average response time of the requestscompleted due to timeout during the sampling interval.
Average Service Time (msec) The average service time of the request.
Average Service Timeout (msec) The average service time of the requestscompleted due to timeout during the sampling interval.
Average Wait Time (msec) The average wait time of the request in the queue.
Interval (sec) The length (in seconds) of the interval. The valid format is a positiveinteger.
ODR Server Name The ODR server name.
ODR Server Node The ODR node name.
320 ITCAM Agents for WebSphere Applications, J2EE, and HTTP Servers: User Guide

ODR Servers Running How many ODR servers are running The valid format is a4-byte integer.
Protocol The protocol name.
ODR Server Status The ODR server status. Status can be Stopped, Running orMaintenance.
Request Above Goal Count The number of requests above response timethreshold during the sampling interval.
Request Above Goal Percent Indicates the percent of serviced requests which wereabove response time threshold during the sampling interval.
Request Above Goal Rate (per sec) The rate per second of requests aboveresponse time threshold during the sampling interval.
Request Arrived Count The number of requests arrived at ODR during thesampling interval.
Request Arrived Rate (per sec) The rate per second of requests that arrived atODR during the sampling interval.
Request Failed Count The number of requests returned with an error indicatorduring the sampling interval.
Request Failed Percent Indicates the percent of requests that returned, during thereported interval, with an error indicator.
Request Failed Rate (per sec) The rate per second of requests returned with anerror indicator during the sampling interval.
Request Dispatched Count The number of requests dispatched from ODR toserver during the sampling interval.
Request Dispatched Rate (per sec) The rate per second of the requests dispatchedfrom ODR to server during the sampling interval.
Request Dropped Count The number of requests dropped by ODR after arrival orlater from the queue during the sampling interval.
Request Dropped Rate (per sec) The rate per second of requests dropped by ODRafter arrival or later from the queue during the sampling interval.
Request Dropped Percent Indicates the percent of requests dropped at OnDemandRouter.
Response Time Deviation (msec) The response time deviation.
Request Timed Out Percent Indicates the percent of requests that returned, duringthe reported interval, due to service timeout.
Request Serviced Count The number of requests returned from server to ODRduring the sampling interval.
Chapter 3. ITCAM Agent for WebSphere Applications 321

Request Serviced Rate (per sec) The rate per second of requests returned fromserver to ODR during the sampling interval.
Sample Date and Time The date and time the Tivoli Enterprise Monitoring Agentcollected the data. The valid format is a 12-character timestamp. For the STR andSCAN functions, the format is MM/DD/YY HH:MM:SS; Example: 09/25/0916:20:46 indicates the data was collected on September 25 2009, at 14:20:46.
Service Time Deviation (msec) The average service time deviation during thesampling interval.
Origin Node The XD Cell subnode.
Cell Name The WebSphere XD Cell name.
Deployment Target Name The Deployment Target name.
Deployment Target Type Indicates the deployment target type. Deployment targettypes can be Dynamic Cluster, Static Cluster, or Server.
Row Type Indicates the row type.
Server Name Indicates the server name.
Server Node Indicates the server node name.
Server Status Indicates the server status. The Server status can be Stopped,Running or Maintenance.
Server Weight Indicates the server weight in cluster.
Application Indicates the application name.
Module Indicates the name of the module.
Transaction Class Indicates the transaction class.
Service Policy Indicates the service policy name.
Service Policy Importance Indicates the service policy importance.
Service Policy Goal Type Indicates the service policy goal type.
Service Policy Goal Value (msec) Indicates the service policy goal value.
Request Timed Out Count Indicates the number of requests that completed due toservice timeout during the sampling interval.
Requests Timed Out Rate (per sec) Indicates the rate per second of requests thatcompleted due to service timeout during the sampling interval.
Label Indicates the row label.
Application Label Indicates the application label.
322 ITCAM Agents for WebSphere Applications, J2EE, and HTTP Servers: User Guide

Jobs attributesThe WebSphere XD Jobs might be in queue, in a submitted state or in a suspendedstate. The Jobs workspace provided information about jobs that are active and notfinished.
The attributes within this group are used to build the “Jobs workspace” on page310.
Cell Name Indicates the WebSphere XD Cell name.
Execute Time (min) The job execution time.
Grid Endpoint Server Name The Grid Endpoint server name where job is running.
Grid Endpoint Server Node The Grid Endpoint node name.
Interval (sec) The length (in seconds) of the interval. The valid format is a positiveinteger.
Job ID The job ID.
Job Type The job type.
Job Scheduler Server Name The Job Scheduler server name on which job isscheduled.
Job Scheduler Server Node The Job Scheduler node name.
Origin Node Indicates the XD Cell subnode.
Queue Time (min) The current number of minutes job spent in queue.
Sample Date and Time The date and time the Tivoli Enterprise Monitoring Agentcollected the data. The valid format is a 12-character timestamp. For the STR andSCAN functions, the format is MM/DD/YY HH:MM:SS; Example: 09/25/0916:20:46 indicates the data was collected on September 25 2009, at 14:20:46.
Start Date and Time The job start date and time.
State Indicates the job state.
Submitter The job submitter name.
Suspended Until The job is suspended until the specified date and time.
Total Time (min) The total time passed since the job was submitted.
Filter The name of the job filter. The valid format is an alphanumeric string, with amaximum of 256 characters.
WebSphere XD Job Filter attributesThe WebSphere XD Job Filter attributes provide information about the current jobfilter.
The attributes within this group are used to build the jobs filter table in the “Jobsworkspace” on page 310workspace.
Chapter 3. ITCAM Agent for WebSphere Applications 323

Cell Name Indicates the WebSphere XD Cell name.
Total Time Greater (min) Indicates the filter for job total time to be greater thanthe specified time.
Grid Endpoint Indicates the filter for the Grid Endpoint full server name(node:server).
Interval (sec) The length (in seconds) of the interval. The valid format is a positiveinteger.
Job ID Indicates the filter for the job ID.
Job Name Indicates the filter for the job name.
Job Scheduler Server Indicates the filter for the Job Scheduler full server name(node:server).
Maximum Jobs Indicates the maximum number of jobs to pass the filter.
Queue Time Greater (min) Indicates the filter for job time in queue to be greaterthan the specified time.
Sort Order Indicates the job sort order.
Sort By Indicates the jobs attribute to sort by.
Origin Node Indicates the XD Cell subnode.
Sample Date and Time The date and time the Tivoli Enterprise Monitoring Agentcollected the data. The valid format is a 12-character timestamp. For the STR andSCAN functions, the format is MM/DD/YY HH:MM:SS; Example: 09/25/0916:20:46 indicates the data was collected on September 25 2009, at 14:20:46.
Filter ID The ID of the filter. The valid format is a 4-byte integer.
Filter The name of the filter. The valid format is an alphanumeric string, with amaximum of 256 characters.
Job Notification attributesThe WebSphere XD Job Notification attributes provide information about thecurrent job notifications.
The attributes within this group are used to build the “Jobs workspace” on page310.
Cell Name Indicates the WebSphere XD Cell name.
Date and Time Indicates the notification date and time.
Interval (sec) The length (in seconds) of the interval. The valid format is a positiveinteger.
Job ID Indicates the job ID.
Origin Node Indicates the XD Cell subnode.
324 ITCAM Agents for WebSphere Applications, J2EE, and HTTP Servers: User Guide

Notification Type Indicates the notification type.
Sample Date and Time The date and time the Tivoli Enterprise Monitoring Agentcollected the data. The valid format is a 12-character timestamp. For the STR andSCAN functions, the format is MM/DD/YY HH:MM:SS; Example: 09/25/0916:20:46 indicates the data was collected on September 25 2009, at 14:20:46.
Sequence Number Indicates the notification sequence number.
Step Name Indicates the step name.
Job Topology attributesThe WebSphere XD Job Topology attributes provide topology information aboutrunning jobs.
The attributes within this group are used to build the “Jobs workspace” on page310.
Cell Name Indicates the WebSphere XD Cell name.
From Node ID Indicates the incoming link node ID.
ID Indicates the node ID.
Interval (sec) The length (in seconds) of the interval. The valid format is a positiveinteger.
Job ID Indicates the job ID.
Name Indicates the node name.
Origin Node Indicates the XD Cell subnode.
Sample Date and Time The date and time the Tivoli Enterprise Monitoring Agentcollected the data. The valid format is a 12-character timestamp. For the STR andSCAN functions, the format is MM/DD/YY HH:MM:SS; Example: 09/25/0916:20:46 indicates the data was collected on September 25 2009, at 14:20:46.
State Indicates the node state.
To Node ID Indicates the outgoing link node ID.
Type Indicates the node type.
Filter The name of the job filter. The valid format is an alphanumeric string, with amaximum of 128 characters.
Servers attributesThe Servers attributes provide JVM and process information about the WebSphereXD servers.
The attributes within this group are used to build the “Servers workspace” onpage 312.
Origin Node Indicates the XD Cell subnode.
Chapter 3. ITCAM Agent for WebSphere Applications 325

Cell Name Indicates the WebSphere XD Cell name.
CPU Used Percent Indicates the server CPU usage percent.
Interval (sec) The length (in seconds) of the interval. The valid format is a positiveinteger.
JVM Heap Used (MB) Indicates the size of the used JVM heap space.
JVM Heap Free (MB) Indicates the size of the free JVM heap space.
JVM Heap Total (MB) Indicates the total JVM heap size.
Process Resident Memory (MB) Indicates the server process resident memory.
Process Total Memory (MB) Indicates the server process total memory.
Sample Date and Time The date and time the Tivoli Enterprise Monitoring Agentcollected the data. The valid format is a 12-character timestamp. For the STR andSCAN functions, the format is MM/DD/YY HH:MM:SS; Example: 09/25/0916:20:46 indicates the data was collected on September 25 2009, at 14:20:46.
Server Name The name of the server.
Sever Node The name of the server node.
Service Policy Violations attributesThe WebSphere XD Service Policy Violations attributes provide information aboutopen service policy violation tasks.
The attributes within this group are used to build the“Service Policies workspace”on page 313.
Cell Name Indicates the WebSphere XD Cell name.
Date and Time Indicates the date and time when the service policy violation taskwas open.
Interval (sec) The length (in seconds) of the interval. The valid format is a positiveinteger.
Origin Node Indicates the XD Cell subnode.
Row Number Indicates sequential row number.
Sample Date and Time The date and time the Tivoli Enterprise Monitoring Agentcollected the data. The valid format is a 12-character timestamp. For the STR andSCAN functions, the format is MM/DD/YY HH:MM:SS; Example: 09/25/0916:20:46 indicates the data was collected on September 25 2009, at 14:20:46.
Service Policy Indicates the service policy name.
Service Policy Importance Indicates the service policy importance.
Service Policy Goal Type Indicates the service policy goal type.
326 ITCAM Agents for WebSphere Applications, J2EE, and HTTP Servers: User Guide

Service Policy Goal Unit Indicates the service policy goal unit.
Service Policy Goal Value Indicates the service policy goal value.
Violation Indicates the service policy violation task description.
Steps attributesThe WebSphere XD Steps attributes provide information about current steps.
The attributes within this group are used to build the “Jobs workspace” on page310.
Cell Name Indicates the WebSphere XD Cell name.
End Date and Time Indicates the step end date.
Execution Time (min) Indicates the step execution time in minutes.
Job ID Indicates the job ID.
Interval (sec) The length (in seconds) of the interval. The valid format is a positiveinteger.
Origin Node Indicates the XD Cell subnode.
Result Code Indicates the finished step result code.
Sample Date and Time The date and time the Tivoli Enterprise Monitoring Agentcollected the data. The valid format is a 12-character timestamp. For the STR andSCAN functions, the format is MM/DD/YY HH:MM:SS; Example: 09/25/0916:20:46 indicates the data was collected on September 25 2009, at 14:20:46.
Start Date and Time Indicates the step start date.
Status Indicates the finished step status.
Step Name Indicates the step name.
XD Cell subnode attributesThe XD Cell Configuration attributes provide configuration information.
The attributes within this group are used to build the “WebSphere XD Cellsubnode workspace” on page 303.
Origin Node Indicates the XD Cell subnode.
Cell Name Indicates the WebSphere XD Cell name.
Interval (sec) The length (in seconds) of the interval. The valid format is a positiveinteger.
Sample Date and Time The date and time the Tivoli Enterprise Monitoring Agentcollected the data. The valid format is a 12-character timestamp. For the STR andSCAN functions, the format is MM/DD/YY HH:MM:SS; Example: 09/25/0916:20:46 indicates the data was collected on September 25 2009, at 14:20:46.
Chapter 3. ITCAM Agent for WebSphere Applications 327

Row Id The row identifier. The valid format is a 2-byte integer.
View Id The view identifier. The valid format is a 2-byte integer.
Act Id The act identifier. The valid format is a 2-byte integer.
Data The data string. The valid format is an alphanumeric string, with a maximumof 4096 characters.
XD Cell attributesThe WebSphere XD Cell attributes provide information about a WebSphere XDcell.
The attributes within this group are used to build the “WebSphere XD Cellsubnode workspace” on page 303.
Connection Status Indicates the connection status to the cell deployment manager.
Connection Host Indicates the connection address of the deployment manager.
Connection Port Indicates the connection port of the deployment manager.
Connection Type Indicates the connection type of the deployment manager.
WebSphere Version Indicates the WebSphere version.
WebSphere Location Indicates the WebSphere XD root directory.
Cell Name Indicates the WebSphere XD Cell name.
Interval (sec) The length (in seconds) of the interval. The valid format is a positiveinteger.
Origin Node Indicates the XD Cell subnode.
Sample Date and Time The date and time the Tivoli Enterprise Monitoring Agentcollected the data. The valid format is a 12-character timestamp. For the STR andSCAN functions, the format is MM/DD/YY HH:MM:SS; Example: 09/25/0916:20:46 indicates the data was collected on September 25 2009, at 14:20:46.
ITCAM for Application Diagnostics - WebSphere XD TakeActions
Use the XD Take Action commands in the Tivoli Enterprise Portal interface to addand remove XD cells to and from a WebSphere application server.
WebSphere XD uses two take action commands.v Add_XD_Cellv Remove_XD_Cell
You must use the Add_XD_Cell command as part of the XD Cell configurationprocess.
To remove an XD Cell, you must access this option from the node of the XD cellthat you want to remove. For more information, see“Remove_XD_Cell: Remove anXD cell from the WebSphere XD Cell” on page 329
328 ITCAM Agents for WebSphere Applications, J2EE, and HTTP Servers: User Guide

Remove_XD_Cell: Remove an XD cell from the WebSphere XDCellUse the Remove_XD_Cell command to remove an XD cell from the WebSphere XDCell. This take action command is available on the specific cell subnode only.
Command syntax
Before you remove an XD cell from the agent, disable monitoring using theconfiguration workspace. If you do not disable monitoring, then theRemove_XD_Cell finishes displaying an error message notifying you to disablemonitoring beforehand. See “Application Diagnostics Configuration - Basic Tab” onpage 581. To access the command, right-click the XD Cell node that you want to remove.
Click Take Actions > Select.2. From the Name drop-down menu, select Remove_XD_Cell.3. Click OK to remove the cell.
YN:RemXDCell
See also “ITCAM for Application Diagnostics - WebSphere XD Take Actions” onpage 328
ITCAM for Application Diagnostics - XD Agent situationsWebSphere XD has a number of predefined situations that you can use to completethe following tasks:v Detect importance conditions in the WebSphere XD cell you monitor.v Create your own situations using the predefined situations as examples.
These predefined situations display an alert status. When these situations triggeran alert, you can investigate the event by opening its workspace. For example, youcan use these situations to monitor a WebSphere XD cell for requests not meetingthe expected goal.
How the situations work
Situations are tests expressed in IF-TRUE format of system conditions that youwant to monitor; the tested value is an ITCAM Agent for WebSphere Applicationsattribute expressed in the form attribute-group.attribute-name. If the specifiedcondition occurs or exists, the situation is true, and an alert is issued.
Avoid using negative values
If you define situations that use a counter or a range of numbers, always provide athreshold or use values in a positive range of numbers. For example, use agreater-than-or-equal-to-zero expression as shown in some of the followingpredefined situations. This practice prevents a situation from falsely tripping. If theITCAM Agent for WebSphere Applications Tivoli Enterprise Monitoring Agentencounters an undefined attribute value, it reports this value as a negative numberand a situation that specifies a negative number can fire erroneously.
Accessing the situations
A number of predefined situations are shipped to monitor the WebSphere XD Cell.All of the situations except XDVEAppReqArrivedRateHigh are active by default.
Chapter 3. ITCAM Agent for WebSphere Applications 329

You can customize thresholds used in a situation to suit your environment.Situation XDVEAppReqArrivedRateHigh, needs to be run manually. To start asituation manually, access the situations in the Tivoli Enterprise Portal using one ofthe following methods:
v From the toolbar on the main menu, click the Situation Editor icon andscroll to the situation that you want to view.
v In the WebSphere agent, right-click the specific workspace. Click ManageSituations to display all the managed situations available. If you want to start,stop, edit or model a situation, right-click the situation and select the option youwant.
XDConnectionError monitors connectivity between the monitoring agent and thedeployment manager and issues a Critical alert when there is no connectionbetween the monitoring agent and the deployment manager. The formula is:
If
WebSphere_XD_Cell.Connection_Status equals error
then
the situation XDConnectionError is true.
XDCPUUsedHigh monitors the percentage of the CPU being consumed and issuesa Critical alert when the CPU usage is higher than 80%. The formula is:
If
WebSphere_XD_Servers.CPU_Used_Percent is greater than 80
then
the situation XDCPUUsedHigh is true.
XDVEODRNotRunning monitors the ODR servers running in the XD cell andissues a Critical alert when the number of ODR servers running equals 0. Theformula is:
If
WebSphere_XD_ODR.Servers_Running equals 0 andWebSphere_XD_ODR.Row_Type equals ODR
then
the situation XDVEODRNotRunning is true.
XDVEODRQueueLengthHigh monitors the average ODR server queue length andissues a Critical alert when the queue length is longer than 10. The formula is:
If
WebSphere_XD_ODR.Average_Queue_Length is greater than 10 andWebSphere_XD_ODR.Row_Type equals ODR
330 ITCAM Agents for WebSphere Applications, J2EE, and HTTP Servers: User Guide

then
the situation XDVEODRQueueLengthHigh is true.
XDVEAppReqFailedPercentHigh monitors the percentage of failed applicationrequests and issues a Critical alert when more than 0.5 percent of applicationrequest fail. The formula is:
If
WebSphere_XD_ODR.Request_Failed_Percent is greater than 0.5 andWebSphere_XD_ODR.Row_Type equals Application
then
the situation XDVEAppReqFailedPercentHigh is true.
XDVEAppReqDroppedPercentHigh monitors the percentage of applicationrequests that drop and issues a Critical alert when percent of dropped request ishigher than 0.5 percent. The formula is:
If
WebSphere_XD_ODR.Request_Dropped_Percent is greater than 0.5 andWebSphere_XD_ODR.Row_Type equals Application
then
the situation XDVEAppReqDroppedPercentHigh is true.
XDVEAppReqArrivedRateHigh monitors the application request arrival rate andissues a Critical alert when the request arrival rate is higher than 1000 per second.The formula is:
If
WebSphere_XD_ODR.Request_Arrived_Rate is greater than 1000 andWebSphere_XD_ODR.Row_Type equals Application
then
the situation XDVEAppReqArrivedRateHigh is true.
Note: You must run this situation XDVEAppReqArrivedRateHigh manually.
XDVEAppReqAboveGoalPercentHigh monitors the number of applicationrequests above the response time threshold during the sampling interval and issuesa Critical alert when the average request response time is 0.5 percent. The formulais:
If
WebSphere_XD_ODR.Requests_Above_Goal_Percent is greater than 0.5 andWebSphere_XD_ODR.Row_Type equals Application
then
Chapter 3. ITCAM Agent for WebSphere Applications 331

the situation XDVEAppReqAboveGoalPercentHigh is true.
XDVEAppReqTimedOutPercentHigh monitors the percentage of applicationrequests that time out and issues a Critical alert when the percent of timed-outrequests is higher than 0.5 percent. The formula is:
If
WebSphere_XD_ODR.Request_Timed_Out_Percent is greater than 0.5 andWebSphere_XD_ODR.Row_Type equals Application
then
the situation XDVEAppReqTimedOutPercentHigh is true.
XDVEServerMaintenance monitors the need for server maintenance and issues aCritical alert when a server requires maintenance. The formula is:
If
WebSphere_XD_ODR.Server_State equals Maintenance andWebSphere_XD_ODR.Row_Type equals Server
then
the situation XDVEServerMaintenance is true.
XDVEDynClusterPartlyRunning monitors for any dynamic clusters that arepartially running and issues a Critical alert when this is the case. A cluster isconsidered partially running when some servers are active, but the number ofactive servers is lower than the configured minimum amount of instances in thecluster. For example, if a cluster is configured to run with a minimum of fourinstances, but only three are active, the cluster is partially running. The formula is:
If
WebSphere_XD_Dynamic_Clusters.Cluster_State equals Partially_Running
then
the situation WASPortletResponseTime is true.
XDVESPolicyTaskOpen searches for open service policy violation tasks and issuesa Critical alert when one occurs. The formula is:
If
WebSphere_XD_Policy_Violations.Service_Policy is not equal to "empty string"
then
the situation XDVESPolicyTaskOpen is true.
XDCGJobSchNotRunning monitors the connectivity of the Job Scheduler serversand issues a Critical alert when a Job Scheduler server is not running. The formulais:
332 ITCAM Agents for WebSphere Applications, J2EE, and HTTP Servers: User Guide

If
WebSphere_XD_Compute_Grid.Job_Scheduler_Servers_Running equals Cell andWebSphere_XD_Compute_Grid.Row_Type equals Cell
then
the situation XDCGJobSchNotRunning is true.
XDCGJobSchQueueLengthHigh monitors the Job Scheduler queue length andissues a Critical alert when the queue length is higher than 5000 per second. Theformula is:
If
WebSphere_XD_Compute_Grid.Jobs_in_Queue is greater than 5000 andWebSphere_XD_Compute_Grid.Row_Type equals Job_Scheduler_Server
then
the situation XDCGJobSchQueueLengthHigh is true.
XDCGJobSchDispErrorPercentHigh monitors the percentage of job scheduler jobsthat fail and issues a Critical alert when a job fails. The formula is:
If
WebSphere_XD_Compute_Grid.Average_Job_Dispatch_Error_Time is greater than 0and WebSphere_XD_Compute_Grid.Row_Type equals Job_Scheduler_Server
then
the situation XDCGJobSchDispErrorPercentHigh is true.
XDCGJobExcessiveTotalTime monitors the duration time of a job and issues aCritical alert when the job execution time is longer than one day (1440 mins). Theformula is:
If
WebSphere_XD_Jobs.Total_Time is greater than 1440
then
the situation XDCGJobExcessiveExecTotalTime is true.
XDCGJobExcessiveQueueTime monitors job queue time and issues a Critical alertwhen the job is in a queue for longer than 10 minutes. The formula is:
If
WebSphere_XD_Jobs.Queue_Time is greater than 10
then
the situation XDCGJobExcessiveQueueTime is true.
Chapter 3. ITCAM Agent for WebSphere Applications 333

WebSphere Extreme Scale overview for ITCAM Agent for WebSphereApplications
ITCAM Agent for WebSphere Applications provides monitoring for WebSphereExtreme Scale deployment. You can configure monitoring for an Extreme Scalezone, or several zones, under the node for any server belonging to the zone orzones. You can drill down to view information for different servers, map sets, andpartitions within the zone or zones.
WebSphere Extreme Scale prerequisitesFor WebSphere Extreme Scale monitoring, your environment must meet thefollowing conditions.v In the WebSphere Extreme Scale server properties file, statistics must be enabled.
For details, see the WebSphere Extreme Scale Administration Guide, in thesection on monitoring with managed beans (MBeans).
v ITCAM Agent for WebSphere Applications must be installed on at least oneserver in the monitored Extreme Scale zone, with Catalog Service enabled on theserver. Alternatively, the Agent can be installed on a different host with goodnetwork connectivity to such a server.
v For hung thread detection, ITCAM Agent for WebSphere Applications must beinstalled, and the data collector must be configured, for every monitoredExtreme Scale server. If the data collector is not configured for any server, hungthread detection does not work for it, but all other metrics remain available.
WebSphere Extreme Scale WorkspacesUse workspaces to configure monitoring of an Extreme Scale zone and to viewmonitoring information.
WebSphere Extreme Scale configuration workspaceUse the WebSphere Extreme Scale configuration workspace to configuremonitoring for a WebSphere Extreme Scale zone.
After creating an Extreme Scale zone node using the WXS_Add_Zone Take Actioncommand (see “WXS_Add_Zone: add a zone node” on page 371), you mustconfigure it using this workspace. The monitoring workspaces for the zone do notdisplay any data before you configure it. You can also change this configuration ata later time.
Attention: Before configuring monitoring for a security-enabled WebSphereExtreme Scale environment, you must complete additional configuration steps, asdescribed in the IBM Tivoli Composite Application Manager: Agent for WebSphereApplications Installation and Configuration Guide. Otherwise, the monitoring mightfail.
This workspace includes the following tabs:v Connection Settingsv Security Settingsv Collection Settings
334 ITCAM Agents for WebSphere Applications, J2EE, and HTTP Servers: User Guide

Connection Settings tab
Specify WebSphere Extreme Scale zone information, including catalog servers, inthis tab. The agent uses the catalog servers to retrieve monitoring informationabout the zone.
The Connection Settings tab contains the following fields for the zone:v Zone Name The name of the zone to monitor. You can also specify * to monitor
aggregated information for all zones that include the listed catalog servers.v Connection type The type of the zone: Embedded WAS if catalog servers
running within WebSphere application servers, or Standalone if it is running asstand-alone containers (with their own JVMs).
It also contains a table of catalog servers, listing all the servers that are configuredor discovered. The table shows the following information:v Info Blank if the agent has connected to the server successfully. If the connection
has failed, the column contains a red icon. Place the mouse cursor over the iconto display details about the failure.
v Server Name The catalog name for the catalog server. If the catalog namedetected at the configured host and port is different, the agent marks the catalogserver as OUT_OF_SYNC in the Catalogs workspace. You can set * as the cataloghost. In this case, the agent detects the name when connecting to the server forthe first time.
v Host name The host name of the catalog server. For best performance, configureWebSphere Extreme Scale monitoring under a node corresponding to a serverwithin the monitored zone, with Catalog Service enabled. In this case, uselocalhost for this field. Alternatively, to monitor a different server, enter itshostname in this field.
v Port number The RMI port for the catalog server. The default value is 1099 forWebSphere Extreme Scale stand-alone, 9809 for embedded WebSphereApplication Server.
Before you configure a catalog server for the zone, the agent does not monitor thezone. You can only view default settings in the other tabs of this workspace. Tostart monitoring a zone, you must provide information about at least one catalogserve for the zone. The server must be running and available.
After you configure a server and monitoring starts, the agent discovers othercatalog servers. When you open the configuration window again, you can see thediscovered servers added to the table.
To configure the settings for a catalog server for the zone, enter the settings in thefields and click Add. You can enter * for the server name; in this case, the agentdetermines the name automatically. You must enter the host name and portnumber.
To change the settings for a catalog server, select it in the table, modify the settingsin the fields and click Modify.
To remove a catalog server from the table, select it in the table and click Remove.Use this option for catalog servers that are no longer active. If you remove acatalog server that is still active, the agent discovers it later and adds it to the tableagain.
Chapter 3. ITCAM Agent for WebSphere Applications 335

Important: If the server is monitored by a version of the agent older than 7.2, thisworkspace contains information for one catalog server only. You can set the zonename, catalog server name and hostname, port number, and connection type.
Attention: If the server is monitored by a version of the agent older than 7.2 andthe catalog server name changes after configuration, the agent reports a connectionerror. To fix this error, use the configuration workspace again.
Security Settings tab
If JMX connection security (SOAP SSL) is enabled on WebSphere Extreme ScaleCatalog Service, specify the security and authentication information in this tab.
The Security Settings tab contains the following fields:v Connector Security Is Enabled Select TRUE if JMX connection security is enabled
on WebSphere Extreme Scale Catalog Service. Otherwise, select FALSE; thedefault setting is FALSE.
v User The user name for authentication with the WebSphere Extreme ScaleCatalog Service JMX connection.
v Password, Confirm Password The password for authentication with theWebSphere Extreme Scale Catalog Service JMX connection.
v SSL Trust Store File The path to the SSL Trust Store File.v SSL Trust Store Password, Confirm SSL Trust Store Password The password
for the SSL Trust Store.v SSL Trust Store Type The type of the SSL trust store.
Important: All paths in this tab must be set for the server on which the Agent isinstalled, that is, the server represented by the node under which the WebSphereExtreme Scale zone node is located.
Collection Settings tab
You can modify settings for collection of monitoring information from WebSphereExtreme Scale in this tab.
The Collection Settings tab contains the following fields:v Discovery Interval (seconds) Interval for discovering grid topology changes,
such as new container or catalog services added to the zone.v Collection Interval (seconds) Interval for collecting all Extreme Scale metrics
from the Catalog Service (using MBeans).v Hung ThreadsMonitoring Enables or disables monitoring of hung threads
inside Extreme Scale JVM processes on all servers within the zone.
Important: For hung thread detection, ITCAM Agent for WebSphereApplications must be installed, and the data collector must be configured, forevery monitored Extreme Scale server.
v Hung Thread Detection Timeout (seconds) Timeout for detecting hung threads.
Accessing the WebSphere Extreme Scale configuration workspace
To access the workspace, complete the following steps:v Within the Navigator, expand Windows Systems, Linux Systems, z/OS Systems,
or UNIX Systems, as appropriate for the node you are monitoring.
336 ITCAM Agents for WebSphere Applications, J2EE, and HTTP Servers: User Guide

v Within the node list, expand the entry that corresponds to the server node.v Within that node list of monitored applications, expand the WebSphere agent.v Under the WebSphere agent, expand WebSphere XS Zone.v Under the WebSphere XS Zone, select the Extreme Scale zone node of your
choice.v Right-click, and choose WebSphere XS Zone – Configuration.
To create an Extreme Scale zone node, use the WXS_Add_Zone Take Action, see“WXS_Add_Zone: add a zone node” on page 371.
WebSphere Extreme Scale Zone Summary workspaceThis workspace shows the summary statistics for the monitored Extreme Scalezones. It is available if more than one zone node is configured for an agent node.
This workspace displays data provided by the “Extreme Scale Grids attributes” onpage 360,“Extreme Scale Map attributes” on page 362 and “Extreme Scale Serversattributes” on page 358.
The predefined workspace contains the following items:v Situation Event Console, which shows the event log for all Extreme Scale events
on this agent node.v Transaction Times History graph, which shows the history and real-time value
for the average transaction time for every configured zone node.v Transaction Rates History graph, which shows the history and real-time value
for the average transaction rate for every configured zone node.v Hit Rates History graph, which shows the history and real-time value for the
average map hit rate for every configured zone node.v Available Processors History graph, which shows the history and real-time value
for the number of available CPUs in every configured zone node.v Memory History graph, which shows the history and real-time values for the
total used and free JVM heap memory, in megabytes, in every configured zonenode.
From all the graphs, you can select the WebSphere XS Zone link to open the“WebSphere Extreme Scale Zone workspace” for the selected zone.
Accessing the WebSphere Extreme Scale Zone Summary workspace
Under an Agent for WebSphere Applications node for which two or more ExtremeScale zone nodes are configured, select the WebSphere XS Zone node.
WebSphere Extreme Scale Zone workspaceThis workspace shows the common statistics for a monitored Extreme Scale zonenode.
This workspace displays data provided by the “Extreme Scale Grids attributes” onpage 360,“Extreme Scale Map attributes” on page 362 and “Extreme Scale Serversattributes” on page 358.
The predefined workspace contains the following items:v Situation Event Console, which shows the event log for all Extreme Scale events
for this zone node.
Chapter 3. ITCAM Agent for WebSphere Applications 337

v Transaction Times history graph, which shows the history and real-time valuefor the average transaction time for this zone node.
v Transaction Rate history graph, which shows the history and real-time value forthe average transaction rate for this zone node.
v Map Hit Rates graph, which shows the history and real-time value for theaverage map hit rate for this zone node.
v Available Processors graph, which shows the history and real-time value for thenumber of available CPUs in this zone node.
v Heap Memory History graph, which shows the history and real-time values forthe total used and free JVM heap memory, in megabytes, for this zone node.
Accessing the WebSphere Extreme Scale Zone workspace
To access the workspace, complete the following steps:v Within the Navigator, expand Windows Systems, Linux Systems, z/OS Systems,
or UNIX Systems, as appropriate for the node you are monitoring.v Within the node list, expand the entry that corresponds to the server node.v Within that node list of monitored applications, expand the WebSphere agent.v Under the WebSphere agent, expand WebSphere XS Zone.v Under the WebSphere XS Zone, select the Extreme Scale zone node of your
choice.
Catalogs workspaceThis workspace shows the statistics for the catalog services running within amonitored Extreme Scale zone node.
This workspace displays data provided by the “Extreme Scale Catalog attributes”on page 355.
The predefined workspace contains the following items:v Situation Event Console, which shows the event log for catalog-related Extreme
Scale events for this zone node.v Active Catalogs History graph, displaying the history and real-time value for the
numbers of active catalog services and of catalog services that have a quorum.v Catalog Services table, displaying the attributes and statistics for every catalog
service in the zone node.
Accessing the Catalogs workspace
To access the workspace, complete the following steps:v Within the Navigator, expand Windows Systems, Linux Systems, z/OS Systems,
or UNIX Systems, as appropriate for the node you are monitoring.v Within the node list, expand the entry that corresponds to the server node.v Within that node list of monitored applications, expand the WebSphere agent.v Under the WebSphere agent, expand WebSphere XS Zone.v Under the WebSphere XS Zone, expand the Extreme Scale zone node of your
choice.v Under the Extreme Scale zone node of your choice, select the Catalogs node.
Containers workspaceThis workspace shows the statistics, including hung threads, for the Gridcontainers running within a monitored Extreme Scale zone node.
338 ITCAM Agents for WebSphere Applications, J2EE, and HTTP Servers: User Guide

This workspace displays data provided by the “Extreme Scale Servers attributes”on page 358 and the “Extreme Scale Thread Pools attributes” on page 368.
The predefined workspace contains the following items:v Situation Event Console, which shows the event log for all Extreme Scale events
for this zone node.v Container Servers Summary table, displaying the attributes and statistics,
including hung threads, for every server JVM in the zone node.v Highest Memory Used: by Server bar chart, displaying the memory usage for
the server JVMs that consume most memory.v Highest Active Threads: by Server bar chart, displaying the active thread count
for the server JVMs that are, or were, running the highest number of threads.Only available for WebSphere Extreme Scale 7.1.
To view detailed statistics for the server, use the following links from the ContainerServers Summary table and from the bar charts:
Selected Server To view the “Selected Containers workspace” for the server.
Selected Server – Transactions To view the “Transactions – Selected Levelworkspace” on page 342 for the server.
Selected Server – Maps To view the “Maps – Selected Level workspace” on page347 for the server.
Selected Server – Shards To view the “Shards – Selected Level workspace” onpage 351 for the server.
Accessing the Containers workspace
To access the workspace, complete the following steps:v Within the Navigator, expand Windows Systems, Linux Systems, z/OS Systems,
or UNIX Systems, as appropriate for the node you are monitoring.v Within the node list, expand the entry that corresponds to the server node.v Within that node list of monitored applications, expand the WebSphere agent.v Under the WebSphere agent, expand WebSphere XS Zone.v Under the WebSphere XS Zone, expand the Extreme Scale zone node of your
choice.v Under the Extreme Scale zone node of your choice, select the Containers node.
Selected Containers workspaceThis workspace shows the statistics for a Grid container (server) JVM runningwithin a monitored Extreme Scale zone node.
This workspace displays data provided by the “Extreme Scale Servers attributes”on page 358,“Extreme Scale Grids attributes” on page 360, and “Extreme ScaleThread Pools attributes” on page 368.
The predefined workspace contains the following items:v JVM Memory History graph, displaying the history and real-time value for the
free and used JVM memory on the server. Only available for WebSphereExtreme Scale 7.1.
v Maps Memory History graph, displaying the history and real-time value for theestimated memory used by every map running on the server. This value
Chapter 3. ITCAM Agent for WebSphere Applications 339

includes only the memory that every map uses on this server, and not on otherservers. Only available for WebSphere Extreme Scale 7.1.
v Transaction Times history graph, which shows the average transaction timehistory and real-time value for the server.
v Threads Activity history graph, which shows the active thread count andmaximum thread pool size history and real-time values for the server. Onlyavailable for WebSphere Extreme Scale 7.1.
v Server Summary table, displaying the attributes and statistics for the server.
To view detailed statistics for the server, select any item in table or the graphs,right click, and select one of the following links:v Selected Server – Transactions To see the “Transactions – Selected Level
workspace” on page 342 workspace for the server.v Selected Server – Maps To see the “Maps – Selected Level workspace” on page
347 workspace for the server.v Selected Server – Shards To see the “Shards – Selected Level workspace” on
page 351 workspace for the server.
Accessing the Selected Containers workspace
To access the workspace, complete the following steps:v Within the Navigator, expand Windows Systems, Linux Systems, z/OS Systems,
or UNIX Systems, as appropriate for the node you are monitoring.v Within the node list, expand the entry that corresponds to the server node.v Within that node list of monitored applications, expand the WebSphere agent.v Under the WebSphere agent, expand WebSphere XS Zone.v Under the WebSphere XS Zone, expand the Extreme Scale zone node of your
choice.v Under the Extreme Scale zone node of your choice, select the Containers node.v In the “Containers workspace” on page 338, select a server in a table or bar
chart, right click, and select Selected Server.
Grids workspaceThis workspace shows the statistics for the Grids running within a monitoredExtreme Scale zone node.
This workspace displays data provided by the “Extreme Scale Placementsattributes” on page 367.
The predefined workspace contains the following items:v Situation Event Console, which shows the event log for all grid-related Extreme
Scale events for this zone node.v Outstanding Work Items History graph, displaying the history and current
values for the number of outstanding work items (that is, requests that have notyet been completed) for every grid within the zone node.
v Active Containers History graph, displaying the history and current values forthe number of active containers (JVM server processes) for every grid within thezone node.
v Grids Summary table, displaying the attributes and statistics for everycombination of grid and map set in the zone node.
To view detailed statistics for any grid, use the following links from the GridsSummary table and from the graphs:
340 ITCAM Agents for WebSphere Applications, J2EE, and HTTP Servers: User Guide

Selected Grid – Transactions To view the “Transactions – Selected Levelworkspace” on page 342 for the grid.
Selected Grid – Maps To view the “Maps – Selected Level workspace” on page347 for the grid.
Selected Grid – Shards To view the “Shards – Selected Level workspace” on page351 for the grid.
Accessing the Grids workspace
To access the workspace, complete the following steps:v Within the Navigator, expand Windows Systems, Linux Systems, z/OS Systems,
or UNIX Systems, as appropriate for the node you are monitoring.v Within the node list, expand the entry that corresponds to the server node.v Within that node list of monitored applications, expand the WebSphere agent.v Under the WebSphere agent, expand WebSphere XS Zone.v Under the WebSphere XS Zone, expand the Extreme Scale zone node of your
choice.v Under the Extreme Scale zone node of your choice, select the Grids node.
Transactions workspaceThis workspace shows information on grid and server transaction rates andtransaction response times in a monitored Extreme Scale zone node. Theinformation is aggregated on the grid level (aggregated across servers) and on theserver level.
This workspace displays data provided by the “Extreme Scale Grids attributes” onpage 360.
The predefined workspace contains the following items:v Situation Event Console, which shows the event log for all transaction-related
Extreme Scale events for the zone node.v Transaction Times History: Grids graph, displaying the history and real-time
values for average transaction times for every grid in the zone node.v Transaction Rates History: Grids graph, displaying the history and real-time
values for average transaction rates for every grid in the zone node.v Longest Transaction Times: by Server bar chart, displaying the servers with the
highest average transaction time values for this zone node. In this table, you cansee the specific server JVMs that have, or recently had, the longest transactiontimes.
v Highest Transaction Rates: by Server bar chart, displaying the servers with thehighest transaction rate values for this zone node. In this table, you can see thespecific server JVMs that have, or recently had, the highest transaction rates.
To view detailed transaction statistics for a grid, select the grid in the TransactionTimes History: Grids or the Transaction Rates History: Grids graph. Then rightclick and select Selected Grid – Transactions. The system displays the“Transactions – Selected Level workspace” on page 342 for the grid.
To view detailed transaction statistics for a server, select the server in the LongestTransaction Times: by Server or the Highest Transaction Rates: by Server bar
Chapter 3. ITCAM Agent for WebSphere Applications 341

chart. Then right click and select Selected Server – Transactions. The systemdisplays “Transactions – Selected Level workspace” for the server.
To view container details for a server, select the server in the Longest TransactionTimes: by Server or the Highest Transaction Rates: by Server bar chart. Thenright click and select Selected Server – Containers. The system displays the“Selected Containers workspace” on page 339 for the server.
Accessing the Transactions workspace
To access the workspace, complete the following steps:v Within the Navigator, expand Windows Systems, Linux Systems, z/OS Systems,
or UNIX Systems, as appropriate for the node you are monitoring.v Within the node list, expand the entry that corresponds to the server node.v Within that node list of monitored applications, expand the WebSphere agent.v Under the WebSphere agent, expand WebSphere XS Zone.v Under the WebSphere XS Zone, expand the Extreme Scale zone node of your
choice.v Under the Extreme Scale zone node of your choice, select the Transactions node.
Transactions – Selected Level workspaceThis workspace shows information about transaction rates and transactionresponse times in a selected server, grid, or map set within the monitored ExtremeScale environment.
This workspace displays data provided by the “Extreme Scale Grids attributes” onpage 360.
The exact content of the workspace depends on whether it is invoked for a server,grid, or map set.
Transactions – Selected Grid
This workspace contains transaction data for a grid, aggregated from all servers.
The predefined workspace contains the following items:v Transactions Summary table, which shows the attributes and statistics for map
sets available in the grid.v Transaction Rates History graph, displaying the history and real-time values for
average transaction rates for every map set in the grid.v Transaction Times History graph, displaying the history and real-time values for
average transaction times for every map set in the grid.v Highest Transaction Rates bar chart, displaying the transaction rate on servers
that have, or recently had, the highest transaction rates.v Longest Transaction Times bar chart, displaying the transaction time on servers
that have, or recently had, the longest transaction times.
To view detailed transaction statistics for a map set, select the map set in theTransactions Summary table or in the Transaction Rates History or theTransaction Times History graph. Then right click and select Selected Map Set –Transactions. The system displays the “Transactions – Selected Level workspace”for the map set.
342 ITCAM Agents for WebSphere Applications, J2EE, and HTTP Servers: User Guide

To view detailed transaction statistics for a server, select the server in the HighestTransaction Rates or the Longest Transaction Times bar chart. Then right clickand select Selected Server – Transactions. The system displays the “Transactions –Selected Level workspace” on page 342 for the server.
To view container details for a server, select the server in the Highest TransactionRates or the Longest Transaction Times bar chart. Then right click and selectSelected Server – Containers. The system displays the “Selected Containersworkspace” on page 339 for the server.
To view map information for the same grid, select any row in the TransactionsSummary table. Then right click and select Selected Level – Maps. The systemdisplays the “Maps – Selected Level workspace” on page 347 for the grid.
To view shard information for the same grid, select any row in the TransactionsSummary table. Then right click and select Selected Level – Shards. The systemdisplays the “Shards – Selected Level workspace” on page 351 for the grid.
Transactions – Selected Server
This workspace contains transaction data for a single server.
The predefined workspace contains the following items:v Transactions Summary table, which shows the attributes and summary
transaction statistics for map sets available in the server.v Transaction Rates History graph, displaying the history and real-time values for
average transaction rates for every map set on the server.v Transaction Times History graph, displaying the history and real-time values for
average transaction times for every map set on the server.v Highest Transaction Rates bar chart, displaying the transaction rate on shards
that have, or recently had, the highest transaction rates.v Longest Transaction Times bar chart, displaying the transaction time on shards
that have, or recently had, the longest transaction times.
To view detailed transaction statistics for a map set, select the map set in theTransactions Summary table or in the Transaction Rates History or theTransaction Times History graph. Then right click and select Selected Map Set –Transactions. The system displays the “Transactions – Selected Level workspace”on page 342 for the map set.
To view detailed transaction statistics for a shard, select the shard in the HighestTransaction Rates or the Longest Transaction Times bar chart. Then right clickand select Selected Partition – Transactions. The system displays the “Transactions– Selected Partition workspace” on page 345 for the partition corresponding to theshard.
To view container details for the server, select any shard in the HighestTransaction Rates or Longest Transaction Times bar chart. Then right click andselect Selected Server – Containers. The system displays the “Selected Containersworkspace” on page 339 for the server.
To view map information for the same server, select any row in the TransactionsSummary table. Then right click and select Selected Level – Maps. The systemdisplays the “Maps – Selected Level workspace” on page 347 for the server.
Chapter 3. ITCAM Agent for WebSphere Applications 343

To view shard information for the same server, select any row in the TransactionsSummary table. Then right click and select Selected Level – Shards. The systemdisplays the “Shards – Selected Level workspace” on page 351 for the server.
Transactions – Selected Map Set
This workspace displays transaction data for a map set aggregated among allservers (if called from a Selected Grid workspace) or on one server (if called from aSelected Server workspace).
The predefined workspace contains the following items:v Transactions Summary table, which shows the attributes and summary
transaction statistics for the map set. This table has one row.v Transaction Rates History graph, displaying the history and real-time value for
the average transaction rate for the map set.v Transaction Times History graph, displaying the history and real-time value for
average transaction time for the map set.v Highest Transaction Rates bar chart, displaying the transaction rate for the
shards that have, or recently had, the highest transaction rates.v Longest Transaction Times bar chart, displaying the transaction time for the
shards that have, or recently had, the longest transaction times.
To view detailed transaction statistics for a shard, select the shard in the HighestTransaction Rates or the Longest Transaction Times bar chart. Then right clickand select Selected Partition – Transactions. The system displays the “Transactions– Selected Partition workspace” on page 345 for the partition corresponding to theshard.
To view container details for the server running a shard, select the shard in theHighest Transaction Rates or the Longest Transaction Times bar chart. Then rightclick and select Selected Server – Containers. The system displays the “SelectedContainers workspace” on page 339 for the server.
To view shard information for the same map set, select the row in the TransactionsSummary table. Then right click and select Selected Level – Shards. The systemdisplays the “Shards – Selected Level workspace” on page 351 for the map set.
Accessing the Transactions – Selected Level workspace
To access the workspace, complete the following steps:v Within the Navigator, expand Windows Systems, Linux Systems, z/OS Systems,
or UNIX Systems, as appropriate for the node you are monitoring.v Within the node list, expand the entry that corresponds to the server node.v Within that node list of monitored applications, expand the WebSphere agent.v Under the WebSphere agent, expand WebSphere XS Zone.v Under the WebSphere XS Zone, expand the Extreme Scale zone node of your
choice.v Under the Extreme Scale zone node of your choice, select the Transactions node.v Complete one of the following steps:
– To view the Transactions – Selected Level workspace for a grid, select thegrid in the Transaction Times History: Grids or the Transaction RatesHistory: Grids graph. Then right click and select Selected Grid –Transactions.
344 ITCAM Agents for WebSphere Applications, J2EE, and HTTP Servers: User Guide

– To view the Transactions – Selected Level workspace for a server, select theserver in the Longest Transaction Times: by Server or the HighestTransaction Rates: by Server bar chart. Then right click and select SelectedServer – Transactions
v To view the Transactions – Selected Level workspace for a map set, view it fora grid or server as described in the previous step. Then, select the map set in theTransactions Summary table, right click, and select Selected Map Set –Transactions.
Transactions – Selected Partition workspaceThis workspace shows information about transaction rates and transactionresponse times in a selected partition within the monitored Extreme Scaleenvironment.
This workspace displays data provided by the “Extreme Scale Grids attributes” onpage 360.
The predefined workspace contains the following items:v Transactions Summary table, which shows the attributes and summary
transaction statistics for the partition shards, that is, the shards that belonged tothe partition within the history time span for the workspace (by default, the last2 hours).
v Transaction Rates History graph, displaying the history and real-time values foraverage transaction rates for the partition shards.
v Transaction Times History graph, displaying the history and real-time values foraverage transaction times for the partition shards.
To view container details for the server running a shard, select the shard in theTransactions Summary table. Then right click and select Selected Server –Containers. The system displays the “Selected Containers workspace” on page 339for the server.
To view map information for the same partition, select any row in the TransactionsSummary table. Then right click and select Selected Level – Maps. The systemdisplays the “Maps – Selected Partition workspace” on page 349 for the partition.
To view shard information for the same partition, select any row in theTransactions Summary table. Then right click and select Selected Level – Shards.The system displays the “Shards – Selected Partition workspace” on page 354 forthe partition.
Accessing the Transactions – Selected Partition workspace
To access the workspace, complete the following steps:v Within the Navigator, expand Windows Systems, Linux Systems, z/OS Systems,
or UNIX Systems, as appropriate for the node you are monitoring.v Within the node list, expand the entry that corresponds to the server node.v Within that node list of monitored applications, expand the WebSphere agent.v Under the WebSphere agent, expand WebSphere XS Zone.v Under the WebSphere XS Zone, expand the Extreme Scale zone node of your
choice.v Under the Extreme Scale zone node of your choice, select the Transactions node.
Chapter 3. ITCAM Agent for WebSphere Applications 345

v Select a server in the Longest Transaction Times: by Server or the HighestTransaction Rates: by Server bar chart. Then right click and select SelectedServer – Transactions.
v Select a shard in the Highest Transaction Rates or the Longest TransactionTimes bar chart. Then right click and select Selected Partition – Transactions.
Maps workspaceThis workspace shows information about map counts and map hit rates in amonitored Extreme Scale zone node. The information is aggregated on the grid andserver levels.
This workspace displays data provided by the “Extreme Scale Map attributes” onpage 362.
The predefined workspace contains the following items:v Situation Event Console, which shows the event log for all map-related Extreme
Scale events for this zone node.v Hit Rates History: Grids graph, displaying the history and real-time values for
average map hit rates for every grid in the zone node.v Map Counts History: Grids graph, displaying the history and real-time values
for map counts for every grid in the zone node.v Lowest Hit Rates: by Server bar chart, displaying hit rate for the server JVMs
that have, or recently had, the lowest hit rates.v Highest Map Counts: by Server bar chart, displaying the map count for the
server JVMs that have, or recently had, the highest map counts.
To view detailed map statistics for a grid, select the grid in the Hit Rates History:Grids or the Map Counts History: Grids graph. Then right click and selectSelected Grid – Maps. The system displays the “Maps – Selected Levelworkspace” on page 347 for the grid.
To view detailed map statistics for a server, select the server in the Lowest HitRates: by Server or the Highest Map Counts: by Server bar chart. Then right clickand select Selected Server – Maps. The system displays the “Maps – SelectedLevel workspace” on page 347 for the server.
To view container details for a server, select the server in the Lowest Hit Rates: byServer or the Highest Map Counts: by Server bar chart. Then right click andselect Selected Server – Containers. The system displays the “Selected Containersworkspace” on page 339 for the server.
Accessing the Maps workspace
To access the workspace, complete the following steps:v Within the Navigator, expand Windows Systems, Linux Systems, z/OS Systems,
or UNIX Systems, as appropriate for the node you are monitoring.v Within the node list, expand the entry that corresponds to the server node.v Within that node list of monitored applications, expand the WebSphere agent.v Under the WebSphere agent, expand WebSphere XS Zone.v Under the WebSphere XS Zone, expand the Extreme Scale zone node of your
choice.v Under the Extreme Scale zone node of your choice, select the Maps node.
346 ITCAM Agents for WebSphere Applications, J2EE, and HTTP Servers: User Guide

Maps – Selected Level workspaceThis workspace shows information about map counts and hit rates in a selectedserver, grid, or map set within the monitored Extreme Scale environment.
This workspace displays data provided by the “Extreme Scale Map attributes” onpage 362.
The exact content of the workspace depends on whether it is invoked for a server,grid, or map set.
Maps – Selected Grid
This workspace contains map data for a grid, aggregated from all servers.
The predefined workspace contains the following items:v Maps Summary table, which shows the attributes and statistics for maps
available in the grid.v Hit Rates History graph, displaying the history and real-time values of the map
hit rate for every map in the grid.v Map Counts History graph, displaying the history and real-time values of the
map count for every map in the grid.v Lowest Hit Rates bar chart, displaying the hit rate for the server JVMs that have,
or recently had, the lowest hit rates.v Highest Map Counts bar chart, displaying the map count for the server JVMs
that have, or recently had, the highest map counts.
To view detailed map statistics for a map, select the map in the Maps Summarytable or in the Hit Rates History or the Map Counts History graph. Then rightclick and select Selected Map – Maps. The system displays the“Maps – SelectedLevel workspace” for the map.
To view detailed map statistics for a server, select the server in the Lowest HitRates or the Highest Map Counts bar chart. Then right click and select SelectedServer – Maps. The system displays the “Maps – Selected Level workspace” forthe server.
To view container details for a server, select the server in the Lowest Hit Rates orthe Highest Map Counts bar chart. Then right click and select Selected Server –Containers. The system displays the “Selected Containers workspace” on page 339for the server.
To view transaction information for the same grid, select any row in the MapsSummary table. Then right click and select Selected Level – Transactions. Thesystem displays the “Transactions – Selected Level workspace” on page 342 for thegrid.
To view shard information for the same grid, select any row in the Selected Mapstable. Then right click and select Selected Level – Shards. The system displays the“Shards – Selected Level workspace” on page 351 for the grid.
Maps – Selected Server
This workspace contains map data for a single server.
The predefined workspace contains the following items:
Chapter 3. ITCAM Agent for WebSphere Applications 347

v Maps Summary table, which shows the attributes and statistics for mapsavailable on the server.
v Hit Rates History graph, displaying the history and real-time values of the maphit rate for every map on the server.
v Map Counts History graph, displaying the history and real-time values of themap count for every map on the server.
v Lowest Hit Rates bar chart, displaying the hit rate for the shards on this serverthat have, or recently had, the lowest map hit rates.
v Highest Map Counts bar chart, displaying map count for the shards on thisserver that have, or recently had, the highest map counts.
To view detailed map statistics for a map, select the map in the Maps Summarytable or in the Hit Rates History or the Map Counts History graph. Then rightclick and select Selected Map – Maps. The system displays the“Maps – SelectedLevel workspace” on page 347 for the map.
To view detailed map statistics for a shard, select the shard in the Lowest HitRates or the Highest Map Counts bar chart. Then right click and select SelectedPartition – Maps. The system displays the “Maps – Selected Partition workspace”on page 349 for the partition corresponding to the shard.
To view container details for the server, select any shard in the Lowest Hit Ratesor the Highest Map Counts bar chart. Then right click and select Selected Server –Containers. The system displays the “Selected Containers workspace” on page 339for the server.
To view transaction information for the same server, select any row in the MapsSummary table. Then right click and select Selected Level – Transactions. Thesystem displays the “Transactions – Selected Level workspace” on page 342 for theserver.
To view shard information for the same server, select any row in the MapsSummary table. Then right click and select Selected Level – Shards. The systemdisplays the “Shards – Selected Level workspace” on page 351 for the server.
Maps – Selected Map
This workspace displays map data for a map aggregated among all servers (ifcalled from a Selected Grid workspace) or on one server (if called from a SelectedServer workspace).
The predefined workspace contains the following items:v Maps Summary table, which shows the attributes and statistics for the map. This
table has one row.v Hit Rates History graph, displaying the history and real-time value of the map
hit rate for the map.v Map Counts History graph, displaying the history and real-time value of the
map count for the map.v Lowest Hit Rates bar chart, displaying the hit rate for the shards that have, or
recently had, the lowest map hit rates.v Highest Map Counts bar chart, displaying the map count for the shards that
have, or recently had, the highest map counts.
348 ITCAM Agents for WebSphere Applications, J2EE, and HTTP Servers: User Guide

To view detailed map statistics for a shard, select the shard in the Lowest HitRates or the Highest Map Counts bar chart. Then right click, and select SelectedPartition – Maps. The system displays the “Maps – Selected Partition workspace”for the partition corresponding to the shard.
To view container details for the server running a shard, select the shard in theLowest Hit Rates or the Highest Map Counts bar chart. Then right click and selectSelected Server – Containers. The system displays the “Selected Containersworkspace” on page 339 for the server.
Accessing the Maps – Selected Level workspace
To access the workspace, complete the following steps:v Within the Navigator, expand Windows Systems, Linux Systems, z/OS Systems,
or UNIX Systems, as appropriate for the node you are monitoring.v Within the node list, expand the entry that corresponds to the server node.v Within that node list of monitored applications, expand the WebSphere agent.v Under the WebSphere agent, expand WebSphere XS Zone.v Under the WebSphere XS Zone, expand the Extreme Scale zone node of your
choice.v Under the Extreme Scale zone node of your choice, select the Maps node.v Perform one of the following steps:
– To view the Maps – Selected Level workspace for a grid, select the grid in theHit Rates History: Grids or the Map Counts History: Grids graph. Themright click and select Selected Grid – Maps.
– To view the Maps – Selected Level workspace for a server, select the server inthe Lowest Hit Rates: by Server or the Highest Map Counts: by Server barchart. Then right click and select Selected Server – Maps.
v To view the Maps – Selected Level workspace for a map, view it for a grid orserver as described in the previous step. Then, select the map in the MapsSummary table, right click, and select Selected Map – Maps.
Maps – Selected Partition workspaceThis workspace shows information about map counts and hit rates in a selectedpartition within the monitored Extreme Scale environment.
This workspace displays data provided by the “Extreme Scale Map attributes” onpage 362.
The predefined workspace contains the following items:v Maps Summary table, which shows the attributes and summary map statistics
for the partition shards, that is, the shards that belonged to the partition withinthe history time span for the workspace (by default, the last 2 hours).
v Hit Rates History graph, displaying the history and real-time value of the maphit rate for the partition shards.
v Map Counts History graph, displaying the history and real-time value of themap count for the partition shards.
v Batch Update Times History graph, displaying the history and real-time value ofthe batch update time for the partition shards.
v Used Memory History graph, displaying the history and real-time amount of theJVM memory used by the partition shards.
Chapter 3. ITCAM Agent for WebSphere Applications 349

To view container details for the server running a shard, select the shard in theMaps Summary table. Then right click and select Selected Server – Containers.The system displays the “Selected Containers workspace” on page 339 for theserver.
To view transaction information for the same partition, select any row in the MapsSummary table. Then right click and select Selected Level – Transactions. Thesystem displays the “Transactions – Selected Level workspace” on page 342 for thepartition.
To view shard information for the same partition, select any row in the SelectedMaps table. Then right click and select Selected Level – Shards. The systemdisplays the “Shards – Selected Partition workspace” on page 354 for the partition.
Accessing the Maps – Selected Partition workspace
To access the workspace, complete the following steps:v Within the Navigator, expand Windows Systems, Linux Systems, z/OS Systems,
or UNIX Systems, as appropriate for the node you are monitoring.v Within the node list, expand the entry that corresponds to the server node.v Within that node list of monitored applications, expand the WebSphere agent.v Under the WebSphere agent, expand WebSphere XS Zone.v Under the WebSphere XS Zone, expand the Extreme Scale zone node of your
choice.v Under the Extreme Scale zone node of your choice, select the Maps node.v Select a server in the Lowest Hit Rates: by Server or the Highest Map Counts:
by Server bar chart. Then right click and select Selected Server – Maps.v Select a shard in the Lowest Hit Rates or the Highest Map Counts bar chart.
Then right click and select Selected Partition – Maps.
Shards workspaceThis workspace shows information about shard request rates and active requestcounts in a monitored Extreme Scale zone node. The information is aggregated onthe grid and server levels.
This workspace displays data provided by the “Extreme Scale Shards attributes”on page 365.
The predefined workspace contains the following items:v Situation Event Console, which shows the event log for all shard-related Extreme
Scale events for this zone node.v Request Rates History: Grids graph, displaying the history and real-time values
for average shard request rates for every grid in the zone node.v Active Requests History: Grids graph, displaying the history and real-time
values for average shard active requests count for every grid in the zone node.v Highest Request Rates: by Server bar chart, displaying the average shard request
rates for the server JVMs that have, or recently had, the highest shard requestrates.
v Highest Active Requests: by Server bar chart, displaying the average shardactive request counts for the server JVMs that have, or recently had, the highestshard active request counts.
350 ITCAM Agents for WebSphere Applications, J2EE, and HTTP Servers: User Guide

To view detailed shard statistics for a grid, select the grid in the Request RatesHistory: Grids or the Active Requests History: Grids graph. Then right click andselect Selected Grid – Shards. The system displays the “Shards – Selected Levelworkspace” for the grid.
To view detailed shard statistics for a server, select the server in the HighestRequest Rates: by Server or the Highest Active Requests: by Server bar chart.Then right click and select Selected Server – Shards. The system displays the“Shards – Selected Level workspace” for the server.
Accessing the Shards workspace
To access the workspace, complete the following steps:v Within the Navigator, expand Windows Systems, Linux Systems, z/OS Systems,
or UNIX Systems, as appropriate for the node you are monitoring.v Within the node list, expand the entry that corresponds to the server node.v Within that node list of monitored applications, expand the WebSphere agent.v Under the WebSphere agent, expand WebSphere XS Zone.v Under the WebSphere XS Zone, expand the Extreme Scale zone node of your
choice.v Under the Extreme Scale zone node of your choice, select the Shards node.
Shards – Selected Level workspaceThis workspace shows information about shard request rates and active requestcounts in a selected server, grid, or map set within the monitored Extreme Scaleenvironment.
This workspace displays data provided by the “Extreme Scale Shards attributes”on page 365.
The exact content of the workspace depends on whether it is invoked for a server,grid, or map set.
Shards – Selected Grid
This workspace contains shard data for a grid, aggregated from all servers.
The predefined workspace contains the following items:v Shards Summary table, which shows the attributes and summary shard statistics
for map sets available in the grid.v Request Rates History graph, displaying the history and real-time values for
average shard request rates for every map set in the grid.v Active Requests History graph, displaying the history and real-time values for
average shard active requests count for every map set in the grid.v Highest Request Rates bar chart, displaying the shard request rate for the server
JVMs that have, or recently had, the highest shard request rates.v Highest Active Requests bar chart, displaying the shard active request count for
the server JVMs that have, or recently had, the highest shard active requestcounts.
Chapter 3. ITCAM Agent for WebSphere Applications 351

To view detailed shard statistics for a map set, select the map set in the ShardsSummary table or in the Request Rates History or Active Requests History graph.Then select Selected Map Set – Shards. The system displays the“Shards – SelectedLevel workspace” on page 351 for the map.
To view detailed shard statistics for a server, select the server in the HighestRequest Rates or the Highest Active Requests bar chart. Then right click andselect Selected Server – Shards . The system displays the “Shards – Selected Levelworkspace” on page 351 for the server.
To view container details for a server, select the server in the Highest RequestRates or the Highest Active Requests bar chart. Then right click and selectSelected Server – Containers. The system displays the “Selected Containersworkspace” on page 339 for the server.
To view transaction information for the same grid, select any row in the ShardsSummary table. Then right click and select Selected Level – Transactions. Thesystem displays the “Transactions – Selected Level workspace” on page 342 for thegrid.
To view map information for the same grid, select any row in the ShardsSummary table. Then right click and select Selected Level – Maps. The systemdisplays the “Maps – Selected Level workspace” on page 347 for the grid.
Shards – Selected Server
This workspace contains shard data for a single server.
The predefined workspace contains the following items:v Shards Summary table, which shows the attributes and summary shard statistics
for map sets available on the server.v Request Rates History graph, displaying the history and real-time values for
average shard request rates for every map set on the server.v Active Requests History graph, displaying the history and real-time values for
average shard active requests count for every map set on the server.v Highest Request Rates bar chart, displaying the request rate for the shards that
have, or recently had, the highest request rates.v Highest Active Requests bar chart, displaying the active request count for the
shards that have, or recently had, the highest shard active request counts.
To view detailed shard statistics for a map set, select the map set in the ShardsSummary table or in the Request Rates History or the Active Requests Historygraph. Then right click and select Selected Map Set – Shards. The system displaysthe“Shards – Selected Level workspace” on page 351 for the map.
To view detailed shard statistics for a shard, select the shard in the HighestRequest Rates or the Highest Active Requests bar chart. Then right click andselect Selected Partition – Shards. The system displays the “Shards – SelectedPartition workspace” on page 354 for the partition corresponding to the shard.
To view container details for the server, select any shard in the Highest RequestRates or the Highest Active Requests bar chart. Then right click and selectSelected Server – Containers. The system displays the “Selected Containersworkspace” on page 339 for the server.
352 ITCAM Agents for WebSphere Applications, J2EE, and HTTP Servers: User Guide

To view transaction information for the same server, select any row in the ShardsSummary table. Then right click and select Selected Level – Transactions. Thesystem displays the “Transactions – Selected Level workspace” on page 342 for theserver.
To view map information for the same server, select any row in the ShardsSummary table. Then right click and select Selected Level – Maps. The systemdisplays the “Maps – Selected Level workspace” on page 347 for the server.
Shards – Selected Map Set
This workspace displays shard data for a map set aggregated among all servers (ifcalled from a Selected Grid workspace) or on one server (if called from a SelectedServer workspace).
The predefined workspace contains the following items:v Shards Summary table, which shows the attributes and summary shard statistics
for the map set. This table has one row.v Request Rates History graph, displaying the history and real-time value for
average shard request rates for this map set.v Active Requests History graph, displaying the history and real-time value for
average shard active requests count for this map set.v Highest Request Rates bar chart, displaying the request rate for the shards in
this map set that have, or recently had, the highest request rates.v Highest Active Requests bar chart, displaying the active request counts for the
shards in this map set that have, or recently had, the highest shard activerequest counts.
To view detailed shard statistics for a shard, select the shard in the HighestRequest Rates or the Highest Active Requests bar chart. Then right click andselect Selected Partition – Shards. The system displays the “Shards – SelectedPartition workspace” on page 354 for the partition corresponding to the shard.
To view container details for the server running a shard, select the shard in theHighest Request Rates or the Highest Active Requests bar chart. Then right clickand select Selected Server – Containers. The system displays the “SelectedContainers workspace” on page 339 for the server.
To view transaction information for the same map set, select the row in the ShardsSummary table. Then right click and select Selected Level – Transactions. Thesystem displays the “Transactions – Selected Level workspace” on page 342 for themap set.
Accessing the Shards – Selected Level workspace
To access the workspace, complete the following steps:v Within the Navigator, expand Windows Systems, Linux Systems, z/OS Systems,
or UNIX Systems, as appropriate for the node you are monitoring.v Within the node list, expand the entry that corresponds to the server node.v Within that node list of monitored applications, expand the WebSphere agent.v Under the WebSphere agent, expand WebSphere XS Zone.v Under the WebSphere XS Zone, expand the Extreme Scale zone node of your
choice.
Chapter 3. ITCAM Agent for WebSphere Applications 353

v Under the Extreme Scale zone node of your choice, select the Shards node.v Perform one of the following steps:
– To view the Shards – Selected Level workspace for a grid, select the grid inthe Request Rates History: Grids or the Active Requests History: Gridsgraph. Then right click and select Selected Grid – Shards.
– To view the Shards – Selected Level workspace for a server, select the serverin the Highest Request Rates: by Server or the Highest Active Requests: byServer bar chart. Then right click and select Selected Server – Shards.
v To view the Shards – Selected Level workspace for a map set, view it for a gridor server as described in the previous step. Then, select the map set in theShards Summary table, right click, and select Selected Map Set – Shards.
Shards – Selected Partition workspaceThis workspace shows information about shard request rates and active requestcounts in a selected partition within the monitored Extreme Scale environment.
This workspace displays data provided by the “Extreme Scale Shards attributes”on page 365.
The predefined workspace contains the following items:v Shards Summary table, which shows the attributes and summary shard statistics
for the partition shards, that is, the shards that belonged to the partition withinthe history time span for the workspace (by default, the last 2 hours)..
v Request Rates History graph, displaying the history and real-time value forrequest rates for the partition shards.
v Active Requests History graph, displaying the history and real-time value foractive requests count for the partition shards.
v Forwarded Requests History graph, displaying the history and real-time valuefor forwarded requests count for the partition shards.
To view container details for the server running a shard, select the shard in theShards Summary table. Then right click and select Selected Server – Containers.The system displays the “Selected Containers workspace” on page 339 for theserver.
To view transaction information for the same partition, select the row in theShards Summary table. Then right click and select Selected Level – Transactions.The system displays the “Transactions – Selected Level workspace” on page 342 forthe partition.
To view map information for the same partition, select the row in the ShardsSummary table. Then right click and select Selected Level – Maps. The systemdisplays the “Maps – Selected Partition workspace” on page 349 for the partition.
Accessing the Shards – Selected Partition workspace
To access the workspace, complete the following steps:v Within the Navigator, expand Windows Systems, Linux Systems, z/OS Systems,
or UNIX Systems, as appropriate for the node you are monitoring.v Within the node list, expand the entry that corresponds to the server node.v Within that node list of monitored applications, expand the WebSphere agent.v Under the WebSphere agent, expand WebSphere XS Zone.
354 ITCAM Agents for WebSphere Applications, J2EE, and HTTP Servers: User Guide

v Under the WebSphere XS Zone, expand the Extreme Scale zone node of yourchoice.
v Under the Extreme Scale zone node of your choice, select the Shards node.v Select a server in the Highest Request Rates: by Server or the Highest Active
Requests: by Server bar chart. Then right click and select Selected Server –Shards.
v Select a shard in the Highest Request Rates or the Highest Active Requests barchart. Then right click and select Selected Partition – Shards.
WebSphere Extreme Scale AttributesIBM Tivoli Composite Application Manager Agent for WebSphere Applicationsuses several attribute groups to store data for WebSphere Extreme Scalemonitoring.
Extreme Scale Catalog attributesThe Extreme Scale Catalog attributes provide information about the catalog servicefor the WebSphere Extreme Scale grid.
The attributes within this group are used to build the “Catalogs workspace” onpage 338.
Origin Node The server name subnode. The valid format is an alphanumericstring, with a maximum of 32 characters.
Sample Date and Time The date and time at which the agent has collected thisdata. The valid format is a 16-character timestamp. For the STR and SCANfunctions, the format is MM/DD/YY HH:MM:SS; the following table shows thevalues contained in this character string:
Table 69. Format of the 16-character timestamp
Character String Meaning
MM Month
DD Day
YY Year
HH Hour
MM Minute
SS Second
Interval Time The length of the sample interval in seconds. The valid format is apositive integer.
Server Name The name of the catalog service. The valid format is an alphanumericstring, with a maximum of 48 characters.
Host Name The host name where the catalog service is running. The valid formatis an alphanumeric string, with a maximum of 32 characters.
JMX URL The URL for the catalog service JMX connection. The valid format is analphanumeric string, with a maximum of 192 characters.
Grid Servers The combined number of grid processes (catalog services andcontainer servers) running in the grid. The valid format is a positive integer. For
Chapter 3. ITCAM Agent for WebSphere Applications 355

WebSphere Extreme Scale 7.1 this attribute is collected from the server; forWebSphere Extreme Scale 6.1 and 7.0, the Agent calculates the value by trackingactive catalog services in the grid.
Heart Beat Frequency Level The heart beat frequency level, as reported by theWebSphere Extreme Scale MBean. For WebSphere Extreme Scale 6.1 and 7.0, thevalid values are TYPICAL,RELAXED and AGGRESSIVE. This information is not availablefor WebSphere Extreme Scale 7.1; for this version the value is always LEVEL_OFF.
Active Catalogs The number of active catalog service processes monitored in thegrid, reported by WebSphere Extreme Scale 7.1 MBean or calculated by agent forback-level versions. The valid format is a positive integer. For WebSphere ExtremeScale 7.1 this attribute is collected from the server; for WebSphere Extreme Scale 6.1and 7.0, the Agent calculates the value.
Quorum Catalogs The number of quorum catalog service processes monitored inthe grid. The valid format is a positive integer. This information is only availablefor WebSphere Extreme Scale 7.1. In WebSphere Extreme Scale 6.1 and 7.0, ignorethis value as the WebSphere Extreme Scale MBean does not provide the data.
Is Primary Whether this is the primary catalog service for workspace reports andsituation formula checks. The valid values are YES and NO. The agent discovers theprimary catalog service for the grid automatically; the catalog service configured inthe agent might not be the primary service.
Attention: For WebSphere Extreme Scale 6.1, this field is set to YES for therandomly selected catalog service that the agent monitors.
Connection Status Agent connection status for the catalog service. The validvalues are ONLINE and OFFLINE; if the value is OFFLINE, monitoring informationmight not be up to date.
Configuration Status Agent configuration status for the catalog service. The validvalues are:v YES: this is the catalog service configured in the agent, using the “WebSphere
Extreme Scale configuration workspace” on page 334.v NO: this catalog service was automatically discovered via the initially configured
service. The agent discovers all catalog services in the grid node.v ERROR: the catalog service connection is not configured. When a zone node is
created but not yet configured, or configured incorrectly, no monitoring isperformed, but one row is available in the Catalog attributes table withConfiguration Status set to ERROR.
Quorum Status Indicates the quorum status for the catalog service domain. Thevalid values are DISABLE, NORMAL, WAITING ,OVERRIDE, and INCONSISTENT. ForWebSphere Extreme Scale 6.1 and 7.0 this attribute is collected from the server; forWebSphere Extreme Scale 7.1, the Agent calculates the value (DISABLE, NORMAL orWAITING).
Monitored Servers The number of container servers on this catalog service that aremonitored by the agent. This can be less than the total number of servers on thecatalog service; for example, if the catalog service includes servers in multiplezones, but only one zone is configured in the agent, only servers in that zone isincluded in this value. The valid format is a positive integer.
356 ITCAM Agents for WebSphere Applications, J2EE, and HTTP Servers: User Guide

Extreme Scale Containers attributesThe Extreme Scale Containers attributes provide statistics for grid shards runningwithin a Grid Container on a server.
The attributes within this group are not used for any predefined workspace.
Origin Node The server name subnode. The valid format is an alphanumericstring, with a maximum of 128 characters.
Sample Date and Time The date and time at which the agent has collected data.The valid format is a 16-character timestamp. For the STR and SCAN functions,the format is MM/DD/YY HH:MM:SS; the following table shows the valuescontained in this character string:
Table 70. Format of the 16-character timestamp
Character String Meaning
MM Month
DD Day
YY Year
HH Hour
MM Minute
SS Second
Interval Time The length of the sample interval in seconds. The valid format is apositive integer.
Server Name The name of the server. The valid format is an alphanumeric string,with a maximum of 48 characters.
Container Name The name of this Grid Container instance. The valid format is analphanumeric string, with a maximum of 128 characters.
Zone Name The Zone name for this container on this server. The valid format isan alphanumeric string, with a maximum of 128 characters.
Domain Name Domain name of the grid instance within the virtual machine. Thevalid format is an alphanumeric string, with a maximum of 128 characters. Onlyavailable for WebSphere Extreme Scale 7.1.
Core Group The name of core group. The valid format is an alphanumeric string,with a maximum of 32 characters.
Stats Name The name of the map. The valid format is an alphanumeric string,with a maximum of 32 characters.
Active Shard Count The number of active Shards hosted by this containerinstance. The valid format is a positive integer.
Activated Shard Counts The number of Shards activated in this container instanceduring the collection interval. The valid format is a positive integer.
Deactivated Shard Count The number of Shards deactivated in this containerinstance during the collection interval. The valid format is a positive integer.
Chapter 3. ITCAM Agent for WebSphere Applications 357

Stats Level The level of the statistics. The valid values are:v CONTAINER: metrics for a single container.v SERVER: metrics for a single server.v COREGROUP: aggregated metrics for servers in a core group.v ZONE: aggregated metrics for servers in a zone.
Extreme Scale Servers attributesThe Extreme Scale Servers attributes provide statistics for a JVM process that hostsall grid components on a server, or aggregated information for JVM processes onseveral servers.
The attributes within this group are used to build the “WebSphere Extreme ScaleZone Summary workspace” on page 337,“WebSphere Extreme Scale Zoneworkspace” on page 337“Containers workspace” on page 338 and “SelectedContainers workspace” on page 339.
Origin Node The grid zone subnode name. The valid format is an alphanumericstring, with a maximum of 32 characters.
Sample Date and Time The date and time at which the agent has collected data.The valid format is a 16-character timestamp. For the STR and SCAN functions,the format is MM/DD/YY HH:MM:SS; the following table shows the valuescontained in this character string:
Table 71. Format of the 16-character timestamp
Character String Meaning
MM Month
DD Day
YY Year
HH Hour
MM Minute
SS Second
Interval Time The length of the sample interval in seconds. The valid format is apositive integer.
Server Name The server name. The valid format is an alphanumeric string, with amaximum of 48 characters.
Core Group The name of the core group in which the server is running. The validformat is an alphanumeric string, with a maximum of 32 characters.
Host Name The name of the host on which the server runs.The valid format is analphanumeric string, with a maximum of 32 characters.
Zone Name The WebSphere Extreme Scale grid zone name. (This is the nameconfigured in Extreme Scale, even if the agent zone node name is different). Thevalid format is an alphanumeric string, with a maximum of 32 characters.
Available Processors The number of available processors on the server. The validformat is a 4-byte integer.
358 ITCAM Agents for WebSphere Applications, J2EE, and HTTP Servers: User Guide

Free Memory Amount of free memory available on the server JVM process, inmegabytes. The valid format is a decimal (formatted to three decimal places).
Max Memory Amount of max memory available on the server JVM process, inmegabytes. The valid format is a decimal (formatted to three decimal places).
Used Memory Amount of used memory on the server JVM process, in megabytes.The valid format is a decimal (formatted to three decimal places).
Stats Spec Shows which statistics are available for the server. Normally set tostatsSpec=all=enabled, meaning that all statistics are available, The valid format isan alphanumeric string, with a maximum of 256 characters. Only available forWebSphere Extreme Scale 7.1.
Is Safe To Shutdown YES if replicas exists for each primary shard hosted by theserver. The valid values are YES ena NO.
Trace Spec The trace specification for the server, in the format Component = Level= [enable|disable]; for example, *=all=enable - tracing is enabled for allcomponents at all levels. The valid format is an alphanumeric string, with amaximum of 256 characters. Only available for WebSphere Extreme Scale 7.1.
WebSphere Server SubNode If the server is also monitored by ITCAM Agent forWebSphere Applications, and is represented by a node in Tivoli Enterprise Portal,this field contains the agent subnode name for this server. Using this value, youcan link from Extreme Scale workspaces directly into agent workspaces for theserver. The valid format is an alphanumeric string, with a maximum of 32characters.
Heap Used Percent The percentage of used JVM memory. The valid format is adecimal (formatted to one decimal place).
Connection Status The agent status for the Catalog Service connection. The validvalues are ONLINE and OFFLINE.
Is Leader Whether the server is the leader in a core group. The valid values areYES or NO.
Stats Level The level of the statistics. The valid values are:v SERVER: metrics for a single server.v COREGROUP: aggregated metrics for servers in a core group.v ZONE: aggregated metrics for servers in a zone.
Hung Threads Blocked Number of hung threads detected in the BLOCKED state.The valid format is a positive integer.
Hung Threads Blocked Number of hung threads detected in the WAITING state.The valid format is a positive integer.
Hung Threads Blocked Number of hung threads detected in theTIMED_WAITING state. The valid format is a positive integer.
Hung Threads Total Total number of hung threads detected on the server orseveral servers. The valid format is a positive integer.
Chapter 3. ITCAM Agent for WebSphere Applications 359

Extreme Scale Grids attributesThe Extreme Scale Grids attributes provide common statistics for a grid instancerunning on a virtual machine process, or a shard or map set within this grid, oraggregated statistics across all grids in a container. These statistics can also beaggregated from several servers.
The attributes within this group are used to build the “WebSphere Extreme ScaleZone Summary workspace” on page 337, “WebSphere Extreme Scale Zoneworkspace” on page 337 “Selected Containers workspace” on page 339“Transactions workspace” on page 341, “Transactions – Selected Level workspace”on page 342 “Transactions – Selected Partition workspace” on page 345
Origin Node The server name subnode. The valid format is an alphanumericstring, with a maximum of 128 characters.
Sample Date and Time The date and time at which the agent has collected thisdata. The valid format is a 16-character timestamp. For the STR and SCANfunctions, the format is MM/DD/YY HH:MM:SS; the following table shows thevalues contained in this character string:
Table 72. Format of the 16-character timestamp
Character String Meaning
MM Month
DD Day
YY Year
HH Hour
MM Minute
SS Second
Interval Time The length of the sample interval in seconds. The valid format is apositive integer.
Statistics Level The level at which statistics are aggregated in the table. The validvalues are:v SHARD: raw statistics for an individual shardv PARTITION: summary across all shards in a partition. Not used in the current
version.v MAP: summary across all partitions within a map.v MAPSET: summary across all partitions within a map set.v GRID: summary across all map sets within a Grid.v DOMAIN: summary across all Grid Containers within a Grid Domain,
Scope Level The servers from which the statistic information is collected for thetable. The valid values are:v SHARD: statistics from a single shard, on one serverv CONTAINER: statistics from one containerv SERVER: statistics from one serverv COREGROUP: statistics from servers within a core groupv ZONE: statistics from servers within a zone
360 ITCAM Agents for WebSphere Applications, J2EE, and HTTP Servers: User Guide

Grid Name The grid name. The valid format is an alphanumeric string, with amaximum of 32 characters.
Server Name The server name. The valid format is an alphanumeric string, with amaximum of 48 characters.
Core Group Name The core group name. The valid format is an alphanumericstring, with a maximum of 32 characters.
Statistics Name The name of the unit for which the information is aggregated inthis row. For example, if the information is aggregated for a zone, this is the zonename. If the information is aggregated for a map set, this is the map set name, andso on. The valid format is an alphanumeric string, with a maximum of 48characters.
Statistics ID The unique identifier for this statistics row. Used for identifying thestatistic that triggers a situation. The valid format is an alphanumeric string, with amaximum of 96 characters.
Partition ID The partition ID for this Grid Shard, collected for SHARD aggregationlevel only. The valid format is a positive integer.
Summary Level The aggregation level and scope for this row. This fielddetermines the values of the Statistics Level and Statistics Scope fields. The validvalues are:v SHARD: raw statistics for an individual shard. Level is SHARD, Scope is SHARD.v PARTITION: aggregated information for all shards in a partition. Level is
PARTITION, Scope is ZONE
v MAP: aggregated information for a map, on all servers within a zone. Level isMAPSET, Scope is ZONE.
v MAPSET: aggregated information for a map set, on all servers within a zone. Levelis MAPSET, Scope is ZONE.
v GRID: aggregated information for a grid, on all servers within a zone. Level isGRID, Scope is ZONE.
v DOMAIN: aggregated information for a domain, on all servers within a zone. Levelis DOMAIN, Scope is ZONE.
v MAP_SRV: aggregated information for a map, on a single server. Level is MAP,Scope is SERVER.
v MAPSET_SRV: aggregated information for a map set, on a single server. Level isMAPSET, Scope is SERVER.
v GRID_SRV: aggregated information for a grid, on a single server. Level is GRID,Scope is SERVER.
v DOMAIN_SRV: aggregated information for a domain, on a single server. Level isDOMAIN, Scope is SERVER.
v MAP_CG: aggregated information for a map, on all servers within a core group.Level is MAP, Scope is COREGROUP.
v MAPSET_CG: aggregated information for a map set, on all servers within a coregroup. Level is MAPSET, Scope is COREGROUP.
v GRID_CG: aggregated information for a grid, on all servers within a core group.Level is GRID, Scope is COREGROUP.
v DOMAIN_CG: aggregated information for a domain, on all servers within a coregroup. Level is DOMAIN, Scope is COREGROUP.
Chapter 3. ITCAM Agent for WebSphere Applications 361

MapSet Name The map set name. The valid format is an alphanumeric string,with a maximum of 32 characters.
Domain Name The domain name for the grid instance within the server JVM. Thevalid format is an alphanumeric string, with a maximum of 32 characters. Onlyavailable for WebSphere Extreme Scale 7.1.
Important: Some name fields might be set to [Summary] at various aggregationlevels. For example, Server Name is [Summary] if information is aggregated frommultiple servers.
Transaction Count The number of transactions processed by the Grid Shard or allShards during the collection interval. The valid format is a positive integer.
Transaction Time The total transaction processing time spent by the Grid Shard orall Shards during the collection interval. The valid format is a positive integer.
Transaction Rate The average rate, per second, at which the Grid Shard or allShards were processing transactions during the collection interval. The validformat is a decimal (formatted to three decimal places).
Extreme Scale Map attributesThe Extreme Scale Map attributes provide statistics for a particular map runningwithin a grid container, or aggregated statistics for several maps. A map runs on aparticular server, within a grid and a map set; it is associated with one or severalpartitions on the server.
The attributes within this group are used to build the “WebSphere Extreme ScaleZone Summary workspace” on page 337,“WebSphere Extreme Scale Zoneworkspace” on page 337“Maps workspace” on page 346“Maps – Selected Levelworkspace” on page 347 and “Maps – Selected Partition workspace” on page 349.
Origin Node The server name subnode. The valid format is an alphanumericstring, with a maximum of 128 characters.
Sample Date and Time The date and time at which the agent has collected data.The valid format is a 16-character timestamp. For the STR and SCAN functions,the format is MM/DD/YY HH:MM:SS; the following table shows the valuescontained in this character string:
Table 73. Format of the 16-character timestamp
Character String Meaning
MM Month
DD Day
YY Year
HH Hour
MM Minute
SS Second
Interval Time Indicates the length of the sample interval in seconds. The validformat is a positive integer.
362 ITCAM Agents for WebSphere Applications, J2EE, and HTTP Servers: User Guide

Statistics Level The level at which statistics are aggregated in the table. The validvalues are:v SHARD: raw statistics for an individual shardv PARTITION: summary across all shards in a partition. Not used in the current
version.v MAP: summary across all partitions within a map.v MAPSET: summary across all partitions within a map set.v GRID: summary across all map sets within a Grid.v DOMAIN: summary across all Grid Containers within a Grid Domain,
Scope Level The servers from which the statistic information is collected for thetable. The valid values are:v SHARD: statistics from a single shard, on one serverv CONTAINER: statistics from one containerv SERVER: statistics from one serverv COREGROUP: statistics from servers within a core groupv ZONE: statistics from servers within a zone
Grid Name The grid name. The valid format is an alphanumeric string, with amaximum of 32 characters.
Server Name The server name. The valid format is an alphanumeric string, with amaximum of 48 characters.
Core Group Name The core group name. The valid format is an alphanumericstring, with a maximum of 32 characters.
Statistics Name The name of the unit for which the information is aggregated inthis row. For example, if the information is aggregated for a zone, this is the zonename; if the information is for an individual map, this is the map name, and so on.The valid format is an alphanumeric string, with a maximum of 48 characters.
Statistics ID The unique identifier for this statistics row. Used for identifying thestatistic that triggers a situation. The valid format is an alphanumeric string, with amaximum of 96 characters.
Partition ID The partition ID for this Grid Shard, collected for SHARD aggregationlevel only. The valid format is a positive integer.
Summary Level The aggregation level and scope for this row. This fielddetermines the values of the Statistics Level and Statistics Scope fields. The validvalues are:v SHARD: raw statistics for an individual shard. Level is SHARD, Scope is SHARD.v PARTITION: aggregated information for all shards in a partition. Level is
PARTITION, Scope is ZONE
v MAP: aggregated information for a map, on all servers within a zone. Level isMAPSET, Scope is ZONE.
v MAPSET: aggregated information for a map set, on all servers within a zone. Levelis MAPSET, Scope is ZONE.
v GRID: aggregated information for a grid, on all servers within a zone. Level isGRID, Scope is ZONE.
Chapter 3. ITCAM Agent for WebSphere Applications 363

v DOMAIN: aggregated information for a domain, on all servers within a zone. Levelis DOMAIN, Scope is ZONE.
v MAP_SRV: aggregated information for a map, on a single server. Level is MAP,Scope is SERVER.
v MAPSET_SRV: aggregated information for a map set, on a single server. Level isMAPSET, Scope is SERVER.
v GRID_SRV: aggregated information for a grid, on a single server. Level is GRID,Scope is SERVER.
v DOMAIN_SRV: aggregated information for a domain, on a single server. Level isDOMAIN, Scope is SERVER.
v MAP_CG: aggregated information for a map, on all servers within a core group.Level is MAP, Scope is COREGROUP.
v MAPSET_CG: aggregated information for a map set, on all servers within a coregroup. Level is MAPSET, Scope is COREGROUP.
v GRID_CG: aggregated information for a grid, on all servers within a core group.Level is GRID, Scope is COREGROUP.
v DOMAIN_CG: aggregated information for a domain, on all servers within a coregroup. Level is DOMAIN, Scope is COREGROUP.
Map Name The map name. The valid format is an alphanumeric string, with amaximum of 32 characters.
Important: Some name fields can be set to [Summary] at various aggregation levels.For example, Server Name is [Summary] if information is aggregated from multipleservers.
Map Count The number of the map entries held in this Grid Partition. The validformat is a positive integer.
Get Count The number of maps gets registered on the collection interval. Thevalid format is a positive integer. The Get Count attribute is only supported forWebSphere Extreme Scale 7.1. Ignore this attribute value for WebSphere ExtremeScale 6.1 and 7.0; it does not reflect the actual hit count and is only used forinternal calculations.
Hit Count The number of map hits registered on the collection interval. The validformat is a positive integer. The Hit Count attribute is only supported forWebSphere Extreme Scale 7.1. Ignore this attribute value for WebSphere ExtremeScale 6.1 and 7.0; it does not reflect the actual get count and is only used forinternal calculations.
Hit Rate The map hit rate percentage registered on the collection interval. -1 whenGet Count is 0. The valid format is a positive integer.
Used KBytes The memory, in kilobytes, used by all entries in the map. The validformat is a positive integer. This information is not available for WebSphereExtreme Scale 6.1 and 7.0; for these versions, the value is always -1.
Batch Update Total Time The total time, in seconds, spent on batch databaseupdates for the Map during the collection interval. The valid format is a positiveinteger.
364 ITCAM Agents for WebSphere Applications, J2EE, and HTTP Servers: User Guide

Extreme Scale Shards attributesThe Extreme Scale Shards attributes provide statistics for a particular shardrunning within a grid container, or aggregated statistics for several shards. A shardruns on a particular server. A shard belongs to a grid and a map set. A shardcorresponds to a partition. One partition can contain several shards on differentservers, but only one shard can belong to a partition on any given server.
The attributes within this group are used to build the “Shards workspace” on page350,“Shards – Selected Level workspace” on page 351 and “Shards – SelectedPartition workspace” on page 354.
Origin Node The server name subnode. The valid format is an alphanumericstring, with a maximum of 128 characters.
Sample Date and Time The date and time at which the agent has collected data.The valid format is a 16-character timestamp. For the STR and SCAN functions,the format is MM/DD/YY HH:MM:SS; the following table shows the valuescontained in this character string:
Table 74. Format of the 16-character timestamp
Character String Meaning
MM Month
DD Day
YY Year
HH Hour
MM Minute
SS Second
Interval Time Indicates the length of the sample interval in seconds. The validformat is a positive integer.
Server Name The server name. The valid format is an alphanumeric string, with amaximum of 48 characters.
Grid Name The grid name. The valid format is an alphanumeric string, with amaximum of 32 characters.
Core Group Name The core group name. The valid format is an alphanumericstring, with a maximum of 32 characters.
MapSet Name The map set name. The valid format is an alphanumeric string,with a maximum of 32 characters.
Domain Name The domain name for the grid instance within the server JVM. Thevalid format is an alphanumeric string, with a maximum of 32 characters. Onlyavailable for WebSphere Extreme Scale 7.1.
Container Name The name of this Grid Container. The valid format is analphanumeric string, with a maximum of 32 characters.
Important: Some name fields might be set to [Summary] at various aggregationlevels. For example, Server Name is [Summary] if information is aggregated frommultiple servers.
Chapter 3. ITCAM Agent for WebSphere Applications 365

Statistics Name The name of the unit for which the information is aggregated inthis row. For example, if the information is aggregated for a zone, this is the zonename; if the information is for an individual shard, this is the shard name, and soon. The valid format is an alphanumeric string, with a maximum of 48 characters.
Display name The unique identifier for this statistics row. Used for identifying thestatistic that triggers a situation. The valid format is an alphanumeric string, with amaximum of 96 characters.
State The state of the shard, as reported by WebSphere Extreme Scale. The validformat is an alphanumeric string, with a maximum of 32 characters.
Partition The partition ID for this Grid Shard, collected for SHARD aggregationlevel only. The valid format is a positive integer.
Active Request Count The number of requests currently being processed by thisshard. The valid format is a positive integer.
Request Count The total number of requests that this shard has processed orforwarded on the collection interval. The valid format is a positive integer.
Forwarded Request Count The number of requests that this shard has forwardedon the collection interval. The valid format is a positive integer.
Processed Request Count The number of requests that this shard has processed orforwarded on the collection interval. The valid format is a positive integer.
Request Rate The overall request processing rate for this shard, including bothprocessed and forwarded requests, during the collection interval. The valid formatis a decimal (formatted to three decimal places).
Forwarded Request Rate The rate of processing forwarded requests for this shardduring the collection interval. The valid format is a decimal (formatted to threedecimal places).
Processed Request Rate The rate of processing non-forwarded (processed) requestsfor this shard during the collection interval. The valid format is a decimal(formatted to three decimal places).
Type The type of the shard. The valid values are:v PRIMARY: This is a primary shard in the partition.v INACTIVE: This shard is currently inactive within the partition.v SYNC_REPLICA: This shard is currently a replica within the partition and is
synchronized with the primary shard.v ASYNC_REPLICA: This shard is currently a replica within the partition and is not
synchronized with the primary shard.
Statistics Level The level at which statistics are aggregated in the table. The validvalues are:v SHARD: raw statistics for an individual shardv PARTITION: summary across all shards in a partition. Not used in the current
version.v MAP: summary across all partitions within a map.v MAPSET: summary across all partitions within a map set.
366 ITCAM Agents for WebSphere Applications, J2EE, and HTTP Servers: User Guide

v GRID: summary across all map sets within a Grid.v DOMAIN: summary across all Grid Containers within a Grid Domain,
Scope Level The servers from which the statistic information is collected for thetable. The valid values are:v SHARD: statistics from a single shard, on one serverv CONTAINER: statistics from one containerv SERVER: statistics from one serverv COREGROUP: statistics from servers within a core groupv ZONE: statistics from servers within a zone
Summary Level The aggregation level and scope for this row. This fielddetermines the values of the Statistics Level and Statistics Scope fields. The validvalues are:v SHARD: raw statistics for an individual shard. Level is SHARD, Scope is SHARD.v PARTITION: aggregated information for all shards in a partition. Level is
PARTITION, Scope is ZONE
v MAP: aggregated information for a map, on all servers within a zone. Level isMAPSET, Scope is ZONE.
v MAPSET: aggregated information for a map set, on all servers within a zone. Levelis MAPSET, Scope is ZONE.
v GRID: aggregated information for a grid, on all servers within a zone. Level isGRID, Scope is ZONE.
v DOMAIN: aggregated information for a domain, on all servers within a zone. Levelis DOMAIN, Scope is ZONE.
v MAP_SRV: aggregated information for a map, on a single server. Level is MAP,Scope is SERVER.
v MAPSET_SRV: aggregated information for a map set, on a single server. Level isMAPSET, Scope is SERVER.
v GRID_SRV: aggregated information for a grid, on a single server. Level is GRID,Scope is SERVER.
v DOMAIN_SRV: aggregated information for a domain, on a single server. Level isDOMAIN, Scope is SERVER.
v MAP_CG: aggregated information for a map, on all servers within a core group.Level is MAP, Scope is COREGROUP.
v MAPSET_CG: aggregated information for a map set, on all servers within a coregroup. Level is MAPSET, Scope is COREGROUP.
v GRID_CG: aggregated information for a grid, on all servers within a core group.Level is GRID, Scope is COREGROUP.
v DOMAIN_CG: aggregated information for a domain, on all servers within a coregroup. Level is DOMAIN, Scope is COREGROUP.
Extreme Scale Placements attributesThe Extreme Scale Placements attributes provide information about grids andtheir placement in the WebSphere Extreme Scale zone.
The attributes within this group are used to build the “Grids workspace” on page340.
Origin Node The server name subnode. The valid format is an alphanumericstring, with a maximum of 32 characters.
Chapter 3. ITCAM Agent for WebSphere Applications 367

Sample Date and Time The date and time at which the agent has collected thisdata. The valid format is a 16-character timestamp. For the STR and SCANfunctions, the format is MM/DD/YY HH:MM:SS; the following table shows thevalues contained in this character string:
Table 75. Format of the 16-character timestamp
Character String Meaning
MM Month
DD Day
YY Year
HH Hour
MM Minute
SS Second
Interval Time The length of the sample interval in seconds. The valid format is apositive integer.
Grid Name The name of the grid. The valid format is an alphanumeric string, witha maximum of 32 characters.
MapSet Name The name of the map set. The valid format is an alphanumericstring, with a maximum of 32 characters.
Placement Strategy The Grid shards placement strategy. The valid values arePER_CONTAINER and FIXED_PARTITIONS.
Min Sync Replicas The minimum amount of synchronous replicas in the grid. Thevalid format is a positive integer.
Development Mode The Grid development mode status. The valid format is apositive integer.
Number of Containers The number of containers in the grid. The valid format is apositive integer.
Number of Machines The number of machines in the grid. The valid format is apositive integer.
Outstanding Work Items The number of Outstanding Work Items in the grid. Thevalid format is a positive integer.
Number of Active Zones The number of Active Zones in the grid. The validformat is a positive integer.
Extreme Scale Thread Pools attributesThe Extreme Scale Thread Pools attributes provide information about thread poolson servers within the WebSphere Extreme Scale zone.
The attributes within this group are used to build the “Containers workspace” onpage 338 and “Selected Containers workspace” on page 339.
All attributes in this group are only available for WebSphere Extreme Scale 7.1.
368 ITCAM Agents for WebSphere Applications, J2EE, and HTTP Servers: User Guide

Origin Node The server name subnode. The valid format is an alphanumericstring, with a maximum of 32 characters.
Sample Date and Time The date and time at which the agent has collected thisdata. The valid format is a 16-character timestamp. For the STR and SCANfunctions, the format is MM/DD/YY HH:MM:SS; the following table shows thevalues contained in this character string:
Table 76. Format of the 16-character timestamp
Character String Meaning
MM Month
DD Day
YY Year
HH Hour
MM Minute
SS Second
Interval Time The length of the sample interval in seconds. The valid format is apositive integer.
Thread Pool Name The name of the thread pool. The valid format is analphanumeric string, with a maximum of 32 characters.
Server Name The name of the server. The valid format is an alphanumeric string,with a maximum of 48 characters.
Core Group The name of core group. The valid format is an alphanumeric string,with a maximum of 32 characters.
Maximum Size The maximum pool size. The valid format is a positive integer.Only available for WebSphere Extreme Scale 7.1.
Minimum Size The minimum pool size. The valid format is a positive integer.Only available for WebSphere Extreme Scale 7.1.
Active Thread Count The active thread count. The valid format is a positiveinteger. Only available for WebSphere Extreme Scale 7.1.
Stats Level The level at which statistics are aggregated in the table. The validvalues are:v SERVER: information for thread pools on a single server.v COREGROUP: aggregated information for thread pools on servers within a core
group.v ZONE: aggregated information for thread pools on servers within a zone.
WebSphere XS Configuration attributesThe WebSphere XS Configuration attributes provide data access for WXS cellconfiguration workspaces.
Origin Node The XD Cell subnode. The valid format is an alphanumeric string,with a maximum of 32 characters.
Chapter 3. ITCAM Agent for WebSphere Applications 369

Sample Date and Time The date and time at which the agent collected data. Thevalid format is T.
Interval Time The length of the sample interval in seconds. The valid format is a4-byte integer. Valid fixed values are: =-1
Row Id The row identifier. The valid format is a 2-byte integer.
View Id The view identifier. The valid format is a 2-byte integer.
Act Id The act identifier. The valid format is a 2-byte integer.
Data The data string. The valid format is an alphanumeric string, with a maximumof 4096 characters.
Situations for WebSphere Extreme ScaleSome predefined situations are available for WebSphere Extreme Scale monitoring.You can use them to monitor quorum status and detect the stopping of a catalogserver.
These predefined situations display an alert status. When these situations triggeran alert, you can investigate the event by opening the corresponding workspace.
How the situations work
Situations are tests expressed in IF-TRUE format of system conditions that youwant to monitor; the tested value is an ITCAM Agent for WebSphere Applicationsattribute expressed in the form attribute-group.attribute-name. If the specifiedcondition occurs or exists, the situation is true, and an alert is issued.
Accessing the situations
A number of predefined situations are shipped to monitor WebSphere ExtremeScale. Access the situations in the Tivoli Enterprise Portal using one of thefollowing methods:
v From the toolbar on the main menu, click the Situation Editor icon andscroll to the situation that you want to view.
v Right-click a WebSphere Extreme Scale zone node. Click Manage Situations todisplay all the situations available for the zone. If you want to start, stop edit ormodel a situation right-click the situation and select the option you want.
WXSQuorumWaiting is a critical situation. It is raised when a Grid within themonitored zone or zones is waiting for the quorum.
WXSCatalogOffline is a critical situation. It is raised when a catalog server withinthe monitored zone or zones goes offline.
WXSContainerOffline is a critical situation. It is raised when a container serverwithin the monitored zone or zones goes offline.
WXSHighUsedMemoryPercent is a critical situation. It is raised when the usedheap memory goes over 80% of the maximum on a container server within themonitored zone or zones.
370 ITCAM Agents for WebSphere Applications, J2EE, and HTTP Servers: User Guide

WXSHungThreadsDetected is a critical situation. It is raised when the used hungthreads are detected on a container server within the monitored zone or zones.
WebSphere Extreme Scale Take Action CommandsUse Take Action commands to manage Extreme Scale zone nodes, to trigger zonetopology discovery, to override the quorum on the Extreme Scale catalog service, toshut down servers in the Extreme Scale grid, and to trigger map set placement inthe grid.
WXS_Add_Zone: add a zone nodeUse the WXS_Add_Zone Take Action command, available on the Agent forWebSphere Applications node level, to add a new WebSphere Extreme Scale zonenode for this server.
Command syntax
YN:WXS_Add_Zone Node_Name
Parameters:
Node_NameThe name of the new zone node
Important: A newly created node contains no data. To monitor a WebSphereExtreme Scale zone or several zones, configure the node. To do this, right-click thenode and select WebSphere XS Zone – Configuration. See “WebSphere ExtremeScale configuration workspace” on page 334.
WXS_Rename_Zone: rename a zone nodeUse the WXS_Rename_Zone Take Action command, available on the WebSphereExtreme Scale zone node level, to change the name of the zone node in thenavigator.
Attention: When you rename a zone node, Tivoli Monitoring loses all historyinformation for it.
Command syntax
YN:WXS_Rename_Zone New_Node_Name
Parameters:
New_Node_NameThe new name of the zone node.
Important: The node with the old name is disabled. Use the Clear Offline Nodescommand in Tivoli Enterprise Portal to remove the inactive zone from the tree.
WXS_Remove_Zone: remove a zone nodeUse the WXS_Remove_Zone Take Action command, available on the WebSphereExtreme Scale zone node level, to remove a zone node.
Command syntax
YN:WXS_Remove_Zone
Chapter 3. ITCAM Agent for WebSphere Applications 371

Important: The zone is disabled. Use the Clear Offline Nodes command in TivoliEnterprise Portal to remove the inactive zone from the tree.
WXS_Remove_Offline: remove a catalog or container in theoffline state from monitoringUse the WXS_Remove_Offline Take Action command, available on the WebSphereExtreme Scale zone node level, to stop monitoring a catalog or container (server)that is now offline. If you do not use this Take Action command, the offline catalogor container remains in the monitoring tables for a while. It is listed in workspacesand might trigger false events.
Command syntax
YN:WXS_Remove_Offline Server_Name
Parameters:
Server_NameThe name of the server to remove.
WXS_Discover_Zone: discover the zone topologyUse the WXS_Discover_Zone Take Action command, available on the WebSphereExtreme Scale zone node level, to discover the topology of the monitored zone.This action updates monitoring of the zone to the new topology.
Zone topology is discovered automatically once in the Discovery interval (set inthe “WebSphere Extreme Scale configuration workspace” on page 334). If containerservers or catalog services were added, removed, or restarted, you can use thisTake Action command to update monitoring to the new topology without waitingfor expiration of the Discovery interval.
Command syntax
YN:WXS_Discover_Zone
WXS_Override_Quorum: override quorum for the catalog serverUse the WXS_Override_Quorum Take Action command, available on theWebSphere Extreme Scale zone node level, to override quorum on the monitoredzone.
To perform this action, the agent uses the OverrideQuorum method on the primarycatalog server.
Command syntax
YN:WXS_Override_Quorum
WXS_Tear_Down_Servers: stop Extreme Scale container serverUse the WXS_Tear_Down_Servers Take Action command to stop an Extreme Scalecontainer server. This command is available on the WebSphere Extreme Scale zonenode, or in the Container Servers Summary table (Containers workspace).
To perform this action, the agent uses the tearDownServers method onPlacementServiceMBean.
372 ITCAM Agents for WebSphere Applications, J2EE, and HTTP Servers: User Guide

When the action is invoked from the Container Servers Summary table(“Containers workspace” on page 338), the server name is taken from the selectedrow.
Command syntax
YN:WXS_Tear_Down_Servers Server_Name
Parameters:
Server_NameThe name of the server to stop.
WXS_Trigger_Placement: trigger the placement of a map set onan Extreme Scale gridUse the WXS_Trigger_Placement Take Action command to trigger the placement ofa map set on an Extreme Scale grid. By default, a grid be placed automatically, butyou can use this command to start its placement earlier. This command is availableon the WebSphere Extreme Scale zone node, or in the Grids Summary table (Gridsworkspace).
To perform this action, the agent uses the triggerPlacement method onPlacementServiceMBean.
When the action is invoked from the Grids Summary table (“Grids workspace” onpage 340), the grid and map set names are taken from the selected row.
Command syntax
YN:WXS_Trigger_Placement Grid_Name MapSet_Name
Parameters:
Grid_NameThe name of the grid.
MapSet_NameThe name of the map set. The agent triggers placement of this map set on thegrid.
WebSphere PMI Attribute MappingThe following tables show how the data displayed in the ITCAM for ApplicationDiagnostics resource workspaces map to their corresponding WebSphere PMIcategories and their attributes. It also provides the monitoring overhead incurredwhen turning on these attributes.
By default, ITCAM changes the PMI collection level based on its monitoring level.See the Advanced configuration of the Agent chapter of ITCAM Agent for WebSphereApplications Installation and Configuration Guide to learn more about this behaviorand how to turn it off for custom monitoring.
Chapter 3. ITCAM Agent for WebSphere Applications 373

TEP Console Workspace Columns to WebSphere PMI AttributeMapping
Table 77. TEP Console Workspace Columns to WebSphere PMI Attribute Mapping.
TEP Console Workspace Columns to WebSphere PMI Attribute Mapping
AppServer--HighAvailability Manager ITM Table Name: KYNHAMGMT
TEP Console ColumnName WebSphere 7 PMI Attribute WebSphere 8 PMI Attribute
WebSpherePMI Level Overhead
Category: HAManager
Local Groups LocalGroupCount LocalGroupCount All High
Group State RebuildTime GroupStateRebuildTime GroupStateRebuildTime All High
Bulletin-Board Subjects BulletinBoardSubjectCount BulletinBoardSubjectCount All High
Bulletin-BoardSubscriptions BulletinBoardSubcriptionCount BulletinBoardSubcriptionCount All High
Bulletin-Board RebuildTime BulletinBoardRebuildTime BulletinBoardRebuildTime All High
Local Bulletin-BoardSubjects LocalBulletinBoardSubjectCount LocalBulletinBoardSubjectCount All High
AppServer-DCS Stacks ITM Table Name: KYNDCSSTK
TEP Console ColumnName WebSphere 7 PMI Attribute WebSphere 8 PMI Attribute
WebSpherePMI Level Overhead
Category: DCS Statistics
Message BufferReallocations MessageBufferReallocationCount MessageBufferReallocationCount All Medium
Sent Messages SentMessageCount SentMessageCount All High
Average OutgoingMessage Size OutgoingMessageSize OutgoingMessageSize All High
Minimum OutgoingMessage Size OutgoingMessageSize OutgoingMessageSize All High
Maximum OutgoingMessage Size OutgoingMessageSize OutgoingMessageSize All High
Outgoing Messages SentMessageCount SentMessageCount All High
Average IncomingMessage Size IncomingMessageSize IncomingMessageSize All High
Minimum IncomingMessage Size IncomingMessageSize IncomingMessageSize All High
Maximum IncomingMessage Size IncomingMessageSize IncomingMessageSize All High
Incoming Messages ReceivedMessageCount ReceivedMessageCount All High
SynchronizationCompletion Time SynchronizationCompleteTime SynchronizationCompleteTime All High
SynchronizationTimeouts SynchronizationTimeoutCount SynchronizationTimeoutCount All Medium
High SeverityCongestion Events HighSeverityCongestionEventCount HighSeverityCongestionEventCount All Medium
Coalesce Time CoalesceTime CoalesceTime All Medium
Join View Change Time JoinViewChangeTime JoinViewChangeTime All High
Remove View ChangeTime RemoveViewChangeTime RemoveViewChangeTime All High
374 ITCAM Agents for WebSphere Applications, J2EE, and HTTP Servers: User Guide

Table 77. TEP Console Workspace Columns to WebSphere PMI Attribute Mapping (continued).
TEP Console Workspace Columns to WebSphere PMI Attribute Mapping
Suspicions SuspicionCount SuspicionCount All High
View Changes ViewChangeCount ViewChangeCount All Medium
Group Size ViewGroupSize ViewGroupSize All Medium
Web Applications ITM Table Name: KYNAPP
TEP Console ColumnName WebSphere 7 PMI Attribute WebSphere 8 PMI Attribute
WebSpherePMI Level Overhead
Category: Web Applications
Request Count RequestCount (Servlet Info) RequestCount (Servlet Info) Basic Low
Request Rate (per sec) RequestCount RequestCount Basic Low
Error Count ErrorCount (Servlet Info) ErrorCount (Servlet Info) Extended Low
Error Rate (per sec) ErrorCount (Servlet Info) ErrorCount (Servlet Info) Extended Low
Average Response Time(ms) ServiceTime (Servlet Info) ServiceTime (Servlet Info) Basic Medium
Average ConcurrentRequests ConcurrentRequests (Servlet Info) ConcurrentRequests (Servlet Info) Extended High
Servlets Loaded LoadedServletCount LoadedServletCount All Low
Servlets Reloaded ReloadCount ReloadCount All Low
WebApplications--ServletSessions ITM Table Name: KYNSERVS
TEP Console ColumnName WebSphere 7 PMI Attribute WebSphere 8 PMI Attribute
WebSpherePMI Level Overhead
Category: Servlet Session Manager
Sessions Created CreateCount CreateCount All Low
Session Creation Rate(per sec) CreateCount CreateCount All Low
Sessions Invalidated InvalidateCount InvalidateCount All Low
Session InvalidationRate (per sec) InvalidateCount InvalidateCount All Low
Average SessionLifetime (ms) LifeTime LifeTime Extended Medium
Average ConcurrentlyActive Sessions ActiveCount ActiveCount All High
Average ConcurrentlyLive Sessions LiveCount LiveCount Basic High
Failed Session Requests NoRoomForNewSessionCount NoRoomForNewSessionCount Extended Low
Failed Session RequestRate (per sec) NoRoomForNewSessionCount NoRoomForNewSessionCount Extended Low
Cache Discards CacheDiscardCount CacheDiscardCount All Low
Cache Discard Rate (persec) CacheDiscardCount CacheDiscardCount All Low
External Read Time(ms) ExternalReadTime ExternalReadTime Extended Medium
External Read Size(bytes) ExternalReadSize ExternalReadSize Extended Medium
Chapter 3. ITCAM Agent for WebSphere Applications 375

Table 77. TEP Console Workspace Columns to WebSphere PMI Attribute Mapping (continued).
TEP Console Workspace Columns to WebSphere PMI Attribute Mapping
External Write Time(ms) ExternalWriteTime ExternalWriteTime Extended Medium
External Write Size(bytes) ExternalWriteSize ExternalWriteSize Extended Medium
Broken SessionAffinities AffinityBreakCount AffinityBreakCount All Low
Broken Session AffinityRate (per sec) AffinityBreakCount AffinityBreakCount All Low
Time since LastActivated TimeSinceLastActivated TimeSinceLastActivated All Medium
Nonexistent SessionRequests ActivateNonExistSessionCount ActivateNonExistSessionCount All Low
Nonexistent SessionRequest Rate (per sec) ActivateNonExistSessionCount ActivateNonExistSessionCount All Low
Total SerializableSession Object Size(bytes) SessionObjectSize SessionObjectSize All Max
Average SerializableSession Object Size(bytes) SessionObjectSize SessionObjectSize All Max
Min Serializable SessionObject Size (bytes) SessionObjectSize SessionObjectSize All Max
Max Serializable SessionObject Size (bytes) SessionObjectSize SessionObjectSize All Max
EJB Containers ITM Table Name: KYNCONTNR
TEP Console ColumnName WebSphere 7 PMI Attribute WebSphere 8 PMI Attribute
WebSpherePMI Level Overhead
Category: Enterprise Beans
Method AverageResponse Time (ms) MethodResponseTime MethodResponseTime Basic High
Method InvocationCount MethodCallCount MethodCallCount Basic High
Method Invocation Rate(per sec) MethodCallCount MethodCallCount Basic High
Create Average Time(ms) CreateTime CreateTime All Max
Remove Average Time(ms) RemoveTime RemoveTime All Max
Average ConcurrentlyReady Beans ReadyCount ReadyCount Basic Low
Average ConcurrentlyLive Beans LiveCount LiveCount Extended High
Active Method Count ActiveMethodCount ActiveMethodCount All High
Create Count CreateCount CreateCount Basic Low
Creation Rate (per sec) CreateCount CreateCount Basic Low
Remove Count RemoveCount RemoveCount Basic Low
Removal Rate per sec) RemoveCount RemoveCount Basic Low
Activate Count ActivateCount ActivateCount All Low
376 ITCAM Agents for WebSphere Applications, J2EE, and HTTP Servers: User Guide

Table 77. TEP Console Workspace Columns to WebSphere PMI Attribute Mapping (continued).
TEP Console Workspace Columns to WebSphere PMI Attribute Mapping
Activation Rate (persec) ActivateCount ActivateCount All Low
Passivate Count PassivateCount PassivateCount Basic Low
Passivation Rate (persec) PassivateCount PassivateCount Basic Low
Entity Bean Load Count LoadCount LoadCount All Low
Entity Bean Load Rate(per sec) LoadCount LoadCount All Low
Entity Bean Store Count StoreCount StoreCount All Low
Entity Bean Store Rate(per sec) StoreCount StoreCount All Low
Instantiate Count InstantiateCount InstantiateCount All Low
Instantiation Rate (persec) InstantiateCount InstantiateCount All Low
Destroy Count FreedCount FreedCount All Low
Destruction Rate (persec) FreedCount FreedCount All Low
EJB Containers---Enterprise JavaBeans ITM Table Name: KYNEJB
TEP Console ColumnName WebSphere 7 PMI Attribute WebSphere 8 PMI Attribute
WebSpherePMI Level Overhead
Category: Enterprise Beans
Method Invocations MethodCallCount MethodCallCount Basic High
Method Invocation Rate(per sec) MethodCallCount MethodCallCount Basic High
Method AverageResponse Time (ms) MethodResponseTime MethodResponseTime Basic High
Create Count CreateCount CreateCount Basic Low
Creation Rate (per sec) CreateCount CreateCount Basic Low
Create Average Time(ms) CreateTime CreateTime All Max
Remove Count RemoveCount RemoveCount Basic Low
Removal Rate (per sec) RemoveCount RemoveCount Basic Low
Remove Average Time(ms) RemoveTime RemoveTime All Max
Activate Count ActivateCount ActivateCount All Low
Activation Rate (persec) ActivateCount ActivateCount All Low
Passivate Count PassivateCount PassivateCount All Low
Passivation Rate PassivateCount PassivateCount All Low
Entity Bean Load Count LoadCount LoadCount All Low
Entity Bean Load Rate(per sec) LoadCount LoadCount All Low
Entity Bean Store Count StoreCount StoreCount All Low
Entity Bean Store Rate(per sec) StoreCount StoreCount All Low
Chapter 3. ITCAM Agent for WebSphere Applications 377

Table 77. TEP Console Workspace Columns to WebSphere PMI Attribute Mapping (continued).
TEP Console Workspace Columns to WebSphere PMI Attribute Mapping
Instantiate Count InstantiateCount InstantiateCount All Low
Destroy Count FreedCount FreedCount All Low
Destruction Rate (persec) FreedCount FreedCount All Low
Find Count RetrieveFromPoolSuccessCount RetrieveFromPoolSuccessCount All Low
Find Rate (per sec) RetrieveFromPoolSuccessCount RetrieveFromPoolSuccessCount All Low
Get Count RetrieveFromPoolCount RetrieveFromPoolCount All Low
Get Rate (per sec) RetrieveFromPoolCount RetrieveFromPoolCount All Low
Return Count ReturnsToPoolCount ReturnsToPoolCount Extended Low
Return Rate (per sec) ReturnsToPoolCount ReturnsToPoolCount Extended Low
Discard Count ReturnsDiscardCount ReturnsDiscardCount Extended Low
Discard Rate (per sec) ReturnsDiscardCount ReturnsDiscardCount Extended Low
Drain Count DrainsFromPoolCount DrainsFromPoolCount All Low
Drain Rate (per sec) DrainsFromPoolCount DrainsFromPoolCount All Low
Average ConcurrentlyReady Beans ReadyCount ReadyCount Basic High
Average ConcurrentlyLive Beans LiveCount LiveCount Extended High
Active Method Count ActiveMethodCount ActiveMethodCount All High
Average ObjectsDiscarded DrainSize DrainSize All Medium
Average Objects in Pool PooledCount PooledCount Basic High
EJB Containers---ContainerTransactions ITM Table Name: KYNTRANS
TEP Console ColumnName WebSphere 7 PMI Attribute WebSphere 8 PMI Attribute
WebSpherePMI Level Overhead
Category: Transaction Manager
Global TransactionsBegun GlobalBegunCount GlobalBegunCount Extended Low
Global TransactionsBegin Rate (per sec) GlobalBegunCount GlobalBegunCount Extended Low
Local TransactionsBegun LocalBegunCount LocalBegunCount Extended Low
Local TransactionsBegin Rate (per sec) LocalBegunCount LocalBegunCount Extended Low
Global TransactionsActive ActiveCount ActiveCount Basic Low
Local TransactionsActive LocalActiveCount LocalActiveCount All Low
Global TransactionsCommitted CommittedCount CommittedCount Basic Low
Global TransactionCommit Rate (per sec) CommittedCount CommittedCount Basic Low
Local TransactionsCommitted LocalCommittedCount LocalCommittedCount All Low
Local TransactionCommit Rate (per sec) LocalCommittedCount LocalCommittedCount All Low
378 ITCAM Agents for WebSphere Applications, J2EE, and HTTP Servers: User Guide

Table 77. TEP Console Workspace Columns to WebSphere PMI Attribute Mapping (continued).
TEP Console Workspace Columns to WebSphere PMI Attribute Mapping
Global TransactionsRolled Back RolledbackCount RolledbackCount Basic Low
Global TransactionRollback Rate (per sec) RolledbackCount RolledbackCount Basic Low
Local TransactionsRolled Back LocalRolledbackCount LocalRolledbackCount All Low
Local TransactionRollback Rate (per sec) LocalRolledbackCount LocalRolledbackCount All Low
Global TransactionTimeouts GlobalTimeoutCount GlobalTimeoutCount Extended Low
Global TransactionTimeout Rate (per sec) GlobalTimeoutCount GlobalTimeoutCount Extended Low
Local TransactionTimeouts LocalTimeoutCount LocalTimeoutCount Extended Low
Local TransactionTimeout Rate (per sec) LocalTimeoutCount LocalTimeoutCount Extended Low
Global TransactionsOptimized OptimizationCount OptimizationCount All Low
Global TransactionOptimize Rate (per sec) CommittedCount CommittedCount Basic Low
Global TransactionsInvolved GlobalInvolvedCount GlobalInvolvedCount All Low
Global TransactionsInvolve Rate (per sec) GlobalInvolvedCount GlobalInvolvedCount All Low
Global TransactionDuration (ms) GlobalTranTime GlobalTranTime Extended Medium
Local TransactionDuration (ms) LocalTranTime LocalTranTime Extended Medium
Global Transactionbefore CompletionDuration (ms) GlobalBeforeCompletionTime GlobalBeforeCompletionTime All Medium
Local Transaction beforeCompletion Duration(ms) LocalBeforeCompletionTime LocalBeforeCompletionTime All Medium
Global TransactionCommit Duration (ms) GlobalCommitTime GlobalCommitTime All Medium
Local TransactionCommit Duration (ms) LocalCommitTime LocalCommitTime All Medium
Global TransactionPrepare Duration (ms) GlobalPrepareTime GlobalPrepareTime All Medium
EJB Containers---Container ObjectPools ITM Table Name: KYNCNTROP
TEP Console ColumnName WebSphere 7 PMI Attribute WebSphere 8 PMI Attribute
WebSpherePMI Level Overhead
Average Objects in Pool PooledCount PooledCount Basic High
Average ObjectsDiscarded DrainSize DrainSize All Medium
Find Count RetrieveFromPoolSuccessCount RetrieveFromPoolSuccessCount All Low
Chapter 3. ITCAM Agent for WebSphere Applications 379

Table 77. TEP Console Workspace Columns to WebSphere PMI Attribute Mapping (continued).
TEP Console Workspace Columns to WebSphere PMI Attribute Mapping
Find Rate RetrieveFromPoolSuccessCount RetrieveFromPoolSuccessCount All Low
Get Count RetrieveFromPoolCount RetrieveFromPoolCount All Low
Get Rate RetrieveFromPoolCount RetrieveFromPoolCount All Low
Return Count ReturnsToPoolCount ReturnsToPoolCount Extended Low
Return Rate ReturnsToPoolCount ReturnsToPoolCount Extended Low
Discard Count ReturnsDiscardCount ReturnsDiscardCount Extended Low
Discard Rate ReturnsDiscardCount ReturnsDiscardCount Extended Low
Drain Count DrainsFromPoolCount DrainsFromPoolCount All Low
Drain Rate DrainsFromPoolCount DrainsFromPoolCount All Low
DB Connection Pools ITM Table Name: KYNDBCONP
TEP Console ColumnName WebSphere 7 PMI Attribute WebSphere 8 PMI Attribute
WebSpherePMI Level Overhead
Category: JDBC Connection Pools
Maximum Pool Size PoolSize PoolSize Basic High
Average Pool Size PoolSize PoolSize Basic High
Average WaitingThreads WaitingThreadCount WaitingThreadCount Basic High
Average Wait Time (ms) WaitTime WaitTime Basic Medium
Average Usage Time(ms) UseTime UseTime Basic Medium
Average Free Pool Size FreePoolSize FreePoolSize Basic High
JDBC Time(ms) JDBCTime JDBCTime Extended Medium
Percent Used PercentUsed PercentUsed Basic High
Percent of Time Pool atMax PercentMaxed PercentMaxed All High
Connections Created CreateCount CreateCount Basic Low
Connection CreationRate (per sec) CreateCount CreateCount Basic Low
Connections Allocated AllocateCount AllocateCount Extended Low
Connection AllocationRate (per sec) AllocateCount AllocateCount Extended Low
Connections Destroyed CloseCount CloseCount Basic Low
Connection DestructionRate (per sec) CloseCount CloseCount Basic Low
Threads Timed Out FaultCount FaultCount Extended Low
Thread Timeout Rate(per sec) FaultCount FaultCount Extended Low
Prep Statement CacheDiscards PrepStmtCacheDiscardCount PrepStmtCacheDiscardCount Extended Low
Prep Statement CacheDiscard Rate (per sec) PrepStmtCacheDiscardCount PrepStmtCacheDiscardCount Extended Low
Return Count ReturnCount ReturnCount Extended Low
Return Rate(per sec) ReturnCount ReturnCount Extended Low
380 ITCAM Agents for WebSphere Applications, J2EE, and HTTP Servers: User Guide

Table 77. TEP Console Workspace Columns to WebSphere PMI Attribute Mapping (continued).
TEP Console Workspace Columns to WebSphere PMI Attribute Mapping
J2C Connection Pools ITM Table Name: KYNJ2C
TEP Console ColumnName WebSphere 7 PMI Attribute WebSphere 8 PMI Attribute
WebSpherePMI Level Overhead
Category: J2C Connection Pools
Maximum Pool Size PoolSize PoolSize Basic High
Average Pool Size PoolSize PoolSize Basic High
Average FreeConnections FreePoolSize FreePoolSize Basic High
Connections Used ManagedConnectionCount ManagedConnectionCount All Low
Connection Handles ConnectionHandleCount ConnectionHandleCount All Low
Average Wait Time (ms) WaitTime WaitTime Basic Medium
Concurrent WaitingThreads WaitingThreadCount WaitingThreadCount Basic High
Average Usage Time(ms) UseTime UseTime Basic Medium
Pool Used (%) PercentUsed PercentUsed All High
Percent of Time Pool atMax PercentMaxed PercentMaxed All High
Connections Created CreateCount CreateCount Basic Low
Connection CreationRate (per sec) CreateCount CreateCount Basic Low
Connections Allocated AllocateCount AllocateCount All Low
Connection AllocationRate (per sec) AllocateCount AllocateCount All Low
Connections Returned FreedCount FreedCount All Low
Connection Return Rate(per sec) FreedCount FreedCount All Low
Connections Destroyed CloseCount CloseCount Basic Low
Connection DestructionRate (per sec) CloseCount CloseCount Basic Low
Connection PoolTimeouts FaultCount FaultCount All Low
Connection PoolTimeout Rate (per sec) FaultCount FaultCount All Low
Thread Pools Table Name: KYNTHRDP
TEP Console ColumnName WebSphere 7 PMI Attribute WebSphere 8 PMI Attribute
WebSpherePMI Level Overhead
Category: Thread Pools
Maximum Pool Size PoolSize PoolSize Basic High
Average Pool Size PoolSize PoolSize Basic High
Average Active Threads ActiveCount ActiveCount Extended High
Average Free Threads PoolSize - ActiveCount PoolSize - ActiveCount Extended High
Percent of Time Pool atMax PercentMaxed PercentMaxed All High
Threads Created CreateCount CreateCount All Low
Thread Creation Rate(per sec) CreateCount CreateCount All Low
Chapter 3. ITCAM Agent for WebSphere Applications 381

Table 77. TEP Console Workspace Columns to WebSphere PMI Attribute Mapping (continued).
TEP Console Workspace Columns to WebSphere PMI Attribute Mapping
Threads Destroyed DestroyCount DestroyCount All Low
Thread Destruction Rate(per sec) DestroyCount DestroyCount All Low
Thread Pools ---AlarmManager ITM Table Name: KYNALARMM
TEP Console ColumnName WebSphere 7 PMI Attribute WebSphere 8 PMI Attribute
WebSpherePMI Level Overhead
Category: Alarm Manager
Alarms Cancelled AlarmsCancelledCount AlarmsCancelledCount All High
Alarms LatencyDuration AlarmLatencyDuration AlarmLatencyDuration All High
Alarms Rate AlarmRate AlarmRate All High
Alarms Created AlarmsCreatedCount AlarmsCreatedCount All High
Alarms Fired AlarmsFiredCount AlarmsFiredCount All High
Alarms Pending Size AlarmsPendingSize AlarmsPendingSize All High
Dynamic Cache ITM Table Name: KYNCACHE
TEP Console ColumnName WebSphere 7 PMI Attribute WebSphere 8 PMI Attribute
WebSpherePMI Level Overhead
Category: Dynamic Caching
Maximum In-MemoryCache Size MaxInMemoryCacheEntryCount MaxInMemoryCacheEntryCount All Low
Current In-MemoryCache Size InMemoryCacheEntryCount InMemoryCacheEntryCount All Low
In-Memory and DiskTimeouts TimeoutInvalidationCount TimeoutInvalidationCount All Low
In-Memory and DiskTimeout Rate (per sec) TimeoutInvalidationCount TimeoutInvalidationCount All Low
Dynamic CacheTemplates ITM Table Name: KYNCACHT
TEP Console ColumnName WebSphere 7 PMI Attribute WebSphere 8 PMI Attribute
WebSpherePMI Level Overhead
Category: Templates
Current Cache SizeInMemoryAndDiskCacheEntryCount
InMemoryAndDiskCacheEntryCount All Low
Disk Hits HitsOnDiskCount HitsOnDiskCount All Low
Disk Hit Rate(per sec) HitsOnDiskCount HitsOnDiskCount All Low
Memory Hits HitsInMemoryCount HitsInMemoryCount Extended Low
Memory Hit Rate(persec) HitsInMemoryCount HitsInMemoryCount Extended Low
Remote Hits RemoteHitCount RemoteHitCount All Low
Remote Hit Rate(persec) RemoteHitCount RemoteHitCount All Low
Cache Misses MissCount MissCount Extended Low
382 ITCAM Agents for WebSphere Applications, J2EE, and HTTP Servers: User Guide

Table 77. TEP Console Workspace Columns to WebSphere PMI Attribute Mapping (continued).
TEP Console Workspace Columns to WebSphere PMI Attribute Mapping
Cache Miss Rate(persec) MissCount MissCount Extended Low
Remote Cache EntriesReceived RemoteCreationCount RemoteCreationCount All Low
Remote Cache EntryReceive Rate(per sec) RemoteCreationCount RemoteCreationCount All Low
Client Requests ClientRequestCount ClientRequestCount All Low
Client Request Rate(persec) ClientRequestCount ClientRequestCount All Low
Cluster Requests DistributedRequestCount DistributedRequestCount All Low
Cluster RequestRate(per sec) DistributedRequestCount DistributedRequestCount All Low
Total ExplicitInvalidations ExplicitInvalidationCount ExplicitInvalidationCount All Low
Total ExplicitInvalidation Rate(persec) ExplicitInvalidationCount ExplicitInvalidationCount All Low
Timeout Invalidations TimeoutInvalidationCount TimeoutInvalidationCount All Low
Timeout InvalidationRate(per sec) TimeoutInvalidationCount TimeoutInvalidationCount All Low
Least Recently UsedInvalidations LruInvalidationCount LruInvalidationCount All Low
Least Recently UsedInvalidation Rate(persec) LruInvalidationCount LruInvalidationCount All Low
Explicit MemoryInvalidations ExplicitMemoryInvalidationCount ExplicitMemoryInvalidationCount All Low
Explicit MemoryInvalidation Rate(persec) ExplicitMemoryInvalidationCount ExplicitMemoryInvalidationCount All Low
Explicit DiskInvalidations ExplicitDiskInvalidationCount ExplicitDiskInvalidationCount All Low
Explicit DiskInvalidations Rate(persec) ExplicitDiskInvalidationCount ExplicitDiskInvalidationCount All Low
Explicit LocalInvalidations LocalExplicitInvalidationCount LocalExplicitInvalidationCount All Low
Explicit LocalInvalidation Rate(persec) LocalExplicitInvalidationCount LocalExplicitInvalidationCount All Low
Explicit RemoteInvalidations RemoteExplicitInvalidationCount RemoteExplicitInvalidationCount All Low
Explicit RemoteInvalidation Rate(persec) RemoteExplicitInvalidationCount RemoteExplicitInvalidationCount All Low
Workload ManagementClient ITM Table Name: KYNWLMCL
TEP Console ColumnName WebSphere 7 PMI Attribute WebSphere 8 PMI Attribute
WebSpherePMI Level Overhead
Category: Workload Managementclient
Chapter 3. ITCAM Agent for WebSphere Applications 383

Table 77. TEP Console Workspace Columns to WebSphere PMI Attribute Mapping (continued).
TEP Console Workspace Columns to WebSphere PMI Attribute Mapping
Outgoing Requests OutgoingIIOPRequestCount OutgoingIIOPRequestCount All Low
Outgoing Request Rate(per sec) OutgoingIIOPRequestCount OutgoingIIOPRequestCount All Low
Client Cluster Updates ClientClusterUpdateCount ClientClusterUpdateCount All Low
Client Cluster UpdateRate (per sec) ClientClusterUpdateCount ClientClusterUpdateCount All Low
Client Response Time ClientResponseTime ClientResponseTime All Medium
Workload ManagementServer ITM Table Name: KYNWLMSR
WebSphere PMI Level
TEP Console ColumnName WebSphere 7 PMI Attribute WebSphere 8 PMI Attribute
WebSpherePMI Level Overhead
Category: Workload Managementserver
Incoming Requests IIOPRequestCount IIOPRequestCount Extended Low
Incoming Request Rate(per sec) IIOPRequestCount IIOPRequestCount Extended Low
Incoming StrongAffinity Requests StrongAffinityIIOPRequestCount StrongAffinityIIOPRequestCount All Low
Incoming StrongAffinity Request Rate(per sec) StrongAffinityIIOPRequestCount StrongAffinityIIOPRequestCount All Low
Incoming NonaffinityRequests NoAffinityIIOPRequestCount NoAffinityIIOPRequestCount All Low
Incoming NonaffinityRequest Rate (per sec) NoAffinityIIOPRequestCount NoAffinityIIOPRequestCount All Low
Incoming Non-WLMObject Requests NonWLMEnabledIIOPRequestCount NonWLMEnabledIIOPRequestCount All Low
Incoming Non-WLMObject Request Rate(per sec) NonWLMEnabledIIOPRequest Count NonWLMEnabledIIOPRequestCount All Low
Server Cluster Updates ServerClusterUpdateCount ServerClusterUpdateCount All Low
Server Cluster UpdateRate (per sec) ServerClusterUpdateCount ServerClusterUpdateCount All Low
WLM Clients Serviced WLMClientsServicedCount WLMClientsServicedCount All Low
WLM Clients ServicedRate (per sec) WLMClientsServicedCount WLMClientsServicedCount All Low
Concurrent Requests ConcurrentRequestCount ConcurrentRequestCount Extended High
Server Response Time(ms) ServerResponseTime ServerResponseTime Extended Medium
Scheduler ITM Table Name: KYNSCHED
TEP Console ColumnName WebSphere 7 PMI Attribute WebSphere 8 PMI Attribute
WebSpherePMI Level Overhead
Category: Schedulers
Poll Count PollCount PollCount All High
Poll Duration PollDuration PollDuration All High
384 ITCAM Agents for WebSphere Applications, J2EE, and HTTP Servers: User Guide

Table 77. TEP Console Workspace Columns to WebSphere PMI Attribute Mapping (continued).
TEP Console Workspace Columns to WebSphere PMI Attribute Mapping
Poll Query Duration PollQueryDuration PollQueryDuration All High
Run Duration RunDuration RunDuration All High
Task Collision Rate TaskCollisionRate TaskCollisionRate All High
Task Delay Duration TaskDelayDuration TaskDelayDuration All High
Task Expiration Rate TaskExpirationRate TaskExpirationRate All High
Task Failure Count TaskFailureCount TaskFailureCount All High
Task Finish Count TaskFinishCount TaskFinishCount All High
Task Finish Rate TaskFinishRate TaskFinishRate All High
Task Run Rate TaskRunRate TaskRunRate All High
Web Services ITM Table Name: KYNWEBSVC
TEP Console ColumnName WebSphere 7 PMI Attribute WebSphere 8 PMI Attribute
WebSpherePMI Level Overhead
Category: Web services
Received Requests ReceivedRequestCount ReceivedRequestCount All Low
Dispatched Requests DispatchedRequestCount DispatchedRequestCount All Low
Processed Requests ProcessedRequestCount ProcessedRequestCount All Low
Response Time ResponseTime ResponseTime All High
Request Response Time RequestResponseTime RequestResponseTime All Medium
Dispatch ResponseTime DispatchResponseTime DispatchResponseTime All Medium
Reply Response Time ReplyResponseTime ReplyResponseTime All Medium
Payload Size PayloadSize PayloadSize All Medium
Reply Payload Size ReplyPayloadSize ReplyPayloadSize All Medium
Request Payload Size RequestPayloadSize RequestPayloadSize All Medium
WebServices Gateway ITM Table Name: KYNWEBSGW
TEP Console ColumnName WebSphere 7 PMI Attribute WebSphere 8 PMI Attribute
WebSpherePMI Level Overhead
Category: Web services Gateway
Synchronous Requests SynchronousRequestCount SynchronousRequestCount All Low
Synchronous Responses SynchronousResponseCount SynchronousResponseCount All Low
Asynchronous Requests AsynchronousRequestCount AsynchronousRequestCount All Low
AsynchronousResponses AsynchronousResponseCount AsynchronousResponseCount All Low
Messaging Engines ITM Table Name: KYNMSGENG
TEP Console ColumnName WebSphere 7 PMI Attribute WebSphere 8 PMI Attribute
WebSpherePMI Level Overhead
Category: SIB Service > SIBMessaging Engines
Average Local WaitTime (ms) LocalMessageWaitTime LocalMessageWaitTime All Low
Chapter 3. ITCAM Agent for WebSphere Applications 385

Table 77. TEP Console Workspace Columns to WebSphere PMI Attribute Mapping (continued).
TEP Console Workspace Columns to WebSphere PMI Attribute Mapping
Expired Messages ReportEnabledMessagesExpiredCount ReportEnabledMessagesExpiredCount All Low
Incomplete TopicPublications IncompletePublicationCount IncompletePublicationCount All Low
Total Published TotalMessagesPublishedCount TotalMessagesPublishedCount All Low
Client Communications ITM Table Name: KYNCLICOM
TEP Console ColumnName WebSphere 7 PMI Attribute WebSphere 8 PMI Attribute
WebSpherePMI Level Overhead
Category: Standard Statistics
Clients Attached ClientsAttachedCount ClientsAttached All Low
API Connections APIConnectionsCount APIConnections All Low
Errors ErrorsCount Errors All Low
Writes WritesCount Writes All Low
Reads ReadsCount Reads All Low
Writes Blocked WritesBlockedCount WritesBlocked All Low
Reads Blocked ReadsBlockedCount ReadsBlocked All Low
Multicast Write (bytes) MulticastWriteBytesCount MulticastWriteBytes All Low
Multicast SendMessages MulticastSendMessageCount MulticastSendMessage All Low
Buffered Write (bytes) BufferedWriteBytesCount BufferedWriteBytes All Low
Buffered Read (bytes) BufferedReadBytesCount BufferedReadBytes All Low
Message Written (bytes) MessagesBytesWrittenCount ClientStats.MessageBytesWritten All Low
Message Read (bytes) MessageBytesReadCount MessageBytesRead All Low
Total Written (bytes) TotalBytesWrittenCount TotalBytesWritten All Low
Total Read (bytes) TotalBytesReadCount TotalBytesRead All Low
Category: Detailed Statistics
Sent at Highest Priority(bytes) BytesSentAtHighestPriorityCount BytesSentAtHighestPriority All Low
Sent at Very HighPriority (bytes) BytesSentAtVeryHighPriorityCount BytesSentAtVeryHighPriority All Low
Sent at High Priority(bytes) BytesSentAtHighPriorityCount BytesSentAtHighPriority All Low
Sent at JMS 9 Priority(bytes) BytesSentAtJMS9PriorityCount BytesSentAtJMS9Priority All Low
Sent at JMS 8 Priority(bytes) BytesSentAtJMS8PriorityCount BytesSentAtJMS8Priority All Low
Sent at JMS 7 Priority(bytes) BytesSentAtJMS7PriorityCount BytesSentAtJMS7Priority All Low
Sent at JMS 6 Priority BytesSentAtJMS6PriorityCount BytesSentAtJMS6Priority All Low
Sent at JMS 5 Priority(bytes) BytesSentAtJMS5PriorityCount BytesSentAtJMS5Priority All Low
Sent at JMS 4 Priority(bytes) BytesSentAtJMS4PriorityCount BytesSentAtJMS4Priority All Low
Sent at JMS 3 Priority(bytes) BytesSentAtJMS3PriorityCount BytesSentAtJMS3Priority All Low
Sent at JMS 2 Priority(bytes) BytesSentAtJMS2PriorityCount BytesSentAtJMS2Priority All Low
386 ITCAM Agents for WebSphere Applications, J2EE, and HTTP Servers: User Guide

Table 77. TEP Console Workspace Columns to WebSphere PMI Attribute Mapping (continued).
TEP Console Workspace Columns to WebSphere PMI Attribute Mapping
Sent at JMS 1 Priority(bytes) BytesSentAtJMS1PriorityCount BytesSentAtJMS1Priority All Low
Sent at JMS 0 Priority(bytes) BytesSentAtJMS0PriorityCount BytesSentAtJMS0Priority All Low
Sent at Low Priority(bytes) BytesSentAtLowPriorityCount BytesSentAtLowPriority All Low
Sent at Very LowPriority (bytes) BytesSentAtVeryLowPriorityCount BytesSentAtVeryLowPriority All Low
Sent at Lowest Priority(bytes) BytesSentAtLowestPriorityCount BytesSentAtLowestPriority All Low
Received at HighestPriority (bytes) BytesReceivedAtHighestPriorityCount BytesReceivedAtHighestPriority All Low
Received at Very HighPriority (bytes)
BytesReceivedAtVeryHighPriorityCount BytesReceivedAtVeryHighPriority All Low
Received at HighPriority (bytes) BytesReceivedAtHighPriorityCount BytesReceivedAtHighPriority All Low
Received at JMS 9Priority (bytes) BytesReceivedAtJMS9PriorityCount BytesReceivedAtJMS9Priority All Low
Received at JMS 8Priority (bytes) BytesReceivedAtJMS8PriorityCount BytesReceivedAtJMS8Priority All Low
Received at JMS 7Priority (bytes) BytesReceivedAtJMS7PriorityCount BytesReceivedAtJMS7Priority All Low
Received at JMS 6Priority (bytes) BytesReceivedAtJMS6PriorityCount BytesReceivedAtJMS6Priority All Low
Received at JMS 5Priority (bytes) BytesReceivedAtJMS5PriorityCount BytesReceivedAtJMS5Priority All Low
Received at JMS 4Priority (bytes) BytesReceivedAtJMS4PriorityCount BytesReceivedAtJMS4Priority All Low
Received at JMS 3Priority (bytes) BytesReceivedAtJMS3PriorityCount BytesReceivedAtJMS3Priority All Low
Received at JMS 2Priority (bytes) BytesReceivedAtJMS2PriorityCount BytesReceivedAtJMS2Priority All Low
Received at JMS 1Priority (bytes) BytesReceivedAtJMS1PriorityCount BytesReceivedAtJMS1Priority All Low
Received at JMS 0Priority (bytes) BytesReceivedAtJMS0PriorityCount BytesReceivedAtJMS0Priority All Low
Received at LowPriority (bytes) BytesReceivedAtLowPriorityCount BytesReceivedAtLowPriority All Low
Received at Very LowPriority (bytes)
BytesReceivedAtVeryLowPriorityCount BytesReceivedAtVeryLowPriority All Low
Received at LowestPriority (bytes) BytesReceivedAtLowestPriorityCount BytesReceivedAtLowestPriority All Low
Messages Sent at JMS 9Priority MessagesSentAtJMS9PriorityCount MessagesSentAtJMS9Priority All Low
Messages Sent at JMS 8Priority MessagesSentAtJMS8PriorityCount MessagesSentAtJMS8Priority All Low
Messages Sent at JMS 7Priority MessagesSentAtJMS7PriorityCount MessagesSentAtJMS7Priority All Low
Messages Sent at JMS 6Priority MessagesSentAtJMS6PriorityCount MessagesSentAtJMS6Priority All Low
Messages Sent at JMS 5Priority MessagesSentAtJMS5PriorityCount MessagesSentAtJMS5Priority All Low
Chapter 3. ITCAM Agent for WebSphere Applications 387

Table 77. TEP Console Workspace Columns to WebSphere PMI Attribute Mapping (continued).
TEP Console Workspace Columns to WebSphere PMI Attribute Mapping
Messages Sent at JMS 4Priority MessagesSentAtJMS4PriorityCount MessagesSentAtJMS4Priority All Low
Messages Sent at JMS 3Priority MessagesSentAtJMS3PriorityCount MessagesSentAtJMS3Priority All Low
Messages Sent at JMS 2Priority MessagesSentAtJMS2PriorityCount MessagesSentAtJMS2Priority All Low
Messages Sent at JMS 1Priority MessagesSentAtJMS1PriorityCount MessagesSentAtJMS1Priority All Low
Messages Sent at JMS 0Priority MessagesSentAtJMS0PriorityCount MessagesSentAtJMS0Priority All Low
Messages Received atJMS 9 Priority
MessagesReceivedAtJMS9PriorityCount MessagesReceivedAtJMS9Priority All Low
Messages Received atJMS 8 Priority
MessagesReceivedAtJMS8PriorityCount MessagesReceivedAtJMS8Priority All Low
Messages Received atJMS 7 Priority
MessagesReceivedAtJMS7PriorityCount MessagesReceivedAtJMS7Priority All Low
Messages Received atJMS 6 Priority
MessagesReceivedAtJMS6PriorityCount MessagesReceivedAtJMS6Priority All Low
Messages Received atJMS 5 Priority
MessagesReceivedAtJMS5PriorityCount MessagesReceivedAtJMS5Priority All Low
Messages Received atJMS 4 Priority
MessagesReceivedAtJMS4PriorityCount MessagesReceivedAtJMS4Priority All Low
Messages Received atJMS 3 Priority
MessagesReceivedAtJMS3PriorityCount MessagesReceivedAtJMS3Priority All Low
Messages Received atJMS 2 Priority
MessagesReceivedAtJMS2PriorityCount MessagesReceivedAtJMS2Priority All Low
Messages Received atJMS 1 Priority
MessagesReceivedAtJMS1PriorityCount MessagesReceivedAtJMS1Priority All Low
Messages Received atJMS 0 Priority
MessagesReceivedAtJMS0PriorityCount MessagesReceivedAtJMS0Priority All Low
Messaging EngineCommunications ITM Table Name: KYNMECOM
TEP Console ColumnName WebSphere 7 PMI Attribute WebSphere 8 PMI Attribute
WebSpherePMI Level Overhead
Category: SIB Communications >Messaging Engines > StandardStatistics
Messaging EngineAttached MEAttachedCount MEAttached All Low
API Connections APIConnectionsCount APIConnections All Low
Errors ErrorsCount Errors All Low
Writes WritesCount Writes All Low
Reads ReadsCount Reads All Low
Writes Blocked WritesBlockedCount WritesBlocked All Low
Reads Blocked ReadsBlockedCount ReadsBlocked All Low
Buffered Write (bytes) BufferedWriteBytesCount BufferedWriteBytes All Low
Buffered Reads (bytes) BufferedReadBytesCount BufferedReadBytes All Low
Message Written (bytes) MessageBytesWrittenCount MessageBytesWritten All Low
388 ITCAM Agents for WebSphere Applications, J2EE, and HTTP Servers: User Guide

Table 77. TEP Console Workspace Columns to WebSphere PMI Attribute Mapping (continued).
TEP Console Workspace Columns to WebSphere PMI Attribute Mapping
Message Read (bytes) MessageBytesReadCount MessageBytesRead All Low
Total Written (bytes) TotalBytesWrittenCount TotalBytesWritten All Low
Total Read (bytes) TotalBytesReadCount TotalBytesRead All Low
Durable Subscriptions ITM Table Name: KYNDURSUB
TEP Console ColumnName WebSphere 7 PMI Attribute WebSphere 8 PMI Attribute
WebSpherePMI Level Overhead
Category: SIB Service > SIBMessaging Engines > Destinations >Topicspaces > Durable Subscriptions
Available Message AvailableMessageCount AvailableMessageCount All Low
Total MessagesConsumed TotalMessagesConsumedCount TotalMessagesConsumedCount All Low
Best EffortNon-persistentMessages Consumed
BestEffortNonPersistentMessagesConsumedCount
BestEffortNonPersistentMessagesConsumedCount All Low
Express Non-persistentMessages Consumed
ExpressNonPersistentMessagesConsumedCount
ExpressNonPersistentMessagesConsumedCount All Low
Reliable Non-persistentMessages Consumed
ReliableNonPersistentMessagesConsumedCount
ReliableNonPersistentMessagesConsumedCount All Low
Reliable PersistentMessages Consumed
ReliablePersistentMessagesConsumedCount
ReliablePersistentMessagesConsumedCount All Low
Assured PersistentMessages Consumed
AssuredPersistentMessagesConsumedCount
AssuredPersistentMessagesConsumedCount All Low
Aggregate MessageWait Time AggregateMessageWaitTime AggregateMessageWaitTime All High
Local Message WaitTime LocalMessageWaitTime LocalMessageWaitTime All High
Local Oldest MessageAge LocalOldestPublicationAge LocalOldestPublicationAge All Max
Queue ITM Table Name: KYNMSGQUE
TEP Console ColumnName WebSphere 7 PMI Attribute WebSphere 8 PMI Attribute
WebSpherePMI Level Overhead
Category: SIB Service > SIBMessaging Engines > Destinations >Queues
Available Message AvailableMessageCount AvailableMessageCount All Low
Unavailable Message UnavailableMessageCount UnavailableMessageCount All Low
Local Producer Attaches LocalProducerAttachesCount LocalProducerAttachesCount All Low
Local Producer LocalProducerCount LocalProducerCount All Low
Local ConsumerAttaches LocalConsumerAttachesCount LocalConsumerAttachesCount All Low
Local Consumer LocalConsumerCount LocalConsumerCount All Low
Total MessagesProduced TotalMessagesProducedCount TotalMessagesProducedCount All Low
Chapter 3. ITCAM Agent for WebSphere Applications 389

Table 77. TEP Console Workspace Columns to WebSphere PMI Attribute Mapping (continued).
TEP Console Workspace Columns to WebSphere PMI Attribute Mapping
Best EffortNon-persistentMessages Produced
BestEffortNonPersistentMessagesProducedCount
BestEffortNonPersistentMessagesProducedCount All Low
Express Non-persistentMessages Produced
ExpressNonPersistentMessagesProducedCount
ExpressNonPersistentMessagesProducedCount All Low
Reliable Non-persistentMessages Produced
ReliableNonPersistentMessagesProducedCount
ReliableNonPersistentMessagesProducedCount All Low
Reliable PersistentMessages Produced
ReliablePersistentMessagesProducedCount
ReliablePersistentMessagesProducedCount All Low
Assured PersistentMessages Produced
AssuredPersistentMessagesProducedCount
AssuredPersistentMessagesProducedCount All Low
Total MessagesConsumed TotalMessagesConsumedCount TotalMessagesConsumedCount All Low
Best EffortNon-persistentMessages Consumed
BestEffortNonPersistentMessagesConsumedCount
BestEffortNonPersistentMessagesConsumedCount All Low
Express Non-persistentMessages Consumed
ExpressNonPersistentMessagesConsumedCount
ExpressNonPersistentMessagesConsumedCount All Low
Reliable Non-persistentMessages Consumed
ReliableNonPersistentMessagesConsumedCount
ReliableNonPersistentMessagesConsumedCount All Low
Reliable PersistentMessages Consumed
ReliablePersistentMessagesConsumedCount
ReliablePersistentMessagesConsumedCount All Low
Assured PersistentMessages Consumed
AssuredPersistentMessagesConsumedCount
AssuredPersistentMessagesConsumedCount All Low
Report EnabledMessages Expired
ReportEnabledMessagesExpiredCount
ReportEnabledMessagesExpiredCount All Low
Aggregate MessageWait Time AggregateMessageWaitTime AggregateMessageWaitTime All Low
Local Message WaitTime LocalMessageWaitTime LocalMessageWaitTime All Low
Local Oldest MessageAge LocalOldestMessageAge LocalOldestMessageAge All Low
Topic Spaces ITM Table Name: KYNTOPICSP
TEP Console ColumnName WebSphere 7 PMI Attribute WebSphere 8 PMI Attribute
WebSpherePMI Level Overhead
Category: SIB Service > SIBMessaging Engines > Destinations >Topicspaces
Incomplete Publication IncompletePublicationCount IncompletePublicationCount All Low
Local PublisherAttaches LocalPublisherAttachesCount LocalPublisherAttachesCount All Low
Local Publisher LocalPublisherCount LocalPublisherCount All Low
Total Local Subscription TotalLocalSubscriptionCount TotalLocalSubscriptionCount All Low
Non-durable LocalSubscription NonDurableLocalSubscriptionCount NonDurableLocalSubscriptionCount All Low
Durable LocalSubscription DurableLocalSubscriptionCount DurableLocalSubscriptionCount All Low
Total MessagesPublished TotalMessagesPublishedCount TotalMessagesPublishedCount All Low
390 ITCAM Agents for WebSphere Applications, J2EE, and HTTP Servers: User Guide

Table 77. TEP Console Workspace Columns to WebSphere PMI Attribute Mapping (continued).
TEP Console Workspace Columns to WebSphere PMI Attribute Mapping
Best EffortNon-persistentMessages Published
BestEffortNonPersistentMessagesPublishedCount
BestEffortNonPersistentMessagesPublishedCount All Low
Express Non-persistentMessages Published
ExpressNonPersistentMessagesPublishedCount
ExpressNonPersistentMessagesPublishedCount All Low
Reliable Non-persistentMessages Published
ReliableNonPersistentMessagesPublishedCount
ReliableNonPersistentMessagesPublishedCount All Low
Reliable PersistentMessages Published
ReliablePersistentMessagesPublishedCount
ReliablePersistentMessagesPublishedCount All Low
Assured PersistentMessages Published
AssuredPersistentMessagesPublishedCount
AssuredPersistentMessagesPublishedCount All Low
Total Local SubscriptionHits TotalLocalSubscriptionHitCount TotalLocalSubscriptionHitCount All Low
Best EffortNon-persistent LocalSubscription Hits
BestEffortNonPersistentLocalSubscriptionHitCount
BestEffortNonPersistentLocalSubscriptionHitCount All Low
Express Non-persistentLocal Subscription Hits
ExpressNonPersistentLocalSubscriptionHitCount
ExpressNonPersistentLocalSubscriptionHitCount All Low
Reliable Non-persistentLocal Subscription Hits
ReliableNonPersistentLocalSubscriptionHitCount
ReliableNonPersistentLocalSubscriptionHitCount All Low
Reliable Persistent LocalSubscription Hits
ReliablePersistentLocalSubscriptionHitCount
ReliablePersistentLocalSubscriptionHitCount All Low
Assured PersistentLocal Subscription Hits
AssuredPersistentLocalSubscriptionHitCount
AssuredPersistentLocalSubscriptionHitCount All Low
Report EnabledPublication Expired
ReportEnabledPublicationsExpiredCount
ReportEnabledPublicationsExpiredCount All Low
Local Oldest PublicationAge LocalOldestPublicationAge LocalOldestPublicationAge All Max
Important: Some attributes were renamed between WebSphere Application Serverversions 7 and 8. The names for version 8 also apply to version 8.5.
Data sources for workspacesITCAM Agent for Application Diagnostics collects data from several sources on theapplication server. Different workspaces use data from different sources.
Types of data
The Agent collects the following four types of data:v Resource datav Request datav Data from WebSphere log filesv Process data from the operating system
These four categories are based on the source from which the monitoring data iscollected. The workspaces in the Tivoli Enterprise Portal display data from thesesources. Usually, each workspace displays data from one of the sources. Someworkspaces contain summary information collected from one or more sources andprocessed by the Agent.
Chapter 3. ITCAM Agent for WebSphere Applications 391

Resource Data
ITCAM Agent for WebSphere Applications obtains resource data from thePerformance Monitoring Infrastructure (PMI) component that WebSphereApplication Server provides. This data mostly contains usage and performanceinformation about a resource in the system. For example, the "DB ConnectionPools" workspace provides data about connection pool resources, including howlong a connection is checked out, how many threads are waiting for connection,and so on.
Table 78. Workspaces that display resource data, which is obtained from PMI.
Workspace Description
“Web Applications workspace” on page 125 Displays performance data for each webapplication (.war). This data includesnumber of requests, average response time,and number of errors. Note that one Webapplication may have multiple URLs foruser requests and the response times for allthe requests are aggregated in this window.
“Servlets/JSPs - Selected Web Applicationworkspace” on page 120
Breaks down the performance data for aparticular Web application into the servletsor JavaServer pages (JSPs) that it contains.Again, each servlet/JSP can contain or bemapped to multiple URLs and all userrequests are combined.
“Sessions workspace” on page 122 Provides information regarding HTTPsessions created by each Web application.HTTP sessions are used to maintain a usersession between multiple invocations andstores user specific data. This workspacealso displays the total, average, maximum,and minimum sizes of the user data storedfor each Web application.
“EJB Containers workspace” on page 87 Provides an overview of the performance ofdifferent types of Enterprise JavaBeans(EJBs) deployed in the application server.
“Enterprise Java Beans workspace” on page89
Displays the performance data for each EJBdeployed in the application. Based on theBean type, data is available in theappropriate columns.
“Container Transactions workspace” on page79
Provides performance data regarding Java®
Transaction API (JTA) transactions the EJBsare involved in.
“Container Object Pools workspace” on page78
Provides information about the behavior ofstateless and entity bean pools.
“DB Connection Pools workspace” on page82
Displays the usage data regarding Databaseconnection pools such as the number ofconnections available, checked out, threadswaiting for a connection, and so on. Thisworkspace is useful in understanding thepool usage and identifying potentialbottlenecks in application performance whena thread is waiting or getting timed out for aconnection from the pool.
392 ITCAM Agents for WebSphere Applications, J2EE, and HTTP Servers: User Guide

Table 78. Workspaces that display resource data, which is obtained from PMI. (continued)
Workspace Description
“J2C Connection Pools workspace” on page94
Displays the usage data for connection poolsset up for Java Connector Architecture (JCA)based resource adapters. The WebSphereApplication Server creates connection poolsfor the resource adapters that are deployed(some of the adapters are provided byapplication server installation itself) and thisworkspace is useful in monitoringperformance bottlenecks in terms of waittimes to obtain a connection.
“Pool Analysis workspace” on page 103 Provides information about the usage ofseveral types of pools associated with eachapplication server, including Web containerpools, ORB pools, J2C connection pools, anddatabase connection pools. This workspacehelps you detect resource constraints andpotential performance congestion.
“Thread Pools workspace” on page 123 Displays the usage data for thread pools.The data can be used to determine whetherthe pool is configured correctly to serviceuser requests. For example, the WebContainer thread pool is used to executeservlet requests from the users and if thenumber of threads in the pool is smallcompared to the number of incomingrequests, there will be a delay in servicingthem leading to slower response times.
“Thread Pool Trend workspace” on page 124 Displays trend information about threadpool size and usage.
Cache Analysis: Dynamic Cache“CacheAnalysis workspace” on page 76
Provides the usage data of the variousdynamic caches that have been configured inthe system. In WebSphere Application Server6.x and later, multiple caches can beconfigured.
Also provides the usage data for eachdynamic cache template. The templates areunique IDs that are specified in thecachespec.xml files to identify differentURLs that must be cached.
Chapter 3. ITCAM Agent for WebSphere Applications 393

Table 78. Workspaces that display resource data, which is obtained from PMI. (continued)
Workspace Description
“Workload Management workspace” onpage 134
Workload management distributes the userrequests made through the Object RequestBroker (ORB) to different servers in a cluster.This usually means that this feature willcome into play only when remote EJB callsare made over the ORB. This feature isapplicable only in the ND (NetworkDeployment) environment when clusters areset up, so that the workload can bedistributed when remote EJB calls areinvoked over the ORB.
If the ORB is not used, this feature is notexercised and there will be no data in thisworkspace. If a server has both Servlets andEJBs on the same server instance, the callsare usually configured to be local callsinstead of remote calls for betterperformance, and hence the ORB will notcome into play. The server side dataprovides information about the number ofrequests received on the server side (forexample, the EJB container receiving theuser requests).
“Scheduler workspace” on page 121 Scheduler service runs periodic tasks.Schedulers are persistent transactional timerservices that run Enterprise JavaBeanmethods or send Java Message Servicemessages using any JEE server application.
“Web Services workspace” on page 127 Provides performance data on the WebServices hosted by the application serverinstance. Web Services provides dataregarding number of Web services loaded,number of requests delivered, size of therequests, and so on.
Also includes information on the Webservices gateway, which is used to map anexisting service - either an inbound or anoutbound service - to a new Web servicethat appears to be provided by the gateway.The gateway acts as a proxy: your gatewayservice users need not know whether theunderlying service is being providedinternally or externally. The gatewayprovides you with a single point of control,access and validation of Web servicerequests, and allows you to control whichWeb services are available to differentgroups of Web service users.
“Workplace Mail workspace” on page 135 Provides aggregated statistics of the usageinformation about the incoming messagetraffic.
“Messages Queues workspace” on page 99 Provides information about messagedelivery state, including ready retry,unprocessed, and dead.
394 ITCAM Agents for WebSphere Applications, J2EE, and HTTP Servers: User Guide

Table 78. Workspaces that display resource data, which is obtained from PMI. (continued)
Workspace Description
“Messaging workspace” on page 101 The messaging engines defined in variousService Integration Buses in this applicationserver. Provides performance numbers oneach messaging engine such as number ofmessages published. This workspacedisplays data only when a ServiceIntegration Bus (SIB) is available in thesystem.
“Client Communications workspace” onpage 77
Provides communication details withdistinct client processes that are currentlynetwork-connected to the Service IntegrationBuses of this application server. The datadeals with messages sent and received fromand to the various client processes.
“Messaging Engine Communicationsworkspace” on page 100
Provides information about other applicationservers that are hosting messaging enginesand are network-connected to thisapplication server. The Service IntegrationBus is used to send and receive messagesfrom these messaging engines.
“Destinations workspace” on page 85 Provides performance data and counters forthe destinations of a selected messagingengine. This includes the numbers ofavailable and unavailable messages,numbers of messages produced andconsumed, aggregated wait times and so on.
“WMQ Client Link Communicationsworkspace” on page 132
Provides information regardingcommunication to WebSphere MQ JMSclients that are connected to this applicationserver.
“WMQ Link Communications workspace”on page 133
Provides information regardingcommunication to WebSphere MQ JMSqueue managers that are connected to thisapplication server.
“Alarm Manager workspace” on page 71 Provides aggregated information about thealarms for each work manager. This includesthe number of alarms created, fired, canceledand so on.
“DCS Stacks workspace” on page 84 Provides aggregated information about eachDCS stack within the entire WebSphereApplication Server domain, includingmultiple nodes and servers. This includesthe incoming and outgoing message size, thenumber of incoming and outgoing messages,congestion events, and message bufferre-allocations.
“Durable Subscriptions workspace” on page86
Provides statistic counters for the durablesubscriptions of a selected topic.
“High Availability Manager workspace” onpage 92
Provides aggregated information about highavailability managers.
Chapter 3. ITCAM Agent for WebSphere Applications 395

Table 78. Workspaces that display resource data, which is obtained from PMI. (continued)
Workspace Description
“IMAP/POP workspace” on page 93 Provides aggregated statistics of the usageinformation about the IMAP service and thePOP3 service connectivity, especially for theperformance-related connectivity.
“Service Components workspace” on page119
Provides overview performance of the keyservice components. WebSphere serversfeature their own service components, andeach of these components has its own set ofevent points that can be monitored.
“Service Component Elements workspace”on page 117
Lists performance metrics for all the servicecomponents and their elements. Servicecomponents contain one or more elements,which are sets of different steps processed ineach service component. In turn, eachelement has its own set of event natures,which are key points that are reached whenprocessing a service component element.
The availability of data in these workspaces depends on whether PMI is turned onin the WebSphere Application Server, and on the level of PMI data collection thatis turned on.
PMI might be enabled at None, Basic, Extended, All, Custom levels. Each of theselevels turns on a set of data counters. The higher level is inclusive of all thecounters turned on at the lower level. As you go higher, the cost overhead for thecollection increases. The "low" level incurs the least cost (usually obtains data thatdisplays various "counts") and the "maximum" level incurs the highest cost (this,for example, returns time average data that requires extra memory and processing).
There is an additional "custom" level where individual data attributes can beturned on in addition to the data collection levels based on cost.
Hence, to view the Resource data in the portal workspaces, you will need tocomplete the following steps:1. Have the appropriate resources defined. For example, JDBC providers and
Datasources defined with connection pools to see data in DB Connection pools,Schedulers defined to see any data in the Schedulers workspace, and so on.
2. Turn on the PMI monitoring in the WebSphere Application Server (eitherthrough the admin console, wsadmin, or custom scripts).
3. Select the appropriate level of PMI data collection based on the desired datathat needs to be monitored.
For a list of the PMI categories and attributes that the Agent workspaces and tablesuse, see “WebSphere PMI Attribute Mapping” on page 373.
Request Data
The Request data traces user transactions and measures the time to performvarious activities (such as database access and JMS operations). Depending on theRequest Data workspace, this information is grouped into various categories. Forexample, in the Request Analysis workspace the data is grouped by the request
396 ITCAM Agents for WebSphere Applications, J2EE, and HTTP Servers: User Guide

name (either the URL for servlets/JSPs or the EJB name) and in DataSourcesworkspaces by the name of the Datasource.
ITCAM Agent for WebSphere Applications tracks the user transactions bymodifying application and WebSphere system Java classes by adding method entryand exit "hooks". These hooks are callback methods into the ITCAM Data collectorfor WebSphere module that will track a user transaction as it travels through theclasses in various modules (servlets, EJBs, Datasources, JMS, and so on). Theapplication and WebSphere Application Server system Java classes are modifiedwhen they are loaded by WebSphere classloaders. During this load time, based onthe type of class - Servlets, EJB, Datasource, JMS, JCA, JNDI, and so on - differentcallback methods are injected into the class using "Byte Code Modification" (BCM).
Table 79. Workspaces that display request data, which is obtained through Byte CodeModification.
Workspace Monitoring level Description
“Request Analysisworkspace” on page 107
Level 1 This workspace displays thenumber of user requests thatwere tracked during thesampling interval and theiraverage response times. Therequests are grouped byURLs for servlet calls andEJB names for direct EJBcalls.
“Request Baselineworkspace” on page 109
Level 1 This workspace displaysaggregated informationabout the request baseline. Inthe baselining process, theagent collects statisticalinformation about a requestcompletion times and usesthis information to assign"fair" and "bad" thresholdsfor requests.
“Request Analysisworkspace” on page 107
Level 2 In addition to Level 1 data,the workspace also showsthe breakdown of theresponse times intoapplication, SQL Query, SQLUpdate, JCA, JMS, JNDI,SCA, web services processingtimes. This breakdown canbe displayed in millisecondsand as a percentage ofaverage response time.
Chapter 3. ITCAM Agent for WebSphere Applications 397

Table 79. Workspaces that display request data, which is obtained through Byte CodeModification. (continued)
Workspace Monitoring level Description
“Selected Request -Datasources workspace” onpage 115
“Selected Request - JMSQueues workspace” on page115
“Selected Request - ResourceAdapters workspace” onpage 116
“Selected Request - ServiceComponents workspace” onpage 117
Level 2 To access this workspace,clicking the link icon on therow header of each row inthe Request Analysisworkspace. This workspaceprovides more details on theresources accessed by theselected user transaction -including the resourcenames, the average responsetime, and the longestresponse time during thesampling interval.
“Data sources workspace” onpage 80
Level 2 This workspace displays thetime spent on various Datasource operations. Theoperations include obtaininga connection, and executing aquery or update. Theworkspace also shows thenumber of connections usedduring the sampling interval.The data in this workspacesupplements the “DBConnection Poolsworkspace” on page 82 byidentifying the reason forlong connection checkouttimes.
“JMS Summary workspace”on page 96
Level 2 This workspace providescount and timemeasurements for JMSoperations: send, receive,browse, and publish. Itdisplays data on a queue andtopic basis. The dataprovides a breakdown of theJMS delay shown in theRequest Analysis workspace.
The Monitoring Level determines the amount of collected request data. At Level 2the Agent collects more detailed data and incurs additional overhead in terms ofmemory and processing time. The default is Level 1. To change the value, use the“Start_Request_Monitoring : Begin reporting request data” on page 296 TakeAction command.
Another parameter that determines the amount of data collected is the RequestData Sampling Rate. It specifies the percentage of user requests that the Agenttracks and monitors. When the load on the system is very large, tracking everysingle user request becomes very expensive. Therefore, the Agent uses a samplingapproach to monitor the performance of the applications. The default is 2% (i.e.only 2 out of every 100 user requests are tracked).
398 ITCAM Agents for WebSphere Applications, J2EE, and HTTP Servers: User Guide

However, the load on your system might be very low (for example, in a testsystem you might apply a 10 user load). In this case, you might see no data in theRequest Data workspaces with the default setting of 2%, as the probability oftracking one of the 10 requests will be very low. Hence, you need to increase thesampling rate in systems with low load. Use the “Set_Request_Sampling_Rate: Setthe sampling rate for request data” on page 295 Take Action command to do this.
Log File Data
ITCAM Agent for WebSphere Applications reads the application server log filesand analyzes them to display data in several workspaces.
Table 80. Workspaces that display log file data.
Workspace Log file Description
“Garbage Collection Analysisworkspace” on page 90
Native error file specified inapplication serverconfiguration. The file nameis set when configuring theData Collector (the default isgc.log).
ITCAM Agent for WebSphereApplications scans theverbose garbage collection(GC) log to provideinformation about how theGC is performing. Thisworkspace can identifyapplication performanceissues when the GCconsumes a lot of time. Suchissues usually happen whenthe heap size parameters inthe JVM are not set correctly.You can stop and start thecollection of GC data usingthe Start_GC_Monitoring andStop_GC_Monitoring TakeAction commands.Important: the Take Actioncommand does not turn onand off the verbose GC flagin WebSphere JVM. This flagis required for collection ofGC data. You might need toenable or disable it using theapplication server adminconsole.
“Allocation Failuresworkspace” on page 72
Same as Garbage CollectionAnalysis
Provides information aboutheap allocation failures thatcause the JVM to invokegarbage collection.
“JVM Stack Trendworkspace” on page 97
Same as Garbage CollectionAnalysis
Provides trend dataregarding JVM CPU usage,JVM garbage collection, andJVM heap usage. DisplaysOperating System data forCPU usage.
Chapter 3. ITCAM Agent for WebSphere Applications 399

Table 80. Workspaces that display log file data. (continued)
Workspace Log file Description
“Log Analysis workspace”on page 98
SystemOut.log The Agent scans theapplication serverSystemOut.log file andretrieves the messages fordisplay in this workspace.Use the workspace to beinformed about the health ofthe application server andalso to create situations whencertain message IDs areencountered.
“Log Analysis workspace”on page 98
Data Collector messageevents
Displays the Data Collectordiagnostic messages,informing whether the DataCollector has initialized andis working correctly.
Application server process data from the operating system
ITCAM Agent for WebSphere Applications obtains the system CPU usage for theapplication server process by making operating system calls. This data is displayedin the “Application Server Summary and Business Process Manager Summaryworkspaces” on page 50 in the CPU Used (ms) and CPU Used (%) columns. The“JVM Stack Trend workspace” on page 97 also uses this data.
The “OS Stack workspace” on page 102 displays detailed operating systemperformance information for the application server.
WebSphere summary and aggregated information
The following workspaces contain summary or aggregated information forWebSphere Application Server:
Table 81. Workspaces that display summary and aggregated information.
Workspace Description
“Application Server Summary and BusinessProcess Manager Summary workspaces” onpage 50
This workspace displays overall statisticinformation for each application server thatis monitored by the agent. The informationincludes history of heap usage, responsetimes, request rates, and % CPU used.
“WebSphere Agent workspace” on page 128 This workspace displays events occurringwithin the agent and all the applicationservers on the host. It also displays statusinformation about the agent and theonline/offline status of the monitoredservers.
“EJB Tier Analysis workspace” on page 110 The workspace displays information aboutthe health of a WebSphere application basedon response time and completion rates forEJB requests. It also displays ORB threadpool information and PMI informationrelated to EJB requests.
400 ITCAM Agents for WebSphere Applications, J2EE, and HTTP Servers: User Guide

Table 81. Workspaces that display summary and aggregated information. (continued)
Workspace Description
“Backend Tier Analysis workspace” on page112
The workspace displays information aboutthe health of a WebSphere application basedon response time for Backend Tier requests.It also displays information about backendtier resources, including Data Sources, JMSresources, JDBC and JCA Pools, and JVMstatistics.
“Web Tier Analysis workspace” on page 113 The workspace displays information aboutthe health of a WebSphere application basedon response time and completion rates forWeb Tier requests. It also displaysWebContainer thread pool information andPMI information related to HTTP sessions.
z/OS region workspaces
In a z/OS environment, most workspace tables report data at both a region andserver instance level. The advantage is that you can view metrics collected at bothlevels and switch between server instance lever and region level.
Data Display Problems
If you do not see data in the portal workspaces, use the following checklist toverify the settings.
Workspace Checkpoint Comments
All Workspaces The application server isrunning and the monitoringagent is connected to it
Check that the Statuscolumn in the “ApplicationServer Summary andBusiness Process ManagerSummary workspaces” onpage 50 shows Connected.
All Workspaces There is user load applied onthe application server
The Request data workspacesdisplay data only when userload is applied. The Resourcedata workspaces still displaydata rows even if load is notapplied, but the columns willeither be empty or displayzeros. The data rows in thiscase are created from theapplication serverconfiguration informationabout the resource type.
Chapter 3. ITCAM Agent for WebSphere Applications 401

Workspace Checkpoint Comments
Request Data Workspaces Request Data collection isturned on
Verify by checking theRequest Data MonitoringLevel column in theApplication Server Summaryworkspace is not Disabled. Ifit is Disabled, start themonitoring by using the“Start_Request_Monitoring :Begin reporting request data”on page 296 Take Actioncommand.
Request Data Workspaces Sampling rate is high enough The default sampling rate is2%. If the load on theapplication server is low, theAgent might fail to trackuser transactions. Verify thesampling rate in the RequestData Sampling Rate(%)column in the “ApplicationServer Summary andBusiness Process ManagerSummary workspaces” onpage 50. Set the rate higherby using the“Set_Request_Sampling_Rate:Set the sampling rate forrequest data” on page 295Take Action command.
“Data sources workspace” onpage 80
“JMS Summary workspace”on page 96
Request Data MonitoringLevel is set to Level 2
The Request DataMonitoring Level column in“Application ServerSummary and BusinessProcess Manager Summaryworkspaces” on page 50workspace displays thevalue. To change themonitoring level, use the“Start_Request_Monitoring :Begin reporting request data”on page 296 Take Actioncommand.
“Data sources workspace” onpage 80
Data sources are configuredin the application server;user requests are accessingthese Data sources
To check the presence ofData sources, use theapplication server adminconsole. You need to knowapplication logic to verifywhether the user requests areaccessing the Data sources.Check “DB Connection Poolsworkspace” on page 82 foractivity with the Datasources.
402 ITCAM Agents for WebSphere Applications, J2EE, and HTTP Servers: User Guide

Workspace Checkpoint Comments
“JMS Summary workspace”on page 96
JMS resources (queues,topics) are configured andapplications are accessingthese resources
To check the existence of JMSresources, use the adminconsole. You need to knowapplication logic to verifywhether these resources areused.
Resource Data Workspaces Feature is available Verify the application serverfeature is being used. Forexample, Dynamic cachedata will be available onlywhen the cache feature hasbeen set up. All "PlatformMessaging" workspaces willbe available only when theService Integration Bus hasbeen configured and used.
Resource Data Workspaces PMI is enabled in theapplication server
Verify PMI is enabledthrough the administrationconsole of WebSphereApplication Server. Makesure PMI is enabled for thedesired modules (forexample, WebApplications,ServletSessions,EJBContainer, and so on). Todo this, check the Runtimetab of the PerformanceMonitoring Infrastructurepage in the applicationserver admin console.
Resource Data Workspaces Data not available in certaincolumns
Verify PMI level is highenough to capture data forthese columns. Check theInstrumentation Levelcolumn in the workspacethat you need to view.Tip: Change the PMI levelthrough the applicationserver admin console. Thecontextual help on the datacolumns in portal workspacespecifies the PMI level atwhich data will be available.
Resource Data Workspaces Resource Data Monitoring isturned on
The Resource DataMonitoring column in“Application ServerSummary and BusinessProcess Manager Summaryworkspaces” on page 50must say Enabled. If it is setto Disabled, turn it on usingthe“Start_Resource_Monitoring:Begin reporting PMI data”on page 297 Take Actioncommand.
Chapter 3. ITCAM Agent for WebSphere Applications 403

Workspace Checkpoint Comments
“Garbage Collection Analysisworkspace” on page 90
Verbose GC flag is turned onin WAS
Verify the Verbose GC box ischecked in the ApplicationServer->ProcessDefinition->Java VirtualMachine page of the adminconsole.
“Garbage Collection Analysisworkspace” on page 90
Garbage CollectionMonitoring is enabled
The Garbage CollectionMonitoring columnin“Application ServerSummary and BusinessProcess Manager Summaryworkspaces” on page 50must be Enabled. If it set toDisabled, use the“Start_GC_Monitoring: Beginreporting garbage-collectiondata” on page 296 TakeAction command to start it.Important: the Take Actioncommand will not enable theverbose GC flag in theapplication server. You haveto do it separately.
Glossary for ITCAM Agent for WebSphere ApplicationsC
class file A file containing Java object code for a single Java class of objects.
class loader A Java component that loads Java object classes into the heap.
component In object-oriented programming environments like Java, a componentis a reusable program building block that can be combined with other componentsrunning on the same or different computers in a distributed network to form anapplication. Examples of a component include a single button in a graphical userinterface, an interface to a database manager, and an EJB. A component runswithin a container.
connection pool A group of host connections that are maintained in an initializedstate, ready to be used without having to create and initialize them.
container In the Enterprise JavaBeans (EJB) architecture, a container is anapplication program that executes the program building block known as acomponent (a JavaBean). You write a Java container (such as a GUI button or adatabase requester) that runs both prewritten and site-developed JavaBeans.Examples of containers include pages on a website as well as the web browsersthemselves.
contention In the database manager, a situation in which a transaction attempts tolock a row or table that is already locked.
CPU Central Processing Unit. The part of the computer that controls theinterpretation and execution of instructions.
404 ITCAM Agents for WebSphere Applications, J2EE, and HTTP Servers: User Guide

CTG CICS Transaction Gateway. CTG integrates your site WebSphere applicationserver applications with key business systems running on CICS servers. CTGintegrates middle-tier application servers with CICS by providing a multiusergateway that supports web applications written in Java, C/C++, Visual Basic, andCOBOL. CTG supports three programming interfaces: the External Call Interface(ECI), the External Presentation Interface (EPI), and the External Security Interface(ESI). The latest version of CTG implements the JEE Connector Architecture (JCA),which allows enterprise Java technology to use CICS applications.
D
data sources Data pertaining to JDBC data streams. These are logical connectionsto database subsystems.
DCE Distributed Computing Environment. A specification from the Open SoftwareFoundation (OSF) that supports remote function execution across a network.WebSphere application server uses DCE to provide certain types of security, forexample, authentication of tokens, tickets, or credentials in an untrusted network.
design patterns Written narratives that define a recurring problem, outline asolution, and describe the trade offs involved in implementing that solution. Inobject-oriented programming environments like Java, a design pattern alsodescribes certain objects and object classes to be used when creating thearchitecture for such a solution.
DHCP Dynamic Host Configuration Protocol. A communications protocol that letsnetwork administrators centrally manage the assignment of Internet Protocol (IP)addresses across an organization network. Without DHCP, each computer IPaddress must be entered manually at each computer. If computers move to anotherlocation in another part of the network, a new IP address must be chosen. DHCPlets a network administrator supervise and distribute IP addresses from a centralpoint and automatically sends a new IP address when a computer is plugged intoa different location in the network.
dynamic cache A consolidation of several caching activities, including servlets,web services, and WebSphere commands into one service where these activitieswork together to improve performance and share configuration parameters.
E
EJB Enterprise Java Bean. A component architecture for the development anddeployment of object-oriented, distributed, enterprise-level applications.Applications written using the Enterprise JavaBeans architecture are scalable,transactional, multi-user, and secure.
G
garbage collection A facility of the JVM that reallocates and frees up memory lostwhen objects are created and later destroyed. Garbage collection usually occurswhen insufficient heap space is available for allocating new objects, although youcan trigger it manually by invoking the System.gc method.
Garbage collection can be expensive since it involves identifying all theunreferenced objects, removing them from the heap, and then possibly compactingthe heap.
Chapter 3. ITCAM Agent for WebSphere Applications 405

H
heap A memory storage area known formally as the System Resources area thatstores system information about running applications. The main storage area usedfor allocating Java classes and object instances, as well as executable code. Theallocation of objects on the heap creates a live or active object, which exists as longas the JVM maintains a pointer to it. When all references to an object cease to exist,it is subject to garbage collection.
HTTP Hypertext Transfer Protocol. A suite of protocols for the Internet thattransfer and display hypertext documents.
HTTP sessions Data related to sessions of specific World Wide Web browsers.
I
IIOP Internet Inter-ORB Protocol. A protocol that distributed programs written indifferent programming languages can use to communicate over the Internet. IIOP,a part of the Common Object Request Broker Architecture (CORBA), is based onthe client/server computing model, in which a client program makes requests of aserver program that waits to respond to client requests. With IIOP, you can writeclient programs that communicate with your existing site server programswherever they are located and without having to understand anything about theserver other than the service it performs and its address (called the InteroperableObject Reference, IOR, which comprises the server port number and IP address).
instrumentation The process of modifying program code so the time it takes thecode to run, along with other statistics, can be measured. These modificationsinsert hooks into these Java methods so that the real time and CPU time spentexecuting the methods can be measured. Instrumentation is key to certaindata-collection features (such as lock analysis) of IBM Tivoli Composite ApplicationManager Agent for WebSphere Applications.
IBM Tivoli Monitoring platform The software architecture and foundation thatsupport the development and operations of Tivoli Enterprise Portal and its TivoliEnterprise Monitoring Agents.
J
J2C WebSphere application server implementation of the connection-managementand pool-management components of JCA. Applications needing a backendresource (such as a CICS transaction) reference a connection factory suitable for usewith that resource. The connection factory in turn calls the WebSphere applicationserver DB2 Relational Resource Adapter, DB2 RRA (which, despite its name, alsosupports Oracle, SQL Server, and other database management systems). The DB2RRA passes the connection request to a J2C connection manager, which tries toprovide an available connection from a predefined pool. But when all connectionsare in use, the J2C connection manager calls back to the DB2 RRA to obtain a newconnection from the backend system. When this connection is returned, theconnection manager adds it to the connection pool for future reuse.
J2C container The third type of container within WebSphere application server(EJB containers and web containers are the other two types). A J2C containercontains connection factories that represent backend resources like CICS. It alsomanages access to these resources via a connection manager associated with eachconnection factory.
406 ITCAM Agents for WebSphere Applications, J2EE, and HTTP Servers: User Guide

JEE Java Platform, Enterprise Edition. An environment for developing anddeploying enterprise applications using the Java language. The JEE platformconsists of a set of services, application programming interfaces (APIs), andprotocols that provide the functions needed for developing multi-tiered, Web-basedapplications.
JAR file A Java archive file, which is a compressed file containing many class filesalong with their directory structure.
JavaBean The Java implementation of component-based software architecture,which defines how small, tested software entities called components can beintegrated to build complete software solutions (called containers).
JCA JEE Connector Architecture. A template for writing your own connectors,which is a binding between a JEE application server and a backend enterpriseinformation system (EIS) or data repository such as CICS, IMS, or DB2.
JDBC Java Database Connectivity. An application programming interface (API) forconnecting Java programs to the data in a relational database. With this API, youcan encode data requests in Structured Query Language (SQL) that JDBC thenpasses to the database manager for interpretation and processing.
JMS Java Message Service. A programming interface that connects Java programsto middleware messaging applications, for example, WebSphere MQ.
JMX Java Management Extensions. A standard technology for management andmonitoring of Java applications and Java environments that defines architecture,application programming interfaces (APIs), and services for application andnetwork management. JMX provides tools for building distributed, Web-basedsolutions for managing and monitoring Java devices and applications.
A JMX agent is an Mbean container.
JNDI Java Naming and Directory Interface. A programming interface that connectsJava applications to naming and directory servers such as LDAP.
JSP JavaServer Page. A web page that specifies one or more servlets whoseexecution on the web server modifies the page content or appearance before it ispresented to the user.
JTA Java Transaction API. An application programming interface developed by SunMicrosystems that specifies standard Java interfaces between a transaction manager(such as Tuxedo) and other players in a distributed transaction system: theresource manager, the application server, the transactional applications, and oftenthe database manager as well.
JVM Java virtual machine. A software implementation of a central processing unit(CPU) that runs Java applets and applications. The JVM provides a softwareexecution engine that safely and compatibly executes the byte codes in Java classfiles on various microprocessors, whether embedded in a computer or in anotherelectronic device.
JVMPI Java Virtual Machine Profiling Interface. An experimental interface thatprovides profiling hooks into the Java virtual machine. This interface supportstwo-way function calls between the JVM and a profiler agent: the virtual machine
Chapter 3. ITCAM Agent for WebSphere Applications 407

notifies the agent of various events, and the agent issues requests for controlinformation.
K
Kerberos A security system from the Massachusetts Institute of Technology thatprovides security services for networking.
L
LDAP Lightweight Directory Access Protocol. A protocol that uses TCP/IP toaccess directories. Applications can use these directories for storing common dataand for retrieving data. For example, applications can use LDAP to access suchinformation as email address, service configuration parameters, or public keys.
lock A semaphore created through the use of the Java synchronized keyword thatprevents simultaneous access to a Java object or section of code.
logstream A system logger application that records error information, unexpectedconditions, or failures detected within WebSphere application server code.Logstreams are specific to the z/OS platform.
M
MBeans Managed Beans. A set of standard instrumentation methods for use inJava programs and by Java management applications (such as IBM TivoliComposite Application Manager Agent for WebSphere Applications) that allowsmonitoring and management of Java-based applications. An MBean is a JavaBeanthat represents a JMX-manageable resource.
monitor 1) A transaction environment for maintaining large quantities of data in aconsistent state and that controls which users and clients can access data throughauthorized servers. 2) A programming primitive created so multiple programthreads can share the same resource (such as an object). A program creates amonitor for a given resource by requesting it from the system; the system returns aunique ID for that monitor. After that, any thread needing the resource must usethe monitor to lock the resource while the thread is using it. If the monitor isalready locked, a thread requesting the resource is queued by the system and thengiven control when the monitor becomes unlocked. Also called a mutex.
MVC The Model/View/Controller design pattern is based on the separation of theapplication into three objects: the user interface ("view") , the logical structure ofthe data the application requires ("model"), and the user commands that changethe view or the model ("controller"). Design patterns themselves are writtennarratives that define a recurring problem, outline a solution, and describe thetrade offs involved in implementing that solution. (In object-oriented programmingenvironments like Java, a design pattern also describes certain objects and objectclasses to be used when creating the architecture for such a solution).
N
node Any managed system, such as a WebSphere application server, that the TivoliEnterprise Portal is monitoring. A node can also be a managed system of subnodesbeing managed under a primary node.
408 ITCAM Agents for WebSphere Applications, J2EE, and HTTP Servers: User Guide

O
OLT Object Level Trace. A tool for testing distributed applications that include agraphical trace facility and a remote debugger.
ORB Object Request Broker. In object-oriented programming, software that servesas an intermediary by transparently enabling objects to exchange requests andresponses.
P
PMI Performance Monitoring Infrastructure. The application programminginterface (API) that IBM provides for extracting WebSphere application serverperformance data. PMI must be enabled and the appropriate instrumentation levelsset for the Tivoli Enterprise Monitoring Agent to extract PMI data and populatecertain workspaces. PMI runs as an interface to JMX.
portal A Web-based application that commonly provides personalization, singlesignon, and content aggregation from different sources, and hosts the presentationlayer of Information Systems (IS). Portals are becoming the next-generationdesktop, delivering ebusiness applications over the web to many types of clientdevices.
portlet A Java technology-based web component, managed by a portlet container,that process requests and generates dynamic content. Portlets are used by portalsas pluggable user interface components that provide a presentation layer to variousheterogeneous Enterprise Information Systems (EIS) or Information Systems (IS).
R
request The entry point into an application whose processing or response timedirectly affects the response time the end user perceives. In IBM Tivoli CompositeApplication Manager Agent for WebSphere Applications, a request is a servlet, JSP,or EJB method. Also called a transaction.
request analysis A configuration technique for a request (that is, a transaction)within WebSphere application server that allows you to see how often the requestruns and what factors about the request degrade its performance. Request analysisinvolves collecting and aggregating request data on each request that runs. Itsprimary purpose is to report on requests running in the application server, howoften they run, their response time, and what is causing performance degradation.
Request analysis works by dynamic object code instrumentation, which modifiesthe Java object code for the application classes as they are being loaded into theJVM.
resource adapter An implementation of the JEE Connector ArchitectureSpecification that provides applications with access to resources outside of theserver or provides server applications with access to an Enterprise InformationSystem (EIS). A resource adapter can provide applications access to resources suchas DB2, CICS, SAP, and PeopleSoft. It can provide an EIS with the ability tocommunicate with message-driven beans configured on the server. A resourceadapter is implemented in a resource adapter archive file, which has an extensionof .rar. A resource adapter can be provided as a stand-alone adapter or as part ofan application, in which case it is referred to as an embedded adapter.
Chapter 3. ITCAM Agent for WebSphere Applications 409

RMI Remote Method Invocation. A Java standard from Sun Microsystems thatperforms a remote procedure call (RPC) to allow Java objects stored in the networkto be accessed remotely in a client/server environment.
RPC Remote Procedure Call. A protocol based on the Distributed ComputingEnvironment (DCE) of the Open Software Foundation that allows one program torequest services from a program running on another computer in a network. (Aprocedure call is also known as a function call or a subroutine call.) RPC uses theclient/server model: the requesting program is the client, and the respondingprogram is the server. As with a local procedure call, an RPC is a synchronousoperation: the requesting program is suspended until the remote procedure returnsits results.
S
SCA Service Component Architecture. An architecture in which all elements of abusiness transaction, such as web service access, Enterprise Information System(EIS) service assets, business rules, workflows, databases, and so on, arerepresented in a service-oriented way.
servlet A Java application that runs in an application server or web server, andthat provides server-side processing.
session A series of requests to a servlet that originate from the same user at thesame browser. Sessions allow applications running in a web container to tracksindividual users.
signature The name of an operation or method and its parameters.
SSL Secure Sockets Layer. A security protocol for communication privacy toprovide secure client-server conversations.
struts A widely used framework for developing servlet- or JSP-based webapplications that is distributed as open source by the Apache Jakarta Project. Strutsencourages application architectures based on the Model 2 approach, a variation ofthe Model-View-Controller (MVC) design paradigm.
T
thread A dispatchable unit of work.
thread pool The threads that are being used by or are available to a computerprogram.
transaction A single execution of a workload.
U
URI Uniform Resource Identifier. An identifier for a point of content on theInternet, be it a page of text, a video or sound clip, a still or animated image, or aprogram. The most common form of URI is the web page address, which is aparticular form of URI called a Universal Resource Locator (URL). A URI typicallydescribes the mechanism used to access the resource, the computer that houses theresource, and the name of the resource (such as a file name) on that computer.
410 ITCAM Agents for WebSphere Applications, J2EE, and HTTP Servers: User Guide

URL Universal Resource Locator. The unique address for a file accessible via theInternet. Such a file might be a web page (usually the home page), an image file,or a program such as a Java applet or servlet. The URL comprises the protocolused to access the file, a domain name that identifies a specific computer on theInternet, and a path name that specifies the file location on that computer.
W
Web container A special JEE container that manages web applications in a JEEarchitecture. A web container specifies a runtime environment for webcomponents, including security, concurrency, lifecycle management, transaction,deployment, and other services. It also enables a web application to access externalresources such as relational databases (via JDBC) and Enterprise Java Beans. A webcontainer provides the same services as a JSP container and provides support formanaging JavaServer Pages.
Every JEE server contains at least one web container.
workload management The optimization of the distribution of incoming workrequests to the application servers, enterprise beans, servlets, and other objects thatcan effectively process the request.
Chapter 3. ITCAM Agent for WebSphere Applications 411

412 ITCAM Agents for WebSphere Applications, J2EE, and HTTP Servers: User Guide

Chapter 4. ITCAM Agent for J2EE
IBM Tivoli Composite Application Manager for Application Diagnostics Agent forJ2EE provides a Systems Management solution for the J2EE Application ServerVersion 6.2 for distributed platforms. Using ITCAM Agent for J2EE, you canmonitor multiple J2EE application servers running on the same physical node.Each application server must be configured with its own IBM Tivoli CompositeApplication Manager (ITCAM) for J2EE data collector.
The Tivoli Enterprise Monitoring Agent collects performance data from thefollowing four primary sources:v Response time data for application server requests from the ITCAM for J2EE
data collectorv Resource data from the Performance Monitoring Infrastructure (PMI) of J2EEv J2EE Application Server log messagesv Garbage-collector activity recorded by the JVM verboseGC trace
Attributes within the product collect data about the inner workings of anapplication server and performance information about user applications runningunder its control.
Initiating data collection and reporting of data
Because of high processor usage, some data items are not automatically collectedand reported. The collection of some data and statistics depends upon the settingof instrumentation levels for certain attributes. If the instrumentation levels are notset appropriately, certain information is not collected and displayed in theworkspaces. Similarly, those attributes that collect request and application tracedata require you to complete several configuration steps. To collect this data, useone of the following methods to reconfigure data collection:v Complete configuration steps (as explained in the ITCAM Agent for J2EE
installation and customization guide).v Issue Take Action commands, with which you can take specific action against
your J2EE application server using the Tivoli Enterprise Portal.v Use Manage Tivoli Enterprise Services (as explained in the various IBM Tivoli
Monitoring installation manuals and the ITCAM Agent for J2EE installation andcustomization guide).
Automatic baselining
To display application health status, ITCAM monitors request response times(averaged over a sampling interval, by default 60 seconds) for every application.Every top-level request available in an application is monitored separately.
For every request, two thresholds are set, known as fair and bad. When at least oneaverage request response time for an application rises over the fair threshold, ahealth warning (yellow) for this application is reported. Similarly, when at leastone average request response time rises over the bad threshold, an applicationhealth alarm (red) is reported.
© Copyright IBM Corp. 2006, 2014 413

ITCAM also monitors the nested requests (for example, database calls) withinevery top-level request. In the event of a warning or alarm, ITCAM checks whichof the nested requests is taking more than its usual share of time. Depending onthe type of such nested requests, ITCAM shows whether the client, application, orbackend tier is the likely cause of the warning/alarm. Servlet and Portal requesttypes are assigned to the client tier. EJB and User (Custom) request types areassigned to the application tier. All other request types (JNDI, JDBC, JCA, JMS) areassigned to the backend tier.
When ITCAM starts to monitor a new application, it automatically starts abaselining process. This process normally runs for seven days but provides updatedinformation every hour from the beginning. During the process, ITCAM collectsstatistical data for all requests in this application. When the data is collected,ITCAM sets the thresholds automatically; it also records the typical share ofresponse time for each nested request type.
In most cases, this automatic setting is adequate. During the baselining process, thebaselines get updated periodically, and the alarms/warnings start to correspond toreal problems. You do not have to adjust baselining settings when things areworking normally. (The automatic thresholds usually become usable earlier, afterthe application has been observed through its typical load patterns). If you need toacquire thresholds, based on whatever data is available, before the hourlyautomatic update, you can manually update baselining.
However, in some situations the threshold levels can become inadequate. Thisresults in either too many false alarms/warnings, or in real problems goingundetected. Such situations can be split broadly into two categories:v If time has passed since the baselining process for an application, its response
times might have changed because of configuration alteration, database growth,changing load patterns, and so on. In this case, you might have to run thebaselining process again. It is good practice to do it after any configuration orinfrastructure change.
v If the thresholds are incorrect immediately after the baselining process has beencompleted, you might have to adjust the auto threshold settings.
As a last resort, you can also override the thresholds with fixed values. However,do not do this unless you know a lot about the monitored application, or unlessinstructed by IBM Level 3 Support.
If you need the thresholds set before they are updated automatically for the firsttime, you can trigger a baseline update. This immediately sets the thresholds basedon the request data collected so far.
Additional information
For additional usage information about this agent, see:v Workspacesv Attributesv Situationsv Take Action commands
414 ITCAM Agents for WebSphere Applications, J2EE, and HTTP Servers: User Guide

Workspaces for ITCAM Agent for J2EEAs part of the IBM Tivoli Composite Application Manager for ApplicationDiagnostics Agent for J2EE product integration with the Tivoli Enterprise Portal,the workspaces offer views of monitoring data that provide detailed, current dataabout the J2EE application servers running on the UNIX and Windows platformson your site. In addition to reports and graphs, a workspace can contain otherviews (that is, windows), such as a Notepad editor session, a browser session, atelnet session, an event console, or a Take Action view from which you can issuecommands.
Several views of high-level information
Several workspaces provide high-level information to help you meet themonitoring and administrative needs of your site. These workspaces report onstatus and availability for both the J2EE administrative server and its applicationserver instances. They enable you to easily monitor the availability of yourenterprise, the J2EE Application Server, and application server instances.
Primary and secondary workspaces
The workspaces listed in the Navigator are directly accessible and are calledprimary workspaces. Some of these also contain secondary workspaces, which are notaccessible directly from the Navigator. Instead, you must select and display theprimary workspace and then use either a menu option or a special link icon in theprimary workspace views to reach the secondary workspaces (sometimes calledsubsidiary workspaces).
Workspaces with historical data links
Several workspaces provide secondary workspaces that display historical data. Youcan specify a time span over which to collect historical data, which accumulatesand summarizes the data in the primary workspaces that generate them. (Thedefault setting is 15 minutes; you can modify this setting to suit your needs.) Thedescriptions of the historical workspaces follow the descriptions of the primaryworkspaces that generate them in the workspace helps.
Available Tivoli Enterprise Portal workspaces
For an overview of the organization of the available workspaces, see Organizationof the predefined workspaces.
Organization of the predefined workspacesThe IBM Tivoli Composite Application Manager for Application Diagnostics Agentfor J2EE workspaces for the Tivoli Enterprise Portal define data shows that displayin the physical view of the Navigator. In addition to the workspaces that theNavigator lists, you can reach their subsidiary (or secondary) workspaces from theprimary workspaces (those listed in the Navigator).
Accessing the subsidiary workspaces
You can access the subsidiary workspaces of a primary workspace by using one ormore of the following methods:v From the Navigator:
1. Select the primary workspace.
Chapter 4. ITCAM Agent for J2EE 415

2. Right-click the name of the selected workspace in the Navigator.3. Select Workspaces from the menu.4. Select the desired subsidiary workspace.
v From the View menu:1. Select the primary workspace.2. Select View > Workspaces.3. Select the desired subsidiary workspace.
v From a report:1. Select the primary workspace.2. If the workspace report contains a link, as shown in the following example:
You can either click the icon to select the row or right-click the icon andselect a subsidiary workspace from the menu.
v From a chart view:The data displayed in some bar charts and plot charts is linked to subsidiaryworkspaces. To search for a link, right-click a bar or data point in the chart. IfLink to displays in the menu, you can select a subsidiary workspace pertainingto the data in the chart.
Workspace organization
The hierarchy levels shown in the Navigator depend upon the customization of theTivoli Enterprise Portal by your enterprise. However, ITCAM Agent for J2EEprovides a set of predefined workspaces, which do not require customization. Thefollowing list shows the order and hierarchy of the predefined workspacesprovided by the IBM Tivoli Composite Application Manager for ApplicationDiagnostics Agent for J2EE Tivoli Enterprise Monitoring Agent. It is arepresentation of how the predefined workspaces are organized in the Navigator.For more detailed information about a workspace, click its name in the list.
operating system [for example, Windows]v system [or nodename]
–– J2EE Agent
- JBoss App Serverv Application Health Summary
– Selected Application - Application Tier Analysis– Selected Application - Configuration– Selected Application - Backend Tier Analysis– Selected Application - Request Analysis– Selected Application - Health History– Selected Application - Client Tier Analysis– Application Registry
- Selected Request - Baseline
416 ITCAM Agents for WebSphere Applications, J2EE, and HTTP Servers: User Guide

v Request Analysis– Selected Request - Datasources– Selected Request - JMS Queues– Selected Request - Resource Adapters– Selected Request - History
v Garbage Collection Analysis– Allocation Failures– Garbage Collections - Selected Allocation Failure
v Log Analysisv Datasources
– Selected Datasource - Historyv JMS Summaryv Web Applications
– Servlets / JSPs - Selected Web Applicationv EJB Modules
– Enterprise Java Beansv JCA Connection Poolsv JTA Resources
- SAP NetWeaver Server Workspacev Application Health Summary
– Selected Application - Application Tier Analysis– Selected Application - Configuration– Selected Application - Backend Tier Analysis– Selected Application - Request Analysis– Selected Application - Health History– Selected Application - Client Tier Analysis– Application Registry
- Selected Request - Baselinev Request Analysis
– Selected Request - Datasources– Selected Request - JMS Queues– Selected Request - Resource Adapters– Selected Request - History
v Garbage Collection Analysis– Allocation Failures– Garbage Collections - Selected Allocation Failure
v Log Analysisv Datasources
– Selected Datasource - Historyv JMS Summaryv Web Containerv Enterprise Java Beansv DB Connection Pools
– Selected DB Connection Pool - Historyv JTA Summary
Chapter 4. ITCAM Agent for J2EE 417

- Tomcat Server Workspacev Application Health Summary
– Selected Application - Application Tier Analysis– Selected Application - Configuration– Selected Application - Backend Tier Analysis– Selected Application - Health History– Selected Application - Client Tier Analysis– Application Registry
- Selected Request - Baselinev Request Analysis
– Selected Request - Datasources– Selected Request - JMS Queues– Selected Request - Resource Adapters– Selected Request - History
v Garbage Collection Analysis– Allocation Failures– Garbage Collections - Selected Allocation Failure
v Log Analysisv Datasources
– Selected Datasource - Historyv JMS Summary
- Oracle App Server Workspacev Application Health Summary
– Selected Application - Application Tier Analysis– Selected Application - Configuration– Selected Application - Backend Tier Analysis– Selected Application - Health History– Selected Application - Client Tier Analysis– Application Registry
- Selected Request - Baselinev Request Analysis
– Selected Request - Datasources– Selected Request - JMS Queues– Selected Request - Resource Adapters– Selected Request - History
v Garbage Collection Analysis– Allocation Failures– Garbage Collections - Selected Allocation Failure
v Log Analysisv Datasources
– Selected Datasource - Historyv JMS Summaryv Web Applications
– Servlets / JSPs - Selected Web Applicationv EJB Modules
418 ITCAM Agents for WebSphere Applications, J2EE, and HTTP Servers: User Guide

– Enterprise Java Beans- BEA WebLogic App Server Workspace
v Application Health Summary– Selected Application - Application Tier Analysis– Selected Application - Configuration– Selected Application - Backend Tier Analysis– Selected Application - Request Analysis– Selected Application - Health History– Selected Application - Client Tier Analysis– Application Registry
- Selected Request - Baselinev Request Analysis
– Selected Request - Datasources– Selected Request - JMS Queues– Selected Request - Resource Adapters– Selected Request - History
v Garbage Collection Analysis– Allocation Failures– Garbage Collections - Selected Allocation Failure
v Log Analysisv Datasources
– Selected Datasource - Historyv JMS Summaryv Web Applications
– Servlets / JSPs - Selected Enterprise Applicationv EJB Components Workspace
– EJBs - Selected Enterprise Applicationv JDBC Connection Pools
– Selected JDBC Connection Pool - Historyv JCA Connection Poolsv JMS Sessionsv JTA Resources
- WebSphere App Server CEv Application Health Summary
– Selected Application - Application Tier Analysis– Selected Application - Configuration– Selected Application - Backend Tier Analysis– Selected Application - Request Analysis– Selected Application - Health History– Selected Application - Client Tier Analysis– Application Registry
- Selected Request - Baselinev Request Analysis
– Selected Request - Datasources– Selected Request - JMS Queues
Chapter 4. ITCAM Agent for J2EE 419

– Selected Request - Resource Adapters– Selected Request - History
v Garbage Collection Analysis– Allocation Failures– Garbage Collections - Selected Allocation Failure
v Log Analysisv Datasources
– Selected Datasource - Historyv JMS Summaryv Web Applications
– Servlets / JSPs - Selected Web Application- J2SE Application
v Request Analysis– Selected Request - Datasources– Selected Request - JMS Queues– Selected Request - Resource Adapters– Selected Request - History
v Garbage Collection Analysis– Allocation Failures– Garbage Collections - Selected Allocation Failure
v DC Message Eventsv Datasources
– Selected Datasource - Historyv JMS Summaryv JVM Statistics
For additional information, see:
“Attribute groups used by the predefined workspaces” on page 456
Configuration workspacesMonitoring Agent configuration and tuning is facilitated in the Tivoli EnterprisePortal through configuration workspaces. There are two configuration workspaces:one for the Monitoring Agent level and one for the server level:v J2EE Agent Configuration workspacev application server Configuration workspace
Both configuration workspaces have the same tabs and configuration settings.
The J2EE Agent Configuration workspace settings are initial settings applied to alldata collectors managed by the Monitoring Agent. For example, when a datacollector connects to the Monitoring Agent for the first time or if the data collectorconfiguration was deleted. In both these examples, the configuration settingsspecified in the J2EE Agent Configuration workspace are applied.
The application server Configuration workspace contains individual server settingsand the settings in this workspace override the settings in the J2EE AgentConfiguration workspace.
420 ITCAM Agents for WebSphere Applications, J2EE, and HTTP Servers: User Guide

Settings for the J2EE Agent Configuration and application server Configurationworkspaces are saved in the following files:
Table 82. Workspace configuration files
Workspace Configuration file
J2EE AgentConfigurationworkspace onWindowssystems:
CANDLE_HOME\TMAITM6\hostname_productcode.xml
ApplicationserverConfigurationworkspace onWindowssystems:
CANDLE_HOME\TMAITM6\hostname_productcode_servervendor.servernode.server name.xml
J2EE AgentConfigurationworkspace onother platforms:
CANDLE_HOME/config/hostname_productcode.xml
ApplicationserverConfigurationworkspace onother platforms:
CANDLE_HOME/config/hostname_productcode_servervendor.servernode.server name.xml
The J2EE Agent Configuration workspace configuration settings are initial settingswhich are applied to all data collectors managed by the selected J2EE agent. Theapplication server Configuration workspace configuration settings override agentlevel configuration settings.
Both configuration workspaces have the following two views:v Application Diagnostics Configuration view - this view has the following four
tabs– Collection (Basic)– Collection (Advanced)– Application Dashboard (Basic)– Application Dashboard (Auto Threshold)
v Application Servers view - this view has one tab which lists all applicationservers monitored by the selected J2EE agent, for each application server, there isa link to application server Configuration workspace.
Application Diagnostics Configuration - Basic TabThe Basic tab contains the following fields:v Request Data Monitoring - in this field, specify the monitoring level for
requesting data from connected data collectors. The following values can beentered into this field:– Disable - request data is not monitored and is not displayed– Level 1 - only monitors edge request data, for example, servlets, JSPs, EJBs,
SCA requests, and web service requests– Level 2 - monitors nested request data in addition to edge request data, for
example, JNDI, JMS, JDBC, and JCA requests
Chapter 4. ITCAM Agent for J2EE 421

Important: This monitoring level is applied by default to newly discoveredapplications. However, you can set the monitoring level for any operationseparately, using the “Set_Application_Monitoring: Set monitoring” on page 536Take Action command.
v Request Data Monitoring Method - in this field, specify the monitoring methodused by the Monitoring Agent to govern when it uploads request and garbagecollection data from connected data collectors. The following values can beentered into this field:– On Demand - when the monitoring method is set to On Demand, data is
uploaded only when requested by the user. The exception to this is if thecache of data is still current. Whether this data is current is determined by theRequest Data On Demand Maximum Sample Age (sec) field in the CollectionAdvanced tab. With On Demand monitoring, the Tivoli Enterprise Portalresponse time is slower because the data is collected as requested. However,the retrieved data is the most current available. CPU and memory usage onthe monitored systems is lower for On Demand monitoring.
– Fixed Interval - when the monitoring method is set to Fixed Interval, theMonitoring Agent will upload sample data from the data collectors at regularfixed intervals, and respond to a user request using the latest cache of sampledata gathered at the last interval. With Fixed Interval monitoring, CPU andmemory usage can be higher because more data is collected more frequentlybut Tivoli Enterprise Portal response time is faster as the data is more readilyavailable. Data samples are calculated for the same time interval and as aresult are more consistent.
v Resource Data Monitoring - in this field, specify whether resource data ismonitored from connected data collectors. The following values can be enteredin this field:– Disable - resource data is not collected by the Monitoring Agent and is not
displayed in the Tivoli Enterprise Portal.– Enable - resource data is collected by the Monitoring Agent and is displayed
in the Tivoli Enterprise Portal.v Resource Data Monitoring Method - in this field, specify the monitoring
methodology used by the agent to govern when it uploads resource data fromconnected data collectors. The following values can be entered into this field– On Demand - when the monitoring method is set to On Demand, data is
uploaded only when requested by the user. The exception to this is if thecache of data is still current. Whether this data is current is determined by theResource Data On Demand Maximum Sample Age (sec) field in the CollectionAdvanced tab. With On Demand monitoring, the Tivoli Enterprise Portalresponse time is slower as the data is collected as requested. However, theretrieved data is the most current available. CPU and memory usage on themonitored systems is lower for On Demand monitoring.
– Fixed Interval - when the monitoring method is set to Fixed Interval, theMonitoring Agent will upload sample data from the data collectors at regularfixed intervals, and respond to a user request using the latest cache of sampledata gathered at the last interval. With Fixed Interval monitoring, CPU andmemory usage can be higher because more data is collected more frequentlybut Tivoli Enterprise Portal response time is faster as the data is more readilyavailable. Data samples are calculated for the same time interval and as aresult are more consistent.
v Garbage Collection Monitoring - in this field, specify if verbose garbagecollection output monitoring is enabled. The following values can be entered inthis field:
422 ITCAM Agents for WebSphere Applications, J2EE, and HTTP Servers: User Guide

– Disable - verbose garbage collection output data is not collected by theMonitoring Agent and is not displayed in the Tivoli Enterprise Portal.
– Enable - verbose garbage collection output data is collected by theMonitoring Agent and is displayed in the Tivoli Enterprise Portal.
Application Dashboard (Basic) tabThe Application Dashboard (Basic) tab contains the following fields:v Application Fair Completion Rate Threshold (%) - Defines the default
completion percentage for application fair availability threshold.v Application Bad Completion Rate Threshold (%) - Defines the default
completion percentage for application bad availability threshold.v Application Fair Resource Usage Threshold (%) - Defines the threshold
percentage for fair usage level of an application resource.v Application Bad Resource Usage Threshold (%) - Defines the threshold
percentage for bad usage level of an application resource.v Application Resource Usage Monitoring Cutoff Threshold (%) - Defines the
cutoff threshold percentage for application resources usage monitoring.v Request Monitoring Control Level - Specifies the request monitoring control
level for the server. The following entries can be entered to this field:– Application Request monitoring settings are defined for each application
independently.– Server Request monitoring settings are defined on the server level
The Request Monitoring Control Level option gives you more control over requestmonitoring settings. In certain sequences, you can benefit from locking the requestmonitoring control on the server level, because you can change data collectormonitoring level in one place.
In ITCAM For Application Diagnostics, the request data monitoring level (Level1or Level2) that displays on the Tivoli Enterprise Portal depends on the RequestMonitoring Control Level setting you choose.v If you select the Request Monitoring Control Level as Application (the default
setting), the monitoring level is set separately for every application. For a newlydiscovered application, the current monitoring level for the agent is applied.Therefore, to display Level2 data for an application in the Tivoli EnterprisePortal, you must set the monitoring level for the application using the“Set_Application_Monitoring: Set monitoring” on page 536 Take Actioncommand.
v If you select the Request Monitoring Control Level as Server, the level is set forthe server and affects all applications. If you set the Request Data MonitoringLevel at Level2 using the “Start_Request_Monitoring : Begin reporting requestdata” on page 539 Take Action command, the Request Data Monitoring Level forall the applications in this server is Level2. While you can still use theSet_Application_Monitoring Take Action command to set the monitoring levelfor an individual application, the level does not apply as a server-wide level isin operation. To apply the levels set for individual applications, change theRequest Monitoring Control Level setting to Application.
Collection Advanced tabThe Collection Advanced tab contains the following fields:v Request Data On Demand Maximum Sample Age (sec) - The maximum
allowed age of sample request data in seconds before collecting a new sample ofdata. If the monitoring method is set to On Demand, when a user request is
Chapter 4. ITCAM Agent for J2EE 423

received, and the current sample cache is older than the value specified, then theMonitoring Agent uploads a new sample before servicing the request. Twosuccessive on-demand requests received from users within the period specifiedby the maximum sample age return the same results without incurring the CPUand memory cost of a new data sample.
v Request Data Fixed Interval between Collections (sec) - The amount of time inseconds between uploads of sample request data from the data collectors to theMonitoring Agent when the monitoring method is set to Fixed Interval. When auser request is received, it is serviced from the latest uploaded sample.
v Request Data Sampling Rate (%) - The percentage of requests that are sampledfor request data monitoring.
v Resource Data On Demand Maximum Sample Age (sec) - The maximumallowed age of sample resource data in seconds before collecting a new sampleof data. If the monitoring method is set to On Demand, when a user request isreceived and the current sample cache is older than the value specified in thisfield, then the Monitoring Agent uploads a new sample before servicing therequest. Two successive on-demand requests received from a user within theperiod specified by the maximum sample age return the same results withoutincurring the CPU and memory cost of a new data sample.
v Resource Data Fixed Interval between Collections (sec) - The amount of timein seconds between uploads of sample resource data from the data collectors tothe agent. When a Tivoli Enterprise Portal request is received, it is serviced fromthe latest uploaded sample.
v Garbage Collection Polling Interval (sec) - The interval in seconds between theMonitoring Agent scanning the verbose Garbage Collection output.
v Log Scan Polling Interval (sec) - The interval in seconds between the Agentscanning the application server standard output log for changes.
Application Dashboard (Auto Threshold) tabThe Application Dashboard (Auto Threshold) tab contains the fields:v Response Time Selection (%) - Defines the percentage from baseline to be used
for response time auto-thresholding.v Response Time Deviation (%) - Defines the deviation for baseline selection to
be used for response times auto-thresholding.v Fair Response Time Projection (%) - Defines the percentage to derive the fair
response time threshold from the baseline selection.v Bad Response Time Projection (%) - Defines the percentage to derive the bad
response time threshold from the baseline selection.
Allocation Failures workspaceThis workspace summarizes all the heap-allocation failures that occurred withinthe Java Virtual Machine (JVM) over the current interval and that caused the JVMto initiate garbage collection.
This workspace displays data provided by the Allocation Failure attributes.
Note to Solaris and HP-UX users: Allocation-failure information is not recordedon these platforms. Consequently this workspace is always empty.
The predefined workspace contains the following items:v Allocation Failure Elapsed Times bar chart, which displays the number of
allocation failures during the current interval.
424 ITCAM Agents for WebSphere Applications, J2EE, and HTTP Servers: User Guide

v Heap Usage bar chart, which displays the heap usage for this JVM. The hoverhelp associated with the bar gives the allocation-failure ID number followed bya range of recording times. This allocation-failure number displays in theAllocation Failures report and associates each bar with that particular rowwithin the report.
v Allocation Failures report, which displays information about the heap-allocationfailure that caused the JVM hosting the application server to start itsgarbage-collection routine.
Accessing the Allocation Failures workspace
To access this workspace from the “Garbage Collection Analysis workspace” onpage 433, right-click the link icon, and from the menu, click Allocation Failures.
For additional information, see:v Organization of the predefined workspacesv Attribute groups used by the predefined workspaces
Application Health Summary workspaceThe workspace displays the information about the real-time health status ofapplications monitored by the Tivoli Enterprise Monitoring Agent.
The health status information is collected from the following sources:v Request Metrics - performance data that measures request execution time
collected from the ITCAM instrumentation points in the application code.v Garbage Collection Metrics - metrics on garbage collection frequency and
performance collected from parsing of the GC verbose log file when it is enabledfor the application server JVM.
v Operating System metrics - metrics collected about the JVM process and thewhole system execution, such as CPU used percentage, paging rate, and so on.
Additionally, the monitoring agent uses thresholds, called Application HealthIndicators, to determine the quality of the application service. These thresholds areassigned automatically during baselining or you can manually customize them.There are three monitored application tiers evaluated for health status.v Client Tier provides performance data and status of application execution in
servlets/JSPs or portal containers as well as corresponding thread poolsservicing these containers.
v Application Tier provides application execution metrics of EJB containers andcustom requests.
v Backend Tier provides application execution in JDBC, JCA, JMS, and JNDI APIcalls.
This workspace displays data provided by the Application Health Status attributes.
The predefined workspace contains:v Situation Event console view, which shows the event console with activity
associated with the Application Health Summary Navigator item and any otherworkspaces in the group, as well as linked workspaces. The Navigator displaysan event icon overlaid on the Application Health Summary node when asituation becomes true. The report is useful when multiple alerts are raised asyou can see them all in a single filtered view.
Chapter 4. ITCAM Agent for J2EE 425

v Application Health Summary report, which shows the report of the applicationname, status, and health indicator for client, application, and backend tiershealth status.
Accessing the Application Health Summary workspace
To access this workspace, complete the following steps:1. Within the Navigator, expand Windows Systems, Linux Systems, UNIX
Systems, or z/OS Systems, as appropriate for the node you are monitoring.2. Within the node list, expand the entry that corresponds to your node name.3. Within the list of monitored applications associated with that node, expand the
list of J2EE agents.4. Within the list of available agents, expand the J2EE application server entry of
your choice.5. Within the list of available J2EE application Server workspaces on that server,
click the Application Health entry.
For additional information, see:v Organization of the predefined workspacesv Attribute groups used by the predefined workspaces
Application Registry workspaceThis workspace displays the information about the server configuration for theapplication.
This workspace displays data provided by the Application MonitoringConfiguration attributes.
The predefined workspace contains:v Situation Event Console report, which shows the event activity for situations
associated with the current Navigator item. The Navigator alerts you when asituation becomes true by displaying an event indicator on the Navigator item.This report is useful when multiple alerts are raised and you might not knownewly arrived alerts just by looking at the indicator.
v Application Configuration report, which shows the configurations that arediscovered, stored and managed for J2EE applications running within thatapplication server.
Accessing the Application Registry workspace
To access this workspace from the Application Health Summary workspace, useone of the following procedures:v Within the Navigator, right-click the Application Health entry; and select
Workspace -> Application Registry.v From the primary Tivoli Enterprise Portal menu, select View -> Workspace ->
Application Registry.
For additional information, see:v Organization of the predefined workspacesv Attribute groups used by the predefined workspaces
426 ITCAM Agents for WebSphere Applications, J2EE, and HTTP Servers: User Guide

BEA WebLogic Application Server workspaceThis workspace displays overall statistics for each application server beingmonitored by the Tivoli Enterprise Monitoring Agent.
The predefined workspace contains the following items:v Heap Usage - History bar chart, which displays free memory size and used
memory size (in KB) within the J2EE Application Server heap over time. Thehover help associated with the chart displays the exact values.This view displays data provided by the Garbage Collection Analysis attributes .
v Response Time - History graph, which shows the server response time torequests over time.This view displays data provided by the Request Times and Rates attributes .
v Request Rate - History graph, which shows the rate at which requests have beenreceived by this server over time.This view displays data provided by the Request Times and Rates attributes .
v Percent CPU Used - History graph, which shows the percentage of the CPU thatthis server consumed over time.This view displays data provided by the Application Server attributes .
v Application Server Summary report, which displays overall information aboutthis BEA WebLogic Application Server, including JVM statistics and CPU usagestatistics.This view displays data provided by the Application Server attributes .
Accessing BEA WebLogic Application Server Workspace
To access this workspace, complete the following steps:1. Within the Navigator, expand Windows Systems, Linux Systems, UNIX Systems
as appropriate for the node you are monitoring.2. Within the node list, expand the entry that corresponds to your node name.3. Within the list of monitored applications associated with that node, expand the
list of J2EE agents.4. Within the list of available agents, select the BEA WebLogic Application Server
entry.
See also:v Organization of the predefined workspacesv Attribute groups used by the predefined workspaces
Data sources workspaceThis workspace displays statistical data for the data sources that your applicationsreference when accessing databases.
This workspace displays data provided by the Datasources attributes.
The predefined workspace contains the following items:v Worst Data source Query Times bar chart, which shows the longest times (in
milliseconds) the application spent waiting to retrieve data from the databaseduring the specified interval
v Worst Data source Update Times bar chart, which shows the longest times (inmilliseconds) the application spent updating data within the database during thespecified interval
Chapter 4. ITCAM Agent for J2EE 427

v Data sources - Current Interval report, which displays database usageinformation. For example, this report shows traffic information, such as the timethe application spent trying to connect to the database and the total and averageprocessing times for database queries and updates
Accessing the data sources workspace
To access this workspace, complete the following steps:1. Within the Navigator, expand Windows Systems, Linux Systems, UNIX
Systems, as appropriate for the node you are monitoring.2. Within the node list, expand the entry that corresponds to your node name.3. Within the list of monitored applications associated with that node, expand the
list of J2EE agents.4. Within the list of available agents, expand the J2EE application server entry of
your choice.5. Within the list of available J2EE application server workspaces on that server,
click the Datasources entry.
Selected data source - History workspace
This workspace displays the historical information that corresponds to theinformation in the data source workspace for a selected data source. Historicalinformation is collected over a specific time span. See the online help for TivoliEnterprise Portal for a detailed explanation of historical reporting.
Accessing the Selected data source - History workspace
To access this workspace from the data source workspace, use one of the followingprocedures:v From the Data sources - Current Interval report, right-click, and from the menu,
click Selected Datasource - History.v From Worst Data source Query Times bar chart or the Worst Data source Update
Times bar chart, right-click any bar; then, from the menu, select Link To >Selected Datasource - History.
For additional information, see:v Organization of the predefined workspacesv Attribute groups used by the predefined workspaces
DB Connection Pools workspaceThis workspace displays information about the database connection poolsassociated with SAP NetWeaver application server.
This workspace displays data provided by the “DB Connection Pools - NetWeaverattributes” on page 472.
The predefined workspace contains the following items:v Pool Sizes bar chart, shows the current size of data source poolv DB Connection Pools report, which displays information about the database
connection pool for each defined data source, and an aggregated value thataggregates over all data sources. For example, this report displays the number ofthreads waiting for a connection and the number of connections created andreleased
428 ITCAM Agents for WebSphere Applications, J2EE, and HTTP Servers: User Guide

Accessing the DB Connection Pools workspace
To access this workspace, complete the following steps:1. Within the Navigator, expand Windows Systems, Linux Systems, UNIX
Systems, as appropriate for the node you are monitoring.2. Within the node list, expand the entry that corresponds to your node name.3. Within the list of monitored applications associated with that node, expand the
list of J2EE agents.4. Within the list of available agents, expand the SAP NetWeaver application
server entry of your choice.5. Within the list of available J2EE application server workspaces on the SAP
NetWeaver server, select the DB Connection Pools entry.
Selected DB Connection Pool - History workspace
This workspace displays the historical information that corresponds to theinformation in the DB Connection Pools workspace for a selected connection pool.Historical information is collected over a particular measured time span. See theonline help for Tivoli Enterprise Portal for a detailed explanation of historicalreporting.
This workspace displays data provided by the “DB Connection Pools - NetWeaverattributes” on page 472.
The predefined workspace contains the following items:v Active and Available Connections - History table, which displays the history of
active and available connectionsv Highest Wait Times - History table, which displays the history of the highest
wait times (in milliseconds) for each database connection poolv Selected DB Connection Pool - History report, which displays historical data and
statistics in the DB connection pools for a selected connection pool
Accessing the Selected DB Connection Pool - History workspace
To access this workspace from the DB Connection Pools workspace, use one of thefollowing procedures:v From the DB Connection Pools report, right-click the link icon and select
Selected DB Connection Pool - History.v From Pool Size bar chart, right-click any bar, and select Link To > Selected DB
Connection Pool - History.
For additional information, see:v Organization of the predefined workspacesv Attribute groups used by the predefined workspaces
DC Message Events workspaceThis workspace displays the information about messages generated by the ITCAMfor J2EE data collector and the event activity for situations associated with theNavigator item.
This workspace displays data provided by the “DC Messages - J2EE attributes” onpage 473. This workspace is available only for J2SE servers.
Chapter 4. ITCAM Agent for J2EE 429

The predefined workspace contains the following items:v Situation Event Console report, which shows the event activity for situations
associated with the current Navigator item. The Navigator alerts you when asituation becomes true by overlaying the Navigator item with an event indicator.This report is useful when multiple alerts are raised and you might not knownewly arrived alerts just by looking at the indicator.
v DC Message Events report, which displays the messages generated by theITCAM for J2EE data collector and the related information of the messages. Thisinformation includes message identifier, sequence number, and the componentfrom which the messages were generated.
Accessing the DC Message Events workspace
To access this workspace, complete the following steps:1. Within the Navigator, expand Windows Systems, Linux Systems, UNIX
Systems, as appropriate for the node you are monitoring.2. Within the node list, expand the entry that corresponds to your node name.3. Within the list of monitored applications associated with that node, expand the
list of J2EE agents.4. Within the list of available agents, expand the J2SE application server of your
choice.5. Within the list of available J2SE application server workspaces on that server,
select the DC Message Events entry.
For additional information, see:v Organization of the predefined workspacesv Attribute groups used by the predefined workspacesv “Situations for ITCAM Agent for J2EE” on page 528
EJB Components workspaceThis workspace displays runtime information for an EJB component in theOracle/BEA WebLogic Server.
This workspace displays data provided by the “Enterprise Java Bean Components -WebLogic attributes” on page 474.
The predefined workspace contains the following items:v Activated EJBs bar chart, which displays the number of activated EJBsv EJB Components report, which displays runtime information for an EJB
component
Accessing the EJB Components workspace
To access this workspace, complete the following steps:1. Within the Navigator, expand Windows Systems, Linux Systems, UNIX
Systems, as appropriate for the node you are monitoring.2. Within the node list, expand the entry that corresponds to your node name.3. Within the list of monitored applications associated with that node, expand the
list of J2EE agents.4. Within the list of available agents, expand the Oracle/BEA WebLogic
application server entry.
430 ITCAM Agents for WebSphere Applications, J2EE, and HTTP Servers: User Guide

5. Within the list of available J2EE application server workspaces on theOracle/BEA WebLogic server, select the EJB Components entry.
For additional information, see:v Organization of the predefined workspacesv Attribute groups used by the predefined workspaces
Enterprise Java Beans workspaceThis workspace reports information about each Enterprise Java Bean (EJB) definedfor an EJB module. The workspace provides information about these beansregarding their identity, instrumentation level settings, creation and destruction ofbean objects, response times, invocations, calls, and rates for retrievals, returns, anddiscards.
For JBoss and Oracle application servers, this workspace displays data provided bythe “Enterprise Java Bean Modules - J2EE attributes” on page 475.
The predefined workspace contains the following items:v Message Driven Beans report, which displays performance statistics for message
driven beans in the given EJB modulev Entity Beans report, which displays performance statistics for entity beans in the
given EJB modulev Stateful Session Beans report, which displays performance statistics for stateful
session beans in the given EJB modulev Stateless Session Beans report, which displays performance statistics for stateless
session beans in the given EJB module
Accessing the Enterprise Java Beans - JBoss and Oracleapplication servers workspace
You access this workspace from the “EJB Modules workspace” on page 432. To listthe EJBs, use one of the following procedures:v From the primary Tivoli Enterprise Portal menu, select View ->Workspace >
Enterprise Java Beans.v In the Navigator, right-click the EJB Modules entry and select Workspace>
Enterprise Java Beans.
To see the EJBs referenced by a specific EJB module, from the EJB modules report,right-click the link icon and select Enterprise Java Beans.
Enterprise Java Beans - NetWeaver workspace
In SAP NetWeaver server, this workspace displays data provided by the“Enterprise Java Bean Service - NetWeaver attributes” on page 477.
The predefined workspace contains the following items:v Highest Creation Counts bar chart, which displays the highest count of times of
a "create" method was invoked on the beanv Most Active Session timeouts, which display the most timeout for the active
sessions. If a session stays idle and not passivated for this long, it is removedv Enterprise Java Beans report, which displays information about each Enterprise
Java Bean (EJB)
Chapter 4. ITCAM Agent for J2EE 431

Accessing the Enterprise Java Beans - NetWeaver workspace
To access this workspace, complete the following steps:1. Within the Navigator, expand Windows Systems, Linux Systems, UNIX
Systems, as appropriate for the node you are monitoring.2. Within the node list, expand the entry that corresponds to your node name.3. Within the list of monitored applications associated with that node, expand the
list of J2EE agents.4. Within the list of available agents, expand the SAP NetWeaver application
server entry of your choice.5. Within list of available J2EE application server workspaces on the SAP
NetWeaver server, click the Enterprise Java Beans entry.
For additional information, see:v Organization of the predefined workspacesv Attribute groups used by the predefined workspaces
EJB Modules workspaceThis workspace displays aggregated information about each defined EJB. Itdisplays aggregated bean performance data for all Enterprise beans deployed to anEJB module. It also displays aggregated information for the application server thataggregates bean performance data for all Enterprise beans deployed to theapplication server.
This workspace displays data provided by the “Enterprise Java Bean Modules -J2EE attributes” on page 475.
Note to OracleAS9 users: This workspace is not supported on OracleAS9 and nodata is provided, hence this workspace is always empty.
The predefined workspace contains the following items:v Highest Creation Count bar chart, which displays the largest number of times
that beans were created during the intervalv EJB Modules report, which displays aggregated information for each defined EJB
module that aggregates bean performance data for all Enterprise beans deployedto that module. The report also displays aggregated information for theapplication server that aggregates bean performance data for all Enterprise beansdeployed to the application server
Accessing the EJB Modules workspace
To access this workspace, complete the following steps:1. Within the Navigator, expand Windows Systems, Linux Systems, UNIX
Systems, as appropriate for the node you are monitoring.2. Within the node list, expand the entry that corresponds to your node name.3. Within the list of monitored applications associated with that node, expand the
list of J2EE agents.4. Within the list of available agents, expand the J2EE application server entry of
your choice.5. Within the list of available J2EE application server workspaces on that server,
select EJB Modules.
432 ITCAM Agents for WebSphere Applications, J2EE, and HTTP Servers: User Guide

For additional information, see:v Organization of the predefined workspacesv Attribute groups used by the predefined workspaces
EJBs - Selected Enterprise Application workspaceThis workspace displays resource statistics for selected EJB module. It displaysperformance statistics about individual EJBs deployed to the J2EE application.
This workspace displays data provided by the Enterprise Java Bean Components -WebLogic attributes.
The predefined workspace contains the following items:v Highest Activation Rates bar chart, which displays the highest number of beans
from this EJB Home that have been activated per second for the interval sincethe previous sample
v EJBs - Selected Enterprise Application report, which displays resource statisticsfor selected EJB module.
Accessing the EJBs - Selected Enterprise Application workspace
This workspace is accessed from the EJB Components workspace. To list the EJBs,use one of the following procedures:v From the primary Tivoli Enterprise Portal menu, open the View menu, then
click Workspace > EJBs - Selected Enterprise Application.v Within the Navigator, right-click the EJB Components entry and select
Workspace> EJBs - Selected Enterprise Application.v Organization of the predefined workspacesv Attribute groups used by the predefined workspaces
Garbage Collection Analysis workspaceThis workspace summarizes all the Java Virtual Machine garbage-collector activityover a user-defined interval. The JVM generates detailed garbage collection logs foran application server when started with the verbose:gc runtime parameter.
This workspace displays data provided by the Garbage Collection Analysisattributes.
The predefined workspace contains the following items:v Garbage Collection Rate - History graph, which displays the rate at which the
garbage-collection algorithm is being invokedv Heap Usage - History bar chart, which displays the high water mark of free
storage (in kilobytes) available in the heap after each garbage-collector runv Percentage of Time Garbage Collector Running - History graph, which displays
the percentage of real time the garbage collector was running during the currentinterval, for each server region
v Garbage Collection Analysis report, which displays information about thegarbage-collection activities within the Java Virtual Machine that is hosting theapplication server. For example, this report displays the number of times thecollector ran during the interval and the resulting number of objects that thecollector freed
Chapter 4. ITCAM Agent for J2EE 433

Accessing the Garbage Collection Analysis workspace
To access this workspace, complete the following steps:1. Within the Navigator, expand Windows Systems, Linux Systems, UNIX
Systems, as appropriate for the node you are monitoring.2. Within the node list, expand the entry that corresponds to your node name.3. Within the list of monitored applications associated with that node, expand the
list of J2EE agents.4. Within the list of available agents, expand the J2EE application server of your
choice.5. Within the list of available J2EE application server workspaces on that server,
click the Garbage Collection Analysis entry.
For additional information, see:v Organization of the predefined workspacesv Attribute groups used by the predefined workspaces
Garbage Collections - Selected Allocation Failure workspaceThis workspace provides detailed information about the garbage-collection cyclesthat occurred in response to a specific heap-allocation failure that occurred withinthe Java Virtual Machine.
This workspace displays data provided by the Garbage Collection Cycle attributes .
Note to Solaris and HP-UX users: Allocation-failure information is not recordedon these platforms; hence this workspace is always empty.
The predefined workspace contains the following items:v GC Elapsed Times bar chart, which breaks down the mark, sweep, and compact
times (in milliseconds) for each garbage-collection cycle that occurred for theselected allocation failure
v Heap Usage bar chart, which displays the JVM heap usage (kilobytes in use,freed, and free at start of garbage collection) for each garbage-collection cycle
v Garbage Collections - Selected Allocation Failure report, which displaysinformation about a single garbage-collection cycle that the Java Virtual Machinehosting the application server performed. For example, this report displays thefree heap space both before and after garbage collection, the heap space freed,and the number of objects moved during garbage collection
Accessing the Garbage Collections - Selected Allocation Failureworkspace
To access this workspace from the “Allocation Failures workspace” on page 424,use one of the following procedures:v From the Allocation Failures report, right-click the link icon, and select Garbage
Collections - Selected Allocation Failure.v From the Allocation Failure Elapsed Times bar chart or the Heap Usage -
History bar chart, right-click any bar and select Link To -> Garbage Collections- Selected Allocation Failure.
For additional information, see:v Organization of the predefined workspacesv Attribute groups used by the predefined workspaces
434 ITCAM Agents for WebSphere Applications, J2EE, and HTTP Servers: User Guide

J2EE Agent workspaceThis workspace displays product events that affect the ability of the J2EEApplication Server agent to collect data. This workspace displays events occurringwithin the J2EE Application Server agent and J2EE application servers that areinstalled on the host computer. It also displays the status of the Tivoli EnterpriseMonitoring Agent.
The predefined workspace contains the following items:v J2EE Agent Events report, which displays information about agent-level events
that affect the ability of the Tivoli Enterprise Monitoring Agent to collect data forthe J2EE application server. You can use this view to see exception and errormessages, their IDs, and their severity.Agent Events report also shows the result of issuing a Take Action command.Place your cursor over a truncated message to display the text of the completemessage.This report displays data reported by the “J2EE Agent Events attributes” onpage 486.
v Application Servers Summary report displays information about status of theJ2EE server.This report displays data reported by the Application Server Status attributes .
Accessing the J2EE Agent workspace
To access this workspace, complete the following steps:1. Within the Navigator, expand Windows Systems, Linux Systems, UNIX
Systems, as appropriate for the node you are monitoring.2. Within the node list, expand the entry that corresponds to your node name.3. Within the list of available Tivoli Enterprise Monitoring Agents on that node,
click the J2EE Agent entry.
For additional information, see:v Organization of the predefined workspacesv Attribute groups used by the predefined workspacesv “Situations for ITCAM Agent for J2EE” on page 528
J2SE Application workspaceThis workspace displays overall statistics for each application server beingmonitored by the Tivoli Enterprise Monitoring Agent.
The predefined workspace contains the following items:v Heap Usage - History bar chart, which displays free memory size and used
memory size (in kilo bytes) within the J2SE Application Server heap over time.The hover help associated with the chart displays the exact valuesThis view displays data provided by the Garbage Collection Analysis attributes .
v Response Time - History graph, which shows the server response time torequests over timeThis view displays data provided by the Request Times and Rates attributes .
v Request Rate - History graph, which shows the rate at which requests have beenreceived by this server over timeThis view displays data provided by the Request Times and Rates attributes .
Chapter 4. ITCAM Agent for J2EE 435

v Percent CPU Used - History graph, which shows the percentage of the CPU thatthis server consumed over timeThis view displays data provided by the Application Server attributes .
v Application Server Summary report, which displays overall information aboutthis J2SE Application Server, including JVM statistics and CPU usage statisticsThis view displays data provided by the Application Server attributes .
Accessing J2SE Application Workspace
To access this workspace, complete the following steps:1. Within the Navigator, expand Windows Systems, Linux Systems, UNIX
Systems, as appropriate for the node you are monitoring.2. Within the node list, expand the entry that corresponds to your node name.3. Within the list of monitored applications on that node, expand the list of J2EE
agents.4. Within the list of available agents, click the J2SE Application entry of your
choice.
For additional information, see:v Organization of the predefined workspacesv Attribute groups used by the predefined workspaces
JBoss App Server workspaceThis workspace displays overall statistics for each application server beingmonitored by the Tivoli Enterprise Monitoring Agent.
The predefined workspace contains the following items:v Heap Usage - History bar chart, which displays free memory size and used
memory size (in kilo bytes) within the J2EE Application Server heap over time.The hover help associated with the chart displays the exact valuesThis view displays data provided by the Garbage Collection Analysis attributes .
v Response Time - History graph, which shows the server response time torequests over a time periodThis view displays data provided by the Request Times and Rates attributes .
v Request Rate - History graph, which shows the rate at which requests have beenreceived by this server over a time periodThis view displays data provided by the Request Times and Rates attributes .
v Percent CPU Used - History graph, which shows the percentage of the CPU thatthis server consumed over a time periodThis view displays data provided by the Application Server attributes .
v Application Server Summary report, which displays overall information aboutthis JBoss application server, including JVM statistics and CPU usage statisticsThis view displays data provided by the Application Server attributes .
Accessing the JBoss App Server workspace
To access this workspace, complete the following steps:1. Within the Navigator, expand Windows Systems, Linux Systems, UNIX
Systems, as appropriate for the node you are monitoring.2. Within the node list, expand the entry that corresponds to your node name.
436 ITCAM Agents for WebSphere Applications, J2EE, and HTTP Servers: User Guide

3. Within the list of monitored applications on that node, expand the list of J2EEagents.
4. Within the list of available agents, select the JBoss App Server entry of yourchoice.
For additional information, see:v “Organization of the predefined workspaces” on page 415v “Attribute groups used by the predefined workspaces” on page 456
JCA Connection Pools workspaceThis workspace displays information about resource adapters and connectors thatadhere to JCA, the J2EE Connector Architecture (JCA).
In JBoss Application Server, this workspace displays data provided by the “JCAConnection Pools - J2EE attributes” on page 489.
The predefined workspace contains the following items:v Highest Pool Usage bar chart, which shows the largest pool usage for each JCA
connection pool. The Y-axis headings correspond to the row number of the JCAConnection Pools report
v Worst Wait Times bar chart, which shows the worst wait time (in milliseconds)for each of the JCA connection pools. The Y-axis headings correspond to the rownumber of the JCA Connection Pools report
v Worst Use Times bar chart, which shows the worst use time (in milliseconds) foreach of the JCA connection pools. The Y-axis headings correspond to the rownumber of the JCA Connection Pools report
v JCA Connection Pools report, which displays information about the JCAconnection pool for each Connection Factory
In the Oracle/BEA WebLogic Application Server, this workspace displays dataprovided by the “J2EE Connector Connection Pools - WebLogic attributes” on page487.
The predefined workspace contains the following items:v Highest Active Connections bar chart, which shows the current highest active
connections.v Worst Connection Rejection Rates, which shows the worst connection rejection
rates (in milliseconds) for each JCA connection pools.v JCA Connection Pools report, which displays information about the JCA
connection pool for each Connection Factory
Accessing the JCA Connection Pools workspace
To access this workspace, complete the following steps:1. Within the Navigator, expand Windows Systems, Linux Systems, UNIX
Systems, as appropriate for the node you are monitoring.2. Within the node list, expand the entry that corresponds to your node name.3. Within the list of monitored applications on that node, expand the list of J2EE
agents.4. Within the list of available agents, expand the J2EE application server of your
choice.
Chapter 4. ITCAM Agent for J2EE 437

5. Within the list of available J2EE application server workspaces in that server,select the JCA Connection Pools entry.
For additional information, see:v Organization of the predefined workspacesv Attribute groups used by the predefined workspaces
JDBC Connection Pools workspaceThis workspace provides usage information about the JDBC connection pools for adatabase in the Oracle/BEA WebLogic Server.
This workspace displays data provided by the “JDBC Connection Pools - WebLogicattributes” on page 491.
The predefined workspaces contains the following items:v Highest Active Connections bar chart, which shows the current highest active
connectionsv Worst Wait Times bar chart, which shows the worst wait times (in milliseconds)
for each database connection poolv DB Connection Pools report, which displays information about the database
connection pool for each defined data source, and an aggregated value thataggregates over all data sources. For example, this report displays the number ofthreads waiting for a connection and the number of connections created andreleased
Accessing the JDBC Connection Pools workspace
To access this workspace, complete the following steps:1. Within the Navigator, expand Windows Systems, Linux Systems, UNIX
Systems, as appropriate for the node you are monitoring.2. Within the node list, expand the entry that corresponds to your node name.3. Within the list of monitored applications associated with that node, expand the
list of J2EE agents.4. Within the list of available agents, expand the Oracle/BEA WebLogic
application server entry.5. Within the list of available J2EE application server workspaces on the
Oracle/BEA WebLogic server, click the JDBC Connection Pools entry.
Selected JDBC Connection Pool - History workspace
This workspace displays the historical information that corresponds to theinformation in the JDBC Connection Pools workspace for a selected connectionpool. Historical information is collected over a particular measured time span. Seethe online help for Tivoli Enterprise Portal for a detailed explanation of historicalreporting.
The predefined workspace contains the following items:v Active and Available Connections - History table, which displays the history of
active and available connections.v Highest Wait Times - History table, which displays the history of the highest
wait times (in milliseconds) for each database connection pool.v Selected JDBC Connection Pool - History report, which displays historical data
and statistics in the JDBC connection pools for a selected connection pool.
438 ITCAM Agents for WebSphere Applications, J2EE, and HTTP Servers: User Guide

Accessing the Selected JDBC Connection Pool - Historyworkspace
To access this workspace from the DC Connection Pools workspace, use one of thefollowing procedures:v From the JDBC Connection Pools report, right-click the link icon, and from the
menu, click Selected JDBC Connection Pool - History.v From the Highest Active Connection bar chart, the Worst Wait Times bar chart,
right-click any bar, and select Link To -> Selected JDBC Connection Pool -History.
For additional information, see:v Organization of the predefined workspacesv Attribute groups used by the predefined workspaces
JMS Sessions workspaceThis workspace displays statistics for Java Message Service (JMS) sessions inOracle/BEA WebLogic Server.
In Oracle/BEA WebLogic Server, the workspace displays data provided by the“JMS Sessions - WebLogic attributes” on page 499.
The predefined workspace contains the following items:v Most Messages Sent bar chart, which displays the largest number of messages
sentv Most Messages Received bar chart, which displays the largest number of
messages receivedv JMS Sessions report, which displays statistics for JMS sessionsv Message Producers report, which displays information about message producersv Message Consumers report, which displays information about message
consumers
Accessing the JMS Sessions workspace
To access this workspace, complete the following steps:1. Within the Navigator, expand Windows Systems, Linux Systems, UNIX
Systems, as appropriate for the node you are monitoring.2. Within the node list, expand the entry that corresponds to your node name.3. Within the list of monitored applications associated with that node, expand the
list of J2EE agents.4. Within the list of available agents, expand the Oracle/BEA WebLogic
application server.5. Within the list of available J2EE application workspaces on that server, click the
JMS Sessions entry.
For additional information, see:v Organization of the predefined workspacesv Attribute groups used by the predefined workspaces
JMS Summary workspaceThe JMS Summary workspace displays information about queues being used byyour applications via the JMS interface and about how J2EE Application Server
Chapter 4. ITCAM Agent for J2EE 439

applications are using J2EE MQ. It displays such information as the number ofmessages read and written and which queue managers and queues were usedduring the interval.
This workspace displays data provided by the JMS Summary attributes .
The predefined workspace contains the following items:v Worst JMS Send Times bar chart, which displays the longest times (in
milliseconds) that your application spent putting messages into a queue duringthe interval
v Worst JMS Receive Times bar chart, which displays the longest times (inmilliseconds) that your application spent getting messages from a queue duringthe interval
v Worst JMS Browse Times bar chart, which displays the longest times (inmilliseconds) that your application spent browsing messages on a queue duringthe interval
v JMS Summary - Current Interval report, which displays detailed informationabout the send, receive, browse, and publish times for the messagingmiddleware (J2EE MQ) by your J2EE Application Server applications using JMS.It includes about the queue managers and queues that are being used and howmany messages are being read and written
Accessing the JMS Summary workspace
To access this workspace, complete the following steps:1. Within the Navigator, expand Windows Systems, Linux Systems, UNIX
Systems, as appropriate for the node you are monitoring.2. Within the node list, expand the entry that corresponds to your node name.3. Within the list of monitored applications associated with that node, expand the
list of J2EE agents.4. Within the list of available agents, expand the J2EE application server of your
choice.5. Within the list of available J2EE application server workspaces on that server,
click the JMS Summary entry.
For additional information, see:v Organization of the predefined workspacesv Attribute groups used by the predefined workspaces
JTA Resources workspaceThis workspace displays information about the Java Transaction API (JTA)resources.
This workspace displays data provided by the “JTA Resources - J2EE attributes” onpage 506 for JBoss and Oracle application servers. For WebLogic application server,this workspace displays data provided by “Java Transaction Service - WebLogicattributes” on page 503.
The predefined workspace contains the following items:v Active Transactions bar chart, which shows the number of active transactionsv JTA Resources report, which displays information about the JTA resources
440 ITCAM Agents for WebSphere Applications, J2EE, and HTTP Servers: User Guide

Accessing the JTA Resources workspace
To access this workspace, complete the following steps:1. Within the Navigator, expand Windows Systems, Linux Systems, UNIX
Systems, as appropriate for the node you are monitoring.2. Within the node list, expand the entry that corresponds to your node name.3. Within the list of monitored applications associated with that node, expand the
list of J2EE agents.4. Within the list of available agents, expand the J2EE application server of your
choice.5. Within the list of available J2EE application server workspaces on that server,
click the JTA Resources entry.
For additional information, see:v “Organization of the predefined workspaces” on page 415v “Attribute groups used by the predefined workspaces” on page 456
JTA Summary workspaceThis workspace displays the performance summary statistics information abouttransactions in SAP NetWeaver application server.
This workspace displays data provided by “JTA Summary - NetWeaver attributes”on page 507.
The predefined workspace contains the following items:v Transactions - History graph, which shows the history of transactionsv Transaction Service report, which displays performance data of the Transaction
Service
Accessing the JTA Summary workspace
To access this workspace, complete the following steps:1. Within the Navigator, expand Windows Systems, Linux Systems, UNIX
Systems, as appropriate for the node you are monitoring.2. Within the node list, expand the entry that corresponds to your node name.3. Within the list of monitored applications associated with that node, expand the
list of J2EE agents.4. Within the list of available agents, expand the SAP NetWeaver application
server entry of your choice.5. Within the list of available J2EE application server workspaces on the SAP
NetWeaver server, click the JTA Summary entry.
For additional information, see:v Organization of the predefined workspacesv Attribute groups used by the predefined workspaces
JVM Statistics workspaceThis workspace reports the detailed statistics of the operating system on which theJ2SE application server is running and the Java Virtual Machine (JVM) information.
Chapter 4. ITCAM Agent for J2EE 441

This workspace displays data provided by “JDK - Operation System attributes” onpage 493,“JDK - Memory attributes” on page 495“JDK - JVM attributes” on page496 and “JDK - Threading attributes” on page 498.
The predefined workspace contains the following items:v Memory Usage - History graph, which displays the amount of used heap
memory and non-heap memory (in kilobytes) in the JVM over timev Pending Objects - History graph, which displays the number of objects that are
not finalizedv Heap Sizes - History graph, which displays the maximum heap memory size
and non-heap memory size (in kilobytes) in the JVM over timev Threads - History graph, which displays the information about threads, such as
peak threads and daemon threadsv JVM Statistics report, which shows the overall JVM information that the current
J2SE application server uses, such as JVM name, version, and vendorv Operating System report, which shows the overall information about the
operating system on which the J2SE application server is running
Accessing the JVM Statistics workspace
To access this workspace, complete the following steps:1. Within the Navigator, expand Windows Systems, Linux Systems, UNIX
Systems, as appropriate for the node you are monitoring.2. Within the node list, expand the entry that corresponds to your node name.3. Within the list of monitored applications associated with that node, expand the
list of J2EE agents.4. Within the list of available agents, expand the J2SE Application entry of your
choice.5. Within the list of available workspaces on the J2SE Application, click the JVM
Statistics entry.
For additional information, see:v Organization of the predefined workspacesv Attribute groups used by the predefined workspaces
Log Analysis workspaceThis workspace reports application server error and exception conditions asrecorded in the application server log file.
This workspace displays data provided by the Log Analysis attributes .
The predefined workspace contains the following items:v DC Message Events report, which displays information about the data collector
MessagesThis report displays data reported by the “DC Messages - J2EE attributes” onpage 473.
v Log Analysis report, which displays application server error and exceptionconditions as recorded in the application server log file. This informationincludes the exception severity as well as the ID and text of the associatedmessage
442 ITCAM Agents for WebSphere Applications, J2EE, and HTTP Servers: User Guide

Accessing the Log Analysis workspace
To access this workspace, complete the following steps:1. Within the Navigator, expand Windows Systems, Linux Systems, UNIX
Systems, as appropriate for the node you are monitoring.2. Within the node list, expand the entry that corresponds to your node name.3. Within the list of monitored applications associated with that node, expand the
list of J2EE agents.4. Within the list of available agents, expand the J2EE application server of your
choice.5. Within the list of available J2EE application server workspaces in that server,
click the Log Analysis entry.
For additional information, see:v Organization of the predefined workspacesv Attribute groups used by the predefined workspacesv “Situations for ITCAM Agent for J2EE” on page 528
Oracle App Server workspaceThis workspace displays overall statistics for each application server beingmonitored by the Tivoli Enterprise Monitoring Agent.
The predefined workspace contains the following items:v Heap Usage - History bar chart, which displays free memory size and used
memory size (in kilobytes) within the J2EE Application Server heap over time.The hover help associated with the chart displays the exact valuesThis view displays data provided by the Garbage Collection Analysis attributes .
v Response Time - History graph, which shows the server response time torequests over timeThis view displays data provided by the Request Times and Rates attributes .
v Request Rate - History graph, which shows the rate at which requests have beenreceived by this server over timeThis view displays data provided by the Request Times and Rates attributes .
v Percent CPU Used - History graph, which shows the percentage of the CPU thatthis server consumed over timeThis view displays data provided by the Application Server attributes .
v Application Server Summary report, which displays overall information aboutthis Oracle Application Server, including JVM statistics and CPU usage statisticsThis view displays data provided by the Application Server attributes .
Accessing Oracle App Server Workspace
To access this workspace, complete the following steps:1. Within the Navigator, expand Windows Systems, Linux Systems, UNIX
Systems, as appropriate for the node you are monitoring.2. Within the node list, expand the entry that corresponds to your node name.3. Within the list of monitored applications associated with that node, expand the
list of J2EE agents.4. Within the list of available agents, click the Oracle App Server entry of your
choice.
Chapter 4. ITCAM Agent for J2EE 443

For additional information, see:v Organization of the predefined workspacesv Attribute groups used by the predefined workspaces
Request Analysis workspaceThe workspace reports response times and functional decomposition informationabout requests (including servlets, JSPs, and EJB methods) that completed duringthe interval. A historical version of this workspace provides a long-term view of asingle request that you select.
This workspace displays data provided by the Request Analysis attributes .
The predefined workspace contains the following items:v Worst Response Times bar chart, which displays the five worst response times
for requests processed during the current intervalv Worst Completion Rates bar chart, which displays the 10 requests that have the
worst completion ratesv Requests - Current Interval report, which displays detailed information about
the response times recorded for each request
Accessing the Request Analysis workspace
To access this workspace, complete the following steps:1. Within the Navigator, expand Windows Systems, Linux Systems, UNIX
Systems, as appropriate for the node you are monitoring.2. Within the node list, expand the entry that corresponds to your node name.3. Within the list of monitored applications associated with that node, expand the
list of J2EE agents.4. Within the list of available agents, expand the J2EE application server of your
choice.5. Within the list of available J2EE application server workspaces on that server,
select the Request Analysis entry.
Selected Request - History workspace
The Selected Request - History workspace displays the historical information thatcorresponds to the information in the Request Analysis workspace for a singlerequest type that you select. Historical information is collected over a specific timespan. See the online help for Tivoli Enterprise Portal for a detailed explanation ofhistorical reporting.
Accessing the Selected Request - History workspace
To access this workspace from the Request Analysis workspace, use one of thefollowing procedures:v From the Requests - Current Interval report, right-click the link icon, then from
the menu, click Selected Request - History.v From the Worst Response Times bar chart, right-click any bar, then from the
menu, click Link To > Selected Request - History.
For additional information, see:v Organization of the predefined workspaces
444 ITCAM Agents for WebSphere Applications, J2EE, and HTTP Servers: User Guide

v Attribute groups used by the predefined workspaces
Selected Request - Baseline workspaceThis workspace displays aggregated information about the request baseline. Thebaselining collects statistical information about an application requests completiontimes and uses this information to assign fair and bad thresholds on theapplication requests. The product divides the whole request response times intobuckets and collects individual hits into each bucket. Use these attributes to getstatistics from individual requests collected during baselining interval.
This workspace displays data provided by the Baseline attributes.
The predefined workspace contains:v Baseline Data report, which shows lower and upper boundaries for each bucket
request as well as the breakdown of nested request types in percentage.v Request Label report, which shows the monitoring configuration settings for
selected requests, including auto-threshold settings and actual thresholdscalculated from the baseline data.
v Nested Delays Distribution bar chart, which displays a bar for each bucket ofresponse times across the different nested types (JDBC, JCA, JMS, and so on.).This chart provides you with additional hints and insight about how to interpretresponse times distribution displayed in the distribution chart.
v Response Time Distribution bar chart, which displays the distribution of theservlet response times on the baselining interval, also called zones.
Accessing the Selected Request - Baseline workspace
To access this workspace from the Application Registry workspace, use thefollowing procedure:v From the Application Configurations report, right-click the link icon to the left of
any row and select Selected Request - Baseline.
For additional information, see:v Organization of the predefined workspacesv Attribute groups used by the predefined workspaces
Selected Application - Application Tier Analysis workspaceThe workspace displays detailed information about application tier health for aselected J2EE application.
The application tier health is derived from the following performance statistics:v Calculated application request delays in EJB container or custom requests delays
compared against corresponding thresholds assigned in applicationconfiguration.
v Completion rates for application edge EJB requests.v Application server ORB thread pool utilization level.
This workspace displays data provided by the Application Health Status attributes.
The predefined workspace contains:v Application Tier Analysis report, which shows the overall health status of the
Application tier for a selected application.
Chapter 4. ITCAM Agent for J2EE 445

v Worst Application Tier Delays - Top 10 bar chart, which displays the top 10delayed requests in the application tier. This view displays data provided by theRequest Analysis attributes.
v Worst Application Tier Completion Rates - Top 10 bar chart, which displays thetop 10 worst requests in the application tier. This view displays data providedby the Request Analysis attributes.
v JVM Health - CPU Used % graph, which displays the percentage of the CPUused by the Java Virtual Machine (JVM) during the interval. This view displaysdata provided by the Application Server attributes.
v JVM Health - Heap Used % graph, which displays the current heap usage forthe monitored JVM. This view displays data provided by the Garbage CollectionAnalysisattributes.
v JVM Health - GC Time % graph, which displays the percentage of real time thatthe garbage collector was active during the interval. This view displays dataprovided by the Garbage Collection Analysis attributes.
Accessing the Selected Application - Application Tier Analysisworkspace
To access this workspace from the Application Health Summary workspace, usethe following procedures:v From the Application Health Summary report, right-click the link icon and select
Selected Application - Application Tier Analysis.
For additional information, see:v Organization of the predefined workspacesv Attribute groups used by the predefined workspaces
Selected Application - Configuration workspaceThis workspace displays the information about the configuration details of theselected application. The workspace contains information about applicationrequests and the corresponding thresholds assigned to them, and informationabout status and configuration for application baseline activity. An entry is createdfor each application in the configuration report when a J2EE application isdiscovered by the monitoring agent. The data is also stored in a context file local tothe monitoring agent where it can persist between monitoring agent restarts.
This workspace displays data provided by the Application MonitoringConfiguration attributes.
The predefined workspace contains:v Longest Request Thresholds - Top 10 bar chart, which displays the 10 longest (in
time) request thresholds configured for the given application (Servlet/JSP URLor EJB class/method call).
v Application Requests report, which shows the discovered application requestsand thresholds assigned to them.
v Application report, which shows the common details about applicationconfiguration, including custom requests monitoring levels for application andcurrent baseline status.
446 ITCAM Agents for WebSphere Applications, J2EE, and HTTP Servers: User Guide

Accessing the Selected Application - Configuration workspace
Use the following steps to access this workspace.1. Click Application Health Summary > Application Health Summary Report.2. Right-click the link icon and select Selected Application - Configuration
For additional information, see:v Organization of the predefined workspacesv Attribute groups used by the predefined workspaces
Selected Application - Backend Tier Analysis workspaceThis workspace displays information about the details of the Backend tier for aselected application.
This workspace displays data provided by the Application Health Status attributes.
The predefined workspace contains:v Backend Tier Analysis report, which shows the overall health status of the
backend tier for a selected application.v Worst Backend Tier Delays - Top 10 bar chart, which displays the top 10 delayed
requests in the backend tier. This view displays data provided by the RequestAnalysis attributes.
v Most Used Data sources - Top 10 bar chart, which displays the average time perrequest used by queries and updates to the data source. This view displays dataprovided by the Datasources attributes.
v Most Used JMS Resources - Top 10 bar chart, which displays the longest timesyour application spent in getting messages from a queue, putting messages ontoa queue, publishing messages to a queue, or browsing messages on a queueduring the interval. This view displays data provided by the JMS Summaryattributes.
v JVM Health - CPU Used % graph, which displays the percentage of the CPUused by the Java Virtual Machine (JVM) during the interval. This view displaysdata provided by the Application Server attributes.
v JVM Health - Heap Used % graph, which displays the current heap usage forthe monitored JVM. This view displays data provided by the Garbage CollectionAnalysis attributes.
v JVM Health - GC Time % graph, which displays the percentage of real time thatthe garbage collector was active during the interval. This view displays dataprovided by the Garbage Collection Analysis attributes.
Accessing the Selected Application - Backend Tier Analysisworkspace
To access this workspace from the Application Health Summary workspace, usethe following procedures:v From the Application Health Summary report, right-click the link icon and, from
the menu, click Selected Application - Backend Tier Analysis.
For additional information, see:v Organization of the predefined workspacesv Attribute groups used by the predefined workspaces
Chapter 4. ITCAM Agent for J2EE 447

Selected Application - Health History workspaceThe workspace displays the information about the historical health status of aselected application. By default, the history data is collected for the last 24 hours.
This workspace displays data provided by the Application Health Status attributes.
The predefined workspace contains:v Availability/Throughput - History graph, which displays average request
processing rate by application over the time. This view displays data providedby the Request Times and Rates attributes.
v Availability/Completion Rate - History graph, which displays the averagerequest completion rate by application over the time. Completion rate is definedas the ratio of successfully completed requests count to the total count ofrequests processed by application on the interval. This view displays dataprovided by the Request Times and Rates attributes.
v Availability/Average Load- History graph, which displays the average numberof concurrent application requests over the time. This view displays dataprovided by the Request Times and Rates attributes.
v Response Time - History graph, which displays the average application responsetime over the time. This view displays data provided by the Request Times andRates attributes.
v Server Resources/CPU Used - History graph, which displays the percent of CPUtime used by the application JVM process over the time. This view displays dataprovided by the Application Server attributes.
v Server Resources/Paging Rate - History graph, which displays the systempaging rate in kilobytes per second over the time. This view displays dataprovided by the Application Server attributes.
v Server Resources/GC Active Time - History graph, which displays thepercentage of total CPU time for which the garbage collector was active over thetime. This view displays data provided by the Garbage Collection Analysisattributes.
Accessing the Selected Application - Health History workspace
To access this workspace from the Application Health Summary workspace, usethe following procedures:v From the Application Health Summary report, right-click the link icon and select
Selected Application - Health History.
For additional information, see:v Organization of the predefined workspacesv Attribute groups used by the predefined workspaces
Selected Application - Client Tier Analysis workspaceThis workspace displays detailed information about the client tier health for aselected J2EE application.
The client tier health indicator is derived from the following performance statistics:v Calculated application request delays inside Servlet/JSP or Portal container
compared against corresponding thresholds assigned in applicationconfiguration.
v Completion rates for edge Servlet/JSP and Portal application requests.
448 ITCAM Agents for WebSphere Applications, J2EE, and HTTP Servers: User Guide

This workspace displays data provided by the Application Health Status attributes.
The predefined workspace contains:v Client Tier Analysis report, which shows the overall health status of application
execution in web or portal containers.v Worst Client Tier Delays - Top 10 bar chart, which displays the top 10 requests
with biggest delays (threshold violations) in the client tier. This view displaysdata provided by the Request Analysis attributes.
v Worst Client Tier Completion Rates - Top 10 bar chart, which displays the top 10Servlet/JSP/Portal edge requests with the worst completion rates. This viewdisplays data provided by the Request Analysis attributes.
v JVM Health - CPU Used % graph, which displays the percentage of the CPUused by the Java Virtual Machine (JVM) during the interval. This view displaysdata provided by the Application Server attributes.
v JVM Health - Heap Used % graph, which displays the current heap usage forthe monitored JVM. This view displays data provided by the Garbage CollectionAnalysis attributes.
v JVM Health - GC Time % graph, which displays the percentage of real time thatthe garbage collector was active during the interval. This view displays dataprovided by the Garbage Collection Analysis attributes.
Accessing the Selected Application - Client Tier Analysisworkspace
To access this workspace from the Application Health Summary workspace, usethe following procedures:v From the Application Health Summary report, right-click the link icon to the left
of any row and select Selected Application - Client Tier Analysis.
For additional information, see:v Organization of the predefined workspacesv Attribute groups used by the predefined workspaces
Selected Request - data sources workspaceThe Selected Request - data sources workspace displays information about JDBCactivity performed by the request you selected in the primary Request Analysisworkspace.
This workspace displays data provided by the Selected Request attributes .
The predefined workspace contains the following items:v Worst Data Sources Response Times bar chart, which shows the worst response
times (in milliseconds) for data sources accessed by this requestv Selected Request - Data sources report, which displays detailed information
about the data sources accessed for the selected request
Accessing the Selected Request - data sources workspace
To access this workspace from the “Request Analysis workspace” on page 444, useone of the following procedures:v From the Requests - Current Interval report, right-click the link icon, and select
Selected Request - Datasources.
Chapter 4. ITCAM Agent for J2EE 449

v From Worst Average Response Times bar chart, right-click any bar and selectLink To > Selected Request - Datasources.
For additional information, see:v Organization of the predefined workspacesv Attribute groups used by the predefined workspaces
Selected Request - JMS Queues workspaceThe Selected Request - JMS Queues workspace displays information about messagequeues owned by messaging middleware and accessed by the request that youselected in the primary Request Analysis workspace.
This workspace displays data provided by the Selected Request attributes .
The predefined workspace contains the following items:v Worst JMS Queues Response Times bar chart, which shows the worst response
times (in milliseconds) for JMS resources accessed by this requestv Selected Request - JMS Queues report, which displays detailed information
about the JMS resources accessed by the selected request
Accessing the Selected Request - JMS Queues workspace
To access this workspace from the Request Analysis workspace , use one of thefollowing procedures:v From the Requests - Current Interval report, right-click the link icon, and select
Selected Request - JMS Queues.v From Worst Average Response Times bar chart, right-click any bar and select
Link To > Selected Request - JMS Queues.
For additional information, see:v Organization of the predefined workspacesv Attribute groups used by the predefined workspaces
Selected Request - Resource Adapters workspaceThe Selected Request - Resource Adapters workspace displays response-timeinformation about the JCA resources adapters referenced by the request youselected in the primary Request Analysis workspace.
This workspace displays data provided by the Selected Request attributes .
The predefined workspace contains the following items:v Worst Resource Adapter Response Times bar chart, which shows the
worst-performing JCA resource adapter nested requests, in millisecondsv Selected Request - Resource Adapters report, which displays detailed
information about each JCA resource adapter that was accessed by the selectedrequest
Accessing the Selected Request - Resource Adapter
To access this workspace from the “Request Analysis workspace” on page 444, useone of the following procedures:v From the Requests - Current Interval report, right-click the link icon, and select
Selected Request - Resource Adapters.
450 ITCAM Agents for WebSphere Applications, J2EE, and HTTP Servers: User Guide

v From Worst Average Response Times bar chart, right-click any bar and selectLink To > Selected Request - Resource Adapters.
For additional information, see:v Organization of the predefined workspacesv Attribute groups used by the predefined workspaces
SAP NetWeaver Server workspaceThis workspace displays overall statistics for each application server beingmonitored by the Tivoli Enterprise Monitoring Agent.
The predefined workspace contains the following items:v Heap Usage - History bar chart, which displays free memory size and used
memory size (in kilobytes) within the J2EE Application Server heap over time.The hover help associated with the chart displays the exact valuesThis view displays data provided by the Garbage Collection Analysis attributes .
v Response Time - History graph, which shows the server response time torequests over timeThis view displays data provided by the Request Times and Rates attributes .
v Request Rate - History graph, which shows the rate at which requests have beenreceived by this server over timeThis view displays data provided by the Request Times and Rates attributes .
v Percent CPU Used - History graph, which shows the percentage of the CPU thatthis server consumed over timeThis view displays data provided by the Application Server attributes .
v Application Server Summary report, which displays overall information aboutthis SAP NetWeaver Server, including JVM statistics and CPU usage statisticsThis view displays data provided by the Application Server attributes .
Accessing SAP NetWeaver Server workspace
To access this workspace, complete the following steps:1. Within the Navigator, expand Windows Systems, Linux Systems, UNIX
Systems, as appropriate for the node you are monitoring.2. Within the node list, expand the entry that corresponds to your node name.3. Within the list of monitored applications associated with that node, expand the
list of J2EE agents.4. Within the list of available agents, click the SAP NetWeaver Server entry of
your choice.
For additional information, see:v “Organization of the predefined workspaces” on page 415v “Attribute groups used by the predefined workspaces” on page 456
Servlets/JSPs - Selected Enterprise Application workspaceThis workspace displays performance statistics for Servlets/JSPs running in thegiven Enterprise Application.
This workspace displays data provided by the “Servlets and JSPs - WebLogicattributes” on page 523.
Chapter 4. ITCAM Agent for J2EE 451

The predefined workspace contains the following items:v Worst Execution Times bar chart, which displays the worst amount of time the
invocations of the servlet have executed for the interval since the previoussample
v Servlets/JSPs - Selected Enterprise Application report, which displaysperformance information for servlets and JavaServer pages
Accessing the Servlets/JSPs - Selected Enterprise Applicationworkspace
To access this workspace from the“Web Applications workspace” on page 453 inBEA WebLogic application server, use one of the following procedures:v From the web Applications report, right-click the link icon, and select
Servlets/JSPs - Selected Enterprise Application.v From the Worst Response Times bar chart, the Most Popular web Applications
bar chart, the Worst Error Rates bar chart, or the Worst Execution Time barchart, right-click any bar and select Link To > Servlets/JSPs - SelectedEnterprise Application.
For additional information, see:v “Organization of the predefined workspaces” on page 415v “Attribute groups used by the predefined workspaces” on page 456
Servlets/JSPs - Selected Web Application workspaceThis workspace displays statistical data regarding the servlets and JSPs invoked bya single web application.
This workspace displays data provided by the “Servlets JSPs - J2EE attributes” onpage 521.
The predefined workspace contains the following items:v Worst Response Times bar chart, which displays the worst average response
times (in milliseconds) for servlets invoked by the selected web applicationv Servlets/JSPs - Selected Web Application report, which displays performance
information about the servlets and JSPs invoked by the application. For example,this report displays the average number of concurrent requests for a servlet andthe time it takes a servlet to respond to a request
Accessing the Servlets/JSPs - Selected Web Applicationworkspace
To access this workspace from the “Web Applications workspace” on page 453, useone of the following procedures:v From the Web Applications report, right-click the link icon, and select
Servlets/JSPs - Selected Web Application.v From the Worst Response Times bar chart, the Most Popular Web Applications
bar chart, the Worst Error Rates bar chart, or the Worst Execution Time barchart, right-click any bar and select Link To -> Servlets/JSPs - Selected WebApplication.
For additional information, see:v “Organization of the predefined workspaces” on page 415v “Attribute groups used by the predefined workspaces” on page 456
452 ITCAM Agents for WebSphere Applications, J2EE, and HTTP Servers: User Guide

Tomcat Server workspaceThis workspace displays overall statistics for each application server beingmonitored by the Tivoli Enterprise Monitoring Agent.
The predefined workspace contains the following items:v Heap Usage - History bar chart, which displays free memory size and used
memory size (in kilo bytes) within the J2EE Application Server heap over time.The hover help associated with the chart displays the exact valuesThis view displays data provided by the Garbage Collection Analysis attributes .
v Response Time - History graph, which shows the server response time torequests over timeThis view displays data provided by the Request Times and Rates attributes .
v Request Rate - History graph, which shows the rate at which requests have beenreceived by this server over timeThis view displays data provided by the Request Times and Rates attributes .
v Percent CPU Used - History graph, which shows the percentage of the CPU thatthis server consumed over timeThis view displays data provided by the Application Server attributes .
v Application Server Summary report, which displays overall information aboutthis Tomcat server, including JVM statistics and CPU usage statisticsThis view displays data provided by the Application Server attributes .
Accessing Tomcat Server Workspace
To access this workspace, perform the following steps:1. Within the Navigator, expand Windows Systems, Linux Systems, UNIX
Systems, as appropriate for the node you are monitoring.2. Within the node list, expand the entry that corresponds to your node name.3. Within the list of monitored applications associated with that node, expand the
list of J2EE agents.4. Within the list of available agents, click the Tomcat Server entry of your choice.
For additional information, see:v “Organization of the predefined workspaces” on page 415v “Attribute groups used by the predefined workspaces” on page 456
Web Applications workspaceThis workspace displays information about the web applications running in J2EEapplication servers.
Note to OracleAS9 users: This workspace is not supported on OracleAS9 and nodata is provided, hence this workspace is always empty.
This workspace displays data provided by the “Web Applications - J2EE attributes”on page 525.
The predefined workspace contains the following items:v Worse Response Times bar chart, which shows the worst servlet response times
(in milliseconds) during the intervalv Most Popular Web Applications bar chart, which shows the servlet exception
and request rates (in events per second)
Chapter 4. ITCAM Agent for J2EE 453

v Web Applications report, which displays aggregated performance data for eachweb application about all servlets and JSPs deployed to that web application,including response and error rates and response times
In the BEA WebLogic Application Server, this workspace displays data provided bythe “Web Applications - WebLogic attributes” on page 527.
The predefined workspace contains the following items:v Most Active Sessions bar chart, which shows the high water mark of the total
number of open sessions in this serverv Most Popular Web Applications bar chart, which shows the servlet exception
and request rates (in events per second)v Web Applications report, which displays aggregated performance data for each
web application about all servlets and JSPs deployed to that web application,including response and error rates and response times
Accessing the Web Applications workspace
To access this workspace, perform the following steps:1. Within the Navigator, expand Windows Systems, Linux Systems, UNIX
Systems, as appropriate for the node you are monitoring.2. Within the node list, expand the entry that corresponds to your node name.3. Within the list of monitored applications associated with that node, expand the
list of J2EE agents.4. Within the list of available agents, expand the J2EE application server of your
choice.5. Within the list of available J2EE application server workspaces on that server,
click the Web Applications entry.
For additional information, see:v “Organization of the predefined workspaces” on page 415v “Attribute groups used by the predefined workspaces” on page 456
Web Container workspaceThis workspace displays summary statistics about servlets/JSPs invocations in SAPNetWeaver Web Container.
This workspace displays data provided by the “Web Container - NetWeaverattributes” on page 524.
The predefined workspace contains the following items:v Security Sessions bar chart, which displays the number of current valid, invalid,
and also timed out security sessionsv Http Sessions bar chart, which displays the number of current valid, invalid and
also timed out http sessionsv Servlets/JSPs report, which displays performance information about the servlets
and JSPs invoked by the application
Accessing the Web Container workspace
To access this workspace, perform the following steps:
454 ITCAM Agents for WebSphere Applications, J2EE, and HTTP Servers: User Guide

1. Within the Navigator, expand Windows Systems, Linux Systems, UNIXSystems, as appropriate for the node you are monitoring.
2. Within the node list, expand the entry that corresponds to your node name.3. Within the list of monitored applications associated with that node, expand the
list of J2EE agents.4. Within the list of available agents, expand the SAP NetWeaver application
server.5. Within the list of available J2EE application server workspaces on the SAP
NetWeaver server, click the Web Container entry.
For additional information, see:v Organization of the predefined workspacesv Attribute groups used by the predefined workspaces
WebSphere App Server CE workspaceThis workspace displays overall statistics for each application server beingmonitored by the Tivoli Enterprise Monitoring Agent.
The predefined workspace contains the following items:v Heap Usage - History bar chart, which displays free memory size and used
memory size (in kilo bytes) within the J2EE Application Server heap over time.The hover help associated with the chart displays the exact valuesThis view displays data provided by the Garbage Collection Analysis attributes .
v Response Time - History graph, which shows the server response time torequests over timeThis view displays data provided by the Request Times and Rates attributes .
v Request Rate - History graph, which shows the rate at which requests have beenreceived by this server over timeThis view displays data provided by the Request Times and Rates attributes .
v Percent CPU Used - History graph, which shows the percentage of the CPU thatthis server consumed over timeThis view displays data provided by the Application Server attributes .
v Application Server Summary report, which displays overall information aboutthis WebSphere App Server CE application server, including JVM statistics andCPU usage statisticsThis view displays data provided by the Application Server attributes .
Accessing WebSphere App Server CE workspace
To access this workspace, perform the following steps:1. Within the Navigator, expand Windows Systems, Linux Systems, UNIX
Systems, as appropriate for the node you are monitoring.2. Within the node list, expand the entry that corresponds to your node name.3. Within the list of monitored applications associated with that node, expand the
list of J2EE agents.4. Within the list of available agents, click the WebSphere App Server CE entry of
your choice.
For additional information, see:v “Organization of the predefined workspaces” on page 415v “Attribute groups used by the predefined workspaces” on page 456
Chapter 4. ITCAM Agent for J2EE 455

Attributes for ITCAM Agent for J2EEIBM Tivoli Composite Application Manager for Application Diagnostics Agent forJ2EE is a Tivoli Enterprise Management Agent that is located within yourdistributed system. This agent gathers data about running J2EE Application Serverprocesses that have been collected and stored by the ITCAM for J2EE datacollector, and stores this data in elements called attributes. Each attribute is acharacteristic of an object. For example, the Receive Count attribute in the JMSSummary attribute group counts the number of messages your applications haveretrieved from JMS messages queues.
Attribute groups
The ITCAM Agent for J2EE attributes are organized into groups of related items.These attribute groups comprise the attribute tables for this agent. For example, theGarbage Collection Analysis attribute group provides information about thefrequency with which the Java Virtual Machine (JVM) starts its garbage collector.
Attributes and workspaces
Various attributes are referenced by the predefined situations of the product. Youcan also use the IBM Tivoli Composite Application Manager for ApplicationDiagnostics Agent for J2EE attributes to create your own situations to monitor theperformance of your J2EE application servers and their applications. Thesesituations can monitor your J2EE Application Server resources or correlate multipleconditions to alert you to problems that might have occurred when attribute valuesexceed defined thresholds.
Attribute groups used by the predefined workspacesA workspace contains graphical data or report columns that correspond directly toparticular attributes in an attribute group. The table shows the correlationsbetween the predefined workspaces and the attribute groups. The primary andsecondary workspaces are listed alphabetically, not in the order in which theydisplay in the Navigator.
Table 83. Workspaces and the attribute groups they reference
Workspace Related Attribute Groups
Application Health Summary Application Health Status
Application Registry Application Monitoring Configuration
Allocation Failures Allocation Failure - J2EE
BEA WebLogic App Server Application Server - J2EERequest Times and Rates - J2EEGarbage Collection Analysis - J2EE
DatasourcesSelected Datasource - History
Datasources - J2EE
DB Connection PoolsSelected DB Connection Pool - History
DB Connection Pools - NetWeaver
EJB Components Enterprise Java Bean Components - WebLogic
EJB Modules Enterprise Java Bean Modules - J2EE
EJBs - Selected Enterprise Application Enterprise Java Bean - WebLogic
Enterprise Java Beans Enterprise Java Bean Service - NetWeaverEnterprise Java Bean Modules - J2EE
456 ITCAM Agents for WebSphere Applications, J2EE, and HTTP Servers: User Guide

Table 83. Workspaces and the attribute groups they reference (continued)
Workspace Related Attribute Groups
Garbage Collection Analysis Garbage Collection Analysis - J2EE
Garbage Collections - Selected Allocation Failure Garbage Collection Cycle - J2EE
J2EE Agent J2EE Agent EventsApplication Server Status - J2EE
J2SE Application Application Server - J2EERequest Times and Rates - J2EEGarbage Collection Analysis - J2EE
JBoss App Server Application Server - J2EERequest Times and Rates - J2EEGarbage Collection Analysis - J2EE
JCA Connection Pools JCA Connection Pools - J2EEJ2EE Connector Connection Pools - WebLogic
JDBC Connection PoolsSelected JDBC Connection Pool - History
JDBC Connection Pools - WebLogic
JMS Session JMS Sessions - WebLogic
JMS Summary JMS Summary
JTA Resources JTA Resources - J2EEJava Transaction Service - WebLogic
JTA Summary JTA Summary - NetWeaver
JVM Statistics JDK - Operating SystemJDK - MemoryJDK - JVMJDK - Threading
Log AnalysisDC Message Events
Log Analysis - J2EEDC Messages - J2EE
Oracle App Server Application Server - J2EERequest Times and Rates - J2EEGarbage Collection Analysis - J2EE
Request AnalysisSelected Request - History
Request Analysis - J2EE
Selected Request - Baseline Baseline attributes
Selected Application - Application Tier AnalysisSelected Application - Backend Tier AnalysisSelected Application - Health HistorySelected Application - Client Tier Analysis
Application Health Status
Selected Application - Configuration Application Monitoring Configuration
Selected Request - Datasources Selected Request - J2EE
Selected Request - JMS Queues Selected Request - J2EE
SAP NetWeaver Server workspace Application Server - J2EERequest Times and Rates - J2EEGarbage Collection Analysis - J2EE
Selected Request - Resource Adapters Selected Request - J2EE
Servlets/JSPs - Selected Enterprise Application Servlets and JSPs - WebLogic
Servlets/JSPs - Selected Web Application Servlets JSPs - J2EE
Tomcat Server Application Server - J2EERequest Times and Rates - J2EEGarbage Collection Analysis - J2EE
Chapter 4. ITCAM Agent for J2EE 457

Table 83. Workspaces and the attribute groups they reference (continued)
Workspace Related Attribute Groups
Web Applications Web Applications - J2EEWeb Applications - WebLogic
Web Containers Web Container - NetWeaver
WebSphere App Server CE Application Server - J2EERequest Times and Rates - J2EEGarbage Collection Analysis - J2EE
Allocation Failure - J2EE attributesThe Allocation Failure - J2EE attribute group provides information about theheap-allocation failure that caused the Java Virtual Machine hosting the applicationserver to start its garbage-collection routine. Use the Allocation Failure attributes todetermine the events that caused the JVM to start garbage collection.
The attributes within this group are used to build the “Allocation Failuresworkspace” on page 424.
Allocation Failure Number The identifier assigned to the current allocation-failureblock, which is associated with a bar in the Heap Usage - History bar chart(supported IBM Developer Kit for Java). The valid format is a positive integer.
Bytes Needed The number of bytes needed on the heap when this allocationfailure occurred. The valid format is a positive integer.
GC Cycle Count The number of Garbage Collection cycles ran for this allocation.The valid format is a positive integer.
Heap Expanded The total number of kilobytes by which the heap expanded orcontracted as a result of garbage collection. The valid format is a positive integer.
Heap Free (%) after GC The percentage of heap that is free after allocation failure.The valid format is a positive integer.
Heap Status Indicates whether the out-of-heap-space alert has been raised. Validvalues are Normal, Out_of_heap_space, Heap_space_is_low, and Insufficient_space.
Interval (sec) The length of the interval in seconds. The valid format is a positiveinteger.
Kbytes Free at Start of GC The number of kilobytes that were available in theheap before garbage collection began in response to this allocation failure. Thevalid format is a positive integer.
Kbytes Freed by GC The number of kilobytes freed for this allocation failure. Thevalid format is a positive integer.
Kbytes Used The number of kilobytes in the heap that were in use when thisallocation failure occurred. The valid format is a positive integer.
Node Name The name of the system on which the server is running. The validformat is an alphanumeric string, with a maximum length of 256 characters.
458 ITCAM Agents for WebSphere Applications, J2EE, and HTTP Servers: User Guide

Objects Moved The total objects moved during compaction available. The validformat is a positive integer.
Origin Node The name of the server subnode. The valid format is analphanumeric string, with a maximum of 128 characters.
Process ID The process ID of the Java Virtual Machine (JVM). The valid format is apositive integer.
Sample Date and Time The date and time that the monitoring agent for WebLogicServer agent collected data. The valid format is a 12-character timestamp. For theSTR and SCAN functions, the format is MM/DD/YY HH:MM:SS; the followingtable shows the values contained in this character string:
Table 84. Format of the 12-character timestamp
Character String Meaning
MM Month
DD Day
YY Year
HH Hour
MM Minute
SS Second
Example: 09/13/06 18:32:03 indicates the data were collected on September 13 2006,at 18:32:03.
This attribute was designed for logging and reporting data-collection times ratherthan for creating situations. To specify a time and date for comparison and testing,use attributes from the Universal Time or Local Time groups.
Server Name The name of the application server. The valid format is analphanumeric string, with a maximum of 256 characters.
Time since Last Failure (ms) The time elapsed since the last allocation failure. Thevalid format is a positive integer.
Time to Complete (ms) The time (in milliseconds) taken to complete the actionthat resulted from this allocation failure. The valid format is a positive integer.
Total Kbytes Freed by GC The total number of kilobytes freed by the garbagecollector in response to this allocation failure. The valid format is a positive integer.
For additional information, see:v Organization of the predefined workspacesv Attribute groups used by the predefined workspaces
Application Health Status attributesThe Application Health Status attributes provide information for real-time andhistorical application health status.
The attributes within this group are used to build the Application Health Summaryworkspace.
Chapter 4. ITCAM Agent for J2EE 459

Application Health The combined application health level. Valid values areUnknown, Good, Fair, and Bad.
Application ID The unique identifier that is assigned automatically when theapplication is first configured and is preserved during the whole application lifecycle. The valid format is a positive integer.
Application Name The name of the application to which the request belongs. Thevalid format is an alphanumeric string, with a maximum of 256 characters.
Application Status The status of the monitored application (only supported forTomcat, and Oracle). Valid values are Standby, Discovered, Unknown, Starting,Running, Stopping, Stopped, and Failed.
Application Tier Health The health level of the application tier. Valid values areUnknown, Good, Fair, and Bad. Application tier health indicator is determinedfrom EJB or custom request delays collected on the interval and compared againstthresholds configured for application requests.
Backend Tier Health The health level of the backend tier. Backend tier healthindicator is determined from JDBC, JCA, JNDI, JMS delays collected on the intervaland compared against thresholds configured for application requests. Valid valuesare Unknown, Good, Fair, and Bad.
Client Tier Health The health level of the client tier. Valid values are Unknown,Good, Fair, and Bad. Client tier health indicator is determined from servlet/JSP orportal delays collected on the interval and compared against thresholds configuredfor application requests.
Completion Level The completion level of the requests during the interval. Validvalues are Unknown, Good, Fair, and Bad. This attribute is determined fromrequest data as the percentage of number of failed requests to the total number ofapplication requests on the interval.
Custom Requests The availability indicator of custom requests. Valid values areUnknown, Good, Fair, and Bad.
EJB Container The health level of the EJB container. Valid values are Unknown,Good, Fair, and Bad. This attribute is determined from EJB delay types collectedduring the interval and compared against application thresholds.
Interval (sec) The length (in seconds) of the sampling interval. The valid format isa positive integer.
JCA The overall health status of J2EE Connector Architecture (JCA) resources usedby applications. Valid values are Unknown, Good, Fair, and Bad. This attribute isdetermined from JCA delay types collected during the interval and comparedagainst application thresholds.
JDBC The overall health status of Java DataBase Connectivity (JDBC) resourcesused by applications. Valid values are Unknown, Good, Fair, and Bad. Thisattribute is determined from JDBC delay types collected during the interval andcompared against application thresholds.
JNDI The overall health status of Java Naming and Directory Interface (JNDI)resources used by applications. Valid values are Unknown, Good, Fair, and Bad.
460 ITCAM Agents for WebSphere Applications, J2EE, and HTTP Servers: User Guide

This attribute is determined from JNDI delay types collected during the intervaland compared against application thresholds.
JMS The overall health status of Java Message Service (JMS) resources used byapplications. Valid values are Unknown, Good, Fair, and Bad. This attribute isdetermined from JMS delay types collected during the interval and comparedagainst application thresholds.
Node Name The name of the system on which the server is running. The validformat is an alphanumeric string, with a maximum of 256 characters.
Origin Node The name of the server subnode. The valid format is analphanumeric string, with a maximum of 128 characters.
Portal Container The health level of the portal container. Valid values areUnknown, Good, Fair, and Bad. This attribute is determined from portal delaytypes collected during the interval and compared against application thresholds.
Response Level The health level of the response time for the requests. Valid valuesare Unknown, Good, Fair, and Bad. This attribute is determined from applicationrequests response times collected during the interval and compared againstapplication thresholds.
Sample Date and Time The date and time the Tivoli Enterprise Monitoring Agentcollected the data. The valid format is a 12-character timestamp. For the STR andSCAN functions, the format is MM/DD/YY HH:MM:SS; the following table showsthe values contained in this character string:
Table 85. Format of the 12-character timestamp
Character String Meaning
MM Month
DD Day
YY Year
HH Hour
MM Minute
SS Second
Example: 09/13/06 18:32:03 indicates the data was collected on September 13 2006,at 18:32:03.
This attribute was designed for logging and reporting data-collection times ratherthan for creating situations. To specify a time and date for comparison and testing,use attributes from the Universal Time or Local Time groups.
Server Name The name of the application server. The valid format is analphanumeric string, with a maximum of 256 characters.
Web Container The health level of the web container. Valid values are Unknown,Good, Fair, and Bad.
For additional information, see:v Organization of the predefined workspacesv Attribute groups used by the predefined workspaces
Chapter 4. ITCAM Agent for J2EE 461

Application Monitoring Configuration attributesThe Application Monitoring Configuration attributes provide information for theApplication Monitoring Configuration. Use these attributes to monitor differentJ2EE applications running within an application server.
The attributes within this group are used to build the Selected Application -Configuration workspace.
Application Alias The alias name that you can optionally assign for theapplication. In practice, this attribute enables you to combine multiple applicationsunder the same common alias and report their request in the Tivoli EnterprisePortal as it would come from same application. This attribute is blank by default.You can assign the value to it from Take Actions at any time in the applicationmonitoring life cycle. The valid format is an alphanumeric string, with a maximumof 256 characters.
App ID The unique identifier that is assigned automatically when the applicationis first configured and is preserved during the whole application life cycle. Thevalid format is a positive integer.
Application Name The name of the application to which the request belongs. Youcan define the pattern of this name in the Application Registry workspace. Thevalid format is an alphanumeric string, with a maximum of 256 characters.
Bad Completion Rate (%) The bad completion rate threshold for the requests. Thevalid format is an alphanumeric string, with a maximum of 256 characters.
Baselining Elapsed Time The number of seconds during which the applicationbaselining has been running. The valid format is a positive integer.
Baselining Status The status of the application baselining process. Valid values areIdle, Running, and Standby.
Baselining Scheduled Stop Time The date and time baselining is scheduled tofinish. The valid format is a 12-character timestamp. For the STR and SCANfunctions, the format is MM/DD/YY HH:MM:SS; the following table shows thevalues contained in this character string:
Table 86. Format of the 12-character timestamp
Character String Meaning
MM Month
DD Day
YY Year
HH Hour
MM Minute
SS Second
Baselining Start Time The date and time when the application baselining wasstarted. The valid format is a 12-character timestamp. For the STR and SCANfunctions, the format is MM/DD/YY HH:MM:SS; the following table shows thevalues contained in this character string:
462 ITCAM Agents for WebSphere Applications, J2EE, and HTTP Servers: User Guide

Table 87. Format of the 12-character timestamp
Character String Meaning
MM Month
DD Day
YY Year
HH Hour
MM Minute
SS Second
Baselining Update Interval The number of seconds that defines how often activebaselining data is incrementally updated to the monitoring agent. The valid formatis a positive integer.
Fair Completion Rate (%) The fair completion rate threshold for the requests. Thevalid format is an alphanumeric string, with a maximum of 256 characters.
Interval (sec) The length (in seconds) of the sampling interval. The valid format isa positive integer.
Monitoring Status The current application monitoring status. Valid values areDiscovered, Enabled, Disabled, and Standby.
Node Name The name of the system on which the server is running. The validformat is an alphanumeric string, with a maximum of 256 characters.
Origin Node The name of the server subnode. The valid format is analphanumeric string, with a maximum of 128 characters.
Request Data Monitoring Level The custom request aggregation level for allapplication requests. Valid values are Default, Disabled, Level1, and Level2. Thisattribute is set to Default when the application is first discovered.
Request Data Sampling Rate The custom request aggregation rate for allapplication requests. The valid format is a positive integer.
Sample Date and Time The date and time the Tivoli Enterprise ManagementAgent collected the data. The valid format is a 12-character timestamp. For the STRand SCAN functions, the format is MM/DD/YY HH:MM:SS; the following tableshows the values contained in this character string:
Table 88. Format of the 12-character timestamp
Character String Meaning
MM Month
DD Day
YY Year
HH Hour
MM Minute
SS Second
Chapter 4. ITCAM Agent for J2EE 463

Example: 09/13/06 18:32:03 indicates the data was collected on September 13 2006,at 18:32:03.
This attribute was designed for logging and reporting data-collection times ratherthan for creating situations. To specify a time and date for comparison and testing,use attributes from the Universal Time or Local Time groups.
Server Name The name of the application server. The valid format is analphanumeric string, with a maximum of 256 characters.
For additional information, see:v Organization of the predefined workspacesv Attribute groups used by the predefined workspaces
Application Server Status - J2EE attributesThe Application Server Status - J2EE attributes provide status information for allJ2EE application servers as well as the J2EE administrative server being monitoredby the OMEGAMON XE agent.
The attributes within this group are used to build the “J2EE Agent workspace” onpage 435.
Cluster Name The name of the server group (cluster) that the application serverbelongs to. The valid format is an alphanumeric string, with a maximum of 128characters. This is supported for WebLogic application server only.
J2EE Configuration Repository Directory Name The name of the J2EEconfiguration repository directory, which normally resides in the configsubdirectory of the product installation root directory. The valid format is analphanumeric string, with a maximum of 128 characters.
J2EE Node Name The name of the J2EE node group that the application serverbelongs to. The valid format is an alphanumeric string, with a maximum of 64characters.
Node Name The name of the system on which the server is running. The validformat is an alphanumeric string, with a maximum of 128 characters.
Origin Node The name of the server subnode. The valid format is analphanumeric string, with a maximum of 128 characters.
Process ID The process identifier of the Java virtual machine. The valid format is apositive integer.
Sample Date and Time The date and time that the OMEGAMON XE for J2EEApplication Server agent collected data. The valid format is a 12-charactertimestamp. For the STR and SCAN functions, the format is MM/DD/YYHH:MM:SS; the following table shows the values contained in this character string:
Table 89. Format of the 12-character timestamp
Character String Meaning
MM Month
DD Day
YY Year
464 ITCAM Agents for WebSphere Applications, J2EE, and HTTP Servers: User Guide

Table 89. Format of the 12-character timestamp (continued)
Character String Meaning
HH Hour
MM Minute
SS Second
Example: 09/13/06 18:32:03 indicates the data was collected on September 13 2006,at 18:32:03.
This attribute was designed for logging and reporting data-collection times ratherthan for creating situations. To specify a time and date for comparison and testing,use attributes from the Universal Time or Local Time groups.
Server Name The name of the application server. The valid format is analphanumeric string, with a maximum of 256 characters.
Start Date and Time The date and time when the J2EE application server started.The valid format is a timestamp. This attribute was designed for logging andreporting data-collection times rather than for creating situations. To specify a timeand date for comparison and testing, use attributes from the Universal Time orLocal Time groups.
Status The status of the J2EE Application Server. The valid values are Starting,Running, Stopping, Stopped, and Failed.
Server Type The type of J2EE server. The valid values are Unknown, AppServer,AdminServer.
For additional information, see:v Organization of the predefined workspacesv Attribute groups used by the predefined workspaces
Application Server - J2EE attributesThe Application Server - J2EE attributes gather status and summary data for aspecific J2EE application server. They provide performance data for the J2EEApplication Server runtime (JVM memory), HTTP sessions, and configurationparameters. They also provide some information from other attribute groups toprovide an overall view of the J2EE application server. Use the Application Serverattributes to monitor the health and performance of a J2EE application server.
The attributes within this group are used to build the J2EE application serversworkspaces.
CPU Used (ms) The number of milliseconds used during the interval. The validformat is a positive integer.
CPU Used (%) The percentage of the CPU used during the interval. The validformat is a decimal (formatted to one decimal place).
Garbage Collection Monitoring This attribute indicates whether GarbageCollection is being monitored. Valid values are Disabled and Enabled.
Chapter 4. ITCAM Agent for J2EE 465

Instrumentation Level The JVM instrumentation level. Valid values are None,Low, Medium, High, Basic, Extended, All, Custom and Maximum. This field isblank if no instrumentation level is set.
Interval (sec) The length of the interval in seconds. The valid format is a positiveinteger.
JVM Memory Free (bytes) The amount of JVM memory that is free (in bytes).Minimum instrumentation level required to collect these data: Low. The validformat is a positive integer.
JVM Memory Total (bytes) The total amount of JVM memory (in bytes). Minimuminstrumentation level required to collect these data: Low. The valid format is apositive integer.
JVM Memory Used (bytes) The amount of JVM memory that has been used (inbytes). Minimum instrumentation level required to collect these data: Low. Thevalid format is a positive integer.
Node Name The name of the system on which the server is running. The valueformat is an alphanumeric string, maximum 256 characters.
Origin Node The name of the server subnode. The valid format is analphanumeric string, maximum 128 characters.
Process CPU Utilization (ms) The process CPU utilization. The valid format is apositive integer.
Process ID The process identifier of the Java virtual machine. The valid format is apositive integer.
Resource Data Monitoring This attribute indicates whether resource data is beingmonitored. Valid values are Disabled and Enabled.
Request Data Monitoring Level The monitoring level for request data stored bythe data collector. Valid values are Disabled, Level1 (in other words, only edgerequest data-such as servlets and JSPs- are displayed), and Level2 (nested requestdata, such as JDBC and JMS requests, are also displayed).
Request Data Sampling Rate (%) The percentage of requests being sampled. Thevalid format is a positive integer.
Sample Date and Time The date and time that the monitoring agent for WebLogicServer agent collected data. The valid format is a 12-character timestamp. For theSTR and SCAN functions, the format is MM/DD/YY HH:MM:SS; the followingtable shows the values contained in this character string:
Table 90. Format of the 12-character timestamp
Character String Meaning
MM Month
DD Day
YY Year
HH Hour
MM Minute
466 ITCAM Agents for WebSphere Applications, J2EE, and HTTP Servers: User Guide

Table 90. Format of the 12-character timestamp (continued)
Character String Meaning
SS Second
Example: 09/13/06 18:32:03 indicates the data was collected on September 13 2006,at 18:32:03.
This attribute was designed for logging and reporting data-collection times ratherthan for creating situations. To specify a time and date for comparison and testing,use attributes from the Universal Time or Local Time groups.
Server Name The name of the application server. The valid format is analphanumeric string, maximum 256 characters.
Start Date and Time The date and time when the J2EE application server started.The valid format is a timestamp. This attribute was designed for logging andreporting data-collection times rather than for creating situations. To specify a timeand date for comparison and testing, use attributes from the Universal Time orLocal Time groups.
Status The status of the J2EE application server. The valid values are Starting,Running, Stopping, Stopped, and Failed.
System Paging Rate (Kbytes/sec) The system paging rate during the interval. Thevalid format is a positive integer.
Version The version of the J2EE Application Server. The valid format is analphanumeric string maximum 8 characters.
For additional information, see:v Organization of the predefined workspacesv Attribute groups used by the predefined workspaces
Baseline attributesThe Baseline attributes provide information for baseline extract data for the givenapplication. The baselining collects statistical information about an applicationrequests completion times and uses this information to assign fair and badthresholds on the application requests. The product divides the whole requestresponse times into buckets and collects individual hits into each bucket. Use theseattributes to get statistics from individual requests collected during the baselininginterval.
The attributes within this group are used to build the Selected Request - Baselineworkspace.
Application ID The unique identifier that is assigned automatically when theapplication is first configured and is preserved during the whole application lifecycle. The valid format is a positive integer.
Bad Hits (%) The percentage of bucket hits in the metric bad value zone. The validformat is a positive integer.
Bucket Number The bucket number of the baselining data. The valid format is apositive integer.
Chapter 4. ITCAM Agent for J2EE 467

EJB (%) The average percent of time that bucket requests were executed inside EJBcontainer. The valid format is a positive integer.
Fair Hits (%) The percentage of bucket hits in the metric fair value zone. The validformat is a positive integer.
Good Hits (%) The percentage of bucket hits in the metric good value zone. Thevalid format is a positive integer.
Hits (%) The percentage of hits for the bucket during the baselining. The validformat is a positive integer.
Interval (sec) The length (in seconds) of the sampling interval. The valid format isa positive integer.
JCA (%) The average percent of time that bucket requests spent for JCA access.The valid format is a positive integer.
JDBC (%) The average percent of time that bucket requests spent for JDBC access.The valid format is a positive integer.
JMS (%) The average percent of time that bucket requests spent for JMS access.The valid format is a positive integer.
JNDI (%) The average percent of time that bucket requests spent for JNDI access.The valid format is a positive integer.
Lower Boundary (msec) The lower boundary of bucket response times inmilliseconds. The valid format is a positive integer.
Metric ID The metric identifier of the baselining data. The valid format is apositive integer.
Metric Type The metric type of the baselining data. Valid formats are Request,Error, and Resource.
Node Name The name of the system on which the server is running. The validformat is an alphanumeric string, with a maximum of 256 characters.
Origin Node The name of the server subnode. The valid format is analphanumeric string, with a maximum of 128 characters.
Portal (%) The average percent of time that bucket requests were executed insideportal container. The valid format is a positive integer.
Response Time Mean (msec) The mean time of bucket response times. The validformat is a positive integer.
Sample Date and Time The date and time the Tivoli Enterprise ManagementAgent collected the data. The valid format is a 12-character timestamp. For the STRand SCAN functions, the format is MM/DD/YY HH:MM:SS; the following tableshows the values contained in this character string:
468 ITCAM Agents for WebSphere Applications, J2EE, and HTTP Servers: User Guide

Table 91. Format of the 12-character timestamp
Character String Meaning
MM Month
DD Day
YY Year
HH Hour
MM Minute
SS Second
Example: 09/13/06 18:32:03 indicates the data was collected on September 13 2006,at 18:32:03.
This attribute was designed for logging and reporting data-collection times ratherthan for creating situations. To specify a time and date for comparison and testing,use attributes from the Universal Time or Local Time groups.
Selection Hits (%) The percentage of bucket hits in the metric selection value zone.The valid format is a positive integer.
Server Name The name of the application server. The valid format is analphanumeric string, with a maximum of 256 characters.
Servlet JSP (%) The average percent of time that bucket requests were executedinside the servlet container. The valid format is a positive integer.
Total Hits The total hits number for the bucket during the baselining. The validformat is a positive integer.
Upper Boundary (msec) The upper boundary of bucket response times. The validformat is a positive integer.
For additional information, see:v Organization of the predefined workspacesv Attribute groups used by the predefined workspaces
Data sources - J2EE attributesThe Data sources - J2EE attributes provide database usage information. Forexample, these attributes provide traffic information such as response times fordatabase requests, the frequencies at which database connections are created anddestroyed, and how often databases are accessed.
The attributes within this group are used to build the Data sources workspace .
Important: The attributes within this attribute group contain meaningful valuesonly if your site has set the request data monitoring level to Level2 to collect dataon data source requests.
Application ID The unique identifier that is assigned automatically when theapplication is first configured and is preserved during the whole application lifecycle. The valid format is a positive integer.
Chapter 4. ITCAM Agent for J2EE 469

Average Processing Time (ms) The total average processing time (in milliseconds)that the data source is used by an application. The valid format is a decimal(formatted to three decimal places).
Average Query Processing Time (ms) The average time (in milliseconds) perrequest used by queries to the data source. The valid format is a decimal(formatted to three decimal places).
Average Update Processing Time (ms) The average time (in milliseconds) perrequest used by updates to the data source. The valid format is a decimal(formatted to three decimal places).
Connection Average Wait Time (ms) The average time (in milliseconds) thatapplications had to wait for a connection. The valid format is a decimal (formattedto three decimal places).
Connection Count The number of connections to the data source. The valid formatis a positive integer.
Connection Max Wait Time (ms) The maximum amount of time (in milliseconds)that applications had to wait for a connection to the data source. The valid formatis a positive integer.
Connection Rate (per sec) The number of connection requests (per second) createdfor the data source. The valid format is a decimal (formatted to three decimalplaces).
Connection Total Wait Time (ms) The total time (in milliseconds) that applicationshad to wait for a connection to the data source. The valid format is a positiveinteger.
Database Product The name of the database product. The valid format is analphanumeric string, with a maximum of 128 characters.
Database Product Version The version of the database product. The valid format isan alphanumeric string, with a maximum of 128 characters.
Datasource Label A shortened version of Data source Name, used to display thedata source name in the chart view. The valid format is an alphanumeric string,with a maximum of 12 characters.
Datasource Name The name of the data source. The valid format is analphanumeric string, with a maximum of 256 characters.
Interval (sec) The length (in seconds) of the interval. The valid format is a positiveinteger.
Node Name The name of the system on which the server is running. The validformat is an alphanumeric string, with a maximum of 256 characters.
Origin Node The name of the application server subnode. The valid format is analphanumeric string, with a maximum of 128 characters.
Process ID The unique identifier of the process running the Java Virtual Machine(JVM). The valid format is a positive integer.
470 ITCAM Agents for WebSphere Applications, J2EE, and HTTP Servers: User Guide

Query Count The number of queries performed against the data source. The validformat is a positive integer.
Query Rate (per sec) The number of queries (per second) being made to the datasource. The valid format is a decimal (formatted to three decimal places).
Sample Date and Time The date and time that the monitoring agent for WebLogicServer agent collected data. The valid format is a 12-character timestamp. For theSTR and SCAN functions, the format is MM/DD/YY HH:MM:SS; the followingtable shows the values contained in this character string:
Table 92. Format of the 12-character timestamp
Character String Meaning
MM Month
DD Day
YY Year
HH Hour
MM Minute
SS Second
Example: 09/13/06 18:32:03 indicates the data was collected on September 13 2006,at 18:32:03.
This attribute was designed for logging and reporting data-collection times ratherthan for creating situations. To specify a time and date for comparison and testing,use attributes from the Universal Time or Local Time groups.
Sampling Rate % The percentage of edge requests-such as servlets and JSPs-thatwere sampled for data source requests during the interval. The valid format is apositive integer.
Server Name The name of the J2EE application server. The valid format is analphanumeric string, with a maximum of 256 characters.
Total Query Processing Time (ms) The total time (in milliseconds) used to processqueries made to the data source. The valid format is a positive integer.
Total Update Processing Time (ms) The total time (in milliseconds) used to updatethe data source. The valid format is a positive integer.
Total Wait Time (ms) The time (in milliseconds) that applications had to wait forconnections to the data source. The valid format is a positive integer.
Update Count The number of updates performed against the data source. Thevalid format is a positive integer.
Update Rate (per sec) The number of updates (per second) made to the datasource. The valid format is a decimal (formatted to three decimal places).
For additional information, see:v Organization of the predefined workspacesv Attribute groups used by the predefined workspaces
Chapter 4. ITCAM Agent for J2EE 471

DB Connection Pools - NetWeaver attributesThe DB Connection Pools - NetWeaver attributes collect information about thedatabase connection pool for each defined data source.
The attributes within this group are used to build the “DB Connection Poolsworkspace” on page 428.
Current Size The current size of data source pool. The valid format is a positiveinteger.
Datasource Name The name of the data source. The valid format is analphanumeric sting, with a maximum of 256 characters.
Increment Step The increment step of data source pool. The valid format is apositive integer.
Init Size The initial size of data source pool. The valid format is a positive integer.
Interval (sec) The length of the interval in seconds. The valid format is a positiveinteger.
Max Size The maximum size of data source pool. The valid format is a positiveinteger.
Min Size The minimum size of data source pool. The valid format is a positiveinteger.
Node Name The name of the system on which the server is running. The validformat is an alphanumeric string, with a maximum of 256 characters.
Origin Node The name of the server subnode. The valid format is analphanumeric string, with a maximum of 128 characters.
Row Number The row number. The valid format is a positive integer.
Sample Date and Time The date and time that the monitoring agent for WebLogicServer agent collected data. The valid format is a 12-character timestamp. For theSTR and SCAN functions, the format is MM/DD/YY HH:MM:SS; the followingtable shows the values contained in this character string:
Table 93. Format of the 12-character timestamp
Character String Meaning
MM Month
DD Day
YY Year
HH Hour
MM Minute
SS Second
Example: 09/13/06 18:32:03 indicates the data were collected on September 13 2006,at 18:32:03.
472 ITCAM Agents for WebSphere Applications, J2EE, and HTTP Servers: User Guide

This attribute was designed for logging and reporting data-collection times ratherthan for creating situations. To specify a time and date for comparison and testing,use attributes from the Universal Time or Local Time groups.
Server Name The name of the J2EE application server. The valid format is analphanumeric string, with a maximum of 256 characters.
UsedConnectionsCount The number of used connections. The valid format is apositive integer.v Organization of the predefined workspacesv Attribute groups used by the predefined workspaces
DC Messages - J2EE attributesThe DC Messages - J2EE attribute group provides information about the datacollector Messages.
The attributes within this group are used to build both the “Log Analysisworkspace” on page 442 and the “DC Message Events workspace” on page 429.
Component The name of the component that caused the error. The valid format isan alphanumeric string, maximum 32 characters.
Event Date and Time The date and time that the event occurred. The valid formatis a 12-character timestamp. For the STR and SCAN functions, the format isMM/DD/YY HH:MM:SS; the following table shows the values contained in thischaracter string:
Table 94. Format of the 12-character timestamp
Character String Meaning
MM Month
DD Day
YY Year
HH Hour
MM Minute
SS Second
Example: 09/13/06 18:32:03 indicates the data was collected on September 13 2006,at 18:32:03.
This attribute was designed for logging and reporting data-collection times ratherthan for creating situations. To specify a time and date for comparison and testing,use attributes from the Universal Time or Local Time groups.
File Name The name of the file. The valid format is an alphanumeric string, with amaximum of 256 characters.
Message Description The description of the message. The valid format is analphanumeric string, with a maximum of 256 characters.
Message ID The ID of the message. The valid format is an alphanumeric string,with a maximum of eight characters.
Chapter 4. ITCAM Agent for J2EE 473

Method Name The name of the method. The valid format is an alphanumericstring, with a maximum of 256 characters.
Node Name The name of the system on which the server is running. The validformat is an alphanumeric string, with a maximum of 128 characters.
Origin Node The name of the server subnode. The valid format is analphanumeric string, with a maximum of 128 characters.
Severity The severity of the message. Valid values are Info, Warning, Error, andSevere.
Server Name The name of the J2EE application server. The valid format is analphanumeric string, with a maximum of 256 characters.
Sequence Number The sequence number in JMX notification stream. The validformat is a positive integer.
Thread ID The ID of the thread where the event occurred. The valid format is analphanumeric string, with a maximum of 16 characters.v Organization of the predefined workspacesv Attribute groups used by the predefined workspaces
Enterprise Java Bean Components - WebLogic attributesThe WebLogic EJB Components - WebLogic attributes provide the runtimeinformation for an EJB component.
The attributes within this group are used to build the “EJB Componentsworkspace” on page 430.
Current Entity EJBs The number of current entity EJBs. The valid format is apositive integer.
Current Message Driven EJBs The number of current message driven EJBs. Thevalid format is a positive integer.
Current Stateful EJBs The number of current stateful EJBs. The valid format is apositive integer.
Current Stateless EJBs The number of current stateless EJBs. The valid format is apositive integer.
Deployment State The current deployment state of the component. Valid valuesare Unprepared, Prepared, Activated, and New.
Enterprise Application Name The J2EE application name. The valid format is analphanumeric string, with a maximum of 128 characters.
EJB Component Name The EJB Component name. The valid format is analphanumeric string, with a maximum of 128 characters.
Interval (sec) The length of the interval in seconds. The valid format is a positiveinteger.
474 ITCAM Agents for WebSphere Applications, J2EE, and HTTP Servers: User Guide

Node Name The name of the system on which the server is running. The validformat is an alphanumeric string, with a maximum of 256 characters.
Origin Node The name of the server subnode. The valid format is analphanumeric string, with a maximum of 128 characters.
Row Number The row number. The valid format is a positive integer.
Sample Date and Time The date and time that the monitoring agent for WebLogicServer agent collected data. The valid format is a 12-character timestamp. For theSTR and SCAN functions, the format is MM/DD/YY HH:MM:SS; the followingtable shows the values contained in this character string:
Table 95. Format of the 12-character timestamp
Character String Meaning
MM Month
DD Day
YY Year
HH Hour
MM Minute
SS Second
Example: 09/13/06 18:32:03 indicates the data was collected on September 13 2006,at 18:32:03.
This attribute was designed for logging and reporting data-collection times ratherthan for creating situations. To specify a time and date for comparison and testing,use attributes from the Universal Time or Local Time groups.
Server Name The name of the J2EE application server. The valid format is analphanumeric string, with a maximum of 256 characters.v Organization of the predefined workspacesv Attribute groups used by the predefined workspaces
Enterprise Java Bean Modules - J2EE attributesThe Enterprise Java Bean Modules - J2EE attributes collect performanceinformation about each Enterprise Java Bean (EJB) deployed to the applicationserver.
The attributes within this group are used to build the “EJB Modules workspace”on page 432 and “Enterprise Java Beans workspace” on page 431.
Bean Name The name of the Enterprise Java Bean (EJB); this name prefixes theapplication name and the EJB JAR name. The valid format is an alphanumericstring, with a maximum of 128 characters.
Bean Type The type of bean. Valid values are Stateless, Stateful, Entity, andMessage_Driven.
Create Count The number of times that beans were created during the interval.Minimum instrumentation level required to collect these data: Low. The validformat is a positive integer.
Chapter 4. ITCAM Agent for J2EE 475

EJB Module The name of the EJB Module. The valid format is an alphanumericstring, with a maximum of 128 characters.
EJB Count The number of EJBs in the EJB module. The valid format is a positiveinteger.
Interval (sec) The length (in seconds) of the interval. The valid format is a positiveinteger.
Message Count The number of messages delivered to the bean on Messagemethod. The valid format is a positive integer.
Method Ready Count The number of bean instances in ready state. The validformat is a positive integer.
Method Ready Count High The high water mark of the number of bean instancesin ready state. The valid format is a positive integer.
Method Ready Count Low The low water mark of the number of bean instancesin ready state. The valid format is a positive integer.
Node Name The name of the system on which the server is running. The valueformat is an alphanumeric string, with a maximum of 256 characters.
Origin Node The name of the server subnode. The valid format is analphanumeric string, with a maximum of 128 characters.
Passive Count The number of beans that are in a passivated state (entity andstateful). Minimum instrumentation level required to collect these data: Low. Thevalid format is a positive integer.
Passive Count High The high water mark of the beans that are in a passivatedstate (entity and stateful). The valid format is a positive integer.
Passive Count Low The low water mark of the beans that are in a passivated state.The valid format is a positive integer.
Pooled Count The average number of objects in the pool. The valid format is apositive integer.
Pooled Count High The high water mark of the average number of objects in thepool. The valid format is a positive integer.
Pooled Count Low The low water mark of the average number of objects in thepool. The valid format is a positive integer.
Ready Count The number of bean instances in ready state. The valid format is apositive integer.
Ready Count High The high water mark of bean instances in ready state. Thevalid format is a positive integer.
Ready Count Low The low water mark of bean instances in ready state. The validformat is a positive integer.
476 ITCAM Agents for WebSphere Applications, J2EE, and HTTP Servers: User Guide

Remove Count The number of times that beans were removed. Minimuminstrumentation level required to collect these data: Low. The valid format is apositive integer.
Row Number The row number. The valid format is a positive integer.
Sample Date and Time The date and time that the monitoring agent for WebLogicServer agent collected data. The valid format is a 12-character timestamp. For theSTR and SCAN functions, the format is MM/DD/YY HH:MM:SS; the followingtable shows the values contained in this character string:
Table 96. Format of the 12-character timestamp
Character String Meaning
MM Month
DD Day
YY Year
HH Hour
MM Minute
SS Second
Example: 09/13/06 18:32:03 indicates the data was collected on September 13 2006,at 18:32:03.
This attribute was designed for logging and reporting data-collection times ratherthan for creating situations. To specify a time and date for comparison and testing,use attributes from the Universal Time or Local Time groups.
Server Name The name of the application server. The valid format is analphanumeric string, with a maximum of 256 characters.
Summary of All EJB Modules The summary of statistical totals for all EJBmodules. Valid values are EJB, No, and Yes.
For additional information, see:v Organization of the predefined workspacesv Attribute groups used by the predefined workspaces
Enterprise Java Bean Service - NetWeaver attributesThe Enterprise Java Bean Service - NetWeaver attributes collect performanceinformation about each Enterprise Java Bean deployed to SAP NetWeaverapplication server.
The attributes within this group are used to build the “Enterprise Java Beansworkspace” on page 431 in SAP NetWeaver Server.
Activations Number The number of activations. The valid format is a positiveinteger.
Active Sessions Count The count of not passivated sessions. The valid format is apositive integer.
Chapter 4. ITCAM Agent for J2EE 477

Active Sessions Timeout The timeout for the active sessions. If a session stays idleand not passivated for this long, it is removed. The valid format is a positiveinteger.
Application Name The name of application using EJB. The valid format is analphanumeric string, with a maximum of 128 characters.
Bean Name The bean class name. The valid format is an alphanumeric string, witha maximum of 128 characters.
Bean Type The type of Bean. Valid formats are Stateless, Stateful, Entity,Message_Driven, and [Summary].
Create Count The count of times of a "create" method was invoked on the bean.The valid format is a positive integer.
Current Pool Size The current size of pool. The valid format is a positive integer.
Completed Sessions The count of already completed sessions. The valid format isa positive integer.
EJB Count The number of EJB in the EJB module. The valid format is a positiveinteger.
EJB Module The name of the EJB Module. The valid format is an alphanumericsting, with a maximum of 128 characters.
Initial Pool Size The initial size of pool. The valid format is a positive integer.
Interval Time The length of the interval in seconds. The valid format is a positiveinteger.
Loads Number The number of loads. The valid format is a positive integer.
Max Pool Size The maximum size of pool. The valid format is a positive integer.
Node Name The name of the system on which the server is running. The validformat is an alphanumeric string, with a maximum of 256 characters.
Origin Node The name of the server subnode. The valid format is analphanumeric string, with a maximum of 128 characters.
Passive Sessions Count The count of passivated sessions. The valid format is apositive integer.
Passive Sessions Timeout The timeout for the passive sessions. If a session staysidle and passivated for this long, it is removed. The valid format is a positiveinteger.
Passivations Number The number of passivations. The valid format is a positiveinteger.
PoolCurrUsed0bj The number of currently used pool objects. The valid format is apositive integer.
478 ITCAM Agents for WebSphere Applications, J2EE, and HTTP Servers: User Guide

Pool Increment Size The size of pool increment. The valid format is a positiveinteger.
Remove Count The count of times of a "remove" method was invoked on thebean. The valid format is a positive integer.
Row Number The row number. The valid format is a positive integer.
Sample Date and Time The date and time that the monitoring agent for WebLogicServer agent collected data. The valid format is a 12-character timestamp. For theSTR and SCAN functions, the format is MM/DD/YY HH:MM:SS; the followingtable shows the values contained in this character string:
Table 97. Format of the 12-character timestamp
Character String Meaning
MM Month
DD Day
YY Year
HH Hour
MM Minute
SS Second
Example: 09/13/06 18:32:03 indicates the data was collected on September 13 2006,at 18:32:03.
This attribute was designed for logging and reporting data-collection times ratherthan for creating situations. To specify a time and date for comparison and testing,use attributes from the Universal Time or Local Time groups.
Server Name The name of the J2EE application server. The valid format is analphanumeric string, with a maximum of 256 characters.
Stores Number The number of the stores. The valid format is a positive integer.
Summary of All EJB Modules The summary row of statistical totals for all EJBmodules. Valid values are EJB and Yes.v Organization of the predefined workspacesv Attribute groups used by the predefined workspaces
Enterprise Java Beans - WebLogic attributesThe Enterprise Java Beans - WebLogic attributes collect performance informationabout each Enterprise Java Bean deployed to the WebLogic application server.
The attributes within this group are used to build the “EJBs - Selected EnterpriseApplication workspace” on page 433.
Activation Rate The number of beans from this EJB Home that have been activatedper second for the interval since the previous sample. The valid format is adecimal (formatted to three decimal places).
Beans Destroyed Percent The percent of the number of beans destroyed from thenumber of requests for a bean for the interval since the previous sample. The validformat is a decimal (formatted to one decimal place).
Chapter 4. ITCAM Agent for J2EE 479

Cache Accesses The number of attempts to access a bean from the cache for theinterval since the previous sample. The valid format is a positive integer.
Cache Access Rate The number of attempts per second to access a bean from thecache for the interval since the previous sample. The valid format is a decimal(formatted to three decimal places).
Cache Miss Percent The percent of the number of times a container cannot find abean in the cache to the number of times it attempts to find a bean in the cache forthe interval since the previous sample. The valid format is a decimal (formatted toone decimal place).
Current Cached Beans The total number of beans from this EJB Home currently inthe EJB cache. The valid format is a positive integer.
Current Lock Entries The current number of beans currently locked. The validformat is a positive integer.
Current Lock Waiters The current number of threads that wait for a lock on abean. The valid format is a positive integer.
Current Pool Beans The summary number of free and in-use beans in the pool.The valid format is a positive integer.
Current Pool Free Percent The percent of the free beans available in the pool. Thevalid format is a decimal (formatted to one decimal place).
Current Pool Waiters The number of threads currently waiting for an availablebean instance from the free pool. The valid format is a positive integer.
Enterprise Application Name The J2EE application name. The valid format is analphanumeric string, with a maximum of 128 characters.
EJB Component Name The EJB Component name. The valid format is analphanumeric string, with a maximum of 128 characters.
EJB Name The EJB-name for this EJB. It is as defined in the ejb-jar.xml deploymentdescriptor. The valid format is an alphanumeric string, with a maximum of 128characters.
EJB Type The type of EJB. Valid values are Stateless, Stateful, Entity and MessageDriven.
Interval (sec) The length of the interval in seconds. The valid format is a positiveinteger.
Lock Manager Accesses The number of attempts to obtain a lock on a bean sincethe previous sample. The valid format is a positive integer.
Lock Manager Access Rate The number of attempts to obtain a lock on a bean persecond for the interval since the previous sample. The valid format is a decimal(formatted to three decimal places).
Lock Timeout Percent The percent of timeouts to accesses for the lock manager forthe interval since the previous sample. The valid format is a decimal (formatted toone decimal place).
480 ITCAM Agents for WebSphere Applications, J2EE, and HTTP Servers: User Guide

Lock Waits Percent The percent of times a thread had to wait to obtain a lock on abean comparing to the total amount of lock requests issued for the interval sincethe previous sample. The valid format is a decimal (formatted to one decimalplace).
Node Name The name of the system on which the server is running. The validformat is an alphanumeric string, with a maximum of 256 characters.
Origin Node The name of the server subnode. The valid format is analphanumeric string, with a maximum of 128 characters.
Passivation Rate The number of beans from this EJB Home that have beenpassivated per second for the interval since the previous sample. The valid formatis a decimal (formatted to three decimal places).
Pool Accesses The number of times an attempt was made to get an instance fromthe free pool since the previous sample. The valid format is a positive integer.
Pool Access Rate The number of times per second an attempt was made to get aninstance from the free pool for the interval since the previous sample. The validformat is a decimal (formatted to three decimal places).
Pool Miss Percent The percent of times a request was made to get a bean from thepool when no beans were available. The valid format is a decimal (formatted toone decimal place).
Pool Timeout Percent The percent of requests that have timed out waiting for abean from the pool from the total number of requests made for the interval sincethe previous sample. The valid format is a decimal (formatted to one decimalplace).
Row Number The row number. The valid format is a positive integer.
Sample Date and Time The date and time that the monitoring agent for WebLogicServer agent collected data. The valid format is a 12-character timestamp. For theSTR and SCAN functions, the format is MM/DD/YY HH:MM:SS; the followingtable shows the values contained in this character string:
Table 98. Format of the 12-character timestamp
Character String Meaning
MM Month
DD Day
YY Year
HH Hour
MM Minute
SS Second
Example: 09/13/06 18:32:03 indicates the data was collected on September 13 2006,at 18:32:03.
This attribute was designed for logging and reporting data-collection times ratherthan for creating situations. To specify a time and date for comparison and testing,use attributes from the Universal Time or Local Time groups.
Chapter 4. ITCAM Agent for J2EE 481

Server Name The name of the J2EE application server. The valid format is analphanumeric string, with a maximum of 256 characters.
Transactions Processed The number of transactions processes. The valid format isa positive integer.
Transaction Process Rate The number of transactions processed per second for theinterval since the previous sample. The valid format is a decimal (formatted tothree decimal places).
Transaction Rolled Back Percent The percent transactions that have rolled back tothe number of total transactions involving the EJB for the interval since theprevious sample. The valid format is a decimal (formatted to one decimal place).
Transactions Timed Out Percent The percent of transactions that have timed out tothe number of total transactions involving the EJB for the interval since theprevious sample. The valid format is a decimal (formatted to one decimal place).v Organization of the predefined workspacesv Attribute groups used by the predefined workspaces
Garbage Collection Analysis - J2EE attributesThe Garbage Collection Analysis - J2EE attribute group provides informationfrom the profiler about the garbage collector in the Java Virtual Machines that arehosting an application server. For example, these attributes report the number oftimes the collector ran during the interval and the resulting number of objects thatthe collector freed. Use the Garbage Collection Analysis attributes in situations tomonitor garbage-collection performance and possible problems.
The attributes within this group are used to build the “Garbage Collection Analysisworkspace” on page 433 and the J2EE application servers workspaces.
GC Rate (per min) The rate (per minute) at which the Java Virtual Machine isinvoking its garbage-collection routine. The valid format is a decimal (formatted tothree decimal places).
Heap Used (%) The percentage of heap used at the end of interval. The validformat is a decimal (formatted to one decimal places).
Interval (sec) The length (in seconds) of the interval. The valid format is a positiveinteger.
Kbytes Free The total number of free kilobytes in the heap at the end of the lastgarbage-collection cycle during the interval. The valid format is a positive integer.
Kbytes Used The number of kilobytes in the heap that were in use at the end ofthe last garbage collection cycle during the interval. The valid format is a positiveinteger.
Kbytes Used Delta The delta value between the "Kbytes in Use" value for thisinterval and the "Kbytes in Use" value for the prior interval. A positive valueindicates that the number of kbytes in use grew during the interval. The validformat is a positive or negative integer.
Kbytes Total Freed by GC The total number of kbytes freed by the garbagecollector during the interval. The valid format is a positive integer.
482 ITCAM Agents for WebSphere Applications, J2EE, and HTTP Servers: User Guide

Node Name The name of the system on which the server is running. The validformat is an alphanumeric string, with a maximum of 256 characters.
Objects Freed The number of objects the garbage collector freed during theinterval (supported for IBM Developer Kit for Java). The valid format is a positiveinteger.
Objects Moved The number of objects the garbage collector moved during theinterval (supported for IBM Developer Kit for Java). The valid format is a positiveinteger.
Origin Node The name of the server subnode. The valid format is analphanumeric string, with a maximum of 128 characters.
Process ID The process ID of the JVM. The valid format is a positive integer.
Real Time (ms) The total real time (in milliseconds) that the garbage collectorrequired during the most recent cycle. The valid format is a positive integer.
Real Time % The percentage of real time that the garbage collector was activeduring the interval. The valid format is a decimal (formatted to one decimal place).
Sample Date and Time The date and time that the monitoring agent for WebLogicServer agent collected data. The valid format is a 12-character timestamp. For theSTR and SCAN functions, the format is MM/DD/YY HH:MM:SS; the followingtable shows the values contained in this character string:
Table 99. Format of the 12-character timestamp
Character String Meaning
MM Month
DD Day
YY Year
HH Hour
MM Minute
SS Second
Example: 09/13/06 18:32:03 indicates the data was collected on September 13 2006,at 18:32:03.
This attribute was designed for logging and reporting data-collection times ratherthan for creating situations. To specify a time and date for comparison and testing,use attributes from the Universal Time or Local Time groups.
Server Name The name of the J2EE application server. The valid format is analphanumeric string, with a maximum of 256 characters.
Times Run The number of times the garbage collector ran during the interval. Thevalid format is a positive integer.v Organization of the predefined workspacesv Attribute groups used by the predefined workspaces
Chapter 4. ITCAM Agent for J2EE 483

Garbage Collection Cycle - J2EE attributesThe Garbage Collection Cycle - J2EE attribute group provides information about asingle garbage-collection cycle that the Java Virtual Machine hosting theapplication server performed. For example, these attributes report the free heapspace before and after garbage collection, the heap space freed, and the number ofobjects moved during garbage collection. Use the Garbage Collection Cycleattributes in situations to examine the results of a particular garbage collection.
The attributes within this group are used to build the Garbage Collections -Selected Allocation Failure workspace .
Allocation Failure Number The allocation failure block number for which thiscycle ran (supported for IBM Developer Kit for Java). The valid format is a positiveinteger.
Compact (ms) The time (in milliseconds) required for the compaction phase of thegarbage-collection cycle. The valid format is a positive integer.
Compaction Reason The code describing the reason garbage collection wasinitiated. The valid format is a positive integer.
The compaction codes are shown in the following table:
Table 100. Reasons for initiating garbage collection
Compaction Code Definition
1Insufficient free space for the allocation request followingthe mark and sweep phases.
2 The heap is fragmented and benefits from a compaction.
3 Less than 15% free space available.
4 A call to System.gc requested garbage collection.
5 Less than 5% free space available.
6 Less than 128 K free space available.
7 Parameter Xcompactgc specified.
8 The transient heap has less than 5% free space available.
9The heap is fragmented (this code marks additionalreasons for compaction apart from compaction code 2).
Final sees The Final references that are collected. The valid format is a positiveinteger.
Garbage Collection Number The garbage collection cycle number. The validformat is a positive integer.
GC Date and Time The date and time the Java Virtual Machine invoked thegarbage collector. The valid format is a 16-character timestamp. This attribute wasdesigned for logging and reporting data-collection times rather than for creatingsituations. To specify a time and date for comparison and testing, use attributesfrom the Universal Time or Local Time groups.
Note to Solaris and HP-UX users: Because allocation-failure information is notrecorded on these platforms, this column is always empty on these platforms.
484 ITCAM Agents for WebSphere Applications, J2EE, and HTTP Servers: User Guide

Heap Capacity The total number of kilobytes allocated to the main heap after thisgarbage-collection cycle. The valid format is a positive integer.
Heap Free % after GC The percentage of heap space that is available after thisgarbage-collection cycle. The valid format is a decimal (formatted to one decimalplace).
Heap Space Free (kbytes) The number of kilobytes available within the heap afterthis garbage-collection cycle. The valid format is a positive integer.
Interval (sec) The length (in seconds) of the sampling interval. The valid format isa positive integer.
Kbytes Free at Start of GC The number of kilobytes available in the heap beforegarbage collection began. The valid format is a positive integer.
Kbytes Freed The number of kilobytes freed by the garbage collector. The validformat is a positive integer.
Kbytes Moved The number of kilobytes moved on the heap during thiscompaction. The valid format is a positive integer.
Kbytes Used The number of kilobytes in the heap that were in use after thisgarbage-collection cycle. The valid format is a positive integer.
Mark (ms) The time (in milliseconds) required for the mark phase of thegarbage-collection cycle. The valid format is a positive integer.
Node Name The name of the system on which the server is running. The validformat is an alphanumeric string, with a maximum of 256 characters.
Objects Moved The number of objects the garbage collector moved during thiscompaction. The valid format is a positive integer.
Origin Node The name of the server subnode. The valid format is analphanumeric string, with a maximum of 128 characters.
Phantom sees The number of phantom reference objects collected during thisgarbage-collection cycle. "Phantom" refers to a specific Java class that defines objectreachability. The valid format is a positive integer.
Process ID The unique identifier of the JVM process (the class ID of the JVM). Thevalid format is a positive integer.
Sample Date and Time The date and time that the monitoring agent for WebLogicServer agent collected data. The valid format is a 12-character timestamp. For theSTR and SCAN functions, the format is MM/DD/YY HH:MM:SS; the followingtable shows the values contained in this character string:
Table 101. Format of the 12-character timestamp
Character String Meaning
MM Month
DD Day
YY Year
Chapter 4. ITCAM Agent for J2EE 485

Table 101. Format of the 12-character timestamp (continued)
Character String Meaning
HH Hour
MM Minute
SS Second
Example: 09/13/06 18:32:03 indicates the data was collected on September 13 2006,at 18:32:03.
This attribute was designed for logging and reporting data-collection times ratherthan for creating situations. To specify a time and date for comparison and testing,use attributes from the Universal Time or Local Time groups.
Server Name The name of the J2EE application server. The valid format is analphanumeric string, with a maximum of 256 characters.
Soft sees The number of soft reference objects collected during thisgarbage-collection cycle. "Soft" refers to a specific Java class that defines objectreachability. The valid format is a positive integer.
Sweep (ms) The time (in milliseconds) required for the sweep phase of thegarbage-collection cycle. The valid format is a positive integer.
Time to Complete (ms) The time (in milliseconds) required to complete thisgarbage-collection cycle. The valid format is a positive integer.
Weak sees The number of weak reference objects collected during thisgarbage-collection cycle. "Weak" refers to a specific Java class that defines objectreachability. The valid format is a positive integer.
For additional information, see:v Organization of the predefined workspacesv Attribute groups used by the predefined workspaces
J2EE Agent Events attributesThe J2EE Agent Events attributes collect information about agent-level events thataffect the ability of the OMEGAMON XE agent to collect data about J2EEApplication Server. These attributes provide error messages, their IDs, and theirseverities.
The attributes within this group are used to build the “J2EE Agent workspace” onpage 435.
Event Date and Time The date and time that the event occurred. The valid formatis a 12-character timestamp. For the STR and SCAN functions, the format isMM/DD/YY HH:MM:SS; the following table shows the values contained in thischaracter string:
Table 102. Format of the 12-character timestamp
Character String Meaning
MM Month
DD Day
486 ITCAM Agents for WebSphere Applications, J2EE, and HTTP Servers: User Guide

Table 102. Format of the 12-character timestamp (continued)
Character String Meaning
YY Year
HH Hour
MM Minute
SS Second
Example: 09/13/06 18:32:03 indicates the data was collected on September 13 2006,at 18:32:03.
This attribute was designed for logging and reporting data-collection times ratherthan for creating situations. To specify a time and date for comparison and testing,use attributes from the Universal Time or Local Time groups.
File Name The name of the file. The valid format is an alphanumeric string, with amaximum of 64 characters.
Function Indicates the description of the message. The valid format is analphanumeric sting, with a maximum of 32 characters.
Message Description The message description. The valid format is analphanumeric string, with a maximum of 256 characters.
Message ID The message ID. The valid format is an alphanumeric string, with amaximum of eight characters.
Node Name The system on which the server is running. The valid format is analphanumeric string, with a maximum of 128 characters.
Origin Node The name of the server subnode. The valid format is analphanumeric string, with a maximum of 128 characters.
Severity The severity of the message. Valid values are Info, Warning, Error, andSevere.
For additional information, see:v Organization of the predefined workspacesv Attribute groups used by the predefined workspaces
J2EE Connector Connection Pools - WebLogic attributesThe J2EE Connector Connection Pools - WebLogic attributes provide data andstatistics for the Oracle/BEA WebLogic Connector Connection Pools.
The attributes within this group are used to build the “JCA Connection Poolsworkspace” on page 437.
Connection Creation Rate The number of Connector connections created in thisConnection Pool per second for the interval since the previous sample. The validformat is a decimal (formatted to three decimal places).
Connection Destroy Rate The number of Connector connections destroyed in thisConnector Pool per second for the interval since the previous sample. The validformat is a decimal (formatted to three decimal places).
Chapter 4. ITCAM Agent for J2EE 487

Connections Matched The number of times a request for a Connector connectionwas satisfied via the use of an existing created connection since the previoussample. The valid format is a positive integer.
Connection Match Rate The number of times a request for a Connector connectionwas satisfied per second via the use of an existing created connection since theprevious sample. The valid format is a decimal (formatted to three decimal places).
Connections Recycled The number of Connector connections that have beenrecycled in this Connector Pool since the previous sample. The valid format is apositive integer.
Connection Recycled Rate The number of Connector connections that have beenrecycled in this Connector Pool per second for the interval since the previoussample. The valid format is a decimal (formatted to three decimal places).
Connection Rejected The number of rejected requests for a Connector connectionsince the previous sample. The valid format is a positive integer.
Connection Rejection Rate The number of rejected requests for a Connectorconnection per second since the previous sample. The valid format is a decimal(formatted to three decimal places).
Cumulative Average Active Connections Usage The running average usage ofcreated connections that are active in the Connector Pool since the pool was lastshrunk. The valid format is a positive integer.
Current Active Connections The current number of active connections. The validformat is a positive integer.
Current Free Connections The current number of free connections. The validformat is a positive integer.
Interval (ms) The length of the interval in seconds. The valid format is a positiveinteger.
JNDI Name The configured JNDI Name for the Connection Factory using thisConnector connection pool. The valid format is an alphanumeric string, with amaximum of 128 characters.
Highest Active Connections The high water mark of active connections in thisConnector Pool since the pool was instantiated. The valid format is a positiveinteger.
Highest Free Connections The high water mark of free connections in thisConnector Pool since the pool was instantiated. The valid format is a positiveinteger.
Idle Connections Detected The number of idle connections detected for theinterval since the previous sample. The valid format is a positive integer.
Leaked Connections Detected The number of leaked connections detected for theinterval since the previous sample. The valid format is a positive integer.
Node Name The name of the system on which the server is running. The validformat is an alphanumeric string, with a maximum of 256 characters.
488 ITCAM Agents for WebSphere Applications, J2EE, and HTTP Servers: User Guide

Maximum Capacity The maximum capacity configured for this Connectorconnection pool. The valid format is a positive integer.
Origin Node The name of the server subnode. The valid format is analphanumeric string, with a maximum of 128 characters.
Row Number The row number. The valid format is a positive integer.
Sample Date and Time The date and time the Tivoli Enterprise ManagementAgent for WebLogic Server agent collected the data. The valid format is a12-character timestamp. For the STR and SCAN functions, the format isMM/DD/YY HH:MM:SS; the following table shows the values contained in thischaracter string:
Table 103. Format of the 12-character timestamp
Character String Meaning
MM Month
DD Day
YY Year
HH Hour
MM Minute
SS Second
Example: 09/13/06 18:32:03 indicates the data was collected on September 13 2006,at 18:32:03.
This attribute was designed for logging and reporting data-collection times ratherthan for creating situations. To specify a time and date for comparison and testing,use attributes from the Universal Time or Local Time groups.
Server Name The name of the J2EE application server. The valid format is analphanumeric string, with a maximum of 256 characters.v Organization of the predefined workspacesv Attribute groups used by the predefined workspaces
JCA Connection Pools - J2EE attributesThe JCA Connection Pools - J2EE attribute group collects information about theJCA connection pools for each connection factory.
The attributes within this group are used to build the JCA Connection Poolsworkspace .
Average Usage Time (ms) The average time in milliseconds that a connection wasin use. The valid format is a decimal (formatted to three decimal places).
Average Pool Size The average number of Managed Connections for the interval.Minimum instrumentation level required to collect these data: High. The validformat is a decimal (formatted to three decimal places).
Average Wait Time (ms) The average time in milliseconds that a client waited tobe granted a connection. The valid format is a decimal (formatted to three decimalplaces).
Chapter 4. ITCAM Agent for J2EE 489

Connections Closed The number of connections released. The valid format is apositive integer.
Connections Created The total number of Managed Connections created duringthe sampling interval. Minimum instrumentation level required to collect thesedata: Low. The valid format is a positive integer.
Connection Factory The name of Connection Factory. The valid format is analphanumeric string, with a maximum of 256 characters.
Interval (sec) The length (in seconds) of the sampling interval. The valid format isa positive integer.
JCA Pool Label The short name of the JCA Pool. The valid format is analphanumeric string, with a maximum of 32 characters.
JCA Pool Usage % The percentage of the pool that was used during the samplinginterval. The valid format is a decimal (formatted to three decimal places).
Maximum Pool Size The maximum number of managed connections that can becreated in this connection pool (the field is blank for each individual managedconnection). The valid format is a positive integer.
Node Name The name of the system on which the server is running. The validformat is an alphanumeric string, with a maximum of 256 characters.
Origin Node The name of the server subnode. The valid format is analphanumeric string, with a maximum of 128 characters.
Sample Date and Time The date and time that the monitoring agent for WebLogicServer agent collected data. The valid format is a 12-character timestamp. For theSTR and SCAN functions, the format is MM/DD/YY HH:MM:SS; the followingtable shows the values contained in this character string:
Table 104. Format of the 12-character timestamp
Character String Meaning
MM Month
DD Day
YY Year
HH Hour
MM Minute
SS Second
Example: 09/13/06 18:32:03 indicates the data was collected on September 13 2006,at 18:32:03.
This attribute was designed for logging and reporting data-collection times ratherthan for creating situations. To specify a time and date for comparison and testing,use attributes from the Universal Time or Local Time groups.
Server Name The name of the J2EE application server. The valid format is analphanumeric string, with a maximum of 256 characters.
490 ITCAM Agents for WebSphere Applications, J2EE, and HTTP Servers: User Guide

Total Usage (ms) The total time used. The valid format is a decimal (formatted tothree decimal places).
Total Wait (ms) The total time wait. The valid format is a decimal (formatted tothree decimal places).
Waiting Threads The number of threads waiting for a connection. The valid formatis a positive integer.
For additional information, see:v Organization of the predefined workspacesv Attribute groups used by the predefined workspaces
JDBC Connection Pools - WebLogic attributesThe JDBC Connection Pools - WebLogic attributes provide data and statistics forJDBC connection pools.
The attributes within this group are used to build the “JDBC Connection Poolsworkspace” on page 438.
Average Connection Delay The averaged time necessary to get a connection fromthe database for the interval since the previous sample. The valid format is adecimal (formatted to three decimal places).
Connections Created The number of JDBC connections created during the interval.The valid format is a positive integer.
Connection Creation Rate The number of JDBC connections per second for theinterval since the previous sample. The valid format is a decimal (formatted tothree decimal places).
Cumulative Average Active Connections The running average of activeconnections in this pool. The valid format is a positive integer.
Current Active Connections The current number of active connections in this pool.The valid format is a positive integer.
Current Available Connections The current number of connections that areavailable to applications. The valid format is a positive integer.
Current Capacity The current number of database connections in this pool. Thevalid format is a positive integer.
Current Unavailable Connections The current number of connections in this poolthat are being tested or refreshed and not available to the applications. The validformat is a positive integer.
Current Waiters The current number of waiters for a connection. The valid formatis a positive integer.
Leaked Connections Detected The number of leaked connections for the intervalsince the previous sample. The valid format is a positive integer.
Node Name The name of the system on which the server is running. The validformat is an alphanumeric string, with a maximum of 256 characters.
Chapter 4. ITCAM Agent for J2EE 491

Highest Active Connections The high water mark of active connections in thispool. The valid format is a positive integer.
Highest Available Connections The highest number of connections that wereavailable to applications. The valid format is a positive integer.
Highest Unavailable Connections The highest number of connections in this poolthat are being tested or refreshed and not available to the applications. The validformat is a positive integer.
Highest Waiters The highest number of waiters for a connection. The valid formatis a positive integer.
Highest Wait Time (sec) The number of seconds the longest waiter for aconnection waited. The valid format is a positive integer.
Interval (sec) The length of the interval in seconds. The valid format is a positiveinteger.
JDBC Pool Name The JDBC connection pool name. The valid format is analphanumeric string, with a maximum of 128 characters.
Maximum Capacity The maximum capacity of this connection pool. The validformat is a positive integer.
Origin Node The name of the server subnode. The valid format is analphanumeric string, with a maximum of 128 characters.
Pool State The current state of the connection pool. Valid values are Running,Suspended, Unhealthy, and Unknown.
Prepared Statement Cache Access The number of prepared statement cacheaccesses. The valid format is a positive integer.
Prepared Statement Cache Misses Percent The percent of the number of times aprepared statement was not found in the cache to the total number of requests fora prepared statement for the interval since the previous sample. The valid formatis a decimal (formatted to one decimal place).
Reconnect Failures The number of cases when a connection pool attempted torefresh a connection to a database and failed. The valid format is a positive integer.
Row Number The row number. The valid format is a positive integer.
Sample Date and Time The date and time that the monitoring agent for WebLogicServer agent collected data. The valid format is a 12-character timestamp. For theSTR and SCAN functions, the format is MM/DD/YY HH:MM:SS; the followingtable shows the values contained in this character string:
Table 105. Format of the 12-character timestamp
Character String Meaning
MM Month
DD Day
YY Year
492 ITCAM Agents for WebSphere Applications, J2EE, and HTTP Servers: User Guide

Table 105. Format of the 12-character timestamp (continued)
Character String Meaning
HH Hour
MM Minute
SS Second
Example: 09/13/06 18:32:03 indicates the data was collected on September 13 2006,at 18:32:03.
This attribute was designed for logging and reporting data collection times ratherthan for creating situations. To specify a time and date for comparison and testing,use attributes from the Universal Time or Local Time groups.
Server Name The name of the J2EE application server. The valid format is analphanumeric string, with a maximum of 256 characters.v Organization of the predefined workspacesv Attribute groups used by the predefined workspaces
JDK - Operation System attributesThe JDK - Operation System attributes provide data and statistics of the operatingsystem on which the J2SE application server is running. The information includesthe operating system architecture, name, version, and the available memoryinformation. The data for attributes is gathered from JVM MBeans, which aresupported in JVM version 1.5 and higher. No data is available for JVM withversions lower than 1.5.
The attributes within this group are used to build the “JVM Statistics workspace”on page 441.
Architecture The architecture of the operating system on which the J2SEapplication server is running (supported for JVM version 1.5 and higher). Thevalid format is an alphanumeric string, with a maximum of 256 characters.
Available Processors The number of available processors of the operation systemon which the J2SE application server is running (supported for JVM version 1.5and higher). The valid format is a positive integer.
Committed Virtual Memory Size The committed virtual memory size in kilobytes(supported for JVM version 1.5 and higher). The valid format is a positive integeror N/A if this attribute is not applicable.
Free Physical Memory The free physical memory (in kilobytes) of the operationsystem (supported for JVM version 1.5 and higher). The valid format is a positiveinteger or N/A if this attribute is not applicable.
Free Swap Space Size The free swap space size (in kilobytes) of the operatingsystem (supported for JVM version 1.5 and higher). The valid format is a positiveinteger or N/A if this attribute is not applicable.
Interval (sec) The length of the interval in seconds (supported for JVM version 1.5and higher). The valid format is a positive integer.
Chapter 4. ITCAM Agent for J2EE 493

Node Name The name of the system on which the server is running (supportedfor JVM version 1.5 and higher). The valid format is an alphanumeric string, witha maximum of 256 characters.
Origin Node The name of the server subnode (supported for JVM version 1.5 andhigher). The valid format is an alphanumeric string, with a maximum of 128characters.
OS Name The name of the operating system, such as Windows 2003 (supportedfor JVM version 1.5 and higher). The valid format is an alphanumeric string, witha maximum of 256 characters.
OS Version The version of the operating system on which the J2SE applicationserver is running (supported for JVM version 1.5 and higher). The valid format isan alphanumeric string, with a maximum of 256 characters.
Processing Capacity The processing capacity of operation system (supported forJVM version 1.5 and higher). The valid format is a positive integer or N/A if thisattribute is not applicable.
Sample Date and Time The date and time that the monitoring agent collected data(supported for JVM version 1.5 and higher). The valid format is a 12-charactertimestamp. For the STR and SCAN functions, the format is MM/DD/YYHH:MM:SS; the following table shows the values contained in this character string:
Table 106. Format of the 12-character timestamp
Character String Meaning
MM Month
DD Day
YY Year
HH Hour
MM Minute
SS Second
Example: 09/13/06 18:32:03 indicates the data was collected on September 13 2006,at 18:32:03.
This attribute was designed for logging and reporting data-collection times ratherthan for creating situations. To specify a time and date for comparison and testing,use attributes from the Universal Time or Local Time groups.
Server Name The name of the J2EE application server (supported for JVM version1.5 and higher). The valid format is an alphanumeric string, with a maximum of256 characters.
Total Physical Memory The total physical memory (in kilobytes) of the operationsystem (supported for JVM version 1.5 and higher). The valid format is a positiveinteger or N/A if this attribute is not applicable.
Total Swap Space Size The total swap space size (in kilobytes) of the operatingsystem (supported for JVM version 1.5 and higher). The valid format is a positiveinteger or N/A if this attribute is not applicable.v Organization of the predefined workspaces
494 ITCAM Agents for WebSphere Applications, J2EE, and HTTP Servers: User Guide

v Attribute groups used by the predefined workspaces
JDK - Memory attributesThe JDK - Memory attributes provide the memory usage information of theoperating system on which the J2SE application server is running. This includesheap memory information, heap memory usage information, and pending objects.The data for attributes is gathered from JVM MBeans, which are supported in JVMversion 1.5 and higher. No data is available for JVM with versions lower than 1.5.
The attributes within this group are used to build the “JVM Statistics workspace”on page 441.
Committed Heap Memory Size The amount of committed heap memory (inkilobytes) allocated to the JVM (supported for JVM version 1.5 and higher). Thevalid format is a positive integer.
Committed Non Heap Memory Size The amount of committed non-heap memory(in kilobytes) allocated to the JVM (supported for JVM version 1.5 and higher). Thevalid format is a positive integer.
Initial Heap Memory Size The initial amount of the heap memory (in kilobytes)for the JVM of the J2SE application server (supported for JVM version 1.5 andhigher). The valid format is a positive integer.
Initial Non Heap Memory Size The initial amount of the non-heap memory (inkilobytes) for the JVM of the J2SE application server (supported for JVM version1.5 and higher). The valid format is a positive integer.
Interval (sec) The length of the interval in seconds (supported for JVM version 1.5and higher). The valid format is a positive integer.
Maximum Heap Memory Size The maximum amount of the heap memory (inkilobytes) used by the JVM of the J2SE application server (supported for JVMversion 1.5 and higher). The valid format is a positive integer.
Maximum Non Heap Memory Size The maximum amount of the non-heapmemory (in kilobytes) used by the JVM of the J2SE application server (supportedfor JVM version 1.5 and higher). The valid format is a positive integer.
Node Name The name of the system on which the server is running (supportedfor JVM version 1.5 and higher). The valid format is an alphanumeric string, witha maximum of 256 characters.
Object Pending Finalization Count The number of objects that are not finalized(supported for JVM version 1.5 and higher). The valid format is a positive integer.
Origin Node The name of the server subnode (supported for JVM version 1.5 andhigher). The valid format is an alphanumeric string, with a maximum of 128characters.
Sample Date and Time The date and time that the monitoring agent collected data(supported for JVM version 1.5 and higher). The valid format is a 12-charactertimestamp. For the STR and SCAN functions, the format is MM/DD/YYHH:MM:SS; the following table shows the values contained in this character string:
Chapter 4. ITCAM Agent for J2EE 495

Table 107. Format of the 12-character timestamp
Character String Meaning
MM Month
DD Day
YY Year
HH Hour
MM Minute
SS Second
Example: 09/13/06 18:32:03 indicates the data was collected on September 13 2006,at 18:32:03.
This attribute was designed for logging and reporting data-collection times ratherthan for creating situations. To specify a time and date for comparison and testing,use attributes from the Universal Time or Local Time groups.
Server Name The name of the J2EE application server (supported for JVM version1.5 and higher). The valid format is an alphanumeric string, with a maximum of256 characters.
Used Heap Memory Size The amount of heap memory (in kilobytes) used by theJVM of the J2SE application server (supported for JVM version 1.5 and higher).The valid format is a positive integer.
Used Non Heap Memory Size The amount of non-heap memory (in kilobytes)used by the JVM of the J2SE application server (supported for JVM version 1.5 andhigher). The valid format is a positive integer.v Organization of the predefined workspacesv Attribute groups used by the predefined workspaces
JDK - JVM attributesThe JDK - JVM attributes provide overall information about the Java VirtualMachine (JVM) that the J2SE application server is using. This information includesthe information about JVM name, version, and uptime. The data for attributes isgathered from JVM MBeans, which are supported in JVM version 1.5 and higher.No data is available for JVM with versions lower than 1.5.
The attributes within this group are used to build the “JVM Statistics workspace”on page 441.
Formatted Uptime The time with a specific format during which the Java VirtualMachine is running (supported for JVM version 1.5 and higher). The format isDDd HHh MMm SSs; For example, 1d 2 h 44 m 23 s.
Interval (sec) The length of the interval in seconds (supported for JVM version 1.5and higher). The valid format is a positive integer.
JVM Name The name of the Java Virtual Machine (supported for JVM version 1.5and higher). The valid format is an alphanumeric string, with a maximum of 256characters.
496 ITCAM Agents for WebSphere Applications, J2EE, and HTTP Servers: User Guide

JVM Vendor The producer of the Java Virtual Machine (supported for JVM version1.5 and higher). The valid format is an alphanumeric string, with a maximum of256 characters.
JVM Version The version of the Java Virtual Machine (supported for JVM version1.5 and higher). The valid format is an alphanumeric string, with a maximum of256 characters.
Node Name The name of the system on which the server is running (supportedfor JVM version 1.5 and higher). The valid format is an alphanumeric string, witha maximum of 256 characters.
Origin Node The name of the server subnode (supported for JVM version 1.5 andhigher). The valid format is an alphanumeric string, with a maximum of 128characters.
Sample Date and Time The date and time that the monitoring agent collected data(supported for JVM version 1.5 and higher). The valid format is a 12-charactertimestamp. For the STR and SCAN functions, the format is MM/DD/YYHH:MM:SS; the following table shows the values contained in this character string:
Table 108. Format of the 12-character timestamp
Character String Meaning
MM Month
DD Day
YY Year
HH Hour
MM Minute
SS Second
Example: 09/13/06 18:32:03 indicates the data was collected on September 13 2006,at 18:32:03.
This attribute was designed for logging and reporting data-collection times ratherthan for creating situations. To specify a time and date for comparison and testing,use attributes from the Universal Time or Local Time groups.
Server Name The name of the J2EE application server (supported for JVM version1.5 and higher). The valid format is an alphanumeric string, with a maximum of256 characters.
Start Time The date and time when the Java Virtual Machine was started(supported for JVM version 1.5 and higher). The valid format is a 12-charactertimestamp. This attribute was designed for logging and reporting data-collectiontimes rather than for creating situations. To specify a time and date for comparisonand testing, use attributes from the Universal Time or Local Time groups.
Uptime The amount of time (in seconds) the JVM has been running (supported forJVM version 1.5 and higher). The valid format is a positive integer.v Organization of the predefined workspacesv Attribute groups used by the predefined workspaces
Chapter 4. ITCAM Agent for J2EE 497

JDK - Threading attributesThe JDK - Threading attributes provide overall information about the threads,including peak thread and daemon thread. A thread is the basic unit of programexecution in the Java Virtual Machine. A process can have several threads runningconcurrently, each performing a different job. When a thread has finished its job, itis suspended or destroyed. The data for attributes is gathered from JVM MBeans,which are supported in JVM version 1.5 and higher. No data is available for JVMwith versions lower than 1.5.
The attributes within this group are used to build the “JVM Statistics workspace”on page 441.
Current Thread CPU Time The CPU time (in seconds) used to process the currentthread (supported for JVM version 1.5 and higher). The valid format is a positiveinteger.
Current Thread User Time The user time (in seconds) used for the current thread(supported for JVM version 1.5 and higher). The valid format is a positive integer.
Daemon Thread Count The number of threads which run unattended to performcontinuous or periodic functions (supported for JVM version 1.5 and higher). Thevalid format is a positive integer.
Interval (sec) The length of the interval in seconds (supported for JVM version 1.5and higher). The valid format is a positive integer.
Node Name The name of the system on which the server is running (supportedfor JVM version 1.5 and higher). The valid format is an alphanumeric string, witha maximum of 256 characters.
Origin Node The name of the server subnode (supported for JVM version 1.5 andhigher). The valid format is an alphanumeric string, with a maximum of 128characters.
Peak Thread Count The maximum number of threads executed in the Java VirtualMachine (supported for JVM version 1.5 and higher). The valid format is a positiveinteger.
Sample Date and Time The date and time that the monitoring agent collected data(supported for JVM version 1.5 and higher). The valid format is a 12-charactertimestamp. For the STR and SCAN functions, the format is MM/DD/YYHH:MM:SS; the following table shows the values contained in this character string:
Table 109. Format of the 12-character timestamp
Character String Meaning
MM Month
DD Day
YY Year
HH Hour
MM Minute
SS Second
498 ITCAM Agents for WebSphere Applications, J2EE, and HTTP Servers: User Guide

Example: 09/13/06 18:32:03 indicates the data was collected on September 13 2006,at 18:32:03.
This attribute was designed for logging and reporting data-collection times ratherthan for creating situations. To specify a time and date for comparison and testing,use attributes from the Universal Time or Local Time groups.
Server Name The name of the J2EE application server (supported for JVM version1.5 and higher). The valid format is an alphanumeric string, with a maximum of256 characters.v Organization of the predefined workspacesv Attribute groups used by the predefined workspaces
JMS Sessions - WebLogic attributesThe JMS Sessions - WebLogic attribute group provides statistic for JMS session inWebLogic application server.
The attributes within this group are used to build the “JMS Sessions workspace”on page 439.
Acknowledge Mode The acknowledge mode. The valid format is an alphanumericstring, with a maximum of 64 characters.
Bytes Received The number of bytes received by this session since the previoussample. The valid format is a positive integer.
Byte Receive Rate The number of bytes received by this session per second for theinterval since the previous sample. The valid format is a decimal (formatted tothree decimal places).
Bytes Sent The number of bytes sent by this session since the previous sample.The valid format is a positive integer.
Byte Send Rate The number of bytes sent by this session per second for theinterval since the previous sample. The valid format is a decimal (formatted tothree decimal places).
Connection Name The name of the connection. The valid format is analphanumeric string, with a maximum of 128 characters.
Consumers Created The number of consumers instantiated by this session sincethe previous sample. The valid format is a positive integer.
Consumer Creation Rate The number of consumers instantiated by this sessionper second for the interval since the previous sample. The valid format is adecimal (formatted to three decimal places).
Current Bytes Pending The number of bytes pending (uncommitted andunacknowledged) for this session. The valid format is a positive integer.
Current Consumers The current number of consumers for this session. The validformat is a positive integer.
Current Messages Pending The number of messages pending (uncommitted andunacknowledged) for this session. The valid format is a positive integer.
Chapter 4. ITCAM Agent for J2EE 499

Current Producers The current number of producers for this session. The validformat is a positive integer.
Highest Consumers The peak number of consumers for this session since the lastreset. The valid format is a positive integer.
Highest Producers The peak number of producers for this session since the lastreset. The valid format is a positive integer.
Interval (sec) The length of the interval in seconds. The valid format is a positiveinteger.
Is Transacted Whether the session is transacted. Valid values are Yes and No.
Messages Received The number of messages received by this session since theprevious sample. The valid format is a positive integer.
Message Receive Rate The number of messages received by this session persecond for the interval since the previous sample. The valid format is a decimal(formatted to three decimal places).
Messages Sent The number of messages sent by this session since the previoussample. The valid format is a positive integer.
Message Send Rate The number of messages sent by this session per second forthe interval since the previous sample. The valid format is a decimal (formatted tothree decimal places).
Node Name The name of the system on which the server is running. The validformat is an alphanumeric string, with a maximum of 256 characters.
Origin Node The name of the server subnode. The valid format is analphanumeric string, with a maximum of 128 characters.
Row Number The row number. The valid format is a positive integer.
Producers Created The number of producers for this session created since theprevious sample. The valid format is a positive integer.
Producer Creation Rate The number of producers for this session created persecond for the interval since the previous sample. The valid format is a decimal(formatted to three decimal places).
Sample Date and Time The date and time that the monitoring agent for WebLogicServer agent collected data. The valid format is a 12-character timestamp. For theSTR and SCAN functions, the format is MM/DD/YY HH:MM:SS; the followingtable shows the values contained in this character string:
Table 110. Format of the 12-character timestamp
Character String Meaning
MM Month
DD Day
YY Year
HH Hour
500 ITCAM Agents for WebSphere Applications, J2EE, and HTTP Servers: User Guide

Table 110. Format of the 12-character timestamp (continued)
Character String Meaning
MM Minute
SS Second
Example: 09/13/06 18:32:03 indicates the data was collected on September 13 2006,at 18:32:03.
This attribute was designed for logging and reporting data-collection times ratherthan for creating situations. To specify a time and date for comparison and testing,use attributes from the Universal Time or Local Time groups.
Session Name The name of the session. The valid format is an alphanumericstring, with a maximum of 128 characters.
Server Name The name of the J2EE application server. The valid format is analphanumeric string, with a maximum of 256 characters.v Organization of the predefined workspacesv Attribute groups used by the predefined workspaces
JMS Summary - J2EE attributesThe JMS Summary - J2EE attributes provide information about how J2EEApplication Server applications are interacting with messaging middleware (J2EEMQ) using the Java Messaging Service (JMS). It provides such information aswhich queue managers and queues are being used and how many messages arebeing read and written.
The attributes within this group are used to build the JMS Summary workspace.
Important: The attributes within this attribute group contain meaningful valuesonly if your site has set the request data monitoring level to Level2 to collect dataon JMS requests.
Application ID The unique identifier that is assigned automatically when theapplication is first configured and is preserved during the whole application lifecycle. The valid format is a positive integer.
Average Processing Time (ms) The average time (in milliseconds) per requestusing the JMS. The valid format is a decimal (formatted to three decimal places).
Browse Average Time (ms) The average time (in milliseconds) that it takes foreach browse request from the queue to be processed. The valid format is a decimal(formatted to three decimal places).
Browse Count The number of messages browsed from the queue. The valid formatis a positive integer.
Browse Rate (per sec) The number of messages (per second) browsed from a JMSqueue. The valid format is a decimal (formatted to three decimal places).
Browse Total Time (ms) The total time (in milliseconds) used by browse requestsfrom the queue. The valid format is a positive integer.
Chapter 4. ITCAM Agent for J2EE 501

Full Name The complete name of the message queue, which consists of the queuemanager name concatenated to the queue name and separated by a slash. Thevalid format is an alphanumeric string, with a maximum of 100 characters.
Interval (sec) The length (in seconds) of the sampling interval. The valid format isa positive integer.
JMS Connection Label A shortened version of the full name. The valid format isan alphanumeric string, with a maximum of 12 characters.
Manager Name The name of the J2EE MQ queue manager (not supportedcurrently). This attribute is blank now. The valid format is an alphanumeric string,with a maximum of 48 characters.
Name The name of the J2EE MQ queue. The valid format is an alphanumericstring, with a maximum of 48 characters.
Node Name The name of the system on which the server is running. The validformat is an alphanumeric string, with a maximum of 256 characters.
Origin Node The name of the application server subnode. The valid format is analphanumeric string, with a maximum of 128 characters.
Process ID The unique identifier of the JVM process (the class ID of the JVM). Thevalid format is a positive integer.
Publish Average Time (ms) The average time (in milliseconds) that it takes foreach publish request to be sent to the queue. The valid format is a decimal(formatted to three decimal places).
Publish Count The number of publish requests sent to the queue. The valid formatis a positive integer.
Publish Rate (per sec) The number of publish requests (per second) sent to a JMSqueue. The valid format is a decimal (formatted to three decimal places).
Publish Total Time (ms) The total time (in milliseconds) used by all publishrequests for the queue. The valid format is a positive integer.
Receive Average Time (ms) The average time (in milliseconds) for each get fromthe queue. The valid format is a decimal (formatted to three decimal places).
Receive Count The number of destructive gets from the queue. The valid format isa positive integer.
Receive Rate (per sec) The number of destructive gets (per second) made from thequeue. The valid format is a decimal (formatted to three decimal places).
Receive Total Time (ms) The total time (in milliseconds) consumed by gets fromthe queue. The valid format is a positive integer.
Sample Date and Time The date and time that the monitoring agent for WebLogicServer agent collected data. The valid format is a 12-character timestamp. For theSTR and SCAN functions, the format is MM/DD/YY HH:MM:SS; the followingtable shows the values contained in this character string:
502 ITCAM Agents for WebSphere Applications, J2EE, and HTTP Servers: User Guide

Table 111. Format of the 12-character timestamp
Character String Meaning
MM Month
DD Day
YY Year
HH Hour
MM Minute
SS Second
Example: 09/13/06 18:32:03 indicates the data was collected on September 13 2006,at 18:32:03.
This attribute was designed for logging and reporting data-collection times ratherthan for creating situations. To specify a time and date for comparison and testing,use attributes from the Universal Time or Local Time groups.
Send Average Time (ms) The average time (in milliseconds) for each put to thequeue. The valid format is a decimal (formatted to three decimal places).
Send Count The number of messages put to the queue. The valid format is apositive integer.
Send Rate (per sec) The number of messages (per second) put to the queue. Thevalid format is a decimal (formatted to three decimal places).
Send Total Time (ms) The total time (in milliseconds) consumed by puts to thequeue. The valid format is a positive integer.
Server Name The name of the J2EE application server. The valid format is analphanumeric string, with a maximum of 256 characters.
Total Time (ms) The total time (in milliseconds) spent accessing the queue. Thevalid format is a positive integer.
Type The type of message manager. The valid values are Queue and Topic.
For additional information, see:v Organization of the predefined workspacesv Attribute groups used by the predefined workspaces
Java Transaction Service - WebLogic attributesThe Java Transaction Service - WebLogic attributes provides statistics within aWebLogic server.
The attributes within this group are used to build the “JTA Resources workspace”on page 440.
Committed Transactions Time (ms) The summary number of seconds for allcommitted transactions since the previous sample. The valid format is a positiveinteger.
Chapter 4. ITCAM Agent for J2EE 503

Current Active Transactions The number of active transactions on the server. Thevalid format is a positive integer.
Health State The health state of the JTA subsystem. Valid values are Warning,Critical, and Failed.
Health Reason Code The reason code of the health of the JTA subsystem. Thevalid format is an alphanumeric string, with a maximum of 128 characters.
Interval (sec) The length of the interval in seconds. The valid format is a positiveinteger.
Node Name The name of the system on which the server is running. The validformat is an alphanumeric string, with a maximum of 256 characters.
Origin Node The name of the server subnode. The valid format is analphanumeric string, with a maximum of 128 characters.
Row Number The row number. The valid format is a positive integer.
Sample Date and Time The date and time that the monitoring agent for WebLogicServer agent collected data. The valid format is a 12-character timestamp. For theSTR and SCAN functions, the format is MM/DD/YY HH:MM:SS; the followingtable shows the values contained in this character string:
Table 112. Format of the 12-character timestamp
Character String Meaning
MM Month
DD Day
YY Year
HH Hour
MM Minute
SS Second
Example: 09/13/06 18:32:03 indicates the data was collected on September 13 2006,at 18:32:03.
This attribute was designed for logging and reporting data-collection times ratherthan for creating situations. To specify a time and date for comparison and testing,use attributes from the Universal Time or Local Time groups.
Server Name The name of the J2EE application server. The valid format is analphanumeric string, with a maximum of 256 characters.
Transactions Abandoned The number of transactions that were abandoned sincethe previous sample. The valid format is a positive integer.
Transaction Abandon Rate The number of transactions that were abandoned persecond for the interval since the previous sample. The valid format is a decimal(formatted to three decimal places).
Transactions Committed The number of committed transactions since the previoussample. The valid format is a positive integer.
504 ITCAM Agents for WebSphere Applications, J2EE, and HTTP Servers: User Guide

Transaction Commit Rate The number of committed transactions per second forthe interval since the previous sample. The valid format is a decimal (formatted tothree decimal places).
Transaction Heuristic Completions The number of transactions that completedwith a heuristic status since the previous sample. The valid format is a positiveinteger.
Transaction Heuristic Completion Rate The number of transactions that completedwith a heuristic status per second for the interval since the previous sample. Thevalid format is a decimal (formatted to three decimal places).
Transactions Processed The number of transactions proceeded since the previoussample. The valid format is a positive integer.
Transaction Process Rate The number of transactions processed per second for theinterval since the previous sample. The valid format is a decimal (formatted tothree decimal places).
Transaction Rolled Back The number of transactions that were rolled back sincethe previous sample. The valid format is a positive integer.
Transaction Rolled Back by Application The number of transactions that wererolled back due to an application error since the previous sample. The valid formatis a positive integer.
Transaction Rolled Back by Application Percent The percent of transactions thatwere rolled back due to an application error. The valid format is a decimal(formatted to one decimal place).
Transaction Rolled Back by Resource The number of transactions that were rolledback due to a resource error since the previous sample. The valid format is apositive integer.
Transactions Rolled Back by Resource Percent The percent of transactions thatwere rolled back due to a resource error since the previous sample. The validformat is a decimal (formatted to one decimal place).
Transactions Rolled Back by System The number of transactions that were rolledback due to an internal system error since the previous sample. The valid format isa positive integer.
Transactions Rolled Back by System Percent The percent of transactions that wererolled back due to an internal system error since the previous sample. The validformat is a decimal (formatted to one decimal place).
Transactions Rolled Back by Timeout The number of transactions that were rolledback since the previous sample due to a timeout expiration. The valid format is apositive integer.
Transaction Rolled Back by Timeout Percent The percent of transactions that wererolled back due to a timeout expiration since the previous sample. The validformat is a decimal (formatted to one decimal place).
Chapter 4. ITCAM Agent for J2EE 505

Transaction Rollback Rate The number of transactions that were rolled back persecond for the interval since the previous sample. The valid format is a decimal(formatted to three decimal places).v Organization of the predefined workspacesv Attribute groups used by the predefined workspaces
JTA Resources - J2EE attributesThe JTA Resources - J2EE attributes group collects information about the JavaTransaction API (JTA) Resources.
The attributes within this group are used to build the “JTA Resources workspace”on page 440.
Active Count The number of active transactions. The valid format is a positiveinteger.
Committed Count The number of committed transactions. The valid format is apositive integer.
Interval (sec) The length (in seconds) of the sampling interval. The valid format isa positive integer.
JTA Resource The name of the JTA Resources. The valid format is an alphanumericstring, with a maximum of 256 characters.
Node Name The name of the system on which the server is running. The validformat is an alphanumeric string, with a maximum of 256 characters.
Origin Node The name of the server subnode. The valid format is analphanumeric string, with a maximum of 128 characters.
Rollback Count The number of Rollback transactions. The valid format is apositive integer.
Row Number The row number. The valid format is a positive integer.
For additional information, see:
Sample Date and Time The date and time that the monitoring agent for WebLogicServer agent collected data. The valid format is a 12-character timestamp. For theSTR and SCAN functions, the format is MM/DD/YY HH:MM:SS; the followingtable shows the values contained in this character string:
Table 113. Format of the 12-character timestamp
Character String Meaning
MM Month
DD Day
YY Year
HH Hour
MM Minute
SS Second
506 ITCAM Agents for WebSphere Applications, J2EE, and HTTP Servers: User Guide

Example: 09/13/06 18:32:03 indicates the data was collected on September 13 2006,at 18:32:03.
This attribute was designed for logging and reporting data-collection times ratherthan for creating situations. To specify a time and date for comparison and testing,use attributes from the Universal Time or Local Time groups.
Server Name The name of the J2EE application server. The valid format is analphanumeric string, with a maximum of 256 characters.v Organization of the predefined workspacesv Attribute groups used by the predefined workspaces
JTA Summary - NetWeaver attributesThe JTA Summary - NetWeaver attributes provide Transaction Serviceperformance data.
The attributes within this group are used to build the “JTA Summary workspace”on page 441.
Active Transactions Count The number of active transactions. The valid format isa positive integer.
Committed Transactions Count The number of transactions that have beencommitted. The valid format is a positive integer.
Interval (sec) The length of the interval in seconds. The valid format is a positiveinteger.
Node Name The name of the system on which the server is running. The validformat is an alphanumeric string, with a maximum of 256 characters.
Origin Node The name of the server subnode. The valid format is analphanumeric string, with a maximum of 128 characters.
Rolled Back Transactions Count The number of transactions that have been rolledback. The valid format is a positive integer.
Sample Date and Time The date and time that the monitoring agent for WebLogicServer agent collected data. The valid format is a 12-character timestamp. For theSTR and SCAN functions, the format is MM/DD/YY HH:MM:SS; the followingtable shows the values contained in this character string:
Table 114. Format of the 12-character timestamp
Character String Meaning
MM Month
DD Day
YY Year
HH Hour
MM Minute
SS Second
Example: 09/13/06 18:32:03 indicates the data was collected on September 13 2006,at 18:32:03.
Chapter 4. ITCAM Agent for J2EE 507

This attribute was designed for logging and reporting data-collection times ratherthan for creating situations. To specify a time and date for comparison and testing,use attributes from the Universal Time or Local Time groups.
Server Name The name of the J2EE application server. The valid format is analphanumeric string, with a maximum of 256 characters.
Suspended Transactions Count The number of suspended transactions. The validformat is a positive integer.
Timeouted Transactions Count The number of transactions that have timed out.v Organization of the predefined workspacesv Attribute groups used by the predefined workspaces
Log Analysis - J2EE attributesThe Log Analysis - J2EE attributes provide application server error and exceptionconditions as recorded in the application server log file. The log file isSystemOut.log. Use the Log Analysis attributes in situations to monitor errors andexception conditions and their severity.
The attributes within this group are used to build the Log Analysis workspace .
Component The name of the component that caused the error. The valid format isan alphanumeric string, with a maximum of 32 characters.
Event Date and Time The date and time when the event occurred. The validformat is a 12-character timestamp. For the STR and SCAN functions, the format isMM/DD/YY HH:MM:SS; the following table shows the values contained in thischaracter string:
Table 115. Format of the 12-character timestamp
Character String Meaning
MM Month
DD Day
YY Year
HH Hour
MM Minute
SS Second
Example: 09/13/06 18:32:03 indicates the data was collected on September 13 2006,at 18:32:03.
This attribute was designed for logging and reporting data-collection times ratherthan for creating situations. To specify a time and date for comparison and testing,use attributes from the Universal Time or Local Time groups.
Job ASID The identifier assigned to the address space running this servant region.The valid format is an alphanumeric string, with a maximum of four characters.
Job Name Where the message originates; that is, the log file name and linenumber. The valid format is an alphanumeric string, with a maximum of eightcharacters.
508 ITCAM Agents for WebSphere Applications, J2EE, and HTTP Servers: User Guide

Message ID The identifier assigned to the message. The valid format is analphanumeric string, with a maximum of 12 characters.
Message Origin Where the message originates; that is, the log file name and linenumber. The valid format is an alphanumeric string, with a maximum of 32characters.
Message Text The text of the error message. The valid format is alphanumericstring, with a maximum of 256 characters. All error message text data that goesbeyond 256 characters is truncated and not shown in the portal.
Node Name The name of the system on which the server is running. The valueformat is an alphanumeric string, with a maximum of 256 characters.
Origin Node The name of the server subnode. The valid format is analphanumeric string, with a maximum of 128 characters.
Process ID The process identifier of the Java virtual machine. The valid format isan alphanumeric sting, with a maximum of eight characters.
Sequence Number The sequence number in JMX notifications stream. The validformat is a positive integer.
Server Instance Name The name of the application server instance. This is thename of a single address space that can run application code (called a "specificserver" or simply a "server" ) . The valid format is an alphanumeric string, with amaximum of eight characters.
Server Name The name of the application server. The valid format is analphanumeric string, with a maximum of 256 characters.
Severity The severity of the message. The valid values are shown in the followingtable:
Table 116. Message severities and their meanings
Severity Definition
Informational A message intended to convey only user information
Unconditional A message of type Unconditional
Dump A message of type Dump
SystemOut A message written directly to System.out by the userapplication or internal components
SystemError A message written directly to System.err by the userapplication or internal components
User A message of type user
EntryMethod A message written upon entry to a method
ExitMethod A message written upon exit from a method
Event A message of type Event
Debug A message of type Debug
Audit An audit message
Warning A warning message
Error An error message
Chapter 4. ITCAM Agent for J2EE 509

Table 116. Message severities and their meanings (continued)
Severity Definition
Terminate A message of type Terminate (exit process)
Fatal A fatal message
Unknown A placeholder that indicates the message type was notrecognized
Thread ID The unique identifier of the thread where the event occurred. The validformat is an alphanumeric string, maximum 16 characters.
For additional information, see:v Organization of the predefined workspacesv Attribute groups used by the predefined workspacesv “Situations for ITCAM Agent for J2EE” on page 528
Request Analysis - J2EE attributesThe Request Analysis - J2EE attributes provide response times and functionaldecomposition information about requests (servlets, JSPs, and EJB methods) thatran on the application server.
The attributes within this group are used to build the Request Analysis workspace.
Application Name The name of the application to which the request belongs. Thevalid format is an alphanumeric string, with a maximum of 256 characters.
Application Time (ms) The average time (in milliseconds) this request spentprocessing application requests other than JCA, JMS, JNDI, and JDBC requests.This field can have a zero value if the total time is less than the number ofrequests, due to truncation. The valid format is a positive integer.
Application Time (% of Average Response) The percentage of time this requestspent processing application requests other than JCA, JMS, JNDI, and JDBCrequests. The valid format is a decimal (formatted to one decimal place).
Application Bad Delay (msec) The delay time (in milliseconds) in the applicationtier collected during the interval. This column is non-zero value when applicationdelay exceeds the bad threshold configured for it. The valid format is a positiveinteger.
Application Fair Delay (msec) The delay time (in milliseconds) in the applicationtier collected during the interval. This column is non-zero value when applicationdelay exceeds the fair threshold configured for it. The valid format is a positiveinteger.
Application Good Delay (msec) The delay time (in milliseconds) in the applicationtier collected during the interval. This column is non-zero when application delayis less than fair threshold configured for it. The valid format is a positive integer.
Application Tier Delay Type This attribute defines the request type based on itsdelay time in the application tier. Valid values are Unknown, Good, Fair, and Bad.
510 ITCAM Agents for WebSphere Applications, J2EE, and HTTP Servers: User Guide

Application Tier Response (msec) The actual response time in milliseconds in theapplication tier collected during the interval. The valid format is a positive integer.
Average Response (ms) The average time (in milliseconds) required each time thisrequest ran during the interval. The valid format is a positive integer.
Backend Bad Delay (msec) The delay time (in milliseconds) in the backend tiercollected during the interval. This column is non-zero value when backend delayexceeds the bad threshold configured for it. The valid format is a positive integer.
Backend Fair Delay (msec) The delay time (in milliseconds) in the backend tiercollected during the interval. This column is non-zero value when backend delayexceeds the fair threshold configured for it. The valid format is a positive integer.
Backend Good Delay (msec) The delay time (in milliseconds) in the backend tiercollected during the interval. This column is non-zero when backend delay is lessthan fair threshold configured for it. The valid format is a positive integer.
Backend Tier Delay Type This attribute defines the request type based on its delaytime in the backend tier. Valid values are Unknown, Good, Fair, and Bad.
Backend Tier Response (msec) The actual response time in milliseconds in thebackend tier collected during the interval. The valid format is a positive integer.
Client Bad Delay (msec) The delay time (in milliseconds) in the client tiercollected during the interval. This column is non-zero value when client delayexceeds the bad threshold configured for it. The valid format is a positive integer.
Client Fair Delay (msec) The delay time (in milliseconds) in the client tiercollected during the interval. This column is non-zero value when client delayexceeds the fair threshold configured for it. The valid format is a positive integer.
Client Good Delay (msec) The delay time (in milliseconds) in the client tiercollected during the interval. This column is non-zero when client delay is lessthan fair threshold configured for it. The valid format is a positive integer.
Client Tier Delay Type This attribute defines the request type based on its delaytime in the client tier. Valid values are Unknown, Good, Fair, and Bad.
Client Tier Response (msec) The actual response time in milliseconds in the clienttier collected during the interval. The valid format is a positive integer.
Completion Count The number of requests that successfully completed during theinterval. The valid format is a positive integer.
Custom Request Count The number of custom requests. The valid format is apositive integer.
Custom Request Time (ms) The average time (in milliseconds) the custom requestsspent. The valid format is a positive integer.
Custom Request Time (%) The percentage of time the custom requests spent. Thevalid format is a decimal (formatted to one decimal place).
EJB Count The number of times this request invoked an Enterprise Java Bean (EJB)request. The valid format is a positive integer.
Chapter 4. ITCAM Agent for J2EE 511

EJB Time (ms) The average time (in milliseconds) this request spent processingEnterprise Java Bean (EJB) requests. This field can have a zero value if the totaltime is less than the number of requests, due to truncation. The valid format is apositive integer.
EJB Time (%) The percentage of time this request spent processing Enterprise JavaBean (EJB) requests. The valid format is a decimal (formatted to one decimalplace).
Interval (sec) The length (in seconds) of the sampling interval. The valid format isa positive integer.
JCA Count The number of times this request invoked a J2EE ConnectorArchitecture (JCA) request. The valid format is a positive integer.
JCA Time (ms) The average time (in milliseconds) this request spent processingJ2EE Connector Architecture (JCA) requests. This field can have a zero value if thetotal time is less than the number of requests, due to truncation. The valid formatis a positive integer.
JCA Time (%) The percentage of time this request spent processing J2EE ConnectorArchitecture (JCA) requests. The valid format is a decimal (formatted to onedecimal place).
JMS Count The number of times this request invoked a Java Message Service(JMS) request. The valid format is a positive integer.
JMS Time (ms) The average time (in milliseconds) this request spent processingJava Message Service (JMS) requests. This field can have a zero value if the totaltime is less than the number of requests, due to truncation. The valid format is apositive integer.
JMS Time (%) The percentage of time this request spent processing Java MessageService (JMS) requests. The valid format is a decimal (formatted to one decimalplace).
JNDI Count The number of times this request invoked a Java Naming andDirectory Interface (JNDI) request. The valid format is a positive integer.
JNDI Time (ms) The average time (in milliseconds) this request spent processingJava Naming and Directory Interface (JNDI) requests. This field can have a zerovalue if the total time is less than the number of requests, due to truncation. Thevalid format is a positive integer.
JNDI Time (%) The percentage of time this request spent processing Java Namingand Directory Interface (JNDI) requests. The valid format is a decimal (formattedto one decimal place).
Longest Response (ms) The maximum time (in milliseconds) it took this request torun during the interval. The valid format is a positive integer.
Node Name The name of the system on which the server is running. The validformat is an alphanumeric string, with a maximum of 256 characters.
Origin Node The name of the application server subnode. The valid format is analphanumeric string, with a maximum of 128 characters.
512 ITCAM Agents for WebSphere Applications, J2EE, and HTTP Servers: User Guide

Process ID The process identifier of the Java virtual machine. The valid format is apositive integer.
Request Bad Response Threshold (msec) The threshold that defines the badrequests. A request that spends more time to complete than this threshold tocomplete is a bad request. The valid format is a positive integer.
Request Completion (%) The percentage of the requests that completedsuccessfully during the interval. The valid format is a positive integer.
Request Completion Level The completion level of the requests during theinterval. Valid values are Unknown, Good, Fair, and Bad.
Request Count The number of times this request ran during the interval. The validformat is a positive integer.
Request Detail The URI for servlet requests, or the method name for EJBs. Thevalid format is an alphanumeric string, with a maximum of 128 characters.
Request Delay Type The type of the request delay. Valid values are Unknown,Good, Fair, and Bad.
Request Fair Response Threshold (msec) The threshold that defines the fairrequests. A request that spends more time than this threshold and less time thanthe Request Bad Response Threshold (msec) attribute to complete is a fair request. Thevalid format is a positive integer.
Request Bad Delay (msec) The delay time (in milliseconds) collected during theinterval. This column is non-zero value when the whole request response timeexceeds the bad threshold configured for it. The valid format is a positive integer.
Request Fair Delay (msec) The delay time (in milliseconds) collected during theinterval. This column is non-zero value when the whole request response timeexceeds the fair threshold configured for it. The valid format is a positive integer.
Request Good Delay (msec) The delay time (in milliseconds) collected during theinterval. This column is non-zero value when the whole request response time isless than fair threshold configured for it. The valid format is a positive integer.
Request Label A shortened version of Request Name, used to display the requestname in the chart view. The valid format is an alphanumeric string, with amaximum of 128 characters.
Request Name The URL for servlet requests, or the fully qualified class name forEJBs. The valid format is an alphanumeric string, with a maximum of 128characters.
Request Rate (per sec) The number of requests completed per second during theinterval. If the sampling rate is less than 100%, this number is extrapolated toestimate 100% of completed requests. The valid format is a decimal (formatted tothree decimal places).
Request Type The type of request being run. Valid values are Servlet, EJB_Method,Custom, All_Workloads, Unknown, and Portlet.
Chapter 4. ITCAM Agent for J2EE 513

Sample Date and Time The date and time the Tivoli Enterprise ManagementAgent collected the data. The valid format is a 12-character timestamp. For the STRand SCAN functions, the format is MM/DD/YY HH:MM:SS; the following tableshows the values contained in this character string:
Table 117. Format of the 12-character timestamp
Character String Meaning
MM Month
DD Day
YY Year
HH Hour
MM Minute
SS Second
Example: 09/13/06 18:32:03 indicates the data was collected on September 13 2006,at 18:32:03.
This attribute was designed for logging and reporting data-collection times ratherthan for creating situations. To specify a time and date for comparison and testing,use attributes from the Universal Time or Local Time groups.
Sampling Rate (%) The percentage of requests being sampled. The valid format isa positive integer.
Server Name The name of the J2EE application server. The valid format is analphanumeric string, with a maximum of 256 characters.
Servlet Count The number of times this request invoked a Servlet request. Thevalid format is a positive integer.
Servlet Time (ms) The average time (in milliseconds) this request spent processingServlet requests. This field can have a zero value if the total time is less than thenumber of requests, due to truncation. The valid format is a positive integer.
Servlet Time (%) The percentage of time this request spent processing Servletrequests. The valid format is a decimal (formatted to one decimal place).
SQL Connect Count The number of times this request connected to a JDBCdatabase. The valid format is a positive integer.
SQL Connect Time (ms) The average time (in milliseconds) this request spentconnecting to a JDBC database. This field can have a zero value if the total time isless than the number of requests, due to truncation. The valid format is a positiveinteger.
SQL Connect Time (%) The percentage of time this request spent connecting to aJDBC database. The valid format is a decimal (formatted to one decimal place).
SQL Execute Count The number of times this request executed a JDBC database.The valid format is a positive integer.
514 ITCAM Agents for WebSphere Applications, J2EE, and HTTP Servers: User Guide

SQL Execute Time (ms) The average time (in milliseconds) this request spentexecuting a JDBC database. This field can have a zero value if the total time is lessthan the number of requests, due to truncation. The valid format is a positiveinteger.
SQL Execute Time (%) The percentage of time this request spent executing a JDBCdatabase. The valid format is a decimal (formatted to one decimal place).
SQL Query Count The number of times this request queried a JDBC database. Thevalid format is a positive integer.
SQL Query Time (ms) The average time (in milliseconds) this request spentquerying a JDBC database. This field can have a zero value if the total time is lessthan the number of requests, due to truncation. The valid format is a positiveinteger.
SQL Query Time (%) The percentage of time this request spent querying a JDBCdatabase. The valid format is a decimal (formatted to one decimal place).
SQL Update Count The number of times this request updated a JDBC database.The valid format is a positive integer.
SQL Update Time (ms) The average time (in milliseconds) this request spentupdating a JDBC database. This field can have a zero value if the total time is lessthan the number of requests, due to truncation. The valid format is a positiveinteger.
SQL Update Time (%) The percentage of time this request spent updating a JDBCdatabase. The valid format is a decimal (formatted to one decimal place).
Total Time (ms) The total CPU time (in milliseconds) this request consumedduring the interval. The valid format is a positive integer.
For additional information, see:v Organization of the predefined workspacesv Attribute groups used by the predefined workspaces
Requests Monitoring Configuration attributesThe Requests Monitoring Configuration attributes provide information for allrequests monitored in application. Use these attributes to monitor application edgerequests. The agent supports three types of edge requests, Servlet/JSP, EJB, andPortal.
The attributes within this group are used to build the Request Baseline workspace.
Application Name The name of the application to which the request belongs. Thevalid format is an alphanumeric string, with a maximum of 256 characters.
Application ID The unique identifier that is assigned automatically when theapplication is first configured and is preserved during the whole application lifecycle. The valid format is a positive integer.
Application Tier Threshold (msec) The response time threshold in the applicationtier in milliseconds. The valid format is a positive integer.
Chapter 4. ITCAM Agent for J2EE 515

Auto Threshold Bad Projection (%) The bad response time projection used forauto threshold. The valid format is a positive integer.
Auto Threshold Fair Ratio The percentage to derive the fair response timethreshold from the baseline selection. The valid format is a positive integer.
Auto Threshold Fair Projection (%) The fair response time projection used forauto thresholds. The valid format is a positive integer.
Auto Threshold Mode The request auto threshold mode. Valid values are Default,Custom, and Disabled.
Auto Threshold Deviation (%) The maximum allowed deviation of requestsbaseline data used for auto threshold. The valid format is a positive integer.
Auto Threshold Percent (%) The minimum percent of requests baseline data usedfor auto threshold. The valid format is a positive integer.
Backend Tier Threshold (msec) The response time threshold in the backend tier inmilliseconds. The valid format is a positive integer.
Bad Response Threshold (msec) The time (in milliseconds) that defines the badrequests. A request that spends more time than this threshold to complete is a badrequest. Use this attribute with Fair Response Threshold (msec) attribute and FairResponse Zone (msec) attribute. The valid format is a positive integer.
Bad Errors Rate Threshold The value of bad error rate percentage. The validformat is a positive integer.
Client Tier Threshold (msec) The response time threshold in the client tier inmilliseconds. The valid format is a positive integer.
Fair Response Threshold (msec) The time (in milliseconds) that defines the fairrequests. A request that spends less time than this threshold to complete is a goodrequest. Use this attribute with Fair Response Zone (msec) attribute and BadResponse Threshold (msec) attribute. The valid format is a positive integer.
Fair Response Zone (msec) The time span (in milliseconds) that defines the fairrequests. This time span is between the fair response time threshold and the badtime threshold. If the response time of a request falls into this time span, therequest is a fair request. Use this attribute with Fair Response Threshold (msec)attribute and Bad Response Threshold (msec) attribute. The valid format is apositive integer.
Fair Errors Rate Threshold The value of fair error rate percentage. The validformat is a positive integer.
Interval (sec) The length (in seconds) of the sampling interval. The valid format isa positive integer.
Node Name The name of the system on which the server is running. The validformat is an alphanumeric string, with a maximum of 256 characters.
Origin Node The name of the server subnode. The valid format is analphanumeric string, with a maximum of 128 characters.
516 ITCAM Agents for WebSphere Applications, J2EE, and HTTP Servers: User Guide

Request Detail The request detail name. The valid format is an alphanumericstring, with a maximum of 256 characters.
Request ID The unique identifier of the request that belongs to the application.The valid format is a positive integer.
Request Label A shortened version of Request Name, used to display the requestname in the chart view. The valid format is an alphanumeric string, with amaximum of 24 characters.
Request Name The URL for servlet requests, or the fully qualified class name forEJBs. The valid format is an alphanumeric string, with a maximum of 256characters.
Request Type The type of request being run. Valid values are All, Servlet/JSP, EJB,and Portal.
Sample Date and Time The date and time the Tivoli Enterprise ManagementAgent collected the data. The valid format is a 12-character timestamp. For the STRand SCAN functions, the format is MM/DD/YY HH:MM:SS; the following tableshows the values contained in this character string:
Table 118. Format of the 12-character timestamp
Character String Meaning
MM Month
DD Day
YY Year
HH Hour
MM Minute
SS Second
Example: 09/13/06 18:32:03 indicates the data was collected on September 13 2006,at 18:32:03.
This attribute was designed for logging and reporting data collection times ratherthan for creating situations. To specify a time and date for comparison and testing,use attributes from the Universal Time or Local Time groups.
Server Name The name of the application server. The valid format is analphanumeric string, with a maximum of 256 characters.
For additional information, see:v Organization of the predefined workspacesv Attribute groups used by the predefined workspaces
Request Times and Rates - J2EE attributesThe Request Times and Rates - J2EE attribute group provides information abouthistorical request throughput and average response time for a particularapplication server.
The attributes within this group are used to build the J2EE application serversworkspaces.
Chapter 4. ITCAM Agent for J2EE 517

Application Name The name of the application to which the request belongs. Thevalid format is an alphanumeric string, with a maximum of 256 characters.
Average Load The average number of concurrent requests during the interval. Thevalid format is a decimal (formatted to three decimal places).
Average Request Completion Rate The average request completion rate (that is,the request throughput). If the sampling rate is less than 100%, this number isextrapolated to estimate 100% of completed requests. The valid format is a positiveinteger.
Average Request Response Time (ms) The average request response time, inmilliseconds. The valid format is a positive integer.
Error Rate (%) The error rate of the request during the interval. The valid format isa decimal (formatted to three decimal places).
Interval (sec) The length (in seconds) of the sampling interval. The valid format isa positive integer.
Node Name The name of the system on which the server is running. The validformat is an alphanumeric string, with a maximum of 256 characters.
Origin Node The name of the server subnode. The valid format is analphanumeric string, with a maximum of 128 characters.
Request Count The number of times this request ran during the interval. The validformat is a positive integer.
Request Type The type of request being run. Valid values are Servlet, EJB_Method,Custom, All_Workloads, Unknown, and Portlet.
Sample Date and Time The date and time that the monitoring agent for WebLogicServer agent collected data. The valid format is a 12-character timestamp. For theSTR and SCAN functions, the format is MM/DD/YY HH:MM:SS; the followingtable shows the values contained in this character string:
Table 119. Format of the 12-character timestamp
Character String Meaning
MM Month
DD Day
YY Year
HH Hour
MM Minute
SS Second
Example: 09/13/06 18:32:03 indicates the data was collected on September 13 2006,at 18:32:03.
This attribute was designed for logging and reporting data collection times ratherthan for creating situations. To specify a time and date for comparison and testing,use attributes from the Universal Time or Local Time groups.
518 ITCAM Agents for WebSphere Applications, J2EE, and HTTP Servers: User Guide

Sampling Rate (%) The percentage of edge requests-such as servlets and JSPs thatwere sampled during the interval. The valid format is a positive integer.
Server Name The name of the application server. The valid format is analphanumeric string, with a maximum of 256 characters.
Total (ms) The total time. The valid format is a decimal (formatted to three decimalplaces).
For additional information, see:v Organization of the predefined workspacesv Attribute groups used by the predefined workspaces
Selected Request - J2EE attributesThe Selected Request - J2EE attribute group provides detailed information abouttransaction requests for database (that is, JDBC), messaging (that is, JMS), or EIS(that is, JCA) services.
The attributes within this group are used to build these workspaces:v “Selected Request - data sources workspace” on page 449v “Selected Request - JMS Queues workspace” on page 450v “Selected Request - Resource Adapters workspace” on page 450
Note: The attributes within this attribute group contain meaningful values only ifyour site has set the request data monitoring level to Level2 to collect data onnested requests.
Activity Category The type of request. Valid values are n/a (not applicable), JDBC,JMS, and JCA.
Activity Detail Detailed information about the activity performed by the selectedrequest, for example, the SQL statement being processed. The valid format is analphanumeric string, maximum 128 characters.
Activity Label An abbreviated version of Activity Name, used to display theactivity name in the chart view. The valid format is an alphanumeric string, with amaximum of 128 characters.
Activity Name The resource that the request is accessing, for example, the datasource name. The valid format is an alphanumeric string, with a maximum of 128characters.
Activity Type The type of the resource being requested. Valid values display in thefollowing table:
Table 120. Activity types
Type Definition
n/a not applicable
Servlet A call to the doGet or doPost methods of a server
EJB_Method_Call A call to a business method for an EJB class
Obtain_SQL_Connection_from_Datasource A call to obtain a connection from a JDBC data source
SQL_Query A Query request to a JDBC data source
Chapter 4. ITCAM Agent for J2EE 519

Table 120. Activity types (continued)
Type Definition
SQL_Update An Update request to a JDBC data source
SQL_Other Any other request to a JDBC data source
JMS_Message_Browse A call to browse a message from a JMS queue
JMS_Message_Get A call to receive a message from a JMS queue (that is, adestructive get)
JMS_Message_Put A call to put a message from a JMS queue
JMS_Publish_Message A call to publish a publication to a JMS queue
JCA_CCI_Execute_interaction A request by a J2EE application to execute a JCAinteraction (a JDBC, JMS, or other JCA-supportedoperation) against a backend system
JNDI_Lookup A call to JNDI to build an Initial Context or to perform alookup
Unknown The activity type cannot be determined
Average Response (ms) The average time (in milliseconds) executing this request,per occurrence. The valid format is a decimal (formatted to one decimal place).
Delay (%) The percentage of execution time this activity consumed on averagewhen processing this request. The valid format is a decimal (formatted to onedecimal place).
Interval (sec) The length (in seconds) of the interval. The valid format is a positiveinteger.
Longest Response (ms) The worst-case response time (in milliseconds) experiencedby this request. The valid format is a positive integer.
Node Name The name of the system on which the server is running. The valueformat is an alphanumeric string, with a maximum of 256 characters.
Occurrences The number of occurrences. The valid format is a positive integer.
Origin Node The name of the application server subnode. The valid format is analphanumeric string, with a maximum of 128 characters.
Process ID The unique identifier of the JVM process (the class ID of the JVM). Thevalid format is a positive integer.
Request Detail The URI for servlet requests, or the method name for EJBs. Thevalid format is an alphanumeric string, with a maximum of 128 characters.
Request Name The URL for servlet requests, or the fully qualified class name forEJBs. The valid format is an alphanumeric string, with a maximum of 128characters.
Request Type The type of transaction being run. Valid values are Servlet andEJB_Method, Custom, All_Workloads, Unknown, Portlet.
Sample Date and Time The date and time that the monitoring agent for WebLogicServer agent collected data. The valid format is a 12-character timestamp. For the
520 ITCAM Agents for WebSphere Applications, J2EE, and HTTP Servers: User Guide

STR and SCAN functions, the format is MM/DD/YY HH:MM:SS; the followingtable shows the values contained in this character string:
Table 121. Format of the 12-character timestamp
Character String Meaning
MM Month
DD Day
YY Year
HH Hour
MM Minute
SS Second
Example: 09/13/06 18:32:03 indicates the data was collected on September 13 2006,at 18:32:03.
This attribute was designed for logging and reporting data-collection times ratherthan for creating situations. To specify a time and date for comparison and testing,use attributes from the Universal Time or Local Time groups.
Sampling Rate (%) The percentage of edge requests-such as servlets and JSPs-thatwere sampled for nested requests during the interval. The valid format is apositive integer.
Server Name The name of the J2EE application server. The valid format is analphanumeric string, with a maximum of 256 characters.
Total Time (ms) The total CPU time (in milliseconds) consumed by this request.The valid format is a positive integer.
For additional information, see:v Organization of the predefined workspacesv Attribute groups used by the predefined workspaces
Servlets JSPs - J2EE attributesThe Servlets JSPs - J2EE attributes collect performance information for servletsand Java server pages (JSPs).
The attributes within this group are used to build the “Servlets/JSPs - SelectedWeb Application workspace” on page 452.
Average Response Time (ms) The average servlet service time in milliseconds. Thevalid format is a decimal (formatted to three decimal places). This attribute mightbe empty if servlet is not invoked yet.
Error Count The number of servlets that are in error. The valid format is a positiveinteger.
Interval (sec) The length (in seconds) of the interval. The valid format is a positiveinteger.
Invocation Count The number of invocations. The valid format is a positiveinteger. This attribute might be empty if servlet is not invoked yet.
Chapter 4. ITCAM Agent for J2EE 521

Max Time (ms) The longest service time in milliseconds. The valid format is adecimal (formatted to three decimal places).
Min Time (ms) The shortest service time in milliseconds. The valid format is adecimal (formatted to three decimal places).
Node Name The name of the system on which the server is running. The valueformat is an alphanumeric string, with a maximum of 256 characters.
Origin Node The name of the server subnode. The valid format is analphanumeric string, with a maximum of 128 characters.
Row Number The row number. The valid format is a positive integer.
Sample Date and Time The date and time that the monitoring agent for WebLogicServer agent collected data. The valid format is a 12-character timestamp. For theSTR and SCAN functions, the format is MM/DD/YY HH:MM:SS; the followingtable shows the values contained in this character string:
Table 122. Format of the 12-character timestamp
Character String Meaning
MM Month
DD Day
YY Year
HH Hour
MM Minute
SS Second
Example: 09/13/06 18:32:03 indicates the data was collected on September 13 2006,at 18:32:03.
This attribute was designed for logging and reporting data-collection times ratherthan for creating situations. To specify a time and date for comparison and testing,use attributes from the Universal Time or Local Time groups.
Server Name The name of the application server. The valid format is analphanumeric string, with a maximum of 256 characters.
Servlet/JSP Name The name of the web application. The valid format is analphanumeric string, with a maximum of 128 characters.
Total Time (ms) The total service time in milliseconds. The valid format is adecimal (formatted to three decimal places).
Web Application Name The name of the web application. The valid format is analphanumeric string, with a maximum of 128 characters.
For additional information, see:v Organization of the predefined workspacesv Attribute groups used by the predefined workspaces
522 ITCAM Agents for WebSphere Applications, J2EE, and HTTP Servers: User Guide

Servlets and JSPs - WebLogic attributesThe Servlets and JSPs - WebLogic attributes provide performance information forservlets and JavaServer pages (JSPs).
The attributes within this group are used to build the “Servlets/JSPs - SelectedEnterprise Application workspace” on page 451.
Average Execution Time (ms) The average amount of time (in milliseconds) theinvocations of the servlet have executed for the interval since the previous sample.The valid format is a decimal (formatted to three decimal places).
Context Path The context path. The valid format is an alphanumeric string, with amaximum of 256 characters.
Cumulative Average Execution Time (ms) The average amount of time (inmilliseconds) all invocations of the servlet have executed since created. The validformat is a positive integer.
Enterprise Application Name The J2EE application name. The valid format is analphanumeric string, with a maximum of 128 characters.
Execution Time (ms) The amount of time (in milliseconds) all invocations of theservlet has executed since the previous sample. The valid format is a positiveinteger.
Highest Execution Time (ms) The amount of time (in milliseconds) the singlelongest invocation of the servlets has executed since created. The valid format is apositive integer.
Interval (sec) The length of the interval in seconds. The valid format is a positiveinteger.
Invocations The number of times the servlet has been invoked since the previoussample. The valid format is a positive integer.
Invocation Rate The number of times the servlet has been invoked per second forthe interval since the previous sample. The valid format is a decimal (formatted tothree decimal places).
Lowest Execution Time (ms) The amount of time (in milliseconds) the singleshortest invocation of the servlet has executed since created. The valid format is apositive integer.
Maximum Pool Capacity The maximum capacity of this servlet for single threadmodel servlets. The valid format is a positive integer.
Node Name The name of the system on which the server is running. The validformat is an alphanumeric string, with a maximum of 256 characters.
Origin Node The name of the server subnode. The valid format is analphanumeric string, with a maximum of 128 characters.
Reloads The number of times the servlet has been reloaded for interval since theprevious sample. The valid format is a positive integer.
Chapter 4. ITCAM Agent for J2EE 523

Reload Rate The number of times the servlet has been reloaded per second for theinterval since the previous sample. The valid format is a decimal (formatted tothree decimal places).
Row Number The row number. The valid format is a positive integer.
Sample Date and Time The date and time that the monitoring agent for WebLogicServer agent collected data. The valid format is a 12-character timestamp. For theSTR and SCAN functions, the format is MM/DD/YY HH:MM:SS; the followingtable shows the values contained in this character string:
Table 123. Format of the 12-character timestamp
Character String Meaning
MM Month
DD Day
YY Year
HH Hour
MM Minute
SS Second
Example: 09/13/06 18:32:03 indicates the data was collected on September 13 2006,at 18:32:03.
This attribute was designed for logging and reporting data-collection times ratherthan for creating situations. To specify a time and date for comparison and testing,use attributes from the Universal Time or Local Time groups.
Server Name The name of the J2EE application server. The valid format is analphanumeric string, with a maximum of 256 characters.
Servlet Name The servlet or JSP name. The valid format is an alphanumeric string,with a maximum of 128 characters.
Servlet Path The servlet path. The valid format is an alphanumeric string, with amaximum of 256 characters.
Web Application Name The web application component name. The valid format isan alphanumeric string, with a maximum of 128 characters.v Organization of the predefined workspacesv Attribute groups used by the predefined workspaces
Web Container - NetWeaver attributesThe Web Container - NetWeaver attributes collect performance information aboutservlets and Java Server pages (JSPs).
The attributes within this group are used to build the “Web Container workspace”on page 454.
All Requests Count The number of all requests since server startup. The validformat is a positive integer.
Current Http Sessions The number of the currently valid http sessions. The validformat is a positive integer.
524 ITCAM Agents for WebSphere Applications, J2EE, and HTTP Servers: User Guide

Current Security Sessions The number of the currently valid security sessionscreated for http clients. The valid format is a positive integer.
Interval (sec) The length of the interval in seconds. The valid format is a positiveinteger.
Invalidated Http Sessions The number of http sessions invalidated by application.The valid format is a positive integer.
Invalidated Security Sessions The number of security sessions which have beeninvalidated by application. The valid format is a positive integer.
Node Name The name of the system on which the server is running. The validformat is an alphanumeric string, with a maximum of 256 characters.
Origin Node The name of the server subnode. The valid format is analphanumeric string, with a maximum of 128 characters.
Sample Date and Time The date and time that the monitoring agent for WebLogicServer agent collected data. The valid format is a 12-character timestamp. For theSTR and SCAN functions, the format is MM/DD/YY HH:MM:SS; the followingtable shows the values contained in this character string:
Table 124. Format of the 12-character timestamp
Character String Meaning
MM Month
DD Day
YY Year
HH Hour
MM Minute
SS Second
Example: 09/13/06 18:32:03 indicates the data was collected on September 13 2006,at 18:32:03.
This attribute was designed for logging and reporting data-collection times ratherthan for creating situations. To specify a time and date for comparison and testing,use attributes from the Universal Time or Local Time groups.
Server Name The name of the J2EE application server. The valid format is analphanumeric string, with a maximum of 256 characters.
Timed Out Http Sessions The number of http sessions which have timed out. Thevalid format is a positive integer.
Timed Out Security Sessions The number of security sessions which have timedout. The valid format is a positive integer.v Organization of the predefined workspacesv Attribute groups used by the predefined workspaces
Web Applications - J2EE attributesThe Web Applications - J2EE attributes provide aggregated information for eachWeb application and for the application server running that application. This
Chapter 4. ITCAM Agent for J2EE 525

performance data describes all servlets and JSPs deployed to that Web applicationas well as performance data for all servlets and JSPs running in the applicationserver. Examples include the number of loaded servlets and JSPs and totalrequests. Use the Web Applications - J2EE attributes to create situations thatmonitor Web application performance and application server loads.
The attributes within this group are used to build the Web Applications workspace.
Average Response Time The average response time of the application, inmilliseconds. The valid format is a decimal (formatted to three decimal places).This attribute might be empty if servlet is not invoked yet.
Interval (sec) The length (in seconds) of the sampling interval. The valid format isa positive integer.
Invocation Count The total invocation count for application. The valid format is apositive integer. This attribute might be empty if servlet is not invoked yet.
Node Name The name of the system on which the server is running. The valueformat is an alphanumeric string, with a maximum of 256 characters.
Origin Node The name of the server subnode. The valid format is analphanumeric string, with a maximum of 128 characters.
Row Number The row number. The valid format is a positive integer.
Sample Date and Time The date and time that the monitoring agent for WebLogicServer agent collected data. The valid format is a 12-character timestamp. For theSTR and SCAN functions, the format is MM/DD/YY HH:MM:SS; the followingtable shows the values contained in this character string:
Table 125. Format of the 12-character timestamp
Character String Meaning
MM Month
DD Day
YY Year
HH Hour
MM Minute
SS Second
Example: 09/13/06 18:32:03 indicates the data was collected on September 13 2006,at 18:32:03.
This attribute was designed for logging and reporting data-collection times ratherthan for creating situations. To specify a time and date for comparison and testing,use attributes from the Universal Time or Local Time groups.
Server Name The name of the application server. The valid format is analphanumeric string, with a maximum of 256 characters.
Servlet Count The number of servlets in these web applications. The valid formatis a positive integer.
526 ITCAM Agents for WebSphere Applications, J2EE, and HTTP Servers: User Guide

Total Time The total time. The valid format is a decimal (formatted to threedecimal places).
Web Application Name The name of the Web application. The valid format is analphanumeric string, with a maximum of 128 characters.
For additional information, see:v Organization of the predefined workspacesv Attribute groups used by the predefined workspaces
Web Applications - WebLogic attributesThe Web Applications - WebLogic attributes provide data and aggregatedstatistics for Web application components.
The attributes within this group are used to build the “Web Applicationsworkspace” on page 453.
Context Root The context root (context path) for the Web application. The validformat is an alphanumeric string, with a maximum of 256 characters.
Current Servlet Sessions The current number of open servlet sessions. The validformat is a positive integer.
Enterprise Application Name The J2EE application name. The valid format is analphanumeric string, with a maximum of 128 characters.
Highest Servlet Sessions The high water mark of the total number of opensessions in this server. The valid format is a positive integer.
Interval (sec) The length of the interval in seconds. The valid format is a positiveinteger.
Node Name The name of the system on which the server is running. The validformat is an alphanumeric string, with a maximum of 256 characters.
Origin Node The name of the server subnode. The valid format is analphanumeric string, with a maximum of 128 characters.
Row Number The row number. The valid format is a positive integer.
Sample Date and Time The date and time that the monitoring agent for WebLogicServer agent collected data. The valid format is a 12-character timestamp. For theSTR and SCAN functions, the format is MM/DD/YY HH:MM:SS; the followingtable shows the values contained in this character string:
Table 126. Format of the 12-character timestamp
Character String Meaning
MM Month
DD Day
YY Year
HH Hour
MM Minute
SS Second
Chapter 4. ITCAM Agent for J2EE 527

Example: 09/13/06 18:32:03 indicates the data was collected on September 13 2006,at 18:32:03.
This attribute was designed for logging and reporting data-collection times ratherthan for creating situations. To specify a time and date for comparison and testing,use attributes from the Universal Time or Local Time groups.
Server Name The name of the J2EE application server. The valid format is analphanumeric string, with a maximum of 256 characters.
Servlet Invocation Rate The number of servlet requests per second for the intervalsince the previous sample. The valid format is a decimal (formatted to threedecimal places).
Session Monitoring Enabled Whether servlet sessions monitoring is enabled. Itcan be enabled in weblogic.xml. Valid values are Enabled and Disabled.
Servlet Reload Rate The servlets reloads per second for the interval since theprevious sample. The valid format is a decimal (formatted to three decimal places).
Servlet Sessions Opened The number of servlet sessions opened since theprevious sample. The valid format is a positive integer.
Servlet Session Creation Rate The number of servlet sessions opened per secondfor the interval since the previous sample. The valid format is a decimal (formattedto three decimal places).
Status The component status. The valid format is an alphanumeric string, with amaximum of 64 characters.
Web Application Name The web application component name. The valid format isan alphanumeric string, with a maximum of 128 characters.v Organization of the predefined workspacesv Attribute groups used by the predefined workspaces
Situations for ITCAM Agent for J2EEITCAM Agent for J2EE provides 11 predefined situations that you can use to:v Immediately begin monitoring your J2EE application serversv Monitor and manage widely dispersed J2EE Application Server resources
through localized automationv Use models for creating your own situations
These predefined situations have an alert status of Critical. When these situationstrigger an alert, you can investigate the event by opening its workspace. Forexample, you can use these situations to monitor a J2EE application server forerrors occurring within it or the web applications on your site.
How the situations work
Situations are tests expressed in an IF-TRUE format of system conditions that youwant to monitor. The tested value is an ITCAM Agent for J2EE attribute expressedin the form attribute-group.attribute-name. Thus, if the specified condition occurs orexists, the situation is true, and an alert is issued.
528 ITCAM Agents for WebSphere Applications, J2EE, and HTTP Servers: User Guide

Avoid using negative values
If you define situations that use a counter or a range of numbers, always provide athreshold or use values in a positive range of numbers. For example, use agreater-than-or-equal-to-zero expression as shown in some of the followingpredefined situations. Using this expression prevents a situation from falselytripping. If the ITCAM Agent for J2EE Tivoli Enterprise Monitoring Agentencounters an undefined attribute value, it interprets this value as a negativenumber and erroneously fires a situation that specified a negative number.
Predefined situations-descriptions and formulas
J2EEServletsJSPsError Monitors the error count for servlets and JSPs invoked by aJ2EE Application Server application and issues a Critical condition whenever thecount becomes nonzero. The J2SE application server does not support thissituation. Its formula is as follows:
If
Servlets_JSPs.Error_Count is greater than 0
then
the situation J2EEServletsJSPsError is true.
J2EEError Monitors the error severity for a single J2EE Application Server andissues a Critical condition whenever that severity is greater than 21. The J2SEapplication server does not support this situation. Its formula is as follows:
If
Log_Analysis.Severity is greater than 21
then
the situation J2EEError is true.
J2EENotConnected Monitors the connection between the ITCAM for J2EE datacollector running in an application server and the ITCAM Agent for J2EEmonitoring agent to ensure that the monitoring agent is connected and issues aCritical condition whenever it is not. Its formula is as follows:
If
Application_Server_Status.Status equals 0
then
the situation J2EENotConnected is true.
J2EEOutofHeapSpace Monitors the heap allocation status and issues a Criticalcondition whenever heap space is exhausted. The formula is as follows:
If
Allocation_Failure.Heap_Status equals 1
Chapter 4. ITCAM Agent for J2EE 529

then
the situation J2EEOutofHeapSpace is true.
J2EEHighResponseTime Monitors the average request response time and issues aCritical condition whenever that time exceeds 2 seconds. The formula is as follows:
If
Request_Times_and_Rates.Average_Request_Response_Time is greater than 2000
then
the situation J2EEHighResponseTime is true.
J2EEHighCPUPercentUsed Monitors the percentage of the CPU being consumedand issues a Critical condition whenever that time exceeds 80%. The formula is asfollows:
If
Application_Server.CPU_Used_Percent is greater than 80
then
the situation J2EEHighCPUPercentUsed is true.
J2EEHighGCTimePercent Monitors the percentage of time being spent by thegarbage collector and issues a Critical condition whenever that time exceeds 80%.The formula is as follows:
If
Garbage_Collection_Analysis.Real_Time_Percent is greater than 80
then
the situation J2EEHighGCTimePercent is true.
J2EEAppDiscovered monitors J2EE applications deployed in the application serverand issues an Informational alert when a new application is discovered. Themonitoring agent checks for new applications each time when it connects to thedata collector or when an application is deployed when the data collector isalready active. The J2SE application server does not support this situation. Theformula is:
If
Application_Monitoring_Configuration.Monitoring_Status equals 0
then
the situation J2EEAppDiscovered is true.
530 ITCAM Agents for WebSphere Applications, J2EE, and HTTP Servers: User Guide

The predefined Take Action command Start_Baselining associated with theJ2EEAppDiscovered situation enables you to automate the baselining of newlydiscovered applications.
J2EEAppHealthGood monitors the overall application health and issues anInformational alert when application health is good. The J2SE application serverdoes not support this situation. The formula is:
If
Application_Health_Status.Application_Health equals 1
then
the situation J2EEAppHealthGood is true.
The predefined Take Action command Set_Appliction_Monitoring associated withthe J2EEAppHealthGood situation lowers the request monitoring level forapplications generated alert, and reduces the monitoring overhead.
J2EEAppHealthFair monitors the overall application health and issues a warningalert when application health is fair. The J2SE application server does not supportthis situation. The formula is:
If
Application_Health_Status.Application_Health equals 2
then
the situation J2EEAppHealthFair is true.
The predefined Take Action command Set_Appliction_Monitoring associated withJ2EEAppHealthFair situation raises the request monitoring level for applicationsgenerated alert, and enables you to collect detailed performance data that helps topinpoint a bottleneck down to particular application tiers.
J2EEAppHealthBad monitors the overall application health and issues a Criticalalert when the application health is bad. The J2SE application server does notsupport this situation. The formula is:
If
Application_Health_Status.Web_Tier_Health equals 3
then
the situation J2EEAppHealthBad is true.
The predefined Take Action command Set_Appliction_Monitoring associated withJ2EEAppHealthBad situation increases the request monitoring rate for applicationsgenerated alert, and enables you to collect more detailed performance data thathelps to collect the most precise data about each application tier health level.
For additional information, see:
Chapter 4. ITCAM Agent for J2EE 531

“Attributes for ITCAM Agent for J2EE” on page 456
Take Action commands for ITCAM Agent for J2EEUsing the Take Action feature, your interactive Tivoli Enterprise Portal users canenter a command that stops or starts a process at any system in your networkwhere one or more Tivoli Enterprise Monitoring Agents are installed. With theITCAM Agent for J2EE Take Action commands, you can use the portal interface tostart, stop, or recycle a J2EE application server or to control the level of monitoringfor the current server.
You can start a Take Action command from a workspace, from the Navigator, froma situation that you create, in an improvised mode, or by recalling a saved TakeAction command. For details on using these general features, see the online helpfor Tivoli Enterprise Portal.
Enable_Auto_Threshold: set threshold parametersUse the Enable_Auto_Threshold Take Action to set automatic threshold parametersand remove any overrides of the thresholds.
The baselining process supplies statistical information about request responsetimes. ITCAM interprets this information to set automatic thresholds. Severalparameters control this interpretation.
The default values for these parameters are sufficient for most cases. However, ifthe thresholds are not adequate and the baselining process was run recently, youmight have to change these parameters. If there are many false alarms or warnings,you must raise the bad or fair threshold. If alarms or warnings are not triggeredwhen needed, you must lower the bad or fair threshold.
Although you can change the parameters for the entire application or for allrequests of a given type, usually you do this only for an individual request.v To set threshold parameters for all requests in the application, select this
application in the “Application Health Summary workspace” on page 425 or“Application Registry workspace” on page 426, and select theEnable_Auto_Threshold take action command.
v To set threshold parameters for all requests of a given type in the application,select this request type in the Application Request Configuration table of the“Selected Application - Configuration workspace” on page 446, and select theEnable_Auto_Threshold take action command.
v To set threshold parameters for an individual request, select this request in the“Selected Request - Baseline workspace” on page 445, and select theEnable_Auto_Threshold take action command.
In the “Selected Request - Baseline workspace” on page 445, when you select a linerepresenting a request, you can see the bar charts representing statistical data forthis request. This data was gathered during the baselining process. Colors on thebar charts show the way in which the parameters are applied. You can change theparameters using the Enable_Auto_Threshold take action command, andimmediately see the effects on the bar charts.
532 ITCAM Agents for WebSphere Applications, J2EE, and HTTP Servers: User Guide

The Response Times Distribution chart shows the statistical distribution ofresponse times for this request. To the left are smaller (faster) response times; tothe right, larger (slower) ones. The height of every bar shows the percentage ofrequests that had the indicated response time during the baselining period.
Some bars represent bigger time intervals than others; more bars are devoted tomost common response times. For example, if the maximum encountered time is1000 ms but most response times are 300 - 500 ms, then the first bar might be 0 -50 ms, but there can also be bars like 305 - 310 ms and 400 - 402 ms.
The blue bars show the zone into which the "typical" response times for thisapplication fall. The green bars show response times that are not "typical", but arebelow the fair threshold. Response times above the fair threshold but below thebad threshold are shown as yellow bars; for those above the bad threshold, thebars are red.
Use the Enable_Auto_Threshold take action command to set the parameters thataffect both the position of the "typical" zone and the way the thresholds arederived from this zone.
For more information about how the bar chart and parameters work, see“Threshold calculation detail” on page 541.
The Level2 Delays Distribution chart shows the distribution of time spent in"nested requests" within the requests that had this response time range. Each barrepresents a response time of the top-level request (the same as on the top chart).Within this bar, colored sections show how much time is spent within nestedrequests of different types; the color legend is shown on the bar. ITCAM uses thisdistribution within the selection zone (that is for typical overall request types) towork out the average share of time taken by each nested request type. When anerror or warning arises, ITCAM checks which of the request types takes more thanits usual share of time. Based on this, it displays whether the likely cause is theapplication, backend, or server.
Command syntax
YN:Enable_Auto_Threshold App_Id Request_Id Auto_Threshold_PercentAuto_Threshold_Deviation Auto_Threshold_Fair_ProjectionAuto_Threshold_Bad_Projection Use_Default
Chapter 4. ITCAM Agent for J2EE 533

Where:
App_IdThe application ID, automatically assigned in the portal from the selectioncontext when Take Action was invoked.
Request_IdThe request ID, automatically assigned in the portal from the selection contextwhen Take Action was invoked.
Auto_Threshold_PercentAuto_Threshold_Deviation
ITCAM uses these two parameters to calculate the borders of the "typicalzone". See “Threshold calculation detail” on page 541.
Auto_Threshold_Fair_ProjectionThis determines the position of the fair threshold. Increase this parameter toincrease the fair threshold; decrease the parameter to decrease the fairthreshold. If the parameter is set to 100, the fair threshold is at the right borderof the selection zone. For details, see “Threshold calculation detail” on page541. The bad threshold is not affected.
Auto_Threshold_Bad_ProjectionThis determines the position of the bad threshold. Increase this parameter toincrease the bad threshold; decrease the parameter to decrease the badthreshold. If the parameter is set to 100, the bad threshold is at the right borderof the selection zone. For details, see “Threshold calculation detail” on page541. The fair threshold is not affected.
Use_DefaultIf set to 0, the auto threshold setting is modified according to the otherparameters in this Take Action. If set to 1, the value of the auto thresholdsettings for this request is taken from the "parent": the values that have beenset for the request type, for the entire application, or the ITCAM defaultvalues.
Example: YN:Enable_Auto_Threshold 1 12 50 200 150 300 0
Override_Auto_Threshold: override threshold valuesUse the Override_Auto_Threshold Take Action to override fair and bad responsetime threshold values for any request in the application. In this case, while thebaselining statistical data is still preserved, ITCAM does not use automaticallycalculated thresholds.
Do not override threshold values unless you have analyzed the applicationperformance in detail (or were instructed to override threshold values by IBMLevel 3 Support). To adjust threshold values without manually overriding them,see “Enable_Auto_Threshold: set threshold parameters” on page 532.
To remove an override, select a request in the “Selected Request - Baselineworkspace” on page 445, and select the Enable_Auto_Threshold takes actioncommand. Leave all parameters as they are, in order to use the same autothreshold parameters as were used before the override. If you need to change theseparameters, see “Enable_Auto_Threshold: set threshold parameters” on page 532.
534 ITCAM Agents for WebSphere Applications, J2EE, and HTTP Servers: User Guide

Command syntax
YN:Override_Auto_Threshold App_Id Request_Id Fair_Response_ThresholdBad_Response_Threshold
Parameters:
App_IdThe application ID, automatically assigned in the portal from the selectioncontext when Take Action was invoked.
Request_IdThe request ID, automatically assigned in the portal from the selection contextwhen Take Action was invoked.
Fair_Response_ThresholdThe fair response time threshold, in milliseconds.
Bad_Response_ThresholdThe bad response time threshold, in milliseconds.
Recycle_Application_Server: Recycle a J2EE applicationUse the Recycle_Application_Server command to stop and then restart anapplication server. The J2SE application server does not support this take actioncommand.
Command syntax
If invoked from the J2EE Agent entry on the Navigator, the syntax is:
YJ:CycleAppSrv server_name user password
Where server_name is the J2EE server name, and the user and password are yourown J2EE Application Server identifiers set by the J2EE administrative console(required only if J2EE global security is enabled.)
If, however, this command is invoked from a subnode of the J2EE Agent entry onthe Navigator, the syntax is:
YJ: CycleAppSvr user password
Where user and password are your own J2EE Application Server identifiers set bythe J2EE administrative console; these are required only if J2EE global security isenabled. (In this case, server_name is not required because the subnode name-thatis, the server name is already known.)
Remove_J2EE_Application: Remove a J2EE ApplicationYou can use the Remove_J2EE_Application command to remove an applicationthat is in an undeployed state.
Command syntax
If invoked from the WebSphere Agent entry on the Navigator, the syntax is:
YN:Remove Application &App_Id
where &App_Id is the application ID.
Chapter 4. ITCAM Agent for J2EE 535

If this command is invoked from a subnode of the J2EE Agent entry on theNavigator, the syntax is:
YN:Remove Application App_Id
In this case you must enter the value for the App_Id where App_Id is theapplication ID.
Remove_J2EE_SubNode: Remove an inactive J2EEapplication server
Use the Remove_SubNode command to remove a J2EE application server that isno longer active from the Navigator tree.
Command syntax
If invoked from the J2EE Agent entry on the Navigator, the syntax is:
YJ:RemSubNode server_name
where server_name is the J2EE server (the subnode name).
If, however, this command is invoked from a subnode of the J2EE Agent entry onthe Navigator, the syntax is:
YJ:RemSubNode
In this case, the server_name value is not required because the subnode name(server name) is already known.
Set_Application_Monitoring: Set monitoringUse the Set_Application_Monitoring command to set monitoring of the J2EEapplication. The J2SE application server does not support this take actioncommand.
Command syntax
YJ:Set_Application_Monitoring App_Id Monitoring_EnabledRequest_Data_Monitoring_Level Request_Data_Sampling_Rate
where App_Id is the application ID which is automatically assigned in the portalfrom the selection context when Take Action was invoked.
Monitoring_Enabled is a Boolean value and the valid values are 0 and 1. It defineswhether monitoring agent application dashboard monitoring feature is enabled forthe given application.
Request_Data_Monitoring_Level is an integer value that defines custom requestmonitoring level for the given application. Valid values are 0 (DISABLE), 1(LEVEL1), and 2 (LEVEL2). This level overrides any level that the user might setfor the entire monitoring agent.
Request_Data_Sampling_Rate is an integer value that defines custom requestmonitoring rate (in percentage) for the given application. Valid values range from 0to 100.
536 ITCAM Agents for WebSphere Applications, J2EE, and HTTP Servers: User Guide

Set_Completion_Thresholds: Set completion thresholdsUse the Set_Completion_Thresholds command to define the thresholds of the errorrate for the J2EE application. The J2SE application server does not support thistake action command.
Command syntax
YJ:Set_Completion_Thresholds App_Id Fair_Completion_Rate Bad_Completion_Rate
where App_Id is the application ID which is automatically assigned in the portalfrom the selection context when Take Action was invoked.
Fair_Completion_Rate and Bad_Completion_Rate are the values in percentage thatdefine thresholds for fair and bad requests completion rates.
Set_Request_Sampling_Rate: Set the sampling rate forrequest data
Use the Set_Request_Sampling_Rate command to define the percentage of requeststo monitor.
Command syntax
YJ:SetRequestSamplingRate percent
where percent is the percentage of requests you want sampled. Specify a value inthe range 1 - 100.
Start_Application_Server: Start a J2EE application serverUse the Start_Application_Server command to start a J2EE application server. TheJ2SE application server does not support this take action command.
Command syntax
If invoked from the J2EE Agent entry on the Navigator, the syntax is:
YJ:StartAppSrv server_name user password
where server_name is the J2EE server name, and user and password are your ownJ2EE Application Server identifiers set by the J2EE administrative console (requiredonly if J2EE global security is enabled).
If, however, this command is invoked from a subnode of the J2EE Agent entry onthe Navigator, the syntax is:
YJ:StartAppSrv user password
where user and password are your own J2EE Application Server identifiers set bythe J2EE administrative console; these are required only if J2EE global security isenabled. (In this case, server_name is not required because the subnode name-that isthe server name-is already known.
Start_Baselining: Start the baselining processITCAM can run a baselining process for every application. During this process,which runs for a preset period, the data collector collects statistical data on metric
Chapter 4. ITCAM Agent for J2EE 537

values for a given period. Based on this statistical data, the monitoring agent canautomatically set the fair and bad thresholds, as well as the typical breakdown ofresponse times for nested requests. Use the Start Baselining Take Action commandto start the baselining process.
When ITCAM begins monitoring an application for the first time, it automaticallystarts this process for the application. However, with time, average response timescan change because of configuration, load pattern, database size, and other issues.You can manually start the baselining process again to take these changes intoaccount. You can also use IBM Tivoli Monitoring (ITM) policies and workflowmanagement to run the baselining process every few months.
As soon as you take the Start Baselining action, the baselining process begins. Thethresholds are updated when either the Period or the Update Interval passes.
While the baselining process is running, you can trigger a baseline update toimmediately set the thresholds based on the information collected so far.
Command syntax
YN:Start_Baselining App_Id Period Update_Interval Run_Clean
Where:
App_IdThe application ID, automatically assigned in the portal from the selectioncontext when Take Action was invoked.
PeriodThe time for which the baselining process runs. The data collector collects thenecessary statistical information for this entire period. When ITCAM starts thebaselining process automatically, it sets the period to seven days. The format isddd/hh:mm:ss.
Update_IntervalIf you set this parameter to a time interval, ITCAM updates the thresholdsaccording to the information already collected every time this interval passes.For example, when ITCAM starts the baselining process automatically, it setsthe update interval to 1 hour. During the seven days that the initial baseliningruns, every hour the thresholds are updated according to the statistical datacollected so far (for all request types where at least one request was receivedduring the baselining process). The format is ddd/hh:mm:ss.
Run_CleanSet to either 0 or 1. If set to 0, statistical data collected in any previousbaselining for the same requests are kept and "amalgamated" with the newdata; if set to 1, only the new data is used for setting the thresholds. Normally,you set this to 1.
Note: when this Take Action command is selected for a node representing a z/OSservant region, applies to all servant regions in the same managed system (IBMWebSphere Application Server instance).
538 ITCAM Agents for WebSphere Applications, J2EE, and HTTP Servers: User Guide

Start_GC_Monitoring: Begin reporting garbage-collection dataUse the Start_GC_Monitoring command to activate the display ofgarbage-collection statistics. This setting is on top of the J2EE Application ServerVerbose Garbage Collection value, which must also be active for garbage-collectiondata to be reported.
Command syntax
YJ:StartGCMonitor
Start_Request_Monitoring : Begin reporting request dataUse the Start_Request_Monitoring command to activate the display of request data.
Command syntax
YJ:StartRequestMonitor level
where level is the resource-data collection level, either Level1 or Level2. When thecollection level is set to Level1, only edge request data-such as servlets andJSPs-are collected; when set to Level2, nested request data (such as JDBC and JMSrequests) are also collected.
Important: You can set the monitoring level for any operation separately, using the“Set_Application_Monitoring: Set monitoring” on page 536 Take Action command.The monitoring level from the Start_Request_Monitoring Take Action command isapplied by default to newly discovered applications.
Start_Resource_Monitoring: Begin reporting PMI dataUse the Start_Resource_Monitoring command to activate the display of resource(that is, PMI) data. This setting is on top of the J2EE Application Server PMIinstrumentation levels, which must also be set for resource data to be reported.
Command syntax
YJ:StartResourceMonitor
Stop_Application_Server: Stop a J2EE application serverUse the Stop_Application_Sever command to stop an application server. The J2SEapplication server does not support this take action command.
Command syntax
If invoked from the J2EE Agent entry on the Navigator, the syntax is:
YJ:StopAppSvr server_name user password
where server_name is the J2EE server name, and user and password are your ownJ2EE Application Server identifiers set by the J2EE administrative console (requiredonly if J2EE global security is enabled).
If, however, this command is invoked from a subnode of the J2EE Agent entry onthe Navigator, the syntax is:
YJ:StopAppSvr user password
Chapter 4. ITCAM Agent for J2EE 539

where user and password are your own J2EE Application Server identifiers set bythe J2EE administrative console; these are required only if J2EE global security isenabled. (In this case, server_name is not required because the subnode name-thatis, the server name-is already known.)
Stop_Baselining: stop the baselining processUse the Stop_Baselining Take Action command to immediately stop the baseliningprocess for an application, and recalculate the thresholds based on the request dataavailable up to this point.
Normally you do not have to perform this action. To recalculate the thresholdsbased on the request data available up to this point, without stopping thebaselining process, see “Update_Baseline: trigger a baseline update.”
Command syntax
YN:Stop_Baselining App_Id
Where:
App_IdThe application ID, automatically assigned in the portal from the selectioncontext when Take Action was invoked.
Note: when this Take Action is selected for a node representing a z/OS servantregion, it applies to all servant regions in the same managed system (IBMWebSphere Application Server instance).
Stop_GC_Monitoring: Stop reporting garbage-collection dataUse the Stop_GC_Monitoring command to end the display of garbage-collectionstatistics.
Command syntax
YJ:StopGCMonitor
Stop_Request_Monitoring: Stop reporting request dataUse the Stop_Request_Monitoring command to end the display of request data.
Command syntax
YJ:StopRequestMonitor
Stop_Resource_Monitoring: Stop reporting PMI dataUse the Stop_Resource_Monitoring command to end the display of resource (thatis, PMI) data.
Command syntax
YJ:StopResourceMonitor
Update_Baseline: trigger a baseline updateIf the baselining process is running, the thresholds are set automatically wheneither the Period or the Update Interval passes. For the initial baselining process,
540 ITCAM Agents for WebSphere Applications, J2EE, and HTTP Servers: User Guide

the first automatic update happens after one hour. With the Update_Baseline TakeAction command, you can force ITCAM to update the thresholds immediately,based on the information collected so far. This can be useful if you do not want towait for the periodic automatic update. Once the automatic update time comes, thethreshold is updated again.
If a baselining process is not running for the application, an error is raised. If norequests of a given request type have been received since the baselining processhas started, the update does not affect this request type.
Command syntax
YN:Update_Baseline App_Id
Where:
App_IdThe application ID, automatically assigned in the portal from the selectioncontext when Take Action was invoked.
Note: When this Take Action is selected for a node representing a z/OS servantregion, it applies to all servant regions in the same managed system (IBMWebSphere Application Server instance).
Threshold calculation detailIf you want to set parameters that affect the calculation of the automatic responsetime thresholds, you might need to know the details of this calculation.
ITCAM processes the baselining statistical data and applies the auto thresholdparameters in the following way. The parameters are set in theEnable_Auto_Threshold take action command, see “Enable_Auto_Threshold: setthreshold parameters” on page 532.1. The response time results are sorted into up to 64 "buckets", from zero to the
maximum response time encountered for this request. The buckets do notrepresent equal time intervals; for response time regions where most of the"hits" fall, the buckets represent smaller intervals. For example, if the maximumencountered time is 1000 ms but most response times are 300 - 500 ms, then thefirst bucket might be 0 - 50 ms, but there can also be buckets representingresponse times of 305 - 310 ms and 400 - 402 ms. ITCAM distributes the bucketborders so that the largest number of hits in any one bucket are not more thanthree times the number of hits in the smallest bucket.ITCAM calculates the percentage of the total amount of requests that fall intoeach response time bucket, and divides it by the time interval widthrepresented by the bucket. This is shown on the Response Times Distributionbar chart in the “Selected Request - Baseline workspace” on page 445.
Chapter 4. ITCAM Agent for J2EE 541

Each bar represents a bucket. The bar height shows the percentage of therequests in this bucket. All the subsequent calculations are rounded up tobuckets.
2. ITCAM determines the selection zone, which contains the "typical" responsetime values. This zone is represented by the blue bars on the chart.ITCAM finds the response time interval (left border L to right border R) wherethe following factors are true:v The percentage of hits that fall into this interval is no less than the
Auto_Threshold_Percent parameter.v The spread of the time interval, calculated as (R/L)*100 - 100, is not greater
than the Auto_Threshold_Deviation parameter.
Important: The Auto_Threshold_Deviation parameter does not denote thestatistical definition of deviation.
If several zones match these criteria, ITCAM chooses the one where thefollowing value is the greatest: S/(R-L), where S is the total number of hits thatfell into this zone.If a zone where both requirements are true cannot be found at all, ITCAM firstdetermines the interval where the percentage of hits is not less than theAuto_Threshold_Percent parameter while the spread is as little as possible.Then, within this interval, it finds a zone where the spread is not greater thanthe Auto_Threshold_Deviation parameter and the percentage of hits is as largeas possible.ITCAM determines the typical nested request times from the nested requesttimes in this zone, shown on the Level2 Delays Distribution chart.
3. Finally, ITCAM calculates the thresholds.The fair threshold is determined using the left and right borders of the selectionzone and the Auto_Threshold_Fair_Projection parameter:F = L + ((R-L) * Auto_Threshold_Fair_Projection / 100)The bad threshold is calculated in the same way, using theAuto_Threshold_Bad_Projection parameter:B = L + ((R-L) * Auto_Threshold_Bad_Projection / 100)Example: the left border of the selection zone can be L=1450 ms, and the rightborder R=3000 ms. By default, Auto_Threshold_Fair_Projection=150, andAuto_Threshold_Bad_Projection=300. In this case:v The fair response threshold is F = 1450 + ((3000-1450) * 150 / 100) = 3775 ms
542 ITCAM Agents for WebSphere Applications, J2EE, and HTTP Servers: User Guide

v The bad response threshold is B = 1450 + ((3000-1450) * 300 / 100) = 6100 ms
Glossary for ITCAM Agent for J2EEA
administrative console A graphical interface that guides the user through systemsadministration tasks such as deployment, configuration, monitoring, starting, andstopping applications, services, and resources.
C
connection pool A group of host connections that are maintained in an initializedstate, ready to be used without having to create and initialize them.
CPU Central Processing Unit. The part of the computer that controls theinterpretation and execution of instructions.
CTG CICS Transaction Gateway. CTG integrates the J2EE Application Serverapplications of your site with key mature business systems running on CICSservers. CTG integrates middle-tier application servers with CICS by providing amultiuser gateway that supports Web applications written in Java, C/C++, VisualBasic, and COBOL. CTG supports three programming interfaces: the External CallInterface (ECI), the External Presentation Interface (EPI), and the External SecurityInterface (ESI). The latest version of CTG implements the J2EE ConnectorArchitecture (JCA), which allows enterprise Java technology to exploit CICSapplications.
D
data sources Data pertaining to JDBC data streams. These are logical connectionsto database subsystems.
DCE Distributed Computing Environment. A specification from the Open SoftwareFoundation (OSF) that supports remote function execution across a network. J2EEApplication Server uses DCE to provide certain types of security, for example,authentication of tokens, tickets, or credentials in an untrusted network.
design patterns Written narratives that define a recurring problem, outline asolution, and describe the tradeoffs involved in implementing that solution. Inobject-oriented programming environments like Java, a design pattern alsodescribes certain objects and object classes to be used when designing such asolution.
DHCP Dynamic Host Configuration Protocol. A communications protocol that letsnetwork administrators centrally manage the assignment of Internet Protocol (IP)addresses across an organization network. Without DHCP, each computer IPaddress must be entered manually at each computer; if computers move to anotherlocation in another part of the network, a new IP address must be chosen. DHCPlets a network administrator supervise and distribute IP addresses from a centralpoint and automatically sends a new IP address when a computer is plugged intoa different location in the network.
dynamic cache A consolidation of several caching activities, including servlets,Web services, and J2EE commands into one service where these activities worktogether to improve performance and share configuration parameters.
Chapter 4. ITCAM Agent for J2EE 543

E
EJB Enterprise Java Bean. A component architecture for the development anddeployment of object-oriented, distributed, enterprise-level applications.Applications written using the Enterprise JavaBeans architecture are scalable,transactional, multi-user, and secure.
EJB module A software unit that consists of one or more enterprise beans and anEJB deployment descriptor.
G
garbage collection A facility of the JVM that reallocates and frees up memory lostwhen objects are created and later destroyed. Garbage collection usually occurswhen insufficient heap space is available for allocating new objects, although youcan trigger it manually by invoking the System.gc method.
Garbage collection can be expensive since it involves identifying all theunreferenced objects, removing them from the heap, and then possibly compactingthe heap.
H
heap A memory storage area known formally as the System Resources area thatstores system information about running applications. The main storage area usedfor allocating Java classes and object instances, as well as executable code. Theallocation of objects on the heap creates a live or active object. The object exists aslong as the JVM maintains a pointer to it; when all references to an object cease toexist, it is subject to garbage collection.
hover help A form of online help that can be viewed by moving a cursor over aGUI item such as an icon or field.
HTTP Hypertext Transfer Protocol. A suite of protocols for the Internet thattransfer and display hypertext documents.
HTTP sessions Data related to sessions of specific World Wide Web browsers.
I
IIOP Internet Inter-ORB Protocol. A protocol that distributed programs written indifferent programming languages can use to communicate over the Internet. IIOPis a part of the Common Object Request Broker Architecture (CORBA). IIOP isbased on the client/server computing model, in which a client program makesrequests of a server program that waits to respond to client requests. With IIOP,you can write client programs that communicate with the existing server programsof your site wherever they are located. You can do this without having tounderstand anything about the server other than the service it performs and itsaddress (called the Interoperable Object Reference, IOR, which comprises theserver port number and IP address).
instrumentation The process of modifying program code so that the time it takesthe code to run, along with other statistics, can be measured. These modificationsinsert hooks into these Java methods so that the real time and CPU time spentexecuting the methods can be measured. Instrumentation is key to certain
544 ITCAM Agents for WebSphere Applications, J2EE, and HTTP Servers: User Guide

data-collection features (such as lock analysis) of IBM Tivoli Composite ApplicationManager for Application Diagnostics Agent for J2EE.
IBM Tivoli Monitoring platform The software architecture and foundation thatsupport the development and operations of Tivoli Enterprise Portal and its TivoliEnterprise Monitoring Agents.
J
J2EE Java 2 Platform, Enterprise Edition. An environment for developing anddeploying enterprise applications using the Java language. The J2EE platformconsists of a set of services, application programming interfaces (APIs), andprotocols that provide the functions needed for developing multi-tiered, Web-basedapplications.
JAR file A Java archive file, which is a compressed file containing many class filesalong with their directory structure.
JavaBean The Java implementation of component-based software architecture,which defines how small, tested software entities called components can beintegrated to build complete software solutions (called containers).
JCA J2EE Connector Architecture. A template for writing your own connectors.The template is a binding between a J2EE application server and a backendenterprise information system (EIS) or data repository such as CICS, IMS, or DB2.
JDBC Java Database Connectivity. An application programming interface (API) forconnecting Java programs to the data in a relational database. With this API, youcan encode data requests in Structured Query Language (SQL) that JDBC thenpasses to the database manager for interpretation and processing.
JMS Java Message Service. A programming interface that connects Java programsto middleware messaging applications, for example, J2EE MQ.
JMX Java Management Extensions. A standard technology for management andmonitoring of Java applications and Java environments that defines architecture,application programming interfaces (APIs), and services for application andnetwork management. JMX provides tools for building distributed, Web-basedsolutions for managing and monitoring Java devices and applications.
A JMX agent is an MBean container.
JNDI Java Naming and Directory Interface. A programming interface that connectsJava applications to naming and directory servers such as LDAP.
JSP Java server page. A Web page that specifies one or more servlets whoseexecution on the Web server modifies the page content or appearance before it ispresented to the user.
JTA Java Transaction API. An application programming interface developed by SunMicrosystems that specifies standard Java interfaces between a transaction manager(such as Tuxedo) and other players in a distributed transaction system: theresource manager, the application server, the transactional applications, and oftenthe database manager as well.
Chapter 4. ITCAM Agent for J2EE 545

JVM Java virtual machine. A software implementation of a central processing unit(CPU) that runs Java applets and applications. The JVM provides a softwareexecution engine that safely and compatibly executes the byte codes in Java classfiles on various microprocessors, whether embedded in a computer or in anotherelectronic device.
JVMPI Java Virtual Machine Profiling Interface. An experimental interface thatprovides profiling hooks into the Java virtual machine. This interface supportstwo-way function calls between the JVM and a profiler agent: the virtual machinenotifies the agent of various events, and the agent issues requests for controlinformation.
K
Kerberos A security system from the Massachusetts Institute of Technology thatprovides security services for networking.
L
LDAP Lightweight Directory Access Protocol. A protocol that uses TCP/IP toaccess directories. Applications can use these directories for storing common dataand for retrieving data. For example, applications can use LDAP to access suchinformation as email address, service configuration parameters, or public keys.
lock A semaphore created through the use of the Java synchronized keyword thatprevents simultaneous access to a Java object or section of code.
M
MBeans Managed Beans. A set of standard instrumentation methods for use inJava programs and by Java management applications (such as IBM TivoliComposite Application Manager for Application Diagnostics Agent for J2EE) thatallows monitoring and management of Java-based applications. An MBean is aJavaBean that represents a JMX-manageable resource.
monitor 1) A transaction environment for maintaining large quantities of data in aconsistent state and that controls which users and clients can access data throughauthorized servers. 2) A programming primitive created so multiple programthreads can share the same resource (such as an object). A program creates amonitor for a given resource by requesting it from the system; the system returns aunique ID for that monitor. After that, any thread needing the resource must usethe monitor to lock the resource while the thread is using it. If the monitor isalready locked, a thread requesting the resource is queued by the system and thengiven control when the monitor becomes unlocked. Also called a mutex.
MVC The Model/View/Controller design pattern is based on the separation of theapplication into three objects: the user interface ("view"), the logical structure of thedata the application requires ("model"), and the user commands that change theview or the model ("controller"). Design patterns themselves are written narrativesthat define a recurring problem, outline a solution, and describe the tradeoffsinvolved in implementing that solution (in object-oriented programmingenvironments like Java, a design pattern also describes certain objects and objectclasses to be used when creating such a solution).
546 ITCAM Agents for WebSphere Applications, J2EE, and HTTP Servers: User Guide

N
node Any managed system, such as a J2EE application server, that the TivoliEnterprise Portal is monitoring. A node can also be a managed system of subnodesbeing managed under a primary node.
O
OLT Object Level Trace. A tool for testing distributed applications that include agraphical trace facility and a remote debugger.
ORB Object Request Broker. In object-oriented programming, software that servesas an intermediary by transparently enabling objects to exchange requests andresponses.
P
PMI Performance Monitoring Infrastructure. The application programminginterface (API) that IBM provides for extracting J2EE Application Serverperformance data. PMI must be enabled and the appropriate instrumentation levelsset for the Tivoli Enterprise Monitoring Agent to extract PMI data and populatecertain workspaces. PMI runs as an interface to JMX.
portal A Web-based application that commonly provides personalization, singlesignon, and content aggregation from different sources, and hosts the presentationlayer of Information Systems (IS). Portals are becoming the next-generationdesktop, delivering e-business applications over the Web to many types of clientdevices.
portlet A Java technology-based Web component, managed by a portlet container,that process requests and generates dynamic content. Portlets are used by portalsas pluggable user interface components that provide a presentation layer to variousheterogeneous Enterprise Information Systems (EIS) or Information Systems (IS).
R
request The entry point into an application whose processing or response timedirectly affects the response time the end user perceives. In IBM Tivoli CompositeApplication Manager for Application Diagnostics Agent for J2EE, a request is aservlet, JSP, or EJB method. Also called a transaction.
request analysis A configuration technique for a request (that is, a transaction)within J2EE Application Server that allows you to see how often the request runsand what factors about the request degrade its performance. Request analysisinvolves collecting and aggregating request data on each request that runs. Itsprimary purpose is to report on requests running in the application server, howoften they run, their response time, and what is causing performance degradation.
Request analysis works by dynamic object code instrumentation, which modifiesthe Java object code for the application' s classes as they are being loaded into theJVM.
resource adapter An implementation of the J2EE Connector ArchitectureSpecification that provides applications with access to resources outside of theserver or provides server applications with access to an Enterprise InformationSystem (EIS). A resource adapter can provide applications access to resources such
Chapter 4. ITCAM Agent for J2EE 547

as DB2, CICS, SAP, and PeopleSoft. It can provide an EIS with the ability tocommunicate with message-driven beans configured on the server. A resourceadapter is implemented in a resource adapter archive file, which has an extensionof .rar. A resource adapter can be provided as a stand-alone adapter or as part ofan application, in which case it is referred to as an embedded adapter.
RMI Remote Method Invocation. A Java standard from Sun Microsystems thatperforms a remote procedure call (RPC) to allow Java objects stored in the networkto be accessed remotely in a client/server environment.
RPC Remote Procedure Call. A protocol based on the Distributed ComputingEnvironment (DCE) of the Open Software Foundation. DCE allows one program torequest services from a program running on another computer in a network. (Aprocedure call is also known as a function call or a subroutine call.) RPC uses theclient/server model: the requesting program is the client, and the respondingprogram is the server. As with a local procedure call, an RPC is a synchronousoperation: the requesting program is suspended until the remote procedure returnsits results.
S
servlet A Java application that runs in an application server or Web server, andthat provides server-side processing.
session A series of requests to a servlet that originate from the same user at thesame browser. Sessions allow applications running in a Web container to trackindividual users.
signature The name of an operation or method and its parameters.
SSL Secure Sockets Layer. A security protocol for communication privacy toprovide secure client-server conversations.
struts A widely used framework for developing servlet- or JSP-based Webapplications that is distributed as open source by the Apache Jakarta Project. Strutsencourages application architectures based on the Model two approach, a variationof the Model-View-Controller (MVC) design paradigm.
T
thread A dispatchable unit of work.
thread pool The threads that are being used by or are available to a computerprogram.
transaction A single execution of a workload.
U
URI Uniform Resource Identifier. An identifier for a point of content on theInternet, be it a page of text, a video or sound clip, a still or animated image, or aprogram. The most common form of URI is the Web page address, which is aparticular form of URI called a Universal Resource Locator (URL). A URI typicallydescribes the mechanism used to access the resource, the computer that houses theresource, and the name of the resource (such as a file name) on that computer.
548 ITCAM Agents for WebSphere Applications, J2EE, and HTTP Servers: User Guide

URL Universal Resource Locator. The unique address for a file accessible via theInternet. Such a file might be a Web page (usually the home page), an image file,or a program such as a Java applet or servlet. The URL comprises the protocolused to access the file, a domain name that identifies a specific computer on theInternet, and a path name that specifies that file location on that computer.
W
Web applications The runtime environment for dynamic Web applications. A J2EEWeb application server implements the services of the J2EE standard. It providescommunications, resource management, security, transaction management, andpersistence capabilities for Web applications. It also typically includes anadministration interface for managing the server and deployed applications.
Web container A special J2EE container that manages Web applications in a J2EEarchitecture. A Web container specifies a runtime environment for Webcomponents, including security, concurrency, life cycle management, transaction,deployment, and other services; it also enables a Web application to access externalresources such as relational databases (via JDBC) and Enterprise Java Beans. A Webcontainer provides the same services as a JSP container and provides support formanaging Java Server Pages.
Every J2EE server contains at least one Web container.
Chapter 4. ITCAM Agent for J2EE 549

550 ITCAM Agents for WebSphere Applications, J2EE, and HTTP Servers: User Guide

Chapter 5. ITCAM Agent for HTTP Servers
IBM Tivoli Composite Application Manager Agent for HTTP Servers provides aSystems Management solution for the web servers for distributed platforms. UsingITCAM Agent for HTTP Servers, you can monitor multiple web servers running onthe same physical node.
The Tivoli Enterprise Monitoring Agent collects performance data using thefollowing methods:v Apache servers parse the config file to get the server name and collect data by
the module. The module handles all the HTTP requests.v Sun web servers collect data by polling SNMP service for web server statistics
and parsing web server configuration files to get information not provided bythe SNMP subagent.
Attributes within ITCAM Agent for HTTP Servers collect data about the innerworkings of a web server and performance information about user applicationsrunning under its control.
For additional usage information about this agent, see:v Workspacesv Attributesv Situationsv Take Action commands
Workspaces for ITCAM Agent for HTTP ServersAs part of the integration of IBM Tivoli Composite Application Manager Agent forHTTP Servers with the Tivoli Enterprise Portal, the workspaces show views ofmonitoring data that provide detailed current data about the web servers runningon the UNIX and Windows platforms of your site. In addition to reports andgraphs, a workspace can contain other views (that is, windows), such as a RequestRate - History view, or a Take Action view from which you can issue commands.
Several views of high-level information
Several workspaces provide high-level information to help you meet themonitoring and administrative needs of your site. These workspaces report onstatus and availability for both the web server administrative server and its webserver instances. You can use the workspaces to easily monitor the availability ofyour enterprise, the web servers, and web server instances.
Available Tivoli Enterprise Portal workspaces
For an overview of the organization of the available workspaces, see Organizationof the predefined workspaces.
Organization of the predefined workspacesThe IBM Tivoli Composite Application Manager Agent for HTTP Serversworkspaces for the Tivoli Enterprise Portal define data displays that display in theNavigator Physical view.
© Copyright IBM Corp. 2006, 2014 551

Workspace organization
The hierarchy levels shown in the Navigator depend upon the enterprisecustomization of the Tivoli Enterprise Portal. However, ITCAM Agent for HTTPServers does provide a set of predefined workspaces, which do not requirecustomization. The following list shows the order and hierarchy of the predefinedworkspaces provided by the ITCAM Agent for HTTP Servers Tivoli EnterpriseMonitoring Agent. It is a representation of how the predefined workspaces areorganized in the Navigator. For more detailed information about a workspace, clickits name in this list.
operating system [for example, Windows]v system [that is, nodename]
– “web server Agent workspace” on page 555- “Apache web server workspace”
v “Apache websites workspace” on page 553- “Sun Java System web server workspace” on page 554
v “Sun websites workspace” on page 554
For additional information, see: Attribute groups used by the predefinedworkspaces
Apache web server workspaceThis workspace shows the Apache web server information, including the summaryrates over all websites (virtual hosts).
This workspace displays data provided by the “Apache web server attributes” onpage 557.
The predefined workspace contains the following items:v Request Rate - History graph, which shows the historical rate at which HTTP
requests were made per secondv Server Failure Rate - History graph, which shows the historical rate at which
server internal errors occurred per minutev Transfer Rate - History graph, which shows the number of kilobytes received
and sent by the web server per secondv Failed Request Rate - History graph, which shows the historical number of failed
requests per minutev Server Summary report, which displays summarized information about the
Apache web server, including server status, request rate, kilobytes rate, andlogin rate
Accessing the Apache web server workspace
To access this workspace, complete the following steps:1. Within the Navigator, expand Windows Systems, Linux Systems, or UNIX
Systems, as appropriate for the node you are monitoring.2. Within the node list, expand the entry that corresponds to your node name.3. Within the node list of monitored applications, expand the list of web server
agents.4. Within the list of available agents, click the Apache Web Server entry of your
choice.
552 ITCAM Agents for WebSphere Applications, J2EE, and HTTP Servers: User Guide

For additional information, see:v Organization of the predefined workspacesv Attribute groups used by the predefined workspaces
Apache websites workspaceThis workspace shows the list of the websites (virtual hosts) that are configured forthe Apache web server along with their status. Clicking the link in the SelectedWeb Site view shows data for the selected website in the same workspace. Bydefault the website listed in first row in the websites table is presented in theApache websites workspace.
There are five views in the Apache websites workspace:v Selected Web Sitev Request Rate - Historyv Transfer Rate - Historyv Pages Failed Rate - Historyv Failed Logins Rate - History
The Selected Web Site view displays all the web sites by default. Where as the fourother views can only display the data for the first web site listed in the SelectedWeb Site view. This is a product limiataion.
This workspace displays data provided by the “Apache websites attributes” onpage 558.
The predefined workspace contains the following items:v Request Rate - History graph, which shows the historical rate at which HTTP
requests were made, per second, for the selected Apache websitev Transfer Rate - History graph, which shows the number of kilobytes, per second,
received, and sent by the selected web servicev Pages Failed Rate - History graph, which shows the number of requests per
minute that were not satisfied by the server because the requested documentwas not found or is forbidden. This rate applies to the collection interval for aselected Apache website
v Failed Login Rate - History graph, which shows the historical number of failedlogins per minute for the selected Apache website
v Websites report, which displays the status of each Apache websitev Selected website report, which displays aggregated information about all Apache
websites
Accessing the Apache websites workspace
To access this workspace, perform the following steps:1. Within the Navigator, expand Windows Systems, Linux Systems, or UNIX
Systems, as appropriate for the node you are monitoring.2. Within the node list, expand the entry that corresponds to your node name.3. Within the node list of monitored applications, expand the list of web server
agents.4. Within the list of available agents, expand the web server of your choice.
Chapter 5. ITCAM Agent for HTTP Servers 553

5. Within the list of available web server workspaces on that server, click theApache Web Sites entry. By default the website listed in first row in thewebsites table is presented in the Apache websites workspace.
Note:
For additional information, see:v Organization of the predefined workspacesv Attribute groups used by the predefined workspaces
Sun Java System web server workspaceThis workspace shows the Sun Java System web server information, including thesummary rates over all websites (virtual servers).
This workspace displays data provided by the “Sun web server attributes” on page560.
The predefined workspace contains the following items:v Requests per second - History graph, which shows the rate, per second, at which
requests have been processed by the virtual serverv Kilobytes per second - History graph, which shows the aggregated number of
kilobytes received and sent per secondv Server Error per minute graph, which shows the rate at which the number of
500-level (Server Error) responses issued (per minute) by the web server duringthe collection interval
v Connection Queue Count - Which shows the number of connections currently inthe web server connection queue
v Server Summary report, which displays the summarized information about theSun Java System web server
Accessing the Sun Java System web server workspace
To access this workspace, perform the following steps:1. Within the Navigator, expand Windows Systems, Linux Systems, or UNIX
Systems, as appropriate for the node you are monitoring.2. Within the node list, expand the entry that corresponds to your node name.3. Within the list of monitored applications on that node, expand the list of web
server agents.4. Within the list of available agents, click the Sun Java System Web Server entry
of your choice.
For additional information, see:v Organization of the predefined workspacesv Attribute groups used by the predefined workspaces
Sun websites workspaceThis workspace shows the list of the Sun websites (virtual servers) configured forthe server along with their status. Clicking the link in the website table shows datafor the selected website in the same workspace.
This workspace displays data provided by the “Sun websites attributes” on page563.
554 ITCAM Agents for WebSphere Applications, J2EE, and HTTP Servers: User Guide

The predefined workspace contains the following items:v Request per second - History graph, which shows the rate, per second, at which
requests have been processed by the serverv Pages not Found per minute - History graph, which shows the number, per
minute, of 404-level responses (Pages Not Found) issued by the virtual serverduring the collection interval
v Kilobytes per second - History graph, which shows the aggregated number ofkilobytes received and sent per second
v Failed Logins per minute - History graph, which shows the historical number of401-level responses (Failed Login) issued, per minute, by the virtual serverduring the collection interval
v Websites report, which displays the status of each Sun websitev Selected website report, which displays aggregated information about all the Sun
websites
Accessing the Sun websites workspace
To access this workspace, perform the following steps:1. Within the Navigator, expand Windows Systems, Linux Systems, or UNIX
Systems, as appropriate for the node you are monitoring.2. Within the node list, expand the entry that corresponds to your node name.3. Within the list of monitored applications on that node, expand the list of web
server agents.4. Within the list of available agents, expand the web server of your choice.5. Within the list of available web server workspaces on that server, click the Sun
websites entry.
For additional information, see:v Organization of the predefined workspacesv Attribute groups used by the predefined workspaces
web server Agent workspaceThis workspace shows the status on all monitored web servers and the web serveragent events.
This workspace displays data provided by both the “HTTP Servers Agent Eventsattributes” on page 566 and the “Web Servers Status attributes” on page 567.
The predefined workspace contains the following items:v Web Servers Summary report, which displays the overall status of web servers,
including server type, server name, server status, uptime, and process IDv Agent Events report, which displays information about web server agent events,
including severity, message ID, and message description
Accessing the web server Agent workspace
To access this workspace, perform the following steps:1. Within the Navigator, expand Windows Systems, Linux Systems, or UNIX
Systems, as appropriate for the node you are monitoring.2. Within the node list, expand the entry that corresponds to your node name.3. Within the list of monitored applications on that node, click Web Server Agent.
Chapter 5. ITCAM Agent for HTTP Servers 555

For additional information, see:v Organization of the predefined workspacesv Attribute groups used by the predefined workspaces
Attributes for ITCAM Agent for HTTP ServersIBM Tivoli Composite Application Manager Agent for HTTP Servers is a TivoliEnterprise Management Agent that is located within your distributed systems. Thisagent gathers data about web server processes that are running, and stores thisdata in elements called attributes. Each attribute is a characteristic of an object. Forexample, the Kilobytes Rate (per second) attribute in the Apache web serverattribute group reports the rate at which kilobytes were sent and received, persecond, during the collection interval.
Attribute groups
The ITCAM Agent for HTTP Servers attributes are organized into groups of relateditems. These attribute groups comprise the attribute tables for this agent.
Attributes and workspaces
Within the Tivoli Enterprise Portal workspaces, these attributes are displayed in,and correspond to, the columns in the reports and the items in the graphicdisplays for charts and graphs. You can use the collected data to analyze andmonitor the performance of your web servers and the applications running withinthem. For an overview of the correlations between the predefined workspaces andthe attribute groups, see Attribute groups used by the predefined workspaces.
Attributes and situations
Various attributes are referenced by the predefined situations of the product. Youcan also use the ITCAM Agent for HTTP Servers attributes to create your ownsituations to monitor the performance of your web servers and their applications.These situations can monitor your web server resources or correlate multipleconditions to alert you to problems that might occur when attribute values exceedthresholds defined by you.
Attribute groups used by the predefined workspacesA workspace contains graphical data or report columns that correspond directly toparticular attributes in an attribute group. The table shows the correlationsbetween the predefined workspaces and the attribute groups. The workspaces arelisted alphabetically, not in the order in which they are displayed in the Navigator.
Table 127. Workspaces and the attribute groups they reference
Workspace Related Attribute Groups
“Apache web server workspace” on page 552 “Apache web server attributes” on page 557
“Apache websites workspace” on page 553 “Apache websites attributes” on page 558
“Sun Java System web server workspace” on page 554 “Sun web server attributes” on page 560
“Sun websites workspace” on page 554 “Sun websites attributes” on page 563
“web server Agent workspace” on page 555 “Web Servers Status attributes” on page 567“HTTP Servers Agent Events attributes” on page 566
556 ITCAM Agents for WebSphere Applications, J2EE, and HTTP Servers: User Guide

Apache web server attributesThe Apache Web Server attributes provide status information about the Apacheweb server.
The attributes within this group are used to build the “Apache web serverworkspace” on page 552.
Configuration File The fully qualified path of the Apache HTTP Serverconfiguration file name. The valid format is an alphanumeric string, with amaximum of 256 characters.
Failed Login Rate (per min) The average number of failed logins that occurred,per minute. The valid format is a decimal (formatted to three decimal places).
Failed Requests Rate (per min) The average number (per minute) of failedrequests. The valid format is a decimal (formatted to three decimal places).
Interval (sec) The length of the interval in seconds. The valid format is a positiveinteger.
Kilobytes Rate (per sec) The number of kilobytes that are sent and received persecond. The valid format is a decimal (formatted to three decimal places).
Node Name The name of the system on which the server is running. The validformat is an alphanumeric string, with a maximum 256 of characters.
Origin Node The name of the server subnode. The valid format is analphanumeric string, with a maximum of 128 characters.
Process ID The identifier of the Apache Server process. The valid format is apositive integer.
Request Rate (per sec) The rate at which HTTP requests were made. The validformat is a decimal (formatted to three decimal places).
Sample Date and Time The date and time the Tivoli Enterprise ManagementAgent collected the data. The valid format is a 12-character timestamp. For the STRand SCAN functions, the format is MM/DD/YY HH:MM:SS; the following tableshows the values contained in this character string:
Table 128. Format of the 12–character timestamp
Character String Meaning
MM Month
DD Day
YY Year
HH Hour
MM Minute
SS Second
Example: 09/13/06 18:32:03 indicates the data was collected on September 13 2006,at 18:32:03.
Chapter 5. ITCAM Agent for HTTP Servers 557

This attribute was designed for logging and reporting data collection times ratherthan for creating situations. To specify a time and date for comparison and testing,use attributes from the Universal Time or Local Time groups.
Server Failures Rate (per min) The average number of internal server errors. Thevalid format is a decimal (formatted to three decimal places).
Start Date and Time The date and time when the web server started. The validformat is a timestamp. This attribute was designed for logging and reporting datacollection times rather than for creating situations. To specify a time and date forcomparison and testing, use attributes from the Universal Time or Local Timegroups.
Status The status of the Apache HTTP server. Valid values are Not_Running,Running, and Error.
Successful Login Rate (per min) The average number of successful logins thatoccurred per minute. The valid format is a decimal (formatted to three decimalplaces).
Version The version of the Apache web server. The valid format is analphanumeric string, with a maximum of 64 characters.
Web Server Name The name of the web server. The valid format is analphanumeric string, with a maximum of 256 characters.
For additional information, see:v Organization of the predefined workspacesv Attribute groups used by the predefined workspaces
Apache websites attributesThe Apache Web Sites attributes provide status and performance informationabout the Apache websites workspace.
The attributes within this group are used to build the “Apache websitesworkspace” on page 553.
Failed Login Rate (per min) The average number of failed logins that occurred perminute. The valid format is a decimal (formatted to three decimal places).
Failed Pages Rate (per min) The rate (per minute) of pages not found orforbidden. The valid format is a decimal (formatted to three decimal places).
Failed Request Rate (per min) The average number, per minute, of failed requestsmade to the server. The valid format is a decimal (formatted to three decimalplaces).
Interval (sec) The length (in seconds) of the sampling interval. The valid format isa positive integer.
Kilobytes Rate (per sec) The rate, per second, at which kilobytes sent andreceived. The valid format is a decimal (formatted to three decimal places).
Node Name The name of the system on which the server is running. The valueformat is an alphanumeric string, with a maximum of 256 characters.
558 ITCAM Agents for WebSphere Applications, J2EE, and HTTP Servers: User Guide

Origin Node The name of the server subnode. The valid format is analphanumeric string, with a maximum of 128 characters.
Request Rate (per sec) The rate at which HTTP requests were made. The validformat is a decimal (formatted to three decimal places).
Sample Date and Time The date and time the Tivoli Enterprise ManagementAgent collected the data. The valid format is a 12-character timestamp. For the STRand SCAN functions, the format is MM/DD/YY HH:MM:SS; the following tableshows the values contained in this character string:
Table 129. Format of the 12-character timestamp
Character String Meaning
MM Month
DD Day
YY Year
HH Hour
MM Minute
SS Second
Example: 09/13/06 18:32:03 indicates the data was collected on September 13 2006,at 18:32:03.
This attribute was designed for logging and reporting data collection times ratherthan for creating situations. To specify a time and date for comparison and testing,use attributes from the Universal Time or Local Time groups.
Server Failures Rate (per min) The rate (per minute) at which Apache web serverfailures occurred during the collection interval. The valid format is a decimal(formatted to three decimal places).
Attention: This attribute shows incorrect results for some environments. For morereliable information, use the server failures rate attribute of the “Apache webserver attributes” on page 557.
SSL Whether SSL is enabled for the virtual host. Valid values are Disabled andEnabled.
Successful Login Rate (per min) The average number of successful logins thatwere made per minute. The valid format is a decimal (formatted to three decimalplaces).
Successful Request Rate (per sec) The average number of requests that werefulfilled, per second, during the collection interval. The valid format is a decimal(formatted to three decimal places).
Web Server Name The name of the web server. The valid format is analphanumeric string, with a maximum of 256 characters.
Web Site Name The name of the website. The valid format is an alphanumericstring, with a maximum of 256 characters.
Chapter 5. ITCAM Agent for HTTP Servers 559

Web Site Status The status of the Apache website. Valid values are Not_Running,Running, and Error.
For additional information, see:v Organization of the predefined workspacesv Attribute groups used by the predefined workspaces
Sun web server attributesThe Sun Web Server attributes provide status information about the Sun webserver.
The attributes within this group are used to build the “Sun Java System web serverworkspace” on page 554.
Client Errors Rate (per sec) The number of 400-level (Client Error) responsesissued by the web server (per second) during the collection interval. The validformat is a decimal (formatted to three decimal places).
Connection Queue Count The number of connections currently in the web serverconnection queue. The valid format is a positive integer.
Connection Queue Max The maximum number of connections allowed in the webserver connection queue. The valid format is a positive integer.
Connection Queue Overflows The number of connections rejected as a result ofconnection queue overflow. The valid format is a positive integer.
Connection Queue Peak The largest number of connections that were queuedsimultaneously. The valid format is a positive integer.
Connection Queue Total The number of connections that were accepted. The validformat is a positive integer.
Failed Login Rate (per min) The number of 401-level (Failed Login) responsesissued by the web server (per minute) during the collection interval. The validformat is a decimal (formatted to three decimal places).
Idle Threads Count The number of web server request processing threadscurrently idle. The valid format is a positive integer.
Interval (sec) The length of the sampling interval in seconds. The valid format is apositive integer.
Keepalive Queue Count The number of connections currently in the web serverkeepalive queue. The valid format is a positive integer.
Keepalive Queue Max The maximum number of connections allowed in the webserver keepalive queue. The valid format is a positive integer.
Kilobytes Rate (per sec) The summary rate at which kilobytes are received andtransmitted on the network (per second). The valid format is a decimal (formattedto three decimal places).
560 ITCAM Agents for WebSphere Applications, J2EE, and HTTP Servers: User Guide

Kilobytes Received Rate (per sec) The rate at which kilobytes are received on thenetwork (per second). The valid format is a decimal (formatted to three decimalplaces).
Kilobytes Sent Rate (per sec) The rate at which Kilobytes are transmitted on thenetwork (per second). The valid format is a decimal (formatted to three decimalplaces).
Node Name The name of the system on which the server is running. The validformat is an alphanumeric string, with a maximum of 256 characters.
Origin Node The name of the server subnode. The valid format is analphanumeric string, with a maximum of 128 characters.
Other Responses Rate (per sec) The number of responses at a level other than 2xx,3xx, 4xx, or 5xx that were issued by the web server (per second) during thecollection interval. The valid format is a decimal (formatted to three decimalplaces).
Pages Not Found Rate (per min) The number of 404 (Pages Not Found) responsesissued by the web server (per minute) during the collection interval. The validformat is a decimal (formatted to three decimal places).
Process ID The process identifier of the Java virtual machine. The valid format isan alphanumeric string, with a maximum of 64 characters.
Process Size Fraction System Memory Usage The fraction of system memory thatis being used by the web server instance process. The valid format is a positiveinteger.
Process Size Resident The web server instance process resident size in kilobytes.The valid format is a positive integer.
Process Size Virtual The web server instance process size in kilobytes. The validformat is a positive integer.
Redirected Request Rate (per sec) The number of 300-level (Redirection) responsesissued by the web server (per second) during the collection interval. The validformat is a decimal (formatted to three decimal places).
Request Rate (per sec) The number of requests processed, per second. The validformat is a decimal (formatted to three decimal places).
Response Bad Request Rate (per sec) The number of 400® (Bad Request) responsesissued by the web server (per second) during the collection interval. The validformat is a decimal (formatted to three decimal places).
Response Forbidden Rate (per min) The number of 403 (Forbidden) responsesissued by the web server (per minute) during the collection interval. The validformat is a decimal (formatted to three decimal places).
Response Moved Temporarily Rate (per sec) The number of 302 (MovedTemporarily) responses issued by the web server (per second) during the collectioninterval. The valid format is a decimal (formatted to three decimal places).
Chapter 5. ITCAM Agent for HTTP Servers 561

Response Not Modified Rate (per sec) The number of 304 (Not Modified)responses issued by the web server (per second) during the collection interval. Thevalid format is a decimal (formatted to three decimal places).
Response Successful Rate (per sec) The number of 200 (OK) responses issued bythe web server (per second) during the collection interval. The valid format is adecimal (formatted to three decimal places).
Response Unavailable Rate (per min) The number of 503 (Unavailable) responsesissued by the web server (per minute) during the collection interval. The validformat is a decimal (formatted to three decimal places).
Sample Date and Time The date and time the Tivoli Enterprise ManagementAgent collected the data. The valid format is a 12-character timestamp. For the STRand SCAN functions, the format is MM/DD/YY HH:MM:SS; the following tableshows the values contained in this character string:
Table 130. Format of the 12-character timestamp
Character String Meaning
MM Month
DD Day
YY Year
HH Hour
MM Minute
SS Second
Example: 09/13/06 18:32:03 indicates the data was collected on September 13 2006,at 18:32:03.
This attribute was designed for logging and reporting data collection times ratherthan for creating situations. To specify a time and date for comparison and testing,use attributes from the Universal Time or Local Time groups.
Server Contact The contact information for people responsible for server instance.The valid format is an alphanumeric string, with a maximum of 256 characters.
Server Death Times The number of times that the server instance processesstopped during the collection interval. The valid format is a positive integer.
Server Description The description of the server instance. The valid format is analphanumeric string, with a maximum of 256 characters.
Server Directory The directory of the server instance. The valid format is analphanumeric string, with a maximum of 256 characters.
Server Failures Rate (per min) The number of 500-level (Server Error) responsesissued by the web server (per minute) during the collection interval. The validformat is a decimal (formatted to three decimal places).
Server Instance The MIB index for the web server instance. The valid format is apositive integer.
562 ITCAM Agents for WebSphere Applications, J2EE, and HTTP Servers: User Guide

Server Location The location of the server instance. The valid format is analphanumeric string, with a maximum of 256 characters.
Server Organization The organization that is responsible for the server instance.The valid format is an alphanumeric string, with a maximum of 256 characters.
Start Date and Time The date and time when the web server started. The validformat is a timestamp. This attribute was designed for logging and reporting datacollection times rather than for creating situations. To specify a time and date forcomparison and testing, use attributes from the Universal Time or Local Timegroups.
Status The status of the Sun web server. Valid values are Non_Running andRunning.
Successful Request Rate (per sec) The number of 200-level (Successful) responsesissued by the web server (per second) during the collection interval. The validformat is a decimal (formatted to three decimal places).
Thread Count The number of web server request processing threads. The validformat is a positive integer.
Thread Pool Count The number of threads in the pool. The valid format is apositive integer.
Thread Pool Instance The thread pool MIB index. The valid format is a positiveinteger.
Thread Pool Max The maximum number of threads allowed in pool. The validformat is a positive integer.
Thread Pool Name The thread pool identifier. The valid format is an alphanumericstring, with a maximum of 256 characters.
Thread Pool Peak The maximum number of threads in the pool. The valid formatis a positive integer.
Version The software version of the server instance. The valid format is analphanumeric string, with a maximum of 256 characters.
Web Server Name The name of the web server. The valid format is analphanumeric string, with a maximum of 256 characters.
For additional information, see:v Organization of the predefined workspacesv Attribute groups used by the predefined workspaces
Sun websites attributesThe Sun Web Sites attributes provide status information about the Sun websitesworkspace of the Sun Java System web server.
The attributes within this group are used to build the “Sun websites workspace”on page 554.
Chapter 5. ITCAM Agent for HTTP Servers 563

Address Port SSL The Sun website IP address, port and whether security isenabled. The valid format is an alphanumeric string, with a maximum of 256characters.
Client Errors Rate (per sec) The number of 400-level (Client Error) responsesissued by the virtual server (per second) during the collection interval. The validformat is a decimal (formatted to three decimal places).
Failed Login Rate (per min) The number of 401 (Failed Login) responses issued bythe virtual server (per minute) during the collection interval. The valid format is adecimal (formatted to three decimal places).
Failed Responses Percent The percentage of failed responses of the total requestcount. The valid format is a positive integer.
Interval (sec) The length of the sampling interval in seconds. The valid format is apositive integer.
Kilobytes Rate (per sec) The summary rate at which kilobytes are received andtransmitted on the network per second. The valid format is a decimal (formatted tothree decimal places).
Kilobytes Received Rate (per sec) The rate at which kilobytes are received on thenetwork (per second). The valid format is a decimal (formatted to three decimalplaces).
Kilobytes Sent Rate (per sec) The rate at which kilobytes are transmitted on thenetwork (per second). The valid format is a decimal (formatted to three decimalplaces).
Node Name The name of the system on which the server is running. The valueformat is an alphanumeric string, with a maximum of 256 characters.
Origin Node The name of the server subnode. The valid format is analphanumeric string, with a maximum of 128 characters.
Other Responses Rate (per sec) The number of responses at a level other than 2xx,3xx, 4xx, or 5xx that were issued by the virtual server (per second) during thecollection interval. The valid format is a decimal (formatted to three decimalplaces).
Pages Not Found Rate (per min) The number of 404 (Pages Not Found) responsesissued by the virtual server (per minute) during the collection interval. The validformat is a decimal (formatted to three decimal places).
Redirected Request Rate (per sec) The number of 300-level (Redirection) responsesissued by the virtual server (per second) during the collection interval. The validformat is a decimal (formatted to three decimal places).
Request Rate (per sec) The number of requests processed per second by the virtualserver during the collection interval. The valid format is a decimal (formatted tothree decimal places).
Response Bad Request Rate (per sec) The number of 400 (Bad Request) responsesissued by the virtual server (per second) during the collection interval. The validformat is a decimal (formatted to three decimal places).
564 ITCAM Agents for WebSphere Applications, J2EE, and HTTP Servers: User Guide

Response Forbidden Rate (per min) The number of 403 (Forbidden) responsesissued by the virtual server (per minute) during the collection interval. The validformat is a decimal (formatted to three decimal places).
Response Moved Temporarily Rate (per sec) The number of 302 (MovedTemporarily) responses issued by the virtual server (per second) during thecollection interval. The valid format is a decimal (formatted to three decimalplaces).
Response Not Modified Rate (per sec) The number of 304 (Not Modified)responses issued by the virtual server (per second) during the collection interval.The valid format is a decimal (formatted to three decimal places).
Response Successful Rate (per sec) The number of 200 (OK) responses issued bythe virtual server (per second) during the collection interval. The valid format is adecimal (formatted to three decimal places).
Response Unavailable Rate (per min) The number of 503 (Unavailable) responsesissued by the virtual server (per minute) during the collection interval. The validformat is a decimal (formatted to three decimal places).
Sample Date and Time The date and time the Tivoli Enterprise ManagementAgent collected the data. The valid format is a 12-character timestamp. For the STRand SCAN functions, the format is MM/DD/YY HH:MM:SS; the following tableshows the values contained in this character string:
Table 131. Format of the 12-character timestamp
Character String Meaning
MM Month
DD Day
YY Year
HH Hour
MM Minute
SS Second
Example: 09/13/06 18:32:03 indicates the data was collected on September 13 2006,at 18:32:03.
This attribute was designed for logging and reporting data collection times ratherthan for creating situations. To specify a time and date for comparison and testing,use attributes from the Universal Time or Local Time groups.
Server Failures Rate (per min) The number of 500-level (Server Error) responsesissued by the virtual server (per minute) during the collection interval. The validformat is a decimal (formatted to three decimal places).
Server Failures Percent The percentage of server failures of the total request count.The valid format is a positive integer.
Server Instance The web server MIB index for the web server instance. The validformat is a positive integer.
Chapter 5. ITCAM Agent for HTTP Servers 565

Successful Request Rate (per sec) The number of 200-level (Successful) responsesissued by the virtual server (per second) during the collection interval. The validformat is a decimal (formatted to three decimal places).
Successful Requests Percent The percentage of successful requests of the totalrequest count. The valid format is a positive integer.
Unauthorized Requests Percent The percentage of unauthorized requests of thetotal request count. The valid format is a positive integer.
Web Server Name The name of the web server. The valid format is analphanumeric string, with a maximum of 256 characters.
Web Site Instance The web server MIB index for the virtual server instance. Thevalid format is a positive integer.
Web Site Name The name of the website. The valid format is an alphanumericstring, with a maximum of 128 characters.
Web Site Status The status of the SUN website. Valid values are Running, Error,and AddressPortUnavailable.
For additional information, see:v Organization of the predefined workspacesv Attribute groups used by the predefined workspaces
HTTP Servers Agent Events attributesThe HTTP Servers Agent Events attributes collect information about agent-levelevents that affect the ability of the IBM Tivoli Composite Application Manager forWeb Servers agent to collect data for Web Servers, including Apache web serverand Sun Java Web server.
The attributes within this group are used to build the “web server Agentworkspace” on page 555.
Event Date and Time The date and time the event occurred. The valid format is a12-character timestamp. For the STR and SCAN functions, the format isMM/DD/YY HH:MM:SS; the following table shows the values contained in thischaracter string:
Table 132. Format of the 12-character timestamp
Character String Meaning
MM Month
DD Day
YY Year
HH Hour
MM Minute
SS Second
Example: 09/13/06 18:32:03 indicates the data was collected on September 13 2006,at 18:32:03.
566 ITCAM Agents for WebSphere Applications, J2EE, and HTTP Servers: User Guide

This attribute was designed for logging and reporting data collection times ratherthan for creating situations. To specify a time and date for comparison and testing,use attributes from the Universal Time or Local Time groups.
Message Description The description of the message. The valid format is analphanumeric string, with a maximum of 256 characters.
Message ID The unique identifier of the message. The valid format is analphanumeric string, with a maximum of eight characters.
Node Name The name of the system on which the server is running. The valueformat is an alphanumeric string, with a maximum of 128 characters.
Origin Node The name of the server subnode. The valid format is analphanumeric string, with a maximum of 128 characters.
Sequence Number The sequence number of the message. The valid format is apositive integer.
Severity The severity of the message. Valid values are Info, Warning, Error, andSevere.
For additional information, see:v Organization of the predefined workspacesv Attribute groups used by the predefined workspaces
Web Servers Status attributesThe Web Servers Status attributes provide status about the monitored web servers.
The attributes within this group are used to build the “web server Agentworkspace” on page 555.
Node Name The name of the system on which the server is running. The valueformat is an alphanumeric string, with a maximum of 256 characters.
Origin Node The name of the server subnode. The valid format is analphanumeric string, with a maximum of 128 characters.
Process ID The identifier of the web server process. The valid format is analphanumeric string, with a maximum of 64 characters.
Sample Date and Time The date and time the Tivoli Enterprise ManagementAgent collected the data. The valid format is a 12-character timestamp. For the STRand SCAN functions, the format is MM/DD/YY HH:MM:SS; the following tableshows the values contained in this character string:
Table 133. Format of the 12-character timestamp
Character String Meaning
MM Month
DD Day
YY Year
HH Hour
MM Minute
Chapter 5. ITCAM Agent for HTTP Servers 567

Table 133. Format of the 12-character timestamp (continued)
Character String Meaning
SS Second
Example: 09/13/06 18:32:03 indicates the data was collected on September 13 2006,at 18:32:03.
This attribute was designed for logging and reporting data collection times ratherthan for creating situations. To specify a time and date for comparison and testing,use attributes from the Universal Time or Local Time groups.
Server Directory The directory of the web server. The valid format is analphanumeric string, with a maximum of 256 characters.
Server Name The name of the web server. The valid format is an alphanumericstring, with a maximum of 256 characters.
Server Type The type of the web Server. Valid values are Apache andSun_Web_Server
Start Date and Time The date and time when the web server started. The validformat is a timestamp. This attribute was designed for logging and reporting datacollection times rather than for creating situations. To specify a time and date forcomparison and testing, use attributes from the Universal Time or Local Timegroups.
Status The status of the web server. Valid values are Error, Stopped, Start_Pending,Stop_Pending, Running, Continue_Pending, Pause_Pending, and Paused.
For additional information, see:v Organization of the predefined workspacesv Attribute groups used by the predefined workspaces
Situations for ITCAM Agent for HTTP ServersIBM Tivoli Composite Application Manager Agent for HTTP Servers provides anumber of predefined situations that you can use to complete the following tasks:v Monitor your web serversv Monitor and manage widely dispersed web server resources through localized
automationv Create your own situations using the predefined situations as examples
These predefined situations have alert status of Critical and Warning. When thesesituations trigger an alert, you can investigate the event by opening its workspace.
How the situations work
Situations are tests expressed in IF-TRUE statements of system conditions that youwant to monitor; the tested value is an ITCAM Agent for HTTP Servers attributeexpressed in the form attribute-group.attribute-name. Thus, if the specified conditionoccurs or exists, the situation is true, and an alert is issued.
568 ITCAM Agents for WebSphere Applications, J2EE, and HTTP Servers: User Guide

Avoid using negative values
If you define situations that use a counter or a range of numbers, always provide athreshold or use values in a positive range of numbers. For example, use agreater-than-or-equal-to-zero expression as shown in some of the followingpredefined situations. This practice prevents a situation from falsely tripping. If theITCAM Agent for HTTP Servers Tivoli Enterprise Monitoring Agent encounters anundefined attribute value, it interprets this as a negative number and erroneouslytriggers a situation that specified a negative number.
Predefined situations, descriptions, and formulas
Apache_HTTP_Stopped Monitors the status of the Apache web server and issuesa Critical condition when the Apache HTTP server is not active. Its formula is asfollows:
If
Apache_Web_Server.Server_Status does NOT equal 1
then
the situation Apache_HTTP_Stopped is true.
Apache_Site_Down Monitors the status of the Apache website and issues aCritical condition when one of the virtual hosts run by the Apache HTTP Server isunavailable. Its formula is as follows:
If
Apache_Web_Sites.Web_Site_Status does NOT equal 1
then
the situation Apache_Site_Down is true.
Apache_Site_failed Monitors the server failure rate of Apache web server andissues a Critical condition whenever the server failures rate is greater than 1. Itsformula is as follows:
If
Apache_Web_Sites.Server_Failures_Rate is greater than 1
then
the situation Apache_Site_failed is true.
Apache_Site_trafic Monitors the count of kilobytes sent and received and issues aWarning condition whenever the kilobytes rate is greater than 10,000,000. Itsformula is as follows:
If
Apache_Web_Sites.Kilobytes_Rate is greater than 10,000,000
Chapter 5. ITCAM Agent for HTTP Servers 569

then
the situation Apache_Site_trafic is true.
Apache_Site_requests Monitors the rate at which the Apache HTTP requests weremade and issues a Warning condition whenever the request rate is greater than100,000. Its formula is as follows:
If
Apache_Web_Sites.Request_Rate is greater than 100,000
then
the situation Apache_Site_requests is true.
Apache_Site_fail_logins Monitors the count of failed logins and issues a Warningcondition whenever the failed login rate is greater than 100. Its formula is asfollows:
If
Apache_Web_Sites.Failed_Login_Rate is greater than 100
then
the situation Apache_Site_fail_logins is true.
Apache_Site_fail_pages Monitors the rate of failed pages and issues a Warningcondition whenever the failed pages rate is greater than 1,000. Its formula is asfollows:
If
Apache_Web_Sites.Failed_Pages_Rate is greater than 1,000
then
the situation Apache_Site_fail_pages is true.
SWebSrvStoped Monitors the status of the Sun web server and issues a Criticalcondition when the server stops. Its formula is as follows:
If
Sun_Web_Server.Server_Status equals 0
then
the situation SWebSrvStoped is true.
SWebSrvHFrMEM Monitors the fraction of system memory that is being used bythe web server instance process and issues a Warning condition whenever thesystem memory usage is greater than 80%. Its formula is as follows:
If
570 ITCAM Agents for WebSphere Applications, J2EE, and HTTP Servers: User Guide

Sun_Web_Server.Process_Size_Fraction_System_Memory_Usage is greater than 80
then
the situation SWebSrvHFrMEM is true.
SWebSrvCONQLIM Monitors the numbers of connections in the connection queueand issues a Warning condition whenever the count is greater than 100. Its formulais as follows:
If
Sun_Web_Server.Connection_Queue_Count is greater than 100
then
the situation SWebSrvCONQLIM is true.
SWebSrvKPALQLIM Monitors the number of connections in the keepalive queueand issues a Warning condition whenever the number exceeds 100. Its formula isas follows:
If
Sun_Web_Server.Keepalive_Queue_Count is greater than 100
then
the situation SWebSrvKPALQLIM is true.
SWebSrvHNetSent Monitors the kilobytes transmitted on the network of the Sunweb server and issues a Warning condition whenever the number exceeds10,000,000 kilobytes per second. Its formula is as follows:
If
Sun_Web_Server.Kilobytes_Out_Rate is greater than 10,000,000
then
the situation SWebSrvHNetSent is true.
SWebSrvHNetRecv Monitors the kilobytes received on the network of the Sunweb server and issues a Warning condition whenever the number exceeds10,000,000 kilobytes per second. Its formula is as follows:
If
Sun_Web_Server.Kilobytes_In_Rate is greater than 10,000,000
then
the situation SWebSrvHNetRecv is true.
Chapter 5. ITCAM Agent for HTTP Servers 571

SVWebStHNetRecv Monitors the kilobytes received on the network of the Sunwebsite and issues a Warning condition whenever the number exceeds 10,000,000kilobytes per second. Its formula is as follows:
If
Sun_Web_Sites.Kilobytes_In_Rate is greater than 10,000,000
then
the situation SWebStHNetRecv is true.
SVWebStHNetSent Monitors the kilobytes transmitted on the network of the Sunwebsite and issues a Warning condition whenever the number exceeds 10,000,000kilobytes per second. Its formula is as follows:
If
Sun_Web_Sites.Kilobytes_Out_Rate is greater than 10,000,000
then
the situation SWebStHNetSent is true.
SVWebStFailed Monitors the percentage of failed responses violation and issues aCritical condition whenever the percentage exceeds 50%. Its formula is as follows:
If
Sun_Web_Sites.Percentage_of_failed_responses_violation is greater than 50
then
the situation SVWebStFailed is true.
SVWebStServErr Monitors the percentage of server error violations and issues aCritical condition whenever the percentage exceeds 50%. Its formula is as follows:
If
Sun_Web_Sites.Percentage_of_server_errors_violation is greater than 50
then
the situation SVWebStServErr is true.
SVWebStUnAuthErr Monitors the percentage of unauthorized response violationsand issues a Warning condition whenever the percentage exceeds 50%. Its formulais as follows:
If
Sun_Web_Sites.Percentage_of_unauthorized_responses_violation is greater than 50
then
572 ITCAM Agents for WebSphere Applications, J2EE, and HTTP Servers: User Guide

the situation SVWebStUnAuthErr is true.
SVWebStSucssfResp Monitors the percentage of successful response violationsand issues a Critical condition whenever the percentage exceeds 50%. Its formula isas follows:
If
Sun_Web_Sites.Percentage_of_successful_responses_violation is greater than 50
then
the situation SVWebStSucssfResp is true.
Take Action commands for ITCAM Agent for HTTP ServersThe Take Action commands allow your interactive Tivoli Enterprise Portal usersenter a command or stop or start a process at any system in your network whereone or more Tivoli Enterprise Monitoring Agents are installed. The ITCAM Agentfor HTTP Servers Take Action commands allow you to use the Tivoli EnterprisePortal interface to start, stop, or restart a web server or a website.
Users can run a Take Action command from a workspace, from the Navigator,from a situation that you create, in an improvised mode, or by recalling a savedTake Action command. For details about using these general commands, see theonline help for Tivoli Enterprise Portal.
Predefined Take Action commands for Apache web servers
StartServer: Start an Apache web server
Use the StartServer command to start an Apache web server instance.
Command syntax
HT:startServer
StopServer: Stop an Apache web server
Use the StopServer command to stop an Apache web server instance.
Command syntax
HT:stopServer
RestartServer: Restart an Apache web server
Use the RestartServer command to restart an Apache web server instance.
Command syntax
HT:restartServer
Predefined Take Action commands for Sun web servers
Chapter 5. ITCAM Agent for HTTP Servers 573

StartServer: Start a Sun web server
Use the StartServer command to start a Sun web server.
Command syntax
HT:startServer
StopServer: Stop a Sun web server
Use the StopServer command to stop a Sun web server.
Command syntax
HT:stopServer
RestartServer: Restart a Sun web server
Use the RestartServer command to restart a Sun web server.
Command syntax
HT:restartServer
Glossary for ITCAM Agent for HTTP ServersA
Apache HTTP server An open source web server. IBM offers a web server, calledthe IBM HTTP Server, which is based on Apache.
application server A program in a distributed network that provides the executionenvironment for an application program.
attribute Data associated with a component. For example, a web server componentmight have attributes such as web server name, WWW server status, node name,origin node, interval time, and so on.
attribute group A set of related attributes that can be combined in a view or asituation. For example, the Apache web server attribute group and the Sunwebsites attribute group in the ITCAM Agent for HTTP Servers.
H
HTTP Hypertext Transfer Protocol. A suite of protocols for the Internet thattransfer and display hypertext documents.
HTTP request A transaction initiated by a web browser and adhering to HTTP.The server usually responds with HTML data, but can send other kinds of objectsas well.
I
IBM Tivoli Monitoring platform The software architecture and foundation thatsupport the development and operations of Tivoli Enterprise Portal and its TivoliEnterprise Monitoring Agents.
574 ITCAM Agents for WebSphere Applications, J2EE, and HTTP Servers: User Guide

J
J2EE Java 2 Platform, Enterprise Edition. An environment for developing anddeploying enterprise applications using the Java language. The J2EE platformconsists of a set of services, application programming interfaces (APIs), andprotocols that provide the functions needed for developing multi-tiered, Web-basedapplications.
Java An object-oriented programming language for portable interpretive code thatsupports interaction among remote objects. Java was developed and specified bySun Microsystems, Incorporated.
JSP Java server page. A web page that specifies one or more servlets whoseexecution on the web server modifies the page content or appearance before it ispresented to the user.
M
monitor 1) A transaction environment for maintaining large quantities of data in aconsistent state and that controls which users and clients can access data throughauthorized servers. 2) A programming primitive created so multiple programthreads can share the same resource (such as an object). A program creates amonitor for a given resource by requesting it from the system; the system returns aunique ID for that monitor. After that, any thread needing the resource must usethe monitor to lock the resource while the thread is using it. If the monitor isalready locked, a thread requesting the resource is queued by the system and thengiven control when the monitor becomes unlocked. Also called a mutex.
monitored application An application that interfaces with a Tivoli PrivacyManager monitor to enable access to monitored items that flow between theapplication and the monitored system.
N
node Any managed system, such as a web server, that the Tivoli Enterprise Portalis monitoring. A node can also be a managed system of subnodes being managedunder a primary node.
R
request The entry point into an application whose processing or response timedirectly affects the response time the user perceives.
S
server In a network, hardware, or software that provides facilities to clients.Examples of a server are a file server, a printer server, or a mail server.
session A series of requests to a servlet that originate from the same user at thesame browser. Using sessions, applications running in a web container can trackindividual users.
T
thread pool The threads that are being used by or are available to a computerprogram.
Chapter 5. ITCAM Agent for HTTP Servers 575

U
URI Uniform Resource Identifier. An identifier for a point of content on theInternet, be it a page of text, a video or sound clip, a still or animated image, or aprogram. The most common form of URI is the web page address, which is aparticular form of URI called a Universal Resource Locator (URL). A URI typicallydescribes the mechanism used to access the resource, the computer that houses theresource, and the name of the resource (such as a file name) on that computer.
URL Universal Resource Locator. The unique address for a file accessible via theInternet. Such a file might be a web page (usually the home page), an image file,or a program such as a Java applet or servlet. The URL comprises the protocolused to access the file, a domain name that identifies a specific computer on theInternet, and a path name that specifies that file location on that computer.
V
virtual server A server that shares its resources with other servers to supportapplications.
W
Web Server A software program that can service Hypertext Transfer Protocol(HTTP) requests.
Web service A self-contained, self-describing modular application that can bepublished, discovered, and invoked over a network using standard networkprotocols. Typically, XML is used to tag the data, SOAP is used to transfer the data,WSDL is used to describe the services available, and UDDI is used for listing whatservices are available.
Website A related collection of files available on the web that is managed by asingle entity (an organization or an individual) and contains information inhypertext for its users. A website often includes hypertext links to other websites.
workspace A window composed of one or more views.
576 ITCAM Agents for WebSphere Applications, J2EE, and HTTP Servers: User Guide

Part 3. Appendixes
© Copyright IBM Corp. 2006, 2014 577

578 ITCAM Agents for WebSphere Applications, J2EE, and HTTP Servers: User Guide

Appendix. Accessibility
Accessibility features help users with physical disabilities, such as restrictedmobility or limited vision, to use software products successfully.
The accessibility features in the product enable users to:v Use assistive technologies, such as screen reader software and digital speech
synthesizers, to hear what is displayed on the screen. Consult the productdocumentation of the assistive technology for details on using the technologywith this product.
v Perform tasks with the software using only the keyboard.
General Navigation
Each page has four main sections:v Headerbarv Toolbarv Main tabsv Content
Each page has navigation points for screen readers. The following navigationpoints are all H1:v Title barv Main tabsv Main formv Section labelsv Table labels
Menu Navigation
You use the Go To menu at the top of the screen to navigate to any of theapplications that you have access to. The Go To menu is a cascading menu that isthree levels deep at its deepest point. The following instructions describe how toget started with JAWS:1. To get to the Go To menu press Alt+G.2. When you open the menu, JAWS reads the first application in the menu. If
JAWS does not begin to read the entry, restart the screen reader.3. Navigate the list of applications in the menus by using the arrow keys.4. JAWS indicates if a menu item has submenus. To get to a submenu, press the
right arrow or enter.5. Press the left arrow to move up a level in the hierarchy. If you press the left
arrow at the highest level of the Go To menu, you leave the menu completely.6. Press the Enter key to enter an application.
Accessibility help
The Accessibility Help panels provide details on general navigation, menunavigation, and hot keys. Click Accessibility Help from the toolbar of the productto access the help panels.
© Copyright IBM Corp. 2006, 2014 579

Screen reader setting
The product contains a screen reader flag. When you turn on the screen readerflag, the user interface is optimized to work with JAWS for Windows®. You use theUser tab in the Users application to turn on the screen reader flag.
Keyboard shortcuts
You can navigate within the applications by using a combination of keys.
Accessible reports
To use the accessibility tools to read reports, you must access the reports inMicrosoft Excel. In the reports applications, select the Run Reports option in theSelect Action menu. With this option, you can email an .xls file version of a reportto yourself at a scheduled time.
IBM and accessibility
For more information about the commitment that IBM has to accessibility, see theIBM Human Ability and Accessibility Center. The IBM Human Ability andAccessibility Center is at the following web address: http://www.ibm.com/able
580 ITCAM Agents for WebSphere Applications, J2EE, and HTTP Servers: User Guide

Index
Bbaselining 541
Ccalculating baseline 541calculating threshold 541cookies 586
Pprivacy policy 586publications, online ix
Sservice xservice management connect xSMC xsupport x
Tthreshold 541
© Copyright IBM Corp. 2006, 2014 581

582 ITCAM Agents for WebSphere Applications, J2EE, and HTTP Servers: User Guide

Trademarks
IBM, the IBM logo, and ibm.com are trademarks or registered trademarks ofInternational Business Machines Corp., registered in many jurisdictions worldwide.Other product and service names might be trademarks of IBM or other companies.A current list of IBM trademarks is available on the Web at “Copyright andtrademark information” at http://www.ibm.com/us/en/legal/copytrade.shtml.
Adobe is either a registered trademark or a trademark of Adobe SystemsIncorporated in the United States, other countries, or both.
Linux is a registered trademark of Linus Torvalds in the United States, othercountries, or both.
Microsoft and Windows are trademarks of Microsoft Corporation in the UnitedStates, other countries, or both.
UNIX is a registered trademark of The Open Group in the United States and othercountries.
Java and all Java-based trademarks are trademarks or registered trademarksof Oracle and/or its affiliates.
Other company, product, and service names may be trademarks or service marksof others.
© Copyright IBM Corp. 2006, 2014 583

584 ITCAM Agents for WebSphere Applications, J2EE, and HTTP Servers: User Guide

Notices
This information was developed for products and services offered in the U.S.A.IBM might not offer the products, services, or features discussed in this documentin other countries. Consult your local IBM representative for information on theproducts and services currently available in your area. Any reference to an IBMproduct, program, or service is not intended to state or imply that only that IBMproduct, program, or service may be used. Any functionally equivalent product,program, or service that does not infringe any IBM intellectual property right maybe used instead. However, it is the user's responsibility to evaluate and verify theoperation of any non-IBM product, program, or service.
IBM might have patents or pending patent applications covering subject matterdescribed in this document. The furnishing of this document does not give youany license to these patents. You can send license inquiries, in writing, to:
IBM Director of LicensingIBM CorporationNorth Castle DriveArmonk, NY 10504-1785 U.S.A.
For license inquiries regarding double-byte (DBCS) information, contact the IBMIntellectual Property Department in your country or send inquiries, in writing, to:
Intellectual Property LicensingLegal and Intellectual Property LawIBM Japan, Ltd.19-21, Nihonbashi-Hakozakicho, Chuo-kuTokyo 103-8510, Japan
The following paragraph does not apply to the United Kingdom or any othercountry where such provisions are inconsistent with local law:
INTERNATIONAL BUSINESS MACHINES CORPORATION PROVIDES THISPUBLICATION "AS IS" WITHOUT WARRANTY OF ANY KIND, EITHEREXPRESS IMPLIED, INCLUDING, BUT NOT LIMITED TO, THE IMPLIEDWARRANTIES OF NON-INFRINGEMENT, MERCHANTABILITY FITNESS FOR APARTICULAR PURPOSE.
Some states do not allow disclaimer of express or implied warranties in certaintransactions, therefore, this statement might not apply to you.
This information could include technical inaccuracies or typographical errors.Changes are periodically made to the information herein; these changes will beincorporated in new editions of the publication. IBM may make improvements orchanges in the product(s) or the program(s) described in this publication at anytime without notice.
Any references in this information to non-IBM Web sites are provided forconvenience only and do not in any manner serve as an endorsement of those Websites. The materials at those Web sites are not part of the materials for this IBMproduct and use of those Web sites is at your own risk.
© Copyright IBM Corp. 2006, 2014 585

IBM may use or distribute any of the information you supply in any way itbelieves appropriate without incurring any obligation to you.
Licensees of this program who want to have information about it for the purposeof enabling: (i) the exchange of information between independently createdprograms and other programs (including this one) and (ii) the mutual use of theinformation which has been exchanged, should contact:
IBM Corporation2Z4A/10111400 Burnet RoadAustin, TX 78758 U.S.A.
Such information might be available, subject to appropriate terms and conditions,including in some cases payment of a fee.
The licensed program described in this document and all licensed materialavailable for it are provided by IBM under terms of the IBM Customer Agreement,IBM International Program License Agreement or any equivalent agreementbetween us.
Any performance data contained herein was determined in a controlledenvironment. Therefore, the results obtained in other operating environmentsmight vary significantly. Some measurements might have been made ondevelopment-level systems and there is no guarantee that these measurements willbe the same on generally available systems. Furthermore, some measurementmight have been estimated through extrapolation. Actual results might vary. Usersof this document should verify the applicable data for their specific environment.
Information concerning non-IBM products was obtained from the suppliers ofthose products, their published announcements or other publicly available sources.IBM has not tested those products and cannot confirm the accuracy ofperformance, compatibility or any other claims related to non-IBM products.Questions on the capabilities of non-IBM products should be addressed to thesuppliers of those products.
COPYRIGHT LICENSE:
This information contains sample application programs in source language, whichillustrate programming techniques on various operating platforms. You may copy,modify, and distribute these sample programs in any form without payment toIBM, for the purposes of developing, using, marketing or distributing applicationprograms conforming to the application programming interface for the operatingplatform for which the sample programs are written. These examples have notbeen thoroughly tested under all conditions. IBM, therefore, cannot guarantee orimply reliability, serviceability, or function of these programs. You may copy,modify, and distribute these sample programs in any form without payment toIBM for the purposes of developing, using, marketing, or distributing applicationprograms conforming to IBM‘s application programming interfaces.
Privacy policy considerationsIBM Software products, including software as a service solutions, (“SoftwareOfferings”) may use cookies or other technologies to collect product usageinformation, to help improve the end user experience, to tailor interactions withthe end user or for other purposes. In many cases no personally identifiable
586 ITCAM Agents for WebSphere Applications, J2EE, and HTTP Servers: User Guide

information is collected by the Software Offerings. Some of our Software Offeringscan help enable you to collect personally identifiable information. If this SoftwareOffering uses cookies to collect personally identifiable information, specificinformation about this offering’s use of cookies is set forth below.
Depending upon the configurations deployed, this Software Offering may usesession cookies that collect each user’s user name for purposes of sessionmanagement, authentication, and single sign-on configuration. These cookiescannot be disabled.
If the configurations deployed for this Software Offering provide you as customerthe ability to collect personally identifiable information from end users via cookiesand other technologies, you should seek your own legal advice about any lawsapplicable to such data collection, including any requirements for notice andconsent.
For more information about the use of various technologies, including cookies, forthese purposes, See IBM’s Privacy Policy at http://www.ibm.com/privacy andIBM’s Online Privacy Statement at http://www.ibm.com/privacy/details thesection entitled “Cookies, Web Beacons and Other Technologies” and the “IBMSoftware Products and Software-as-a-Service Privacy Statement” athttp://www.ibm.com/software/info/product-privacy.
Notices 587

588 ITCAM Agents for WebSphere Applications, J2EE, and HTTP Servers: User Guide


����
Printed in USA
SC27-2817-03
Related Documents