ITC 6 European Country Survey Wave 1 Technical Report February 1, 2017 This project has received funding from the European Union’s Horizon 2020 research and innovation programme under grant agreement No 681109

Welcome message from author
This document is posted to help you gain knowledge. Please leave a comment to let me know what you think about it! Share it to your friends and learn new things together.
Transcript
ITC 6 European Country Survey
Wave 1 Technical Report
February 1, 2017
This project has received funding from the European Union’s Horizon 2020research and innovation programme under grant agreement No 681109

ITC 6 European Country Research TeamDr. Constantine Vardavas1, Principal Investigator and EUREST-PLUS CoordinatorDr. Ute Mons2, Principal Investigator, GermanyDr. Yannis Tountas3, Principal Investigator, GreeceMr. Tibor Demjén4, Principal Investigator, HungaryMr. Krzysztof Przewozniak5, Principal Investigator, PolandDr. Witold Zatonski5, Principal Investigator, PolandDr. Antigona Trofor6, Principal Investigator, RomaniaDr. Esteve Fernandez7, Principal Investigator, SpainMr. Nicolas Bécuwe8, Principal Investigator, BelgiumMs. Sophie Goudet8, Co-investigator, BelgiumMr. Christopher Hanley8, Data Analyst. Belgium
ITC 6 European Country International Research TeamProfessor Geoffrey T. Fong9, Principal Investigator, CanadaProfessor Mary E. Thompson10, Co-Investigator, CanadaDr. Shannon Gravely9, Co-Investigator, CanadaDr. Anne C.K. Quah9, Co-investigator, CanadaMr. Thomas Agar9, Project Manager, CanadaMr. Pete Driezen9, Senior Data Analyst, Canada
1 European Network on Smoking and Tobacco Prevention2 German Cancer Research Center3University of Athens, Medical School4 Smoking or Health Hungarian Foundation (SHHF)5 Health Promotion Foundation6 Aer Pur Romania7 Institut CatalÃa dâAZOncologia8 Kantar Public9 Department of Psychology, University of Waterloo10 Department of Statistics and Actuarial Science, University of Waterloo
Funding: The ITC 6 European Country Project has received funding support from:
• European Union’s Horizon 2020 Program (Grant No. 681109 - Vardavas)• University of Waterloo, Canada (Grant No. 118096 - Fong)
Suggested Citation: ITC Project. (2017, January). ITC 6 European Country Wave 1 (2016)Technical Report. University of Waterloo, Waterloo, Ontario, Canada, and European Net-work on Smoking and Tobacco Prevention, Brussels, Belgium.
2 | ITC 6 European Country Wave 1 Technical Report

CONTENTS
Contents
Preface 5
1 Introduction 6
1.1 Background . . . . . . . . . . . . . . . . . . . . . . . . . . . . . . . . . . . . . . . . 6
1.2 Main Objectives . . . . . . . . . . . . . . . . . . . . . . . . . . . . . . . . . . . . . . 7
1.3 Survey Design . . . . . . . . . . . . . . . . . . . . . . . . . . . . . . . . . . . . . . . 9
1.4 The Research Team . . . . . . . . . . . . . . . . . . . . . . . . . . . . . . . . . . . . 9
1.5 Country Timelines . . . . . . . . . . . . . . . . . . . . . . . . . . . . . . . . . . . . 10
2 Survey Process, Protocols and Fieldwork 23
2.1 Survey Process . . . . . . . . . . . . . . . . . . . . . . . . . . . . . . . . . . . . . . . 23
2.2 Replenishment Participant Selection and Consent . . . . . . . . . . . . . . . . . 23
2.3 Household Screener Survey . . . . . . . . . . . . . . . . . . . . . . . . . . . . . . . 24
2.4 Main Questionnaire . . . . . . . . . . . . . . . . . . . . . . . . . . . . . . . . . . . 24
2.4.1 Screeners . . . . . . . . . . . . . . . . . . . . . . . . . . . . . . . . . . . . . . 24
2.4.2 Content of Survey . . . . . . . . . . . . . . . . . . . . . . . . . . . . . . . . . 25
2.4.3 Language of Survey . . . . . . . . . . . . . . . . . . . . . . . . . . . . . . . . 25
2.4.4 Length of the Interview . . . . . . . . . . . . . . . . . . . . . . . . . . . . . 25
2.5 Remuneration . . . . . . . . . . . . . . . . . . . . . . . . . . . . . . . . . . . . . . . 25
2.6 Progress Report . . . . . . . . . . . . . . . . . . . . . . . . . . . . . . . . . . . . . . 26
2.6.1 Survey Translation . . . . . . . . . . . . . . . . . . . . . . . . . . . . . . . . 26
2.6.2 Field Work Preparation and Interviewer Training . . . . . . . . . . . . . . 26
2.6.3 Survey Fieldwork . . . . . . . . . . . . . . . . . . . . . . . . . . . . . . . . . 26
2.6.4 Questionnaire Checking . . . . . . . . . . . . . . . . . . . . . . . . . . . . . 27
2.6.5 Data Checking and Cleaning . . . . . . . . . . . . . . . . . . . . . . . . . . 28
2.6.6 Data Delivery . . . . . . . . . . . . . . . . . . . . . . . . . . . . . . . . . . . 28
ITC 6 European Country Wave 1 Technical Report | 3

CONTENTS
3 Monitoring and Quality Control 29
3.1 Management of Fieldwork Teams . . . . . . . . . . . . . . . . . . . . . . . . . . . 29
3.2 Survey Protocol . . . . . . . . . . . . . . . . . . . . . . . . . . . . . . . . . . . . . . 29
3.3 Monitoring and Quality Assurance . . . . . . . . . . . . . . . . . . . . . . . . . . . 29
3.4 Handling Special Situations . . . . . . . . . . . . . . . . . . . . . . . . . . . . . . . 30
4 Sampling Design and Weight Construction 31
4.1 Sampling design . . . . . . . . . . . . . . . . . . . . . . . . . . . . . . . . . . . . . . 31
4.2 Weight construction . . . . . . . . . . . . . . . . . . . . . . . . . . . . . . . . . . . 32
4.2.1 General comments about weight construction . . . . . . . . . . . . . . . . 32
4.2.2 Wave 1 weights . . . . . . . . . . . . . . . . . . . . . . . . . . . . . . . . . . 33
4.3 Taking the sampling design into account in analyses . . . . . . . . . . . . . . . . 36
4.3.1 Specification of strata and PSUs for analyses . . . . . . . . . . . . . . . . . 36
4.3.2 Bootstrap weights . . . . . . . . . . . . . . . . . . . . . . . . . . . . . . . . . 37
Appendices 39
A Sample size tables 39
B Benchmark/calibration figures 39
C Summary statistics of the weights 58
D Field materials 63
E Survey information letter and consent 63
F Final outcomes rates 67
G Country profiles 69
4 | ITC 6 European Country Wave 1 Technical Report
CONTENTS
Preface
This technical report documents the first wave of the International Tobacco Control PolicyEvaluation Survey carried out in Germany, Greece, Hungary, Poland, Romania, and Spain.This project is known as the ITC 6 European Country Project (6E) under the larger projectcalled European Regulatory Science on Tobacco: Policy Implementation to Reduce LungDisease (EUREST-PLUS). Wave 1 was conducted from June to September 2016.
This report also presents the weight calculations for the Wave 1 respondents.
ITC 6 European Country Wave 1 Technical Report | 5
1 INTRODUCTION
1 Introduction
1.1 Background
The International Tobacco Control (ITC) Project is a multi-country prospective cohort studydesigned to measure the psychosocial and behavioural impact of key policies of the WorldHealth Organization (WHO) Framework Convention on Tobacco Control (FCTC).
Germany, Greece, Hungary, Poland, Romania, and Spain make up the six countries of theITC 6 European Country Project (6E). Hungary was the first state to ratify the FCTC in April2004, followed by Germany in December of that year. Spain ratified the FCTC in January2005. Greece was next to ratify the FCTC in January 2006, followed by the remaining states(Poland and Romania) in September 2006. In addition to the FCTC, each country is a partyof the European Union, and as such must also comply with the European Commission’sTobacco Products Directive (TPD), the latest of which was made law in 2014 with a compli-ance date of May 20, 2016. Previous to the TPD of 2014 was the TPD of 2001, under whichall six European States had to meet minimum standards of tobacco labelling and packagingrestrictions, as well as regulations regarding cross-border trading and product ingredients.The latest TPD (2014) sets regulations on the following areas:
(i) Ingredients and emissions, including maximum emission levels on tar, nicotine, andCO2, as well as restrictions on additives such as flavours and stimulants
(ii) Labelling and packaging restrictions, setting minimum dimensions for packages oftobacco as minimum standards on graphic (combined) tobacco health warning labels
(iii) Traceability and security measures to combat illegal cigarette smuggling and counter-feit products
(iv) Cross-border purchase regulations(v) E-cigarette product regulations including pan-European restrictions on the amount
of nicotine allowed within e-cigarettes/e-liquid, product design elements such as reser-voir sizes, and more.
To evaluate the effect of the FCTC and the TPD (2014), the ITC Project is conducting the ITC6E Project as part of the European Regulatory Science on Tobacco: Policy Implementation toReduce Lung Disease (EUREST PLUS) Project. The main objective of EUREST-PLUS Projectis to monitor and evaluate the impact of the implementing acts of the TPD and assess thesewithin the context of FCTC ratification at a European level.
The ITC 6E Project will run two prospective cohort surveys which will parallel surveys ofadult smokers in 22 other ITC countries—(Canada, United States, United Kingdom, Aus-tralia, Ireland, Thailand, Malaysia, China, South Korea, New Zealand, Mexico, Uruguay,France, The Netherlands, Brazil, Mauritius, Bangladesh, Bhutan, India, Kenya, Zambia, andAbu Dhabi – United Arab Emirates).
The ITC 6 European Country Wave 1 Survey was carried out from June to September 2016.
6 | ITC 6 European Country Wave 1 Technical Report
1 INTRODUCTION
1.2 Main Objectives
Representing three of the seven work packages (WP) of the EUREST-PLUS Project, the ITC6 European Country Project is key to meeting the overall EUREST-PLUS objectives. Thoseobjectives are:
a) To evaluate the psychosocial and behavioral impact of TPD implementation and FCTCimplementation, through the creation of a longitudinal cohort of adult smokers in 6EU MS (Germany, Greece, Hungary, Poland, Romania, and Spain; total n=6000) in apre- vs. post-TPD study design (Work Package, or WP, 2 and 3). Moreover, these eval-uation studies of the impact of the TPD and FCTC will be conducted with respect tovulnerable populations, including low-income/socio-economic status (SES) groupsand those smokers with respiratory co-morbidities (and/or those with pre-morbidsymptomatology). Another important topic that will be addressed in the scientificstudies of the ITC 6E cohorts will be a focus on e-cigarettes, addressing basic issues oftransition rates from cigarettes to e-cigarettes or dual use, rates of reversion back tocigarettes and rates of quitting all nicotine products. Studies that examine e-cigaretteswill be linked to additional analysis, focussing on product testing of various designfeatures of e-cigarettes systematically procured in those same 6 countries where theITC 6 European Country Surveys will be conducted.
b) To assess support for TPD implementation through secondary dataset analyses of the2015 Special Eurobarometer on Tobacco Survey (SETS), a cross-sectional survey per-formed among 27,000 adults in all 28 EU MS, before the TPD is implemented, and tomonitor progress in FCTC implementation in the EU over the past years through trendanalyses on the merged datasets of the 2009, 2012 and 2015 SETS datasets (n=80,000),with a special focus on vulnerable populations (youth, minorities, unemployed, etc.)(WP5)
c) To document changes in e-cigarette product parameters (technical design, labelling/packaging and chemical composition) following TPD implementation of Article 20 ofthe TPD. (WP6)
d) To enhance innovative joint research collaborations on chronic, non-communicablediseases (NCDs) in low- and middle-income countries (LMICs) and in vulnerable pop-ulations in high-income countries (HICs), a key priority of the Global Alliance forChronic Disease (GACD) outlined in the call. We will specifically address these cross-country analyses through the pooling and comparisons across both other EU coun-tries of the ITC Project (6E, UK, France, Netherlands), and other non-EU countriesfrom LMICs and HICs from the global ITC Project (including key countries of com-parison such as Australia, Canada, New Zealand, United States, China). (WP4)
ITC 6 European Country Wave 1 Technical Report | 7

1 INTRODUCTION
The objectives of the ITC 6 European Country Survey are:
a. To examine the prevalence and patterns of tobacco use in all six European States.The ITC 6 European Country Survey provides multidimensional estimates of preva-lence and patterns of tobacco use among the populations of all six participating states.It describes the consumption patterns and quitting behaviour within each country’spopulation, as well as each population’s knowledge, beliefs, and attitudes about to-bacco use. As well, the survey investigates each country’s growth or absence of aware-ness and use of electronic cigarettes (e-cigarettes).
b. To examine the impact of the Tobacco Products Directive (2014) in all 6 countriesthroughout the course of the study period. The ITC 6E Survey evaluates the impactof the TPD in the following areas:
• Health warning labels and package descriptors• Tobacco ingredients and additives• Cross-border sales of tobacco products• E-cigarette use and behaviour
The survey also evaluates the impact of the FCTC in the following areas:
• Smoke-free legislation• Pricing and taxation of tobacco products, as well as the prevalence of compen-
satory behaviours that may offset the impact of taxation (e.g., cheaper purchas-ing options, smuggling)
• Education and support for cessation• Tobacco advertising and promotion
This report provides a detailed picture of the current tobacco control policy landscapein all six European countries, including cigarette smokers and e-cigarette users’ be-liefs, attitudes, and behaviours, following the passage of the TPD in 2014.
c. To compare smoking behaviour and the impact of policies between the 6 Europeancountries and other ITC countries. The ITC Project aims to provide an evidence baseto guide policies enacted under the FCTC, and to systematically evaluate the effective-ness of these legislative efforts. All ITC Surveys are developed using the same concep-tual framework and methods, and the survey questions are designed to be identicalor functionally equivalent in order to allow strong comparisons across countries. Theevaluation studies conducted from the ITC Surveys take advantage of natural environ-ments created when an ITC country implements a policy: changes in policy-relevantvariables in that country from pre- to post-policy survey waves are compared to thosein other ITC countries where that policy has not changed. This research design pro-vides high levels of internal validity, allowing more confident judgments regarding thepossible causal impact of the policy.
8 | ITC 6 European Country Wave 1 Technical Report
1 INTRODUCTION
d. To suggest changes to current European tobacco policies. Recommendations tostrengthen the current tobacco policies are made based on existing and derived sur-vey information. The aim is to optimise the effects of tobacco control policies with re-gard to situational and individual difference moderators: (a) demographic variables;(b) personality variables (e.g. time perspective); (c) environmental context (e.g. num-ber of peers/family members who smoke); and (d) the individual’s smoking history(e.g. past quit attempts, smoking intensity and quitting smoking).
1.3 Survey Design
The ITC 6E Survey is a longitudinal cohort study. In other words, the respondents who par-ticipate in this survey will be re-contacted in the future to participate in follow-up surveys.The respondents were recruited through a face-to-face multi-stage stratified random sam-ple of the general population aged 18 or more.
1.4 The Research Team
The ITC 6 European Country Survey is conducted by researchers throughout Europe fromboth the six participating countries as well as other institution partners within Europe andabroad.
Investigators Organization Country
1. Constantine Vardavas(coordinator)
European Network on Smoking and Tobacco Pre-vention (ENSP)
Belgium
2. Ann McNeill Kings College London (KCL) United Kingdom3. Ute Mons German Cancer Research Center (DKFZ) Germany4. Marc Willemsen University of Maastricht (UniMaas) Netherlands5. Yiannis Tountas University of Athens (UoA) Greece6. Antigona Trofor Aer Pur Romania (APR) Romania7. Brian Ward European Respiratory Society (ERS) Switzerland8. Geoffrey Fong University of Waterloo (UW) Canada9. Esteve Fernandez Institut Català d’Oncologia (ICO) Spain10. Tibor Demjén Smoking or Health Hungarian Founation (SHFF) Hungary11. Witold Zatonski Health Promotion Foundation Poland12. Aristidis Tsatsakis University of Crete (UoC) Greece13. Nicolas Bécuwe Kantar Public Brussels (KP) Belgium
ITC 6 European Country Wave 1 Technical Report | 9

1 INTRODUCTION
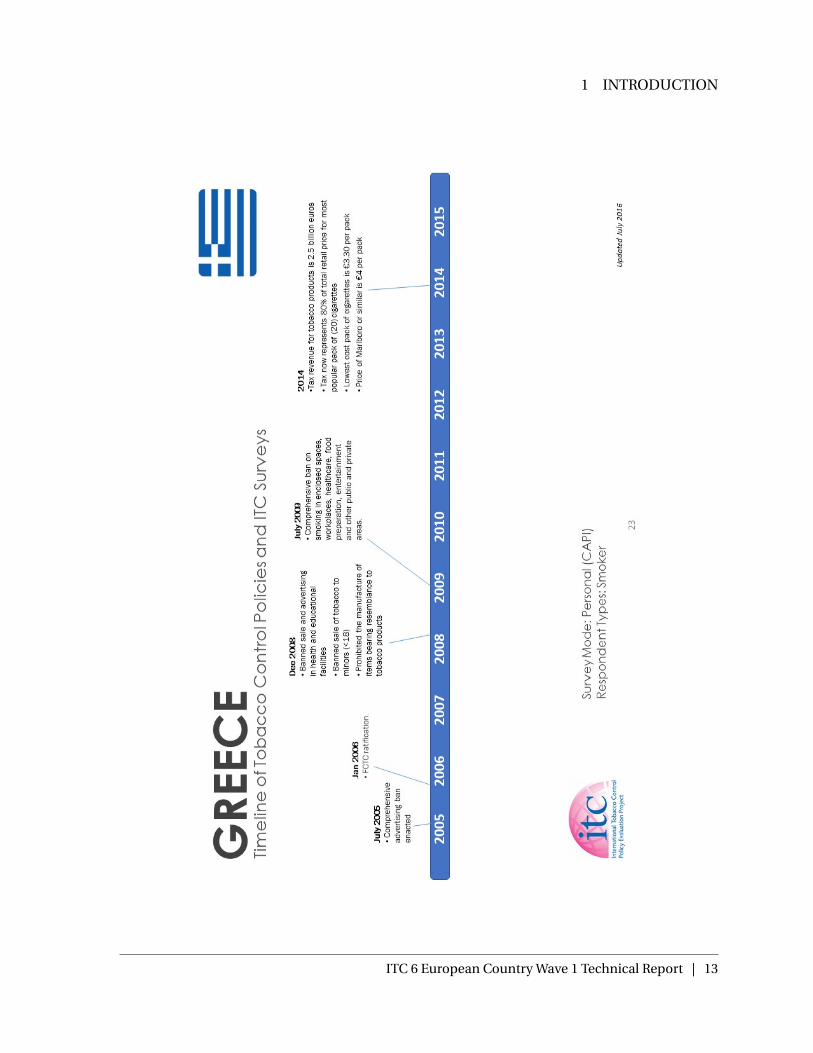
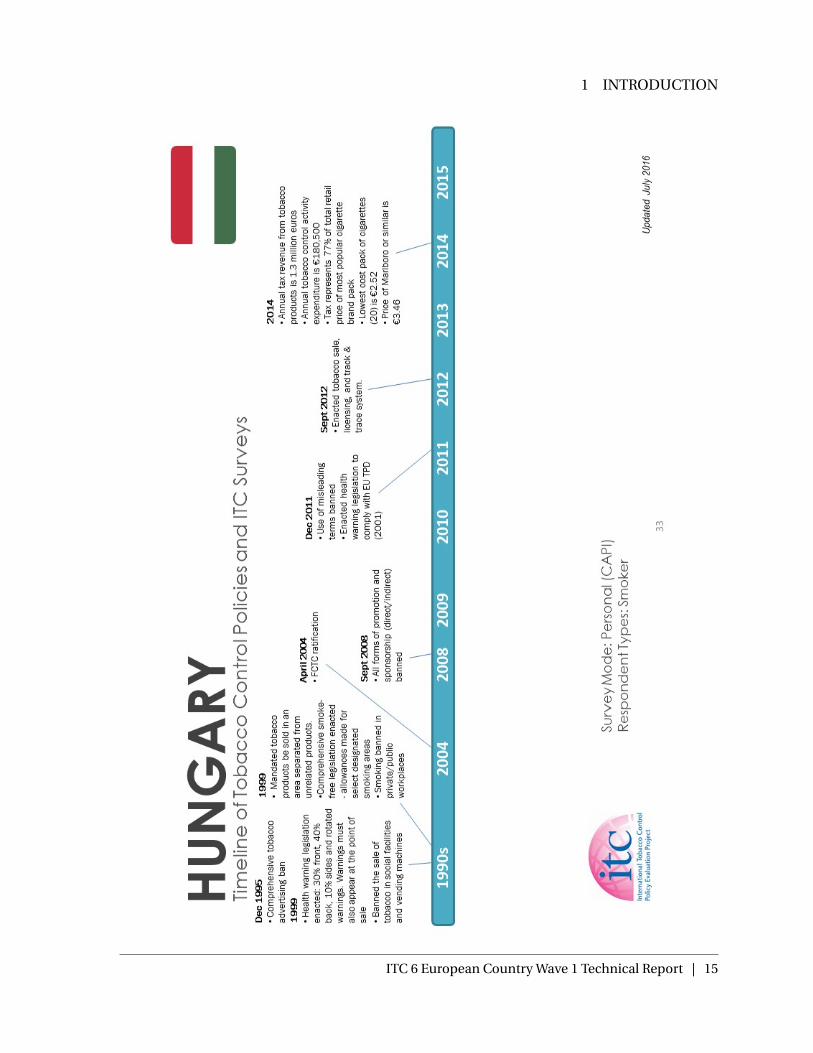
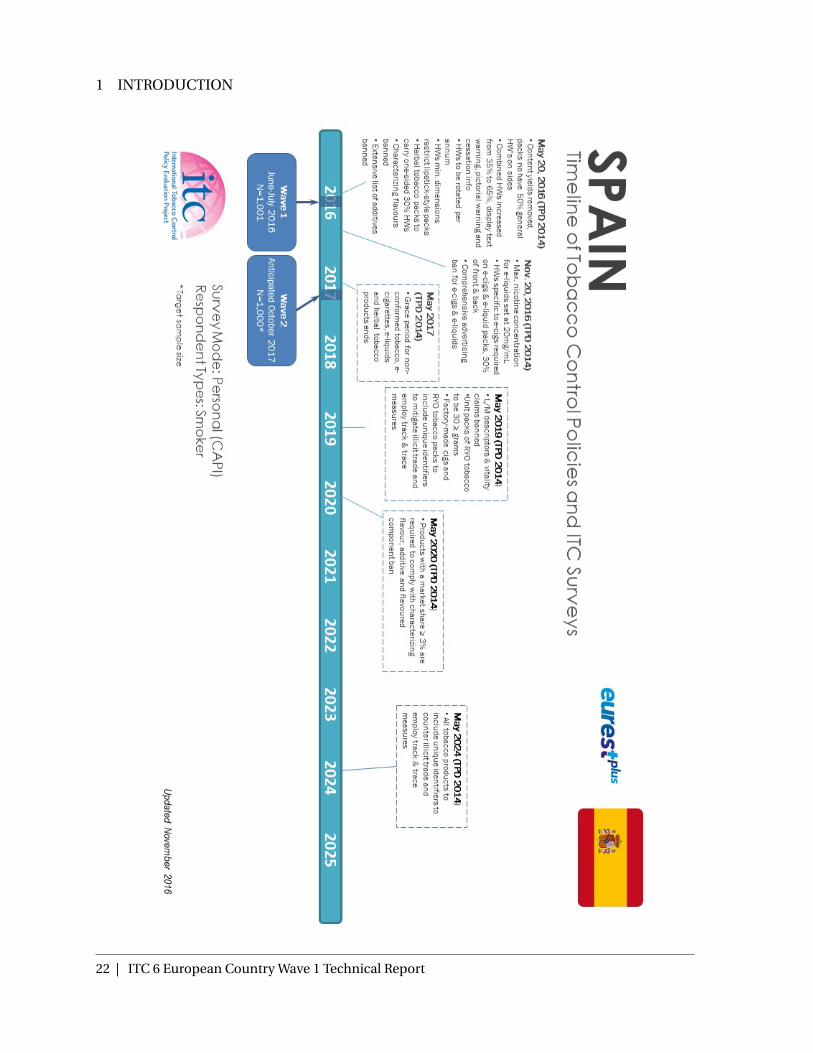
1.5 Country Timelines
Below are the timelines in conjunction with the tobacco control policies and ITC wave foreach of the 6 countries.
10 | ITC 6 European Country Wave 1 Technical Report

1 INTRODUCTION
ITC 6 European Country Wave 1 Technical Report | 11

1 INTRODUCTION
12 | ITC 6 European Country Wave 1 Technical Report
1 INTRODUCTION
ITC 6 European Country Wave 1 Technical Report | 13

1 INTRODUCTION
14 | ITC 6 European Country Wave 1 Technical Report
1 INTRODUCTION
ITC 6 European Country Wave 1 Technical Report | 15

1 INTRODUCTION
16 | ITC 6 European Country Wave 1 Technical Report

1 INTRODUCTION
ITC 6 European Country Wave 1 Technical Report | 17

1 INTRODUCTION
18 | ITC 6 European Country Wave 1 Technical Report

1 INTRODUCTION
ITC 6 European Country Wave 1 Technical Report | 19

1 INTRODUCTION
20 | ITC 6 European Country Wave 1 Technical Report

1 INTRODUCTION
ITC 6 European Country Wave 1 Technical Report | 21
1 INTRODUCTION
22 | ITC 6 European Country Wave 1 Technical Report
2 SURVEY PROCESS, PROTOCOLS AND FIELDWORK
2 Survey Process, Protocols and Fieldwork
2.1 Survey Process
The ITC 6 European Country Wave 1 fieldwork was managed and coordinated by KantarPublic Brussels. The fieldwork was conducted in the 6 European countries by the followingagencies: Foerster and Thelen (Germany), Metron Analysis (Greece), Kantar TNS Hoffman(Hungary), Kantar TNS Polska (Poland), Curs (Romania) and Kantar TNS Spain (Spain).
The ITC 6 European Country Wave 1 Survey fieldwork consisted of 7 main steps (see Ap-pendix B). The interviewers:
1. Approached a household and introduced themselves;2. Administered the Household Screener Survey to the Most Knowledgeable Individual
(MKI);3. Had each selected respondent read the information letter and obtained the respon-
dent’s consent;4. Administered a survey screener to each selected respondent;5. Completed the respondents’ individual questionnaires;6. Completed the individual outcome codes in the HRF/HEF Form B;7. Thanked the respondents and provided a token of appreciation to the household. For
each household of respondents, the respondent was presented with a token of appre-ciation of varying value dependent on the country as remuneration for their time (SeeSection 2.5 for remuneration amounts).
2.2 Replenishment Participant Selection and Consent
Identifying eligible members. Adult cigarette smokers formed the only category of eligi-ble respondents in a household.
Selection of household members. Household members aged 18 years and older were sam-pled. From households with cigarette smokers, up to one male and one female cigarettesmoker were selected using the last birthday method of selection for each.
Information and consent. Once a respondent was selected, the information letter wasprovided and consent was administered to the respondent (See Appendix B).
ITC 6 European Country Wave 1 Technical Report | 23

2 SURVEY PROCESS, PROTOCOLS AND FIELDWORK
Table 1. Percentage of respondents who consented to take part in the second wave (Autumn2017)
ConsentingCountry National Agency Respondents (%)
Germany Foerster and Thelen 93%Greece Metron Analysis 69%Hungary Kantar TNS (TNS Hoffmann) 60%Poland Kantar TNS (TNS Polska) 70%Romania Curs 95%Spain Kantar TNS Spain 97%
2.3 Household Screener Survey
In each selected household that contained eligible adult smokers, the identified key Infor-mant or Most Knowledgeable Individual was given a brief Household Screener, from whichrespondents were selected. The purpose of the household screener was to identify residentsof the household who fit the screening criteria of the project: (1)18 years or older; (2) smokeat least monthly.
If the Key Informant/Most Knowledgeable Individual was available at the first householdvisit, the Household Screener was administered, and then the individual household mem-bers were selected and interviewed if possible. If not, an appointment was made to comeback to complete the Household Screener.
2.4 Main Questionnaire
2.4.1 Screeners
After completing the Household Screener and before administering the appropriate indi-vidual questionnaires, each selected respondent was given an individual survey screener.This screener confirms the information supplied by the Most Knowledgeable Individual atthe individual level.
24 | ITC 6 European Country Wave 1 Technical Report

2 SURVEY PROCESS, PROTOCOLS AND FIELDWORK
2.4.2 Content of Survey
A summary of the survey questions is given below:
• Demographic questions (e.g., age, gender, education, income, socio-economic sta-tus);
• Questions relevant to the policies of interest. These include measures of awareness(e.g., of warning labels, product ingredients, cessation assistance, advertising and pro-motion, prices, and e-cigarettes) and, where relevant, of more extensive cognitive pro-cessing (e.g., thinking about health warnings, relative harm between alternative prod-ucts);
• Moderator variables (e.g., time perspective, stress, co-morbidities);• Well-established questions assessing smoking behaviour;• Other important psychosocial predictors of smoking behaviour (psychosocial medi-
ating variables, e.g., normative beliefs, self-efficacy, intentions to quit).
2.4.3 Language of Survey
The survey questionnaire was translated into the national languages of all six participatingcountries: German; Greek; Hungarian; Polish; Romanian; and Spanish.
2.4.4 Length of the Interview
The survey was conducted by a face-to-face interview with the respondent. It took about 35minutes to complete the survey questionnaire.
2.5 Remuneration
Interviewees were given the token of appreciation upon completion of the interview. Re-ceipt of the token of appreciation was recorded by the interviewer as part of the post-interviewsection of the questionnaire. The interviewer had to confirm in the script that the respon-dent had received his or her voucher. Remuneration amounts in each country are listed inTable 2.
ITC 6 European Country Wave 1 Technical Report | 25

2 SURVEYPROCESS,PROTOCOLSANDFIELDWORK
Table2.Remunerationamountsineachcountry
Country NationalAgency Incentive( )
Germany FoersterandThelen 10
Greece MetronAnalysis 5
Hungary KantarTNS(TNSHoffmann) 10
Poland KantarTNS(TNSPolska) 10
Romania Curs 7
Spain KantarTNSSpain 3
2.6 ProgressReport
2.6.1 SurveyTranslation
AllthesurveysforWave1fieldworkwerefinalizedbytheendofMay2016.Translationof
thesurveydocumentsintothesixnationallanguagesalsotookplaceoverthecourseofthe
monthofMay.TranslationwashandledinhousebythesurveyfirmKantarPublicBrussels.
Thetranslationprocessusedwasthefollowing:firstthequestionnairewastranslatedby
anindependenttranslator.Thenthisversionwasrevisedtwice:firstbyanindependent
proof-readerandthenbythenationalagencyprojectmanager. Whenthetranslationwas
finaliseditwassentforapprovaltothenationalmembersoftheConsortiumwhosenttheir
finalcommentsandagreements.
2.6.2 FieldWorkPreparationandInterviewerTraining
ThesurveyfirmKantarPublicBrusselshandledallfieldworkpreparationwithinthesix
countriesoverthemonthofJune2016.RepresentativesfromKantarPublicBrusselstrained
localcountryteamstousethetablet-basedCAPIsurvey,aswellasensuringfieldworkoper-
atorsfollowedtheproperproceduresoutlinedintheprotocol.
2.6.3 SurveyFieldwork
ThefieldworkstartedonJune16,2016andcontinueduntilSeptember12,2016.Duetothe
internationalnatureoftheproject,eachcountryhadvaryingstartandcompletiondates.
Table3outlinesthefieldworkdateswithineachcountry.
26|ITC6EuropeanCountryWave1TechnicalReport

2 SURVEY PROCESS, PROTOCOLS AND FIELDWORK
Table 3. ITC Europe fieldwork dates (2016).
Country National Agency Fieldwork Dates
Germany Foerster and Thelen June 15–August 30Greece Metron Analysis June 16–September 12Hungary Kantar TNS (TNS Hoffmann) June 22–July 20Poland Kantar TNS (TNS Polska) June 25–August 11Romania Curs June 25–August 8Spain Kantar TNS Spain June 23–July 21
Fieldwork in Athens, Greece had to be suspended for one week during the month of Au-gust (August 12 – August 19) due to much of the population being away in mid-August, acommon vacation period. Fieldwork was concluded on September 12, 2016.
In Romania, extra call backs were conducted between September 2 and September 12 to askBQ49221 (Q76.9) that could not be asked during the face-to-face survey. 789 respondentsout of 1003 were reached and asked this question.
The total number of respondents completing the survey in each country and the size of thefield work teams are listed in Tables 4 and 5, respectively.
Table 4. Total respondents completing the ITC Europe Survey in each country
Country National Agency # Completes
Germany Foerster and Thelen 1003Greece Metron Analysis 1000Hungary Kantar TNS (TNS Hoffmann) 1000Poland Kantar TNS (TNS Polska) 1006Romania Curs 1001Spain Kantar TNS Spain 1001
2.6.4 Questionnaire Checking
The final version of the English questionnaire was checked by Kantar Public Brussels. Com-ments were sent to University of Waterloo and then the questionnaire was finalised. Themaster script of the questionnaire was then built. The script was checked by Kantar PublicBrussels and sent for approval to the University of Waterloo.
Once the script was finalised in English, the national scripts were implemented and checkedby national agencies before implementing the survey.
ITC 6 European Country Wave 1 Technical Report | 27
2 SURVEY PROCESS, PROTOCOLS AND FIELDWORK
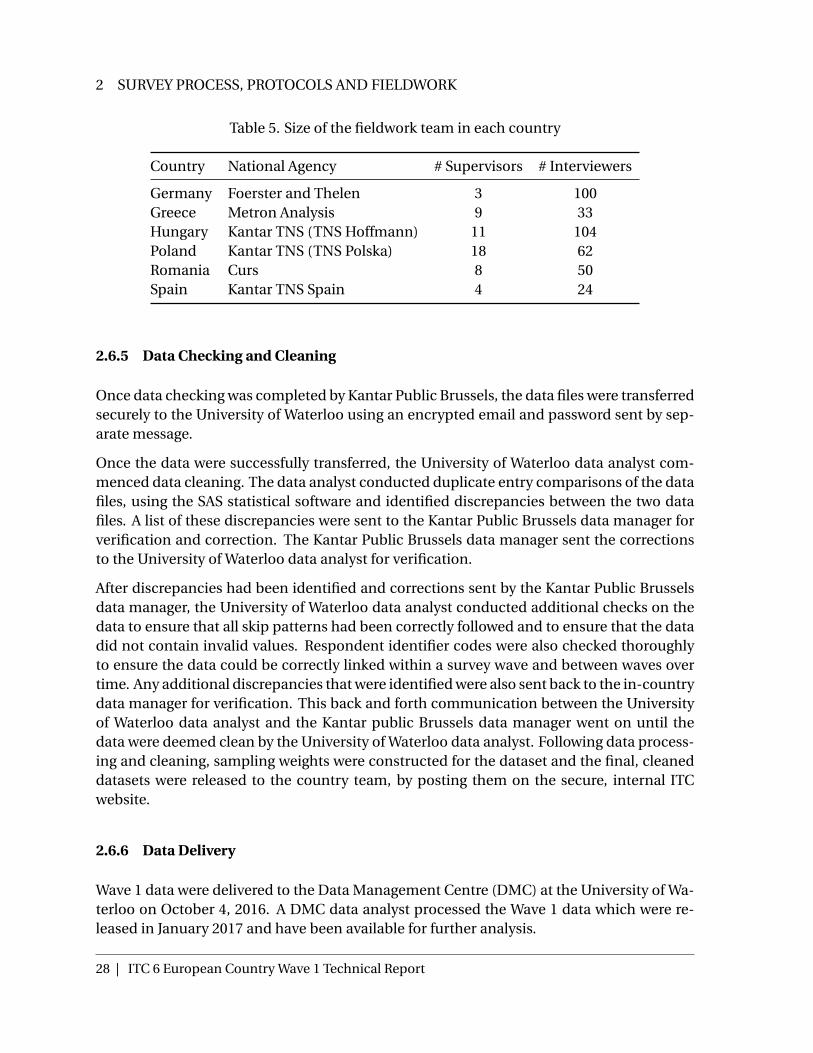
Table 5. Size of the fieldwork team in each country
Country National Agency # Supervisors # Interviewers
Germany Foerster and Thelen 3 100Greece Metron Analysis 9 33Hungary Kantar TNS (TNS Hoffmann) 11 104Poland Kantar TNS (TNS Polska) 18 62Romania Curs 8 50Spain Kantar TNS Spain 4 24
2.6.5 Data Checking and Cleaning
Once data checking was completed by Kantar Public Brussels, the data files were transferredsecurely to the University of Waterloo using an encrypted email and password sent by sep-arate message.
Once the data were successfully transferred, the University of Waterloo data analyst com-menced data cleaning. The data analyst conducted duplicate entry comparisons of the datafiles, using the SAS statistical software and identified discrepancies between the two datafiles. A list of these discrepancies were sent to the Kantar Public Brussels data manager forverification and correction. The Kantar Public Brussels data manager sent the correctionsto the University of Waterloo data analyst for verification.
After discrepancies had been identified and corrections sent by the Kantar Public Brusselsdata manager, the University of Waterloo data analyst conducted additional checks on thedata to ensure that all skip patterns had been correctly followed and to ensure that the datadid not contain invalid values. Respondent identifier codes were also checked thoroughlyto ensure the data could be correctly linked within a survey wave and between waves overtime. Any additional discrepancies that were identified were also sent back to the in-countrydata manager for verification. This back and forth communication between the Universityof Waterloo data analyst and the Kantar public Brussels data manager went on until thedata were deemed clean by the University of Waterloo data analyst. Following data process-ing and cleaning, sampling weights were constructed for the dataset and the final, cleaneddatasets were released to the country team, by posting them on the secure, internal ITCwebsite.
2.6.6 Data Delivery
Wave 1 data were delivered to the Data Management Centre (DMC) at the University of Wa-terloo on October 4, 2016. A DMC data analyst processed the Wave 1 data which were re-leased in January 2017 and have been available for further analysis.
28 | ITC 6 European Country Wave 1 Technical Report

3 MONITORING AND QUALITY CONTROL
3 Monitoring and Quality Control
3.1 Management of Fieldwork Teams
The project fieldwork team consisted of five levels of management, including:
• Project Manager: responsible for overseeing all aspects of the survey fieldwork (de-sign of the survey, sampling design and central briefing of national project managers),as well as administrative duties and communicating with the ITC Six European Coun-try team in Waterloo and the Project Consultants.
• Fieldwork Manager: responsible for managing the survey fieldwork in all 6 countries,setting up the central coordination of fieldwork (supply sample, load script), ensuringthe daily communication with national project manager and applying quality controlon a regular basis.
• Project Manager (Fieldwork): responsible for managing national fieldwork includingchecking national script, data quality control and proving weekly reporting on field-work progress.
• Field Supervisors: responsible for supervising the interviewers, contacting local au-thorities and monitoring the interviews.
• Interviewers: responsible for obtaining consent, interviewing respondents, and re-porting to the field supervisor with any problems.
3.2 Survey Protocol
An English survey protocol outlining the process in which fieldwork was to be conductedwas written to ensure a benchmark standard for fieldwork across each country. The surveyfirm, Kantar Public Brussels, relayed the information outlined in the survey protocol to thecountry teams developing a survey wave manual that was used for a central briefing
3.3 Monitoring and Quality Assurance
To ensure the accuracy and quality of the ITC Six European Country Survey, the survey field-work was monitored in several ways.
• Centralised data management: The fieldwork was centrally managed by Kantar Pub-lic Brussels. Data were centrally transmitted via NFIELD software and therefore Kan-tar Public Brussels were able to assess progress and access data on a regular basis.
ITC 6 European Country Wave 1 Technical Report | 29

3 MONITORING AND QUALITY CONTROL
• Progress Reports: The Project Manager was provided regular progress reports oncompletion rates and any problems or issues by the survey firm, Kantar Public Brus-sels. Those reports were then presented to the Data Management team on a weeklybasis.
• Field Supervision: The Field Supervisor was in charge of supervising the interviewers,helping them when they had a question regarding the contact procedure, the method-ology or the script and liaising with the national agency.
• Identification Numbers: Identification numbers would be generated automaticallyby the CAPI program. All interviews in the six countries were conducted on Tabletsusing the NFIELD software.
• Quality control at local level: 10% back checks on interviews conducted within aweek of completion (national institutes). Checks on coding (at least 10% of answersrecoded as part of overall quality back check). Comparison between raw samples andnational universe (central team). Ensuring item response is 100% within each com-pleted survey
3.4 Handling Special Situations
Private interviews. Adult participants were interviewed alone whenever possible. If an-other person insisted on being present, the respondent needed to agree for the interview toproceed.
Proxy interviews. A proxy interview is an interview conducted with another knowledge-able member of the household on behalf of the selected respondent. Proxy interviews werenot allowed in the ITC Six European Country Survey.
Respondent not available. If a respondent was unavailable, an appointment time (hardappointment) was rescheduled to interview that respondent.
Substitution. Only if a selected household was recorded to have the disposition “No oneat home” or “Cannot answer” for all four visits over four different times, (weekday day-time,weekday nighttime, weekend day-time and weekend night-time) could the household bereplaced by a substitute, selected by the Field Supervisor.
Handling multiple respondents. An interviewer could not interview two adults at the sametime.
30 | ITC 6 European Country Wave 1 Technical Report

4 SAMPLING DESIGN AND WEIGHT CONSTRUCTION
4 Sampling Design and Weight Construction
4.1 Sampling design
The ITC 6E Survey is a prospective longitudinal study, and its sampling design was chosento yield nationally representative random samples of adult smokers residing in Germany,Greece, Hungary, Poland, Romania and Spain. Respondents were interviewed between June18 and September 12, 2016. All interviews were conducted face-to-face by interviewers us-ing tablets (CAPI).
To qualify for the study, respondents had to be 18 years old or more, smoke at least monthly,and have smoked more than 100 cigarettes in their lives. In each country, a probabilitysample of dwellings was approached. At each dwelling, an informant was identified andasked the number of male smokers of at least 18 years of age and the number of femalesmokers of at least 18 years of age. Where possible a male smoker and a female smoker wereselected from each household, using the Next Birthday method (Binson & Catania (2000)).No substitution within a household was allowed, except when it was known that the selectedrespondent would be absent for the entire fieldwork period.
The probability sample of dwellings was chosen as follows in each country. The countrywas divided into major geographic regions, namely NUTS2 regions for all countries exceptGermany, where NUTS1 regions were used. (Excluded for Greece were the islands in theIonian Sea, the northern Aegean Sea and the southern Aegean Sea; excluded for Spain werethe Canaries, Ceuta and Melilla.) The geographic strata were the NUTS regions crossed withdegree of urbanization (urban, intermediate, rural). The strata were conceptually consid-ered to be a union of clusters, each the size of an enumeration area, with the objective ofsampling 100 clusters per country, and obtaining 10 adult smokers in each cluster. Clusterswere allocated to strata proportionally to 18+ population size, subject to requiring at leasttwo clusters in each stratum, and selected at random within each stratum.
In each selected cluster, a random walk method was to be used to select dwellings. A startingpoint was to be chosen at random using GPS coordinates, and a random walk path predrawnon a tablet; the interviewers were to follow the path and approach every fifth address onthe path, for household screening and potential selection of adult smokers for interview. Ifan address corresponded to multiple households, a single household was to be selected atrandom. For each chosen address, contact was attempted up to four times.
As indicated above, one randomly selected male smoker and one randomly selected femalesmoker were to be selected for interview from a household where possible. Screening ofhouseholds was to continue until the required number of smokers from the cluster had beeninterviewed.
The ITC 6E Wave 1 sample has the following sample sizes. Appendix A provides a detailedbreakdown of the sample size within each country by sampling region, degree of urbaniza-tion and sex-age group.
ITC 6 European Country Wave 1 Technical Report | 31

4 SAMPLING DESIGN AND WEIGHT CONSTRUCTION
Table 6. Country sample sizes
Country Sample Size
Germany 1003Greece 1000Hungary 1000Poland 1006Romania 1001Spain 1001
Overall 6011
4.2 Weight construction
4.2.1 General comments about weight construction
As with most survey weights, the ITC 6E Wave 1 weights are constructed to correct and ad-just for sample misrepresentation caused by unequal sampling probabilities, frame error(i.e., under-coverage and multiplicity), and non-response, as well as to improve precision ofestimates through the use of auxiliary information (e.g., smoking prevalences). We brieflydescribe these key concepts of weight construction in this section, but refer the reader toLevy & Lemeshow (2008), chapter 16, for more detailed information.
Basic design weights are defined as the reciprocals of selection probabilities, and thus adjustfor sample misrepresentation caused by unequal sampling probabilities. For example, asmoker residing alone has a probability of selection twice that of a smoker residing withanother smoker of the same sex, and thus will typically have a smaller weight to compensate.
The sampling frame is effectively a set of starting points within selected areas of each stra-tum, and may fail to cover some addresses. This is referred to as frame under-coverage, andcan result in non-coverage bias. To reduce non-coverage bias in the ITC 6E Survey, post-stratification adjustments have been performed on the sampling weights to ensure that, foreach stratum/sex/age group, the totals of the sampling weights are approximately equal toassumed benchmarks; see step 3 in section 4.2.2. Note that these benchmark figures arealso referred to as calibration or target figures, and thus the post-stratification adjustmentis also referred to as weight calibration.
If non-respondents behave differently than respondents, then inference based solely on thesample of respondents will be biased unless adjustments are made. The greater the ex-pected proportion of non-response, the greater this bias is likely to be. In the ITC 6E Survey,the post-stratification adjustments described in the above paragraph also adjust for non-response bias. It should be noted that if data are missing completely at random (MCAR, see
32 | ITC 6 European Country Wave 1 Technical Report
4 SAMPLING DESIGN AND WEIGHT CONSTRUCTION
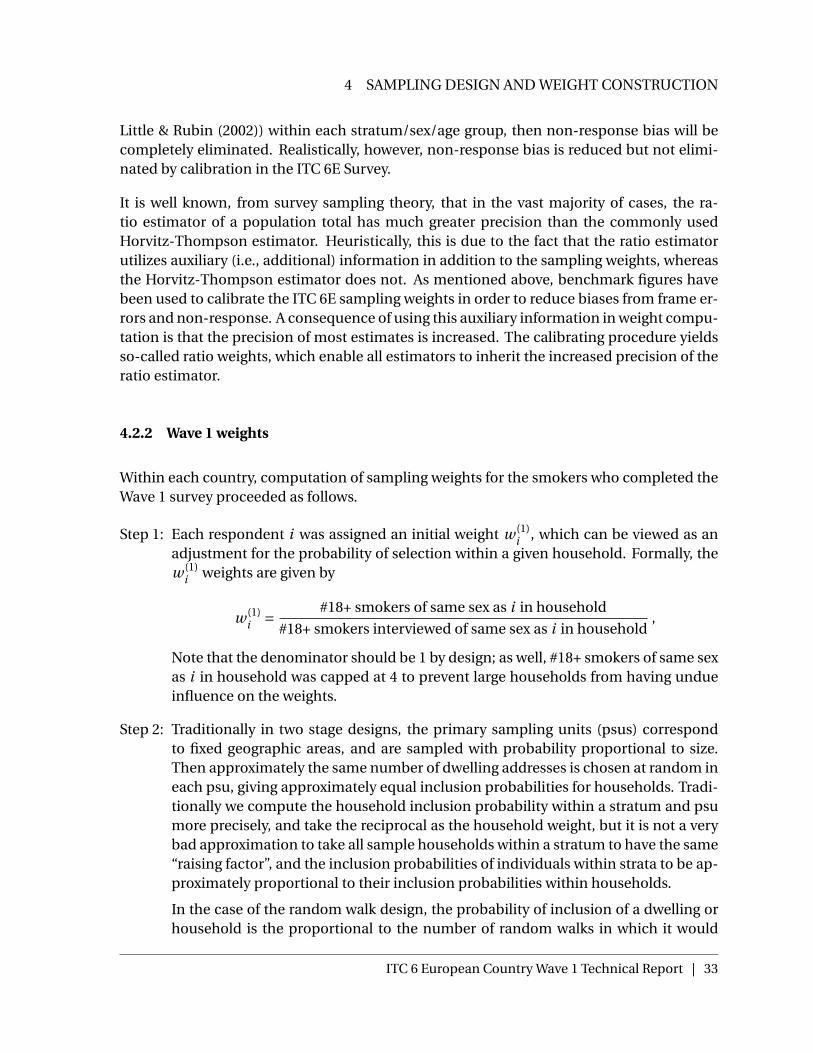
Little & Rubin (2002)) within each stratum/sex/age group, then non-response bias will becompletely eliminated. Realistically, however, non-response bias is reduced but not elimi-nated by calibration in the ITC 6E Survey.
It is well known, from survey sampling theory, that in the vast majority of cases, the ra-tio estimator of a population total has much greater precision than the commonly usedHorvitz-Thompson estimator. Heuristically, this is due to the fact that the ratio estimatorutilizes auxiliary (i.e., additional) information in addition to the sampling weights, whereasthe Horvitz-Thompson estimator does not. As mentioned above, benchmark figures havebeen used to calibrate the ITC 6E sampling weights in order to reduce biases from frame er-rors and non-response. A consequence of using this auxiliary information in weight compu-tation is that the precision of most estimates is increased. The calibrating procedure yieldsso-called ratio weights, which enable all estimators to inherit the increased precision of theratio estimator.
4.2.2 Wave 1 weights
Within each country, computation of sampling weights for the smokers who completed theWave 1 survey proceeded as follows.
Step 1: Each respondent i was assigned an initial weight w (1)i , which can be viewed as an
adjustment for the probability of selection within a given household. Formally, thew (1)
i weights are given by
w (1)i = #18+ smokers of same sex as i in household
#18+ smokers interviewed of same sex as i in household,
Note that the denominator should be 1 by design; as well, #18+ smokers of same sexas i in household was capped at 4 to prevent large households from having undueinfluence on the weights.
Step 2: Traditionally in two stage designs, the primary sampling units (psus) correspondto fixed geographic areas, and are sampled with probability proportional to size.Then approximately the same number of dwelling addresses is chosen at random ineach psu, giving approximately equal inclusion probabilities for households. Tradi-tionally we compute the household inclusion probability within a stratum and psumore precisely, and take the reciprocal as the household weight, but it is not a verybad approximation to take all sample households within a stratum to have the same“raising factor”, and the inclusion probabilities of individuals within strata to be ap-proximately proportional to their inclusion probabilities within households.
In the case of the random walk design, the probability of inclusion of a dwelling orhousehold is the proportional to the number of random walks in which it would
ITC 6 European Country Wave 1 Technical Report | 33

4 SAMPLING DESIGN AND WEIGHT CONSTRUCTION
be one of the sampled households. It cannot be computed from the informationavailable„ and thus we have taken the inclusion probabilities of households to beapproximately equal within strata, and the inclusion probabilities of individualswithin strata to be approximately proportional to their inclusion probabilities withinhouseholds.
Step 3: A post-stratification adjustment was then performed to calibrate the w (1)i weights
to smoking prevalence by stratum/sex/age groups. We used the same categories asused in the Eurobarometer surveys. To this end, age was divided into 3 intervals(i.e., [18, 39), [40, 54), and 55+ ); urbanization was divided into 3 categories: rural(U1), intermediate (U2), and cities/large urban area (U3).
Eurobarometer survey data from 2014 were used to model smoking prevalence, us-ing a weighted logistic regression of smoking status (binary) on sex, age group, ur-banization and NUTS region. A sex × age group interaction was also included. Thisyielded an estimated probability of being a smoker
p(s, a,u,r )
for someone with sex s, age group a, urbanization u and region r . (For this purpose,in Spain, Navarra and Basque Country were put together, as were Rioja and Aragon;in Germany, Bremen and Niedersachsen were put together; in each case, it was be-cause the smaller region had no smoker respondents in the Eurobarometer survey.In Spain, the smoking rate for Cantabria, with no Eurobarometer respondents, wastaken to be the average of the rates for Galicia and Asturias.)
The logistic regression analysis was restricted to Eurobarometer respondents aged18 and older.
Projections from census data for January 1, 2015, found at the Eurostat website (seethe tables in Appendix B), were used to estimate
N (s, a,u,r ),
the number of people of sex s, age group a, urbanization u and region r . Specifically,there are tables for:
(a) Population for each region (NUTS2), age (18+, by single year age category) andsex
(b) Number of households by region (NUTS2) by degree of urbanization
For Germany, it was possible to obtain the figures for the NUTS1 regions instead.
Using (b), and making the assumption that the population of individuals followsthe distribution of households by urban/intermediate/rural areas, it was possibleto multiply total population estimates for (a) by the proportion of the population in
34 | ITC 6 European Country Wave 1 Technical Report
4 SAMPLING DESIGN AND WEIGHT CONSTRUCTION
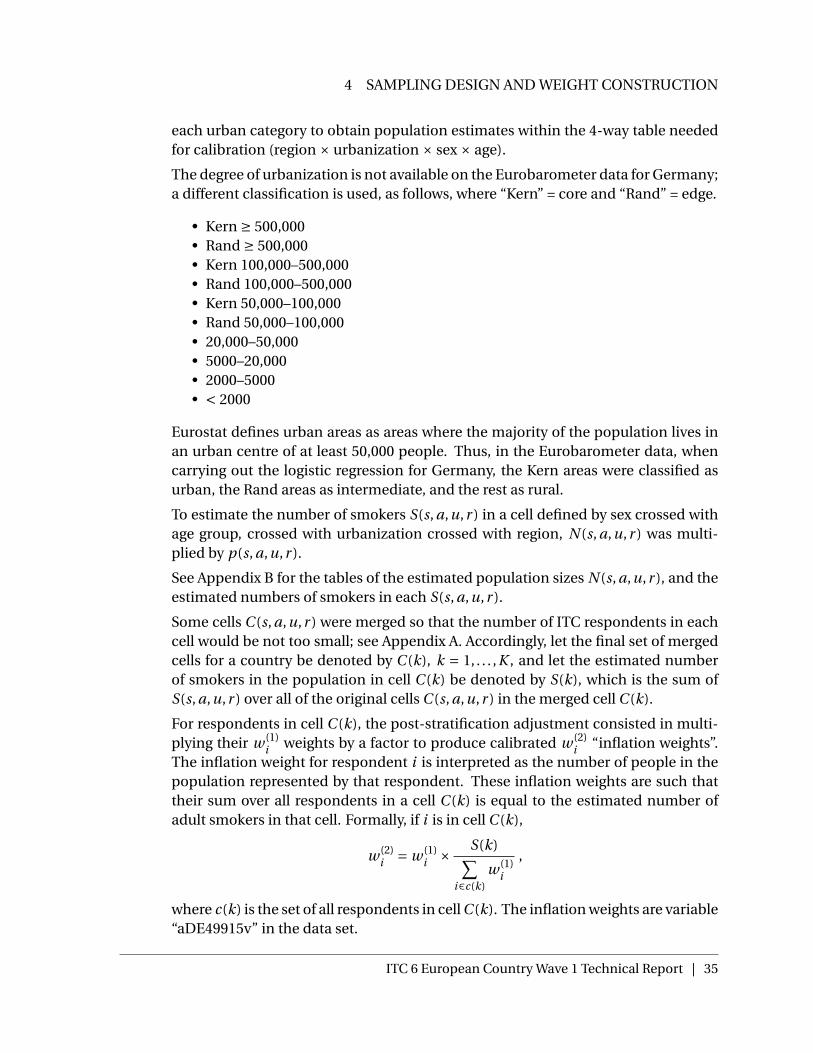
each urban category to obtain population estimates within the 4-way table neededfor calibration (region × urbanization × sex × age).
The degree of urbanization is not available on the Eurobarometer data for Germany;a different classification is used, as follows, where “Kern” = core and “Rand” = edge.
• Kern ≥ 500,000• Rand ≥ 500,000• Kern 100,000–500,000• Rand 100,000–500,000• Kern 50,000–100,000• Rand 50,000–100,000• 20,000–50,000• 5000–20,000• 2000–5000• < 2000
Eurostat defines urban areas as areas where the majority of the population lives inan urban centre of at least 50,000 people. Thus, in the Eurobarometer data, whencarrying out the logistic regression for Germany, the Kern areas were classified asurban, the Rand areas as intermediate, and the rest as rural.
To estimate the number of smokers S(s, a,u,r ) in a cell defined by sex crossed withage group, crossed with urbanization crossed with region, N (s, a,u,r ) was multi-plied by p(s, a,u,r ).
See Appendix B for the tables of the estimated population sizes N (s, a,u,r ), and theestimated numbers of smokers in each S(s, a,u,r ).
Some cells C (s, a,u,r ) were merged so that the number of ITC respondents in eachcell would be not too small; see Appendix A. Accordingly, let the final set of mergedcells for a country be denoted by C (k), k = 1, . . . ,K , and let the estimated numberof smokers in the population in cell C (k) be denoted by S(k), which is the sum ofS(s, a,u,r ) over all of the original cells C (s, a,u,r ) in the merged cell C (k).
For respondents in cell C (k), the post-stratification adjustment consisted in multi-plying their w (1)
i weights by a factor to produce calibrated w (2)i “inflation weights”.
The inflation weight for respondent i is interpreted as the number of people in thepopulation represented by that respondent. These inflation weights are such thattheir sum over all respondents in a cell C (k) is equal to the estimated number ofadult smokers in that cell. Formally, if i is in cell C (k),
w (2)i = w (1)
i × S(k)∑i∈c(k)
w (1)i
,
where c(k) is the set of all respondents in cell C (k). The inflation weights are variable“aDE49915v” in the data set.
ITC 6 European Country Wave 1 Technical Report | 35

4 SAMPLING DESIGN AND WEIGHT CONSTRUCTION
Step 4: To facilitate comparisons among the 6 countries and with other ITC countries, thew (2)
i weights were rescaled to have a mean equal to 1 in each country. This yielded
the “analytic” w (3)i weights, which are formally defined as
w (3)i = w (2)
i × nγ∑i∈Sγ
w (2)i
,
where Sγ is the set of all sampled smokers in country γ, and nγ is the size of thatsample from Table 1.
Hence, in each country γ, the w (3)i weights sum to nγ. The analytic weights are vari-
able “aDE49919v” in the data set.
The means and coefficients of variation (CVs) of the inflation weights in the six countriesare given in Appendix C.
4.3 Taking the sampling design into account in analyses
The inflation weights and analytic weights adjust for sampling bias in the estimation of pop-ulation means, ratios, regression coefficients, and more generally parameters that are de-fined as the solutions of population level estimating equations. Analyses of the data shouldalso take into account the fact that the sampling design within each country is both strat-ified (tending to increase efficiency) and two-stage at the household level (tending to de-crease efficiency because the sample is clustered in primary sampling units (PSUs). Thestatistical software packages SAS, SPSS, Stata, R and SUDAAN are able to produce standarderrors and hypothesis tests for basic analyses that account for the complex sampling design.In each case, the software requires the stratum and PSU variables and the weight variable tobe specified.
4.3.1 Specification of strata and PSUs for analyses
In the ITC 6E sampling design, in each of the countries there was at least one stratum witha single or “lonely PSU”. In such a case, there is no design-based unbiased estimator of thevariance of a linear estimator, such as an estimator of a population mean. Some softwarepackages, such as SAS, will simply omit from the analysis data from a stratum with a singlePSU. This makes the analysis representative only of the remaining strata. Other packages,such as SUDAAN, use a model-based assumption to allow the single-PSU stratum to con-tribute to the overall estimation of variance.
An alternative way of handling this situation is to collapse strata, most simply to merge eachsingle-PSU stratum with another that is geographically close to it and can be expected to
36 | ITC 6 European Country Wave 1 Technical Report

4 SAMPLING DESIGN AND WEIGHT CONSTRUCTION
have similar attributes. This choice of strata to merge is motivated by the need not to losetoo much of the advantage of stratification: if the two strata being merged have very differ-ent means, for example, the merging will make the standard error estimation blind to theefficiency gain from the original stratification, meaning that standard errors will tend to beoverestimated.
With the ITC 6E data, we have used the stratum collapsing technique, where possible merg-ing a single-PSU stratum with another which is within the same NUTS region and has thesame level of urbanization. The variable name for the collapsed strata or “variance strata”is “VARSTRAT”. The variable name for PSU is “VARPSU”.
4.3.2 Bootstrap weights
In another approach to accounting for the complex sampling design, we have provided a setof bootstrap weights, based on the Rao and Wu (1988) bootstrap technique, and constructedas follows.
For b = 1, . . . ,6000, we produced a b-th “column” of initial bootstrap weights, as follows.Within each variance stratum h as defined in Section 3.1, if there are nh sampled PSUs,we selected nh PSUs by simple random sampling with replacement. For each respondent(h, i , j ) in sampled PSU (h, i ), that person’s bootstrap weight whi j b is the main (inflation oranalytic) weight whi j times [1−λ1h + (number of times PSU (h, i ) has been “resampled”)×λ1h], where λ1h =√
nh/nh −1. The bootstrap weight whi j b will be 0 if (h, i ) was not resam-pled, 1 if (h, i ) was resampled once, a higher number if (h, i ) was resampled twice, and soon.
The columns of initial bootstrap weights were then averaged, 12 at a time, to produce 500averaged bootstrap weight variables. In the data set, the averaged analytic bootstrap weightsare named “RSBSW001” to “RSBSW500”.
Because of the fine stratification of the survey design, calibration of each of the initial 6000bootstrap weight columns with the same method as for the main weights was not feasible.At the same time, it was found that calibration of the averaged bootstrap weights led tounderestimation of standard errors as compared with the output of linearization methods.Thus neither the original 6000, nor the 500 averaged bootstrap weights which are providedwith the data, have been calibrated.
The averaged bootstrap weights can be used with complex survey software to produce stan-dard errors for various parameter estimates. Typically a BRR (balanced repeated replica-tion) option is used, because the formula for producing standard errors with BRR is eas-ily translated into the formula for producing standard errors in bootstrapping. A usefuldocument is “Weighted estimation and bootstrap variance estimation for analyzing sur-vey data: How to implement in selected software”, by Gagné, Roberts and Keown, at http:
ITC 6 European Country Wave 1 Technical Report | 37

REFERENCES
//www.statcan.gc.ca/pub/12-002-x/2014001/article/11901-eng.htm. The paper by Phillips(2004) explaining the Fay adjustment is available at http://www5.statcan.gc.ca/olc-cel/olc.action?ObjId=12-002-X20040027032&ObjType=47&lang=en&limit=0.
References
Binson, D. & Catania, J. A. (2000), Random selection in a national telephone survey: a com-parison of the Kish, next-birthday and last-birthday methods. Journal of Official Statis-tics, 16, 53-60.
Levy, P. S. & Lemeshow, S. (2008), Sampling of Populations: Methods and Applications, 4 edn,John Wiley & Sons, Hoboken, NJ.
Little, R. J. A. & Rubin, D. B. (2002), Statistical Analysis with Missing Data, 2 edn, John Wiley& Sons, Hoboken, NJ.
Phillips, O. (2004), Using bootstrap weights with WesVar and SUDAAN. Research Data Cen-tres, Information and Technical Bulletin, 1(2), 6-15.
Rao, J. N. K. & Wu, C. F. J. (1988), Resampling inference with complex survey data. Journal ofthe American Statistical Association, 83, 231-241.
38 | ITC 6 European Country Wave 1 Technical Report

APPENDICES
Appendices
A Sample size tables
A detailed set of sample size tables are available upon request that depict the total numberof respondents sampled in each country. Sample sizes in these tables are broken down bysampling region crossed with degree of urbanization crossed with sex and age group.
B Benchmark/calibration figures
The following tables show (a) the population estimates as of 2015-01-01 and (b) the esti-mated numbers of smokers in each country for region crossed with urbanization crossedwith sex and age group.
Projections from census data for January 1, 2015, found at the Eurostat website were usedto estimate the population numbers the number of people by region, urbanization, sex andage group. Specifically, there are tables for:
(a) Population for each region (NUTS2), age (18+, by single year age category) and sexhttp://ec.europa.eu/eurostat/web/population-demography-migration-projections/population-data/database
(b) Number of households by region (NUTS2) by degree of urbanizationhttp://ec.europa.eu/eurostat/web/degree-of-urbanisation/data/database– the number of households table can be found under the “Labour market” category.
Using (b), and making the assumption that the population of individuals follows the distri-bution of households by urban/intermediate/rural areas, it was possible to multiply totalpopulation estimates for (a) by the proportion of the population in each urban category toobtain population estimates within the 4-way table needed for calibration (region × urban-ization × sex × age).
Germany
ITC 6 European Country Wave 1 Technical Report | 39

APPENDICES
Table 7. Total population by degree of urbanization and age-sex group.
Men Women
Region 18–39 40–54 ≥55 18–39 40–54 ≥55
UrbanSchleswig-Holstein 89,810 87,488 121,525 88,173 88,563 142,914Hamburg 274,315 202,824 235,560 282,872 196,011 289,967Niedersachsen 265,469 244,947 333,752 253,669 243,232 392,266Bremen 97,618 73,888 100,530 92,860 70,766 124,587Nordrhein-Westfalen 1,177,584 1,041,964 1,375,304 1,150,138 1,037,419 1,662,517Hessen 270,246 237,373 308,814 264,987 233,977 362,859Rheinland-Pfalz 115,782 104,617 145,384 111,442 104,290 169,752Baden-Württemberg 417,631 349,509 450,890 398,497 343,131 531,690Bayern 537,151 458,523 586,202 517,025 449,289 691,057Saarland 25,204 22,735 34,895 23,762 23,029 41,664Berlin 542,185 391,150 486,701 542,693 373,367 594,783Brandenburg 48,060 51,624 76,003 44,112 50,030 89,600Mecklenburg-Vorpommern 68,580 63,800 98,515 61,356 60,730 118,671Sachsen 214,326 182,593 296,109 192,249 170,417 369,170Sachsen-Anhalt 73,862 71,255 112,825 64,832 67,739 139,879Thüringen 64,046 59,214 93,642 56,682 55,864 113,583
IntermediateSchleswig-Holstein 165,733 161,447 224,258 162,711 163,431 263,728Hamburg 0 0 0 0 0 0Niedersachsen 413,021 381,092 519,257 394,663 378,424 610,294Bremen 0 0 0 0 0 0Nordrhein-Westfalen 953,646 843,816 1,113,766 931,419 840,136 1,346,360Hessen 409,976 360,106 468,485 401,998 354,955 550,474Rheinland-Pfalz 239,400 216,313 300,606 230,426 215,637 350,992Baden-Württemberg 799,584 669,159 863,260 762,950 656,948 1,017,957Bayern 708,877 605,112 773,609 682,316 592,926 911,986Saarland 80,055 72,214 110,838 75,474 73,147 132,336Berlin 0 0 0 0 0 0Brandenburg 133,172 143,047 210,603 122,233 138,631 248,278Mecklenburg-Vorpommern 47,367 44,066 68,044 42,378 41,946 81,965Sachsen 203,110 173,037 280,613 182,188 161,498 349,850Sachsen-Anhalt 92,217 88,962 140,863 80,943 84,573 174,641Thüringen 105,514 97,552 154,272 93,381 92,033 187,123
RuralSchleswig-Holstein 88,178 85,898 119,316 86,570 86,953 140,316Hamburg 0 0 0 0 0 0Niedersachsen 319,397 294,707 401,552 305,201 292,643 471,953Bremen 0 0 0 0 0 0Nordrhein-Westfalen 197,041 174,348 230,125 192,449 173,588 278,183Hessen 139,175 122,246 159,037 136,466 120,497 186,870Rheinland-Pfalz 163,695 147,909 205,546 157,559 147,447 239,998Baden-Württemberg 273,799 229,138 295,603 261,255 224,957 348,576Bayern 512,235 437,254 559,010 493,042 428,449 659,002
Continued on next page
40 | ITC 6 European Country Wave 1 Technical Report

APPENDICES
Table 7. (Continued)
Men Women
Region 18–39 40–54 ≥55 18–39 40–54 ≥55
Saarland 19,433 17,529 26,905 18,321 17,756 32,124Berlin 0 0 0 0 0 0Brandenburg 99,019 106,361 156,591 90,885 103,078 184,604Mecklenburg-Vorpommern 83,169 77,373 119,473 74,409 73,649 143,916Sachsen 103,424 88,111 142,889 92,771 82,236 178,145Sachsen-Anhalt 102,924 99,292 157,218 90,342 94,393 194,918Thüringen 97,939 90,549 143,197 86,677 85,426 173,689
ITC 6 European Country Wave 1 Technical Report | 41

APPENDICES
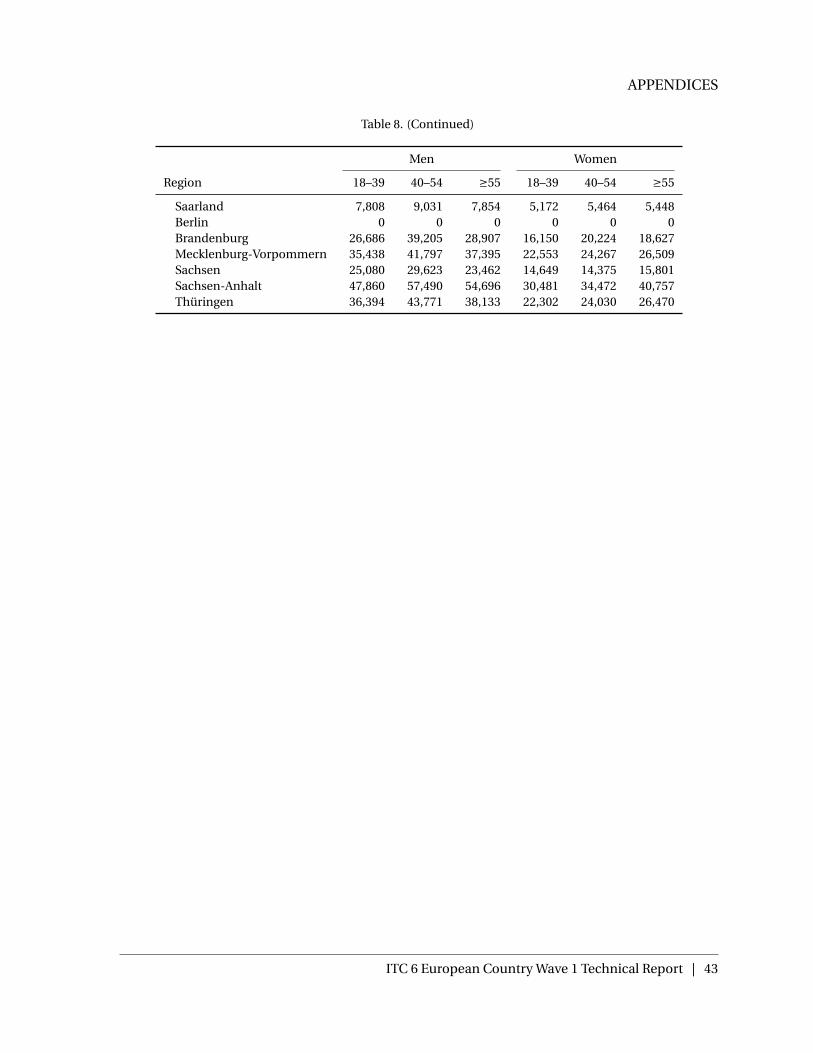
Table 8. Total smokers by degree of urbanization and age-sex group.
Men Women
Region 18–39 40–54 ≥55 18–39 40–54 ≥55
UrbanSchleswig-Holstein 70,941 74,898 84,788 60,637 63,172 76,245Hamburg 104,925 100,378 64,873 75,301 56,980 45,960Niedersachsen 72,924 91,782 62,946 46,041 48,744 40,521Bremen 26,816 27,686 18,960 16,854 14,182 12,870Nordrhein-Westfalen 469,974 533,902 398,288 322,154 316,828 279,469Hessen 96,235 110,758 78,253 64,816 62,682 52,252Rheinland-Pfalz 43,268 50,802 38,963 28,852 29,524 26,074Baden-Württemberg 127,586 143,404 95,859 81,652 77,376 62,739Bayern 187,681 210,645 145,319 123,724 117,804 97,024Saarland 11,370 12,852 11,700 7,723 8,113 8,333Berlin 239,863 217,714 159,346 172,142 128,550 115,626Brandenburg 14,951 21,512 13,985 9,224 11,512 10,815Mecklenburg-Vorpommern 32,651 37,629 35,268 21,315 22,804 25,692Sachsen 60,333 69,860 57,386 35,874 35,089 39,317Sachsen-Anhalt 38,076 44,698 44,566 24,889 27,990 34,186Thüringen 26,893 31,608 28,795 16,874 18,094 20,490
IntermediateSchleswig-Holstein 124,913 133,807 146,328 104,444 109,417 127,117Hamburg 0 0 0 0 0 0Niedersachsen 97,308 124,922 82,614 60,344 64,105 52,302Bremen 0 0 0 0 0 0Nordrhein-Westfalen 334,634 388,999 277,439 224,006 221,376 190,106Hessen 127,257 149,768 101,380 83,857 81,462 66,277Rheinland-Pfalz 78,236 93,988 69,019 51,016 52,443 45,173Baden-Württemberg 210,770 241,968 155,473 132,219 125,806 99,963Bayern 215,640 247,430 163,618 139,056 133,053 106,976Saarland 32,086 37,132 32,265 21,246 22,449 22,378Berlin 0 0 0 0 0 0Brandenburg 35,783 52,598 38,751 21,647 27,116 24,952Mecklenburg-Vorpommern 20,136 23,760 21,243 12,807 13,783 15,049Sachsen 49,112 58,019 45,936 28,676 28,133 30,927Sachsen-Anhalt 42,789 51,420 48,879 27,237 30,810 36,395Thüringen 39,209 47,059 40,959 23,952 25,815 28,424
RuralSchleswig-Holstein 66,521 71,244 77,973 55,647 58,285 67,773Hamburg 0 0 0 0 0 0Niedersachsen 75,474 96,870 64,088 46,818 49,749 40,588Bremen 0 0 0 0 0 0Nordrhein-Westfalen 69,319 80,549 57,508 46,419 45,879 39,419Hessen 43,311 50,964 34,527 28,562 27,738 22,574Rheinland-Pfalz 53,643 64,400 47,337 34,994 35,962 30,984Baden-Württemberg 72,392 83,063 53,415 45,432 43,214 34,335Bayern 156,232 179,187 118,622 100,827 96,444 77,630
Continued on next page
42 | ITC 6 European Country Wave 1 Technical Report
APPENDICES
Table 8. (Continued)
Men Women
Region 18–39 40–54 ≥55 18–39 40–54 ≥55
Saarland 7,808 9,031 7,854 5,172 5,464 5,448Berlin 0 0 0 0 0 0Brandenburg 26,686 39,205 28,907 16,150 20,224 18,627Mecklenburg-Vorpommern 35,438 41,797 37,395 22,553 24,267 26,509Sachsen 25,080 29,623 23,462 14,649 14,375 15,801Sachsen-Anhalt 47,860 57,490 54,696 30,481 34,472 40,757Thüringen 36,394 43,771 38,133 22,302 24,030 26,470
ITC 6 European Country Wave 1 Technical Report | 43

APPENDICES
Greece
Table 9. Total population by degree of urbanization and age-sex group.
Men Women
Region 18–39 40–54 ≥55 18–39 40–54 ≥55
UrbanAttica 388,620 294,972 383,376 391,428 332,028 492,459Crete 35,095 25,632 33,455 35,762 25,951 38,171Eastern Macedonia & Thrace 8,468 5,743 9,028 7,477 6,016 10,782Central Macedonia 100,134 80,723 114,028 102,259 85,395 138,160Western Macedonia 0 0 0 0 0 0Epirus 9,536 7,980 14,266 10,123 7,910 15,892Thessaly 43,794 35,618 57,173 43,497 36,106 65,792Western Greece 31,676 23,520 34,974 30,516 23,489 39,965Central Greece 6,870 5,568 8,244 6,143 5,255 9,420Peloponnese 9,437 7,952 13,010 8,738 7,937 14,038
IntermediateAttica 138,647 105,236 136,776 139,649 118,457 175,693Crete 17,383 12,696 16,571 17,714 12,854 18,907Eastern Macedonia & Thrace 41,523 28,160 44,269 36,663 29,497 52,867Central Macedonia 86,363 69,622 98,347 88,196 73,651 119,160Western Macedonia 17,623 15,868 24,119 17,586 15,843 26,518Epirus 8,626 7,219 12,906 9,157 7,156 14,376Thessaly 21,626 17,589 28,233 21,479 17,830 32,489Western Greece 23,500 17,450 25,947 22,640 17,426 29,650Central Greece 28,319 22,954 33,985 25,324 21,664 38,832Peloponnese 23,304 19,635 32,125 21,578 19,598 34,663
RuralAttica 13,694 10,394 13,509 13,793 11,700 17,353Crete 39,104 28,559 37,277 39,847 28,915 42,531Eastern Macedonia & Thrace 38,961 26,422 41,537 34,401 27,677 49,605Central Macedonia 64,705 52,161 73,683 66,077 55,180 89,276Western Macedonia 16,563 14,913 22,668 16,528 14,890 24,922Epirus 23,151 19,373 34,634 24,574 19,204 38,581Thessaly 28,666 23,314 37,423 28,471 23,633 43,065Western Greece 39,925 29,645 44,082 38,463 29,605 50,372Central Greece 41,112 33,323 49,337 36,763 31,450 56,374Peloponnese 42,110 35,481 58,050 38,991 35,414 62,637
44 | ITC 6 European Country Wave 1 Technical Report

APPENDICES
Table 10. Total smokers by degree of urbanization and age-sex group.
Men Women
Region 18–39 40–54 ≥55 18–39 40–54 ≥55
UrbanAttica 188,986 166,718 123,064 162,951 167,840 110,065Crete 17,537 14,820 11,130 15,353 13,463 8,890Eastern Macedonia & Thrace 3,836 3,055 2,641 2,872 2,840 2,168Central Macedonia 50,578 47,110 38,496 44,442 44,773 32,730Western Macedonia 0 0 0 0 0 0Epirus 6,055 5,625 6,631 5,741 5,162 5,499Thessaly 20,255 19,287 17,175 17,103 17,389 13,639Western Greece 15,132 13,091 10,961 12,444 11,669 8,696Central Greece 3,784 3,493 3,130 2,949 2,994 2,558Peloponnese 3,166 3,255 2,619 2,407 2,800 1,868
IntermediateAttica 62,377 55,659 39,651 53,220 55,544 34,980Crete 8,050 6,883 4,988 6,976 6,198 3,929Eastern Macedonia & Thrace 17,315 13,950 11,647 12,836 12,852 9,442Central Macedonia 40,461 38,125 30,055 35,190 35,920 25,190Western Macedonia 15,150 14,183 18,176 14,454 13,763 17,255Epirus 5,179 4,862 5,532 4,861 4,427 4,508Thessaly 9,219 8,882 7,640 7,707 7,936 5,988Western Greece 10,371 9,077 7,338 8,445 8,021 5,740Central Greece 14,564 13,600 11,752 11,236 11,556 9,459Peloponnese 7,075 7,351 5,741 5,334 6,273 4,056
RuralAttica 5,269 4,802 3,215 4,418 4,717 2,773Crete 15,544 13,574 9,237 13,229 12,029 7,107Eastern Macedonia & Thrace 13,777 11,332 8,910 10,038 10,279 7,074Central Macedonia 26,063 25,079 18,561 22,255 23,253 15,195Western Macedonia 13,651 12,907 15,881 12,880 12,433 14,647Epirus 12,381 11,858 12,628 11,402 10,635 9,992Thessaly 10,389 10,219 8,270 8,536 8,988 6,348Western Greece 15,040 13,441 10,214 12,027 11,688 7,818Central Greece 18,402 17,548 14,209 13,930 14,675 11,140Peloponnese 10,532 11,145 8,284 7,829 9,378 5,769
ITC 6 European Country Wave 1 Technical Report | 45

APPENDICES
Hungary
Table 11. Total population by degree of urbanization and age-sex group.
Men Women
Region 18–39 40–54 ≥55 18–39 40–54 ≥55
UrbanCentral Hungary 288,755 185,594 233,102 291,121 190,681 342,176Central Transdanubia 16,706 11,334 14,699 15,562 11,186 20,340Western Transdanubia 35,954 25,120 32,804 34,009 24,659 45,096Southern Transdanubia 23,303 16,588 23,120 22,213 16,857 32,528Northern Hungary 27,555 18,736 24,429 25,556 18,919 36,076Northern Great Plain 55,455 36,449 45,098 52,183 36,630 63,669Southern Great Plain 46,985 32,212 44,382 44,331 32,538 62,914
IntermediateCentral Hungary 144,860 93,107 116,941 146,047 95,659 171,660Central Transdanubia 71,697 48,641 63,084 66,789 48,010 87,296Western Transdanubia 53,580 37,434 48,886 50,681 36,748 67,204Southern Transdanubia 42,802 30,469 42,465 40,800 30,962 59,746Northern Hungary 63,710 43,319 56,481 59,088 43,742 83,411Northern Great Plain 77,189 50,734 62,773 72,634 50,985 88,622Southern Great Plain 67,112 46,011 63,394 63,321 46,476 89,864
RuralCentral Hungary 31,718 20,387 25,605 31,978 20,945 37,586Central Transdanubia 75,455 51,191 66,390 70,289 50,526 91,872Western Transdanubia 59,788 41,772 54,550 56,553 41,006 74,991Southern Transdanubia 64,871 46,179 64,361 61,837 46,926 90,552Northern Hungary 81,714 55,560 72,443 75,785 56,103 106,982Northern Great Plain 97,233 63,909 79,074 91,496 64,225 111,635Southern Great Plain 74,643 51,174 70,508 70,427 51,692 99,949
46 | ITC 6 European Country Wave 1 Technical Report

APPENDICES
Table 12. Total smokers by degree of urbanization and age-sex group.
Men Women
Region 18–39 40–54 ≥55 18–39 40–54 ≥55
UrbanCentral Hungary 114,636 65,329 49,627 63,726 57,166 36,100Central Transdanubia 9,324 5,783 5,021 5,440 5,044 3,753Western Transdanubia 16,082 10,056 8,185 8,713 8,502 5,709Southern Transdanubia 10,158 6,458 5,570 5,498 5,637 3,955Northern Hungary 13,530 8,302 6,933 7,437 7,291 5,314Northern Great Plain 25,204 14,846 11,500 13,662 12,868 8,271Southern Great Plain 18,465 11,213 9,325 9,575 9,638 6,537
IntermediateCentral Hungary 63,811 36,656 28,569 36,658 32,381 21,217Central Transdanubia 43,133 26,981 24,149 26,128 23,784 18,585Western Transdanubia 26,351 16,617 13,903 14,784 14,188 9,926Southern Transdanubia 20,554 13,175 11,682 11,514 11,617 8,484Northern Hungary 34,117 21,118 18,153 19,452 18,743 14,280Northern Great Plain 38,517 22,881 18,223 21,623 20,037 13,417Southern Great Plain 29,281 17,930 15,291 15,691 15,560 10,945
RuralCentral Hungary 13,027 7,443 5,700 7,317 6,531 4,172Central Transdanubia 43,168 26,845 23,535 25,487 23,495 17,750Western Transdanubia 27,586 17,298 14,199 15,111 14,668 9,974Southern Transdanubia 29,185 18,606 16,187 15,966 16,288 11,573Northern Hungary 41,282 25,402 21,407 22,955 22,385 16,539Northern Great Plain 45,563 26,912 21,026 24,969 23,404 15,227Southern Great Plain 30,357 18,484 15,491 15,902 15,931 10,924
ITC 6 European Country Wave 1 Technical Report | 47
APPENDICES
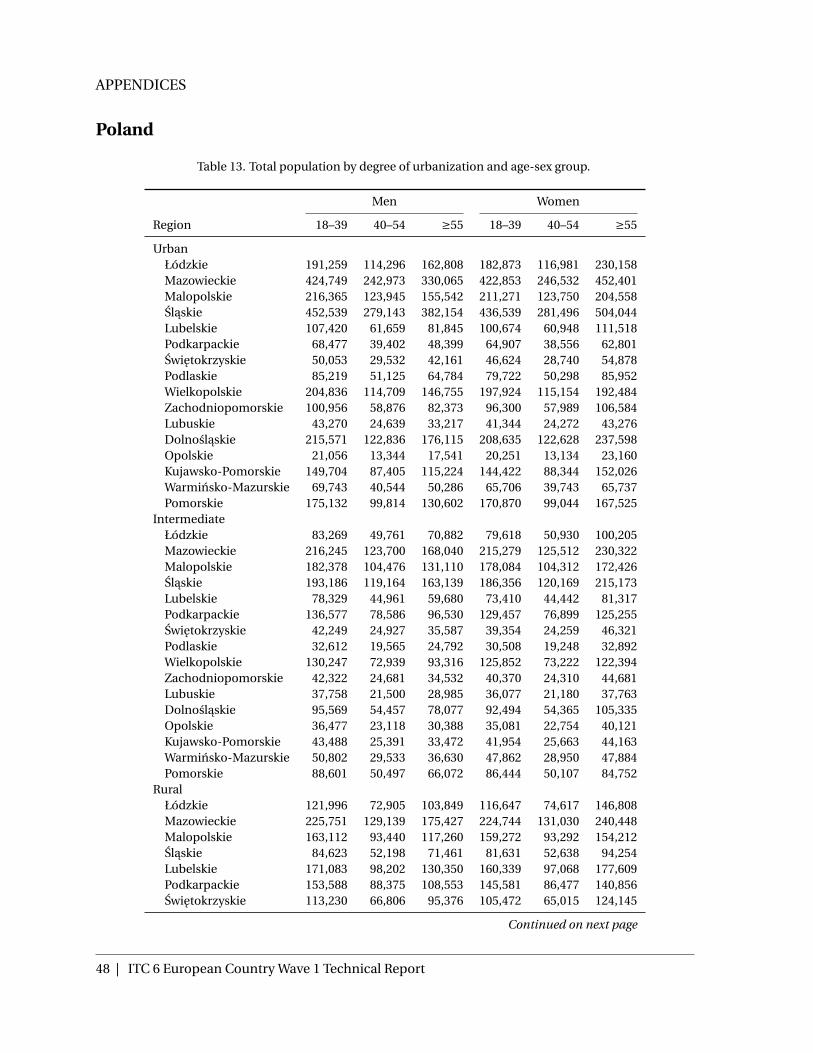
Poland
Table 13. Total population by degree of urbanization and age-sex group.
Men Women
Region 18–39 40–54 ≥55 18–39 40–54 ≥55
UrbanŁódzkie 191,259 114,296 162,808 182,873 116,981 230,158Mazowieckie 424,749 242,973 330,065 422,853 246,532 452,401Malopolskie 216,365 123,945 155,542 211,271 123,750 204,558Slaskie 452,539 279,143 382,154 436,539 281,496 504,044Lubelskie 107,420 61,659 81,845 100,674 60,948 111,518Podkarpackie 68,477 39,402 48,399 64,907 38,556 62,801Swietokrzyskie 50,053 29,532 42,161 46,624 28,740 54,878Podlaskie 85,219 51,125 64,784 79,722 50,298 85,952Wielkopolskie 204,836 114,709 146,755 197,924 115,154 192,484Zachodniopomorskie 100,956 58,876 82,373 96,300 57,989 106,584Lubuskie 43,270 24,639 33,217 41,344 24,272 43,276Dolnoslaskie 215,571 122,836 176,115 208,635 122,628 237,598Opolskie 21,056 13,344 17,541 20,251 13,134 23,160Kujawsko-Pomorskie 149,704 87,405 115,224 144,422 88,344 152,026Warminsko-Mazurskie 69,743 40,544 50,286 65,706 39,743 65,737Pomorskie 175,132 99,814 130,602 170,870 99,044 167,525
IntermediateŁódzkie 83,269 49,761 70,882 79,618 50,930 100,205Mazowieckie 216,245 123,700 168,040 215,279 125,512 230,322Malopolskie 182,378 104,476 131,110 178,084 104,312 172,426Slaskie 193,186 119,164 163,139 186,356 120,169 215,173Lubelskie 78,329 44,961 59,680 73,410 44,442 81,317Podkarpackie 136,577 78,586 96,530 129,457 76,899 125,255Swietokrzyskie 42,249 24,927 35,587 39,354 24,259 46,321Podlaskie 32,612 19,565 24,792 30,508 19,248 32,892Wielkopolskie 130,247 72,939 93,316 125,852 73,222 122,394Zachodniopomorskie 42,322 24,681 34,532 40,370 24,310 44,681Lubuskie 37,758 21,500 28,985 36,077 21,180 37,763Dolnoslaskie 95,569 54,457 78,077 92,494 54,365 105,335Opolskie 36,477 23,118 30,388 35,081 22,754 40,121Kujawsko-Pomorskie 43,488 25,391 33,472 41,954 25,663 44,163Warminsko-Mazurskie 50,802 29,533 36,630 47,862 28,950 47,884Pomorskie 88,601 50,497 66,072 86,444 50,107 84,752
RuralŁódzkie 121,996 72,905 103,849 116,647 74,617 146,808Mazowieckie 225,751 129,139 175,427 224,744 131,030 240,448Malopolskie 163,112 93,440 117,260 159,272 93,292 154,212Slaskie 84,623 52,198 71,461 81,631 52,638 94,254Lubelskie 171,083 98,202 130,350 160,339 97,068 177,609Podkarpackie 153,588 88,375 108,553 145,581 86,477 140,856Swietokrzyskie 113,230 66,806 95,376 105,472 65,015 124,145
Continued on next page
48 | ITC 6 European Country Wave 1 Technical Report
APPENDICES
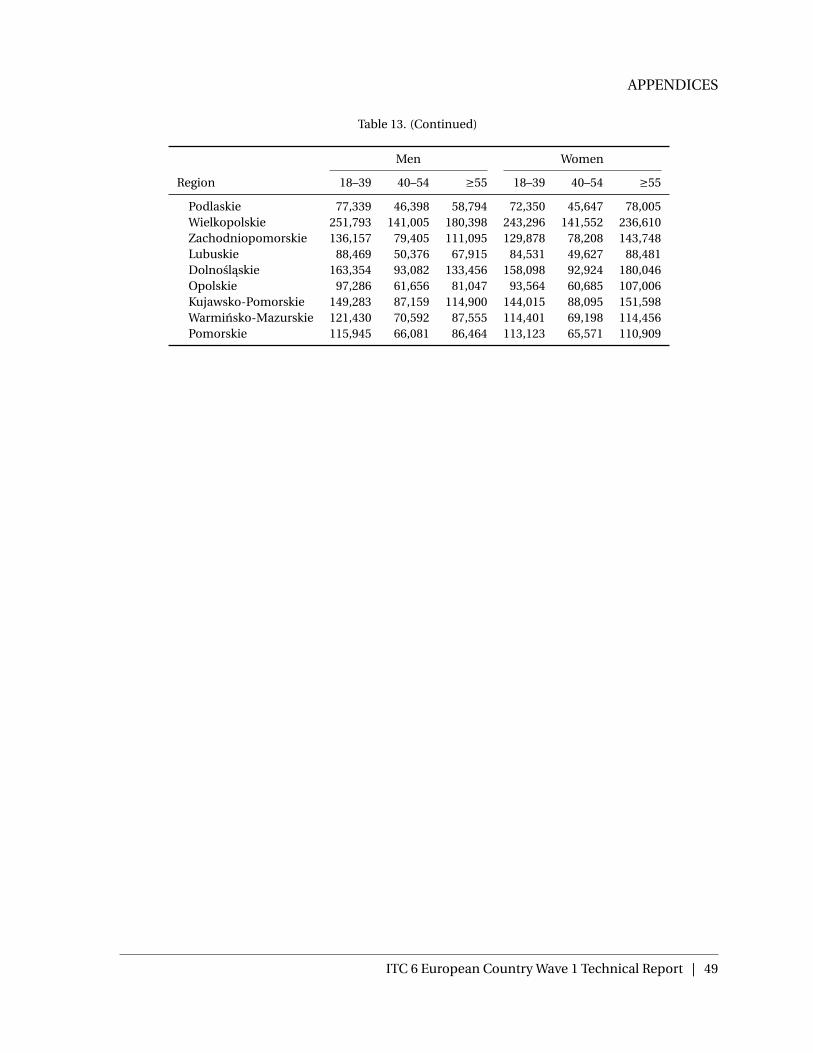
Table 13. (Continued)
Men Women
Region 18–39 40–54 ≥55 18–39 40–54 ≥55
Podlaskie 77,339 46,398 58,794 72,350 45,647 78,005Wielkopolskie 251,793 141,005 180,398 243,296 141,552 236,610Zachodniopomorskie 136,157 79,405 111,095 129,878 78,208 143,748Lubuskie 88,469 50,376 67,915 84,531 49,627 88,481Dolnoslaskie 163,354 93,082 133,456 158,098 92,924 180,046Opolskie 97,286 61,656 81,047 93,564 60,685 107,006Kujawsko-Pomorskie 149,283 87,159 114,900 144,015 88,095 151,598Warminsko-Mazurskie 121,430 70,592 87,555 114,401 69,198 114,456Pomorskie 115,945 66,081 86,464 113,123 65,571 110,909
ITC 6 European Country Wave 1 Technical Report | 49

APPENDICES
Table 14. Total smokers by degree of urbanization and age-sex group.
Men Women
Region 18–39 40–54 ≥55 18–39 40–54 ≥55
UrbanŁódzkie 60,859 54,405 45,684 54,332 30,614 45,318Mazowieckie 148,322 124,135 102,188 138,315 71,371 99,483Malopolskie 36,717 24,554 22,694 33,022 16,632 19,842Slaskie 152,596 138,902 113,997 137,728 78,453 106,303Lubelskie 35,814 30,423 24,128 31,400 30,072 23,207Podkarpackie 24,255 20,347 15,212 21,549 11,335 14,049Swietokrzyskie 13,549 12,389 9,984 11,735 6,320 8,956Podlaskie 34,582 29,177 23,536 30,470 17,177 22,691Wielkopolskie 60,365 51,458 37,980 54,350 27,741 34,647Zachodniopomorskie 27,420 24,763 19,572 24,316 12,798 17,458Lubuskie 27,213 18,908 19,468 25,038 13,658 20,383Dolnoslaskie 59,692 52,463 42,708 53,744 27,628 39,798Opolskie 4,763 4,840 3,443 4,241 2,386 3,083Kujawsko-Pomorskie 49,462 42,820 33,645 44,612 24,083 31,302Warminsko-Mazurskie 13,126 12,605 8,161 11,400 5,950 7,132Pomorskie 29,545 28,277 18,937 26,553 13,232 16,149
IntermediateŁódzkie 27,021 24,049 20,308 24,148 13,614 20,191Mazowieckie 76,962 64,101 53,084 71,817 37,101 51,822Malopolskie 31,716 30,371 19,614 28,529 14,374 17,174Slaskie 66,417 60,166 49,676 59,988 34,200 46,434Lubelskie 26,624 22,512 17,958 23,359 12,497 17,321Podkarpackie 49,291 41,155 30,948 43,821 23,077 28,658Swietokrzyskie 11,682 10,634 8,616 10,122 5,458 7,745Podlaskie 13,462 11,305 9,176 11,871 6,700 8,874Wielkopolskie 39,178 33,246 24,682 35,301 18,035 22,569Zachodniopomorskie 11,740 10,556 8,388 10,419 5,487 7,497Lubuskie 23,999 16,609 17,194 22,097 12,070 18,058Dolnoslaskie 27,027 23,651 19,355 24,344 12,531 18,075Opolskie 8,437 8,540 6,108 7,518 4,232 5,477Kujawsko-Pomorskie 14,651 12,624 9,975 13,224 7,145 9,305Warminsko-Mazurskie 9,790 9,368 6,092 8,510 4,441 5,334Pomorskie 15,319 14,604 9,825 13,762 6,865 8,382
RuralŁódzkie 42,455 37,152 32,037 38,027 21,520 32,151Mazowieckie 85,853 70,303 59,470 80,324 41,654 58,621Malopolskie 30,910 29,228 19,172 27,841 14,068 16,871Slaskie 31,133 27,728 23,382 28,179 16,134 22,074Lubelskie 62,257 51,752 42,168 54,740 29,402 41,045Podkarpackie 59,208 48,589 37,342 52,759 27,906 34,918Swietokrzyskie 33,754 30,230 24,979 29,300 15,851 22,644Podlaskie 33,921 27,992 23,224 29,982 16,999 22,699Wielkopolskie 81,430 67,964 51,486 73,524 37,695 47,488
Continued on next page
50 | ITC 6 European Country Wave 1 Technical Report

APPENDICES
Table 14. (Continued)
Men Women
Region 18–39 40–54 ≥55 18–39 40–54 ≥55
Zachodniopomorskie 40,711 36,018 29,196 36,197 19,137 26,320Lubuskie 58,363 39,822 41,992 53,863 29,553 44,639Dolnoslaskie 49,758 42,846 35,766 44,916 23,203 33,687Opolskie 24,380 24,311 17,701 21,754 12,289 15,987Kujawsko-Pomorskie 53,861 45,628 36,825 48,720 26,428 34,670Warminsko-Mazurskie 25,452 24,030 15,882 22,159 11,598 13,998Pomorskie 21,844 20,571 14,050 19,661 9,829 12,056
ITC 6 European Country Wave 1 Technical Report | 51

APPENDICES
Romania
Table 15. Total population by degree of urbanization and age-sex group.
Men Women
Region 18–39 40–54 ≥55 18–39 40–54 ≥55
UrbanNorth-West 118,494 78,468 93,874 112,803 76,075 123,288Central 105,047 71,537 91,367 98,015 69,435 116,693North-East 136,912 95,862 119,840 124,116 87,857 152,514South-East 126,652 96,245 124,266 116,364 91,508 159,515South 92,679 71,780 89,519 84,251 67,073 118,306Bucharest 331,228 191,549 227,613 345,974 208,623 325,318South-West 83,607 65,845 82,889 77,011 62,128 106,055West 84,314 58,920 71,332 79,981 57,447 94,264
IntermediateNorth-West 100,605 66,622 79,702 95,773 64,590 104,675Central 104,799 71,368 91,151 97,784 69,272 116,418North-East 110,249 77,194 96,502 99,945 70,747 122,813South-East 85,783 65,188 84,167 78,815 61,980 108,042South 122,932 95,211 118,740 111,752 88,967 156,925Bucharest 44,569 25,774 30,627 46,553 28,072 43,774South-West 35,147 27,680 34,845 32,374 26,118 44,583West 87,578 61,201 74,093 83,077 59,670 97,913
RuralNorth-West 192,525 127,493 152,524 183,279 123,604 200,314Central 150,261 102,328 130,693 140,204 99,322 166,921North-East 240,326 168,270 210,358 217,865 154,217 267,713South-East 145,494 110,563 142,753 133,676 105,122 183,246South 227,014 175,824 219,274 206,369 164,293 289,788Bucharest 13,727 7,938 9,433 14,338 8,646 13,482South-West 171,627 135,166 170,153 158,086 127,535 217,706West 111,413 77,857 94,259 105,688 75,911 124,562
52 | ITC 6 European Country Wave 1 Technical Report

APPENDICES
Table 16. Total smokers by degree of urbanization and age-sex group.
Men Women
Region 18–39 40–54 ≥55 18–39 40–54 ≥55
UrbanNorth-West 52,232 29,504 11,058 35,070 18,722 10,356Central 55,234 32,821 14,454 38,059 21,858 13,326North-East 56,202 33,302 12,655 35,385 19,671 11,423South-East 58,133 37,863 15,620 38,039 23,801 14,324South 60,149 42,042 21,359 43,330 29,096 20,940Bucharest 175,816 88,821 36,623 136,002 66,572 37,834South-West 62,981 46,098 28,265 48,994 34,705 27,797West 55,082 34,775 17,262 41,502 25,185 16,939
IntermediateNorth-West 30,222 16,462 5,404 18,896 9,753 4,983Central 39,467 22,545 8,468 25,130 13,868 7,637North-East 30,329 17,361 5,829 17,840 9,615 5,195South-East 27,116 17,021 6,111 16,488 9,960 5,510South 61,700 41,426 17,324 40,879 26,201 16,461Bucharest 16,994 8,255 2,897 12,141 5,710 2,928South-West 21,953 15,498 7,666 15,795 10,659 7,227West 44,367 26,910 10,981 30,755 17,806 10,438
RuralNorth-West 59,028 32,205 10,631 37,022 19,134 9,795Central 57,625 32,980 12,468 36,818 20,351 11,267North-East 67,532 38,702 13,063 39,826 21,482 11,646South-East 46,922 29,498 10,649 28,620 17,314 9,602South 115,596 77,767 32,781 76,893 49,386 31,210Bucharest 5,329 2,593 916 3,821 1,800 926South-West 108,365 76,639 38,284 78,284 52,953 36,161West 57,255 34,794 14,318 39,844 23,122 13,640
ITC 6 European Country Wave 1 Technical Report | 53

APPENDICES
Spain
Table 17. Total population by degree of urbanization and age-sex group.
Men Women
Region 18–39 40–54 ≥55 18–39 40–54 ≥55
UrbanGalicia 139,534 121,795 176,058 136,440 123,324 218,339Asturias 72,644 69,132 100,039 70,868 70,372 128,027Cantabria 24,397 21,800 27,802 23,570 21,561 33,951Basque Country 88,940 85,404 110,728 87,237 85,114 136,908Rioja 21,075 18,677 23,520 20,680 17,950 27,082Aragon 94,717 82,984 105,097 89,549 78,381 123,905Madrid 750,580 621,299 643,682 765,922 646,188 836,540Castile-Leon 123,946 114,994 167,830 117,132 110,681 193,523Castile-La Mancha 77,033 61,481 70,026 71,545 57,364 79,358Extremadura 37,913 31,315 38,638 35,897 30,018 44,588Cataluna 622,139 528,437 603,330 616,187 514,711 738,443Valencia 250,809 212,258 245,849 241,774 205,700 291,282Baleares 67,560 53,211 52,684 65,876 50,186 60,275Andalucia 514,380 403,975 430,155 497,197 399,287 509,349Murcia 106,587 81,749 80,138 100,255 76,955 93,640
IntermediateGalicia 85,953 75,026 108,452 84,048 75,968 134,497Asturias 22,800 21,698 31,399 22,243 22,087 40,183Cantabria 36,155 32,306 41,202 34,929 31,953 50,314Basque Country 63,163 60,652 78,637 61,954 60,446 97,230Rioja 10,961 9,714 12,233 10,756 9,336 14,086Aragon 32,202 28,213 35,731 30,445 26,648 42,125Madrid 112,184 92,861 96,207 114,477 96,581 125,032Castile-Leon 65,343 60,624 88,479 61,751 58,350 102,023Castile-La Mancha 31,445 25,097 28,585 29,205 23,416 32,394Extremadura 12,674 10,468 12,916 12,000 10,035 14,905Cataluna 295,469 250,967 286,536 292,642 244,449 350,704Valencia 322,744 273,137 316,362 311,118 264,697 374,826Baleares 37,489 29,527 29,235 36,555 27,848 33,446Andalucia 273,472 214,775 228,694 264,337 212,283 270,797Murcia 38,747 29,718 29,132 36,445 27,975 34,041
RuralGalicia 131,903 115,134 166,430 128,978 116,579 206,398Asturias 34,172 32,520 47,059 33,337 33,103 60,225Cantabria 17,752 15,862 20,230 17,150 15,688 24,704Basque Country 117,805 113,122 146,665 115,550 112,738 181,342Rioja 10,146 8,992 11,323 9,956 8,642 13,038Aragon 54,760 47,977 60,761 51,772 45,315 71,635Madrid 51,974 43,022 44,572 53,036 44,745 57,926Castile-Leon 127,454 118,250 172,581 120,448 113,814 199,001Castile-La Mancha 202,103 161,300 183,719 187,706 150,499 208,203
Continued on next page
54 | ITC 6 European Country Wave 1 Technical Report

APPENDICES
Table 17. (Continued)
Men Women
Region 18–39 40–54 ≥55 18–39 40–54 ≥55
Extremadura 106,404 87,886 108,437 100,746 84,247 125,137Cataluna 114,137 96,946 110,686 113,045 94,428 135,474Valencia 127,367 107,790 124,848 122,779 104,459 147,920Baleares 72,665 57,231 56,665 70,854 53,978 64,829Andalucia 474,169 372,395 396,528 458,329 368,074 469,531Murcia 83,518 64,056 62,794 78,556 60,300 73,373
ITC 6 European Country Wave 1 Technical Report | 55
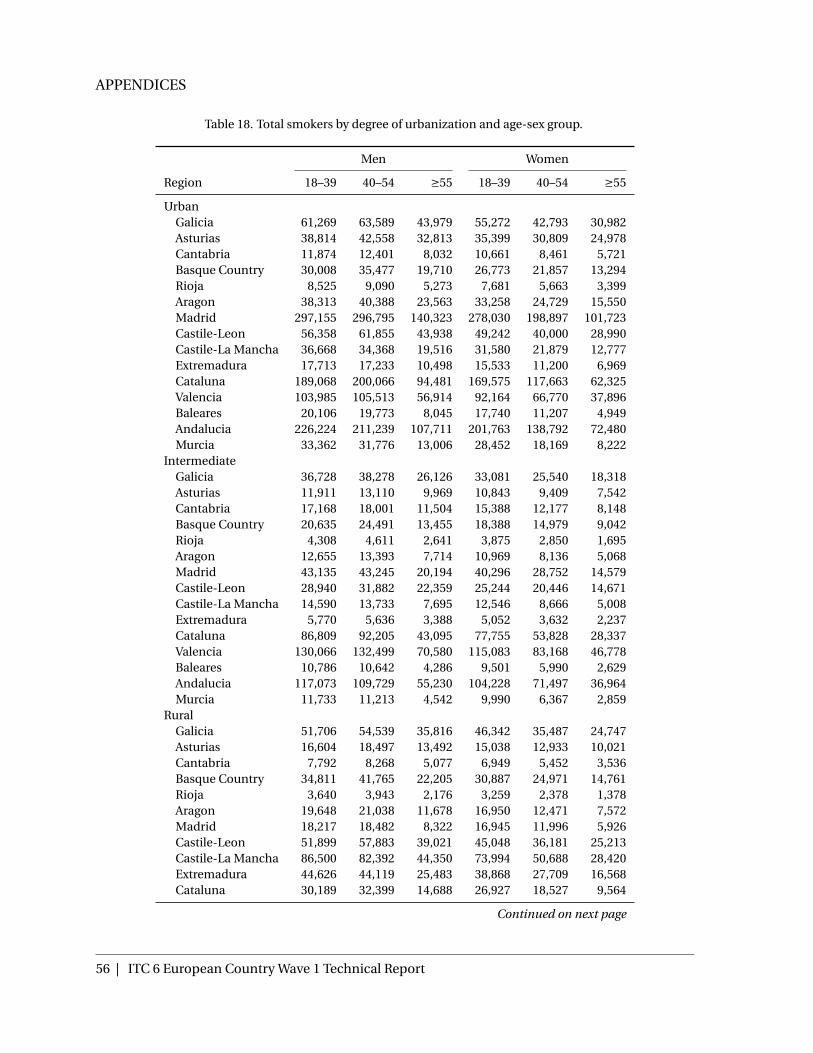
APPENDICES
Table 18. Total smokers by degree of urbanization and age-sex group.
Men Women
Region 18–39 40–54 ≥55 18–39 40–54 ≥55
UrbanGalicia 61,269 63,589 43,979 55,272 42,793 30,982Asturias 38,814 42,558 32,813 35,399 30,809 24,978Cantabria 11,874 12,401 8,032 10,661 8,461 5,721Basque Country 30,008 35,477 19,710 26,773 21,857 13,294Rioja 8,525 9,090 5,273 7,681 5,663 3,399Aragon 38,313 40,388 23,563 33,258 24,729 15,550Madrid 297,155 296,795 140,323 278,030 198,897 101,723Castile-Leon 56,358 61,855 43,938 49,242 40,000 28,990Castile-La Mancha 36,668 34,368 19,516 31,580 21,879 12,777Extremadura 17,713 17,233 10,498 15,533 11,200 6,969Cataluna 189,068 200,066 94,481 169,575 117,663 62,325Valencia 103,985 105,513 56,914 92,164 66,770 37,896Baleares 20,106 19,773 8,045 17,740 11,207 4,949Andalucia 226,224 211,239 107,711 201,763 138,792 72,480Murcia 33,362 31,776 13,006 28,452 18,169 8,222
IntermediateGalicia 36,728 38,278 26,126 33,081 25,540 18,318Asturias 11,911 13,110 9,969 10,843 9,409 7,542Cantabria 17,168 18,001 11,504 15,388 12,177 8,148Basque Country 20,635 24,491 13,455 18,388 14,979 9,042Rioja 4,308 4,611 2,641 3,875 2,850 1,695Aragon 12,655 13,393 7,714 10,969 8,136 5,068Madrid 43,135 43,245 20,194 40,296 28,752 14,579Castile-Leon 28,940 31,882 22,359 25,244 20,446 14,671Castile-La Mancha 14,590 13,733 7,695 12,546 8,666 5,008Extremadura 5,770 5,636 3,388 5,052 3,632 2,237Cataluna 86,809 92,205 43,095 77,755 53,828 28,337Valencia 130,066 132,499 70,580 115,083 83,168 46,778Baleares 10,786 10,642 4,286 9,501 5,990 2,629Andalucia 117,073 109,729 55,230 104,228 71,497 36,964Murcia 11,733 11,213 4,542 9,990 6,367 2,859
RuralGalicia 51,706 54,539 35,816 46,342 35,487 24,747Asturias 16,604 18,497 13,492 15,038 12,933 10,021Cantabria 7,792 8,268 5,077 6,949 5,452 3,536Basque Country 34,811 41,765 22,205 30,887 24,971 14,761Rioja 3,640 3,943 2,176 3,259 2,378 1,378Aragon 19,648 21,038 11,678 16,950 12,471 7,572Madrid 18,217 18,482 8,322 16,945 11,996 5,926Castile-Leon 51,899 57,883 39,021 45,048 36,181 25,213Castile-La Mancha 86,500 82,392 44,350 73,994 50,688 28,420Extremadura 44,626 44,119 25,483 38,868 27,709 16,568Cataluna 30,189 32,399 14,688 26,927 18,527 9,564
Continued on next page
56 | ITC 6 European Country Wave 1 Technical Report

APPENDICES
Table 18. (Continued)
Men Women
Region 18–39 40–54 ≥55 18–39 40–54 ≥55
Valencia 46,922 48,376 24,820 41,327 29,625 16,227Baleares 18,798 18,743 7,321 16,495 10,337 4,447Andalucia 186,206 176,664 85,531 164,998 112,263 56,438Murcia 22,784 22,016 8,640 19,325 12,235 5,386
ITC 6 European Country Wave 1 Technical Report | 57
APPENDICES
C Summary statistics of the weights
The following tables show the means, standard deviations and coefficients of variation forthe weights in the regions crossed with urbanization (following merging as indicated in Ap-pendix A).
58 | ITC 6 European Country Wave 1 Technical Report
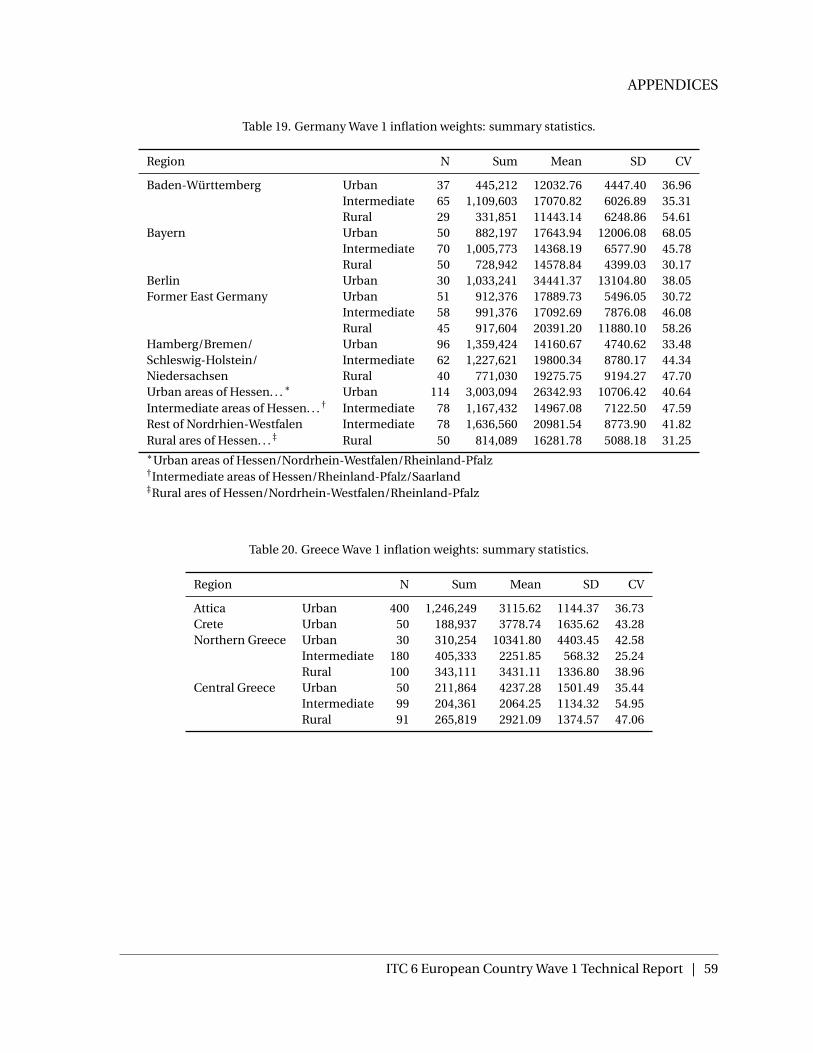
APPENDICES
Table 19. Germany Wave 1 inflation weights: summary statistics.
Region N Sum Mean SD CV
Baden-Württemberg Urban 37 445,212 12032.76 4447.40 36.96Intermediate 65 1,109,603 17070.82 6026.89 35.31Rural 29 331,851 11443.14 6248.86 54.61
Bayern Urban 50 882,197 17643.94 12006.08 68.05Intermediate 70 1,005,773 14368.19 6577.90 45.78Rural 50 728,942 14578.84 4399.03 30.17
Berlin Urban 30 1,033,241 34441.37 13104.80 38.05Former East Germany Urban 51 912,376 17889.73 5496.05 30.72
Intermediate 58 991,376 17092.69 7876.08 46.08Rural 45 917,604 20391.20 11880.10 58.26
Hamberg/Bremen/ Urban 96 1,359,424 14160.67 4740.62 33.48Schleswig-Holstein/ Intermediate 62 1,227,621 19800.34 8780.17 44.34Niedersachsen Rural 40 771,030 19275.75 9194.27 47.70Urban areas of Hessen. . .∗ Urban 114 3,003,094 26342.93 10706.42 40.64Intermediate areas of Hessen. . . † Intermediate 78 1,167,432 14967.08 7122.50 47.59Rest of Nordrhien-Westfalen Intermediate 78 1,636,560 20981.54 8773.90 41.82Rural ares of Hessen. . . ‡ Rural 50 814,089 16281.78 5088.18 31.25∗Urban areas of Hessen/Nordrhein-Westfalen/Rheinland-Pfalz†Intermediate areas of Hessen/Rheinland-Pfalz/Saarland‡Rural ares of Hessen/Nordrhein-Westfalen/Rheinland-Pfalz
Table 20. Greece Wave 1 inflation weights: summary statistics.
Region N Sum Mean SD CV
Attica Urban 400 1,246,249 3115.62 1144.37 36.73Crete Urban 50 188,937 3778.74 1635.62 43.28Northern Greece Urban 30 310,254 10341.80 4403.45 42.58
Intermediate 180 405,333 2251.85 568.32 25.24Rural 100 343,111 3431.11 1336.80 38.96
Central Greece Urban 50 211,864 4237.28 1501.49 35.44Intermediate 99 204,361 2064.25 1134.32 54.95Rural 91 265,819 2921.09 1374.57 47.06
ITC 6 European Country Wave 1 Technical Report | 59

APPENDICES
Table 21. Hungary Wave 1 inflation weights: summary statistics.
Region N Sum Mean SD CV
Central Hungary Urban 192 386,584 2013.46 1035.13 51.41Intermediate 109 263,482 2417.27 1240.71 51.33
Urban Transdanubia∗ Urban 60 128,888 2148.13 949.29 44.19Rest of Central Transdanubia Intermediate 40 162,760 4069.00 3075.88 75.59
Rural 40 160,280 4007.00 1841.17 45.95Rest of Western Transdanubia Intermediate 30 95,769 3192.30 1982.95 62.12
Rural 50 98,836 1976.72 686.94 34.75Rest of Southern Transdanubia Intermediate 40 77,026 1925.65 592.38 30.76
Rural 40 107,805 2695.13 1452.07 53.88Urban Nothern/Great Plain† Urban 90 199,911 2221.23 1128.61 50.81Rest of Northern Hungary Intermediate 50 125,863 2517.26 1109.38 44.07
Rural 50 149,970 2999.40 1155.13 38.51Rest of Northern Great Plain Intermediate 60 134,698 2244.97 586.84 26.14
Rural 50 157,101 3142.02 1773.08 56.43Rest of Southern Great Plain Intermediate 59 104,698 1774.54 560.43 31.58
Rural 40 107,089 2677.23 812.45 30.35∗Urban areas of Central/Western/Southern Transdanubia†Urban Northern Hungary and Northern & Southern Great Plain
60 | ITC 6 European Country Wave 1 Technical Report

APPENDICES
Table 22. Poland Wave 1 inflation weights: summary statistics.
Region N Sum Mean SD CV
Lodzkie (NUTS2) Urban 29 291,212 10041.79 5439.11 54.16Intermediate 22 129,331 5878.68 2756.69 46.89Rural 28 203,342 7262.21 3797.19 52.29
Mazowieckie (NUTS2) Urban 64 683,814 10684.59 3694.32 34.58Intermediate 44 354,887 8065.61 2047.52 25.39Rural 48 396,225 8254.69 2376.85 28.79
Poludniowy (NUTS1) Urban 75 881,440 11752.53 5379.99 45.78Intermediate 90 458,659 5096.21 2650.69 52.01Rural 63 286,720 4551.11 1933.68 42.49
Wschondi (NUTS1) Urban 48 502,357 10465.77 5085.35 48.59Intermediate 41 452,866 11045.51 3563.82 32.26Rural 90 853,661 9485.12 5294.18 55.82
Polnocno-Zachodni (NUTS1) Urban 53 517,536 9764.83 4614.77 47.26Intermediate 53 337,125 6360.85 3525.60 55.43Rural 52 815,398 15680.73 7643.61 48.75
Poludniowo-Zachodni (NUTS1) Urban 21 298,789 14228.05 3551.69 24.96Intermediate 25 165,295 6611.80 2475.81 37.45Rural 18 346,598 19255.44 6465.94 33.58
Polnocny (NUTS1) Urban 51 416,991 8176.29 5196.16 63.55Intermediate 34 179,216 5271.06 2790.68 52.94Rural 57 457,262 8022.14 5666.73 70.64
ITC 6 European Country Wave 1 Technical Report | 61

APPENDICES
Table 23. Romania Wave 1 inflation weights: summary statistics.
Region N Sum Mean SD CV
North-West + Central Urban 69 332,694 4821.65 1427.97 29.62Intermediate 70 202,835 2897.64 2036.15 70.27Rural 100 339,324 3393.24 1354.23 39.91
North-East Urban 49 168,638 3441.59 1530.90 44.48Intermediate 60 168,375 2806.25 1349.84 48.10Rural 80 192,251 2403.14 1426.19 59.35
South-East Urban 63 187,780 2980.63 1293.91 43.41Rural 51 142,605 2796.18 1826.73 65.33
South + Bucharest Urban 120 758,584 6321.53 3952.70 62.53Intermediate 70 252,916 3613.09 2677.76 74.11Rural 80 399,018 4987.73 1794.99 35.99
South-West + West Urban 59 439,585 7450.59 4145.60 55.64Intermediate 40 220,055 5501.38 2343.32 42.60Rural 90 573,659 6373.99 3651.28 57.28
Table 24. Spain Wave 1 inflation weights: summary statistics.
Region N Sum Mean SD CV
Galicia/Asturias/ Urban 40 560,405 14010.12 6740.35 48.11Cantabria Intermediate 40 323,241 8081.03 3386.17 41.90
Rural 30 372,296 12409.87 6325.76 50.97Pais Vasco/Rioja/ Urban 51 362,551 7108.84 3309.10 46.55Aragon Intermediate 30 178,905 5963.50 2078.56 34.85
Rural 19 275,531 14501.63 6948.82 47.92Madrid/Leon/La Mancha/ Urban 160 1,829,240 11432.75 4960.97 43.39Extremadura Intermediate 60 421,696 7028.27 4243.97 60.38
Rural 50 898,850 17977.00 11392.04 63.37Valencia/Baleares Urban 60 545,062 9084.37 4592.59 50.55
Intermediate 60 622,008 10366.80 3414.61 32.94Cataluna/Valencia Rural 20 339,591 16979.55 3857.49 22.72Rest of Cataluna Urban 110 833,178 7574.35 2862.50 37.79
Intermediate 50 382,029 7640.58 3163.80 41.41Andalucia/Murcia Urban 111 1,091,196 9830.59 4628.63 47.08
Intermediate 80 541,425 6767.81 3206.79 47.38Rural 30 872,486 29082.87 11734.24 40.35
62 | ITC 6 European Country Wave 1 Technical Report

APPENDICES
D Field materials
Every Interviewer going into the field should have the following: Field preparatory ma-terials:
• Interviewer’s tablets (using NFIELD software in each country)• ID card• Survey manual and maps of the sampling points were loaded on the tablet• Incentives
Every Supervisor had the following field materials:
• Maps of selected survey areas, where possible.• Additional interviewing tablet
E Survey information letter and consent
The following are the scripts used for both the information letter and consent:
Selected Respondent Information Letter:
Research Project: International Tobacco Control 6 European Country Project(ITC 6E Project)
Human Research Ethics Committee, University of Waterloo: ORE # 21262, IRBs
What is this research about?
The International Tobacco Control (ITC) Project 6-European Country Study is a project un-der the European Regulatory Science on Tobacco: Policy implementation to reduce lungdiseases (EUREST-PLUS). The objectives of EUREST-PLUS are to monitor and evaluate theimpact of the tobacco control policies within the Tobacco Products Directive (TPD), thenewly adopted legislation in the EU, and assess these within the context of the WHO Frame-work Convention on Tobacco Control (FCTC) ratification at a European level. The primaryobjective of the project is to evaluate the psychosocial and behavioural impact of the TPD.The aims of this research are to find out:
1. The impact of specific tobacco control policies within the TPD on residents of six Eu-ropean countries (Germany, Greece, Hungary, Poland, Romania, and Spain),
2. The prevalence and patterns of tobacco use behaviour within these countries,
ITC 6 European Country Wave 1 Technical Report | 63

APPENDICES
3. The tobacco use behaviour and the impact of tobacco control policies between thesecountries and other countries within the ITC Project.
Who is conducting this research?
The ITC 6E Project is led and coordinated by the ITC Project at the University of Waterloo(UW) in Canada in collaboration with European Network of Smoking and Tobacco Preven-tion (Belgium) and research partners from the 6 project countries. The overall internationalproject is being led by Professor Geoffrey T. Fong from the University of Waterloo, Canada,in collaboration with Dr. Ute Mons, German Cancer Research Center; Prof. Yiannis Toun-tas, University of Athens; Prof. Witold Zatonski, Poland Health Promotion Foundation; Dr.Krzysztof Przewozniak, Poland Health Promotion Foundation; Prof. Antigona Trofor, AerPur Romania; Prof. Esteve Fernandez, Institut Català d’Oncologia; Dr. Tibor Demjén, Smok-ing or Health Hungarian Foundation; Prof. Aristidis Tsatsakis, University of Crete; and Mr.Nicolas Bécuwe, Kantar Public Brussels.
What are we asking of you?
This research involves completing the survey interview (approximately 35 minutes) today.We plan to return approximately every 18 months to do follow-up surveys because we areinterested in how peopleâAZs opinions and behaviours might change over time.
Survey Participation
If you agree to participate in this research, first we will need to ask you a few essential ques-tions for statistical purposes and to determine whether you are eligible. If you are not eligi-ble, or if you do not answer these essential questions, we will not proceed further with theinterview. If you are eligible, we will proceed with the interview, which will take about 35minutes.
Participation is voluntary, and you may skip any non-essential questions if you wish. Youmay stop and start again if you cannot complete the survey all at one time. Once we arefinished, a token of appreciation will be provided for your participation.
Risk
Participants will not face any risk or harm to their well-being either physically, psychologi-cally, socially or culturally throughout completion of the survey.
Possible Benefits
This study will help the researchers to evaluate and understand the effects of national-leveltobacco control policies in European Union Member States. Also policy makers throughoutthe world will be able to use this evidence to create and implement tobacco control policiesfor demonstrated effectiveness.
64 | ITC 6 European Country Wave 1 Technical Report

APPENDICES
Confidentiality and Security of Data
All the information you provide is treated as strictly confidential. Data from this researchwill not be destroyed, but any identifying information about you such as name and addresswill be removed so that your answers cannot be linked back to you.
The data will be held in secure electronic files at the survey firm TNS Opinion (Belgium)and at the University of Waterloo (Canada) on computers that have security certificates, arepassword protected, and can only be accessed by the research team. Eventually, after twoyears, the data without names or personal information may be shared with other healthresearchers.
If you wish to discuss any questions or concerns about this research project, please contact:
Dr. Constantine Vardavas, Principal Investigator, EUREST-PLUS, European Network onSmoking and Tobacco Prevention. Tel: *************.
OR
Dr. Geoffrey T. Fong, Principal Investigator, ITC Project, Department of Psychology, Uni-versity of Waterloo, Canada. Tel: +1 519 888 4567 ext. 35811.
If you wish to lodge a complaint concerning the manner in which this research is beingconducted, please contact:
[ethics contact]
If you feel that the local ethics committee has not resolved your concerns to your satisfac-tion, you may wish to contact the Human Research Ethics Committee in Canada that isoverseeing the project:
Office of Research Ethics, University of Waterloo, 200 University Avenue West, Waterloo,Ontario, Canada N2L 3G1, Tel: + 1 519 888 4567 ext. 36005
BI49260Ask all.Thank you. This is a comprehensive survey of smokers in this and other European Unionmember countries that has to do with beliefs, attitudes, knowledge, and behavior abouttobacco use. It is being carried out by researchers from the EU and an international group.
This project is funded by an ongoing grant from the EU Horizon 2020. A major goal of thesurvey is to examine how smokers in this country differ or are the same in their views to-wards smoking.
We will talk to you for about 35 minutes, depending on your answers, and we think you willfind the questions quite interesting. In addition, we will provide a token of appreciation foryour involvement in this survey.
ITC 6 European Country Wave 1 Technical Report | 65

APPENDICES
All personal information you provide is treated as strictly confidential, subject to legal re-quirements and limitations. It will be held in secure storage and password protected at TNSOpinion, Belgium and the University of Waterloo, Canada and only be accessed by this re-search team. Any identifying information about you will be removed before the data aresecurely stored, so that your answers cannot be linked back to you. After two years, the sur-vey data, but not your name or other identifying information, will be shared with authorizedresearchers in other countries, as it will be used to make comparisons of smoking behaviourand attitudes across countries.
BI49235Ask all.Would you be willing to answer the 35-minute survey today and then again in 12-18 monthsfor a second token of our appreciation?
1 Yes2 No3 Time is not convenient
See HelpScreens for answers to any questions about follow-up surveys and contacts.If response=1, go to FR225.If response=2, go to BI439.If response=3, make appointment and terminate.
BI49439Ask if BI235=2.We understand how you feel. We really appreciate your participation. The difference be-tween this and most other surveys is that this is an EU and international research projectand we are talking to the same people a number of times to better understand what affectstheir opinions and smoking behaviour. This is why your participation is so important to us.
Can we just start with a few questions and see how it goes? (If hesitates, say) Or would an-other time be better?
1 Yes2 No3 Another time would be better
If response=1, go to FR225.If response=2, go to BI901. (enter Indivdisp)If response=3, make appointment and end interview.
66 | ITC 6 European Country Wave 1 Technical Report

APPENDICES
F Final outcomes rates
ITC 6 European Country Wave 1 Technical Report | 67

APPENDICES
T able
25.Fin
alou
tcom
erates
Germ
any
Greece
Hu
ngary
Polan
dR
om
ania
Spain
1.Nu
mb
ero
fadd
ressesap
pro
ached
/attemp
ted10325
35372754
34214490
41142.N
um
ber
ofad
dresses
wh
ereco
ntacth
asb
eenm
ade
82592856
24043028
27783853
3.Nu
mb
ero
fcon
tactedad
dresses
with
eligibility
determ
ined
30861295
17912154
20652451
4.Nu
mb
ero
fcon
tactedad
dresses
with
no
eligible
respo
nd
ents
1982466
9721163
11341509
5.Nu
mb
ero
fcon
tactedad
dresses
with
eligible
respo
nd
ents
1104829
819991
931942
6.Nu
mb
ero
fadd
ressesw
itheligib
leresp
on
den
ts,mem
bers
selected1085
823809
976911
9367.E
ligibility
ratefo
rh
ou
seho
lds,given
determ
inatio
n(5./3.)
0.3580.640
0.4570.460
0.4510.384
8.Estim
atedeligib
leh
ou
seho
lds
amo
ng
attemp
ted(7.*1.)
36942264
12591574
20241581
9.Nu
mb
ero
find
ividu
alsselected
for
interview
14251116
10781265
12541234
10.Nu
mb
ero
find
ividu
alrefusals
or
break
offs
20091
64227
232219
11.Nu
mb
ero
fcom
pleted
interview
s1003
10001000
10061003
1001
Ho
useh
old
con
tactrate(2./1.)
0.8000.807
0.8730.885
0.6190.937
Ho
useh
old
coo
peratio
nrate,given
eligible
(6./5.)0.983
0.9930.988
0.9850.979
0.994H
ou
seho
ldresp
on
serate
(6./8.)0.294
0.3630.642
0.6200.450
0.592
I nd
ividu
alcoo
peratio
nrate
(11./(11.+10.))0.834
0.9170.940
0.8160.812
0.820In
divid
ualresp
on
serate,given
selection
(11./9.)0.704
0.8960.928
0.7950.800
0.811
68 | ITC 6 European Country Wave 1 Technical Report

APPENDICES
G Country profiles
GERMANY
Germany has an estimated population of 82 million, 75% of whom live in urban areas. In2014, GDP per capita was US $42,000, making it the fourth largest economy in the world(nominally). Tobacco consumption leads to more than 128,000 deaths each year.
According to the WHO Report on the Global Tobacco Epidemic, 2015, the percentage ofcurrent tobacco smokers across both sexes was 24.5% with women smoking at a rate of ap-proximately 20.3%, and men smoking at a rate of 29.0%. In terms of daily users, the ratedrops to 20.9% total (17.1% Women and 25.1% Men). For youth aged 12-17, the total smok-ing rate is 12%; however, unlike adults, young girls have the higher smoking rate over theirmale counterparts with smoking rates of 12.6% and 11.5% respectively. The use of smoke-less forms of tobacco in Germany are very small, with approximately 2% of all adults usingsmokeless tobacco.
As of December 2014, total government expenditure on tobacco control activities was ap-proximately 4.5 million euros annually.
Price of Tobacco. Cigarette prices in Germany are in the middle range of costs across Eu-rope. As of March 2015, the average price per pack of 20 cigarettes was 5.96 euros. Excisetaxes on cigarettes meet the recommended percentage of at least 70% excise tax of the retailprice set out by the WHO with a 72.9% excise tax in place since 2012.
Smoke-free. As of 2007, Germany passed a comprehensive public smoke-free law. A smok-ing ban in restaurants, bars, and pubs was brought into force in August 2007, however Ger-man courts overturned the ban in one-room bars and restaurants. State authorities maypass more stringent smoke-free laws than those passed by the federal government. As such,regional governments in Bavaria, Saarland, and North Rhine-Westphalia have all introducedstricter smoke-free legislation such as the elimination of designated smoking rooms, or fullbans on smoking in public places. Currently smoking is restricted in indoor workplaces andpublic spaces nationwide. Smoking is also prohibited on all forms of transportation unless‘physically separate units’ exist for tobacco users. This means smoking is banned in formsof transportation such as streetcars or trolleys, buses, and taxis.
Tobacco Advertising, Promotion, and Sponsorship. Germany adopted its first advertisingand promotion ban of smoked tobacco in 1974 when it passed a comprehensive ban on ad-vertising on both television and radio. A comprehensive advertising ban was later adoptedin 1991. Point of sale advertising and promotion is still allowed in Germany. In 2010, a banon all forms of promotional discounts was passed.
Tobacco Packaging and Labelling. Prior to the European Commission Tobacco ProductsDirective (TPD), 2014, smoked tobacco products only required one of two text warnings
ITC 6 European Country Wave 1 Technical Report | 69

APPENDICES
occupying 30% of the front of the package, as well as an additional text message (one offourteen authorized messages) on the back of the package occupying 40% of the space. Un-der the new TPD, Germany must now feature one of 14 combined (graphic) health warningsoccupying at least 65% of both the front and back surfaces.
FCTC Status. Germany became a party of the FCTC on October 24, 2003 and ratified theAgreement on December 16, 2004.
GREECE
Greece has an estimated population of 11 million, approximately 78% of whom live in urbanareas. As of 2015, GDP per capita was US $26,000, making it the 46th largest economy in theworld (nominally).
According to the WHO Report on the Global Tobacco Epidemic, 2015, the percentage ofcurrent tobacco smokers across both sexes was 38.2% with women smoking at a rate of ap-proximately 25.7%, and men smoking at a rate of 51.2%. In terms of daily users, the ratedrops to 36.6% total (23.9% Women and 49.7% Men). For youth aged 12-17, the total smok-ing rate is 16.4% (13.3% female and 19.3% male). The use of smokeless forms of tobacco inGreece is very small, with approximately 0.2% of all adults using smokeless tobacco.
Price of Tobacco. Cigarette prices in Greece are low when compared to the rest of Europe.As of March 2015, the average price per pack of 20 cigarettes was 4.36 euros. Excise taxes oncigarettes meet the recommended percentage of at least 70% excise tax of the retail price setout by the WHO with a 79.95% excise tax in place since 2014.
Smoke-free. As of July 1, 2009 Greece has banned smoking in all healthcare facilities, foodpreparation areas, and entertainment venues, as well as public or private working areas, andany enclosed waiting area, airport, or transportation station. While such legislation exists,Greece has not enforced such bans effectively, especially in restaurants, cafes, and bars. Assuch, few restaurants or cafes comply with the legislation.
Tobacco Advertising, Promotion, and Sponsorship. Greece has had a comprehensive banon all tobacco advertising and promotion since July 2005. As such, all forms of tobaccoadvertising on television and radio, as well as any domestic print media and outdoor ad-vertising such as billboards are prohibited. Any free distribution of tobacco products is alsobanned, while promotional discount prices are still allowed.
Tobacco Packaging and Labelling. Prior to the European Commission Tobacco ProductsDirective (TPD), 2014, smoked tobacco products only required text warnings occupying30% of the primary surface area of the pack. The law required that the back surface of thetobacco package have a warning that covered at least 40% of that surface. Under the newTPD, Greece must now feature one of 14 combined (graphic) health warnings occupying atleast 65% of both the front and back surfaces.
70 | ITC 6 European Country Wave 1 Technical Report

APPENDICES
FCTC Status. Greece became a party of the FCTC on June 16, 2003 and ratified the Agree-ment on January 27, 2006.
HUNGARY
Hungary has an estimated population of 9.8 million, approximately 71% of whom live inurban areas. As of 2016, GDP per capita was US $26,941, making it the 58th largest economyin the world (nominally).
According to the latest WHO FCTC Report (2016), the percentage of current tobacco smok-ers across both sexes was 27.5% with women smoking at a rate of approximately 22.2%, andmen smoking at a rate of 33.4%. In terms of daily users, the rate drops to 25.8% total (20.8%Women and 31.5% Men). For youth aged 13-15, the total smoking rate is 30.5% (28.0% fe-male and 33.0% male).
Price of Tobacco. Cigarette prices in Hungary are low when compared to the rest of Europe.As of March 2015, the average price per pack of 20 cigarettes was 3.84 euros. Excise taxes oncigarettes meet the recommended percentage of at least 70% excise tax of the retail price setout by the WHO with a 77.26% excise tax in 2014.
Smoke-free. As of 1999, Hungary has had a comprehensive smoking ban in locations suchas: medical institutions, pharmacies, childcare facilities, educational facilities, social insti-tutions, sports facilities, government facilities, hospitality establishments, and workplaces.Under the same law, private establishments could allow smoking under particular circum-stances. An amendment to Act XLII of 1999 on the Protection of Non-Smokers and CertainRegulations on the Consumption and Distribution of Tobacco Products was passed by theHungarian Parliament on 26 April 2011. According to the amendment, by 1 January 2012smoking is prohibited on all public transportation and in all enclosed public places, includ-ing workplaces, bars and restaurants. Smoking is also banned in public education, childcareand health-care institutions; designated areas for smokers will be forbidden both indoorsand outdoors at these facilities..
Tobacco Advertising, Promotion, and Sponsorship. Hungary has had a comprehensiveban on all tobacco advertising and promotion since September 2008 (both direct and indi-rect). Hungary has also banned tobacco company sponsorship in all forms, as well as anyuse of promotional free-samples of tobacco products. Promotional discounts, as well asadvertising at the point-of-sale, are still permitted.
Tobacco Packaging and Labelling. Prior to the European Commission Tobacco ProductsDirective (TPD), 2014, smoked tobacco products required graphic warnings on all tobaccoproducts. Warnings needed to cover 30% of the front and 40% of the back surface areas ofall tobacco packages. According to the TPD for 14 text warnings, there are 42 pictures (3pictures per text). Each year a new picture accompanies the text warnings.
ITC 6 European Country Wave 1 Technical Report | 71

APPENDICES
From 20 August 2016, Hungary requires cigarette packages to carry pictorial health warningsof 65% of the front and back of packages. All packs with smaller pictorial warnings will needto be sold out by 20 May 2017.
FCTC Status. Hungary became a party of the FCTC on June 16, 2003 and ratified the Agree-ment on April 7, 2004.
POLAND
Poland has an estimated population of 38.2 million, approximately 60% of whom live inurban areas. As of 2015, GDP per capita was US $26,500, and represents the 24th largesteconomy in the world according to the World Bank.
According to the WHO Report on the Global Tobacco Epidemic, 2015, the percentage ofcurrent cigarette smokers across both sexes was 26.0% with women smoking at a rate ofapproximately 23.0%, and men smoking at a rate of 30.0%. In terms of daily users, the ratedrops to 22.0% total (18.0% Women and 27.0% Men). For youth, 12.1% of young females and15.7% of young males smoke respectively. The use of smokeless forms of tobacco in Polandis very small, with approximately 0.5% of all adults using smokeless tobacco.
Price of Tobacco. Cigarette prices in Poland are low when compared to the rest of Europe.As of March 2015, the average price per pack of 20 cigarettes was 3.84 euros. Excise taxes oncigarettes meet the recommended percentage of at least 70% excise tax of the retail price setout by the WHO with a 80.3% excise tax in place as of 2014.
Smoke-free. As of April 30, 1996, Poland has had a comprehensive ban on smoking in anypremise designated for public use. This includes public transportation and transportationestablishments, sporting establishments and public playgrounds for children, workplaces,and public cultural, recreational, food, and entertainment establishments.
Tobacco Advertising, Promotion, and Sponsorship. Poland has had a comprehensive banon all tobacco advertising and promotion since April 30, 1996. As such, all forms of tobaccoadvertising on television and radio, as well as any domestic print media and outdoor adver-tising such as billboards are prohibited. This includes a ban on advertising at the point-of-sale, though compliance with this particular area is low according to the WHO. Any form ofpromotional discount, free-sample, or sponsorship of an event is also banned.
Tobacco Packaging and Labelling. Prior to the European Commission Tobacco ProductsDirective (TPD), 2014, smoked tobacco products only required text warnings occupying35% of the primary surface area of the pack (30% of the front and 40% of the back). Un-der the new TPD, Poland must now feature one of 14 combined (graphic) health warningsoccupying at least 65% of both the front and back surfaces.
FCTC Status. Poland became a party of the FCTC on June 14, 2004 and ratified the Agree-ment on September 15, 2006.
72 | ITC 6 European Country Wave 1 Technical Report

APPENDICES
ROMANIA
Romania has an estimated population of 21.6 million, approximately 54.6% of whom live inurban areas. As of 2015, GDP per capita was US $20,800 in Romania, and represents the 51stlargest economy in the world according to the World Bank.
According to the WHO Report on the Global Tobacco Epidemic, 2015, the percentage ofcurrent cigarette smokers across both sexes was 26.7% with women smoking at a rate ofapproximately 16.7%, and men smoking at a rate of 37.4%. In terms of daily users, the ratedrops to 24.3% total (14.5% Women and 34.9% Men). For youth aged 13-15 the total smokingrate is 11.2%, 10.1% of young females and 12.2% of young males smoking respectively.
Price of Tobacco. Cigarette prices in Romania are low when compared to the rest of Europe.As of July 2014, the lowest price per pack of 20 cigarettes was 2.80 euros and the highestprice was 3.26 euros inclusive of taxes. Excise taxes on cigarettes meet the recommendedpercentage of at least 70% excise tax of the retail price set out by the WHO with a 75.4%excise tax in place as of December 2014.
Smoke-free. As of 2002, Romania has had a complete ban on smoking in all enclosed places,including workplaces, public transportation, children’s playgrounds, health care facilities,and educational facilities. Smoking is also banned in all restaurants, bars, cafes, and night-clubs.
Tobacco Advertising, Promotion, and Sponsorship. Romania has had a comprehensiveban on all tobacco advertising since January 31, 2008. As such, all forms of tobacco ad-vertising on television and radio, as well as print media and outdoor advertising such asbillboards are prohibited. Free or paid distribution of tobacco or related products, productsthat have an evident likeness to tobacco products, and any products used to promote smok-ing to minors are also banned. As of 2014, promotional discounts on tobacco products werestill permitted in Romania.
Tobacco Packaging and Labelling. Graphic health warnings have been required in Romaniasince 2002. As of 2014, warnings were required to meet a minimum of 35% of the principaldisplay areas (30% on the front and 40% on the back). With the implementation of the Euro-pean Commission Tobacco Products Directive (TPD), 2014, Romania must now feature oneof 14 combined (graphic) health warnings occupying at least 65% of both the front and backsurfaces.
FCTC Status. Romania became a party of the FCTC on June 25, 2004 and ratified the Agree-ment on January 27, 2006.
SPAIN
Spain has an estimated population of 47 million, approximately 79.6% of whom live in urbanareas. As of 2015, GDP per capita was US $28,520 in Spain, and represents the 14th largesteconomy in the world according to the World Bank.
ITC 6 European Country Wave 1 Technical Report | 73

APPENDICES
According to the WHO Report on the Global Tobacco Epidemic, 2015, the percentage ofcurrent cigarette smokers across both sexes was 27.0% with women smoking at a rate ofapproximately 22.8%, and men smoking at a rate of 31.4%. In terms of daily users, the ratedrops to 24.0% total (20.2% Women and 27.9% Men). For youth aged 14-18 the total smokingrate is actually higher than that of adults. As of 31 December 2014, the smoking rate amongyouth was 32.4%, 36.4% of young females and 28.1% of young males smoking respectively.
Price of Tobacco. Cigarette prices in Spain are in the middle when compared to the restof Europe. As of March 2015, the average price per pack of 20 cigarettes was 5.29 eurosinclusive of taxes. Excise taxes on cigarettes meet the recommended percentage of at least70% excise tax of the retail price set out by the WHO with a 78.09% excise tax in place as of31 July 2014.
Smoke-free. As of January 1, 2006, Spain has had a ban on smoking spaces such as health,teaching, sports, shopping, social, recreational, and entertainment establishments, as wellas workplaces, dance halls, gaming, food, and cultural centres. Under this law, smokingrooms are allowed to exist in hospitality establishments (up to 30% of the establishment).All public administrative and law entities are to be smoke free, as are public transportationpremises and vehicles, taxis and ambulances. Spain has a strong record of compliance withits smoke-free laws.
Tobacco Advertising, Promotion, and Sponsorship. As of 2003, Spain has banned all adver-tising from television and radio broadcasting, and all printed mediums (with the exceptionof tobacco trade publications). Spain has also banned smoking or the mentioning of smok-ing related brands or activities from all domestic media. Spain has prohibited any promo-tional activities such as discounts, free distribution, or sponsorships. As of January 2nd 2011,the smoke-free legislation was improved with the prohibition of smoking in all hospitalityvenues with no exceptions as well as at the outdoors of campuses of educational institutionsand healthcare centres.
Tobacco Packaging and Labelling. Spain mandated graphic health warnings as of May 27,2010. As of 2014, warnings were required to meet a minimum of 35% of the principal dis-play areas (30% on the front and 40% on the back). With the implementation of the Euro-pean Commission Tobacco Products Directive (TPD), 2014, Spain must now feature one of14 combined (graphic) health warnings occupying at least 65% of both the front and backsurfaces.
FCTC Status. Spain became a party of the FCTC on June 16, 2003 and ratified the Agreementon January 11, 2005.
74 | ITC 6 European Country Wave 1 Technical Report
Related Documents