©2012 International Monetary Fund IMF Country Report No. 12/167 ITALY 2012 ARTICLE IV CONSULTATION Under Article IV of the IMF’s Articles of Agreement, the IMF holds bilateral discussions with members, usually every year. In the context of the 2012 Article IV consultation with Italy, the following documents have been released and are included in this package: Staff Report for the 2012 Article IV consultation, prepared by a staff team of the IMF, following discussions that ended on May 16, 2012, with the officials of Italy on economic developments and policies. Based on information available at the time of these discussions, the staff report was completed on June 21, 2012. The views expressed in the staff report are those of the staff team and do not necessarily reflect the views of the Executive Board of the IMF. Informational Annex prepared by the IMF. Staff Statement of July 9, 2012 Public Information Notice (PIN) summarizing the views of the Executive Board as expressed during its July 9, 2012 discussion of the staff report that concluded the Article IV consultation. Statement by the Executive Director for Italy. The document listed below has been or will be separately released. Selected Issues Paper The policy of publication of staff reports and other documents allows for the deletion of market-sensitive information. Copies of this report are available to the public from International Monetary Fund Publication Services 700 19 th Street, N.W. Washington, D.C. 20431 Telephone: (202) 623-7430 Telefax: (202) 623-7201 E-mail: [email protected] Internet: http://www.imf.org International Monetary Fund Washington, D.C. July 2012

Welcome message from author
This document is posted to help you gain knowledge. Please leave a comment to let me know what you think about it! Share it to your friends and learn new things together.
Transcript

©2012 International Monetary Fund
IMF Country Report No. 12/167
ITALY 2012 ARTICLE IV CONSULTATION
Under Article IV of the IMF’s Articles of Agreement, the IMF holds bilateral discussions with members, usually every year. In the context of the 2012 Article IV consultation with Italy, the following documents have been released and are included in this package: Staff Report for the 2012 Article IV consultation, prepared by a staff team of the IMF, following discussions that ended on May 16, 2012, with the officials of Italy on economic developments and policies. Based on information available at the time of these discussions, the staff report was completed on June 21, 2012. The views expressed in the staff report are those of the staff team and do not necessarily reflect the views of the Executive Board of the IMF.
Informational Annex prepared by the IMF.
Staff Statement of July 9, 2012
Public Information Notice (PIN) summarizing the views of the Executive Board as expressed during its July 9, 2012 discussion of the staff report that concluded the Article IV consultation.
Statement by the Executive Director for Italy.
The document listed below has been or will be separately released. Selected Issues Paper
The policy of publication of staff reports and other documents allows for the deletion of market-sensitive information.
Copies of this report are available to the public from
International Monetary Fund Publication Services 700 19th Street, N.W. Washington, D.C. 20431
Telephone: (202) 623-7430 Telefax: (202) 623-7201 E-mail: [email protected] Internet: http://www.imf.org
International Monetary Fund
Washington, D.C.
July 2012

Is
ITALY STAFF REPORT FOR THE 2012 ARTICLE IV CONSULTATION
AN AGENDA FOR REVIVING GROWTH
Italy and the Euro area crisis. The authorities have embarked on an ambitious agenda to secure sustainability and promote growth. Despite these strong efforts, Italy remains vulnerable to contagion from the euro area crisis, with spillover consequences for the region and globally. Securing stability and reviving growth will require not only maintaining the momentum for reforms in Italy, but also progress at the European level in strengthening the currency union. Outlook. The economy is expected to contract through the year due to fiscal consolidation, tight financial conditions, and the global slowdown. The risks are on the downside, stemming mainly from an intensification of the euro area crisis.
Closing the competitiveness gap. The difficult business environment, fragmented labor market, and limited service competition have contributed to Italy’s weak growth performance and loss in competitiveness. Without reforms to address these structural gaps, potential growth will likely remain low over the medium term.
Structural reforms to revive growth. Comprehensive structural reforms are needed to raise productivity and participation. Labor reforms should aim to bridge the gap between permanent and temporary workers, reduce the tax wedge, and decentralize wage setting. Accelerating product market reforms in the energy, local public, and professional service sectors would drive down rents and lower the cost of business.
Growth-friendly fiscal consolidation. The government’s near-term fiscal plans are ambitious and critical for sustainability, but more can be done over the medium term to strengthen the fiscal outlook. To support growth, the composition of adjustment should be rebalanced more towards expenditure cuts and lower taxes. The new constitutional balanced budget rule provides an important tool for strengthening fiscal discipline and policymaking.
A resilient financial system. With limited access to wholesale funding, Italian banks continue to rely heavily on Eurosystem financial support. To remain resilient to the downturn, banks need to maintain adequate capital and liquidity buffers. Steps to reduce banks’ impaired loans would free up resources for new lending and support corporate restructuring.
June 21, 2012

2012 ARTICLE IV REPORT ITALY
2 INTERNATIONAL MONETARY FUND
Approved By Aasim Husain and Hugh Bredenkamp
Discussions took place in Rome and Milan from May 3–16, 2012. The staff team comprised Mr. Husain (head), Mr. Kang, Ms. Barkbu, Ms. Lusinyan, Mr. Tyson, Ms. Zoli (all EUR), Messrs. Eyraud (FAD), Guzzo and Moore (MCM), and Tiffin (SPR). Mr. Spilimbergo (EUR) and Ms. Nardin (EXR) also joined for a few days. Mr. Moghadam participated in the concluding meetings and press briefing. Mr. Sadun (OED) attended the policy meetings. The mission met with Prime Minister Monti, Labor Minister Fornero, Minister for Parliamentary Relations Giarda, Finance Vice Minister Grilli, and Bank of Italy Director General Saccomanni, other senior officials, and financial, industry, academic, parliament, and trade union representatives.
CONTENTS
ITALY AND THE EURO AREA CRISIS ____________________________________________________________ 4
OUTLOOK AND RISKS ___________________________________________________________________________ 6
A. A Fragile Path to Recovery ______________________________________________________________________6
B. Closing the Competitiveness Gap over the Medium Term _____________________________________ 11
POLICY CHALLENGES FOR REVIVING GROWTH _______________________________________________ 14
A. Structural Reforms to Revive Growth __________________________________________________________ 14
B. Making Fiscal Consolidation More Growth-Friendly ___________________________________________ 20
C. Building a More Dynamic and Resilient Financial System _____________________________________ 27
STAFF APPRAISAL ______________________________________________________________________________ 33
TABLES
1. Summary of Economic Indicators, 2008–17 __________________________________________________ 35
2. General Government Accounts (National Presentation), 2008–17 ___________________________ 36
2.1. Statement of Operations–General Government (GFSM 2001 format), 2008–17 ______________ 37
2.2. General Government Balance Sheet, 2005–11 _______________________________________________ 38
3. Financial Sector Indicators ___________________________________________________________________ 39
4. Summary of Balance of Payments, 2009–13 _________________________________________________ 40
5. Highlights of the Authorities’ Structural Reform Agenda ____________________________________ 41
FIGURES
1. Real Sector Selected Economic Indicators _____________________________________________________5
2. Balance of Payments ___________________________________________________________________________8
3. Banking Sector Indicators ____________________________________________________________________ 29
ITALY 2012 ARTICLE IV REPORT
INTERNATIONAL MONETARY FUND 3
BOXES
1. What are the Factors Behind Deleveraging in Italy? _____________________________________________ 7
2. Spillovers from A Potential Intensification of the Euro Area Crisis ______________________________ 12
3. Impact of Structural Reforms on Growth and Competitiveness _________________________________ 16
4. The Authorities’ Fiscal Consolidation Packages _________________________________________________ 21
5. Shifts in the Investor Base for Italian Government Bonds _______________________________________ 23
6. Would a Fiscal Devaluation Work in Italy _______________________________________________________ 25
ANNEXES
I. Debt Sustainability Analysis _____________________________________________________________________ 42
II. External Competitiveness _______________________________________________________________________ 46
APPENDIX
I. Main Recommendation of the 2011 Article IV Consultation and Authorities’ Response ________ 49

2012 ARTICLE IV REPORT ITALY
4 INTERNATIONAL MONETARY FUND
ITALY AND THE EURO AREA CRISIS 1. The economy has been in recession since the middle of 2011. GDP contracted for a third straight quarter, by 0.8 percent (q/q, s.a.) in Q1 2012. The contraction was led by sharp falls in consumption and investment as concerns about the fiscal outlook and the euro area crisis depressed confidence and tightened credit conditions (Figure 1). Exports also fell, along with the slowdown in global demand, but net exports contributed positively to growth due to the sharp import compression. Household real disposable income continued to decline in 2011, while consumer sentiment fell below levels in 2008–09. The unemployment rate rose to 10.2 percent in April 2012, its highest level in more than ten years, with youth unemployment at 35 percent.
2. The Italian authorities have taken strong measures to stabilize the fiscal situation and initiate structural reforms. Italy came under intense financial pressures in late 2011, as the euro area crisis pushed 10-year government bond yields above 7 percent. To restore confidence, the new government in December announced a third fiscal consolidation plan, bringing the total adjustment for 2012–14 to around 5 percent of GDP. It also approved a comprehensive package of structural reforms to liberalize services and announced plans for key labor reforms. Together with liquidity injections under the ECB’s LTRO, these actions drove down 10-year bond yields, with spreads dropping
below those of Spain by early March.
3. Following a brief respite, Italian financial markets came under pressure again in May. Concerns over contagion from the euro area crisis and the deepening recession have again pushed up 10-year Italian sovereign spreads, by almost 150 bps since early March. The government through mid June has issued €237 billion in sovereign debt, completing more than half of its financing for the year, but still faces sizeable funding needs in the coming months. Italian equity prices have performed poorly, down 17 percent for the year through May.
4. The turmoil has put banks under stress. Credit ratings for several Italian banks were cut in late 2011 and again in May, and remain on a negative outlook. With limited access to wholesale
100
200
300
400
500
600
700
100
200
300
400
500
600
700
Jan-11 Apr-11 Jul-11 Oct-11 Jan-12 Apr-12
10-year Government Bond Spread Against Germany (basis points)
Italy
Spain
Source: Bloomberg.
-30
-10
10
30
50
70
90
-30
-10
10
30
50
70
90
Jan-12 Mar-12 May-12 Jul-12 Sep-12 Nov-12
Monthly deficitMedium/long-term debt amortizationShort-term debt repaymentIssuance 1/
Italy: Projected Public Financing Requirements Excluding Issuance of New Short-term Debt , 2012 (bllions of euros)
Sources: Ministry of Economy and Finance; and IMF staff estimates.1/ Issuance for June is as of June 18.

ITALY 2012 ARTICLE IV REPORT
INTERNATIONAL MONETARY FUND 5
Figure 1. Italy: Real Sector Selected Economic Indicators
Source: Italian Statistical Of f ice and Bank of Italy.
-8
-6
-4
-2
0
2
4
6
8
2005 2007 2009 2011
GDP Growth and Output Gap(Annual rate and percent of potential GDP)
Real GDP
Output gap-8
-6
-4
-2
0
2
4
6
8
-8
-6
-4
-2
0
2
4
6
8
2007 2009 2011
Contribution to GDP Growth(Year-on-year percent change)
Private consumptionPublic consumptionForeign balanceInvestment
55
57
59
61
63
65
10
12
14
16
18
20
2005 2006 2007 2008 2009 2010 2011
Household Savings and Consumption
Consumption (percent of GDP, rhs)Savings rate (percent of disposable income)
-4
-3
-2
-1
0
1
-4
-3
-2
-1
0
1
2005 2006 2007 2008 2009 2010 2011
Trade Balance and Current Account(Percent of GDP)
Trade balance
Current account
2007 2008 2009 2010 2011 201260
65
70
75
80
5
6
7
8
9
10
11Capacity Utilization and Unemployment Rates
Unemployment rate (rhs)Capacity utilization
-8
-6
-4
-2
0
2
4
6
8
10
-8
-6
-4
-2
0
2
4
6
8
10
2007 2008 2009 2010 2011 2012
Productivity and Unilt Labor Cost(Year-on-year percent change)
ProductivityUnit labor cost
The recovery from the 2008-09 crisis has been modest...
.. as sharp declines in domestic demand pushedthe economy back into recession in late 2011.
The unemployment rate is again increasing, mirrored by a decline in capacity utilization..
.. contributing to a moderation in unit labor costs.
.. while the current account deficit has widened.
The household savings rate has reached historical lows...

2012 ARTICLE IV REPORT ITALY
6 INTERNATIONAL MONETARY FUND
markets and soaring funding costs, Italian banks have relied heavily on Eurosystem support, accounting for nearly one-quarter of their total financing. Banks have made progress in raising private capital to meet their EBA targets, but at a steep discount. Higher funding costs and tighter lending standards, especially for smaller firms, have pushed up corporate borrowing rates, while private sector credit has contracted by 0.8 percent from December through April (Box 1) .
5. The external current account deficit has started to narrow, from 3½ percent of GDP in 2010 to around 2¾ percent of GDP in the year to Q1 2012, as weak imports improved the trade balance (Figure 2). Net foreign liabilities have been stable at around 20 percent of GDP, but with around 37 percent of public debt held by non-residents, Italy remains vulnerable to changes in market sentiment. Imbalances with the euro area payment system (Target 2) have widened over the past year, as external outflows from the sovereign and banks have been offset by ECB support. 6. The broad public and parliamentary support for Prime Minister Monti’s technocratic government has weakened in recent months. The government’s approval ratings have fallen to below 50 percent in the face of stiff resistance to the labor reform bill and the lengthy recession. General elections will be held in April 2013, and Prime Minister Monti has declared he will not run, raising questions by market analysts about the continuity of reforms beyond his term.
OUTLOOK AND RISKS
A. A Fragile Path to Recovery
7. The economy is expected to continue contracting through the year due to the needed fiscal consolidation, tight financial conditions, and the global slowdown. The pace of contraction is expected to moderate before stabilizing towards the end of the year.1 Staff projects that GDP will decline by 1.9 percent in 2012 and another 0.3 percent in 2013. The main factors driving the contraction are:
Fiscal consolidation. The government’s fiscal adjustment program is estimated to reduce growth by 1½ percentage points in both 2012 and 2013. With revenue increases making up the bulk of the adjustment, growth in disposable income and household spending is expected to remain sluggish.
1 The impact of the earthquake in Northern Italy in May and June is expected to hold back industrial production and exports in the region through Q3. Production in the affected areas is concentrated in biomedical supplies, ceramics, and dairy, and accounts for roughly 1 percent of GDP.
-2
-1
0
1
2
3
4
-2
-1
0
1
2
3
42008 2009 2010 2011 2012 2013
Fiscal Impulse (change in structural primary balance, percent of GDP)
Source: IMF staff estimates and projections.

ITALY 2012 ARTICLE IV REPORT
INTERNATIONAL MONETARY FUND 7
-5
0
5
10
15
20
25
-5
0
5
10
15
20
25
t-8 t-5 t-2 t+1 t+4 t+7
Annual Nominal Credit Growth Compared Across Recessions (percent) 1/
1992q2-1993q3
2008q2-2009q2
2011q3-
Sources: ISTAT, IMF; and IMF staff calculations.1/ The legend shows the dates of recession episodes. t is the recession starting period.
Box 1: What are the Factors Behind Deleveraging In Italy? 1/ Credit flows have stagnated since late last year, especially for small firms. Credit growth to the non-financial private sector dropped from 3.5 percent (y/y) in November to 1.6 percent (y/y) in April, mostly reflecting declines in non-financial corporate loans. The decline has been most pronounced in lending to small firms whose growth fell from 0.4 percent (y/y) in November to -4 percent (y/y) in March. Surveys conducted at the end of 2011 showed significant tightening of lending conditions, similar to those after the Lehman bankruptcy, owing to higher bank funding costs, though more recent surveys indicate some improvement. As in previous recessions, the slowdown in credit partly reflects weak loan demand. The slowdown in private sector credit so far seems in line with those in previous recessions. Indeed, three quarters since the start of the recession, annual private credit growth has fallen by 3.3 percentage points, compared to declines of 6.5 and 4.7 percentage points respectively during corresponding periods in the early 1990s and 2008–09. Nevertheless, supply constraints are also playing a role and appear to have prevailed over demand factors at the end of 2011. Analysis based on bank lending surveys suggests that growth in loan demand exceeded that of credit supply by 0.5 percentage point in Q4 2011, similar to that observed after the Lehman bankruptcy. In 2012, the situation has reversed with weak demand now appearing to be the main factor driving the decline in credit. After the LTRO and other actions taken by policymakers to support banks in early 2012, the situation reversed with estimated demand for funds falling well short of supply. The fall in corporate borrowing rates observed in early 2012 is consistent with the notion that weak demand, rather than supply constraints, is driving credit developments. ______________________________ 1/ See accompanying Selected Issues Paper titled, “Recent Movements in Italian Government Bond Spreads: Driving Factors and Implications for Lending Conditions.”
0
1
2
3
4
5
6
7
0
1
2
3
4
5
6
7
Jan-07 Nov-07 Sep-08 Jul-09 May-10 Mar-11 Jan-12
Firm Lending Rates (Percent)
New loans < 1 mil. eurosNew loans > 1 mil. euros
Source: Bank of Italy.
-1.5
-1.0
-0.5
0.0
0.5
1.0
1.5
-1.5
-1.0
-0.5
0.0
0.5
1.0
1.5
2003Q1 2004Q4 2006Q3 2008Q2 2010Q1 2011Q4
Difference between Estimated Demand and Supply in Bank Credit to Firms 1/
(Quarterly growth, percentage points)
Sources: Bank of Italy ; and IMF staff calculations.
Lehman bankruptcy
1/ Loan supply and demand are estimated as linear functions of the indicators of supply and demand conditions obtained from the bank lending survey.

2012 ARTICLE IV REPORT ITALY
8 INTERNATIONAL MONETARY FUND
Figure 2. Italy: Balance of Payments
Source: Haver, IFS, and IMF staff calculations.
-6
-4
-2
0
2
-6
-4
-2
0
2
2007 2008 2009 2010 2011
Goods & Services Income
Transfers Total
Current Account Balance(Percent of GDP, rolling annual)
40
60
80
100
120
140
2.5
3.0
3.5
4.0
4.5
2005 2006 2007 2008 2009 2010 2011
Energy DeficitOil Price ($/barrel, RHS) 1/
Energy Trade Balance(Percent of GDP, rolling annual)
-5
0
5
10
15
Dec-10 Mar-11 Jun-11 Sep-11 Dec-11
EU Non-EU
Contributions to Import Volume Growth(Percent, annual)
-5
0
5
10
15
Dec-10 Mar-11 Jun-11 Sep-11 Dec-11
EU Non-EU
Contributions to Export Volume Growth(Percent, annual)
-15
-10
-5
0
5
10
15
2007 2008 2009 2010 2011
Portfolio
Direct Investment
Loans (excl Eurosystem)
Others
Financial Account Balance, excl. Eurosystem(Percent of GDP, rolling annual)
0
50
100
150
200
250
300
0
50
100
150
200
250
300
Dec-08 Dec-09 Dec-10 Dec-11
AssetsLiabilities
Bank of Italy Balances vis-a-vis the Eurosystem(Euro billions)
A deteriorating current account over 2010-11...
But recent import compression...
The recent turnaround in bank and portfolio flows...
1/ Average Brent/Dubai/Alaska
...largely reflects higher energy prices.
...has been offset by Eurosystem support.
...has outweighed slowing export growth

ITALY 2012 ARTICLE IV REPORT
INTERNATIONAL MONETARY FUND 9
Tight financial conditions. Bank deleveraging and the lagged impact of higher interest rates are expected to weigh on business investment. The IMF’s April 2012 Global Financial Stability Report (GFSR) sees higher funding costs and capital pressures on banks contributing to a 2¾ percent contraction in private credit during 2012–13 (compared to positive growth of 3½ percent during 2008–10). This is estimated to lower growth by 0.8 and 0.2 percentage points in 2012 and 2013, respectively.
Slowing exports. Real import growth in Italy’s trading partners, mainly in Europe, is expected to slow sharply to 2 percent in 2012, from over 5 percent in 2011.
8. The economy is expected to emerge from the recession in early 2013, led by a modest pickup in exports. Reflecting growing demand from trading partners, exports are projected to expand moderately starting in the second half of 2012, lifting gradually household spending and investment. However, given the drag from fiscal consolidation and tighter credit, the recovery will lag the rest of the region by nearly two quarters. Construction investment, in particular, is likely to continue contracting, as housing sales, which are 25 percent below 2007 levels, remain sluggish. Reflecting the slow pace of recovery, unemployment is projected to reach 11 percent in 2013.
9. Inflation will ease only gradually, as the impact of weak demand is partly offset by higher indirect taxes. Annual HICP inflation was 3.5 percent (y/y) in May, and is projected to remain above the euro area average in 2012–13 as a result of hikes in the VAT rate and indirect taxes. Core inflation (excluding energy and seasonal food at constant taxes) was 1.4 percent (y/y) in May and is expected to remain low, consistent with the widening output gap. Amidst high unemployment, wages will likely increase at a slower rate than inflation, generating a moderate real wage adjustment.
10. The risks to the outlook are tilted to the downside, stemming mainly from an intensification of the euro area crisis. As highlighted in the Risk Assessment Matrix, Italy is vulnerable to contagion from the euro area crisis and financial distress. Despite the significant consolidation, spreads on Italian sovereign bonds remain elevated, and the annual volume of maturing debt for the sovereign and banks is substantial. A “muddle-through” scenario for policies in the euro area
Sources: BoI, MEF; and IMF staff estimates.
0
100
200
300
400
500
600
700
0
100
200
300
400
500
600
700
2012 2013 2014
Projected gross financing needs of the public sector Bank medium and long-term debt falling due
Italy: Government and Bank Financing Needs (Billions of euros)
-4
-3
-2
-1
0
1
2
-4
-3
-2
-1
0
1
2
2008Q1 2009Q1 2010Q1 2011Q1 2012Q1 2013Q1
Euro area
Italy
Real GDP growth(Quarter-on-quarter percent change, s.a.)
Projections
Source: April 2012 WEO and IMF staff projections.

2012 ARTICLE IV REPORT ITALY
10 INTERNATIONAL MONETARY FUND
ITALY: RISK ASSESSMENT MATRIX2
Source of Main Risks
Relative Likelihood of Risk in the Next 1-3 Years (High, medium, or low)
Expected Impact if Risk is Realized (High, medium, or low)
1. The euro area crisis intensifies strongly
Medium Italy is prone to contagion from the euro area crisis and could experience a loss of investor confidence in its debt sustainability. Lack of progress in strengthening the currency union could undermine confidence in the firewall and continued EU support.
High Given the large sovereign financing need and debt burden, significantly higher funding costs could exacerbate the debt dynamics. Funding pressures could create a negative feedback loop, where spillovers to bank funding and higher domestic interest rates hurt growth, and weaken the sovereign further. A deeper downturn in the euro area could jeopardize the export-led recovery.
2. Banks’ asset quality deteriorates with the slowdown and/or funding pressures rise
Medium Increasing NPLs due to recession, especially from the weak SME and construction sectors, would erode banks’ capital base. The banking system is increasingly exposed to the sovereign, hence vulnerable to market valuations of sovereign debt. Banks could face funding pressure due to spillover from the euro area, and/or from deposit outflow, shortage of collateral, or debt rollover, including at LTRO maturity.
High Bank deleveraging could lead to a credit crunch, depressing activity and creating more NPLs. Further bank recapitalization from market sources may be difficult to obtain and may trigger contingent liabilities from government guarantees of bank debt. Prospects for public capital support reinforce the negative feedback loop between the sovereign and the banks.
3. Fiscal consolidation goes off track
Medium Change in political leadership or policy complacency may weaken the implementation of fiscal adjustment plans. Higher-than-expected fiscal multipliers could lead to a sharper downturn, making it more difficult to stabilize the debt ratio.
High Market concerns about medium-term debt sustainability may intensify, thereby increasing interest rates, further undermining sustainability. The stock of outstanding public payments could increase.
4. Structural reforms stall
Medium Reform implementation may stall due to policy complacency, unstable politics, or social opposition. The short-run effects of reform on growth and employment may be less positive than anticipated or medium-run effects may fail to fully materialize.
Medium Insufficient reform may keep growth low for a protracted period, undermining fiscal consolidation and the capacity to address growing pressures from an aging society. High youth and long-term unemployment could have lasting consequences for growth.
5. Oil prices sharply increase
Low Geopolitical instability could trigger a large and sustained oil price shock.
Medium Higher oil prices would damage economic activity. A $10 increase in the oil price could reduce growth―via compression of domestic as well as external demand―by up to 0.4 percentage points in the first year.
2 The RAM shows events that could materially alter the baseline path--the scenario most likely to materialize in staff’s view.

ITALY 2012 ARTICLE IV REPORT
INTERNATIONAL MONETARY FUND 11
combined with a protracted period of low growth in the area as a whole could lead to an intensification of the crisis, pushing Italy back into a bad equilibrium, with higher sovereign yields, declining activity, and rising public debt reinforcing each other. Other downside risks include a larger contractionary impact from fiscal adjustment, a faster pace of deleveraging, and a sharp fall in partner demand outside the euro area. On the other hand, slow progress in implementing fiscal and structural reforms could also undermine confidence and growth. These risks are likely to be correlated as euro area turmoil and a weaker growth outlook would raise funding pressures for both banks and the sovereign. In a tail scenario of a significant increase in sovereign yields, doubts about Italy’s fiscal outlook could have potentially large spillovers to the euro zone and the global economy, including on account of Italy’s prominent position in global sovereign bond markets and as a “gatekeeper” for shocks to and from core Europe and elsewhere (Box 2).
11. On the upside, a more robust global recovery or faster progress in reforms could boost sentiment and activity. This, coupled with continued liquidity support by the ECB that helps spur bank lending, could lift growth and lower the fiscal deficit faster than in the baseline.
B. Closing the Competitiveness Gap over the Medium Term
12. Over the medium term, low trend productivity and an aging society are likely to constrain Italy’s growth prospects. Growth is projected to average 1 percent over 2014–17, as the recovery in domestic demand closes the output gap. Growth will eventually converge to the economy’s potential, which, after accounting for weak productivity and slowing investment and employment trends, is likely to remain low at around ½ percent and lag behind that of other advanced European economies.
13. Weak productivity growth has contributed to a widening competitiveness gap over the past decade. Productivity growth has lagged behind wage increases, resulting in a steady loss of competitiveness. This is partly reflected in Italy’s weaker export performance compared to the rest of Europe and decline in global market share. Based on a range of methodologies, staff estimates Italy’s real exchange rate to be overvalued by 5–10 percent which is roughly consistent with market views.3 The current account deficit is projected to decline from 3¼ percent of GDP in 2011
3 See Annex II for a further discussion on external competitiveness.
-1
0
1
2
3
-1
0
1
2
3
2000 2002 2004 2006 2008 2010 2012 2014 2016
Euro area GermanyFrance Italy
Potential GDP Growth(Percent)
Sources: WEO; and IMF staff estimates.
Projections
-40
-20
0
20
40
60
-40
-20
0
20
40
60
Manuf. Total Manuf. 2/
Total Manuf. Total
Germany France Italy
Wages Productivity 1/ ULC
Contribution to Unit Labor Cost Change in Manufacturing and Total Economy, 2000–11
(Cumulative percent change)
Sources: AMECO and IMF staff calculations.1/ Negative = Increase in labor productivity; 2/ 2000–10.

2012 ARTICLE IV REPORT ITALY
12 INTERNATIONAL MONETARY FUND
Box 2. Italy – Spillovers from a Potential Intensification of the Euro Area Crisis Despite strong efforts to stabilize the fiscal position and implement growth-enhancing reform, Italy remains vulnerable to an intensification of the euro area crisis. Shocks could propagate through Italy’s sizeable trade and financial links with other euro area countries: Trade. About 8 percent of Italy’s total exports is directed to the periphery (Greece, Ireland, Portugal, and
Spain), and 40 percent to the euro area. A steeper euro area recession could therefore delay an export-led recovery in Italy.
Financial. Italian banks’ direct exposure to the periphery is relatively limited (2.4 percent of GDP) but that to all euro area countries is considerable (25 percent of GDP), with the largest exposure to Germany and Austria. Italian banks’ funding is also concentrated, with most interbank loans coming from Europe (4½ percent of GDP) and primarily from Germany and France (3 percent of GDP combined). Non-European interbank funding is relatively limited (less than 1 percent of GDP) and is mostly from the United States.
Official. Italy has also provided guarantees for funding to Greece, Ireland, and Portugal through the Greek loan facility and the EFSF, amounting to around €35 billion (2.2 percent of GDP).
A euro area shock could lead to higher sovereign interest rates, tighter credit conditions and reduced trade, triggering a deeper recession in Italy. In a severe downside scenario, spreads on Italian government bonds could rise sharply, led mainly by an acceleration of sales by nonresidents. Banks could face mark-to-market losses from their sovereign exposure (7 percent of total assets) as well as higher NPLs from the weaker economy, and accelerate deleveraging. Additional ECB financing may be needed to supplement the liquidity from earlier LTROs to cover maturing bank debt. The spillovers from Italy to the euro area and beyond could be significant, highlighting the need for a coordinated response to contain the crisis. Italy represents 17 percent of euro area GDP and accounts for 5 percent of the global stock of government bonds, and therefore occupies a central role in the global trading and financial system. Staff cluster analysis of global trade and financial flows suggests that Italy is a “gatekeeper” not only for core Europe—serving as conduit of shocks to and from Belgium, France, Germany, and the Netherlands—but also for central- and southeastern Europe (CEESE) and other economies, especially those in the CIS and Middle East.1 Given this gatekeeper role, Italy can serve as a propagator or a dampener of shocks, depending on the country’s underlying vulnerabilities and policy response.
1/ See IMF, “Enhancing Surveillance – Interconnectedness and Clusters,” FO/Dis/12/37, 03/15/2012.
Italy
Greece Ireland
PortugalSpain
Germany
France
AUT
Restof EA
United Kingdom
Emerging Europe
UnitedStates
Sources: BIS and IMF staff calculations.1/ Size of bubble represents total domestic banks' total non-resident exposure. Thickness of line represents the sum of gross exposure of Italian banks to a country or region pluss the country's or regions' banks' exposure to Italy. This figure covers only claims of banks in BIS reporting countries.
375bn120bn
70bn
180bn110bn
125bn
369bn
83bn
Italy: Cross-Border Bank Exposure, 2011 1/(Billion of US dollars)
Italy
GreeceIreland
PortugalSpain
Germany
France
AUT
Rest of EA
UnitedKingdom
Emerging Europe
UnitedStates
Sources: DOTS and IMF staff calculations.2/ Size of bubble represents total imports. Thickness of line represents trade between Italy and each country; i.e. the sum of the two countries or regions' exports.
155bn26bn
46bn
70bn40bn
106bn74bn
109bn
Italy: Cross-Border Trade Flows in 2011 2/(Billions of US dollars)

ITALY 2012 ARTICLE IV REPORT
INTERNATIONAL MONETARY FUND 13
to 1½ percent of GDP by 2017, but will still be about 1 percentage point above the level consistent with medium-term fundamentals and appropriate policies. Continued progress in implementing the authorities’ medium-term fiscal plans and structural reform agenda will be key in narrowing the current account and competitiveness gaps.
Authorities’ Views 14. Compared to staff’s projections, the authorities expect the economy to recover earlier during the second half of this year. Although the earthquakes in the North could adversely affect Q2 GDP, its impact, as well as those from bad weather in the winter and tighter lending conditions, is likely to ease and be offset by improving exports. They agreed that fiscal consolidation will weigh on domestic demand but do not see the fiscal multiplier as having increased significantly in the downturn, pointing to the resilience of household spending despite declining real disposable incomes. The Ministry of Economy and Finance forecasts GDP to contract by 1.2 percent in 2012, followed by a modest increase of 0.5 percent in 2013, but highlighted that the forecast depends very much on the strength of the global recovery and the outlook for government bond yields. With a faster pace of recovery than assumed by staff (but similar estimates of potential growth), the authorities also project a smaller negative output gap in 2012–13.
15. ECB liquidity support and other policy measures have prevented a large credit contraction. The modest decline in lending since November last year was mainly to the corporate sector and reflected both weak demand as well as supply constraints. Large banks reduced loans to risky firms which were partly offset by an increase in lending by smaller banks. More recently, with the LTRO and other supportive measures, lending standards have loosened, while interest rates on loans have started to ease.
16. Weak global demand and an intensification of the euro area crisis are seen as the main downside risks to the outlook. Given sluggish domestic demand, a decline in global trade or renewed financial turmoil would make Italy’s recovery more uncertain. Other risks include an erosion in confidence should the reform momentum stall or political uncertainty rise. The construction sector is likely to remain weak, but the risk of a significant housing price correction is low given the modest run-up in prices and low household leverage. On the upside, stronger global demand could speed up Italy’s recovery, given the depressed levels of capital spending.
17. Structural reforms to improve productivity and competitiveness are essential for lifting potential growth. Low productivity was the main factor behind Italy’s poor growth performance, reflecting in part structural rigidities that had prevented the economy from adjusting to the rapid pace of globalization and technology. The authorities noted that Italy has relatively low external imbalances compared to other euro area countries and that exports have held up reasonably well in recent years. Nevertheless, Italy has experienced a loss in competitiveness, which if left unaddressed, will remain a drag on growth.

2012 ARTICLE IV REPORT ITALY
14 INTERNATIONAL MONETARY FUND
POLICY CHALLENGES FOR REVIVING GROWTH 18. Reviving growth will require not only comprehensive reforms in Italy, but also progress at the European level in strengthening the currency union. The authorities’ ambitious and wide-ranging agenda appropriately aims to revive growth and restore dynamism to the economy. The priority should continue to be on wide-ranging structural reforms to boost productivity and labor participation, a supportive fiscal strategy that is both growth-friendly and sustainable, and steps to promote a more dynamic and resilient banking system. At the same time, progress at European level in creating a more integrated currency union with greater fiscal and financial discipline and risk sharing, combined with further monetary easing and unconventional measures as needed by the ECB, is crucial for securing stability and providing needed time for Italy’s adjustment and reform efforts.
A. Structural Reforms to Revive Growth
19. Maintaining the momentum for reform will be important to address stagnant productivity and entrenched structural weaknesses. The difficult business environment, fragmented labor market, and limited competition in services have contributed to the poor growth performance and a loss in competitiveness. The high level of youth and long-term unemployment risks creating a “lost generation” with lasting consequences for growth. Addressing these weaknesses is a key priority for reviving growth and alleviating the social cost of the crisis.
Enforcing contracts #31
• Takes twice longer and more procedures
•And costs more
Getting electricity #29
• Takes more time
•And costs 4 times more
Construction permits #27
• Takes more time
•And costs 3 times more
Registering property #25
• More procedures
•But takes less time at about the same cost
Resolving insolvency #19
• Takes longer to close a business
•Costs twice but with lower recovery rate
Paying taxes #31
• Takes more time and more payments
•Tax rates are much higher
Getting credit #28
• Weaker legal rights
•Wider cove-rage in credit registries
Trading across the board #26
•Takes twice longer to export/import
•Costs about 20% more to export/import
Starting a business #21
•Takes less time•But costs 4 times more
Protecting investors #16
•Transparency is better
•But investor protection is weaker
Source: World Bank Doing Business 2012.1/ OECD high-income economies; 2/ For each topic, the ranking among 31 OECD countries is reported.
Ease of Doing Business in Italy vs. OECD Average 1/2/The 2012 World Bank Doing Business survey ranked Italy 30 out 31 OECD countries in the ease of doing business,
with Italy faring poorly particularly in the areas of contract enforcement, tax payments, and getting electricity.

ITALY 2012 ARTICLE IV REPORT
INTERNATIONAL MONETARY FUND 15
20. The potential gains to growth from deeper structural reforms are substantial. IMF staff estimates suggest that product and labor market reforms that bring Italy closer to OECD best practices could increase the level of GDP by about 6 percent over the medium term and contribute significantly to closing Italy’s competitiveness gap (Box 3). The government has embarked on important reforms to deregulate the service sector and make the labor market more inclusive and flexible, as well as strengthen the anti-corruption legal framework. Changes to the government’s initial proposals on labor reform have highlighted the political challenges in advancing the structural agenda. Accelerating these reforms, and locking in the necessary legislative and administrative changes as soon as possible, would strengthen confidence and create momentum for further reforms. Greater coordination at the EU level, especially in strengthening the single market for energy, transportation, and services, would also support Italy’s efforts in these areas.
Repairing the Labor Market
21. The labor market reform bill should be passed quickly to reduce uncertainty and encourage new hires. The bill promotes open-ended and apprenticeship contracts for young workers and makes unemployment insurance more universal. It also facilitates hiring by allowing companies to lay off workers for economic reasons and reducing the cost of dismissal (Table 5). Clarifying further the conditions for reinstatement via the judicial process would reduce uncertainty and facilitate out-of-court settlements of dismissal disputes.
22. More is needed to bridge the gap between permanent and temporary workers, improve labor participation, especially for the youth and women, and better match wages to productivity.
Bridging the gap between permanent and temporary workers. The cost of new regular hires could be lowered by allowing for a more flexible open-ended contract for new workers that gradually increases employment protection with tenure. This would also facilitate the employment of young workers.
Boosting female labor participation. In addition to child-care and maternity support measures envisaged in the reform, reducing the marginal tax rates for married second-earners would help raise female labor participation, one of the lowest in the OECD.
Decentralizing wage setting. The June 2011 agreement among social partners to promote setting of firm-level contracts independent of national ones should be made more operational. Allowing companies and workers to first set firm-level contracts, unless they agree to opt out and abide by national ones, would better
40
50
60
70
80
90
40
50
60
70
80
90
Italy OECD EU G7
Labor Force Participation Rates, 2011(Percent of respective population groups)
Youth (20-24)Female
Source: OECD.

2012 ARTICLE IV REPORT ITALY
16 INTERNATIONAL MONETARY FUND
Box 3: Impact of Structural Reforms on Growth and Competitiveness 1/
The impact of structural reforms in Italy is estimated using the IMF’s Global Integrated Monetary and Fiscal model (Kumhof and others, 2010). In the model, staff considered: (i) product market reforms which increase competition and productivity, especially in the non-tradable sector by lowering the cost of doing business; and (ii) labor market reforms which boost labor participation and increase efficiency by lowering adjustment costs and improving job matching. Most reforms are assumed to be implemented over 2013–18, closing roughly half the gap with best practice cases (based on the OECD for the labor market, and the rest of the euro area for the product market). In addition, growth-enhancing fiscal reforms that would—in a deficit-neutral way—lower the labor tax wedge and increase infrastructure spending are also considered. The estimates suggest that a comprehensive package of product and labor market reforms could raise the level of real GDP by 5¾ percent after 5 years and by 10½ percent in the long run. This compares with the authorities’ estimate of a 2.4 percent increase in the level of GDP by 2020 if their recent liberalization and simplification measures are implemented with a similar impact on competition and costs as in earlier reforms. The measures with the largest impact are those which improve the competitiveness of the non-tradable sector. The impact of the labor market reforms considered in the simulations is smaller, explained in part by a relatively smaller gap with best practice cases, but there is a significant payoff from doing product and labor market reforms simultaneously. Combining fiscal reforms could raise real GDP by an additional 3 percent after 5 years, with a shift from public transfers to infrastructure investment having the highest growth impact in the long run. 2/ Comprehensive structural reforms could also contribute to closing Italy’s competitiveness gap. Italy’s competitiveness gap (real exchange rate overvaluation) is estimated to be around 5–10 percent. The simulations show that structural reforms could depreciate the real exchange rate by about 3 percent after 5 years and over 7 percent in a decade. Unit labor cost would decline by about 4½ percent after 5 years, as increased labor productivity would more than offset the increase in wages. In the short run, the current account would deteriorate slightly reflecting higher investment relative to private savings, but in the long run, would converge to zero and move slightly into surplus. Staff’s estimates are consistent with other studies that also find potentially large positive effects of structural reforms. OECD (2012) and Bouis and Duval (2011) find that closing the gap with best practices could increase Italy’s per capita GDP by about 7 percent after 5 years and close to 15 percent after a decade. Forni and others (2010) find that increasing competition in services sector in Italy could raise real GDP by up to 11 percent in the long run. In a more ambitious reform scenario, the authorities estimate that closing the gap in competition, entry barriers, and administrative costs with the best performers in Europe could raise real GDP by a smaller 5 percent by 2020. ___________________________________ 1/ Based on the accompanying Selected Issues Paper titled, “Structural Reforms in Italy: Overview and Macroeconomic Impact.” 2/ Although not captured in the model, the short-run impact of the reforms, especially in the labor market, can potentially be smaller or even negative because of adjustment costs and unfavorable cyclical position (Cacciatore and others, 2012; Bouis and others, 2012).
Year 5 Long Run
Product and labor market reforms 5.7 10.5
Product market reforms 4.4 8.3
of which: Non-tradables sector 3.3 6.9
Labor market reforms 1.1 1.8
of which: Female participation rate 0.7 1.0
Fiscal reforms 3.0 9.8
Switching from direct to indirect taxes 1/ 1.3 1.8
Switching from transfers to investment 1.6 7.7
Source: IMF staff estimates.1/ Direct taxes include both labor and capital taxes.
Italy: Reforms Scenario—Impact on Real GDP(Percent deviation from baseline)

ITALY 2012 ARTICLE IV REPORT
INTERNATIONAL MONETARY FUND 17
match wages to productivity. Greater differentiation of public wages across regions would support private wage flexibility and employment, especially in the South.
Raising Productivity in Services
23. Important progress is being made in overdue product market reforms. Parliament in March passed a comprehensive liberalization package that covered network industries, fuel distribution, local public services, transport, professional services, and infrastructure, and strengthened the enforcement of competition rules. Administrative simplification reforms, which should lower the cost of doing business were also approved (Table 5). Together, these measures, when implemented, should help close Italy’s competitiveness gaps and boost growth potential over the long term.
24. In product markets, priority should be given to accelerating reforms in the energy, local public, and professional services sectors with the broadest impact on growth. Services in Italy contribute over 70 percent of total value added, as in other advanced economies, but its productivity has lagged behind. Product market reforms to increase competition in services can raise productivity by reducing business costs and improving resource reallocation. The priorities are to:
Complete the planned ownership separation of gas distribution and production in 2012. This would improve competition and eventually help drive down energy prices, which are among the highest in the euro area.4
Accelerate the opening of professional orders, which would strengthen competition and lower excessive rents and costs for businesses and households.
Push forward on privatization, especially for local public utilities, to enhance the efficiency and quality of public services and lower their cost.
4 The price of electricity in Italy is 50 percent higher than the European average due to limited competition and insufficient infrastructure in the gas sector coupled with Italy’s large reliance on gas in electricity production (Antitrust Authority and 2009 OECD Review of Regulatory Reform “Italy: Better Regulation to Strengthen Market Dynamics”).
98
100
102
104
106
108
98
100
102
104
106
108
2000 2002 2004 2006 2008 2010
Euro areaItalyGermanyFrance
Productivity in Services Sector 1/ (Index; 2000=100)
Source: AMECO.1/ Gross value added at 2005 prices per person employed.
0
500
1,000
1,500
2,000
2,500
3,000
0
500
1,000
1,500
2,000
2,500
3,000
2000 2002 2004 2006 2008 2010
Italy, total priceItaly, excl. taxPeers 1/, total pricePeers 1/, excl. tax
Electricity Prices: Industry(Euro/tonne of oil equivalent)
Source: OECD.1/ Peers = Average of Austria, Belgium, France, Germany, Netherlands, Portugal, and Spain.

2012 ARTICLE IV REPORT ITALY
18 INTERNATIONAL MONETARY FUND
25. Reforms in services, especially network industries, would benefit from wider EU initiatives. These policies, as supported by the Italian government, could include developing a broader internal energy market; removing barriers to infrastructure investment; developing a single European transport area; and reducing the number of regulated professions in Europe. Simulation results suggest that when product and labor market reforms in Italy are combined with wider euro area structural reforms, the gains for Italy would increase.5
Helping Companies Grow 26. Italian small and medium-size enterprises (SMEs) are the cornerstone of the corporate sector but face difficulties in growing. Compared to the EU average, Italian SMEs account for a much higher share of value added (71 percent versus 58 percent) and are concentrated among micro firms with less than 10 workers. Small size and low productivity are particularly evident in the trade and tourism-related sectors. SMEs also suffer from excess leverage, with debt-to-equity ratios above 200 percent in 2010. Business startup and exit rates in Italy are low, limiting the economy’s flexibility and innovative capacity.
27. Improving access to financing and streamlining tax and other regulations would help companies grow. Expanding risk-based—as opposed to collateral-based—lending would improve SMEs’ access to credit, while developing further the venture capital and private equity industry would expand the availability of risk capital. Recent initiatives to foster firm recapitalization, such as the allowance for corporate equity, are welcome in this regard. In addition, reforms to promote greater inward FDI (among the lowest in the OECD) would allow SMEs to benefit from the growth in global supply chains and technology transfer.
Authorities’ Views 28. Product and labor market reforms aim to enhance competition, flexibility, and employment, which over time should translate into higher productivity and investment. The authorities estimate that the recent liberalization and simplification measures could increase the level of GDP by 2.4 percentage points in 2020 (on average by
5 See accompanying Selected Issues Paper titled, “Structural Reforms in Italy: Overview and Macroeconomic Impact.”
0
30
60
90
0
30
60
90
Germany France EU27 Spain Italy
Share of Value Added by Smalland Medium Size Enterprises
(Percent)
Source: EC Small Business Act Fact Sheet (2008).
0
200
400
600
800
1,000
1,200
1,400
0
200
400
600
800
1,000
1,200
1,400
US FR DE UK ES IE GR IT
Enforcing Contracts: Time to Resolve a Dispute Through Courts (days)
Source: World Bank Doing Business 2012.

ITALY 2012 ARTICLE IV REPORT
INTERNATIONAL MONETARY FUND 19
0.3 percentage points annually). Nevertheless, more still needs to be done, especially in improving the efficiency of the judicial system which would have wide-ranging benefits. For example, reducing the lengthy period for civil trials (1,200 days on average in Italy versus 331 days in France) would remove an important barrier to effective contract enforcement.
29. The objective of the labor reform bill is to create a more inclusive and dynamic labor market. The reforms seek to strike a balance between preserving firms’ flexibility and strengthening the social safety net, especially for marginal workers. The authorities believe that the proposed limits on compensation for economic dismissals would reduce significantly hiring uncertainty and the incentive for using the judicial process. On the proposal for a more flexible open-ended contract with phased-in protection over time, the authorities saw instead apprenticeship contracts as the main entry point for young workers that would encourage firms to invest in training while maintaining hiring flexibility.
30. More is needed to raise the participation of women and match wages to productivity. The government is keen to provide more financial incentives for hiring women and youth but faces a tight budget constraint. Improving the welfare system for child and elderly care would also facilitate the entry of women to the labor force. To promote wage decentralization, the government has proposed to extend tax allowances for firm-level wage bargaining. Greater regional differentiation of public sector wages across regions could support private wage flexibility but is seen as politically challenging and would need to be tackled in the context of broader reform of the public sector.
31. Product market reforms are entering the implementation phase. The government has issued a decree on separating ownership in the gas sector and will issue parameters for setting professional fees by end-July. The energy reforms should lower prices but the decline will likely be gradual given Italy’s heavy dependence on gas for its energy needs. For transportation, the authorities highlighted the creation of independent Transport Authorities as important for promoting competition, especially at the local level. Although current conditions are not suited to large-scale asset sales, the authorities remain committed to pursuing privatization and are working on completing the inventory of public assets and exploring ways to improve their efficiency and revenue generation capacity.
32. Several initiatives are underway to improve the business environment and support firms’ growth. The authorities saw the difficult regulatory environment and poor quality of public services as key factors holding back firms’ growth. In this regard, the simplification reforms to reduce administrative burden by streamlining information requirements, authorization procedures, and the tax administration system should help firms grow. The government has also implemented measures to facilitate SME financing, such as through government credit guarantees, allowances for corporate equity to foster firm recapitalization, and tax incentives for venture capital. In June, as part of the growth agenda, the government approved measures to provide tax incentives for infrastructure and construction investment, expand debt instruments for non-listed firms, and simplify procedures for business startups.

2012 ARTICLE IV REPORT ITALY
20 INTERNATIONAL MONETARY FUND
33. Greater market integration at the European level would also support Italy’s reform efforts. In particular, further opening of the gas distribution network at the EU level would allow Italy to diversify its energy sources and create a more competitive market. Moving towards a trans-European transportation network would generate economies of scale and drive down transport costs in Italy. Greater use of the EU structural funds and EIB investment could also help meet infrastructure needs.
B. Making Fiscal Consolidation More Growth-Friendly
34. The government has enacted a series of fiscal adjustment and reform packages to improve the budgetary position. The three packages, introduced in 2011, feature significant and front-loaded consolidation; pension reforms to strengthen long-term sustainability; a modest shift from direct to indirect taxes; higher taxes on wealth, especially property; and more aggressive action against tax evasion (Box 4). Roughly two-thirds of the adjustment is revenue-based, adding to Italy’s already-high tax burden, and relies mainly on hiking tax rates rather than broadening the base. The government in April embarked on another spending review to identify expenditure cuts that would replace the need to increase VAT rates in October. Also in April, the Parliament approved a structural balanced budget rule in the constitution which is set to take effect in 2014 and legislated the creation of a fiscal council.
35. As a result of these measures, the primary surplus of the general government is expected to rise to above 4 percent by 2013, the highest in the euro area. The general government met its 2011 deficit target of 3.9 percent of GDP, and in 2012, the overall deficit is projected to decline further to 2.6 percent of GDP.6 Based on staff’s macroeconomic assumptions, the primary balance would improve further from 3.0 percent of GDP in 2012 to 4.2 percent of GDP in 2013, and the overall deficit in would shrink to 1.5 percent of GDP. The gross debt ratio would peak in 2013 at 126.4 percent of GDP.
36. Despite the improvement in the primary balance, the debt ratio is projected to decline only gradually after 2013 and will remain vulnerable to adverse shocks. Based on staff estimates, the structural surplus after 2013 is expected to ease slightly as the impact of higher interest rates pass through the budget. The debt ratio is projected to decline to around 119 percent
6 In response to the recent earthquakes in the North, the government has proposed to finance the reconstruction efforts (0.2 percent of GDP) through a 2 cent increase in gasoline prices and further expenditure cuts.
-6
-4
-2
0
2
4
6
Uni
ted
King
dom
Irela
nd
Fran
ce
Gre
ece
Port
ugal
Belg
ium
Swed
en
Ger
man
y
Italy
2012
2013
General Government Primary Balance(Percent of GDP)

ITALY 2012 ARTICLE IV REPORT
INTERNATIONAL MONETARY FUND 21
Box 4. The Authorities’ Fiscal Consolidation Packages
Between July and December 2011 the authorities legislated a series of fiscal packages. The overarching objective was to support debt reduction, but some offsetting measures were included to support growth, such as modest reductions in the taxation of labor and capital and support to local transport and infrastructure. Ministries were allowed to rebalance the cuts to their budgets towards the least productive expenditure areas, and the reductions in health expenditure will be underpinned by policies to harmonize pharmaceutical spending and increase patient co-pay.
The fiscal packages also introduced additional pension reforms, which deliver both short-term savings and also strengthen long-term sustainability. Key components include: (i) de-indexation of high-level pensions; (ii) immediate extension of contributory system to previously grandfathered workers; (iii) tightening of seniority pension rules; and (iv) an earlier rise in the pensionable age, especially for women. The pension reforms are expected to generate savings of around 1.2 percent of GDP annually during 2020–30.
2012 2013 2014
Increase in revenue 49.5 63.3 67.2Of which:
Increased taxes on consumption 17.5 26.9 30.4Increase in VAT (20% to 23% and 10% to 12%) 7.5 17.4 20.6Fuel excises, tobbaco and lottery 10.0 9.6 9.7
Increased taxes on wealth 15.3 16.2 15.0Property tax with revaluation of tax base 10.7 10.9 11.3Stamp duty on financial assets; tax on assets abroad 4.2 4.9 3.3Luxury asset tax 0.4 0.4 0.4
Other increase 8.6 10.6 11.4Increased social security contributions 1.2 1.6 2.0Capital income taxation 1.4 1.5 1.9Regional income tax surcharge 2.2 2.2 2.2Tax collection measures/anti-evasion/gaming 3.7 5.3 5.3
Reduction in revenue -9.2 -11.2 -13.5Of which:
Incentives for Capital and Labor -3 -5 -6Reduced tax on labor (IRAP) -2 -4 -3Allowance for Corporate Equity (ACE) -1 -1 -3
Reduction in expenditure 24.5 29.1 34.0Of which:
Ministerial expenditure 7.1 5.1 3.3Sub-national government expenditure 7.0 9.2 9.2Health expenditure 0.0 2.5 5.0Pension measures 3.2 8.5 10.5
Increase in expenditure -15.8 -5.5 -6.3Of which:
Transport, Infrastructure and other growth Funds -1.9 -2.2 -2.5Credits to truck hauliers -1.1 -1.1 -1.1IRAP deductability -1.0 -1.0 -1.0
Net fiscal impact (consolidation) 48.9 75.7 81.3
Percent of GDP 3.1 4.8 5.0Share of net revenue measures (percent) 82.3 68.8 66.0Share of net expenditure measures (percent) 17.7 31.2 34.0
Source: National authorities and IMF staff estimates.
Cumulative Size of Fiscal Adjustment Plans: Packages of July, September and December 2011(Billions of euros, unless otherwise indicated)

2012 ARTICLE IV REPORT ITALY
22 INTERNATIONAL MONETARY FUND
AUT
BEL
FIN
FRA
ITA
NLD
ESP
0
100
200
300
400
500
600
700
0
100
200
300
400
500
600
700
15 25 35 45 55
Sove
reig
n bo
nd sp
read
vers
us B
unds
(bps
)
Gross financing need in 2012-13 (percent of GDP)
Government Gross Financing Needs in 2012-13 and Sovereign Bond Spreads
versus Bunds
by 2017. As highlighted in staff’s DSA, the large stock of debt and low growth leave the debt dynamics vulnerable to adverse shocks (see Annex I). For example, a combined shock of a 1 percentage point reduction in growth and a 100 bps increase in interest rates would push the debt ratio above 140 percent of GDP and keep it on a rising path.
37. The investor base for Italian government bonds is becoming increasingly domestic-focused. Nonresident investors continue to reduce their holdings of Italian sovereign bonds, with their share declining from 52 percent in 2010 to an estimated 36 percent in March, which has been offset by increased purchases by the ECB and Italian banks (see Box 5). Since November, Italian banks have emerged as a major investor in sovereign bonds, purchasing more than €80 billion, financed partly from support under the LTRO. The authorities have taken steps to broaden the investor base, including by selling €7.3 billion of inflation-linked bonds to domestic retail investors in February and €1.7 billion in June. Despite some shift to shorter-maturity bonds in recent months, the average maturity of public debt remains at 6.8 years. Given the size of public debt, however, the funding pressures will remain high with the amount needed to be rolled over annually at around €415 billion (25 percent of GDP) during 2012–13.
Policy Issues and Staff Views
38. The fiscal adjustment this year and next is appropriate, but more should be done over the medium-term to strengthen the fiscal outlook. The sizeable improvement in the structural primary balance in 2012–13 will weigh heavily on growth but is critical for fiscal sustainability. The increased focus on targeting a structural balance which adjusts for the economic cycle will allow fiscal policy to remain flexible in a more severe downturn. To safeguard the recovery, the government should identify and implement the needed expenditure cuts to avoid an increase in the VAT rates later this year.
39. Shifting further the composition of adjustment towards expenditure cuts and lower taxes would better distribute the burden of adjustment and support growth. Cutting government expenditure, such as the public sector wage bill or other items identified in the ongoing spending review; reducing Italy’s sizeable tax expenditures (estimated at around 8 percent of GDP); and stepping up efforts against tax evasion would create space for growth-supporting measures. 7 These measures could include: reducing the labor tax wedge to boost employment; raising the
7 Building on tax reform proposals to rationalize the various types of tax offenses, the authorities could consider criminalizing “self-laundering” (i.e. using the illegal proceeds from tax evasion) to strengthen tax compliance.

ITALY 2012 ARTICLE IV REPORT
INTERNATIONAL MONETARY FUND 23
0 50 100 150 200
All BIS
European
Non-European
France
Germany
Japan
Spain
Switzerland
United Kingdom
United States
2010 Q42011 Q4
Source: BIS
Foreign Banks' Exposure to Italy's Public Sector (Ultimate risk basis, billions of euros)
Box 5: Shifts in the Investor Base for Italian Government Bonds 1/
After a long period of stability, foreign holdings of Italian government bonds declined rapidly during the second half of 2011. The share of Italian government securities held by foreigners increased steadily from 30 percent at the onset of the European Monetary Union to over 51 percent in 2006 and remained stable until mid-2011. With the intensification of the euro area crisis, the share of foreign holdings fell sharply to an estimated 37 percent, after excluding securities purchased by the ECB through the Securities Market Program (SMP). 2/
Foreign banks and non-bank investors contributed to the decline. Foreign banks’ exposure to Italy’s public sector fell by about four percentage points from 12.4 percent in June 2011 to 8.4 percent by year-end. Other non-bank investors, primarily real money investors, account for the remaining drop, from 38.7 to about 30 percent of total government securities. Balance-of-payments figures for Q1 2012 signal that non-residents continued to reduce holdings of Italian medium- and long-term securities although for the first time in several months, net purchases at maturities shorter than one year were observed.
European Banking Authority (EBA) stress test data suggest that foreign selling has been led by European banks. A comparison of the latest EBA stress test with that in December 2010 reveals a €33 billion drop in the holdings of Italian public debt by foreign banks from €162billion in Q4 2010 to €129 billion in Q3 2011 mainly in positions in the trading book and in available for sale (AFS) in the banking book. French, German, and Dutch banks account for most of the decline.
Official funding made available through the SMP and Italian banks have filled in the void left by non-residents. The estimated share of Italian sovereign bonds held by the Eurosystem rose significantly, from 4.3 percent in June 2011 to an estimated (by staff) 10-12 percent in February. Preliminary data suggest that domestic banks also become more active, purchasing over €80 billion between November 2011 and April 2012, as LTRO-driven flows were invested in government bonds. The rising “home bias” in the sovereign debt market has helped stabilize the investor base in the short run, but may raise the risk of a tighter link between domestic banks and the sovereign. _________________________________ 1/ See Accompanying Selected Issues Paper titled, “Recent Developments in the Investor Base for Italian Government Bonds.” 2/ While the ECB does not disclose the country breakdown of the securities purchased through the SMP, a gross approximation may be obtained by dividing the change in the holdings of the Bank of Italy―which had been fairly stable before the extension of the SMP to Italy―by its share in the ECB’s capital (about 18 percent).
0
10
20
30
40
50
60
0
10
20
30
40
50
60
1999 2001 2003 2005 2007 2009 2011
Official SectorMonetary and Financial InstitutionsOther Domestic InvestorsRest of the World
Italy: Composition of General Government Securities by Holders (percent of total aggregate)
Sources: Bank of Italy; and IMF staff estimates.Note: Official Sector includes BoI and SMP Holdings

2012 ARTICLE IV REPORT ITALY
24 INTERNATIONAL MONETARY FUND
allowance for corporate equity to encourage investment; or financing a modest, well-targeted increase in public infrastructure investment. The growth impact would depend on the composition of rebalancing; for example, staff estimates that a 2 percent of GDP shift from social security contributions to the VAT could raise the level of GDP by at least 1 percent over the long term (Box 6).
40. Locking in prudent fiscal policies over the medium term would improve confidence and support growth. Looking beyond 2013, with the debt-to-GDP ratio projected to decline only gradually, the fiscal position will remain vulnerable to market distress or an economic slowdown. To create a buffer against such shocks, targeting a 1 percent of GDP structural surplus from 2014 onwards as the medium-term anchor for the fiscal rule would put the debt ratio on a more robust downward path, even under adverse conditions. This could be achieved by using the ongoing spending reviews to identify further cuts to less productive expenditure, with some of the savings used to reduce debt. To lock in the gains, the medium-term expenditure cuts could be legislated with next year’s budget, while the structural surplus target could be enshrined in supportive legislation of the fiscal rule. Comprehensive structural reforms that boost growth would also significantly improve the debt dynamics (see Annex I). The credibility gains from a faster pace of debt reduction could lower borrowing costs significantly, especially once market conditions stabilize.
Estimated Fiscal Impact over 5 years
Savings MeasuresPublic expenditure based savings 2/ 0.6 0.6 1.1 1.6Reduction in tax expenditures 3/ 2.0
Growth Supportive MeasuresAvoid increase in top VAT rate from 21 to 23.5 -0.6
Reducing the labor tax wedge to boost employment -1.5
Lower CIT (incl. cutting rates and raising allowance for corporate equity) -0.5
Well targeted increase in public investment -0.5
Net savings from rebalancing fiscal composition 0.0 0.0 0.0 0.5
1/ Against baseline, which already assumes some modest adjustment in 2016/17 to comply with the structural balance rule.
2/ Annualized savings from the Spending Review, plus potential reductions in public wage bill.
3/ OECD estimates tax expenditures at 8 percent of GDP.
Possible Options for Fiscal Rebalancing and Consolidation over 5 Years 1/(in percent of GDP)
Possible Packages
118
120
122
124
126
128
130
132
118
120
122
124
126
128
130
132
2011 2012 2013 2014 2015 2016 2017
Debt-to GDP in baseline and policy scenarios subject to interest rate shock 1/
Baseline
Policy Advice 2/
1/ Spreads are 180 bps higher than baseline or policy scenario from 2013 (1.5 standard deviations).2/ Targeting a structural fiscal surplus of 1 percent from 2014.

ITALY 2012 ARTICLE IV REPORT
INTERNATIONAL MONETARY FUND 25
Box 6. Would a Fiscal Devaluation Work in Italy? 1/
A “fiscal devaluation” (FD) is a revenue-neutral shift from employer’s social contributions toward value-added tax, meant to promote growth, employment, and exports. This shift should reduce tax distortions and enhance growth. It should also raise the demand for labor by reducing labor costs. In addition, the decline in the terms of trade should improve the trade balance.
Both simulation results and the limited empirical evidence suggest that the tax shift needs to be sizeable to have a marked effect. For example, a shift on the order of two percent of GDP from social security contributions (SSC) towards VAT would raise GDP and employment by 0.5–1.5 percent above baseline after ten years (the impact may be stronger if both labor and capital taxes are cut, see Box 3). The revenue shift could also increase net exports by at least 0.4 percent of GDP in the short-run (Table).
A FD may be particularly beneficial in Italy. The country presents four features that would greatly enhance FD effectiveness: (i) a high tax wedge; (ii) strong wage rigidities; (iii) a moderate competitiveness gap, and (iv) a fixed nominal exchange rate for much of its trade. Under these conditions, FD can speed up the wage and real exchange rate adjustments needed to restore competitiveness that otherwise may take a long time to come about.
Increasing VAT revenues should be achieved by reducing tax expenditures rather than raising the standard rate. The Italian VAT rate is already high by international standards, and further increase may exacerbate tax evasion and avoidance and reduce labor supply incentives. Raising 2 percent of GDP from broadening the base would result in increasing Italy’s VAT efficiency to the OECD average.
The savings could be used to lower taxes on labor. Targeting the SSC cut at lower wage levels would reduce the cost of the measure, while focusing the impact on those whose employment and participation are low and more sensitive to tax considerations would enhance its effectiveness. In Italy, the reduction in the SSC should primarily benefit low earners, women, and young workers. _____________________________ 1/ See accompanying Selected Issues Paper titled, “Fiscal Devaluation In Italy: Towards A More Export, Employment, and Growth Friendly Tax System.”
Country Source Method 2/ST 5/ LT 5/ ST 5/ LT 5/ ST 5/ LT 5/
EU15 EC 2006 M -0.1 to 0.5 0.4 to 0.7 0.1 to 0.7 0.5 to 0.9 -0.2 to 0 -0.1 to -0.2Germany EC 2008 M 0.1 to 0.2 0.2 0.1 to 0.3 0.2OECD Arnold 2008 E 0.7EU27 EC 2010 M 0.2 0Portugal EC 2011 M 0 to 0.2 0.3 to 0.7 0.2 to 0.3 0.4 to 0.7 0 to 0.2 0Portugal ECB 2011 M 0.1 to 0.5 0.2 to 0.3 0.2 to 0.9 0.2 to 0.4 0 to 0.2 0Portugal Franco 2011 E 4OECD De Mooj and Keen 2012 E 0.9 to 4 0Italy IMF 2012 M 0 to 0.2 0.5 0.1 to 0.2 0.21/ Across-the-board SSC cut.2/ M = Model-based simulations; E = Econometric results.3/ Effect on the level of GDP and employment relative to baseline (in percent).4/ Effect on the trade balance as a share of GDP relative to baseline (in percentage point).5/ ST = 1-3 years; LT = 10 years.
Table 1. Short and Long-Term Impacts of a Revenue Shift of 1 percent of GDP From SSC to VAT 1/
GDP 3/ Employment 3/ Trade balance 4/

2012 ARTICLE IV REPORT ITALY
26 INTERNATIONAL MONETARY FUND
41. The new constitutional fiscal rule will be an important tool for strengthening fiscal discipline and policymaking, if backed by sound institutions. The legislated fiscal council will be important in assessing fiscal developments and improving accountability, and should be set up fully independent in terms of staffing, funding, and work agenda. Adopting a binding multi-year expenditure framework and merging the various spending reviews and assigning them a central role in the budget process would also buttress the credibility of the fiscal rule.
42. Plans to address the stock of outstanding public payments should proceed expeditiously. Estimates of outstanding public payments, based largely on surveys, are around 5 percent of GDP and are likely concentrated at the subnational level.8 Completing quickly the stocktaking exercise to determine the size of pending and overdue payments at the central and sub-national levels, while enhancing public expenditure control and improving the reporting and timeliness of public payments, would support the private sector and strengthen fiscal discipline and accountability. The strategy to clear any overdue payments should be complemented by improved coordination among all levels of government and continued incentives for fiscal prudence also at the sub-national levels.
43. The debt management strategy should seek to maintain the current maturity structure of debt and diversify the investor base. The success of the recent placement of inflation-linked bonds with retail investors underscores the potential for new sources of demand. The authorities should also consider other channels such as syndications or private placements to ease pressures on primary dealers. Moving to provide collateral for sovereign swap transactions would further strengthen financial stability. Subsequent regular reporting of such transactions in government accounts would enhance transparency. The authorities should also assess the scope to mobilize public assets, including through privatization, to reduce rollover pressures and debt further.
Authorities’ Views 44. The authorities stressed the importance of defining targets in structural terms to protect the recovery. The government projects the overall deficit to decline further in 2012–13 but fall short of a balanced budget due to the weaker outlook. In structural terms, however, the budget is estimated to be in surplus by 0.6 percent of GDP in 2013 before gradually converging to overall balance by 2016. The authorities remain committed to maintaining a structural balance as the anchor under their fiscal rule. They also placed a high priority on enacting the needed spending cuts to avoid raising the VAT rate in October.
8 In general, outstanding public payments are included in the fiscal deficit in GFS/ESA95, as spending is recorded in accrual terms. These payments, however, are not included in the Maastricht general government debt figures, which exclude commercial debt. An estimate of the stock of outstanding payments is featured in the GFS balance sheet of the government under “Liabilities/other accounts payable.”

ITALY 2012 ARTICLE IV REPORT
INTERNATIONAL MONETARY FUND 27
45. Fiscal consolidation needs to be rebalanced to reduce taxes and unproductive spending. The authorities viewed the spending reviews as crucial for identifying savings to lower tax rates on labor and investment which they saw as too high. They are also considering ways to broaden the tax base by reducing tax expenditures as part of their overall reform of the tax system. They cautioned against expecting a large growth impact of further fiscal devaluation in light of Italy’s mixed experience with earlier fiscal devaluations and the deep rigidities in the economy. They also saw scope to mobilize public assets to generate revenue and reduce public debt. In June, the government announced plans to sell shares in three state-owned companies to Cassa Depositi e Prestiti for around €10 billion which would be used to reduce debt and accelerate delayed payments to suppliers. A real estate fund will also be created to manage public asset disposal at all levels of government.
46. Work is focused on institutions to support the newly adopted balanced budget fiscal rule. In particular, the authorities are considering the appropriate role of the fiscal council and ways to ensure its independence. On the medium-term anchor in the fiscal rule, they did not see a strong case for targeting a 1 percent of GDP structural surplus compared to the current structural balance. They viewed their plans as sufficiently ambitious, with the debt ratio declining to 114½ percent of GDP by 2015 and remaining robust to various shocks. Moreover, the structural overall balance through 2015 would exceed the medium-term objectives and debt reduction target under the Fiscal Compact. Although the constitutional amendment did not rule out a higher medium-term target, they saw risks in changing the rule now and confusing the public about their fiscal plans.
47. Addressing the stock of outstanding public payments to support local economies is a high priority. Delayed public payments are not a new phenomenon in Italy, but are receiving greater attention due to the economic difficulties of local suppliers. In response, the authorities have embarked on a stocktaking exercise to assess the size of the outstanding payments and standardize the certification of claims. They have also announced a strategy to allow firms to net off commercial credits against unpaid taxes or obtain credit based on certified claims from financial institutions that would be guaranteed by a state-backed fund.
48. Public debt management will remain challenging given volatile market conditions. The government successfully overcame the February-April “financing wall” after which sovereign funding needs have eased sharply. Nevertheless, the annual financing need remains sizeable, with the markets still focused on contagion risks from the rest of Europe in pushing up Italian yields. The authorities agreed that a wider range of instruments would help diversify the investor base and were planning another issuance of inflation-linked bonds to retail investors. The Treasury is also considering the scope for providing collateral in swap transactions to enhance financial stability.
C. Building a More Dynamic and Resilient Financial System
49. The LTRO has helped Italian banks meet their funding needs for the year. Italian banks borrowed net €140 billion from the two LTROs, more than sufficient to cover the €115 billion in

2012 ARTICLE IV REPORT ITALY
28 INTERNATIONAL MONETARY FUND
maturing medium-and long-term retail and wholesale debt for the 32 largest banking groups in 2012.9 Italian banks’ use of Eurosystem refinancing stabilized at around €273 billion in May (25 percent of total ECB financing), while available collateral net of haircuts was around €200 billion. Total bank deposits have remained stable, increasing by 0.4 percent from December 2011 to April 2012 (Figure 3). Non-resident deposits continued to decline (-20 percent (y/y) in April) which has been offset by an increase in resident deposits (2 percent, y/y). Looking ahead, Italian banks will need to roll over an estimated €140 billion in maturing debt in 2013, and without an improvement in wholesale funding markets, will likely continue relying on ECB liquidity support to meet their refinancing needs.
50. Banks have strengthened their capital positions, but progress varies across institutions. To meet the capital ratio targets under the EBA, four of the five large banks need to raise €15½ billion by end-June, of which the largest, UniCredit, secured €7.5 billion in common equity last January. The other three banks plan to meet their capital targets through various means, including by converting hybrid instruments into core capital, adjusting risk models, and buying back long-term debt securities at a discount. The average core tier 1 ratio for the five largest banks (covering 68 percent of the banking system total consolidated assets) was 9½ percent at end-March, compared to an average 10.3 percent for the euro area. For the other 9 listed banking groups, accounting for another 12 percent of the system, the average core tier 1 was lower at 8.4 percent, with only a couple of banks below 7 percent. For the remaining banking groups, the average core tier 1 ratio was around 12.2 percent at end-2011.
51. The large stock of impaired loans and growing exposure to the sovereign have left banks vulnerable to the economic downturn and market stress. Gross impaired loans (including bad, substandard, restructured, and past-due loans) have risen to 11 percent in 2011, from less than 6 percent before the crisis. Higher impaired loans, combined
9 This includes borrowing against collateral of about €80 billion government-guaranteed bonds issued by banks to themselves. In early December, the authorities introduced a scheme for bank debt consistent with an EU initiative to bolster term funding which allowed banks to issue securities to themselves, obtain a government guarantee, and then discount the securities at the ECB for liquidity.
0
2
4
6
8
10
12
14
16
0
2
4
6
8
10
12
14
16
2008Q4 2009Q4 2010Q4 2011Q4
Overdue/overdrawnRestructuredSubstandard (incagli)Bad debts (sofferenze)
Italy - Gross Impaired Loans(Percent of Loans)
Source: Bank of Italy, Statistical Bulletin, Table D.3.5.11.
Sources: Company accounts ; and IMF staff calculations.
0
2
4
6
8
10
12
14
0
2
4
6
8
10
12
14
Euro area large banks
Italy's five largest banks
Italy's medium-sized banks
Average
Min
Max
Core Tier 1, End March 2012(Percent)

ITALY 2012 ARTICLE IV REPORT
INTERNATIONAL MONETARY FUND 29
Figure 3. Italy: Banking Sector Indicators
Sources: Bloomberg; Bank of Italy; and IMF staff calculations.1/ Simple average of Unicredit's and Intesa's equity prices.2/ Simple average of Unicredit's and Intesa's senior CDS spreads.3/ Adjusted for securitization.
0
5
10
15
20
25
0
5
10
15
20
25
Jan-12 Jun-12 Nov-12 Apr-13 Sep-13
Medium and Long Debt Amortization of the Twelve Largest Banks
(Billions of euros)
100
200
300
400
500
600
700
800
100
200
300
400
500
600
700
800
Jan-11 Apr-11 Jul-11 Oct-11 Jan-12 Apr-12
Bank 5-years CDS Spreads(Basis points)
iTraxx Europe Senior Financial Index
Italian banks 2/
0
5
10
15
20
25
30
0
50
100
150
200
250
300
Jan-07 Apr-08 Jul-09 Oct-10 Jan-12
Italian Banks' Refinancing Operations with the Eurosystem
Stock (billions of euros)
Ratio of total ECB financing (percent, rhs)
-4
-2
0
2
4
6
8
10
12
14
16
-4
-2
0
2
4
6
8
10
12
14
16
Jul-06 Jun-07 May-08 Apr-09 Mar-10 Feb-11 Jan-12
12- Month Credit Growth 3/ (Percent )
Non-financial firmsHouseholdsPrivate sector
Bank high frequency indicators continue to deteriorate.
Bank financing needs are large...
Despite the decline in non-resident deposits, resident deposits continued to expand
... and have been met largely through ECB support.
Credit growth has declined sharply.
20
30
40
50
60
70
80
90
100
110
20
30
40
50
60
70
80
90
100
110
Jan-10 Jul-10 Jan-11 Jul-11 Jan-12
Bank Equity Prices 1/(Jan 1, 2010=100)
Italy 1/MSCI Europe Banks
600
800
1000
1200
1400
1600
1800
2000
2200
600
800
1000
1200
1400
1600
1800
2000
2200
Jan-11 Apr-11 Jul-11 Oct-11 Jan-12 Apr-12
Deposits (Billions of euros)
Resident private Non resident

2012 ARTICLE IV REPORT ITALY
30 INTERNATIONAL MONETARY FUND
with a decline in provisioning rates below the pre-crisis levels, imply increased vulnerability to the contracting economy, especially the weaker SME and construction sectors. Banks in February agreed to reintroduce a moratorium on SME loan repayments, but this may mask credit risks and delay needed restructuring. At the same time, banks’ holding of government bonds has increased to over 7 percent of assets, compared to the 4 percent average for other euro area banking systems, raising their exposure to sovereign risk.
52. Insurance companies have also been affected by the weak market conditions. Life and non-life insurers hold about €200 billion of Italian government debt, and have close cross-shareholding ties with the banks. In 2011, they experienced a 12½ percent decline in premiums, and an increase in surrenders. Recent legislation allowing insurers to forgo booking unrealized losses on securities held as long-term investments (where they have non-distributable reserves) have shielded insurers from price fluctuations, but market sentiment towards the sector remains weak, as indicated by the 28 percent decline in share prices for the year through May.
53. The corporate sector is also vulnerable to banking distress. While corporate debt as a share of GDP is not particularly large compared to the European average, corporate leverage—measured by the debt to equity ratio—is high and has risen steadily since the onset of the crisis. Italian firms also have a large share of short-term debt (about 40 percent is of maturity less than one year) and are heavily reliant on bank funding, leaving them vulnerable to interest and liquidity risk. Firm profitability remains stagnant, and bankruptcies have grown steadily since end 2007.
Policy Issues and Staff Views
54. Banks need to maintain adequate capital and liquidity buffers to remain resilient to the downturn. The Bank of Italy (BoI) should continue to encourage large banks under the EBA to meet their capital needs by raising equity, converting hybrid instruments into core capital, or disposing of noncore assets, rather than cutting loans. To further enhance transparency, the BoI
100
140
180
220
260
300
1000
1500
2000
2500
3000
3500
4000
2008 2009 2010 2011 2012
Bankruptcies Pre-liquidation procedures (rhs)
Italy: New Pre-liquidations andBankruptcies (Number, seasonally adjusted)
60
80
100
120
140
60
80
100
120
140
2005 2006 2008 2009 2011
Italy
Euro area
Non-financial Corporate Debt to Equity (Percent)
Source: Cerved. Source: Haver.

ITALY 2012 ARTICLE IV REPORT
INTERNATIONAL MONETARY FUND 31
should consider extending its stress tests to a larger set of institutions, including mid-sized banks, and publish the results in its regular Financial Stability Reports. This would help market participants assess banks’ capacity to withstand a slowdown and funding distress and anchor market discipline.10 Encouraging banks to improve their capacity to post eligible collateral at the BoI would facilitate access to Eurosystem liquidity facilities.
55. Reducing impaired loans would free up resources for new lending. Banks’ buildup of impaired loans reflects both an inefficient legal process that delays loan write-offs and the flow of new bad loans arising from the slowdown. The growing stock and slow pace of disposal have constrained core profitability and tied up funding and capital. Supervisors should encourage banks to develop strategies for selling, restructuring or writing down impaired loans to free up resources for lending. The development of a market for restructuring distressed assets could be facilitated by ensuring adequate bank provisioning and aligning more closely tax deductibility of loan loss provisioning and write-offs.11 Streamlining bankruptcy procedures—which on average take more than 8 years—and promoting more out-of-court workouts would provide stronger tools to address impaired loans. Supervisors should also encourage banks to provision appropriately against loans benefiting from the moratorium agreement on SMEs and take early action toward problem borrowers.
56. The crisis management framework should continue to evolve to address systemic risks. The plan to broaden the resolution tool kit under the forthcoming EU Directive, including the introduction of an ex-ante deposit insurance fund, is welcome. Looking ahead, broader backup funding via pan-European mechanisms, including direct capital injections from EU institutions, could make the resolution framework more robust.
Authorities’ Views 57. Italian banks continue to benefit from their large and stable retail funding base, low leverage, and traditional lending model which has limited exposures to risky assets. The resilience of the system has also been supported by firm supervision and regulation. As a result, Italian banks emerged relatively unscathed from the global financial crisis and have strengthened their capital base without large-scale equity support from the government.
58. Maintaining adequate capital and liquidity buffers remains essential. Supervisors saw the large five Italian banks on track to meet their EBA capital requirements without resorting to
10 Using publicly available data, a scenario analysis by the staff that assumes a doubling in default rates on outstanding loans in 2012–13 compared to staff’s baseline projections and an average increase in the coverage ratio by 1 percentage point compared to 2011 would lower the average core tier 1 ratio for the 10 largest banking groups to 7.1 percent from 8.7 percent at end-March 2012. Five banks would have a ratio below 7 percent, with one below 6 percent. Given data limitations, a similar scaling up exercise for the smaller banks was not possible. 11 Banks are limited to deducting loan loss provisions equivalent to 0.3–0.5 percent of their total loan portfolios, with any excess carried over 9–18 years. This is likely to be a binding constraint as banks’ loan loss provision has averaged around 0.8 percent of total loans and would rise during a recession.

2012 ARTICLE IV REPORT ITALY
32 INTERNATIONAL MONETARY FUND
excessive deleveraging. On liquidity, Italian banks still possess ample collateral to receive Eurosystem financing should funding pressures re-emerge. Earlier delays in pledging collateral at the Bank of Italy have been addressed and banks now need to strengthen their capacity to evaluate their collateral. On extending stress tests to smaller banks, supervisors emphasized that they are already undertaking several exercises to assess the soundness of the banking sector, and that the results are published in the Bank of Italy’s Annual Report. They also stressed the need to coordinate stress tests at the European level, starting with the EBA’s own exercise.
59. The authorities cautioned against comparing impaired loan ratios in Italy with other countries in Europe. They pointed out that the definition and coverage of NPLs varies widely across the region and that disclosure in Italy, in some respects, is more stringent and transparent. The more relevant figure is the flow of new impaired loans which in Italy has risen but remains within historical averages. Moreover, although provisioning rates have declined from pre-crisis levels, these figures do not include coverage from real estate and other guarantee collateral which provides an important additional buffer for banks. The authorities considered the stock of “legacy” NPLs a structural feature of the system, reflecting a slow and inefficient legal system that hinders disposals of bad loans. The supervisory authorities recognized that the tax treatment for loan loss provisions may serve as a disincentive for more aggressive write-downs, but not for provisions, which they regulate closely. The tax authorities saw scope to clarify the rules on loan write-offs but pointed to the continued benefit in smoothing the volatility of tax revenues.
60. A market for distressed assets could support corporate restructuring but the timing is important. They noted that a market for distressed assets had developed in the late 1990s as Italy emerged from its deep recession and that more recently, a few banks had sold bad loans. However, the amounts were very small and banks generally remain reluctant to sell due to the wide pricing gap with their perceived recovery value. The authorities cautioned against pushing banks to sell bad loans aggressively in a “fire sale” that would drive down asset prices and generate further losses. Instead, they put the focus on improving the efficiency of the judicial system to allow banks to more proactively restructure and assist their borrowers.
61. The authorities have taken steps to strengthen supervision of insurers. Modifications to the accounting treatment of government bonds were introduced to avoid excessive volatility in balance sheets and contain pro-cyclicality, while at the same time safeguarding stability. They also emphasized that the various agencies cooperate closely in supervising financial conglomerates that are active both in the insurance and banking sectors.
62. Supervisors continue to use preemptively crisis management procedures. Since 2009, 35 financial institutions have been placed under special administration procedures, up from 9 in the previous three-year period. Two-thirds of the cases returned to normal operations, including after merging. Pan-European financial support for public capital or deposit insurance could strengthen the resolution framework but its credibility would depend on the size of resources available.

ITALY 2012 ARTICLE IV REPORT
INTERNATIONAL MONETARY FUND 33
STAFF APPRAISAL 63. Italy’s economy is expected to contract this year owing to tight financial conditions, the global slowdown, and the needed fiscal consolidation. Absent shocks, the recovery will take hold in early 2013, led by a modest pickup in exports, but will lag the rest of the region. The risks to the outlook are on the downside, stemming mainly from an intensification of the euro area crisis.
64. Progress at the European level in strengthening the currency union will be crucial for securing stability. Despite the strong consolidation underway, Italy with its high level of public debt remains vulnerable to contagion from the euro area crisis. A more integrated currency union with greater fiscal and financial discipline and risk sharing, combined with further ECB support as needed, would help secure stability and support Italy’s adjustment efforts.
65. At the same time, maintaining the momentum for reform in Italy will be important to address underlying structural weaknesses and revive growth. The difficult business environment, fragmented labor market, and limited competition in services have contributed to the poor growth performance and loss in competiveness. In the absence of comprehensive reforms, potential growth over the medium term would remain low. To revive growth, the priority should be on comprehensive structural reforms to boost productivity and labor participation, a supportive fiscal strategy that is both growth-friendly and sustainable, and steps to promote a more dynamic and resilient banking system.
66. The gains to growth from deeper structural reforms could be substantial. The government has embarked on important reforms to deregulate the service sector and make the labor market more inclusive and flexible. Accelerating these reforms, and locking in the necessary legislative and administrative changes, would strengthen confidence and create momentum for further reforms.
67. Labor reforms should aim to bridge the gap between permanent and temporary workers, reduce the tax wedge, and decentralize wage setting. The labor market reform bill should be passed quickly to reduce uncertainty and encourage new hires. Allowing for a more flexible open-ended contract that gradually increases employment protection with tenure could lower the cost of new hires, especially for young workers. Reducing the marginal tax rates for married second-earners would help raise female labor participation, while greater use of firm-level contracts would better match wages to flexibility.
68. Product market reforms with the broadest impact on growth should be accelerated. Completing the planned ownership separation in the gas sector this year would improve competition, while accelerating the opening of professional orders will lower rents. A greater push for privatization would improve the quality of public services and reduce costs. Increasing the efficiency of the judicial system would also have wide-ranging benefits for lowering business costs and strengthening other reforms.

2012 ARTICLE IV REPORT ITALY
34 INTERNATIONAL MONETARY FUND
69. The fiscal adjustment this year and next is appropriate but its composition could be made more growth-friendly. The sizeable adjustment in 2012–13 is critical for fiscal sustainability, and the increased focus on targeting a structural balance will ensure flexibility in fiscal policy. Shifting further the composition of adjustment towards lower taxes supported by expenditure cuts would better distribute the burden of adjustment and help growth.
70. Locking in prudent medium-term fiscal policies would further improve confidence. The new constitutional fiscal rule will be an important tool for strengthening fiscal discipline and policymaking. To create a buffer against future shocks, targeting a 1 percent of GDP structural surplus from 2014 onwards as the medium-term anchor for the fiscal rule would put the debt ratio on a more robust downward path. This could be achieved through further cuts to less productive expenditure. The June 2012 plan to dispose of state assets to reduce debt is a positive first step and should be followed by a more comprehensive program for privatization. The progress made in pension reform will be important for securing long-term sustainability.
71. Banks need to maintain adequate capital and liquidity buffers to remain resilient to the downturn. The BoI should continue encouraging large banks to meet their capital needs by raising equity or disposing of noncore assets, rather than cutting loans. Improving banks’ capacity to post eligible collateral at the BoI would facilitate access to Eurosystem facilities. The BoI should extend stress tests to a larger set of institutions and publish the results regularly to further enhance transparency and discipline.
72. Reducing impaired loans would free up resources for new lending. Ensuring adequate bank provisioning and aligning more closely tax deductibility of loan loss provisioning and write-offs could facilitate the development of a market for restructuring distressed assets. Improving the efficiency of bankruptcy proceedings and out-of-court workouts would help banks more effectively address impaired loans.
73. It is recommended that the next Article IV Consultation take place on the standard 12-month cycle.

ITALY 2012 ARTICLE IV REPORT
INTERNATIONAL MONETARY FUND 35
6/ / 0 0:33Est.
2008 2009 2010 2011 2012 2013 2014 2015 2016 2017
Real GDP -1.2 -5.5 1.8 0.4 -1.9 -0.3 0.5 1.0 1.2 1.2Real domestic demand Public consumption 0.6 0.8 -0.6 -0.9 -0.9 -1.5 -0.9 0.1 0.9 0.9 Private consumption -0.8 -1.6 1.2 0.2 -2.6 -1.1 0.5 0.8 0.9 1.0 Gross fixed capital formation -3.7 -11.7 2.1 -1.9 -6.5 1.5 0.3 1.6 1.4 1.4 Final domestic demand -1.2 -3.2 1.0 -0.4 -3.0 -0.7 0.2 0.8 1.0 1.0 Stock building 2/ 0.0 -0.8 0.8 -0.6 -0.5 0.2 0.0 0.0 0.0 0.0
Net exports 2/ 0.0 -1.2 -0.4 1.4 1.9 0.2 0.3 0.2 0.2 0.2 Exports of goods and services -2.8 -17.5 11.6 5.6 0.6 1.9 2.5 3.3 4.1 4.1 Imports of goods and services -3.0 -13.4 12.7 0.4 -6.3 1.2 1.5 2.9 3.8 3.8
Money and credit (end of period, percent change) Private sector credit 3/ 7.1 -0.5 3.6 2.3 ... ... ... ... ... ... National contribution to euro area M3 4/ 6.9 5.5 2.4 -4.4 ... ... ... ... ... ...
Interest rates (percent, end of period) 6-month interbank rate 3.7 1.0 2.3 2.3 ... ... ... ... ... ... Government bond rate, 10-year 4.5 4.1 4.8 5.0 ... ... ... ... ... ...
Resource utilization Potential GDP 0.5 0.0 0.1 -0.1 -0.3 0.0 0.1 0.2 0.3 0.4 Output gap (percent of potential) 1.0 -4.5 -2.9 -2.3 -3.9 -4.1 -3.7 -2.9 -2.0 -1.2 Employment 0.8 -1.6 -0.6 0.4 -1.0 -0.3 0.3 0.9 2.2 1.5 Unemployment rate (percent) 6.8 7.8 8.4 8.4 10.3 11.1 11.3 11.0 9.6 8.8
Prices GDP deflator 2.5 2.1 0.4 1.3 1.3 1.6 1.3 1.3 1.4 1.5 Consumer prices 3.5 0.8 1.6 2.9 3.0 2.1 1.0 1.2 1.3 1.4 Hourly compensation 5/ 5.0 1.9 3.2 3.2 1.5 1.1 0.9 1.1 1.2 1.3 Productivity 5/ -2.0 -6.7 7.3 1.0 -0.2 0.3 0.5 0.8 0.8 0.8 Unit labor costs 5/ 7.0 8.6 -4.1 2.2 1.7 0.8 0.4 0.2 0.4 0.5
Fiscal indicators General government net lending/borrowing 6/ -2.7 -5.4 -4.5 -3.9 -2.6 -1.5 -1.4 -1.3 -1.0 -0.6 General government primary balance 6/ 7/ 2.5 -0.8 0.0 1.0 3.0 4.2 4.5 4.7 5.2 5.6 Structural overall balance (percent of potential GDP) -3.5 -3.6 -3.3 -3.4 -0.7 0.5 0.4 0.2 0.0 0.0 Structural primary balance (percent of potential GDP) 7/ 1.7 0.8 1.2 1.4 4.7 6.0 6.0 6.0 6.1 6.2 General government gross debt 6/ 105.8 116.1 118.7 120.1 125.8 126.4 125.6 124.1 122.0 119.4
Exchange rate regime
Exchange rate (national currency per U.S. dollar) 0.7 0.7 0.8 0.7 … … … … … … Nominal effective rate: CPI based (2000=100) 103.7 104.6 101.3 101.6 … … … … … … Real effective exchange rate based on CPI (2000=100) 102.0 103.3 99.4 99.4 … … … … … … Normalized ULC (2000=100) 111.6 111.6 107.9 107.6 … … … … … …
External sector 6/ Current account balance -2.9 -2.1 -3.6 -3.1 -2.2 -2.0 -1.9 -1.8 -1.7 -1.5 Trade balance -0.1 0.1 -1.3 -1.1 -0.2 -0.1 0.1 0.2 0.3 0.5
Sources: National Authorities; and IMF staff calculations.
2/ Contribution to growth.3/ Twelve-month credit growth, adjusted for securitizations and excluding operations with central counterparties. 4/ Excludes currency in circulation held by nonbank private sector. 5/ In industry (including construction).6/ Percent of GDP.7/ Excludes interest expenditure.
April 2012 Documento di Economia e Finanza.
Table 1. Italy: Summary of Economic Indicators, 2008―17 1/(Annual percentage change, unless noted otherwise)
Projections
Member of EMU
1/ Staff estimates and projections, unless otherwise noted, based on fiscal consolidation measures included in the government's

2008 2016 2017
Prel. Proj. Proj. Auth. Proj. Auth. Proj. Auth. Proj. Auth. Proj. Proj.
Total revenues 46.5 47.1 46.6 46.6 48.9 49.2 49.6 49.5 49.7 49.4 49.8 49.1 49.8 49.9Current revenues 46.2 46.1 46.1 45.9 48.2 48.8 48.8 49.2 49.0 49.1 49.0 48.7 49.1 49.2
Tax revenues 28.9 29.1 28.8 28.8 30.6 31.2 31.1 31.6 31.3 31.6 31.3 31.2 31.4 31.5Direct taxes 15.2 14.7 14.6 14.3 14.6 15.5 14.5 15.3 14.5 15.3 14.6 15.1 14.7 14.8Indirect taxes 13.7 13.6 14.0 14.1 15.9 15.6 16.6 16.3 16.7 16.2 16.7 16.1 16.7 16.7
Social security contributions 13.7 14.0 13.7 13.7 13.8 13.8 13.8 13.7 13.8 13.7 13.8 13.7 13.8 13.8Other current revenues 3.6 3.8 3.8 3.9 3.9 3.8 3.9 3.9 3.9 3.9 3.9 3.8 3.9 3.9
Capital revenues 0.3 1.0 0.5 0.7 0.7 0.4 0.7 0.3 0.7 0.3 0.7 0.3 0.7 0.7
Total expenditures 49.2 52.5 51.2 50.5 51.5 50.9 51.1 50.0 51.1 49.6 51.0 49.1 50.8 50.5Current expenditures 45.4 48.1 47.7 47.5 48.7 47.9 48.4 47.1 48.4 46.7 48.3 46.4 48.1 47.8
Wages and salaries 10.8 11.3 11.1 10.8 10.8 10.6 10.6 10.3 10.4 10.0 10.2 9.8 10.2 10.2Goods and services 8.1 8.8 8.8 8.6 8.7 8.6 8.5 8.3 8.3 8.1 8.3 8.0 8.3 8.3Social transfers 17.6 19.2 19.2 19.3 19.9 19.6 20.0 19.5 20.2 19.5 20.2 19.4 20.1 19.9Other 3.8 4.2 4.1 3.9 3.8 3.8 3.7 3.6 3.6 3.5 3.6 3.4 3.2 3.0Interest payments 5.2 4.7 4.6 4.9 5.6 5.3 5.7 5.4 5.9 5.6 6.0 5.8 6.2 6.3
Capital expenditures 3.8 4.4 3.5 3.0 2.8 3.0 2.7 3.0 2.7 2.8 2.7 2.8 2.7 2.7
Overall balance -2.7 -5.4 -4.6 -3.9 -2.6 -1.7 -1.5 -0.5 -1.4 -0.1 -1.3 0.0 -1.0 -0.6
Memorandum items:Primary balance 2.5 -0.8 0.0 1.0 3.0 3.6 4.2 4.9 4.5 5.5 4.7 5.7 5.2 5.6One-off measures (negative=balance-improving) -0.2 -0.7 -0.2 -0.7 -0.2 -0.2 -0.1 -0.1 -0.2 -0.2 -0.1 -0.1 -0.1 -0.1Structural overall balance 1/ -3.5 -3.6 -3.3 -3.4 -0.7 -0.4 0.5 0.6 0.4 0.6 0.2 0.4 0.0 0.0
Change in structural overal balance 1/ -0.3 -0.2 0.4 -0.1 2.7 ... 1.2 ... -0.2 ... -0.2 ... -0.2 0.0Structural primary balance 1/ 1.7 0.8 1.2 1.4 4.7 4.9 6.0 6.1 6.0 6.2 6.0 6.1 6.1 6.2Primary current expenditure real growth rate 2/ 0.8 3.4 -0.2 -2.5 -2.3 -2.3 -1.9 -2.0 0.2 -0.5 0.6 0.1 0.1 0.3Real GDP growth rate 2/ -1.2 -5.5 1.8 0.4 -1.9 -1.2 -0.3 0.5 0.5 1.0 1.0 1.2 1.2 1.2Output gap 1/ 1.0 -4.5 -2.9 -2.3 -3.9 -3.0 -4.1 -2.6 -3.7 -1.8 -2.9 -1.0 -2.0 -1.2
Public debt 105.8 116.1 118.7 120.1 125.8 123.4 126.4 121.6 125.6 118.3 124.1 114.4 122.0 119.4
Sources: ISTAT; Ministry of Economy and Finance; and IMF staff estimates.1/ Percent of potential GDP.2/ Percent.Auth. = Documento di Economia e Finanza 2012 (April 2012 update of the macro-fiscal framework document).
Table 2. Italy: General Government Accounts (National Presentation), 2008–17(Percent of GDP, unless otherwise indicated)
2013 201420112010 20122009 2015
2012 ARTICLE IV REPORT
ITALY
36 IN
TERNATIO
NAL M
ON
ETARY FUN
D

ITALY 2012 ARTICLE IV REPORT
INTERNATIONAL MONETARY FUND 37
2008 2009 2010 2011 2012 2013 2014 2015 2016 2017Prel.
711.3 711.2Revenue 723.6 707.0 714.6 727.0 758.1 778.6 795.4 814.7 837.5 861.6
Taxes 456.0 441.5 447.6 455.3 479.9 494.7 505.9 518.9 534.0 549.9Social contributions 215.8 212.6 213.4 216.3 216.5 219.7 224.0 228.9 234.6 240.7Grants 2.9 3.0 3.0 3.0 3.0 3.0 3.0 3.0 3.0 3.0Other revenue 48.8 49.5 50.6 52.4 58.6 61.2 62.5 63.9 65.9 68.0
Expenditure 765.7 788.6 784.3 789.4 798.8 802.3 817.9 835.7 854.1 872.4Expense 759.3 780.0 783.1 788.4 800.6 803.3 818.2 835.2 852.6 870.0
Compensation of employees 169.7 171.1 172.1 170.1 169.1 168.2 168.0 168.9 173.7 178.5Use of goods and services 84.8 89.4 90.2 89.2 88.1 85.5 84.6 86.4 89.1 91.8Consumption of fixed capital 29.0 29.9 31.2 31.2 31.1 31.1 31.1 31.1 31.2 31.2Interest 80.7 69.7 69.3 78.0 87.6 90.1 95.0 98.7 105.3 109.2Social benefits 320.0 336.5 344.4 352.1 359.7 365.9 376.7 386.7 393.5 401.6Other expense 75.2 83.5 76.0 67.9 65.0 62.4 62.7 63.4 59.8 57.7
Net acquisition of nonfinancial assets 6.3 8.6 1.2 0.9 -1.7 -0.9 -0.3 0.4 1.5 2.3
Gross / Net Operating Balance 1/ -35.8 -73.0 -68.5 -61.4 -42.5 -24.7 -22.8 -20.5 -15.1 -8.4Net lending/borrowing -42.1 -81.6 -69.7 -62.4 -40.8 -23.8 -22.6 -21.0 -16.6 -10.7
Net acquisition of financial assets 16.8 21.6 19.2 … … … … … … …Net incurrence of liabilities 57.9 98.3 85.6 … … … … … … …
Revenue 45.9 46.5 46.0 46.0 48.3 49.0 49.2 49.2 49.3 49.4Taxes 28.9 29.1 28.8 28.8 30.6 31.1 31.3 31.3 31.4 31.5Social contributions 13.7 14.0 13.7 13.7 13.8 13.8 13.8 13.8 13.8 13.8Grants 0.2 0.2 0.2 0.2 0.2 0.2 0.2 0.2 0.2 0.2Other revenue 3.1 3.3 3.3 3.3 3.7 3.9 3.9 3.9 3.9 3.9
Expenditure 48.6 51.9 50.5 50.0 50.9 50.5 50.6 50.5 50.3 50.0Expense 48.2 51.3 50.4 49.9 51.0 50.5 50.6 50.5 50.2 49.9
Compensation of employees 10.8 11.3 11.1 10.8 10.8 10.6 10.4 10.2 10.2 10.2Use of goods and services 5.4 5.9 5.8 5.6 5.6 5.4 5.2 5.2 5.2 5.3Consumption of fixed capital 1.8 2.0 2.0 2.0 2.0 2.0 1.9 1.9 1.8 1.8Interest 5.1 4.6 4.5 4.9 5.6 5.7 5.9 6.0 6.2 6.3Social benefits 20.3 22.1 22.2 22.3 22.9 23.0 23.3 23.4 23.2 23.0Other expense 4.8 5.5 4.9 4.3 4.1 3.9 3.9 3.8 3.5 3.3
Net acquisition of nonfinancial assets 0.4 0.6 0.1 0.1 -0.1 -0.1 0.0 0.0 0.1 0.1
Gross / Net Operating Balance 1/ -2.3 -4.8 -4.4 -3.9 -2.7 -1.6 -1.4 -1.2 -0.9 -0.5Net lending/borrowing -2.7 -5.4 -4.5 -3.9 -2.6 -1.5 -1.4 -1.3 -1.0 -0.6
Net acquisition of financial assets 1.1 1.4 1.2 … … … … … … …Net incurrence of liabilities 3.7 6.5 5.5 … … … … … … …
Memorandum items:Primary balance 2/ 2.5 -0.8 0.0 1.0 3.0 4.2 4.5 4.7 5.2 5.6Structural balance 3/ -3.5 -3.6 -3.3 -3.4 -0.7 0.5 0.4 0.2 0.0 0.0Change in structural balance 3/ -0.3 -0.2 0.4 -0.1 2.7 1.2 -0.2 -0.2 -0.2 0.0Structural primary balance 3/ 1.7 0.8 1.2 1.4 4.7 6.0 6.0 6.0 6.1 6.2General government gross debt 105.8 116.1 118.7 120.1 125.8 126.4 125.6 124.1 122.0 119.4
Sources: ISTAT; IMF GFS; and IMF staff estimates.1/ Revenue minus expense.2/ Revenue minus primary expenditure.3/ Percent of potential GDP.
(Billions of euros)
(Percent of GDP, unless otherwise indicated)
Table 2.1. Italy: Statement of Operations–General Government (GFSM 2001 format), 2008–17
Projections

2012 ARTICLE IV REPORT ITALY
38 INTERNATIONAL MONETARY FUND
2005 2006 2007 2008 2009 2010 2011Prelim.
Net worth … … … … … … …Nonfinancial assets … … … … … … …
Net financial worth -1341 -1348 -1346 -1409 -1528 -1541 -1482Financial assets 375 397 397 397 412 422 410
Currency and deposits 58 69 58 68 81 92 73Securities other than shares 9 11 14 16 18 21 23Loans 59 49 51 54 55 58 67Shares and other equity 137 146 145 129 130 123 119Insurance technical reserves 2 2 2 2 2 1 2Financial derivatives 0 0 0 0 0 0 0
Other accounts receivable 109 119 127 130 126 126 126
Financial liabilities 1716 1745 1743 1807 1940 1963 1892Currency and deposits 220 223 212 211 221 221 214Securities other than shares 1327 1328 1333 1404 1526 1543 1467Loans 118 141 140 136 136 137 141Shares and other equity 0 0 0 0 0 0 0Insurance technical reserves 0 0 0 0 0 0 0Financial derivatives 1 1 1 1 1 1 1Other accounts receivable 50 53 57 55 57 62 69
Net worth … … … … … …Nonfinancial assets … … … … … …
Net financial worth -93.4 -90.3 -86.6 -89.5 -100.6 -99.2 -93.8Financial assets 26.1 26.6 25.5 25.2 27.1 27.2 25.9
Currency and deposits 4.0 4.6 3.8 4.3 5.3 5.9 4.6Securities other than shares 0.7 0.7 0.9 1.0 1.2 1.4 1.5Loans 4.1 3.3 3.3 3.4 3.6 3.8 4.2Shares and other equity 9.5 9.8 9.3 8.2 8.6 7.9 7.5Insurance technical reserves 0.1 0.1 0.1 0.1 0.1 0.1 0.1Financial derivatives 0.0 0.0 0.0 0.0 0.0 0.0 0.0
Other accounts receivable 7.6 8.0 8.2 8.2 8.3 8.1 8.0
Financial liabilities 119.4 116.9 112.1 114.7 127.7 126.4 119.7Currency and deposits 15.3 14.9 13.6 13.4 14.5 14.2 13.6Securities other than shares 92.4 88.9 85.8 89.1 100.4 99.3 92.9Loans 8.2 9.4 9.0 8.6 8.9 8.8 8.9Shares and other equity 0.0 0.0 0.0 0.0 0.0 0.0 0.0Insurance technical reserves 0.0 0.0 0.0 0.0 0.0 0.0 0.0Financial derivatives 0.0 0.0 0.0 0.0 0.0 0.0 0.0Other accounts payable 3.5 3.5 3.7 3.5 3.7 4.0 4.3
Sources: IMF GFS; and Eurostat.
Table 2.2. Italy: General Government Balance Sheet, 2005–11
(Billions of euros)
(Percent of GDP)

ITALY 2012 ARTICLE IV REPORT
INTERNATIONAL MONETARY FUND 39
2008 2009 2010 2011 2012Latest
available
Regulatory capital to risk-weighted assets 10.4 11.7 12.1 13.0 13.2 MarRegulatory tier I capital to risk-weighted assets 6.9 8.3 8.7 10.0 10.4 MarRegulatory core tier I capital to risk-weighted assets 7.0 8.2 8.3 9.3 9.9 MarNonperforming loans net of provisions to capital 37.1 54.8 60.2 64.6 DecNonperforming loans to total gross loans 6.3 9.4 10.0 11.7 DecSectoral distribution of loans to total loans
Residents 72.3 72.3 74.8 75.5 JuneDeposit-takers 5.5 3.0 2.3 2.4 JuneCentral bank 1.0 1.3 0.8 0.7 JuneOther financial corporations 3.4 5.1 4.9 4.4 JuneGeneral government 2.0 3.1 2.8 2.8 JuneNonfinancial corporations 37.0 37.5 37.9 39.1 JuneOther domestic sectors 23.4 22.4 26.1 26.0 June
Nonresidents 27.7 27.7 25.2 24.5 JuneReturn on assets 0.3 0.3 0.3 -0.9 Dec.Return on equity 4.9 4.0 3.7 -13.0 Dec.Interest margin to gross income 65.9 60.8 57.5 57.1 Dec.Net open position in foreign exchange to capital 2.2 1.6 1.7 1.7 Dec.
Capital to assets 4.1 4.8 5.0 5.4 JuneLarge exposures to capital 1/ 21.1 11.9 89.5 89.2 Dec.Gross asset position in financial derivatives to capital 108.3 76.5 74.7 112.3 Dec.Gross liability position in financial derivatives to capital 110.4 77.8 78.1 117.9 Dec.Trading income to total income -7.1 3.2 1.3 3.1 Dec.Personnel expenses to noninterest expenses 57.4 57.5 58.3 56.5 Dec.Spread between reference lending and deposit rates (basis points) 413.1 336.2 298.6 305.2 Dec.Spread between highest and lowest interbank rate (basis points) 56.2 41.4 40.8 87.6 Dec.Customer deposits to total (noninterbank) loans 59.0 64.0 58.6 56.1 Dec.Foreign currency-denominated loans to total loans 10.7 9.9 9.2 8.9 Dec.Foreign currency-denominated liabilities to total liabilities 22.5 45.7 33.9 30.7 Dec.
Source: IMF, Financial Soundness Indicators.1/ There is a series break in 2010 due to a change in the regulatory framework.
Table 3. Italy: Financial Sector Indicators (Percent, unless otherwise noted)
Core FSIs for Deposit-taking Institutions
Encouraged FSIs for Deposit-taking Institutions

2012 ARTICLE IV REPORT ITALY
40 INTERNATIONAL MONETARY FUND
2009 2010 2011 2012 2013
Prel .
Billions of Euros
Current account balance -30.2 -54.7 -51.5 -34.5 -32.3 Balance of goods and services -7.6 -30.1 -23.6 -6.8 -4.1 Goods balance 0.8 -20.9 -16.6 -3.1 -0.9 Exports 292.3 337.9 376.5 362.9 363.9 Imports -291.5 -358.8 -393.1 -366.1 -364.8 Services balance -8.4 -9.2 -7.0 -3.7 -3.2 Credit 67.8 74.0 76.7 83.1 83.3 Debit -76.2 -83.2 -83.7 -86.8 -86.5 Income balance -10.4 -8.3 -12.0 -11.9 -12.3 Credit 57.7 55.9 56.5 58.4 58.9 Debit -68.1 -64.2 -68.5 -70.3 -71.2 Current transfers (net) -12.2 -16.3 -15.9 -15.7 -15.9
Official (net) -7.5 -10.8 -11.4 -8.9 -9.2
Capital and financial account balance 37.2 86.2 73.9 34.5 32.3 Capital account balance -0.1 -0.6 0.4 0.3 0.0 Financial account 37.3 86.7 73.5 34.2 32.3 Direct investment -0.9 -17.7 -13.1 -20.7 -22.1 Portfolio investment 28.1 38.5 -34.4 25.2 20.2
of which: government 65.5 64.0 -73.0 19.7 20.6 Other investment 5.7 71.8 114.4 29.7 34.2
Derivatives (net) 4.3 -4.7 7.5 0.0 0.0
Reserve assets (increase = -) 0.1 -1.0 -0.9 0.0 0.0
Net errors and omissions -7.1 -31.5 -22.4 0.0 0.0
Percent of GDP
Current account balance -2.0 -3.5 -3.3 -2.2 -2.0Balance on goods and services -0.5 -1.9 -1.5 -0.4 -0.3
Goods balance 0.1 -1.3 -1.1 -0.2 -0.1Services balance -0.6 -0.6 -0.4 -0.2 -0.2
Income balance -0.7 -0.5 -0.8 -0.8 -0.8Current transfers -0.8 -1.0 -1.0 -1.0 -1.0
Capital and financial account balance 2.5 5.5 4.7 2.2 2.0 Capital account balance 0.0 0.0 0.0 0.0 0.0 Financial account 2.5 5.6 4.7 2.2 2.0 Direct investment -0.1 -1.1 -0.8 -1.3 -1.4 Portfolio investment 1.8 2.5 -2.2 1.6 1.3
of which: government 4.3 4.1 -4.6 1.3 1.3 Other investment 0.4 4.6 7.2 1.9 2.2
Derivatives (net) 0.3 -0.3 0.5 0.0 0.0
Reserve assets (increase = -) 0.0 -0.1 -0.1 0.0 0.0
Net errors and omissions -0.5 -2.0 -1.4 0.0 0.0
Gross external debt 116.5 117.3 114.7 119.2 121.0Public sector 52.0 52.5 54.9 61.5 62.1Private sector 64.5 64.9 59.8 57.7 58.9
Sources: Bank of Italy and IMF staff estimates.
Table 4. Italy: Summary of Balance of Payments, 2009–13
Projections

ITALY 2012 ARTICLE IV REPORT
INTERNATIONAL MONETARY FUND 41
Objective Area Measures
Energy • Gas industry: Ownership separation of ENI from gas distribution activity; lower tariffs for vulnerable customers; promote strategic investments
• Electricity: Promote investment in the transmission network; increase transparency
• Petroleum products: Eliminate restrictions on contractual arrangements and activities; replace outdated systems; improve information transparency
Transport • Railways: Introduce competitive tender process for local railway services
• Highways: Review tariffs systems for new concessions
• Taxi services: Limit entry and activity restrictions
Professional services
• Abolish tariffs for regulated professions; reform professional orders to ease entry and activity restrictions; separate administrative, education, and disciplinary functions within orders
• Increase the number of pharmacies and notaries; abolish some restrictions
Local public services
• Require competitive tendering and territorial consolidation in service provision to increase efficiency/reduce costs
Other sectors • Reduce administrative constraints to establishing and running a business; liberalize opening hours for retailers
Enhance the role of competition bodies
Regulatory framework
• Strengthen the powers of the Antitrust Authority, especially to scrutinize and issue binding opinions for activities at the sub-national levels
• Establish independent Transport Authority; strengthen the role of Communication Authority in the postal sector and Energy and Gas Authority in the water sector
Local public services
• Strengthen enforcement of competition rules and sanctions for non-compliance; monitoring by the Presidency of the Council of Ministers
Reduce public sector ownership
• Define a privatization plan (earlier target: at least €5 billion revenue per year over 2012–14); improve public asset management; plans to sell shares in state-owned companies and establish a real estate fund to manage disposal of public assets at all levels of government
Reduce labor market dualism
Employment protection
• Modify job protection on standard contracts to reduce costs of individual dismissal by limiting the compulsory reinstatement in case of dismissal for economic reasons
Contracts • Encourage stable employment relationships (tax disincentives for fixed-term contracts; control abuse of atypical contracts) and promote apprenticeship contracts
Social safety net
• Reorganize social safety net to make the coverage more uniform (within the overall fiscal constraints); extend wage guarantee funds; early retirement schemes
Raise labor participation
• Promote female employment (protection against illegal 'blank resignations' and vouchers for baby-sitting services); strengthen activation policies
• Existing measures focus on tax deductions for hiring of women, youth, and new employees, and establishing a special type of company for young entrepreneurs
Sources: Official reports.1/ The law on competition, liberalization, and infrastructure was approved by the parliament on March 24, 2012.2/ The government approved a draft law on labor market reform on April 5, 2012; the law is yet to be approved by the parliament.
Table 5. Italy: Highlights of the Authorities' Structural Reform Agenda
Product Market Reform 1/
Enhance competition and liberalize economic activity
Labor Market Reform 2/

2012 ARTICLE IV REPORT ITALY
42 INTERNATIONAL MONETARY FUND
ANNEX I: DEBT SUSTAINABILITY ANALYSIS
Years of high debt and low growth have left Italy exposed to heightened concerns about the euro-area crisis and the global outlook. Under staff forecasts, which include the authorities’ announced fiscal plans, but with staff’s macroeconomic outlook, the debt-to-GDP ratio stabilizes in 2013 and remains vulnerable to shocks.
Background
Sovereign yields. The current level of yields on Italian debt is not unprecedented, with part of the rise in spreads attributable to declining German bund-yields, a clear departure from the first decade of the euro-zone.
Maturity and rollover. Given the debt structure (average maturity just under 7 years), the direct interest pass-through to the budget is relatively slow; a 100 basis points shock to the yield curve is estimated to raise the interest bill by just over 0.2 percent of GDP. The effective interest rate is forecast to rise from 4.2 percent in 2011 to 4.6 percent in 2012. The government financing needs are large, at about 30 percent of GDP in 2012, largely due to the rollover of existing debt.
Primary Surplus. Italy is also one of the few euro-area countries running a primary surplus and recent pension reforms have significantly reduced the long-run impact of aging on the fiscal accounts.
Debt-ratio. However, Italy’s public debt-to-GDP ratio is the second highest in the euro area. Italy’s growth performance has been disappointing. The debt-to-GDP ratio remains vulnerable to adverse shocks.
Scenario analysis
Baseline. Staff forecast that the debt-to-GDP ratio will peak at about 126.4 percent in 2013, before declining to about 119 percent in 2017. Although spreads are assumed to moderate from current levels, the effective interest rate is forecast to rise from 4.2 percent in 2011 to 5.3 percent in 2017. The structural primary balance improves with the implementation of the authorities’ fiscal adjustment plans. Beyond 2015, the constitutional requirement for a balanced budget provides a lower-bound for the structural overall balance.
-10
-8
-6
-4
-2
0
2
4
6
8
10
12
2007
2008
2009
2010
2011
2012
2013
2014
2015
2016
2017
2018
2019
2020
Contribution to Changes in Public Debt,(Percent of GDP)
ResidualReal interest rateReal GDP growthPrimary balanceOther debt-creating flowsChange in debt
0
2
4
6
8
10
12
0
2
4
6
8
10
12
1996 1998 2000 2002 2004 2006 2008 2010 2012
Bond spreadItaly
Germany
10-Year Bond Yields, 1996–2012(Percent, monthly average; last observation: May 2012)
Source: Bloomberg.

ITALY 2012 ARTICLE IV REPORT
INTERNATIONAL MONETARY FUND 43
Several additional scenarios are used to evaluate the sustainability of debt (see chart): Structural surplus scenario. Staff recommends targeting a structural overall surplus of
1 percent of GDP from 2014 under the new fiscal rule. In this scenario, the structural primary balance would improve to 6.7 percent of GDP and the debt-to-GDP ratio would drop to about
116 percent by 2017. Spreads are assumed to tighten relative to the baseline.
Slow recovery scenario. A failure to implement domestic structural reforms, weak external demand and tight credit conditions lead to a slower recovery compared to the baseline, with medium-term real annual growth stagnating at 0.25 percent—the average annual growth rate experienced over the last decade (average growth over 2013-17 would be flat). Low growth weighs on the fiscal balance, with the primary surplus reaching only 4.2 percent of GDP by 2017. The debt-ratio continues to rise, reaching 128 percent of GDP in 2017.
High interest rate scenario. Market concerns about medium-term debt sustainability intensify, thereby increasing interest rates—spreads rise to about 580 bps from 2013. The government’s interest bill reaches 8 percent of GDP by 2017, with an implicit average interest rate of 6.5 percent. Higher borrowing costs are passed on to the real economy, depressing growth. The debt-to-GDP ratio approaches 130 percent by 2017, despite a sizeable structural primary surplus. The same scenario is also applied using staff’s recommended fiscal stance (1 percent structural surplus), which provides a greater buffer against the shock.
Policy slippage scenario. Reform fatigue weakens the implementation of fiscal adjustment plans—starting in 2012, only 25 percent of the planned adjustment is undertaken. Short-term growth improves relative to the baseline due to the reduced fiscal drag, although this is partially offset by rising risk premia (25 basis points increase for each 1 percent of GDP slippage). The debt-to-GDP ratio does not stabilize until 2017 at about 131 percent.
2011 2012 2013 2014 2015 2016 2017
AssumptionsReal GDP growth (percent) 0.4 -1.9 -0.3 0.5 1.0 1.2 1.2Nominal GDP growth (percent) 1.7 -0.7 1.3 1.8 2.3 2.6 2.7Ouput gap 1/ -2.3 -3.9 -4.1 -3.7 -2.9 -2.0 -1.2Implicit/effective interest rate (percent) 4.2 4.6 4.6 4.7 4.9 5.1 5.3
OutcomesPrimary balance 1.0 3.0 4.2 4.5 4.7 5.2 5.6Overall balance -3.9 -2.6 -1.5 -1.4 -1.3 -1.0 -0.6Structural primary balance 1/ 1.4 4.7 6.0 6.0 6.0 6.1 6.2Structural overall balance 1/ -3.4 -0.7 0.5 0.4 0.2 0.0 0.0Debt-stabilizing primary balance 3.8 6.5 4.2 3.7 3.2 3.1 3.1Public debt 2/ 120.1 125.8 126.4 125.6 124.1 122.0 119.4
Sources: National Authorities; and IMF staff calculations.
1/ Percent of potential GDP.
2/ Debt projections incorporate Italy’s planned contributions to the EFSF and the ESM, increasing debt by 2 percent of GDP in 2012.
Fiscal Projections in the Baseline(Percent of GDP, unless otherwise indicated)

2012 ARTICLE IV REPORT ITALY
44 INTERNATIONAL MONETARY FUND
Deep recession and interest rate shock. This could potentially arise due to contagion from the euro area crisis and slow progress in structural reforms. Annual GDP growth is 1 percentage point lower than in the baseline and there is a 100 bps increase in interest rates from 2013-2017—these assumptions push the debt-ratio above 140 percent of GDP and keep it on a rising path.
Structural reform scenario. Staff estimates that a comprehensive package of product and labor market reforms could raise the level of real GDP by 5¾ percent after 5 years (see Box 3 of Staff Report). In the simulations, staff considered: (i) product market reforms which increase competition and productivity, especially in the non-tradable sector by lowering the cost of doing business; and (ii) labor market reforms which boost labor participation and increase efficiency by lowering adjustment costs and improving job matching. With these higher growth assumptions, the debt-to-GDP ratio improves to about 108 percent by 2017.
Sensitivity analysis
The level of Italian debt-to-GDP is sensitive to assumptions regarding the growth-interest rate differential. Figure 2 shows a fan-chart of the debt-to-GDP ratio using the staff forecast for the primary balance and stochastic simulations for real GDP growth and interest rates. Given the sizeable primary surplus, according to the simulations, there is 95 percent probability that the debt-to-GDP ratio will remain below 130 percent in the medium term.
0.95
1.00
1.05
1.10
1.15
1.20
1.25
1.30
1.35
1.40
1.45
0.95
1.00
1.05
1.10
1.15
1.20
1.25
1.30
1.35
1.40
1.45
2005 2007 2009 2011 2013 2015 2017
5th-20th pcts
20th-40th pcts
40th-60th pcts
60th-80th pcts
80th-95th pcts
Italy: Sensitivity of Debt-Ratio to Interest and Growth Assumptions 1/
(Public sector debt to GDP ratio)
1/ Probability distribution of possible future paths for the debt-to-GDP ratio given staff projections for the primary balance. For a discusison of the methodology, see IMF SPN/09/18.
105
110
115
120
125
130
135
105
110
115
120
125
130
135
2011 2012 2013 2014 2015 2016 2017
Debt-to GDP under Staff Forecast and Structural Reform Scenarios
Staff forecast
Structural reform

ITALY 2012 ARTICLE IV REPORT
INTERNATIONAL MONETARY FUND 45
118
120
122
124
126
128
130
118
120
122
124
126
128
130
2011 2012 2013 2014 2015 2016 2017
Slow recovery 1/
Staff forecast
Growth shock
114
116
118
120
122
124
126
128
130
132
114
116
118
120
122
124
126
128
130
132
2011 2012 2013 2014 2015 2016 2017
Interest Shock to Staff Forecast 2/
Staff forecast
Interest shock
118
120
122
124
126
128
130
132
134
118
120
122
124
126
128
130
132
134
2011 2012 2013 2014 2015 2016 2017
Policy Slippage 3/
Staff forecast
Policy Slippage115
120
125
130
135
140
145
115
120
125
130
135
140
145
2011 2012 2013 2014 2015 2016 2017
Deep recession and interest shock 4/
Staff forecastCombined shock
Figure 1: Italy: Debt-Sustainability Scenarios(General Government Gross Debt, percent of GDP, unless otherwise indicated)
114
116
118
120
122
124
126
128
114
116
118
120
122
124
126
128
2011 2012 2013 2014 2015 2016 2017
Baseline and Policy Scenario
Structural surplus
Staff forecast
114
116
118
120
122
124
126
128
130
132
114
116
118
120
122
124
126
128
130
132
2011 2012 2013 2014 2015 2016 2017
Interest Rate Shock to Structural Surplus Scenario 2/
Structural surplus
Interest shock
1/ Slow recovery from 2012 recession and then low output growth rates (average growth rate over 2013-2017 is zero).2/ Spreads are 180 bps higher than in the baseline from 2013 (1.5 standard deviations).3/ From 2012, only 25 percent of the planned fiscal adjustment is achieved.4/ Two stage shock: real GDP is 1 percent lower from 2013, then 100 bps point shock to rates relative to baseline (with a knock-on effect for both the interest bill and output growth).

2012 ARTICLE IV REPORT ITALY
46 INTERNATIONAL MONETARY FUND
ANNEX II: EXTERNAL COMPETITIVENESS
Italy’s merchandise balance has deteriorated, owing primarily to a widening energy deficit. The non-energy surplus has declined only marginally since the introduction of the euro, reflecting buoyant external demand, especially in emerging markets. But higher commodity prices have widened the energy deficit.
For non-energy trade, Italy faces growing global competition, due to an unfavorable export structure. A breakdown of Italian exports reveals a relative predominance of labor-intensive and low-technology goods, similar to that of many emerging-market economies where competition is fiercer.
Italian trade is moving up the technology ladder, but only slowly. There is some evidence of restructuring within the manufacturing sector, with a shift toward higher-quality goods that are relatively sheltered from emerging-market competition. But the ability of exporting firms to adjust is constrained by the same structural factors that have held back Italy’s economy-wide potential.
The euro-area crisis has so far had only a modest impact on Italian price-competitiveness trends. Since late 2009, the CPI- and ULC-based real effective exchange rates have depreciated by around 5 and 7 percent, respectively, mostly reflecting the lower euro. Within the eurozone, however, the pattern is less compelling. Producer prices in Italy (excluding construction) have increased by 10½ percent since 2009; in line with German prices, but around 1 point below the euro-area average. Nominal wages, on the other hand, have shown some signs of easing, and have increased by only 3¼ percent in Italy, compared to around 5¼ and 4½ percent in Germany and the Euro area, respectively.
-6
-4
-2
0
2
4
-6
-4
-2
0
2
4
1999 2001 2003 2005 2007 2009 2011
Non-energy Energy
Sources: Haver Analytics and IMF staff calculations
Merchandise Trade Balance, 1999-2011(Percent of GDP)
-15
-10
-5
0
5
10
15
-15
-10
-5
0
5
10
15
High Med-High Med-Low Low
Export Share, by Technology Group, 2011(Relative to average EU-27 composition)
ESP ITA GER GBR
Source:s COMTRADE and IMF staff calculations
0
20
40
60
80
100
120
0
20
40
60
80
100
120
1992 2002 2011
Export Share, by Technology GroupHigh Med-High Med-Low Low
Sources: COMTRADE and IMF staff calculations

ITALY 2012 ARTICLE IV REPORT
INTERNATIONAL MONETARY FUND 47
Looking forward, improved competitiveness will depend closely on successful structural reform. Labor-market rigidities and low productivity have resulted in a gradual deterioration of Italy’s price competitiveness. In this context, staff assesses Italy’s real effective exchange rate to be modestly overvalued by around 5–10 percent. This assessment stems from a range of CGER-style methodologies,12 and is consistent with market views. Using standard trade elasticities, it is also consistent with the new External Balances Assessment (EBA) approach, which finds that the structural current account deficit is around 1–1½ percent of GDP above the level justified by fundamentals and appropriate policies. Simulations suggest that full implementation of the authorities’ reform agenda should close this competitiveness gap (see Box 3).
12 Under the Macroeconomic Balance, External Sustainability, and Equilibrium Real Exchange Rate approaches of the Consultative Group on Exchange Rate Issues (CGER), the most recent overvaluation estimates for May 2012 are 10, 6 and 7 percent, respectively—largely unchanged from the 5-10 percent range from the Fall 2011 CGER round. See Lee and others (2008), “Exchange Rate Assessments: CGER Methodologies” IMF Occasional Paper No. 261, and Vitek (2012) “Exchange Rate Assessment Tools for Advanced, Emerging, and Developing Economies.”

2012 ARTICLE IV REPORT ITALY
48 INTERNATIONAL MONETARY FUND
Italy Competitiveness Indicators, 1990–2011
Sources: AMECO, Eurostat, OECD, Bank of Italy, IFS, DOTS and IMF staff calculations.
1/ Based on producer prices of manufactured goods for the domestic market; in relation to 61 competitor countries.
-1 0 1 2 3
IRLSWEGBRGRCPRTNLDFRAESPGERBEL
EuroAreaLUXITA
Productivity per Person Employed, 1999-2011(Average annual percentage change, whole economy)
0
2
4
6
8
10
0
2
4
6
8
10
IRL
ESP
AU
T
USA FIN
GER
SWE
PRT
BEL
FRA
GBR
GRC IT
A
Export Volumes, 1990-2011(Average annual growth, percent)
0
5
10
15
0
5
10
15
1990 1995 2000 2005 2010
Share of World Exports (percent)
Italy GermanyFrance UKSpain China
-10
-5
0
5
10
15
-10
-5
0
5
10
15
1998 2000 2002 2004 2006 2008 2010
TotalExports to EUExports to extra-EU
Export Unit Value (Year-on-year percent change,)
...has pushed up unit labor costs relative to the euro area...
However, despite slower export growth...
...Italy's market share has moved in line with its peers...
90
100
110
120
130
140
1999 2001 2003 2005 2007 2009 2011
Competitiveness Indicators 1/, 1999-2011(1999=100)
ITA FRA GERESP GRC PRT
5-10 percentovervaluation
95
100
105
110
115
95
100
105
110
115
2000Q1 2003Q1 2006Q1 2009Q1
ULC
Wages & Salaries
Labor Cost Indicators Relative to Euro Area, 2000-2011 (2000Q1 =100)
Onset of euro-area crisis
Italy's lack of productivity growth...
...and resulted in a mild overvaluation.
...supported by rising export prices.
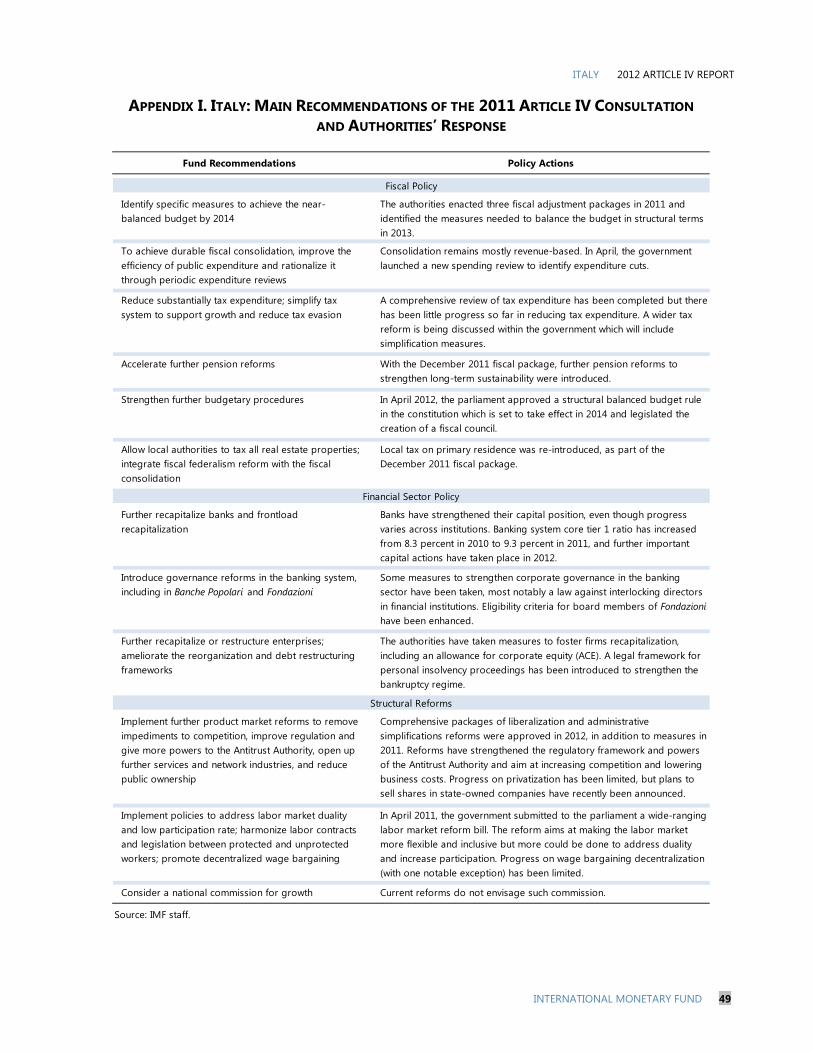
ITALY 2012 ARTICLE IV REPORT
INTERNATIONAL MONETARY FUND 49
APPENDIX I. ITALY: MAIN RECOMMENDATIONS OF THE 2011 ARTICLE IV CONSULTATION AND AUTHORITIES’ RESPONSE
Fund Recommendations Policy Actions
Identify specific measures to achieve the near-balanced budget by 2014
The authorities enacted three fiscal adjustment packages in 2011 and identified the measures needed to balance the budget in structural terms in 2013.
To achieve durable fiscal consolidation, improve the efficiency of public expenditure and rationalize it through periodic expenditure reviews
Consolidation remains mostly revenue-based. In April, the government launched a new spending review to identify expenditure cuts.
Reduce substantially tax expenditure; simplify tax system to support growth and reduce tax evasion
A comprehensive review of tax expenditure has been completed but there has been little progress so far in reducing tax expenditure. A wider tax reform is being discussed within the government which will include simplification measures.
Accelerate further pension reforms With the December 2011 fiscal package, further pension reforms to strengthen long-term sustainability were introduced.
Strengthen further budgetary procedures In April 2012, the parliament approved a structural balanced budget rule in the constitution which is set to take effect in 2014 and legislated the creation of a fiscal council.
Allow local authorities to tax all real estate properties; integrate fiscal federalism reform with the fiscal consolidation
Local tax on primary residence was re-introduced, as part of the December 2011 fiscal package.
Further recapitalize banks and frontload recapitalization
Banks have strengthened their capital position, even though progress varies across institutions. Banking system core tier 1 ratio has increased from 8.3 percent in 2010 to 9.3 percent in 2011, and further important capital actions have taken place in 2012.
Introduce governance reforms in the banking system, including in Banche Popolari and Fondazioni
Some measures to strengthen corporate governance in the banking sector have been taken, most notably a law against interlocking directors in financial institutions. Eligibility criteria for board members of Fondazioni have been enhanced.
Further recapitalize or restructure enterprises; ameliorate the reorganization and debt restructuring frameworks
The authorities have taken measures to foster firms recapitalization, including an allowance for corporate equity (ACE). A legal framework for personal insolvency proceedings has been introduced to strengthen the bankruptcy regime.
Implement further product market reforms to remove impediments to competition, improve regulation and give more powers to the Antitrust Authority, open up further services and network industries, and reduce public ownership
Comprehensive packages of liberalization and administrative simplifications reforms were approved in 2012, in addition to measures in 2011. Reforms have strengthened the regulatory framework and powers of the Antitrust Authority and aim at increasing competition and lowering business costs. Progress on privatization has been limited, but plans to sell shares in state-owned companies have recently been announced.
Implement policies to address labor market duality and low participation rate; harmonize labor contracts and legislation between protected and unprotected workers; promote decentralized wage bargaining
In April 2011, the government submitted to the parliament a wide-ranging labor market reform bill. The reform aims at making the labor market more flexible and inclusive but more could be done to address duality and increase participation. Progress on wage bargaining decentralization (with one notable exception) has been limited.
Consider a national commission for growth Current reforms do not envisage such commission.
Source: IMF staff.
Fiscal Policy
Financial Sector Policy
Structural Reforms

ITALY STAFF REPORT FOR THE 2012 ARTICLE IV CONSULTATION—INFORMATIONAL ANNEX Prepared By
European Department (In consultation with other departments)
FUND RELATIONS ________________________________________________________________________ 2
STATISTICAL ISSUES ______________________________________________________________________ 4
CONTENTS
June 21, 2012

2012 ARTICLE IV REPORT—INFORMATIONAL ANNEX ITALY
2 INTERNATIONAL MONETARY FUND
FUND RELATIONS (as of May 31, 2012)
I. Membership Status: Joined 3/27/47; Article VIII.
II. General Resources Account: SDR Million Percent Quota Quota 7,882.30 100.00 Fund holdings of currency 5,332.73 67.53 Reserve Tranche Position 2,559.58 32.47 Lending to the Fund
New arrangements to borrow 1,550.33
Mission: Rome and Milan, May 3–16, 2012. The concluding statement of the mission is available at: http://www.imf.org/external/np/ms/2012/051612.htm
Staff team: Mr. Husain (head), Mr. Kang, Ms. Barkbu, Ms. Lusinyan, Mr. Tyson, Ms. Zoli (all EUR), Messrs. Eyraud (FAD), Guzzo and Moore (MCM), and Tiffin (SPR). Mr. Spilimbergo (EUR) and Ms. Nardin (EXR) also joined for a few days. Mr. Moghadam participated in the concluding meetings and press briefing. Mr. Sadun (OED) attended the policy meetings.
Country interlocutors: Prime Minister Monti, Labor Minister Fornero, Minister for Parliamentary Relations Giarda, Finance Vice Minister Grilli, and Bank of Italy Director General Saccomanni, other senior officials from the Ministry of Economy and Finance, the Bank of Italy, Presidency of the Council of Ministers; the Ministry of Economic Development, the Ministry of Labor and Social Policies, the Ministry for Public Administration and Simplification; Parliamentary Budget services; Technical Commission on Fiscal Federalism Implementation (COPAFF); Conference of Regions; Association of Municipalities – Fondazione IFEL; major Italian banks; rating agencies; Cassa Depositi e Prestiti; Generali Insurance; the Securities and Exchange Commission (CONSOB); the Antitrust Authority; Pension funds regulatory authority (Covip); Insurance regulatory authority (Isvap); Association on insurance companies (Ania); Interbank Deposit Protection Fund; National Statistics Institute (Istat); representatives of trade unions (CGIL, CSIL, and UIL) ; Confederation of Italian Industry (Confindustria); Italian Banking Association (ABI); Taskforce on innovative startups; research centers; parliament and academic representatives.
Fund relations: The previous consultation discussions took place during April 26–May 11, 2011. The associated Executive Board’s assessment is available at: http://www.imf.org/external/np/sec/pn/2011/pn1189.htm and the staff report and other mission documents at: http://www.imf.org/external/pubs/cat/longres.aspx?sk=25035.0 Italy accepted the obligations under Article VIII and, apart from certain security restrictions, maintains an exchange rate system free of restrictions.
Data: Italy subscribes to the Fund’s Special Data Dissemination Standard, and comprehensive economic data are available on a timely basis (Table 1).

ITALY 2012 ARTICLE IV REPORT—INFORMATIONAL ANNEX
INTERNATIONAL MONETARY FUND 3
III. SDR Department: SDR Million Percent Allocation Net cumulative allocation 6,576.11 100.00 Holdings 5,975.19 90.86
IV. Outstanding Purchases and Loans: None
V. Financial Arrangements: None
VI. Projected Obligations to Fund (SDR million; based on existing use of resources and present holdings of SDRs):
Forthcoming
2012 2013 2014 2015 2016 Principal Charges/Interest 0.39 0.86 0.86 0.86 0.86 Total 0.39 0.86 0.86 0.86 0.86
VII. Exchange Rate Arrangement: Italy entered the final stage of European Economic and Monetary
Union on January 1, 1999, at a rate of 1,936.27 Italian lire per 1 euro.
Italy maintains an exchange system free of restrictions on the making of payments and transfers for current international transactions, except for the exchange restrictions imposed by Italy solely for the preservation of national or international security that have been notified to the Fund pursuant to Executive Board Decision No. 144-(52/51).
VIII. Article IV Consultations: Italy is on the standard 12-month consultation cycle. The previous consultation discussions took place during April 26–May 11, 2011, and the staff report (Country Report No. 11/157, 07/12/11) was discussed on July 11, 2011.
IX. ROSCs/FSAP: Standard Code Assessment Date of Issuance Country Report
Fiscal Transparency October 9, 2002 No. 02/231 Data October 18, 2002 No. 02/234 Fiscal ROSC update November 2003 No. 03/353 Fiscal ROSC update February 2006 No. 06/64 FSAP March 14, 2006 No. 06/112
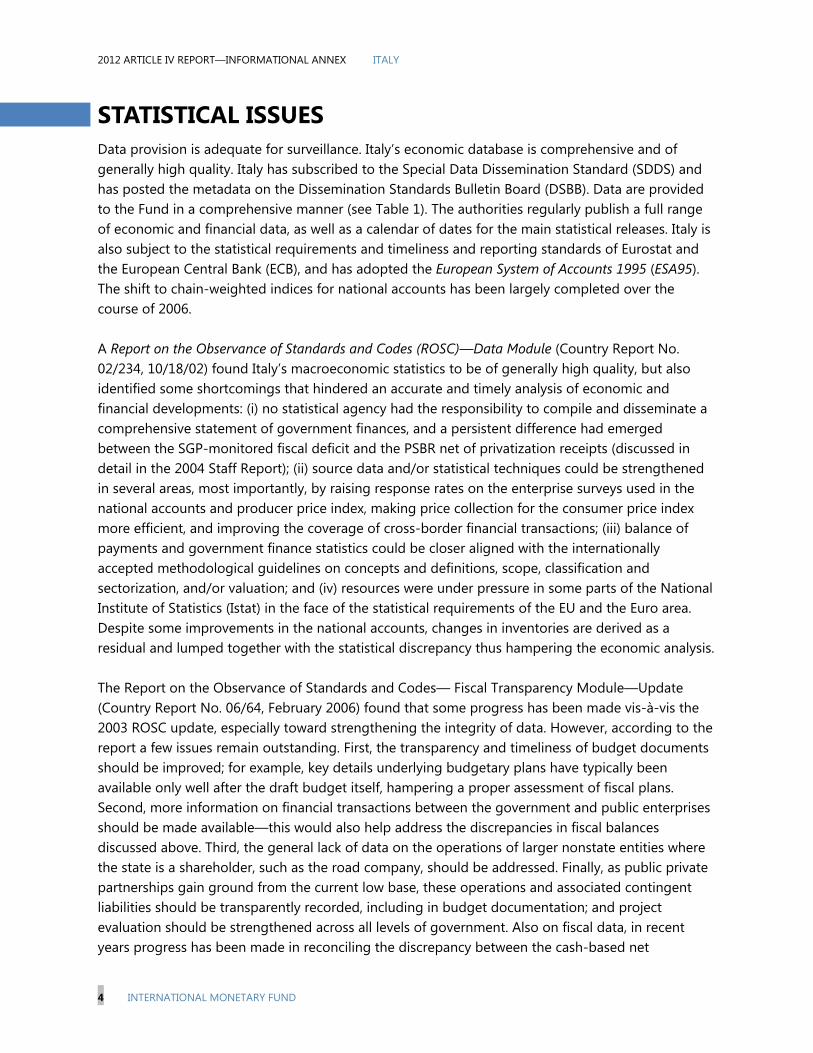
2012 ARTICLE IV REPORT—INFORMATIONAL ANNEX ITALY
4 INTERNATIONAL MONETARY FUND
STATISTICAL ISSUESData provision is adequate for surveillance. Italy’s economic database is comprehensive and of generally high quality. Italy has subscribed to the Special Data Dissemination Standard (SDDS) and has posted the metadata on the Dissemination Standards Bulletin Board (DSBB). Data are provided to the Fund in a comprehensive manner (see Table 1). The authorities regularly publish a full range of economic and financial data, as well as a calendar of dates for the main statistical releases. Italy is also subject to the statistical requirements and timeliness and reporting standards of Eurostat and the European Central Bank (ECB), and has adopted the European System of Accounts 1995 (ESA95). The shift to chain-weighted indices for national accounts has been largely completed over the course of 2006. A Report on the Observance of Standards and Codes (ROSC)—Data Module (Country Report No. 02/234, 10/18/02) found Italy’s macroeconomic statistics to be of generally high quality, but also identified some shortcomings that hindered an accurate and timely analysis of economic and financial developments: (i) no statistical agency had the responsibility to compile and disseminate a comprehensive statement of government finances, and a persistent difference had emerged between the SGP-monitored fiscal deficit and the PSBR net of privatization receipts (discussed in detail in the 2004 Staff Report); (ii) source data and/or statistical techniques could be strengthened in several areas, most importantly, by raising response rates on the enterprise surveys used in the national accounts and producer price index, making price collection for the consumer price index more efficient, and improving the coverage of cross-border financial transactions; (iii) balance of payments and government finance statistics could be closer aligned with the internationally accepted methodological guidelines on concepts and definitions, scope, classification and sectorization, and/or valuation; and (iv) resources were under pressure in some parts of the National Institute of Statistics (Istat) in the face of the statistical requirements of the EU and the Euro area. Despite some improvements in the national accounts, changes in inventories are derived as a residual and lumped together with the statistical discrepancy thus hampering the economic analysis. The Report on the Observance of Standards and Codes— Fiscal Transparency Module—Update (Country Report No. 06/64, February 2006) found that some progress has been made vis-à-vis the 2003 ROSC update, especially toward strengthening the integrity of data. However, according to the report a few issues remain outstanding. First, the transparency and timeliness of budget documents should be improved; for example, key details underlying budgetary plans have typically been available only well after the draft budget itself, hampering a proper assessment of fiscal plans. Second, more information on financial transactions between the government and public enterprises should be made available—this would also help address the discrepancies in fiscal balances discussed above. Third, the general lack of data on the operations of larger nonstate entities where the state is a shareholder, such as the road company, should be addressed. Finally, as public private partnerships gain ground from the current low base, these operations and associated contingent liabilities should be transparently recorded, including in budget documentation; and project evaluation should be strengthened across all levels of government. Also on fiscal data, in recent years progress has been made in reconciling the discrepancy between the cash-based net

ITALY 2012 ARTICLE IV REPORT—INFORMATIONAL ANNEX
INTERNATIONAL MONETARY FUND 5
borrowing requirement and the accrual budget deficit, and, as a result, the statistical discrepancy has decreased in recent years. Furthermore, on-line access to main fiscal documents has improved recently, and consolidated cash accounts of central government economic entities (such as the road company, Anas) are reported in the quarterly cash reports (relazione trimestrale di cassa) of the Ministry of Economy and Finance.

2012 ARTICLE IV REPORT—INFORMATIONAL ANNEX ITALY
6 INTERNATIONAL MONETARY FUND
Table 1. Common Indicators Required for Surveillance (As of June 13, 2012)
Date of latest
observation
Date received
Frequency of Data7
Frequency of
Reporting7
Frequency of
Publication7
Memo Items:
Data Quality – Methodo-logical
soundness8
Data Quality – Accuracy and
reliability9
Exchange Rates May 2012 May 2012 D D D
International Reserve Assets and Reserve Liabilities of the Monetary Authorities1
Apr 2012 May 2012 M M M
Reserve/Base Money Apr 2012 June 2012 M M M O,O,LO,LO O,O,O,O,LO
Broad Money Apr 2012 June 2012 M M M
Central Bank Balance Sheet May 2012 June 2012 M M M
Consolidated Balance Sheet of the Banking System
Apr 2012 June 2012 M M M
Interest Rates2 May 2012 May 2012 D D D
Consumer Price Index May 2012 June 2012 M M M O,O,O,O LO,O,LO,O,O
Revenue, Expenditure, Balance and Composition of Financing3 – General Government4
Q4 2011 April 2012 Q Q Q LO,O,LO,O LO,O,O,O,LO
Revenue, Expenditure, Balance and Composition of Financing3– Central Government
Apr 2012 June 2012 M M M
Stocks of Central Government and Central Government-Guaranteed Debt5
Apr 2012 June 2012 M M M
External Current Account Balance March 2012 May 2012 M M M O,LO,LO,O LO,O,LO,O
Exports and Imports of Goods and Services
March 2012 May 2012 M M M
GDP/GNP Q1 2012 May 2012 Q Q Q O,O,O,O LO,LO,O,O,O
Gross External Debt Q4 2011 March 2012 Q Q Q
International Investment position6 Q4 2011 March 2012 Q Q Q
1 Includes reserve assets pledged or otherwise encumbered as well as net derivative positions. 2 Both market-based and officially-determined, including discount rates, money market rates, rates on treasury bills, notes and bonds. 3 Foreign, domestic bank, and domestic nonbank financing. 4 The general government consists of the central government (budgetary funds, extra budgetary funds, and social security funds) and state and local governments. 5 Including currency and maturity composition. 6 Includes external gross financial asset and liability positions vis a vis nonresidents. 7 Daily (D); weekly (W); monthly (M); quarterly (Q); annually (A); irregular (I); and not available (NA). 8 Reflects the assessment provided in the data ROSC or the Substantive Update for the dataset corresponding to the variable in each row. The assessment indicates whether international standards concerning concepts and definitions, scope, classification/sectorization, and basis for recording are fully observed (O); largely observed (LO); largely not observed (LNO); not observed (NO); and not available (NA).9 Same as footnote 7, except referring to international standards concerning source data, statistical techniques, assessment and validation of source data, assessment, and revisions.

Statement by the Staff Representative on Italy
Executive Board Meeting July 9, 2012
1. This statement provides additional information on policy actions in Italy since the Article IV mission complementing the staff report (SM/12/152). The additional information does not change the thrust of the staff appraisal. 2. Recent macroeconomic developments. Recent macroeconomic data point to continued contraction in Q2 2012, in line with staff’s projections. The unemployment rate came down from 10.2 percent in April to 10.1 percent in May, reflecting a 0.3 percent increase in employment. However, retail sales fell significantly in April, bringing the annual decline to about 7 percent, and business and consumer confidence indicators remained at low levels through June.
3. Bankruptcy and civil justice reforms and other growth measures. A decree law on growth measures entered into effect on June 26. It includes modifications to the bankruptcy regime, such as a new tax provision on deductibility of losses which would facilitate financing of companies in distress. In civil justice, the decree aims to speed up the judicial process by streamlining appeals procedures. In addition, the decree provides for favorable tax treatment for project bonds to promote private-public partnerships, extends tax incentives in infrastructure and construction, amends the VAT regime for real estate leases and sales, and introduces new debt financing instruments for non-listed companies to improve their access to capital markets.
4. Bank recapitalization. On June 26, the Council of Ministers approved measures to increase the capital base of Banca Monte dei Paschi (MPS), Italy’s third largest commercial bank. The state support of up to €3.9 billion, which includes a replacement of €1.9 billion provided in 2009, will help MPS meet the target of 9 percent core Tier 1 ratio as determined by the European Banking Authority (EBA).
5. Labor market reform. On June 27, the parliament approved the labor market reform law, largely in line with the government’s proposal submitted in April. Among the modifications introduced is the extension of tax incentives for firm-level bargaining, a minimum remuneration for some temporary contracts, and some increase in flexibility for firms to use temporary and apprenticeship contracts.

Statement by Arrigo Sadun, Executive Director for Italy July 9, 2012
1. Recent Developments Facing intensive pressure from financial markets as the European debt crisis intensified in the middle of last year, Italy had no choice but to enact multiple rounds of austerity measures that have impacted negatively growth and employment. Against this background, the top priorities of the new government are achieving a lasting consolidation of public finances and restoring growth by addressing its structural weaknesses. The domestic strategy founds its necessary complement in relentless efforts to promote an effective response to the debt crisis at the European level. The structural reforms introduced in the past few months and those planned will produce tangible benefits in the years ahead, but in the short term could hardly be expected to spur aggregate demand. Economic activity continued to contract throughout the first quarter of 2012, while a modest recovery is expected in the second part of the year. The recovery will be led by exports as domestic demand will continue to lag behind the business cycle. Private consumption and investments should contribute positively to GDP growth in 2013 as the growth-dampening effects of the austerity measures wear off and real disposable income recovers. Inflation in the first half of the year was somewhat higher than the European average; this reflected mostly the spike in energy prices and the increase in the VAT. However, core inflation remains at 2.2 percent because of sluggish demand and restrains in wage rates. Wages in the public sector have been frozen for the past two years and have been significantly reduced for senior officers.
2. A Balanced Budget On fiscal policy, the goal is to balance the budget in structural terms and to put the debt on a declining path by 2013. The measures enacted in the last 12 months represent a fiscal adjustment of about 5 percent of GDP and they aim to reduce the deficit from 3.9 percent in 2011 to 1.7 percent this year and to 0.5 percent in 2013. In structural terms, the deficit is expected to decline from 3.6 percent in 2011 to 0.4 percent this year and to achieve a surplus of 0.6 percent in 2013. The principle of a balanced budget has been enshrined in the Italian Constitution, in line with the commitments undertaken in the framework of the European Fiscal Compact. In the short term, the bulk of the fiscal adjustment is taking place through tax increases; however, efforts were made to make fiscal consolidation as growth friendly as possible. Thus, the burden has been placed on consumption and property taxes. VAT rates were increased and a real estate tax abolished by the previous governments has been reinstated. Conversely, taxes have been reduced for companies hiring new employees and on capital investments in order to support economic growth.

2
Further fiscal consolidation measures are expected through spending cuts; a comprehensive spending review has been launched with the objectives of reducing the overall level of government spending and improving its quality. The spending review broadens the efforts made in the past few years to curb current expenditures. Wages in the public sector have been frozen since 2010, while those of senior officials were cut by 10 percent.
3. Debt Reduction Despite challenging economic conditions, the government remains firmly committed to reducing public debt to a more manageable level through the achievement of consistent primary surpluses. A structural primary surplus of more than 1 percent was reached last year; this year, the authorities expect it to increase to well above 4 percent and to stabilize around 6 percent from 2013 onward. Accordingly, the debt should start to decline as of next year, one year ahead of the staff projections, and should reach the 114.4 percent level by 2015. It would not be the first time that the country managed to reduce the debt-to-GDP ratio despite very slow growth, thanks to sizeable primary surpluses. To accelerate the path of debt reduction, the government is also looking at the possibility of disposing of some of its most liquid assets, including stocks of state-owned companies. New initiatives are also scheduled to establish companies, trusts, or real estate funds for the development and sale of public real estate properties. Obviously, its high debt level makes the country vulnerable to external shocks. However, the debt sustainability is ensured even under the relatively pessimistic assumptions used in the sensitivity analysis in the Stability Programme. In fact, assuming a 0.5 percent reduction in GDP growth or higher interest rates of 100 b.p. with respect to the baseline, the debt-to-GDP ratio is projected to decline by 2014 at the latest. It would take rather extreme assumptions such as the staff scenario of permanent no-growth and an increase in interest rates of 100 b.p. to push the debt toward 140 percent of GDP.
4. The Spending Review The need to frontload the fiscal adjustment has led to an increase in fiscal pressure; however, in the medium term, the goal of reducing public debt will rely increasingly on the reduction of current expenditure. Accordingly, the government has embarked on a comprehensive spending review that aims to reduce the overall level of government spending and to improve its quality, focusing on key areas. Thus, the previous approach of imposing linear cuts across the board has been replaced by an analytical assessment of needed resources. All areas of government spending are under review, with top priorities identified in the budget of key central agencies and local governments.

3
5. The Reforms Agenda Since the Reforms Agenda is supported by all major political forces, the government has been able to move expeditiously on a wide range of areas, starting with the completion of the Pension System reform. This will increase the retirement age to the highest level in Europe and it will ensure its sustainability in the long term. In June, Parliament approved a long-delayed reform of the labor market aimed at increasing productivity, creating more jobs, and ultimately boosting growth. The reform reduces some of the rigidities of the labor market as well as the disparities between over-protected traditional jobs and limited benefits for new entrants while providing for a universal unemployment insurance system. It also provides greater flexibility to employers to adjust working hours and employment levels according to the business cycle. These changes are balanced by the introduction of a universal unemployment insurance benefit to which all companies will contribute. Under the new scheme, unemployment benefits will be extended to a much larger segment of the workforce, including workers with relatively shorter tenures. The reform also introduces a faster, out-of-court procedure to handle labor disputes in case of dismissal for economic or other objective reasons. The reform also strengthens active labor market policies by facilitating youngsters to enter the labor force, by widening the use of apprenticeship contracts, and by retraining those who have lost their jobs.
6. Restoring Growth and Competitiveness Even before the global crisis hit hard the Italian economy, its performance had been lagging behind those of other European countries for more than a decade, as a result of a slow adjustment to the new international specialization of labor brought about by the globalization and deep-seated structural rigidities. Economic activity was hampered by deteriorated competitiveness and low productivity growth. The current government came to power last winter with the double mandate of addressing the fiscal crisis with urgent measures and of implementing long-delayed structural measures necessary in order to boost both growth and employment. Some of the reforms that aim to streamline and modernize the Pension, Judicial and Administrative Systems are also expected to improve the efficiency of the economy. Specific measures to boost growth have recently been submitted to Parliament in the so-called “Sviluppo Italia” package. These include initiatives to improve the business environment (a reduction of the tax wedge on labor, notably in the case of employment of women and young workers; the re-funding of the guarantee fund for SMEs; the simplification of the incentives scheme for enterprises; the redesign and extension of tax incentives on building renovations and energy efficiency investments; and the introduction of substantial tax benefits for companies’ recapitalization).

4
A wide array of measures has been introduced to increase competition in key product and services markets, including the liberalization of professional services, the distribution sector, the transportation sector, and the network industries. Of particular importance are the planned liberalizations in the energy sector with the breaking-up of the vertically-integrated cartel in the gas and electricity sectors. The government is seeking to expedite investment in key infrastructure projects by facilitating the participation of private capital in public investment, by reducing the administrative burden, and by coordinating regional programs co-financed by EU structural funds. Furthermore, in order to ease the financial pressures of government suppliers, measures have been taken to accelerate the disbursement of approved payments.
7. The Financial Sector Throughout the global and debt crisis, the Italian banking system has remained broadly resilient, reflecting a sound business model (retail funding accounts for about 85 percent of the total bank loans), prudent risk management practices, and effective supervision. Italian banks faced the crisis without the over-extended leveraging of most of their peers and without large exposure to inflated real estate markets or Program countries. However, two recessions in three years and the intensification of the European debt crisis last summer have taken their toll; access to wholesale markets deteriorated and funding costs rose in the second half of last year. Credit growth declined and the quality of loans worsened. Funding pressures have eased considerably in recent months as result of the ECB LTRO operations. For the 32 banking groups covered by the weekly liquidity monitoring by Banca d’Italia, LTRO funding is sufficient to meet in full those bonds held by institutional investors that come due in the next two years. During 2011 Italian banks have significantly strengthened their capital base, mostly by tapping private markets. For the five largest banking groups (covering about 70 percent of total consolidated assets), the core tier 1 capital ratio increased from less than 6 percent in 2007 to 9.5 percent by March 2012; this compares to an average of slightly above 10 percent for the euro area. To meet the EBA Recommendations, four of the largest banks have strengthened their capital position by about €15 billion by the end-June. Half of this amount has been raised by the largest bank through the issuance of new equity; the rest by a combination of measures, including asset disposal, retained earnings and, in one case, by issuing recapitalization bonds subscribed by the government.

Public Information Notice (PIN) No. 12/73 FOR IMMEDIATE RELEASE July 10, 2012
IMF Executive Board Concludes 2012 Article IV Consultation with Italy On July 9, 2012, the Executive Board of the International Monetary Fund (IMF) concluded the Article IV consultation with Italy.1 Background Italy’s economy entered recession in late 2011. GDP contracted for a third consecutive quarter, by 0.8 percent quarter-on-quarter in Q1 2012, led by sharp falls in consumption and investment. Exports also fell, along with the slowdown in global demand, but net exports contributed positively to growth due to sharp import compression. Household real disposable income continued to decline in 2011, and the unemployment rate reached 10.1 percent in May 2012, with youth unemployment at 36 percent. The external current account deficit narrowed from 3½ percent of GDP in 2010 to around 2¾ percent of GDP in the year to Q1 2012. Inflation increased to 2.9 percent in 2011, and further to 3.6 percent year-on-year in June mainly because of non-core components. The economy is expected to continue contracting through the year owing to tight financial conditions, the global slowdown, and the needed fiscal consolidation. Absent shocks, the recovery will take hold in early 2013, led by a modest pickup in exports, but will lag the rest of the region. Inflation will ease only gradually, as the impact of weak demand is partly offset by higher indirect taxes. The risks to the outlook are however on the downside, stemming mainly
1 Under Article IV of the IMF's Articles of Agreement, the IMF holds bilateral discussions with members, usually every year. A staff team visits the country, collects economic and financial information, and discusses with officials the country's economic developments and policies. On return to headquarters, the staff prepares a report, which forms the basis for discussion by the Executive Board. At the conclusion of the discussion, the Managing Director, as Chairman of the Board, summarizes the views of Executive Directors, and this summary is transmitted to the country's authorities. An explanation of any qualifiers used in summings up can be found here: http://www.imf.org/external/np/sec/misc/qualifiers.htm.
International Monetary Fund 700 19th Street, NW Washington, D. C. 20431 USA

2 from an intensification of the euro area crisis. Over the medium term, low trend productivity and an aging society are likely to constrain Italy’s growth prospects. The steady loss in competitiveness over the past decade, if remained unaddressed, will remain a drag on growth. The overall fiscal deficit continued to improve from 4.5 percent of GDP in 2010 to 3.9 percent of GDP in 2011, in line with the authorities’ target. In response to financial pressures in the second half of 2011, the authorities enacted three fiscal consolidation packages, bringing the total adjustment for 2012–14 to around 5 percent of GDP. As part of the consolidation, the pension system was strengthened further. In April, the Parliament approved a structural balanced budget rule in the constitution which is set to take effect in 2014 and legislated the creation of a fiscal council. Also, in April, the government embarked on a new spending review to identify expenditure cuts that would replace the need to increase VAT rates in October. The financial turmoil has put banks under stress. Credit ratings for several banks were cut in late 2011 and again in 2012, and remain on a negative outlook. With limited access to wholesale markets and higher funding costs, Italian banks have relied heavily on Eurosystem support. Banks have made progress in strengthening their capital positions and raising private capital to meet their EBA targets. Gross impaired loans have risen to 11 percent in 2011, from less than 6 percent before the crisis, and banks’ exposure to the sovereign has also increased. Higher funding costs and tighter lending standards, especially for smaller firms, have pushed up corporate borrowing rates. The government has embarked on wide-ranging structural reforms to boost productivity and potential growth. Important progress is being made in product market reforms. Parliament in March passed a comprehensive liberalization package that covered key sectors and strengthened the enforcement of competition rules. Administrative simplification reforms, which should lower the cost of doing business, were also approved. Parliament has also passed a labor market reform bill aimed at making the labor market more inclusive and flexible. The bill promotes open-ended and apprenticeship contracts for young workers, makes unemployment insurance more universal, and facilitates hiring by reducing the cost of dismissal. Progress has also been made on strengthening the anti-corruption legal framework. Executive Board Assessment Executive Directors commended the Italian authorities for launching an ambitious policy agenda to secure fiscal sustainability and promote growth. The economic and financial situation nevertheless remains challenging, with downside risks to the outlook. Directors emphasized the importance of maintaining strong policies and the momentum for reforms. To revive growth, priority should be given to raising productivity and labor participation, pursuing growth-friendly fiscal consolidation, and promoting a more dynamic and resilient banking system. Sustained

3 implementation of this agenda needs to be supported by continued progress at the European level in strengthening the currency union.
Directors acknowledged the important steps taken towards deregulating the service sector and making the labor market more flexible and inclusive. They welcomed the passage of the labor market reform bill which promotes open-ended contracts and makes unemployment insurance more universal. Further action will be necessary to bridge the gap between permanent and temporary workers, raise female labor participation, and better match wages to productivity via greater wage setting decentralization. In the area of product markets, priority should be given to accelerating reforms in the energy and services sectors. Directors also encouraged the authorities to take steps to improve the investment climate and reduce the cost of doing business. They welcomed efforts to enhance the efficiency of the judicial system.
Directors commended the authorities for initiating a sizeable fiscal adjustment. They welcomed the increased focus on targeting a structural balance to ensure flexibility in fiscal policy. Directors encouraged the authorities to rebalance the adjustment towards expenditure cuts and lower taxes. The recently announced package of spending cuts is a step in the right direction. Directors looked forward to the swift follow-up on the ongoing spending review to help reduce the overall level of government spending and improve its quality. They saw scope for cutting the public sector wage bill, reducing tax expenditures, and stepping up efforts against tax evasion. This would create space for growth-supporting measures to reduce the labor tax wedge and encourage investment.
Directors emphasized that locking in prudent medium-term policies to reduce the high level of public debt would further improve confidence. They welcomed the important progress in the pension reform, the introduction of a new constitutional structural balanced budget rule, and the creation of the fiscal council. Directors saw the recent plan to sell public assets to reduce public debt as a positive first step and stressed the need to pursue more comprehensive privatization.
Directors recognized the strengths of the Italian banking system but concurred that banks need to maintain adequate capital and liquidity buffers to remain resilient to the downturn. They noted that reducing impaired loans would free up resources for new lending and strengthen banks’ balance sheets. In this context, they saw scope for improving the efficiency of bankruptcy proceedings and out-of-court workouts to support corporate restructuring.

4
Public Information Notices (PINs) form part of the IMF's efforts to promote transparency of the IMF's views and analysis of economic developments and policies. With the consent of the country (or countries) concerned, PINs are issued after Executive Board discussions of Article IV consultations with member countries, of its surveillance of developments at the regional level, of post-program monitoring, and of ex post assessments of member countries with longer-term program engagements. PINs are also issued after Executive Board discussions of general policy matters, unless otherwise decided by the Executive Board in a particular case. The staff report (use the free Adobe Acrobat Reader to view this pdf file) for the 2012 Article IV Consultation with Italy is also available.

5
Italy: Selected Economic Indicators 1/
2009 2010 2011 2012 2013
Real Economy (change in percent)
Real GDP -5.5 1.8 0.4 -1.9 -0.3
Final domestic demand -3.2 1.0 -0.4 -3.0 -0.7
Exports of goods and services -17.5 11.6 5.6 0.6 1.9
Imports of goods and services -13.4 12.7 0.4 -6.3 1.2
Consumer prices 0.8 1.6 2.9 3.0 2.1
Unemployment rate (in percent) 7.8 8.4 8.4 10.3 11.1
Money and Credit (end-period, percent change)
Private sector credit 2/ -0.5 3.6 2.3 ... ...
National contribution to euro area M3 3/ 5.5 2.4 -4.4 ... ...
Public Finances
General government balance 4/ -5.4 -4.5 -3.9 -2.6 -1.5
Structural overall balance (percent of potential GDP) -3.6 -3.3 -3.4 -0.7 0.5
General government debt 4/ 116.1 118.7 120.1 125.8 126.4
Interest rates (end-period)
6-month interbank rate 1.0 2.3 2.3 ... ...
10-year government bond yield 4.1 4.8 5.0 ... ...
Balance of Payments (percent of GDP)
Trade balance (goods and services) 0.1 -1.3 -1.1 -0.2 -0.1
Current account -2.1 -3.6 -3.1 -2.2 -2.0
Exchange Rate
Exchange rate regime Member of EMU
Euros per US dollar 0.7 0.8 0.7 … …
Nominal effective rate (1999Q1=100) 104.6 101.3 101.6 … …
Real effective rate (1999Q1=100, CPI based) 103.3 99.4 99.4 … …
Sources: National Authorities; and IMF staff calculations.
1/ Staff estimates and projections, unless otherwise noted, based on fiscal consolidation measures included in the government's April 2012 Documento di Economia e Finanza.
2/ Twelve-month credit growth, adjusted for securitizations and excluding operations with central counterparties.
3/ Excludes currency in circulation held by nonbank private sector.
4/ Percent of GDP.
Related Documents