IT-101 Introduction to Information Technology Lecture #6-7

IT-101 Introduction to Information Technology Lecture #6-7.
Dec 25, 2015
Welcome message from author
This document is posted to help you gain knowledge. Please leave a comment to let me know what you think about it! Share it to your friends and learn new things together.
Transcript

IT-101
Introduction to Information Technology
Lecture #6-7

Overview of Chapters 10-13
Chapter 10
Definition of Sound
Frequency
Audio Signals

Definition of Sound
Vibrations transmitted through an elastic solid or a liquid or gas, with frequencies in the approximate range of 20 to 20,000 hertz, capable of being detected by human organs of hearing.
Transmitted vibrations of any frequency. The sensation stimulated in the organs
of hearing by such vibrations in the air or other medium.
Such sensations considered as a group. http://dictionary.reference.com/search?q=SOUND+
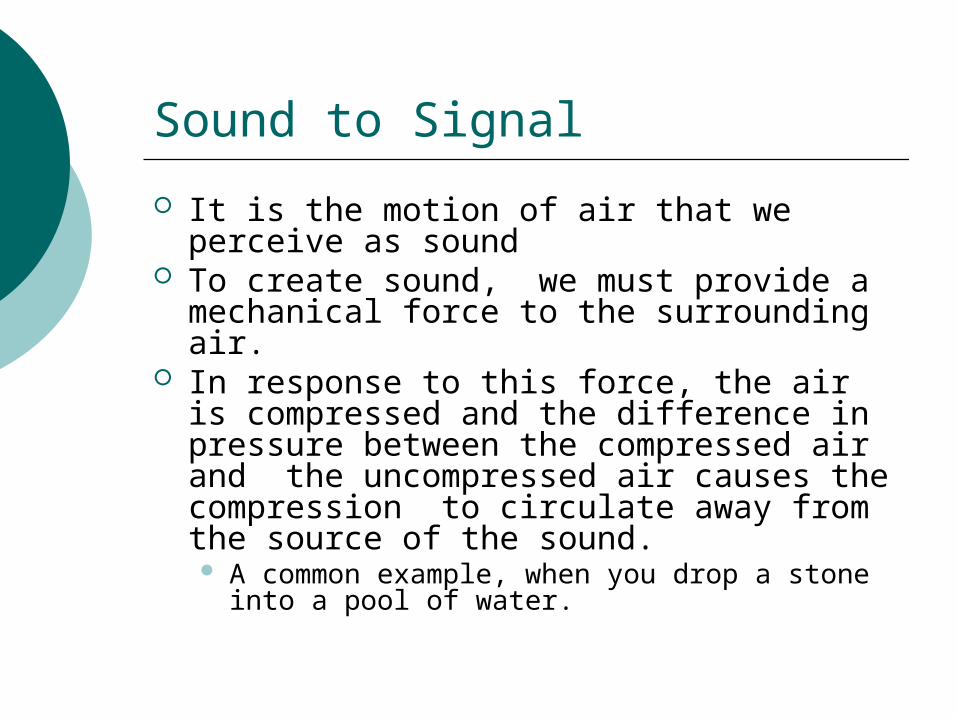
Sound to Signal
It is the motion of air that we perceive as sound
To create sound, we must provide a mechanical force to the surrounding air.
In response to this force, the air is compressed and the difference in pressure between the compressed air and the uncompressed air causes the compression to circulate away from the source of the sound. A common example, when you drop a stone
into a pool of water.

Drop a stone into water…
The water is compressed in the vicinity of the stone.
Due to the difference in pressure between the area where the stone has landed and the surrounding pool.
The compression begins to circulate outward, causing the familiar concentric ripples.

Frequency
Frequency is the measurement of the number of times that a repeated event occurs per unit time. To calculate the frequency, one fixes a time interval, counts the number of occurrences of the event within that interval, and then divides this count by the length of the time interval. The frequency, in hertz, is a
measurement of how rapidly the audio signal is changing.

Audio Signal
All audio signals are comprised of a sum of different [pure tones, each at a different frequency…an audio signal can be described in two different ways.
Time-domain description Frequency spectrum

Fourier
A French mathematician proved that all waveforms (musical, speech, i.e.) can be constructed of the sum of pure tones. The implication of this theory is that
every audio waveform can be built out of sinusoids at certain frequency
Sinusoidal signals have a frequency of repetition that determines the pitch of the tone.

Frequency Spectrum
Specifying which frequency components the signals contains and in what amount each frequency or pure tone occurs. The description of a signal is referred to
as the frequency-domain description.

Chapter 11
Sampling
Sampling Theorem

Sampling
The analog audio signal is a time-continuous waveform. The waveform is measured, or sampled, at periodic intervals.
These samples form a series of discrete amplitude pulses that, together and in sequence, form a representation of the continuous waveform.
http://www.mtsu.edu/~djbrown/Digital_Audio_Fundamentals.html

The Sampling Theorem
There must be enough samples to faithfully reproduce the frequency in question. We could take as many samples as possible, but there are reasons to limit the number:
Hardware limitations - hardware can only gather the samples so fast.
Storage limitations - the samples must be stored, and there is only so much room available to store the given samples. How many samples are needed? There must be
enough to accurately reproduce any and all frequencies in the original signal.

History of Sampling Research
1915 - E.T. Whitaker devised a proof showing that a band-limited function can be reconstructed from samples.
1920 - K. Ogura proved that if a function is sampled at a frequency at least twice the highest function frequency, it could be reconstructed from those samples.

History of Sampling Research
1928 - Bell Labs engineer Harry Nyquist published an article titled Certain topics in Telegraph Transmission Theory. In this article he provided proof that for complete signal construction, the frequency bandwidth is proportional to the signaling speed, and that the highest frequency is equal to half the number of code elements per second.
1949 - Claude Shannon unified many aspects of sampling, founded that larger science of information theory.

The Nyquist theorem states…
A continuous band-limited signal can be replaced by a discreet sequence of samples without loss of information, and the original signal can be reconstructed from those samples.
The sampling frequency must be at least twice the highest signal frequency.
More specifically, audio signals with frequencies between 0 and S/2 Hz can be exactly represented by S samples per second.

The Nyquist theorem states…
If there are at least two samples for a given frequency, that frequency can then be reproduced, since there is a sample for the positive and the negative portion of each cycle. The reproduction process can then recreate both sides of the cycle and, therefore, the reconstruct the given frequency.
The highest frequency S/2 that can be reproduced for a given sampling frequency S is known as the Nyquist frequency
If a frequency is sampled at less than two times per cycle, a different frequency will be reconstructed.

Sampling Intervals (Rate)
The sampling rate is the rate at which samples are taken from an analogue waveform during the analogue-to-digital conversion process. In order to prevent aliasing, the sampling rate should be at least twice the bandwidth of the signal being sampled. In communications systems, such as satellite communications, this means that the minimum sampling rate is limited by the bandwidth of the source signal.
http://satellite.argospress.com/ysamplrat.htm
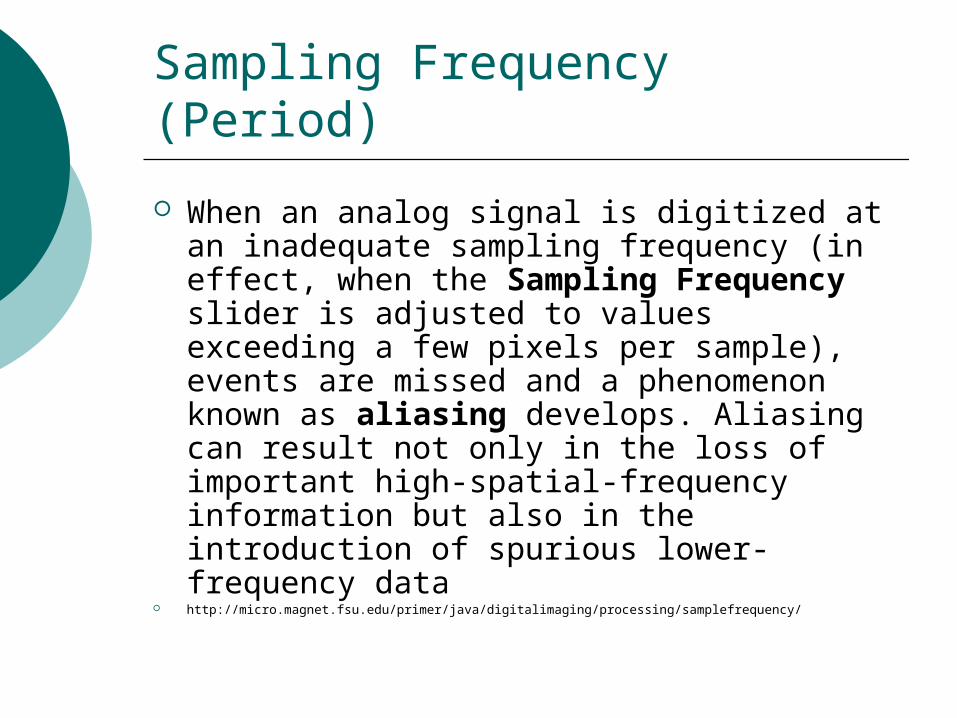
Sampling Frequency (Period)
When an analog signal is digitized at an inadequate sampling frequency (in effect, when the Sampling Frequency slider is adjusted to values exceeding a few pixels per sample), events are missed and a phenomenon known as aliasing develops. Aliasing can result not only in the loss of important high-spatial-frequency information but also in the introduction of spurious lower-frequency data
http://micro.magnet.fsu.edu/primer/java/digitalimaging/processing/samplefrequency/

Converting
Converting between sampling rate and sampling period
- fs =1/Ts - Ts = 1/fs
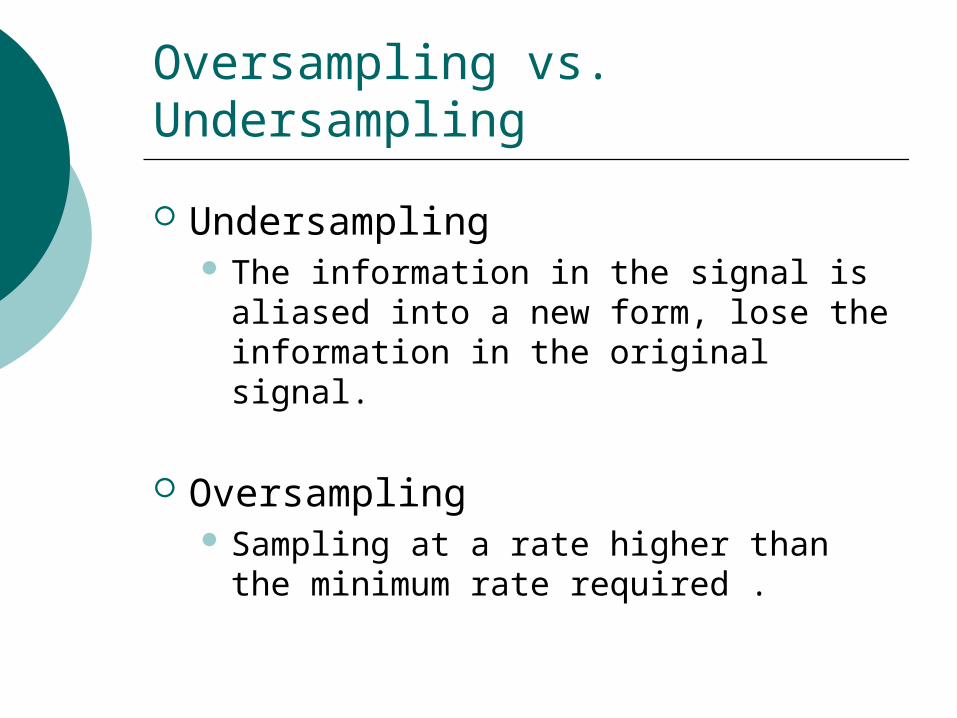
Oversampling vs. Undersampling
Undersampling The information in the signal is aliased
into a new form, lose the information in the original signal.
Oversampling Sampling at a rate higher than the
minimum rate required .
Chapter 12
Conversion Process
Quantization

The Conversion Process
The process of converting analog signals into digital representations involves creating a set of discreet values that correspond to the original signal. Amplitude measurements are taken at specific time intervals, and those measurements are converted into digital data.
The Conversion Process
The process is like placing the signal onto a grid. The x-axis is time and the y-axis is amplitude.
The process of taking measurements at specific time intervals is called sampling, and the process of assigning a value to those measurements is called quantization.
Quantization
After sampling, the modulated pulse chain is quantized. Quantization is the process of assigning a discreet value to each pulse.
The pulse is measured against a scale of discreet quantities. Its amplitude is assigned to the closest quantity.
The value is then given a binary number that can be stored or processed. The most common code for such storage and processing is Pulse Code Modulation (PCM).
The assignment of the value is an approximation - the measurement is "rounded off" to the closest predefined quantity. The greater the number of quantities, the closer the measurements will be.
The number of steps available in a binary system is equal to 2n, where an is the number of bits in the word used to represent the sample.
Analog-to-Digital Conversion (ADC)
This is a sample of the large number of analog-to-digital conversion methods. The basic principle of operation is to use the comparator principle to determine whether or not to turn on a particular bit of the binary number output. It is typical for an ADC to use a digital-to-analog converter (DAC) to determine one of the inputs to the comparator.
http://hyperphysics.phy-astr.gsu.edu/hbase/electronic/adc.html

Digital-to-Analog Conversion (DAC)
When data is in binary form, the 0's and 1's may be of several forms such as the TTL form where the logic zero may be a value up to 0.8 volts and the 1 may be a voltage from 2 to 5 volts. The data can be converted to clean digital form using gates which are designed to be on or off depending on the value of the incoming signal. Data in clean binary digital form can be converted to an analog form by using a summing amplifier. For example, a simple 4-bit D/A converter can be made with a four-input summing amplifier. More practical is the R-2R Network DAC.
http://hyperphysics.phy-astr.gsu.edu/hbase/electronic/dac.html#c1

Quantization Noise
With complex audio, like music, the error is spread over a larger amplitude and dynamic spectrum, and manifests more as noise.
Unlike analog noise, quantization noise only exists when signal is present, since it is the result of quantization error.

Quantization Error
There is error involved with quantization, due to the approximation of the level being quantized.
Error size will be a maximum of +/- half the amplitude of one quantizing interval. More bits make smaller intervals, and error is smaller as well.
Since the quantizing interval is constant, the maximum error is also constant.
As the signal level gets smaller, the signal-to-error ratio gets larger. Therefore, the error is more apparent with lower levels of audio.

Chapter 13
Analog Phone System
Digital Telephone System
Cellular System
Satellite Telephone

Analog vs Digital Phone Systems
Analog is the process of taking an audio or video signal (in most cases, the human voice) and translating it into electronic pulses.
Digital on the other hand is breaking the signal into a binary format where the audio or video data is represented by a series of "1"s and "0"s.
Simple enough when it's the device—analog or digital phone, fax, modem, or likewise—that does all the converting for you.

Terms to Know
PSTN Public Switched Telephone Network
AMPS Only system in US until 1977 Uses 800 MHz
GSM Group Special Mobile Originally a European standard Redefined to represent Global System for
Mobile Communication AMPS & GSM differ so that both systems may
operate simultaneously

Continued…
FDMA Frequency division multiple access
TDMA Time division multiple access
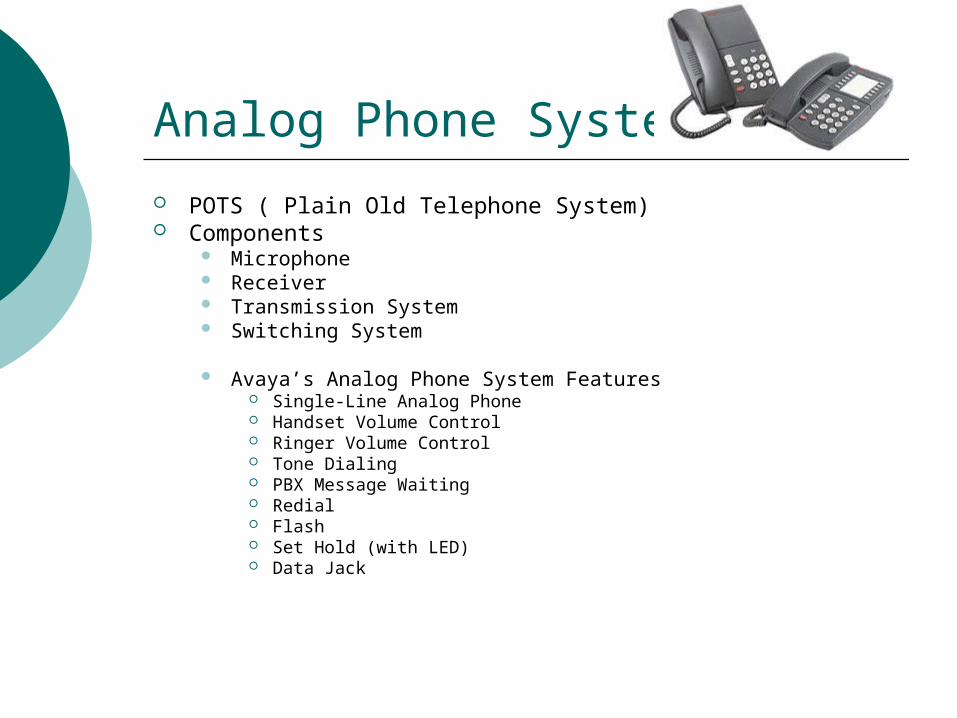
Analog Phone System
POTS ( Plain Old Telephone System) Components
Microphone Receiver Transmission System Switching System
Avaya’s Analog Phone System Features Single-Line Analog Phone Handset Volume Control Ringer Volume Control Tone Dialing PBX Message Waiting Redial Flash Set Hold (with LED) Data Jack
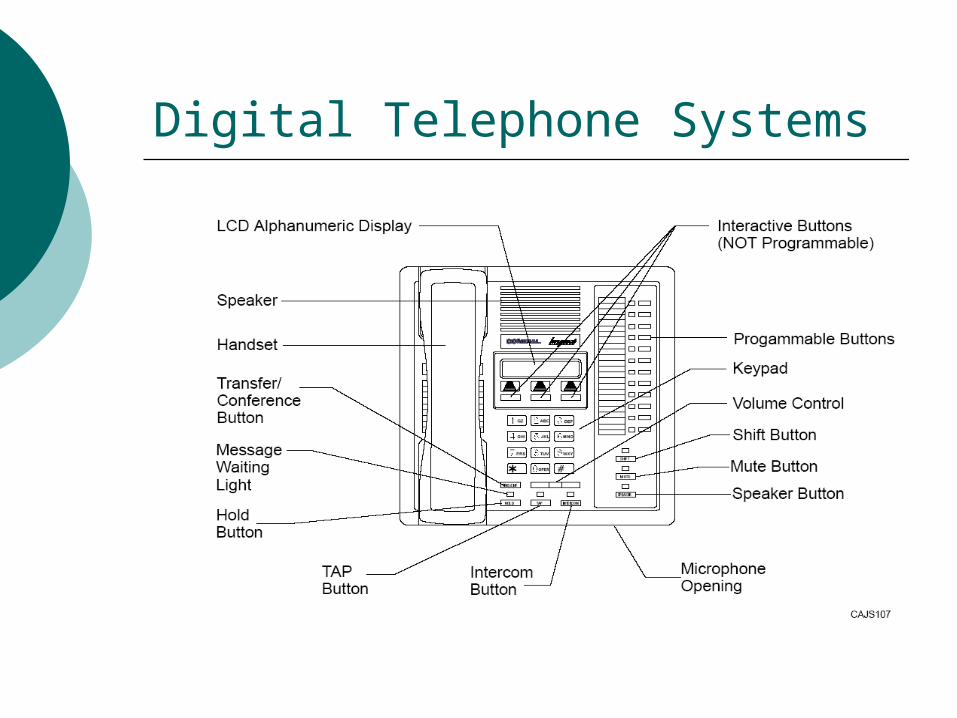
Digital Telephone Systems

Satellite Telephones

Cellular Systems
3rd Generation of Cellular Systems
Next Class
Please Read
Chapters 14 -15
Completed Homework Assignment #5
Related Documents


