1 iSTOXX R Europe Minimum Variance Index NR Rebalancing Report - 22-Oct-2018 Stock Statistics iSTOXX R Europe Minimum Variance Index NR rebalances each third Friday of the month.The new composition is implemented at the opening of the next business day after the third Friday - usually the next Monday. The weights are computed using closing prices three days prior to the third Friday. Both the iSTOXX R Europe Minimum Variance Index NR and the benchmark Stoxx Europe 600 Index NR are computed in EUR. The calculations in the document are performed by Ossiam using Stoxx/Datastream source. The number of constituents in the index decreased from 87 to 85. The Turnover is 48.18%, higher than its historical mean at 37.09%. The weight of the Index Core Portfolio decreased from 92.12% to 88.30%. Characteristics 22-Oct-2018 Number of Stocks 85 Added Stocks 17 Deleted Stocks 19 Core Number 68 Old weight of Core 92.12% New weight of Core 88.30% Turnover 48.18% Historical Turnover 37.09% Added and deleted stocks are relative to 22- Oct-2018. The Core is defined as the subset of stocks that belong to the current as well as the previous composition. Volatility/Weight profile The chart on the right shows the dis- tribution of the new iSTOXX R Europe Minimum Variance Index NR composition on 22-Oct-2018 in terms of annualized volatility (x-axis) and weight (y-axis). Volatility computed over 125 days ending on 16-Oct-2018. On the upper left corner we find low volatile stocks with big weight in the index. On the lower right corner we find high volatile stocks with low weight in the index. These stocks usually enter the index for diversification purposes. We distinguish between Core index and added stocks to appreciate how these newly added stock are positioned in terms of volatility and weight. FOR PROFESSIONAL CLIENTS USE ONLY

Welcome message from author
This document is posted to help you gain knowledge. Please leave a comment to let me know what you think about it! Share it to your friends and learn new things together.
Transcript
1
iSTOXX R© Europe Minimum Variance Index NRRebalancing Report - 22-Oct-2018
Stock Statistics
iSTOXX R© Europe Minimum Variance Index NR rebalanceseach third Friday of the month.The new composition isimplemented at the opening of the next business day afterthe third Friday - usually the next Monday. The weights arecomputed using closing prices three days prior to the thirdFriday. Both the iSTOXX R© Europe Minimum VarianceIndex NR and the benchmark Stoxx Europe 600 Index NRare computed in EUR. The calculations in the document areperformed by Ossiam using Stoxx/Datastream source.
The number of constituents in the index decreased from 87to 85. The Turnover is 48.18%, higher than its historicalmean at 37.09%. The weight of the Index Core Portfoliodecreased from 92.12% to 88.30%.
Characteristics 22-Oct-2018Number of Stocks 85Added Stocks 17Deleted Stocks 19Core Number 68Old weight of Core 92.12%New weight of Core 88.30%Turnover 48.18%Historical Turnover 37.09%
Added and deleted stocks are relative to 22-Oct-2018. The Core is defined as the subsetof stocks that belong to the current as wellas the previous composition.
Volatility/Weight profile
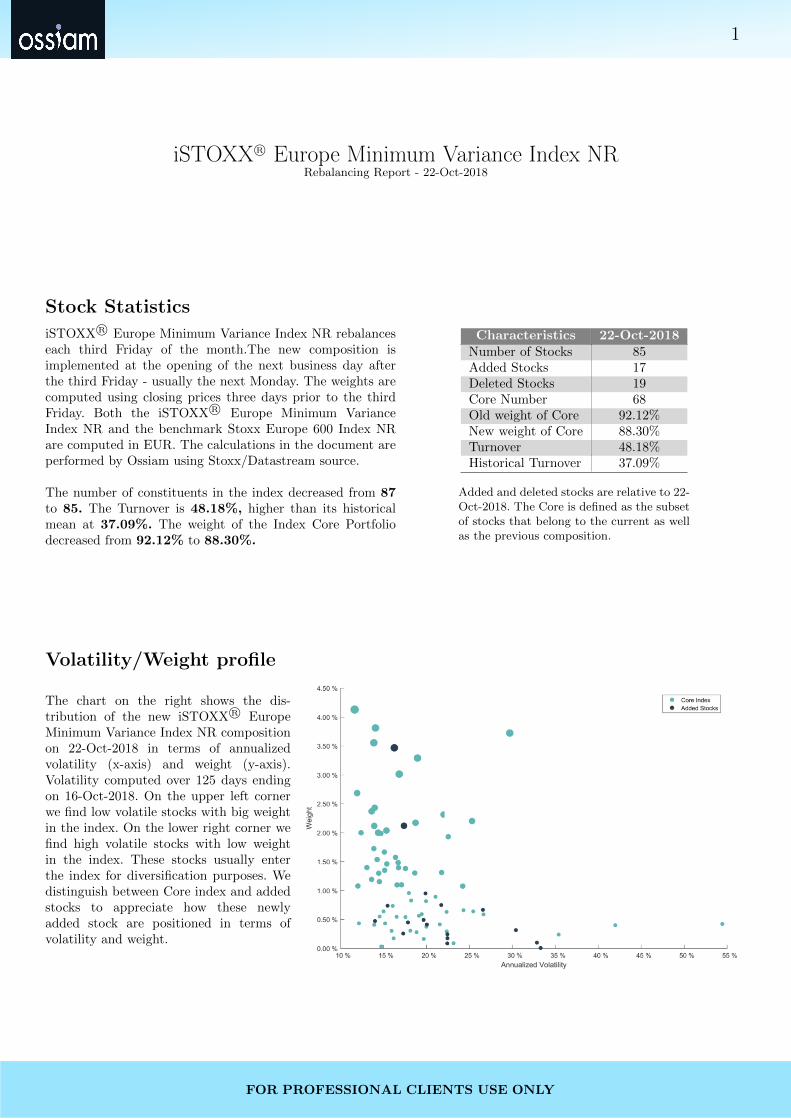
The chart on the right shows the dis-tribution of the new iSTOXX R© EuropeMinimum Variance Index NR compositionon 22-Oct-2018 in terms of annualizedvolatility (x-axis) and weight (y-axis).Volatility computed over 125 days endingon 16-Oct-2018. On the upper left cornerwe find low volatile stocks with big weightin the index. On the lower right corner wefind high volatile stocks with low weightin the index. These stocks usually enterthe index for diversification purposes. Wedistinguish between Core index and addedstocks to appreciate how these newlyadded stock are positioned in terms ofvolatility and weight.
FOR PROFESSIONAL CLIENTS USE ONLY

2
Sector Allocation
The most significant changes in sector expo-sures are: 3.39% for C.Services, -2.31% forIndustrials, -1.71% for Materials. The biggestsector exposures are: 20.00% for Financials, 20.00% for C.Goods , 17.88% for C.Services .
PREV. CURR. Diff.C.Goods 20.85% 20.00% -0.85%C.Services 14.49% 17.88% 3.39%Financials 20.60% 20.00% -0.60%HealthCare 10.33% 10.54% 0.21%Industrials 11.07% 8.76% -2.31%Materials 10.67% 8.96% -1.71%Oil - Gas 2.29% 2.82% 0.53%Technology 1.33% 1.35% 0.02%Telecom. 2.82% 4.12% 1.30%Utilities 5.55% 5.58% 0.03%
The left-hand side of the chart below shows the sector deviations at rebalancing. Differences are shown on the right-hand side. Indexweights are taken as of 19-Oct-2018 (last business day before the new composition is implemented) compared to the new rebalancingweights as of 22-Oct-2018.
Sector breakdown vs. benchmark
The iSTOXX R© Europe Minimum Variance Index NRoverweights C.Services by 11.53% and C.Goods by 2.28%compared to Stoxx Europe 600 Index NR. The iSTOXX R©Europe Minimum Variance Index NR underweights Industri-als by -5.36% and Oil - Gas by -4.60% compared to StoxxEurope 600 Index NR.
Vol.B S Diff. B S
C.Goods 17.72% 20.00% 2.28% 10.77% 8.79%C.Services 6.35% 17.88% 11.53% 10.49% 9.53%Financials 21.55% 20.00% -1.55% 11.66% 8.67%HealthCare 13.88% 10.54% -3.34% 11.77% 10.42%Industrials 14.12% 8.76% -5.36% 12.77% 9.68%Materials 6.93% 8.96% 2.03% 15.48% 13.98%Oil - Gas 7.41% 2.82% -4.60% 16.87% 20.94%Technology 5.22% 1.35% -3.88% 16.44% 20.47%Telecom. 3.18% 4.12% 0.93% 12.79% 11.66%Utilities 3.62% 5.58% 1.96% 12.64% 12.81%
The table above shows, for each sector, the weight in the iSTOXX R© Europe Minimum Variance Index NR (S), in the benchmarkStoxx Europe 600 Index NR (B) and their difference. We also show the annualized volatility of each sector in the iSTOXX R©Europe Minimum Variance Index NR and in the benchmark. Annualized volatilities are computed using 125 business days endingon 16-Oct-2018
FOR PROFESSIONAL CLIENTS USE ONLY

3
Country Allocation
The most significant changes in country ex-posures are: 2.53% for GB, -1.60% for FR,1.45% for DE. The biggest country exposuresare: 31.54% for GB , 18.54% for FR , 10.49%for CH .
PREV. CURR. Diff.AT 0.65% 0.89% 0.24%BE 4.14% 2.91% -1.23%CH 10.58% 10.49% -0.09%DE 7.05% 8.51% 1.45%DK 6.04% 6.18% 0.14%ES 2.68% 2.11% -0.57%FI 2.55% 1.95% -0.60%FR 20.14% 18.54% -1.60%GB 29.01% 31.54% 2.53%IT 3.73% 2.86% -0.88%NL 10.00% 10.04% 0.03%NO 2.92% 3.98% 1.06%PL - 0.01% 0.01%SE 0.50% - -0.50%
The left-hand side of the chart below shows the country deviations at rebalancing. Differences are shown on the right-hand side.Index weights are taken as of 19-Oct-2018 (last business day before the new composition is implemented) compared to the newrebalancing weights as of 22-Oct-2018.
Country breakdown vs. benchmark
FOR PROFESSIONAL CLIENTS USE ONLY

4
The iSTOXX R© Europe Minimum Variance Index NR overweightsNL by 5.05% and GB by 4.26% compared to Stoxx Europe 600Index NR. The iSTOXX R© Europe Minimum Variance Index NRunderweights DE by -6.12% and SE by -4.40% compared toStoxx Europe 600 Index NR.
Vol.B S Diff. B S
AT 0.40% 0.89% 0.49% 15.75% 21.07%BE 1.82% 2.91% 1.08% 11.90% 15.12%CH 13.05% 10.49% -2.56% 10.27% 9.31%DE 14.63% 8.51% -6.12% 13.18% 10.31%DK 2.64% 6.18% 3.54% 13.91% 13.24%ES 4.64% 2.11% -2.52% 13.27% 13.48%FI 1.86% 1.95% 0.09% 12.85% 12.75%FR 17.22% 18.54% 1.33% 11.19% 8.71%GB 27.28% 31.54% 4.26% 10.49% 8.50%IE 0.95% - -0.95% 12.32% -IT 3.85% 2.86% -0.99% 17.34% 12.14%LU 0.33% - -0.33% 23.29% -NL 4.98% 10.04% 5.05% 10.86% 9.42%NO 1.26% 3.98% 2.73% 15.45% 16.07%PL 0.45% 0.01% -0.44% 20.86% 33.30%PT 0.26% - -0.26% 13.67% -SE 4.40% - -4.40% 13.86% -
The table above shows, for each country, the weight in the iSTOXX R© Europe Minimum Variance Index NR (S), in the benchmarkStoxx Europe 600 Index NR (B) and their difference. We also show the annualized volatility of each country in the iSTOXX R©Europe Minimum Variance Index NR and in the benchmark. Annualized volatilities are computed using 125 business days endingon 16-Oct-2018
FOR PROFESSIONAL CLIENTS USE ONLY

5Added Stocks
The rebalancing has added 17 new stocks. In the table below, T is the current rebalancing date (22-Oct-2018), while T-1 is the previous rebalancing date (24-Sep-2018). Vol(T-1) and Vol(T) are the annualized volatilities computed over 125 business days ending, respectively, on 16-Oct-2018 and 18-Sep-2018. The average dailyvolumes ADV(T-1) and ADV(T), expressed in mln EUR, are computed over 50 business days ending on the same dates as before, with the relative ranking overthe benchmark Stoxx Europe 600 Index NR. WW(T) is the stock weight at the current rebalancing date. Finally, the column Reason Excl. details the reasons ofexclusion at the previous rebalancing.
Vol ADVName Sector Country WW(T) T-1 T T-1 T Reason Exclusion
ACCOR C.Services FR 0.45% 17.82% 17.86% 32.87(189) 33.86(199) Excl. Minimum VarianceAROUNDTOWN Financials DE 3.47% 14.61% 16.27% 16.10(365) 26.72(254) Excl. LiquidityASSOCIATED BRIT.FDS.PLC. C.Goods GB 0.95% 20.67% 19.90% 30.16(215) 27.29(250) Excl. Minimum VarianceBUNZL PLC. Industrials GB 0.74% 14.12% 15.49% 20.10(302) 23.20(292) Excl. LiquidityGVC HOLDINGS PLC. C.Services GB 0.67% 26.57% 26.59% 28.42(223) 28.38(238) Excl. Minimum VarianceINGENICO GROUP Technology FR 0.32% 30.78% 30.42% 31.64(198) 29.09(231) Excl. Minimum VarianceNATIONAL GRID PLC. Utilities GB 0.26% 17.32% 17.31% 56.80(114) 63.61(111) Excl. Minimum VarianceNORSK HYDRO ASA Materials NO 0.10% 30.62% 32.87% 26.94(237) 36.05(185) Excl. Minimum VariancePLKNC.NAFTOWY ORLEN Oil - Gas PL 0.01% 33.82% 33.30% 16.62(359) 22.85(293) Excl. LiquidityPUBLICIS GROUPE SA C.Services FR 0.09% 24.66% 22.44% 38.29(166) 33.87(198) Excl. Minimum VarianceRENAULT SA C.Goods FR 0.49% 21.99% 19.68% 75.94(82) 76.17(92) Excl. Minimum VarianceSHIRE PLC. HealthCare GB 2.12% 29.95% 17.39% 91.89(65) 102.07(62) Excl. Minimum VarianceSODEXO C.Services FR 0.75% 31.55% 21.74% 30.79(206) 28.73(235) Excl. Minimum VarianceSUEZ CO. Utilities FR 0.24% 23.07% 22.45% 21.70(286) 22.17(300) Excl. Minimum VarianceSWISS RE AG Financials CH 0.47% 15.10% 14.02% 78.07(78) 89.64(75) Excl. Minimum VarianceVIVENDI C.Services FR 0.41% 20.75% 20.06% 73.31(86) 74.10(96) Excl. Minimum VarianceYARA INTERNATIONAL ASA Materials NO 0.18% 23.58% 22.46% 21.89(283) 23.80(283) Excl. Minimum Variance
FO
RP
RO
FE
SS
ION
AL
CL
IEN
TS
US
EO
NLY

6Deleted Stocks
The rebalancing has deleted 19 new stocks. In the table below, T is the current rebalancing date (22-Oct-2018), while T-1 is the previous rebalancing date (24-Sep-2018). Vol(T-1) and Vol(T) are the annualized volatilities computed over 125 business days ending, respectively, on 16-Oct-2018 and 18-Sep-2018. The average dailyvolumes ADV(T-1) and ADV(T), expressed in mln EUR, are computed over 50 business days ending on the same dates as before, with the relative ranking overthe benchmark Stoxx Europe 600 Index NR. WW(T-1) is the stock weight at the previous rebalancing date. Finally, the column Reason Excl. details the reasons ofexclusion at the current rebalancing.
Vol ADVName Sector Country WW(T-1) T-1 T T-1 T Reason Exclusion
ANTOFAGASTA PLC. Materials GB 0.36% 30.23% 32.03% 28.17(226) 33.01(206) Excl. Minimum VarianceBERKELEY GROUP HDG.PLC. C.Goods GB 0.94% 18.50% 20.76% 22.34(280) 20.80(319) Excl. LiquidityFORTUM OYJ Utilities FI 0.05% 18.42% 19.93% 27.03(235) 29.57(228) Excl. Minimum VarianceHERMES INTERNATIONAL C.Goods FR 0.24% 18.14% 20.67% 30.50(210) 37.61(177) Excl. Minimum VarianceHEXAGON AB Technology SE 0.23% 20.17% 21.42% 30.34(213) 30.41(225) Excl. Minimum VarianceKBC GROEP NV Financials BE 0.03% 17.33% 18.84% 43.60(146) 49.51(141) Excl. Minimum VarianceKONINKLIJKE KPN NV Telecom. NL 0.51% 18.42% 20.18% 34.04(183) 33.55(200) Excl. Minimum VarianceKUEHNE+NAGEL INTL.G Industrials CH 1.89% 14.05% 15.98% 20.68(294) 20.01(331) Excl. LiquidityLEGAL & GENERAL Financials GB 0.19% 13.95% 14.98% 43.54(147) 45.40(153) Excl. Minimum VarianceLOGITECH INTL.SA Technology CH 0.10% 20.63% 22.19% 26.40(240) 28.23(241) Excl. Minimum VarianceNOVO NORDISK A/S HealthCare DK 0.92% 21.82% 24.39% 86.31(68) 95.78(69) Excl. Minimum VariancePARTNERS GROUP HOLDING Financials CH 0.30% 14.38% 16.13% 30.65(208) 34.32(197) Excl. Minimum VarianceRELX PLC. C.Services GB 0.32% 14.10% 15.92% 97.74(61) 117.00(50) Excl. Minimum VarianceSCA AB Materials SE 0.27% 20.92% 22.78% 22.61(278) 23.61(287) Excl. Minimum VarianceSGS SA Industrials CH 0.01% 14.33% 16.69% 31.39(199) 33.21(202) Excl. Minimum VarianceSWISS LIFE HOLDING AG Financials CH 0.13% 13.21% 13.91% 43.21(150) 52.91(132) Excl. Minimum VarianceTAYLOR WIMPEY PLC. C.Goods GB 0.76% 17.36% 19.85% 22.99(274) 19.91(333) Excl. LiquidityVONOVIA SE PRE Financials DE 0.63% 15.33% 16.58% 59.27(107) 67.25(107) Excl. Minimum VarianceWOLTERS KLUWER NV C.Services NL 0.01% 15.49% 17.17% 39.60(160) 39.53(169) Excl. Minimum Variance
FO
RP
RO
FE
SS
ION
AL
CL
IEN
TS
US
EO
NLY

7Ranking Index Constituents - Top 25
The table shows the top 25 positions in the iSTOXX R© Europe Minimum Variance Index NR as of 22-Oct-2018. The column WW indicates the weights in theiSTOXX R© Europe Minimum Variance Index NR as of 22-Oct-2018. The column Vol gives the annualized volatility computed over 125 business days ending on16-Oct-2018. We also provide the ranking of these volatilities (Rank Vol) relative to the Filtered Selection at the rebalancing date. The column Corr gives the averagecorrelation of each stock relative to the rest of the filtered selection, computed over 500 business days ending on 16-Oct-2018. We also provide the ranking of thesecorrelations (Rank Corr) relative to the Filtered Selection at the rebalancing date. The Rank Blend is computed as 66% Rank Vol + 34% Rank Corr. The lowerthe stock’s Rank Blend, the higher the likelihood that the stock will be overweighted in the Index. Finally, the column Core shows whether the stock was in theiSTOXX R© Europe Minimum Variance Index NR already (YES) or it entered at this rebalancing (NO).
Sector Country WW Vol Rank Vol Corr Rank Corr Rank Blend CoreMORRISON(WM)SPMKTS.PLC. C.Services GB 4.13% 11.66% 7 16.28% 154 56 YESAKZO NOBEL NV Materials NL 3.81% 14.07% 30 17.28% 187 83 YESRANDGOLD RESOURCES LTD. Materials GB 3.72% 29.71% 490 2.02% 3 324 YESCARLSBERG AS C.Goods DK 3.55% 13.89% 22 16.26% 153 66 YESAROUNDTOWN Financials DE 3.47% 16.27% 78 11.19% 39 64 NOTESCO PLC. C.Services GB 3.29% 18.98% 176 9.01% 22 123 YESKON.AHOLD DLHZ.NV C.Services NL 3.01% 16.84% 97 10.02% 27 73 YESNESTLE AG C.Goods CH 2.69% 11.94% 8 20.58% 329 117 YESUNILEVER PLC. C.Goods GB 2.43% 13.98% 27 15.93% 143 66 YESUNILEVER DUTCH CERT. C.Goods NL 2.37% 13.63% 20 16.59% 164 68 YESMARINE HARVEST ASA C.Goods NO 2.31% 22.01% 297 9.81% 26 204 YESVESTAS WINDSYSTEMS A/S Oil - Gas DK 2.20% 25.32% 401 10.76% 33 275 YESUCB SA HealthCare BE 2.17% 18.74% 169 15.03% 111 149 YESSHIRE PLC. HealthCare GB 2.12% 17.39% 110 15.26% 124 114 NOAXA Financials FR 2.12% 13.93% 25 21.38% 366 140 YESLLOYDS BANKING GP.PLC. Financials GB 2.04% 15.36% 63 18.26% 226 118 YESESSILORLUXOTTICA SA HealthCare FR 2.00% 14.38% 39 19.12% 273 118 YESGEBERIT AG Industrials CH 2.00% 12.40% 12 26.08% 530 188 YESROCHE HOLDING AG HealthCare CH 1.99% 14.71% 46 19.33% 287 127 YESPEARSON PLC. C.Services GB 1.93% 22.55% 322 11.89% 52 230 YESPERNOD-RICARD C.Goods FR 1.72% 13.89% 21 19.90% 308 118 YESDT.WHN.SE Financials DE 1.66% 15.11% 55 14.97% 108 73 YESDEUTSCHE BOERSE AG Financials DE 1.57% 16.41% 81 19.31% 284 150 YESHSBC HOLDINGS PLC. Financials GB 1.54% 14.27% 36 21.45% 370 149 YESBAE SYSTEMS PLC. Industrials GB 1.48% 16.71% 93 20.75% 338 176 YES
FO
RP
RO
FE
SS
ION
AL
CL
IEN
TS
US
EO
NLY

8
DISCLAIMERS
This document is of a commercial and not of a regulatory nature.
Ossiam, a subsidiary of Natixis Investment Managers, is a French asset manager authorized by the Au-torite des Marches Financiers (Agreement No. GP-10000016). Although information contained herein is fromsources believed to be reliable, Ossiam makes no representation or warranty regarding the accuracy of anyinformation of which it is not the source. The information presented in this document is based on marketdata at a given moment and may change from time to time.
This material has been prepared solely for informational purposes only and it is not intended to be and shouldnot be considered as an offer, or a solicitation of an offer, or an invitation or a personal recommendation tobuy or sell participating shares in any Ossiam Fund, or any security or financial instrument, or to participatein any investment strategy, directly or indirectly. It is intended for use only by those recipients to whom it ismade directly available by Ossiam. Ossiam will not treat recipients of this material as its clients by virtue oftheir receiving this material.
This material reflects the views and opinions of the individual authors at this date and in no way the officialposition or advices of any kind of these authors or of Ossiam and thus does not engage the responsibility ofOssiam nor of any of its officers or employees. Past performance is not a guide to future performance. Anyopinions expressed herein are statements of our judgment on this date and are subject to change withoutnotice. Ossiam assume no fiduciary responsibility or liability for any consequences, financial or otherwise,arising from, an investment in any security or financial instrument described herein or in any other security,or from the implementation of any investment strategy. This information contained herein is not intended fordistribution to, or use by, any person or entity in any country or jurisdiction where to do so would be contraryto law or regulation or which would subject Ossiam to any registration requirements in these jurisdictions.The risks associated with the Fund and the Index are detailed in the “General Risk Considerations’ sectionof the Prospectus, available in English on www.ossiam.com. Investments decision should only be made on thebasis of the Prospectus. Investors should also be well informed about the main characteristics of the Index(number of stocks, sector and or country breakdown, past evolution...) in order to have an overview of therisks and opportunities related to an exposure to the Index.
The STOXX R© Indices and the data composed therein (the Index Data) are the intellectual property (in-cluding registered trademarks) of STOXX Limited, Zurich, Switzerland (STOXX) and/or its licensors (theSTOXX Licensors). The use of the Index Data requires a license from STOXX. STOXX and the STOXXLicensors do not make any warranties or representations, express or implied with respect to the timeliness,sequency, accuracy, completness, currentness, merchantability, quality or fitness for any particular purposeof the Index Data. In particular, the inclusion of a company in a STOXX R© Index does not in any wayreflect an opinion of STOXX or the STOXX Licensors on the merits of that company. STOXX and theSTOXX Licensors are not providing investment, tax or other professional advice through the publication ofthe STOXX R© Indices or in connection there with STOXX and its licensors have no relationship to Ossiam,other than the licensing of the iSTOXX R© Europe Minimum Variance Index and the related trademarks foruse in connection with OSSIAM ETF indexed to the Index.STOXX and its Licensors do not sponsor, endorse, sell or promote the OSSIAM UCITS ETF iStoxx EuropeMinimum Variance Index NR.This material may not be distributed, published, or reproduced, in whole or in part.
FOR PROFESSIONAL CLIENTS USE ONLY
Related Documents