Issues on Estimating Software Metrics in a Large Software Operation Rodrigo C. Barros, Duncan D. Ruiz, Nelson N. Tenório Jr. Faculty of Informatics Pontifical Catholic University of Rio Grande do Sul Porto Alegre, Brazil {rodrigo.barros, duncan, nelson.tenorio}@pucrs.br Márcio P. Basgalupp Institute of Math Sciences and Computing University of São Paulo São Carlos, Brazil [email protected] Karin Becker Quality Knowledge Ltda. Porto Alegre, Brazil [email protected] Abstract—Software engineering metrics prediction has been a challenge for researchers throughout the years. Several approaches for deriving satisfactory predictive models from empirical data have been proposed, although none has been massively accepted due to the difficulty of building a generic solution applicable to a considerable number of different software projects. The most common strategy on estimating software metrics is the linear regression statistical technique, for its ease of use and availability in several statistical packages. Linear regression has numerous shortcomings though, which motivated the exploration of many techniques, such as data mining and other machine learning approaches. This paper reports different strategies on software metrics estimation, presenting a case study executed within a large worldwide IT company. Our contributions are the lessons learned during the preparation and execution of the experiments, in order to aid the state of the art on prediction models of software development projects. Keywords- software metrics estimation; machine learning; linear regression; human judgment approaches I. INTRODUCTION Software projects are failing due to poor project management and planning practices, especially in companies with immature development processes, which experience difficulties for schedule control, budget miscalculations and considerable financial losses within projects’ lifecycle. Process improvement models such as CMMI [1] and Six Sigma [2] incorporate best practices in defined levels, in order to provide the means by which a software company can achieve maturity and capacity in its development process. In a high-level vision, such process improvement models suggest the establishment of a metrics repository, which can provide the basis for process analysis, control and estimation. Software organizations have longed for realistic estimates of software development variables. To date, many software engineering predictive models have been developed to predict costs, effort, schedule and quality of software under development. However, software development practices have evolved enormously within the last years, which made impracticable the establishment of a single model that would continue to yield high accuracy prediction levels. With that in mind, many researchers addressed the problem looking for strategies that could result in consistent predictive models, which could eventually be generalized for different software projects. In this paper, we present an empirical study on software estimation dealing with three distinct approaches: expert judgment, least square linear regression based models and data mining regression tree models. This study was developed in Hewlett-Packard Enterprise Application Services Brazil (from now on referred to as HP- EAS), a multi-national IT company that seeks to improve the quality of its development process through better estimates. We hope the results presented here can serve as basis and guidance for building and deriving predictive models, hence contributing with the state of the art in the subject. We also hope the issues we have faced will be addressed in similar future projects. The remaining of this paper is organized as follows. Section II reviews software estimation models and model- building techniques. Section III presents the scenario on which the case study was executed. Section IV details the experimentation plan adopted in our experiments. Section V reports the execution of the experiments, and compares the results achieved by different estimation approaches with the current organization’s strategy. Section VI summarizes the lessons learned with the experiments’ execution, whereas Section VII presents conclusions and future work. II. SOFTWARE ESTIMATION APPROACHES We divided the existent software estimation work in four different classes:

Welcome message from author
This document is posted to help you gain knowledge. Please leave a comment to let me know what you think about it! Share it to your friends and learn new things together.
Transcript
Issues on Estimating Software Metrics in a Large Software Operation
Rodrigo C. Barros, Duncan D. Ruiz, Nelson N. Tenório Jr. Faculty of Informatics
Pontifical Catholic University of Rio Grande do Sul Porto Alegre, Brazil
{rodrigo.barros, duncan, nelson.tenorio}@pucrs.br
Márcio P. Basgalupp Institute of Math Sciences and Computing
University of São Paulo São Carlos, Brazil
Karin Becker Quality Knowledge Ltda.
Porto Alegre, Brazil [email protected]
Abstract—Software engineering metrics prediction has been a challenge for researchers throughout the years. Several approaches for deriving satisfactory predictive models from empirical data have been proposed, although none has been massively accepted due to the difficulty of building a generic solution applicable to a considerable number of different software projects. The most common strategy on estimating software metrics is the linear regression statistical technique, for its ease of use and availability in several statistical packages. Linear regression has numerous shortcomings though, which motivated the exploration of many techniques, such as data mining and other machine learning approaches. This paper reports different strategies on software metrics estimation, presenting a case study executed within a large worldwide IT company. Our contributions are the lessons learned during the preparation and execution of the experiments, in order to aid the state of the art on prediction models of software development projects.
Keywords- software metrics estimation; machine learning; linear regression; human judgment approaches
I. INTRODUCTION Software projects are failing due to poor project
management and planning practices, especially in companies with immature development processes, which experience difficulties for schedule control, budget miscalculations and considerable financial losses within projects’ lifecycle.
Process improvement models such as CMMI [1] and Six Sigma [2] incorporate best practices in defined levels, in order to provide the means by which a software company can achieve maturity and capacity in its development process. In a high-level vision, such process improvement models suggest the establishment of a metrics repository, which can provide the basis for process analysis, control and estimation.
Software organizations have longed for realistic estimates of software development variables. To date, many software engineering predictive models have been developed
to predict costs, effort, schedule and quality of software under development. However, software development practices have evolved enormously within the last years, which made impracticable the establishment of a single model that would continue to yield high accuracy prediction levels.
With that in mind, many researchers addressed the problem looking for strategies that could result in consistent predictive models, which could eventually be generalized for different software projects.
In this paper, we present an empirical study on software estimation dealing with three distinct approaches: expert judgment, least square linear regression based models and data mining regression tree models.
This study was developed in Hewlett-Packard Enterprise Application Services Brazil (from now on referred to as HP-EAS), a multi-national IT company that seeks to improve the quality of its development process through better estimates. We hope the results presented here can serve as basis and guidance for building and deriving predictive models, hence contributing with the state of the art in the subject. We also hope the issues we have faced will be addressed in similar future projects.
The remaining of this paper is organized as follows. Section II reviews software estimation models and model-building techniques. Section III presents the scenario on which the case study was executed. Section IV details the experimentation plan adopted in our experiments. Section V reports the execution of the experiments, and compares the results achieved by different estimation approaches with the current organization’s strategy. Section VI summarizes the lessons learned with the experiments’ execution, whereas Section VII presents conclusions and future work.
II. SOFTWARE ESTIMATION APPROACHES We divided the existent software estimation work in four
different classes:

• Expertise-based Models: based on human judgment, where estimates are provided considering the experience of human-resources;
• Parametric Empirical Models: provide estimates through the insertion of parameters in different equations, derived through historical data or human expertise;
• Regression Models: provide estimates through regression models, with single or multiple variables, and generates equations based on the previous behavior of metrics collected from the companies’ databases. The most common approaches are the linear and robust regressions;
• Data Mining and Machine Learning Approaches: provide estimates through intelligence (or mining) based models.
A. Parametric Empirical Models The initial attempts on building predictive models were
such as SLIM [3], COCOMO (Constructive Cost Model) [4] and more recently COCOMO 2 [5]. They are all grounded on empirical data in order to calibrate specific equations to predict one or other software metric. Inputs to these models may include the experience of the development team, the degree of domain knowledge and the percentage of code reusability, among others.
The calibration process of the empirical models is the key to the achievement of high accuracy levels. Calibrating a model means to extract knowledge from historical data, generally stored in databases, with the purpose of defining a common ground for the estimating process. In other words, the constants and other attributes that will guide each equation of an empirical model are previously mapped from the organization’s historical data, thus the name empirical.
Different calibration methods were proposed in the literature. COCOMO was calibrated through an approach of linear regression with multiple variables, while COCOMO 2 achieved better results with a Bayesian approach [6]. SLIM relies on surveys within the organization environment for the cases where no historical data is available [3].
The main shortcoming of empirical models is the laborious task of calibrating the model. Whilst it may seem simple to gather data from similar software projects, this task is not trivial at all. This is consequence mainly of the distinctiveness of software projects, where unpredictable variables show up often, generating distorted parameters and making the reproducibility of results hardly feasible.
B. Linear Regression Bearing in mind the necessity of simple-to-handle
models, the most common approach for deriving predictive models from empirical data is the least square linear regression (LSLR) [7]. LSLR basically consists of a set of variables called explanatory or independent, which can together explain or derive a single dependent variable, in this case our estimating target (1):
(1)
where y is the dependent variable of the i observation, B … B are coefficients estimated through a least squares criterion, x is one of the independent variables for the i observation and e is a random variable used for representing a probability distribution (i.e., normal) to indicate the variability of the process.
The approach is very attractive due to its simplicity, but it has its downfalls. The first and more obvious one is the need of large amounts of quality data available, which is not a reality for most software companies [6].
Another drawback of linear regression is the sensibility of the technique to extreme cases (e.g., outliers), which can distort parameters estimates. Outliers are common in this context, mainly due to the unstable process of software metrics collection [6]. The aforementioned implies the need of data pre-processing in order to remove the identified outliers, a task that can be time-consuming and exponentially complex.
Co-linearity of variables, that is, the high correlation values identified between independent variables, is also a major issue in regression-based software estimation. The number of independent variables is usually not high when considering software metrics, and consequently it is hard to discard any of these explanatory variables. When they share high correlation values though, not discarding one of them inflates the error term of estimates, leading to less reliable models [7].
C. Data Mining and Machine Learning Approaches The difficulties acknowledged in a linear regression
approach induced the search for new strategies on building software metrics predictive models. Machine learning and data mining techniques, such as neural networks, fuzzy logic, case-based reasoning and classification and regression trees, have been considered for deriving accurate models in response to the shortcomings of the regression-based approaches.
Neural networks, in particular, have been considerably explored in the software estimation domain. Backpropagation trained feed-forward neural networks are the most common model-building technique in the literature as an alternative to LSLR [7]. They are developed by defining a set of neurons, which are distributed over several layers. Each input to a certain neuron is processed according to a particular transfer function, and the correspondent output is propagated. The neural network learns by adjusting the weights that represent each neuron connection, in order to decrease the distance between the actual values and the previously estimated ones. The training process continues until the network can generalize its results for different data, which is measured through the network performance over the training data.

One may argue that whereas neural networks provide solid accurate results in different software projects, it is also considered a “black-box”, because the means by which are achieved the final results are not explicit. Meaningfulness and interpretability of the process that led a certain metric to achieve a specific value is essential for project managers to be able to make decisions. In this case, accuracy comes at the expense of interpretable results.
Works such as [8] and [9] are examples of software effort and cost estimation based on neural networks. Shukla and Misra [8] aim at software maintenance projects, and validate their approach through the mean magnitude of the relative error (MMRE), which was considered low in their experiments. Tadayon [9] relates a neural network approach to COCOMO 2, providing a hybrid optimal model representation, which is yet to be tested in real data.
Fuzzy logic and case-based reasoning systems addressed the neural networks problem of results’ interpretability, though the accuracy level of such models was not a match for the neural approaches. Thus, the power of interpretation comes at the expense of accuracy.
One example of a case-based reasoning system for predicting software metrics is ESTOR [10], which was compared to a human expert and to COCOMO for predicting software effort. ESTOR displayed better results than COCOMO, confirming the feasibility of such systems in the software estimation context. Examples of models built over fuzzy logic systems can be found at [11-13].
Decision and regression trees were also explored on software metrics prediction. Regression trees, in particular, are well-suited for the metrics domain because of its solid dealing with numeric continuous attributes. They usually incorporate a top-down approach for analyzing which of the data attributes better split the dataset into heterogeneous pieces. The tree-constructing algorithm looks at which attributes can be used to best classify the data and iteratively constructs the tree, splitting nodes when required. This method has the advantage of being easily interpretable, and therefore allows for the verification of logical errors [7].
Khoshgoftaar et al. [14] employ the regression CART algorithm [15] to predict software defects, and how long a prediction model can resist throughout the project lifecycle until it loses significance. Other related work is [16], where the authors compare a regression tree based prediction model with a density of defect metric, given by the ratio of documents called change reports and system LOC (lines of code). The regression tree model showed better results in all the experimental cases presented.
III. SCENARIO DESCRIPTION This paper describe experiments that compare three
different approaches to software metrics prediction: human expertise, linear regression and a data mining regression tree algorithm. The experiment was conducted within the largest software maintenance project of HP-EAS. The project’s name and all classified information were changed or suppressed in the following description. The estimation strategy for this project is based on the expert judgment only.
Project P1 is a continuous maintenance project that inserts, modifies and removes functionalities in a software product previously developed by the organization. The software product is divided into versions, where each version corresponds to a single iteration in the maintenance lifecycle. An iteration must deliver a number of labor-hours/month to the client and may have one or more product releases. Each Service Order (SO) aggregates a set of change requirements for the product.
Project P1’s teams are divided into: • Design Team: people responsible for estimating
effort and for creating and maintaining design documents;
• Client Developers: people that create and maintain the code for the client application;
• Server Developers: people that create and maintain the code for the server application;
• Testers: people involved in the execution of integration tests.
Project P1 has three types of requirement documents: (1) Design Requirements, (2) Server Requirements, and (3) Interface/Client Requirements. These documents have well defined structures divided into sections. Typically, such sections are:
• History of Changes Header: present in all document types; records all changes performed in documents;
• Description: present in all document types; briefly describes the content of the document;
• Business Rules: in Design Requirements document, describes the software functionality; in Server and Interface/Client Requirements, documents the pseudo-code of business rules;
• Screen layouts: present only in Interface/Client Requirements, contains screen designs and descriptions of their behavior rules.
Project P1 uses a classic waterfall lifecycle. Different tools are used to support the team’s activities during the lifecycle: a) MS-Project Server for scheduling the activities planned in the project; B) IBM-ClearQuest for defects control; c) IBM-RequisitePro for managing all requirements presented in an SO; and d) an in-house developed tool used to record the effort spent by each team associated to address a task.
IV. EXPERIMENTATION PLAN The Company is CMM3 certified and has a central data
repository for all its projects. This repository is directed to the high-level managers in order to assist their decision-making process, and it is detailed in [17].
The granularity level of data in the organizational repository does not allow its use to estimate work effort for each requirement, because such data are summarized by phase and version, in an approach that disposes of important project details. Consequently, we had to access directly the data sources of the tools adopted by the project. We accessed the data repository from ClearQuest, RequisitePro, and the locally-developed software tool, so as to retrieve the following SO information:
• Adjusted Function-Points for each SO (FPs); • Size of a SO in thousands of lines of code (KLOC); • Number of requirement documents for each SO
(NDOCs); • Previously performed test-cases (PPTC); • SO Baseline data: • Baseline Schedule (BS); • Baseline Effort in hours (BE); • Actual effort of each SO in hours (EFF); Considering the 7 SO attributes above, we have 5
numeric continuous attributes (FPs, KLOC, NDOCs, BE and EFF) and 2 categorical attributes (PPTC and BS). PPTC indicates whether SO test-cases were performed (PPTC = {true, false, partially}) and BS is a date (BS format = (YYYY, MM, DD)) which the SO is expected to be delivered. All SO baseline data are derived through the human expert feeling, in the moment that the SO is started-up.
In this paper, we predict the effort spent so as to fulfill a SO cycle. Our main goal is to improve the human expert estimation, and for that we perform two distinct strategies with the purpose of defining a new predictive model for the IT Company. We have chosen the least square linear regression technique, as well as a data mining regression tree algorithm, because of the following reasons:
Existence of a project’s historical database: project P1 owns large amounts of historical data consolidated in databases, which allows the exploration of relevant patterns so as to aid the prediction of future events;
Ease of use and understanding: the technique cannot afford to be a burden for the SO scheduling responsible employee, and it certainly needs to provide results of easy interpretability, in order to assist the managers’ decision making;
Raison d’être of the techniques: the own nature of LSLR and regression trees makes them well-suited for this particular task, because they permit patterns recognition that can be used for predicting values in large amounts of data;
Suggestion of use by established authors: the aforementioned techniques are suggested by software engineering authors such as [18], [19] and [20], as well as by the IEEE 1061 metrics standard [21]. The major advantage of using such techniques is their maturity in different knowledge areas;
Availability of tools: a single calculation spreadsheet and an open-source data mining tool is all we need to implement these techniques, making their use affordable (i.e., no extra costs for the Company).
A. Model Evaluation There are several measures in the literature for evaluating
the accuracy of software prediction models. In this paper, we will employ the two most commonly used [22], which were also used in [23], [7] and [24]. They are:
• Mean Magnitude of Relative Error (MMRE):
MMRE 1n |y y |y (2)
where y is the actual value of the i observation and y is the predicted value for the same observation, in an universe of n observations. Good prediction models should yield low values of MMRE (e.g., 25%).
• Prediction at level l:
Pred l in (3)
where i is the number of observed values that fall within the l % of the actual values, and n is the total number of observations. It is suggested that a good prediction model should satisfyPred 20 75% , but this is often hard to achieve in software metrics estimation [23]. We use Pred 25 in our experiments as recommended by [22].
B. Data Preparation The SO dataset consists of 1522 instances, each instance
representing a unique SO of project P1. We faced some problems with this dataset, as follows:
• Quality problems with data prior to 2006. Until the year of 2006, the metrics collection process was not automated, generating data distortions and many missing values. Hence, we have deleted all instances prior to 2006;
• Missing values for Baseline Effort and Actual Effort. Due to unknown reasons, some instances had no effort values, even though the corresponding SO was already concluded. We also deleted such instances, for they could no longer aggregate significance in the building of a prediction model.
After this data cleaning process, we have ended up with 561 instances, where 505 (90%) were used for building the prediction model, and the other 56 (10%) were used for evaluating the model.
C. Hypotheses Before executing the experiments, we have identified
three hypotheses, listed in Tab. I. Hypotheses H1 and H2 refer to the LSLR statistic
strategy, where H1 considers a single-variable LSLR, and H2 considers a multi-variable approach.
Hypothesis H3 refers to the use of a regression tree algorithm called M5P [25, 26], which is a powerful solution because it combines decision trees and linear regression for predicting a continuous variable, and has the ability of using both continuous and categorical attributes as inputs. The next section details the experiment’s execution in order to validate these 3 hypotheses.

Figure 1. Three-step moving average (ma) of the LSLR NDOCS model and the actual effort
0
100
200
300
1 6 11 16 21 26 31 36 41 46 51
ma Actual Effort ma LSLR with NDOCs
TABLE I. EXPERIMENTS’ HYPOTHESES
Hypothesis Description
H1
For a given amount of SO-associated software artifacts (NDOCs), it is possible to predict the SO work effort through LSLR with a higher degree of accuracy than the current company’s strategy – the human expert judgment.
H2
Considering different combinations of numeric attributes, it is possible to predict the SO work effort through LSLR with a higher degree of accuracy than the current company’s strategy – the human expert judgment and also than the H1 strategy.
H3
Considering all SO-associated numeric and categorical attributes previously described, it is possible to predict the SO work effort through a data mining regression tree algorithm with a higher degree of accuracy than the H2 described strategy.
V. EXPERIMENTS’ EXECUTION The experiments executed within this case study were
divided in three parts. Each of these will search to validate a hypothesis through the evaluation measures MMRE and Pred(25).
A. Experiment on hypothesis H1 The hypothesis H1 searches for an equation that
expresses a pattern providing work effort estimates through the independent variable number of documents (NDOCs). That is, we assume that there is a high correlation factor between the two variables, where modifications in the NDOCs would affect directly the SO work effort. The
optimal model we have derived generated the following equation:
95 1.61 (4)
We can observe that this equation will never produce an effort estimate below 95 hours, compromises the estimates of all low-effort SOs. The MMRE and Pred(25) of this model are shown in Tab II. We can notice that the LSLR model described in H1 provided an error of 349%, practically 5 times higher than the human expert estimates. When analyzing the percentage of instances that fell within the 25% of the actual effort values, we also notice that the LSLR with NDOCs only provided 11% of what we can call “good estimates”, three times a lower value when compared to the human expert guesses. The LSLR NDOCs model did not follow the tendency of the actual effort values, as we can see in a 3-step moving average chart, shown at Fig. 1. This chart details the tendency of the SOs, summarized by the month they were required (a 3-steps moving average chart was chosen because it can approximately summarize the total number of SOs effort by month, whilst keeping the chart clearer).
TABLE II. HYPOTHESIS H1 VALIDATION
Prediction Model MMRE Pred 25 LSLR – NDOCs 3.49 0.11 Human Expert 0.7 0.29
Hence, we can discard H1 as a valid hypothesis, for we
did not improve the results achieved by the human expert. The next experiment involves the validation of hypothesis H2. For that, we used different combinations of attributes to build a multi-variable LSLR approach.
B. Experiment on hypothesis H2
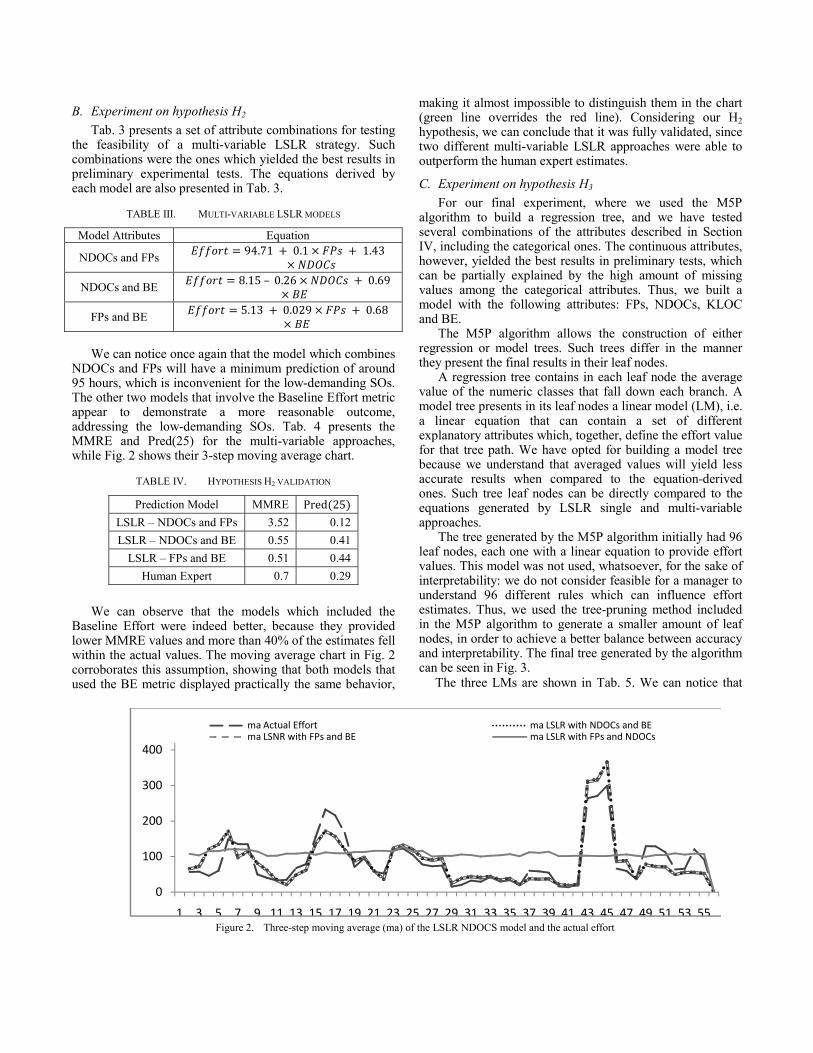
Tab. 3 presents a set of attribute combinations for testing the feasibility of a multi-variable LSLR strategy. Such combinations were the ones which yielded the best results in preliminary experimental tests. The equations derived by each model are also presented in Tab. 3.
TABLE III. MULTI-VARIABLE LSLR MODELS
Model Attributes Equation
NDOCs and FPs 94.71 0.1 1.43
NDOCs and BE 8.15 – 0.26 0.69
FPs and BE 5.13 0.029 0.68
We can notice once again that the model which combines
NDOCs and FPs will have a minimum prediction of around 95 hours, which is inconvenient for the low-demanding SOs. The other two models that involve the Baseline Effort metric appear to demonstrate a more reasonable outcome, addressing the low-demanding SOs. Tab. 4 presents the MMRE and Pred(25) for the multi-variable approaches, while Fig. 2 shows their 3-step moving average chart.
TABLE IV. HYPOTHESIS H2 VALIDATION
We can observe that the models which included the
Baseline Effort were indeed better, because they provided lower MMRE values and more than 40% of the estimates fell within the actual values. The moving average chart in Fig. 2 corroborates this assumption, showing that both models that used the BE metric displayed practically the same behavior,
making it almost impossible to distinguish them in the chart (green line overrides the red line). Considering our H2 hypothesis, we can conclude that it was fully validated, since two different multi-variable LSLR approaches were able to outperform the human expert estimates.
C. Experiment on hypothesis H3
For our final experiment, where we used the M5P algorithm to build a regression tree, and we have tested several combinations of the attributes described in Section IV, including the categorical ones. The continuous attributes, however, yielded the best results in preliminary tests, which can be partially explained by the high amount of missing values among the categorical attributes. Thus, we built a model with the following attributes: FPs, NDOCs, KLOC and BE.
The M5P algorithm allows the construction of either regression or model trees. Such trees differ in the manner they present the final results in their leaf nodes.
A regression tree contains in each leaf node the average value of the numeric classes that fall down each branch. A model tree presents in its leaf nodes a linear model (LM), i.e. a linear equation that can contain a set of different explanatory attributes which, together, define the effort value for that tree path. We have opted for building a model tree because we understand that averaged values will yield less accurate results when compared to the equation-derived ones. Such tree leaf nodes can be directly compared to the equations generated by LSLR single and multi-variable approaches.
The tree generated by the M5P algorithm initially had 96 leaf nodes, each one with a linear equation to provide effort values. This model was not used, whatsoever, for the sake of interpretability: we do not consider feasible for a manager to understand 96 different rules which can influence effort estimates. Thus, we used the tree-pruning method included in the M5P algorithm to generate a smaller amount of leaf nodes, in order to achieve a better balance between accuracy and interpretability. The final tree generated by the algorithm can be seen in Fig. 3.
The three LMs are shown in Tab. 5. We can notice that
Prediction Model MMRE Pred 25 LSLR – NDOCs and FPs 3.52 0.12 LSLR – NDOCs and BE 0.55 0.41
LSLR – FPs and BE 0.51 0.44 Human Expert 0.7 0.29
Figure 2. Three-step moving average (ma) of the LSLR NDOCS model and the actual effort
0
100
200
300
400
1 3 5 7 9 11 13 15 17 19 21 23 25 27 29 31 33 35 37 39 41 43 45 47 49 51 53 55
ma Actual Effort ma LSLR with NDOCs and BEma LSNR with FPs and BE ma LSLR with FPs and NDOCs

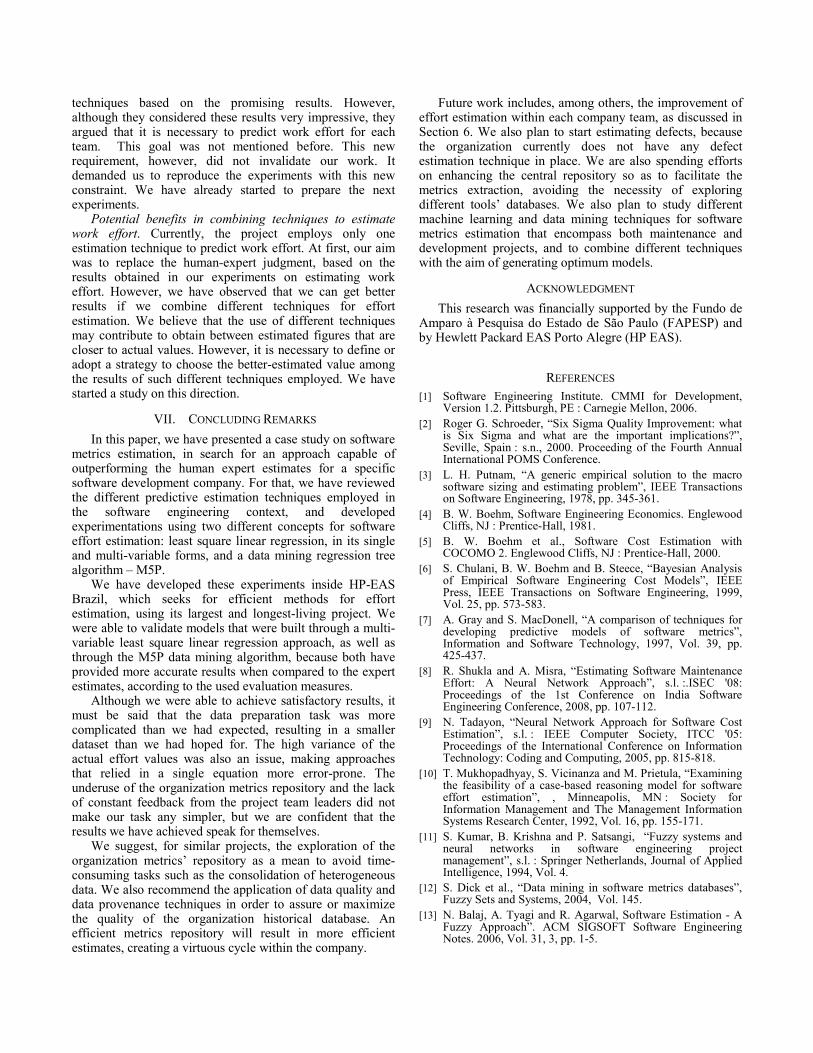
only the Baseline Effort and Size metrics wthis reduced version of the tree. Although twith 96 different linear models yielded betteof MMRE and Pred(25), the reduced tree ithe best multi-variable LSLR model, as wellexpert feeling. Fig. 4 shows the final compabest H2 and H3 models, along with theestimates, in a reduced sample of the SOs t56), for the sake of visualization.
TABLE V. M5P LINEAR MODE
Linear Model Equation LM1 0.7865LM2
0.0842 LM3
0.2468 319.30
TABLE VI. HYPOTHESIS H3 VALID
Prediction Model MMRE PM5P Regression Tree 0.52 LSLR – FPs and BE 0.51
Human Expert 0.7
Figure 3. Model tree generated by M5P af
Figure 4. Compariso
-50
50
150
250
350
450
1 2 3 4
Actual Effort
were considered in the complete tree er results in terms is a better fit for l as to the human arison among the e human expert test set (15 out of
ELS
2.4103 0.350595.6631 1.0369016
ATION red 25 0.46 0.44 0.29
We can conclude that the M5Presults in terms of effort estimationmore than 45% of its estimates falliactual effort values, and MMRE oonly 0,01% higher than the multi-vamodel. Even though these error rateglance, we should emphasize thedataset, where effort values vary hours, considering the whole datasthe human expert was our main goathe fact we were able to provide a daof yielding more satisfying results thsquare linear regression technique.
VI. LESSONS LE
We classified the lessons leafollowing issues:
Large effort in preparing dataintention was to estimate work efforthe organizational repository becaSection 4, it concentrates all projfigured out that we needed more dstored in the organizational reposnecessary to start a comprehensstructures underlying the supportindevelop the execution of complexconsolidate data from different sourof effort in data extraction and cleissue identified is that in the case of tool, even an upgrade, the queries will probably need to be redesigned.
Underuse of the organizational that the organizational repository cdata about project, which would mwork effort estimations easier. Textending the data model of corresponding extract-transform-lTherefore, the process of predictbecome more independent from the
Project Team Leaders Feedbacleaders would start actions to imp
fter pruning.
on of the best derived models for project P1 effort estimation (first 15 SO
5 6 7 8 9 10 11 12
Human Expert M5P Model LSLR with
P model yielded the best n of all experiments, with ing within the 25% of the of around 50%, which is ariable LSLR FPs and BE s may seem high at a first e high variance of the
between 0.7 and 3000 et. Whilst outperforming
al, we are also pleased by ata mining model capable han a multi-variable least
EARNED arned according to the
a. When we started, our rt of a SO using data from ause, as pointed out in ects data. However, we
detailed data than the one sitory. Therefore, it was sive study of the data ng tools used and, then, x queries to extract and rces, which implied a lot
eaning activities. Another f replacing any supporting
used in data preparation . repository. We detected
could have more detailed make data preparation for This could be achieved
such repository and load (ETL) routines. ting work effort would supporting tools.
ck. We thought that team plement one of the new
Os)
13 14 15
FPs and BE
techniques based on the promising results. However, although they considered these results very impressive, they argued that it is necessary to predict work effort for each team. This goal was not mentioned before. This new requirement, however, did not invalidate our work. It demanded us to reproduce the experiments with this new constraint. We have already started to prepare the next experiments.
Potential benefits in combining techniques to estimate work effort. Currently, the project employs only one estimation technique to predict work effort. At first, our aim was to replace the human-expert judgment, based on the results obtained in our experiments on estimating work effort. However, we have observed that we can get better results if we combine different techniques for effort estimation. We believe that the use of different techniques may contribute to obtain between estimated figures that are closer to actual values. However, it is necessary to define or adopt a strategy to choose the better-estimated value among the results of such different techniques employed. We have started a study on this direction.
VII. CONCLUDING REMARKS In this paper, we have presented a case study on software
metrics estimation, in search for an approach capable of outperforming the human expert estimates for a specific software development company. For that, we have reviewed the different predictive estimation techniques employed in the software engineering context, and developed experimentations using two different concepts for software effort estimation: least square linear regression, in its single and multi-variable forms, and a data mining regression tree algorithm – M5P.
We have developed these experiments inside HP-EAS Brazil, which seeks for efficient methods for effort estimation, using its largest and longest-living project. We were able to validate models that were built through a multi-variable least square linear regression approach, as well as through the M5P data mining algorithm, because both have provided more accurate results when compared to the expert estimates, according to the used evaluation measures.
Although we were able to achieve satisfactory results, it must be said that the data preparation task was more complicated than we had expected, resulting in a smaller dataset than we had hoped for. The high variance of the actual effort values was also an issue, making approaches that relied in a single equation more error-prone. The underuse of the organization metrics repository and the lack of constant feedback from the project team leaders did not make our task any simpler, but we are confident that the results we have achieved speak for themselves.
We suggest, for similar projects, the exploration of the organization metrics’ repository as a mean to avoid time-consuming tasks such as the consolidation of heterogeneous data. We also recommend the application of data quality and data provenance techniques in order to assure or maximize the quality of the organization historical database. An efficient metrics repository will result in more efficient estimates, creating a virtuous cycle within the company.
Future work includes, among others, the improvement of effort estimation within each company team, as discussed in Section 6. We also plan to start estimating defects, because the organization currently does not have any defect estimation technique in place. We are also spending efforts on enhancing the central repository so as to facilitate the metrics extraction, avoiding the necessity of exploring different tools’ databases. We also plan to study different machine learning and data mining techniques for software metrics estimation that encompass both maintenance and development projects, and to combine different techniques with the aim of generating optimum models.
ACKNOWLEDGMENT This research was financially supported by the Fundo de
Amparo à Pesquisa do Estado de São Paulo (FAPESP) and by Hewlett Packard EAS Porto Alegre (HP EAS).
REFERENCES [1] Software Engineering Institute. CMMI for Development,
Version 1.2. Pittsburgh, PE : Carnegie Mellon, 2006. [2] Roger G. Schroeder, “Six Sigma Quality Improvement: what
is Six Sigma and what are the important implications?”, Seville, Spain : s.n., 2000. Proceeding of the Fourth Annual International POMS Conference.
[3] L. H. Putnam, “A generic empirical solution to the macro software sizing and estimating problem”, IEEE Transactions on Software Engineering, 1978, pp. 345-361.
[4] B. W. Boehm, Software Engineering Economics. Englewood Cliffs, NJ : Prentice-Hall, 1981.
[5] B. W. Boehm et al., Software Cost Estimation with COCOMO 2. Englewood Cliffs, NJ : Prentice-Hall, 2000.
[6] S. Chulani, B. W. Boehm and B. Steece, “Bayesian Analysis of Empirical Software Engineering Cost Models”, IEEE Press, IEEE Transactions on Software Engineering, 1999, Vol. 25, pp. 573-583.
[7] A. Gray and S. MacDonell, “A comparison of techniques for developing predictive models of software metrics”, Information and Software Technology, 1997, Vol. 39, pp. 425-437.
[8] R. Shukla and A. Misra, “Estimating Software Maintenance Effort: A Neural Network Approach”, s.l. :.ISEC '08: Proceedings of the 1st Conference on India Software Engineering Conference, 2008, pp. 107-112.
[9] N. Tadayon, “Neural Network Approach for Software Cost Estimation”, s.l. : IEEE Computer Society, ITCC '05: Proceedings of the International Conference on Information Technology: Coding and Computing, 2005, pp. 815-818.
[10] T. Mukhopadhyay, S. Vicinanza and M. Prietula, “Examining the feasibility of a case-based reasoning model for software effort estimation”, , Minneapolis, MN : Society for Information Management and The Management Information Systems Research Center, 1992, Vol. 16, pp. 155-171.
[11] S. Kumar, B. Krishna and P. Satsangi, “Fuzzy systems and neural networks in software engineering project management”, s.l. : Springer Netherlands, Journal of Applied Intelligence, 1994, Vol. 4.
[12] S. Dick et al., “Data mining in software metrics databases”, Fuzzy Sets and Systems, 2004, Vol. 145.
[13] N. Balaj, A. Tyagi and R. Agarwal, Software Estimation - A Fuzzy Approach”. ACM SIGSOFT Software Engineering Notes. 2006, Vol. 31, 3, pp. 1-5.
[14] T. Khoshgoftaar, M. Taghi et al., “Classification-Tree Models of Software-Quality over Multiple Releases”, IEEE Transactions on Reliabiilty, March 2000, Vol. 49, pp. 4-11.
[15] L. Breiman, et al., Classification and Regression Trees, Chapman and Hall, 1985.
[16] S. Gokhale and M. Lyu, “Regression Tree Modeling for the prediction of Software Quality”, Anaheim, CA: Proc. of Third ISSAT International Conference no Reliability '97, 1997, pp. 31-36.
[17] K. Becker et al., “SPDW: A Software Development Process Performance Data Warehousing Environment”, Washington, DC : IEEE Computer Society, SEW '06: Proceedings of the 30th Annual IEEE/NASA Software Engineering Workshop, 2006, pp. 107-118.
[18] Stephen H Kan, Metrics and Models in Software Quality Engineering. Boston : Addison Wesley, 2003. p. 528.
[19] Roger S. Pressman, Software Engineering - A Practitioner's Approach. s.l. : McGraw-Hill, 2001.
[20] Ian Sommerville, Software Engineering. São Paulo : Makron Books, 2003.
[21] IEEE Computer Society, IEEE Standard for Software Quality Metrics Methodology. New York : The Institute of Electrical and Electronics Engineers, Inc., 1998.
[22] C. Burgess and M. Lefley, “Can genetic programming improve software effort estimation? A comparative evaluation”, Information and Software Technology, 2001, Vol. 43, pp. 863-873.
[23] Da Deng, Martin Purivs and Maryam Purvis, “Software Metric Estimation: An Empirical Study Usng an Integrated Data Analysis Approach”, Proceedings of the International Conference on Service Systems and Service Management, 2007, pp. 1-6.
[24] P. Braga, A. Oliveira e S. Meira, “Software Effort Estimation Using Machine Learning Techniques with Robust Confidence Intervals”, Washington, DC : IEEE Computer Society, ICTAI '07: Proceedings of the 19th IEEE International Conference on Tools with Artificial Intelligence, 2007, Vol. 1, pp. 181-185.
[25] J. R. Quinlan, “Learning with continuous classes”, 5th Australian Joint Conference on Artificial Intelligence, 1992, pp. 343-348.
[26] Y. Wang and I. Witten, “Inducing model trees for continuous classes”, Prague, Czech Republic : 9th European Conference on Machine Learning, 1997.
Related Documents