ISSUES AND TRENDS ON SUSTAINABLE TRANSPORTATION: THE CASE OF BRAZILIAN CITIES (2003-2010) Marcelo Sampaio Dias Maciel (CEFET-RJ ) [email protected] Ursula Gomes Rosa Maruyama (CEFET-RJ ) [email protected] Antonio Mauricio Castanheira das Neves (CEFET-RJ ) [email protected] Andre Luiz Lucas Amorim (CEFET-RJ ) [email protected] Brazilian transportation system generates negative externalities in terms of energy consumption, carbon dioxide and local pollution emissions, social costs and expenditures on infrastructure, which results in an unsustainable mobility systeem. The inefficient use of resources is alarming, and this trend indicates worsening the problem in the coming years. The continued expansion of Brazilian cities, which drives the demand for passenger mobility, besides the increasing access of lower income households to private cars as well as the low quality of public transportation options provide the basis for an exponential growth of external costs related to transportation. This paper aims to present the external costs and trends of the urban transportation system in Brazil. The results show a trend towards a significant increase in public expenditures, especially those concerning infrastructure, atmospheric emissions and final energy use over the last 8 years. The conclusion introduce the idea of a more sustainable transportation system, in which public transportation is privileged. Therefore, Brazilian cities could save their financial and environmental resources. Keywords: Brazilian cities, GEE, local pollution, energy, social costs, sustainable transportation.

Welcome message from author
This document is posted to help you gain knowledge. Please leave a comment to let me know what you think about it! Share it to your friends and learn new things together.
Transcript
ISSUES AND TRENDS ON SUSTAINABLE
TRANSPORTATION: THE CASE OF BRAZILIAN
CITIES (2003-2010)
Marcelo Sampaio Dias Maciel (CEFET-RJ )
Ursula Gomes Rosa Maruyama (CEFET-RJ )
Antonio Mauricio Castanheira das Neves (CEFET-RJ )
Andre Luiz Lucas Amorim (CEFET-RJ )
Brazilian transportation system generates negative externalities in terms of energy
consumption, carbon dioxide and local pollution emissions, social costs and expenditures on
infrastructure, which results in an unsustainable mobility systeem. The inefficient use of
resources is alarming, and this trend indicates worsening the problem in the coming years.
The continued expansion of Brazilian cities, which drives the demand for passenger mobility,
besides the increasing access of lower income households to private cars as well as the low
quality of public transportation options provide the basis for an exponential growth of
external costs related to transportation. This paper aims to present the external costs and
trends of the urban transportation system in Brazil. The results show a trend towards a
significant increase in public expenditures, especially those concerning infrastructure,
atmospheric emissions and final energy use over the last 8 years. The conclusion introduce
the idea of a more sustainable transportation system, in which public transportation is
privileged. Therefore, Brazilian cities could save their financial and environmental resources.
Keywords: Brazilian cities, GEE, local pollution, energy, social costs, sustainable
transportation.
ICIEOM – CIO 2013 – Valladolid, Spain
2
1 Introduction
Urbanization has been the dominant contemporary process as an increasing part of the world
population lives in cities. Moreover, urban mobility issues have grown in importance to support society
requirements from these urban agglomerations. Worldwide, passenger and transportation generates
over 23% of the total of greenhouse gas emissions arising from the combustion of fuels and accounts
for at least 26% of the planet’s fuel use (Kahn, 2007; IEA, 2008; IPCC, 2007;OPEC, 2007).
The transportation sector uses between 25% and 60% of the land in major cities throughout the world
(Litman& Burwell, 2006; Vasconcellos, 2000; Litman, 1995), and the time lost in traffic congestion in
several countries leads to economic losses of approximately 1 to 3% of GDP (Gwilliam, 2002).
Furthermore, over a million people die and 3 million are injured every year in road traffic accidents
worldwide (WHO, 2004; Granados, 1998; Quinet, 1994). These accidents result in economic costs of
approximately 5% of GDP in some countries (Vasconcellos, 2008).
Several emerging economies, such as Brazil, have adopted transportation systems that repeat the
errors committed by industrialized countries, including the encouragement of individual motorized
transportation as standard. This has not proved to be the optimal solution (Pucher et al., 2005; Rosa,
2003). In this sense, the Brazilian government regularly proclaims its overriding commitment to both
efficient public resources usage and improvement of living standards for the population.
However, Brazilian cities still need a drastic overhaul of the currently unsustainable transportation
system. Therefore, the accurate calculation of resource consumption and atmospheric emissions
produced by Brazilian transportation system in the last years is a key factor for ensuring the adequate
redirection of public policies towards higher social benefits to the society. This study presents the
external costs of motorized passenger transportation (both public and private) in major urban areas of
Brazil. Based on this data, it uses a simple equation in order to calculate the input-output ratio or its
efficiency of the transportation system.
2 Definition of Sustainable Transport
According to sustainable development concept, human beings should use available resources to meet
our present requirements only to the extent that such use does not prejudice the capacity to satisfy
the needs of future generations. Therefore, according to the European Foundation for the Improvement
of Living and Working Conditions, sustainable development is a continuous economic development
that does not threaten the environment or natural resources (Litman & Burwell, 2006). In general,
sustainability may be defined as the capacity to impart long-term continuity to our present actions.
Everything that can be continued indefinitely is sustainable; everything to the contrary is unsustainable.
How does this view of sustainability apply to a transportation system? For Litman and Burwell (2006),
the principal tenet of sustainable transportation is that governments must address environmental,
economic and social factors in their transportation decisions. This view is firmly endorsed by Feitelson
(2002). Other authors (e.g. Gudmundsson & Höjer, 1996) maintain that there are four key elements to
the concept of sustainable development for transportation: the protection of natural resources, the
maintenance of intergenerational productive capital, the drive for improvement in individual quality of
life and the fair distribution of that quality of life. The additional approach of Black (2010) and Buehler
& Pucher (2011) maintains that a sustainable transportation system is the one that provides
transportation and mobility from renewable energy sources, thereby minimizing local and global
emissions, preventing avoidable deaths and injuries from road traffic accidents and minimizing the loss
of economic productivity due to traffic congestion.
The reality of transportation systems remains far removed from the ideals visualized in academic circles
and the offices of urban planners. The large-scale use of private cars for urban journeys results in
energy and social inefficiency and environmental unsustainability (Wright & Egan, 2000; Anable, 2005).
Tolley and Turton (1995) depict private transportation inefficiency in comparison with public
transportation modes.
In addition, Schipper (2011), Parry et al.(2007), and Schipper and Eriksson (1995) illustrate the negative
impacts of the use of the motor car for city transportation systems and list the eight cardinal sins of
such use: accidents, atmospheric pollution, inefficient use of urban space of urban space, congestion,
ICIEOM – CIO 2013 – Valladolid, Spain
3
noise pollution, energy waste, emission of greenhouse gases and inefficient distribution of cargo. The
more a transportation system relies on individual motorized vehicles, the more unsustainable the
system becomes.
According to Sperling and Gordon (2008), the use of IMT (individual motorized transportation) will
become an even more serious problem in the next decade. These authors argue that even if the
number of individual motorized vehicles increases very little in industrialized countries, the number of
vehicles in developing countries, such as China and India, are increasing at 8% p.a.
In Brazil, the number of motor cars is growing at 8% p.a. and at 14%p.a. for motorcycles (DENATRAN,
2010). These rates may increase further due to income effects. Between 2003 and 2009, per capita
income increased from R$ 9,511 (approximately USD 5,705) to approximately R$ 17,467 (approximately
USD 10,481) per annum (IBGE, 2011). In addition, current owners of vehicles use their cars more and
are travelling longer distances within cities so that the use of cars is becoming increasingly inefficient
due to greater traffic congestion (MMA, 2011).
3 External costs and changes on urban transportation in Brazil
This section presents environmental, energy and social (health and mobility) costs related to passenger
transportation in Brazilian urban areas with over 60,000 inhabitants (ANTP, 2009). Analysis of available
data indicates that the country’s transportation system wastes social, financial, and natural resources to
a degree that is incompatible with Brazil’s socio-economic and environmental conditions (Elvik, 2006).
Therefore, the use of an unsustainable transportation system leads to public waste of resources in
Brazil.
In addition, these waste of resources results in social costs, as the society has to meet the negative
external consequences of individual motorized vehicles, which are not always fully covered by the taxes
and duties paid by the users (Gwilliam, 2008). The evolution of passenger transport realized demand
was calculated by ANTP (2011) in billions of passengers.kilometers/year between 2003 and 2010. These
results are presented in table 1.
Table 1 – Social issues and passenger transport realized demand in Brazilian cities
Information/Ac
tivities2003 2004 2005 2006 2007 2008 2009 2010
Population
(million)108 111 113 115 117 120 121 122
Jobs (million)1 13 13 14 14 14 15 15 15
Household month
average income
(USD)
608 603 614 642 664 747 771 799
PT (Million) 0,093 0,095 0,098 0,097 0,101 0,102 0,103 0,106
IMT (Million) 17,9 18,9 19,9 20,9 23,9 25,9 27,9 29,9
Total (million) 18 19 20 21 24 26 28 30
PT 187 192 199 208 217 226 230 236
Auto 106 108 113 116 119 122 123 128
Moto 7 8 9 10 11 12 14 15
IMT - total 113 116 121 125 130 134 137 143
Total 300 308 320 333 347 360 367 379
Ve
hic
les
Billio
n K
m-P
as
s
Notes: 1- Industry and commerce (FIBGE, 2011)
PT = Public Transport; IMT = Individual Motorized Transportation
Source: Authors based on ANTP (2011)
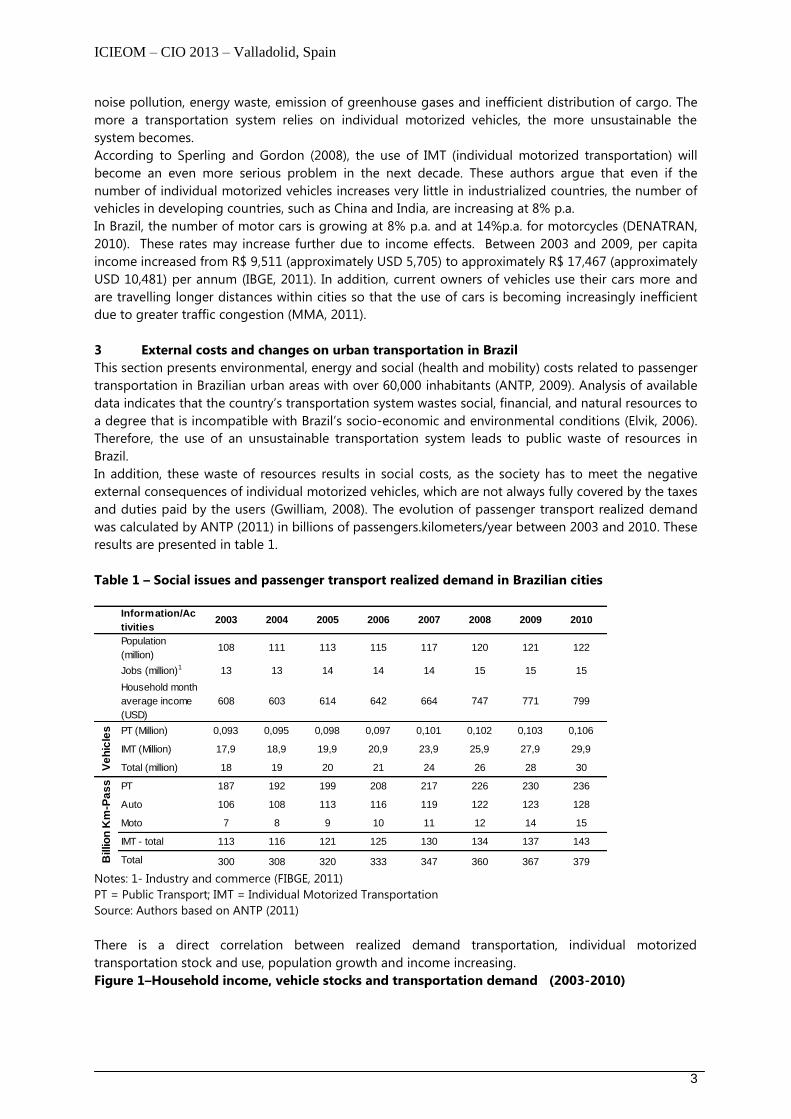
There is a direct correlation between realized demand transportation, individual motorized
transportation stock and use, population growth and income increasing.
Figure 1–Household income, vehicle stocks and transportation demand (2003-2010)
ICIEOM – CIO 2013 – Valladolid, Spain
4
Source: Made by the authors
Figure 1 depicts a strong correlation among realized transportation demand, household income and
vehicle stock in Brazilian cities. Each demand in terms of km-passenger realized needs energy,
atmosphere sunk, infrastructure and health cares to be supported.
3.1 Costs of health
Health costs are presented as traffic accidents costs and also as costs derived from atmospheric
pollution. Globally, traffic accidents are one of the principal problems in public health. Over a million
people lose their lives and 50 million are injured worldwide in road accidents every year (WHO, 2004).
Road systems were constructed in public spaces and were designed to maximize the number and
speed of vehicles using them.
In Brazil, the situation is even worsened by a legal system that is lenient, in practice, on aggressive or
drunken drivers and also by a system of traffic management that encourages speed and impedes the
free circulation of pedestrians. The result is that R$ 8.9 billion (USD 5.3 billion) is spent annually on
social costs due to road traffic accidents in Brazilian urban areas with over 60 thousand inhabitants. Of
this, R$ 7.7 billion (USD 4.6 billion) is attributable to damage caused by individual motorized vehicles.
In Brazil, there is a significant effort to reduce the pollutants emitted by motor vehicles. Although
considerable advances have been made (MMA, 2010), the total ammount of pollutants emitted by the
passenger transportation sector is still substantial. Individual motorized transportation (“IMT”) is
responsible for 83% of the carbon monoxide emitted by the transportation sector (public transport
generates only 2%). IMT also generates 23% of carbon dioxide produced by the sector, as opposed to
11% emitted by mass transportation. Both types of transportaton (IMT and mass) carry practically the
same number of passengers per year (about 17 billion) in Brazil (table 2).
Table 2 – Number of passengers transported by transport type, emission of local pollutants and
emission of greenhouse gases
Emissions
2008/2009Public Transport Individual Transport
Passengers/year 16.8 billion 17.0 billion
CO 2% (34,000 tons) 83% (1,500,000 tons)
NOx 14% (147,000 tons) 9% (94,500 tons)
CO2 11% (18,700,000 tons) 23% (39,100,100 tons)
Source: MMA (2010)
According to the previous table 18.3 million out of 28.1 million tons of pollutants generated by
passenger transportation in 2008 in Brazil, were produced by IMT (17.1 by motor cars). Mass transport
emitted 9.8 million tons. As a result, IMT accounts for 65% of total pollutant emissions in Brazilian
cities. Computing accident costs and pollutant costs – total of USD 55.0 billion (at the last 7 years) -
USD 40.1 billion was generated by IMT and only USD 10.7 billion originates from mass transport
ICIEOM – CIO 2013 – Valladolid, Spain
5
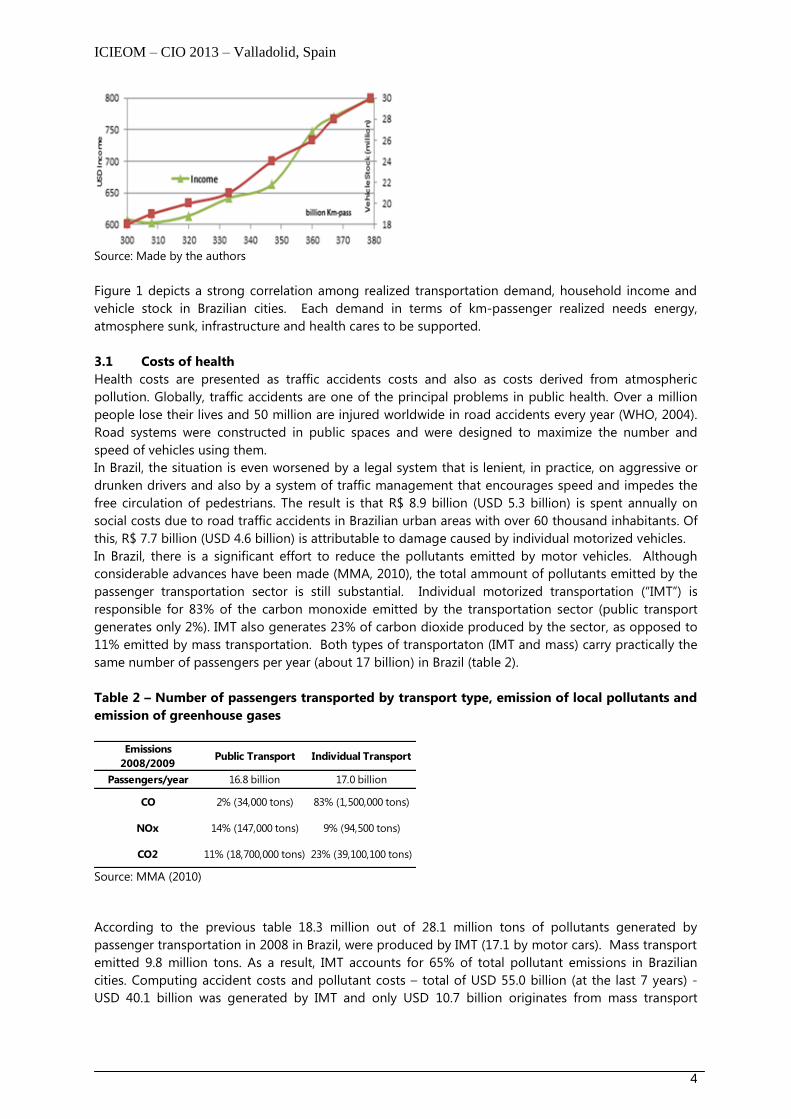
(ANTP, 2010). Moreover, public transport produced more than 2,338 billion km-passengers in 7 years
meanwhile IMT produced only 2,266 billion. Figure 2 shows de evolution of transport health costs.
Figure 2 – Passenger Transport Health costs – Time Series
Source: Made by the authors.
3.2 Energy Costs
The transportation system requires large quantities of petroleum products both in the construction of
the system itself and then in the upkeep and management of the infrastructure (Brand & Preston,
2010). Although Brazil has fewer motor vehicles per thousand inhabitants compared to other
countries, a significant upward trend can be seen in this index since 2003 (DENATRAN, 2010). Brazilian
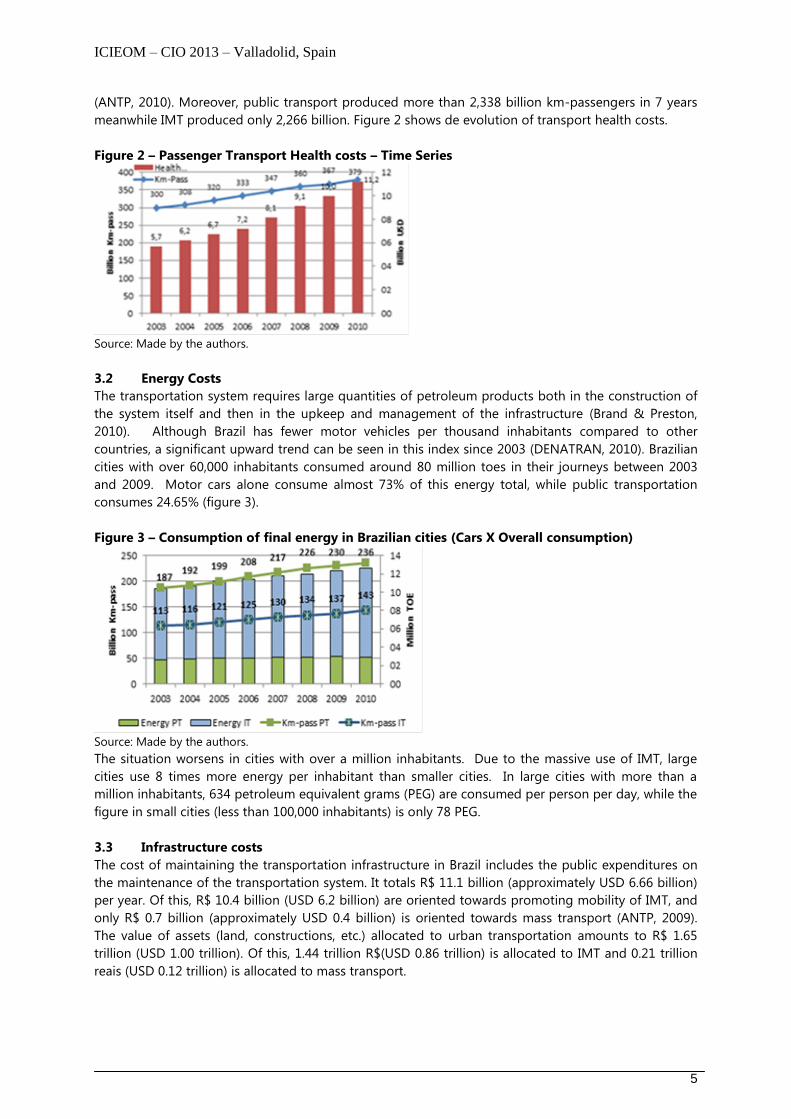
cities with over 60,000 inhabitants consumed around 80 million toes in their journeys between 2003
and 2009. Motor cars alone consume almost 73% of this energy total, while public transportation
consumes 24.65% (figure 3).
Figure 3 – Consumption of final energy in Brazilian cities (Cars X Overall consumption)
Source: Made by the authors.
The situation worsens in cities with over a million inhabitants. Due to the massive use of IMT, large
cities use 8 times more energy per inhabitant than smaller cities. In large cities with more than a
million inhabitants, 634 petroleum equivalent grams (PEG) are consumed per person per day, while the
figure in small cities (less than 100,000 inhabitants) is only 78 PEG.
3.3 Infrastructure costs
The cost of maintaining the transportation infrastructure in Brazil includes the public expenditures on
the maintenance of the transportation system. It totals R$ 11.1 billion (approximately USD 6.66 billion)
per year. Of this, R$ 10.4 billion (USD 6.2 billion) are oriented towards promoting mobility of IMT, and
only R$ 0.7 billion (approximately USD 0.4 billion) is oriented towards mass transport (ANTP, 2009).
The value of assets (land, constructions, etc.) allocated to urban transportation amounts to R$ 1.65
trillion (USD 1.00 trillion). Of this, 1.44 trillion R$(USD 0.86 trillion) is allocated to IMT and 0.21 trillion
reais (USD 0.12 trillion) is allocated to mass transport.
ICIEOM – CIO 2013 – Valladolid, Spain
6
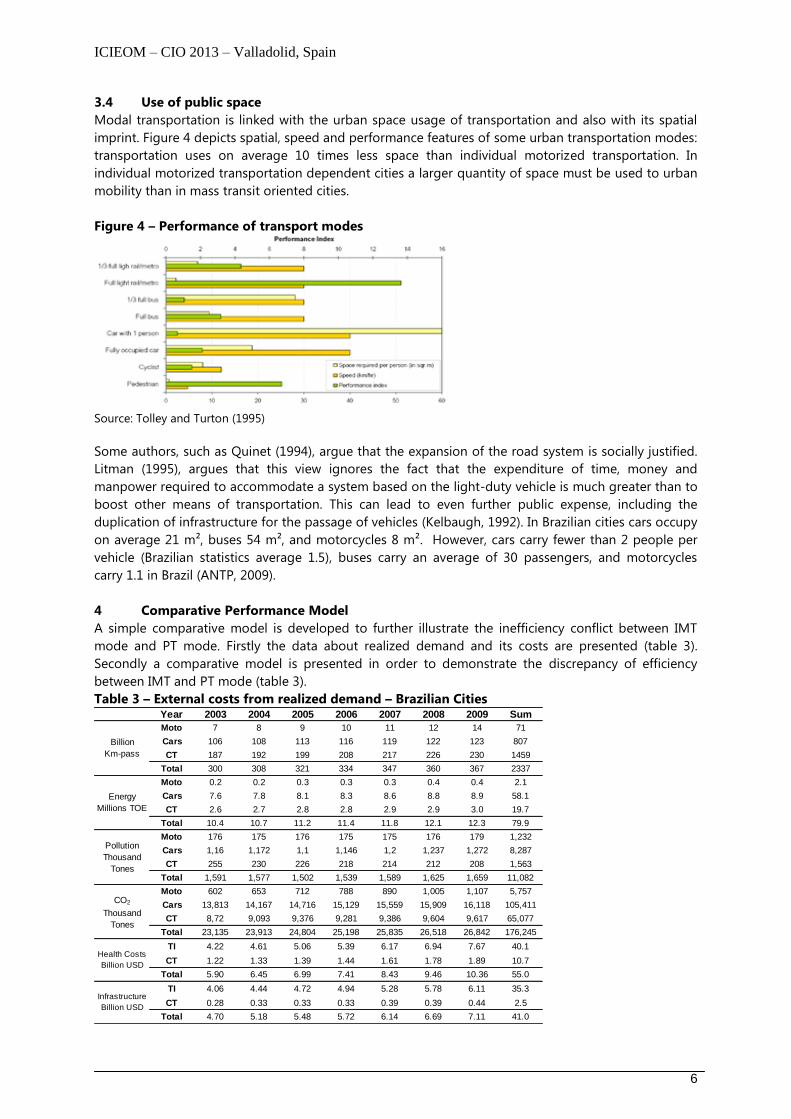
3.4 Use of public space
Modal transportation is linked with the urban space usage of transportation and also with its spatial
imprint. Figure 4 depicts spatial, speed and performance features of some urban transportation modes:
transportation uses on average 10 times less space than individual motorized transportation. In
individual motorized transportation dependent cities a larger quantity of space must be used to urban
mobility than in mass transit oriented cities.
Figure 4 – Performance of transport modes
Source: Tolley and Turton (1995)
Some authors, such as Quinet (1994), argue that the expansion of the road system is socially justified.
Litman (1995), argues that this view ignores the fact that the expenditure of time, money and
manpower required to accommodate a system based on the light-duty vehicle is much greater than to
boost other means of transportation. This can lead to even further public expense, including the
duplication of infrastructure for the passage of vehicles (Kelbaugh, 1992). In Brazilian cities cars occupy
on average 21 m², buses 54 m², and motorcycles 8 m². However, cars carry fewer than 2 people per
vehicle (Brazilian statistics average 1.5), buses carry an average of 30 passengers, and motorcycles
carry 1.1 in Brazil (ANTP, 2009).
4 Comparative Performance Model
A simple comparative model is developed to further illustrate the inefficiency conflict between IMT
mode and PT mode. Firstly the data about realized demand and its costs are presented (table 3).
Secondly a comparative model is presented in order to demonstrate the discrepancy of efficiency
between IMT and PT mode (table 3).
Table 3 – External costs from realized demand – Brazilian Cities Year 2003 2004 2005 2006 2007 2008 2009 Sum
Moto 7 8 9 10 11 12 14 71
Cars 106 108 113 116 119 122 123 807
CT 187 192 199 208 217 226 230 1459
Total 300 308 321 334 347 360 367 2337
Moto 0.2 0.2 0.3 0.3 0.3 0.4 0.4 2.1
Cars 7.6 7.8 8.1 8.3 8.6 8.8 8.9 58.1
CT 2.6 2.7 2.8 2.8 2.9 2.9 3.0 19.7
Total 10.4 10.7 11.2 11.4 11.8 12.1 12.3 79.9
Moto 176 175 176 175 175 176 179 1,232
Cars 1,16 1,172 1,1 1,146 1,2 1,237 1,272 8,287
CT 255 230 226 218 214 212 208 1,563
Total 1,591 1,577 1,502 1,539 1,589 1,625 1,659 11,082
Moto 602 653 712 788 890 1,005 1,107 5,757
Cars 13,813 14,167 14,716 15,129 15,559 15,909 16,118 105,411
CT 8,72 9,093 9,376 9,281 9,386 9,604 9,617 65,077
Total 23,135 23,913 24,804 25,198 25,835 26,518 26,842 176,245
TI 4.22 4.61 5.06 5.39 6.17 6.94 7.67 40.1
CT 1.22 1.33 1.39 1.44 1.61 1.78 1.89 10.7
Total 5.90 6.45 6.99 7.41 8.43 9.46 10.36 55.0
TI 4.06 4.44 4.72 4.94 5.28 5.78 6.11 35.3
CT 0.28 0.33 0.33 0.33 0.39 0.39 0.44 2.5
Total 4.70 5.18 5.48 5.72 6.14 6.69 7.11 41.0
Billion
Km-pass
Energy
Millions TOE
Pollution
Thousand
Tones
CO2
Thousand
Tones
Health Costs
Billion USD
Infrastructure
Billion USD
ICIEOM – CIO 2013 – Valladolid, Spain
7
Source: Made by the authors
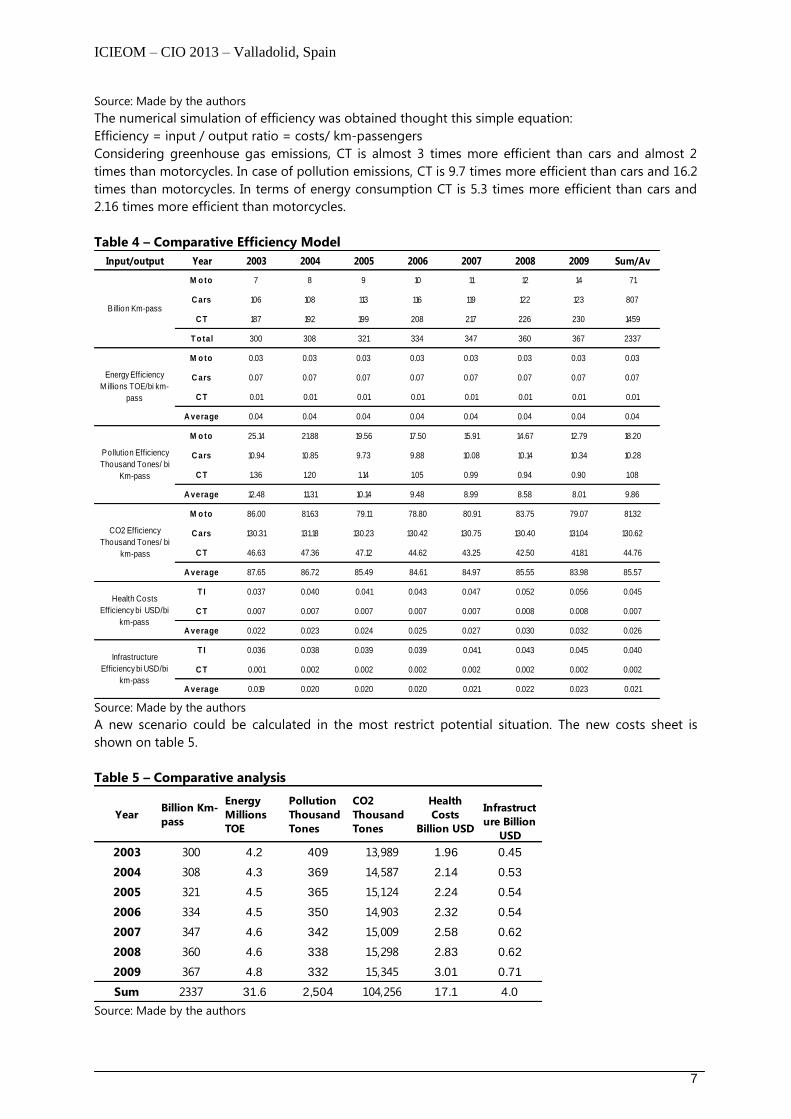
The numerical simulation of efficiency was obtained thought this simple equation:
Efficiency = input / output ratio = costs/ km-passengers
Considering greenhouse gas emissions, CT is almost 3 times more efficient than cars and almost 2
times than motorcycles. In case of pollution emissions, CT is 9.7 times more efficient than cars and 16.2
times than motorcycles. In terms of energy consumption CT is 5.3 times more efficient than cars and
2.16 times more efficient than motorcycles.
Table 4 – Comparative Efficiency Model
Input/output Year 2003 2004 2005 2006 2007 2008 2009 Sum/Av
M o to 7 8 9 10 11 12 14 71
C ars 106 108 113 116 119 122 123 807
C T 187 192 199 208 217 226 230 1459
T o tal 300 308 321 334 347 360 367 2337
M o to 0.03 0.03 0.03 0.03 0.03 0.03 0.03 0.03
C ars 0.07 0.07 0.07 0.07 0.07 0.07 0.07 0.07
C T 0.01 0.01 0.01 0.01 0.01 0.01 0.01 0.01
A verage 0.04 0.04 0.04 0.04 0.04 0.04 0.04 0.04
M o to 25.14 21.88 19.56 17.50 15.91 14.67 12.79 18.20
C ars 10.94 10.85 9.73 9.88 10.08 10.14 10.34 10.28
C T 1.36 1.20 1.14 1.05 0.99 0.94 0.90 1.08
A verage 12.48 11.31 10.14 9.48 8.99 8.58 8.01 9.86
M o to 86.00 81.63 79.11 78.80 80.91 83.75 79.07 81.32
C ars 130.31 131.18 130.23 130.42 130.75 130.40 131.04 130.62
C T 46.63 47.36 47.12 44.62 43.25 42.50 41.81 44.76
A verage 87.65 86.72 85.49 84.61 84.97 85.55 83.98 85.57
T I 0.037 0.040 0.041 0.043 0.047 0.052 0.056 0.045
C T 0.007 0.007 0.007 0.007 0.007 0.008 0.008 0.007
A verage 0.022 0.023 0.024 0.025 0.027 0.030 0.032 0.026
T I 0.036 0.038 0.039 0.039 0.041 0.043 0.045 0.040
C T 0.001 0.002 0.002 0.002 0.002 0.002 0.002 0.002
A verage 0.019 0.020 0.020 0.020 0.021 0.022 0.023 0.021
Billion Km-pass
Energy Efficiency
M illions TOE/bi km-
pass
Pollution Efficiency
Thousand Tones/ bi
Km-pass
CO2 Efficiency
Thousand Tones/ bi
km-pass
Health Costs
Efficiency bi USD/bi
km-pass
Infrastructure
Efficiency bi USD/bi
km-pass
Source: Made by the authors
A new scenario could be calculated in the most restrict potential situation. The new costs sheet is
shown on table 5.
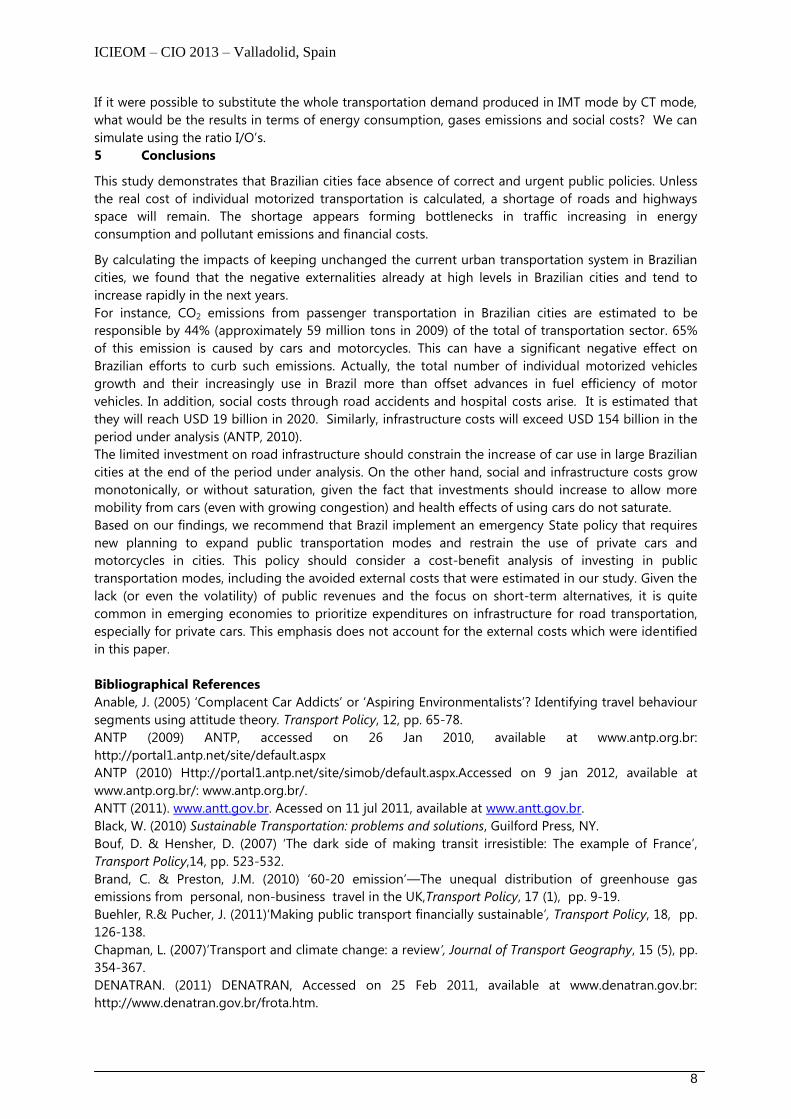
Table 5 – Comparative analysis
YearBillion Km-
pass
Energy
Millions
TOE
Pollution
Thousand
Tones
CO2
Thousand
Tones
Health
Costs
Billion USD
Infrastruct
ure Billion
USD
2003 300 4.2 409 13,989 1.96 0.45
2004 308 4.3 369 14,587 2.14 0.53
2005 321 4.5 365 15,124 2.24 0.54
2006 334 4.5 350 14,903 2.32 0.54
2007 347 4.6 342 15,009 2.58 0.62
2008 360 4.6 338 15,298 2.83 0.62
2009 367 4.8 332 15,345 3.01 0.71
Sum 2337 31.6 2,504 104,256 17.1 4.0 Source: Made by the authors
ICIEOM – CIO 2013 – Valladolid, Spain
8
If it were possible to substitute the whole transportation demand produced in IMT mode by CT mode,
what would be the results in terms of energy consumption, gases emissions and social costs? We can
simulate using the ratio I/O’s.
5 Conclusions
This study demonstrates that Brazilian cities face absence of correct and urgent public policies. Unless
the real cost of individual motorized transportation is calculated, a shortage of roads and highways
space will remain. The shortage appears forming bottlenecks in traffic increasing in energy
consumption and pollutant emissions and financial costs.
By calculating the impacts of keeping unchanged the current urban transportation system in Brazilian
cities, we found that the negative externalities already at high levels in Brazilian cities and tend to
increase rapidly in the next years.
For instance, CO2 emissions from passenger transportation in Brazilian cities are estimated to be
responsible by 44% (approximately 59 million tons in 2009) of the total of transportation sector. 65%
of this emission is caused by cars and motorcycles. This can have a significant negative effect on
Brazilian efforts to curb such emissions. Actually, the total number of individual motorized vehicles
growth and their increasingly use in Brazil more than offset advances in fuel efficiency of motor
vehicles. In addition, social costs through road accidents and hospital costs arise. It is estimated that
they will reach USD 19 billion in 2020. Similarly, infrastructure costs will exceed USD 154 billion in the
period under analysis (ANTP, 2010).
The limited investment on road infrastructure should constrain the increase of car use in large Brazilian
cities at the end of the period under analysis. On the other hand, social and infrastructure costs grow
monotonically, or without saturation, given the fact that investments should increase to allow more
mobility from cars (even with growing congestion) and health effects of using cars do not saturate.
Based on our findings, we recommend that Brazil implement an emergency State policy that requires
new planning to expand public transportation modes and restrain the use of private cars and
motorcycles in cities. This policy should consider a cost-benefit analysis of investing in public
transportation modes, including the avoided external costs that were estimated in our study. Given the
lack (or even the volatility) of public revenues and the focus on short-term alternatives, it is quite
common in emerging economies to prioritize expenditures on infrastructure for road transportation,
especially for private cars. This emphasis does not account for the external costs which were identified
in this paper.
Bibliographical References
Anable, J. (2005) ‘Complacent Car Addicts’ or ‘Aspiring Environmentalists’? Identifying travel behaviour
segments using attitude theory. Transport Policy, 12, pp. 65-78.
ANTP (2009) ANTP, accessed on 26 Jan 2010, available at www.antp.org.br:
http://portal1.antp.net/site/default.aspx
ANTP (2010) Http://portal1.antp.net/site/simob/default.aspx.Accessed on 9 jan 2012, available at
www.antp.org.br/: www.antp.org.br/.
ANTT (2011). www.antt.gov.br. Acessed on 11 jul 2011, available at www.antt.gov.br.
Black, W. (2010) Sustainable Transportation: problems and solutions, Guilford Press, NY.
Bouf, D. & Hensher, D. (2007) ‘The dark side of making transit irresistible: The example of France’,
Transport Policy,14, pp. 523-532.
Brand, C. & Preston, J.M. (2010) ‘60-20 emission’—The unequal distribution of greenhouse gas
emissions from personal, non-business travel in the UK,Transport Policy, 17 (1), pp. 9-19.
Buehler, R.& Pucher, J. (2011)‘Making public transport financially sustainable’, Transport Policy, 18, pp.
126-138.
Chapman, L. (2007)‘Transport and climate change: a review’, Journal of Transport Geography, 15 (5), pp.
354-367.
DENATRAN. (2011) DENATRAN, Accessed on 25 Feb 2011, available at www.denatran.gov.br:
http://www.denatran.gov.br/frota.htm.
ICIEOM – CIO 2013 – Valladolid, Spain
9
Downtown, P. (2000) Compact City Environmental Strategies: Calcutta’s Urban Ecosystem in: Jenkins M.;
Burgess, R.. Compact Cities: Sustainable Urban Forms for Developing Countries. Teylor & Francis
Group, Spon Press. London
Feitelson, E. (2002)‘Introducing environmental equity dimensions into the sustainable transport
discourse: issues and pitfalls’Transportation Research Part D, 7, pp. 99-118.
Elvik, R. (2006)‘Are individual preferences always a legitimate basis for evaluating the costs and
benefits of public policy? The case of road traffic law enforcement’,Transport Policy,13 (5), pp. 379-
385.
Granados, J., (1998)‘Reducing automobile traffic: an urgent policy for health promotion’, Rev Panam
Salud Publica, pp. 227-241.
Gudmundsson, H., &Höjer, M. (1996)‘Sustainable development principles and their implications for
transport’, Ecological Economics, 19 (3), pp. 269-282.
Gwilliam, K.(2002)Cities on the move : a World Bank urban transport strategy review,World Bank,
Washington D.C.
Gwilliam, K. (2008) ‘A review of issues in transit economics’, Research in Transportation Economics, 23
(1), pp. 4-22.
Han, J. & Hayashi, Y. (2008) ‘A system dynamics model of CO2 mitigation in China’s inter-city
passenger transport’, Transportation Research Part D,13 (5), pp. 298-305.
Hau, T.,(1992) Economics fundamentals of road pricing: a diagramatica analysis, Word Bank,
Washington.
IBGE. (2011). Accessed on 21 Feb 2011, available at Ibge.gov.br:
http://www.ibge.gov.br/home/mapa_site/mapa_site.php#economia.
IEA. (2002)Bus systems for the future: Achieving Sustainable Transport Worldwide, OECD/IEA, Paris.
IEA.(2008)CO2 Emissions From Fuels Combustions, OECD/IEA, Paris.
IPCC (2007) Summary for policy makers, Working group I contribution to the Intergovernmental Panel
on Climate Change Fourth Assessment Report: climate change 2007—The physical science basis,.Paris.
Kahn et al, S. (2007)2007:Transport and its infrastructure. In: B. E. METZ, Climate Change 2007:
Mitigation. Contribution of Working Group III to the Fourth, Cambridge University Press, NY.
Kelbaugh, D. (1992) Housing Affordability and Density, Washington Department of Community
Development, Washington.
Litman, T. (1995)‘Land use impact costs of transportation’, World Transport Policy & Practice, 9-16.
________, (2009) VTPI. Accessed on 26 Sept 2009, available at www.vtpi.org:
http://www.vtpi.org/future.pdf.
Litman, T., & BURWELL, D. (2006)‘Issues in sustainable transportation’, Int. J. Global Environmental
Issues, 6, pp. 331-347.
MMA. (2010) MMA, Accessed on 3 July 2010, available at www.mma.gov.br
OPEC. (2007)World Oil Outlook 2007,OPEC, Vienna.
Parry, I., Walls, M., & Harrington, W.(2007)‘Automobile Externalities and Policies’,Journal of Economic
Literature, XLV, 374-400.
Pucher,J. et al. (2005)‘Urban transport crisis in India’,Transport Policy, 12, pp. 185-198.
Quinet, E. (1994)The social costs of transport: evaluation and links with internalization policiesIn: K.
BUTTON, Internalizing the Social Costs of Transport, OECD ,Paris.
Rosa, L. P. (2003)Climate changes and gases emissions in the energy system:contributions from transport
sector In: S. E. KAHN, Transportation and climate change (pp. 7-10), COPPE, Rio de Janeiro.
Schipper, L., & Eriksson, G. (1995)Taxation Policies Affecting Automobile Characteristics and Use in
Western Europe, Japan and the United StatesIn: D. Sperling, & S. Shahen, Transportation and Energy:
Strategies for a Sustainable Transportation System (pp. 217-242), America Council for an Energy
Efficient Economy, Washington.
Schipper, L. (2011). ‘Automobile use, fuel economy and CO2 emissions in industrialized countries:
Encouraging trends through 2008?’,Transport Policy, 18 (2), pp. 358-372.
, D., & Gordon, D. (2008) Two Billion Cars.TR News, 259, pp. 2-9.
ICIEOM – CIO 2013 – Valladolid, Spain
10
Tolley, R. and Turton, B. (1995) Transport systems, policy and planning: a geographical approach. New
York: Longman.
Urry, J. (2004) ‘The ‘System’ of Automobility’, Theory, Culture & Society, pp. 25-39.
Vasconcellos, E. (2000)Transporte urbano nos países em desenvolvimento, Anablume, São Paulo.
___________. (2005 a)‘Transport metabolism, social diversity and equity: The case of São Paulo,
Brazil’,Journal of Transport Geography, pp. 329-339.
__________. (2005 b)‘Urban change, mobility and transport in São Paulo:three decades, three cities’,
Transport Policy, 12 (2), pp. 91-104.
______________ (2008)Transporte e meio ambiente: conceitos e informações para análise de
impactos,Anablume, São Paulo.
WHO (2004)World Report on Road Traffic Injury prevention,World Health Organization, Geneva.
WOO (2010)Organization of the Petroleum Exporting Countries, OPEC Secretariat, Vienna.
World Bank (2002)Cities on the Move: A World Bank Urban Transport Strategy Review, The International
Bank for Reconstruction and Development, Washington.
World Bank (2011) World Bank,Accessed on 31 May 2011, available at
http://data.worldbank.org/indicator.
Wright, C. & Egan, J. (2000) ‘De-marketing the car’, Transport Policy, 7 (4), pp. 287-294.
Related Documents