N Save Nature to Survive 9(2): 823-828, 2014 (Supplement on Genetics and Plant Breeding) www.thebioscan.in 823 ISSR BASED GENOTYPIC DIFFERENTIATION OF GRAPE (VITIS VINIFERA L.) R. S. CHOUDHARY 1 *, V. S. ZAGADE 1, MABOODURRAHMAN 2 , G. D. KHALAKAR 3 AND N. K. SINGH 3 1 Department of Plant Biotechnology, K. K. Wagh College of Agricultural Biotechnology, Nashik - 422 003, Maharashtra, India 2 Department of Food Engineering, K. K. Wagh College of Agricultural Biotechnology, Nashik - 422 003, Maharashtra, INDIA 3 C. P. College of Agriculture, S. D. Agricultural University, S. K. Nagar - 385 506, Gujarat, INDIA e-mail: [email protected]. INTRODUCTION Grapevine (Vitis vinifera L.) is one of the most important perennial fruit crops botanically belonging to the family Vitaceae and is divided into 12 genera. Vitis vinifera is the most widely cultivated species of the genus Vitis and is grown throughout the temperate and tropical regions. Vitis vinifera is known for its wide morphological and genetic diversity and there exist a large number of cultivars (Teixeira et al., 2013). In India, Grapes are cultivated over an area of 111.4 thousand hectares with a production of 1,234 thousand tonnes and productivity 11.1 tonnes per hectare (NHB, 2011). Besides being eaten as fresh fruit, grapes are also used for grape wine, grape juice, raisins and canned products. It contains high levels of easily absorbable glucose, protein, vitamins, amino acids, lecithin and minerals; and contain flavonoids which are a powerful antioxidant, eliminate free radicals, and prevent aging (Pandey and Rizvi, 2009). Although, most of the commercially cultivated grapes in India are introduced from major grape growing countries, and hence, interrelationships between them are not very clear (Jogaiah et al., 2013). Despite botanical homogeneity, grape varieties possess wide and unique phenotypic variability regarding berries size, shape and colour, and quality traits including berry composition, content of sugars, acidity and organic acids (Coombe, 1992; Shiraishi et al., 2010). Accurate identification of grape cultivars is difficult due to the vegetative propagation and reliance upon ampelography (Dhanorkar et al., 2005), and often, same variety is known by different names which may lead to confusion in nomenclature (Soyolt et al., 2013). Therefore, knowledge on genetic relationships and correct identification of varieties is essential for evolutionary studies, germplasm collection, and in situ conservation. However, use of molecular markers for grapevine identification is regarded as an alternative or supplementary to ampelography (Herrera et al., 2002; Bahurupe et al., 2013). Molecular markers provide powerful tools to reveal polymorphism at the DNA sequence level and are robust to detect genetic variability and are not influenced by the environment or the developmental stage of a plant, making them ideal for genetic relationships studies (Akhare et al., 2008). ISSR (Inter Simple Sequence Repeats) is a PCR-based technique and provide a reliable marker system for many organisms, especially plants (Modgil et al., 2005; Kandasamy et al., 2013) because of its simple, fast, high stability, no prior requirement of sequence information, cost effectiveness and versatility of markers. It involves amplification of the DNA segment present at an amplifiable distance in-between two identical microsatellite repeat regions oriented in opposite directions (Zietkiewicz et al., 1994). ISSR has been widely used for varietal fingerprinting or genetic diversity analysis, characterization of genetic relatedness among populations, detection of clonal variation, cultivar identification, phylogenetic analysis, detection of genomic instability, and assessment of hybridization (Bornet and Branchard, 2004; ABSTRACT In order to study the genetic variability of four grape cultivars (Nanasaheb purple, Sonaka, Thompson seedless and Ganesh), 10 ISSR primers were screened of which seven were found polymorphic. These polymorphic primers produced a sum total of 86 bands of which 56 were polymorphic. The grape cultivars grouped into two major clusters at 51 per cent similarity. The first cluster had only Nanasaheb purple whereas; the second cluster contained Sonaka, Thompson seedless and Ganesh cultivars. Thompson seedless and Ganesh in the second cluster showed a similarity coefficient of 0.63. Clustering was strongly supported by high bootstrap values. Resolving power of the ISSR primers ranged between 3 (UBC 850) and 10 (UBC 810), PIC value from 0.78 (UBC 850) to 0.88 (UBC 811, UBC 815 and UBC 834), and Marker indices (MI) from 3.89 (UBC 850) to 8.80 (UBC 815 and UBC 834) with a mean value of 6.14, 0.85, and 6.88, respectively. The results revealed that ISSR could be a better tool for evaluation of genetic diversity among the grape cultivars. KEYWORDS Genetic diversity ISSR PCA Vitis vinifera Received on : 06.01.2014 Accepted on : 10.05.2014 *Corresponding author

Welcome message from author
This document is posted to help you gain knowledge. Please leave a comment to let me know what you think about it! Share it to your friends and learn new things together.
Transcript
NSave Nature to Survive
9(2): 823-828, 2014 (Supplement on Genetics and Plant Breeding)www.thebioscan.in
823
ISSR BASED GENOTYPIC DIFFERENTIATION OF GRAPE (VITIS
VINIFERA L.)
R. S. CHOUDHARY1*, V. S. ZAGADE1, MABOODURRAHMAN2, G. D. KHALAKAR3 AND N. K. SINGH3
1Department of Plant Biotechnology,
K. K. Wagh College of Agricultural Biotechnology, Nashik - 422 003, Maharashtra, India2Department of Food Engineering,
K. K. Wagh College of Agricultural Biotechnology, Nashik - 422 003, Maharashtra, INDIA3C. P. College of Agriculture, S. D. Agricultural University, S. K. Nagar - 385 506, Gujarat, INDIA
e-mail: [email protected].
INTRODUCTION
Grapevine (Vitis vinifera L.) is one of the most importantperennial fruit crops botanically belonging to the familyVitaceae and is divided into 12 genera. Vitis vinifera is themost widely cultivated species of the genus Vitis and is grownthroughout the temperate and tropical regions. Vitis vinifera isknown for its wide morphological and genetic diversity andthere exist a large number of cultivars (Teixeira et al., 2013).In India, Grapes are cultivated over an area of 111.4 thousandhectares with a production of 1,234 thousand tonnes andproductivity 11.1 tonnes per hectare (NHB, 2011). Besidesbeing eaten as fresh fruit, grapes are also used for grape wine,grape juice, raisins and canned products. It contains highlevels of easily absorbable glucose, protein, vitamins, aminoacids, lecithin and minerals; and contain flavonoids whichare a powerful antioxidant, eliminate free radicals, and preventaging (Pandey and Rizvi, 2009).
Although, most of the commercially cultivated grapes in Indiaare introduced from major grape growing countries, andhence, interrelationships between them are not very clear(Jogaiah et al., 2013). Despite botanical homogeneity, grapevarieties possess wide and unique phenotypic variabilityregarding berries size, shape and colour, and quality traitsincluding berry composition, content of sugars, acidity andorganic acids (Coombe, 1992; Shiraishi et al., 2010). Accurateidentification of grape cultivars is difficult due to the vegetativepropagation and reliance upon ampelography (Dhanorkar et
al., 2005), and often, same variety is known by different names
which may lead to confusion in nomenclature (Soyolt et al.,
2013). Therefore, knowledge on genetic relationships and
correct identification of varieties is essential for evolutionary
studies, germplasm collection, and in situ conservation.
However, use of molecular markers for grapevine identification
is regarded as an alternative or supplementary to
ampelography (Herrera et al., 2002; Bahurupe et al., 2013).
Molecular markers provide powerful tools to reveal
polymorphism at the DNA sequence level and are robust to
detect genetic variability and are not influenced by the
environment or the developmental stage of a plant, making
them ideal for genetic relationships studies (Akhare et al.,
2008). ISSR (Inter Simple Sequence Repeats) is a PCR-based
technique and provide a reliable marker system for many
organisms, especially plants (Modgil et al., 2005; Kandasamy
et al., 2013) because of its simple, fast, high stability, no prior
requirement of sequence information, cost effectiveness and
versatility of markers. It involves amplification of the DNA
segment present at an amplifiable distance in-between two
identical microsatellite repeat regions oriented in opposite
directions (Zietkiewicz et al., 1994). ISSR has been widely
used for varietal fingerprinting or genetic diversity analysis,
characterization of genetic relatedness among populations,
detection of clonal variation, cultivar identification,
phylogenetic analysis, detection of genomic instability, and
assessment of hybridization (Bornet and Branchard, 2004;
ABSTRACTIn order to study the genetic variability of four grape cultivars (Nanasaheb purple, Sonaka, Thompson seedless
and Ganesh), 10 ISSR primers were screened of which seven were found polymorphic. These polymorphic
primers produced a sum total of 86 bands of which 56 were polymorphic. The grape cultivars grouped into two
major clusters at 51 per cent similarity. The first cluster had only Nanasaheb purple whereas; the second cluster
contained Sonaka, Thompson seedless and Ganesh cultivars. Thompson seedless and Ganesh in the second
cluster showed a similarity coefficient of 0.63. Clustering was strongly supported by high bootstrap values.
Resolving power of the ISSR primers ranged between 3 (UBC 850) and 10 (UBC 810), PIC value from 0.78 (UBC
850) to 0.88 (UBC 811, UBC 815 and UBC 834), and Marker indices (MI) from 3.89 (UBC 850) to 8.80 (UBC
815 and UBC 834) with a mean value of 6.14, 0.85, and 6.88, respectively. The results revealed that ISSR could
be a better tool for evaluation of genetic diversity among the grape cultivars.
KEYWORDSGenetic diversity
ISSR
PCA
Vitis vinifera
Received on :
06.01.2014
Accepted on :
10.05.2014
*Corresponding
author
824
R. S. CHOUDHARY et al.,
Tamhankar et al., 2001; Herrera et al., 2002; Hassan et al.,
2011; Joshi et al., 2013). Therefore, the present study was
aimed at using ISSR markers to assess the levels of genetic
diversity among the selected grape cultivars.
MATERIALS AND METHODS
Planting Material
Four grape cultivars (Nanasaheb Purple, Sonaka, Thompson
seedless and Ganesh) were collected from the Grapes and
Onion Research Centre, Pimpalgaon (Maharashtra, India). The
morphological characterization of these four varieties used in
the present study has been described in Table 1.
Isolation and quantification of DNA
The young immature leaves (200-300mg) were ground using
liquid nitrogen to a fine powder with mortar and pestle (frozen
rapidly at -20ºC) and were immediately transferred to a 1.5mL
microcentrifuge tube containing 700μL of prewarmed CTAB
buffer for isolation of DNA (Piccolo et al., 2012). The DNA
preparation was treated with RNase-A (Bangalore GeNei, India)
for 1 hour at 37ºC to remove RNA contamination and the
samples were diluted to a concentration of 50 ng/μL.
Selection of primers
Ten ISSR primers with good resolving power were procured
from UBC primer set (University of British Columbia,
Vancouver, Canada) and were screened for polymorphism
against the grape varieties. Of these, 7 ISSR primers (Table 2)
produced distinct banding pattern with good quality of
amplification and reproducibility, however, no band was
detected in any negative control.
Inter simple sequence repeat-PCR
PCR reactions were performed in a 20 μL reaction volume
[2.5 μL of 10X Taq buffer (with MgCl2), 5.0 μL of 100 mM
dNTPs, 2.0 μL (50 ng) of genomic DNA, 2.0 μL 10 pM primer,
0.3 μL of Taq DNA polymerase (1 U), 8.2 μL of sterile water]
using Eppendorf Master Cycler (Eppendorf, USA). PCR was
performed by using following thermal profile: 94ºC for 5
minutes (1 cycle); 94ºC for 1 minute, 40ºC for 1 minute, 72ºC
for 2 minutes (35 cycles); final extension at 72oC for 7 minutes
(1 cycle) and cooling of samples at 4ºC.
Agarose gel electrophoresis
The amplified PCR products were run on 1.4% agarose gel
using 1X TAE buffer stained with ethidium bromide along
with 1 kb marker (ëDNA). The profile was visualized under
UV transilluminator and documented using gel documentation
system (UVItec, Cambridge, UK).
Data collection and analysis
The documented ISSR profiles were carefully examined for
banding pattern, polymorphism and number of bands. A locus
was considered to be polymorphic if the band was present in
one variety and not in the other (Khalekar et al., 2014).
Resolving power (Rp) (Prevost and Wilkinson, 1999),
Polymorphic information content (PIC) (Smith et al., 1997)
and Marker index (MI) (Manimekalai and Nagarajan, 2006)
were calculated for the primers for better understanding
relation among the grapes cultivars. The data was analysed
using numerical taxonomy system of multivariate statistical
programme (NTSYSpc 2.02i) software package (Rohlf, 2000).
It was further used for construction of dendrogram using
unweighted pair group method of arithmetic averages
(UPGMA) and two-dimensional (2D) and three-dimensional
(3D) principal component analyses (PCA) using Jaccard’s
coefficient, EIGEN and PROJ modules of NTSYSpc.
Bootstrapping was done using WINBOOT software (Yap and
Nelson, 1996) with 1,000 replications.
RESULTS AND DISCUSSION
ISSR analysis
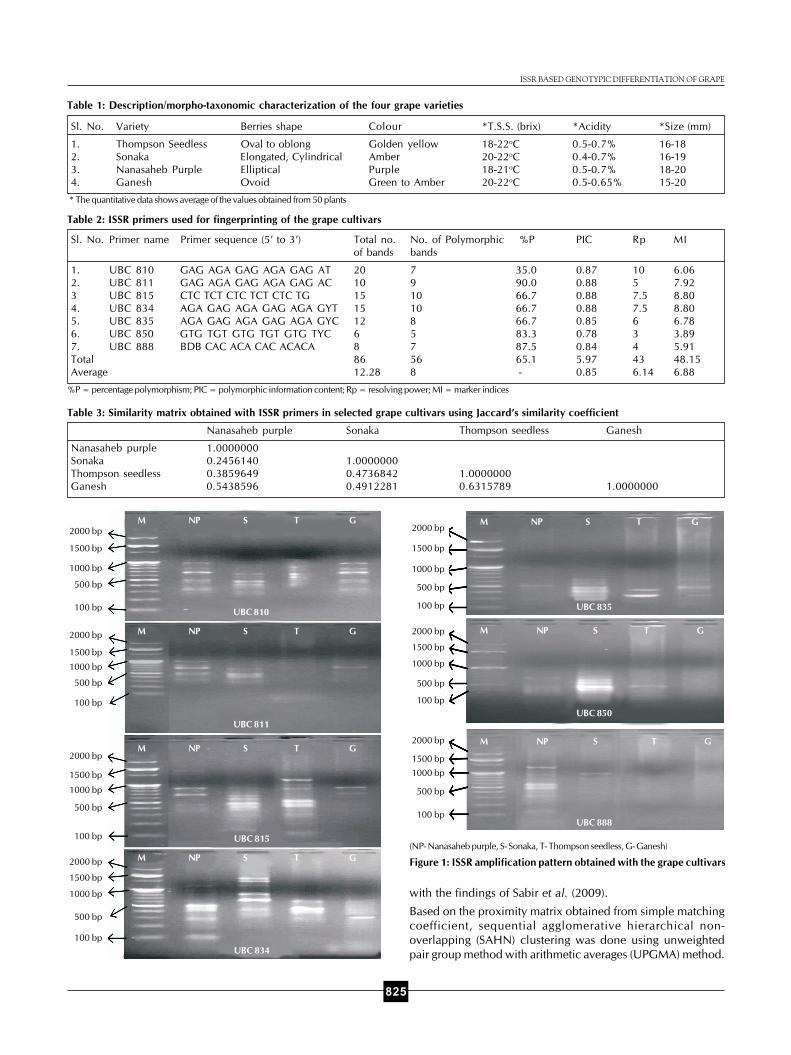
The preliminary screening of ten ISSR primers showed that
only seven primers (UBC 810, UBC 811, UBC 815, UBC 834,
UBC 835, UBC 850 and UBC 888) produced polymorphic
amplification pattern (Fig. 1), which were finally selected for
molecular profiling of the grape varieties. A total number of
bands produced by the polymorphic primers varied from 5
(UBC 850) to 10 (UBC 815). The total number of bands,
number of polymorphic bands, percent polymorphism (%P),
polymorphic information content (PIC), resolving power (Rp)
and marker indices (MI) are summarized in Table 2. The
resolving power (Rp) of the ISSR primers ranged between 3
(UBC 850) and 10 (UBC 810) with an average of 6.14. The
polymorphic information content (PIC) value for 7 primers
varied between 0.78 (UBC 850) and 0.88 (UBC 811, UBC 815
and UBC 834) with average of 0.85. The marker indices (MI)
of ISSR primers ranged from 3.89 (UBC 850) to 8.80 (UBC 815
and UBC 834) with a mean of 6.88.
Genetic variability
A total of 10 ISSR primers were screened for detection of
polymorphism among the four grape varieties, of these 7
primers gave polymorphic bands. The sequences of the
primers giving polymorphic bands indicate that the
microsatellites more frequently contain repeated dinucleotides
(AG)n, (GA)n, (GT)n and (CA)n. Overall, the number of
amplicons produced with the ISSR primers ranged from 6 (for
UBC 850) to 20(for UBC 810). However, the average number
of bands and average number polymorphic bands/primer for
7 ISSR primers were 12.8 and 8 respectively. Earlier findings
in grapevine cultivars also suggest wide variation in allele
produced per primer (Seyedimoradi et al., 2012). Such allelic
variation may be due to difference among the cultivars or
varieties used and concentration of the agarose gel (Powell et
al., 1996).
Polymorphism involves the existence of different forms (alleles)
of the same gene in plants or a population of plants. These
differences are tracked as molecular markers to identify desired
genes and the resulting trait. It has been reported that the
ability to resolve genetic variation may be more directly related
to the number of polymorphisms detected by the marker
system (Sivaprakash et al., 2004). The term polymorphic
information content (PIC), originally introduced by Botstein et
al. (1980), refers to the value of a marker detecting
polymorphism within a population depending on the number
of detectable alleles and their frequency. In the present
investigation, 7 ISSR primers produced PIC value ranging
between 0.78 (UBC 850) to 0.88 (UBC 811, UBC 815 and
UBC 834) with an average of 0.85, which was comparable
825
ISSR BASED GENOTYPIC DIFFERENTIATION OF GRAPE
Table 3: Similarity matrix obtained with ISSR primers in selected grape cultivars using Jaccard’s similarity coefficient
Nanasaheb purple Sonaka Thompson seedless Ganesh
Nanasaheb purple 1.0000000
Sonaka 0.2456140 1.0000000
Thompson seedless 0.3859649 0.4736842 1.0000000
Ganesh 0.5438596 0.4912281 0.6315789 1.0000000
Table 1: Description/morpho-taxonomic characterization of the four grape varieties
Sl. No. Variety Berries shape Colour *T.S.S. (brix) *Acidity *Size (mm)
1. Thompson Seedless Oval to oblong Golden yellow 18-22oC 0.5-0.7% 16-18
2. Sonaka Elongated, Cylindrical Amber 20-22oC 0.4-0.7% 16-19
3. Nanasaheb Purple Elliptical Purple 18-21oC 0.5-0.7% 18-20
4. Ganesh Ovoid Green to Amber 20-22oC 0.5-0.65% 15-20
* The quantitative data shows average of the values obtained from 50 plants
Table 2: ISSR primers used for fingerprinting of the grape cultivars
Sl. No. Primer name Primer sequence (5’ to 3’) Total no. No. of Polymorphic %P PIC Rp MI
of bands bands
1. UBC 810 GAG AGA GAG AGA GAG AT 20 7 35.0 0.87 10 6.06
2. UBC 811 GAG AGA GAG AGA GAG AC 10 9 90.0 0.88 5 7.92
3 UBC 815 CTC TCT CTC TCT CTC TG 15 10 66.7 0.88 7.5 8.80
4. UBC 834 AGA GAG AGA GAG AGA GYT 15 10 66.7 0.88 7.5 8.80
5. UBC 835 AGA GAG AGA GAG AGA GYC 12 8 66.7 0.85 6 6.78
6. UBC 850 GTG TGT GTG TGT GTG TYC 6 5 83.3 0.78 3 3.89
7. UBC 888 BDB CAC ACA CAC ACACA 8 7 87.5 0.84 4 5.91
Total 86 56 65.1 5.97 43 48.15
Average 12.28 8 - 0.85 6.14 6.88
%P = percentage polymorphism; PIC = polymorphic information content; Rp = resolving power; MI = marker indices
(NP- Nanasaheb purple, S- Sonaka, T- Thompson seedless, G- Ganesh)
Figure 1: ISSR amplification pattern obtained with the grape cultivars
2000 bp
1500 bp
1000 bp
500 bp
100 bp
2000 bp
1500 bp
1000 bp
500 bp
100 bp
2000 bp
1500 bp
1000 bp
500 bp
100 bp
2000 bp
1500 bp
1000 bp
500 bp
100 bp
M NP S T G
M NP S T G
M NP S T G
M NP S T G
UBC 834
UBC 815
UBC 811
UBC 810
2000 bp
1500 bp
1000 bp
500 bp
100 bp
2000 bp
1500 bp
1000 bp
500 bp
100 bp
2000 bp
1500 bp
1000 bp
500 bp
100 bp
M NP S T G
UBC 835
M NP S T G
UBC 850
M NP S T G
UBC 888
with the findings of Sabir et al. (2009).
Based on the proximity matrix obtained from simple matching
coefficient, sequential agglomerative hierarchical non-
overlapping (SAHN) clustering was done using unweighted
pair group method with arithmetic averages (UPGMA) method.
826
R. S. CHOUDHARY et al.,
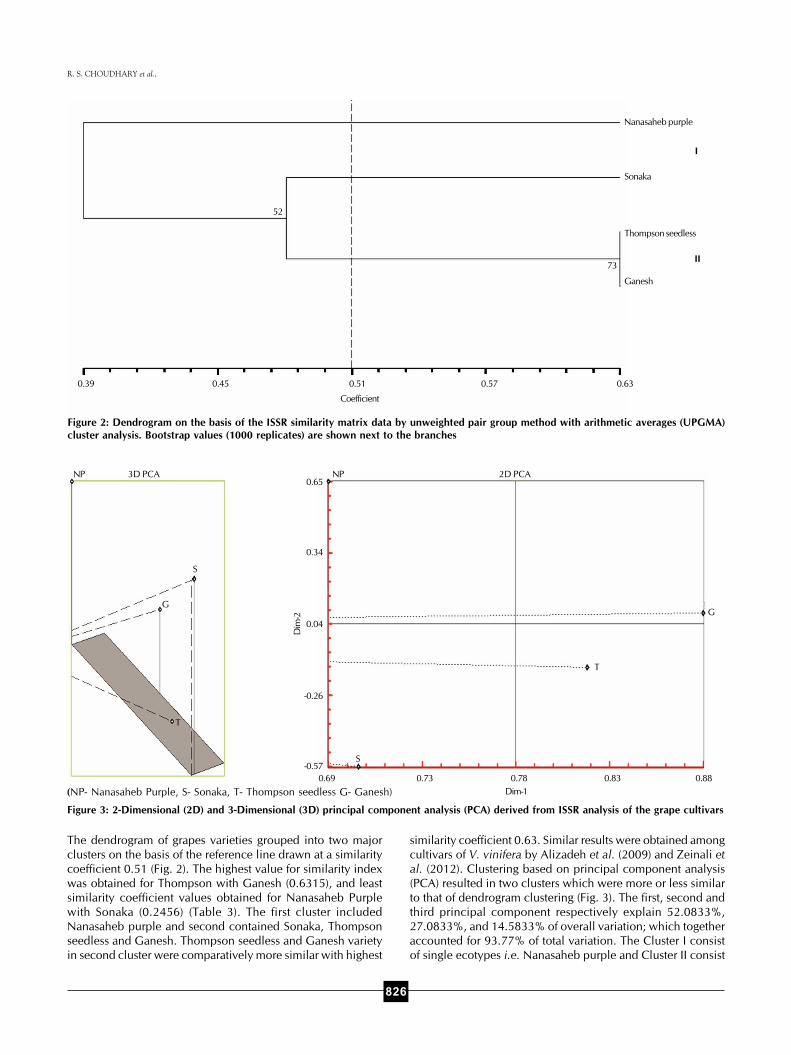
Figure 2: Dendrogram on the basis of the ISSR similarity matrix data by unweighted pair group method with arithmetic averages (UPGMA)
cluster analysis. Bootstrap values (1000 replicates) are shown next to the branches
Nanasaheb purple
Sonaka
Thompson seedless
Ganesh
I
II
52
73
0.39 0.45 0.51 0.57 0.63
Coefficient
(NP- Nanasaheb Purple, S- Sonaka, T- Thompson seedless G- Ganesh)
Figure 3: 2-Dimensional (2D) and 3-Dimensional (3D) principal component analysis (PCA) derived from ISSR analysis of the grape cultivars
3D PCANP
S
G
T
2D PCANP
G
T
S
Dim-1
Dim
-2
0.65
0.34
0.04
-0.26
-0.57
0.69 0.73 0.78 0.83 0.88
The dendrogram of grapes varieties grouped into two major
clusters on the basis of the reference line drawn at a similarity
coefficient 0.51 (Fig. 2). The highest value for similarity index
was obtained for Thompson with Ganesh (0.6315), and least
similarity coefficient values obtained for Nanasaheb Purple
with Sonaka (0.2456) (Table 3). The first cluster included
Nanasaheb purple and second contained Sonaka, Thompson
seedless and Ganesh. Thompson seedless and Ganesh variety
in second cluster were comparatively more similar with highest
similarity coefficient 0.63. Similar results were obtained among
cultivars of V. vinifera by Alizadeh et al. (2009) and Zeinali et
al. (2012). Clustering based on principal component analysis
(PCA) resulted in two clusters which were more or less similar
to that of dendrogram clustering (Fig. 3). The first, second and
third principal component respectively explain 52.0833%,
27.0833%, and 14.5833% of overall variation; which together
accounted for 93.77% of total variation. The Cluster I consist
of single ecotypes i.e. Nanasaheb purple and Cluster II consist
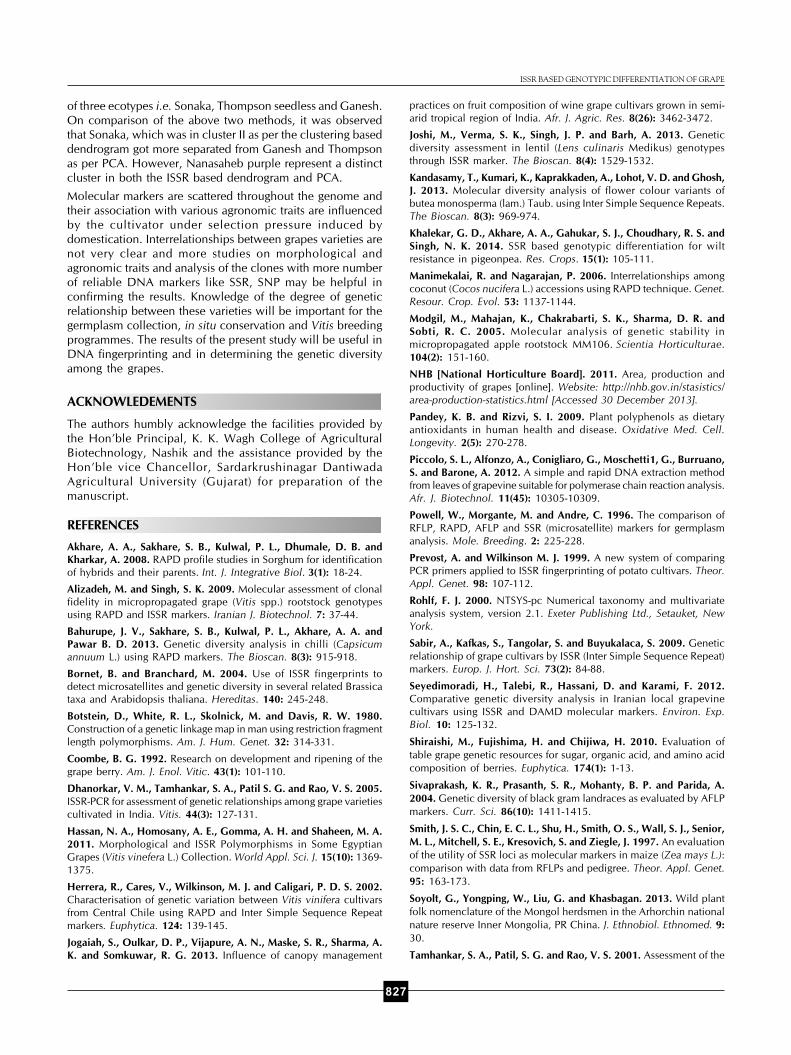
827
of three ecotypes i.e. Sonaka, Thompson seedless and Ganesh.
On comparison of the above two methods, it was observed
that Sonaka, which was in cluster II as per the clustering based
dendrogram got more separated from Ganesh and Thompson
as per PCA. However, Nanasaheb purple represent a distinct
cluster in both the ISSR based dendrogram and PCA.
Molecular markers are scattered throughout the genome and
their association with various agronomic traits are influenced
by the cultivator under selection pressure induced by
domestication. Interrelationships between grapes varieties are
not very clear and more studies on morphological and
agronomic traits and analysis of the clones with more number
of reliable DNA markers like SSR, SNP may be helpful in
confirming the results. Knowledge of the degree of genetic
relationship between these varieties will be important for the
germplasm collection, in situ conservation and Vitis breeding
programmes. The results of the present study will be useful in
DNA fingerprinting and in determining the genetic diversity
among the grapes.
ACKNOWLEDEMENTS
The authors humbly acknowledge the facilities provided by
the Hon’ble Principal, K. K. Wagh College of Agricultural
Biotechnology, Nashik and the assistance provided by the
Hon’ble vice Chancellor, Sardarkrushinagar Dantiwada
Agricultural University (Gujarat) for preparation of the
manuscript.
REFERENCES
Akhare, A. A., Sakhare, S. B., Kulwal, P. L., Dhumale, D. B. and
Kharkar, A. 2008. RAPD profile studies in Sorghum for identification
of hybrids and their parents. Int. J. Integrative Biol. 3(1): 18-24.
Alizadeh, M. and Singh, S. K. 2009. Molecular assessment of clonal
fidelity in micropropagated grape (Vitis spp.) rootstock genotypes
using RAPD and ISSR markers. Iranian J. Biotechnol. 7: 37-44.
Bahurupe, J. V., Sakhare, S. B., Kulwal, P. L., Akhare, A. A. and
Pawar B. D. 2013. Genetic diversity analysis in chilli (Capsicum
annuum L.) using RAPD markers. The Bioscan. 8(3): 915-918.
Bornet, B. and Branchard, M. 2004. Use of ISSR fingerprints to
detect microsatellites and genetic diversity in several related Brassica
taxa and Arabidopsis thaliana. Hereditas. 140: 245-248.
Botstein, D., White, R. L., Skolnick, M. and Davis, R. W. 1980.
Construction of a genetic linkage map in man using restriction fragment
length polymorphisms. Am. J. Hum. Genet. 32: 314-331.
Coombe, B. G. 1992. Research on development and ripening of the
grape berry. Am. J. Enol. Vitic. 43(1): 101-110.
Dhanorkar, V. M., Tamhankar, S. A., Patil S. G. and Rao, V. S. 2005.
ISSR-PCR for assessment of genetic relationships among grape varieties
cultivated in India. Vitis. 44(3): 127-131.
Hassan, N. A., Homosany, A. E., Gomma, A. H. and Shaheen, M. A.
2011. Morphological and ISSR Polymorphisms in Some Egyptian
Grapes (Vitis vinefera L.) Collection. World Appl. Sci. J. 15(10): 1369-
1375.
Herrera, R., Cares, V., Wilkinson, M. J. and Caligari, P. D. S. 2002.
Characterisation of genetic variation between Vitis vinifera cultivars
from Central Chile using RAPD and Inter Simple Sequence Repeat
markers. Euphytica. 124: 139-145.
Jogaiah, S., Oulkar, D. P., Vijapure, A. N., Maske, S. R., Sharma, A.
K. and Somkuwar, R. G. 2013. Influence of canopy management
practices on fruit composition of wine grape cultivars grown in semi-
arid tropical region of India. Afr. J. Agric. Res. 8(26): 3462-3472.
Joshi, M., Verma, S. K., Singh, J. P. and Barh, A. 2013. Genetic
diversity assessment in lentil (Lens culinaris Medikus) genotypes
through ISSR marker. The Bioscan. 8(4): 1529-1532.
Kandasamy, T., Kumari, K., Kaprakkaden, A., Lohot, V. D. and Ghosh,
J. 2013. Molecular diversity analysis of flower colour variants of
butea monosperma (lam.) Taub. using Inter Simple Sequence Repeats.
The Bioscan. 8(3): 969-974.
Khalekar, G. D., Akhare, A. A., Gahukar, S. J., Choudhary, R. S. and
Singh, N. K. 2014. SSR based genotypic differentiation for wilt
resistance in pigeonpea. Res. Crops. 15(1): 105-111.
Manimekalai, R. and Nagarajan, P. 2006. Interrelationships among
coconut (Cocos nucifera L.) accessions using RAPD technique. Genet.
Resour. Crop. Evol. 53: 1137-1144.
Modgil, M., Mahajan, K., Chakrabarti, S. K., Sharma, D. R. and
Sobti, R. C. 2005. Molecular analysis of genetic stability in
micropropagated apple rootstock MM106. Scientia Horticulturae.
104(2): 151-160.
NHB [National Horticulture Board]. 2011. Area, production and
productivity of grapes [online]. Website: http://nhb.gov.in/stasistics/
area-production-statistics.html [Accessed 30 December 2013].
Pandey, K. B. and Rizvi, S. I. 2009. Plant polyphenols as dietary
antioxidants in human health and disease. Oxidative Med. Cell.
Longevity. 2(5): 270-278.
Piccolo, S. L., Alfonzo, A., Conigliaro, G., Moschetti1, G., Burruano,
S. and Barone, A. 2012. A simple and rapid DNA extraction method
from leaves of grapevine suitable for polymerase chain reaction analysis.
Afr. J. Biotechnol. 11(45): 10305-10309.
Powell, W., Morgante, M. and Andre, C. 1996. The comparison of
RFLP, RAPD, AFLP and SSR (microsatellite) markers for germplasm
analysis. Mole. Breeding. 2: 225-228.
Prevost, A. and Wilkinson M. J. 1999. A new system of comparing
PCR primers applied to ISSR fingerprinting of potato cultivars. Theor.
Appl. Genet. 98: 107-112.
Rohlf, F. J. 2000. NTSYS-pc Numerical taxonomy and multivariate
analysis system, version 2.1. Exeter Publishing Ltd., Setauket, New
York.
Sabir, A., Kafkas, S., Tangolar, S. and Buyukalaca, S. 2009. Genetic
relationship of grape cultivars by ISSR (Inter Simple Sequence Repeat)
markers. Europ. J. Hort. Sci. 73(2): 84-88.
Seyedimoradi, H., Talebi, R., Hassani, D. and Karami, F. 2012.
Comparative genetic diversity analysis in Iranian local grapevine
cultivars using ISSR and DAMD molecular markers. Environ. Exp.
Biol. 10: 125-132.
Shiraishi, M., Fujishima, H. and Chijiwa, H. 2010. Evaluation of
table grape genetic resources for sugar, organic acid, and amino acid
composition of berries. Euphytica. 174(1): 1-13.
Sivaprakash, K. R., Prasanth, S. R., Mohanty, B. P. and Parida, A.
2004. Genetic diversity of black gram landraces as evaluated by AFLP
markers. Curr. Sci. 86(10): 1411-1415.
Smith, J. S. C., Chin, E. C. L., Shu, H., Smith, O. S., Wall, S. J., Senior,
M. L., Mitchell, S. E., Kresovich, S. and Ziegle, J. 1997. An evaluation
of the utility of SSR loci as molecular markers in maize (Zea mays L.):
comparison with data from RFLPs and pedigree. Theor. Appl. Genet.
95: 163-173.
Soyolt, G., Yongping, W., Liu, G. and Khasbagan. 2013. Wild plant
folk nomenclature of the Mongol herdsmen in the Arhorchin national
nature reserve Inner Mongolia, PR China. J. Ethnobiol. Ethnomed. 9:
30.
Tamhankar, S. A., Patil, S. G. and Rao, V. S. 2001. Assessment of the
ISSR BASED GENOTYPIC DIFFERENTIATION OF GRAPE
828
R. S. CHOUDHARY et al.,
Genetic diversity of some important grape genotypes in India using
RAPD markers. Vitis. 40: 157-161.
Teixeira, A., Eiras-Dias, J. and Geros, H. 2013. Berry phenolics of
grapevine under challenging environments. Int. J. Mol. Sci. 14: 18711-
18739.
Yap, I. and Nelson, R. J. 1996. Winboot: a program for performing
bootstrap analysis of binary data to determine the confidence limits of
UPGMA-based dendrogram. IRRI. Discussion paper series no 14,
International Rice Institute, Manila, Philippines. http://www.irri.org/
science/software/winboot.asp.
Zeinali, R., Rahmani, F., Abaspour, N. and Baneh, H. D. 2012.
Molecular and morphological diversity among grapevine (Vitis vinifera
L.) Cultivars in Iran. International J. Agril. Res. Rev. 2(6): 735-743.
Zietkiewicz, E., Rafalski, A. and Labuda, D. 1994. Genome
fingerprinting by simple sequence repeat (SSR)-anchored polymerase
chain reaction amplification. Genomics. 20: 176-183.
Related Documents