ISSN (Print): 0972-6268; ISSN (Online) : 2395-3454 Vol. 18, No. 5 (Special Issue), 2019 (Special Issue on Clean Water, Air & Soil, 2019)

Welcome message from author
This document is posted to help you gain knowledge. Please leave a comment to let me know what you think about it! Share it to your friends and learn new things together.
Transcript

ISSN (Print): 0972-6268; ISSN (Online) : 2395-3454Vol. 18, No. 5 (Special Issue), 2019
(Special Issue on Clean Water, Air & Soil, 2019)
(An International Quarterly Scientific Research Journal)
EDITORS
Dr. P. K. Goel Dr. K. P. SharmaFormer Head, Deptt. of Pollution Studies Former Professor, Deptt. of BotanyY. C. College of Science, Vidyanagar University of RajasthanKarad-415 124, Maharashtra, India Jaipur-302 004, India
Published by : Mrs. T. P. Goel, B-34, Dev Nagar, Tonk Road, Jaipur-302 018Rajasthan, India
Managing Office : Technoscience Publications, A-504, Bliss Avenue, Balewadi,Pune-411 045, Maharashtra, India
E-mail : [email protected]; [email protected]@gmail.com
Scope of the JournalThe Journal publishes original research/review papers covering almost all aspects ofenvironment like monitoring, control and management of air, water, soil and noisepollution; solid waste management; industrial hygiene and occupational health hazards;biomedical aspects of pollution; conservation and management of resources;environmental laws and legal aspects of pollution; toxicology; radiation and recyclingetc. Reports of important events, environmental news, environmental highlights andbook reviews are also published in the journal.
Format of Manuscript• The manuscript (mss) should be typed in double space leaving wide margins on both the
sides.• First page of mss should contain only the title of the paper, name(s) of author(s) and
name and address of Organization(s) where the work has been carried out along with theaffiliation of the authors.
Continued on back inner cover...
INSTRUCTIONS TO AUTHORS
www.neptjournal.com
A-504, Bliss Avenue, Balewadi,Opp. SKP Campus, Pune-411 045
Maharashtra, India

Nature Environment and Pollution TechnologyVol. 18, No. (5) Special Issue, December, 2019
(Special Issue on Clean Water, Air & Soil, 2019)
CONTENTS1. Nur-Syakeera Mahmud, Nur-NazifahMansor, Siti-Zahrah Abdullah, K. C. A. Jalal,
R. Rimatulhana and M. N. AmaAssessment of Bacteria and Water Quality Parameters in CageCultured Pangasius hypophthalmus in Temerloh, Pahang River, Malaysia 1479-1486
2. Liying Zhang, Cuixia Li and Nguyen Hoang Phuong, Economic Development of Biomass EnergyIndustry in Heilongjiang Province Based on Analytic Hierarchy Process 1487-1493
3. Liying Zhang and Cuixia Li, Carbon Emission from Modern Coal Chemical Industry and Its EconomicImpact in the Rebuilding of Old Industrial Base in Northeast China 1495-1500
4. Hui-rong Wei and Nguyen Xuan Phuong, Decolourization and Stability of Ozone Oxidation inMunicipal Wastewater Regeneration 1501-1507
5. Lin Huang, Fengyin Liu and Van Huong Dong, Geotechnical Slope Protection Model Based onGenetic Algorithm 1509-1513
6. Lin Huang, Fengyin Liu, Thi Thuy Hoa Phan and Van Huong Dong, Factors Affecting SlopeReinforcement Based on Data Mining Algorithm 1515-1520
7. Zhilong Xu, Shuai Zhai and Nguyen Xuan Phuong, Research on Green Transition Development ofEnergy Enterprises Taking Mining Industry as an Example 1521-1526
8. Ying Ma, Mathematical Model for Determining the Economic Well Depth in Mine Lots 1527-15339. Junzhao Gao, Dongqi Tang and Muhammad Aqeel Ashraf, Analysis of Deep Foundation Treatment
of Soft Soil Under Strong Corrosion Conditions 1535-154010. Xuemei Bai, Numerical Simulation and Stability Analysis of Grouting in Hydraulic Engineering 1541-154711. Juan Ling, Yuanfang Wu and Jiabao Ding, Research on Automatic Analysis Technology of Remote
Sensing Monitoring Based on GIS 1549-155412. Ying Dong, Xijun Wu and Ahmad Jalal Khan Chowdhury, Study on Calculation Method of Ecological
Environment Flow Rate of Water Conservancy and Hydropower Project in Coal Mining Area 1555-156013. Zhi-qi Zhou, Study on the Index System of Environmental Impact Assessment (EIA) of Water
Conservancy Projects 1561-156514. Wei Li, Yan Li, Lei Wang and Haroon Rashid, Atmospheric Quality Testing Based on Deep Learning 1567-157215. Xinghua Wang, System Simulation Optimization of Resource and Environmental Effects of Circular
Economy 1573-157816. Xiaoqin Wang, Mengying Peng, Ciyu Wang and Ahmed Jalal Khan Chowdhury, Effect of Lime-
bone Ratio on Compressive Strength and Void Fraction of Recycled Green Ecological Concrete 1579-158317. Hongzhi Zhou, Gang Yu and Linguo Li, Environmental Monitoring and Management System Based
on K-Means Algorithms 1585-159118. Lefei Xuan, Xiaojing Tu, Mengning Niu and Muhammad Aqeel Ashraf, Sewage Discharge Monitoring
and Management System Based on K-Means Algorithms 1593-159919. Lefei Xuan, Xiaojing Tu, Mengning Niu and Ahmed Jalal Khan Chowdhury, Sewage Monitoring
System Based on Artificial Intelligence 1601-160720. Bin Zhou, Groundwater Pollution Diffusion Model Based on Partial Differential Equation 1609-161321. Hongxin Wang, Research on Underground Sewage Monitoring System Based on Intelligent Algorithm 1615-162022. Haiying Zhang and Ahmed Jalal Khan Chowdhury, Research on Integrated Technology of
Desulphurization, Denitration and Waste Heat Recovery of Coke Oven Flue Gas 1621-162523. Guo Huiling and Liu Xin, Coal-Rock Interface Recognition Method Based on Image Recognition 1627-163324. Yan Zhang, Research on the Early Warning Model of Environmental Desertification Based on
Grid Scale 1635-1640

25. Caijun Wang, Wenjun Lu, Chuanchuan Xi and Xuan Phuong Nguyen, Research on Green BuildingEnergy Management Based on BIM and FM 1641-1646
26. Bin Zhou, Dan He and Rodeano Roslee, Study on Mathematical Modelling of Geological HazardAssessment 1647-1654
27. Yaqi Chen, Muhammad Aqeel Ashraf and Haroon Rashid, Effects of Drip Irrigation on Water Saving,Fertilization and Gas Emission in Arid Regions 1655-1660
28. Haijuan Jin, Application of Fuzzy Mathematical Evaluation Method in Classification and Evaluationof Condensate Gas Reservoir 1661-1666
29. Xiaoli Cai, Shahreen Kassim and Van Huong Dong, Environmental Monitoring Wireless SensorNetwork Node Energy Technology Analysis 1667-1673
30. Jinpu Liu, Rui Song, Saima Nasreen and Anh Tuan Hoang, Analysis of the Complementary Propertyof Solar Energy and Thermal Power Based on Coupling Model 1675-1681
31. Wenjuan Liu, Performance of New Permeable Concrete Materials based on Mechanical Strength 1683-168932. Gan Wan and Jun Zhang, Carbon Regulation and Trading Supply Chain Factory Production and
Emission Reduction Decision System 1691-169933. Cuiping Kang, Muhammad Aqeel Ashraf and Yung-Tse Hung, Study on Dye-Sensitized Solar Cells
Based on TiO2 Composite Nanomaterials 1701-170434. Zou Hang, Muhammad Aqeel Ashraf and Yung-Tse Hung, Water Pollution in Old Towns Affecting
the Environment and Ecological restoration 1705-171135. Shupei Ouyang, Muhammad Aqeel Ashraf and Yung-Tse Hung, Application of Rb/Sr Ratio in
Paleo-climate Inversion 1713-171836. Lei Wang, Wei Li and Yan Li, Research on Coal Mine Gas Concentration Prediction Based on Cloud
Computing Technology Under the Background of Internet 1719-172537. Fu-Xing Liu, Jun-Tao Zhu and Van Huong Dong, Research on Sewage Treatment Computer System
Based on ADP Iterative Algorithm 1727-173238. Chen Chen, Noshabah Tabssum and Hoang Phuong Nguyen, Study on Ancient Chu Town Urban
Green Space Evolution and Ecological and Environmental Benefits 1733-173839. Yunan Zhang, Bilin Xu and Haroon Rashid, Air Treatment Effect Assessment for Improving Vehicle
Emission Standards: Counterfactual Analysis Based on Machine Learning 1739-174540. Hong Liu, Pengfei Gao, Jing Fu and Haroon Rashid, Effects of Different Microbial Treatments on the
Removal of Petroleum Hydrocarbons from Soil 1747-1755

www.neptjournal.com
The Journal
is
Currently
Abstractedand
Indexedin:
Scopus®, SJR (0.146) 2018
NAAS Rating of the Journal (2019) = 3.85
Zoological Records
Indian Citation Index (ICI)
EBSCO: Environment Index™
ProQuest, U.K.
British Library
WorldCat (OCLC) JournalSeek
Indian Science Geobase
SHERPA/RoMEO Directory of Science
Indian Science Abstracts,New Delhi, India
Elsevier BibliographicDatabases
EI Compendex of Elsevier
Access to Global Online Research in Agriculture (AGORA)
Full papers are available on the Journal’s Website:www.neptjournal.com
International Scientific Indexing (UAE) with Impact Factor 2.236 (2018)
Index Copernicus (2016) = 109.45
Paryavaran Abstract,New Delhi, India
Electronic Social and ScienceCitation Index (ESSCI)
Chemical Abstracts, U.S.A.
Pollution Abstracts, U.S.A.
Google Scholar
CSA: Environmental Sciences and Pollution Management
Environment Abstract, U.S.A.
Zetoc
Connect Journals (India)
Research Bible (Japan)
ElektronischeZeitschriftenbibliothek (EZB)
CNKI Scholar (China NationalKnowledge Infrastructure)
J-Gate
Centre for Research Libraries
AGRIS (UN-FAO)
The journal is also included in the UGC CARE list of journals in India
UDL-EDGE (Malaysia) Products like i-Journals, i-Focus and i-Future

Dr. P. K. Goel Dr. K. P. SharmaFormer Head, Deptt. of Pollution Studies Former Professor, Ecology Lab, Deptt. of BotanyYashwantrao Chavan College of Science University of RajasthanVidyanagar, Karad-415 124 Jaipur-302 004, IndiaMaharashtra, India Rajasthan, IndiaManager Operations: Mrs. Apurva Goel Garg, C-102, Building No. 12, Swarna CGHS, Beverly Park, Kanakia,Mira Road (E)-401107, Distt. Thane, Maharashtra, India (E-mail: [email protected])Business Manager: Mrs. Tara P. Goel, Technoscience Publications, A-504, Bliss Avenue, Balewadi,Pune-411 045, Maharashtra, India (E-mail: [email protected])
Nature Environment and Pollution Technology
1. Dr. Prof. Malay Chaudhury, Department of Civil Engineering, Universiti Teknologi PETRONAS, Malaysia
2. Dr. Saikat Kumar Basu, University of Lethbridge,Lethbridge AB, Canada
3. Dr. Sudip Datta Banik, Department of Human EcologyCinvestav-IPN Merida, Yucatan, Mexico
4. Dr. Elsayed Elsayed Hafez, Deptt. of of Molecular PlantPathology, Arid Land Institute, Egypt
5. Dr. Dilip Nandwani, College of Agriculture, Human & Natu-ral Sciences, Tennessee State Univ., Nashville, TN, USA
6. Dr. Ibrahim Umaru, Department of Economics, NasarawaState University, Keffi, Nigeria
7. Dr. Tri Nguyen-Quang, Department of EngineeringAgricultural Campus, Dalhousie University, Canada
8. Dr. Hoang Anh Tuan, Deptt. of Science and TechnologyHo Chi Minh City University of Transport, Vietnam
9. Mr. Shun-Chung Lee, Deptt. of Resources Engineering,National Cheng Kung University, Tainan City, Taiwan
10. Samir Kumar Khanal, Deptt. of Molecular Biosciences &Bioengineering,University of Hawaii, Honolulu, Hawaii
11. Dr. Sang-Bing Tsai, Zhongshan Institute,University of Electronic Science and Technology, China
12. Dr. Zawawi Bin Daud, Faculty of Civil and EnvironmentalEngg., Universiti Tun Hussein Onn Malaysia, Johor, Malaysia
13. Dr. Srijan Aggarwal, Civil and Environmental Engg.University of Alaska, Fairbanks, USA
14. Dr. M. I. Zuberi, Department of Environmental Science,Ambo University, Ambo, Ethiopia
15. Dr. Prof. A.B. Gupta, Dept. of Civil Engineering, MREC,Jaipur, India
16. Dr. B. Akbar John, Kulliyyah of Science, InternationalIslamic University, Kuantan, Pahang, Malaysia
17. Dr. Bing Jie Ni, Advanced Water Management Centre,The University of Queensland, Australia
18. Dr. Prof. S. Krishnamoorthy, National Institute of Technol-ogy, Tiruchirapally, India
19. Dr. Prof. (Mrs.) Madhoolika Agarwal, Dept. of Botany,B.H.U., Varanasi, India
20. Dr. Anthony Horton, Envirocarb Pty Ltd., Australia21. Dr. C. Stella, School of Marine Sciences,
Alagappa University, Thondi -623409, Tamil Nadu, India22. Dr. Ahmed Jalal Khan Chowdhury, International Islamic
University, Kuantan, Pahang Darul Makmur, Malaysia23. Dr. Prof. M.P. Sinha, Dumka University, Dumka, India24. Dr. G.R. Pathade, H.V. Desai College, Pune, India25. Dr. Hossam Adel Zaqoot, Ministry of Environmental
Affairs, Ramallah, Palestine26. Prof. Riccardo Buccolieri, Deptt. of Atmospheric Physics,
University of Salento-Dipartimento di Scienze e TecnologieBiologiche ed Ambientali Complesso Ecotekne-Palazzina MS.P. 6 Lecce-Monteroni, Lecce, Italy
27. Dr. James J. Newton, Environmental Program Manager701 S. Walnut St. Milford, DE 19963, USA
28. Prof. Subhashini Sharma, Dept. of Zoology, Uiversity ofRajasthan, Jaipur, India
29. Dr. Murat Eyvaz, Department of EnvironmentalEngg. Gebze Inst. of Technology, Gebze-Kocaeli, Turkey
30. Dr. Zhihui Liu, School of Resources and EnvironmentScience, Xinjiang University, Urumqi , China
31. Claudio M. Amescua García, Department of PublicationsCentro de Ciencias de la Atmósfera, Universidad NacionalAutónoma de, México
32. Dr. D. R. Khanna, Gurukul Kangri Vishwavidyalaya,Hardwar, India
33. Dr. S. Dawood Sharief, Dept. of Zoology, The NewCollege, Chennai, T. N., India
34. Dr. Amit Arora, Department of Chemical Engineering Shaheed Bhagat Singh State Technical Campus Ferozepur -152004, Punjab, India
35. Dr. Xianyong Meng, Xinjiang Inst. of Ecology and Geo-graphy, Chinese Academy of Sciences, Urumqi , China
36. Dr. Sandra Gómez-Arroyo, Centre of Atmospheric SciencesNational Autonomous University, Mexico
37. Dr. Nirmal Kumar, J. I., ISTAR, Vallabh Vidyanagar,Gujarat, India
38. Dr. Wen Zhang, Deptt. of Civil and EnvironmentalEngineering, New Jersey Institute of Technology, USA
EDITORIAL ADVISORY BOARD
GUEST EDITORS
EDITORS
Prof. Dr. Ahmad Jalal Khan ChwodhuryKulliyah of ScienceInternational Islamic University, Malaysia
Prof. Dr. Muhammad Aqeel AshrafSchool of Environmental StudiesChina University of Geosciences, Wuhan, China
Assessment of Bacteria and Water Quality Parameters in Cage Cultured Pangasius hypophthalmus in Temerloh, Pahang River, Malaysia
Nur-Syakeera Mahmud*, Nur-NazifahMansor*†, Siti-Zahrah Abdullah**, K. C. A. Jalal*, R. Rimatulhana** and M. N. Amal****Kulliyyah of Science, International Islamic University Malaysia, Bandar InderaMahkota, 25200 Kuantan, Pahang, Malaysia**National Fish Health Research Centre, 11960, BatuMaung, Penang, Malaysia***Department of Biology, Faculty of Science, 43400 Serdang, Selangor, Malaysia†Corresponding Author: Nur NazifahMansor
ABSTRACT
Pangasius hypophthalmus or famously known by local Malaysians as Patin Hitam is one of the most important sources of food in Malaysia. It is widely cultured in the Peninsular Malaysia especially in Pahang as Patin and is a popularly consumed freshwater fish. Global economic interest in the fish has increased its demand in the USA and Europe. However, high mortality due to bacterial and viral infections is the main problem that needs to be solved. Therefore, bacteria in P. hypophthalmus in Pahang is being focused with the factors connected to the prevalence of bacteria and virus in P. hypophthalmus. This research was conducted for two cycles (February-September 2016 and January-August 2017) in different farms in Temerloh, Pahang. Bacteria and virus samples were taken from three organs of Patin Hitam which are kidney, liver and spleen. Physical parameters for water quality were measured using a multi-parameter probe sensor (YSI, USA) and chemical parameters were analysed with DR900 colorimeter (Hach, USA). Bacteria samples were identified using biochemical test kits, API 20NE and 20E, followed by confirmation of the bacteria using Polymerase Chain Reaction (PCR). Virus samples were identified using conventional PCR. There are several bacteria isolated throughout the culture period. The highest prevalence of Aeromonas hydrophila in Temerloh in the first cycle was in May 2016 (40%), however, was equally evident in four out of the seven months of the second cycle, which was in April, May, June and July 2017 (20%). There was a relationship between the prevalence of A. hydrophila and iron, nitrite and pH in the first cycle in Temerloh. However, there was no relationship in the second cycle. Significantly, these results could contribute to better treatment of fish disease and development of standard operating procedure of future fish culture for early disease prevention.
INTRODUCTION
Fish farming is one of the most important sectors that con-tribute economically in Malaysia. In Malaysia, catfish is the largest freshwater aquaculture species being cultured including, Pangasius spp., Clarias spp. and Mystus numer-us. Pangasius spp. is one of the largest and most important freshwater fisheries in the world and Vietnam producing more than 1.1 million tons in 2008. Other producers are Thailand, Cambodia, Laos People’s Democratic Republic, Myanmar, Malaysia, Bangladesh and China (FAO 2009). The production of Pangasius spp. in Malaysia showed tenfold in-crease from 1,625.21 tons in 2000 to 10,891.51 tons in 2011. Although the production of Pangasius spp. is increasing, it is reported to face disease problem causing 30% mortality especially in Sungai Pahang due to multiple combination of bacterial and viral infections. It has been reported that Patin Hitam or Pangasuis spp. were susceptible to diseases such as aeromonad infection or Motile Aeromonas Septicemia
(MAS) caused by Aeromonas spp. (Subagja et al. 1999, Ferguson et al. 2001), bacillary necrosis of Pangasius (BNP) caused by Edwardsiella ictaluri (Crumlish et al. 2002, Asnor et al. 2018), Channel Catfish Virus caused by herpes virus (Siti Zahrah et al. 2013), and some ecto- and endoparasites infestations (Mavuti et al. 2012, Amir et al. 2018).
MAS is caused by any of the three species of the genus Aeromonas which are Aeromonas hydrophila, A. caviae and A. sobria. These species are commonly referred to as motile aeromonads (Hanson et al. 2014). The widespread distri-bution of these bacteria in the aquatic environment and the stress induced by intensive culture practices predisposes fish to infections. Involvement of bacteria is very vital in produc-ing diseases in the farmed fishes in Bangladesh (Chowdhury 1998, Bikram et al. 2019). Channel catfish virus (CCV) disease is an acute infection of cultured fry and fingerling channel catfish (Ictalurus punctatus) which occurs mainly during summer and is often in fish less than four months old but with a few exceptions (Plumb 1986, Jing et al. 2018).
Nat. Env. & Poll. Tech.Website: www.neptjournal.com
Received: 28-08-2019 Accepted: 14-10-2019
Key Words:Cage culture Pangasius hypophthalmus Pahang River Water quality
2019pp. 1479-1486 Vol. 18
p-ISSN: 0972-6268 No. 5 (Special Issue)
Nature Environment and Pollution Technology An International Quarterly Scientific Journal
Original Research Paper
e-ISSN: 2395-3454
Open Access
1480 Nur-Syakeera Mahmud et al.
Vol. 18, No. 5 (Special Issue), 2019 • Nature Environment and Pollution Technology
The environmental conditions which include availability of iron, oxygen levels, osmotic strength, pH, rainfall, water quality and temperature, and poor management practices (inadequate nutrition, overcrowding and overfeeding) can cause stress to the cultured fish and thus, making them more vulnerable to disease outbreaks (Winton 2001, Feng 2018). However, the information on the effect of water quality on the presence and susceptibility of fish to MAS and CCV infection diseases under the field conditions are limited. In this paper, the prevalence of bacteria and virus and factors associated with the infections were studied.
MATERIALS AND METHODS
Sample collection and bacterial isolation from fish, water and sediment: Ten fish from each farm were collected and dissected on field. Bacteria from kidney, liver and spleen tissues were swabbed and streaked onto Tryptic Soy Agar (TSA) media plates. Samples were brought back to the lab-oratory and were incubated at 30°C for 18 h (Pridgeon 2011, Khairunnisa et al. 2018). Single colonies were isolated to ob-tain pure colony cultures. Bacteria from water and sediment samples collected were also isolated to obtain pure colony.
Bacterial identification (API and PCR kit): From pure cul-ture of bacteria, gram staining was conducted to classify the bacteria as gram positive or gram-negative bacteria. Next was biochemical tests for catalase and oxidase enzymes. After the classification, gram positive bacteria were identified using API 20E kit, while gram negative bacteria were identified using API 20NE kit. Bacteria were further identified by 16S rRNA PCR using universal primer 27F/1492R with the fol-
lowing amplification protocol: initial denaturation at 95°C for 5 min, followed by 30 cycles of 95°C for 30s (denaturation), 55°C for 30 s (annealing) and 72°C for 30s (extension), and a final extension of 72°C for 10 min (Wu 2012). The ampli-fied PCR products were then sent for sequencing (First Base Laboratories, Serdang, Malaysia). Sequence data obtained were analyzed using the basic local alignment search tool (BLAST) available at the National Center for Biotechnology Information (NCBI) (http//:www.ncbi.nlm.nih.gov/BLAST) to obtain bacterial species identity defined by 97% homology.
Water quality observation (physical and chemical): For physical parameters of water, the data of temperature, pH and dissolved oxygen were recorded using multi-parameter probe sensor (YSI, USA). Water samples were brought to the laboratory for water chemical content observation which in-clude nitrite, sulfide, ammonia and iron measured by DR900 colorimeter (Hach, USA).
Statistical analysis: Data were analyzed by a one-way ANOVA with the assumptions of normal distribution and homogeneity of variance were checked by the Shapiro-Wilk and the Levene’s tests, respectively. Tukey’s post-hoc test was used for comparisons between means with significant differences (p < 5). The statistical analyses were run with IBM SPSS v.20 software for Windows.
RESULTS AND DISCUSSION
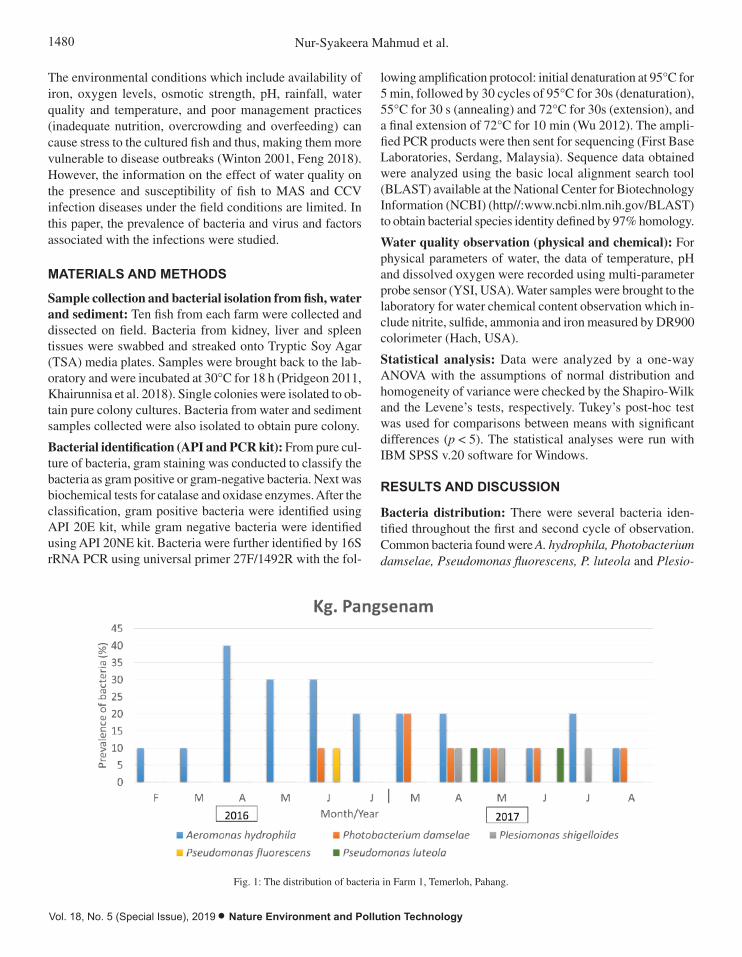
Bacteria distribution: There were several bacteria iden-tified throughout the first and second cycle of observation. Common bacteria found were A. hydrophila, Photobacterium damselae, Pseudomonas fluorescens, P. luteola and Plesio-
RESULTS AND DISCUSSION
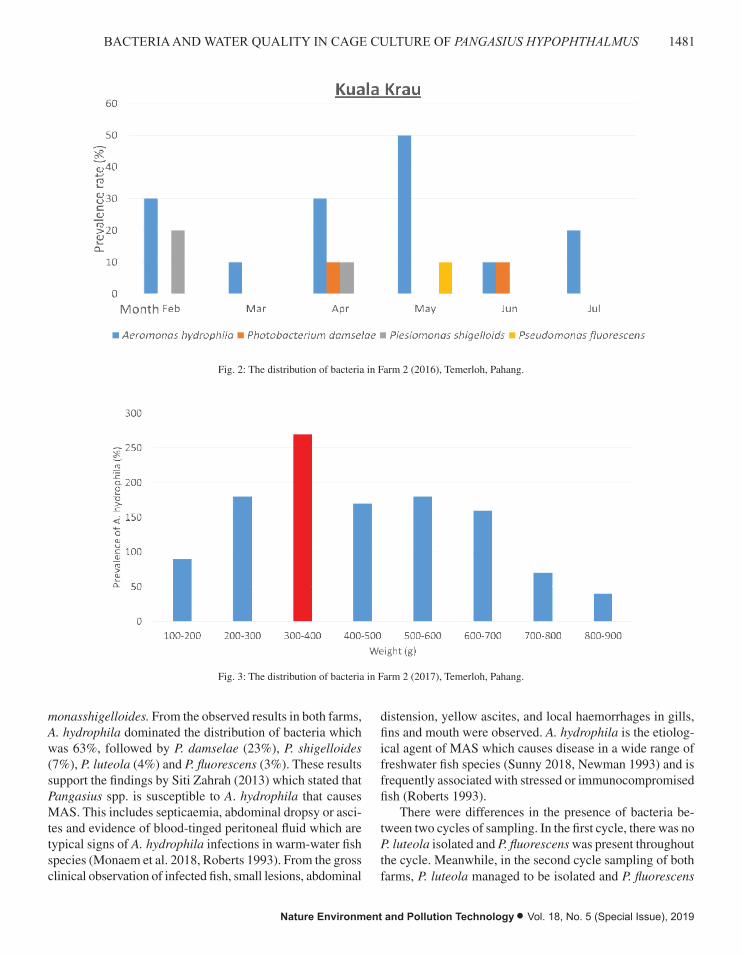
Bacteria distribution: There were several bacteria identified throughout the first and second cycle of observation. Common bacteria found were A. hydrophila, Photobacterium damselae, Pseudomonas fluorescens, P. luteola and Plesiomonasshigelloides. From the observed results in both farms, A. hydrophila dominated the distribution of bacteria which was 63%, followed by P. damselae (23%), P. shigelloides (7%), P. luteola (4%) and P. fluorescens (3%). These results support the findings by Siti Zahrah (2013) which stated that Pangasius spp. is susceptible to A. hydrophila that causes MAS. This includes septicaemia, abdominal dropsy or ascites and evidence of blood-tinged peritoneal fluid which are typical signs of A. hydrophila infections in warm-water fish species (Monaem et al. 2018, Roberts 1993). From the gross clinical observation of infected fish, small lesions, abdominal distension, yellow ascites, and local haemorrhages in gills, fins and mouth were observed. A. hydrophila is the etiological agent of MAS which causes disease in a wide range of freshwater fish species (Sunny 2018, Newman 1993) and is frequently associated with stressed or immunocompromised fish (Roberts 1993).
There were differences in the presence of bacteria between two cycles of sampling. In the first cycle, there was no P. luteola isolated and P. fluorescens was present throughout the cycle. Meanwhile, in the second cycle sampling of both farms, P. luteola managed to be isolated and P. fluorescens was absent. This might be because of the temperature of water that was higher in the first cycle than in the second cycle. P. fluorescens is present when temperature is elevated, meanwhile P. luteola exists in the damp and moist environment (Figs. 1-3).
Fig. 1: The distribution of bacteria in Farm 1, Temerloh, Pahang. Fig. 1: The distribution of bacteria in Farm 1, Temerloh, Pahang.
1481BACTERIA AND WATER QUALITY IN CAGE CULTURE OF PANGASIUS HYPOPHTHALMUS
Nature Environment and Pollution Technology • Vol. 18, No. 5 (Special Issue), 2019
monasshigelloides. From the observed results in both farms, A. hydrophila dominated the distribution of bacteria which was 63%, followed by P. damselae (23%), P. shigelloides (7%), P. luteola (4%) and P. fluorescens (3%). These results support the findings by Siti Zahrah (2013) which stated that Pangasius spp. is susceptible to A. hydrophila that causes MAS. This includes septicaemia, abdominal dropsy or asci-tes and evidence of blood-tinged peritoneal fluid which are typical signs of A. hydrophila infections in warm-water fish species (Monaem et al. 2018, Roberts 1993). From the gross clinical observation of infected fish, small lesions, abdominal
Fig. 2: The distribution of bacteria in Farm 2 (2016), Temerloh, Pahang.
Fig. 3: The distribution of bacteria in Farm 2 (2017), Temerloh, Pahang.
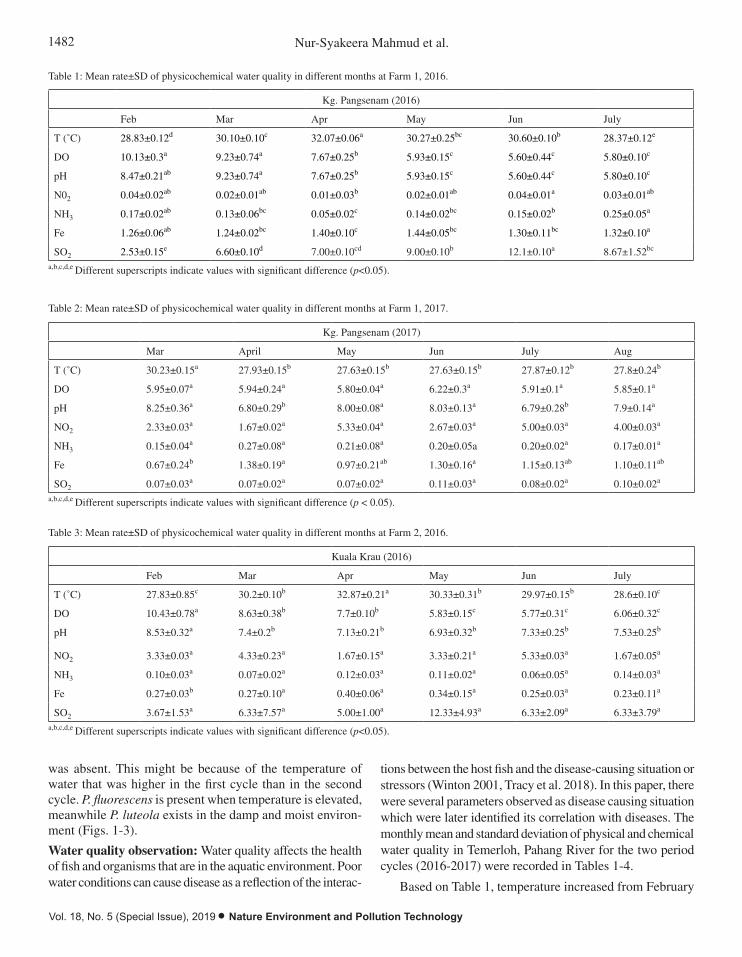
Water quality observation: Water quality affects the health of fish and organisms that are in the aquatic environment. Poor water conditions can cause disease as a reflection of the interactions between the host fish and the disease-causing situation or stressors (Winton 2001, Tracy et al. 2018). In this paper, there were several parameters observed as disease causing situation which were later identified its correlation with diseases. The monthly mean and standard deviation of physical and chemical water quality in Temerloh, Pahang River for the two period cycles (2016-2017) were recorded in Tables 1-4.
Table 1: Mean rate±SD of physicochemical water quality in different months at Farm 1, 2016.
Fig. 2: The distribution of bacteria in Farm 2 (2016), Temerloh, Pahang.
Fig. 4: Weight and prevalence of A. hydrophila.
Isolations of A. hydrophila were significantly higher from P. hypophthalmus that weighed between 300-400g (Fig. 4). During this size, Patin Hitam are in the grow-out phase and their cage became overcrowded. Factors of high-water temperature, suboptimal oxygen level and overcrowding combined, made diseases to be easily transmitted from fish to fish or from environment to the fish. This result support a statement from Rasmussen-Ivey (2016) which asserted that disease outbreaks occur when the fish are in stressful condition.
CONCLUSION
In conclusion, there are several bacteria isolated which are A. hydrophila, P damselae, P. fluorescens, P. shigelliodes and P. luteola. There were different isolation patterns between 2016 and 2017. As for physicochemical water quality, correlation was observed only at Farm 1 in 2016 between iron, nitrite, pH and the presence of A. hydrophila where p < 0.05.
ACKNOWLEDGEMENT
We would like to thank FRGS for funding this research. We also want to express our appreciation to National Fish Health Research Centre for all the support, help and advice throughout this research.
REFERENCES
Abedi, Z., Khalesi, M., KohestanEskandari, S. and Rahmani, H. 2012. Comparison of lethal concentrations (LC50-96 h) of CdCl2, CrCl3, and Pb (NO3) 2 in common carp (Cyprinus Carpio) and Sutchi Catfish (Pangasius hypophthalmus). Iranian Journal of Toxicology, 6(18): 672-680.
Amir, K., Gul, Z., Anwarud, D. and Shakoor, M. 2018. Analytic solution of fractional Jeffrey fluid induced by abrupt motion of the plate. Matrix Science Mathematic, 1(1): 01-03.
Asnor, A.S. and Che Abd Rahim, M. 2018. Correlation between total suspended particles and natural radionuclide in Malaysia Maritime air during haze event in June-July 2009. Journal CleanWAS, 2(1): 01-05.
Fig. 3: The distribution of bacteria in Farm 2 (2017), Temerloh, Pahang.
distension, yellow ascites, and local haemorrhages in gills, fins and mouth were observed. A. hydrophila is the etiolog-ical agent of MAS which causes disease in a wide range of freshwater fish species (Sunny 2018, Newman 1993) and is frequently associated with stressed or immunocompromised fish (Roberts 1993).
There were differences in the presence of bacteria be-tween two cycles of sampling. In the first cycle, there was no P. luteola isolated and P. fluorescens was present throughout the cycle. Meanwhile, in the second cycle sampling of both farms, P. luteola managed to be isolated and P. fluorescens
1482 Nur-Syakeera Mahmud et al.
Vol. 18, No. 5 (Special Issue), 2019 • Nature Environment and Pollution Technology
was absent. This might be because of the temperature of water that was higher in the first cycle than in the second cycle. P. fluorescens is present when temperature is elevated, meanwhile P. luteola exists in the damp and moist environ-ment (Figs. 1-3).
Water quality observation: Water quality affects the health of fish and organisms that are in the aquatic environment. Poor water conditions can cause disease as a reflection of the interac-
tions between the host fish and the disease-causing situation or stressors (Winton 2001, Tracy et al. 2018). In this paper, there were several parameters observed as disease causing situation which were later identified its correlation with diseases. The monthly mean and standard deviation of physical and chemical water quality in Temerloh, Pahang River for the two period cycles (2016-2017) were recorded in Tables 1-4.
Based on Table 1, temperature increased from February
Table 3: Mean rate±SD of physicochemical water quality in different months at Farm 2, 2016.
Kuala Krau (2016)
Feb Mar Apr May Jun July
T (˚C) 27.83±0.85c 30.2±0.10b 32.87±0.21a 30.33±0.31b 29.97±0.15b 28.6±0.10c
DO 10.43±0.78a 8.63±0.38b 7.7±0.10b 5.83±0.15c 5.77±0.31c 6.06±0.32c
pH 8.53±0.32a 7.4±0.2b 7.13±0.21b 6.93±0.32b 7.33±0.25b 7.53±0.25b
NO2 3.33±0.03a 4.33±0.23a 1.67±0.15a 3.33±0.21a 5.33±0.03a 1.67±0.05a
NH3 0.10±0.03a 0.07±0.02a 0.12±0.03a 0.11±0.02a 0.06±0.05a 0.14±0.03a
Fe 0.27±0.03b 0.27±0.10a 0.40±0.06a 0.34±0.15a 0.25±0.03a 0.23±0.11a
SO2 3.67±1.53a 6.33±7.57a 5.00±1.00a 12.33±4.93a 6.33±2.09a 6.33±3.79a
a,b,c,d,e Different superscripts indicate values with significant difference (p<0.05).
Table 2: Mean rate±SD of physicochemical water quality in different months at Farm 1, 2017.
Kg. Pangsenam (2017)
Mar April May Jun July Aug
T (˚C) 30.23±0.15a 27.93±0.15b 27.63±0.15b 27.63±0.15b 27.87±0.12b 27.8±0.24b
DO 5.95±0.07a 5.94±0.24a 5.80±0.04a 6.22±0.3a 5.91±0.1a 5.85±0.1a
pH 8.25±0.36a 6.80±0.29b 8.00±0.08a 8.03±0.13a 6.79±0.28b 7.9±0.14a
NO2 2.33±0.03a 1.67±0.02a 5.33±0.04a 2.67±0.03a 5.00±0.03a 4.00±0.03a
NH3 0.15±0.04a 0.27±0.08a 0.21±0.08a 0.20±0.05a 0.20±0.02a 0.17±0.01a
Fe 0.67±0.24b 1.38±0.19a 0.97±0.21ab 1.30±0.16a 1.15±0.13ab 1.10±0.11ab
SO2 0.07±0.03a 0.07±0.02a 0.07±0.02a 0.11±0.03a 0.08±0.02a 0.10±0.02a
a,b,c,d,e Different superscripts indicate values with significant difference (p < 0.05).
Table 1: Mean rate±SD of physicochemical water quality in different months at Farm 1, 2016.
Kg. Pangsenam (2016)
Feb Mar Apr May Jun July
T (˚C) 28.83±0.12d 30.10±0.10c 32.07±0.06a 30.27±0.25bc 30.60±0.10b 28.37±0.12e
DO 10.13±0.3a 9.23±0.74a 7.67±0.25b 5.93±0.15c 5.60±0.44c 5.80±0.10c
pH 8.47±0.21ab 9.23±0.74a 7.67±0.25b 5.93±0.15c 5.60±0.44c 5.80±0.10c
N02 0.04±0.02ab 0.02±0.01ab 0.01±0.03b 0.02±0.01ab 0.04±0.01a 0.03±0.01ab
NH3 0.17±0.02ab 0.13±0.06bc 0.05±0.02c 0.14±0.02bc 0.15±0.02b 0.25±0.05a
Fe 1.26±0.06ab 1.24±0.02bc 1.40±0.10c 1.44±0.05bc 1.30±0.11bc 1.32±0.10a
SO2 2.53±0.15e 6.60±0.10d 7.00±0.10cd 9.00±0.10b 12.1±0.10a 8.67±1.52bc
a,b,c,d,e Different superscripts indicate values with significant difference (p<0.05).
1483BACTERIA AND WATER QUALITY IN CAGE CULTURE OF PANGASIUS HYPOPHTHALMUS
Nature Environment and Pollution Technology • Vol. 18, No. 5 (Special Issue), 2019
to April but slowly decreased from May to July. The highest temperature was in April 2016. There were no significant differences between the mean of temperature in March, May and June. However, the mean temperature in February, April and July showed significant differences where p<0.05. There were no significant differences for dissolved oxygen (DO), pH, nitrite, ammonia, iron and sulphide from February to July 2016 in Farm 1.
Temperature showed decrement at Farm 1 from March to August 2017 and was overall much lower compared to the temperature of water during 2016 at the same farm. Other physicochemical water showed no significant differences (p > 0.05) each month.
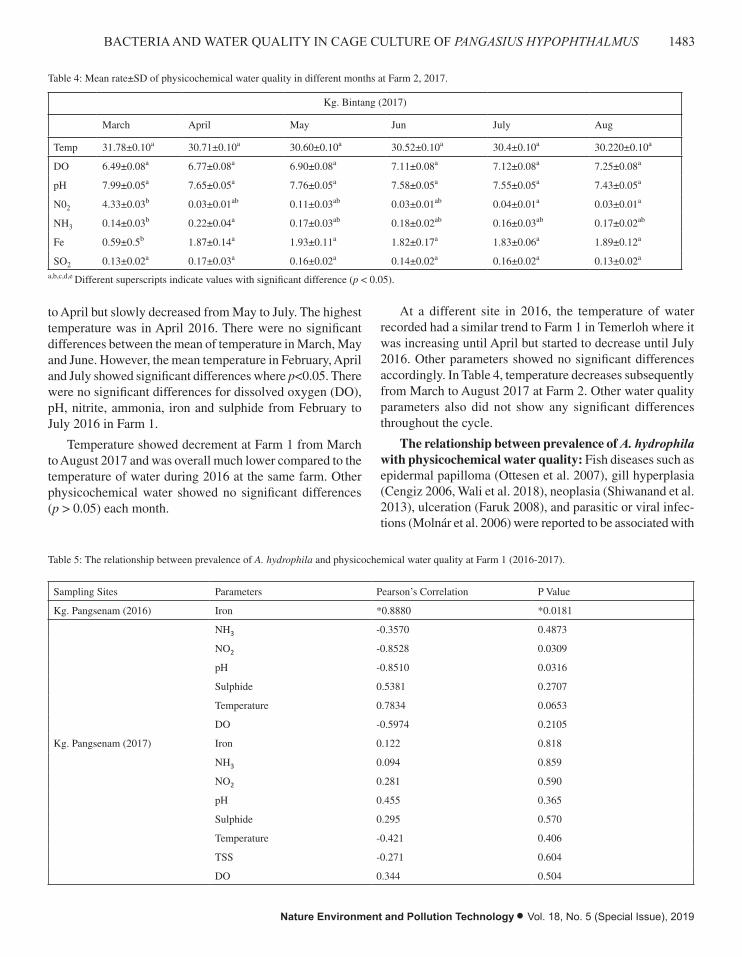
At a different site in 2016, the temperature of water recorded had a similar trend to Farm 1 in Temerloh where it was increasing until April but started to decrease until July 2016. Other parameters showed no significant differences accordingly. In Table 4, temperature decreases subsequently from March to August 2017 at Farm 2. Other water quality parameters also did not show any significant differences throughout the cycle.
The relationship between prevalence of A. hydrophila with physicochemical water quality: Fish diseases such as epidermal papilloma (Ottesen et al. 2007), gill hyperplasia (Cengiz 2006, Wali et al. 2018), neoplasia (Shiwanand et al. 2013), ulceration (Faruk 2008), and parasitic or viral infec-tions (Molnár et al. 2006) were reported to be associated with
Table 4: Mean rate±SD of physicochemical water quality in different months at Farm 2, 2017.
Kg. Bintang (2017)
March April May Jun July Aug
Temp 31.78±0.10a 30.71±0.10a 30.60±0.10a 30.52±0.10a 30.4±0.10a 30.220±0.10a
DO 6.49±0.08a 6.77±0.08a 6.90±0.08a 7.11±0.08a 7.12±0.08a 7.25±0.08a
pH 7.99±0.05a 7.65±0.05a 7.76±0.05a 7.58±0.05a 7.55±0.05a 7.43±0.05a
N02 4.33±0.03b 0.03±0.01ab 0.11±0.03ab 0.03±0.01ab 0.04±0.01a 0.03±0.01a
NH3 0.14±0.03b 0.22±0.04a 0.17±0.03ab 0.18±0.02ab 0.16±0.03ab 0.17±0.02ab
Fe 0.59±0.5b 1.87±0.14a 1.93±0.11a 1.82±0.17a 1.83±0.06a 1.89±0.12a
SO2 0.13±0.02a 0.17±0.03a 0.16±0.02a 0.14±0.02a 0.16±0.02a 0.13±0.02a
a,b,c,d,e Different superscripts indicate values with significant difference (p < 0.05).
Table 5: The relationship between prevalence of A. hydrophila and physicochemical water quality at Farm 1 (2016-2017).
Sampling Sites Parameters Pearson’s Correlation P Value
Kg. Pangsenam (2016) Iron *0.8880 *0.0181
NH3 -0.3570 0.4873
NO2 -0.8528 0.0309
pH -0.8510 0.0316
Sulphide 0.5381 0.2707
Temperature 0.7834 0.0653
DO -0.5974 0.2105
Kg. Pangsenam (2017) Iron 0.122 0.818
NH3 0.094 0.859
NO2 0.281 0.590
pH 0.455 0.365
Sulphide 0.295 0.570
Temperature -0.421 0.406
TSS -0.271 0.604
DO 0.344 0.504

1484 Nur-Syakeera Mahmud et al.
Vol. 18, No. 5 (Special Issue), 2019 • Nature Environment and Pollution Technology
Table 6: The relationship between prevalence of A. hydrophila and physicochemical water quality at Farm 2 (2016-2017).
Sampling Sites Parameters Pearson’s Correlation P Value
Kaula Krau Iron 0.237 0.608
NH3 0.208 0.654
NO2 0.255 0.255
pH -0.383 0.396
Sulphide -0.501 0.252
Temperature -0.059 0.900
TSS 0.232 0.616
DO -0.269 0.560
Kg. Bintang Iron 0.320 0.484
NH3 0.481 0.274
NO2 0.606 0.149
pH -0.722 0.065
Sulphide 0.689 0.087
Temperature -0.140 0.765
TSS 0.607 0.148
DO 0.510 0.242
the aquatic environment conditions or pollution. The cause for these diseases has often been linked to contaminated diets (Sherif et al. 2013) or pollutants such as nitrogenous com-pounds, ammonia (Benli et al. 2008) and nitrites (Svobodova et al. 2005, Xiao et al. 2018), hydrocarbons (Noreña-Barroso et al. 2004), and heavy metals (Abedi et al. 2012) which can come from pesticides (Murthy et al. 2013, Zaheer et al.
2018) and sewage (Maceda-Veiga et al. 2013). The pollutants may weaken the fish metabolism and immune system and thus, leading to the colonization of microorganism and the development of clinical disease.
Based on Table 5, the relationship between water quality and the presence of A. hydrophila was observed. The results showed that there were relationships between iron, nitrite and
Fig. 4: Weight and prevalence of A. hydrophila.

1485BACTERIA AND WATER QUALITY IN CAGE CULTURE OF PANGASIUS HYPOPHTHALMUS
Nature Environment and Pollution Technology • Vol. 18, No. 5 (Special Issue), 2019
pH in the first cycle of observation at Farm 1 in 2016 where p < 0.05. Meanwhile, in the second cycle at the same farm, no correlation was observed. This might be because of the sand mining activity that occurred during the monitoring period in 2016. On the other hand, there was no correlation between the physicochemical parameters of water quality and the presence of A. hydrophila at Farm 2 in 2016 and 2017.
Weight and prevalence of A. hydrophila: Isolations of A. hydrophila were significantly higher from P. hypophthalmus that weighed between 300-400g (Fig. 4). During this size, Patin Hitam are in the grow-out phase and their cage became overcrowded. Factors of high-water temperature, suboptimal oxygen level and overcrowding combined, made diseases to be easily transmitted from fish to fish or from environment to the fish. This result support a statement from Rasmussen-Ivey (2016) which asserted that disease outbreaks occur when the fish are in stressful condition.
CONCLUSION
In conclusion, there are several bacteria isolated which are A. hydrophila, P damselae, P. fluorescens, P. shigelliodes and P. luteola. There were different isolation patterns between 2016 and 2017. As for physicochemical water quality, correlation was observed only at Farm 1 in 2016 between iron, nitrite, pH and the presence of A. hydrophila where p < 0.05.
ACKNOWLEDGEMENT
We would like to thank FRGS for funding this research. We also want to express our appreciation to National Fish Health Research Centre for all the support, help and advice throughout this research.
REFERENCES
Abedi, Z., Khalesi, M., KohestanEskandari, S. and Rahmani, H. 2012. Comparison of lethal concentrations (LC50-96 h) of CdCl2, CrCl3, and Pb (NO3) 2 in common carp (Cyprinus carpio) and Sutchi Catfish (Pangasius hypophthalmus). Iranian Journal of Toxicology, 6(18): 672-680.
Amir, K., Gul, Z., Anwarud, D. and Shakoor, M. 2018. Analytic solution of fractional Jeffrey fluid induced by abrupt motion of the plate. Matrix Science Mathematic, 1(1): 01-03.
Asnor, A.S. and Che Abd Rahim, M. 2018. Correlation between total suspended particles and natural radionuclide in Malaysia Maritime air during haze event in June-July 2009. Journal CleanWAS, 2(1): 01-05.
Benli, A.Ç.K., Köksal, G. and Özkul, A. 2008. Sublethal ammonia expo-sure of Nile tilapia (Oreochromis niloticus L.): effects on gill, liver and kidney histology. Chemosphere, 72(9): 1355-1358.
Bikram, N., Devashish, B. and Jiban, S. 2019. Mineral nutrient content of buckwheat (Fagopyrum esculentum Moench) for nutritional security in Nepal. Malaysian Journal of Sustainable Agriculture, 3(1): 01-04.
Cengiz, E.I. 2006. Gill and kidney histopathology in the freshwater fish Cyprinus carpio after acute exposure to deltamethrin. Environ. Tox-icol. Pharmacol., 22(2): 200-204.
Chowdhury, M.B.R. 1998. Involvement of aeromonads and pseudomo-nads in diseases of farmed fish in Bangladesh. Fish Pathology, 33(4): 247-254.
Crumlish, M., Thanh, P.C., Koesling, J., Tung, V.T. and Gravningen, K. 2010. Experimental challenge studies in Vietnamese catfish, Pangasianodon hypophthalmus (Sauvage), exposed to Edwardsiella ictaluri and Aeromonas hydrophila. J. Fish Dis., 33: 717-722.
FAO, 2009. Food and Agriculture Organization of the United Nations (FAO). The State of World Fisheries and Aquaculture 2009. Rome, Italy.
Faruk, M.A. 2008. Disease and health management of farmed exotic cat-fish Pangasius hypopthalmus in Mymensingh district of Bangladesh. Diseases in Asian Aquaculture VI. Fish Health Section, 505.
Feng, Q. 2018. Research on design principles of visual identity in campus environment. Science Heritage Journal, 2(2): 01-03.
Ferguson, H.W., Turnbull, J.F., Shinn, A., Thomson, K., Dung, T.T. and Crumlish, M. 2001. Bacillary necrosis in farmed Pangaisus hypoph-thalmus (Sauvage) from the Mekong Delta, Vietnam. J. Fish. Dis., 24: 509-513.
Hanson, L., Liles, M.R., Hossain, M.J., Griffin, M. and Hemstreet, W. 2014. Motile aeromonas septicemia. In: Fish Health Section Blue Book (2014 Edition). Bethesda, MD: American Fisheries Society - Fish Health Section; Available online at: http://www.afs-fhs.org/perch/resources/citation-guidelines-2014.pdf.
Jing, Z. and Shu-Min, L. 2018. The impact of tourism development on the environment in China. Acta Scientifica Malaysia, 2(1): 01-04.
Khairunnisa, A. H. and Ee, L. Y. 2018. Integrating two-stage up-flow anaerobic sludge blanket with A single-stage aerobic packed-bed reactor for raw palm oil mill effluent treatment. Water Conservation and Management, 2(1): 01-04.
Maceda-Veiga, A., Monroy, M., Navarro, E., Viscor, G. and de Sostoa, A. 2013. Metal concentrations and pathological responses of wild native fish exposed to sewage discharge in a Mediterranean river. Sci. Total Environ., 449: 9-19.
Mavuti, S.K., Waruiru, R.M., Mbuthia, P.G., Maina, J.G., Mbaria, J.M. and Otieno, R.O. 2017. Prevalence of ecto-and endo-parasitic infections of farmed tilapia and catfish in Nyeri County, Kenya. Prevalence, 68(60): 55.
Molnár, K., Székely, C., Mohamed, K. and Shaharom-Harrison, F. 2006. Myxozoan pathogens in cultured Malaysian fishes. I. Myxozoan in-fections of the sutchi catfish Pangasius hypophthalmus in freshwater cage cultures. Dis. Aquat. Organ., 68(3): 209-218.
Monaem, E., Moneer, A., Naji, A. and Otman, I. 2018. Waste-to-energy potential in Tripoli City-Libya. Environment & Ecosystem Science, 2(1): 01-03.
Murthy, K.S., Kiran, B.R. and Venkateshwarlu, M. 2013. A review on toxicity of pesticides in Fish. Int. J. Open Sci. Res., 1(1): 15-36.
Newman, S.G. 1993. Bacterial vaccines for fish. Annu. Rev. Fish Dis., 3: 145-185.
Noreña-Barroso, E., Sima-Alvarez, R., Gold-Bouchot, G. and Zapa-ta-Pérez, O. 2004. Persistent organic pollutants and histological lesions in Mayan catfish Ariopsis assimilis from the Bay of Chetumal, Mexico. Mar. Pollut. Bull., 48(3-4): 263-269.
Ottesen, O. H., Noga, E. J. and Sandaa, W. 2007. Effect of substrate on progression and healing of skin erosions and epidermal papillomas of Atlantic halibut, Hippoglossus hippoglossus (L.). J. Fish Dis., 30(1): 43-53.
Plumb, J.A. 1986. Channel catfish virus disease. US Fish & Wildlife Service.
Pridgeon, J., Klesius, P., Mu, X. and Song, L. 2011. An in vitro screening method to evaluate chemicals as potential chemotherapeutants to control Aeromonas hydrophila infection in channel catfish. J. Appl. Microbiol., 111: 114-124
Rasmussen-Ivey, C.R., Hossain, M.J., Odom, S.E., Terhune, J.S., Hem-

1486 Nur-Syakeera Mahmud et al.
Vol. 18, No. 5 (Special Issue), 2019 • Nature Environment and Pollution Technology
street, W.G., Shoemaker, C.A. and Figueras, M.J. 2016. Classification of a hypervirulent Aeromonas hydrophila pathotype responsible for epidemic outbreaks in warm-water fishes. Front Microbiol., 7: 1615.
Sherif, A.H., Abdel-Maksoud, S.A. and Shukry, M.M. 2013. Study on toxicity of Oreochromis niloticus with aflatoxin B1. Egypt J. Aquat. Biology and Fisheries, 287(1827): 1-26.
Shiwanand, A. and Tripathi, G. 2013. A review on ammonia toxicity in fish. Asia Pac. J. Life Sci., 7(2): 193.
Siti Zahrah, Zamri-Saad, M., Firdaus Nawi, M., Hazreen-Nita, M. K. and Nur-Nazifah, M. 2013. Detection of channel catfish virus in cage-cultured Pangasius hypophthalmus (Sauvage 1878) in Malaysia. J. Fish. Dis., 37(11): 981-3.
Subagja, J., Slembrouck, J., Hung, L.T. and Legendre M. 1999. Larval rearing of an Asian catfish Pangasius hypophthalmus (Siluroidei Pangasiidae): analysis of precocious mortality and proposition of appropriate treatments. Aquat. Living Resour., 12: 37-44.
Sunny, A A. 2018. Derivatives and analytic signals: improved techniques for lithostructural classifications. Malaysian Journal of Geosciences, 2(1): 01-08.
Svobodova, Z., Machova, J., Poleszczuk, G., Hůda, J., Hamáůková, J. and
Kroupova, H. 2005. Nitrite poisoning of fish in aquaculture facilities with water-recirculating systems. Acta. Vet. Brno., 74(1): 129-137.
Tracy, G. L., Sanudin, T. and Junaidi, A. 2018. Stratigraphy of paleogene se-quences in Wes ton- Sipitang, Sabah. Geological Behavior, 2(1): 01-04.
Wali, E., Phil-Eze, P.O. and Nwankwoala, H.O. 2018. Saltwater - freshwa-ter wetland ecosystem and urban land use change in port Harcourt Metropolis, Nigeria. Earth Sciences Malaysia, 2(1): 01-07.
Winton, J.R. 2001. Fish health management, in: Wedemeyer, G. (Ed.), Fish Hatchery Management, 2nd ed. Am. Fish Soc., Bethesda, MD., pp. 559-639.
Wu, S., Wang, G., Angert, E.R., Wang, W., Li, W. and Zou, H. 2012. Composition, diversity, and origin of the bacterial community in grass carp intestine. PloS One, 7(2): e30440.
Xiao, G. Y. and Ashraf, M. A. 2018. Analysis of The function relations between the depth of gap or slot and the speed of vibration in mil-lisecond multiple-row holes blasting. Engineering Heritage Journal, 2(1): 01-04.
Zaheer, A., Waqas, A., Abdul, N., Arfan, A. 2018. Atmospheric monitoring for ambient air quality parameters and source apportionment of city Faisalabad, Pakistan. Earth Sciences Pakistan, 2(1): 01-04.

Economic Development of Biomass Energy Industry in Heilongjiang Province Based on Analytic Hierarchy Process
Liying Zhang*, Cuixia Li* and Nguyen Hoang Phuong***Institute of Economic Management Northeast Agricultural University, Harbin Heilongjiang Province, 150030, China**Ho Chi Minh City University of Transport, Ho Chi Minh, Vietnam
ABSTRACT
In order to study the comprehensive evaluation index system of biomass energy industry economy in Heilongjiang Province, a hierarchical analysis is made from four aspects: society and technology, energy supply and demand, economy and environment. By analytic hierarchy process (AHP) and expert scoring method, various comprehensive evaluation values affecting the economy of biomass energy industry are calculated. The results show that in the economic development of biomass energy industry in Heilongjiang Province, biomass biogas industry > biomass power generation industry > biomass briquette fuel industry > biomass gasification industry > biomass liquid fuel industry. Finally, in view of the actual situation of Heilongjiang Province, relevant suggestions are proposed for the economic development of biomass energy industry.
INTRODUCTION
The construction of ecological civilization at the 18th Nation-al Congress, the blue sky in Beijing during APEC meeting in 2014, the tax levied by Germany on disposable beverage bottles in order to improve the reuse rate of beverage bottles, the “junk bank” in Bangkok, chewing gum for special days in Singapore, and the Brazilian Institute of Environmental Arbitration, almost all over the world, are calling for the protection of natural resources and the sustainable develop-ment (Nakomcicsmaragdakis et al. 2016, Edgar et al. 2018, Mohammed 2018). Everyone thinks of biomass energy as an alternative to traditional energy.
Biomass energy is the most widely used renewable energy at present. Its total consumption is second only to coal, oil and natural gas, and it plays an important role in the future sustainable energy system. Biomass energy refers to the ener-gy stored in biomass, which directly or indirectly transforms solar energy into chemical energy through photosynthesis of green plants, and then fixes and stores it in organisms. In addition to direct combustion to release energy for human use, it can also be converted into conventional solid, liquid and gaseous fuels under certain technical conditions. At present, the development and utilization of biomass energy mainly includes five schemes: biomass power generation, biomass solidified briquette fuel, biomass biogas, biomass gasification, and biomass liquid fuel (Zheng et al. 2016, Sa-lem et al. 2017, Abdul Rahman et al. 2018, Md Reaz 2019).
As a new energy source, biomass has attracted intense attention from governments and experts and scholars all
over the world for a long time. Many countries have issued a large number of laws and regulations, and formulated me-dium-term and long-term development plans, and China has been committed to the relevant research of biomass energy. It is expected that if this energy is used in the future, at least 200 million tons of liquid fuel can be supplied, and it can effectively alleviate the energy pressure caused by the rapid economic development (Nishiguchi et al. 2016, Khan 2018, Muhammad et al. 2018, Rohana et al. 2018, Rodeano et al. 2018). Taking the main cities of Heilongjiang Province as the research scope, the reserves of biomass energy in Heilongjiang Province are estimated, and the energy gap of economic development is predicted to find the direction of energy development in Heilongjiang Province. The problems existing in the development of biomass energy are discussed, and finally corresponding countermeasures and suggestions are provided for the development of biomass energy industry in Heilongjiang Province.
EARLIER STUDIES
Jerson pointed out in his article entitled Feasibility of Bio-mass Energy Promotion in Costa Rica that sustained financial support would bring a lot of attention to biomass energy in the short term. Taking Srikata, a small district minister in southern Italy, as the research object, it is feasible to consider biomass energy as the energy supply of Srikata, and the fea-sibility plan of promoting biomass energy to the global scope is discussed (Motghare et al. 2016, Ghanshyam et al. 2019, Yanan et al. 2018). The world is facing serious energy crisis
Nat. Env. & Poll. Tech.Website: www.neptjournal.com
Received: 20-08-2019 Accepted: 27-10-2019
Key Words:Biomass energy AHP Industrial economyEconomic development
2019pp. 1487-1493 Vol. 18
p-ISSN: 0972-6268 No. 5 (Special Issue)
Nature Environment and Pollution Technology An International Quarterly Scientific Journal
Original Research Paper
e-ISSN: 2395-3454
Open Access
1488 Liying Zhang et al.
Vol. 18, No. 5 (Special Issue), 2019 • Nature Environment and Pollution Technology
and environmental problems. Under the urgent situation, people turn their attention to biomass energy, a recognized renewable energy (Mekonnen et al. 2017, Sajid et al. 2018, Nurul Syahidah et al. 2018). The advantages and disadvan-tages of biomass energy, as well as the challenges faced by biomass gasification utilization, were also comprehensively analysed, and the technical difficulties of biomass energy experimental research were explored.
After analysing the current situation of international biomass energy development, the targets of biomass power generation, biomass briquette fuel and biogas in China from 2015 to 2020, the difficulties of raw material transportation and low energy density need to be overcome in developing biomass energy. Starting from four kinds of biomass: herbaceous bio-mass, woody biomass, microalgae and lipids, various methods of liquid fuel synthesis and discussed in detail the influence of parameters in various research methods (Tziolas et al. 2016, Zaleha et al. 2018, Nwankwo et al. 2018, Xiao et al. 2018). It was concluded that most of the liquid fuel preparation tech-nologies were still in the stage of research and development, and only the oil-vinegar exchange and fermentation alcohols had reached the stage of commercialization and large-scale development and biomass forming machine can be vigorously promoted and developed. The HPB-resistance hydraulic drive two-way extrusion dry Xuan forming machine developed by Henan Agricultural University had been put into the market very well. There is still a long way to go to be in line with the international standards.
MATERIALS AND METHODS
Comprehensive evaluation index system for economic
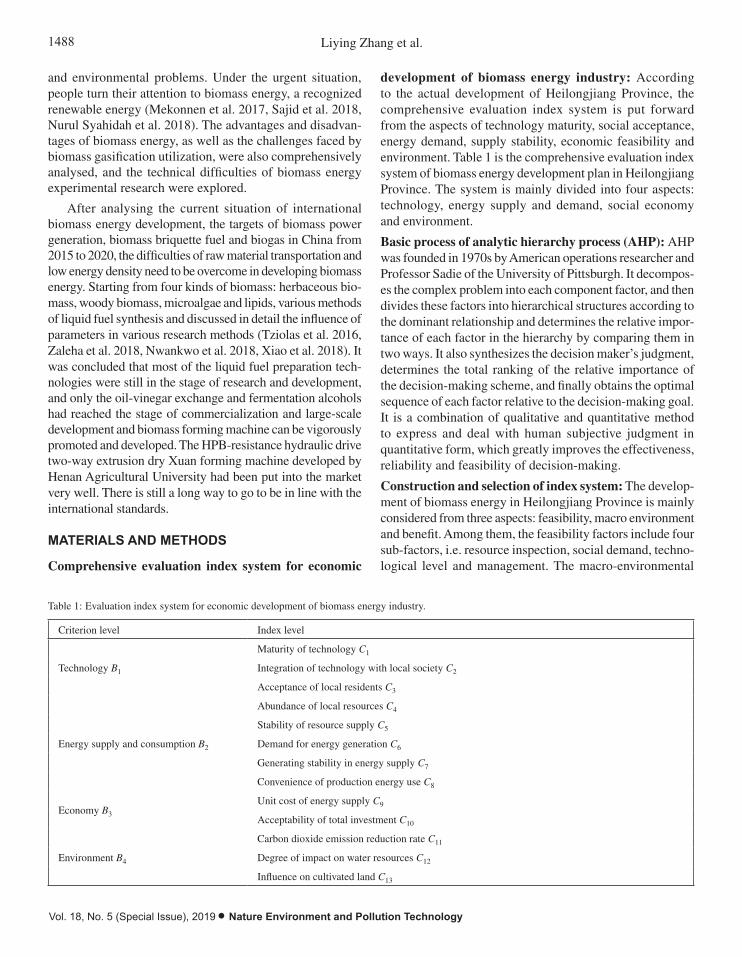
development of biomass energy industry: According to the actual development of Heilongjiang Province, the comprehensive evaluation index system is put forward from the aspects of technology maturity, social acceptance, energy demand, supply stability, economic feasibility and environment. Table 1 is the comprehensive evaluation index system of biomass energy development plan in Heilongjiang Province. The system is mainly divided into four aspects: technology, energy supply and demand, social economy and environment.
Basic process of analytic hierarchy process (AHP): AHP was founded in 1970s by American operations researcher and Professor Sadie of the University of Pittsburgh. It decompos-es the complex problem into each component factor, and then divides these factors into hierarchical structures according to the dominant relationship and determines the relative impor-tance of each factor in the hierarchy by comparing them in two ways. It also synthesizes the decision maker’s judgment, determines the total ranking of the relative importance of the decision-making scheme, and finally obtains the optimal sequence of each factor relative to the decision-making goal. It is a combination of qualitative and quantitative method to express and deal with human subjective judgment in quantitative form, which greatly improves the effectiveness, reliability and feasibility of decision-making.
Construction and selection of index system: The develop-ment of biomass energy in Heilongjiang Province is mainly considered from three aspects: feasibility, macro environment and benefit. Among them, the feasibility factors include four sub-factors, i.e. resource inspection, social demand, techno-logical level and management. The macro-environmental
Table 1: Evaluation index system for economic development of biomass energy industry.
Criterion level Index level
Technology B1
Maturity of technology C1
Integration of technology with local society C2
Acceptance of local residents C3
Energy supply and consumption B2
Abundance of local resources C4
Stability of resource supply C5
Demand for energy generation C6
Generating stability in energy supply C7
Convenience of production energy use C8
Economy B3
Unit cost of energy supply C9
Acceptability of total investment C10
Environment B4
Carbon dioxide emission reduction rate C11
Degree of impact on water resources C12
Influence on cultivated land C13
1489ECONOMIC DEVELOPMENT OF BIOMASS ENERGY INDUSTRY IN HEILONGJIANG PROVINCE
Nature Environment and Pollution Technology • Vol. 18, No. 5 (Special Issue), 2019
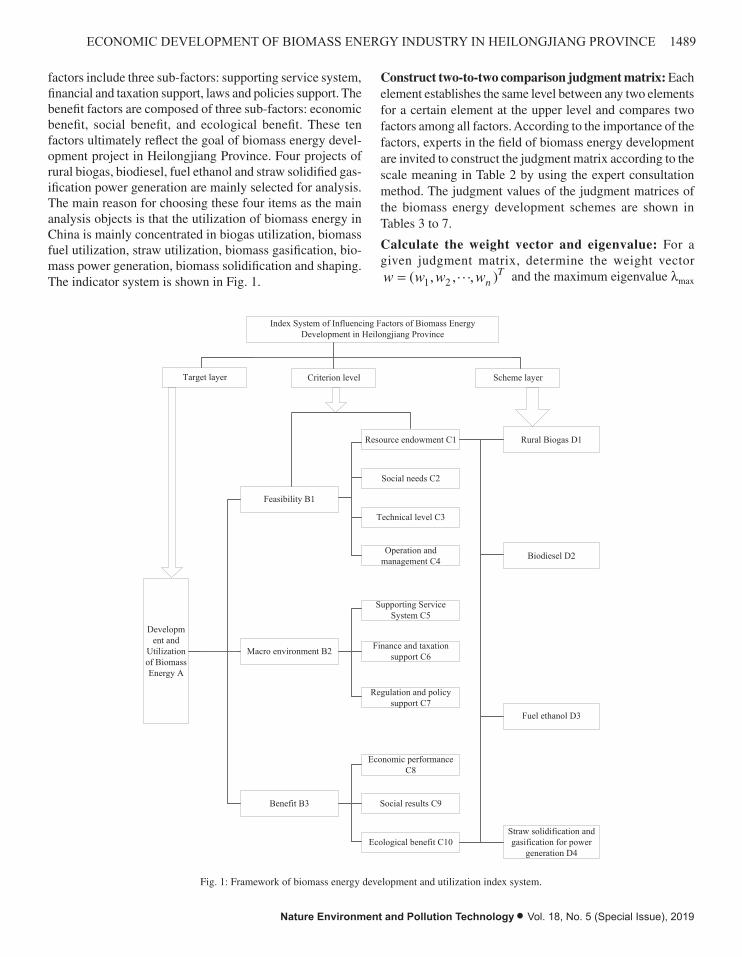
factors include three sub-factors: supporting service system, financial and taxation support, laws and policies support. The benefit factors are composed of three sub-factors: economic benefit, social benefit, and ecological benefit. These ten factors ultimately reflect the goal of biomass energy devel-opment project in Heilongjiang Province. Four projects of rural biogas, biodiesel, fuel ethanol and straw solidified gas-ification power generation are mainly selected for analysis. The main reason for choosing these four items as the main analysis objects is that the utilization of biomass energy in China is mainly concentrated in biogas utilization, biomass fuel utilization, straw utilization, biomass gasification, bio-mass power generation, biomass solidification and shaping. The indicator system is shown in Fig. 1.
Construct two-to-two comparison judgment matrix: Each element establishes the same level between any two elements for a certain element at the upper level and compares two factors among all factors. According to the importance of the factors, experts in the field of biomass energy development are invited to construct the judgment matrix according to the scale meaning in Table 2 by using the expert consultation method. The judgment values of the judgment matrices of the biomass energy development schemes are shown in Tables 3 to 7.
Calculate the weight vector and eigenvalue: For a given judgment matrix, determine the weight vector w w w wn
T= ⋅⋅⋅( , , , )1 2 and the maximum eigenvalue lmax
Index System of Influencing Factors of Biomass EnergyDevelopment in Heilongjiang Province
Target layer Criterion level Scheme layer
Development and
Utilizationof BiomassEnergy A
Feasibility B1
Macro environment B2
Benefit B3
Resource endowment C1
Social needs C2
Technical level C3
Operation andmanagement C4
Supporting ServiceSystem C5
Finance and taxationsupport C6
Regulation and policysupport C7
Economic performanceC8
Social results C9
Ecological benefit C10
Rural Biogas D1
Biodiesel D2
Fuel ethanol D3
Straw solidification andgasification for power
generation D4 Fig. 1: Framework of biomass energy development and utilization index system.
Construct two-to-two comparison judgment matrix: Each element establishes the same level between any two elements for a certain element at the upper level and compares two factors among all factors. According to the importance of the factors, experts in the field of biomass energy development are invited to construct the judgment matrix according to the scale meaning in Table 2 by using the expert consultation method. The judgment values of the judgment matrices of the biomass energy development schemes are shown in Tables 3 to 7.
Table 2: The meaning of number (1-9) scale.
Importance scale Meaning 1 Two elements are equivalently important. 3 The former is slightly more important than the latter. 5 The former is obviously more important than the latter. 7 The former is strongly more important than the latter. 9 The former is extremely more important than the latter.
2,4,6,8 The median value of the above judgment.
Fig. 1: Framework of biomass energy development and utilization index system.

1490 Liying Zhang et al.
Vol. 18, No. 5 (Special Issue), 2019 • Nature Environment and Pollution Technology
The calculation formulas are as follows:
wn
a
a
i niij
kjj
nj
n
= = ⋅⋅⋅
=
= ∑∑1
1 2
1
1
,( , , ) …(1)
lmax ==
=
∑∑1 1
1n
a w
w
ij jj
n
ij
n …(2)
Consistency test: The consistency index of judgment matrix is CI, the random consistency index is RI (the value of RI is shown in Table 8), and the consistency ratio is CR.
CIm
nn=
−−
>lmax ( )
11 …(3)
CRCI
RI= …(4)
When CR<0.1, it is considered that the consistency requirement is satisfied. The weight vectors and consistency ratios of each judgment matrix are shown in Table 9.
RESULTS AND DISCUSSION
Through the analysis of the above steps, the weight results
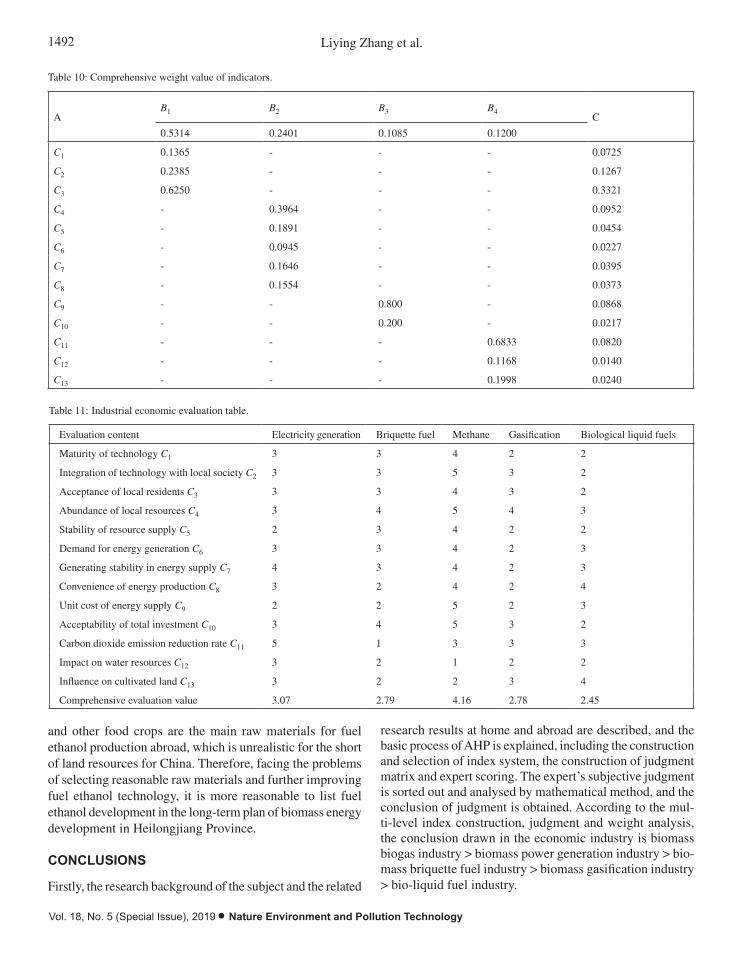
of the lower layer relative to the upper layer are calculated, and the comprehensive weights of the index layer relative to the target layer (C layer versus A layer) are obtained. The weights of each layer and comprehensive weights are shown in Table 10.
According to the comprehensive weight values of the indicators obtained by AHP in Table 10 and the scoring results of expert schemes, the comprehensive evaluation values of biomass energy for economic development from various aspects are obtained by weighted summation method.
For a specific project, the form of consultation sheet is used, and the five-point system is used to evaluate the fac-tors. Consultants are mainly experts in the field of biomass energy research. A total of 15 consultation tables are issued and 15 are recovered. The results of statistical scoring for each scheme are shown in Table 11.
From the comprehensive evaluation value in Table 11, it can be concluded that biomass biogas industry > bio-mass power generation industry > biomass briquette fuel industry > biomass gasification industry > biomass liquid fuel industry.
According to the above multi-level index construction, judgment and weight analysis, the time series of biomass energy development in Heilongjiang Province is rural biogas,
Table 2: The meaning of number (1-9) scale.
Importance scale Meaning
1 Two elements are equivalently important.
3 The former is slightly more important than the latter.
5 The former is obviously more important than the latter.
7 The former is strongly more important than the latter.
9 The former is extremely more important than the latter.
2,4,6,8 The median value of the above judgment.
Reciprocal If the importance ratio of element i to element j is aij, then the importance ratio of element j to element i is aji = 1 / aij.
Table 3: Binary judgment A.
A B1 B2 B3 B4
B1 1 4 3 4
B2 1/4 1 4 2
B3 1/3 ¼ 1 1
B4 1/4 ½ 1 1
Table 4: Binary judgment B1.
B1 C1 C2 C3
C1 1 1/2 1/4
C2 2 1 1/3
C3 4 3 1

1491ECONOMIC DEVELOPMENT OF BIOMASS ENERGY INDUSTRY IN HEILONGJIANG PROVINCE
Nature Environment and Pollution Technology • Vol. 18, No. 5 (Special Issue), 2019
straw solidified gasification power generation, biodiesel, and fuel ethanol. That is to say, according to the scores of many experts, a time sequence of the development of biomass energy in Heilongjiang Province, or a priority development plan can be obtained. Relatively speaking, rural biogas is the most important and should be given priority to development. At present, the development and utilization of biogas biomass energy in rural areas in Heilongjiang Province is much larger than that of other types of biomass energy. From the reality of biomass energy development in Heilongjiang Province, biogas has the longest history in Heilongjiang Province, technology has matured, and management, capital, policy and other supporting measures are more systematic. At present,
China is actively building a new socialist countryside. As an important rural energy, biogas has solved most of the rural energy demand, and its environment-friendly characteristics also make the countryside look greatly changed. Biogas is the urgent need for rural development in Heilongjiang Province. Therefore, from the analysis results, the development and utilization of biogas projects ranked first in line with the actual development needs.
The development of fuel ethanol in Heilongjiang Prov-ince is relatively slow. The main reason is the shortage of raw materials. In order to ensure national food security, the development of fuel ethanol can only consider non-food crops as raw materials. At present, corn, sorghum, wheat
Table 6: Binary judgment B3.
B3 C9 C1
C9 1 4
C10 ¼ 1
Table 8: Value table of RI.
n 1 2 3 4 5 6 7 8 9
RI 0.00 0.00 0.52 0.89 1.12 1.26 1.36 1.41 1.46
Table 5: Binary judgment B2.
B2 C4 C5 C6 C7 C8
C4 1 3 2 3 3
C5 1/3 1 2 1 2
C6 1/2 1/2 1 1/2 1/3
C7 1/3 1 2 1 1
C8 1/3 1/2 3 1 1
Table 9: Weight vectors and consistency ratio values of judgment matrix.
Judgement matrix Weight vector W Consistency ratio
A [0.5134, 0.2401, 0.1085, 0.1200]T 0.0924
B1 [0.1365, 0.2385, 0.6250]T 0.0176
B2 [0.3964, 0.1891, 0.0945, 0.1646, 0.1554]T 0.0758
B3 [0.8000, 0.2000]T 0.000
B4 [0.6833, 0.1168, 0.1998]T 0.0236
Table 7: Binary judgment B4.
B4 C11 C12 C13
C11 1 5 4
C12 1/5 1 1/2
C13 1/4 2 1
1492 Liying Zhang et al.
Vol. 18, No. 5 (Special Issue), 2019 • Nature Environment and Pollution Technology
and other food crops are the main raw materials for fuel ethanol production abroad, which is unrealistic for the short of land resources for China. Therefore, facing the problems of selecting reasonable raw materials and further improving fuel ethanol technology, it is more reasonable to list fuel ethanol development in the long-term plan of biomass energy development in Heilongjiang Province.
CONCLUSIONS
Firstly, the research background of the subject and the related
research results at home and abroad are described, and the basic process of AHP is explained, including the construction and selection of index system, the construction of judgment matrix and expert scoring. The expert’s subjective judgment is sorted out and analysed by mathematical method, and the conclusion of judgment is obtained. According to the mul-ti-level index construction, judgment and weight analysis, the conclusion drawn in the economic industry is biomass biogas industry > biomass power generation industry > bio-mass briquette fuel industry > biomass gasification industry > bio-liquid fuel industry.
Table 10: Comprehensive weight value of indicators.
AB1 B2 B3 B4
C
0.5314 0.2401 0.1085 0.1200
C1 0.1365 - - - 0.0725
C2 0.2385 - - - 0.1267
C3 0.6250 - - - 0.3321
C4 - 0.3964 - - 0.0952
C5 - 0.1891 - - 0.0454
C6 - 0.0945 - - 0.0227
C7 - 0.1646 - - 0.0395
C8 - 0.1554 - - 0.0373
C9 - - 0.800 - 0.0868
C10 - - 0.200 - 0.0217
C11 - - - 0.6833 0.0820
C12 - - - 0.1168 0.0140
C13 - - - 0.1998 0.0240
Table 11: Industrial economic evaluation table.
Evaluation content Electricity generation Briquette fuel Methane Gasification Biological liquid fuels
Maturity of technology C1 3 3 4 2 2
Integration of technology with local society C2 3 3 5 3 2
Acceptance of local residents C3 3 3 4 3 2
Abundance of local resources C4 3 4 5 4 3
Stability of resource supply C5 2 3 4 2 2
Demand for energy generation C6 3 3 4 2 3
Generating stability in energy supply C7 4 3 4 2 3
Convenience of energy production C8 3 2 4 2 4
Unit cost of energy supply C9 2 2 5 2 3
Acceptability of total investment C10 3 4 5 3 2
Carbon dioxide emission reduction rate C11 5 1 3 3 3
Impact on water resources C12 3 2 1 2 2
Influence on cultivated land C13 3 2 2 3 4
Comprehensive evaluation value 3.07 2.79 4.16 2.78 2.45

1493ECONOMIC DEVELOPMENT OF BIOMASS ENERGY INDUSTRY IN HEILONGJIANG PROVINCE
Nature Environment and Pollution Technology • Vol. 18, No. 5 (Special Issue), 2019
Based on the research conclusion, the following sug-gestions for the economic development of biomass energy industry in Heilongjiang Province are put forward: First, vigorously popularize rural biogas. Heilongjiang Province has a good foundation for rural biogas construction and a high degree of technical maturity. In the future, priority should be given to the development of biomass biogas projects, vig-orously building the service network system of rural biogas projects, and forming a “pre-production, mid-production and post-production” integrated service chain. Secondly, biomass power generation should be steadily promoted. In the future, the approved biomass power generation projects under construction in Heilongjiang Province are focused on, suitable sites for new biomass power generation projects in areas with abundant biomass resources and no large-scale utilization projects are selected, and new biomass power generation projects re scientifically planned, so as to stead-ily promote the development of biomass power generation industry. Then, solid briquette fuels and biomass gasification are actively promoted. According to the development demand of biomass power generation and gasification industries, it is suggested to actively promote the biomass solidified briquette industry. Due to the technical bottleneck and environmental secondary pollution of biomass gasification, it is suggested that biomass gasification should be properly developed. Finally, the bio-liquid fuels are developed, mainly through the use of biomass or cultivation of non-food energy crops, from which biodiesel and fuel ethanol are developed. Heilongjiang Province’s biodiesel production capacity and technology research and development are in the leading domestic level, striving to build a biodiesel production base as soon as possible.
ACKNOWLEDGEMENT
The authors acknowledge the National Natural Science Foun-dation of China (Grant: 111578109), the National Natural Science Foundation of China (Grant: 11111121005).
REFERENCES
Abdul Rahman, M. F., Mohd Armi, A. S. and Khairul Bariyah, A. H. 2018. Journal CleanWAS, 2(1): 06-10.
Edgar, J. J., Felix, T. and Rodeano, R. 2018. Engineering properties of de-bris flow material at Bundu Tuhan, Ranau, Sabah, Malaysia. Pakistan Journal of Geology, 2(2): 22-26.
Ghanshyam, T. P., Tatung, T. S., Kishan, S. R. and Sudhir, K. S. 2019. Es-timation of infiltration rate from soil properties using regression model for cultivated land. Geology, Ecology, and Landscapes. 3(1): 1-13.
Jerson, G., Carlos, R., Dagoberto, A., Juan, C.V. and Diego, C. 2018. Fi-
nancial evaluation of 2 MW electricity generation from forest biomass in Costa Rica. Kurú, 15(1): 37-44.
Khan, M. M. H. 2018. Occurrence, Distribution, host preference and damage severity of red pumpkin beetle - A review. Malaysian Journal of Halal Research Journal, 1(1): 03-09.
Md. Reaz, M. 2019. Large scale production and increased shelf life of Trichoderma harzianum inoculums in semi solid medium. Malaysian Journal of Sustainable Agriculture, 3(1): 05-07.
Mekonnen, D., Bryan, E. and Alemu, T. 2017. Food versus fuel: examining tradeoffs in the allocation of biomass energy sources to domestic and productive uses in Ethiopia. Khirurgiia, 48(4): 425-435.
Mohammed, H. 2018. Effect of rhizobium inoculation with phosphorus and nitrogen fertilizer on physico-chemical properties of the groundnut soil. Environment & Ecosystem Science, 2(1): 04-06.
Motghare, K. A., Rathod, A. P. and Wasewar, K. L. 2016. Comparative study of different waste biomass for energy application. Waste Manag., 47(Pt A): 40-45.
Muhammad, U., Noor, B. and Fazal, G. 2018. Higher order compact finite difference method for the solution of 2-D time fractional diffusion equation. Matrix Science Mathematic, 1(1): 04-08.
Nakomcicsmaragdakis, B., Cepic, Z. and Dragutinovic, N. 2016. Analysis of solid biomass energy potential in autonomous province of Vojvodina. Renew. Sust. Energ. Rev., 57: 186-191.
Nishiguchi, S. and Tabata, T. 2016. Assessment of social, economic, and environmental aspects of woody biomass energy utilization: direct burning and wood pellets. Renew. Sust. Energ. Rev., 57: 1279-1286.
Nurul Syahidah, Z., Wei, L. A. and Abdul Wahab, M. 2018. Cake filtration for suspended solids removal in digestate from anaerobic digested palm oil mill effluent (Pome). Water Conservation and Management, 2(1): 05-09.
Nwankwo, C. and Nwankwoala, H.O. 2018. Gully erosion susceptibility mapping in Ikwuano local government area of Abia State using GIS techniques. Earth Sciences Malaysia, 2(1): 08-15.
Rodeano, R. and Felix, T. 2018. Engineering geological assessment (EGA) on slopes along the Penampang to Tambunan Road, Sabah, Malaysia. Malaysian Journal of Geosciences, 2(1): 09-17.
Rohana, T. and Laurine, D. 2018. Spring-water as an alternative resource after earthquake for villagers, Kota Belud Sabah. Geological Behavior, 2(1): 05-11.
Sajid, M., Syed Tahseen, K. and Syed Shahzaib, A. 2018. Comparison of drinking water bottles of different countries along with Zamzam water, Pakistan. Earth Sciences Pakistan, 2(1): 05-14.
Salem, S. Abu, A., Abbas, F. M., Alkarkhi, Marlia, M., Hanafiah and Mohammed Shadi, S. A. 2017. The effect of combined Al2SO4 and persulfate on COD, color and NH3-N removal from leachate. Acta Chemica Malaysia, 1(2): 11-17.
Tziolas, E., Manos, B. and Bournaris, T. 2016. Planning of agro-energy districts for optimum farm income and biomass energy from crops residues. Oper. Res., 6(2): 1-12.
Xiao, G.Y. and Ashraf, M. A. 2018. Opposite degree computation and its application. Engineering Heritage Journal, 2(1): 05-13.
Yanan, L, Peng, Y. and Huajun, W. 2018. Collecting coal fired power envi-ronmental tax to promote wind power development and environmental improvement. Acta Scientifica Malaysia, 2(1): 05-08.
Zaleha, K., Zuhairi, A. and Norshida, I. 2018. Diversity of bivalves in mangrove forest, Tok Bali Kelantan, Malaysia. Science Heritage Journal, 2(2): 04 -09.
Zheng, Y., Dong, L.H. and Li, F.R. 2016. Branch quantity distribution simulation for Pinus koraiensis plantation in Heilongjiang Province, China. Ying Yong Sheng Tai Xue Bao, 27(7): 2172-2180.

Vol. 18, No. 5 (Special Issue), 2019 • Nature Environment and Pollution Technology
1494

Carbon Emission from Modern Coal Chemical Industry and Its Economic Impact in the Rebuilding of Old Industrial Base in Northeast China
Liying Zhang and Cuixia LiInstitute of Economic Management, Northeast Agricultural University, Harbin, Heilongjiang Province, 150030, China
ABSTRACT
In order to study the relationship between economic growth and carbon emissions in Northeast China, Tapio decoupling model can be introduced to help analyse the elastic relationship between energy saving and emission reduction and economic benefits in Northeast China. The results show that in recent years, especially in the past 10 years, the economy of Northeast China has not developed rapidly. However, the carbon emissions remain high, which means energy saving has been achieved, but the effect of emission reduction is not good, and the relationship between economic growth and carbon emissions is weak decoupling. Through the gradual improvement of the influencing factors and the establishment of a complete data model for analysis and comparison, it is found that among a series of influencing factors, large-scale enterprises and enterprises with deep opening-up often achieve the decoupling of economic growth and carbon emissions. The larger the scale of enterprises is, the more obvious the decoupling effect is, which is the most important factor.
INTRODUCTION
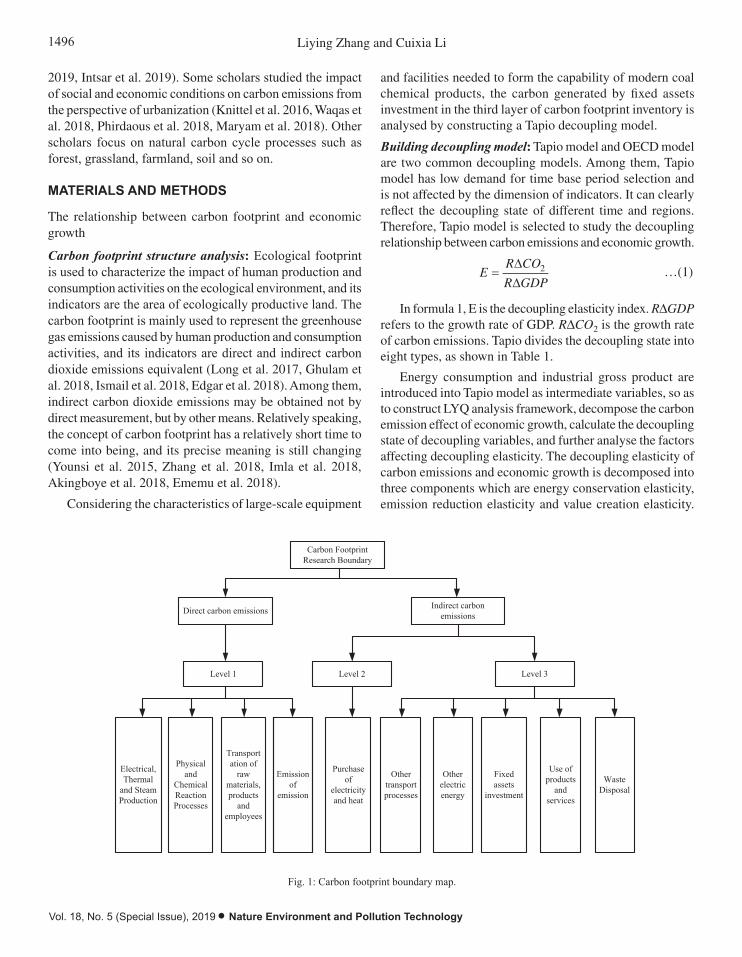
In recent years, with the rapid economic development, sus-tained population expansion, industrialization and urbani-zation, energy consumption has increased dramatically, and the ecological environment has deteriorated increasingly, especially the climate warming caused by greenhouse gas emissions has seriously threatened the survival and develop-ment of human beings. Low-carbon economy has attracted worldwide attention and became the preferred strategy to cope with climate change and achieve sustainable economic development. The old industrial base in Northeast China is a serious disaster area of carbon emission in China. It inevita-bly becomes the primary target of carbon emission reduction in the whole country, and industry is the main force of energy consumption. Therefore, it is necessary to analyse the influ-encing factors of the change of industrial carbon emission in the old industrial base in Northeast China and find out the measures to control or reduce the carbon emission. It is of great significance for energy saving and emission reduction and promoting the development of low-carbon economy in the old industrial base in Northeast China. A decoupling model used to analyse the decoupling relationship between economic growth and carbon emissions is built. The specific factors affecting the decoupling relationship between carbon emissions and economic growth through the spatial panel model are further analysed. The purpose is to provide an empirical reference for energy saving and emission reduction in the future of the old industrial base in Northeast China,
and accordingly put forward policy recommendations to control carbon emissions, so as to promote the development of low-carbon economy in the old industrial base in Northeast China, and realize the revitalization and long-term sustaina-ble development of the old industrial base in Northeast China.
State of the art: This study concludes that many countries in Asia have higher carbon dioxide emissions which increase with the increase of energy consumption. With the change of economic development stage, there are some differences between the increase of carbon dioxide emissions and eco-nomic growth. Global economic development is constantly reaching a new high record, while energy consumption is also increasing, especially fossil fuels. In particular, the use of fossil fuels remains high, which destroys the balance of carbon dioxide in the atmosphere. This cannot and shouldn’t be achieved only by reducing energy consumption.
Currently, most of the energy and carbon emissions as-sessment studies are based on global or national scales. Most of the studies on China’s carbon emissions by some scholars focus on the total amount of carbon emissions at the national level (Fan et al. 2015, Kekwaru et al. 2018, Akash et al. 2017, Marwan et al. 2018). Some studies selected Northeast China as the research object and conclude that the per capita carbon emissions and intensity of carbon emissions in Northeast China are higher than the national level. The main reason is the excessive dependence on fossil fuels in Northeast China, which leads to the continuous increase of carbon dioxide emissions (Miao et al. 2016, H’ng et al. 2018, Wafae et al.
Nat. Env. & Poll. Tech.Website: www.neptjournal.com
Received: 08-08-2019 Accepted: 22-10-2019
Key Words:Old industrial base Carbon emission Coal chemical industry Tapio decoupling model
2019pp.1495-1500 Vol. 18
p-ISSN: 0972-6268 No. 5 (Special Issue)
Nature Environment and Pollution Technology An International Quarterly Scientific Journal
Original Research Paper
e-ISSN: 2395-3454
Open Access
1496 Liying Zhang and Cuixia Li
Vol. 18, No. 5 (Special Issue), 2019 • Nature Environment and Pollution Technology
2019, Intsar et al. 2019). Some scholars studied the impact of social and economic conditions on carbon emissions from the perspective of urbanization (Knittel et al. 2016, Waqas et al. 2018, Phirdaous et al. 2018, Maryam et al. 2018). Other scholars focus on natural carbon cycle processes such as forest, grassland, farmland, soil and so on.
MATERIALS AND METHODS
The relationship between carbon footprint and economic growth
Carbon footprint structure analysis: Ecological footprint is used to characterize the impact of human production and consumption activities on the ecological environment, and its indicators are the area of ecologically productive land. The carbon footprint is mainly used to represent the greenhouse gas emissions caused by human production and consumption activities, and its indicators are direct and indirect carbon dioxide emissions equivalent (Long et al. 2017, Ghulam et al. 2018, Ismail et al. 2018, Edgar et al. 2018). Among them, indirect carbon dioxide emissions may be obtained not by direct measurement, but by other means. Relatively speaking, the concept of carbon footprint has a relatively short time to come into being, and its precise meaning is still changing (Younsi et al. 2015, Zhang et al. 2018, Imla et al. 2018, Akingboye et al. 2018, Ememu et al. 2018).
Considering the characteristics of large-scale equipment
and facilities needed to form the capability of modern coal chemical products, the carbon generated by fixed assets investment in the third layer of carbon footprint inventory is analysed by constructing a Tapio decoupling model.
Building decoupling model: Tapio model and OECD model are two common decoupling models. Among them, Tapio model has low demand for time base period selection and is not affected by the dimension of indicators. It can clearly reflect the decoupling state of different time and regions. Therefore, Tapio model is selected to study the decoupling relationship between carbon emissions and economic growth.
ER CO
R GDP=
∆∆
2 …(1)
In formula 1, E is the decoupling elasticity index. RDGDP refers to the growth rate of GDP. RDCO2 is the growth rate of carbon emissions. Tapio divides the decoupling state into eight types, as shown in Table 1.
Energy consumption and industrial gross product are introduced into Tapio model as intermediate variables, so as to construct LYQ analysis framework, decompose the carbon emission effect of economic growth, calculate the decoupling state of decoupling variables, and further analyse the factors affecting decoupling elasticity. The decoupling elasticity of carbon emissions and economic growth is decomposed into three components which are energy conservation elasticity, emission reduction elasticity and value creation elasticity.
Carbon FootprintResearch Boundary
Direct carbon emissions Indirect carbonemissions
Level 1 Level 2 Level 3
Electrical,Thermal
and SteamProduction
Transportation of
rawmaterials,products
andemployees
Physicaland
ChemicalReactionProcesses
Emissionof
emission
Purchaseof
electricityand heat
Othertransportprocesses
Otherelectricenergy
Fixedassets
investment
Use ofproducts
andservices
WasteDisposal
Fig. 1: Carbon footprint boundary map.
Building decoupling model: Tapio model and OECD model are two common decoupling models. Among them, Tapio model has low demand for time base period selection and is not affected by the dimension of indicators. It can clearly reflect the decoupling state of different time and regions. Therefore, Tapio model is selected to study the decoupling relationship between carbon emissions and economic growth.
2R COER GDP
…(1)
In formula 1, E is the decoupling elasticity index. R GDP refers to the growth rate of GDP. 2R CO is the growth rate of carbon emissions. Tapio divides the decoupling state into eight types, as shown in Table 1.
Table 1: Classification of Tapio decoupling elasticity.
Decoupling state 2CO GDP Elastic level E
Negative decoupling
Strong negative decoupling >0 <0 <0
Weakly negative decoupling <0 <0 0<t<0.8
Expansion negative decoupling >0 >0 t>1.2
Decoupling
Strong decoupling <0 >0 <0
Weak decoupling >0 >0 0<t<0.8
Recessive decoupling <0 <0 t>1.2
Connect Growth link >0 >0 0<t<0.8
Fig. 1: Carbon footprint boundary map.
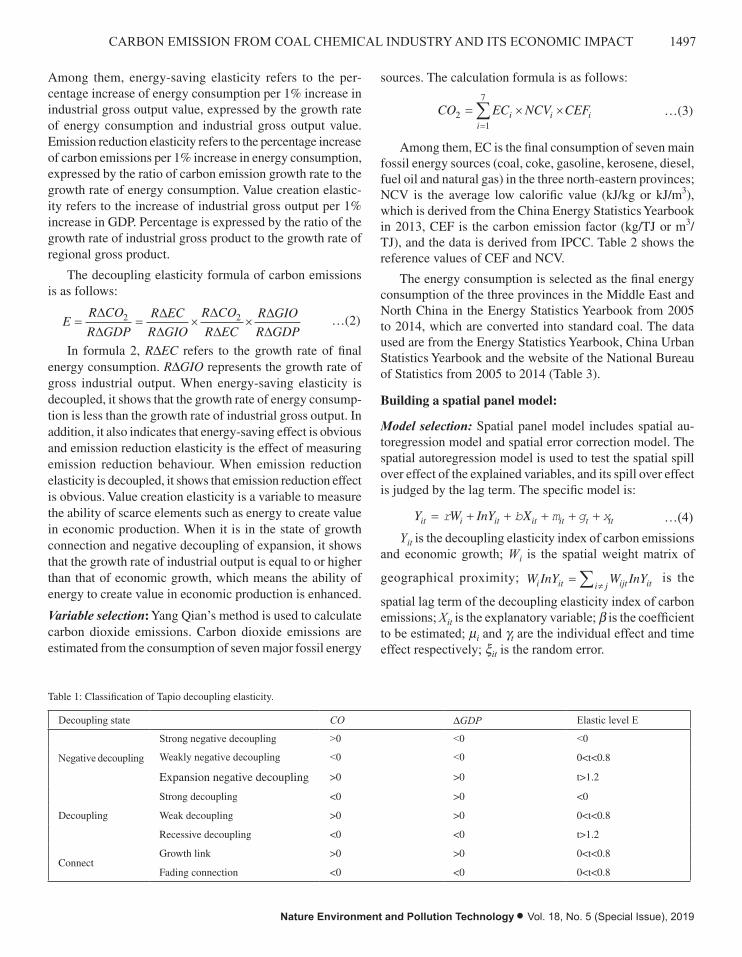
1497CARBON EMISSION FROM COAL CHEMICAL INDUSTRY AND ITS ECONOMIC IMPACT
Nature Environment and Pollution Technology • Vol. 18, No. 5 (Special Issue), 2019
Among them, energy-saving elasticity refers to the per-centage increase of energy consumption per 1% increase in industrial gross output value, expressed by the growth rate of energy consumption and industrial gross output value. Emission reduction elasticity refers to the percentage increase of carbon emissions per 1% increase in energy consumption, expressed by the ratio of carbon emission growth rate to the growth rate of energy consumption. Value creation elastic-ity refers to the increase of industrial gross output per 1% increase in GDP. Percentage is expressed by the ratio of the growth rate of industrial gross product to the growth rate of regional gross product.
The decoupling elasticity formula of carbon emissions is as follows:
ER CO
R GDP
R EC
R GIO
R CO
R EC
R GIO
R GDP= = × ×
∆∆
∆∆
∆∆
∆∆
2 2 …(2)
In formula 2, RDEC refers to the growth rate of final energy consumption. RDGIO represents the growth rate of gross industrial output. When energy-saving elasticity is decoupled, it shows that the growth rate of energy consump-tion is less than the growth rate of industrial gross output. In addition, it also indicates that energy-saving effect is obvious and emission reduction elasticity is the effect of measuring emission reduction behaviour. When emission reduction elasticity is decoupled, it shows that emission reduction effect is obvious. Value creation elasticity is a variable to measure the ability of scarce elements such as energy to create value in economic production. When it is in the state of growth connection and negative decoupling of expansion, it shows that the growth rate of industrial output is equal to or higher than that of economic growth, which means the ability of energy to create value in economic production is enhanced.
Variable selection: Yang Qian’s method is used to calculate carbon dioxide emissions. Carbon dioxide emissions are estimated from the consumption of seven major fossil energy
sources. The calculation formula is as follows:
CO EC NCV CEFii
i i21
7
= × ×=∑ …(3)
Among them, EC is the final consumption of seven main fossil energy sources (coal, coke, gasoline, kerosene, diesel, fuel oil and natural gas) in the three north-eastern provinces; NCV is the average low calorific value (kJ/kg or kJ/m3), which is derived from the China Energy Statistics Yearbook in 2013, CEF is the carbon emission factor (kg/TJ or m3/TJ), and the data is derived from IPCC. Table 2 shows the reference values of CEF and NCV.
The energy consumption is selected as the final energy consumption of the three provinces in the Middle East and North China in the Energy Statistics Yearbook from 2005 to 2014, which are converted into standard coal. The data used are from the Energy Statistics Yearbook, China Urban Statistics Yearbook and the website of the National Bureau of Statistics from 2005 to 2014 (Table 3).
Building a spatial panel model:
Model selection: Spatial panel model includes spatial au-toregression model and spatial error correction model. The spatial autoregression model is used to test the spatial spill over effect of the explained variables, and its spill over effect is judged by the lag term. The specific model is:
Y W InY Xit i it it it t it= + + + + +r b m g x …(4)Yit is the decoupling elasticity index of carbon emissions
and economic growth; Wi is the spatial weight matrix of
geographical proximity; W InY W InYi it ijt iti j=
≠∑ is the
spatial lag term of the decoupling elasticity index of carbon emissions; Xit is the explanatory variable; b is the coefficient to be estimated; mi and gt are the individual effect and time effect respectively; xit is the random error.
Table 1: Classification of Tapio decoupling elasticity.
Decoupling state CO DGDP Elastic level E
Negative decoupling
Strong negative decoupling >0 <0 <0
Weakly negative decoupling <0 <0 0<t<0.8
Expansion negative decoupling >0 >0 t>1.2
Decoupling
Strong decoupling <0 >0 <0
Weak decoupling >0 >0 0<t<0.8
Recessive decoupling <0 <0 t>1.2
ConnectGrowth link >0 >0 0<t<0.8
Fading connection <0 <0 0<t<0.8
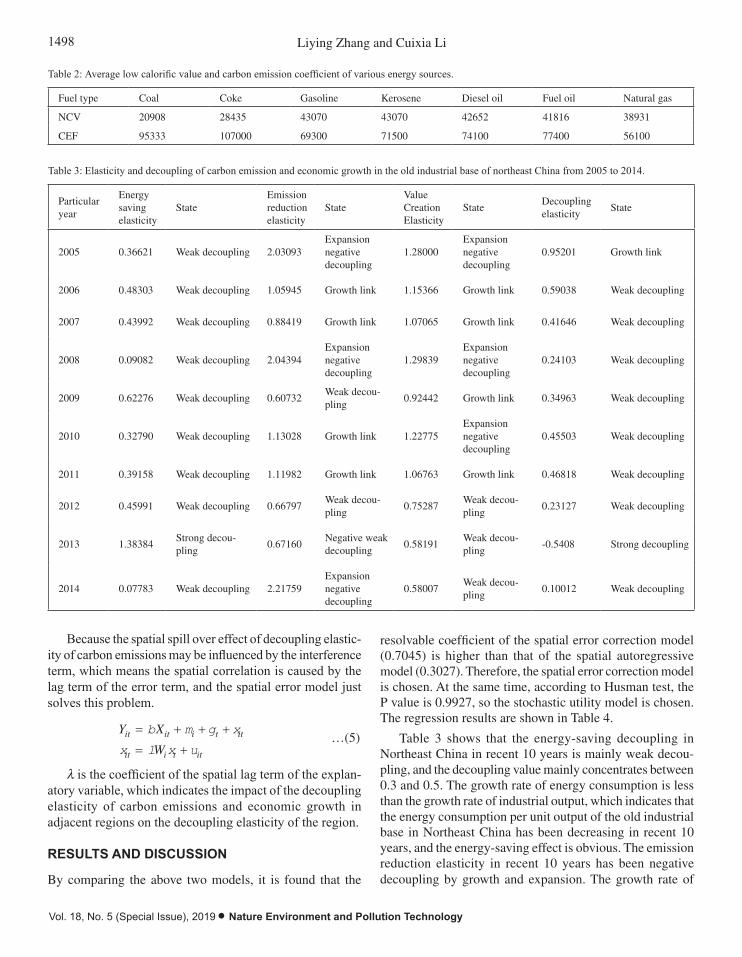
1498 Liying Zhang and Cuixia Li
Vol. 18, No. 5 (Special Issue), 2019 • Nature Environment and Pollution Technology
Because the spatial spill over effect of decoupling elastic-ity of carbon emissions may be influenced by the interference term, which means the spatial correlation is caused by the lag term of the error term, and the spatial error model just solves this problem.
Y X
Wit it i t it
it i t it
= + + +
= +
b m g x
x l x u …(5)
l is the coefficient of the spatial lag term of the explan-atory variable, which indicates the impact of the decoupling elasticity of carbon emissions and economic growth in adjacent regions on the decoupling elasticity of the region.
RESULTS AND DISCUSSION
By comparing the above two models, it is found that the
resolvable coefficient of the spatial error correction model (0.7045) is higher than that of the spatial autoregressive model (0.3027). Therefore, the spatial error correction model is chosen. At the same time, according to Husman test, the P value is 0.9927, so the stochastic utility model is chosen. The regression results are shown in Table 4.
Table 3 shows that the energy-saving decoupling in Northeast China in recent 10 years is mainly weak decou-pling, and the decoupling value mainly concentrates between 0.3 and 0.5. The growth rate of energy consumption is less than the growth rate of industrial output, which indicates that the energy consumption per unit output of the old industrial base in Northeast China has been decreasing in recent 10 years, and the energy-saving effect is obvious. The emission reduction elasticity in recent 10 years has been negative decoupling by growth and expansion. The growth rate of
Table 2: Average low calorific value and carbon emission coefficient of various energy sources.
Fuel type Coal Coke Gasoline Kerosene Diesel oil Fuel oil Natural gas
NCV 20908 28435 43070 43070 42652 41816 38931
CEF 95333 107000 69300 71500 74100 77400 56100
Table 3: Elasticity and decoupling of carbon emission and economic growth in the old industrial base of northeast China from 2005 to 2014.
Particular year
Energy saving elasticity
StateEmission reduction elasticity
StateValue Creation Elasticity
StateDecoupling elasticity
State
2005 0.36621 Weak decoupling 2.03093Expansion negative decoupling
1.28000Expansion negative decoupling
0.95201 Growth link
2006 0.48303 Weak decoupling 1.05945 Growth link 1.15366 Growth link 0.59038 Weak decoupling
2007 0.43992 Weak decoupling 0.88419 Growth link 1.07065 Growth link 0.41646 Weak decoupling
2008 0.09082 Weak decoupling 2.04394Expansion negative decoupling
1.29839Expansion negative decoupling
0.24103 Weak decoupling
2009 0.62276 Weak decoupling 0.60732Weak decou-pling
0.92442 Growth link 0.34963 Weak decoupling
2010 0.32790 Weak decoupling 1.13028 Growth link 1.22775Expansion negative decoupling
0.45503 Weak decoupling
2011 0.39158 Weak decoupling 1.11982 Growth link 1.06763 Growth link 0.46818 Weak decoupling
2012 0.45991 Weak decoupling 0.66797Weak decou-pling
0.75287Weak decou-pling
0.23127 Weak decoupling
2013 1.38384Strong decou-pling
0.67160Negative weak decoupling
0.58191Weak decou-pling
-0.5408 Strong decoupling
2014 0.07783 Weak decoupling 2.21759Expansion negative decoupling
0.58007Weak decou-pling
0.10012 Weak decoupling
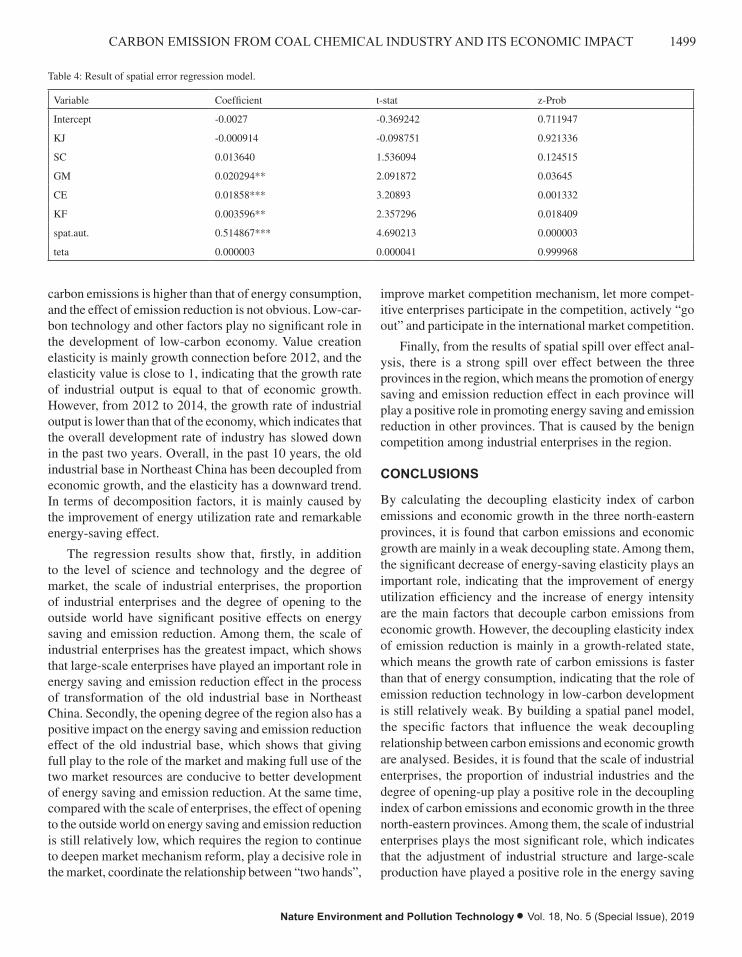
1499CARBON EMISSION FROM COAL CHEMICAL INDUSTRY AND ITS ECONOMIC IMPACT
Nature Environment and Pollution Technology • Vol. 18, No. 5 (Special Issue), 2019
carbon emissions is higher than that of energy consumption, and the effect of emission reduction is not obvious. Low-car-bon technology and other factors play no significant role in the development of low-carbon economy. Value creation elasticity is mainly growth connection before 2012, and the elasticity value is close to 1, indicating that the growth rate of industrial output is equal to that of economic growth. However, from 2012 to 2014, the growth rate of industrial output is lower than that of the economy, which indicates that the overall development rate of industry has slowed down in the past two years. Overall, in the past 10 years, the old industrial base in Northeast China has been decoupled from economic growth, and the elasticity has a downward trend. In terms of decomposition factors, it is mainly caused by the improvement of energy utilization rate and remarkable energy-saving effect.
The regression results show that, firstly, in addition to the level of science and technology and the degree of market, the scale of industrial enterprises, the proportion of industrial enterprises and the degree of opening to the outside world have significant positive effects on energy saving and emission reduction. Among them, the scale of industrial enterprises has the greatest impact, which shows that large-scale enterprises have played an important role in energy saving and emission reduction effect in the process of transformation of the old industrial base in Northeast China. Secondly, the opening degree of the region also has a positive impact on the energy saving and emission reduction effect of the old industrial base, which shows that giving full play to the role of the market and making full use of the two market resources are conducive to better development of energy saving and emission reduction. At the same time, compared with the scale of enterprises, the effect of opening to the outside world on energy saving and emission reduction is still relatively low, which requires the region to continue to deepen market mechanism reform, play a decisive role in the market, coordinate the relationship between “two hands”,
improve market competition mechanism, let more compet-itive enterprises participate in the competition, actively “go out” and participate in the international market competition.
Finally, from the results of spatial spill over effect anal-ysis, there is a strong spill over effect between the three provinces in the region, which means the promotion of energy saving and emission reduction effect in each province will play a positive role in promoting energy saving and emission reduction in other provinces. That is caused by the benign competition among industrial enterprises in the region.
CONCLUSIONS
By calculating the decoupling elasticity index of carbon emissions and economic growth in the three north-eastern provinces, it is found that carbon emissions and economic growth are mainly in a weak decoupling state. Among them, the significant decrease of energy-saving elasticity plays an important role, indicating that the improvement of energy utilization efficiency and the increase of energy intensity are the main factors that decouple carbon emissions from economic growth. However, the decoupling elasticity index of emission reduction is mainly in a growth-related state, which means the growth rate of carbon emissions is faster than that of energy consumption, indicating that the role of emission reduction technology in low-carbon development is still relatively weak. By building a spatial panel model, the specific factors that influence the weak decoupling relationship between carbon emissions and economic growth are analysed. Besides, it is found that the scale of industrial enterprises, the proportion of industrial industries and the degree of opening-up play a positive role in the decoupling index of carbon emissions and economic growth in the three north-eastern provinces. Among them, the scale of industrial enterprises plays the most significant role, which indicates that the adjustment of industrial structure and large-scale production have played a positive role in the energy saving
Table 4: Result of spatial error regression model.
Variable Coefficient t-stat z-Prob
Intercept -0.0027 -0.369242 0.711947
KJ -0.000914 -0.098751 0.921336
SC 0.013640 1.536094 0.124515
GM 0.020294** 2.091872 0.03645
CE 0.01858*** 3.20893 0.001332
KF 0.003596** 2.357296 0.018409
spat.aut. 0.514867*** 4.690213 0.000003
teta 0.000003 0.000041 0.999968

1500 Liying Zhang and Cuixia Li
Vol. 18, No. 5 (Special Issue), 2019 • Nature Environment and Pollution Technology
and emission reduction effect in the process of the adjustment of the old industrial bases in Northeast China.
Based on the research conclusion, the following sugges-tions for energy saving and emission reduction of the old industrial base in Northeast China are put forward. Firstly, it is necessary to play the role of large-scale enterprises, make use of their abundant capital and high level of science and technology, further improve the efficiency of energy utilization, and focus on improving the technology level of emission reduction on the basis of energy saving. Secondly, it is also necessary to speed up industrial restructuring, elimi-nate backward capacity enterprises, and achieve high-quality production level of industrial enterprises. Finally, enterprises in the region are encouraged to actively go out and participate in market competition and make full use of the two markets and resources, so as to better realize production with high energy utilization and less environmental pollution in inter-national competition.
ACKNOWLEDGEMENTS
The authors acknowledge the National Natural Science Foun-dation of China (Grant: 111578109), the National Natural Science Foundation of China (Grant: 11111121005).
REFERENCES
Akash, K., and Yugal, A. 2017. Study of quality testing of milk powder in sterling agro industries limited - Nova. Acta Chemica. Malaysia, 1(2): 08-10.
Akingboye, A. S., Ademila, O. and Ogunyele, A. C. 2018. Improved mag-netic data analyses and enhancement techniques for lithological and structural mapping around Akure, Southwestern Nigeria. Earth Sciences Malaysia, 2(1): 16-21.
Edgar, J.J., Felix, T. and Rodeano, R. 2018. Relationship between rainfall and debris flow occurrence in the Crocker range of Sabah, Malaysia. Malaysian Journal of Geosciences, 2(1): 18-29.
Ememu, A.J. and Nwankwoala, H.O. 2018. Application of water quality index (WQI) for agricultural and irrigational use around Okpoko, Southeastern Nigeria. Engineering Heritage Journal, 2(1): 14-18.
Fan, T., Luo, R. and Xia, H. 2015. Using LMDI method to analyse the influencing factors of carbon emissions in China’s petrochemical industries. Nat Hazards, 75(2): 319-332.
Ghulam, H., Rahmat, A.K. and Muhammad, I. 2018. Existence of positive solutions to a coupled system of fractional hybrid differential equations. Matrix Science Mathematic, 1(1): 09-12.
H’ng, S.Y., Mohd Shamsul, A. and Mohd Zuhair, M. N. 2018. Drying, colour and sensory characteristics of ‘Berangan’ Banana (Musa Ac-cuminata) flesh dried using a microwave oven. Malaysian Journal of Halal Research, 1(1): 10-14.
Imla, E. and Hafizuddin, W. Y. 2018. The use of factorial design for analysis of mercury removal efficiency using palm oil fuel ash. Water Conser-vation and Management, 2(1): 10-12.
Intsar, H. H., Al-Hilfy, S. A., Wahid, H. M. K., Al-Abodi, S. A. A., Al-Salm-ani, Md. Reaz Mahamud and Md. Bellal Hossain. 2019. Grain yield and quality of wheat as affected by cultivars and seeding rates. Malaysian Journal of Sustainable Agriculture, 3(1): 08-12.
Ismail, A. R., Sanudin, T., Baba, M. and Rodeano, R. 2018. Urbanization vs environmental quality: some observation in Telipok, Sabah, Malaysia. Geological Behavior, 2(1): 12-17.
Kekwaru, M.M. and Nwankwoala, H.O. 2018. Determination of groundwater and overland flow direction in Ndele, Rivers State, Nigeria. Pakistan Journal of Geology, 2(2): 18-21.
Knittel, C., Metaxoglou, K. and Trindade, A. 2016. Are we fracked? The impact of falling gas prices and the implications for coal-to-gas switching and carbon emissions. Oxford Rev. Econ. Pol., 32(2): 241-259.
Long, Z. and Xin, Z. 2017. Decoupling relationship between industrial growth and carbon emissions in three north-eastern provinces of China: Anal-ysis based on stability and deviation. Journal of Discrete Mathematical Sciences & Cryptography, 20(1): 271-294.
Marwan, M. and Ahmed, A. 2018. Protein digestibility and amino acid content of Malaysian local egg protein prepared by different methods. Environment & Ecosystem Science, 2(1): 07-09.
Maryam, Z., Hazrin, A. H., Hizrri, A., Norhidayah, A., Samsuddin, N. and Mohd Shukri, M.A. 2018. Association of particulate matter (PM) with respiratory symptoms among children in selected primary schools in Pahang. Journal Clean WAS, 2(1): 11-15.
Miao, Y., Song, C. and Wang, X. 2016. Annual carbon gas emissions from a boreal peatland in continuous permafrost zone, northeast China. CLEAN - Soil, Air, Water, 44(5): 456-463.
Phirdaous, A., Yumi, Z.H.Y. H. and Hamzah, M. S. 2018. Cytotoxic effects and response surface optimization of solvent extraction of crude extracts from Aquilaria subintegra uninfected branch. Science Heritage Journal, 2(2): 10 -15.
Wafae, N., Saïd, C., Dimitri, R., Ismail, K., Abderrahim, E., Jamal, C., Mo-hamed, A., Bouchra, R., Mohamed, Y. and Fatima, E. H. 2019. Mapping the water erosion risk in the Lakhdar river basin (central High Atlas, Morocco). Geology, Ecology, and Landscapes, 3(1): 22-28.
Waqas, A., Muhammad, S.N., Abdul, N., Haroon, R., Iqra, A., Syed Hamza, G. and Muhammad, J. L. 2018. Assessment of carbon footprints in terms of CO2 of diesel generator, Pakistan. Earth Sciences Pakistan, 2(1): 15-17.
Younsi, M., Hassine, A. B. H. and Ncir, M. 2015. The Economic and energy effects of carbon dioxide emissions trading in the international market: New challenge conventional measurement. Journal of the Knowledge Economy, 8(2): 1-20.
Zhang L, Xu D, and Wang H. 2018. Two-stage cubature Kalman Filter and its application in water pollution model. Acta Scientifica Malaysia, 2(1): 09-13.
Decolourization and Stability of Ozone Oxidation in Municipal Wastewater Regeneration
Hui-rong Wei* and Nguyen Xuan Phuong***School of Chemical Engineering, Lanzhou Institute of Arts and Science, Lanzhou 730000, China**Ho Chi Minh City University of Transport, Ho Chi Minh, Vietnam
ABSTRACT
In order to understand the de-colourization effect and stability of ozone oxidation in municipal wastewater regeneration process, ozone oxidation experiment and related index analysis method are used. The results show that ozone oxidation treatment can effectively reduce the colour and true colour of secondary effluent. During the simulation of natural conditions, the true colour of water samples with different ozone dosage doesn’t change significantly after 22 days, and the changes in surface colour and chlorophyll-a show good consistency. When the ozone dosage is less than 6 mg·L-1, the colour of water samples increases slowly within 12 days, then rise rapidly until the maximum is reached after 22 days. Low dose ozone treatment (less than 6 mg·L-1) can promote algae reproduction and increase the instability of water colour. However, when the dosage of ozone is more than 8 mg·L-1, it can obviously prolong the time of colour repetition of civilian water samples. The colour and turbidity of water samples increase slightly after 18 days. The changes in colour and turbidity are mainly caused by the living and reproduction of algae. High ozone dosage can maintain the stability of colour of water. Therefore, the ozone dosage of 8 mg·L-1 is recommended for municipal wastewater regeneration treatment.
INTRODUCTION
As an irreplaceable natural resource, water resources play an important role in economic development and people’s lives. China is a country with a serious water shortage. The total amount of freshwater resources in China is 280 billion cubic meters, accounting for 6% of the world’s water resources. It ranks fourth in the world after Brazil, Russia and Canada. However, its per capita water resources are only 2,200 cubic meters, which is less than one fourth of the world’s average level. It is one of the 13 countries with the poorest per capita water resources in the world. There is a great disparity in the quantity of water resources in different parts of China. The uneven distribution of rainfall, runoff and time-space distribution of water resources during the year not only causes frequent floods or droughts in large areas, but also aggravates the imbalance between supply and demand of water resources. Besides, that is also extremely unfavourable to the development and utilization of water resources. There are more than 600 cities in China. By the end of the 20th century, more than 400 cities had water shortage problems, including 110 cities with serious water shortage and 6 bil-lion cubic meters of total water shortage. The increasingly serious water pollution not only reduces the use function of water body, but also further aggravates the contradiction of water resources shortage. A large number of industrial and agricultural sewage discharges into natural water body, which
results in huge environmental problems, has a serious impact on the sustainable development strategy being implemented in China, and also poses a serious threat to the water safety and health of urban residents.
Water is an important material basis for human survival and a non-renewable resource. In order to solve the prob-lem of water shortage in modern cities, many countries and regions in the world have already opened up the secondary effluent of municipal sewage treatment plants as a new water source, and recycled municipal sewage as a way to alleviate the contradiction between supply and demand of water re-sources. The utilization of recycled water has become one of the important ways to solve the water shortage. Reclaimed water refers to the water that can be used usefully after proper treatment of sewage to reach a certain water quality index and meet a certain use requirement. Reclaimed water is a valuable water resource with large quantity, stable water quality and little influence by season and climate. It is internationally recognized as the second water source in cities.
Recycled water reuse is a new water resource utilization technology, which realizes the all-round sustainable utili-zation of water resources and provides a new method for alleviating the shortage of water resources. The utilization of reclaimed water can improve the comprehensive utilization rate of water resources and reduce water pollution. Rational utilization of reclaimed water is an important measure to
Nat. Env. & Poll. Tech.Website: www.neptjournal.com
Received: 01-08-2019 Accepted: 28-10-2019
Key Words:Municipal wastewaterReclaimed water Ozone oxidation Chromaticity
2019pp. 1501-1507 Vol. 18
p-ISSN: 0972-6268 No. 5 (Special Issue)
Nature Environment and Pollution Technology An International Quarterly Scientific Journal
Original Research Paper
e-ISSN: 2395-3454
Open Access
1502 Hui-rong Wei and Nguyen Xuan Phuong
Vol. 18, No. 5 (Special Issue), 2019 • Nature Environment and Pollution Technology
implement the strategy of sustainable development. Re-cycling and recycling of sewage has considerable social, environmental and economic benefits, and has become an inevitable choice to solve the problem of water resources in the world. Therefore, it is of great strategic significance to recycle sewage, open up non-traditional water sources and realize sewage recycling to solve the water resources crisis.
EARLIER STUDIES
The development and utilization of reclaimed water has effectively alleviated the water crisis in water-scarce areas around the world, and has unique advantages in terms of economy, environmental protection and sustainable use. The United States, Japan, Israel, Australia, Singapore and other countries are in the leading position in recycled water reuse technology. The development of sewage recycling technology in these places is earlier and more mature. The technology has been widely used in all walks of life. Recycled water allocation research starts in the United States, and the initial prototype is a simple reclaimed water reuse system. Other system analysis methods are applied to establish a linear programming model for the reuse and transportation of reclaimed water. The model takes the minimum cost of water supply as the objective function, takes the balance of water distribution of multiple sources as the constraint condition, and fully considers the quantity of reclaimed water, the arbitrariness of reclaimed water reuse, seasonal differences and other factors, resulting in better allocation results. However, the linear programming mathematical model has certain limitations because it doesn’t take into account the impact of treatment process, water quality and other factors on the reuse of reclaimed water (Sun et al. 2018, Haroon et al. 2018, Hailing 2017, Md Mahmudul 2018). A study establishes a linear programming model with the lowest water allocation cost of water resources from different sources as objective function and water quality and quantity as constraints. The model is flexible and can meet different water quality standards (Dong et al. 2018). In a recent re-search, the non-linear programming model of regional water supply is developed and applied to Texas. In this way, the regenerated water resources allocation scheme of the region is obtained (Jing et al. 2018). Incorporate sewage into the water resources allocation system and solve the water sup-ply in different years and seasons. Environmental pollution has become a key factor to restrict the rational allocation of reclaimed water. A previous study has put the water quality requirements of reclaimed water and the discharge of water resources pollution into the allocation study and put forward a dynamic programming allocation model of reclaimed water (Wang et al. 2018, Sahadeb et al. 2019, Abija et al. 2018).
A study proposes a system method of reclaimed water allo-cation based on health risk assessment and user acceptance (Chhipi-Shrestha et al. 2017, Chuanlei et al. 2018, Kadharsha et al. 2018). A comprehensive model of reclaimed water reuse including discharge, treatment, transportation, storage and so on is put forward by a study (Jiao et al. 2017, Ullah et al. 2018, Roslee 2018, Thiruchelvam et al. 2018). The model takes into account many factors such as supply and demand, environ-mental pollution, health risk, technical treatment degree and so on. A research thinks that not only the factors put forward by Oron, but also the cost of recycled water reuse should be considered. Therefore, the concept of cost-benefit should be introduced into the allocation of recycled water according to the specific situation of Israel. After the 21st century, the al-location method of renewable water resources is more mature (Gu et al. 2017, Gu et al. 2018). Based on a study, a simula-tion model to simulate Mexico’s surface water, groundwater, reclaimed water and other water use conditions is used, and an economically viable urban water use planning is proposed (Carre et al. 2017, Nwankwoala et al. 2018, Duy et al. 2018). Besides, an economic and technological combination model to plan and dispose municipal wastewater treatment and evaluate the planning and disposal scheme based on environmental impact and economic and technological standards is used (Godenzoni & Perraton 2017, Elmnifi et al. 2018, Hanafiah 2018). In another study, set up cost function and GIS to obtain data were used to study the reclaimed water project in Tokyo area, and obtain a more economical water distribution scheme (Wang et al. 2017, Kamarubahrin et al. 2019).
MATERIALS AND METHODS
Ozone oxidation experiment: The ozone oxidation test is completed in the pilot plant. The pilot plant process main-ly includes air compression and purification device, air condenser, oxygen making device, ozone generator, ozone reaction tower (stainless steel), ozone concentration detector and catalytic ozone tail gas treatment device. Air enters the discharge chamber of ozone generator through compressor and purification device to produce mixing of ozone-contain-ing gases. The ozone mixture gas is evenly distributed into the ozone reactor through the Qin metal aeration device, and the gas-water counter current is carried out in order to fully mix the reaction. The residual ozone enters the ozone tail gas destroyer and is catalytically decomposed. Ozone concentration is detected by on-line monitor (Hare EG-00, Jitsugyo Japan). The effective volume of ozone reactor is 250 L, the contact time between ozone and water is 10 minutes, and the inflow water flow is 1.5 m3h-1. By adjusting ozone concentration and inlet gas flow rate of ozone generator, the dosage is controlled at 2, 4, 6, 8 and 10 mg·L-1.
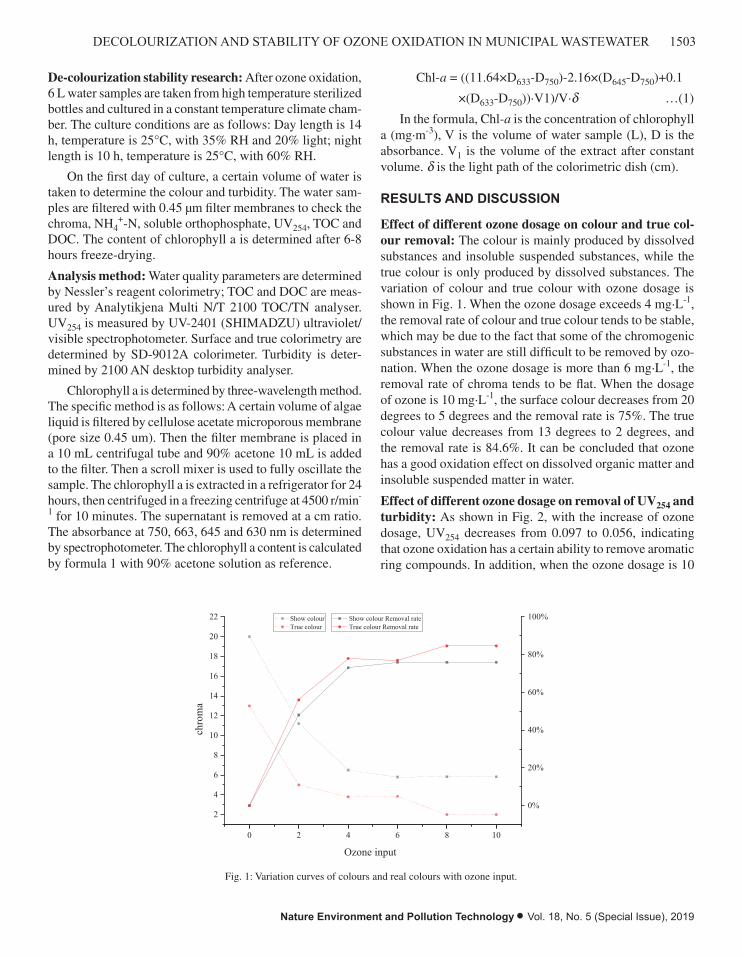
1503DECOLOURIZATION AND STABILITY OF OZONE OXIDATION IN MUNICIPAL WASTEWATER
Nature Environment and Pollution Technology • Vol. 18, No. 5 (Special Issue), 2019
De-colourization stability research: After ozone oxidation, 6 L water samples are taken from high temperature sterilized bottles and cultured in a constant temperature climate cham-ber. The culture conditions are as follows: Day length is 14 h, temperature is 25°C, with 35% RH and 20% light; night length is 10 h, temperature is 25°C, with 60% RH.
On the first day of culture, a certain volume of water is taken to determine the colour and turbidity. The water sam-ples are filtered with 0.45 μm filter membranes to check the chroma, NH4
+-N, soluble orthophosphate, UV254, TOC and DOC. The content of chlorophyll a is determined after 6-8 hours freeze-drying.
Analysis method: Water quality parameters are determined by Nessler’s reagent colorimetry; TOC and DOC are meas-ured by Analytikjena Multi N/T 2100 TOC/TN analyser. UV254 is measured by UV-2401 (SHIMADZU) ultraviolet/visible spectrophotometer. Surface and true colorimetry are determined by SD-9012A colorimeter. Turbidity is deter-mined by 2100 AN desktop turbidity analyser.
Chlorophyll a is determined by three-wavelength method. The specific method is as follows: A certain volume of algae liquid is filtered by cellulose acetate microporous membrane (pore size 0.45 um). Then the filter membrane is placed in a 10 mL centrifugal tube and 90% acetone 10 mL is added to the filter. Then a scroll mixer is used to fully oscillate the sample. The chlorophyll a is extracted in a refrigerator for 24 hours, then centrifuged in a freezing centrifuge at 4500 r/min-
1 for 10 minutes. The supernatant is removed at a cm ratio. The absorbance at 750, 663, 645 and 630 nm is determined by spectrophotometer. The chlorophyll a content is calculated by formula 1 with 90% acetone solution as reference.
Chl-a = ((11.64×D633-D750)-2.16×(D645-D750)+0.1
×(D633-D750))·V1)/V·d …(1)
In the formula, Chl-a is the concentration of chlorophyll a (mg·m-3), V is the volume of water sample (L), D is the absorbance. V1 is the volume of the extract after constant volume. d is the light path of the colorimetric dish (cm).
RESULTS AND DISCUSSION
Effect of different ozone dosage on colour and true col-our removal: The colour is mainly produced by dissolved substances and insoluble suspended substances, while the true colour is only produced by dissolved substances. The variation of colour and true colour with ozone dosage is shown in Fig. 1. When the ozone dosage exceeds 4 mg·L-1, the removal rate of colour and true colour tends to be stable, which may be due to the fact that some of the chromogenic substances in water are still difficult to be removed by ozo-nation. When the ozone dosage is more than 6 mg·L-1, the removal rate of chroma tends to be flat. When the dosage of ozone is 10 mg·L-1, the surface colour decreases from 20 degrees to 5 degrees and the removal rate is 75%. The true colour value decreases from 13 degrees to 2 degrees, and the removal rate is 84.6%. It can be concluded that ozone has a good oxidation effect on dissolved organic matter and insoluble suspended matter in water.
Effect of different ozone dosage on removal of UV254 and turbidity: As shown in Fig. 2, with the increase of ozone dosage, UV254 decreases from 0.097 to 0.056, indicating that ozone oxidation has a certain ability to remove aromatic ring compounds. In addition, when the ozone dosage is 10
value decreases from 13 degrees to 2 degrees, and the removal rate is 84.6%. It can be concluded that ozone has a good oxidation effect on dissolved organic matter and insoluble suspended matter in water.
2
4
6
8
10
12
14
16
18
20
22
0 2 4 6 8 10
0%
20%
40%
60%
80%
100%
chro
ma
Ozone input
Show colourTrue colour
Show colour Removal rate True colour Removal rate
Fig. 1: Variation curves of colours and real colours with ozone input.
Effect of different ozone dosage on removal of UV254 and turbidity: As shown in Fig. 2, with the increase of ozone dosage, UV254 decreases from 0.097 to 0.056, indicating that ozone oxidation has a certain ability to remove aromatic ring compounds. In addition, when the ozone dosage is 10 mg·L-1, the turbidity decreases from 2.08 NTU at the beginning to 0.77 NTU at the end, and the turbidity decreases by 1.31 NTU.
0.00
0.01
0.02
0.03
0.04
0.05
0.06
0.07
0.08
0.09
0.10
0 2 4 6 8 100.0
0.2
0.4
0.6
0.8
1.0
1.2
1.4
1.6
1.8
2.0
2.2
2.4
Turb
idity
/NTU
Ozone input/mg·L-1
UV
254/m
g·L-1
UV254
Turbidity
Fig. 2: Changes of UV254 and turbidity with ozone addition.
Changes of algae and water quality under simulated natural conditions: From the appearance, the water samples oxidized by ozone dosage of 2, 4, 6, 8, 10 mg·L-1 are relatively clear at first, and there are no suspended substances. Only the raw water without ozone treatment is light green, and there is a small amount of suspended substances. When the natural conditions are simulated for 15 days, the water samples without ozone oxidation become green, the water body becomes turbid and the suspended substances increase. The dosage of 2, 4, 6 mg·L-1 is added again. Reclaimed water changes from colourless to light yellow, then green. The regenerated
Fig. 1: Variation curves of colours and real colours with ozone input.

1504 Hui-rong Wei and Nguyen Xuan Phuong
Vol. 18, No. 5 (Special Issue), 2019 • Nature Environment and Pollution Technology
mg·L-1, the turbidity decreases from 2.08 NTU at the be-ginning to 0.77 NTU at the end, and the turbidity decreases by 1.31 NTU.
Changes of algae and water quality under simulated nat-ural conditions: From the appearance, the water samples ox-idized by ozone dosage of 2, 4, 6, 8, 10 mg·L-1 are relatively clear at first, and there are no suspended substances. Only the raw water without ozone treatment is light green, and there is a small amount of suspended substances. When the natural conditions are simulated for 15 days, the water samples with-out ozone oxidation become green, the water body becomes turbid and the suspended substances increase. The dosage of 2, 4, 6 mg·L-1 is added again. Reclaimed water changes from
colourless to light yellow, then green. The regenerated water with 4, 6 mg·L-1 ozone dosage change to green in a short time, while the regenerated water with 8 and 10 mg·L-1 ozone dosage has no obvious change in colour and turbidity. After 24 days, the regenerated water samples with dosage of 0, 2, 4, 6 mg·L-1 turns dark green, and with the increase of ozone dosage, the turbidity of water samples increases, especially in 4, 6 mg·L-1 water sample. The phenomena are closely related to the growth of algae. When algae begin to appear in the water body in the early stage, they evenly disperse in the whole water body and gradually become turbid. In the later stage, algae begin to accumulate on the surface and bottom of the water body, and the water samples with the dosage of
value decreases from 13 degrees to 2 degrees, and the removal rate is 84.6%. It can be concluded that ozone has a good oxidation effect on dissolved organic matter and insoluble suspended matter in water.
2
4
6
8
10
12
14
16
18
20
22
0 2 4 6 8 10
0%
20%
40%
60%
80%
100%
chro
ma
Ozone input
Show colourTrue colour
Show colour Removal rate True colour Removal rate
Fig. 1: Variation curves of colours and real colours with ozone input.
Effect of different ozone dosage on removal of UV254 and turbidity: As shown in Fig. 2, with the increase of ozone dosage, UV254 decreases from 0.097 to 0.056, indicating that ozone oxidation has a certain ability to remove aromatic ring compounds. In addition, when the ozone dosage is 10 mg·L-1, the turbidity decreases from 2.08 NTU at the beginning to 0.77 NTU at the end, and the turbidity decreases by 1.31 NTU.
0.00
0.01
0.02
0.03
0.04
0.05
0.06
0.07
0.08
0.09
0.10
0 2 4 6 8 100.0
0.2
0.4
0.6
0.8
1.0
1.2
1.4
1.6
1.8
2.0
2.2
2.4
Turb
idity
/NTU
Ozone input/mg·L-1
UV
254/m
g·L-1
UV254
Turbidity
Fig. 2: Changes of UV254 and turbidity with ozone addition.
Changes of algae and water quality under simulated natural conditions: From the appearance, the water samples oxidized by ozone dosage of 2, 4, 6, 8, 10 mg·L-1 are relatively clear at first, and there are no suspended substances. Only the raw water without ozone treatment is light green, and there is a small amount of suspended substances. When the natural conditions are simulated for 15 days, the water samples without ozone oxidation become green, the water body becomes turbid and the suspended substances increase. The dosage of 2, 4, 6 mg·L-1 is added again. Reclaimed water changes from colourless to light yellow, then green. The regenerated
Fig. 2: Changes of UV254 and turbidity with ozone addition.
water with 4, 6 mg·L-1 ozone dosage change to green in a short time, while the regenerated water with 8 and 10 mg·L-1 ozone dosage has no obvious change in colour and turbidity. After 24 days, the regenerated water samples with dosage of 0, 2, 4, 6 mg·L-1 turns dark green, and with the increase of ozone dosage, the turbidity of water samples increases, especially in 4, 6 mg·L-1 water sample. The phenomena are closely related to the growth of algae. When algae begin to appear in the water body in the early stage, they evenly disperse in the whole water body and gradually become turbid. In the later stage, algae begin to accumulate on the surface and bottom of the water body, and the water samples with the dosage of 8 and 10 mg·L-1 gradually become light green, with a small amount of suspended matter coming out.
Since all algae contain chlorophyll a, it can directly reflect the growth of algae cells as an indicator of microbial primary productivity in water. Fig. 3 shows the variation curve of chlorophyll a with time under different ozone dosage. It can be seen that the growth of algae has gone through several stages, such as slow growth, logarithmic growth and stable growth. Chlorophyll-a of water samples with ozone dosage of 2 ,4, 6 mg·L-1 begin to increase gradually after a delay of about 6 days in the initial growth stage of algae. After 12 days, algae begin to grow suddenly and sharply more than those of water samples without oxidation treatment. This may be due to the fact that at low concentration, ozone can only destroy a small number of algae cells and promote the release of N, P and other elements into the water, which on the contrary promotes the growth of algae. However, when the ozone dosage is 8, 10 mg·L-1, the appearance of water samples remains unchanged. This is because ozone kills most of the algae and ensures the biological stability of water samples at high doses.
4 6 8 10 12 14 16 18 20 22
0
50
100
150
200
250
chlo
roph
yll/m
g/l-1
t/d
0mg·L-1
2mg·L-1
4mg·L-1
6mg·L-1
8mg·L-1
10mg·L-1
Fig. 3: Changes of chlorophyll a concentration with time.
Fig. 4 shows that DOC increases by 5.64 mg·L1 from 5.03 mg·L-1 with ozone dosage of 2, 4, 6 mg·L-1, and decreases by 5.38 mg·L-1 with ozone dosage of 8 and 10 mg·L-1. It can be explained that ozone molecule oxidation destroys cell wall and leads to cell split and death. Cell content substances are released into water; thus, DOC rises. However, with the further increase of ozone dosage, the released cell content is mineralized into CO2. When the natural environment is simulated after 6 days, a large number of bacteria multiplies and utilizes part of the organic matter in the water, and DOC decreases significantly. After 24 days, with the algae in the water entering the decay period, the intracellular substances begin to release, which leads to the increase of DOC. As shown in Fig. 4b, TUC in water samples doesn’t change much without oxidative pre-treatment and high ozone dosage (more than 8 mg·L-1), while TUC in water samples increases significantly with low ozone dosage, which is consistent with the results of chlorophyll analysis. It indicates that low dose ozone treatment can promote algae reproduction instead.
Fig. 3: Changes of chlorophyll a concentration with time.
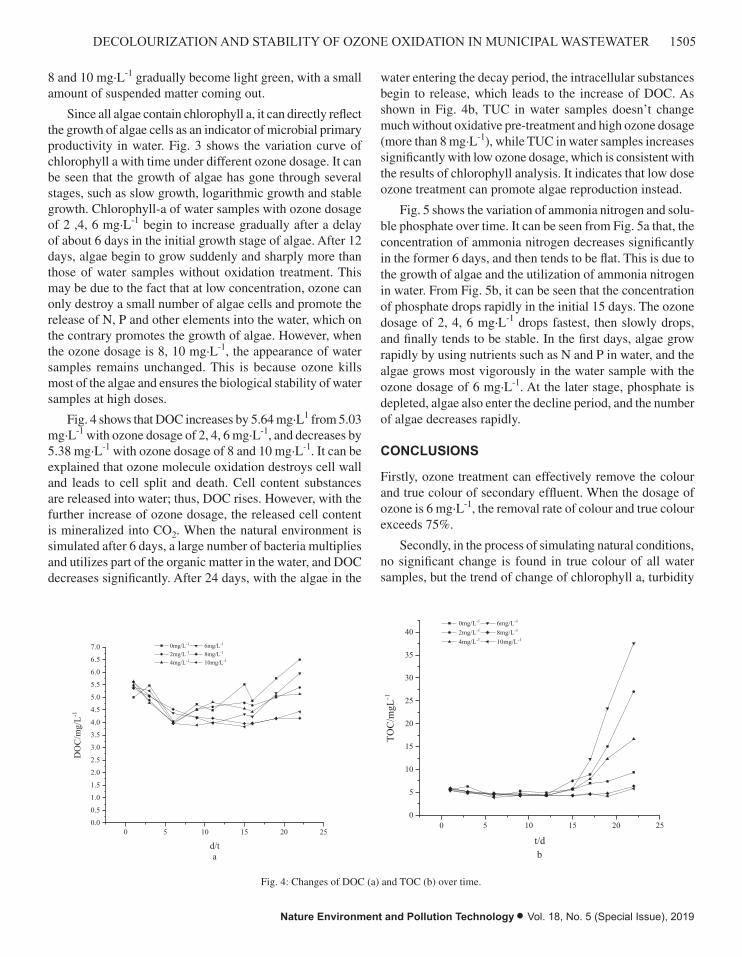
1505DECOLOURIZATION AND STABILITY OF OZONE OXIDATION IN MUNICIPAL WASTEWATER
Nature Environment and Pollution Technology • Vol. 18, No. 5 (Special Issue), 2019
8 and 10 mg·L-1 gradually become light green, with a small amount of suspended matter coming out.
Since all algae contain chlorophyll a, it can directly reflect the growth of algae cells as an indicator of microbial primary productivity in water. Fig. 3 shows the variation curve of chlorophyll a with time under different ozone dosage. It can be seen that the growth of algae has gone through several stages, such as slow growth, logarithmic growth and stable growth. Chlorophyll-a of water samples with ozone dosage of 2 ,4, 6 mg·L-1 begin to increase gradually after a delay of about 6 days in the initial growth stage of algae. After 12 days, algae begin to grow suddenly and sharply more than those of water samples without oxidation treatment. This may be due to the fact that at low concentration, ozone can only destroy a small number of algae cells and promote the release of N, P and other elements into the water, which on the contrary promotes the growth of algae. However, when the ozone dosage is 8, 10 mg·L-1, the appearance of water samples remains unchanged. This is because ozone kills most of the algae and ensures the biological stability of water samples at high doses.
Fig. 4 shows that DOC increases by 5.64 mg·L1 from 5.03 mg·L-1 with ozone dosage of 2, 4, 6 mg·L-1, and decreases by 5.38 mg·L-1 with ozone dosage of 8 and 10 mg·L-1. It can be explained that ozone molecule oxidation destroys cell wall and leads to cell split and death. Cell content substances are released into water; thus, DOC rises. However, with the further increase of ozone dosage, the released cell content is mineralized into CO2. When the natural environment is simulated after 6 days, a large number of bacteria multiplies and utilizes part of the organic matter in the water, and DOC decreases significantly. After 24 days, with the algae in the
water entering the decay period, the intracellular substances begin to release, which leads to the increase of DOC. As shown in Fig. 4b, TUC in water samples doesn’t change much without oxidative pre-treatment and high ozone dosage (more than 8 mg·L-1), while TUC in water samples increases significantly with low ozone dosage, which is consistent with the results of chlorophyll analysis. It indicates that low dose ozone treatment can promote algae reproduction instead.
Fig. 5 shows the variation of ammonia nitrogen and solu-ble phosphate over time. It can be seen from Fig. 5a that, the concentration of ammonia nitrogen decreases significantly in the former 6 days, and then tends to be flat. This is due to the growth of algae and the utilization of ammonia nitrogen in water. From Fig. 5b, it can be seen that the concentration of phosphate drops rapidly in the initial 15 days. The ozone dosage of 2, 4, 6 mg·L-1 drops fastest, then slowly drops, and finally tends to be stable. In the first days, algae grow rapidly by using nutrients such as N and P in water, and the algae grows most vigorously in the water sample with the ozone dosage of 6 mg·L-1. At the later stage, phosphate is depleted, algae also enter the decline period, and the number of algae decreases rapidly.
CONCLUSIONS
Firstly, ozone treatment can effectively remove the colour and true colour of secondary effluent. When the dosage of ozone is 6 mg·L-1, the removal rate of colour and true colour exceeds 75%.
Secondly, in the process of simulating natural conditions, no significant change is found in true colour of all water samples, but the trend of change of chlorophyll a, turbidity
0 5 10 15 20 250.0
0.5
1.0
1.5
2.0
2.5
3.0
3.5
4.0
4.5
5.0
5.5
6.0
6.5
7.0
DO
C/m
g/L-1
d/t
0mg/L-1 6mg/L-1
2mg/L-1 8mg/L-1
4mg/L-1 10mg/L-1
a
0 5 10 15 20 250
5
10
15
20
25
30
35
40 0mg/L-1 6mg/L-1
2mg/L-1 8mg/L-1
4mg/L-1 10mg/L-1
TOC
/mgL
-1
t/db
Fig. 4: Changes of DOC(a) and TOC(b) over time.
Fig. 5 shows the variation of ammonia nitrogen and soluble phosphate over time. It can be seen from Fig. 5a that, the concentration of ammonia nitrogen decreases significantly in the former 6 days, and then tends to be flat. This is due to the growth of algae and the utilization of ammonia nitrogen in water. From Fig. 5b, it can be seen that the concentration of phosphate drops rapidly in the initial 15 days. The ozone dosage of 2, 4, 6 mg·L-1 drops fastest, then slowly drops, and finally tends to be stable. In the first days, algae grow rapidly by using nutrients such as N and P in water, and the algae grows most vigorously in the water sample with the ozone dosage of 6 mg·L-1. At the later stage, phosphate is depleted, algae also enter the decline period, and the number of algae decreases rapidly.
Fig. 4: Changes of DOC (a) and TOC (b) over time.
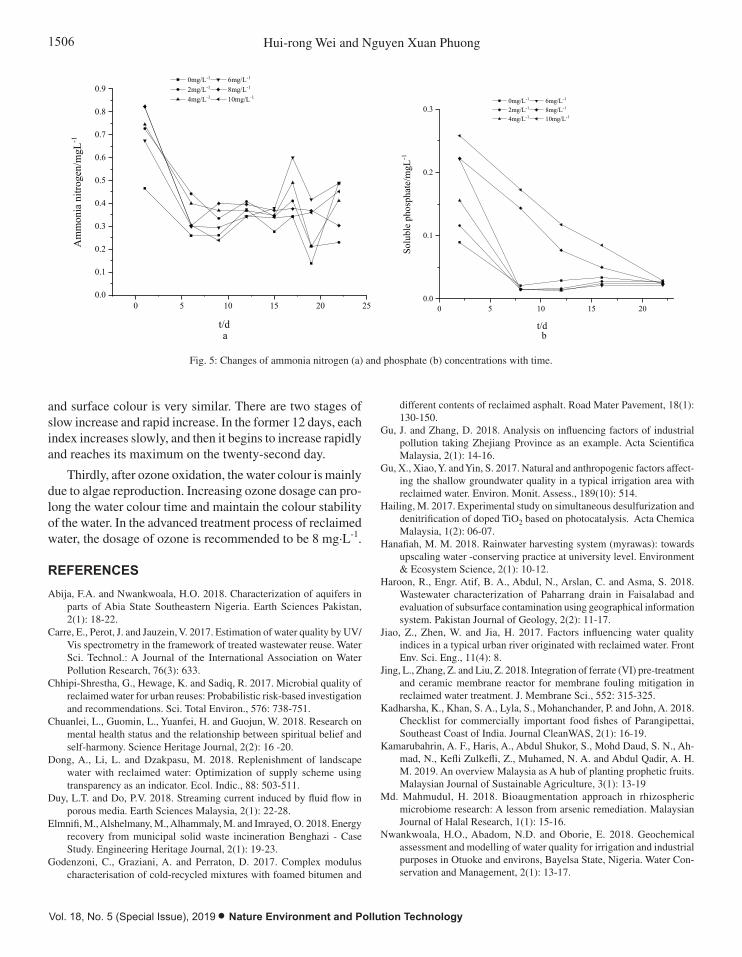
1506 Hui-rong Wei and Nguyen Xuan Phuong
Vol. 18, No. 5 (Special Issue), 2019 • Nature Environment and Pollution Technology
and surface colour is very similar. There are two stages of slow increase and rapid increase. In the former 12 days, each index increases slowly, and then it begins to increase rapidly and reaches its maximum on the twenty-second day.
Thirdly, after ozone oxidation, the water colour is mainly due to algae reproduction. Increasing ozone dosage can pro-long the water colour time and maintain the colour stability of the water. In the advanced treatment process of reclaimed water, the dosage of ozone is recommended to be 8 mg·L-1.
REFERENCES
Abija, F.A. and Nwankwoala, H.O. 2018. Characterization of aquifers in parts of Abia State Southeastern Nigeria. Earth Sciences Pakistan, 2(1): 18-22.
Carre, E., Perot, J. and Jauzein, V. 2017. Estimation of water quality by UV/Vis spectrometry in the framework of treated wastewater reuse. Water Sci. Technol.: A Journal of the International Association on Water Pollution Research, 76(3): 633.
Chhipi-Shrestha, G., Hewage, K. and Sadiq, R. 2017. Microbial quality of reclaimed water for urban reuses: Probabilistic risk-based investigation and recommendations. Sci. Total Environ., 576: 738-751.
Chuanlei, L., Guomin, L., Yuanfei, H. and Guojun, W. 2018. Research on mental health status and the relationship between spiritual belief and self-harmony. Science Heritage Journal, 2(2): 16 -20.
Dong, A., Li, L. and Dzakpasu, M. 2018. Replenishment of landscape water with reclaimed water: Optimization of supply scheme using transparency as an indicator. Ecol. Indic., 88: 503-511.
Duy, L.T. and Do, P.V. 2018. Streaming current induced by fluid flow in porous media. Earth Sciences Malaysia, 2(1): 22-28.
Elmnifi, M., Alshelmany, M., Alhammaly, M. and Imrayed, O. 2018. Energy recovery from municipal solid waste incineration Benghazi - Case Study. Engineering Heritage Journal, 2(1): 19-23.
Godenzoni, C., Graziani, A. and Perraton, D. 2017. Complex modulus characterisation of cold-recycled mixtures with foamed bitumen and
different contents of reclaimed asphalt. Road Mater Pavement, 18(1): 130-150.
Gu, J. and Zhang, D. 2018. Analysis on influencing factors of industrial pollution taking Zhejiang Province as an example. Acta Scientifica Malaysia, 2(1): 14-16.
Gu, X., Xiao, Y. and Yin, S. 2017. Natural and anthropogenic factors affect-ing the shallow groundwater quality in a typical irrigation area with reclaimed water. Environ. Monit. Assess., 189(10): 514.
Hailing, M. 2017. Experimental study on simultaneous desulfurization and denitrification of doped TiO2 based on photocatalysis. Acta Chemica Malaysia, 1(2): 06-07.
Hanafiah, M. M. 2018. Rainwater harvesting system (myrawas): towards upscaling water -conserving practice at university level. Environment & Ecosystem Science, 2(1): 10-12.
Haroon, R., Engr. Atif, B. A., Abdul, N., Arslan, C. and Asma, S. 2018. Wastewater characterization of Paharrang drain in Faisalabad and evaluation of subsurface contamination using geographical information system. Pakistan Journal of Geology, 2(2): 11-17.
Jiao, Z., Zhen, W. and Jia, H. 2017. Factors influencing water quality indices in a typical urban river originated with reclaimed water. Front Env. Sci. Eng., 11(4): 8.
Jing, L., Zhang, Z. and Liu, Z. 2018. Integration of ferrate (VI) pre-treatment and ceramic membrane reactor for membrane fouling mitigation in reclaimed water treatment. J. Membrane Sci., 552: 315-325.
Kadharsha, K., Khan, S. A., Lyla, S., Mohanchander, P. and John, A. 2018. Checklist for commercially important food fishes of Parangipettai, Southeast Coast of India. Journal CleanWAS, 2(1): 16-19.
Kamarubahrin, A. F., Haris, A., Abdul Shukor, S., Mohd Daud, S. N., Ah-mad, N., Kefli Zulkefli, Z., Muhamed, N. A. and Abdul Qadir, A. H. M. 2019. An overview Malaysia as A hub of planting prophetic fruits. Malaysian Journal of Sustainable Agriculture, 3(1): 13-19
Md. Mahmudul, H. 2018. Bioaugmentation approach in rhizospheric microbiome research: A lesson from arsenic remediation. Malaysian Journal of Halal Research, 1(1): 15-16.
Nwankwoala, H.O., Abadom, N.D. and Oborie, E. 2018. Geochemical assessment and modelling of water quality for irrigation and industrial purposes in Otuoke and environs, Bayelsa State, Nigeria. Water Con-servation and Management, 2(1): 13-17.
0 5 10 15 20 250.0
0.1
0.2
0.3
0.4
0.5
0.6
0.7
0.8
0.9 0mg/L-1 6mg/L-1
2mg/L-1 8mg/L-1
4mg/L-1 10mg/L-1
Am
mon
ia n
itrog
en/m
gL-1
t/da
0 5 10 15 200.0
0.1
0.2
0.3 0mg/L-1 6mg/L-1
2mg/L-1 8mg/L-1
4mg/L-1 10mg/L-1
Solu
ble
phos
phat
e/m
gL-1
t/db
Fig. 5: Changes of ammonia nitrogen (a) and phosphate (b) concentrations with time.

1507DECOLOURIZATION AND STABILITY OF OZONE OXIDATION IN MUNICIPAL WASTEWATER
Nature Environment and Pollution Technology • Vol. 18, No. 5 (Special Issue), 2019
Roslee, R. 2018. Geohazards in Sandakan town area, Sabah, Malaysia. Geological Behavior, 2(1): 18-23.
Sahadeb, C. M., Kamrul, I. and Hossain, M. M. 2019. State of research on carbon sequestration in Bangladesh: a comprehensive review. Geology, Ecology, and Landscapes, 3(1): 29-36,
Sun, J., Chen, L. and Rene, E.R. 2018. Biological nitrogen removal using soil columns for the reuse of reclaimed water: Performance and microbial community analysis. J. Environ. Econ. Manag., 217: 100.
Thiruchelvam, S., Ismail, M. F., Ghazali, A., Mustapha, K. N., Norkhairi, F. F., Yahya, N., Mat Isa, A. A. and Che Muda, Z. 2018. Development of humanitarian supply chain performance conceptual framework in
creating resilient logistics network. Malaysian Journal of Geosciences, 2(1): 30-33.
Ullah, Z., Ali, A. and Muhammad Iqbal, R. A. K. 2018. Existence results to A class of hybrid fractional differential equations. Matriks Sains Matematik, 1(1): 13-17.
Wang, W., Chen, J. and Sun, Y. 2017. Laboratory performance analysis of high percentage artificial RAP binder with WMA additives. Constr. Build. Mater., 147: we58-65.
Wang., M., Tian, Y. and Zhao, X. 2018. The application of an efficient modified decolourizer in coagulation treatment of high colour reclaimed water. Water Sci. Technol.: A Journal of the International Association on Water Pollution Research, 77(9): 2190.

Vol. 18, No. 5 (Special Issue), 2019 • Nature Environment and Pollution Technology
1508

Geotechnical Slope Protection Model Based on Genetic Algorithm
Lin Huang*, Fengyin Liu* and Van Huong Dong***Institute of Geotechnical Engineering, Xi’an University of Technology, Xi’an, China**Ho Chi Minh City University of Transport, Ho Chi Minh, Vietnam
ABSTRACT
In order to study the rock slope protection model based on a genetic algorithm, the theory of slope stability and evaluation theory were introduced. Slope engineering geological model framework, slope safety and stability mathematical mechanics model and slope evolution bifurcation model were studied. The application of artificial intelligence in slope stability was analyzed. Based on the theoretical results at home and abroad, an FCM clustering analysis based on genetic algorithm was obtained. Soft set theory and fuzzy soft set theory were introduced. An algorithm model for evaluating decision-making in slope management was proposed. An example analysis was carried out in combination with the developed system. The results showed that the evaluation system had obvious advantages. The model provides an effective reference for engineering decision-making.
INTRODUCTION
The evaluation of slope stability plays an important role in the construction of the project. With the development of mathe-matics, more and more new mathematical methods are widely used in slope stability research. The evaluation method is a discrete, random, nonlinear and complex problem (Cao et al. 2017; Roslee et al. 2018; Kushwah et al. 2017). In 1916, Peterson first proposed the stability analysis of soil slope with sliding surface as arc. In 1955, Bishop proposed a Bishop method that takes into account the force between strands. Domestic scholars have done a lot of research on slope stability evaluation. A study used fuzzy clustering method to analyze slope stability problems (Thong & Le 2016, Oyedotun 2019, Nawaz et al. 2018). Based on the fuzziness of slope stability problems, Xue Xinhua (2007) presented a fuzzy neural network model for slope stability prediction. Combining the fuzzy method and the limit equilibrium the-ory, Wang (2008) analyzed the stability of the slope. Zhang (2011) gave the logistic regression model of slope stability. Some scholars gave a homotopy FCM clustering algorithm for slope stability classification evaluation (Pei et al. 2017, Ismail et al. 2018, Zainal Abidin 2018).
At present, many scholars have proposed a lot of slope management programs. For different slopes, different meas-ures should be taken. However, there will be a variety of suitable treatment schemes for a slope. The economics and safety of the programs to be evaluated. It should be conducive to environmental protection and construction. After a com-prehensive evaluation of the advantages and disadvantages of
each program, the best plan is selected. The evaluation and design of large slope engineering is a challenge. The existing theory of slope is needed to develop into the new technology theory of information and intelligence (Alameda-Hernández 2017, Khan et al. 2018, Herayani et al. 2018, Siew Len et al. 2018). Therefore, in order to study slope engineering, some other disciplines, such as mathematics, mechanics and other basic disciplines, as well as simulation, neural network and other cutting-edge theories, need to be combined.
MATERIALS AND METHODS
Slope engineering theory: The slope engineering has achieved great achievements in the analysis of failure law, the study of failure mechanism and the study of stability. It has preliminarily formed an independent subject system of slope engineering (Li et al. 2017, Md Atikuzzaman et al. 2018, Zahan et al. 2018, Yang et al. 2018). The theory of rock mass structure control mainly focuses on the study of the control of rock mass structure and various geological structures in the face of deformation and failure. Fractal theory is mainly used in the study of self-similar graphics. Under the condition of obtaining the fractal dimension of the graph, the nature and the law of the graph are described. The theory is applied to the study of slope engineering. The 3S system contains GIS, RS, and GPS. Based on this system, the 3S theory gives a new observation, description and thought for the prediction and prevention of slope engineering. The theory of reliability is to combine the specific conditions of the slope with the theory of structural reliability under the condition that the
Nat. Env. & Poll. Tech.Website: www.neptjournal.com
Received: 23-08-2019Accepted: 20-10-2019
Key Words:Slope stability Genetic algorithm Fuzzy soft set theory Decision making
2019pp. 1509-1513 Vol. 18
p-ISSN: 0972-6268 No. 5 (Special Issue)
Nature Environment and Pollution Technology An International Quarterly Scientific Journal
Original Research Paper
e-ISSN: 2395-3454
Open Access
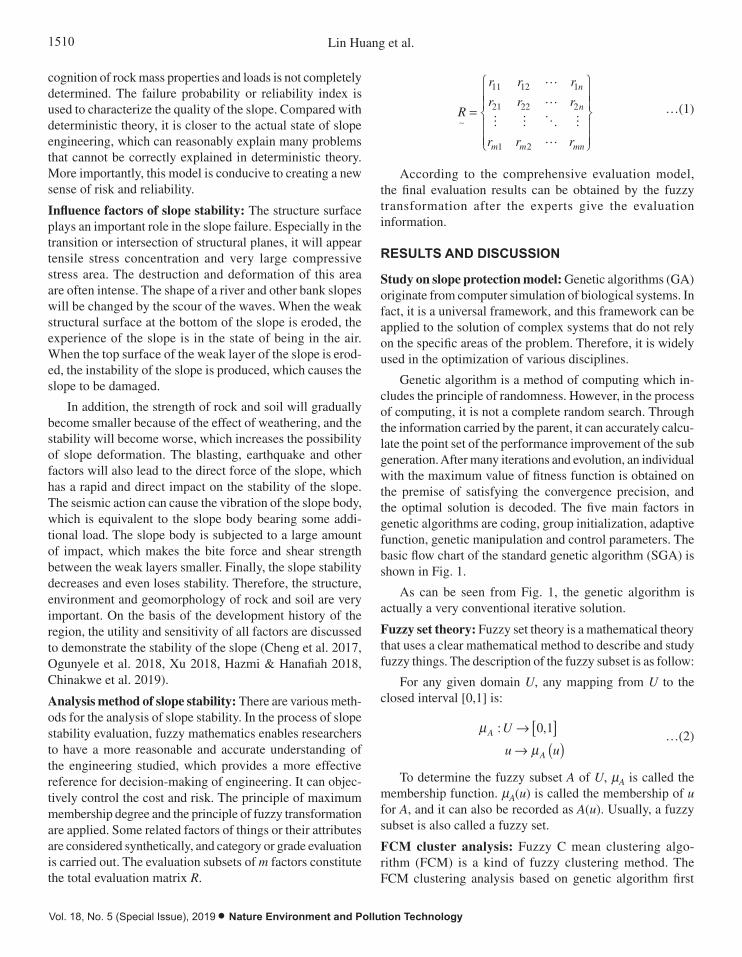
1510 Lin Huang et al.
Vol. 18, No. 5 (Special Issue), 2019 • Nature Environment and Pollution Technology
cognition of rock mass properties and loads is not completely determined. The failure probability or reliability index is used to characterize the quality of the slope. Compared with deterministic theory, it is closer to the actual state of slope engineering, which can reasonably explain many problems that cannot be correctly explained in deterministic theory. More importantly, this model is conducive to creating a new sense of risk and reliability.
Influence factors of slope stability: The structure surface plays an important role in the slope failure. Especially in the transition or intersection of structural planes, it will appear tensile stress concentration and very large compressive stress area. The destruction and deformation of this area are often intense. The shape of a river and other bank slopes will be changed by the scour of the waves. When the weak structural surface at the bottom of the slope is eroded, the experience of the slope is in the state of being in the air. When the top surface of the weak layer of the slope is erod-ed, the instability of the slope is produced, which causes the slope to be damaged.
In addition, the strength of rock and soil will gradually become smaller because of the effect of weathering, and the stability will become worse, which increases the possibility of slope deformation. The blasting, earthquake and other factors will also lead to the direct force of the slope, which has a rapid and direct impact on the stability of the slope. The seismic action can cause the vibration of the slope body, which is equivalent to the slope body bearing some addi-tional load. The slope body is subjected to a large amount of impact, which makes the bite force and shear strength between the weak layers smaller. Finally, the slope stability decreases and even loses stability. Therefore, the structure, environment and geomorphology of rock and soil are very important. On the basis of the development history of the region, the utility and sensitivity of all factors are discussed to demonstrate the stability of the slope (Cheng et al. 2017, Ogunyele et al. 2018, Xu 2018, Hazmi & Hanafiah 2018, Chinakwe et al. 2019).
Analysis method of slope stability: There are various meth-ods for the analysis of slope stability. In the process of slope stability evaluation, fuzzy mathematics enables researchers to have a more reasonable and accurate understanding of the engineering studied, which provides a more effective reference for decision-making of engineering. It can objec-tively control the cost and risk. The principle of maximum membership degree and the principle of fuzzy transformation are applied. Some related factors of things or their attributes are considered synthetically, and category or grade evaluation is carried out. The evaluation subsets of m factors constitute the total evaluation matrix R.
R
r r r
r r r
r r r
n
n
m m mn
∼
��
� � � ��
=
Ï
ÌÔÔ
ÓÔÔ
¸
˝ÔÔ
˛ÔÔ
11 12 1
21 22 2
1 2
…(1)
According to the comprehensive evaluation model, the final evaluation results can be obtained by the fuzzy transformation after the experts give the evaluation information.
RESULTS AND DISCUSSION
Study on slope protection model: Genetic algorithms (GA) originate from computer simulation of biological systems. In fact, it is a universal framework, and this framework can be applied to the solution of complex systems that do not rely on the specific areas of the problem. Therefore, it is widely used in the optimization of various disciplines.
Genetic algorithm is a method of computing which in-cludes the principle of randomness. However, in the process of computing, it is not a complete random search. Through the information carried by the parent, it can accurately calcu-late the point set of the performance improvement of the sub generation. After many iterations and evolution, an individual with the maximum value of fitness function is obtained on the premise of satisfying the convergence precision, and the optimal solution is decoded. The five main factors in genetic algorithms are coding, group initialization, adaptive function, genetic manipulation and control parameters. The basic flow chart of the standard genetic algorithm (SGA) is shown in Fig. 1.
As can be seen from Fig. 1, the genetic algorithm is actually a very conventional iterative solution.
Fuzzy set theory: Fuzzy set theory is a mathematical theory that uses a clear mathematical method to describe and study fuzzy things. The description of the fuzzy subset is as follow:
For any given domain U, any mapping from U to the closed interval [0,1] is:
m
mA
A
U
u u
: ,Æ [ ]Æ ( )
0 1 …(2)
To determine the fuzzy subset A of U, mA is called the membership function. mA(u) is called the membership of u for A, and it can also be recorded as A(u). Usually, a fuzzy subset is also called a fuzzy set.
FCM cluster analysis: Fuzzy C mean clustering algo-rithm (FCM) is a kind of fuzzy clustering method. The FCM clustering analysis based on genetic algorithm first
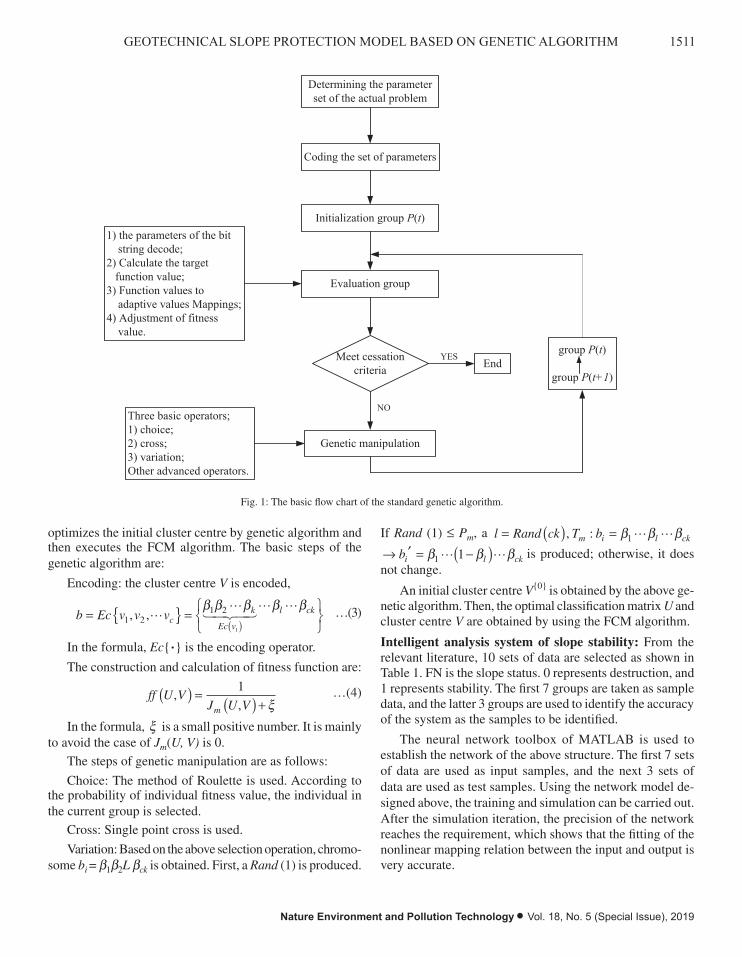
1511GEOTECHNICAL SLOPE PROTECTION MODEL BASED ON GENETIC ALGORITHM
Nature Environment and Pollution Technology • Vol. 18, No. 5 (Special Issue), 2019
optimizes the initial cluster centre by genetic algorithm and then executes the FCM algorithm. The basic steps of the genetic algorithm are:
Encoding: the cluster centre V is encoded,
b Ec v v vck
Ec v
l ck= { } =ÏÌÓ
¸˝˛( )1 2
1 2
1
, ,�� � �� �� ��b b b b b …(3)
In the formula, Ec{·} is the encoding operator.
The construction and calculation of fitness function are:
ff U VJ U Vm
,,
( ) = ( ) +1
x …(4)
In the formula, x is a small positive number. It is mainly to avoid the case of Jm(U, V) is 0.
The steps of genetic manipulation are as follows:
Choice: The method of Roulette is used. According to the probability of individual fitness value, the individual in the current group is selected.
Cross: Single point cross is used.
Variation: Based on the above selection operation, chromo-some bi = b1b2L bck is obtained. First, a Rand (1) is produced.
If Rand (1) £ Pm, a l Rand ck T bm i l ck= ( ) =, : b b b1� �
Æ ¢ = -( )bi l ckb b b1 1� � is produced; otherwise, it does not change.
An initial cluster centre V{0} is obtained by the above ge-netic algorithm. Then, the optimal classification matrix U and cluster centre V are obtained by using the FCM algorithm.
Intelligent analysis system of slope stability: From the relevant literature, 10 sets of data are selected as shown in Table 1. FN is the slope status. 0 represents destruction, and 1 represents stability. The first 7 groups are taken as sample data, and the latter 3 groups are used to identify the accuracy of the system as the samples to be identified.
The neural network toolbox of MATLAB is used to establish the network of the above structure. The first 7 sets of data are used as input samples, and the next 3 sets of data are used as test samples. Using the network model de-signed above, the training and simulation can be carried out. After the simulation iteration, the precision of the network reaches the requirement, which shows that the fitting of the nonlinear mapping relation between the input and output is very accurate.
Genetic algorithm is a method of computing which includes the principle of randomness. However, in the process of computing, it is not a complete random search. Through the information carried by the parent, it can accurately calculate the point set of the performance improvement of the sub generation. After many iterations and evolution, an individual with the maximum value of fitness function is obtained on the premise of satisfying the convergence precision, and the optimal solution is decoded. The five main factors in genetic algorithms are coding, group initialization, adaptive function, genetic manipulation and control parameters. The basic flow chart of the standard genetic algorithm (SGA) is shown in Fig. 1.
Determining the parameterset of the actual problem
Coding the set of parameters
Initialization group P(t)
Evaluation group
1) the parameters of the bitstring decode;
2) Calculate the targetfunction value;
3) Function values toadaptive values Mappings;
4) Adjustment of fitnessvalue.
Meet cessationcriteria
YESEnd
NO
Genetic manipulation
group P(t)
group P(t+1)
Three basic operators;1) choice;2) cross;3) variation;Other advanced operators.
Fig. 1: The basic flow chart of the standard genetic algorithm.
As can be seen from Fig. 1, the genetic algorithm is actually a very conventional iterative solution.
Fuzzy set theory: Fuzzy set theory is a mathematical theory that uses a clear mathematical method to describe and study fuzzy things. The description of the fuzzy subset is as follow:
For any given domain U, any mapping from U to the closed interval [0,1] is:
0 1A
A
:U ,
u u
…(2)
To determine the fuzzy subset A of U, is called the membership function. (u) is called the membership of u for A, and it can also be recorded as A(u). Usually, a fuzzy subset is also called a fuzzy set.
FCM cluster analysis: Fuzzy C mean clustering algorithm (FCM) is a kind of fuzzy clustering method. The FCM clustering analysis based on genetic algorithm first optimizes the initial cluster centre by genetic algorithm and then executes the FCM algorithm. The basic steps of the genetic algorithm are:
Encoding: the cluster centre V is encoded,
𝑏𝑏 = 𝐸𝐸𝐸𝐸{𝑣𝑣1, 𝑣𝑣2,⋯𝑣𝑣𝑐𝑐} = {𝛽𝛽1𝛽𝛽2 ⋯𝛽𝛽𝑘𝑘⏟ 𝐸𝐸𝑐𝑐(𝑣𝑣1)
⋯𝛽𝛽𝑙𝑙 ⋯𝛽𝛽𝑐𝑐𝑘𝑘} …(3)
In the formula, Ec is the encoding operator.
Fig. 1: The basic flow chart of the standard genetic algorithm.

1512 Lin Huang et al.
Vol. 18, No. 5 (Special Issue), 2019 • Nature Environment and Pollution Technology
System login
Sample data read in
Algorithm selection
Parameter setting
NO
Read sample read in
Calculation divisionmatrix and
classification clarity
Discriminant output
Fig. 2: Flow chart of the system.
The method of cluster analysis is adopted to evaluate the stability of the slope. The principle of the system is based on FCM clustering and genetic algorithm. A relatively perfect database is set up through the arrangement of the existing engineering data. By analysing the sample data of the database, the degree of proximity between the identified samples and the known samples is calculated. Then, the stability of the identified samples is judged by the approach of proximity.
CONCLUSION
Slope engineering is an important problem in the process of engineering construction. Landslide and collapse caused by slope instability often bring great loss of life and property. On the basis of previous research and combined with artificial intelligence method, the slope stability is analysed. The slope protection model is emphatically studied. An FCM clustering analysis method based on genetic algorithm is obtained. On the basis of this algorithm, MATLAB is used to develop the software system. The system establishes a relatively perfect database through the arrangement of the existing engineering data. Finally, an intelligent analysis system for evaluating the stability of the slope is obtained. The results show that the system is reasonable.
REFERENCES
Alameda-Hernández, P., Hamdouni, R.E. and Irigaray, C. 2017. Weak foliated rock slope stability analysis with ultra-close-range terrestrial digital photogrammetry. B. Eng. Geol. Environ., (4): 1-15.
Cao, Z., Wang, Y. and Li, D. 2017. Practical reliability analysis of slope stability by advanced Monte Carlo simulations in a spreadsheet. Can. Geotech. J., 48(1): 162-172.
Cheng, L., Liu, Y.R. and Yang, Q. 2017. Mechanism and numerical simulation of reservoir slope deformation during impounding of high arch dams based on nonlinear FEM. Computers & Geotechnics, 81: 143-154.
Chinakwe, E.C., Ibekwe, V.I., Nwogwugwu, U.N., Ofoegbu, J., Mike-Anosike, E., Nwachukwu, I.N., Adeleye, S. and Chinakwe, P.O. 2019. Evaluation of plant growth promoting potentials exhibited by rhizobacteria associated with beans plant. Malaysian Journal of Sustainable Agriculture, 3(1): 20-22.
Fig. 2: Flow chart of the system.
On the basis of the sample data, two kinds of intelligent algorithms are set up in the system by using MATLAB. The parameters of each algorithm need to be set up independently. The sample data can be stored in the excel file in advance. The data are read by selecting the path of the file, which
facilitates the management and update of the sample data. Flow chart of the system is shown in Fig. 2.
The method of cluster analysis is adopted to evaluate the stability of the slope. The principle of the system is based on FCM clustering and genetic algorithm. A relatively perfect
Table 1: Cointegration test results.
Number g KN mi -( )3 c(KPa) f �( ) y f�( ) H(m) µ FN
1 22.4 10 35 45 10 0.4 0
2 20 20 36 45 50 0.5 0
3 20 0.1 36 45 50 0.25 0
4 20 0.1 36 45 50 0.5 0
5 27 50 40 42 407 0.25 1
6 27 35 35 42 359 0.25 1
7 27 37 35 37.8 320 0.25 1
8 27 32 33 47.2 289 0.25 1
9 27.3 10 39 41 511 0.25 1
10 27.3 10 39 40 470 0.25 1

1513GEOTECHNICAL SLOPE PROTECTION MODEL BASED ON GENETIC ALGORITHM
Nature Environment and Pollution Technology • Vol. 18, No. 5 (Special Issue), 2019
database is set up through the arrangement of the existing en-gineering data. By analysing the sample data of the database, the degree of proximity between the identified samples and the known samples is calculated. Then, the stability of the identified samples is judged by the approach of proximity.
CONCLUSION
Slope engineering is an important problem in the process of engineering construction. Landslide and collapse caused by slope instability often bring great loss of life and property. On the basis of previous research and combined with artificial intelligence method, the slope stability is analysed. The slope protection model is emphatically studied. An FCM clustering analysis method based on genetic algorithm is obtained. On the basis of this algorithm, MATLAB is used to develop the software system. The system establishes a relatively perfect database through the arrangement of the existing engineering data. Finally, an intelligent analysis system for evaluating the stability of the slope is obtained. The results show that the system is reasonable.
REFERENCES
Alameda-Hernández, P., Hamdouni, R.E. and Irigaray, C. 2017. Weak foliated rock slope stability analysis with ultra-close-range terrestrial digital photogrammetry. B. Eng. Geol. Environ., 4: 1-15.
Cao, Z., Wang, Y. and Li, D. 2017. Practical reliability analysis of slope stability by advanced Monte Carlo simulations in a spreadsheet. Can. Geotech. J., 48(1): 162-172.
Cheng, L., Liu, Y.R. and Yang, Q. 2017. Mechanism and numerical simu-lation of reservoir slope deformation during impounding of high arch dams based on nonlinear FEM. Computers & Geotechnics, 81: 143-154.
Chinakwe, E.C., Ibekwe, V.I., Nwogwugwu, U.N., Ofoegbu, J., Mike-Anosike, E., Nwachukwu, I.N., Adeleye, S. and Chinakwe, P.O. 2019. Evaluation of plant growth promoting potentials exhibited by rhizo-bacteria associated with beans plant. Malaysian Journal of Sustainable Agriculture, 3(1): 20-22.
Hazmi, N. I. Z. and Hanafiah, M. M. 2018. Phytoremediation of livestock wastewater using Azolla Fili culoides and Lemna minor. Environment & Ecosystem Science, 2(1): 13-16.
Herayani Harith, N.S.C., Kibata, L.H. and Mirasa, A.K. 2018. Suitability of Dbela methods as seismic vulnerability assessment for buildings in Kota Kinabalu, Sabah. Geological Behavior, 2(1): 29-31.
Ismail, M.I., Azizan, N.H. and Mohd Ashaari, M. 2018. Isolation and
screening of biosurfactant-producing marine bacteria from Kuantan Port, Pahang, Malaysia. Science Heritage Journal, 2(2): 21-26.
Khan, R., Khan, R., Khan, M.U. and Khan, H.U. 2018. Right pure uni-soft ideals of ordered semigroups. Matriks Sains Matematik, 1(1): 18-23.
Kushwah, A. and Kumar, R. 2017. HACCP - its need and practices. Acta Chemica Malaysia, 1(2): 01-05.
Li, D.Q., Yang, Z.Y. and Cao, Z.J. 2017. System reliability analysis of slope stability using generalized subset simulation. Appl. Math Model, 46: 650-664.
Md. Atikuzzamman, Islam M. A., Md. Moniruzzaman and Islam, M.S. 2018. Vendors and consumers status and microbiological analysis of some common fast food items of different fast food restaurants in Barisal City. Malaysian Journal of Halal Research, 1(1): 17-21.
Nawaz, A., Arshad, F. and Khurshid, F. 2018. Evaluation of low-cost envi-ronment friendly natural extracts for the purification of drinking water. Earth Sciences Pakistan, 2(1): 23-25.
Ogunyele, A.C., Obaje, S.O. and Akingboye, A.S. 2018. Lithostructural relationships and petrogenetic affinities of the basement complex rocks around Okpella, Southwestern Nigeria. Earth Sciences Malaysia, 2(1): 29-36.
Oyedotun, T.D.T. 2019. Land use change and classification in Chaohu Lake catchment from multi-temporal remotely sensed images. Geology, Ecology, and Landscapes, 3(1): 37-45.
Pei, H.X., Zheng, Z.R. and Wang, C. 2017. D-FCM: Density based fuzzy c-means clustering algorithm with application in medical image seg-mentation. Procedia. Comput. Sci., 122: 407-414.
Roslee, R. and Tongkul, F. 2018. Engineering geological mapping on slope design in the mountainous area of Sabah Western, Malaysia. Pakistan Journal of Geology, 2(2): 01-10.
Siew, Len N.L., Bolong, N., Roslee, R., Tongkul, F., Mirasa, A. K. and Ayog, J. L. 2018. Flood vulnerability of critical infrastructures - Review. Malaysian Journal of Geosciences, 2(1): 34-37.
Thong, P.H. and Le, H.S. 2016. Picture fuzzy clustering: A new computa-tional intelligence method. Soft Comput., 20(9): 3549-3562.
Xinhua, X.U.E. 2007. A fuzzy neural network model for predicting slope stability. Journal of Engineering Geology, 15(1): 77-82.
Xu, D. 2018. Research on the cultural construction of homelink real estate. Engineering Heritage Journal, 2(1): 24-26.
Yang, L., Guo, H., Chen, H., He, L. and Sun, T. 2018. A bibliometric analysis of desalination research during 1997-2012. Water Conservation and Management, 2(1): 18-23.
Zahan, T., Hashem, A., Rahman, M., Bell, R.W. and Begum, M. 2018. Effi-cacy of herbicides in non-puddled transplanted rice under conservation agriculture systems and their effect on establishment of the succeeding crops. Acta Scientifica Malaysia, 2(1): 17-25.
Zainal Abidin, Z. A. and Chowdhury, A. J. K. 2018. Heavy metals and antibiotic resistance bacteria in marine sediment of Pahang Coastal Water. J. CleanWAS, 2(1): 20-22.
Zhang, Ju-lian, Shen, Ming-rong 2011. A new approach to expressway slope stability assessment. Rock and Soil Mechanics, 32(12): 3623-3629..

Vol. 18, No. 5 (Special Issue), 2019 • Nature Environment and Pollution Technology
1514
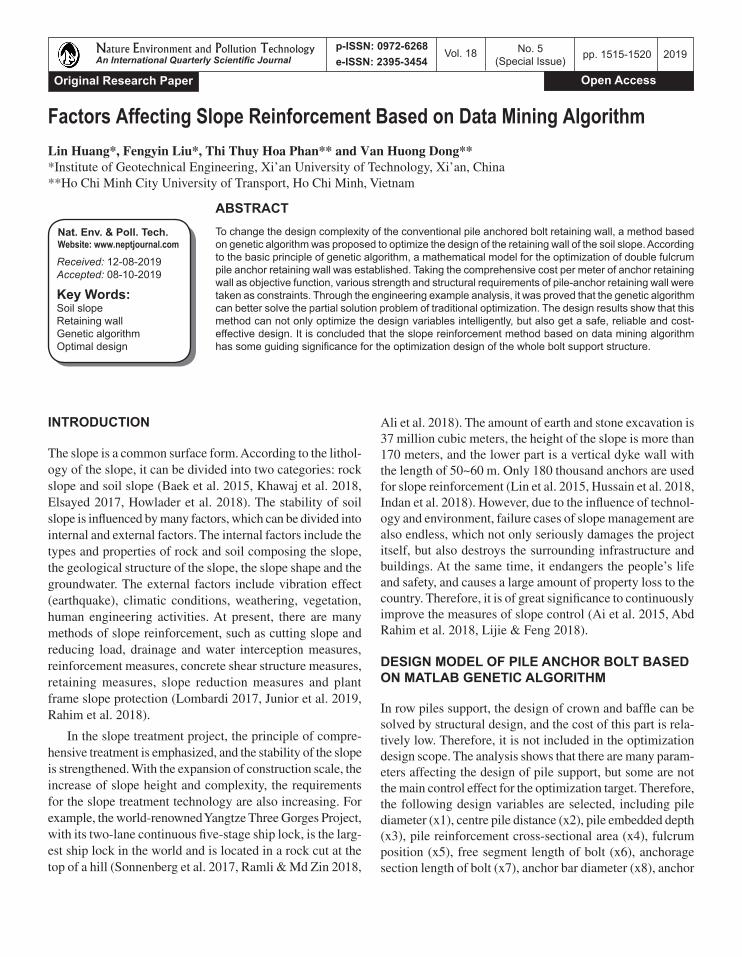
Factors Affecting Slope Reinforcement Based on Data Mining Algorithm
Lin Huang*, Fengyin Liu*, Thi Thuy Hoa Phan** and Van Huong Dong***Institute of Geotechnical Engineering, Xi’an University of Technology, Xi’an, China**Ho Chi Minh City University of Transport, Ho Chi Minh, Vietnam
ABSTRACT
To change the design complexity of the conventional pile anchored bolt retaining wall, a method based on genetic algorithm was proposed to optimize the design of the retaining wall of the soil slope. According to the basic principle of genetic algorithm, a mathematical model for the optimization of double fulcrum pile anchor retaining wall was established. Taking the comprehensive cost per meter of anchor retaining wall as objective function, various strength and structural requirements of pile-anchor retaining wall were taken as constraints. Through the engineering example analysis, it was proved that the genetic algorithm can better solve the partial solution problem of traditional optimization. The design results show that this method can not only optimize the design variables intelligently, but also get a safe, reliable and cost-effective design. It is concluded that the slope reinforcement method based on data mining algorithm has some guiding significance for the optimization design of the whole bolt support structure.
INTRODUCTION
The slope is a common surface form. According to the lithol-ogy of the slope, it can be divided into two categories: rock slope and soil slope (Baek et al. 2015, Khawaj et al. 2018, Elsayed 2017, Howlader et al. 2018). The stability of soil slope is influenced by many factors, which can be divided into internal and external factors. The internal factors include the types and properties of rock and soil composing the slope, the geological structure of the slope, the slope shape and the groundwater. The external factors include vibration effect (earthquake), climatic conditions, weathering, vegetation, human engineering activities. At present, there are many methods of slope reinforcement, such as cutting slope and reducing load, drainage and water interception measures, reinforcement measures, concrete shear structure measures, retaining measures, slope reduction measures and plant frame slope protection (Lombardi 2017, Junior et al. 2019, Rahim et al. 2018).
In the slope treatment project, the principle of compre-hensive treatment is emphasized, and the stability of the slope is strengthened. With the expansion of construction scale, the increase of slope height and complexity, the requirements for the slope treatment technology are also increasing. For example, the world-renowned Yangtze Three Gorges Project, with its two-lane continuous five-stage ship lock, is the larg-est ship lock in the world and is located in a rock cut at the top of a hill (Sonnenberg et al. 2017, Ramli & Md Zin 2018,
Ali et al. 2018). The amount of earth and stone excavation is 37 million cubic meters, the height of the slope is more than 170 meters, and the lower part is a vertical dyke wall with the length of 50~60 m. Only 180 thousand anchors are used for slope reinforcement (Lin et al. 2015, Hussain et al. 2018, Indan et al. 2018). However, due to the influence of technol-ogy and environment, failure cases of slope management are also endless, which not only seriously damages the project itself, but also destroys the surrounding infrastructure and buildings. At the same time, it endangers the people’s life and safety, and causes a large amount of property loss to the country. Therefore, it is of great significance to continuously improve the measures of slope control (Ai et al. 2015, Abd Rahim et al. 2018, Lijie & Feng 2018).
DESIGN MODEL OF PILE ANCHOR BOLT BASED ON MATLAB GENETIC ALGORITHM
In row piles support, the design of crown and baffle can be solved by structural design, and the cost of this part is rela-tively low. Therefore, it is not included in the optimization design scope. The analysis shows that there are many param-eters affecting the design of pile support, but some are not the main control effect for the optimization target. Therefore, the following design variables are selected, including pile diameter (x1), centre pile distance (x2), pile embedded depth (x3), pile reinforcement cross-sectional area (x4), fulcrum position (x5), free segment length of bolt (x6), anchorage section length of bolt (x7), anchor bar diameter (x8), anchor
Nat. Env. & Poll. Tech.Website: www.neptjournal.com
Received: 12-08-2019Accepted: 08-10-2019
Key Words:Soil slope Retaining wall Genetic algorithm Optimal design
2019pp. 1515-1520 Vol. 18
p-ISSN: 0972-6268 No. 5 (Special Issue)
Nature Environment and Pollution Technology An International Quarterly Scientific Journal
Original Research Paper
e-ISSN: 2395-3454
Open Access
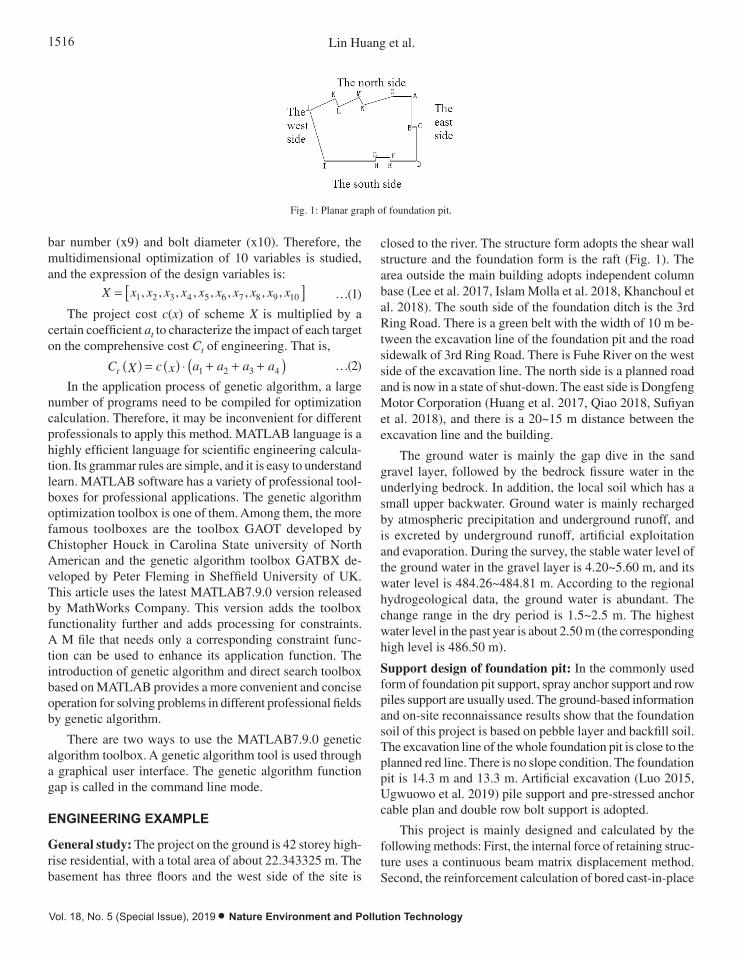
1516 Lin Huang et al.
Vol. 18, No. 5 (Special Issue), 2019 • Nature Environment and Pollution Technology
technology and environment, failure cases of slope management are also endless, which not only seriously damages the project itself, but also destroys the surrounding infrastructure and buildings. At the same time, it endangers the people's life and safety, and causes a large amount of property loss to the country. Therefore, it is of great significance to continuously improve the measures of slope control (Ai et al. 2015, Abd Rahim et al. 2018, Lijie & Feng 2018).
DESIGN MODEL OF PILE ANCHOR BOLT BASED ON MATLAB GENETIC ALGORITHM
In row piles support, the design of crown and baffle can be solved by structural design, and the cost of this part is relatively low. Therefore, it is not included in the optimization design scope. The analysis shows that there are many parameters affecting the design of pile support, but some are not the main control effect for the optimization target. Therefore, the following design variables are selected, including pile diameter (x1), centre pile distance (x2), pile embedded depth (x3), pile reinforcement cross-sectional area (x4), fulcrum position (x5), free segment length of bolt (x6), anchorage section length of bolt (x7), anchor bar diameter (x8), anchor bar number (x9) and bolt diameter (x10). Therefore, the multidimensional optimization of 10 variables is studied, and the expression of the design variables is:
10987654321 ,,,,,,,,, xxxxxxxxxxX … (1)
The project cost c(x) of scheme X is multiplied by a certain coefficient at to characterize the impact of each target on the comprehensive cost Ct of engineering. That is,
4321 aaaaxcXCt … (2)
In the application process of genetic algorithm, a large number of programs need to be compiled for optimization calculation. Therefore, it may be inconvenient for different professionals to apply this method. MATLAB language is a highly efficient language for scientific engineering calculation. Its grammar rules are simple, and it is easy to understand learn. MATLAB software has a variety of professional toolboxes for professional applications. The genetic algorithm optimization toolbox is one of them. Among them, the more famous toolboxes are the toolbox GAOT developed by Chistopher Houck in Carolina State university of North American and the genetic algorithm toolbox GATBX developed by Peter Fleming in Sheffield University of UK. This article uses the latest MATLAB7.9.0 version released by MathWorks Company. This version adds the toolbox functionality further and adds processing for constraints. A M file that needs only a corresponding constraint function can be used to enhance its application function. The introduction of genetic algorithm and direct search toolbox based on MATLAB provides a more convenient and concise operation for solving problems in different professional fields by genetic algorithm.
There are two ways to use the MATLAB7.9.0 genetic algorithm toolbox. A genetic algorithm tool is used through a graphical user interface. The genetic algorithm function gap is called in the command line mode.
ENGINEERING EXAMPLE
General study: The project on the ground is 42 storey high-rise residential, with a total area of about 22.343325 m. The basement has three floors and the west side of the site is closed to the river. The structure form adopts the shear wall structure and the foundation form is the raft (Fig. 1). The area outside the main building adopts independent column base (Lee et al. 2017, Islam Molla et al. 2018, Khanchoul et al. 2018). The south side of the foundation ditch is the 3rd Ring Road. There is a green belt with the width of 10 m between the excavation line of the foundation pit and the road sidewalk of 3rd Ring Road. There is Fuhe River on the west side of the excavation line. The north side is a planned road and is now in a state of shutdown. The east side is Dongfeng Motor Corporation (Huang et al. 2017, Qiao 2018, Sufiyan et al. 2018), and there is a 20~15 m distance between the excavation line and the building.
Fig. 1: Planar graph of foundation pit.
bar number (x9) and bolt diameter (x10). Therefore, the multidimensional optimization of 10 variables is studied, and the expression of the design variables is:
X x x x x x x x x x x= [ ]1 2 3 4 5 6 7 8 9 10, , , , , , , , , …(1)
The project cost c(x) of scheme X is multiplied by a certain coefficient at to characterize the impact of each target on the comprehensive cost Ct of engineering. That is,
C X c x a a a at ( ) = ( ) ◊ + + +( )1 2 3 4 …(2)
In the application process of genetic algorithm, a large number of programs need to be compiled for optimization calculation. Therefore, it may be inconvenient for different professionals to apply this method. MATLAB language is a highly efficient language for scientific engineering calcula-tion. Its grammar rules are simple, and it is easy to understand learn. MATLAB software has a variety of professional tool-boxes for professional applications. The genetic algorithm optimization toolbox is one of them. Among them, the more famous toolboxes are the toolbox GAOT developed by Chistopher Houck in Carolina State university of North American and the genetic algorithm toolbox GATBX de-veloped by Peter Fleming in Sheffield University of UK. This article uses the latest MATLAB7.9.0 version released by MathWorks Company. This version adds the toolbox functionality further and adds processing for constraints. A M file that needs only a corresponding constraint func-tion can be used to enhance its application function. The introduction of genetic algorithm and direct search toolbox based on MATLAB provides a more convenient and concise operation for solving problems in different professional fields by genetic algorithm.
There are two ways to use the MATLAB7.9.0 genetic algorithm toolbox. A genetic algorithm tool is used through a graphical user interface. The genetic algorithm function gap is called in the command line mode.
ENGINEERING EXAMPLE
General study: The project on the ground is 42 storey high-rise residential, with a total area of about 22.343325 m. The basement has three floors and the west side of the site is
closed to the river. The structure form adopts the shear wall structure and the foundation form is the raft (Fig. 1). The area outside the main building adopts independent column base (Lee et al. 2017, Islam Molla et al. 2018, Khanchoul et al. 2018). The south side of the foundation ditch is the 3rd Ring Road. There is a green belt with the width of 10 m be-tween the excavation line of the foundation pit and the road sidewalk of 3rd Ring Road. There is Fuhe River on the west side of the excavation line. The north side is a planned road and is now in a state of shut-down. The east side is Dongfeng Motor Corporation (Huang et al. 2017, Qiao 2018, Sufiyan et al. 2018), and there is a 20~15 m distance between the excavation line and the building.
The ground water is mainly the gap dive in the sand gravel layer, followed by the bedrock fissure water in the underlying bedrock. In addition, the local soil which has a small upper backwater. Ground water is mainly recharged by atmospheric precipitation and underground runoff, and is excreted by underground runoff, artificial exploitation and evaporation. During the survey, the stable water level of the ground water in the gravel layer is 4.20~5.60 m, and its water level is 484.26~484.81 m. According to the regional hydrogeological data, the ground water is abundant. The change range in the dry period is 1.5~2.5 m. The highest water level in the past year is about 2.50 m (the corresponding high level is 486.50 m).
Support design of foundation pit: In the commonly used form of foundation pit support, spray anchor support and row piles support are usually used. The ground-based information and on-site reconnaissance results show that the foundation soil of this project is based on pebble layer and backfill soil. The excavation line of the whole foundation pit is close to the planned red line. There is no slope condition. The foundation pit is 14.3 m and 13.3 m. Artificial excavation (Luo 2015, Ugwuowo et al. 2019) pile support and pre-stressed anchor cable plan and double row bolt support is adopted.
This project is mainly designed and calculated by the following methods: First, the internal force of retaining struc-ture uses a continuous beam matrix displacement method. Second, the reinforcement calculation of bored cast-in-place
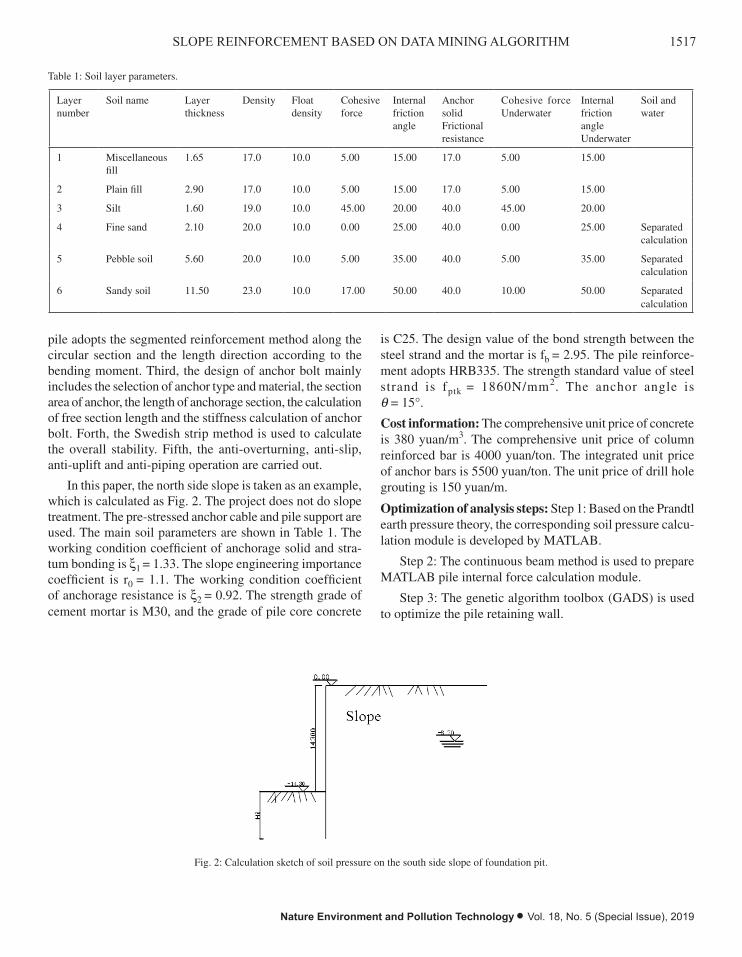
1517SLOPE REINFORCEMENT BASED ON DATA MINING ALGORITHM
Nature Environment and Pollution Technology • Vol. 18, No. 5 (Special Issue), 2019
Table 1: Soil layer parameters.
Layer number
Soil name Layer thickness
Density Float density
Cohesive force
Internal friction angle
Anchor solid Frictional resistance
Cohesive force Underwater
Internal friction angle Underwater
Soil and water
1 Miscellaneous fill
1.65 17.0 10.0 5.00 15.00 17.0 5.00 15.00
2 Plain fill 2.90 17.0 10.0 5.00 15.00 17.0 5.00 15.00
3 Silt 1.60 19.0 10.0 45.00 20.00 40.0 45.00 20.00
4 Fine sand 2.10 20.0 10.0 0.00 25.00 40.0 0.00 25.00 Separated calculation
5 Pebble soil 5.60 20.0 10.0 5.00 35.00 40.0 5.00 35.00 Separated calculation
6 Sandy soil 11.50 23.0 10.0 17.00 50.00 40.0 10.00 50.00 Separated calculation
pile adopts the segmented reinforcement method along the circular section and the length direction according to the bending moment. Third, the design of anchor bolt mainly includes the selection of anchor type and material, the section area of anchor, the length of anchorage section, the calculation of free section length and the stiffness calculation of anchor bolt. Forth, the Swedish strip method is used to calculate the overall stability. Fifth, the anti-overturning, anti-slip, anti-uplift and anti-piping operation are carried out.
In this paper, the north side slope is taken as an example, which is calculated as Fig. 2. The project does not do slope treatment. The pre-stressed anchor cable and pile support are used. The main soil parameters are shown in Table 1. The working condition coefficient of anchorage solid and stra-tum bonding is x1
= 1.33. The slope engineering importance coefficient is r0 = 1.1. The working condition coefficient of anchorage resistance is x2 = 0.92. The strength grade of cement mortar is M30, and the grade of pile core concrete
is C25. The design value of the bond strength between the steel strand and the mortar is fb = 2.95. The pile reinforce-ment adopts HRB335. The strength standard value of steel strand is fptk = 1860N/mm2. The anchor angle is q = 15°.
Cost information: The comprehensive unit price of concrete is 380 yuan/m3. The comprehensive unit price of column reinforced bar is 4000 yuan/ton. The integrated unit price of anchor bars is 5500 yuan/ton. The unit price of drill hole grouting is 150 yuan/m.
Optimization of analysis steps: Step 1: Based on the Prandtl earth pressure theory, the corresponding soil pressure calcu-lation module is developed by MATLAB.
Step 2: The continuous beam method is used to prepare MATLAB pile internal force calculation module.
Step 3: The genetic algorithm toolbox (GADS) is used to optimize the pile retaining wall.
Fig. 2: Calculation sketch of soil pressure on the south side slope of foundation pit.
Cost information: The comprehensive unit price of concrete is 380 yuan/m3. The comprehensive unit price of column reinforced bar is 4000 yuan/ton. The integrated unit price of anchor bars is 5500 yuan/ton. The unit price of drill hole grouting is 150 yuan/m.
Optimization of analysis steps:
Step 1: Based on the Prandtl earth pressure theory, the corresponding soil pressure calculation module is developed by MATLAB.
Step 2: The continuous beam method is used to prepare MATLAB pile internal force calculation module.
Step 3: The genetic algorithm toolbox (GADS) is used to optimize the pile retaining wall.
Optimization results:
0 2 4 6 8 10 12 14 16 18 20 22
0
2
4
6
8
Best fitness Mean fitness
Fitn
ess v
alue
Generation Fig. 3: Optimization of graphic output interface by genetic algorithm.
Fig. 2: Calculation sketch of soil pressure on the south side slope of foundation pit.
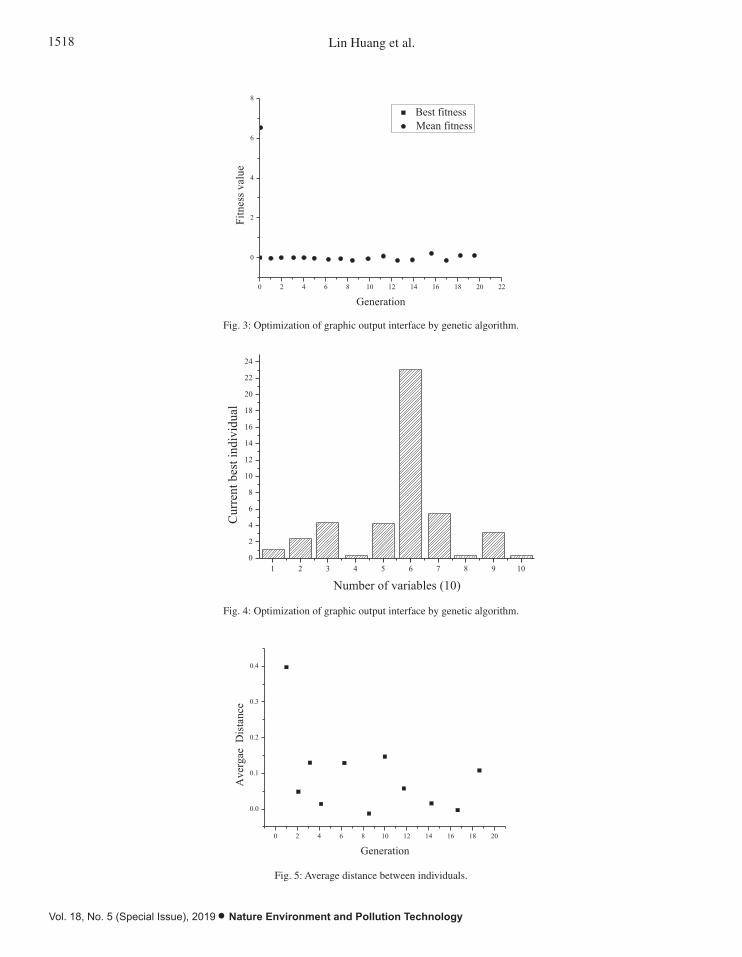
1518 Lin Huang et al.
Vol. 18, No. 5 (Special Issue), 2019 • Nature Environment and Pollution Technology
Fig. 2: Calculation sketch of soil pressure on the south side slope of foundation pit.
Cost information: The comprehensive unit price of concrete is 380 yuan/m3. The comprehensive unit price of column reinforced bar is 4000 yuan/ton. The integrated unit price of anchor bars is 5500 yuan/ton. The unit price of drill hole grouting is 150 yuan/m.
Optimization of analysis steps:
Step 1: Based on the Prandtl earth pressure theory, the corresponding soil pressure calculation module is developed by MATLAB.
Step 2: The continuous beam method is used to prepare MATLAB pile internal force calculation module.
Step 3: The genetic algorithm toolbox (GADS) is used to optimize the pile retaining wall.
Optimization results:
0 2 4 6 8 10 12 14 16 18 20 22
0
2
4
6
8
Best fitness Mean fitness
Fitn
ess v
alue
Generation Fig. 3: Optimization of graphic output interface by genetic algorithm.
Fig. 3: Optimization of graphic output interface by genetic algorithm.
1 2 3 4 5 6 7 8 9 100
2
4
6
8
10
12
14
16
18
20
22
24
Cur
rent
bes
t ind
ivid
ual
Number of variables (10) Fig. 4: Optimization of graphic output interface by genetic algorithm.
0 2 4 6 8 10 12 14 16 18 20
0.0
0.1
0.2
0.3
0.4
Ave
rgae
Dis
tanc
e
Generation Fig. 5: Average distance between individuals.
The optimization results are shown in Figs. 3-5. The results of the optimization and the original design are compared in Table 2.
Table 2: Optimization result comparison.
x1 (m)
x2 (m)
x3 (m)
x4 (m)
x5 (m)
x6 (m)
x7 (m)
x8 (m)
x9 (number)
x10 (m)
Original design
1.00 3.00 4.00 0.0069 4.00 15.00 10.00 0.015 5 0.15
Optimal design
0.90 3.00 4.30 0.0058 4.50 22.92 5.78 0.016 3 0.15
The comparison results show that compared with the original design, the pile diameter decreases. Although the embedded degree increases a little, the pile reinforcement is correspondingly reduced due to the reduction of the maximum bending moment of the pile under the fulcrum position. Compared to the original design, the free segment length of anchor increases, the anchorage length decreases more. In addition, the decrease of anchor reduces the engineering cost greatly.
By adjusting and optimizing the fulcrum location, row diameter, embedded depth and anchorage length, the comprehensive cost can be saved, and the internal force of pile body can be optimized. The optimization results are in good agreement with the measured data, which show that the optimization of the genetic algorithm for the pile anchor retaining wall is successful.
CONCLUSION
In this paper, a new soil pressure calculation theory is introduced and the Prandtl sliding surface formula for calculating the soil pressure is derived. The earth pressure calculation method is combined with the continuous
Fig. 4: Optimization of graphic output interface by genetic algorithm.
1 2 3 4 5 6 7 8 9 100
2
4
6
8
10
12
14
16
18
20
22
24
Cur
rent
bes
t ind
ivid
ual
Number of variables (10) Fig. 4: Optimization of graphic output interface by genetic algorithm.
0 2 4 6 8 10 12 14 16 18 20
0.0
0.1
0.2
0.3
0.4
Ave
rgae
Dis
tanc
e
Generation Fig. 5: Average distance between individuals.
The optimization results are shown in Figs. 3-5. The results of the optimization and the original design are compared in Table 2.
Table 2: Optimization result comparison.
x1 (m)
x2 (m)
x3 (m)
x4 (m)
x5 (m)
x6 (m)
x7 (m)
x8 (m)
x9 (number)
x10 (m)
Original design
1.00 3.00 4.00 0.0069 4.00 15.00 10.00 0.015 5 0.15
Optimal design
0.90 3.00 4.30 0.0058 4.50 22.92 5.78 0.016 3 0.15
The comparison results show that compared with the original design, the pile diameter decreases. Although the embedded degree increases a little, the pile reinforcement is correspondingly reduced due to the reduction of the maximum bending moment of the pile under the fulcrum position. Compared to the original design, the free segment length of anchor increases, the anchorage length decreases more. In addition, the decrease of anchor reduces the engineering cost greatly.
By adjusting and optimizing the fulcrum location, row diameter, embedded depth and anchorage length, the comprehensive cost can be saved, and the internal force of pile body can be optimized. The optimization results are in good agreement with the measured data, which show that the optimization of the genetic algorithm for the pile anchor retaining wall is successful.
CONCLUSION
In this paper, a new soil pressure calculation theory is introduced and the Prandtl sliding surface formula for calculating the soil pressure is derived. The earth pressure calculation method is combined with the continuous
Fig. 5: Average distance between individuals.
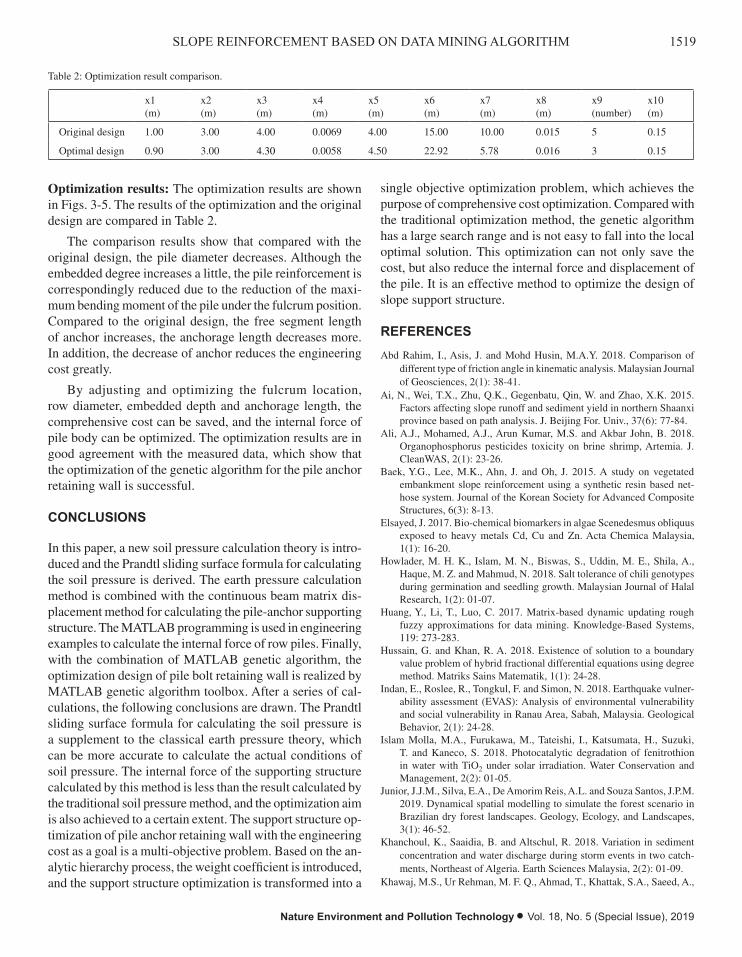
1519SLOPE REINFORCEMENT BASED ON DATA MINING ALGORITHM
Nature Environment and Pollution Technology • Vol. 18, No. 5 (Special Issue), 2019
Table 2: Optimization result comparison.
x1(m)
x2(m)
x3(m)
x4(m)
x5(m)
x6(m)
x7(m)
x8(m)
x9(number)
x10(m)
Original design 1.00 3.00 4.00 0.0069 4.00 15.00 10.00 0.015 5 0.15
Optimal design 0.90 3.00 4.30 0.0058 4.50 22.92 5.78 0.016 3 0.15
Optimization results: The optimization results are shown in Figs. 3-5. The results of the optimization and the original design are compared in Table 2.
The comparison results show that compared with the original design, the pile diameter decreases. Although the embedded degree increases a little, the pile reinforcement is correspondingly reduced due to the reduction of the maxi-mum bending moment of the pile under the fulcrum position. Compared to the original design, the free segment length of anchor increases, the anchorage length decreases more. In addition, the decrease of anchor reduces the engineering cost greatly.
By adjusting and optimizing the fulcrum location, row diameter, embedded depth and anchorage length, the comprehensive cost can be saved, and the internal force of pile body can be optimized. The optimization results are in good agreement with the measured data, which show that the optimization of the genetic algorithm for the pile anchor retaining wall is successful.
CONCLUSIONS
In this paper, a new soil pressure calculation theory is intro-duced and the Prandtl sliding surface formula for calculating the soil pressure is derived. The earth pressure calculation method is combined with the continuous beam matrix dis-placement method for calculating the pile-anchor supporting structure. The MATLAB programming is used in engineering examples to calculate the internal force of row piles. Finally, with the combination of MATLAB genetic algorithm, the optimization design of pile bolt retaining wall is realized by MATLAB genetic algorithm toolbox. After a series of cal-culations, the following conclusions are drawn. The Prandtl sliding surface formula for calculating the soil pressure is a supplement to the classical earth pressure theory, which can be more accurate to calculate the actual conditions of soil pressure. The internal force of the supporting structure calculated by this method is less than the result calculated by the traditional soil pressure method, and the optimization aim is also achieved to a certain extent. The support structure op-timization of pile anchor retaining wall with the engineering cost as a goal is a multi-objective problem. Based on the an-alytic hierarchy process, the weight coefficient is introduced, and the support structure optimization is transformed into a
single objective optimization problem, which achieves the purpose of comprehensive cost optimization. Compared with the traditional optimization method, the genetic algorithm has a large search range and is not easy to fall into the local optimal solution. This optimization can not only save the cost, but also reduce the internal force and displacement of the pile. It is an effective method to optimize the design of slope support structure.
REFERENCES
Abd Rahim, I., Asis, J. and Mohd Husin, M.A.Y. 2018. Comparison of different type of friction angle in kinematic analysis. Malaysian Journal of Geosciences, 2(1): 38-41.
Ai, N., Wei, T.X., Zhu, Q.K., Gegenbatu, Qin, W. and Zhao, X.K. 2015. Factors affecting slope runoff and sediment yield in northern Shaanxi province based on path analysis. J. Beijing For. Univ., 37(6): 77-84.
Ali, A.J., Mohamed, A.J., Arun Kumar, M.S. and Akbar John, B. 2018. Organophosphorus pesticides toxicity on brine shrimp, Artemia. J. CleanWAS, 2(1): 23-26.
Baek, Y.G., Lee, M.K., Ahn, J. and Oh, J. 2015. A study on vegetated embankment slope reinforcement using a synthetic resin based net-hose system. Journal of the Korean Society for Advanced Composite Structures, 6(3): 8-13.
Elsayed, J. 2017. Bio-chemical biomarkers in algae Scenedesmus obliquus exposed to heavy metals Cd, Cu and Zn. Acta Chemica Malaysia, 1(1): 16-20.
Howlader, M. H. K., Islam, M. N., Biswas, S., Uddin, M. E., Shila, A., Haque, M. Z. and Mahmud, N. 2018. Salt tolerance of chili genotypes during germination and seedling growth. Malaysian Journal of Halal Research, 1(2): 01-07.
Huang, Y., Li, T., Luo, C. 2017. Matrix-based dynamic updating rough fuzzy approximations for data mining. Knowledge-Based Systems, 119: 273-283.
Hussain, G. and Khan, R. A. 2018. Existence of solution to a boundary value problem of hybrid fractional differential equations using degree method. Matriks Sains Matematik, 1(1): 24-28.
Indan, E., Roslee, R., Tongkul, F. and Simon, N. 2018. Earthquake vulner-ability assessment (EVAS): Analysis of environmental vulnerability and social vulnerability in Ranau Area, Sabah, Malaysia. Geological Behavior, 2(1): 24-28.
Islam Molla, M.A., Furukawa, M., Tateishi, I., Katsumata, H., Suzuki, T. and Kaneco, S. 2018. Photocatalytic degradation of fenitrothion in water with TiO2 under solar irradiation. Water Conservation and Management, 2(2): 01-05.
Junior, J.J.M., Silva, E.A., De Amorim Reis, A.L. and Souza Santos, J.P.M. 2019. Dynamical spatial modelling to simulate the forest scenario in Brazilian dry forest landscapes. Geology, Ecology, and Landscapes, 3(1): 46-52.
Khanchoul, K., Saaidia, B. and Altschul, R. 2018. Variation in sediment concentration and water discharge during storm events in two catch-ments, Northeast of Algeria. Earth Sciences Malaysia, 2(2): 01-09.
Khawaj, M.S., Ur Rehman, M. F. Q., Ahmad, T., Khattak, S.A., Saeed, A.,

1520 Lin Huang et al.
Vol. 18, No. 5 (Special Issue), 2019 • Nature Environment and Pollution Technology
Adnan, M. T., Irfan, Rehman, S.U., Ahmad, I. and Ishfaque, M. 2018. Benthic foraminiferal biostratigraphy, microfacies analysis and deposi-tional environment of Chorgali formation Yaadgar section, Muzaffarabad, Pakistan. Pakistan Journal of Geology, 2(1): 21-29.
Lee, S., Lee, M.J. and Jung, H.S. 2017. Data mining approaches for landslide susceptibility mapping in Umyeonsan, Seoul, South Korea. Appl. Sci., 7(7): 683.
Lijie, L. and Feng, Y. 2018. A study on the rhythm and respiratory charac-teristics of Zhuang Language. Acta Scientifica Malaysia, 2(1): 26-28.
Lin, P., Liu, X., Zhou, W., Wang, R. and Wang, S. 2015. Cracking, stability and slope reinforcement analysis relating to the Jinping dam based on a Geomechanical model test. Arab. J. Geosc., 8(7): 4393-4410.
Lombardi, F., Scippa, G.S. and Lasserre, B. 2017. The influence of slope on Spartium junceum, root system: morphological, anatomical and biome-chanical adaptation. J. Plant Res., 130(3): 515-525.
Luo, G., He, Z. and Zeng, L. 2015. Numerical analysis of reinforcement effect of slope anti-slide pile on expressway reconstruction projection. J. Cent. South Univ. Technol., 46(6): 2244-2249.
Qiao, F. 2018. The study on the integration of green architecture and appro-priate technology. Engineering Heritage Journal, 2(2): 01-03.
Rahim, Y., Khan, M.S. and Mughal, S. 2018. Petrography of sandstone of the Lumshiwal formation from Eastern Hazara, Khyber Pakhtunkhwa, Pakistan: Implications for provenance, diagenesis and environments of deposition. Earth Sciences Pakistan, 2(2): 01-06.3.
Ramli, N. S. and Md Zin, N.H. 2018. Alpha-amylase inhibitory activity of inhibitor proteins in different types of commercial rice. Science Heritage Journal, 2(2): 27-29.
Sonnenberg, R., Bransby, M.F. and Hallett, P.D. 2017. Centrifuge modelling of soil slopes reinforced with vegetation. Can. Geotech. J., 47(12): 1415-1430.
Sufiyan, I., Zakariya, R. and Yaacob, R. 2018. Delineation of flood risk zones and 3D modelling in Terengganu River Catchment using GIS and SWAT. Environment & Ecosystem Science, 2(2): 01-05.
Ugwuowo, L.C., Ebenebe, C.I., Ezeano, C.I and Nnadi, C.C. 2019. Effect of photoperiod on the growth performance and behavioral pattern of Achatina snail. Malaysian Journal of Sustainable Agriculture, 3(1): 28-32.
Research on Green Transition Development of Energy Enterprises Taking Mining Industry as an Example
Zhilong Xu*, Shuai Zhai**† and Nguyen Xuan Phuong****International Exchange College of Ningbo University of Technology, Ningbo 315211, China**Business School of Huzhou University, Huzhou 313000, China***Ho Chi Minh City University of Transport, Ho Chi Minh, Vietnam†Corresponding Author: Shuai Zhai
ABSTRACT
To fully understand the development models of the green mining economy, this paper, based on the western externality theory, focused on a green mining construction case in China. Results have shown that the green mining concept has early emerged in the mining industry and currently has reached a relatively high target, indicating the application value of the concept of green mining development. It is then concluded that the green mining development model is valid and effectively verified by the green mining construction case.
INTRODUCTION
The coal mining industry is an important industry supporting China’s social development, whose level of development is closely related to people’s livelihood. Currently, development in all sectors demands more and more coal mines, posing great difficulty in coal mine supply. To alleviate this problem and achieve the purpose of energy conservation and emission reduction, the concept of green cola mining economic devel-opment has been proposed in China. The core philosophy is to realize the optimal mineral resources development and the minimum ecological environmental impact on the premise that the mine environmental disturbance is less than or equal to the regional environmental capacity. This model can maintain the ecological balance, advance the economic development of mining, and reduce the difficulty of coal supply, so as to promote the rational distribution of coal mine supply, attracting much attention of the community.
This paper, taking a mineral enterprise as an example, studied its actions for green coal mining development from the perspective of the system theory based on the Western mainstream economic theory, the resource industry econom-ics and ecological economic theory. Additionally, a green mining economic development model and corresponding policy support system were put forward based on the analysis of the motivations for coal mining enterprises to develop green mining economy.
PAST STUDIES
Under the premise that the amount of environmental disturbance is not greater than the regional environmental capacity and its self-purification capability, the mineral development model with the optimal allocation of mineral resources and the minimization of regional eco-environmental impacts is implemented. Green mining is no longer taking the old road of extensive mineral resources development and utilization, but rather achieving sustainable development. For the relationship between mining development and economic development, many experts at home and abroad have conducted research (Dai et al. 2016, Usman et al. 2018, Hanafiah et al. 2017, Sultana et al. 2018). There is complete compatibility between mining activities, the environment, society and the economy. At present, the mining companies should be able to profitably provide the society with mineral products while also protecting the environment and social welfare. These environmental and social benefits are necessary for social and economic development. Mineral resource-based enterprises must handle several relationships in the course of their operations (Kusi-Sarpong et al. 2016, Babaranti et al. 2019). First of all, enterprises should listen to shareholders’ opinions and provide enough investment returns and benefits. The second is to achieve the optimal allocation of resources. The last step is to govern, restore, and protect the ecological environment in the mining area and
Nat. Env. & Poll. Tech.Website: www.neptjournal.com
Received: 27-08-2019Accepted: 08-10-2019
Key Words:Green transition development Energy enterprises Mining industry
2019pp. 1521-1526 Vol. 18
p-ISSN: 0972-6268 No. 5 (Special Issue)
Nature Environment and Pollution Technology An International Quarterly Scientific Journal
Original Research Paper
e-ISSN: 2395-3454
Open Access
1522 Zhilong Xu et al.
Vol. 18, No. 5 (Special Issue), 2019 • Nature Environment and Pollution Technology
compensate them in subsequent operations. This illustrates the basic connotations of green mining from another perspective. The miners are responsible for ensuring that the world economy supplies sufficient raw materials to support economic growth and continuously improve people’s living standards. The development of mining must take into account the full use of resources, the protection of the environment, the training and development of staff, and the local economic and social development. Mineral resource companies must create a new business model. In this way, the sustainable development of the mining economy will be achieved through the joint efforts of the government, surrounding organizations and civil society groups (Musa & Chinniah 2016, Jamil et al. 2018, Khan et al. 2018). Therefore, the construction of green mines and the development of green mining are new models for the sustainable development of the mining economy.
As a large mining country, there are currently more than 10,000 state-owned large, medium, and small-sized mines, and mining cities such as Daqing and Panzhihua that are supported by mining and mineral processing industries. The development and utilization of mineral resources have become one of the pillar industries in China’s socio-econom-ic development (Ouoba 2017, Alsulaiman & Nizam 2018, Zada & Ali 2018). With the development and utilization of mineral resources, the topography and geomorphology of the earth’s surface and the structure of subterranean rock formations have been greatly changed. This not only destroys the natural landscape of the surface, but also destroys the balance of the ground stress, water balance and ecological environment balance, resulting in the occurrence of ground subsidence, mountain cracking, landslides and mudslides and other geological disasters (Shen et al. 2015, Yew & Abd Rahim 2017, Ismail et al. 2017). The massive emission of by-products such as waste rock and tailings in mines not only wastes natural resources, but also destroys the structure of the soil, causing the loss of water and soil, the desertification of the land and the destruction of the ecological environment in the mining area. Tailings and their by-products are the wastes of mines in the process of exploiting and utilizing mineral resources (Sivakumar et al. 2015, Aslam 2017, Za-repourfard et al. 2017). Under different technical conditions, it is also a potential resource. Under the conditions of the development of green mining economy, it can be effectively developed and utilized through innovative technologies such as recycling and low carbon. In the field of green mining economy and sustainable development, domestic scholars have also conducted a lot of research. From the perspective of economic structure and regional economic development, the western region will certainly become the replacement of China’s energy and mineral resources. Mineral resources are abundant, the degree of development and utilization is low,
and the potential is huge. Most of the eastern mines will be closed and mining cities will need to be transformed (Xu et al. 2016, Bakar et al. 2017, Kumar 2018). In formulating the grand plan for the development of the western region, the experience and lessons of industrial civilization and environmental and ecological imbalances should be sum-marized. The development of the western mining industry must be based on two basic points. First, starting from the overall perspective, two mineral resources must be devel-oped. This is a national condition. Second, the ecologically fragile western region must be protected. This is a national policy. Based on the conceptual connotations of “resource depletion function”, “intergenerational equity” and “social tolerance”, sustainable development of the mining industry means not only meeting the needs of economic development, but also not damaging the human living environment, health and life. Through scientific and technological innovation, the consumption rate of coal resources is maintained at a relative level. When resources are depleted, humans have enough time and conditions to make an orderly shift to alternative resources. Based on game theory, the company’s green mining and continuous innovation are systematically analysed (Zhang et al. 2017, OmaraShaestan et al. 2017, Sedaghathoor & Shahrajil 2018). The corresponding policies and recommendations are put forward.
In summary, while providing clean fuel, raw materials, and electricity to the society, the coal industry should make full use of market mechanisms. Through scientific and technological innovation, it seeks alternative resources and regulates the optimal recovery rate and exhaustion rate of coal resources. Economic, social, environmental protection and resources are optimally configured. While satisfying the needs of the present generation, it does not pose a danger to future generations. Mining is the basis of economic de-velopment. In the process of economic development, on the one hand, a large amount of essential basic raw material is provided; on the other hand, mine pollution problems caused by irrational development and utilization of resources are gradually increasing, which destroys the inherent ecological environment. Typical diseases in mining areas are frequent, underground and surface water are polluted to varying degrees, and events such as landslides, mudslides, and soil depletion frequently occur. Therefore, it is of great signifi-cance to systematically deal with the relationship between the exploitation and utilization of mineral resources, the ecological environment, and regional economic development. The construction of green mines, the development of green mining and the green mining economy are the only way to coordinate sustainable development.
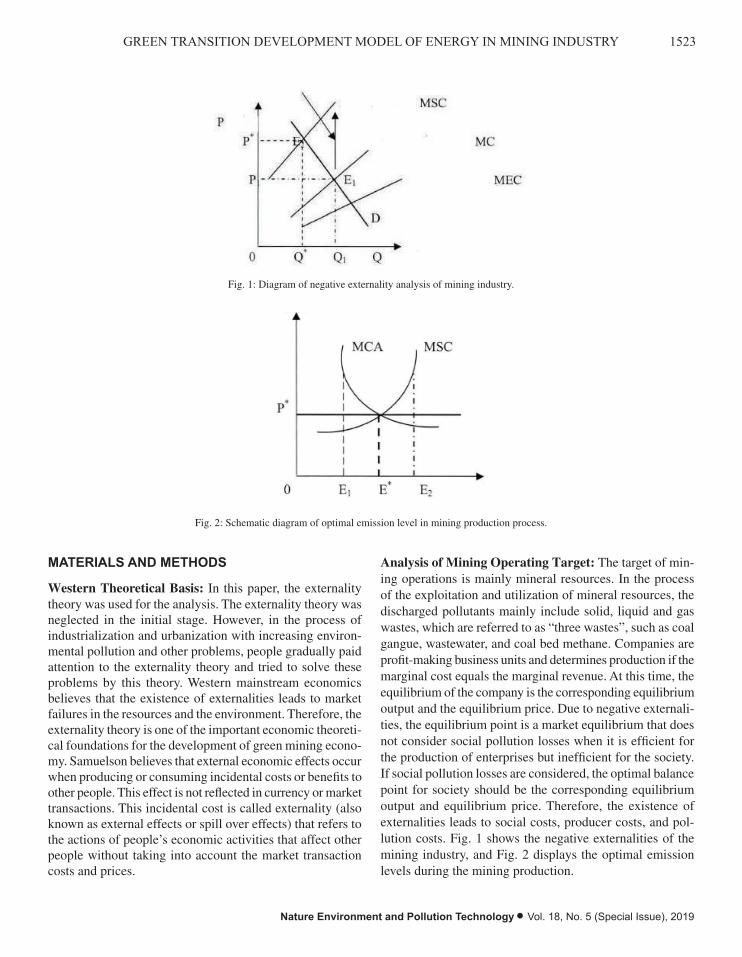
1523GREEN TRANSITION DEVELOPMENT MODEL OF ENERGY IN MINING INDUSTRY
Nature Environment and Pollution Technology • Vol. 18, No. 5 (Special Issue), 2019
shift to alternative resources. Based on game theory, the company's green mining and continuous innovation are systematically analysed (Zhang et al. 2017, OmaraShaestan et al. 2017, Sedaghathoor & Shahrajil 2018). The corresponding policies and recommendations are put forward.
In summary, while providing clean fuel, raw materials, and electricity to the society, the coal industry should make full use of market mechanisms. Through scientific and technological innovation, it seeks alternative resources and regulates the optimal recovery rate and exhaustion rate of coal resources. Economic, social, environmental protection and resources are optimally configured. While satisfying the needs of the present generation, it does not pose a danger to future generations. Mining is the basis of economic development. In the process of economic development, on the one hand, a large amount of essential basic raw material is provided; on the other hand, mine pollution problems caused by irrational development and utilization of resources are gradually increasing, which destroys the inherent ecological environment. Typical diseases in mining areas are frequent, underground and surface water are polluted to varying degrees, and events such as landslides, mudslides, and soil depletion frequently occur. Therefore, it is of great significance to systematically deal with the relationship between the exploitation and utilization of mineral resources, the ecological environment, and regional economic development. The construction of green mines, the development of green mining and the green mining economy are the only way to coordinate sustainable development.
METHODS
Western Theoretical Basis: In this paper, the externality theory was used for the analysis. The externality theory was neglected in the initial stage. However, in the process of industrialization and urbanization with increasing environmental pollution and other problems, people gradually paid attention to the externality theory and tried to solve these problems by this theory. Western mainstream economics believes that the existence of externalities leads to market failures in the resources and the environment. Therefore, the externality theory is one of the important economic theoretical foundations for the development of green mining economy. Samuelson believes that external economic effects occur when producing or consuming incidental costs or benefits to other people. This effect is not reflected in currency or market transactions. This incidental cost is called externality (also known as external effects or spill over effects) that refers to the actions of people's economic activities that affect other people without taking into account the market transaction costs and prices.
Analysis of Mining Operating Target: The target of mining operations is mainly mineral resources. In the process of the exploitation and utilization of mineral resources, the discharged pollutants mainly include solid, liquid and gas wastes, which are referred to as “three wastes”, such as coal gangue, wastewater, and coal bed methane. Companies are profit-making business units and determines production if the marginal cost equals the marginal revenue. At this time, the equilibrium of the company is the corresponding equilibrium output and the equilibrium price. Due to negative externalities, the equilibrium point is a market equilibrium that does not consider social pollution losses when it is efficient for the production of enterprises but inefficient for the society. If social pollution losses are considered, the optimal balance point for society should be the corresponding equilibrium output and equilibrium price. Therefore, the existence of externalities leads to social costs, producer costs, and pollution costs. Fig. 1 shows the negative externalities of the mining industry, and Fig. 2 displays the optimal emission levels during the mining production.
Fig. 1: Diagram of negative externality analysis of mining industry.
Fig. 1: Diagram of negative externality analysis of mining industry.
Fig. 2: Schematic diagram of optimal emission level in mining production process.
Analysis of Corporate Behaviours in Green Mining Development:
Inter-enterprise game analysis: Coal is a non-renewable resource, and its recoverable reserves in China are relatively limited. To main the sustainability, both the time and space for development and utilization should be considered. In terms of space, it is to solve the problem of sustainable use within the generation, mainly referring to the exploitation of resources in one region doing no harm to the use of resources in other areas. Enterprises are profit-oriented business units. When considering the economic benefits, each market entity starts from its own, and does not pay attention to the impact of its own behaviour on other entities. The lack of the system concept leads to the "Tragedy of Public Land Use" in coal mining in China. In terms of time, it is to solve the issue of sustainable intergenerational use. It mainly refers to that the exploitation and utilization of coal resources by contemporary people does not harm the use of this resource by future generations. Therefore, the inter-enterprise game during the coal mining development and utilization can be based to analyse the root motivation for corporate green mining development. The inter-enterprise game matrix is shown in Fig. 3.
Fig. 3: Schematic diagram of game matrix between coal enterprises.
Enterprise-government game analysis: Another major content of developing green mining and building green mines is to reduce the environmental destruction and pollution reduction, which relies mainly on government policies. The treatment of environmental pollution and the implementation of green mining demands a large amount of capital and energy, which will cause rapid increase in the cost of business operations and losses for enterprises in the short term, and will not necessarily bring profits to the company in the long run. The shortage of funds, inexperience, and shortage of green technologies to minimize the remaining materials may all hinder the efforts of companies to build green mines, develop green mining, and achieve green mining economic growth plans. Therefore, only with the mandatory constraints of government policies, coal companies are forced to consider the development of green mining economy. Generally speaking, in the process of realizing the transformation from the traditional linear economy to the green economy, the government bears the corresponding public responsibility and social obligations. In essence, the implementation process of environmental treatment policies is the process of transmitting or imposing government social responsibilities and value standards to enterprises. However, pursuing profit maximization is a rational behaviour of enterprises, which leads to the conflicts between companies and governments in the responsibility and value standards, also a conflict between individual rationality and collective rationality. From another perspective, this poses a test to the government in its governing ability and management level.
MATERIALS AND METHODS
Western Theoretical Basis: In this paper, the externality theory was used for the analysis. The externality theory was neglected in the initial stage. However, in the process of industrialization and urbanization with increasing environ-mental pollution and other problems, people gradually paid attention to the externality theory and tried to solve these problems by this theory. Western mainstream economics believes that the existence of externalities leads to market failures in the resources and the environment. Therefore, the externality theory is one of the important economic theoreti-cal foundations for the development of green mining econo-my. Samuelson believes that external economic effects occur when producing or consuming incidental costs or benefits to other people. This effect is not reflected in currency or market transactions. This incidental cost is called externality (also known as external effects or spill over effects) that refers to the actions of people’s economic activities that affect other people without taking into account the market transaction costs and prices.
Analysis of Mining Operating Target: The target of min-ing operations is mainly mineral resources. In the process of the exploitation and utilization of mineral resources, the discharged pollutants mainly include solid, liquid and gas wastes, which are referred to as “three wastes”, such as coal gangue, wastewater, and coal bed methane. Companies are profit-making business units and determines production if the marginal cost equals the marginal revenue. At this time, the equilibrium of the company is the corresponding equilibrium output and the equilibrium price. Due to negative externali-ties, the equilibrium point is a market equilibrium that does not consider social pollution losses when it is efficient for the production of enterprises but inefficient for the society. If social pollution losses are considered, the optimal balance point for society should be the corresponding equilibrium output and equilibrium price. Therefore, the existence of externalities leads to social costs, producer costs, and pol-lution costs. Fig. 1 shows the negative externalities of the mining industry, and Fig. 2 displays the optimal emission levels during the mining production.
Fig. 2: Schematic diagram of optimal emission level in mining production process.
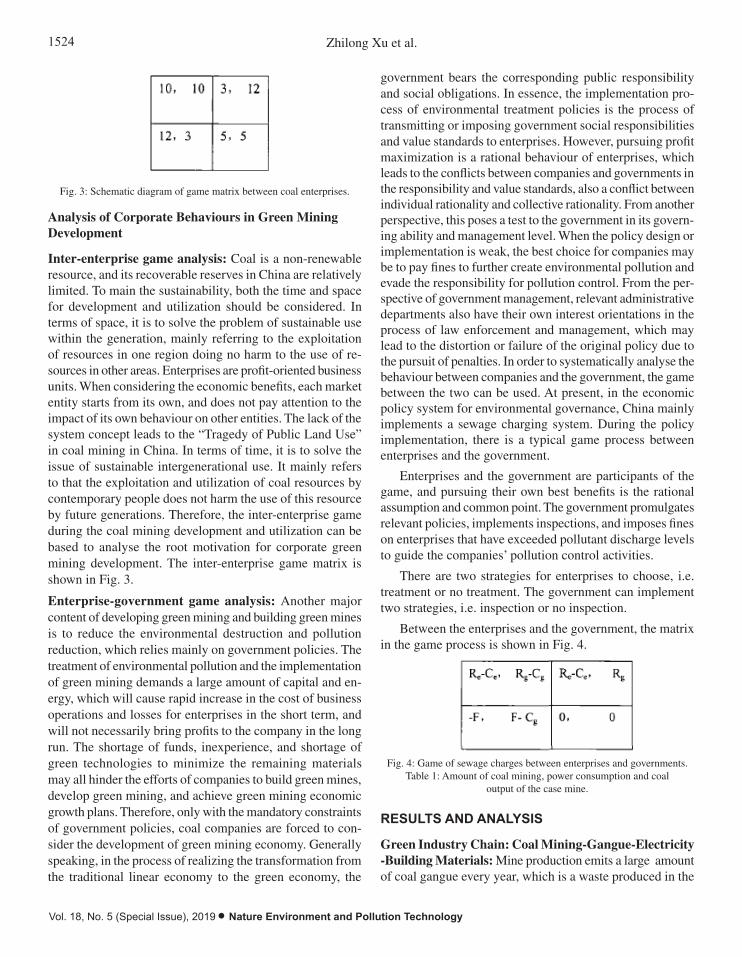
1524 Zhilong Xu et al.
Vol. 18, No. 5 (Special Issue), 2019 • Nature Environment and Pollution Technology
Fig. 1: Diagram of negative externality analysis of mining industry.
Fig. 2: Schematic diagram of optimal emission level in mining production process.
Analysis of Corporate Behaviours in Green Mining Development:
Inter-enterprise game analysis: Coal is a non-renewable resource, and its recoverable reserves in China are relatively limited. To main the sustainability, both the time and space for development and utilization should be considered. In terms of space, it is to solve the problem of sustainable use within the generation, mainly referring to the exploitation of resources in one region doing no harm to the use of resources in other areas. Enterprises are profit-oriented business units. When considering the economic benefits, each market entity starts from its own, and does not pay attention to the impact of its own behaviour on other entities. The lack of the system concept leads to the "Tragedy of Public Land Use" in coal mining in China. In terms of time, it is to solve the issue of sustainable intergenerational use. It mainly refers to that the exploitation and utilization of coal resources by contemporary people does not harm the use of this resource by future generations. Therefore, the inter-enterprise game during the coal mining development and utilization can be based to analyse the root motivation for corporate green mining development. The inter-enterprise game matrix is shown in Fig. 3.
Fig. 3: Schematic diagram of game matrix between coal enterprises.
Enterprise-government game analysis: Another major content of developing green mining and building green mines is to reduce the environmental destruction and pollution reduction, which relies mainly on government policies. The treatment of environmental pollution and the implementation of green mining demands a large amount of capital and energy, which will cause rapid increase in the cost of business operations and losses for enterprises in the short term, and will not necessarily bring profits to the company in the long run. The shortage of funds, inexperience, and shortage of green technologies to minimize the remaining materials may all hinder the efforts of companies to build green mines, develop green mining, and achieve green mining economic growth plans. Therefore, only with the mandatory constraints of government policies, coal companies are forced to consider the development of green mining economy. Generally speaking, in the process of realizing the transformation from the traditional linear economy to the green economy, the government bears the corresponding public responsibility and social obligations. In essence, the implementation process of environmental treatment policies is the process of transmitting or imposing government social responsibilities and value standards to enterprises. However, pursuing profit maximization is a rational behaviour of enterprises, which leads to the conflicts between companies and governments in the responsibility and value standards, also a conflict between individual rationality and collective rationality. From another perspective, this poses a test to the government in its governing ability and management level.
Fig. 3: Schematic diagram of game matrix between coal enterprises.
Analysis of Corporate Behaviours in Green Mining Development
Inter-enterprise game analysis: Coal is a non-renewable resource, and its recoverable reserves in China are relatively limited. To main the sustainability, both the time and space for development and utilization should be considered. In terms of space, it is to solve the problem of sustainable use within the generation, mainly referring to the exploitation of resources in one region doing no harm to the use of re-sources in other areas. Enterprises are profit-oriented business units. When considering the economic benefits, each market entity starts from its own, and does not pay attention to the impact of its own behaviour on other entities. The lack of the system concept leads to the “Tragedy of Public Land Use” in coal mining in China. In terms of time, it is to solve the issue of sustainable intergenerational use. It mainly refers to that the exploitation and utilization of coal resources by contemporary people does not harm the use of this resource by future generations. Therefore, the inter-enterprise game during the coal mining development and utilization can be based to analyse the root motivation for corporate green mining development. The inter-enterprise game matrix is shown in Fig. 3.
Enterprise-government game analysis: Another major content of developing green mining and building green mines is to reduce the environmental destruction and pollution reduction, which relies mainly on government policies. The treatment of environmental pollution and the implementation of green mining demands a large amount of capital and en-ergy, which will cause rapid increase in the cost of business operations and losses for enterprises in the short term, and will not necessarily bring profits to the company in the long run. The shortage of funds, inexperience, and shortage of green technologies to minimize the remaining materials may all hinder the efforts of companies to build green mines, develop green mining, and achieve green mining economic growth plans. Therefore, only with the mandatory constraints of government policies, coal companies are forced to con-sider the development of green mining economy. Generally speaking, in the process of realizing the transformation from the traditional linear economy to the green economy, the
government bears the corresponding public responsibility and social obligations. In essence, the implementation pro-cess of environmental treatment policies is the process of transmitting or imposing government social responsibilities and value standards to enterprises. However, pursuing profit maximization is a rational behaviour of enterprises, which leads to the conflicts between companies and governments in the responsibility and value standards, also a conflict between individual rationality and collective rationality. From another perspective, this poses a test to the government in its govern-ing ability and management level. When the policy design or implementation is weak, the best choice for companies may be to pay fines to further create environmental pollution and evade the responsibility for pollution control. From the per-spective of government management, relevant administrative departments also have their own interest orientations in the process of law enforcement and management, which may lead to the distortion or failure of the original policy due to the pursuit of penalties. In order to systematically analyse the behaviour between companies and the government, the game between the two can be used. At present, in the economic policy system for environmental governance, China mainly implements a sewage charging system. During the policy implementation, there is a typical game process between enterprises and the government.
Enterprises and the government are participants of the game, and pursuing their own best benefits is the rational assumption and common point. The government promulgates relevant policies, implements inspections, and imposes fines on enterprises that have exceeded pollutant discharge levels to guide the companies’ pollution control activities.
There are two strategies for enterprises to choose, i.e. treatment or no treatment. The government can implement two strategies, i.e. inspection or no inspection.
Between the enterprises and the government, the matrix in the game process is shown in Fig. 4.
When the policy design or implementation is weak, the best choice for companies may be to pay fines to further create environmental pollution and evade the responsibility for pollution control. From the perspective of government management, relevant administrative departments also have their own interest orientations in the process of law enforcement and management, which may lead to the distortion or failure of the original policy due to the pursuit of penalties. In order to systematically analyse the behaviour between companies and the government, the game between the two can be used. At present, in the economic policy system for environmental governance, China mainly implements a sewage charging system. During the policy implementation, there is a typical game process between enterprises and the government.
Enterprises and the government are participants of the game, and pursuing their own best benefits is the rational assumption and common point. The government promulgates relevant policies, implements inspections, and imposes fines on enterprises that have exceeded pollutant discharge levels to guide the companies’ pollution control activities.
There are two strategies for enterprises to choose: treatment or no treatment.
The government can implement two strategies: inspection or no inspection.
Between the enterprises and the government, the matrix in the game process is shown in Fig. 4.
Fig. 4: Game of sewage charges between enterprises and governments.
RESULTS AND ANALYSIS
Green Industry Chain: Coal Mining-Gangue-Electricity-Building Materials: Mine production emits a large amount of coal gangue every year, which is a waste produced in the coal mining, washing and adding, mainly composed of inorganic and organic matters. The piled-up gangue hill is susceptible to landslides, spontaneous combustion, and the release of toxic gases. Occupying a large land area, it will also pollute the surrounding soil and groundwater under the effect of leaching. Therefore, comprehensive development and utilization of coal gangue must be carried out.
Green Industry Chain: Coal Mining-Gangue-Electricity: For a variety of reasons, the large amount of heat generated during the mining production process is lost in the form of residual heat, which is a great waste of energy. At the same time, the boiler room that was rebuilt or newly built to meet the needs of the ground production and life has consumed a lot of coal resources. Through the technical transformation of the production equipment of the coal gangue power plant, the capacity of the boiler has been increased and the heating pipelines have been laid, which enables centralized heating for the majority of the entire mining area and reduces waste heat emissions. At present, a wide range of the mining areas, office buildings, industrial squares and other places are receiving heating from the waste heat of the coal gangue power plant. Also, the waste heat can be used in water boiling, with the steam supply of more than 10,000 tons. At the same time, the coal mine has also cancelled the original coal-fired boilers to eliminate exhaust gas emissions from coal combustion, annually saving huge coal resources. If taken various costs such as utilities and labour costs into consideration, the implementation of the green industry chain can save up to 10,000 RMB. Next, the mine will make full use of the heat source of the power plant, and gradually expand the heating area. Table 1 is the amount of coal mining, power consumption and coal output of the case mine. And Table 2 is a statistical table of the amount of solid waste produced and processed in the case mine.
Table 1: Amount of coal mining, power consumption and coal output of the case mine.
Time Coal mining Power consumption The yield of coals 2005 281.69 6183.08 14.10 2006 280.00 6437.68 14.00
Fig. 4: Game of sewage charges between enterprises and governments.Table 1: Amount of coal mining, power consumption and coal
output of the case mine.
RESULTS AND ANALYSIS
Green Industry Chain: Coal Mining-Gangue-Electricity -Building Materials: Mine production emits a large amount of coal gangue every year, which is a waste produced in the
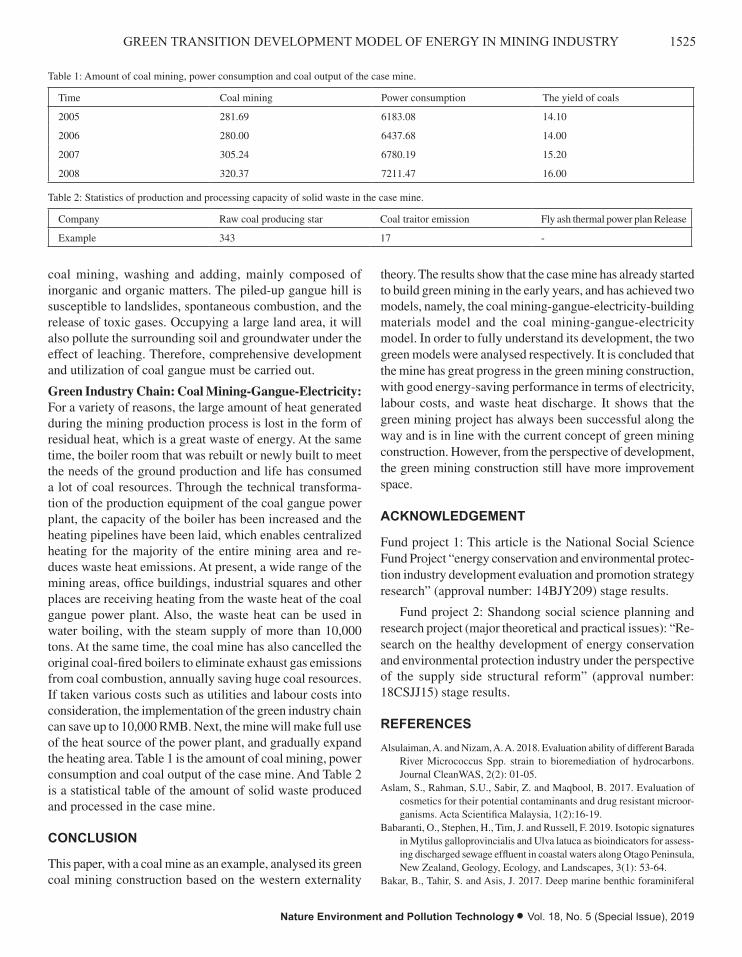
1525GREEN TRANSITION DEVELOPMENT MODEL OF ENERGY IN MINING INDUSTRY
Nature Environment and Pollution Technology • Vol. 18, No. 5 (Special Issue), 2019
coal mining, washing and adding, mainly composed of inorganic and organic matters. The piled-up gangue hill is susceptible to landslides, spontaneous combustion, and the release of toxic gases. Occupying a large land area, it will also pollute the surrounding soil and groundwater under the effect of leaching. Therefore, comprehensive development and utilization of coal gangue must be carried out.
Green Industry Chain: Coal Mining-Gangue-Electricity: For a variety of reasons, the large amount of heat generated during the mining production process is lost in the form of residual heat, which is a great waste of energy. At the same time, the boiler room that was rebuilt or newly built to meet the needs of the ground production and life has consumed a lot of coal resources. Through the technical transforma-tion of the production equipment of the coal gangue power plant, the capacity of the boiler has been increased and the heating pipelines have been laid, which enables centralized heating for the majority of the entire mining area and re-duces waste heat emissions. At present, a wide range of the mining areas, office buildings, industrial squares and other places are receiving heating from the waste heat of the coal gangue power plant. Also, the waste heat can be used in water boiling, with the steam supply of more than 10,000 tons. At the same time, the coal mine has also cancelled the original coal-fired boilers to eliminate exhaust gas emissions from coal combustion, annually saving huge coal resources. If taken various costs such as utilities and labour costs into consideration, the implementation of the green industry chain can save up to 10,000 RMB. Next, the mine will make full use of the heat source of the power plant, and gradually expand the heating area. Table 1 is the amount of coal mining, power consumption and coal output of the case mine. And Table 2 is a statistical table of the amount of solid waste produced and processed in the case mine.
CONCLUSION
This paper, with a coal mine as an example, analysed its green coal mining construction based on the western externality
theory. The results show that the case mine has already started to build green mining in the early years, and has achieved two models, namely, the coal mining-gangue-electricity-building materials model and the coal mining-gangue-electricity model. In order to fully understand its development, the two green models were analysed respectively. It is concluded that the mine has great progress in the green mining construction, with good energy-saving performance in terms of electricity, labour costs, and waste heat discharge. It shows that the green mining project has always been successful along the way and is in line with the current concept of green mining construction. However, from the perspective of development, the green mining construction still have more improvement space.
ACKNOWLEDGEMENT
Fund project 1: This article is the National Social Science Fund Project “energy conservation and environmental protec-tion industry development evaluation and promotion strategy research” (approval number: 14BJY209) stage results.
Fund project 2: Shandong social science planning and research project (major theoretical and practical issues): “Re-search on the healthy development of energy conservation and environmental protection industry under the perspective of the supply side structural reform” (approval number: 18CSJJ15) stage results.
REFERENCES
Alsulaiman, A. and Nizam, A. A. 2018. Evaluation ability of different Barada River Micrococcus Spp. strain to bioremediation of hydrocarbons. Journal CleanWAS, 2(2): 01-05.
Aslam, S., Rahman, S.U., Sabir, Z. and Maqbool, B. 2017. Evaluation of cosmetics for their potential contaminants and drug resistant microor-ganisms. Acta Scientifica Malaysia, 1(2):16-19.
Babaranti, O., Stephen, H., Tim, J. and Russell, F. 2019. Isotopic signatures in Mytilus galloprovincialis and Ulva latuca as bioindicators for assess-ing discharged sewage effluent in coastal waters along Otago Peninsula, New Zealand, Geology, Ecology, and Landscapes, 3(1): 53-64.
Bakar, B., Tahir, S. and Asis, J. 2017. Deep marine benthic foraminiferal
Table 1: Amount of coal mining, power consumption and coal output of the case mine.
Time Coal mining Power consumption The yield of coals
2005 281.69 6183.08 14.10
2006 280.00 6437.68 14.00
2007 305.24 6780.19 15.20
2008 320.37 7211.47 16.00
Company Raw coal producing star Coal traitor emission Fly ash thermal power plan Release
Example 343 17 -
Table 2: Statistics of production and processing capacity of solid waste in the case mine.

1526 Zhilong Xu et al.
Vol. 18, No. 5 (Special Issue), 2019 • Nature Environment and Pollution Technology
from Temburong formation in Labuan Island. Earth Science Malaysia, 1(2): 17-22.
Dai, H., Xie, X., Xie, Y., Liu, J. and Masui, T. 2016. Green growth: The economic impacts of large-scale renewable energy development in China. Appl. Energ., 162: 435-449.
Hanafiah, M. M. M., Ali, M. Y. A., Aziz, N. I. H. and John, A. 2017. Biogas production from agrowaste and effluents. Acta Chemica Malaysia, 1(1): 13-15.
Ismail, I., Husain, M. L. and Zakaria, R. 2017. Attenuation of waves from boat wakes in mixed mangrove forest of Rhizophora and Bruguiera species in Matang, Perak. Malaysian Journal Geosciences, 1(2): 29-32.
Jamil, F., Arshad, R. and Ali, M. A. 2018. Design, fabrication and evalua-tion of rotary hot-air dryer for the value addition of fruit waste. Earth Sciences Pakistan, 2(2): 07-11.
Khan, A., Fiaz, M., Khan, R.A., Khan, J.B., Khan, F.U. and Wahab, Z.U. 2018. Antimicrobial efficacy of Tamarix Dioca (L.) leaves and flowers. Science Heritage Journal, 2(1): 01-03.
Kumar, R. 2018. Comparison of instruction scheduling and register alloca-tion for Mips and Hpl -Pd architecture for exploitation of instruction level parallelism. Engineering Heritage Journal, 2(2): 04-08.
Kusi-Sarpong, S., Sarkis, J. and Wang, X. 2016. Assessing green supply chain practices in the Ghanaian mining industry: A framework and evaluation. Int. J. Prod. Econ., 181: 325-341.
Musa, H. and Chinniah, M. 2016. Malaysian SMEs development: Future and challenges on going green. Procedia. Soc. Behav. Sci., 224: 254-262.
Omara Shahestan, M. J. and Omara Shastani, S. 2017. Evaluating environ-mental considerations with checklist and delphi methods, case study: Suran city, Iran. Environment Ecosystem Science, 1(2): 01-04.
Ouoba, Y. 2017. Economic sustainability of the gold mining industry in Burkina Faso. Resources Policy, 51: 194-203.
Sedaghathoor, S. and Shahrajil, H. 2018. Unexpected rooted in shoot-tip
cuttings of ponytail palm (Beaucarnea Recurvata). Malaysian Journal of Sustainable Agriculture, 2(2): 24.
Shen, L., Muduli, K. and Barve, A. 2015. Developing a sustainable devel-opment framework in the context of mining industries: AHP approach. Resources Policy, 46: 15-26.
Sivakumar, R., Kannan, D. and Murugesan, P. 2015. Green vendor evalua-tion and selection using AHP and Taguchi loss functions in production outsourcing in mining industry. Resources Policy, 46: 64-75.
Sultana, T., Rahman, S., Naher, N., Md. Masum, R., Ahmed, A. H. A. and Islam, R. 2018. Performance of fruit vegetables in summer under mahagony based agroforestry systems. Malaysian Journal of Halal Research, 1(2): 08-14.
Usman, M., Khalid, M. B., Yasin, H., Nasir, A. and Ch Arslan. 2018. Impact of industrial effluents on ground water quality- A case study of Gujran-wala, Pakistan. Pakistan Journal of Geology, 2(1): 18-20.
Xu, Y., Zhang, X. and Zhang, H. 2016. Research on the e-commerce platform performance and green supply chain based on data mining and SVM. International Journal of Database Theory and Application, 9(12): 141-150.
Yew, L.K. and Abd Rahim, I. 2017. Prediction of rock mass properties, tunnel stability and support pressure by geological strength index (GSI) in crocker formation: A Case Study. Geological Behavior, 1(2): 31-33.
Zada, A. and Ali, S. 2018. Stability analysis of periodic and almost-pe-riodic discrete switched linear system. Matrix Science Mathematic, 2(2): 01-06.
Zarepourfard, H., Aryafar, A. and Zia, H. 2017. The investigation of ground-water hydrochemistry of Khezri Plain, South Khorasan Province, Iran. Water Conservation and Management (WCM), 1(2):13-16.
Zhang, R., Cui, Y. and Dong, J. 2017. Study on coal mining and utilization model and elastic development in post-industry age. Int. J. Oil Gas Coal Engineering, 5(6): 139.

Mathematical Model for Determining the Economic Well Depth in Mine Lots
Ying MaAnhui University of Science & Technology, Anhui 232001, China
ABSTRACT
In order to better determine the economic depth of deep wells and improve the safety of exploitation in a mine lot, this paper introduces the integration of the fuzzy mathematical model with the cost analysis into the mining process. The economic exploitation depth in the mine lot is determined by substituting the model test, providing the clues to the study. The findings show that the production situation of the coal mine S at a mining depth of 780 meters has reached a reasonable critical limit in the economy, and the economic exploitation depth can hit upon 900~1000 m. It is thus clear that the increase of mining depth will improve the probability of occurrence of production accidents; the economic exploitation depth of the mine can reach 900~1000 meters, if the mining continues to extend downward, a heavy loss will be suffered.
INTRODUCTION
In response to the booming demand for energy resources, many countries have been depleted of shallow resources, and successively, they turn to deprive of deep resources. The deep resources of China’s coal reserves exceed 50% of the total. It is likely attributed to the strong and stable IT industry, in that more and more mine lots in the country have accessed to deep reserves. Some scholars stated that the domestic mining depth has not reached the limits, and in order to improve the utilization of mine resources, there is a need to study the economic exploitation depth of deep wells in mine lots.
In this paper, we take the deep well of the mine S in Xin-han mine lot as a study case. First, the mining technology and the basic modelling are analysed. The integration between the fuzzy mathematical and the cost analysis models is used to analyse the calamity cost and reasonable mining depth, as well as the applications of the model.
PAST STUDIES
Mine dynamic disasters are the result of the combined ac-tion of crustal movement driven by power in the earth and mining disturbance. They are the dynamic failure process of mechanical deformation system composed of coal and rock mass under external disturbance. All kinds of mine dynamic disasters have a unified power source-elastic energy accumulated in the process of crustal movement. There is a unified mechanical mechanism and characteristics. In the mid-1960s, Hodot of the former Soviet Union and Cook
of South Africa put forward the theory of rock burst and prominent energy, respectively. Petuhov of the former Soviet Union pointed out that coal seams with both rock burst and outburst danger are very common, so it is necessary to study the unified theory of rock burst and outburst. On the basis of comprehensive research, the force-energy theory of rock burst and outburst was put forward. A research forwards the theory of instability of rock burst and outburst. It considered that rock burst and outburst were both dynamic instability process of coal (rock) deformation system under unstable equilibrium state disturbed by various factors. The energy criterion of instability was used as the unified criterion of rock burst and outburst (Agusto 2017, Abdel-Maksou & Abdel-Maksoud 2017). A recent study pointed out that there was a close correlation between mine tremor and gas outburst by analysing the co-seismic phenomena of coal and gas outburst and mine tremor, and verified the triggering effect of gas fluid on mine tremor, especially the important role of the special properties of supercritical fluid in the occurrence of mine tremor (Apostol 2017, Aldaihani & Alenezi 2017, Bata et al. 2017, Chidumayo 2018). From the characteristics and laws of mine dynamic disasters, they are all local failure of coal and rock mass; the failure process is very rapid; they are brittle failure; and they are all in high stress areas. From the view of prevention measures of mine dynamic disasters, drilling cuttings method and sound pulse and micro seismic method of testing coal and rock damage are used to forecast in production; mining methods to avoid high stress concen-tration are adopted in the case of rock burst and outburst; and mining protective layer is taken as regional prevention measures. Local preventive measures such as water injection,
Nat. Env. & Poll. Tech.Website: www.neptjournal.com
Received: 02-08-2019Accepted: 23-10-2019
Key Words:Mathematical model Mine lots Economic well depth
2019pp. 1527-1533 Vol. 18
p-ISSN: 0972-6268 No. 5 (Special Issue)
Nature Environment and Pollution Technology An International Quarterly Scientific Journal
Original Research Paper
e-ISSN: 2395-3454
Open Access

1528 Ying Ma
Vol. 18, No. 5 (Special Issue), 2019 • Nature Environment and Pollution Technology
borehole grooving and pressure relief blasting are adopted, and vibration blasting is used to induce slight rock burst or outburst to prevent the occurrence of high-intensity rock burst and outburst. Therefore, it is of great significance to establish a unified prediction theory for mine dynamic disasters.
Theoretical research and production practice show that mine dynamic disasters should be the result of interaction of two aspects, i.e. natural geological dynamic state of coal (rock) body and mining engineering activities. The uneven distribution of mine dynamic disasters in time and space and the difference of their apparent intensity depend on the natu-ral geological dynamic state of mine. The geological dynamic state affects the dynamic disasters of mines by acting on a variety of factors. A research on some outburst mining areas in China showed that coal (rock) and gas outbursts mostly occurred in mining areas with the characteristics of geo-dynamic stress field. Higher horizontal stress often existed in the surrounding rock of outburst coal seam. The greater the horizontal stress was, the more serious the outburst was (Boulanger & Hill 2017, Hejazi et al. 2017, Hussin et al. 2017, Ilyas et al. 2018). In addition, many scholars and engi-neering technicians analysed the influencing factors of mine dynamic disasters under the action of geological dynamic state. A study described in detail the conditions of coal and gas outbursts, including geological structures, folds, igneous rock walls, changes in coal structure, coal permeability, and high-pressure gas, based on coal and gas outbursts seen in Northumberland and Durham, England (Gatapova & Kabov 2016, Khan et al. 2017, Khattak et al. 2018). Also mentioned the gas pressure, coal body structure, geological structure, coal porosity and other factors in the study of coal and gas outburst (Hockmann 2017, Nazihah et al. 2018, Nordin et al. 2018). Based on a study, summarized the factors as follows: rock stress, gas, physical and chemical properties of coal, macro-structure and self-weight of coal (Keshavarz et al. 2016, Nwankwoala et al. 2018). By 1974, the former Soviet Union had established the main geological factors determining the impact risk and the corresponding criteria: geological structural characteristics, mechanical properties of coal, rock composition of roof, strength and thickness, and coal seam burial depth.
Others argued that the comprehensive characteristics of rock and gas outburst meant that rock and gas outburst were not only regarded as physical phenomena of crops, but also as a complex multi-factor system. The multi-factors and their changes in time and space made it difficult to predict them (Montemor et al. 2017, Razzak et al. 2018). Besides, thought that the natural factors of outburst cause included gas desorption capacity, mechanical properties of coal seam and surrounding rock, geological structure, overburden
pressure and so on (Ng et al. 2017, Tao 2018). A recent study summarized the relationship between outburst and mining depth, coal thickness, dip angle of coal seam and structure through a large number of outburst examples, and put forward the natural factors affecting rock burst, including fold and fault, tectonic stress zone, mechanical properties of coal and rock mass, mining depth, structural characteristics of roof and floor strata, coal seam thickness and coal seam inclination change band (Polymenakos & Tweeton 2015, Yun et al. 2017).
There are three stages in the development of technology for preventing and controlling outburst and rock burst in the world. After the two stages of taking safety measures as the main and adopting prevention and control measures univer-sally, the technology has entered the stage of comprehensive prevention and control in the past 20 years. The prevention and control technology of coal mine can be categorized into four aspects: hazard area prediction, prevention and control measures, effect inspection and safety protection. Hazard area prediction is the premise of implementing comprehen-sive measures. Mining practice at home and abroad shows that the occurrence of mine dynamic disasters is regionally distributed. Therefore, regional prediction plays an important role in the prevention and control of mine dynamic disas-ters. Over the past decades, the commonly used methods of outburst risk prediction at home and abroad are single index method, geological statistics method and comprehensive index method. The prediction of rock burst at home and abroad is based on strength theory, energy theory, impact tendency theory, stiffness theory and instability theory. In recent years, geophysical methods and gas geology methods have been studied in China.
There are many factors affecting the occurrence of mine dynamic disasters, so it is difficult to meet the needs of pre-vention and control projects by using single factor index. A research used the geodynamic zoning method to evaluate the natural geodynamic condition of the mining area and predict the possibility of mine dynamic disasters (Wang et al. 2014, Pazand & Hezarkhani 2018). Liaoning University of Engineering and Technology cooperated well with Russia in Beipiao Mining Area. Geodynamic zoning method was introduced into China, and multi-factor pattern recognition probability prediction method for regional prediction was put forward.
In summary, the above research work mainly carries on the detailed analysis to each aspect influence factor of the mining area deep well in the actual development process, then uses the corresponding theory basis to carry on the re-lated factor research. According to the prevention measures of mine dynamic disasters, drilling cuttings method, sound
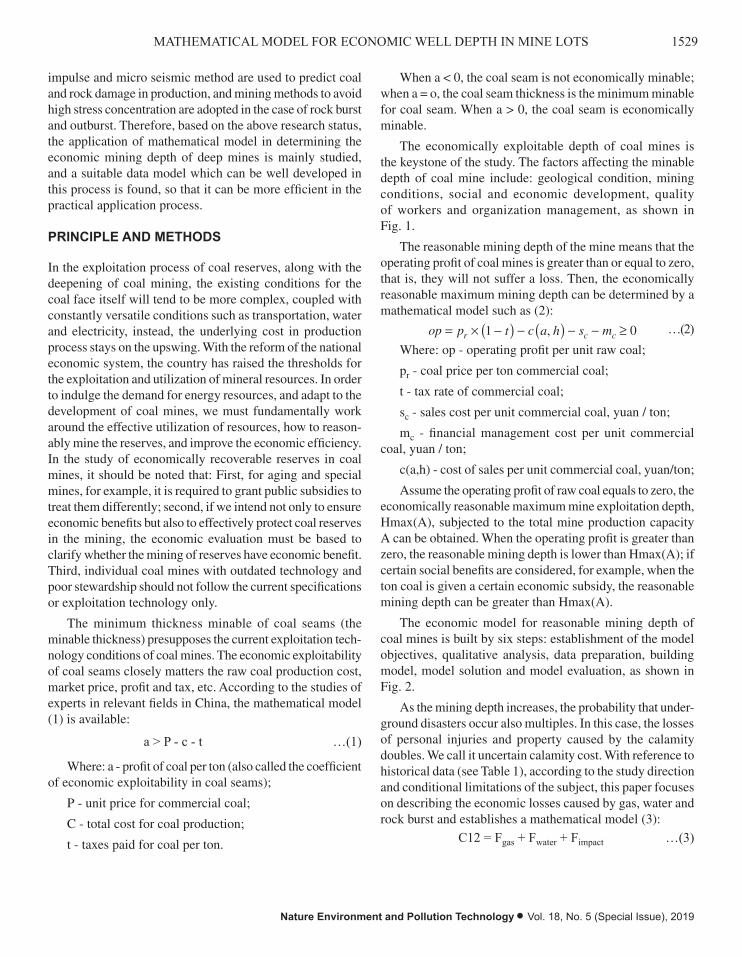
1529MATHEMATICAL MODEL FOR ECONOMIC WELL DEPTH IN MINE LOTS
Nature Environment and Pollution Technology • Vol. 18, No. 5 (Special Issue), 2019
impulse and micro seismic method are used to predict coal and rock damage in production, and mining methods to avoid high stress concentration are adopted in the case of rock burst and outburst. Therefore, based on the above research status, the application of mathematical model in determining the economic mining depth of deep mines is mainly studied, and a suitable data model which can be well developed in this process is found, so that it can be more efficient in the practical application process.
PRINCIPLE AND METHODS
In the exploitation process of coal reserves, along with the deepening of coal mining, the existing conditions for the coal face itself will tend to be more complex, coupled with constantly versatile conditions such as transportation, water and electricity, instead, the underlying cost in production process stays on the upswing. With the reform of the national economic system, the country has raised the thresholds for the exploitation and utilization of mineral resources. In order to indulge the demand for energy resources, and adapt to the development of coal mines, we must fundamentally work around the effective utilization of resources, how to reason-ably mine the reserves, and improve the economic efficiency. In the study of economically recoverable reserves in coal mines, it should be noted that: First, for aging and special mines, for example, it is required to grant public subsidies to treat them differently; second, if we intend not only to ensure economic benefits but also to effectively protect coal reserves in the mining, the economic evaluation must be based to clarify whether the mining of reserves have economic benefit. Third, individual coal mines with outdated technology and poor stewardship should not follow the current specifications or exploitation technology only.
The minimum thickness minable of coal seams (the minable thickness) presupposes the current exploitation tech-nology conditions of coal mines. The economic exploitability of coal seams closely matters the raw coal production cost, market price, profit and tax, etc. According to the studies of experts in relevant fields in China, the mathematical model (1) is available:
a > P - c - t …(1)
Where: a - profit of coal per ton (also called the coefficient of economic exploitability in coal seams);
P - unit price for commercial coal;
C - total cost for coal production;
t - taxes paid for coal per ton.
When a < 0, the coal seam is not economically minable; when a = o, the coal seam thickness is the minimum minable for coal seam. When a > 0, the coal seam is economically minable.
The economically exploitable depth of coal mines is the keystone of the study. The factors affecting the minable depth of coal mine include: geological condition, mining conditions, social and economic development, quality of workers and organization management, as shown in Fig. 1.
The reasonable mining depth of the mine means that the operating profit of coal mines is greater than or equal to zero, that is, they will not suffer a loss. Then, the economically reasonable maximum mining depth can be determined by a mathematical model such as (2):
op p t c a h s mr c c= ¥ -( ) - ( ) - - ≥1 0, …(2)Where: op - operating profit per unit raw coal;
pr - coal price per ton commercial coal;
t - tax rate of commercial coal;
sc - sales cost per unit commercial coal, yuan / ton;
mc - financial management cost per unit commercial coal, yuan / ton;
c(a,h) - cost of sales per unit commercial coal, yuan/ton;
Assume the operating profit of raw coal equals to zero, the economically reasonable maximum mine exploitation depth, Hmax(A), subjected to the total mine production capacity A can be obtained. When the operating profit is greater than zero, the reasonable mining depth is lower than Hmax(A); if certain social benefits are considered, for example, when the ton coal is given a certain economic subsidy, the reasonable mining depth can be greater than Hmax(A).
The economic model for reasonable mining depth of coal mines is built by six steps: establishment of the model objectives, qualitative analysis, data preparation, building model, model solution and model evaluation, as shown in Fig. 2.
As the mining depth increases, the probability that under-ground disasters occur also multiples. In this case, the losses of personal injuries and property caused by the calamity doubles. We call it uncertain calamity cost. With reference to historical data (see Table 1), according to the study direction and conditional limitations of the subject, this paper focuses on describing the economic losses caused by gas, water and rock burst and establishes a mathematical model (3):
C12 = Fgas + Fwater + Fimpact …(3)
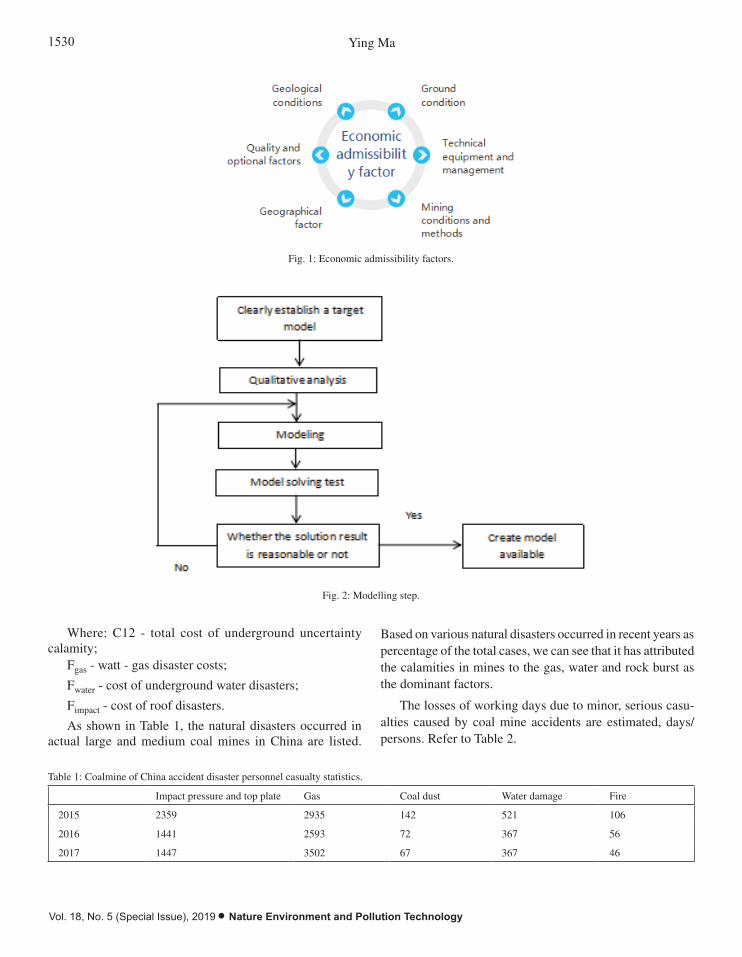
1530 Ying Ma
Vol. 18, No. 5 (Special Issue), 2019 • Nature Environment and Pollution Technology
When a<0, the coal seam is not economically minable; when a=o, the coal seam thickness is the minimum minable for coal seam. When a>0, the coal seam is economically minable.
The economically exploitable depth of coal mines is the keystone of the study. The factors affecting the minable depth of coal mine include: geological condition, mining conditions, social and economic development, quality of workers and organization management, as shown in Fig. 1.
Fig. 1: Economic admissibility factors.
The reasonable mining depth of the mine means that the operating profit of coal mines is greater than or equal to zero, that is, they will not suffer a loss. Then, the economically reasonable maximum mining depth can be determined by a mathematical model such as (2):
…(2)
Where: op - operating profit per unit raw coal;
pr - coal price per ton commercial coal;
t - tax rate of commercial coal;
sc - sales cost per unit commercial coal, yuan / ton;
mc - financial management cost per unit commercial coal, yuan / ton;
c(a,h) - cost of sales per unit commercial coal, yuan/ton;
Assume the operating profit of raw coal equals to zero, the economically reasonable maximum mine exploitation depth, Hmax(A), subjected to the total mine production capacity A can be obtained. When the operating profit is greater than zero, the reasonable mining depth is lower than Hmax(A); if certain social benefits are considered, for example, when the ton coal is given a certain economic subsidy, the reasonable mining depth can be greater than Hmax(A).
The economic model for reasonable mining depth of coal mines is built by six steps: establishment of the model objectives, qualitative analysis, data preparation, building model, model solution and model evaluation, as shown in Fig. 2.
0,1 ccr mshactpop
Fig. 1: Economic admissibility factors.
Fig. 2: Modelling step.
As the mining depth increases, the probability that underground disasters occur also multiples. In this case, the losses of personal injuries and property caused by the calamity doubles. We call it uncertain calamity cost. With reference to historical data (see Table 1), according to the study direction and conditional limitations of the subject, this paper focuses on describing the economic losses caused by gas, water and rock burst and establishes a mathematical model (3):
C12= Fgas + Fwater + Fimpact …(3)
Where: C12 - total cost of underground uncertainty calamity;
Fgas - watt - gas disaster costs;
Fwater - cost of underground water disasters;
Fimpact - cost of roof disasters.
As shown in Table 1, the natural disasters occurred in actual large and medium coal mines in China are listed. Based on various natural disasters occurred in recent years as percentage of the total cases, we can see that it has attributed the calamities in mines to the gas, water and rock burst as the dominant factors.
Table 1: Coalmine of China accident disaster personnel casualty statistics.
Impact pressure and top plate Gas Coal dust Water damage Fire 2015 2359 2935 142 521 106 2016 1441 2593 72 367 56 2017 1447 3502 67 367 46
The losses of working days due to minor, serious casualties caused by coal mine accidents are estimated, days/persons. Refer to Table 2.
Table 2: Coal casualties loss workday.
Casualty situation Lost working day Economic losses Minor injury 100 0.333
Fig. 2: Modelling step.
Where: C12 - total cost of underground uncertainty calamity;
Fgas - watt - gas disaster costs;
Fwater - cost of underground water disasters;
Fimpact - cost of roof disasters.
As shown in Table 1, the natural disasters occurred in actual large and medium coal mines in China are listed.
Based on various natural disasters occurred in recent years as percentage of the total cases, we can see that it has attributed the calamities in mines to the gas, water and rock burst as the dominant factors.
The losses of working days due to minor, serious casu-alties caused by coal mine accidents are estimated, days/persons. Refer to Table 2.
Table 1: Coalmine of China accident disaster personnel casualty statistics.
Impact pressure and top plate Gas Coal dust Water damage Fire
2015 2359 2935 142 521 106
2016 1441 2593 72 367 56
2017 1447 3502 67 367 46
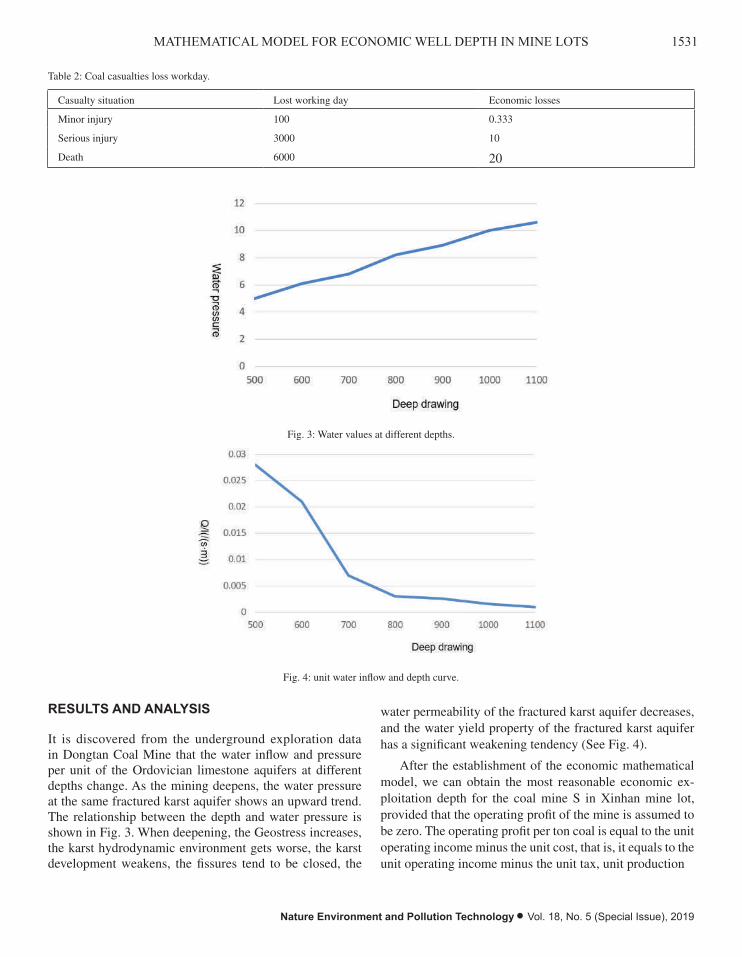
1531MATHEMATICAL MODEL FOR ECONOMIC WELL DEPTH IN MINE LOTS
Nature Environment and Pollution Technology • Vol. 18, No. 5 (Special Issue), 2019
Table 2: Coal casualties loss workday.
Casualty situation Lost working day Economic losses
Minor injury 100 0.333
Serious injury 3000 10
Death 6000 20
Serious injury 3000 10 Death 6000 20
RESULTS AND ANALYSIS
It is discovered from the underground exploration data in Dongtan Coal Mine that the water inflow and pressure per unit of the Ordovician limestone aquifers at different depths change. As the mining deepens, the water pressure at the same fractured karst aquifer shows an upward trend. The relationship between the depth and water pressure is shown in Fig. 3. When deepening, the Geostress increases, the karst hydrodynamic environment gets worse, the karst development weakens, the fissures tend to be closed, the water permeability of the fractured karst aquifer decreases, and the water yield property of the fractured karst aquifer has a significant weakening tendency (See Fig. 4).
Fig. 3: Water values at different depths.
Fig. 4: unit water inflow and depth curve.
After the establishment of the economic mathematical model, we can obtain the most reasonable economic exploitation depth for the coal mine S in Xinhan mine lot, provided that the operating profit of the mine is assumed to be zero. The operating profit per ton coal is equal to the unit operating income minus the unit cost, that is, it equals to the unit operating income minus the unit tax, unit production cost, unit sales expense and unit financial management expenses. Disaster costs are incurred when the probability of occurrence of calamities caused by mine gas, water, and rock burst is non-zero. The probabilities of occurrence of the three kinds of disasters matter the specific disaster level occurred underground in practices. Therefore, when calculating the probability cost, the actual coal yield, practical detection data and geological conditions of the mine should be considered to obtain it. In Fig. 5 below, the dotted line is the curve of the exploitation depth as a function of the profit per ton coal.
Fig. 3: Water values at different depths.
Fig. 4: unit water inflow and depth curve.
RESULTS AND ANALYSIS
It is discovered from the underground exploration data in Dongtan Coal Mine that the water inflow and pressure per unit of the Ordovician limestone aquifers at different depths change. As the mining deepens, the water pressure at the same fractured karst aquifer shows an upward trend. The relationship between the depth and water pressure is shown in Fig. 3. When deepening, the Geostress increases, the karst hydrodynamic environment gets worse, the karst development weakens, the fissures tend to be closed, the
water permeability of the fractured karst aquifer decreases, and the water yield property of the fractured karst aquifer has a significant weakening tendency (See Fig. 4).
After the establishment of the economic mathematical model, we can obtain the most reasonable economic ex-ploitation depth for the coal mine S in Xinhan mine lot, provided that the operating profit of the mine is assumed to be zero. The operating profit per ton coal is equal to the unit operating income minus the unit cost, that is, it equals to the unit operating income minus the unit tax, unit production
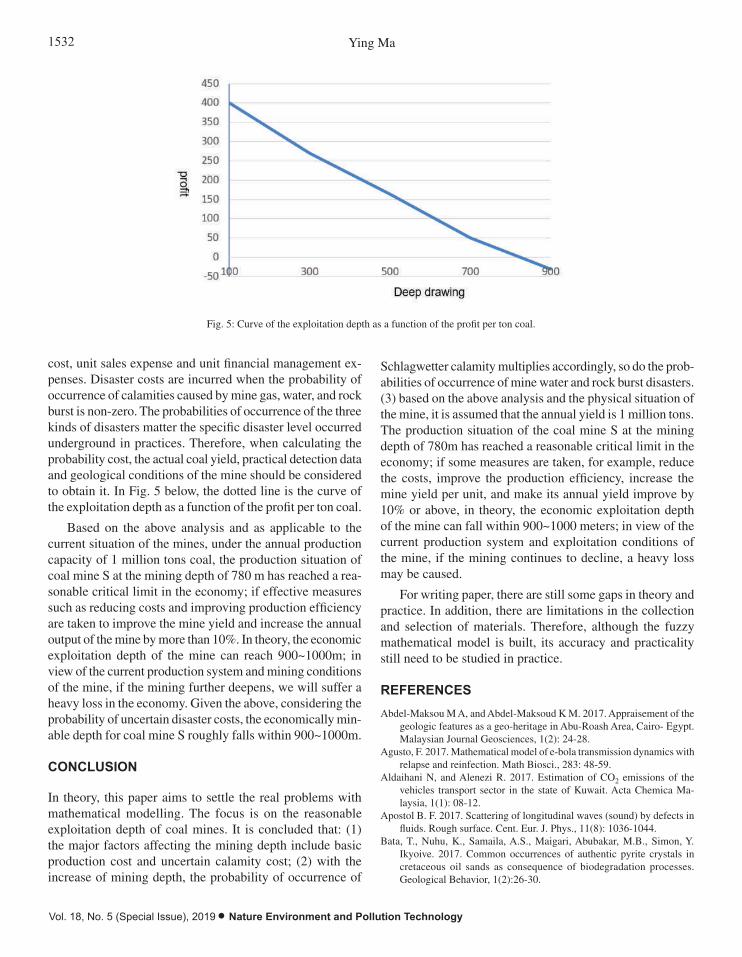
1532 Ying Ma
Vol. 18, No. 5 (Special Issue), 2019 • Nature Environment and Pollution Technology
Fig. 5: Curve of the exploitation depth as a function of the profit per ton coal.
Based on the above analysis and as applicable to the current situation of the mines, under the annual production capacity of 1 million tons coal, the production situation of coal mine S at the mining depth of 780 m has reached a reasonable critical limit in the economy; if effective measures such as reducing costs and improving production efficiency are taken to improve the mine yield and increase the annual output of the mine by more than 10%. In theory, the economic exploitation depth of the mine can reach 900~1000m; in view of the current production system and mining conditions of the mine, if the mining further deepens, we will suffer a heavy loss in the economy. Given the above, considering the probability of uncertain disaster costs, the economically minable depth for coal mine S roughly falls within 900~1000m.
CONCLUSION
In theory, this paper aims to settle the real problems with mathematical modelling. The focus is on the reasonable exploitation depth of coal mines. It is concluded that: (1) the major factors affecting the mining depth include basic production cost and uncertain calamity cost; (2) with the increase of mining depth, the probability of occurrence of Schlagwetter calamity multiplies accordingly, so do the probabilities of occurrence of mine water and rock burst disasters. (3) based on the above analysis and the physical situation of the mine, it is assumed that the annual yield is 1 million tons. The production situation of the coal mine S at the mining depth of 780m has reached a reasonable critical limit in the economy; if some measures are taken, for example, reduce the costs, improve the production efficiency, increase the mine yield per unit, and make its annual yield improve by 10% or above, in theory, the economic exploitation depth of the mine can fall within 900~1000 meters; in view of the current production system and exploitation conditions of the mine, if the mining continues to decline, a heavy loss may be caused.
For writing paper, there are still some gaps in theory and practice. In addition, there are limitations in the collection and selection of materials. Therefore, although the fuzzy mathematical model is built, its accuracy and practicality still need to be studied in practice.
REFERENCES
Abdel-Maksou M A, and Abdel-Maksoud K M. 2017. Appraisement of the geologic features as a geo-heritage in Abu-Roash Area, Cairo- Egypt. Malaysian Journal Geosciences, 1(2): 24-28.
Agusto, F. 2017. Mathematical model of e-bola transmission dynamics with relapse and reinfection. Math Biosci., 283: 48-59.
Aldaihani N, and Alenezi R. 2017. Estimation of CO2 emissions of the vehicles transport sector in the state of Kuwait. Acta Chemica Malaysia, 1(1): 08-12.
Apostol B. F. 2017. Scattering of longitudinal waves (sound) by defects in fluids. Rough surface. Cent. Eur. J. Phys., 11(8): 1036-1044.
Bata, T., Nuhu, K., Samaila, A.S., Maigari, Abubakar, M.B., Simon, Y. Ikyoive. 2017. Common occurrences of authentic pyrite crystals in cretaceous oil sands as consequence of biodegradation processes. Geological Behavior, 1(2):26-30.
Fig. 5: Curve of the exploitation depth as a function of the profit per ton coal.
cost, unit sales expense and unit financial management ex-penses. Disaster costs are incurred when the probability of occurrence of calamities caused by mine gas, water, and rock burst is non-zero. The probabilities of occurrence of the three kinds of disasters matter the specific disaster level occurred underground in practices. Therefore, when calculating the probability cost, the actual coal yield, practical detection data and geological conditions of the mine should be considered to obtain it. In Fig. 5 below, the dotted line is the curve of the exploitation depth as a function of the profit per ton coal.
Based on the above analysis and as applicable to the current situation of the mines, under the annual production capacity of 1 million tons coal, the production situation of coal mine S at the mining depth of 780 m has reached a rea-sonable critical limit in the economy; if effective measures such as reducing costs and improving production efficiency are taken to improve the mine yield and increase the annual output of the mine by more than 10%. In theory, the economic exploitation depth of the mine can reach 900~1000m; in view of the current production system and mining conditions of the mine, if the mining further deepens, we will suffer a heavy loss in the economy. Given the above, considering the probability of uncertain disaster costs, the economically min-able depth for coal mine S roughly falls within 900~1000m.
CONCLUSION
In theory, this paper aims to settle the real problems with mathematical modelling. The focus is on the reasonable exploitation depth of coal mines. It is concluded that: (1) the major factors affecting the mining depth include basic production cost and uncertain calamity cost; (2) with the increase of mining depth, the probability of occurrence of
Schlagwetter calamity multiplies accordingly, so do the prob-abilities of occurrence of mine water and rock burst disasters. (3) based on the above analysis and the physical situation of the mine, it is assumed that the annual yield is 1 million tons. The production situation of the coal mine S at the mining depth of 780m has reached a reasonable critical limit in the economy; if some measures are taken, for example, reduce the costs, improve the production efficiency, increase the mine yield per unit, and make its annual yield improve by 10% or above, in theory, the economic exploitation depth of the mine can fall within 900~1000 meters; in view of the current production system and exploitation conditions of the mine, if the mining continues to decline, a heavy loss may be caused.
For writing paper, there are still some gaps in theory and practice. In addition, there are limitations in the collection and selection of materials. Therefore, although the fuzzy mathematical model is built, its accuracy and practicality still need to be studied in practice.
REFERENCES
Abdel-Maksou M A, and Abdel-Maksoud K M. 2017. Appraisement of the geologic features as a geo-heritage in Abu-Roash Area, Cairo- Egypt. Malaysian Journal Geosciences, 1(2): 24-28.
Agusto, F. 2017. Mathematical model of e-bola transmission dynamics with relapse and reinfection. Math Biosci., 283: 48-59.
Aldaihani N, and Alenezi R. 2017. Estimation of CO2 emissions of the vehicles transport sector in the state of Kuwait. Acta Chemica Ma-laysia, 1(1): 08-12.
Apostol B. F. 2017. Scattering of longitudinal waves (sound) by defects in fluids. Rough surface. Cent. Eur. J. Phys., 11(8): 1036-1044.
Bata, T., Nuhu, K., Samaila, A.S., Maigari, Abubakar, M.B., Simon, Y. Ikyoive. 2017. Common occurrences of authentic pyrite crystals in cretaceous oil sands as consequence of biodegradation processes. Geological Behavior, 1(2):26-30.

1533MATHEMATICAL MODEL FOR ECONOMIC WELL DEPTH IN MINE LOTS
Nature Environment and Pollution Technology • Vol. 18, No. 5 (Special Issue), 2019
Boulanger, J. and Hill, M. 2017. Hypertension and stroke: 2005 Canadian hypertension educational program recommendations. Can. J. Neurol. Sci., 32(04): 403-408.
Chidumayo E. 2018. Seed scarification reduces seedling survival and tree growth and longevity in Senegalia Polyacantha at a site in central Zambia, Southern Africa. Malaysian Journal of Sustainable Agricul-ture, 2(2): 19-23.
Gatapova, E. and Kabov, O. 2016. Shear-driven flows of locally heated liquid films. Int. J. Heat Mass Tran., 51(19): 4797-4810.
Hejazi S M, Lotfi F, Fashandi H, and Alirezazadeh A. 2017. Serishm: an eco-friendly and biodegradable flame retardant for fabrics. Environment Ecosystem Science, 1(2): 05-08.
Hockmann, H. 2017. Heterogeneity in production structures and efficiency: an analysis of the Czech food processing industry. Pac. Econ. Rev., 22(4).
Hussin, H., Fauzi, N., Jamaluddin, T. A. and Arifin, M. H. 2017. Rock mass quality effected by lineament using rock mass rating (Rmr)-case study from former quarry site. Earth Science Malaysia, 1(2): 13-16.
Ilyas, F. M. Arif, Iftikhar, A., Sattar, A., Do Minh Cuong, Ilyas, M. and Parveen, A. 2018. Indigenous vesicular mycorrhizal fungi effect on maize under different textures. Earth Sciences Pakistan, 2(2): 12-15.
Keshavarz, M., Gharagheizi, F. and Pouretedal, H. 2016. Improved reliable approach to predict melting points of energetic compounds. Fluid Phase Equilibr., 308(1): 114-128.
Khan, I. U., Sajid, S., Javed, A., Sajid, S., Shah, S. U., Khan, S. N. and Ullah, K. 2017. Comparative diagnosis of typhoid fever by polymerase chain reaction and widal test in Southern Districts (Bannu, Lakki Marwat and D.I. Khan) of Khyber Pakhtunkhwa, Pakistan. Acta Scientifica Malaysia, 1(2):12-15.
Khattak, A. M., Younas, M., Ali Khan, G., Sameena Nadeem, M. U. R. and Safeer, M. 2018. P-Separation axioms in supra soft topological space. Matrix Science Mathematic, 2(2): 07-10.
Montemor, M., Snihirova, V., Taryba, M., Lamaka, S., Kartsonakis, A. and Balaskas, A.C. 2017. Evaluation of self-healing ability in protective
coatings modified with combinations of layered double hydroxides and cerium molibdate nanocontainers filled with corrosion inhibitors. Electrochim. Acta, 60(1): 31-40.
Nazihah, I., Zaini, M. S., Shahari, R., Che Amri, C. N. A. and Mohammad Tajuddin, N. 2018. Diversity and distribution of fern species in selected trail in Kuantan Pahang. Science Heritage Journal, 2(1): 04-09.
Ng, D., Lo., E.S. and Schober, R. 2017. Energy-efficient resource allocation in multiuser OFDM systems with wireless information and power transfer. Wireless Communications and Networking Conference, IEEE, 12: 3823-3828.
Nordin, N. F. H., Tg Mahassan, T. S. H. and Chowdhury, A. J. K. 2018. Bacterial population study in oil-contaminated and uncontaminated soils. Journal CleanWAS, 2(2): 06-09.
Nwankwoala, H.O. and Oborie, E. 2018. Geological and hydrogeological characterization of A hydrocarbon impacted site in the Niger Delta. Pakistan Journal of Geology, 2(1): 12-17.
Pazand, K. and Hezarkhani, A. 2018. Predictive Cu porphyry potential mapping using fuzzy modelling in Ahar–Arasbaran zone, Iran. Geology, Ecology, and Landscapes, 2(4): 229-239.
Polymenakos, L. and Tweeton, D. 2015. Re-evaluating a seismic travel time tomography survey at Kastas Tumulus (Amphipolis, Greece). J. Archaeol. Sci. Rep., 4: 434-446.
Razzak, M. A., Islam, M. A., Rahman, M. H., Sathi, M. A. and Md. Atikuz-zamman. 2018. Screening of lentil Germplasm against Stemphylium Blight by observing disease reaction in three different stages. Malaysian Journal of Halal Research, 1(2): 15-18.
Tao, S. 2018. Evaluation of technology innovation in Hubei Province. Engineering Heritage Journal, 2(2): 09-10.
Wang, Y., Yu, L., Wen, Q. and Liu, C. 2014. Improved multi-level associa-tion rule in mining algorithm based on a multidimensional data cube. International Conference on Consumer Electronics, Communications and Networks, IEEE, :355-358.
Yun, G., Williams, S. and Wenbin, D. 2017. Water management of the Me-kong River. Water Conservation and Management (WCM), 1(2):10-12.

Vol. 18, No. 5 (Special Issue), 2019 • Nature Environment and Pollution Technology
1534
Analysis of Deep Foundation Treatment of Soft Soil Under Strong Corrosion Conditions
Junzhao Gao*, Dongqi Tang* and Muhammad Aqeel Ashraf***Civil engineering institute of Xuchang College, Henan Province, Xuchang 461000, China**School of Environmental Studies, China University of Geosciences 430074 Wuhan, China
ABSTRACT
In the design and construction process of the foundation treatment of an example power plant, the content of chloride and sulphate ions in the groundwater in this area is tens to hundreds of times the content of other normal areas, which makes the corrosion damage more rapid. The residual strength of concrete after 8-20 years is only 5% to 10% of the original design strength, which will be a terrible consequence, meanwhile making it no longer possible to use concrete drilled cast-in-place piles for foundation treatment. For the dynamic compaction-soil replacement foundation treatment method, first, dynamic compaction is applied for the treatment of foundation, then the soil under the foundation with a thickness of 2m is excavated, and backfilled with graded crushed stones, layered rolling is conducted so as to ensure the compactness. With this method, the requirement for the quality of the bearing capacity of the foundation can be met, and the cost is economical and reasonable. The overall construction period is not too long, the destructive effect of the saline soil is avoided, and there is no need to worry about the corrosion effect of chloride ions and sulphate ions.
INTRODUCTION
With the development of society, the scale of modern architecture becomes larger, which has caused corresponding changes in the foundation, resulting in deep foundation construction technology. The deep foundation construction technology is different from the traditional foundation technology. It has high requirements for soil mass stress, but China’s geological environment is complex, and there are some geological environments with insufficient stress, such as soft soil environment with strong corrosion conditions. To ensure smooth implementation of the project, it is necessary to adopt the corresponding construction technology. This paper mainly analyses the deep foundation treatment method of soft soil with strong corrosion conditions by practical examples.
EARLIER STUDIES
With the increase of the depth and area of foundation pit engineering, the design method and construction technology are constantly updated and improved, which has formed many highlights of domestic foundation pit engineering construction projects in recent years and has produced good effects. Many kinds of retaining structures have been widely used. For instance, diaphragm wall, cement-soil mixing pile retaining, row pile retaining and SMW method, etc. occupy
the main position in the foundation pit retaining. In addition, many kinds of retaining structures have been combined into the overall supporting structure in some projects. There are new theories and methods for foundation pit design and construction technology and verified by the actual project. With the development of enclosure structure, various forms of support emerge as the time requires. New materials begin to be applied to support structure, and reinforced concrete system and steel support system begin to be used in practical projects.
A study carried on the mechanical analysis of the foun-dation pit supporting structure and the results showed that the anisotropy of soil would increase the displacement of retaining wall and the settlement around the foundation pit (Yang et al. 2013, Nwankwoala et al. 2018, Cho 2017). The field observation data of several foundation pits in cohesive soil and found that the horizontal displacement of the surface support structure was related to the uplift resistance coeffi-cient under the conventional construction conditions (Li & Zeng 2013, Kibria et al. 2018, Rawat & Singh 2018). Based on this discovery, some studies simplified the engineering experience by combining the finite element calculation and proposed a stability safety factor method used for estimating the maximum displacement of the ground behind the retain-ing structure and wall (Yang et al. 2016, Azeem et al. 2018, Nordin et al. 2018). Some scholars studied the stability of a foundation pit, which was located in a garbage filling
Nat. Env. & Poll. Tech.Website: www.neptjournal.com
Received: 17-08-2019Accepted: 05-10-2019
Key Words:Soft soil Strong corrosion Groundwater ChlorideSulphate
2019pp. 1535-1540 Vol. 18
p-ISSN: 0972-6268 No. 5 (Special Issue)
Nature Environment and Pollution Technology An International Quarterly Scientific Journal
Original Research Paper
e-ISSN: 2395-3454
Open Access
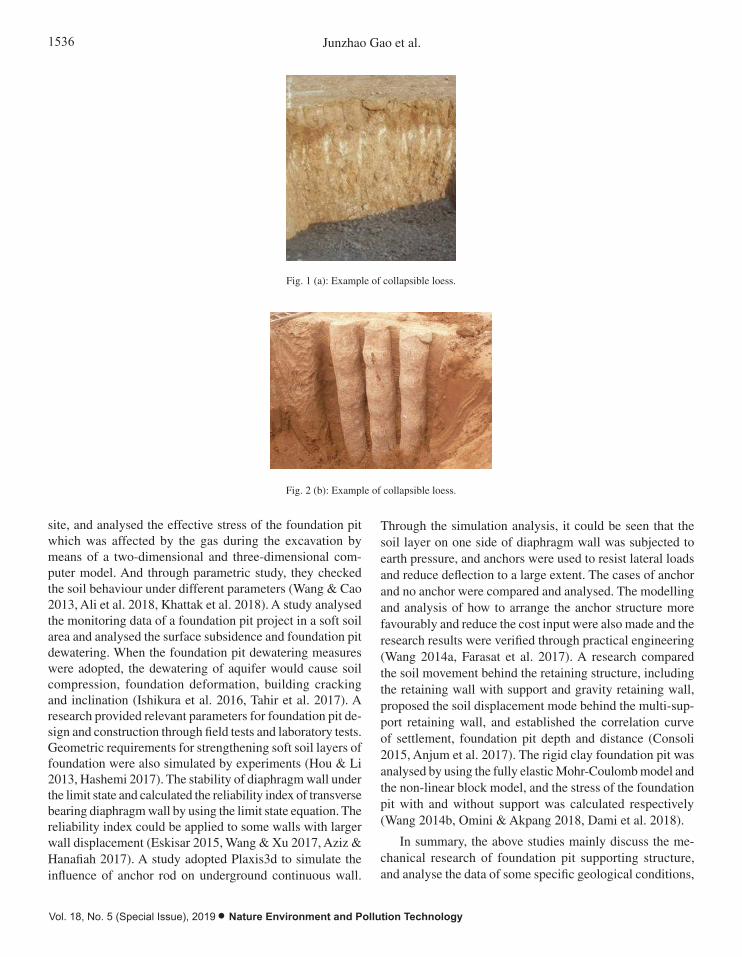
1536 Junzhao Gao et al.
Vol. 18, No. 5 (Special Issue), 2019 • Nature Environment and Pollution Technology
Overview of the example: The geological conditions in this area are quite special, and the adverse geological phenomena are as follows:
Collapsible loess: In the upper part of the plant area, the loess generally presents a denser state, it is the newly accumulated redeposited loess with vertical joints and horizontal bedding. There are developed pores and soluble salt crystals, initial collapse pressure is 78kPa; there is medium weight collapsible loess within 5m in local areas, and the plant area can be considered as a site of non-weight level-I (slight) collapsible loess. Figs. 1 and 2 are examples of collapsible loess.
Fig. 1(a): Example of collapsible loess.
Fig. 2(b): Example of collapsible loess.
Saline soil: The saline soil on the 0~8.5m surface of the plant has a high salt content, which is medium-strong sulphate saline soil with chlorine saline soil distribution; the saline soil in the plant area is moderately-highly corrosive to concrete structures, and is highly corrosive to the steel bars in the reinforced concrete. The corrosiveness of the saline soil in the plant area to the concrete structure of the pile is shown as: the chloride ions and sulphate ions in the groundwater directly act on the concrete, they enter the solution in the pore of the concrete after diffusion and penetration, first the corrosive ions react with Ca(OH)2 in the cement stone to form gypsum, then further react with hydrated calcium aluminate to form ettringite, which expands 2.5 times in volume, causing the structure to bulge and loose, and accelerate the immersion of the corrosive medium SO4
2-
. After the formation of ettringite, the pH value of the pore solution decreases, thereby destroying the alkalinity equilibrium condition of the hydrated calcium silicate and decomposing it. Moreover, the content of chloride and sulphate ions in groundwater in this area is tens to hundreds of times higher than other normal areas, which makes the corrosion damage more rapid. The residual strength of concrete after 8-20 years is only 5% to 10% of the original design strength, which will be a terrible consequence, meanwhile making it no longer possible to use concrete drilled cast-in-place piles for foundation treatment. Figs. 3 and 4 are examples of saline soil.
Analysis of alternative schemes:
This paper mainly designed two schemes, as follows:
Fig. 1 (a): Example of collapsible loess.
Overview of the example: The geological conditions in this area are quite special, and the adverse geological phenomena are as follows:
Collapsible loess: In the upper part of the plant area, the loess generally presents a denser state, it is the newly accumulated redeposited loess with vertical joints and horizontal bedding. There are developed pores and soluble salt crystals, initial collapse pressure is 78kPa; there is medium weight collapsible loess within 5m in local areas, and the plant area can be considered as a site of non-weight level-I (slight) collapsible loess. Figs. 1 and 2 are examples of collapsible loess.
Fig. 1(a): Example of collapsible loess.
Fig. 2(b): Example of collapsible loess.
Saline soil: The saline soil on the 0~8.5m surface of the plant has a high salt content, which is medium-strong sulphate saline soil with chlorine saline soil distribution; the saline soil in the plant area is moderately-highly corrosive to concrete structures, and is highly corrosive to the steel bars in the reinforced concrete. The corrosiveness of the saline soil in the plant area to the concrete structure of the pile is shown as: the chloride ions and sulphate ions in the groundwater directly act on the concrete, they enter the solution in the pore of the concrete after diffusion and penetration, first the corrosive ions react with Ca(OH)2 in the cement stone to form gypsum, then further react with hydrated calcium aluminate to form ettringite, which expands 2.5 times in volume, causing the structure to bulge and loose, and accelerate the immersion of the corrosive medium SO4
2-
. After the formation of ettringite, the pH value of the pore solution decreases, thereby destroying the alkalinity equilibrium condition of the hydrated calcium silicate and decomposing it. Moreover, the content of chloride and sulphate ions in groundwater in this area is tens to hundreds of times higher than other normal areas, which makes the corrosion damage more rapid. The residual strength of concrete after 8-20 years is only 5% to 10% of the original design strength, which will be a terrible consequence, meanwhile making it no longer possible to use concrete drilled cast-in-place piles for foundation treatment. Figs. 3 and 4 are examples of saline soil.
Analysis of alternative schemes:
This paper mainly designed two schemes, as follows:
Fig. 2 (b): Example of collapsible loess.
site, and analysed the effective stress of the foundation pit which was affected by the gas during the excavation by means of a two-dimensional and three-dimensional com-puter model. And through parametric study, they checked the soil behaviour under different parameters (Wang & Cao 2013, Ali et al. 2018, Khattak et al. 2018). A study analysed the monitoring data of a foundation pit project in a soft soil area and analysed the surface subsidence and foundation pit dewatering. When the foundation pit dewatering measures were adopted, the dewatering of aquifer would cause soil compression, foundation deformation, building cracking and inclination (Ishikura et al. 2016, Tahir et al. 2017). A research provided relevant parameters for foundation pit de-sign and construction through field tests and laboratory tests. Geometric requirements for strengthening soft soil layers of foundation were also simulated by experiments (Hou & Li 2013, Hashemi 2017). The stability of diaphragm wall under the limit state and calculated the reliability index of transverse bearing diaphragm wall by using the limit state equation. The reliability index could be applied to some walls with larger wall displacement (Eskisar 2015, Wang & Xu 2017, Aziz & Hanafiah 2017). A study adopted Plaxis3d to simulate the influence of anchor rod on underground continuous wall.
Through the simulation analysis, it could be seen that the soil layer on one side of diaphragm wall was subjected to earth pressure, and anchors were used to resist lateral loads and reduce deflection to a large extent. The cases of anchor and no anchor were compared and analysed. The modelling and analysis of how to arrange the anchor structure more favourably and reduce the cost input were also made and the research results were verified through practical engineering (Wang 2014a, Farasat et al. 2017). A research compared the soil movement behind the retaining structure, including the retaining wall with support and gravity retaining wall, proposed the soil displacement mode behind the multi-sup-port retaining wall, and established the correlation curve of settlement, foundation pit depth and distance (Consoli 2015, Anjum et al. 2017). The rigid clay foundation pit was analysed by using the fully elastic Mohr-Coulomb model and the non-linear block model, and the stress of the foundation pit with and without support was calculated respectively (Wang 2014b, Omini & Akpang 2018, Dami et al. 2018).
In summary, the above studies mainly discuss the me-chanical research of foundation pit supporting structure, and analyse the data of some specific geological conditions,
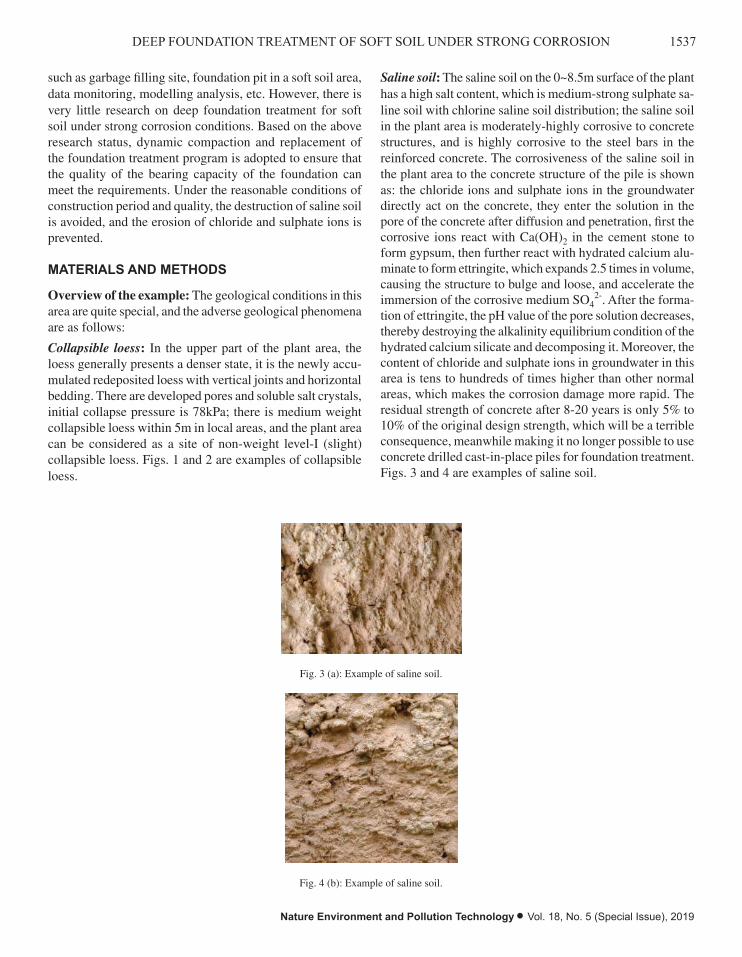
1537DEEP FOUNDATION TREATMENT OF SOFT SOIL UNDER STRONG CORROSION
Nature Environment and Pollution Technology • Vol. 18, No. 5 (Special Issue), 2019
such as garbage filling site, foundation pit in a soft soil area, data monitoring, modelling analysis, etc. However, there is very little research on deep foundation treatment for soft soil under strong corrosion conditions. Based on the above research status, dynamic compaction and replacement of the foundation treatment program is adopted to ensure that the quality of the bearing capacity of the foundation can meet the requirements. Under the reasonable conditions of construction period and quality, the destruction of saline soil is avoided, and the erosion of chloride and sulphate ions is prevented.
MATERIALS AND METHODS
Overview of the example: The geological conditions in this area are quite special, and the adverse geological phenomena are as follows:
Collapsible loess: In the upper part of the plant area, the loess generally presents a denser state, it is the newly accu-mulated redeposited loess with vertical joints and horizontal bedding. There are developed pores and soluble salt crystals, initial collapse pressure is 78kPa; there is medium weight collapsible loess within 5m in local areas, and the plant area can be considered as a site of non-weight level-I (slight) collapsible loess. Figs. 1 and 2 are examples of collapsible loess.
Saline soil: The saline soil on the 0~8.5m surface of the plant has a high salt content, which is medium-strong sulphate sa-line soil with chlorine saline soil distribution; the saline soil in the plant area is moderately-highly corrosive to concrete structures, and is highly corrosive to the steel bars in the reinforced concrete. The corrosiveness of the saline soil in the plant area to the concrete structure of the pile is shown as: the chloride ions and sulphate ions in the groundwater directly act on the concrete, they enter the solution in the pore of the concrete after diffusion and penetration, first the corrosive ions react with Ca(OH)2 in the cement stone to form gypsum, then further react with hydrated calcium alu-minate to form ettringite, which expands 2.5 times in volume, causing the structure to bulge and loose, and accelerate the immersion of the corrosive medium SO4
2-. After the forma-tion of ettringite, the pH value of the pore solution decreases, thereby destroying the alkalinity equilibrium condition of the hydrated calcium silicate and decomposing it. Moreover, the content of chloride and sulphate ions in groundwater in this area is tens to hundreds of times higher than other normal areas, which makes the corrosion damage more rapid. The residual strength of concrete after 8-20 years is only 5% to 10% of the original design strength, which will be a terrible consequence, meanwhile making it no longer possible to use concrete drilled cast-in-place piles for foundation treatment. Figs. 3 and 4 are examples of saline soil.
Scheme 1: Stick to the scheme of using reinforced concrete drilled cast-in-place piles for the treatment of foundation. Take measures to suppress the corrosion of the saline soil to the concrete structure and maintain the stability and durability of the concrete structure.
Scheme 2: Adopt other foundation treatment methods, such as: replacement method, dynamic compaction method.
Fig. 3(a): Example of saline soil.
Fig. 4(b): Example of saline soil.
Comparison and analysis of schemes: If the first scheme is taken, that is to control the chemical corrosion of saline soil and concrete structure, the following measures can be taken: (1) increase the design strength of concrete, use concrete of higher design strength as much as possible; (2) add anti-corrosion agents or corrosion inhibitors; increase the thickness of the protective layer of concrete to minimize the corrosive effect of corrosive ions on the steel bars, because the corrosive effect of the corrosive ions on the steel bars is fatal.
If the second scheme is adopted, that is, the replacement method and the dynamic compaction method. For the replacement method, the southern part of the example area is a mountain area with good natural graded gravel soil, and the collapsible loess at the bottom of the foundation can be excavated and then backfilled. The foundation of most buildings in the plant area was designed to be about -4.0m, the earth excavation depth is about -8.0m, the thickness of the backfill is about 4m, perform layered rolling or dynamic compaction with a small amount of energy. The scheme can use local materials, and the construction process is simple; it can effectively improve the bearing capacity of the foundation, reduce settlement, and accelerate the drainage consolidation of the soft soil layer, but it is easy to disturb the soft underlying layer during the construction process, thereby large additional settlement would occur under the action of the structure; for the dynamic compaction method, as the loess layer and silt layer have characteristics of collapsibility and low foundation bearing capacity, the method of foundation dynamic compaction can be used to eliminate the collapsibility of foundation soil, so as to meet the requirement of plant area buildings and structures for the bearing capacity of
Fig. 3 (a): Example of saline soil.
Scheme 1: Stick to the scheme of using reinforced concrete drilled cast-in-place piles for the treatment of foundation. Take measures to suppress the corrosion of the saline soil to the concrete structure and maintain the stability and durability of the concrete structure.
Scheme 2: Adopt other foundation treatment methods, such as: replacement method, dynamic compaction method.
Fig. 3(a): Example of saline soil.
Fig. 4(b): Example of saline soil.
Comparison and analysis of schemes: If the first scheme is taken, that is to control the chemical corrosion of saline soil and concrete structure, the following measures can be taken: (1) increase the design strength of concrete, use concrete of higher design strength as much as possible; (2) add anti-corrosion agents or corrosion inhibitors; increase the thickness of the protective layer of concrete to minimize the corrosive effect of corrosive ions on the steel bars, because the corrosive effect of the corrosive ions on the steel bars is fatal.
If the second scheme is adopted, that is, the replacement method and the dynamic compaction method. For the replacement method, the southern part of the example area is a mountain area with good natural graded gravel soil, and the collapsible loess at the bottom of the foundation can be excavated and then backfilled. The foundation of most buildings in the plant area was designed to be about -4.0m, the earth excavation depth is about -8.0m, the thickness of the backfill is about 4m, perform layered rolling or dynamic compaction with a small amount of energy. The scheme can use local materials, and the construction process is simple; it can effectively improve the bearing capacity of the foundation, reduce settlement, and accelerate the drainage consolidation of the soft soil layer, but it is easy to disturb the soft underlying layer during the construction process, thereby large additional settlement would occur under the action of the structure; for the dynamic compaction method, as the loess layer and silt layer have characteristics of collapsibility and low foundation bearing capacity, the method of foundation dynamic compaction can be used to eliminate the collapsibility of foundation soil, so as to meet the requirement of plant area buildings and structures for the bearing capacity of
Fig. 4 (b): Example of saline soil.
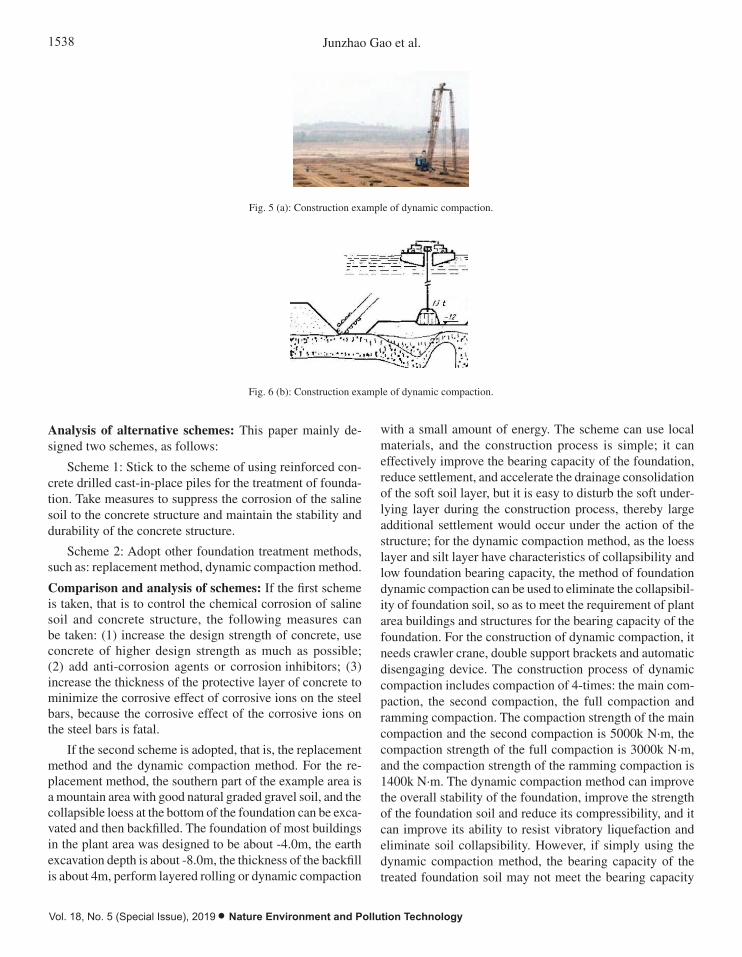
1538 Junzhao Gao et al.
Vol. 18, No. 5 (Special Issue), 2019 • Nature Environment and Pollution Technology
the foundation. For the construction of dynamic compaction, it needs crawler crane, double support brackets and automatic disengaging device. The construction process of dynamic compaction includes compaction of 4-times: the main compaction, the second compaction, the full compaction and ramming compaction. The compaction strength of the main compaction and the second compaction is 5000k N·m, the compaction strength of the full compaction is 3000k N·m, and the compaction strength of the ramming compaction is 1400k N·m. The dynamic compaction method can improve the overall stability of the foundation, improve the strength of the foundation soil and reduce its compressibility, and it can improve its ability to resist vibratory liquefaction and eliminate soil collapsibility. However, if simply using the dynamic compaction method, the bearing capacity of the treated foundation soil may not meet the bearing capacity requirements of the above structures, especially important projects such as the main building, chimney and water tower. Figs. 5 and 6 are construction examples of dynamic compaction.
Fig. 5 (a): Construction example of dynamic compaction.
Fig. 6(b): Construction example of dynamic compaction.
Combining the advantages and disadvantages of the above methods, we have adopted a foundation treatment scheme of dynamic compaction plus replacement method. The foundation treatment is first carried out by the dynamic compaction method, then the soil with a thickness of 2m under the foundation is excavated, and backfilled with crushed stones, layered rolling is conducted so as to ensure the compactness. With this method, the quality requirement for the bearing capacity of the foundation can be met, and the cost is economical and reasonable, the overall construction period is not too long, and the destructive effect of the saline soil is avoided, and there is no need to worry about the corrosion effect of chloride ions and sulphate ions.
RESULTS
Part of the construction requirements are as follows: use crawler crane, double support brackets, automatic disengaging device, round compaction hammer with D=2.65m, the weight of the hammer is 27.8t. The lifting height of the main and second compaction point is 18.0m, the lifting height of the full compaction point is 10.8m. The construction process of dynamic compaction includes compaction of 4-times: the main compaction, the second compaction, the full compaction and ramming compaction. The second compaction points were arranged in 7.2×7.2m grid, the full compaction points were arranged in tangent circles, and the ramming compaction points were arranged in overlapped circles. Main compaction and second compaction were performed in order, the compaction was line-interlaced and dot-interlaced, and was completed twice; the ramming compaction includes reinforced compaction on the main and second compaction points, and alternative compaction between the main and second compaction points, the compaction was line-interlaced and finished twice. The ramming compaction was performed twice in order, for the first time, the ramming was performed one by one, the adjacent prints of the hammer should be tangent circles; the second time, the compaction points should overlap all gaps of the first-time compaction, and should be performed one by one,
Fig. 5 (a): Construction example of dynamic compaction.
the foundation. For the construction of dynamic compaction, it needs crawler crane, double support brackets and automatic disengaging device. The construction process of dynamic compaction includes compaction of 4-times: the main compaction, the second compaction, the full compaction and ramming compaction. The compaction strength of the main compaction and the second compaction is 5000k N·m, the compaction strength of the full compaction is 3000k N·m, and the compaction strength of the ramming compaction is 1400k N·m. The dynamic compaction method can improve the overall stability of the foundation, improve the strength of the foundation soil and reduce its compressibility, and it can improve its ability to resist vibratory liquefaction and eliminate soil collapsibility. However, if simply using the dynamic compaction method, the bearing capacity of the treated foundation soil may not meet the bearing capacity requirements of the above structures, especially important projects such as the main building, chimney and water tower. Figs. 5 and 6 are construction examples of dynamic compaction.
Fig. 5 (a): Construction example of dynamic compaction.
Fig. 6(b): Construction example of dynamic compaction.
Combining the advantages and disadvantages of the above methods, we have adopted a foundation treatment scheme of dynamic compaction plus replacement method. The foundation treatment is first carried out by the dynamic compaction method, then the soil with a thickness of 2m under the foundation is excavated, and backfilled with crushed stones, layered rolling is conducted so as to ensure the compactness. With this method, the quality requirement for the bearing capacity of the foundation can be met, and the cost is economical and reasonable, the overall construction period is not too long, and the destructive effect of the saline soil is avoided, and there is no need to worry about the corrosion effect of chloride ions and sulphate ions.
RESULTS
Part of the construction requirements are as follows: use crawler crane, double support brackets, automatic disengaging device, round compaction hammer with D=2.65m, the weight of the hammer is 27.8t. The lifting height of the main and second compaction point is 18.0m, the lifting height of the full compaction point is 10.8m. The construction process of dynamic compaction includes compaction of 4-times: the main compaction, the second compaction, the full compaction and ramming compaction. The second compaction points were arranged in 7.2×7.2m grid, the full compaction points were arranged in tangent circles, and the ramming compaction points were arranged in overlapped circles. Main compaction and second compaction were performed in order, the compaction was line-interlaced and dot-interlaced, and was completed twice; the ramming compaction includes reinforced compaction on the main and second compaction points, and alternative compaction between the main and second compaction points, the compaction was line-interlaced and finished twice. The ramming compaction was performed twice in order, for the first time, the ramming was performed one by one, the adjacent prints of the hammer should be tangent circles; the second time, the compaction points should overlap all gaps of the first-time compaction, and should be performed one by one,
Fig. 6 (b): Construction example of dynamic compaction.
Analysis of alternative schemes: This paper mainly de-signed two schemes, as follows:
Scheme 1: Stick to the scheme of using reinforced con-crete drilled cast-in-place piles for the treatment of founda-tion. Take measures to suppress the corrosion of the saline soil to the concrete structure and maintain the stability and durability of the concrete structure.
Scheme 2: Adopt other foundation treatment methods, such as: replacement method, dynamic compaction method.
Comparison and analysis of schemes: If the first scheme is taken, that is to control the chemical corrosion of saline soil and concrete structure, the following measures can be taken: (1) increase the design strength of concrete, use concrete of higher design strength as much as possible; (2) add anti-corrosion agents or corrosion inhibitors; (3) increase the thickness of the protective layer of concrete to minimize the corrosive effect of corrosive ions on the steel bars, because the corrosive effect of the corrosive ions on the steel bars is fatal.
If the second scheme is adopted, that is, the replacement method and the dynamic compaction method. For the re-placement method, the southern part of the example area is a mountain area with good natural graded gravel soil, and the collapsible loess at the bottom of the foundation can be exca-vated and then backfilled. The foundation of most buildings in the plant area was designed to be about -4.0m, the earth excavation depth is about -8.0m, the thickness of the backfill is about 4m, perform layered rolling or dynamic compaction
with a small amount of energy. The scheme can use local materials, and the construction process is simple; it can effectively improve the bearing capacity of the foundation, reduce settlement, and accelerate the drainage consolidation of the soft soil layer, but it is easy to disturb the soft under-lying layer during the construction process, thereby large additional settlement would occur under the action of the structure; for the dynamic compaction method, as the loess layer and silt layer have characteristics of collapsibility and low foundation bearing capacity, the method of foundation dynamic compaction can be used to eliminate the collapsibil-ity of foundation soil, so as to meet the requirement of plant area buildings and structures for the bearing capacity of the foundation. For the construction of dynamic compaction, it needs crawler crane, double support brackets and automatic disengaging device. The construction process of dynamic compaction includes compaction of 4-times: the main com-paction, the second compaction, the full compaction and ramming compaction. The compaction strength of the main compaction and the second compaction is 5000k N·m, the compaction strength of the full compaction is 3000k N·m, and the compaction strength of the ramming compaction is 1400k N·m. The dynamic compaction method can improve the overall stability of the foundation, improve the strength of the foundation soil and reduce its compressibility, and it can improve its ability to resist vibratory liquefaction and eliminate soil collapsibility. However, if simply using the dynamic compaction method, the bearing capacity of the treated foundation soil may not meet the bearing capacity
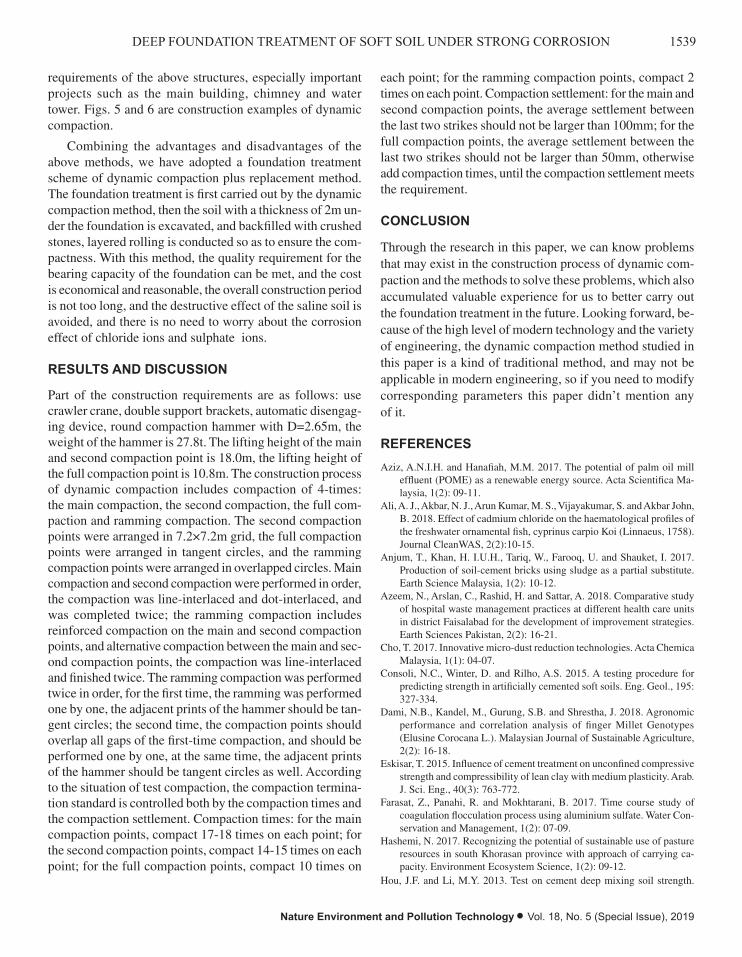
1539DEEP FOUNDATION TREATMENT OF SOFT SOIL UNDER STRONG CORROSION
Nature Environment and Pollution Technology • Vol. 18, No. 5 (Special Issue), 2019
requirements of the above structures, especially important projects such as the main building, chimney and water tower. Figs. 5 and 6 are construction examples of dynamic compaction.
Combining the advantages and disadvantages of the above methods, we have adopted a foundation treatment scheme of dynamic compaction plus replacement method. The foundation treatment is first carried out by the dynamic compaction method, then the soil with a thickness of 2m un-der the foundation is excavated, and backfilled with crushed stones, layered rolling is conducted so as to ensure the com-pactness. With this method, the quality requirement for the bearing capacity of the foundation can be met, and the cost is economical and reasonable, the overall construction period is not too long, and the destructive effect of the saline soil is avoided, and there is no need to worry about the corrosion effect of chloride ions and sulphate ions.
RESULTS AND DISCUSSION
Part of the construction requirements are as follows: use crawler crane, double support brackets, automatic disengag-ing device, round compaction hammer with D=2.65m, the weight of the hammer is 27.8t. The lifting height of the main and second compaction point is 18.0m, the lifting height of the full compaction point is 10.8m. The construction process of dynamic compaction includes compaction of 4-times: the main compaction, the second compaction, the full com-paction and ramming compaction. The second compaction points were arranged in 7.2×7.2m grid, the full compaction points were arranged in tangent circles, and the ramming compaction points were arranged in overlapped circles. Main compaction and second compaction were performed in order, the compaction was line-interlaced and dot-interlaced, and was completed twice; the ramming compaction includes reinforced compaction on the main and second compaction points, and alternative compaction between the main and sec-ond compaction points, the compaction was line-interlaced and finished twice. The ramming compaction was performed twice in order, for the first time, the ramming was performed one by one, the adjacent prints of the hammer should be tan-gent circles; the second time, the compaction points should overlap all gaps of the first-time compaction, and should be performed one by one, at the same time, the adjacent prints of the hammer should be tangent circles as well. According to the situation of test compaction, the compaction termina-tion standard is controlled both by the compaction times and the compaction settlement. Compaction times: for the main compaction points, compact 17-18 times on each point; for the second compaction points, compact 14-15 times on each point; for the full compaction points, compact 10 times on
each point; for the ramming compaction points, compact 2 times on each point. Compaction settlement: for the main and second compaction points, the average settlement between the last two strikes should not be larger than 100mm; for the full compaction points, the average settlement between the last two strikes should not be larger than 50mm, otherwise add compaction times, until the compaction settlement meets the requirement.
CONCLUSION
Through the research in this paper, we can know problems that may exist in the construction process of dynamic com-paction and the methods to solve these problems, which also accumulated valuable experience for us to better carry out the foundation treatment in the future. Looking forward, be-cause of the high level of modern technology and the variety of engineering, the dynamic compaction method studied in this paper is a kind of traditional method, and may not be applicable in modern engineering, so if you need to modify corresponding parameters this paper didn’t mention any of it.
REFERENCES
Aziz, A.N.I.H. and Hanafiah, M.M. 2017. The potential of palm oil mill effluent (POME) as a renewable energy source. Acta Scientifica Ma-laysia, 1(2): 09-11.
Ali, A. J., Akbar, N. J., Arun Kumar, M. S., Vijayakumar, S. and Akbar John, B. 2018. Effect of cadmium chloride on the haematological profiles of the freshwater ornamental fish, cyprinus carpio Koi (Linnaeus, 1758). Journal CleanWAS, 2(2):10-15.
Anjum, T., Khan, H. I.U.H., Tariq, W., Farooq, U. and Shauket, I. 2017. Production of soil-cement bricks using sludge as a partial substitute. Earth Science Malaysia, 1(2): 10-12.
Azeem, N., Arslan, C., Rashid, H. and Sattar, A. 2018. Comparative study of hospital waste management practices at different health care units in district Faisalabad for the development of improvement strategies. Earth Sciences Pakistan, 2(2): 16-21.
Cho, T. 2017. Innovative micro-dust reduction technologies. Acta Chemica Malaysia, 1(1): 04-07.
Consoli, N.C., Winter, D. and Rilho, A.S. 2015. A testing procedure for predicting strength in artificially cemented soft soils. Eng. Geol., 195: 327-334.
Dami, N.B., Kandel, M., Gurung, S.B. and Shrestha, J. 2018. Agronomic performance and correlation analysis of finger Millet Genotypes (Elusine Corocana L.). Malaysian Journal of Sustainable Agriculture, 2(2): 16-18.
Eskisar, T. 2015. Influence of cement treatment on unconfined compressive strength and compressibility of lean clay with medium plasticity. Arab. J. Sci. Eng., 40(3): 763-772.
Farasat, Z., Panahi, R. and Mokhtarani, B. 2017. Time course study of coagulation flocculation process using aluminium sulfate. Water Con-servation and Management, 1(2): 07-09.
Hashemi, N. 2017. Recognizing the potential of sustainable use of pasture resources in south Khorasan province with approach of carrying ca-pacity. Environment Ecosystem Science, 1(2): 09-12.
Hou, J.F. and Li, M.Y. 2013. Test on cement deep mixing soil strength.

1540 Junzhao Gao et al.
Vol. 18, No. 5 (Special Issue), 2019 • Nature Environment and Pollution Technology
Applied Mechanics & Materials, 401-403: 738-742.Ishikura, R., Yasufuku, N. and Brown, M.J. 2016. An estimation method
for predicting final consolidation settlement of ground improved by floating soil cement columns. Soils Found, 56(2): 213-227.
Khattak, A. M., Khan, G. A., Khan, Y., Khattak, M. I. and Jamal, F. 2018. Characterization of soft B separation axioms in soft bi-topological spaces. Matrix Science Mathematic, 2(2): 11-17.
Kibria, A. A., Kamrunnessa and Rahman, M. M. 2018. Extraction and evaluation of phytochemicals from green coconut (Cocos nucifera) Shell. Malaysian Journal of Halal Research, 1(2): 19-22.
Li, Z.M. and Zeng, W.X. 2013. Vibration propagation law and control test of ultra soft soil ground under impact load. Applied Mechanics & Materials, 295-298(2): 2030-2033.
Nordin, N. F. H., Ibrahim, N. H. S. and Chowdhury, A. J. K. 2018. Phys-icochemical parameters and bacterial composition in Sungau Pusu Gombak. Science Heritage Journal, 2(1): 10-12.
Nwankwoala, H.O. and Ememu, A.J. 2018. Hydrogeochemical signatures and quality assessment of groundwater in Okpoko and Environs, South-eastern Nigeria. Pakistan Journal of Geology, 2(1): 06-11.
Omini, E. O. and Akpang, O. M. 2018. Cavity detection under re-enforced concrete floor using ground penetration radar. Engineering Heritage Journal, 2(2): 11-18.
Rawat, K.S. and Singh, S.K. 2018. Water Quality Indices and GIS-based evaluation of a decadal groundwater quality. Geology, Ecology, and Landscapes, 2:4, 240-255.
Tahir, S., Siong, K.V., Musta, B. and Asis, J. 2017. Facies and sandstone characteristics of the Kudat formation, Sabah, Malaysia. Geological Behavior, 1(2):20-25.
Wang, J. and Xu, H. 2017. The crust and uppermost mantle S-Wave velocity structure beneath Japan Islands revealed by joint analysis of P-and S wave receiver functions. Malaysian Journal Geosciences, 1(2): 20-23.
Wang, C., Xu, Y.F. and Dong, P. 2014a. Working characteristics of con-crete-cored deep cement mixing piles under embankments. J. Zhejiang Univ., 15(6): 419-431.
Wang, D. and Cao, J. 2013. The experimental research on the bag-grouting-pile composite foundation in coastal soft foundation treatment. Applied Mechanics & Materials, 275-277: 1411-1414.
Wang, Q.J., Zhang, S.J. and Guo, C. 2014b. Centrifuge model study of high strength piles composite foundation settlement & instability under embankment in different kind soils by different pile spacing. Applied Mechanics & Materials, 580-583: 38-47.
Yang, P., Zhang, J. and Hu, H. 2016. Coefficient analysis of soft soil con-solidation based on measurement of stratified settlement. Geotech. Geol. Eng., 34(1): 383-390.
Yang, Y.K., Yang, W. and Feng, C.Y. 2013. Experimental research of soft soil ground treatment in Yangpu Port by static-dynamic drainage con-solidation. Applied Mechanics & Materials, 353: 203-207.
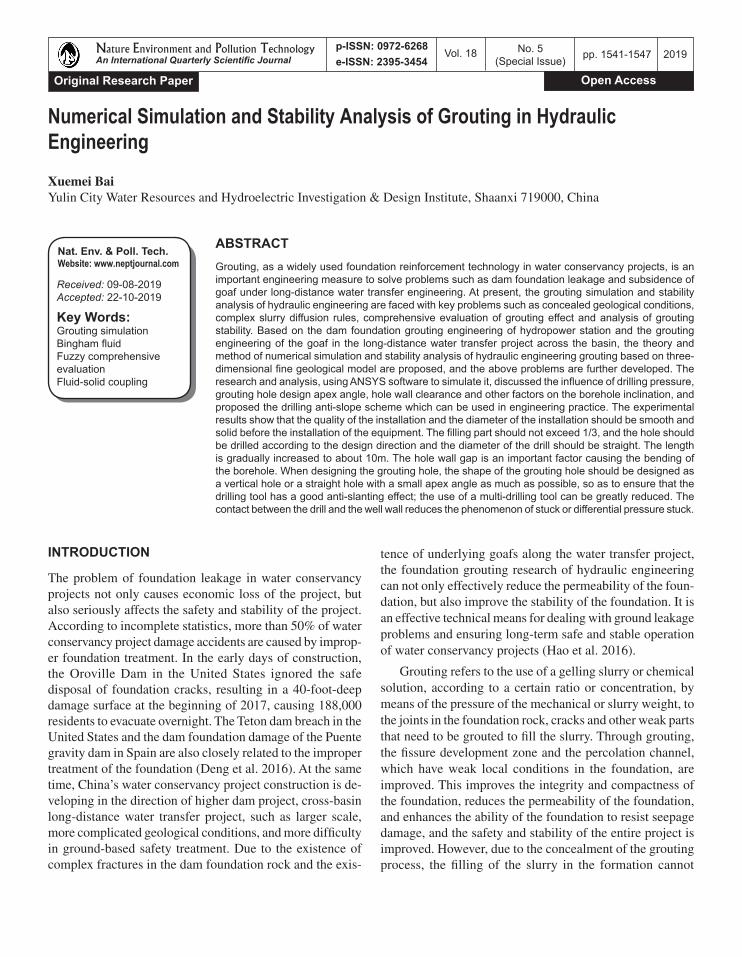
Numerical Simulation and Stability Analysis of Grouting in Hydraulic Engineering
Xuemei BaiYulin City Water Resources and Hydroelectric Investigation & Design Institute, Shaanxi 719000, China
ABSTRACT
Grouting, as a widely used foundation reinforcement technology in water conservancy projects, is an important engineering measure to solve problems such as dam foundation leakage and subsidence of goaf under long-distance water transfer engineering. At present, the grouting simulation and stability analysis of hydraulic engineering are faced with key problems such as concealed geological conditions, complex slurry diffusion rules, comprehensive evaluation of grouting effect and analysis of grouting stability. Based on the dam foundation grouting engineering of hydropower station and the grouting engineering of the goaf in the long-distance water transfer project across the basin, the theory and method of numerical simulation and stability analysis of hydraulic engineering grouting based on three-dimensional fine geological model are proposed, and the above problems are further developed. The research and analysis, using ANSYS software to simulate it, discussed the influence of drilling pressure, grouting hole design apex angle, hole wall clearance and other factors on the borehole inclination, and proposed the drilling anti-slope scheme which can be used in engineering practice. The experimental results show that the quality of the installation and the diameter of the installation should be smooth and solid before the installation of the equipment. The filling part should not exceed 1/3, and the hole should be drilled according to the design direction and the diameter of the drill should be straight. The length is gradually increased to about 10m. The hole wall gap is an important factor causing the bending of the borehole. When designing the grouting hole, the shape of the grouting hole should be designed as a vertical hole or a straight hole with a small apex angle as much as possible, so as to ensure that the drilling tool has a good anti-slanting effect; the use of a multi-drilling tool can be greatly reduced. The contact between the drill and the well wall reduces the phenomenon of stuck or differential pressure stuck.
INTRODUCTION
The problem of foundation leakage in water conservancy projects not only causes economic loss of the project, but also seriously affects the safety and stability of the project. According to incomplete statistics, more than 50% of water conservancy project damage accidents are caused by improp-er foundation treatment. In the early days of construction, the Oroville Dam in the United States ignored the safe disposal of foundation cracks, resulting in a 40-foot-deep damage surface at the beginning of 2017, causing 188,000 residents to evacuate overnight. The Teton dam breach in the United States and the dam foundation damage of the Puente gravity dam in Spain are also closely related to the improper treatment of the foundation (Deng et al. 2016). At the same time, China’s water conservancy project construction is de-veloping in the direction of higher dam project, cross-basin long-distance water transfer project, such as larger scale, more complicated geological conditions, and more difficulty in ground-based safety treatment. Due to the existence of complex fractures in the dam foundation rock and the exis-
tence of underlying goafs along the water transfer project, the foundation grouting research of hydraulic engineering can not only effectively reduce the permeability of the foun-dation, but also improve the stability of the foundation. It is an effective technical means for dealing with ground leakage problems and ensuring long-term safe and stable operation of water conservancy projects (Hao et al. 2016).
Grouting refers to the use of a gelling slurry or chemical solution, according to a certain ratio or concentration, by means of the pressure of the mechanical or slurry weight, to the joints in the foundation rock, cracks and other weak parts that need to be grouted to fill the slurry. Through grouting, the fissure development zone and the percolation channel, which have weak local conditions in the foundation, are improved. This improves the integrity and compactness of the foundation, reduces the permeability of the foundation, and enhances the ability of the foundation to resist seepage damage, and the safety and stability of the entire project is improved. However, due to the concealment of the grouting process, the filling of the slurry in the formation cannot
Nat. Env. & Poll. Tech.Website: www.neptjournal.com
Received: 09-08-2019Accepted: 22-10-2019
Key Words:Grouting simulationBingham fluid Fuzzy comprehensive evaluationFluid-solid coupling
2019pp. 1541-1547 Vol. 18
p-ISSN: 0972-6268 No. 5 (Special Issue)
Nature Environment and Pollution Technology An International Quarterly Scientific Journal
Original Research Paper
e-ISSN: 2395-3454
Open Access
1542 Xuemei Bai
Vol. 18, No. 5 (Special Issue), 2019 • Nature Environment and Pollution Technology
be assessed intuitively, and the effectiveness of grouting and the stability of the engineering cannot be accurately judged. The irritation medium existing in the rock mass of the water conservancy project can be divided into fissures, porous media, etc. The flow patterns and ways of the slurry in different kinds of irritation medium are different, and the geological modelling theory and grouting simulation theory involved are different (Dong-Yang et al. 2016). Due to the large scale of water conservancy projects, the geological environment involved in grouting reinforcement treatment is complex. Therefore, this paper takes two typical grouting projects of dam foundation fractured rock mass grouting and inter-basin long-distance water transfer engineering under the goaf for porous media grouting as an example. Simulation study on grouting diffusion process in underlying goaf of dam foundation and inter-basin long-distance water transfer project, effective evaluation of grouting effect, and fluid-solid coupling method for reasonable analysis of grouting stabil-ity, which is also to ensure water conservancy engineering, important scientific issues of foundation stability and overall engineering safety.
EARLIER STUDIES
In 1974, Baker derived the formula for the filling of Newto-nian fluid under ideal single-fracture conditions. Since then, many scholars have used Newtonian fluid or Bingham fluid model to simulate the slurry flow process in a single fracture from different angles (Wang et al. 2018). Subsequently, in 2001 an analytical solution of the Bingham-type slurry was derived, when it was unsteadily flowing between two parallel smooth plates (Zhang et al. 2017). On the basis of this, Iwasaki et al. (2016) studied the flow diffusion law of Bingham-type slurry fluid between parallel smooth plates under different grouting flows, and used the Laplace trans-form method to derive the slurry for unsteady flow, velocity distribution characteristics and pressure gradient. A study on the calculation method of the infiltration distance of one-dimensional runoff and two-dimensional radial flow in parallel plate cracks (Lai et al. 2016). Based on the parallel plate fracture model, Gordeeva et al. (2017) studied the for-ward ratio of cement slurry radial flow, and proposed that the cement slurry advancement state depends on the grouting time and the grouting pressure or flow control. Previous study proposed a high arch dam grouting model with single fracture to optimize grouting time, control grouting pressure, and control lift deformation, which can effectively reduce high arch dam lifting and related cracking risk (Meng et al. 2016). A recent study discussed the flow-diffusion law of
Bingham-type slurry in a two-dimensional channel network rock mass (Shao-Feng et al. 2017).
MODEL DESIGN METHOD
Research framework: A fuzzy comprehensive evaluation method for grouting effect based on cloud model is proposed. Firstly, the index system of comprehensive evaluation of grouting effect is introduced, including water permeability, sonic wave velocity, fracture filling rate and irritability in post-irrigation rock. The measured values of these evaluation indexes are respectively measured by water pressure test, acoustic wave test and core drilling, in-hole video and grout recorders. Secondly, the fuzzy comprehensive evaluation method of grouting effect is introduced. The cloud model theory is used to consider the fuzziness and randomness in grouting effect evaluation. The fuzzy entropy is introduced and the complexity of evaluation grade attribution is consid-ered. Based on the cloud model-based fuzzy comprehensive evaluation method of grouting effect, the c o mprehensive evaluation of the dam foundation grouting effect of a large hydropower project in China is carried out.
Mathematical model: At present, a few independent stud-ies on the comprehensive evaluation of grouting effect are single-factor independent evaluation, and the randomness in grouting effect evaluation is neglected. In this paper, the cloud model theory is introduced for the uncertainty in grouting effect evaluation, and the comprehensive evalua-tion of grouting effect is established. In the construction of comprehensive evaluation system of grouting effect, four indexes of water permeability, sonic wave velocity, filling rate and potability are comprehensively considered. Secondly, considering the importance scale and membership degree in the evaluation of grouting effect, it is easy to be subject to personal experience and based on the influence of subjective factors, a fuzzy comprehensive evaluation method based on cloud model is proposed. The fuzzy features and randomness are combined organically by using the digital features of the cloud model. Again, it is based on a single evaluation level as a comprehensive grouting effect. The evaluation results are difficult to fully and truly reflect the grouting effect, and the fuzzy entropy is introduced as the auxiliary evaluation of the comprehensive evaluation of grout ing effect. The two-dimensional evaluation results are constructed from the level and complexity, and the grouting effect is evaluated. The mathematical model for comprehensive evaluation of grouting effect is shown in Fig. 1. The mathematical model clarifies the indicator set, evaluation level set, method set and parameter set of the comprehensive evaluation of grouting effect.
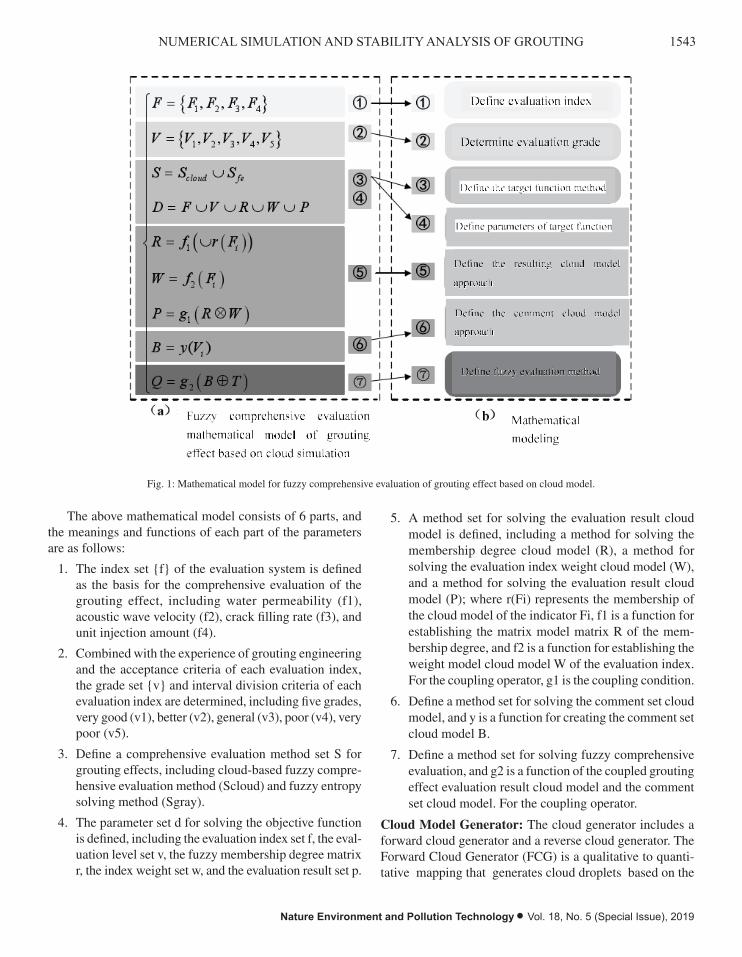
1543NUMERICAL SIMULATION AND STABILITY ANALYSIS OF GROUTING
Nature Environment and Pollution Technology • Vol. 18, No. 5 (Special Issue), 2019
by using the digital features of the cloud model. Again, it is based on a single evaluation level as a
comprehensive grouting effect. The evaluation results are difficult to fully and truly reflect the grouting
effect, and the fuzzy entropy is introduced as the auxiliary evaluation of the comprehensive evaluation
of grouting effect. The two-dimensional evaluation results are constructed from the level and complexity,
and the grouting effect is evaluated. The mathematical model for comprehensive evaluation of grouting
effect is shown in Fig. 1. The mathematical model clarifies the indicator set, evaluation level set, method
set and parameter set of the comprehensive evaluation of grouting effect.
Fig. 1: Mathematical model for fuzzy comprehensive evaluation of grouting effect based on cloud model.
The above mathematical model consists of 6 parts, and the meanings and functions of each part of
the parameters are as follows:
1. The index set {f} of the evaluation system is defined as the basis for the comprehensive evaluation
of the grouting effect, including water permeability (f1), acoustic wave velocity (f2), crack filling rate
(f3), and unit injection amount (f4).
2. Combined with the experience of grouting engineering and the acceptance criteria of each
evaluation index, the grade set {v} and interval division criteria of each evaluation index are determined,
including five grades, very good (v1), better (v2), general (v3), poor (v4), very poor (v5).
3. Define a comprehensive evaluation method set S for grouting effects, including cloud-based fuzzy
comprehensive evaluation method (Scloud) and fuzzy entropy solving method (Sgray).
4. The parameter set d for solving the objective function is defined, including the evaluation index
Fuzzy comprehensive evaluation mathematical model of grouting effect based on cloud simulation
Mathematical modeling
Fuzzy comprehensive evaluation mathematical model of grouting effect based on cloud simulation
Define fuzzy evaluation method
Fig. 1: Mathematical model for fuzzy comprehensive evaluation of grouting effect based on cloud model.
Define parameters of target function
The above mathematical model consists of 6 parts, and the meanings and functions of each part of the parameters are as follows:
1. The index set {f} of the evaluation system is defined as the basis for the comprehensive evaluation of the grouting effect, including water permeability (f1), acoustic wave velocity (f2), crack filling rate (f3), and unit injection amount (f4).
2. Combined with the experience of grouting engineering and the acceptance criteria of each evaluation index, the grade set {v} and interval division criteria of each evaluation index are determined, including five grades, very good (v1), better (v2), general (v3), poor (v4), very poor (v5).
3. Define a comprehensive evaluation method set S for grouting effects, including cloud-based fuzzy compre-hensive evaluation method (Scloud) and fuzzy entropy solving method (Sgray).
4. The parameter set d for solving the objective function is defined, including the evaluation index set f, the eval-uation level set v, the fuzzy membership degree matrix r, the index weight set w, and the evaluation result set p.
5. A method set for solving the evaluation result cloud model is defined, including a method for solving the membership degree cloud model (R), a method for solving the evaluation index weight cloud model (W), and a method for solving the evaluation result cloud model (P); where r(Fi) represents the membership of the cloud model of the indicator Fi, f1 is a function for establishing the matrix model matrix R of the mem-bership degree, and f2 is a function for establishing the weight model cloud model W of the evaluation index. For the coupling operator, g1 is the coupling condition.
6. Define a method set for solving the comment set cloud model, and y is a function for creating the comment set cloud model B.
7. Define a method set for solving fuzzy comprehensive evaluation, and g2 is a function of the coupled grouting effect evaluation result cloud model and the comment set cloud model. For the coupling operator.
Cloud Model Generator: The cloud generator includes a forward cloud generator and a reverse cloud generator. The Forward Cloud Generator (FCG) is a qualitative to quanti-tative mapping that generates cloud droplets based on the

1544 Xuemei Bai
Vol. 18, No. 5 (Special Issue), 2019 • Nature Environment and Pollution Technology
set f, the evaluation level set v, the fuzzy membership degree matrix r, the index weight set w, and the
evaluation result set p.
5. A method set for solving the evaluation result cloud model is defined, including a method for
solving the membership degree cloud model (R), a method for solving the evaluation index weight cloud
model (W), and a method for solving the evaluation result cloud model (P); where r(Fi) represents the
membership of the cloud model of the indicator Fi, f1 is a function for establishing the matrix model
matrix R of the membership degree, and f2 is a function for establishing the weight model cloud model
W of the evaluation index. For the coupling operator, g1 is the coupling condition.
6. Define a method set for solving the comment set cloud model, and y is a function for creating the
comment set cloud model B.
7. Define a method set for solving fuzzy comprehensive evaluation, and g2 is a function of the
coupled grouting effect evaluation result cloud model and the comment set cloud model. For the coupling
operator.
Cloud Model Generator: The cloud generator includes a forward cloud generator and a reverse cloud
generator. The Forward Cloud Generator (FCG) is a qualitative to quantitative mapping that generates
cloud droplets based on the digital features C(Ex, En, He) of the cloud, mapping qualitative concepts to
quantitative locations in the numerical space. Achieving the conversion of qualitative concepts to
quantitative values. The Back Cloud Generator (BCG) is the inverse process of the forward cloud
generator, which realizes the conversion model from the quantitative value to the qualitative concept.
According to the cloud drop that matches a certain distribution, the digital feature C corresponding to the
cloud model is obtained. The forward cloud model and the reverse cloud model generator are specifically
shown in Fig. 2.
Fig. 2: Schematic diagram of the forward generator and reverse generator.
Forward cloud generator algorithm:
Input: The digital features Ex, En, He of a qualitative concept, and the number N of given cloud
drops.
Output: The quantitative position of n cloud drops in the number domain space and each cloud drop
represents the certainty of the concept.
Algorithm:
1) Generate a normal random number Eni' with the expected En and the standard deviation of He;
2) Generate a normal random number xi expecting Ex and standard deviation Eni';
Fig. 2: Schematic diagram of the forward generator and reverse generator.
digital features C(Ex, En, He) of the cloud, mapping qual-itative concepts to quantitative locations in the numerical space. Achieving the conversion of qualitative concepts to quantitative values. The Back Cloud Generator (BCG) is the inverse process of the forward cloud generator, which realizes the conversion model from the quantitative value to the qualitative concept. According to the cloud drop that matches a certain distribution, the digital feature C corre-sponding to the cloud model is obtained. The forward cloud model and the reverse cloud model generator are specifically shown in Fig. 2.
Forward cloud generator algorithm:
Input: The digital features Ex, En, He of a qualitative concept, and the number N of given cloud drops.
Output: The quantitative position of n cloud drops in the number domain space and each cloud drop represents the certainty of the concept.
Algorithm:
1. Generate a normal random number Eni¢ with the ex-pected En and the standard deviation of He;
2. Generate a normal random number xi expecting Ex and standard deviation Eni’;
3. Let x be a specific quantitative value of the qualitative concept, called cloud drop;
4. Calculation: u x Ex Eni i i= - - ¢exp[ ( ) / ( ) ]2 22
5. Let μi be x the certainty of the qualitative concept;
6. Combine (xi, μi) to form 1 cloud drop;
7. Repeat the above steps until the required n drops are generated.
ANALYSIS OF RESULTS
Establishment of evaluation index system: The effect of grouting directly affects the safe and stable operation of hy-draulic engineering. However, due to the concealment of the project, the evaluation of grouting effect is often limited. The comprehensive evaluation index system of grouting effect should be based on a series of complementary indicators of organic factors. Establishing a complete evaluation index
system can objectively and accurately reflect the grouting effect of the area, so establish a reasonable evaluation index system for grouting effect. It is the basis for studying the effect of grouting. This paper establishes an index system for evaluation of grouting effects including target layer, criterion layer and index layer, as shown in Table 1. There are three levels from the top to the bottom. The first layer is the target layer t, that is, the target is the comprehensive evaluation of the grouting effect, the second layer is the criterion layer c, and the permeability and compactness of the post-irrigation rock mass are used as the evaluation criteria. The third layer is the index layer f, which includes four indexes of water permeability, acoustic wave velocity, crack filling rate and potability of the rock mass after irrigation.
Acquisition of evaluation indicators: Pressing the water test on the fractured rock mass and obtaining the permeability value of each hole section on the site is the most commonly used means for judging the permeability of the rock mass and the effect of grouting and seepage prevention. It can directly judge the effectiveness of grouting in each hole section. However, as more and more high dams are put into construc-tion, the results of conventional pressure water tests often cannot effectively reflect the permeability characteristics of rock masses. Therefore, the results of a single pressurized water test cannot be used as the sole basis for determining the grouting effect. On the basis of the water pressure test, more and more geophysical monitoring technologies have emerged, and as an auxiliary means to test and evaluate the grouting effect. The acoustic wave detection method in the hole has the characteristics of fast and timely. The sonic wave velocity has been used for tracking and rapid detection of grouting construction in many hydropower projects such as Ertan and Xiluodu in China. In addition, through the core drilling and digital drilling imaging method, the filling of the slurry in the crack can be directly observed, which is intuitive and reliable, and is not restricted by the formation. Therefore, the crack filling rate can also be used as an effective index in the evaluation of grouting effect. Therefore, in recent years, the water permeability test value of the water pressure test, the acoustic wave velocity result in the post-irrigation rock, and the crack filling condition are effective and reasonable evaluation indexes for the evaluation of grouting effect.
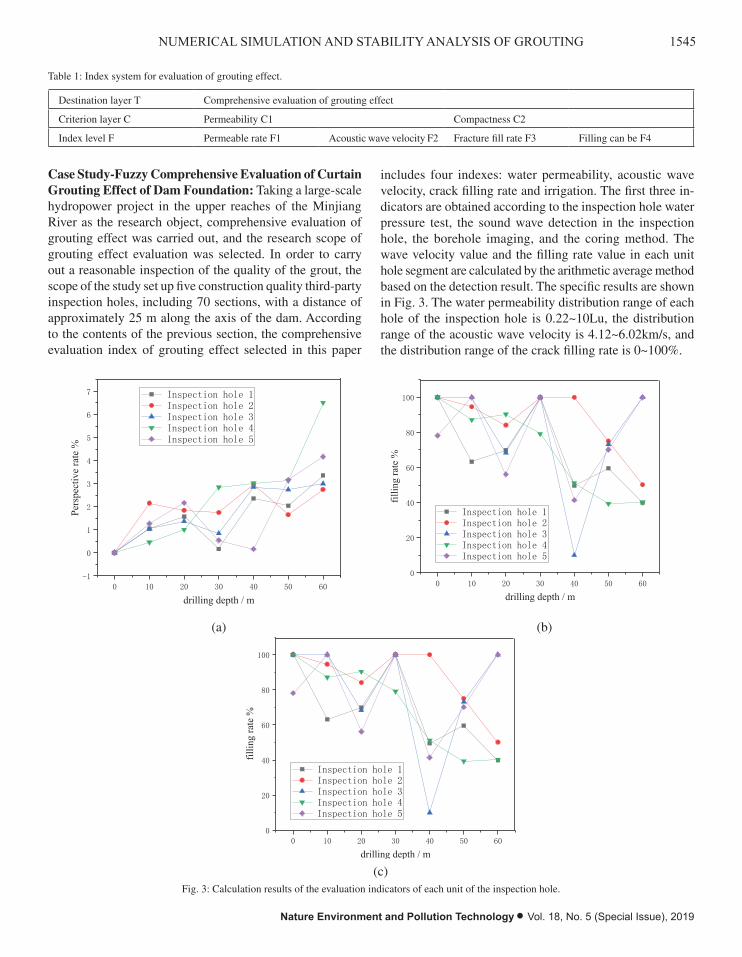
1545NUMERICAL SIMULATION AND STABILITY ANALYSIS OF GROUTING
Nature Environment and Pollution Technology • Vol. 18, No. 5 (Special Issue), 2019
Table 1: Index system for evaluation of grouting effect.
Destination layer T Comprehensive evaluation of grouting effect
Criterion layer C Permeability C1 Compactness C2
Index level F Permeable rate F1 Acoustic wave velocity F2 Fracture fill rate F3 Filling can be F4
Case Study-Fuzzy Comprehensive Evaluation of Curtain Grouting Effect of Dam Foundation: Taking a large-scale hydropower project in the upper reaches of the Minjiang River as the research object, comprehensive evaluation of grouting effect was carried out, and the research scope of grouting effect evaluation was selected. In order to carry out a reasonable inspection of the quality of the grout, the scope of the study set up five construction quality third-party inspection holes, including 70 sections, with a distance of approximately 25 m along the axis of the dam. According to the contents of the previous section, the comprehensive evaluation index of grouting effect selected in this paper
includes four indexes: water permeability, acoustic wave velocity, crack filling rate and irrigation. The first three in-dicators are obtained according to the inspection hole water pressure test, the sound wave detection in the inspection hole, the borehole imaging, and the coring method. The wave velocity value and the filling rate value in each unit hole segment are calculated by the arithmetic average method based on the detection result. The specific results are shown in Fig. 3. The water permeability distribution range of each hole of the inspection hole is 0.22~10Lu, the distribution range of the acoustic wave velocity is 4.12~6.02km/s, and the distribution range of the crack filling rate is 0~100%.
characteristics of fast and timely. The sonic wave velocity has been used for tracking and rapid detection
of grouting construction in many hydropower projects such as Ertan and Xiluodu in China. In addition,
through the core drilling and digital drilling imaging method, the filling of the slurry in the crack can be
directly observed, which is intuitive and reliable, and is not restricted by the formation. Therefore, the
crack filling rate can also be used as an effective index in the evaluation of grouting effect. Therefore, in
recent years, the water permeability test value of the water pressure test, the acoustic wave velocity result
in the post-irrigation rock, and the crack filling condition are effective and reasonable evaluation indexes
for the evaluation of grouting effect.
Case Study-Fuzzy Comprehensive Evaluation of Curtain Grouting Effect of Dam Foundation:
Taking a large-scale hydropower project in the upper reaches of the Minjiang River as the research object,
comprehensive evaluation of grouting effect was carried out, and the research scope of grouting effect
evaluation was selected. In order to carry out a reasonable inspection of the quality of the grout, the scope
of the study set up five construction quality third-party inspection holes, including 70 sections, with a
distance of approximately 25 m along the axis of the dam. According to the contents of the previous
section, the comprehensive evaluation index of grouting effect selected in this paper includes four
indexes: water permeability, acoustic wave velocity, crack filling rate and irrigation. The first three
indicators are obtained according to the inspection hole water pressure test, the sound wave detection in
the inspection hole, the borehole imaging, and the coring method. The wave velocity value and the filling
rate value in each unit hole segment are calculated by the arithmetic average method based on the
detection result. The specific results are shown in Fig. 3. The water permeability distribution range of
each hole of the inspection hole is 0.22~10Lu, the distribution range of the acoustic wave velocity is
4.12~6.02km/s, and the distribution range of the crack filling rate is 0~100%.
(a)
0 10 20 30 40 50 60-1
0
1
2
3
4
5
6
7
Pers
pect
ive
rate
%
drilling depth / m
Inspection hole 1 Inspection hole 2 Inspection hole 3 Inspection hole 4 Inspection hole 5
(b)
(c)
Fig. 3: Calculation results of the evaluation indicators of each unit of the inspection hole.
Since the irritability index is determined according to the quantitative relationship between the ash
injection amount and the hydraulic conductivity of each section of the grouting hole, the inspection hole
and the grouting hole do not coincide, so the monitoring result of the grouting hole closest to the
inspection hole is selected as the irritability index calculation. The input parameters, combined with the
inspection of the water permeability, the acoustic wave velocity and the crack filling rate, determine the
filling effect in the vicinity of the inspection hole. Using the Moye formula, the hydraulic conductivity
of each grouting section can be converted from the water permeability of the pre-irrigation water test.
𝑇𝑇 = 𝑄𝑄𝑤𝑤𝜌𝜌𝑤𝑤𝑔𝑔2𝜋𝜋∗𝛥𝛥𝑃𝑃𝑤𝑤
[1 + 𝑙𝑙𝑙𝑙( 𝐿𝐿2𝑟𝑟𝑏𝑏
)] …(1)
Where, Qw is the pressure water flow, L/min; ρw is the density of water, kg/m3; g is the acceleration
of gravity, m/s2; ΔPw is the effective pressure water pressure, MPa; L is the pressurized water test section
length, m; rb is the radius of the grouting hole, m. According to the judgment method of the irrigability
judgment and the RI value described above, the theoretical calculation value of the ash injection amount
0 10 20 30 40 50 600
20
40
60
80
100fil
ling
rate
%
drilling depth / m
Inspection hole 1 Inspection hole 2 Inspection hole 3 Inspection hole 4 Inspection hole 5
0 10 20 30 40 50 604.0
4.2
4.4
4.6
4.8
5.0
5.2
5.4
5.6
5.8
6.0
Aco
ustic
wav
e ve
loci
ty km/s
drilling depth / m
Inspection hole 1 Inspection hole 2 Inspection hole 3 Inspection hole 4 Inspection hole 5
(a) (b)
(b)
(c)
Fig. 3: Calculation results of the evaluation indicators of each unit of the inspection hole.
Since the irritability index is determined according to the quantitative relationship between the ash
injection amount and the hydraulic conductivity of each section of the grouting hole, the inspection hole
and the grouting hole do not coincide, so the monitoring result of the grouting hole closest to the
inspection hole is selected as the irritability index calculation. The input parameters, combined with the
inspection of the water permeability, the acoustic wave velocity and the crack filling rate, determine the
filling effect in the vicinity of the inspection hole. Using the Moye formula, the hydraulic conductivity
of each grouting section can be converted from the water permeability of the pre-irrigation water test.
𝑇𝑇 = 𝑄𝑄𝑤𝑤𝜌𝜌𝑤𝑤𝑔𝑔2𝜋𝜋∗𝛥𝛥𝑃𝑃𝑤𝑤
[1 + 𝑙𝑙𝑙𝑙( 𝐿𝐿2𝑟𝑟𝑏𝑏
)] …(1)
Where, Qw is the pressure water flow, L/min; ρw is the density of water, kg/m3; g is the acceleration
of gravity, m/s2; ΔPw is the effective pressure water pressure, MPa; L is the pressurized water test section
length, m; rb is the radius of the grouting hole, m. According to the judgment method of the irrigability
judgment and the RI value described above, the theoretical calculation value of the ash injection amount
0 10 20 30 40 50 600
20
40
60
80
100
fillin
g ra
te %
drilling depth / m
Inspection hole 1 Inspection hole 2 Inspection hole 3 Inspection hole 4 Inspection hole 5
0 10 20 30 40 50 604.0
4.2
4.4
4.6
4.8
5.0
5.2
5.4
5.6
5.8
6.0
Aco
ustic
wav
e ve
loci
ty km/s
drilling depth / m
Inspection hole 1 Inspection hole 2 Inspection hole 3 Inspection hole 4 Inspection hole 5
(c)Fig. 3: Calculation results of the evaluation indicators of each unit of the inspection hole.
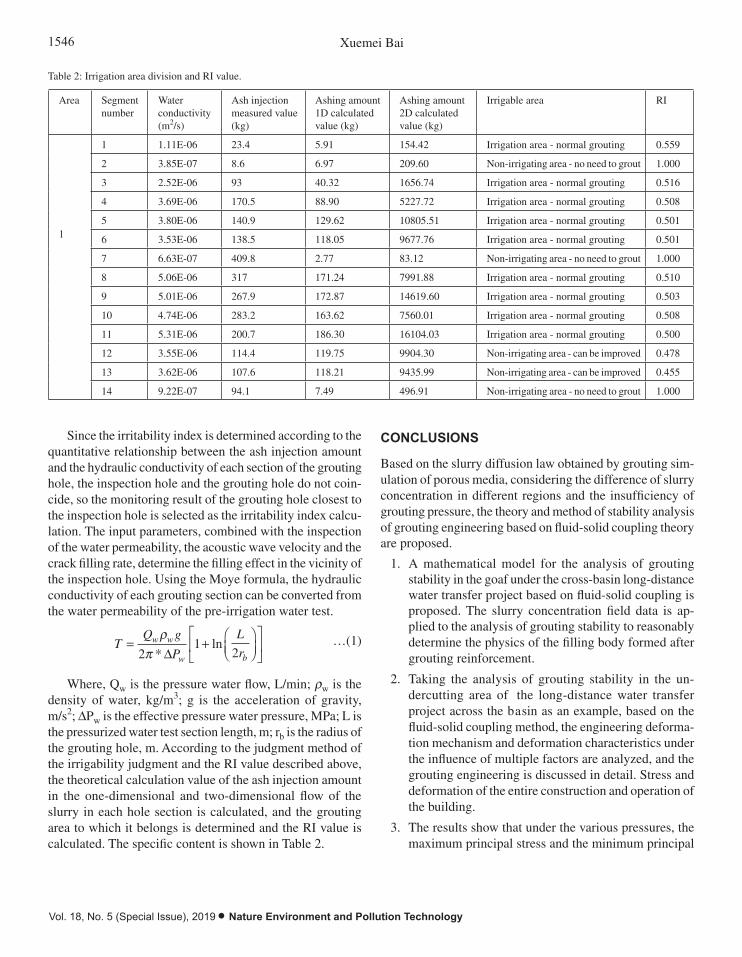
1546 Xuemei Bai
Vol. 18, No. 5 (Special Issue), 2019 • Nature Environment and Pollution Technology
Table 2: Irrigation area division and RI value.
Area Segmentnumber
Water conductivity (m2/s)
Ash injection measured value (kg)
Ashing amount 1D calculated value (kg)
Ashing amount 2D calculated value (kg)
Irrigable area RI
1
1 1.11E-06 23.4 5.91 154.42 Irrigation area - normal grouting 0.559
2 3.85E-07 8.6 6.97 209.60 Non-irrigating area - no need to grout 1.000
3 2.52E-06 93 40.32 1656.74 Irrigation area - normal grouting 0.516
4 3.69E-06 170.5 88.90 5227.72 Irrigation area - normal grouting 0.508
5 3.80E-06 140.9 129.62 10805.51 Irrigation area - normal grouting 0.501
6 3.53E-06 138.5 118.05 9677.76 Irrigation area - normal grouting 0.501
7 6.63E-07 409.8 2.77 83.12 Non-irrigating area - no need to grout 1.000
8 5.06E-06 317 171.24 7991.88 Irrigation area - normal grouting 0.510
9 5.01E-06 267.9 172.87 14619.60 Irrigation area - normal grouting 0.503
10 4.74E-06 283.2 163.62 7560.01 Irrigation area - normal grouting 0.508
11 5.31E-06 200.7 186.30 16104.03 Irrigation area - normal grouting 0.500
12 3.55E-06 114.4 119.75 9904.30 Non-irrigating area - can be improved 0.478
13 3.62E-06 107.6 118.21 9435.99 Non-irrigating area - can be improved 0.455
14 9.22E-07 94.1 7.49 496.91 Non-irrigating area - no need to grout 1.000
Since the irritability index is determined according to the quantitative relationship between the ash injection amount and the hydraulic conductivity of each section of the grouting hole, the inspection hole and the grouting hole do not coin-cide, so the monitoring result of the grouting hole closest to the inspection hole is selected as the irritability index calcu-lation. The input parameters, combined with the inspection of the water permeability, the acoustic wave velocity and the crack filling rate, determine the filling effect in the vicinity of the inspection hole. Using the Moye formula, the hydraulic conductivity of each grouting section can be converted from the water permeability of the pre-irrigation water test.
TQ g
P
L
rw w
w b
= +ÊËÁ
ˆ¯̃
È
ÎÍ
˘
˚˙
rp2
12*
lnD
…(1)
Where, Qw is the pressure water flow, L/min; rw is the density of water, kg/m3; g is the acceleration of gravity, m/s2; DPw is the effective pressure water pressure, MPa; L is the pressurized water test section length, m; rb is the radius of the grouting hole, m. According to the judgment method of the irrigability judgment and the RI value described above, the theoretical calculation value of the ash injection amount in the one-dimensional and two-dimensional flow of the slurry in each hole section is calculated, and the grouting area to which it belongs is determined and the RI value is calculated. The specific content is shown in Table 2.
CONCLUSIONS
Based on the slurry diffusion law obtained by grouting sim-ulation of porous media, considering the difference of slurry concentration in different regions and the insufficiency of grouting pressure, the theory and method of stability analysis of grouting engineering based on fluid-solid coupling theory are proposed.
1. A mathematical model for the analysis of grouting stability in the goaf under the cross-basin long-distance water transfer project based on fluid-solid coupling is proposed. The slurry concentration field data is ap-plied to the analysis of grouting stability to reasonably determine the physics of the filling body formed after grouting reinforcement.
2. Taking the analysis of grouting stability in the un-dercutting area of the long-distance water transfer project across the basin as an example, based on the fluid-solid coupling method, the engineering deforma-tion mechanism and deformation characteristics under the influence of multiple factors are analyzed, and the grouting engineering is discussed in detail. Stress and deformation of the entire construction and operation of the building.
3. The results show that under the various pressures, the maximum principal stress and the minimum principal

1547NUMERICAL SIMULATION AND STABILITY ANALYSIS OF GROUTING
Nature Environment and Pollution Technology • Vol. 18, No. 5 (Special Issue), 2019
stress of the underlying goaf and the overlying rock layers of the water transfer project do not exceed the tensile and compressive strengths of various rock mass-es. No tensile or compressive failure occurred in the rock mass, and the research provided technical support for guiding the stability design and construction of the water conservancy project. The practice shows that the theory and method proposed in this paper can provide theoretical basis and technical support for the grouting simulation, grouting effect evaluation and stability anal-ysis of the hydropower station dam foundation fissure grouting and inter-basin long-distance water transfer project.
REFERENCES
Deng, S., Wang, X., Xuefei, A.O., Ren, B. and Ruijin, L.I. 2016. Three-di-mensional numerical simulation of curtain grouting in the dam bedrock based on Binghamian grouts. J. Hydraul. Eng., 47(2): 165-172.
Dong-Yang, L.I., Chang, S.J. and Wang, Z.Y. 2016. Numerical simulation and analysis for spin-yaw lock-in of a missile. Journal of Ballistics.
Gordeeva, V.Y. and Lyushnin, A.V. 2017. Numerical simulation and stability
analysis of solutocapillary effect in ultrathin films. Eur. Phys. J-Spec. Top, 226(6): 1219-1228.
Hao, Z., Ming, X. and Chen, J. 2016. Analysis of a numerical simulation method of fully grouted and anti-seismic support bolts in underground geotechnical engineering. Comput. Geotech., 76: 61-74.
Iwasaki, T., Shimizu, Y. and Kimura, I. 2016. Sensitivity of free bar mor-phology in rivers to secondary flow modeling: linear stability analysis and numerical simulation. Adv. Water Resour., 92: 57-72.
Lai, J.X., Fan, H.B., Xie, Y.L., Liu, B.Z., Highway, S.O. and University, C. 2016. Consolidation analysis of jet grouting pile reinforcement in loess tunnel. Journal of Changan University, 36(2): 73-79.
Meng, Q., Han, L., Qiao, W., Lin, D. and Hao, L.I. 2016. Numerical sim-ulation research of bolt-grouting supporting mechanism in deep soft rock roadway. Journal of Mining and Safety Engineering, 33(1): 27-34.
Shao-Feng, Y.U., Ai-Xiang, W.U., Wang, Y.M. and Tao, L.I. 2017. Pre-re-inforcement grout in fractured rock masses and numerical simulation for optimizing shrinkage stoping configuration. J. Cent. South Univ. (English Edition), 24(12): 2924-2931.
Wang, X.L., Rui-Jin, L.I., Xue-Fei, A.O. and Deng, S.H. 2018. Three-di-mensional numerical simulation of grouting in stochastic fracture network of dam bedrock in hydropower engineering. Eng. Mech., 35(1): 148-159.
Zhang, Q.Y., Duan, K., Jiao, Y.Y. and Xiang, W. 2017. Physical model test and numerical simulation for the stability analysis of deep gas storage cavern group located in bedded rock salt formation. Int. J. Rock. Mech. Min. Sci., 94: 43-54.

Vol. 18, No. 5 (Special Issue), 2019 • Nature Environment and Pollution Technology
1548

Research on Automatic Analysis Technology of Remote Sensing Monitoring Based on GIS
Juan Ling*, Yuanfang Wu* and Jiabao Ding***Zaozhuang University, Shandong, China**Shaanxi Normal University, Shanxi, China
ABSTRACT
GIS remote sensing technology provides a new generation of observation methods, description languages and thinking tools for scientific research, government management and social production. Therefore, we need to increase research and development of GIS. This paper proposes relevant methods, key points and problems to be solved through the combination of GIS remote sensing automation integration and integrated application. The remote sensing monitoring is the main data source and data updating method of GIS. The research further supports the comprehensive development and utilization of remote sensing information.
INTRODUCTION
Geographic Information System (GIS) is a new technology that began to develop in the mid-1960s. It was originally for solving geographical problems, but now it has become an interdisciplinary subject involving environmental science, surveying and mapping, computer technology, economic management, etc., collecting, storing, managing, describing and analysing the earth’s surface and space and geography, distribution of related data information systems (Wegmann et al. 2017, Zhang et al. 2017). It is based on the geospa-tial database, with the support of computer hardware and software environment, collecting, managing, operating, analysing, simulating and displaying spatially related data, and adopting geographic model analysis method to provide multiple spaces and dynamics at the right time. Geographic information system, a type of computer application system established for geographic research, comprehensive evalua-tion, management, and quantitative analysis decision-making services. In short, GIS is a space-based data management system with computer graphics as a tool for geographic graphics and spatial location (Luo et al. 2017). It is a special and important management information system.
This paper reviews the remote integration monitoring automation integration technology of GIS, comprehen-sively summarizes, analyses and compares the relationship between geographic information system (GIS) and remote sensing (RS), and analyses geographic information system
(GIS) and remote sensing (RS). The integration between the two illustrates that RS is the main data source and data update method of GIS. It also explains the application and development of GIS and further supports the comprehensive development and utilization of remote sensing information (An & Kumar 2017).
PAST RESEARCH
In 1963, Canadian surveyor Chen, L. first proposed the meaning of the term GIS and built the world’s first Canadian Geographic Information System (CGIS) in three years and used it for Canadian land and resource management and planning (Chen et al. 2018a). Due to the low level of com-puter technology, small storage capacity and slow tape access speed, GIS had more machine-assisted graphics colours, and the geoscience analysis function was extremely simple. After the 1970s, the rapid development of computer hardware and software technology provided a powerful means for the input, storage, retrieval and output of spatial data, prompting the rapid development of GIS in the practical direction. Some countries have established many special land information systems and geographic information systems have played a major role in natural resource management and planning (Veronesi et al. 2017, Zhan et al. 2018, Yu et al. 2017). Canada, the former Federal Republic of Germany, Sweden and Japan had also developed their own GIS. At the same time, some commercial companies had become active and
Nat. Env. & Poll. Tech.Website: www.neptjournal.com
Received: 22-08-2019Accepted: 29-10-2019
Key Words:GISRemote sensing monitoring AutomationDesertificationUrbanization
2019pp. 1549-1554 Vol. 18
p-ISSN: 0972-6268 No. 5 (Special Issue)
Nature Environment and Pollution Technology An International Quarterly Scientific Journal
Original Research Paper
e-ISSN: 2395-3454
Open Access

1550 Juan Ling et al.
Vol. 18, No. 5 (Special Issue), 2019 • Nature Environment and Pollution Technology
software was been welcomed in the market. During this period, many universities and research institutions began research on GIS software design and application. In the 1980s, the development of GIS system software and appli-cation software made GIS applications shift from solving infrastructure planning (such as roads and transmission lines) to more complex regional development and planning. For example, geographical factors such as agricultural use of land and urbanization had become an indispensable basis for investment decisions. Combined with satellite remote sensing technology, GIS began to be used for global problem research, such as global desertification, evaluation of global habitable areas, El Niño and acid rain, nuclear proliferation and nuclear waste, and global change and global monitoring (Olorunfemi et al. 2018). At the same time, the development of GIS software had also achieved great results, and some representative GIS software, such as Arc/Info, MrcoSta-tion, MGE Intergraph, Auto CAD, etc., emerged. Since the 1990s, due to the smooth flow of information highways, the geographic information industry has been established, and GIS has gradually penetrated into all walks of life and even thousands of households (Chen 2018b).
GIS REMOTE SENSING MONITORING AUTOMATION RESEARCH
Remote sensing (RS) and geographic information systems (GIS) are the two major spatial technology tools that support modern geography. In recent years, their combination has attracted widespread attention and research. At the same time, as their application fields are from qualitative to quantitative, from static to dynamic, from the description of the status quo to the prediction, their integration has gradually evolved from the low-level to the advanced stage. Remote sensing is a science and technology that uses a sensor device to measure, analyse, and determine the nature of a target without directly contacting the research object. Some people refer to remote sensing as “distant perception.” Remote sensing technology has the characteristics of macroscopic, real-time and dynamic in acquiring ground object information. Geographic Infor-mation System (GIS) is based on geographically oriented data, with the support of computer hardware and software, collecting, managing, operating, analysing, simulating and displaying spatially related data, and using geographic model analysis methods to provide timely and various directional and dynamic geographic information, a computer technology system built for geographic research and geographic decision making services. GIS and RS are two separate technical fields developed independently, but there is a close relationship between them (Boschetti et al. 2017). On the one hand, RS provides multi-temporal and multi-band information sourc-es for GIS to make the information in the system current;
on the other hand, RS provides geographic model analysis function for data management of GIS, providing tools for RS information extraction and geoscience analysis. The auxiliary data in GIS improves the classification accuracy and mapping accuracy of remote sensing information. Therefore, RS is the main data source and data update method of GIS. At the same time, the application and development of GIS further supports the comprehensive development and utilization of remote sensing information.
Automated integration: Integration means to form an organic whole by combining the dispersed parts. Formally, data integration is a logical or physical organic concentration of geospatial data of different origins, formats, and charac-teristics. Organic refers to the integration of data attributes, time and space characteristics, data itself and its expression in data integration. Remote sensing (RS) is a very important means or tool for spatial information acquisition. Geographic information system (GIS) is an important tool for manag-ing information, analysing information and predicting the future. The close combination of the two is changing the human to the earth. With the deterioration of human living environment, the management of water resources has been increasingly valued by governments and scientists. The large-scale water environment not only costs a lot of money and huge manpower, but it can’t be done. People have tried different methods of comprehensive analysis of data, using some geoscience data as auxiliary data, so that the accuracy of remote sensing applications greatly improved. With the development of GIS, it is recognized that although RS and GIS are relatively independent technical systems, the same objects of water quality research make them organically com-bined. In the GIS environment, the combination of multiple data including remote sensing signals can not only improve the accuracy of remote sensing information interpretation, but GIS will also benefit from remote sensing systems in terms of participating in system data analysis. In general, RS pro-vides GIS basic data, which in turn serves RS. GIS can store, retrieve, calculate, and analyse these data, and at the same time provide assistance for remote sensing classification and correction. The integrated technical methods can include:
1. Remote sensing image correction: According to the relationship between the aspect and the remote sens-ing image, the digital correlation technology is used to automatically select the control points to perform geometric correction of the remote sensing image.
2. Composite display: The superimposed composite display of remote sensing and geographic information system can help users to quickly and accurately select the training sample area or directly edit the screen of the classification result.

1551AUTOMATIC ANALYSIS OF REMOTE SENSING MONITORING BASED ON GIS
Nature Environment and Pollution Technology • Vol. 18, No. 5 (Special Issue), 2019
3. Establishing a digital elevation model: The parallax model can directly generate a digital elevation model from a remote sensing stereo image, eliminating the heavy work of digitizing the terrain contours and avoid-ing the errors caused by ground elevation interpolation.
4. Automated or semi-automatic extraction of thematic information: With the support of the GIS, the thematic information is automatically extracted from the remote sensing image and the GIS database is updated.
5. Remote sensing image geographic information system operation: Calling the geographic information system image manipulation function to process remote sensing images, including digital transformation, statistical calculation and so on.
6. Remote sensing and geographic information system integration technology system: An integrated system integrating remote sensing processing and geographic information system functions.
7. Remote sensing image-assisted GIS spatial data ac-quisition and update: GIS spatial data acquisition and update requires remote sensing imagery for assistance (Shao et al. 2018).
Automated integration methods and applications: The combination of GIS and remote sensing images usually has the following three ways:
l. Using a software interface, this combination is econom-ical and practical, and its essence is to solve the data conversion between the geographic information system and the remote sensing image processing system. In the specific implementation, some combined systems have been developed. There are two main methods: one is to use the geographic information system as a subsystem in the remote sensing technology system; the other is to extend the remote sensing image processing function in the geographic information system. Many systems currently use the latter approach.
2. Develop a standard spatial data exchange format as an intermediate format standard for the conversion between geographic information systems and remote sensing image processing, and between different types of geographic information systems (Yu et al. 2017).
3. The geographic information system and the remote sensing image processing system are combined to form a complete system. In this system, the two have become a unity, realizing a true combination. This requires the design of a more efficient data structure model and spatial data management system it can coordinate management of vector data and raster data and achieve comprehensive query and model analysis of spatial data.
ANALYSIS OF RESULTS
Automated integration analysis: RS and GIS are two mutually independent technical fields. With the continuous development of their application fields and their own con-tinuous development, from qualitative to quantitative, from static to dynamic, from the status quo to the prediction, their combination has gradually evolved from a low-level to an advanced stage. The combination of RS and GIS can not only ensure the efficient and stable information source of geographic information system, but also real-time pro-cessing, scientific management and comprehensive analysis of remote sensing information to achieve the purpose of monitoring, forecasting and decision-making. Through the above analysis, the automation of GIS and RS mainly has the following aspects and advantages: (1) Remote sensing can obtain large-area regional data. (2) Remote sensing broadens the data hierarchy. (3) Remote sensing transfers field work to the laboratory. (4) Geographic information systems can make full use of remote sensing information. Geographic information systems use a variety of remote sensing data to establish mathematical analysis models of various natural el-ements, quantitatively study various natural condition factors or natural resources. (5) Mathematical models are the link between remote sensing and geographic information systems.
Automated integration approach and application anal-ysis: According to the current research status, related auto-mation can be divided into three categories which basically reflect the depth of the comprehensive application of the two and the level of analysis problems.
l. Level 1 combination method: This combination method is independent and parallel to each other. It exchanges data between two selected image analysis systems through a software interface. The first level combination method can simultaneously display GIS data (vector structure) and RS image (grid structure), and input the image processing result into GIS, and also input the result of GIS spatial analysis into image processing software. This combination is typically achieved by adding a data conversion interface between the existing GIS and image analysis system (see Fig. 1). This is an independent, parallel approach where the two software modes are only connected in data exchange.
2. Secondary combination mode: Two software modules share one user interface, and serial or parallel processing of raster-vector structure can be implemented. It should have the ability to directly perform image processing of GIS vector data, and unify the ability of different data input methods, error analysis and remote sensing data to simulate temporal changes (Fig. 2). This is a seamless mode where two software modules share a single user interface and can be displayed simultaneously.
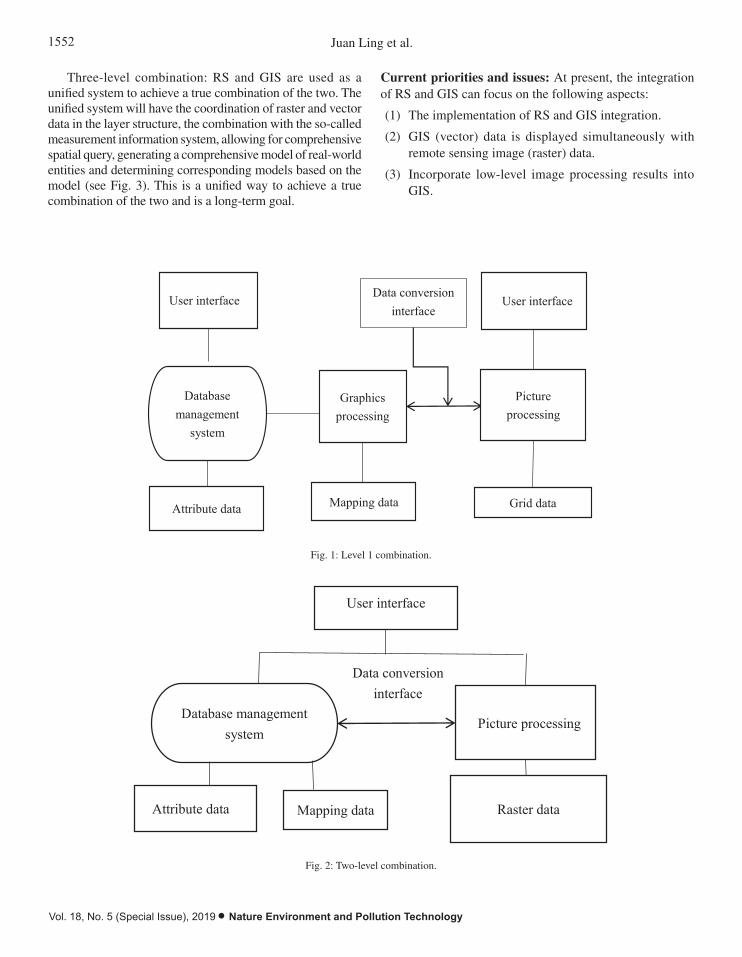
1552 Juan Ling et al.
Vol. 18, No. 5 (Special Issue), 2019 • Nature Environment and Pollution Technology
Three-level combination: RS and GIS are used as a unified system to achieve a true combination of the two. The unified system will have the coordination of raster and vector data in the layer structure, the combination with the so-called measurement information system, allowing for comprehensive spatial query, generating a comprehensive model of real-world entities and determining corresponding models based on the model (see Fig. 3). This is a unified way to achieve a true combination of the two and is a long-term goal.
continuous development of their application fields and their own continuous development, from
qualitative to quantitative, from static to dynamic, from the status quo to the prediction, their combination
has gradually evolved from a low-level to an advanced stage. The combination of RS and GIS can not
only ensure the efficient and stable information source of geographic information system, but also real-
time processing, scientific management and comprehensive analysis of remote sensing information to
achieve the purpose of monitoring, forecasting and decision-making. Through the above analysis, the
automation of GIS and RS mainly has the following aspects and advantages: (1) Remote sensing can
obtain large-area regional data. (2) Remote sensing broadens the data hierarchy. (3) Remote sensing
transfers field work to the laboratory. (4) Geographic information systems can make full use of remote
sensing information. Geographic information systems use a variety of remote sensing data to establish
mathematical analysis models of various natural elements, quantitatively study various natural condition
factors or natural resources. (5) Mathematical models are the link between remote sensing and geographic
information systems.
Automated integration approach and application analysis: According to the current research status,
related automation can be divided into three categories which basically reflect the depth of the
comprehensive application of the two and the level of analysis problems.
(l) Level 1 combination method: This combination method is independent and parallel to each other.
It exchanges data between two selected image analysis systems through a software interface. The first
level combination method can simultaneously display GIS data (vector structure) and RS image (grid
structure), and input the image processing result into GIS, and also input the result of GIS spatial analysis
into image processing software. This combination is typically achieved by adding a data conversion
interface between the existing GIS and image analysis system (see Fig. 1). This is an independent, parallel
approach where the two software modes are only connected in data exchange.
Fig. 1: Level 1 combination.
(2) Secondary combination mode: Two software modules share one user interface, and serial or
parallel processing of raster-vector structure can be implemented. It should have the ability to directly
User interface
Database management
system
Attribute data
Graphics processing
Mapping data
Picture processing
User interface
Grid data
Data conversion interface
Fig. 1: Level 1 combination.
perform image processing of GIS vector data, and unify the ability of different data input methods, error
analysis and remote sensing data to simulate temporal changes (see Fig. 2). This is a seamless mode
where two software modules share a single user interface and can be displayed simultaneously.
User interface
Database management system
Picture processing
Attribute data Mapping data Raster data
Data conversion interface
Fig. 2: Two-level combination.
Current priorities and issues: At present, the integration of RS and GIS can focus on the following aspects:
(1) The implementation of RS and GIS integration.
(2) GIS (vector) data is displayed simultaneously with remote sensing image (raster) data.
(3) Incorporate low-level image processing results into GIS.
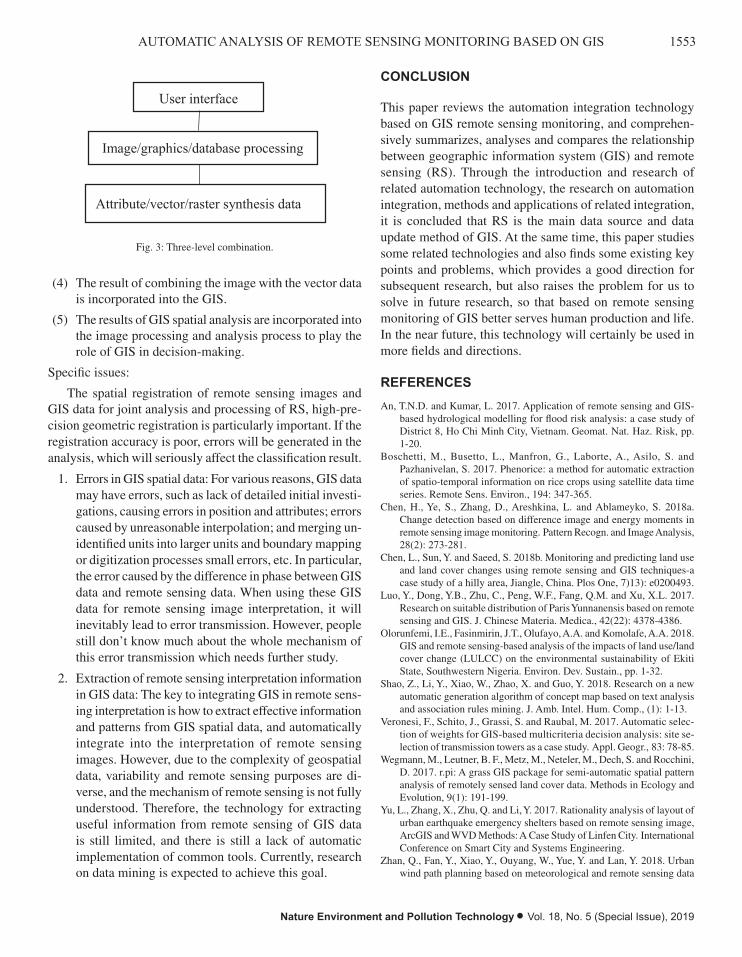
1553AUTOMATIC ANALYSIS OF REMOTE SENSING MONITORING BASED ON GIS
Nature Environment and Pollution Technology • Vol. 18, No. 5 (Special Issue), 2019
Fig. 2: Two-level combination.
Three-level combination: RS and GIS are used as a unified system to achieve a true combination of
the two. The unified system will have the coordination of raster and vector data in the layer structure, the
combination with the so-called measurement information system, allowing for comprehensive spatial
query, generating a comprehensive model of real-world entities and determining corresponding models
based on the model (see Fig. 3). This is a unified way to achieve a true combination of the two and is a
long-term goal.
Fig. 3: Three-level combination.
Current priorities and issues: At present, the integration of RS and GIS can focus on the following
aspects:
(l) The implementation of RS and GIS integration.
(2) GIS (vector) data is displayed simultaneously with remote sensing image (raster) data.
(3) Incorporate low-level image processing results into GIS.
(4) The result of combining the image with the vector data is incorporated into the GIS.
(5) The results of GIS spatial analysis are incorporated into the image processing and analysis
process to play the role of GIS in decision-making.
Specific issues:
The spatial registration of remote sensing images and GIS data for joint analysis and processing of
RS, high-precision geometric registration is particularly important. If the registration accuracy is poor,
errors will be generated in the analysis, which will seriously affect the classification result.
1. Errors in GIS spatial data: For various reasons, GIS data may have errors, such as lack of detailed
initial investigations, causing errors in position and attributes; errors caused by unreasonable
interpolation; and merging unidentified units into larger units and boundary mapping or digitization
processes small errors, etc. In particular, the error caused by the difference in phase between GIS data
and remote sensing data. When using these GIS data for remote sensing image interpretation, it will
inevitably lead to error transmission. However, people still don't know much about the whole mechanism
of this error transmission which needs further study.
2. Extraction of remote sensing interpretation information in GIS data: The key to integrating GIS
User interface
Image/graphics/database processing
Attribute/vector/raster synthesis data
Fig. 3: Three-level combination.
(4) The result of combining the image with the vector data is incorporated into the GIS.
(5) The results of GIS spatial analysis are incorporated into the image processing and analysis process to play the role of GIS in decision-making.
Specific issues:
The spatial registration of remote sensing images and GIS data for joint analysis and processing of RS, high-pre-cision geometric registration is particularly important. If the registration accuracy is poor, errors will be generated in the analysis, which will seriously affect the classification result.
1. Errors in GIS spatial data: For various reasons, GIS data may have errors, such as lack of detailed initial investi-gations, causing errors in position and attributes; errors caused by unreasonable interpolation; and merging un-identified units into larger units and boundary mapping or digitization processes small errors, etc. In particular, the error caused by the difference in phase between GIS data and remote sensing data. When using these GIS data for remote sensing image interpretation, it will inevitably lead to error transmission. However, people still don’t know much about the whole mechanism of this error transmission which needs further study.
2. Extraction of remote sensing interpretation information in GIS data: The key to integrating GIS in remote sens-ing interpretation is how to extract effective information and patterns from GIS spatial data, and automatically integrate into the interpretation of remote sensing images. However, due to the complexity of geospatial data, variability and remote sensing purposes are di-verse, and the mechanism of remote sensing is not fully understood. Therefore, the technology for extracting useful information from remote sensing of GIS data is still limited, and there is still a lack of automatic implementation of common tools. Currently, research on data mining is expected to achieve this goal.
CONCLUSION
This paper reviews the automation integration technology based on GIS remote sensing monitoring, and comprehen-sively summarizes, analyses and compares the relationship between geographic information system (GIS) and remote sensing (RS). Through the introduction and research of related automation technology, the research on automation integration, methods and applications of related integration, it is concluded that RS is the main data source and data update method of GIS. At the same time, this paper studies some related technologies and also finds some existing key points and problems, which provides a good direction for subsequent research, but also raises the problem for us to solve in future research, so that based on remote sensing monitoring of GIS better serves human production and life. In the near future, this technology will certainly be used in more fields and directions.
REFERENCES
An, T.N.D. and Kumar, L. 2017. Application of remote sensing and GIS-based hydrological modelling for flood risk analysis: a case study of District 8, Ho Chi Minh City, Vietnam. Geomat. Nat. Haz. Risk, pp. 1-20.
Boschetti, M., Busetto, L., Manfron, G., Laborte, A., Asilo, S. and Pazhanivelan, S. 2017. Phenorice: a method for automatic extraction of spatio-temporal information on rice crops using satellite data time series. Remote Sens. Environ., 194: 347-365.
Chen, H., Ye, S., Zhang, D., Areshkina, L. and Ablameyko, S. 2018a. Change detection based on difference image and energy moments in remote sensing image monitoring. Pattern Recogn. and Image Analysis, 28(2): 273-281.
Chen, L., Sun, Y. and Saeed, S. 2018b. Monitoring and predicting land use and land cover changes using remote sensing and GIS techniques-a case study of a hilly area, Jiangle, China. Plos One, 7)13): e0200493.
Luo, Y., Dong, Y.B., Zhu, C., Peng, W.F., Fang, Q.M. and Xu, X.L. 2017. Research on suitable distribution of Paris Yunnanensis based on remote sensing and GIS. J. Chinese Materia. Medica., 42(22): 4378-4386.
Olorunfemi, I.E., Fasinmirin, J.T., Olufayo, A.A. and Komolafe, A.A. 2018. GIS and remote sensing-based analysis of the impacts of land use/land cover change (LULCC) on the environmental sustainability of Ekiti State, Southwestern Nigeria. Environ. Dev. Sustain., pp. 1-32.
Shao, Z., Li, Y., Xiao, W., Zhao, X. and Guo, Y. 2018. Research on a new automatic generation algorithm of concept map based on text analysis and association rules mining. J. Amb. Intel. Hum. Comp., (1): 1-13.
Veronesi, F., Schito, J., Grassi, S. and Raubal, M. 2017. Automatic selec-tion of weights for GIS-based multicriteria decision analysis: site se-lection of transmission towers as a case study. Appl. Geogr., 83: 78-85.
Wegmann, M., Leutner, B. F., Metz, M., Neteler, M., Dech, S. and Rocchini, D. 2017. r.pi: A grass GIS package for semi-automatic spatial pattern analysis of remotely sensed land cover data. Methods in Ecology and Evolution, 9(1): 191-199.
Yu, L., Zhang, X., Zhu, Q. and Li, Y. 2017. Rationality analysis of layout of urban earthquake emergency shelters based on remote sensing image, ArcGIS and WVD Methods: A Case Study of Linfen City. International Conference on Smart City and Systems Engineering.
Zhan, Q., Fan, Y., Xiao, Y., Ouyang, W., Yue, Y. and Lan, Y. 2018. Urban wind path planning based on meteorological and remote sensing data

1554 Juan Ling et al.
Vol. 18, No. 5 (Special Issue), 2019 • Nature Environment and Pollution Technology
and GIS-based ventilation analysis. Big Data Support of Urban Planning and Management, pp. 415-433.
Zhang, J., Zhang, J., Du, X., Kang, H. and Qiao, M. 2017. An overview of
ecological monitoring based on geographic information system (GIS) and remote sensing (RS) technology in China. In: IOP Conference Series: Earth and Environmental Science, 94(1): 012056.

Study on Calculation Method of Ecological Environment Flow Rate of Water Conservancy and Hydropower Project in Coal Mining Area
Ying Dong*, Xijun Wu**and Ahmad Jalal Khan Chowdhury****School of Civil Engineering, Yulin University, Yulin, Shaanxi, 719000, China**Shaanxi Key Laboratory of Ecological Restoration in Shanbei Mining Area, Yulin University, Yulin, Shaanxi, 719000, China***Department of Marine Science, Kulliyyah of Science, International Islamic University Malaysia 25200 Kuantan, Malaysia
ABSTRACT
The ecological environment is the basic natural condition related to human survival and development. Protecting and improving the ecological environment is the basis for ensuring social and economic sustainable development and a virtuous cycle of water resources, especially coal mining areas. This paper hopes to understand and master all kinds of calculation methods for the discharge of ecological flow in water conservancy and hydropower projects at home and abroad, analyse the advantages and disadvantages and application scope of various methods, and propose a more reasonable quantitative calculation method of ecological flow in combination with typical water conservancy and hydropower engineering research. The calculations show that most of the aquatic organisms have excellent habitat conditions when the river’s inner diameter flow is 60% of the average annual river flow. It is hoped that it will play a reference role for other similar water conservancy and hydropower projects in China, realize the coordination of water resources development and river ecological protection, implement ecological water conservancy and ecological hydropower model, and solve the ecological problems that restrict the development of water conservancy and hydropower in China to a certain extent.
INTRODUCTION
For a long time, coal resources, as an important material basis for China’s economic development, have made great contributions to economic development and social progress, and have also had a serious impact on the ecological envi-ronment of coal mining areas, bringing many problems that are difficult to avoid, such as surface subsidence, vegetation degradation, meteorite accumulation, river runoff reduction, groundwater source dryness and decline in cultivated land productivity. In view of the fact that China’s energy consump-tion mainly depends on the status quo of coal resources and the trend of coal resource development gradually shifting to the ecologically fragile western region, this paper will analyse the cumulative effect of ecological environment in coal mining area from the perspective of sustainable development of mining area and adhering to the concept of “green development”. Mechanism, analysis and discussion of measures and methods for adaptive management of cu-mulative effects of ecological environment in mining areas and seek mining development models that are suitable for China’s national conditions, coordinated with coal resources development and ecological environment (Chen et al. 2016). The 21st century is a century of knowledge economy and global economic integration. The interaction between eco-
nomic activities and ecological environment is deepening. Global population growth, resource shortage, environmental pollution and ecological deterioration have become common problems faced by mankind. More and more countries and regions regard ecological security as the basic strategy of national security, and seeking coordinated development of economy, population, resources and environment has become a global common action.
This paper studies the calculation of the ecological base flow of the river aquatic ecosystem in the coal mining area, and analyses the relevant calculation methods to obtain the ecological base flow in the coal mining area, which is the ecological environment of the water conservancy and hydro-power project in the future coal mining area. The protection provides a good theoretical basis.
EARLIER RESEARCH
Since the 26th International Geological Congress proposed the geological environment issue in 1980, the awareness of the participation of the world’s earth workers in environmen-tal research has gradually strengthened (Xue et al. 2017, Ying et al. 2018). The geological institutions of many countries have gradually shifted their work to environmental geological work, and environmental geological research has been under
Nat. Env. & Poll. Tech.Website: www.neptjournal.com
Received: 15-08-2019Accepted: 15-10-2019
Key Words:Ecological environmentWater conservancyHydropowerCoal mining areaFlow calculation
2019pp. 1555-1560 Vol. 18
p-ISSN: 0972-6268 No. 5 (Special Issue)
Nature Environment and Pollution Technology An International Quarterly Scientific Journal
Original Research Paper
e-ISSN: 2395-3454
Open Access
1556 Ying Dong et al.
Vol. 18, No. 5 (Special Issue), 2019 • Nature Environment and Pollution Technology
rapid development. The United States, Britain, Canada, Ja-pan, Australia, Russia, France, Germany, China, India, Italy and other countries have carried out fruitful research accord-ing to the actual conditions of various countries, and formed many sub-disciplines, such as: environmental hydrogeology studies, environmental engineering geology, environmental geochemistry, disaster geology, seismic engineering geology, seismic hydrogeology, urban environmental geology, mining environmental geology, etc. These disciplines are further derived into sub-level branches. In research methods, 3s (geo information system (GIS), remote sensing (RS), global posi-tioning system (GPS)) have been widely used as a technical support, forming a large group of subjects including basic theoretical research, applied research and technical methods. But as a gate science, environmental geology itself has not yet formed its own complete and mature theoretical system and working methods (Ding et al. 2016). Wu et al. (2016) studied the environmental problems of water and soil in Shenfu Dongsheng mining area and its control techniques, and discussed the mine water inrush, surface crack collapse, sand collapse, water source damage and vegetation death caused by deformation and destruction caused by mining roof rock. In addition, it has caused serious problems in water and soil environment such as increased desertification and water pollution (Thakur et al. 2016, Joe et al. 2019). It is proposed to establish a grading protection system for water source sites, and to cope with drainage roads to extract groundwater and other measures to protect the water environment (Sahoo et al. 2016). In terms of water environment pollution, Xiqin et al. (2001) proposed a method to meet the water quality protection standards and pollutant discharge concentrations according to river water quality protection standards, and to estimate the amount of water needed to meet environmental functions such as river dilution and self-purification.
RESEARCH METHODS
Hydrology Law
At present, the research status at home and abroad mentioned that the most commonly used representative methods are 7Q10 method, Tennant method, NGPRP method, Basic flow method (Basic Flow) and so on.
7q10 method: From the perspective of controlling the discharge of pollution sources, the method uses the average water volume of the 90% guarantee rate for the last 7 days as the minimum flow design value of the river. Since the natural flow state basically exceeds the 7q10 flow rate, meeting this requirement can meet the sewage discharge requirements in the natural state. However, this flow has nothing to do with the growth of fish in the water. Under this flow, there is no
further health level in the aquatic organism. For most rivers, the 7q10 flow is less than 10% of the annual average flow, so the effect of the flow determined by this method has limited impact on river ecological protection (Ren et al. 2016). In view of the backward development level in China, the water resources in the north and the south are quite different. Our country stipulates in the “Technical Principles and Methods for Formulating Local Water Pollutant Emission Standards” (gb3898-83) that the general river adopts the driest month in the past ten years. The average flow rate or 90% of the guaranteed rate is the smallest monthly average flow as the minimum design flow. Others use the multi-year average of the minimum monthly mean measured runoff of the river as the basic ecological environment water demand of the river (Bruno et al. 2016). Since the measured runoff is used, it is required to select the measured data when the human influence is small.
Tennant method: The method is based on extensive field investigations of the habitat and use parameters of many rivers in the eastern, western and central and western parts of the United States. The annual average runoff percentage is used to describe the flow status in the river according to the hydrological data. See Table 1 for details.
The law considers that the relationship between river aquatic biomass production and water volume is as follows:
The inner diameter of the river channel is 60% of the average annual river flow (i.e. 40% is water consumption outside the river), and most aquatic organisms have excellent to excellent habitat conditions in the main growth period. Under such flow conditions, river width, water depth and flow rate will provide an excellent environment for aquatic organisms to grow. Most rivers, including many rapid shoal areas, will be covered, and water flow will usually occur in the side channels that can be transported. The riparian beach will become a place where fish can swim, and it will become a safe burrowing area for wild animals. Most of the disasters, rapids and shoals will be moderately absent from the water, providing excellent breeding and growing environment for fish. Plants will have plenty of water, and in any shoal area, fish swimming will not be a problem (Wu et al. 2016).
The inner diameter of the river channel is 30% of the average annual river flow (i.e. 70% is water consumption outside the river), which is the amount of water needed to maintain good habitat for most aquatic animals. Under this flow condition, except for the extremely wide shoal, most of the river channels will be out of the water, and most of the side channels will have water flow. Many river banks will become active areas for fish and can also be a place for wildlife to burrow. Many of the river’s currents and the depth of most of the disaster areas will be sufficient as a place for fish to move. The ridge less pusher will be reduced, but it is
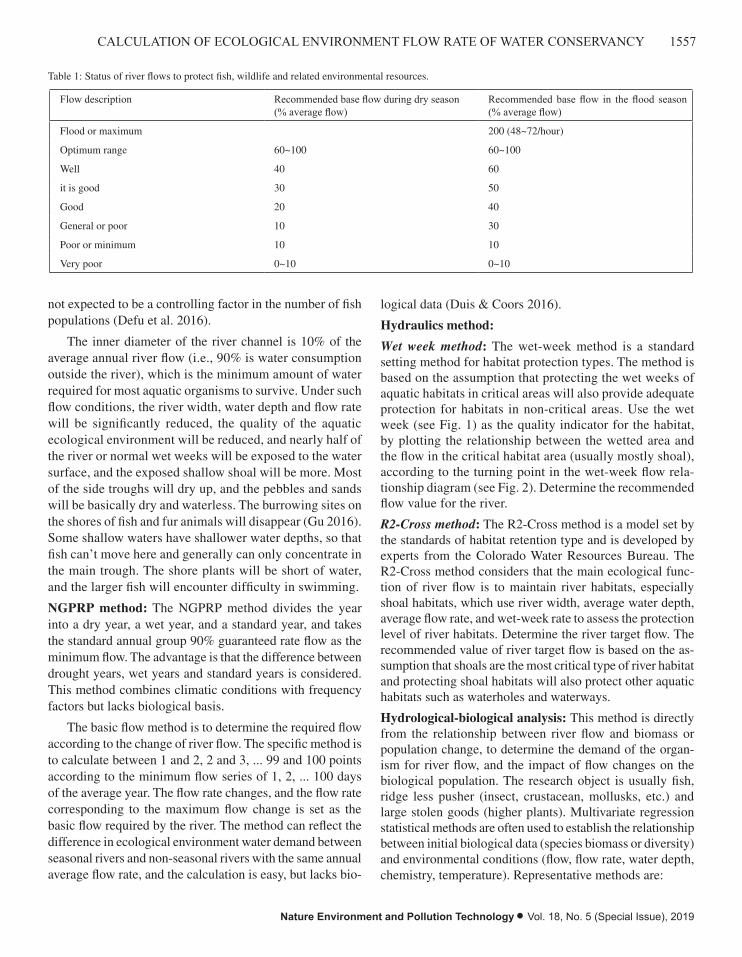
1557CALCULATION OF ECOLOGICAL ENVIRONMENT FLOW RATE OF WATER CONSERVANCY
Nature Environment and Pollution Technology • Vol. 18, No. 5 (Special Issue), 2019
not expected to be a controlling factor in the number of fish populations (Defu et al. 2016).
The inner diameter of the river channel is 10% of the average annual river flow (i.e., 90% is water consumption outside the river), which is the minimum amount of water required for most aquatic organisms to survive. Under such flow conditions, the river width, water depth and flow rate will be significantly reduced, the quality of the aquatic ecological environment will be reduced, and nearly half of the river or normal wet weeks will be exposed to the water surface, and the exposed shallow shoal will be more. Most of the side troughs will dry up, and the pebbles and sands will be basically dry and waterless. The burrowing sites on the shores of fish and fur animals will disappear (Gu 2016). Some shallow waters have shallower water depths, so that fish can’t move here and generally can only concentrate in the main trough. The shore plants will be short of water, and the larger fish will encounter difficulty in swimming.
NGPRP method: The NGPRP method divides the year into a dry year, a wet year, and a standard year, and takes the standard annual group 90% guaranteed rate flow as the minimum flow. The advantage is that the difference between drought years, wet years and standard years is considered. This method combines climatic conditions with frequency factors but lacks biological basis.
The basic flow method is to determine the required flow according to the change of river flow. The specific method is to calculate between 1 and 2, 2 and 3, ... 99 and 100 points according to the minimum flow series of 1, 2, ... 100 days of the average year. The flow rate changes, and the flow rate corresponding to the maximum flow change is set as the basic flow required by the river. The method can reflect the difference in ecological environment water demand between seasonal rivers and non-seasonal rivers with the same annual average flow rate, and the calculation is easy, but lacks bio-
logical data (Duis & Coors 2016).
Hydraulics method:
Wet week method: The wet-week method is a standard setting method for habitat protection types. The method is based on the assumption that protecting the wet weeks of aquatic habitats in critical areas will also provide adequate protection for habitats in non-critical areas. Use the wet week (see Fig. 1) as the quality indicator for the habitat, by plotting the relationship between the wetted area and the flow in the critical habitat area (usually mostly shoal), according to the turning point in the wet-week flow rela-tionship diagram (see Fig. 2). Determine the recommended flow value for the river.
R2-Cross method: The R2-Cross method is a model set by the standards of habitat retention type and is developed by experts from the Colorado Water Resources Bureau. The R2-Cross method considers that the main ecological func-tion of river flow is to maintain river habitats, especially shoal habitats, which use river width, average water depth, average flow rate, and wet-week rate to assess the protection level of river habitats. Determine the river target flow. The recommended value of river target flow is based on the as-sumption that shoals are the most critical type of river habitat and protecting shoal habitats will also protect other aquatic habitats such as waterholes and waterways.
Hydrological-biological analysis: This method is directly from the relationship between river flow and biomass or population change, to determine the demand of the organ-ism for river flow, and the impact of flow changes on the biological population. The research object is usually fish, ridge less pusher (insect, crustacean, mollusks, etc.) and large stolen goods (higher plants). Multivariate regression statistical methods are often used to establish the relationship between initial biological data (species biomass or diversity) and environmental conditions (flow, flow rate, water depth, chemistry, temperature). Representative methods are:
Table 1: Status of river flows to protect fish, wildlife and related environmental resources.
Flow description Recommended base flow during dry season (% average flow)
Recommended base flow in the flood season (% average flow)
Flood or maximum 200 (48~72/hour)
Optimum range 60~100 60~100
Well 40 60
it is good 30 50
Good 20 40
General or poor 10 30
Poor or minimum 10 10
Very poor 0~10 0~10
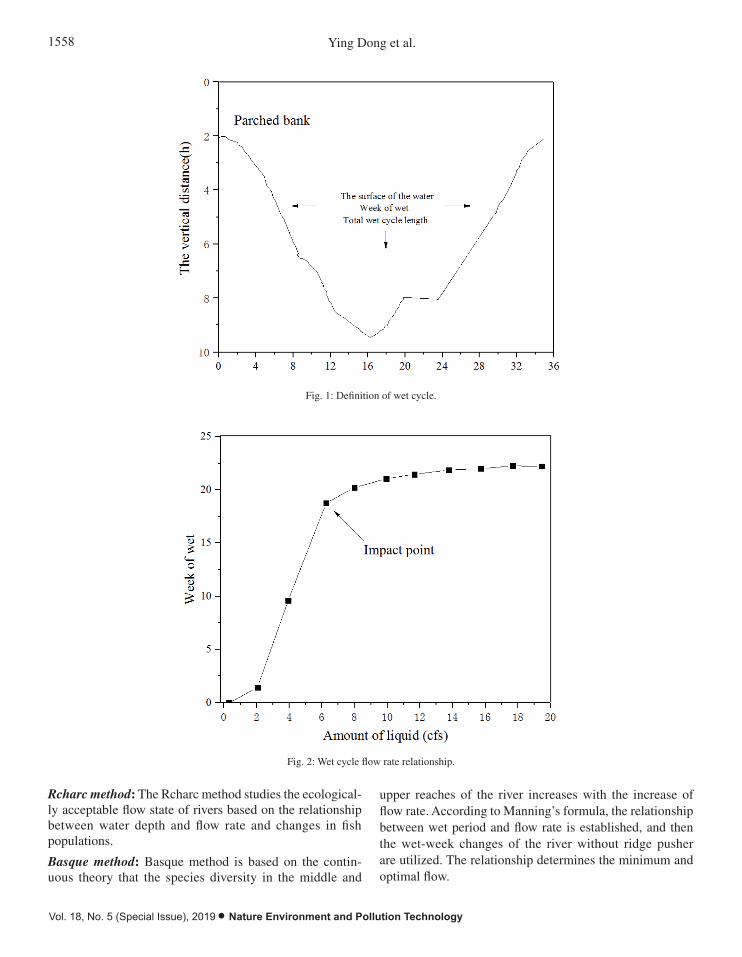
1558 Ying Dong et al.
Vol. 18, No. 5 (Special Issue), 2019 • Nature Environment and Pollution Technology
difficulty in swimming.
NGPRP method: The NGPRP method divides the year into a dry year, a wet year, and a standard year,
and takes the standard annual group 90% guaranteed rate flow as the minimum flow. The advantage is
that the difference between drought years, wet years and standard years is considered. This method
combines climatic conditions with frequency factors but lacks biological basis.
The basic flow method is to determine the required flow according to the change of river flow. The
specific method is to calculate between 1 and 2, 2 and 3, ... 99 and 100 points according to the minimum
flow series of 1, 2, ... 100 days of the average year. The flow rate changes, and the flow rate corresponding
to the maximum flow change is set as the basic flow required by the river. The method can reflect the
difference in ecological environment water demand between seasonal rivers and non-seasonal rivers with
the same annual average flow rate, and the calculation is easy, but lacks biological data (Duis & Coors
2016).
Hydraulics method:
Wet week method: The wet-week method is a standard setting method for habitat protection types. The
method is based on the assumption that protecting the wet weeks of aquatic habitats in critical areas will
also provide adequate protection for habitats in non-critical areas. Use the wet week (see Fig. 1) as the
quality indicator for the habitat, by plotting the relationship between the wetted area and the flow in the
critical habitat area (usually mostly shoal), according to the turning point in the wet-week flow
relationship diagram (see Fig. 2). Determine the recommended flow value for the river.
Fig. 1: Definition of wet cycle.
Fig. 1: Definition of wet cycle.
Fig. 2: Wet cycle flow rate relationship.
R2-Cross method: The R2-Cross method is a model set by the standards of habitat retention type and is
developed by experts from the Colorado Water Resources Bureau. The R2-Cross method considers that
the main ecological function of river flow is to maintain river habitats, especially shoal habitats, which
use river width, average water depth, average flow rate, and wet-week rate to assess the protection level
of river habitats. Determine the river target flow. The recommended value of river target flow is based
on the assumption that shoals are the most critical type of river habitat and protecting shoal habitats will
also protect other aquatic habitats such as waterholes and waterways.
Hydrological-biological analysis: This method is directly from the relationship between river flow and
biomass or population change, to determine the demand of the organism for river flow, and the impact
of flow changes on the biological population. The research object is usually fish, ridge less pusher (insect,
crustacean, mollusks, etc.) and large stolen goods (higher plants). Multivariate regression statistical
methods are often used to establish the relationship between initial biological data (species biomass or
diversity) and environmental conditions (flow, flow rate, water depth, chemistry, temperature).
Representative methods are:
Rcharc method: The Rcharc method studies the ecologically acceptable flow state of rivers based
on the relationship between water depth and flow rate and changes in fish populations.
Basque method: Basque method is based on the continuous theory that the species diversity in the
middle and upper reaches of the river increases with the increase of flow rate. According to Manning's
formula, the relationship between wet period and flow rate is established, and then the wet-week changes
of the river without ridge pusher are utilized. The relationship determines the minimum and optimal flow.
Stromberg and Patten: Stromberg and Patten established a regression equation for flow and growth
of kapok trees in large plant research and determine the minimum flow criteria accordingly.
Gregor and Friedman method: The change of wetland species is related to the inundation time of
Fig. 2: Wet cycle flow rate relationship.
Rcharc method: The Rcharc method studies the ecological-ly acceptable flow state of rivers based on the relationship between water depth and flow rate and changes in fish populations.
Basque method: Basque method is based on the contin-uous theory that the species diversity in the middle and
upper reaches of the river increases with the increase of flow rate. According to Manning’s formula, the relationship between wet period and flow rate is established, and then the wet-week changes of the river without ridge pusher are utilized. The relationship determines the minimum and optimal flow.
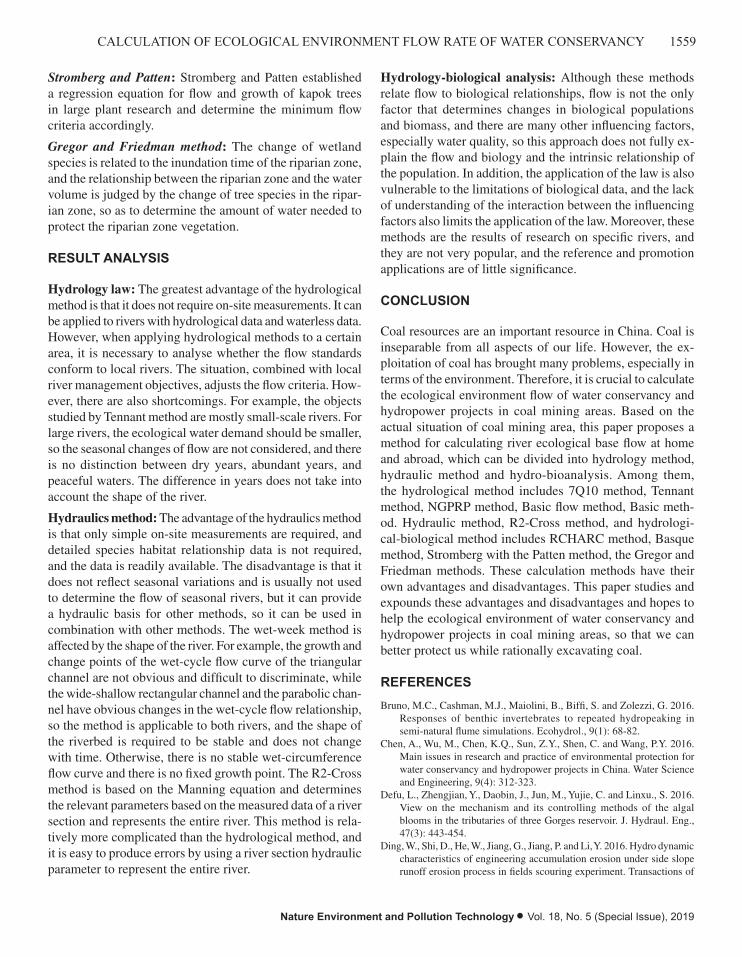
1559CALCULATION OF ECOLOGICAL ENVIRONMENT FLOW RATE OF WATER CONSERVANCY
Nature Environment and Pollution Technology • Vol. 18, No. 5 (Special Issue), 2019
Stromberg and Patten: Stromberg and Patten established a regression equation for flow and growth of kapok trees in large plant research and determine the minimum flow criteria accordingly.
Gregor and Friedman method: The change of wetland species is related to the inundation time of the riparian zone, and the relationship between the riparian zone and the water volume is judged by the change of tree species in the ripar-ian zone, so as to determine the amount of water needed to protect the riparian zone vegetation.
RESULT ANALYSIS
Hydrology law: The greatest advantage of the hydrological method is that it does not require on-site measurements. It can be applied to rivers with hydrological data and waterless data. However, when applying hydrological methods to a certain area, it is necessary to analyse whether the flow standards conform to local rivers. The situation, combined with local river management objectives, adjusts the flow criteria. How-ever, there are also shortcomings. For example, the objects studied by Tennant method are mostly small-scale rivers. For large rivers, the ecological water demand should be smaller, so the seasonal changes of flow are not considered, and there is no distinction between dry years, abundant years, and peaceful waters. The difference in years does not take into account the shape of the river.
Hydraulics method: The advantage of the hydraulics method is that only simple on-site measurements are required, and detailed species habitat relationship data is not required, and the data is readily available. The disadvantage is that it does not reflect seasonal variations and is usually not used to determine the flow of seasonal rivers, but it can provide a hydraulic basis for other methods, so it can be used in combination with other methods. The wet-week method is affected by the shape of the river. For example, the growth and change points of the wet-cycle flow curve of the triangular channel are not obvious and difficult to discriminate, while the wide-shallow rectangular channel and the parabolic chan-nel have obvious changes in the wet-cycle flow relationship, so the method is applicable to both rivers, and the shape of the riverbed is required to be stable and does not change with time. Otherwise, there is no stable wet-circumference flow curve and there is no fixed growth point. The R2-Cross method is based on the Manning equation and determines the relevant parameters based on the measured data of a river section and represents the entire river. This method is rela-tively more complicated than the hydrological method, and it is easy to produce errors by using a river section hydraulic parameter to represent the entire river.
Hydrology-biological analysis: Although these methods relate flow to biological relationships, flow is not the only factor that determines changes in biological populations and biomass, and there are many other influencing factors, especially water quality, so this approach does not fully ex-plain the flow and biology and the intrinsic relationship of the population. In addition, the application of the law is also vulnerable to the limitations of biological data, and the lack of understanding of the interaction between the influencing factors also limits the application of the law. Moreover, these methods are the results of research on specific rivers, and they are not very popular, and the reference and promotion applications are of little significance.
CONCLUSION
Coal resources are an important resource in China. Coal is inseparable from all aspects of our life. However, the ex-ploitation of coal has brought many problems, especially in terms of the environment. Therefore, it is crucial to calculate the ecological environment flow of water conservancy and hydropower projects in coal mining areas. Based on the actual situation of coal mining area, this paper proposes a method for calculating river ecological base flow at home and abroad, which can be divided into hydrology method, hydraulic method and hydro-bioanalysis. Among them, the hydrological method includes 7Q10 method, Tennant method, NGPRP method, Basic flow method, Basic meth-od. Hydraulic method, R2-Cross method, and hydrologi-cal-biological method includes RCHARC method, Basque method, Stromberg with the Patten method, the Gregor and Friedman methods. These calculation methods have their own advantages and disadvantages. This paper studies and expounds these advantages and disadvantages and hopes to help the ecological environment of water conservancy and hydropower projects in coal mining areas, so that we can better protect us while rationally excavating coal.
REFERENCES
Bruno, M.C., Cashman, M.J., Maiolini, B., Biffi, S. and Zolezzi, G. 2016. Responses of benthic invertebrates to repeated hydropeaking in semi-natural flume simulations. Ecohydrol., 9(1): 68-82.
Chen, A., Wu, M., Chen, K.Q., Sun, Z.Y., Shen, C. and Wang, P.Y. 2016. Main issues in research and practice of environmental protection for water conservancy and hydropower projects in China. Water Science and Engineering, 9(4): 312-323.
Defu, L., Zhengjian, Y., Daobin, J., Jun, M., Yujie, C. and Linxu., S. 2016. View on the mechanism and its controlling methods of the algal blooms in the tributaries of three Gorges reservoir. J. Hydraul. Eng., 47(3): 443-454.
Ding, W., Shi, D., He, W., Jiang, G., Jiang, P. and Li, Y. 2016. Hydro dynamic characteristics of engineering accumulation erosion under side slope runoff erosion process in fields scouring experiment. Transactions of

1560 Ying Dong et al.
Vol. 18, No. 5 (Special Issue), 2019 • Nature Environment and Pollution Technology
the Chinese Society of Agricultural Engineering, 32(18): 153-161.Duis, K. and Coors, A. 2016. Micro plastics in the aquatic and terrestrial
environment: sources (with a specific focus on personal care products), fate and effects. Environ. Sci. Eur., 28(1): 2.
Gu, Z., Duan, X., Bing, L., Hu, J. and He, J. 2016. The spatial distribution and temporal variation of rainfall erosivity in the Yunnan plateau, southwest China:1960-2012. Catena, 145: 291-300.
Joe, E.J., Tongkul, F. and Roslee, R. 2019. Behaviour of channelised debris flow in the crocker range of Sabah, Malaysia: A Case Study at Ulu Moyog, Penampang. Geological Behavior, 3(1): 28-32.
Ren, D., Xu, X., Hao, Y. and Huang, G. 2016. Modelling and assessing field irrigation water use in a canal system of Hetao, upper yellow river basin: application to maize, sunflower and watermelon. J. Hydrol., 532: 122-139.
Sahoo, P.K., Equeenuddin, S.M. and Powell, M.A. 2016. Trace elements in soils around coal mines: current scenario, impact and available techniques for management. Curr. Pollut. Rep., 2(1): 1-14.
Thakur, P.K., Aggarwal, S., Aggarwal, S.P. and Jain, S.K. 2016. One-di-mensional hydro dynamic modelling of GLOF and impact on hydro power projects in Dhauliganga river using remote sensing and GIS applications. Nat. Hazards, 83(2):1-19.
Wu, F., Xuan, W., Cai, Y. and Li, C. 2016. Spatio temporal analysis of pre-cipitation trends under climate change in the upper reach of Mekong river basin. Quatern. Int., 392: 137-146.
Xiqin, W., Changming, L. and Zhifeng, Y. 2001. Method of resolving lowest environmental water demands in river course (I): Theory. Acta Scientiae Circumstantiae, 21(5): 544-547.
Xue, L., Zhang, H., Zhang, L., Chi, Y. and Sun, C. 2017. Impact of water conservancy projects on eco-hydrological regime of Tarim river based on improved RVA method. J. Hohai Univ., 45(3):189-196.
Ying, H.S., Anuar, M.S. and Mohd Nor, M.Z. 2018. Drying, colour and sensory characteristics of ‘Berangan’ Banana (Musa Accuminata) flesh dried using a microwave oven. Malaysian Journal of Halal Research, 1(1): 10-14.

Study on the Index System of Environmental Impact Assessment (EIA) of Water Conservancy Projects
Zhi-qi ZhouYellow river Conservancy Technical Institute, Kaifeng, China
ABSTRACT
The post-evaluation of the impact of water conservancy projects on the ecological environment provides scientific decision-making basis for the ecological and environmental management of water conservancy projects, which has important scientific significance and application value. The post-evaluation index system of the impact of the water conservancy project on the ecological environment was constructed, and the FME-AHP evaluation model was used to evaluate the ecological environment impact of the Stone reservoir. AHP weighting method was used to determine the weight of each level, and the normal membership function was used to calculate the membership value of each level index to the next level. It can be seen from the membership degree of each grade of the ecological environment system that the maximum membership degree of the third grade is 0.4332, followed by the membership degree of the second grade, which is 0.3453. This indicates that the influence of Stone river reservoir on the ecological environment is at the third grade (no influence) and tends to the second grade (with relatively adverse influence).
INTRODUCTION
Water conservancy projects, also known as water projects, are projects that are built by controlling and deploying various water resources in the natural world to achieve the goal of eliminating harm and benefiting (Reheman & Rusuli 2017). Water conservancy projects bring great social and economic benefits to people, but at the same time, the natural geo-graphical characteristics of rivers are also changing, and the ecological service function of rivers and the ecological environment of river basins are inevitably damaged. Water projects are often built at the expense of other resources. The feedback information, provides the support for the new project decision-making management, as well as has the important scientific value and the practical significance.
In this paper, the post-evaluation index system of the impact of water conservancy projects on the ecological environment and the FME-AHP evaluation model are applied to conduct the post-evaluation of the impact of Stone river res-ervoir on the ecological environment. AHP weighting method was used to determine the weight of each level, and the normal membership function was used to calculate the membership value of each level index to the next level. Finally, according to the grade value calculated by the FME-AHP evaluation model, the grade of the ecological environment impact of Stone river reservoir was determined. The results showed that the impact of Stone river water conservancy project on the ecological environment was in the third grade (no impact) and inclined to the second grade (with relatively adverse impact).
PREVIOUS RESEARCH
In recent years, the post-evaluation work on the envi-ronmental impact of water conservancy and hydropower projects mainly includes the post-evaluation of the Sanmenx-ia water control project in the Yellow River, the environmen-tal post-evaluation of the Xin’anjiang Hydropower Station, the Longyangxia Hydropower Station and the post-evaluation research and investigation of the reservoir ecological envi-ronment; post-evaluation on the environmental impact of irrigation projects in Dujiangyan irrigation area of Sichuan province, Panjin irrigation area of Liaoning province and Shaoshan irrigation area of Hunan province (Xue et al. 2017). A post evaluation on the ecological impact of Heihe river basin water diversion and recent comprehensive treat-ment on the middle reaches (Sitzia et al. 2018). Based on AHP matter-element extension model, the post-evaluation of ecological impact in the middle reaches of Heihe river (Mo et al. 2018). Using matter-element extension model, AHP method and expert scoring method, combined with the investigation data of Heihe river recent governance, the impact of Heihe river recent governance on midstream ecol-ogy was comprehensively evaluated. The results show that the recent treatment of Heihe river has a favourable impact on the midstream ecology, partially improving the local ecological environment, providing scientific information for the restoration and protection of the ecosystem of Heihe river, and providing decision-making basis for the follow-up
Nat. Env. & Poll. Tech.Website: www.neptjournal.com
Received: 10-08-2019Accepted: 09-10-2019
Key Words:Water conservancy projectEnvironmentIndex systemEIAMembership degree
2019pp. 1561-1565 Vol. 18
p-ISSN: 0972-6268 No. 5 (Special Issue)
Nature Environment and Pollution Technology An International Quarterly Scientific Journal
Original Research Paper
e-ISSN: 2395-3454
Open Access
1562 Zhi-qi Zhou
Vol. 18, No. 5 (Special Issue), 2019 • Nature Environment and Pollution Technology
projects of Heihe river and other similar projects (Mo et al. 2018). Ecological index system of water resources and hydropower engineering can be divided into the natural environment, social environment, environmental pollution condition of three subsystems. This paper introduces the fuzzy evaluation method and comprehensive index method. Fuzzy evaluation method and comprehensive index method are analysed after the ecological impact evaluation of distinction and applicability, and comparing the method, it showed that the comprehensive index method can objec-tively reflect the status of regional ecological environment through the evaluation results (Ding et al. 2017). After the ecological impact of the Sanmenxia Water Control Project, the status of the ecological environment in the Sanmenxia water conservancy project area was expounded, and the changes in the structure and function of the regional eco-systems during the 40 years of construction and operation of the Sanmenxia water conservancy project were analysed. The net primary productivity of the region’s vegetation and the potential for climate production, the different charac-teristics of regional biodiversity and hazard factors before and after the reservoir is built. The results show that the construction and operation of the reservoir have a certain impact on the net productivity of local vegetation and have an adverse impact on the water ecological environment (Tsegaye 2017).
Experimental method
Screening method for environmental impact post-eval-uation index system: For a given j-th primary index, the greater the difference in Xij (i = 1, 2, ..., n; n is the number of evaluation objects), the greater the comparison effect will be, that is, the more decision information it contains and transmits, the more information entropy can measure (Silva-no et al. 2017). Firstly, information entropy formula is used to calculate information entropy. Secondly, determine the distinguishing ability measure Wj of the j-th evaluation index.
W e m e j mj j ji
m
= ( ) -Ê
ËÁˆ
¯̃=( )
=Â1 1 2
1
- / , , ,� …(1)
The larger the value of X j is, the stronger the discrim-inating ability of the index will be. The index with small discriminating ability can be deleted. This method is to delete the index that has little influence on the evaluation result in the index system, so it can realize the reduction of the index system.
The index system of post-evaluation of water conservancy projects on ecological environment was established: De-termining the membership function is the main work of the fuzzy identification evaluation model. How to construct the membership function correctly is one of the key problems
for the success of the fuzzy identification model. The object of fuzzy set research has the characteristics of fuzziness, experience and subjectivity. At present, there is no universal method to establish membership function. The normal type is the most important and the most common type of distribution. The measured values of ecological environment indicators in the ecological environment indicator system are all discrete. When the number of observations is large, it can be approxi-mately considered that the membership function of these data for the same level is normal (Melaku 2018). Based on the conceptual framework of the post-evaluation of the impact of water conservancy projects on the ecological environment and the principle of screening the primary indicators, the final determination and construction of the index system of the post-evaluation of the impact of water conservancy projects on the ecological environment are shown in Table 1.
In the formula, a and b are constants, a > 0, b > 0; x is the index value, and f(x) is the membership function value.
The normal membership function can be expressed as:
f xx a
b( ) = -
-ÊËÁ
ˆ¯̃
Ê
ËÁ
ˆ
¯˜exp
2
…(2)
AHP evaluation method: Determining the membership function is the main work of the fuzzy recognition evalu-ation model. How to construct the membership function correctly is one of the key issues for the success of the fuzzy recognition model. The objects of fuzzy set research have ambiguity, empiricism and subjectivity. At present, the general unified membership function establishment method has not yet been formed.
Weight determination method: Entropy is a physics term. Information entropy is the extension and application of thermodynamic entropy theory in informatics. It can be used to measure the degree of disorder of information sources. Shannon introduces the concept of entropy into the field of communication and calls it “information entropy”, which reflects the average uncertainty of information sources (Ba-nerjee et al. 2018). The information entropy is defined in the mathematical theory of information as the probability of occurrence of discrete random events. In information theory, entropy reflects the degree of information disorder. The larger the entropy is, the more disordered the information will be; on the contrary, the more ordered the information will be. Therefore, information entropy can be used to evaluate the degree of order and its utility of the obtained system infor-mation. Since the probability P(xi) of state xi is different, the self-information I(xi) is also different (Guo 2000, Siew et al. 2019). And the mathematical expectation of the average self-information of uncertainty of the whole system in each state I(xi), denoted as H(xi), that is:
1563INDEX SYSTEM OF EIA OF WATER CONSERVANCY PROJECTS
Nature Environment and Pollution Technology • Vol. 18, No. 5 (Special Issue), 2019
Table 1: Post-evaluation index system of water conservancy projects’ impact on ecological environment.
Target layer Criterion layer Index layer
The impact of the ecological environmentImpact on estuaries and adjacent watersheds C9
Impact on biological resources C10
Impact on the natural ecological environment
Impact on estuaries and adjacent watersheds C9
Reservoir submerged C1
Climate impact C2
Purification environment C3
River scouring C4
Sedimentation C5
Bank Shore Stability C6
Backwater impact C7
Soil erosion C8
Impact on estuaries and adjacent watersheds C9
Impact on biological resources C10
Impact on social ecological environment Population Migration C11
Natural foci affect C12
Water supply impact C13
Flood protection benefit C14
Impact on natural landscapes and places of interest C15
Impact on fisheries C16
H x P x I x P x P x i ni ii
n
i ii
n
i( ) = ( ) ( ) = - ( ) ( ) =( )= =Â Â
1 1
1 2ln , , ,�
…(3)
FME-AHP coupling evaluation model: The rank can be determined by comparing the Hi size. The maximum grade of membership corresponds to the degree of impact of water conservancy projects on the ecological environment. The following grade calculation formula can also be used to evaluate the degree of impact of water conservancy projects on the ecological environment.
G iH
H
i
ii
mi
m
= ¥
=
= ÂÂ
1
1
…(4)
In the formula, G is the grade; m is the number of grades, and m = 5 in this paper.
EXPERIMENTAL RESULTS
According to the post-evaluation index system of ecological engineering impact on water environment, and the FME-AHP coupling evaluation model, the composite element of the ecological environment system of the Stone river basin is established. Determined the evaluation level standard and the weight of each indicator in the natural ecological ring
subsystem and the social ecological environment subsystem according to the AHP empowerment method, and the weight of the two subsystems on the ecological environment system. By using the normal membership function, the membership degree of each index in the subsystem is calculated, and the subsystem fuzzy membership compound element is estab-lished. Through the weighted average calculation of each index and subsystem, the fuzzy membership element of the ecological environment system of the Stone river basin is obtained, and the influence degree of the Stone river reservoir on the ecological environment is determined according to the degree of fuzzy membership. The results show that the impact of the Stone reservoir on the ecological environment is at the third level (no impact) and biased towards the second level (with more adverse effects).
Constructing the elements of the ecological environ-ment system in the Stone River Basin: According to the post-evaluation index system of ecological environment impact of water conservancy projects, the composite matter element of the ecological environment system of the Stone river basin is constructed. On the basis of collecting the statistics of the Stone river basin, many experts are asked to score each index in the Eco-environment System of the Stone river basin. The eigenvalues of the impact of the Stone river reservoir on the ecological environment are listed in Table 2.
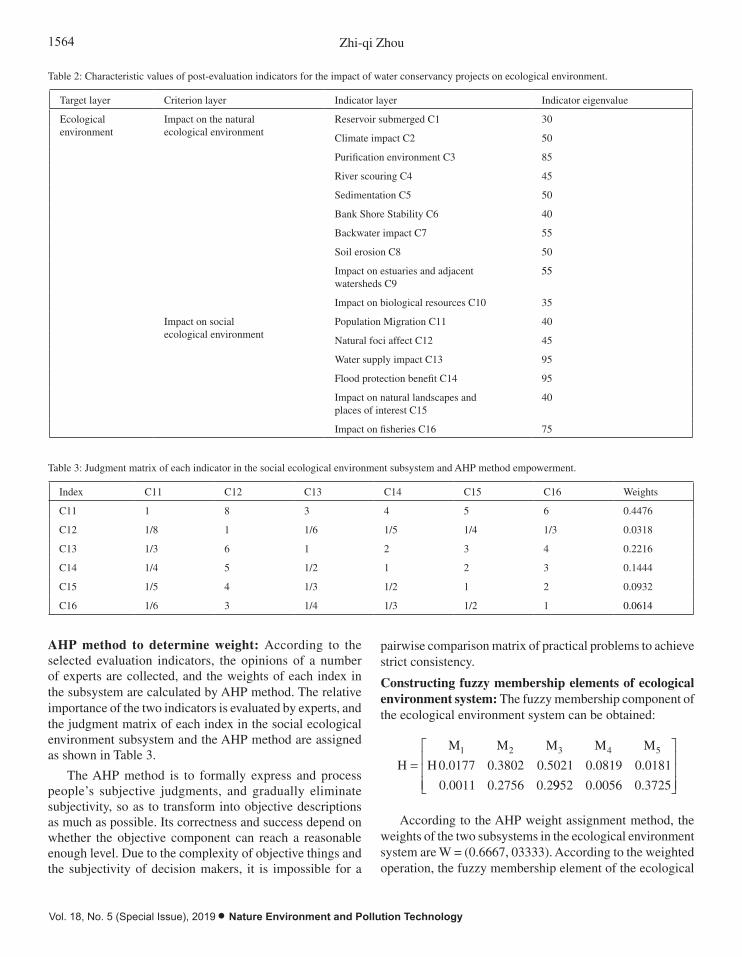
1564 Zhi-qi Zhou
Vol. 18, No. 5 (Special Issue), 2019 • Nature Environment and Pollution Technology
Table 2: Characteristic values of post-evaluation indicators for the impact of water conservancy projects on ecological environment.
Target layer Criterion layer Indicator layer Indicator eigenvalue
Ecological environment
Impact on the natural ecological environment
Reservoir submerged C1 30
Climate impact C2 50
Purification environment C3 85
River scouring C4 45
Sedimentation C5 50
Bank Shore Stability C6 40
Backwater impact C7 55
Soil erosion C8 50
Impact on estuaries and adjacent watersheds C9
55
Impact on biological resources C10 35
Impact on social ecological environment
Population Migration C11 40
Natural foci affect C12 45
Water supply impact C13 95
Flood protection benefit C14 95
Impact on natural landscapes and places of interest C15
40
Impact on fisheries C16 75
Table 3: Judgment matrix of each indicator in the social ecological environment subsystem and AHP method empowerment.
Index C11 C12 C13 C14 C15 C16 Weights
C11 1 8 3 4 5 6 0.4476
C12 1/8 1 1/6 1/5 1/4 1/3 0.0318
C13 1/3 6 1 2 3 4 0.2216
C14 1/4 5 1/2 1 2 3 0.1444
C15 1/5 4 1/3 1/2 1 2 0.0932
C16 1/6 3 1/4 1/3 1/2 1 0.0614
AHP method to determine weight: According to the selected evaluation indicators, the opinions of a number of experts are collected, and the weights of each index in the subsystem are calculated by AHP method. The relative importance of the two indicators is evaluated by experts, and the judgment matrix of each index in the social ecological environment subsystem and the AHP method are assigned as shown in Table 3.
The AHP method is to formally express and process people’s subjective judgments, and gradually eliminate subjectivity, so as to transform into objective descriptions as much as possible. Its correctness and success depend on whether the objective component can reach a reasonable enough level. Due to the complexity of objective things and the subjectivity of decision makers, it is impossible for a
pairwise comparison matrix of practical problems to achieve strict consistency.
Constructing fuzzy membership elements of ecological environment system: The fuzzy membership component of the ecological environment system can be obtained:
According to the AHP weight assignment method, the weights of the two subsystems in the ecological environment system are W = (0.6667, 03333). According to the weighted operation, the fuzzy membership element of the ecological
H H
M M M M M
0.0177 0.3802 0.5021 0.0819 0.0181
0.0011 0.2756 0.2
1 2 3 4 5
=9952 0.0056 0.3725
È
Î
ÍÍÍ
˘
˚
˙˙˙
1565INDEX SYSTEM OF EIA OF WATER CONSERVANCY PROJECTS
Nature Environment and Pollution Technology • Vol. 18, No. 5 (Special Issue), 2019
environment system can be obtained.
H H
M M M M M
0.01722 0.3453 0.4332 0.0731 0.13621 2 3 4 5
=È
Î
ÍÍÍ
˘
˚
˙˙˙
RESULTS AND DISCUSSION
The impact of the natural ecological environment subsystem is at the third level, that is, the water conservancy project has no impact on the ecological environment, and the impact on the social ecological environment subsystem is at the fifth level, that is, the water conservancy project has a favourable impact on the social ecological environment. The ecological environment system can be seen in the membership degree of each level. The membership degree of the third level is 0.4332, and the degree of membership of the second level is 0.3453, which indicates that the influence of Stone reservoir on the ecological environment is the third level (no impact) and biased towards the second level (with more adverse effects). According to the post-evaluation index system of ecological engineering impact on water environment and the fuzzy matter-level analysis coupling model (FME-AHP model), the composite matter element of the ecological environment system of the Stone river basin is established, and the evaluation grade standard is established. According to the AHP empowerment method, the weights of the indicators in the natural ecological ring subsystem and the social ecological environment subsystem are determined, and the weights of the two subsystems on the ecological environment system are determined. By using the normal membership function, the membership degree of each index in the subsystem is calculated, and the subsystem fuzzy membership compound element is established. Through the weighted average calculation of each index and subsystem, the fuzzy membership element of the ecological environment system of the Stone river basin is obtained, and the influence degree of the Stone river reservoir on the ecological environment is determined according to the degree of fuzzy membership. The results show that the impact of the Stone reservoir on the ecological environment is at the third level (no impact) and biased towards the second level (with more adverse effects).
CONCLUSION
The post-evaluation of the impact of water conservancy projects on the ecological environment will continue to
be enriched and improved with human practice activities, economic development and social progress. People have also re-recognized a series of ecological and environmental problems between nature and human society. In a large number of studies, the establishment of an ecologic en-vironment indicator system will become more and more well-founded, the evaluation methods will become more mature, and the calculation results will be more realistic and accurate. Applying the theory of ecological hydraulics, establishing a post-evaluation index system for the impact of water conservancy projects on ecological environment, and conducting research on the post-evaluation index system and evaluation method for the impact of water conservancy pro-jects on ecological environment, providing a basis for water conservancy projects to evaluate ecological environment, and for water resources regulation strategies. The formulation and implementation of the coordinated development strategy of society, economy and environment has realistic guiding significance and application prospects.
REFERENCES
Banerjee, P., Ghose, M.K. and Pradhan, R. 2018. AHP-based spatial analysis of water quality impact assessment due to change in vehicular traffic caused by highway broadening in Sikkim Himalaya. Appl. Water Sci., 8(2): 72.
Ding, J., Zhang, Y., Cheng, H., Shen, Y. and Song, L. 2017. Establishment of environmental impact assessment index system on agricultural plan-ning. Transactions of the Chinese Society of Agricultural Engineering, 33(7): 177-182.
Guo, Z.L. 2000. Methods for environmental impact assessment of agricul-tural water conservancy projects. Transactions of the Chinese Society of Agricultural Engineering, 16(5): 16-19.
Melaku, N.D., Renschler, C.S., Flagler, J., Bayu, W. and Klik, A. 2018. Integrated impact assessment of soil and water conservation structures on runoff and sediment yield through measurements and modelling in the northern Ethiopian highlands. Catena, 169: 140-150.
Mo, Z., Liu, Y., Jing, W. and Wang, T. 2018. Index system of urban resource and environment carrying capacity based on ecological civilization. Environ. Impact Assess. Rev., 68: 90-97.
Reheman, A. and Rusuli, Y. 2017. Ecological effects of the first water diversion hub station in Kaidu river based on the vegetation index. J. Soil Water Conserv., 15(2): 115-124.
Silvano, R.A.M., Hallwass, G., Juras, A.A. and Lopes, P.F.M. 2017. As-sessment of efficiency and impacts of gillnets on fish conservation in a tropical freshwater fishery. Aquat. Conserv., 27(2).
Sitzia, T., Campagnaro, T. and Grigolato, S. 2018. Ecological risk and acces-sibility analysis to assess the impact of roads under habitats directive. J. Environ. Plann. Manag., 59: 1-21.
Tsegaye, F. 2017. Technical and managerial aspects of environmental and health impact assessment of water resource development projects: the Ethiopian experience. Ethiop. J. Health Dev., 42(1): 81-89.
Xue, L., Zhang, H., Zhang, L., Chi, Y. and Sun, C. 2017. Impact of water conservancy projects on eco-hydrological regime of Tarim river based on improved RVA method. J. Hohai Univ., 45(3): 189-196.

Vol. 18, No. 5 (Special Issue), 2019 • Nature Environment and Pollution Technology
1566

Atmospheric Quality Testing Based on Deep Learning
Wei Li*, Yan Li*, Lei Wang* and Haroon Rashid***Hebei Institute of Communications, Shijiazhuang, Hebei, 051430, China**Department of Civil Engineering, Khwaja Fareed University of Engineering and Information Technology, Rahim Yar Khan, Punjab 64200, Pakistan
ABSTRACT
The purpose of this research is to apply the deep learning algorithm to the research of atmospheric quality detection. In this study, firstly, based on genetic algorithm and artificial neural network, the training process of genetic algorithm is optimized and improved, and a new hybrid accelerated genetic algorithm is proposed. Then combined with these algorithms, a universal air quality evaluation method for a variety of air pollutants is proposed. Taking the atmospheric quality inspection report of Dalian city for two months as the research sample, the hybrid accelerated genetic algorithm combined with the artificial neural network algorithm are applied to the BP neural network, which is optimized and improved to predict the atmospheric quality of the next month, and the prediction results are compared with the actual situation. The results show that the new algorithm is excellent in convergence speed and prediction accuracy and has certain value and prospect in the practical application of atmospheric quality prediction in the future.
INTRODUCTION
The quality of atmospheric environment is closely related to people’s health and life. With the rapid development of human society, the ecological environment is also deteriorating. The serious deterioration of air quality and the threat of air pollution to human life also directly affect the sustainable development of human society (Flórez et al. 2018). China, as a developing superpower, is also faced with various tests from environmental problems. How to accurately evaluate the air quality and ensure the quality of life has become an important environmental issue concerned by people. The severity of air pollution is assessed by the air pollution hazard index. The air quality evaluation model is an application model that evaluates the air pollution hazard index and determines the level of air pollution hazard by measuring the relative concentration of various pollutants in the atmosphere (Jiang et al. 2017). The perspective of current environmental quality assessment is multi-directional, and up to now, China has not formed a unified series of assessment methods. In recent years, scholars at home and abroad have discussed the comprehensive evaluation and prediction of atmospheric quality detection and put forward some models of atmospheric evaluation, such as the air pollution index evaluation method, air pollution comprehensive index method, air pollution economics evaluation method, air pollution biological evaluation method, fuzzy comprehensive evaluation method, expert evaluation method, analytic hierarchy process, etc. (Sharma & Rani 2017, Mousavi et al.
2018). However, most of the evaluation methods fail to reflect the multi - factor comprehensiveness of the environmental quality structure and the scientific comprehensiveness of the environmental quality standard, so the standard level of environmental quality can’t be quantitatively determined. These methods presuppose the model or subjectively specify some parameters. For example, the environmental quality index evaluation method involves too many subjective factors in the evaluation process, losing the accurate reflection of the objectivity of environmental quality structure, and the evaluation conclusion is abstract.
With the establishment of new science and the develop-ment of computer technology, a variety of new methods for evaluating atmospheric quality have been proposed, such as neural network method, matter-element extension method, set pair analysis method, genetic optimization method, pro-jection pursuit analysis method, etc. In this study, genetic algorithm and neural network method were combined to optimize the application in atmospheric environmental quality assessment.
PAST RESEARCH
Genetic algorithms (GA) is a method of global optimization to find the optimal solution, and its idea is based on the theory of evolution and heredity. In essence, it is a probabilistic global search algorithm that combines natural selection of survival of the fittest, evolution mechanism of survival of the
Nat. Env. & Poll. Tech.Website: www.neptjournal.com
Received: 25-08-2019Accepted: 11-10-2019
Key Words:Deep learningDalian cityNeural networkAtmospheric qualityGenetic algorithm
2019pp. 1567-1572 Vol. 18
p-ISSN: 0972-6268 No. 5 (Special Issue)
Nature Environment and Pollution Technology An International Quarterly Scientific Journal
Original Research Paper
e-ISSN: 2395-3454
Open Access
1568 Wei Li et al.
Vol. 18, No. 5 (Special Issue), 2019 • Nature Environment and Pollution Technology
fittest and random information exchange mechanism among individuals in the same group to solve complex problems and seek the optimal solution (Tepecik & Navruz 2018). GA is implemented by turning the solution of the problem to be solved into chromosomes represented by binary code strings, and then all possible solutions of the problem constitute the chromosome group. GA places them in the environment of problems and evaluates, replicates, crosses and mutates the adaptability of chromosomes according to the survival of the fittest principle. After the generation of the initial population, GA conducts crossover and mutation operations according to the survival of the fittest principle, resulting in a new population as the solution to the problem. Each population is generated by the process of selection, crossover and mutation (Azamathulla et al. 2018). Finally, it converges to an individual that is most suitable for the problem environment, which is also called the optimal individual. And the optimal solution is obtained by decoding the best individual.
The entire working mode and inspiration of Artificial Neural Network (ANN) is derived from the mode of simulating the operation of human thinking (Petrozziello et al. 2017). It is equivalent to a nonlinear dynamic system. Neural networks acquire knowledge or experience mainly through learning, which can be generally divided into two stages: training and prediction (Sarajcev et al. 2018). The so-called training is to form a functional mapping relationship between the condition and the result, that is, to give a target error value of the actual output and the expected output. If the result obtained by the output layer is greater than the preset error target value, the neural network will return the error signal layer by layer along the original transmission route and adjust the weight value of the neuron connection between each level. This process will continue alternately until the error reaches the target value, and then the training process is end. Prediction is to test the reliability of the discriminant function. Some samples not included in the training set are used to form the prediction set, and then the prediction set is put into the trained network. Under the action of the discriminant function obtained in the training stage, a test result can be obtained, and the prediction can be made from the output end of the network. The main research direction of artificial neural network is quite extensive, which reflects the characteristics of the interdisciplinary technology field. At present, the main research work focuses on the biological prototype, the establishment of theoretical model, network model and algorithm research, artificial neural network application system, pattern recognition and image processing, control
and optimization, financial prediction, management, and communication adaptive balance.
MATERIALS AND METHODS
Research object: The monitoring data of August 1 to September 27 in Dalian city were selected as samples, and the concentrations of SO2, NO2 and PM10 were taken as the main monitoring objects. The data samples in this research were provided by Dalian Environmental Testing Centre.
Genetic algorithm: The way in which the algorithm obtains the optimal solution is to set the range of the solution of the parameter to be optimized to a two - dimensional space. The whole space is regarded as composed of an infinite number of spatial solutions, the number of which is determined by the precise range of the parameters to be optimized, and each spatial solution is also called a spatial individual. A certain number of spatial individuals are randomly selected from the two-dimensional solution space, and then this group of individuals is called the initial parent group of individuals. The algorithm flow of GA is as follows:
Initialization- Set the counter of the evolutionary genera-tion number, set the number of the maximum evolutionary generation, randomly generated individuals were used as the initial parent group and denoted as P (0);
Calculate individual fitness- Calculate the individual fitness of each individual in the parent group; selection operation- perform selection operation on the parent group, select the ith individual from the initial parent, so that the more suitable individual with greater fitness is selected. Two groups of 500 individuals are selected, and the selected probability values are based on the fitness Pi of each individual.
Crossover operation- From the two groups of newly obtained individuals, an individual is extracted to pair and reconstitute two groups of 500 individuals with each new generation.
Mutation operation- Take any of a group of progeny individuals previously obtained and flip some part of the binary code of the individual according to the mutation rate of the population, that is, the original is 1 becomes 0, while the original is 0 turns into 1. Then the resulting new 500 child generations are used as the new parent of the next cycle;
Termination condition judgment- The fitness of the new parent generation obtained by calculation will be stopped if the accuracy is satisfied; if not, the cycle will be continued in the previous step, and when t=T, the individual with the greatest fitness obtained during the evolution process is used as the optimal solution output, and the calculation is termi-nated. The operation flow is shown in Fig. 1.

1569ATMOSPHERIC QUALITY TESTING BASED ON DEEP LEARNING
Nature Environment and Pollution Technology • Vol. 18, No. 5 (Special Issue), 2019
Questions raised
Initialize a set of solution variables and set iteration times T, t = 1 to calculate
accuracy
Calculate the fitness for each group
Satisfies the optimal criterion
No
Choice
overlapping
variation
Generate a new set of solution variables, t = t + 1
Satisfying the optimal criterion or t>T
Yes
Output Optimal Solution
YesNo
Fig. 1: Genetic algorithm flow chart.
Improved hybrid acceleration genetic algorithm (IHAGA): GA has disadvantages such as poor local search ability and precocity, among which the representative problem is how to balance and coordinate the rapid convergence of algorithm and maintain individual diversity. In this study, the genetic algorithm was improved and the local search algorithm was introduced, which could well solve the global optimization of parameters in the formula model of air quality pollution index. In the selection operation, the selection of elite individual migrators enhances the search ability of the algorithm for continuous global optimization and ensures the superiority of species and the convergence speed of the algorithm. Selecting the worst individual for direct variation ensures the individual diversity of the group, strengthens the global search ability of the algorithm, and well avoid the phenomenon of premature algorithm. The segmentation point crossover operator is adopted, so that individual elements can exchange information more uniformly and more scientifically. The introduction of local search operator greatly improves the local search ability of the whole genetic algorithm. In addition, acceleration operator is adopted to avoid unnecessary iteration and improve the operation efficiency of the algorithm, as shown in Fig. 2.
Fig. 1: Genetic algorithm flow chart.
Improved hybrid acceleration genetic algorithm (IHAGA): GA has disadvantages such as poor local search ability and precocity, among which the representative prob-lem is how to balance and coordinate the rapid convergence of algorithm and maintain individual diversity. In this study, the genetic algorithm was improved and the local search algorithm was introduced, which could well solve the global optimization of parameters in the formula model of air quality pollution index. In the selection operation, the selection of elite individual migrators enhances the search ability of the algorithm for continuous global optimization and ensures the superiority of species and the convergence speed of the algorithm. Selecting the worst individual for direct variation ensures the individ-ual diversity of the group, strengthens the global search ability of the algorithm, and well avoid the phenomenon of premature algorithm. The segmentation point crossover operator is adopted, so that individual elements can ex-change information more uniformly and more scientifically.
The introduction of local search operator greatly improves the local search ability of the whole genetic algorithm. In addition, acceleration operator is adopted to avoid unnec-essary iteration and improve the operation efficiency of the algorithm, as shown in Fig. 2.
Neural network algorithm and deep learning: Artificial neural networks use physical devices to simulate some structures and functions of biological neural networks. BP neural network model belongs to multi-layer feed-forward mapping network, and it is a supervised learning algorithm. The network learns and trains the data set through algorithm and determines the connection weight and threshold between each neuron, so as to establish a mapping relationship between the subset of dimensional space and the subset of dimensional space. Each time the learning algorithm adjusts the weights, it includes two processes: signal forward propagation and error response propagation. First, the sample input signal is transmitted from the input layer to the output
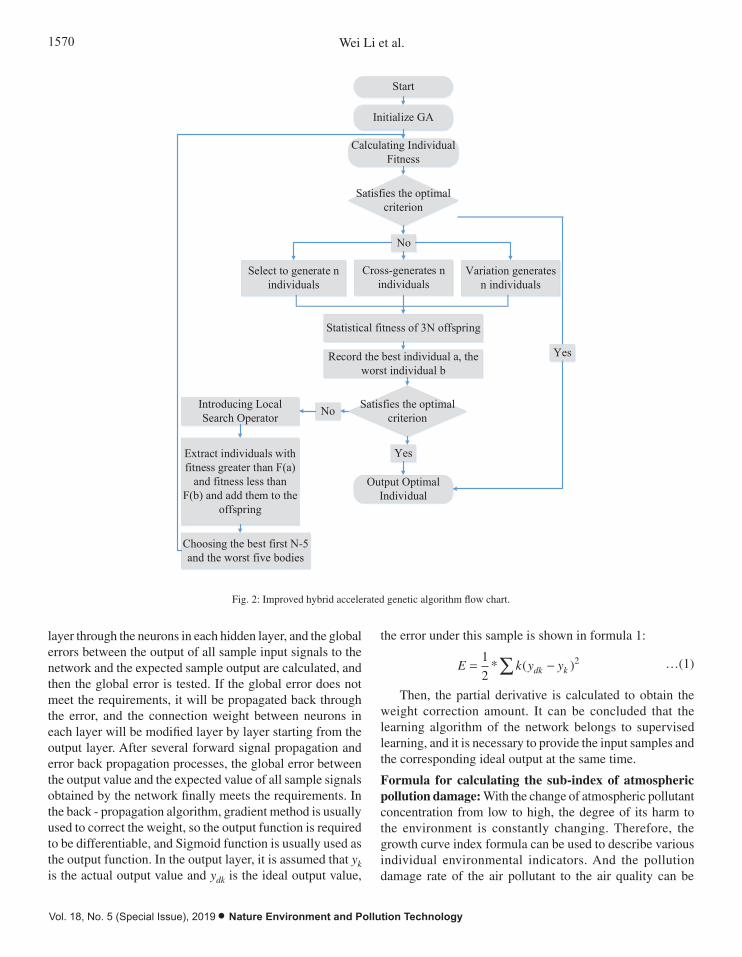
1570 Wei Li et al.
Vol. 18, No. 5 (Special Issue), 2019 • Nature Environment and Pollution Technology
Start
Initialize GA
Calculating Individual Fitness
Satisfies the optimal criterion
No
Select to generate n individuals
Record the best individual a, the worst individual b
Satisfies the optimal criterion
Yes
Output Optimal Individual
Yes
Cross-generates n individuals
Variation generates n individuals
Statistical fitness of 3N offspring
Introducing Local Search Operator No
Extract individuals with fitness greater than F(a)
and fitness less than F(b) and add them to the
offspring
Choosing the best first N-5 and the worst five bodies
Fig. 2: Improved hybrid accelerated genetic algorithm flow chart.
Neural network algorithm and deep learning: Artificial neural networks use physical devices to simulate some structures and functions of biological neural networks. BP neural network model belongs to multi-layer feedforward mapping network, and it is a supervised learning algorithm. The network learns and trains the data set through algorithm and determines the connection weight and threshold between each neuron, so as to establish a mapping relationship between the subset of dimensional space and the subset of dimensional space. Each time the learning algorithm adjusts the weights, it includes two processes: signal forward propagation and error response propagation. First, the sample input signal is transmitted from the input layer to the output layer through the neurons in each hidden layer, and the global errors between the output of all sample input signals to the network and the expected sample output are calculated, and then the global error is tested. If the global error does not meet the requirements, it will be propagated back through the error, and the connection weight between neurons in each layer will be modified layer by layer starting from the output layer. After several forward signal propagation and error back propagation processes, the global error between the output value and the expected value of all sample signals obtained by the network finally meets the requirements. In the back - propagation algorithm, gradient method is usually used to correct the weight, so the output function is required to be differentiable, and Sigmoid function is usually used as the output function. In the output layer, it is assumed that yk is the actual output value and ydk is the ideal output value, the error under this sample is shown in formula 1:
2k*21 kdk yyE …(1)
Fig. 2: Improved hybrid accelerated genetic algorithm flow chart.
layer through the neurons in each hidden layer, and the global errors between the output of all sample input signals to the network and the expected sample output are calculated, and then the global error is tested. If the global error does not meet the requirements, it will be propagated back through the error, and the connection weight between neurons in each layer will be modified layer by layer starting from the output layer. After several forward signal propagation and error back propagation processes, the global error between the output value and the expected value of all sample signals obtained by the network finally meets the requirements. In the back - propagation algorithm, gradient method is usually used to correct the weight, so the output function is required to be differentiable, and Sigmoid function is usually used as the output function. In the output layer, it is assumed that yk is the actual output value and ydk is the ideal output value,
the error under this sample is shown in formula 1:
E k y ydk k= -Â1
22* ( ) …(1)
Then, the partial derivative is calculated to obtain the weight correction amount. It can be concluded that the learning algorithm of the network belongs to supervised learning, and it is necessary to provide the input samples and the corresponding ideal output at the same time.
Formula for calculating the sub-index of atmospheric pollution damage: With the change of atmospheric pollutant concentration from low to high, the degree of its harm to the environment is constantly changing. Therefore, the growth curve index formula can be used to describe various individual environmental indicators. And the pollution damage rate of the air pollutant to the air quality can be
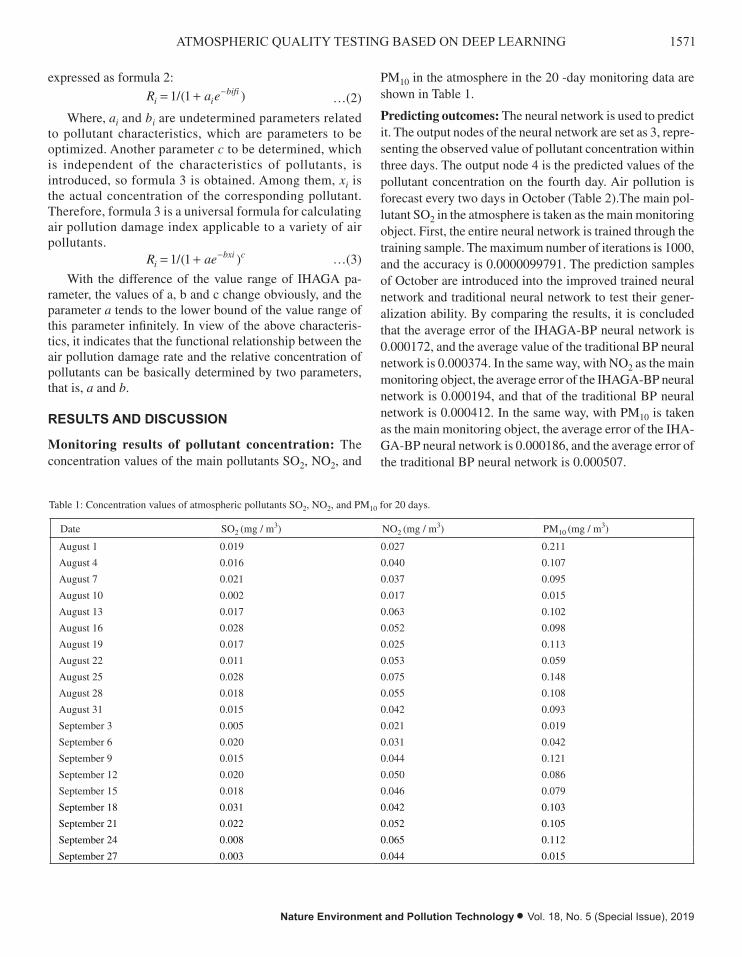
1571ATMOSPHERIC QUALITY TESTING BASED ON DEEP LEARNING
Nature Environment and Pollution Technology • Vol. 18, No. 5 (Special Issue), 2019
expressed as formula 2:
R a ei ibifi= + -1 1/( ) …(2)
Where, ai and bi are undetermined parameters related to pollutant characteristics, which are parameters to be optimized. Another parameter c to be determined, which is independent of the characteristics of pollutants, is introduced, so formula 3 is obtained. Among them, xi is the actual concentration of the corresponding pollutant. Therefore, formula 3 is a universal formula for calculating air pollution damage index applicable to a variety of air pollutants.
R aeibxi c= + -1 1/( ) …(3)
With the difference of the value range of IHAGA pa-rameter, the values of a, b and c change obviously, and the parameter a tends to the lower bound of the value range of this parameter infinitely. In view of the above characteris-tics, it indicates that the functional relationship between the air pollution damage rate and the relative concentration of pollutants can be basically determined by two parameters, that is, a and b.
RESULTS AND DISCUSSION
Monitoring results of pollutant concentration: The concentration values of the main pollutants SO2, NO2, and
PM10 in the atmosphere in the 20 -day monitoring data are shown in Table 1.
Predicting outcomes: The neural network is used to predict it. The output nodes of the neural network are set as 3, repre-senting the observed value of pollutant concentration within three days. The output node 4 is the predicted values of the pollutant concentration on the fourth day. Air pollution is forecast every two days in October (Table 2).The main pol-lutant SO2 in the atmosphere is taken as the main monitoring object. First, the entire neural network is trained through the training sample. The maximum number of iterations is 1000, and the accuracy is 0.0000099791. The prediction samples of October are introduced into the improved trained neural network and traditional neural network to test their gener-alization ability. By comparing the results, it is concluded that the average error of the IHAGA-BP neural network is 0.000172, and the average value of the traditional BP neural network is 0.000374. In the same way, with NO2 as the main monitoring object, the average error of the IHAGA-BP neural network is 0.000194, and that of the traditional BP neural network is 0.000412. In the same way, with PM10 is taken as the main monitoring object, the average error of the IHA-GA-BP neural network is 0.000186, and the average error of the traditional BP neural network is 0.000507.
Table 1: Concentration values of atmospheric pollutants SO2, NO2, and PM10 for 20 days.
Date SO2 (mg / m3) NO2 (mg / m3) PM10 (mg / m3)
August 1 0.019 0.027 0.211
August 4 0.016 0.040 0.107
August 7 0.021 0.037 0.095
August 10 0.002 0.017 0.015
August 13 0.017 0.063 0.102
August 16 0.028 0.052 0.098
August 19 0.017 0.025 0.113
August 22 0.011 0.053 0.059
August 25 0.028 0.075 0.148
August 28 0.018 0.055 0.108
August 31 0.015 0.042 0.093
September 3 0.005 0.021 0.019
September 6 0.020 0.031 0.042
September 9 0.015 0.044 0.121
September 12 0.020 0.050 0.086
September 15 0.018 0.046 0.079
September 18 0.031 0.042 0.103
September 21 0.022 0.052 0.105
September 24 0.008 0.065 0.112
September 27 0.003 0.044 0.015
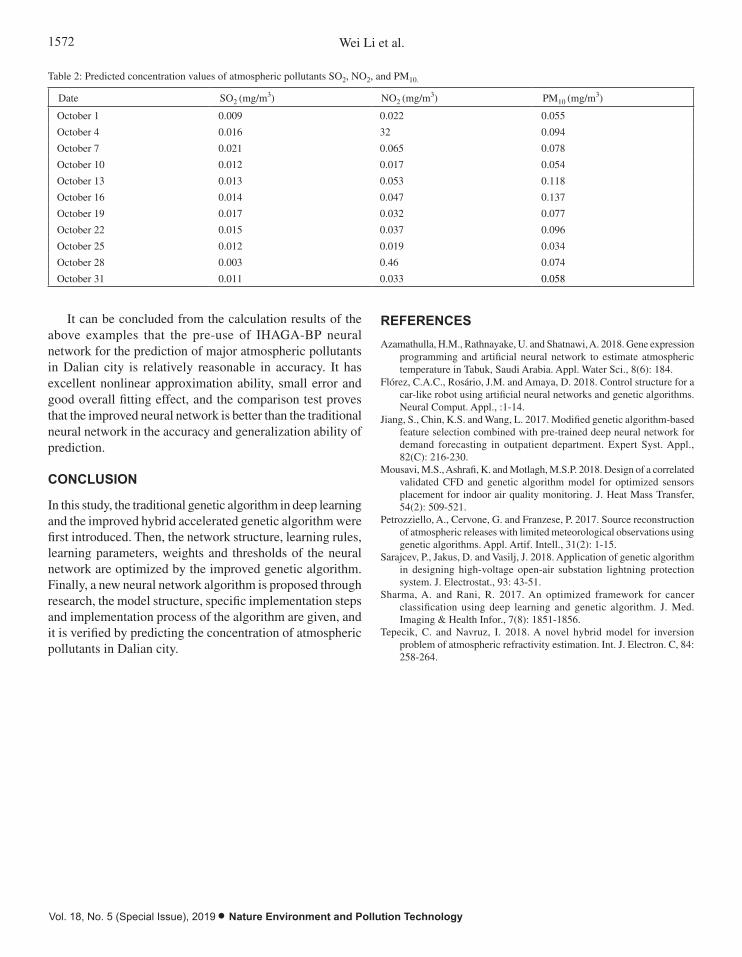
1572 Wei Li et al.
Vol. 18, No. 5 (Special Issue), 2019 • Nature Environment and Pollution Technology
It can be concluded from the calculation results of the above examples that the pre-use of IHAGA-BP neural network for the prediction of major atmospheric pollutants in Dalian city is relatively reasonable in accuracy. It has excellent nonlinear approximation ability, small error and good overall fitting effect, and the comparison test proves that the improved neural network is better than the traditional neural network in the accuracy and generalization ability of prediction.
CONCLUSION
In this study, the traditional genetic algorithm in deep learning and the improved hybrid accelerated genetic algorithm were first introduced. Then, the network structure, learning rules, learning parameters, weights and thresholds of the neural network are optimized by the improved genetic algorithm. Finally, a new neural network algorithm is proposed through research, the model structure, specific implementation steps and implementation process of the algorithm are given, and it is verified by predicting the concentration of atmospheric pollutants in Dalian city.
REFERENCES
Azamathulla, H.M., Rathnayake, U. and Shatnawi, A. 2018. Gene expression programming and artificial neural network to estimate atmospheric temperature in Tabuk, Saudi Arabia. Appl. Water Sci., 8(6): 184.
Flórez, C.A.C., Rosário, J.M. and Amaya, D. 2018. Control structure for a car-like robot using artificial neural networks and genetic algorithms. Neural Comput. Appl., :1-14.
Jiang, S., Chin, K.S. and Wang, L. 2017. Modified genetic algorithm-based feature selection combined with pre-trained deep neural network for demand forecasting in outpatient department. Expert Syst. Appl., 82(C): 216-230.
Mousavi, M.S., Ashrafi, K. and Motlagh, M.S.P. 2018. Design of a correlated validated CFD and genetic algorithm model for optimized sensors placement for indoor air quality monitoring. J. Heat Mass Transfer, 54(2): 509-521.
Petrozziello, A., Cervone, G. and Franzese, P. 2017. Source reconstruction of atmospheric releases with limited meteorological observations using genetic algorithms. Appl. Artif. Intell., 31(2): 1-15.
Sarajcev, P., Jakus, D. and Vasilj, J. 2018. Application of genetic algorithm in designing high-voltage open-air substation lightning protection system. J. Electrostat., 93: 43-51.
Sharma, A. and Rani, R. 2017. An optimized framework for cancer classification using deep learning and genetic algorithm. J. Med. Imaging & Health Infor., 7(8): 1851-1856.
Tepecik, C. and Navruz, I. 2018. A novel hybrid model for inversion problem of atmospheric refractivity estimation. Int. J. Electron. C, 84: 258-264.
Date SO2 (mg/m3) NO2 (mg/m3) PM10 (mg/m3)
October 1 0.009 0.022 0.055
October 4 0.016 32 0.094
October 7 0.021 0.065 0.078
October 10 0.012 0.017 0.054
October 13 0.013 0.053 0.118
October 16 0.014 0.047 0.137
October 19 0.017 0.032 0.077
October 22 0.015 0.037 0.096
October 25 0.012 0.019 0.034
October 28 0.003 0.46 0.074
October 31 0.011 0.033 0.058
Table 2: Predicted concentration values of atmospheric pollutants SO2, NO2, and PM10.

System Simulation Optimization of Resource and Environmental Effects of Circular Economy
Xinghua WangShanxi Agricultural University, Shanxi, China
ABSTRACT
In order to study the system simulation optimization of resource and environment effects of circular economy, based on the theory of composite ecosystem, the dynamic model of composite ecosystem is established by using the method of system dynamics and software tools, and the development trend of future system status and main ecological risks are simulated by using the model. Based on the mechanism and characteristics of the ecosystem revealed by the dynamic model and the results of ecological security assessment, the countermeasures and measures for management and protection are put forward. The results show that GDP growth is very fast in the forecast, while net GDP growth lags far behind the GDP. This shows that the loss of environment and resources and natural disasters is also increasing in the process of rapid economic development. Therefore, this kind of economic development is at the cost of excessive pollution of the environment and consumption of resources. Economic development has become a threat to the pressure and security of the entire urban ecosystem. It is necessary to find ways of energy recycling and sustainable economic development.
INTRODUCTION
Resource conservation, environmental protection and economic development are three major themes facing the development of human society today. Energy sustainability is the foundation, environment sustainability is the condition, and economic sustainability is the ultimate goal. Based on this, the simulation model of energy-economy-environment system operation is established. Traditional economic development hardly takes into account the destructive effects of economic growth on the environment and ecosystem. It is based on the assumption that resources can be supplied without restriction (Edaibat et al. 2017). Therefore, economic activities guided by this kind of development cause a large consumption or even waste of resources and energy. Over the years, human beings have exploited various mineral re-sources predatorily, unilaterally emphasizing the scale and speed of economic development, neglecting many related factors such as ecological carrying capacity, separating the interaction of relevant factors in the ecosystem, causing cli-mate deterioration and resource shortage, adversely affecting economic production, and ultimately endangering the human survival environment (Eker et al. 2017). The study of energy- economy-environment complex system needs not only natural science, engineering technology science and a lot of practical experience, but also the guidance of modern eco-nomic thoughts, theories and methods (King 2017, Sanatani 2017). The research on energy, economy and environment
system also needs some theoretical foundation. The basic theories of analysis include sustainable development theory, energy economics theory, environmental value theory, system theory, econometrics theory and so on. These theories support the research work of this study from different levels and angles (Palomba et al. 2017). Developing circular economy is an important way to achieve clean and efficient production and sustainable development. On the basis of promoting en-ergy saving and emission reduction, it creates new economic growth points for enterprises through extending the industrial chain, which has an obvious social, economic, resource and environmental effects (Teng et al. 2018).
Econometrics is an economic branch based on math-ematical economics and mathematical statistics, which synthesizes the theoretical and empirical approaches to economic problems (Liu & Zhou 2017). The econometric research methods such as regression analysis, time series model, cointegration analysis and Granger causality test are adopted (Morgan et al. 2017). System dynamics is not only a subject of analysing and studying information feedback system, but also a new interdisciplinary subject of recognizing system problems and solving system prob-lems. It is a branch of system science and management science. It is also a horizontal subject of communicating natural science and social science. Based on the research of circular economy, econometrics, environmental effects and system simulation optimization, Yancheng is taken as an example to carry out empirical research, and the future
Nat. Env. & Poll. Tech.Website: www.neptjournal.com
Received: 07-08-2019Accepted: 10-10-2019
Key Words:Circular economyResourcesGDPSystem dynamicsSystem simulationOptimization
2019pp. 1573-1578 Vol. 18
p-ISSN: 0972-6268 No. 5 (Special Issue)
Nature Environment and Pollution Technology An International Quarterly Scientific Journal
Original Research Paper
e-ISSN: 2395-3454
Open Access

1574 Xinghua Wang
Vol. 18, No. 5 (Special Issue), 2019 • Nature Environment and Pollution Technology
operation status of Yancheng energy-economy-environment system is simulated and predicted by using the established simulation model.
PAST RESEARCH
Circular economy model provides a strategic theoretical paradigm for sustainable development, which can funda-mentally solve the contradiction and conflict between current economic development and natural environment. System dynamics model can reflect the interaction between structure, function and dynamic behaviour of complex systems, and is suitable for dealing with complex socio-economic and ecological environment problems with low precision. The focus of relevant research is different.
A study established the energy-saving and efficient waste heat cycle, nitrogen cycle, relaxation gas cycle, water cycle, waste residue recovery and product cycle by developing technologies such as methanol relaxation gas replacing coke oven gas, pressure swing adsorption hydrogen refining benzene, methanol air separation surplus nitrogen gas using dry quenching for power generation, waste water grading treatment, steam allocation cascade utilization, waste residue application coal blending system and so on, which realizes zero emission of “three wastes” and energy efficient cascade utilization in coal chemical production process.
A previous research (Guo et al. 2014) invents and pro-vides a micro-grid control system, which includes micro-grid control cabinet, main control cabinet and measurement and control cabinet, as well as microgrid management module. Micro-grid control cabinet is electrically connected with power generation module and energy storage module respec-tively. It is used to receive and collect electric energy of one or more power generation modules and manage the storage and release of electric energy of energy storage module. The main control cabinet and the measurement and control cabinet are used to monitor the operation of the primary equipment of the whole micro-grid, analyse the operation of the micro-grid in real time, and obtain the optimization and adjustment strategy of the whole micro-grid and imple-ment it quickly and automatically. Among them, the main control cabinet is electrically connected with the microgrid control cabinet, and the measurement and control cabinets are electrically connected with the main control cabinet. The microgrid management module is electrically connected with the microgrid control cabinet, the main control cabinet and the measurement and control cabinet respectively, which centrally controls and manages the microgrid control cabinet, the main control cabinet and the measurement and control cabinet. It is also responsible for the coordination of power generation module, energy storage module and external network. A new energy recycling system using the above
microgrid control system is provided.
In view of the development goals and demands of smart grid in different periods, Han et al. (2012) proposed a dynamic evaluation method of smart grid based on system dynamics model. This method takes the investment of smart grid as the starting point and establishes the system dynamics model of the dynamic impact of smart technology on the construction effect of smart grid through investment. The model quantitatively analyses the causal feedback relationship between the two and gives the trend of the evaluation index of smart grid evolving with time. The rationality and validity of the dynamic evaluation method are verified by simulation analysis.
This paper discusses the basic principles and methods of carrying capacity of water and soil resources. At the same time, based on the characteristics of water and soil resources and economic development in arid areas of northwest China, a system model of carrying capacity of water and soil resources in arid areas of northwest China is established by applying the principle of system dynamics. Taking Hexi region of Gansu province as an example, the carrying capacity of water and soil resources is systematically analysed and studied. The countermeasures to improve the carrying capacity of soil and water resources in this area are put forward.
MATERIALS AND METHODS
Research object: Research object is Yancheng eco-natural environment system dynamics model.
Modelling method of system dynamics: The essence of the system dynamics method is a system of first order differential equations, which describes the dependence of the rate of change of each state variable on each state variable or specific input, as shown in Fig. 1. The modelling steps are as follows:
1. Research methods and modelling purposes are determined. Systematic analysis is carried out on the system characteristics of the object of study and the applicability of selecting the theory and method of system dynamics. Relevant data of the object of study and related data of system operation are collected, and the purpose of building the system dynamics model is clarified. The system boundary and system composition are determined. System events and their actual system behaviour patterns are analysed.
2. The boundary of the system is determined. The system structure is deeply analysed, and the key problems and main elements of the research object system, the hierarchy and subsystem structure of the research object system are clarified. The feedback system of the whole and subsystems of the system are defined as the main variable for describing the system.
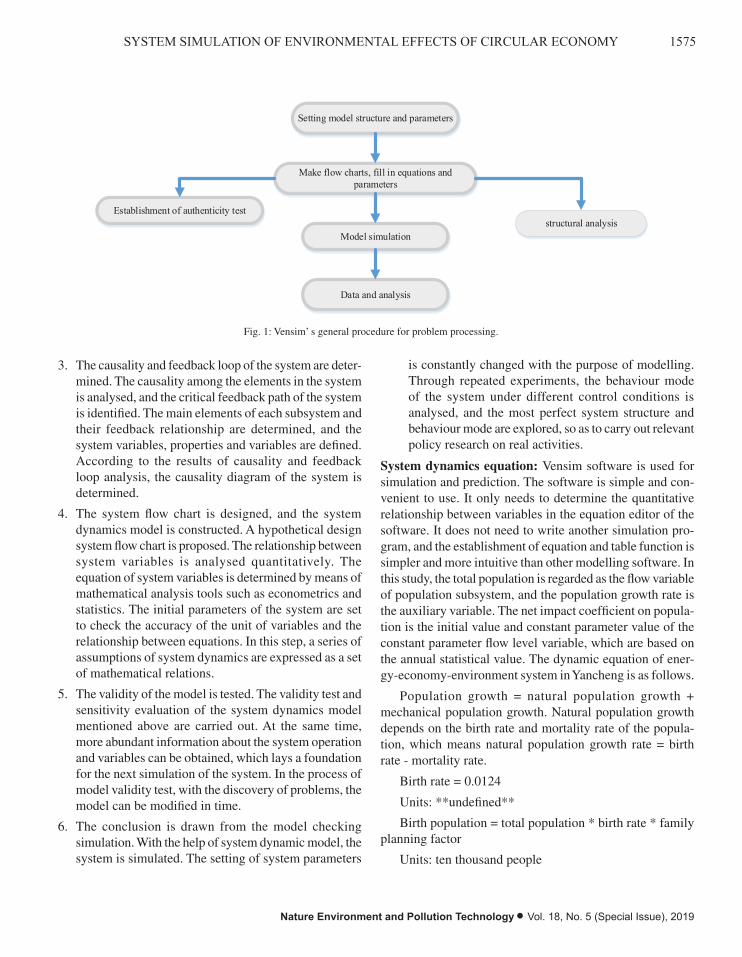
1575SYSTEM SIMULATION OF ENVIRONMENTAL EFFECTS OF CIRCULAR ECONOMY
Nature Environment and Pollution Technology • Vol. 18, No. 5 (Special Issue), 2019
information about the system operation and variables can be obtained, which lays a foundation for the next simulation of the system. In the process of model validity test, with the discovery of problems, the model can be modified in time.
6. The conclusion is drawn from the model checking simulation. With the help of system dynamic model, the system is simulated. The setting of system parameters is constantly changed with the purpose of modelling. Through repeated experiments, the behaviour mode of the system under different control conditions is analysed, and the most perfect system structure and behaviour mode are explored, so as to carry out relevant policy research on real activities.
Setting model structure and parameters
Make flow charts, fill in equations and parameters
Model simulation
Data and analysis
structural analysisEstablishment of authenticity test
Fig. 1: Vensim’ s general procedure for problem processing.
System dynamics equation: Vensim software is used for simulation and prediction. The software is simple and convenient to use. It only needs to determine the quantitative relationship between variables in the equation editor of the software. It does not need to write another simulation program, and the establishment of equation and table function is simpler and more intuitive than other modelling software. In this study, the total population is regarded as the flow variable of population subsystem, and the population growth rate is the auxiliary variable. The net impact coefficient on population is the initial value and constant parameter value of the constant parameter flow level variable, which are based on the annual statistical value. The dynamic equation of energy-economy-environment system in Yancheng is as follows.
Population growth = natural population growth + mechanical population growth. Natural population growth depends on the birth rate and mortality rate of the population, which means natural population growth rate = birth rate - mortality rate.
Birth rate = 0.0124
Units: **undefined**
Birth population = total population * birth rate * family planning factor
Units: ten thousand people
mortality = 0.00643
Units: **undefined**
Death population = total population * mortality * eco-environmental impact factor
Units: ten thousand people
Energy consumption per unit GDP = total energy consumption/GDP
Units: Billion yuan
Per capita GDP = GDP/total population * 10,000
3. The causality and feedback loop of the system are deter-mined. The causality among the elements in the system is analysed, and the critical feedback path of the system is identified. The main elements of each subsystem and their feedback relationship are determined, and the system variables, properties and variables are defined. According to the results of causality and feedback loop analysis, the causality diagram of the system is determined.
4. The system flow chart is designed, and the system dynamics model is constructed. A hypothetical design system flow chart is proposed. The relationship between system variables is analysed quantitatively. The equation of system variables is determined by means of mathematical analysis tools such as econometrics and statistics. The initial parameters of the system are set to check the accuracy of the unit of variables and the relationship between equations. In this step, a series of assumptions of system dynamics are expressed as a set of mathematical relations.
5. The validity of the model is tested. The validity test and sensitivity evaluation of the system dynamics model mentioned above are carried out. At the same time, more abundant information about the system operation and variables can be obtained, which lays a foundation for the next simulation of the system. In the process of model validity test, with the discovery of problems, the model can be modified in time.
6. The conclusion is drawn from the model checking simulation. With the help of system dynamic model, the system is simulated. The setting of system parameters
is constantly changed with the purpose of modelling. Through repeated experiments, the behaviour mode of the system under different control conditions is analysed, and the most perfect system structure and behaviour mode are explored, so as to carry out relevant policy research on real activities.
System dynamics equation: Vensim software is used for simulation and prediction. The software is simple and con-venient to use. It only needs to determine the quantitative relationship between variables in the equation editor of the software. It does not need to write another simulation pro-gram, and the establishment of equation and table function is simpler and more intuitive than other modelling software. In this study, the total population is regarded as the flow variable of population subsystem, and the population growth rate is the auxiliary variable. The net impact coefficient on popula-tion is the initial value and constant parameter value of the constant parameter flow level variable, which are based on the annual statistical value. The dynamic equation of ener-gy-economy-environment system in Yancheng is as follows.
Population growth = natural population growth + mechanical population growth. Natural population growth depends on the birth rate and mortality rate of the popula-tion, which means natural population growth rate = birth rate - mortality rate.
Birth rate = 0.0124
Units: **undefined**
Birth population = total population * birth rate * family planning factor
Units: ten thousand people
Fig. 1: Vensim’ s general procedure for problem processing.
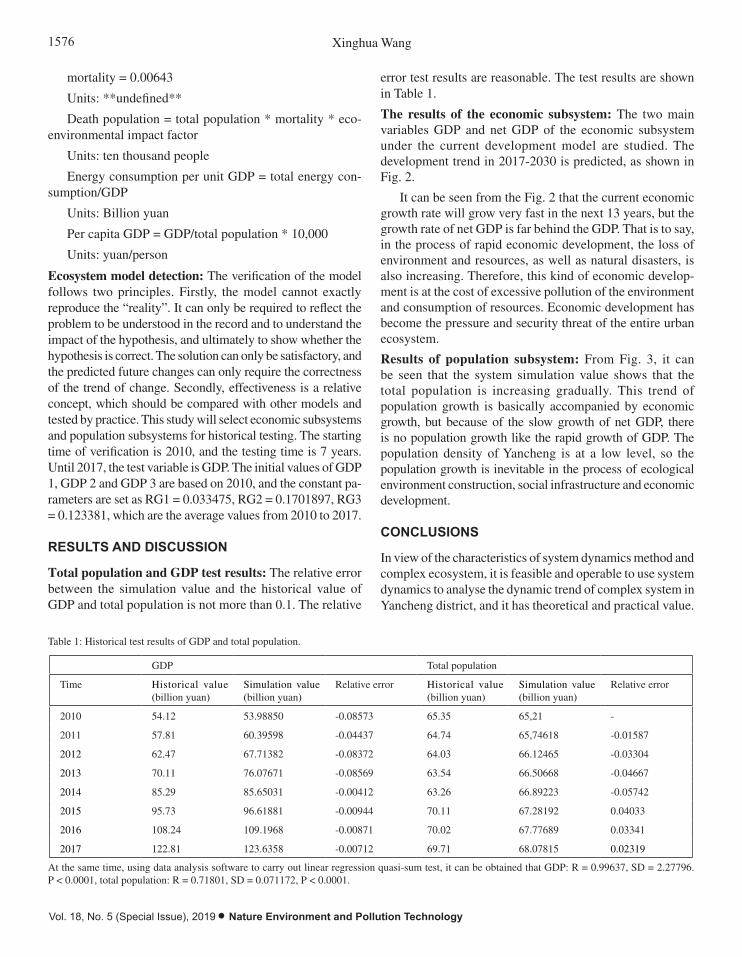
1576 Xinghua Wang
Vol. 18, No. 5 (Special Issue), 2019 • Nature Environment and Pollution Technology
mortality = 0.00643
Units: **undefined**
Death population = total population * mortality * eco-environmental impact factor
Units: ten thousand people
Energy consumption per unit GDP = total energy con-sumption/GDP
Units: Billion yuan
Per capita GDP = GDP/total population * 10,000
Units: yuan/person
Ecosystem model detection: The verification of the model follows two principles. Firstly, the model cannot exactly reproduce the “reality”. It can only be required to reflect the problem to be understood in the record and to understand the impact of the hypothesis, and ultimately to show whether the hypothesis is correct. The solution can only be satisfactory, and the predicted future changes can only require the correctness of the trend of change. Secondly, effectiveness is a relative concept, which should be compared with other models and tested by practice. This study will select economic subsystems and population subsystems for historical testing. The starting time of verification is 2010, and the testing time is 7 years. Until 2017, the test variable is GDP. The initial values of GDP 1, GDP 2 and GDP 3 are based on 2010, and the constant pa-rameters are set as RG1 = 0.033475, RG2 = 0.1701897, RG3 = 0.123381, which are the average values from 2010 to 2017.
RESULTS AND DISCUSSION
Total population and GDP test results: The relative error between the simulation value and the historical value of GDP and total population is not more than 0.1. The relative
error test results are reasonable. The test results are shown in Table 1.
The results of the economic subsystem: The two main variables GDP and net GDP of the economic subsystem under the current development model are studied. The development trend in 2017-2030 is predicted, as shown in Fig. 2.
It can be seen from the Fig. 2 that the current economic growth rate will grow very fast in the next 13 years, but the growth rate of net GDP is far behind the GDP. That is to say, in the process of rapid economic development, the loss of environment and resources, as well as natural disasters, is also increasing. Therefore, this kind of economic develop-ment is at the cost of excessive pollution of the environment and consumption of resources. Economic development has become the pressure and security threat of the entire urban ecosystem.
Results of population subsystem: From Fig. 3, it can be seen that the system simulation value shows that the total population is increasing gradually. This trend of population growth is basically accompanied by economic growth, but because of the slow growth of net GDP, there is no population growth like the rapid growth of GDP. The population density of Yancheng is at a low level, so the population growth is inevitable in the process of ecological environment construction, social infrastructure and economic development.
CONCLUSIONS
In view of the characteristics of system dynamics method and complex ecosystem, it is feasible and operable to use system dynamics to analyse the dynamic trend of complex system in Yancheng district, and it has theoretical and practical value.
Table 1: Historical test results of GDP and total population.
GDP Total population
Time Historical value (billion yuan)
Simulation value (billion yuan)
Relative error Historical value (billion yuan)
Simulation value (billion yuan)
Relative error
2010 54.12 53.98850 -0.08573 65.35 65,21 -
2011 57.81 60.39598 -0.04437 64.74 65,74618 -0.01587
2012 62.47 67.71382 -0.08372 64.03 66.12465 -0.03304
2013 70.11 76.07671 -0.08569 63.54 66.50668 -0.04667
2014 85.29 85.65031 -0.00412 63.26 66.89223 -0.05742
2015 95.73 96.61881 -0.00944 70.11 67.28192 0.04033
2016 108.24 109.1968 -0.00871 70.02 67.77689 0.03341
2017 122.81 123.6358 -0.00712 69.71 68.07815 0.02319
At the same time, using data analysis software to carry out linear regression quasi-sum test, it can be obtained that GDP: R = 0.99637, SD = 2.27796. P < 0.0001, total population: R = 0.71801, SD = 0.071172, P < 0.0001.
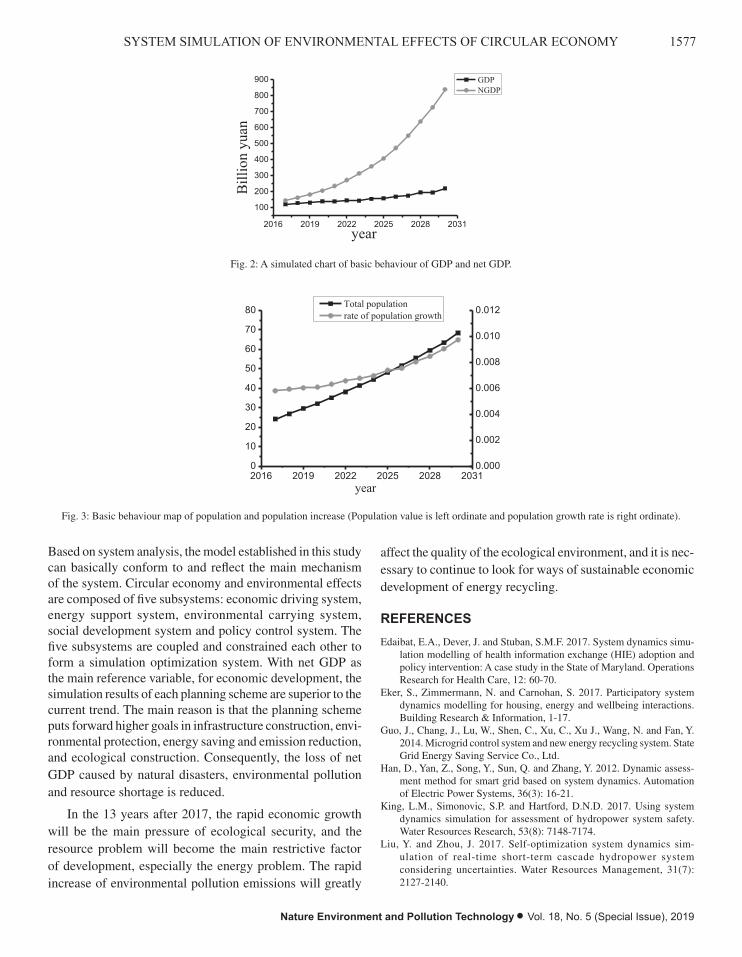
1577SYSTEM SIMULATION OF ENVIRONMENTAL EFFECTS OF CIRCULAR ECONOMY
Nature Environment and Pollution Technology • Vol. 18, No. 5 (Special Issue), 2019
2016 2019 2022 2025 2028 2031
100
200
300
400
500
600
700
800
900
Bill
ion
yuan
year
GDP NGDP
Fig. 2: A simulated chart of basic behaviour of GDP and net GDP.
It can be seen from the Fig. 2 that the current economic growth rate will grow very fast in the next 13 years, but the growth rate of net GDP is far behind the GDP. That is to say, in the process of rapid economic development, the loss of environment and resources, as well as natural disasters, is also increasing. Therefore, this kind of economic development is at the cost of excessive pollution of the environment and consumption of resources. Economic development has become the pressure and security threat of the entire urban ecosystem.
Results of population subsystem: From Fig. 3, it can be seen that the system simulation value shows that the total population is increasing gradually. This trend of population growth is basically accompanied by economic growth, but because of the slow growth of net GDP, there is no population growth like the rapid growth of GDP. The population density of Yancheng is at a low level, so the population growth is inevitable in the process of ecological environment construction, social infrastructure and economic development.
2016 2019 2022 2025 2028 20310
10
20
30
40
50
60
70
80
0.000
0.002
0.004
0.006
0.008
0.010
0.012
year
Total population rate of population growth
Fig. 2: A simulated chart of basic behaviour of GDP and net GDP.
2016 2019 2022 2025 2028 2031
100
200
300
400
500
600
700
800
900
Bill
ion
yuan
year
GDP NGDP
Fig. 2: A simulated chart of basic behaviour of GDP and net GDP.
It can be seen from the Fig. 2 that the current economic growth rate will grow very fast in the next 13 years, but the growth rate of net GDP is far behind the GDP. That is to say, in the process of rapid economic development, the loss of environment and resources, as well as natural disasters, is also increasing. Therefore, this kind of economic development is at the cost of excessive pollution of the environment and consumption of resources. Economic development has become the pressure and security threat of the entire urban ecosystem.
Results of population subsystem: From Fig. 3, it can be seen that the system simulation value shows that the total population is increasing gradually. This trend of population growth is basically accompanied by economic growth, but because of the slow growth of net GDP, there is no population growth like the rapid growth of GDP. The population density of Yancheng is at a low level, so the population growth is inevitable in the process of ecological environment construction, social infrastructure and economic development.
2016 2019 2022 2025 2028 20310
10
20
30
40
50
60
70
80
0.000
0.002
0.004
0.006
0.008
0.010
0.012
year
Total population rate of population growth
Fig. 3: Basic behaviour map of population and population increase (Population value is left ordinate and population growth rate is right ordinate).
Based on system analysis, the model established in this study can basically conform to and reflect the main mechanism of the system. Circular economy and environmental effects are composed of five subsystems: economic driving system, energy support system, environmental carrying system, social development system and policy control system. The five subsystems are coupled and constrained each other to form a simulation optimization system. With net GDP as the main reference variable, for economic development, the simulation results of each planning scheme are superior to the current trend. The main reason is that the planning scheme puts forward higher goals in infrastructure construction, envi-ronmental protection, energy saving and emission reduction, and ecological construction. Consequently, the loss of net GDP caused by natural disasters, environmental pollution and resource shortage is reduced.
In the 13 years after 2017, the rapid economic growth will be the main pressure of ecological security, and the resource problem will become the main restrictive factor of development, especially the energy problem. The rapid increase of environmental pollution emissions will greatly
affect the quality of the ecological environment, and it is nec-essary to continue to look for ways of sustainable economic development of energy recycling.
REFERENCES
Edaibat, E.A., Dever, J. and Stuban, S.M.F. 2017. System dynamics simu-lation modelling of health information exchange (HIE) adoption and policy intervention: A case study in the State of Maryland. Operations Research for Health Care, 12: 60-70.
Eker, S., Zimmermann, N. and Carnohan, S. 2017. Participatory system dynamics modelling for housing, energy and wellbeing interactions. Building Research & Information, 1-17.
Guo, J., Chang, J., Lu, W., Shen, C., Xu, C., Xu J., Wang, N. and Fan, Y. 2014. Microgrid control system and new energy recycling system. State Grid Energy Saving Service Co., Ltd.
Han, D., Yan, Z., Song, Y., Sun, Q. and Zhang, Y. 2012. Dynamic assess-ment method for smart grid based on system dynamics. Automation of Electric Power Systems, 36(3): 16-21.
King, L.M., Simonovic, S.P. and Hartford, D.N.D. 2017. Using system dynamics simulation for assessment of hydropower system safety. Water Resources Research, 53(8): 7148-7174.
Liu, Y. and Zhou, J. 2017. Self-optimization system dynamics sim-ulation of real-time short-term cascade hydropower system considering uncertainties. Water Resources Management, 31(7): 2127-2140.

1578 Xinghua Wang
Vol. 18, No. 5 (Special Issue), 2019 • Nature Environment and Pollution Technology
Morgan, J.S., Howick, S. and Belton, V. 2017. A toolkit of designs for mixing discrete event simulation and system dynamics. European Journal of Operational Research, 257(3): 907-918.
Palomba, V., Ferraro, M. and Frazzica, A. 2017. Dynamic simulation of a multi-generation system, for electric and cooling energy provision, employing a SOFC cogenerator and an adsorption chiller. Energy Procedia, 143: 416-423.
Sanatani, S. 2017. Market penetration of new products in segmented popu-lations: A system dynamics simulation with fuzzy sets. Technological Forecasting & Social Change, 19(4): 313-329.
Teng, J., Chao, X. and Wan, W. 2018. A system dynamics-based deci-sion-making tool and strategy optimization simulation of green building development in China. Clean Technologies and Environmental Policy, 1-12.
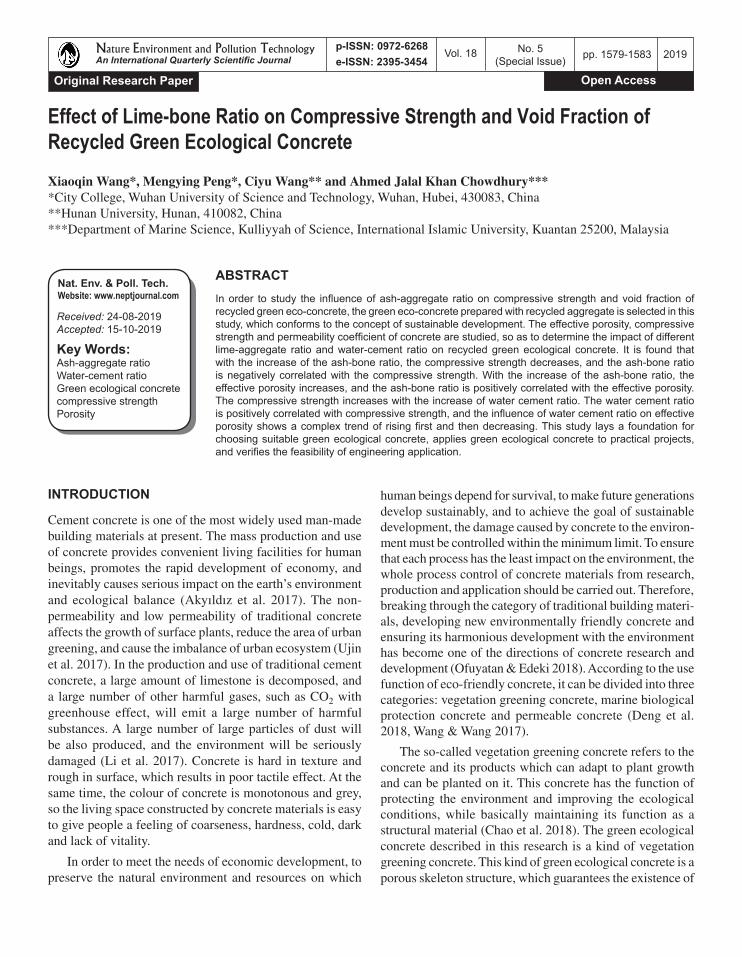
Effect of Lime-bone Ratio on Compressive Strength and Void Fraction of Recycled Green Ecological Concrete
Xiaoqin Wang*, Mengying Peng*, Ciyu Wang** and Ahmed Jalal Khan Chowdhury****City College, Wuhan University of Science and Technology, Wuhan, Hubei, 430083, China**Hunan University, Hunan, 410082, China***Department of Marine Science, Kulliyyah of Science, International Islamic University, Kuantan 25200, Malaysia
ABSTRACT
In order to study the influence of ash-aggregate ratio on compressive strength and void fraction of recycled green eco-concrete, the green eco-concrete prepared with recycled aggregate is selected in this study, which conforms to the concept of sustainable development. The effective porosity, compressive strength and permeability coefficient of concrete are studied, so as to determine the impact of different lime-aggregate ratio and water-cement ratio on recycled green ecological concrete. It is found that with the increase of the ash-bone ratio, the compressive strength decreases, and the ash-bone ratio is negatively correlated with the compressive strength. With the increase of the ash-bone ratio, the effective porosity increases, and the ash-bone ratio is positively correlated with the effective porosity. The compressive strength increases with the increase of water cement ratio. The water cement ratio is positively correlated with compressive strength, and the influence of water cement ratio on effective porosity shows a complex trend of rising first and then decreasing. This study lays a foundation for choosing suitable green ecological concrete, applies green ecological concrete to practical projects, and verifies the feasibility of engineering application.
INTRODUCTION
Cement concrete is one of the most widely used man-made building materials at present. The mass production and use of concrete provides convenient living facilities for human beings, promotes the rapid development of economy, and inevitably causes serious impact on the earth’s environment and ecological balance (Akyıldız et al. 2017). The non-permeability and low permeability of traditional concrete affects the growth of surface plants, reduce the area of urban greening, and cause the imbalance of urban ecosystem (Ujin et al. 2017). In the production and use of traditional cement concrete, a large amount of limestone is decomposed, and a large number of other harmful gases, such as CO2 with greenhouse effect, will emit a large number of harmful substances. A large number of large particles of dust will be also produced, and the environment will be seriously damaged (Li et al. 2017). Concrete is hard in texture and rough in surface, which results in poor tactile effect. At the same time, the colour of concrete is monotonous and grey, so the living space constructed by concrete materials is easy to give people a feeling of coarseness, hardness, cold, dark and lack of vitality.
In order to meet the needs of economic development, to preserve the natural environment and resources on which
human beings depend for survival, to make future generations develop sustainably, and to achieve the goal of sustainable development, the damage caused by concrete to the environ-ment must be controlled within the minimum limit. To ensure that each process has the least impact on the environment, the whole process control of concrete materials from research, production and application should be carried out. Therefore, breaking through the category of traditional building materi-als, developing new environmentally friendly concrete and ensuring its harmonious development with the environment has become one of the directions of concrete research and development (Ofuyatan & Edeki 2018). According to the use function of eco-friendly concrete, it can be divided into three categories: vegetation greening concrete, marine biological protection concrete and permeable concrete (Deng et al. 2018, Wang & Wang 2017).
The so-called vegetation greening concrete refers to the concrete and its products which can adapt to plant growth and can be planted on it. This concrete has the function of protecting the environment and improving the ecological conditions, while basically maintaining its function as a structural material (Chao et al. 2018). The green ecological concrete described in this research is a kind of vegetation greening concrete. This kind of green ecological concrete is a porous skeleton structure, which guarantees the existence of
Nat. Env. & Poll. Tech.Website: www.neptjournal.com
Received: 24-08-2019Accepted: 15-10-2019
Key Words:Ash-aggregate ratioWater-cement ratioGreen ecological concrete compressive strength Porosity
2019pp. 1579-1583 Vol. 18
p-ISSN: 0972-6268 No. 5 (Special Issue)
Nature Environment and Pollution Technology An International Quarterly Scientific Journal
Original Research Paper
e-ISSN: 2395-3454
Open Access
1580 Xiaoqin Wang et al.
Vol. 18, No. 5 (Special Issue), 2019 • Nature Environment and Pollution Technology
a certain amount of connected pore. The pore can store water and nutrients needed for plant root growth, so as to ensure the normal growth of grass on the surface of concrete. At the same time, since this kind of coagulation has more pores and better permeability, it can improve the moisture and heat exchange capacity of concrete surface, reduce the surface temperature of concrete material and improve the ground-water level. The application of green ecological concrete in road slope protection or parking lot can play a protective role, as well as play a role in greening the environment and soil and water conservation. It has good application prospects.
MATERIALS AND METHODS
Testing method of effective porosity: Porosity is an important parameter of permeable concrete. It reflects the structure of permeable concrete. The size of porosity represents the quality of permeability. There are three kinds of pore in permeable concrete: closed pore, semi-connected pore and connected pore. These three kinds of pore are collectively called full pore. Among them, closed pore refers to independently closed pore. Semi-connected pore refers to one end closed; the other end connected with connected pore. Connected pore refers to open pore at both ends. Permeability is measured by effective porosity. Target porosity and effective porosity are intrinsically related but different. For green eco-concrete, only the interconnected and semi-connected pore can ensure its water permeability function, thus ensuring the normal growth of plant roots. If free water can be discharged from the pore, it can be considered as effective pore. Therefore, the interconnected pore belongs to the effective pore. The water in the semi-connected pore is stagnant, but it can be discharged after simple treatment, and the semi-connected pore has sound absorption, so the semi-connected pore can also be called effective pore. The closed pore has no effect on the permeability, nor does it help the sound absorption effect of the permeable concrete. However, its proportion in the whole pore is very small, so it can be neglected.
Preparation of specimens: The test method is carried out in accordance with the ordinary concrete test rules. The specimens are made according to a certain water-binder ratio and bone gelatinization. Three cubic specimens of 100mm * 100mm * 50mm are made in each group. The specimens are demolished 24 hours after moulding and maintained in the standard curing room until 28 days of age. The test pieces are put into the PVC test mould, and the inner diameter of the test mould is the same as the size of the test piece. The test die must be open to the top without leakage. Weight G1 of the inner sleeve specimen is weighed. The test model with the test piece is put into the glass cylinder with water
camp. The height of the water pipe from the bottom of the cylinder is slightly lower than that of the test piece and the test model. Water is carefully injected into the glass cylinder, and it should be noted that water should not be injected into the test model. The height of the injected water is slightly higher than that of the specimen, and the part of the water to be raised will flow out through the water pipe. The height of the injected water will be stabilized and a test tube which can be accurately read will be placed under the water pipe after the specimen. Water is slowly injected into the test mould. When the injected water is level with the surface of the test mould, the injection should be stopped, and it is necessary to stand still for about 5 minutes until the surface of water is stable. The volume of green eco-concrete is M1. According to formula 1, the effective porosity of green eco-concrete can be calculated.
A M M VW= - - ¥ ¥1 1002 1[( ) ( )] %/ r …(1)
Where, A is the effective void fraction of GEC (concrete), M2 is the weight of the sample in air after being dried and placed at (20 ± 2)°C and (60 ± 5)% relative humidity for 24 hours. M1 is the weight in water after being immersed in water and saturated by water absorption. rW is the density of water. V is the apparent volume of GEC measured and calculated by callipers.
Test method for permeability coefficient of specimens: At present, there is no standard method to determine the permeability of GEC in China. Generally, the determination of permeability coefficient can be divided into fixed-head method and variable-head method according to different test principles. According to Japanese research experience, fixed-head method is generally suitable for measuring the permea-bility coefficient of materials with good permeability, while variable-head method is generally suitable for measuring the permeability of materials with poor permeability. Therefore, the constant head method is adopted in this experiment. During the test, the concrete specimens cured up to the age are placed in the permeable cylinder, and certain cementing materials are used to ensure that the specimen and the wall of the permeable cylinder are impermeable. Then water is injected from the upper part of the pervious cylinder sleeve. Water enters the positioning bucket through concrete and is discharged from the outlet pipe. When water is injected, excess water overflows from the overflow pipe. When the amount of water injected is balanced with the amount of water discharged from the outlet pipe and the amount of water overflowing from the outlet pipe, the stopwatch is activated. The quantity Q of water discharged from the outlet pipe is measured at the same time, and the water temperature at that time can be measured to calculate the permeability coefficient of concrete through formula 2. The permeability coefficient

1581EFFECT OF LIME-BONE RATIO ON PROPERTIES OF RECYCLED GREEN CONCRETE
Nature Environment and Pollution Technology • Vol. 18, No. 5 (Special Issue), 2019
of GEC is determined as follows. Under a certain water head, the amount of water passing through concrete in a unit time is proportional to the permeable area of concrete and is in-versely proportional to the permeable thickness of concrete.
K Q D A H t tT = ¥ ¥ ¥ -( ) / [ ( )]2 1 …(2)
Where, KT is permeability coefficient (cm/s) at water temperature T°C, Q is water amount (cm3) through concrete from time T1 to T2, D is the thickness (cm) of GEC speci-mens, A is the area (cm2) of GEC specimens, H is the water head (cm) and (t2 - t1) is determination time (s).
In this experiment, the sealing problem between concrete and sleeve has been puzzling people. Because of various errors in the test, the size of each specimen cannot be exactly the same. There will be a gap between the specimen and sleeve. Water will pass through this gap during the test, and Q is the amount of water passing through the surface of the specimen in a certain time. Therefore, the gap will increase Q and make the result bigger, which cannot reflect the real situation. For the problem of edge leakage, researchers have used a variety of methods to bridge the gap. Some researchers use liquid wax or cement slurry to seal around the specimen, while others use rubber or oil slurry to seal the specimen and sleeve edge. In this test, cement slurry is used to seal the surrounding of the specimen. The consistency of the cement slurry should be appropriate. Excessive thinning will infiltrate into the specimen, plug the pore and affect the permeability. Excessive thickening will not be easy to smear. During the test, the specimen is evenly smeared on all sides, and only two permeable surfaces are left. When smearing, it should be noted that there are no gaps in the edges and corners. After about 12h, the cement slurry has been hardened, and then the sleeves and the test pieces are tightly tied together with a rope. The water permeation instrument used in the exper-iment is made according to the permeation principle. The specimen sleeve is made of plastic foam board with a certain hardness, so that it can ensure that there is no deformation and elasticity, and the outer casing is replaced by a bucket. Since the sleeve is made of rigid plastic foam board, it has a certain elasticity and is tightly tied with the rope, so that the sealing between the specimen and sleeve can be very good.
Test method for compressive strength: Compressive strength refers to “Standard for Testing Method of Mechan-ical Properties of Ordinary Concrete”. Cubic specimens with side length of 150mm * 150mm * 150mm are adopted. Six specimens are taken as a group, and the arithmetic average value of the measured values of six specimens is taken as the compressive strength value of the group of specimens.
Determination of grey bone ratio (G/C): The size of the cement-aggregate ratio (G/C) determines the thickness
and void age of the mortar layer wrapped on the surface of aggregate particles. When the aggregate dosage is fixed, increasing the ash-bone ratio (G/C) will reduce the amount of cement used. The cement slurry wrapped on the aggregate surface will be too thin. Although the porosity of the permeable eco-concrete will be increased, its strength will be decreased. On the contrary, if the ratio of cement to bone (G/C) is reduced, the corresponding amount of cement will increase, and the cement slurry wrapped will become thicker. The strength of permeable eco-concrete will be improved, but the porosity will be reduced, which will affect the permeability of permeable eco-concrete. Therefore, it is also an important factor affecting the strength and permeability of concrete. Since the strength of recycled aggregate itself is much lower than that of natural aggregate, a smaller ash-aggregate ratio is chosen. In this experiment, three levels of ash-aggregate ratio are adopted, namely, 3.5, 4.0 and 4.5.
Determination of W/C: Whatever the type of concrete is, W/C is an important index. The water cement ratio of recy-cled permeable concrete affects not only its strength but also its permeability. When W/C ratio is small, the mixture is dry and astringent, and its workability is poor. Moreover, because some cement cannot be fully hydrated, it will exist in the pore in the form of powder, which makes aggregates not well cemented together, and is not conducive to the improvement of strength. If the water cement ratio (W/C) is too large, the cement slurry will be too thin, which will block up the pore of concrete, affect the permeability of permeable ecological concrete. The compressive strength will be reduced. After a lot of literature research and trial matching, the water cement ratio of 0.3, 0.35 and 0.4 level are adopted in this experiment.
RESULTS AND DISCUSSION
The law of single factor affecting the performance of green eco-concrete: The results of the influence of water cement ratio and ash-bone ratio on green eco-concrete are shown in Table 1. The change trend is shown in Fig. 1.
Effect of compressive strength: When other factors re-main unchanged, the water cement ratio (W/C) is positively correlated with strength, and the strength increases with the increase of W/C. When other factors remain unchanged, the compressive strength is negatively correlated with the bone-cement ratio (G/C). That is to say, with the increase of the bone-cement ratio (G/C), the compressive strength tends to decrease. This is because when the cement-aggregate ratio (G/C) is small, the mortar is relatively more, and the mortar layer can fully wrap the aggregate, so the cohesive force between aggregates is stronger. At this time, the failure generally occurs on the side of the matrix, and the overall

1582 Xiaoqin Wang et al.
Vol. 18, No. 5 (Special Issue), 2019 • Nature Environment and Pollution Technology
Table 1: Effect of single factor on green eco-concrete performance.
Influence factor Compressive strength /MPa Effective porosity /%
Permeability coefficient mm/s
7d 28d
Water cement ratio (W/C) 0.3 1.7 2.9 38.5 6.13
0.35 2.1 2.5 40.8 10.17
0.4 4.1 4.6 35.2 6.65
Cement bone ratio (G/C) 3.0 5.2 6.1 32.7 4.92
3.5 3.9 4.4 35.1 6.68
4.0 1.8 1.9 39.9 10.96
A1 A2
B1 B2
C1 C2
Fig. 1: Effect of water-cement ratio and ash-bone ratio on green eco-concrete (A1: Effects of different grey-bone ratio on compressive strength; A2: Effects of different water-cement ratio on compressive strength; B1: Effects of different grey-bone ratio on effective porosity; B2: Effects of different water-ash ratio on effective porosity; C1: Effects of different lime-bone ratio on permeability coefficient; C2: Effect
of water-cement ratio on permeability coefficient).
Effect of compressive strength: When other factors remain unchanged, the water cement ratio (W/C) is positively correlated with strength, and the strength increases with the increase of W/C. When other factors remain unchanged, the compressive strength is negatively correlated with the bone-cement ratio (G/C). That is to say, with the increase of the bone-cement ratio (G/C), the compressive strength tends to decrease. This is because when the cement-aggregate ratio (G/C) is small, the mortar is relatively more, and the mortar layer can fully wrap the aggregate, so the cohesive force between aggregates is stronger. At this time, the failure generally occurs on the side of the matrix, and the overall strength of the specimen is higher. When the cement-cement ratio (G/C) increases gradually to a higher level, the bond strength between aggregates is not good because the cement slurry is not enough to wrap the recycled aggregates. The failure often occurs on the interface between aggregates, which leads to the destruction of concrete.
Effect on effective porosity: When other factors remain unchanged, the water-cement ratio shows a complex trend of rising first and then decreasing. This is because recycled aggregate absorbs part of the water. When the water cement ratio is small, the remaining water is not enough for cement hydration reaction, and unhydrated cement will be filled in the pore of permeable concrete in the form of powder, which will block the pore between aggregates, and make it unable to form up and down connected permeable channels. Therefore, the effective porosity is small. When the water cement ratio reaches 0.35, from the mixing situation, the mixing is uniform, the drying and wetting is moderate, and the aggregate surface is coated with a layer of thin and uniform cement slurry, which forms a connecting void between aggregate and aggregate. At this time, the effective void rate reaches the
Fig. 1: Effect of water-cement ratio and ash-bone ratio on green eco-concrete (A1: Effects of different grey-bone ratio on compressive strength; A2: Effects of different water-cement ratio on compressive strength; B1: Effects of different grey-bone ratio on effective porosity; B2: Effects of different water-ash ratio on effective porosity; C1: Effects of different lime-bone ratio on permeability coefficient;
C2: Effect of water-cement ratio on permeability coefficient).
1583EFFECT OF LIME-BONE RATIO ON PROPERTIES OF RECYCLED GREEN CONCRETE
Nature Environment and Pollution Technology • Vol. 18, No. 5 (Special Issue), 2019
strength of the specimen is higher. When the cement-cement ratio (G/C) increases gradually to a higher level, the bond strength between aggregates is not good because the cement slurry is not enough to wrap the recycled aggregates. The failure often occurs on the interface between aggregates, which leads to the destruction of concrete.
Effect on effective porosity: When other factors remain unchanged, the water-cement ratio shows a complex trend of rising first and then decreasing. This is because recycled aggregate absorbs part of the water. When the water cement ratio is small, the remaining water is not enough for cement hydration reaction, and unhydrated cement will be filled in the pore of permeable concrete in the form of powder, which will block the pore between aggregates, and make it unable to form up and down connected permeable channels. Therefore, the effective porosity is small. When the water cement ratio reaches 0.35, from the mixing situation, the mixing is uniform, the drying and wetting is moderate, and the aggregate surface is coated with a layer of thin and uni-form cement slurry, which forms a connecting void between aggregate and aggregate. At this time, the effective void rate reaches the maximum, and the effective void rate is 40.3%. When the water cement ratio continues to increase to 0.4, the cement slurry layer on the aggregate surface becomes thicker, the specimen becomes compact and the porosity decreases. Therefore, the water permeability decreases gradually. With the increase of cement-aggregate ratio, the surface area of aggregate increases, and the cement slurry used to wrap the aggregate surface is relatively small, which is not enough to form a uniform cement slurry layer on the aggregate surface, so the effective porosity will increase continuously.
CONCLUSION
From the point of view of environmental protection, green
and sustainable development, the effective porosity, per-meability coefficient and compressive strength of recycled green eco-concrete specimens are studied, and the effects of water-cement ratio and lime-bone ratio on the effective porosity, permeability coefficient and compressive strength of concrete specimens are studied with water-cement ratio and lime-bone ratio as variables respectively. It is found that the water cement ratio (W/C) is positively correlated with the strength, and the strength increases with the increase of W/C. Grey-bone ratio (G/C) is negatively correlated with compressive strength, that is, with the increase of grey-bone ratio (G/C), compressive strength tends to decrease. With the increase of ash-bone ratio, the effective porosity will increase continuously. When the water cement ratio is equal to 0.35, the maximum effective porosity can reach 40.8%. At this time, the permeability is the best, and the permeability coefficient reaches the maximum value of 10.17mm/s.
REFERENCES
Akyıldız, A., Köse, E.T. and Yıldız, A. 2017. Compressive strength and heavy metal leaching of concrete containing medical waste incineration ash. Construction & Building Materials, 138: 326-332.
Chao, L., Miao, L. and Quan, Y. 2018. Effects of viscosity modifying ad-mixture (VMA) on workability and compressive strength of structural EPS concrete. Construction & Building Materials, 175: 342-350.
Deng, F., He, Y. and Zhou, S. 2018. Compressive strength prediction of recycled concrete based on deep learning. Construction & Building Materials, 175: 562-569.
Li, Y., Tao, J.L. and Lei, T. 2017. Experimental study on compressive strength of recycled concrete. Advanced Materials Research, 261-263: 75-78.
Ofuyatan, O.M. and Edeki, S.O. 2018. Dataset on predictive compressive strength model for self-compacting concrete. Data in Brief, 17: 801-806.
Ujin, F., Ali, K.S. and Hanur-Harith, Z.Y. 2017. The effect of eggshells ash on the compressive strength of concrete. Key Engineering Materials, 728: 402-407.
Wang, C.C. and Wang, H.Y. 2017. Assessment of the compressive strength of recycled waste LCD glass concrete using the ultrasonic pulse velocity. Construction & Building Materials, 137: 345-353.

Vol. 18, No. 5 (Special Issue), 2019 • Nature Environment and Pollution Technology
1584

Environmental Monitoring and Management System Based on K-Means Algorithms
Hongzhi Zhou, Gang Yu and Linguo LiCollege of Information Engineering, Fuyang Normal University, Fuyang, China
ABSTRACT
In order to build a resource-saving and environment-friendly society, adjust the economic structure, change the mode of growth and improve the quality of people’s lives, it is proposed that advanced network video surveillance system technology should be integrated into the related fields of environmental protection, and the comprehensive management of polluting enterprises and ecological environment should be closely monitored and managed. The work content and process of environmental protection standard management are sorted out, the difficulties and problems to be solved in the management of environmental protection standards are summarized, and the data and technical support needed for the informatization of environmental protection standards are discussed. The application technology of data mining is studied and combed, and K-Means algorithm is selected and improved to enable it to be applied in the management of environmental protection standards. The demonstration system of environmental standard information management is constructed to provide reference for the construction of environmental standard information management system. The results show that through in-depth study on the framework of environmental video surveillance system, the system design scheme is formed, and the project implementation and operation maintenance management mechanism of environmental video surveillance system is established, which provides an effective overall solution for system implementation, optimization, improvement and application promotion.
INTRODUCTION
With the rapid development of China’s economy and the continuous improvement of people’s living standards, the emission of pollutants has increased rapidly. Environmental pollution has become a major factor restricting the further development of China’s economy and society and the further improvement of people’s living and health level. The threat posed by many problems such as global climate change has made more and more people realize the importance of saving resources and protecting the environment. They have joined in various public welfare activities of environmental protec-tion. In just a few years, the “Earth Hour” activity, which has attracted worldwide attention, started from a limited scale and quickly swept the world at an amazing speed, becoming the world largest environmental protection action.
The main technical means of environmental protection is to use remote environmental monitoring system to monitor pollution sources or sewage discharge and pollution control equipment. There are two characteristics of remote environmental monitoring system: one is remote, which can greatly reduce the investment of human resources, and at the same time keep people away from the harsh environment such as high pollution and high noise; the other is information, which means quantitative and qualitative analysis of
real-time collected data, providing scientific decision support for environmental management and enhancing the ability of environmental protection law enforcement (Zhao et al. 2015). Environmental information is also more conducive to protecting the public’s right to know, supervise and participate in environmental protection, and mobilizing and giving full play to the public’s enthusiasm to participate in environmental protection public utilities.
PAST STUDIES
With the rapid development of the internet, the development environment of video surveillance system based on broadband internet is becoming more and more mature, and the development process is accelerating. The combination of environmental monitoring system and video monitoring system has been widely used. In 2015, a new information system was introduced which combines internet of things (IOT), cloud computing, geographic informatics (remote sensing, RS), geographic information system (GIS), global positioning system (GPS) and environmental monitoring and management electronic science (Yue et al. 2015). In 2016, a research proposed an intelligent indoor environment monitoring system (IDEMS) based on ZigBee wireless sensor network technology, which is used to store and process
Nat. Env. & Poll. Tech.Website: www.neptjournal.com
Received: 21-08-2019Accepted: 04-10-2019
Key Words:Environmental monitoringManagement systemK-Means algorithmVideo monitoring
2019pp. 1585-1591 Vol. 18
p-ISSN: 0972-6268 No. 5 (Special Issue)
Nature Environment and Pollution Technology An International Quarterly Scientific Journal
Original Research Paper
e-ISSN: 2395-3454
Open Access
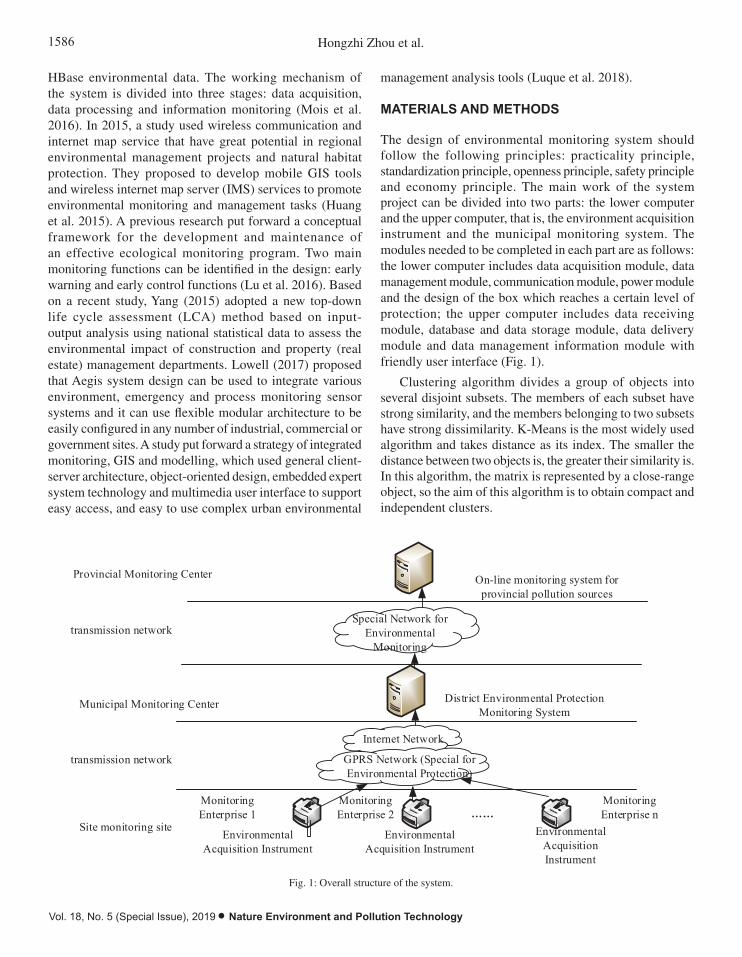
1586 Hongzhi Zhou et al.
Vol. 18, No. 5 (Special Issue), 2019 • Nature Environment and Pollution Technology
HBase environmental data. The working mechanism of the system is divided into three stages: data acquisition, data processing and information monitoring (Mois et al. 2016). In 2015, a study used wireless communication and internet map service that have great potential in regional environmental management projects and natural habitat protection. They proposed to develop mobile GIS tools and wireless internet map server (IMS) services to promote environmental monitoring and management tasks (Huang et al. 2015). A previous research put forward a conceptual framework for the development and maintenance of an effective ecological monitoring program. Two main monitoring functions can be identified in the design: early warning and early control functions (Lu et al. 2016). Based on a recent study, Yang (2015) adopted a new top-down life cycle assessment (LCA) method based on input-output analysis using national statistical data to assess the environmental impact of construction and property (real estate) management departments. Lowell (2017) proposed that Aegis system design can be used to integrate various environment, emergency and process monitoring sensor systems and it can use flexible modular architecture to be easily configured in any number of industrial, commercial or government sites. A study put forward a strategy of integrated monitoring, GIS and modelling, which used general client-server architecture, object-oriented design, embedded expert system technology and multimedia user interface to support easy access, and easy to use complex urban environmental
management analysis tools (Luque et al. 2018).
MATERIALS AND METHODS
The design of environmental monitoring system should follow the following principles: practicality principle, standardization principle, openness principle, safety principle and economy principle. The main work of the system project can be divided into two parts: the lower computer and the upper computer, that is, the environment acquisition instrument and the municipal monitoring system. The modules needed to be completed in each part are as follows: the lower computer includes data acquisition module, data management module, communication module, power module and the design of the box which reaches a certain level of protection; the upper computer includes data receiving module, database and data storage module, data delivery module and data management information module with friendly user interface (Fig. 1).
Clustering algorithm divides a group of objects into several disjoint subsets. The members of each subset have strong similarity, and the members belonging to two subsets have strong dissimilarity. K-Means is the most widely used algorithm and takes distance as its index. The smaller the distance between two objects is, the greater their similarity is. In this algorithm, the matrix is represented by a close-range object, so the aim of this algorithm is to obtain compact and independent clusters.
On-line monitoring system for provincial pollution sources
Special Network for Environmental
Monitoring
District Environmental Protection Monitoring System
Internet Network
GPRS Network (Special for Environmental Protection)
…… Environmental
Acquisition InstrumentEnvironmental
Acquisition InstrumentEnvironmental
Acquisition Instrument
Monitoring Enterprise 1
Monitoring Enterprise 2
Monitoring Enterprise n
transmission network
Provincial Monitoring Center
Municipal Monitoring Center
transmission network
Site monitoring site
Fig. 1: Overall structure of the system.
Clustering algorithm divides a group of objects into several disjoint subsets. The members of each subset have strong similarity, and the members belonging to two subsets have strong dissimilarity. K-Means is the most widely used algorithm and takes distance as its index. The smaller the distance between two objects is, the greater their similarity is. In this algorithm, the matrix is represented by a close-range object, so the aim of this algorithm is to obtain compact and independent clusters.
Fuzzy c-means (FCM), also known as fuzzy K-Means, is one of the most widely used fuzzy clustering methods. The basic idea of FCM algorithm is to introduce a fuzzy coefficient m based on HCM (hard c-means) algorithm and membership matrix of samples belonging to various types, and to establish the objective function.
2kn
N
1n
C
1k
mnk xuJ
…(1)
In Formula (1), m is a fuzzy index, generally valued between [1.5, 2.5]; U={µnk} is a membership matrix, and µnk denotes the membership degree of the nth point belonging to the K clustering centre, which is usually expressed by distance.
1m/2C
1jjknknk d/d/1
…(2)
In Formula (2), dnk=||xn-µk|| is the distance from object xn to cluster centre µk. And 0<µk<1, the constraint is:
1C
1knk
. The formula for calculating cluster centres is as follows:
nm
nk
n nm
nkk
x …(3)
RESULTS AND DISCUSSION
Design of acquisition module of environmental acquisition instrument: The system integration method is adopted in the design and implementation of the acquisition instrument, which is mainly divided into four parts: acquisition module, display module, communication module and power module. Individualized customization of the function and parameters of each module can greatly save the development cycle and ensure the normal operation of the acquisition instrument in high temperature and high dust industrial environment.
The working process of the acquisition instrument is as follows: using PLC to collect the switching status of production equipment and control equipment for storage and processing; transmitting equipment status information to the host computer or receiving query instructions from the host computer through GPRS
Fig. 1: Overall structure of the system.
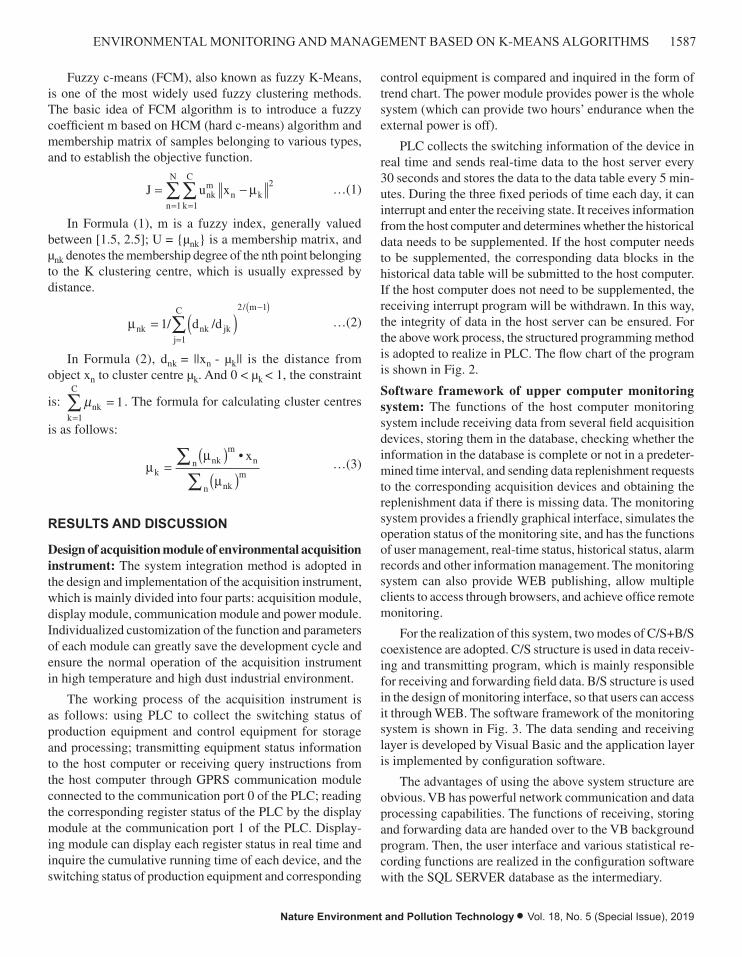
1587ENVIRONMENTAL MONITORING AND MANAGEMENT BASED ON K-MEANS ALGORITHMS
Nature Environment and Pollution Technology • Vol. 18, No. 5 (Special Issue), 2019
Fuzzy c-means (FCM), also known as fuzzy K-Means, is one of the most widely used fuzzy clustering methods. The basic idea of FCM algorithm is to introduce a fuzzy coefficient m based on HCM (hard c-means) algorithm and membership matrix of samples belonging to various types, and to establish the objective function.
J u xnkm
k
C
n
N
n k= -==ÂÂ
11
2m …(1)
In Formula (1), m is a fuzzy index, generally valued between [1.5, 2.5]; U = {µnk} is a membership matrix, and µnk denotes the membership degree of the nth point belonging to the K clustering centre, which is usually expressed by distance.
mnk nk jkj
C m
d d= ( )=
-( )Â1
1
2 1
/ //
…(2)
In Formula (2), dnk = ||xn - µk|| is the distance from object xn to cluster centre µk. And 0 < µk < 1, the constraint
is: mnkk
C
=Â =
1
1. The formula for calculating cluster centres
is as follows:
mm
mk
nkm
nn
nkm
n
x=
( )( )
ÂÂ
• …(3)
RESULTS AND DISCUSSION
Design of acquisition module of environmental acquisition instrument: The system integration method is adopted in the design and implementation of the acquisition instrument, which is mainly divided into four parts: acquisition module, display module, communication module and power module. Individualized customization of the function and parameters of each module can greatly save the development cycle and ensure the normal operation of the acquisition instrument in high temperature and high dust industrial environment.
The working process of the acquisition instrument is as follows: using PLC to collect the switching status of production equipment and control equipment for storage and processing; transmitting equipment status information to the host computer or receiving query instructions from the host computer through GPRS communication module connected to the communication port 0 of the PLC; reading the corresponding register status of the PLC by the display module at the communication port 1 of the PLC. Display-ing module can display each register status in real time and inquire the cumulative running time of each device, and the switching status of production equipment and corresponding
control equipment is compared and inquired in the form of trend chart. The power module provides power is the whole system (which can provide two hours’ endurance when the external power is off).
PLC collects the switching information of the device in real time and sends real-time data to the host server every 30 seconds and stores the data to the data table every 5 min-utes. During the three fixed periods of time each day, it can interrupt and enter the receiving state. It receives information from the host computer and determines whether the historical data needs to be supplemented. If the host computer needs to be supplemented, the corresponding data blocks in the historical data table will be submitted to the host computer. If the host computer does not need to be supplemented, the receiving interrupt program will be withdrawn. In this way, the integrity of data in the host server can be ensured. For the above work process, the structured programming method is adopted to realize in PLC. The flow chart of the program is shown in Fig. 2.
Software framework of upper computer monitoring system: The functions of the host computer monitoring system include receiving data from several field acquisition devices, storing them in the database, checking whether the information in the database is complete or not in a predeter-mined time interval, and sending data replenishment requests to the corresponding acquisition devices and obtaining the replenishment data if there is missing data. The monitoring system provides a friendly graphical interface, simulates the operation status of the monitoring site, and has the functions of user management, real-time status, historical status, alarm records and other information management. The monitoring system can also provide WEB publishing, allow multiple clients to access through browsers, and achieve office remote monitoring.
For the realization of this system, two modes of C/S+B/S coexistence are adopted. C/S structure is used in data receiv-ing and transmitting program, which is mainly responsible for receiving and forwarding field data. B/S structure is used in the design of monitoring interface, so that users can access it through WEB. The software framework of the monitoring system is shown in Fig. 3. The data sending and receiving layer is developed by Visual Basic and the application layer is implemented by configuration software.
The advantages of using the above system structure are obvious. VB has powerful network communication and data processing capabilities. The functions of receiving, storing and forwarding data are handed over to the VB background program. Then, the user interface and various statistical re-cording functions are realized in the configuration software with the SQL SERVER database as the intermediary.
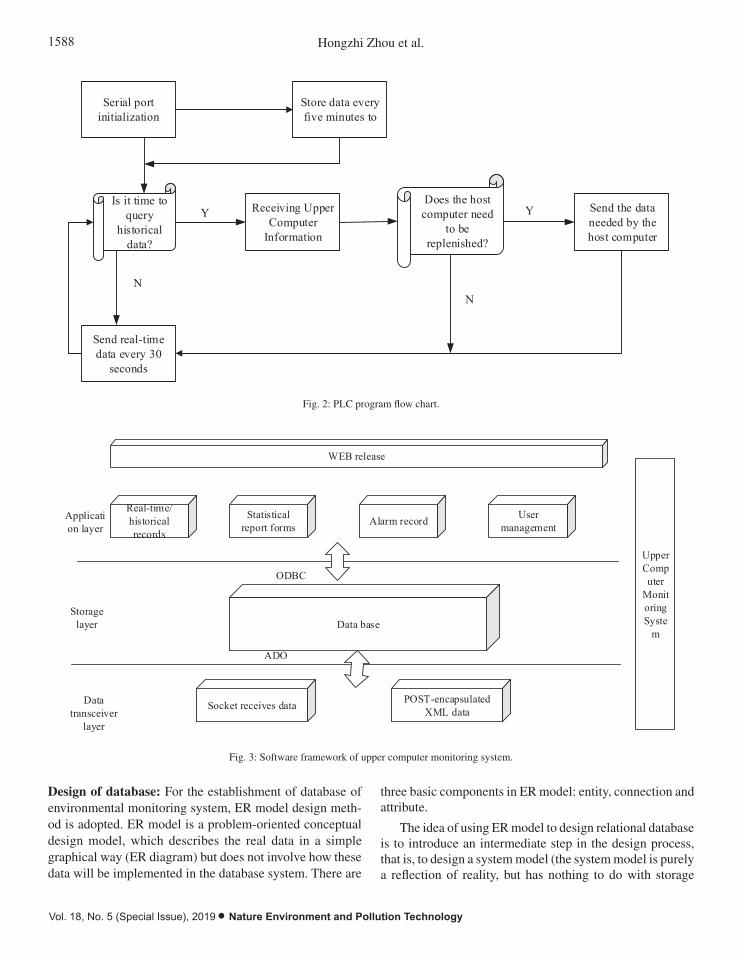
1588 Hongzhi Zhou et al.
Vol. 18, No. 5 (Special Issue), 2019 • Nature Environment and Pollution Technology
communication module connected to the communication port 0 of the PLC; reading the corresponding register status of the PLC by the display module at the communication port 1 of the PLC. Displaying module can display each register status in real time and inquire the cumulative running time of each device, and the switching status of production equipment and corresponding control equipment is compared and inquired in the form of trend chart. The power module provides power is the whole system (which can provide two hours' endurance when the external power is off).
PLC collects the switching information of the device in real time and sends real-time data to the host server every 30 seconds and stores the data to the data table every 5 minutes. During the three fixed periods of time each day, it can interrupt and enter the receiving state. It receives information from the host computer and determines whether the historical data needs to be supplemented. If the host computer needs to be supplemented, the corresponding data blocks in the historical data table will be submitted to the host computer. If the host computer does not need to be supplemented, the receiving interrupt program will be withdrawn. In this way, the integrity of data in the host server can be ensured. For the above work process, the structured programming method is adopted to realize in PLC. The flow chart of the program is shown in Fig. 2.
Serial port initialization
Store data every five minutes to
Is it time to query
historical data?
Receiving Upper Computer
Information
Does the host computer need
to be replenished?
Send the data needed by the host computer
Send real-time data every 30
seconds
Y Y
NN
Fig. 2: PLC program flow chart.
Software framework of upper computer monitoring system: The functions of the host computer monitoring system include receiving data from several field acquisition devices, storing them in the database, checking whether the information in the database is complete or not in a predetermined time interval, and sending data replenishment requests to the corresponding acquisition devices and obtaining the replenishment data if there is missing data. The monitoring system provides a friendly graphical interface, simulates the operation status of the monitoring site, and has the functions of user management, real-time status, historical status, alarm records and other information management. The monitoring system can also provide WEB publishing, allow multiple clients to access through browsers, and achieve office remote monitoring.
For the realization of this system, two modes of C/S+B/S coexistence are adopted. C/S structure is used in data receiving and transmitting program, which is mainly responsible for receiving and forwarding field data. B/S structure is used in the design of monitoring interface, so that users can access it through WEB. The software framework of the monitoring system is shown in Fig. 3. The data sending and receiving layer is developed by Visual Basic and the application layer is implemented by configuration software.
Fig. 2: PLC program flow chart.
WEB release
Real-time/historical records
Statistical report forms Alarm record User
management
Data base
ODBC
Socket receives data POST-encapsulated XML data
ADO
Application layer
Storage layer
Data transceiver
layer
Upper Computer
Monitoring Syste
m
Fig. 3: Software framework of upper computer monitoring system.
The advantages of using the above system structure are obvious. VB has powerful network communication and data processing capabilities. The functions of receiving, storing and forwarding data are handed over to the VB background program. Then, the user interface and various statistical recording functions are realized in the configuration software with the SQL SERVER database as the intermediary.
Design of database: For the establishment of database of environmental monitoring system, ER model design method is adopted. ER model is a problem-oriented conceptual design model, which describes the real data in a simple graphical way (ER diagram) but does not involve how these data will be implemented in the database system. There are three basic components in ER model: entity, connection and attribute.
The idea of using ER model to design relational database is to introduce an intermediate step in the design process, that is, to design a system model (the system model is purely a reflection of reality, but has nothing to do with storage structure, access mode, etc.), and then convert the system model into a data model on a database management system, which is a conceptual data model. There is a connection between the monitoring site and the monitoring enterprise, which belongs to one-to-many relationship; a connection between the enterprise and the acquisition instrument is "assembled", which belongs to one-to-many connection; a connection between the acquisition instrument and the equipment is "monitored", which belongs to one-to-many connection; and there is a connection between the equipment and the "real-time data" and the "historical data", respectively. According to this, the ER diagram of the database can be drawn as shown in Fig. 4:
Monitoring enterprise
Enterprise code
Enterprise name
Enterprise address
Contain
Monitoring station
Site code
Site name
Site password
Site type
Area code
assembling Acquisition instrument
Instrument code
SIM card number
Monitor
equipment
collection
Instrument code
Channel number
Device name
State value
Time information
historical data
Statistics
real-time data
Time information
N
M
M
NN
I
NI
N
I
Fig. 4: ER diagram of database.
According to the ER chart of monitoring system data and the attribute of an example, the relational data structure can be derived. The established data tables include site information table, enterprise information table, instrument information table, equipment information table, real-time data table and historical data table. For this
Fig. 3: Software framework of upper computer monitoring system.
Design of database: For the establishment of database of environmental monitoring system, ER model design meth-od is adopted. ER model is a problem-oriented conceptual design model, which describes the real data in a simple graphical way (ER diagram) but does not involve how these data will be implemented in the database system. There are
three basic components in ER model: entity, connection and attribute.
The idea of using ER model to design relational database is to introduce an intermediate step in the design process, that is, to design a system model (the system model is purely a reflection of reality, but has nothing to do with storage
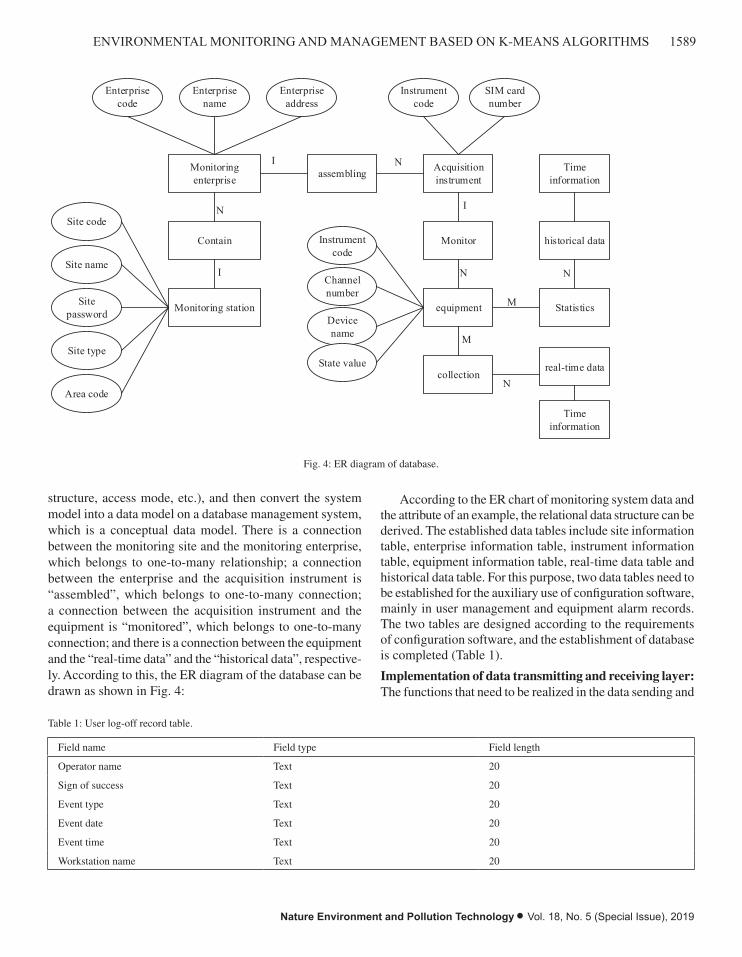
1589ENVIRONMENTAL MONITORING AND MANAGEMENT BASED ON K-MEANS ALGORITHMS
Nature Environment and Pollution Technology • Vol. 18, No. 5 (Special Issue), 2019
WEB release
Real-time/historical records
Statistical report forms Alarm record User
management
Data base
ODBC
Socket receives data POST-encapsulated XML data
ADO
Application layer
Storage layer
Data transceiver
layer
Upper Computer
Monitoring Syste
m
Fig. 3: Software framework of upper computer monitoring system.
The advantages of using the above system structure are obvious. VB has powerful network communication and data processing capabilities. The functions of receiving, storing and forwarding data are handed over to the VB background program. Then, the user interface and various statistical recording functions are realized in the configuration software with the SQL SERVER database as the intermediary.
Design of database: For the establishment of database of environmental monitoring system, ER model design method is adopted. ER model is a problem-oriented conceptual design model, which describes the real data in a simple graphical way (ER diagram) but does not involve how these data will be implemented in the database system. There are three basic components in ER model: entity, connection and attribute.
The idea of using ER model to design relational database is to introduce an intermediate step in the design process, that is, to design a system model (the system model is purely a reflection of reality, but has nothing to do with storage structure, access mode, etc.), and then convert the system model into a data model on a database management system, which is a conceptual data model. There is a connection between the monitoring site and the monitoring enterprise, which belongs to one-to-many relationship; a connection between the enterprise and the acquisition instrument is "assembled", which belongs to one-to-many connection; a connection between the acquisition instrument and the equipment is "monitored", which belongs to one-to-many connection; and there is a connection between the equipment and the "real-time data" and the "historical data", respectively. According to this, the ER diagram of the database can be drawn as shown in Fig. 4:
Monitoring enterprise
Enterprise code
Enterprise name
Enterprise address
Contain
Monitoring station
Site code
Site name
Site password
Site type
Area code
assembling Acquisition instrument
Instrument code
SIM card number
Monitor
equipment
collection
Instrument code
Channel number
Device name
State value
Time information
historical data
Statistics
real-time data
Time information
N
M
M
NN
I
NI
N
I
Fig. 4: ER diagram of database.
According to the ER chart of monitoring system data and the attribute of an example, the relational data structure can be derived. The established data tables include site information table, enterprise information table, instrument information table, equipment information table, real-time data table and historical data table. For this
Fig. 4: ER diagram of database.
structure, access mode, etc.), and then convert the system model into a data model on a database management system, which is a conceptual data model. There is a connection between the monitoring site and the monitoring enterprise, which belongs to one-to-many relationship; a connection between the enterprise and the acquisition instrument is “assembled”, which belongs to one-to-many connection; a connection between the acquisition instrument and the equipment is “monitored”, which belongs to one-to-many connection; and there is a connection between the equipment and the “real-time data” and the “historical data”, respective-ly. According to this, the ER diagram of the database can be drawn as shown in Fig. 4:
According to the ER chart of monitoring system data and the attribute of an example, the relational data structure can be derived. The established data tables include site information table, enterprise information table, instrument information table, equipment information table, real-time data table and historical data table. For this purpose, two data tables need to be established for the auxiliary use of configuration software, mainly in user management and equipment alarm records. The two tables are designed according to the requirements of configuration software, and the establishment of database is completed (Table 1).
Implementation of data transmitting and receiving layer: The functions that need to be realized in the data sending and
Table 1: User log-off record table.
Field name Field type Field length
Operator name Text 20
Sign of success Text 20
Event type Text 20
Event date Text 20
Event time Text 20
Workstation name Text 20

1590 Hongzhi Zhou et al.
Vol. 18, No. 5 (Special Issue), 2019 • Nature Environment and Pollution Technology
receiving layer are: receiving data from several field acquisi-tion devices, storing them in the database, checking whether the information in the database is complete in a predeter-mined time interval, and sending data replenishment requests to the corresponding acquisition devices and obtaining the replenishment data if there is missing data.
The data format reported by field acquisition instrument is hexadecimal byte array, which has three formats: first, hexadecimal array with 12 members; second, hexadecimal array with 2 members, which is the complementary query instruction; third, hexadecimal array with 199 members, which is the supplementary data reported. The specific process of data reception is as follows: receiving real-time data from field acquisition instrument every 30s; generating a data every 5 minutes from historical data table and taking the real-time state as the historical state within 5 minutes. If the real-time state at that time is empty, the state of historical data table is also set to empty, but its position is still reserved and waiting for replenishment.
ADO (ActiveX Data Object) is an important part of Microsoft’s Universal Data Access development strategy. It will replace DAO (Data Access Object) and RDO (Remote Data Object) technologies. ADO achieves access to differ-ent types of data sources through OLEDB. OLEDB is an underlying programming interface that supports relational or non-relational data sources, such as various types of da-tabases, spreadsheets, e-mail and text files. Fig. 5 shows the model for accessing data through ADO.
In VB, there are two main ways to access database by ADO, one is non-programmable access mode, which uses ADOData control mode to access data in the database by binding controls; the other is ADO object model program-ming access mode, through defining objects and writing code to achieve access to data. When using ADOData control to connect database, it does not need to create connection objects and record set objects. It can simplify programming by directly setting related attributes. However, it has some limitations in function. It is difficult to change the connection of database when the program is running, and the efficiency of accessing large database is relatively low. If the database is connected by object model programming, the operation of the database is very flexible, and the efficiency will be greatly improved. There are many ways to use the database data in the data receiving and receiving program, so ADO object model programming is used in this program to access the data.
CONCLUSION
According to the national total pollutant emission reduction and the requirement of speeding up the capacity building of automatic environmental monitoring system, combined with the reality of current environmental management, based on the principle of “high starting point planning, high standard construction and high efficiency operation”, an advanced environmental video monitoring system is gradually established. The system integrates the development of
purpose, two data tables need to be established for the auxiliary use of configuration software, mainly in user management and equipment alarm records. The two tables are designed according to the requirements of configuration software, and the establishment of database is completed (Table 1).
Table 1: User log-off record table.
Field name Field type Field length Operator name Text 20 Sign of success Text 20
Event type Text 20 Event date Text 20 Event time Text 20
Workstation name Text 20
Implementation of data transmitting and receiving layer: The functions that need to be realized in the data sending and receiving layer are: receiving data from several field acquisition devices, storing them in the database, checking whether the information in the database is complete in a predetermined time interval, and sending data replenishment requests to the corresponding acquisition devices and obtaining the replenishment data if there is missing data.
The data format reported by field acquisition instrument is hexadecimal byte array, which has three formats: first, hexadecimal array with 12 members; second, hexadecimal array with 2 members, which is the complementary query instruction; third, hexadecimal array with 199 members, which is the supplementary data reported. The specific process of data reception is as follows: receiving real-time data from field acquisition instrument every 30s; generating a data every 5 minutes from historical data table and taking the real-time state as the historical state within 5 minutes. If the real-time state at that time is empty, the state of historical data table is also set to empty, but its position is still reserved and waiting for replenishment.
ADO (ActiveX Data Object) is an important part of Microsoft's Universal Data Access development strategy. It will replace DAO (Data Access Object) and RDO (Remote Data Object) technologies. ADO achieves access to different types of data sources through OLEDB. OLEDB is an underlying programming interface that supports relational or non-relational data sources, such as various types of databases, spreadsheets, e-mail and text files. Fig. 5 shows the model for accessing data through ADO.
ADO Data Control
ADO
OLE DB
file systemOracleMicrosoft SQL Server ……
Data consumers
data provider
Fig. 5: ADO access data model.
In VB, there are two main ways to access database by ADO, one is non-programmable access mode, which uses ADOData control mode to access data in the database by binding controls; the other is ADO object model programming access mode, through defining objects and writing code to achieve access to data. When using ADOData control to connect database, it does not need to create connection objects and record set objects. It can simplify programming by directly setting related attributes. However, it has some limitations in function. It is difficult to change the connection of database when the program is running, and the efficiency of accessing large database is relatively low. If the database is connected by object model programming, the operation of the database is very flexible, and the efficiency will be greatly improved. There are many ways to use the database data in the
Fig. 5: ADO access data model.

1591ENVIRONMENTAL MONITORING AND MANAGEMENT BASED ON K-MEANS ALGORITHMS
Nature Environment and Pollution Technology • Vol. 18, No. 5 (Special Issue), 2019
communication technology and digital video monitoring technology to make the decentralized and large-scale remote video surveillance system applied to environmental video surveillance system become a reality. The video surveillance information management system is a network, digital and intelligent image management system, which uses advanced information technology and technology as a means to realize the transformation from “artificial random monitoring” with human as the subject to “remote real-time monitoring” with science and technology as the subject. The system is an important part of the province’s environmental automatic monitoring and management system supported by science and technology. As an important means of achieving harmonious and modern urban management, it has become the basic guarantee of creating a “healthy and harmonious” society.
Although this system can meet the project requirements of Environmental Protection Bureau, there are still many areas to be improved to make it become a system with higher application value, such as optimizing the database design. Because of the continuous operation of the moni-toring system, a large amount of data has been accumulated in the database, which may cause greater access pressure
to the database server. It can be considered to optimize the design of database by using triggers of relational database and non-standardization technology to ensure the efficient operation of the whole system.
REFERENCES
Huang, Y., Cheng, W. and Tang, C. 2015. Study of multi-agent-based coal mine environmental monitoring system. Ecol. Indic., 51: 79-86.
Lowell, K.A. 2017. Socio-environmental monitoring system for a UNESCO biosphere reserve. Environ. Monit. Assess., 189(12): 601.
Lu, Y., Macias, D. and Dean, Z.S. 2016. A UAV-mounted whole cell bi-osensor system for environmental monitoring applications. IEEE T. Nanobiosci., 14(8): 811-817.
Luque, A., Gómezbellido, J. and Carrasco, A. 2018. Optimal representation of anuran call spectrum in environmental monitoring systems using wireless sensor networks. Sensors, 18(6): 1803.
Mois, G, Sanislav, T. and Folea, S.C. 2016. A cyber-physical system for environmental monitoring. IEEE T. Instrum. Meas., 65(6): 1-9.
Yang, X., Zhou, Q. and Han, G. 2015. Energy-efficient aquaculture environ-mental monitoring system based on ZigBee. Transactions of the Chinese Society of Agricultural Engineering, 31(17): 183-190.
Yue., P., Zhang, M. and Tan, Z. 2015. A geoprocessing workflow system for environmental monitoring and integrated modelling. Environ. Modell. Softw., 69(C): 128-140.
Zhao, Y., Shepherd, T.A. and Li, H. 2015. Environmental assessment of three egg production systems-Part I: Monitoring system and indoor air quality. Poult. Sci., 94(3): 518-533.

Vol. 18, No. 5 (Special Issue), 2019 • Nature Environment and Pollution Technology
1592

Sewage Discharge Monitoring and Management System Based on K-Means Algorithms
Lefei Xuan*, Xiaojing Tu**, Mengning Niu* and Muhammad Aqeel Ashraf****Hangzhou Vocational & Technical College, Hangzhou Zhejiang, 310018, China**Hang Zhou Polytechnic, Hangzhou Zhejiang, 311402, China*** School of Environmental Studies, China University of Geosciences 430074 Wuhan, China
ABSTRACT
In order to effectively monitor and manage the discharge behaviour of enterprises to avoid water pollution and improve environmental quality, it is proposed to develop and design a sewage discharge monitoring and management system which meets the practical needs. The sewage discharge data management module, monitoring and management module, early warning management module, data statistical analysis module and system query function module are designed and developed. In addition, the development and design process of the functional module of the system is described by means of example diagram and time sequence diagram. On the basis of system function design, language and database technology are applied to realize the functional modules of the system. The function test and performance test of the system are discussed and analysed, and a sewage discharge monitoring and management system that meets the actual needs of the sewage discharge monitoring department is developed. The results show that the sewage online monitoring and management system has the functions of real-time reception, treatment, analysis and early warning. Therefore, the system can help to make up for the loopholes in the sewage discharge monitoring and management of enterprises, effectively standardize the sewage discharge behaviour of enterprises, and then improve the environmental pollution caused by excessive sewage discharge.
INTRODUCTION
The total amount of water resources in China is relatively abundant, but due to the influence of climate conditions and vast land area, there are serious regional and temporal differences in precipitation in China, which also makes the precipitation in the vast northern and inland areas less. Moreover, the overall precipitation in China is mostly con-centrated in summer, it causes serious water shortage in many areas of China. Therefore, it is of great practical significance to strengthen the monitoring and management of sewage discharge and control the pollution of water resources. It is also an important measure to alleviate the shortage of water resources in China.
Judging from the current domestic sewage discharge situation, although China has more detailed standards for enterprise sewage discharge, the phenomenon of enterprise sewage stolen discharge is very serious. The main reason is that the supervision department lacks effective monitoring of enterprise sewage discharge, which provides an opportunity for enterprise stolen discharge. In the view of the sewage discharge supervision department, it is difficult to collect discharge data for enterprises because of the lack of complete information management tools. At the same time, due to the
large number of enterprises and the complex types, it lacks effective monitoring and management of enterprise sewage discharge information, which makes the sewage discharge monitoring and management work have larger loopholes. In view of this research background, the design and imple-mentation of sewage discharge monitoring and management system is studied. It is hoped that this study will improve the environmental pollution caused by serious sewage discharge and inadequate sewage discharge monitoring in enterprises, and effectively standardize the sewage discharge behaviour of enterprises. Implementing immediate punishment to en-terprises violating regulations can effectively manage sewage and protect the ecological environment.
EARLIER RESEARCH
In order to achieve sustainable economic development, many researchers at home and abroad are beginning to intensify the work of sewage discharge supervision and continue to develop and explore automated systems and supporting equipment with independent intellectual property rights. In 2015, a study designed the upper computer application program of sewage treatment system based on Visual Basic software (Ong et al.
Nat. Env. & Poll. Tech.Website: www.neptjournal.com
Received: 01-08-2019Accepted: 26-10-2019
Key Words:Sewage dischargeMonitoring managementSystem designManagement moduleK-means algorithm
2019pp. 1593-1599 Vol. 18
p-ISSN: 0972-6268 No. 5 (Special Issue)
Nature Environment and Pollution Technology An International Quarterly Scientific Journal
Original Research Paper
e-ISSN: 2395-3454
Open Access
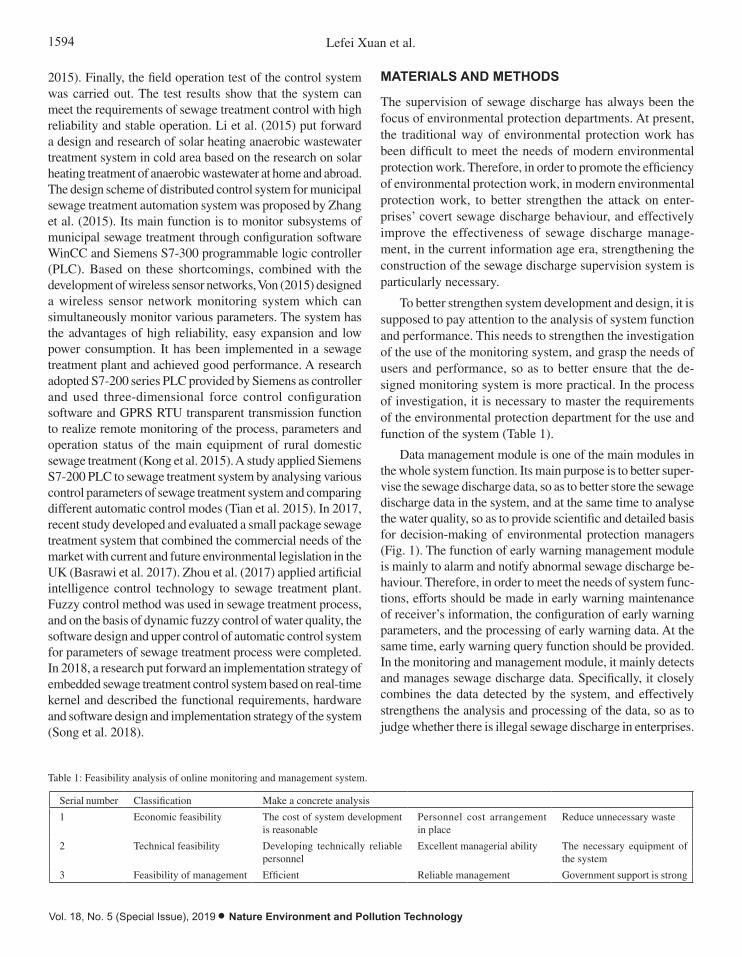
1594 Lefei Xuan et al.
Vol. 18, No. 5 (Special Issue), 2019 • Nature Environment and Pollution Technology
2015). Finally, the field operation test of the control system was carried out. The test results show that the system can meet the requirements of sewage treatment control with high reliability and stable operation. Li et al. (2015) put forward a design and research of solar heating anaerobic wastewater treatment system in cold area based on the research on solar heating treatment of anaerobic wastewater at home and abroad. The design scheme of distributed control system for municipal sewage treatment automation system was proposed by Zhang et al. (2015). Its main function is to monitor subsystems of municipal sewage treatment through configuration software WinCC and Siemens S7-300 programmable logic controller (PLC). Based on these shortcomings, combined with the development of wireless sensor networks, Von (2015) designed a wireless sensor network monitoring system which can simultaneously monitor various parameters. The system has the advantages of high reliability, easy expansion and low power consumption. It has been implemented in a sewage treatment plant and achieved good performance. A research adopted S7-200 series PLC provided by Siemens as controller and used three-dimensional force control configuration software and GPRS RTU transparent transmission function to realize remote monitoring of the process, parameters and operation status of the main equipment of rural domestic sewage treatment (Kong et al. 2015). A study applied Siemens S7-200 PLC to sewage treatment system by analysing various control parameters of sewage treatment system and comparing different automatic control modes (Tian et al. 2015). In 2017, recent study developed and evaluated a small package sewage treatment system that combined the commercial needs of the market with current and future environmental legislation in the UK (Basrawi et al. 2017). Zhou et al. (2017) applied artificial intelligence control technology to sewage treatment plant. Fuzzy control method was used in sewage treatment process, and on the basis of dynamic fuzzy control of water quality, the software design and upper control of automatic control system for parameters of sewage treatment process were completed. In 2018, a research put forward an implementation strategy of embedded sewage treatment control system based on real-time kernel and described the functional requirements, hardware and software design and implementation strategy of the system (Song et al. 2018).
MATERIALS AND METHODS
The supervision of sewage discharge has always been the focus of environmental protection departments. At present, the traditional way of environmental protection work has been difficult to meet the needs of modern environmental protection work. Therefore, in order to promote the efficiency of environmental protection work, in modern environmental protection work, to better strengthen the attack on enter-prises’ covert sewage discharge behaviour, and effectively improve the effectiveness of sewage discharge manage-ment, in the current information age era, strengthening the construction of the sewage discharge supervision system is particularly necessary.
To better strengthen system development and design, it is supposed to pay attention to the analysis of system function and performance. This needs to strengthen the investigation of the use of the monitoring system, and grasp the needs of users and performance, so as to better ensure that the de-signed monitoring system is more practical. In the process of investigation, it is necessary to master the requirements of the environmental protection department for the use and function of the system (Table 1).
Data management module is one of the main modules in the whole system function. Its main purpose is to better super-vise the sewage discharge data, so as to better store the sewage discharge data in the system, and at the same time to analyse the water quality, so as to provide scientific and detailed basis for decision-making of environmental protection managers (Fig. 1). The function of early warning management module is mainly to alarm and notify abnormal sewage discharge be-haviour. Therefore, in order to meet the needs of system func-tions, efforts should be made in early warning maintenance of receiver’s information, the configuration of early warning parameters, and the processing of early warning data. At the same time, early warning query function should be provided. In the monitoring and management module, it mainly detects and manages sewage discharge data. Specifically, it closely combines the data detected by the system, and effectively strengthens the analysis and processing of the data, so as to judge whether there is illegal sewage discharge in enterprises.
Table 1: Feasibility analysis of online monitoring and management system.
Serial number Classification Make a concrete analysis
1 Economic feasibility The cost of system development is reasonable
Personnel cost arrangement in place
Reduce unnecessary waste
2 Technical feasibility Developing technically reliable personnel
Excellent managerial ability The necessary equipment of the system
3 Feasibility of management Efficient Reliable management Government support is strong
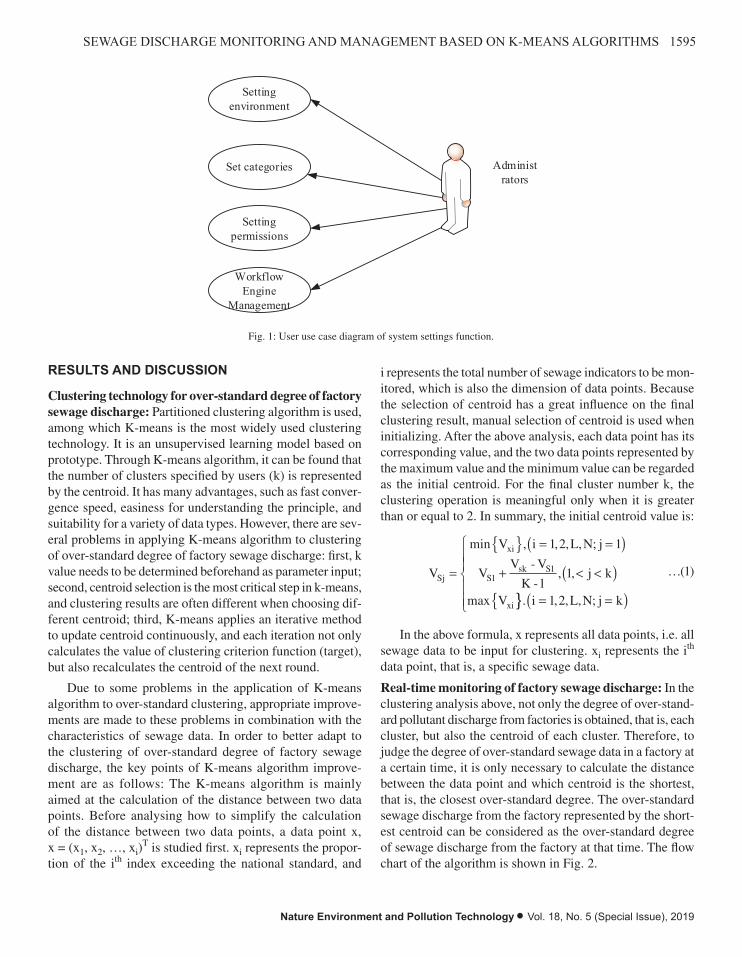
1595SEWAGE DISCHARGE MONITORING AND MANAGEMENT BASED ON K-MEANS ALGORITHMS
Nature Environment and Pollution Technology • Vol. 18, No. 5 (Special Issue), 2019
grasp the needs of users and performance, so as to better ensure that the designed monitoring system is more practical. In the process of investigation, it is necessary to master the requirements of the environmental protection department for the use and function of the system (Table 1).
Table 1: Feasibility analysis of online monitoring and management system.
Serial number Classification Make a concrete analysis 1 Economic
feasibility The cost of system
development is reasonable
Personnel cost arrangement in
place
Reduce unnecessary waste
2 Technical feasibility
Developing technically reliable personnel
Excellent managerial ability
The necessary equipment of the
system 3 Feasibility of
management Efficient Reliable
management Government
support is strong
Data management module is one of the main modules in the whole system function. Its main purpose is to better supervise the sewage discharge data, so as to better store the sewage discharge data in the system, and at the same time to analyse the water quality, so as to provide scientific and detailed basis for decision-making of environmental protection managers (Fig. 1). The function of early warning management module is mainly to alarm and notify abnormal sewage discharge behaviour. Therefore, in order to meet the needs of system functions, efforts should be made in early warning maintenance of receiver's information, the configuration of early warning parameters, and the processing of early warning data. At the same time, early warning query function should be provided. In the monitoring and management module, it mainly detects and manages sewage discharge data. Specifically, it closely combines the data detected by the system, and effectively strengthens the analysis and processing of the data, so as to judge whether there is illegal sewage discharge in enterprises.
Setting environment
Set categories
Setting permissions
Workflow Engine
Management
Administrators
Fig. 1: User use case diagram of system settings function.
RESULTS AND DISCUSSION
Clustering technology for over-standard degree of factory sewage discharge: Partitioned clustering algorithm is used, among which K-means is the most widely used clustering technology. It is an unsupervised learning model based on prototype. Through K-means algorithm, it can be found that the number of clusters specified by users (k) is represented by the centroid. It has many advantages, such as fast convergence speed, easiness for understanding the principle, and suitability for a variety of data types. However, there are several problems in applying K-means algorithm to clustering of over-standard degree of factory sewage discharge: first, k value needs to be determined beforehand as parameter input; second, centroid selection is the most critical step in k-means, and clustering results are often different when choosing different centroid; third, K-means applies an iterative method to update centroid continuously, and each iteration not only calculates the value of clustering criterion function (target), but also recalculates the centroid of the next round.
Due to some problems in the application of K-means algorithm to over-standard clustering, appropriate improvements are made to these problems in combination with the characteristics of sewage data. In order to better adapt to the clustering of over-standard degree of factory sewage discharge, the key points of K-means algorithm
Fig. 1: User use case diagram of system settings function.
RESULTS AND DISCUSSION
Clustering technology for over-standard degree of factory sewage discharge: Partitioned clustering algorithm is used, among which K-means is the most widely used clustering technology. It is an unsupervised learning model based on prototype. Through K-means algorithm, it can be found that the number of clusters specified by users (k) is represented by the centroid. It has many advantages, such as fast conver-gence speed, easiness for understanding the principle, and suitability for a variety of data types. However, there are sev-eral problems in applying K-means algorithm to clustering of over-standard degree of factory sewage discharge: first, k value needs to be determined beforehand as parameter input; second, centroid selection is the most critical step in k-means, and clustering results are often different when choosing dif-ferent centroid; third, K-means applies an iterative method to update centroid continuously, and each iteration not only calculates the value of clustering criterion function (target), but also recalculates the centroid of the next round.
Due to some problems in the application of K-means algorithm to over-standard clustering, appropriate improve-ments are made to these problems in combination with the characteristics of sewage data. In order to better adapt to the clustering of over-standard degree of factory sewage discharge, the key points of K-means algorithm improve-ment are as follows: The K-means algorithm is mainly aimed at the calculation of the distance between two data points. Before analysing how to simplify the calculation of the distance between two data points, a data point x, x = (x1, x2, …, xi)
T is studied first. xi represents the propor-tion of the ith index exceeding the national standard, and
i represents the total number of sewage indicators to be mon-itored, which is also the dimension of data points. Because the selection of centroid has a great influence on the final clustering result, manual selection of centroid is used when initializing. After the above analysis, each data point has its corresponding value, and the two data points represented by the maximum value and the minimum value can be regarded as the initial centroid. For the final cluster number k, the clustering operation is meaningful only when it is greater than or equal to 2. In summary, the initial centroid value is:
V
V i L N j
VV V
Kj k
V
Sj
xi
Ssk S
xi
=
{ } = =( )+ < <( )
{
min , , , , ;
-
-, ,
max
1 2 1
111
1
}} = =( )
Ï
ÌÔÔ
ÓÔÔ . , , , ;i L N j k1 2
…(1)
In the above formula, x represents all data points, i.e. all sewage data to be input for clustering. xi represents the ith data point, that is, a specific sewage data.
Real-time monitoring of factory sewage discharge: In the clustering analysis above, not only the degree of over-stand-ard pollutant discharge from factories is obtained, that is, each cluster, but also the centroid of each cluster. Therefore, to judge the degree of over-standard sewage data in a factory at a certain time, it is only necessary to calculate the distance between the data point and which centroid is the shortest, that is, the closest over-standard degree. The over-standard sewage discharge from the factory represented by the short-est centroid can be considered as the over-standard degree of sewage discharge from the factory at that time. The flow chart of the algorithm is shown in Fig. 2.
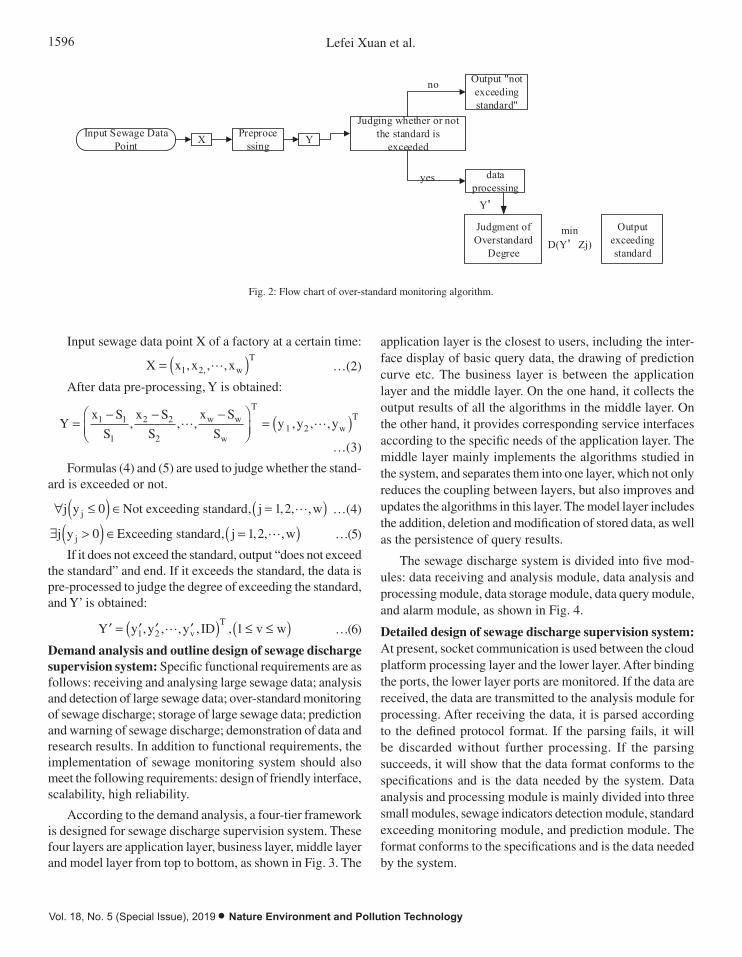
1596 Lefei Xuan et al.
Vol. 18, No. 5 (Special Issue), 2019 • Nature Environment and Pollution Technology
improvement are as follows: The K-means algorithm is mainly aimed at the calculation of the distance between two data points. Before analysing how to simplify the calculation of the distance between two data points, a data point x, x=(x1,x2,…,xi)T is studied first. xi represents the proportion of the ith index exceeding the national standard, and i represents the total number of sewage indicators to be monitored, which is also the dimension of data points. Because the selection of centroid has a great influence on the final clustering result, manual selection of centroid is used when initializing. After the above analysis, each data point has its corresponding value, and the two data points represented by the maximum value and the minimum value can be regarded as the initial centroid. For the final cluster number k, the clustering operation is meaningful only when it is greater than or equal to 2. In summary, the initial centroid value is:
xi
sk S1Sj S1
xi
min V , i = 1, 2 L , N; j = 1
V - VV = V + , 1, < j < k
K - 1max V . i = 1, 2, L , N; j = k
,
…(1)
In the above formula, x represents all data points, i.e. all sewage data to be input for clustering. xi represents the ith data point, that is, a specific sewage data.
Real-time monitoring of factory sewage discharge: In the clustering analysis above, not only the degree of over-standard pollutant discharge from factories is obtained, that is, each cluster, but also the centroid of each cluster. Therefore, to judge the degree of over-standard sewage data in a factory at a certain time, it is only necessary to calculate the distance between the data point and which centroid is the shortest, that is, the closest over-standard degree. The over-standard sewage discharge from the factory represented by the shortest centroid can be considered as the over-standard degree of sewage discharge from the factory at that time. The flow chart of the algorithm is shown in Fig. 2.
Input Sewage Data Point X YPreproce
ssing
Judging whether or not the standard is
exceeded
data processing
Output "not exceeding standard"
Judgment of Overstandard
Degree
Output exceeding standard
yes
no
Y’
min D(Y’Zj)
Fig. 2: Flow chart of over-standard monitoring algorithm.
Input sewage data point X of a factory at a certain time:
Tw,21 xxxX ,,, …(2)
After data pre-processing, Y is obtained:
Tw21
T
w
ww
2
22
1
11 yyyS
SxS
SxS
SxY ,,,,,,
…(3)
Formulas (4) and (5) are used to judge whether the standard is exceeded or not.
w21jstandard exceedingNot 0yj j ,,,, …(4)
w21jstandard Exceeding0yj j ,,,, …(5)
If it does not exceed the standard, output “does not exceed the standard” and end. If it exceeds the standard, the data is pre-processed to judge the degree of exceeding the standard, and Y' is obtained:
Fig. 2: Flow chart of over-standard monitoring algorithm.
Input sewage data point X of a factory at a certain time:
X x x xwT
= ( )1 2, , ,, � …(2)
After data pre-processing, Y is obtained:
Yx S
S
x S
S
x S
Sy y yw w
w
T
wT=
- - -ÊËÁ
ˆ¯̃
= ( )1 1
1
2 2
21 2, , , , , ,� �
…(3)
Formulas (4) and (5) are used to judge whether the stand-ard is exceeded or not.
" £( ) Œ =( )j y j wj 0 1 2Not exceeding standard, , , ,� …(4)
$ >( ) Œ =( )j y j wj 0 1 2Exceeding standard, , , ,� …(5)
If it does not exceed the standard, output “does not exceed the standard” and end. If it exceeds the standard, the data is pre-processed to judge the degree of exceeding the standard, and Y’ is obtained:
¢ = ¢ ¢ ¢( ) £ £( )Y y y y ID v wvT
1 2 1, , , , ,� …(6)
Demand analysis and outline design of sewage discharge supervision system: Specific functional requirements are as follows: receiving and analysing large sewage data; analysis and detection of large sewage data; over-standard monitoring of sewage discharge; storage of large sewage data; prediction and warning of sewage discharge; demonstration of data and research results. In addition to functional requirements, the implementation of sewage monitoring system should also meet the following requirements: design of friendly interface, scalability, high reliability.
According to the demand analysis, a four-tier framework is designed for sewage discharge supervision system. These four layers are application layer, business layer, middle layer and model layer from top to bottom, as shown in Fig. 3. The
application layer is the closest to users, including the inter-face display of basic query data, the drawing of prediction curve etc. The business layer is between the application layer and the middle layer. On the one hand, it collects the output results of all the algorithms in the middle layer. On the other hand, it provides corresponding service interfaces according to the specific needs of the application layer. The middle layer mainly implements the algorithms studied in the system, and separates them into one layer, which not only reduces the coupling between layers, but also improves and updates the algorithms in this layer. The model layer includes the addition, deletion and modification of stored data, as well as the persistence of query results.
The sewage discharge system is divided into five mod-ules: data receiving and analysis module, data analysis and processing module, data storage module, data query module, and alarm module, as shown in Fig. 4.
Detailed design of sewage discharge supervision system: At present, socket communication is used between the cloud platform processing layer and the lower layer. After binding the ports, the lower layer ports are monitored. If the data are received, the data are transmitted to the analysis module for processing. After receiving the data, it is parsed according to the defined protocol format. If the parsing fails, it will be discarded without further processing. If the parsing succeeds, it will show that the data format conforms to the specifications and is the data needed by the system. Data analysis and processing module is mainly divided into three small modules, sewage indicators detection module, standard exceeding monitoring module, and prediction module. The format conforms to the specifications and is the data needed by the system.
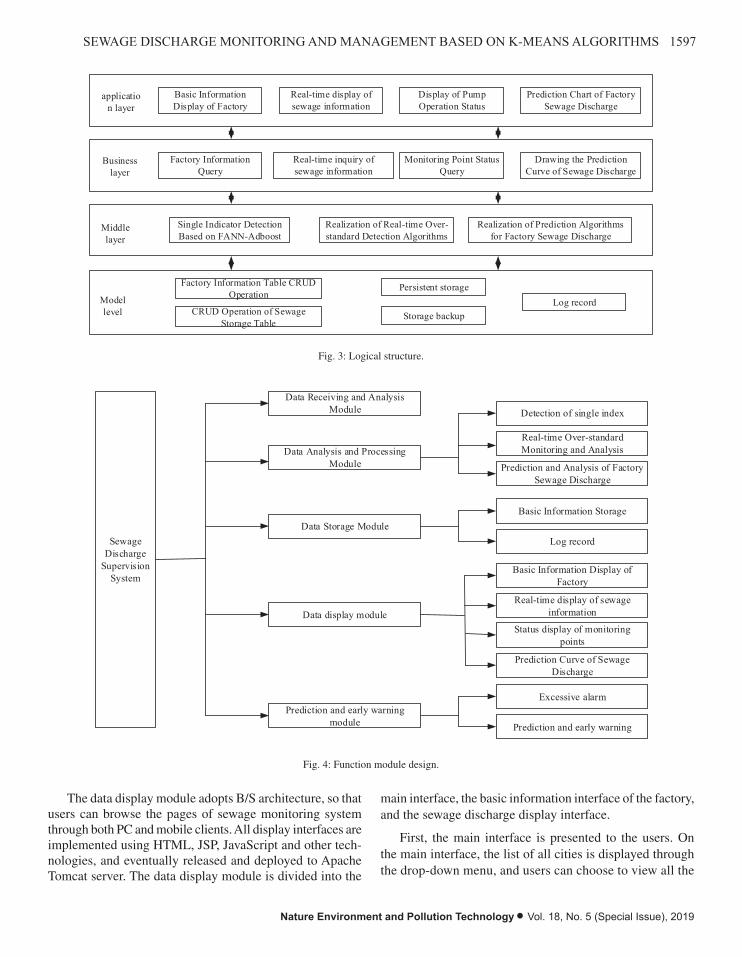
1597SEWAGE DISCHARGE MONITORING AND MANAGEMENT BASED ON K-MEANS ALGORITHMS
Nature Environment and Pollution Technology • Vol. 18, No. 5 (Special Issue), 2019
wv1ID'y'y'y'Y Tv21 ,,,,, …(6)
Demand analysis and outline design of sewage discharge supervision system: Specific functional requirements are as follows: receiving and analysing large sewage data; analysis and detection of large sewage data; over-standard monitoring of sewage discharge; storage of large sewage data; prediction and warning of sewage discharge; demonstration of data and research results. In addition to functional requirements, the implementation of sewage monitoring system should also meet the following requirements: design of friendly interface, scalability, high reliability.
According to the demand analysis, a four-tier framework is designed for sewage discharge supervision system. These four layers are application layer, business layer, middle layer and model layer from top to bottom, as shown in Fig. 3. The application layer is the closest to users, including the interface display of basic query data, the drawing of prediction curve etc. The business layer is between the application layer and the middle layer. On the one hand, it collects the output results of all the algorithms in the middle layer. On the other hand, it provides corresponding service interfaces according to the specific needs of the application layer. The middle layer mainly implements the algorithms studied in the system, and separates them into one layer, which not only reduces the coupling between layers, but also improves and updates the algorithms in this layer. The model layer includes the addition, deletion and modification of stored data, as well as the persistence of query results.
Basic Information Display of Factory
Real-time display of sewage information
Display of Pump Operation Status
Prediction Chart of Factory Sewage Discharge
Factory Information Query
Real-time inquiry of sewage information
Monitoring Point Status Query
Drawing the Prediction Curve of Sewage Discharge
Single Indicator Detection Based on FANN-Adboost
Realization of Real-time Over-standard Detection Algorithms
Realization of Prediction Algorithms for Factory Sewage Discharge
Factory Information Table CRUD Operation
CRUD Operation of Sewage Storage Table
Log recordStorage backup
Persistent storageModel level
Middle layer
Business layer
application layer
Fig. 3: Logical structure.
The sewage discharge system is divided into five modules: data receiving and analysis module, data analysis and processing module, data storage module, data query module, and alarm module, as shown in Fig. 4.
Fig. 3: Logical structure.
Sewage Discharge
Supervision System
Data Receiving and Analysis Module
Data Analysis and Processing Module
Data Storage Module
Data display module
Prediction and early warning module
Detection of single index
Real-time Over-standard Monitoring and Analysis
Prediction and Analysis of Factory Sewage Discharge
Basic Information Storage
Log record
Basic Information Display of Factory
Real-time display of sewage information
Status display of monitoring points
Prediction Curve of Sewage Discharge
Excessive alarm
Prediction and early warning Fig. 4: Function module design.
Detailed design of sewage discharge supervision system: At present, socket communication is used between the cloud platform processing layer and the lower layer. After binding the ports, the lower layer ports are monitored. If the data are received, the data are transmitted to the analysis module for processing. After receiving the data, it is parsed according to the defined protocol format. If the parsing fails, it will be discarded without further processing. If the parsing succeeds, it will show that the data format conforms to the specifications and is the data needed by the system. Data analysis and processing module is mainly divided into three small modules, sewage indicators detection module, standard exceeding monitoring module, and prediction module. The format conforms to the specifications and is the data needed by the system.
The data display module adopts B/S architecture, so that users can browse the pages of sewage monitoring system through both PC and mobile clients. All display interfaces are implemented using HTML, JSP, JavaScript and other technologies, and eventually released and deployed to Apache Tomcat server. The data display module is divided into the main interface, the basic information interface of the factory, and the sewage discharge display interface.
First, the main interface is presented to the users. On the main interface, the list of all cities is displayed through the drop-down menu, and users can choose to view all the regulatory factories in the city. When clicking on a factory, it jumps to the basic information interface of the factory. In the basic information interface of the factory, users can see the name of the factory, the city where the factory is located, the brief introduction to the factory, the number of monitoring points and the list of all monitoring points of the factory. All monitoring points arranged by the factory will be presented to users in the form of a list. If users need to check the operation status of a monitoring point, they can click on the monitoring point. After entering the sewage discharge display interface, users can not only see all the real-time wastewater indicators, including pH, water temperature, COD value, etc., but also see whether the wastewater at this monitoring point of the plant exceeds the standard at the moment. If it exceeds the standard, it will show the corresponding degree of exceeding the standard. Users can click on the "Prediction" button to view the sewage discharge curve of the plant in the past month and the trend in the next few days. The specific process is shown in Fig. 5.
Fig. 4: Function module design.
The data display module adopts B/S architecture, so that users can browse the pages of sewage monitoring system through both PC and mobile clients. All display interfaces are implemented using HTML, JSP, JavaScript and other tech-nologies, and eventually released and deployed to Apache Tomcat server. The data display module is divided into the
main interface, the basic information interface of the factory, and the sewage discharge display interface.
First, the main interface is presented to the users. On the main interface, the list of all cities is displayed through the drop-down menu, and users can choose to view all the

1598 Lefei Xuan et al.
Vol. 18, No. 5 (Special Issue), 2019 • Nature Environment and Pollution Technology
start
Enter the display interface of sewage discharge
Display real-time sewage information
Show the degree of exceeding the standard
Prediction button
click
Drawing the Prediction Curve
yes
Fig. 5: Demonstration process of sewage discharge.
CONCLUSION
The sewage discharge monitoring and management system is mainly studied. In the process of research, starting from the process of sewage monitoring and management of the management department, a sewage discharge integrated management system is developed and designed by using programming language and database technology, which meets the actual needs of sewage discharge monitoring and control. The complete process of sewage discharge data management, sewage discharge monitoring and early warning is controlled. And the sewage discharge data management module, monitoring management module, early warning management module, data statistical analysis module and system query function module are designed and developed.
In the actual application process, the realization and implementation of the system will effectively supervise the sewage discharge situation of sewage discharge enterprises, improve the drawbacks of the original monitoring system which cannot be monitored immediately, improve the speed of information flow, ensure the timely development of sewage monitoring work, and lay a solid foundation for the improvement of the supervision effect and environmental protection benefits of environmental protection departments. The system plays an important role in standardizing the behaviour of enterprise sewage discharge, improving environmental pollution caused by serious sewage discharge and inadequate monitoring of sewage discharge, and promoting the development of environmental protection in China.
REFERENCES
Basrawi, F., Ibrahim, T.K. and Habib, K. 2017. Techno-economic performance of biogas-fueled micro gas turbine cogeneration systems in sewage treatment plants: Effect of prime mover generation capacity. Energy, 124: 238-248.
Kong, X., Cui, B.J., Jin, D.C., Wu, S.H., Yang, B., Deng, Y., Zhuang, G.Q. and Zhuang, X.L.2015. Analysis of microbial community in the membrane bio-reactor (MBR) rural sewage treatment system. Environmental Science, 36(9): 3329-3338.
Li, J.R., Zhang, X.H. and Zhang, H.B. 2015. Assessing environmental and economical benefits of integrated sewage treatment systems. Chinese Journal of Applied Ecology, 26(8): 2482-2492.
Ong, C.B., Mohammad, A.W. and Abdullah, S.R.S. 2015. Pilot study for sewage wastewater reclamation and reuse using RO membrane: comparison of different pre-treatment systems. Desalin. Water Treat., 54(4-5): 900-907.
Tian, D.J., Lim, H.S. and Jin, C. 2015. Nitrogen and phosphorus removal in an anaerobic (UASB)-aerobic (ABF) sewage treatment system. Desalin. Water Treat., 53(10): 2856-2865.
Fig. 5: Demonstration process of sewage discharge.
regulatory factories in the city. When clicking on a factory, it jumps to the basic information interface of the factory. In the basic information interface of the factory, users can see the name of the factory, the city where the factory is located, the brief introduction to the factory, the number of monitoring points and the list of all monitoring points of the factory. All monitoring points arranged by the factory will be presented to users in the form of a list. If users need to check the operation status of a monitoring point, they can click on the monitoring point. After entering the sewage discharge display interface, users can not only see all the real-time wastewater indicators, including pH, water temperature, COD value, etc., but also see whether the wastewater at this monitoring point of the plant exceeds the standard at the moment. If it exceeds the standard, it will show the corresponding degree of exceeding the standard. Users can click on the “Prediction” button to view the sewage discharge curve of the plant in the past month and the trend in the next few days. The specific process is shown in Fig. 5.
CONCLUSION
The sewage discharge monitoring and management system is mainly studied. In the process of research, starting from the process of sewage monitoring and management of the management department, a sewage discharge integrated management system is developed and designed by using programming language and database technology, which meets the actual needs of sewage discharge monitoring and
control. The complete process of sewage discharge data man-agement, sewage discharge monitoring and early warning is controlled. And the sewage discharge data management module, monitoring management module, early warning management module, data statistical analysis module and system query function module are designed and developed.
In the actual application process, the realization and implementation of the system will effectively supervise the sewage discharge situation of sewage discharge enterprises, improve the drawbacks of the original monitoring system which cannot be monitored immediately, improve the speed of information flow, ensure the timely development of sewage monitoring work, and lay a solid foundation for the improve-ment of the supervision effect and environmental protection benefits of environmental protection departments. The sys-tem plays an important role in standardizing the behaviour of enterprise sewage discharge, improving environmental pollution caused by serious sewage discharge and inadequate monitoring of sewage discharge, and promoting the devel-opment of environmental protection in China.
REFERENCES
Basrawi, F., Ibrahim, T.K. and Habib, K. 2017. Techno-economic perfor-mance of biogas-fueled micro gas turbine cogeneration systems in sewage treatment plants: Effect of prime mover generation capacity. Energy, 124: 238-248.
Kong, X., Cui, B.J., Jin, D.C., Wu, S.H., Yang, B., Deng, Y., Zhuang, G.Q. and Zhuang, X.L.2015. Analysis of microbial community in the mem-brane bio-reactor (MBR) rural sewage treatment system. Environmental Science, 36(9): 3329-3338.

1599SEWAGE DISCHARGE MONITORING AND MANAGEMENT BASED ON K-MEANS ALGORITHMS
Nature Environment and Pollution Technology • Vol. 18, No. 5 (Special Issue), 2019
Li, J.R., Zhang, X.H. and Zhang, H.B. 2015. Assessing environmental and economical benefits of integrated sewage treatment systems. Chinese Journal of Applied Ecology, 26(8): 2482-2492.
Ong, C.B., Mohammad, A.W. and Abdullah, S.R.S. 2015. Pilot study for sewage wastewater reclamation and reuse using RO membrane: comparison of different pre-treatment systems. Desalin. Water Treat., 54(4-5): 900-907.
Tian, D.J., Lim, H.S. and Jin, C. 2015. Nitrogen and phosphorus removal in an anaerobic (UASB)-aerobic (ABF) sewage treatment system. Desalin. Water Treat., 53(10): 2856-2865.
Von, S.M. 2015. Comparison of simple, small, full-scale sewage treatment
systems in Brazil: UASB-maturation ponds-coarse filter; UASB-horizontal subsurface-flow wetland; vertical-flow wetland (first stage of French system). Water Sci. Technol., 71(3): 329-337.
Zhang, X.H., Wei, Y. and Pan, H.Y. 2015. The comparison of performances of a sewage treatment system before and after implementing the cleaner production measure. J. Clean., 91: 216-228.
Zhou, L.J., Gu, W. and Liu, J.N. 2017. Fate of eleven phthalic acid esters in aer-obic sewage treatment system. Environmental Science, 38(5): 1972-1981.
Song, S., Liu, B. and Zhang, W. 2018. Performance of a large-scale wetland treatment system in treating tailwater from a sewage treatment plant. Mar. Freshwater Res., 69(5): 833.

Vol. 18, No. 5 (Special Issue), 2019 • Nature Environment and Pollution Technology
1600

Sewage Monitoring System Based on Artificial Intelligence
Lefei Xuan*, Xiaojing Tu**, Mengning Niu* and Ahmed Jalal Khan Chowdhury****Hangzhou Vocational & Technical College, Hangzhou Zhejiang, 310018, China**Hang Zhou Polytechnic, Hangzhou Zhejiang, 311402, China***Department of Marine Science, Kulliyyah of Science, International Islamic University Malaysia 25200 Kuantan, Malaysia
ABSTRACT
In order to avoid the problems of unstable water quality and high treatment cost caused by manual control of operators in wastewater treatment process, it is proposed to design and develop an intelligent wastewater monitoring system. According to the characteristics of numerous sewage treatment devices and unstable control indexes, the soft sensing technology of dissolved oxygen (DO) concentration is combined with computer automatic control technology to design intelligent monitoring scheme of sewage treatment process. The overall structure and function of the system are given, the control software, DO concentration soft measurement module and operation guidance are introduced, which lays a foundation for the concrete implementation of the system. The results show that the intelligent monitoring scheme and the aeration control method based on DO concentration soft measurement are applied to the sewage treatment field, and the hardware integration design and software configuration development are completed. The man-machine interface designed is intuitive and friendly, and the operation is convenient. After field installation and debugging, it is successfully operated in a sewage treatment plant, making the removal rate of effluent impurities reach the expected goal and achieve obvious economic benefits. Therefore, it is of great scientific significance and application value to strengthen the research and application of intelligent control of sewage treatment system in China.
INTRODUCTION
With the rapid development of modern industry and urban-ization as well as the continuous increase of population, the water demand is increasing, and the industrial wastewater and domestic wastewater discharged from cities are also increasing accordingly. Sewage discharged directly into the water without treatment will cause serious water pollution, endanger the ecological environment and affect human health. Limited available water resources and pollution of water sources around cities have made water shortage and pollution become one of the most important problems fac-ing all countries. It has become a prominent problem that seriously restricts the sustainable development of economy and urgently needs to be solved.
Artificial intelligence control discipline has been born for many years. With the continuous development of artificial intelligence control, especially its wide application in non-linear and unstable systems, it has attracted the attention of many scientists at home and abroad and become a frontier subject (Ye & Zhou 2015, Shahzad et al. 2017, Leizou & Elijah 2018, Islam 2019). Artificial intelligence control system has strong self-learning, self-adapting and self-organizing ability, and is widely used in large-scale industrial control process, effectively reducing operating costs. For the more complex
process control of sewage treatment plant, China mainly stays on the traditional control method. Although intelligent control has become the hot spot and frontier of sewage treatment research and application, the research at home and abroad is still in the initial stage. In the practical application of intelligent control of sewage treatment, most of them are still in the experimental state, which requires more scholars to devote themselves to the research on artificial intelligence control of sewage treatment. Therefore, strengthening the research on intelligent control technology of urban sewage treatment will become the development direction of sewage treatment and environmental protection.
PAST STUDIES
Intelligent control is the advanced stage of the development of automatic control. It is a new subject closely related to artificial intelligence, brain science and intelligence research. In recent years, domestic and foreign scholars and control experts have extensively studied the automatic control meth-od of sewage treatment. A study used fuzzy logic control to study the energy-saving performance of aeration process, de-veloped an aeration control system based on fuzzy logic, and tested the main aeration tank in the pilot-scale BARDENPHO process, which saved 40% energy compared with ordinary
Nat. Env. & Poll. Tech.Website: www.neptjournal.com
Received: 01-08-2019Accepted: 26-10-2019
Key Words:Sewage treatmentArtificial intelligenceDetection systemIntelligent monitoring
2019pp. 1601-1607 Vol. 18
p-ISSN: 0972-6268 No. 5 (Special Issue)
Nature Environment and Pollution Technology An International Quarterly Scientific Journal
Original Research Paper
e-ISSN: 2395-3454
Open Access
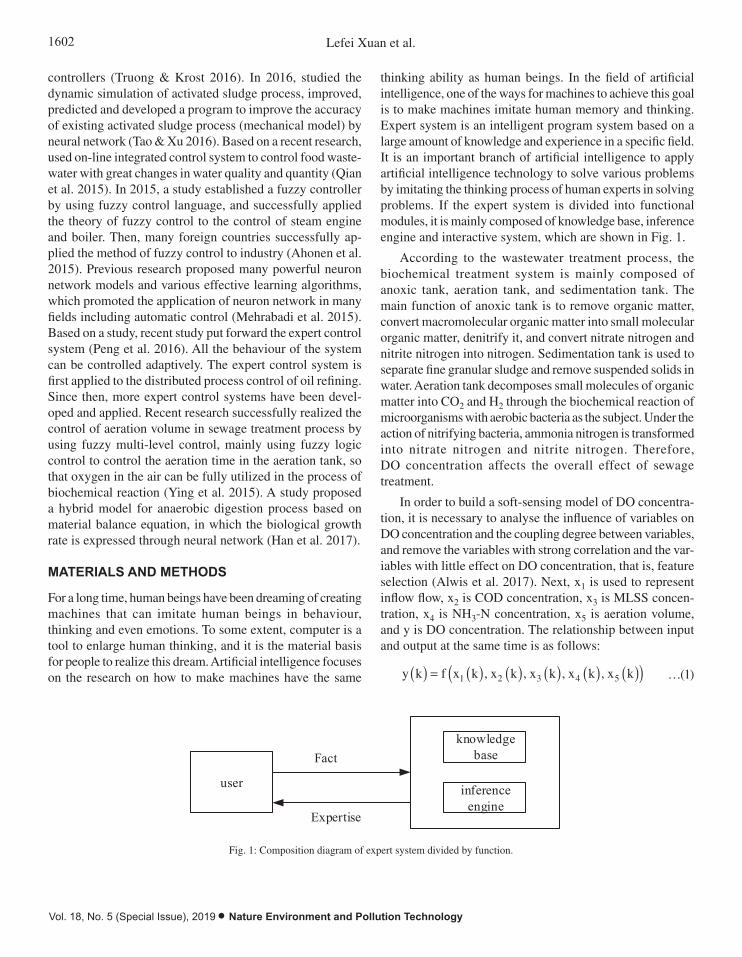
1602 Lefei Xuan et al.
Vol. 18, No. 5 (Special Issue), 2019 • Nature Environment and Pollution Technology
controllers (Truong & Krost 2016). In 2016, studied the dynamic simulation of activated sludge process, improved, predicted and developed a program to improve the accuracy of existing activated sludge process (mechanical model) by neural network (Tao & Xu 2016). Based on a recent research, used on-line integrated control system to control food waste-water with great changes in water quality and quantity (Qian et al. 2015). In 2015, a study established a fuzzy controller by using fuzzy control language, and successfully applied the theory of fuzzy control to the control of steam engine and boiler. Then, many foreign countries successfully ap-plied the method of fuzzy control to industry (Ahonen et al. 2015). Previous research proposed many powerful neuron network models and various effective learning algorithms, which promoted the application of neuron network in many fields including automatic control (Mehrabadi et al. 2015). Based on a study, recent study put forward the expert control system (Peng et al. 2016). All the behaviour of the system can be controlled adaptively. The expert control system is first applied to the distributed process control of oil refining. Since then, more expert control systems have been devel-oped and applied. Recent research successfully realized the control of aeration volume in sewage treatment process by using fuzzy multi-level control, mainly using fuzzy logic control to control the aeration time in the aeration tank, so that oxygen in the air can be fully utilized in the process of biochemical reaction (Ying et al. 2015). A study proposed a hybrid model for anaerobic digestion process based on material balance equation, in which the biological growth rate is expressed through neural network (Han et al. 2017).
MATERIALS AND METHODS
For a long time, human beings have been dreaming of creating machines that can imitate human beings in behaviour, thinking and even emotions. To some extent, computer is a tool to enlarge human thinking, and it is the material basis for people to realize this dream. Artificial intelligence focuses on the research on how to make machines have the same
thinking ability as human beings. In the field of artificial intelligence, one of the ways for machines to achieve this goal is to make machines imitate human memory and thinking. Expert system is an intelligent program system based on a large amount of knowledge and experience in a specific field. It is an important branch of artificial intelligence to apply artificial intelligence technology to solve various problems by imitating the thinking process of human experts in solving problems. If the expert system is divided into functional modules, it is mainly composed of knowledge base, inference engine and interactive system, which are shown in Fig. 1.
According to the wastewater treatment process, the biochemical treatment system is mainly composed of anoxic tank, aeration tank, and sedimentation tank. The main function of anoxic tank is to remove organic matter, convert macromolecular organic matter into small molecular organic matter, denitrify it, and convert nitrate nitrogen and nitrite nitrogen into nitrogen. Sedimentation tank is used to separate fine granular sludge and remove suspended solids in water. Aeration tank decomposes small molecules of organic matter into CO2 and H2 through the biochemical reaction of microorganisms with aerobic bacteria as the subject. Under the action of nitrifying bacteria, ammonia nitrogen is transformed into nitrate nitrogen and nitrite nitrogen. Therefore, DO concentration affects the overall effect of sewage treatment.
In order to build a soft-sensing model of DO concentra-tion, it is necessary to analyse the influence of variables on DO concentration and the coupling degree between variables, and remove the variables with strong correlation and the var-iables with little effect on DO concentration, that is, feature selection (Alwis et al. 2017). Next, x1 is used to represent inflow flow, x2 is COD concentration, x3 is MLSS concen-tration, x4 is NH3-N concentration, x5 is aeration volume, and y is DO concentration. The relationship between input and output at the same time is as follows:
y k f x k x k x k x k x k( ) = ( ) ( ) ( ) ( ) ( )( )1 2 3 4 5, , , , …(1)
user inference engine
knowledge baseFact
Expertise
Fig. 1: Composition diagram of expert system divided by function.
According to the wastewater treatment process, the biochemical treatment system is mainly composed of anoxic tank, aeration tank, and sedimentation tank. The main function of anoxic tank is to remove organic matter, convert macromolecular organic matter into small molecular organic matter, denitrify it, and convert nitrate nitrogen and nitrite nitrogen into nitrogen. Sedimentation tank is used to separate fine granular sludge and remove suspended solids in water. Aeration tank decomposes small molecules of organic matter into CO2 and H2 through the biochemical reaction of microorganisms with aerobic bacteria as the subject. Under the action of nitrifying bacteria, ammonia nitrogen is transformed into nitrate nitrogen and nitrite nitrogen. Therefore, DO concentration affects the overall effect of sewage treatment.
In order to build a soft-sensing model of DO concentration, it is necessary to analyse the influence of variables on DO concentration and the coupling degree between variables, and remove the variables with strong correlation and the variables with little effect on DO concentration, that is, feature selection (Alwis et al. 2017). Next, x1 is used to represent inflow flow, x2 is COD concentration, x3 is MLSS concentration, x4 is NH3-N concentration, x5 is aeration volume, and y is DO concentration. The relationship between input and output at the same time is as follows:
kxkxkxkxkxfky 54321 ,,,, …(1)
The input-output relationship expressed by Formula (1) has strong nonlinearity, so it is difficult to establish its accurate mechanism model. It is necessary to select appropriate methods for DO concentration analysis and measurement. In summary, in order to achieve DO concentration measurement, it is necessary to solve the following problems: building the structure of the soft sensor model, designing the function of the model, and then giving the algorithm implementation. According to the classical cognitive model, the DO concentration soft sensing model structure shown in Fig. 2 is designed.
Case representation
x1x2x3x4x5
Soft Sensing Case Base
GA Distribution Weight Case retrieval
GDM case reuseCase storage
Similar cases
y
Fig. 2: Soft sensing structure of DO concentration.
RESULTS AND DISCUSSION
Structure and function of sewage monitoring system: The sewage treatment process is relatively complex, and the corresponding automation technology requirements are as follows: First, the computer monitoring system requires the completion of the start/stop control and operation status detection of the main production equipment. The control can be started/stopped individually or automatically by the computer, requiring the undisturbed switching of different control modes. Second, monitor the values of the main analog parameters and display them
Fig. 1: Composition diagram of expert system divided by function.
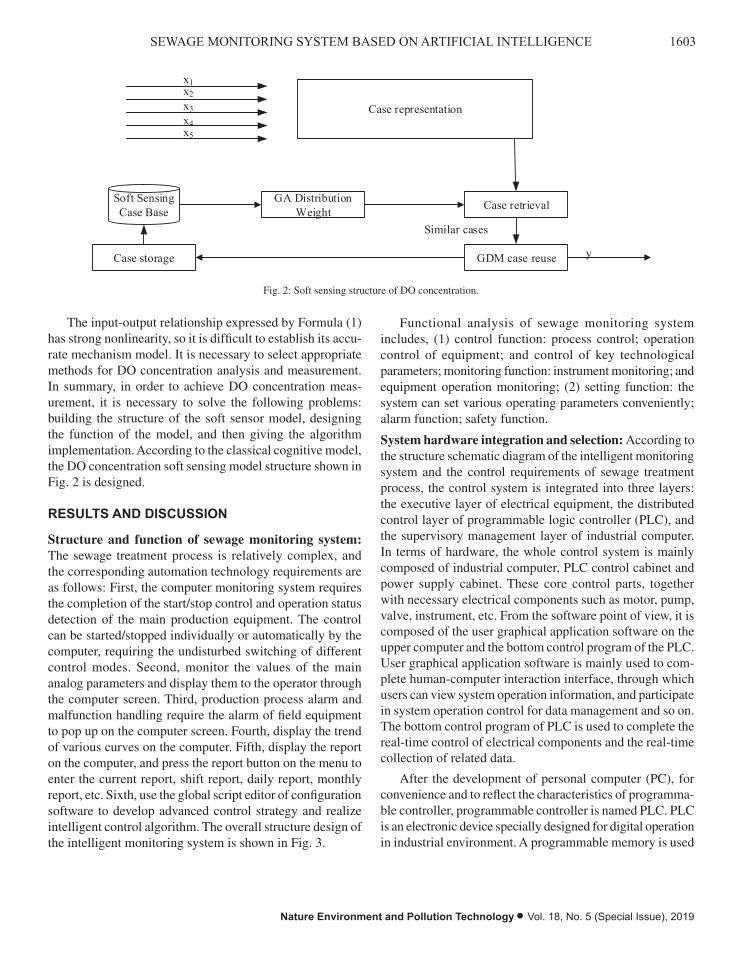
1603SEWAGE MONITORING SYSTEM BASED ON ARTIFICIAL INTELLIGENCE
Nature Environment and Pollution Technology • Vol. 18, No. 5 (Special Issue), 2019
user inference engine
knowledge baseFact
Expertise
Fig. 1: Composition diagram of expert system divided by function.
According to the wastewater treatment process, the biochemical treatment system is mainly composed of anoxic tank, aeration tank, and sedimentation tank. The main function of anoxic tank is to remove organic matter, convert macromolecular organic matter into small molecular organic matter, denitrify it, and convert nitrate nitrogen and nitrite nitrogen into nitrogen. Sedimentation tank is used to separate fine granular sludge and remove suspended solids in water. Aeration tank decomposes small molecules of organic matter into CO2 and H2 through the biochemical reaction of microorganisms with aerobic bacteria as the subject. Under the action of nitrifying bacteria, ammonia nitrogen is transformed into nitrate nitrogen and nitrite nitrogen. Therefore, DO concentration affects the overall effect of sewage treatment.
In order to build a soft-sensing model of DO concentration, it is necessary to analyse the influence of variables on DO concentration and the coupling degree between variables, and remove the variables with strong correlation and the variables with little effect on DO concentration, that is, feature selection (Alwis et al. 2017). Next, x1 is used to represent inflow flow, x2 is COD concentration, x3 is MLSS concentration, x4 is NH3-N concentration, x5 is aeration volume, and y is DO concentration. The relationship between input and output at the same time is as follows:
kxkxkxkxkxfky 54321 ,,,, …(1)
The input-output relationship expressed by Formula (1) has strong nonlinearity, so it is difficult to establish its accurate mechanism model. It is necessary to select appropriate methods for DO concentration analysis and measurement. In summary, in order to achieve DO concentration measurement, it is necessary to solve the following problems: building the structure of the soft sensor model, designing the function of the model, and then giving the algorithm implementation. According to the classical cognitive model, the DO concentration soft sensing model structure shown in Fig. 2 is designed.
Case representation
x1x2x3x4x5
Soft Sensing Case Base
GA Distribution Weight Case retrieval
GDM case reuseCase storage
Similar cases
y
Fig. 2: Soft sensing structure of DO concentration.
RESULTS AND DISCUSSION
Structure and function of sewage monitoring system: The sewage treatment process is relatively complex, and the corresponding automation technology requirements are as follows: First, the computer monitoring system requires the completion of the start/stop control and operation status detection of the main production equipment. The control can be started/stopped individually or automatically by the computer, requiring the undisturbed switching of different control modes. Second, monitor the values of the main analog parameters and display them
Fig. 2: Soft sensing structure of DO concentration.
The input-output relationship expressed by Formula (1) has strong nonlinearity, so it is difficult to establish its accu-rate mechanism model. It is necessary to select appropriate methods for DO concentration analysis and measurement. In summary, in order to achieve DO concentration meas-urement, it is necessary to solve the following problems: building the structure of the soft sensor model, designing the function of the model, and then giving the algorithm implementation. According to the classical cognitive model, the DO concentration soft sensing model structure shown in Fig. 2 is designed.
RESULTS AND DISCUSSION
Structure and function of sewage monitoring system: The sewage treatment process is relatively complex, and the corresponding automation technology requirements are as follows: First, the computer monitoring system requires the completion of the start/stop control and operation status detection of the main production equipment. The control can be started/stopped individually or automatically by the computer, requiring the undisturbed switching of different control modes. Second, monitor the values of the main analog parameters and display them to the operator through the computer screen. Third, production process alarm and malfunction handling require the alarm of field equipment to pop up on the computer screen. Fourth, display the trend of various curves on the computer. Fifth, display the report on the computer, and press the report button on the menu to enter the current report, shift report, daily report, monthly report, etc. Sixth, use the global script editor of configuration software to develop advanced control strategy and realize intelligent control algorithm. The overall structure design of the intelligent monitoring system is shown in Fig. 3.
Functional analysis of sewage monitoring system includes, (1) control function: process control; operation control of equipment; and control of key technological parameters; monitoring function: instrument monitoring; and equipment operation monitoring; (2) setting function: the system can set various operating parameters conveniently; alarm function; safety function.
System hardware integration and selection: According to the structure schematic diagram of the intelligent monitoring system and the control requirements of sewage treatment process, the control system is integrated into three layers: the executive layer of electrical equipment, the distributed control layer of programmable logic controller (PLC), and the supervisory management layer of industrial computer. In terms of hardware, the whole control system is mainly composed of industrial computer, PLC control cabinet and power supply cabinet. These core control parts, together with necessary electrical components such as motor, pump, valve, instrument, etc. From the software point of view, it is composed of the user graphical application software on the upper computer and the bottom control program of the PLC. User graphical application software is mainly used to com-plete human-computer interaction interface, through which users can view system operation information, and participate in system operation control for data management and so on. The bottom control program of PLC is used to complete the real-time control of electrical components and the real-time collection of related data.
After the development of personal computer (PC), for convenience and to reflect the characteristics of programma-ble controller, programmable controller is named PLC. PLC is an electronic device specially designed for digital operation in industrial environment. A programmable memory is used
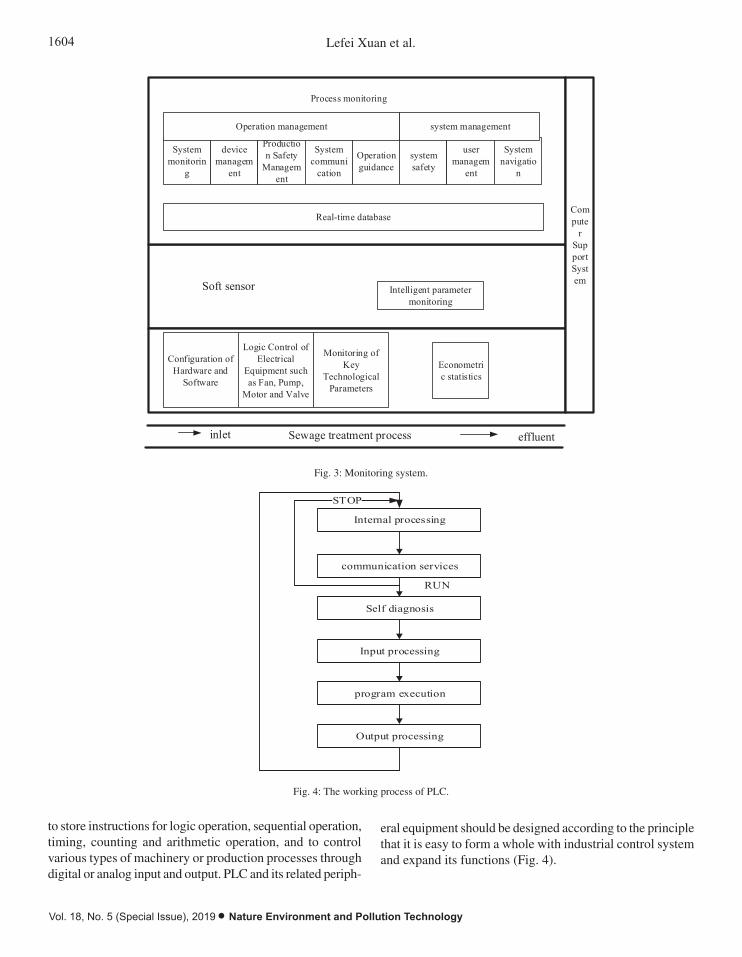
1604 Lefei Xuan et al.
Vol. 18, No. 5 (Special Issue), 2019 • Nature Environment and Pollution Technology
to the operator through the computer screen. Third, production process alarm and malfunction handling require the alarm of field equipment to pop up on the computer screen. Fourth, display the trend of various curves on the computer. Fifth, display the report on the computer, and press the report button on the menu to enter the current report, shift report, daily report, monthly report, etc. Sixth, use the global script editor of configuration software to develop advanced control strategy and realize intelligent control algorithm. The overall structure design of the intelligent monitoring system is shown in Fig. 3.
System monitorin
g
device managem
ent
Production Safety
Management
System communi
cation
system safety
Operation guidance
user managem
ent
System navigatio
n
Operation management system management
Real-time database
Process monitoring
Intelligent parameter monitoring
Soft sensor
Configuration of Hardware and
Software
Logic Control of Electrical
Equipment such as Fan, Pump,
Motor and Valve
Monitoring of Key
Technological Parameters
Econometric statistics
inlet Sewage treatment process effluent
Compute
r Support System
Fig. 3: Monitoring system.
Functional analysis of sewage monitoring system includes, (1) control function: process control; operation control of equipment; and control of key technological parameters; monitoring function: instrument monitoring; and equipment operation monitoring; (2) setting function: the system can set various operating parameters conveniently; alarm function; safety function.
System hardware integration and selection: According to the structure schematic diagram of the intelligent monitoring system and the control requirements of sewage treatment process, the control system is integrated into three layers: the executive layer of electrical equipment, the distributed control layer of programmable logic controller (PLC), and the supervisory management layer of industrial computer. In terms of hardware, the whole control system is mainly composed of industrial computer, PLC control cabinet and power supply cabinet. These core control parts, together with necessary electrical components such as motor, pump, valve, instrument, etc. From the software point of view, it is composed of the user graphical application software on the upper computer and the bottom control program of the PLC. User graphical application software is mainly used to complete human-computer interaction interface, through which users can view system operation information, and participate in system operation control for data management and so on. The bottom control program of PLC is used to complete the real-time control of electrical components and the real-time collection of related data.
After the development of personal computer (PC), for convenience and to reflect the characteristics of programmable controller, programmable controller is named PLC. PLC is an electronic device specially designed for digital operation in industrial environment. A programmable memory is used to store instructions for logic operation, sequential operation, timing, counting and arithmetic operation, and to control various types of machinery or production processes through digital or analog input and output. PLC and its related peripheral equipment should be designed according to the principle that it is easy to form a whole with industrial control system and expand its functions (Fig. 4).
Fig. 3: Monitoring system.
Internal processing
communication services
Self diagnosis
Input processing
program execution
Output processing
STOP
RUN
Fig. 4: The working process of PLC.
CONFIGURATION METHOD
Fame View configuration software is based on Windows 2000/2003/XP/Win7/Win8 platform. It runs stably, fast, simple and easy to use, and has powerful functions and good expansibility. It can provide users with economic and perfect automation solutions. It has been successfully applied in metallurgy, chemical industry, electric power, power distribution, environmental protection, building, water treatment and other industries. It has been proved to be suitable for all large and medium-sized automation projects by application. In addition to providing basic functions such as equipment communication, running database, screen, alarm and historical data, it also provides simple and practical database connection, data formula, data service, forwarding service, report forms, dual-computer redundancy, variable groups, global variables, Web publishing and other enhanced functions, which can provide comprehensive support for users and meet users' needs.
The main features of Fame View are the data parallel acquisition and communication of customizable devices; the running database configuration of classified management; the real three-dimensional picture making and picture roaming, and multi-screen dynamic display; the optional configuration of server redundancy; the alarm service of supporting Email and SMS; the database connection function facilitates the correspondence between process variables and database fields, and carries out conditional data storage and reading and writing. Fame View software mainly includes: picture making, communication system, database and report forms, running database, encrypted dog, scripting and so on, as shown in Fig. 5.
network
service
Serial port
service
Remote connect
ion
SMS service
ADSL service
s
Web service
s
BACNET
services
SNMP service
s
Various forward
ing
OPC service
s
Programming interfac
e
user manage
ment
Monitoring
picture
Variable alarm
historical data
VBS script
Database
Connection
data service
SQL
database
Equipment Data Table
Running database
Core stability
Rapid communication: batch + concurrency
Communication driver
Communication driver
Communication driver
Field equipm
ent
Field equipm
ent
Field equipm
ent Fig. 5: Time and temperature at maximum pore pressure in 10 mm depth.
Fig. 4: The working process of PLC.
to store instructions for logic operation, sequential operation, timing, counting and arithmetic operation, and to control various types of machinery or production processes through digital or analog input and output. PLC and its related periph-
eral equipment should be designed according to the principle that it is easy to form a whole with industrial control system and expand its functions (Fig. 4).
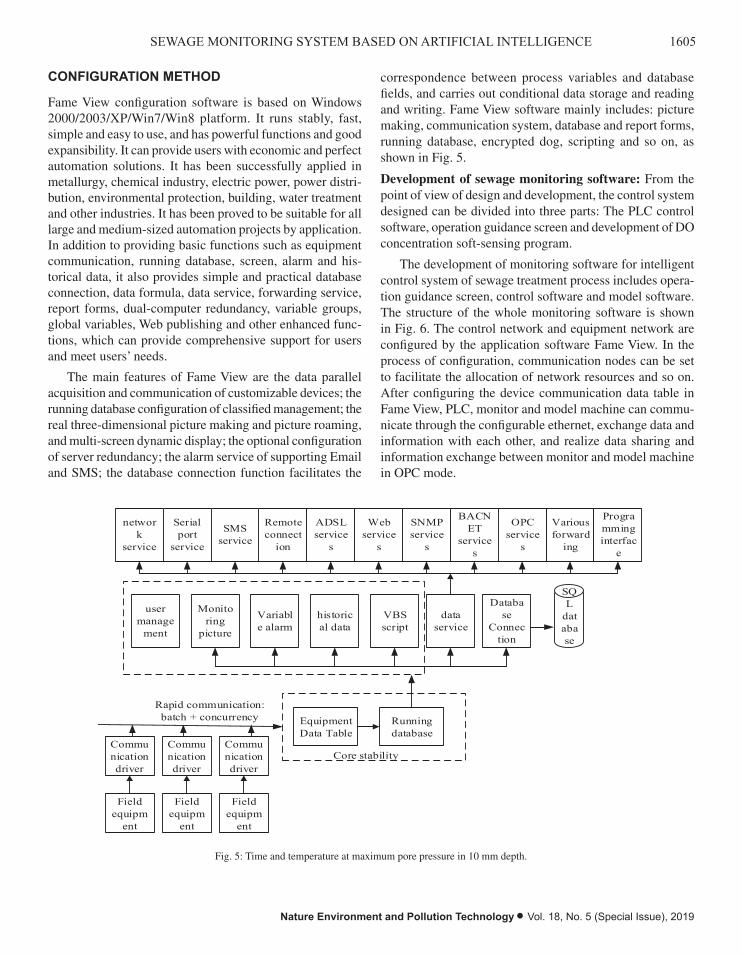
1605SEWAGE MONITORING SYSTEM BASED ON ARTIFICIAL INTELLIGENCE
Nature Environment and Pollution Technology • Vol. 18, No. 5 (Special Issue), 2019
CONFIGURATION METHOD
Fame View configuration software is based on Windows 2000/2003/XP/Win7/Win8 platform. It runs stably, fast, simple and easy to use, and has powerful functions and good expansibility. It can provide users with economic and perfect automation solutions. It has been successfully applied in metallurgy, chemical industry, electric power, power distri-bution, environmental protection, building, water treatment and other industries. It has been proved to be suitable for all large and medium-sized automation projects by application. In addition to providing basic functions such as equipment communication, running database, screen, alarm and his-torical data, it also provides simple and practical database connection, data formula, data service, forwarding service, report forms, dual-computer redundancy, variable groups, global variables, Web publishing and other enhanced func-tions, which can provide comprehensive support for users and meet users’ needs.
The main features of Fame View are the data parallel acquisition and communication of customizable devices; the running database configuration of classified management; the real three-dimensional picture making and picture roaming, and multi-screen dynamic display; the optional configuration of server redundancy; the alarm service of supporting Email and SMS; the database connection function facilitates the
correspondence between process variables and database fields, and carries out conditional data storage and reading and writing. Fame View software mainly includes: picture making, communication system, database and report forms, running database, encrypted dog, scripting and so on, as shown in Fig. 5.
Development of sewage monitoring software: From the point of view of design and development, the control system designed can be divided into three parts: The PLC control software, operation guidance screen and development of DO concentration soft-sensing program.
The development of monitoring software for intelligent control system of sewage treatment process includes opera-tion guidance screen, control software and model software. The structure of the whole monitoring software is shown in Fig. 6. The control network and equipment network are configured by the application software Fame View. In the process of configuration, communication nodes can be set to facilitate the allocation of network resources and so on. After configuring the device communication data table in Fame View, PLC, monitor and model machine can commu-nicate through the configurable ethernet, exchange data and information with each other, and realize data sharing and information exchange between monitor and model machine in OPC mode.
Internal processing
communication services
Self diagnosis
Input processing
program execution
Output processing
STOP
RUN
Fig. 4: The working process of PLC.
CONFIGURATION METHOD
Fame View configuration software is based on Windows 2000/2003/XP/Win7/Win8 platform. It runs stably, fast, simple and easy to use, and has powerful functions and good expansibility. It can provide users with economic and perfect automation solutions. It has been successfully applied in metallurgy, chemical industry, electric power, power distribution, environmental protection, building, water treatment and other industries. It has been proved to be suitable for all large and medium-sized automation projects by application. In addition to providing basic functions such as equipment communication, running database, screen, alarm and historical data, it also provides simple and practical database connection, data formula, data service, forwarding service, report forms, dual-computer redundancy, variable groups, global variables, Web publishing and other enhanced functions, which can provide comprehensive support for users and meet users' needs.
The main features of Fame View are the data parallel acquisition and communication of customizable devices; the running database configuration of classified management; the real three-dimensional picture making and picture roaming, and multi-screen dynamic display; the optional configuration of server redundancy; the alarm service of supporting Email and SMS; the database connection function facilitates the correspondence between process variables and database fields, and carries out conditional data storage and reading and writing. Fame View software mainly includes: picture making, communication system, database and report forms, running database, encrypted dog, scripting and so on, as shown in Fig. 5.
network
service
Serial port
service
Remote connect
ion
SMS service
ADSL service
s
Web service
s
BACNET
services
SNMP service
s
Various forward
ing
OPC service
s
Programming interfac
e
user manage
ment
Monitoring
picture
Variable alarm
historical data
VBS script
Database
Connection
data service
SQL
database
Equipment Data Table
Running database
Core stability
Rapid communication: batch + concurrency
Communication driver
Communication driver
Communication driver
Field equipm
ent
Field equipm
ent
Field equipm
ent Fig. 5: Time and temperature at maximum pore pressure in 10 mm depth. Fig. 5: Time and temperature at maximum pore pressure in 10 mm depth.
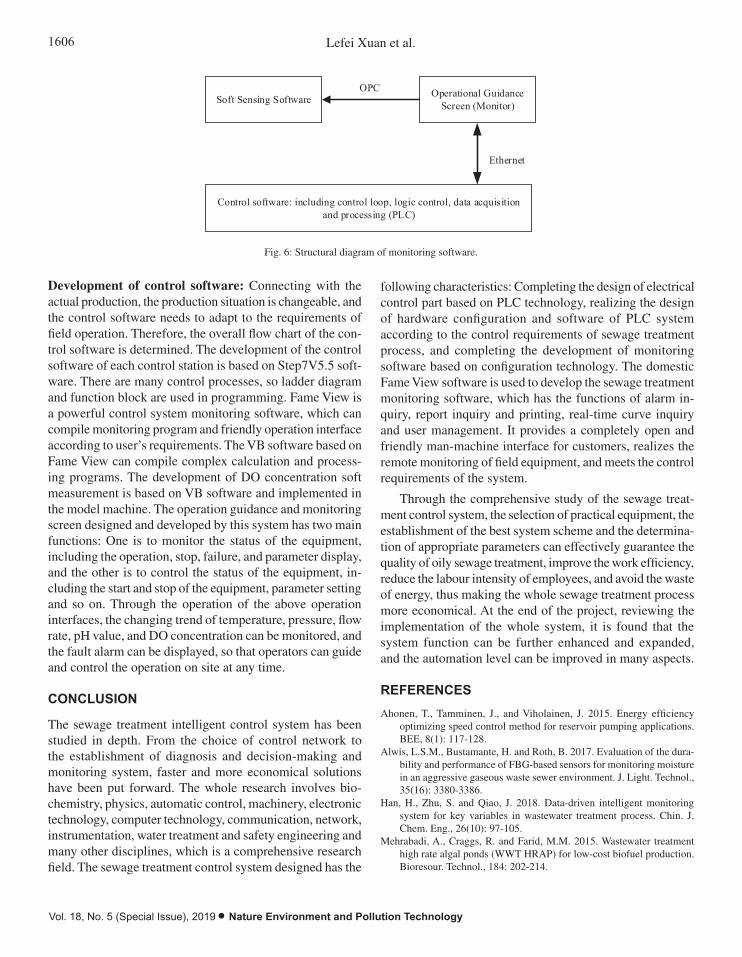
1606 Lefei Xuan et al.
Vol. 18, No. 5 (Special Issue), 2019 • Nature Environment and Pollution Technology
Development of sewage monitoring software: From the point of view of design and development, the control system designed can be divided into three parts: The PLC control software, operation guidance screen and development of DO concentration soft-sensing program.
The development of monitoring software for intelligent control system of sewage treatment process includes operation guidance screen, control software and model software. The structure of the whole monitoring software is shown in Fig. 6. The control network and equipment network are configured by the application software Fame View. In the process of configuration, communication nodes can be set to facilitate the allocation of network resources and so on. After configuring the device communication data table in Fame View, PLC, monitor and model machine can communicate through the configurable ethernet, exchange data and information with each other, and realize data sharing and information exchange between monitor and model machine in OPC mode.
Soft Sensing Software Operational Guidance Screen (Monitor)
Control software: including control loop, logic control, data acquisition and processing (PLC)
OPC
Ethernet
Fig. 6: Structural diagram of monitoring software.
Development of control software: Connecting with the actual production, the production situation is changeable, and the control software needs to adapt to the requirements of field operation. Therefore, the overall flow chart of the control software is determined. The development of the control software of each control station is based on Step7V5.5 software. There are many control processes, so ladder diagram and function block are used in programming. Fame View is a powerful control system monitoring software, which can compile monitoring program and friendly operation interface according to user's requirements. The VB software based on Fame View can compile complex calculation and processing programs. The development of DO concentration soft measurement is based on VB software and implemented in the model machine. The operation guidance and monitoring screen designed and developed by this system has two main functions: One is to monitor the status of the equipment, including the operation, stop, failure, and parameter display, and the other is to control the status of the equipment, including the start and stop of the equipment, parameter setting and so on. Through the operation of the above operation interfaces, the changing trend of temperature, pressure, flow rate, pH value, and DO concentration can be monitored, and the fault alarm can be displayed, so that operators can guide and control the operation on site at any time.
CONCLUSION
The sewage treatment intelligent control system has been studied in depth. From the choice of control network to the establishment of diagnosis and decision-making and monitoring system, faster and more economical solutions have been put forward. The whole research involves biochemistry, physics, automatic control, machinery, electronic technology, computer technology, communication, network, instrumentation, water treatment and safety engineering and many other disciplines, which is a comprehensive research field. The sewage treatment control system designed has the following characteristics: Completing the design of electrical control part based on PLC technology, realizing the design of hardware configuration and software of PLC system according to the control requirements of sewage treatment process, and completing the development of monitoring software based on configuration technology. The domestic Fame View software is used to develop the sewage treatment monitoring software, which has the functions of alarm inquiry, report inquiry and printing, real-time curve inquiry and user management. It provides a completely open and friendly man-machine interface for customers, realizes the remote monitoring of field equipment, and meets the control requirements of the system.
Through the comprehensive study of the sewage treatment control system, the selection of practical equipment, the establishment of the best system scheme and the determination of appropriate parameters can effectively guarantee the quality of oily sewage treatment, improve the work efficiency, reduce the labour intensity of employees, and avoid the waste of energy, thus making the whole sewage treatment process more economical.
Fig. 6: Structural diagram of monitoring software.
Development of control software: Connecting with the actual production, the production situation is changeable, and the control software needs to adapt to the requirements of field operation. Therefore, the overall flow chart of the con-trol software is determined. The development of the control software of each control station is based on Step7V5.5 soft-ware. There are many control processes, so ladder diagram and function block are used in programming. Fame View is a powerful control system monitoring software, which can compile monitoring program and friendly operation interface according to user’s requirements. The VB software based on Fame View can compile complex calculation and process-ing programs. The development of DO concentration soft measurement is based on VB software and implemented in the model machine. The operation guidance and monitoring screen designed and developed by this system has two main functions: One is to monitor the status of the equipment, including the operation, stop, failure, and parameter display, and the other is to control the status of the equipment, in-cluding the start and stop of the equipment, parameter setting and so on. Through the operation of the above operation interfaces, the changing trend of temperature, pressure, flow rate, pH value, and DO concentration can be monitored, and the fault alarm can be displayed, so that operators can guide and control the operation on site at any time.
CONCLUSION
The sewage treatment intelligent control system has been studied in depth. From the choice of control network to the establishment of diagnosis and decision-making and monitoring system, faster and more economical solutions have been put forward. The whole research involves bio-chemistry, physics, automatic control, machinery, electronic technology, computer technology, communication, network, instrumentation, water treatment and safety engineering and many other disciplines, which is a comprehensive research field. The sewage treatment control system designed has the
following characteristics: Completing the design of electrical control part based on PLC technology, realizing the design of hardware configuration and software of PLC system according to the control requirements of sewage treatment process, and completing the development of monitoring software based on configuration technology. The domestic Fame View software is used to develop the sewage treatment monitoring software, which has the functions of alarm in-quiry, report inquiry and printing, real-time curve inquiry and user management. It provides a completely open and friendly man-machine interface for customers, realizes the remote monitoring of field equipment, and meets the control requirements of the system.
Through the comprehensive study of the sewage treat-ment control system, the selection of practical equipment, the establishment of the best system scheme and the determina-tion of appropriate parameters can effectively guarantee the quality of oily sewage treatment, improve the work efficiency, reduce the labour intensity of employees, and avoid the waste of energy, thus making the whole sewage treatment process more economical. At the end of the project, reviewing the implementation of the whole system, it is found that the system function can be further enhanced and expanded, and the automation level can be improved in many aspects.
REFERENCES
Ahonen, T., Tamminen, J., and Viholainen, J. 2015. Energy efficiency optimizing speed control method for reservoir pumping applications. BEE, 8(1): 117-128.
Alwis, L.S.M., Bustamante, H. and Roth, B. 2017. Evaluation of the dura-bility and performance of FBG-based sensors for monitoring moisture in an aggressive gaseous waste sewer environment. J. Light. Technol., 35(16): 3380-3386.
Han, H., Zhu, S. and Qiao, J. 2018. Data-driven intelligent monitoring system for key variables in wastewater treatment process. Chin. J. Chem. Eng., 26(10): 97-105.
Mehrabadi, A., Craggs, R. and Farid, M.M. 2015. Wastewater treatment high rate algal ponds (WWT HRAP) for low-cost biofuel production. Bioresour. Technol., 184: 202-214.

1607SEWAGE MONITORING SYSTEM BASED ON ARTIFICIAL INTELLIGENCE
Nature Environment and Pollution Technology • Vol. 18, No. 5 (Special Issue), 2019
Peng, Y, Qin, R. and Guo, J. 2016. Net-zero-energy model for sustainable wastewater treatment. Environ. Sci. Technol., 51(2): 1017.
Qian, Y., Wu, T. and Zhang, M.F. 2015. Design and implementation of chem-ical wastewater pH control system. Appl. Mech. Mater., 700: 447-450.
Tao, H.J. and Xu, H. 2016. Dynamical modelling and intelligent control of aeration process for pollutants degradation in technics of SBR. Mater. Sci. Forum, 859: 127-133.
Truong, N.H. and Krost, G. 2016. Intelligent energy exploitation from sewage. IET Renew. Power Gener., 10(3): 360-369.
Ye, X.M. and Zhou, A. 2015. Intelligent reform of activated sludge sewage treatment control system. Appl. Mech. Mater., 700: 451-454.
Ying, W., Zhu, S. and Cao, B. 2015. Study on 1,4-butanediol wastewater treatment. Industrial Water Treatment, 24(9): 1975-1989.

Vol. 18, No. 5 (Special Issue), 2019 • Nature Environment and Pollution Technology
1608

Groundwater Pollution Diffusion Model Based on Partial Differential Equation
Bin ZhouHunan Institute of Technology, Hunan 421002, China
ABSTRACT
The objective of the paper is to solve the problems of groundwater using partial differential equation (PDE). The finite element method is one of the most important solutions to the problems, which is applied to obtain the approximate solution of functions. The paper has applied the toolbox method to solve the problems of groundwater in the engineering of the planar two-dimensional (2D) steady flow and the planar 2D unsteady flow. In addition, the planar 2D steady flow includes the specific problems of fully penetrating well with the preset depth of the confined aquifer and the steady flow of the unconfined aquifer. Besides, the PDE toolbox has been applied to solve the practical groundwater problems in engineering, the results have shown that in terms of solving the groundwater problems, the MATLAB PDE toolbox is more convenient, simple, and accurate compared with the method of directly programming the original program. Therefore, in case of problems that cannot be solved by the graphical user interface of the PDE toolbox, the command functions in the MATLAB toolbox could be applied to perform numerical calculations on the problems.
INTRODUCTION
In recent years, the significant development of the science and technology and the agriculture and industry, the continual expansion of cities, the rapid growth of population, and the massive pollution and waste of water resources have caused the continuous decrease of groundwater level, leading to the ever-reducing water resources for human consumption; consequently, water supply crises at different levels have appeared all around the world (Augeraud-Véron et al. 2017). Besides, as more mines are mined, the groundwater resources are also reduced. With the occurrence of the underground sewage incident brewed by a company in Weifang City, Shandong Province, China, people are more concerned about groundwater pollution (Wang & Gao 2017). According to national surveys, given the serious groundwater pollution, the situation of groundwater pollution has become very se-rious, and the speed of water pollution has been increasing. Being an important natural water resource, groundwater is closely related to the daily lives of human beings; it is the only water supply in some cases (Meng et al. 2017, Nnolim 2017). Therefore, the rational development and utilization of groundwater resource have become a problem that must be solved at present.
Currently, the mathematical models of more and more engineering and scientific problems could be classified as the determining solution of partial differential equation (PDE) (Bo et al. 2018). The processes of solving the determining
solutions of PDE are relatively complicated; the research on numerical methods of PDE has become the primary re-searching directions of PDE, as well as the core content of engineering and scientific calculations.
The partial differential equation toolbox (PDE toolbox) software has provided the researchers with a practical work-ing environment and simple solution methods. The toolbox software is specially designed for both beginners and senior users (Wei et al. 2017). There are two applications of the toolbox software on PDE-associated problems: one is the direct application of the graphical user interface (GUI) in the PDE toolbox software. Enter “pdctool” on the command line of the MATLAB window and run it (Abdelrahman et al. 2017). The graphical user interface of the PDE toolbox would be automatically generated, which is a separate graphical environment for solving problems with partial differential equations (Martelloni et al. 2017). Common applications could use specific physical conditions rather than abstract coefficients. The utilization of the pdctool requires no math-ematical knowledge of MATLAB (Kovacic et al. 2017) in terms of solving the partial differential equations, it could be performed under the guidance of examples. The graphical user interface window allows following operations: drawing the geometric area of the partial differential equation, setting the type of the equation and the parameters of the equation, setting the type and parameters of the boundary condition, meshing the geometric area, solving the equation, and plot-ting the chart.
Nat. Env. & Poll. Tech.Website: www.neptjournal.com
Received: 18-08-2019Accepted: 06-10-2019
Key Words:Groundwater pollutionPDE toolboxSteady flowUnsteady flowPollution diffusion
2019pp. 1609-1613 Vol. 18
p-ISSN: 0972-6268 No. 5 (Special Issue)
Nature Environment and Pollution Technology An International Quarterly Scientific Journal
Original Research Paper
e-ISSN: 2395-3454
Open Access
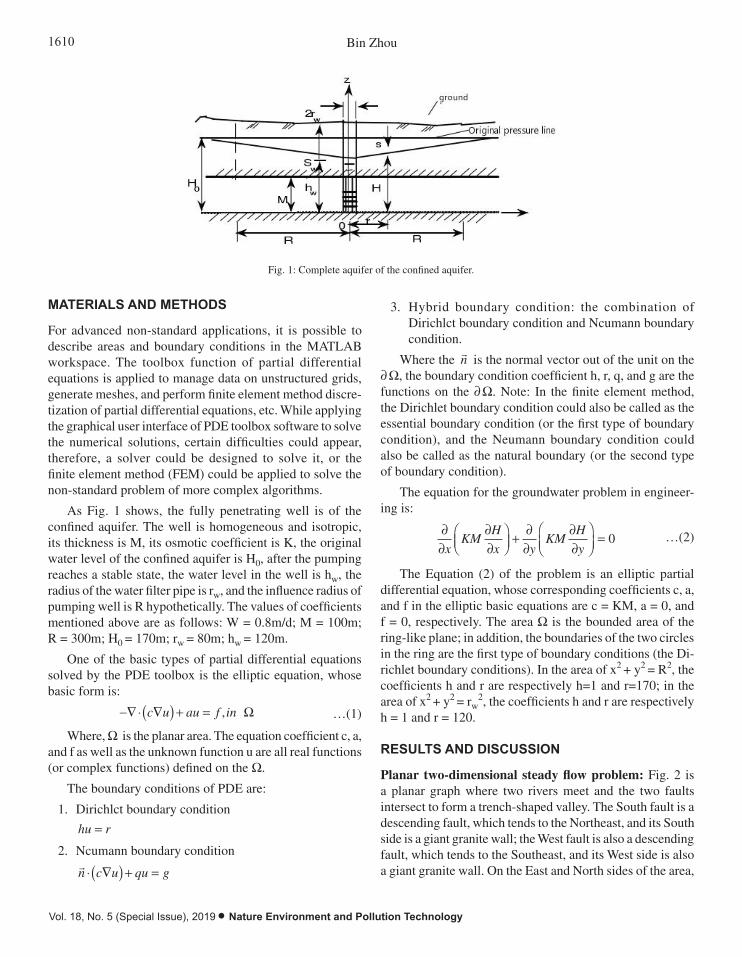
1610 Bin Zhou
Vol. 18, No. 5 (Special Issue), 2019 • Nature Environment and Pollution Technology
Currently, the mathematical models of more and more engineering and scientific problems could be classified as the determining solution of partial differential equation (PDE) (Bo et al. 2018). The processes of solving the determining solutions of PDE are relatively complicated; the research on numerical methods of PDE has become the primary researching directions of PDE, as well as the core content of engineering and scientific calculations.
The partial differential equation toolbox (PDE toolbox) software has provided the researchers with a practical working environment and simple solution methods. The toolbox software is specially designed for both beginners and senior users (Wei et al. 2017). There are two applications of the toolbox software on PDE-associated problems: one is the direct application of the graphical user interface (GUI) in the PDE toolbox software. Enter “pdctool” on the command line of the MATLAB window and run it (Abdelrahman et al. 2017). The graphical user interface of the PDE toolbox would be automatically generated, which is a separate graphical environment for solving problems with partial differential equations (Martelloni et al. 2017). Common applications could use specific physical conditions rather than abstract coefficients. The utilization of the pdctool requires no mathematical knowledge of MATLAB (Kovacic et al. 2017) in terms of solving the partial differential equations, it could be performed under the guidance of examples. The graphical user interface window allows following operations: drawing the geometric area of the partial differential equation, setting the type of the equation and the parameters of the equation, setting the type and parameters of the boundary condition, meshing the geometric area, solving the equation, and plotting the chart.
EXPERIMENTAL PROCEDURE
For advanced non-standard applications, it is possible to describe areas and boundary conditions in the MATLAB workspace. The toolbox function of partial differential equations is applied to manage data on unstructured grids, generate meshes, and perform finite element method discretization of partial differential equations, etc. While applying the graphical user interface of PDE toolbox software to solve the numerical solutions, certain difficulties could appear, therefore, a solver could be designed to solve it, or the finite element method (FEM) could be applied to solve the non-standard problem of more complex algorithms.
As Fig. 1 shows, the fully penetrating well is of the confined aquifer. The well is homogeneous and isotropic, its thickness is M, its osmotic coefficient is K, the original water level of the confined aquifer is H0, after the pumping reaches a stable state, the water level in the well is hw, the radius of the water filter pipe is rw, and the influence radius of pumping well is R hypothetically. The values of coefficients mentioned above are as follows: W=0.8m/d; M=100m; R=300m; H0=170m; rw=80m; hw=120m.
Fig. 1: Complete aquifer of the confined aquifer.
One of the basic types of partial differential equations solved by the PDE toolbox is the elliptic equation, whose basic form is:
−𝛻𝛻 ⋅ (𝑐𝑐𝛻𝛻𝑢𝑢) + 𝑎𝑎𝑢𝑢 = 𝑓𝑓, 𝑖𝑖𝑖𝑖 𝛺𝛺 …(1)
Where, is the planar area. The equation coefficient c, a, and f as well as the unknown function u are all real functions (or complex functions) defined on the .
The boundary conditions of PDE are:
1. Dirichlct boundary condition
Fig. 1: Complete aquifer of the confined aquifer.
MATERIALS AND METHODS
For advanced non-standard applications, it is possible to describe areas and boundary conditions in the MATLAB workspace. The toolbox function of partial differential equations is applied to manage data on unstructured grids, generate meshes, and perform finite element method discre-tization of partial differential equations, etc. While applying the graphical user interface of PDE toolbox software to solve the numerical solutions, certain difficulties could appear, therefore, a solver could be designed to solve it, or the finite element method (FEM) could be applied to solve the non-standard problem of more complex algorithms.
As Fig. 1 shows, the fully penetrating well is of the confined aquifer. The well is homogeneous and isotropic, its thickness is M, its osmotic coefficient is K, the original water level of the confined aquifer is H0, after the pumping reaches a stable state, the water level in the well is hw, the radius of the water filter pipe is rw, and the influence radius of pumping well is R hypothetically. The values of coefficients mentioned above are as follows: W = 0.8m/d; M = 100m; R = 300m; H0 = 170m; rw = 80m; hw = 120m.
One of the basic types of partial differential equations solved by the PDE toolbox is the elliptic equation, whose basic form is:
,-—◊ —( ) + =c u au f in W …(1)
Where, W is the planar area. The equation coefficient c, a, and f as well as the unknown function u are all real functions (or complex functions) defined on the W.
The boundary conditions of PDE are:
1. Dirichlct boundary condition
hu r=
2. Ncumann boundary condition
�n c u qu g◊ —( ) + =
3. Hybrid boundary condition: the combination of Dirichlct boundary condition and Ncumann boundary condition.
Where the �n is the normal vector out of the unit on the
∂ W, the boundary condition coefficient h, r, q, and g are the functions on the ∂ W. Note: In the finite element method, the Dirichlet boundary condition could also be called as the essential boundary condition (or the first type of boundary condition), and the Neumann boundary condition could also be called as the natural boundary (or the second type of boundary condition).
The equation for the groundwater problem in engineer-ing is:
∂∂
∂∂
ÊËÁ
ˆ¯̃
+∂∂
∂∂
ÊËÁ
ˆ¯̃
=x
KMH
x yKM
H
y0 …(2)
The Equation (2) of the problem is an elliptic partial differential equation, whose corresponding coefficients c, a, and f in the elliptic basic equations are c = KM, a = 0, and f = 0, respectively. The area W is the bounded area of the ring-like plane; in addition, the boundaries of the two circles in the ring are the first type of boundary conditions (the Di-richlet boundary conditions). In the area of x2 + y2 = R2, the coefficients h and r are respectively h=1 and r=170; in the area of x2 + y2 = rw
2, the coefficients h and r are respectively h = 1 and r = 120.
RESULTS AND DISCUSSION
Planar two-dimensional steady flow problem: Fig. 2 is a planar graph where two rivers meet and the two faults intersect to form a trench-shaped valley. The South fault is a descending fault, which tends to the Northeast, and its South side is a giant granite wall; the West fault is also a descending fault, which tends to the Southeast, and its West side is also a giant granite wall. On the East and North sides of the area,
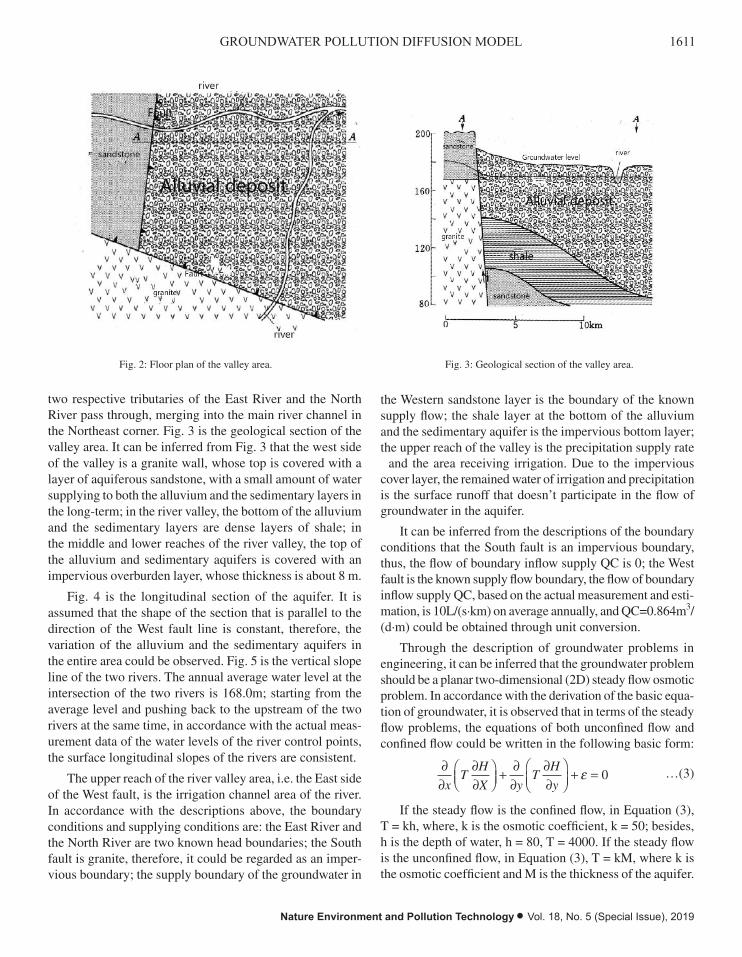
1611GROUNDWATER POLLUTION DIFFUSION MODEL
Nature Environment and Pollution Technology • Vol. 18, No. 5 (Special Issue), 2019
ℎ𝑢𝑢 = 𝑟𝑟
2. Ncumann boundary condition
�⃗�𝑛 ⋅ (𝑐𝑐𝛻𝛻𝑢𝑢) + 𝑞𝑞𝑢𝑢 = 𝑔𝑔
3. Hybrid boundary condition: the combination of Dirichlct boundary condition and Ncumann boundary condition.
Where the �⃗�𝑛 is the normal vector out of the unit on the , the boundary condition coefficient h, r, q, and g are the functions on the . Note: In the finite element method, the Dirichlet boundary condition could also be called as the essential boundary condition (or the first type of boundary condition), and the Neumann boundary condition could also be called as the natural boundary (or the second type of boundary condition).
The equation for the groundwater problem in engineering is:
𝜕𝜕𝜕𝜕𝜕𝜕 (𝐾𝐾𝐾𝐾 𝜕𝜕𝜕𝜕
𝜕𝜕𝜕𝜕) + 𝜕𝜕𝜕𝜕𝜕𝜕 (𝐾𝐾𝐾𝐾 𝜕𝜕𝜕𝜕
𝜕𝜕𝜕𝜕) = 0 …(2)
The Equation (2) of the problem is an elliptic partial differential equation, whose corresponding coefficients c, a, and f in the elliptic basic equations are c=KM, a=0, and f=0, respectively. The area Ω is the bounded area of the ring-like plane; in addition, the boundaries of the two circles in the ring are the first type of boundary conditions (the Dirichlet boundary conditions). In the area of x2+y2=R2, the coefficients h and r are respectively h=1 and r=170; in the area of x2+y2=rw
2, the coefficients h and r are respectively h=1 and r=120.
RESULTS AND DISCUSSION
Planar two-dimensional steady flow problem: Fig. 2 is a planar graph where two rivers meet and the two faults intersect to form a trench-shaped valley. The South fault is a descending fault, which tends to the Northeast, and its South side is a giant granite wall; the West fault is also a descending fault, which tends to the Southeast, and its West side is also a giant granite wall. On the East and North sides of the area, two respective tributaries of the East River and the North River pass through, merging into the main river channel in the Northeast corner. Fig. 3 is the geological section of the valley area. It can be inferred from Fig. 3 that the west side of the valley is a granite wall, whose top is covered with a layer of aquiferous sandstone, with a small amount of water supplying to both the alluvium and the sedimentary layers in the long-term; in the river valley, the bottom of the alluvium and the sedimentary layers are dense layers of shale; in the middle and lower reaches of the river valley, the top of the alluvium and sedimentary aquifers is covered with an impervious overburden layer, whose thickness is about 8m.
Fig. 2: Floor plan of the valley area. Fig. 3: Geological section of the valley area.
Fig. 4 is the longitudinal section of the aquifer. It is assumed that the shape of the section that is parallel to the direction of the West fault line is constant, therefore, the variation of the alluvium and the sedimentary aquifers in the entire area could be observed. Fig. 5 is the vertical slope line of the two rivers. The annual average water level at the intersection of the two rivers is 168.0m; starting from the average level and pushing back to the
Fig. 2: Floor plan of the valley area. Fig. 3: Geological section of the valley area.
two respective tributaries of the East River and the North River pass through, merging into the main river channel in the Northeast corner. Fig. 3 is the geological section of the valley area. It can be inferred from Fig. 3 that the west side of the valley is a granite wall, whose top is covered with a layer of aquiferous sandstone, with a small amount of water supplying to both the alluvium and the sedimentary layers in the long-term; in the river valley, the bottom of the alluvium and the sedimentary layers are dense layers of shale; in the middle and lower reaches of the river valley, the top of the alluvium and sedimentary aquifers is covered with an impervious overburden layer, whose thickness is about 8 m.
Fig. 4 is the longitudinal section of the aquifer. It is assumed that the shape of the section that is parallel to the direction of the West fault line is constant, therefore, the variation of the alluvium and the sedimentary aquifers in the entire area could be observed. Fig. 5 is the vertical slope line of the two rivers. The annual average water level at the intersection of the two rivers is 168.0m; starting from the average level and pushing back to the upstream of the two rivers at the same time, in accordance with the actual meas-urement data of the water levels of the river control points, the surface longitudinal slopes of the rivers are consistent.
The upper reach of the river valley area, i.e. the East side of the West fault, is the irrigation channel area of the river. In accordance with the descriptions above, the boundary conditions and supplying conditions are: the East River and the North River are two known head boundaries; the South fault is granite, therefore, it could be regarded as an imper-vious boundary; the supply boundary of the groundwater in
the Western sandstone layer is the boundary of the known supply flow; the shale layer at the bottom of the alluvium and the sedimentary aquifer is the impervious bottom layer; the upper reach of the valley is the precipitation supply rate ε and the area receiving irrigation. Due to the impervious cover layer, the remained water of irrigation and precipitation is the surface runoff that doesn’t participate in the flow of groundwater in the aquifer.
It can be inferred from the descriptions of the boundary conditions that the South fault is an impervious boundary, thus, the flow of boundary inflow supply QC is 0; the West fault is the known supply flow boundary, the flow of boundary inflow supply QC, based on the actual measurement and esti-mation, is 10L/(s∙km) on average annually, and QC=0.864m3/(d∙m) could be obtained through unit conversion.
Through the description of groundwater problems in engineering, it can be inferred that the groundwater problem should be a planar two-dimensional (2D) steady flow osmotic problem. In accordance with the derivation of the basic equa-tion of groundwater, it is observed that in terms of the steady flow problems, the equations of both unconfined flow and confined flow could be written in the following basic form:
∂∂
∂∂
ÊËÁ
ˆ¯̃
+∂∂
∂∂
ÊËÁ
ˆ¯̃
+ =x
TH
X yT
H
ye 0 …(3)
If the steady flow is the confined flow, in Equation (3), T = kh, where, k is the osmotic coefficient, k = 50; besides, h is the depth of water, h = 80, T = 4000. If the steady flow is the unconfined flow, in Equation (3), T = kM, where k is the osmotic coefficient and M is the thickness of the aquifer.
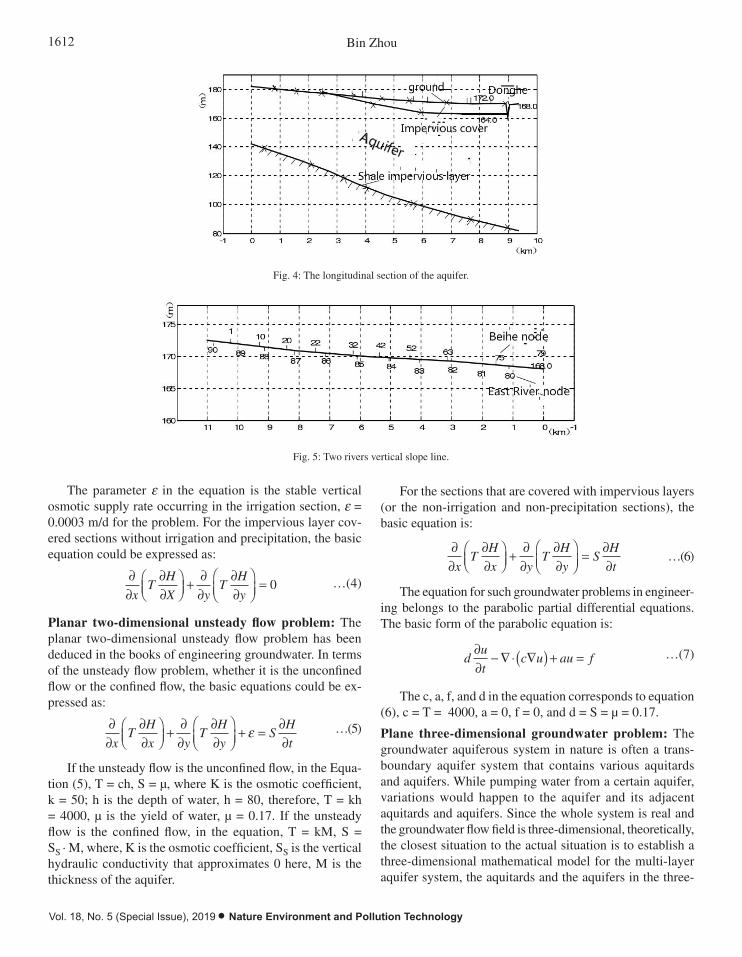
1612 Bin Zhou
Vol. 18, No. 5 (Special Issue), 2019 • Nature Environment and Pollution Technology
upstream of the two rivers at the same time, in accordance with the actual measurement data of the water levels of the river control points, the surface longitudinal slopes of the rivers are consistent.
Fig. 4: The longitudinal section of the aquifer.
Fig. 5: Two rivers vertical slope line.
The upper reach of the river valley area, i.e. the East side of the West fault, is the irrigation channel area of the river. In accordance with the descriptions above, the boundary conditions and supplying conditions are: the East River and the North River are two known head boundaries; the South fault is granite, therefore, it could be regarded as an impervious boundary; the supply boundary of the groundwater in the Western sandstone layer is the boundary of the known supply flow; the shale layer at the bottom of the alluvium and the sedimentary aquifer is the impervious bottom layer; the upper reach of the valley is the precipitation supply rate ε and the area receiving irrigation. Due to the impervious cover layer, the remained water of irrigation and precipitation is the surface runoff that doesn’t participate in the flow of groundwater in the aquifer.
It can be inferred from the descriptions of the boundary conditions that the South fault is an impervious boundary, thus, the flow of boundary inflow supply QC is 0; the West fault is the known supply flow boundary, the flow of boundary inflow supply QC, based on the actual measurement and estimation, is 10L/(s∙km) on average annually, and QC=0.864m3/(d∙m) could be obtained through unit conversion.
Through the description of groundwater problems in engineering, it can be inferred that the groundwater problem should be a planar two-dimensional (2D) steady flow osmotic problem. In accordance with the derivation of the basic equation of groundwater, it is observed that in terms of the steady flow problems, the equations of both unconfined flow and confined flow could be written in the following basic form:
𝜕𝜕𝜕𝜕𝜕𝜕 (𝑇𝑇𝜕𝜕𝜕𝜕𝜕𝜕𝜕𝜕) +
𝜕𝜕𝜕𝜕𝜕𝜕 (𝑇𝑇
𝜕𝜕𝜕𝜕𝜕𝜕𝜕𝜕) + 𝜀𝜀 = 0 …(3)
If the steady flow is the confined flow, in Equation (3), T=kh, where, k is the osmotic coefficient, k=50; besides, h is the depth of water, h=80, T=4000. If the steady flow is the unconfined flow, in Equation (3), T=kM, where k is the osmotic coefficient and M is the thickness of the aquifer. The parameter ε in the equation is the stable vertical osmotic supply rate occurring in the irrigation section, ε = 0.0003 m/d for the problem. For the impervious layer covered sections without irrigation and precipitation, the basic equation could be expressed as:
𝜕𝜕𝜕𝜕𝜕𝜕 (𝑇𝑇𝜕𝜕𝜕𝜕𝜕𝜕𝜕𝜕) +
𝜕𝜕𝜕𝜕𝜕𝜕 (𝑇𝑇
𝜕𝜕𝜕𝜕𝜕𝜕𝜕𝜕) = 0 …(4)
Fig. 4: The longitudinal section of the aquifer.
upstream of the two rivers at the same time, in accordance with the actual measurement data of the water levels of the river control points, the surface longitudinal slopes of the rivers are consistent.
Fig. 4: The longitudinal section of the aquifer.
Fig. 5: Two rivers vertical slope line.
The upper reach of the river valley area, i.e. the East side of the West fault, is the irrigation channel area of the river. In accordance with the descriptions above, the boundary conditions and supplying conditions are: the East River and the North River are two known head boundaries; the South fault is granite, therefore, it could be regarded as an impervious boundary; the supply boundary of the groundwater in the Western sandstone layer is the boundary of the known supply flow; the shale layer at the bottom of the alluvium and the sedimentary aquifer is the impervious bottom layer; the upper reach of the valley is the precipitation supply rate ε and the area receiving irrigation. Due to the impervious cover layer, the remained water of irrigation and precipitation is the surface runoff that doesn’t participate in the flow of groundwater in the aquifer.
It can be inferred from the descriptions of the boundary conditions that the South fault is an impervious boundary, thus, the flow of boundary inflow supply QC is 0; the West fault is the known supply flow boundary, the flow of boundary inflow supply QC, based on the actual measurement and estimation, is 10L/(s∙km) on average annually, and QC=0.864m3/(d∙m) could be obtained through unit conversion.
Through the description of groundwater problems in engineering, it can be inferred that the groundwater problem should be a planar two-dimensional (2D) steady flow osmotic problem. In accordance with the derivation of the basic equation of groundwater, it is observed that in terms of the steady flow problems, the equations of both unconfined flow and confined flow could be written in the following basic form:
𝜕𝜕𝜕𝜕𝜕𝜕 (𝑇𝑇𝜕𝜕𝜕𝜕𝜕𝜕𝜕𝜕) +
𝜕𝜕𝜕𝜕𝜕𝜕 (𝑇𝑇
𝜕𝜕𝜕𝜕𝜕𝜕𝜕𝜕) + 𝜀𝜀 = 0 …(3)
If the steady flow is the confined flow, in Equation (3), T=kh, where, k is the osmotic coefficient, k=50; besides, h is the depth of water, h=80, T=4000. If the steady flow is the unconfined flow, in Equation (3), T=kM, where k is the osmotic coefficient and M is the thickness of the aquifer. The parameter ε in the equation is the stable vertical osmotic supply rate occurring in the irrigation section, ε = 0.0003 m/d for the problem. For the impervious layer covered sections without irrigation and precipitation, the basic equation could be expressed as:
𝜕𝜕𝜕𝜕𝜕𝜕 (𝑇𝑇𝜕𝜕𝜕𝜕𝜕𝜕𝜕𝜕) +
𝜕𝜕𝜕𝜕𝜕𝜕 (𝑇𝑇
𝜕𝜕𝜕𝜕𝜕𝜕𝜕𝜕) = 0 …(4)
Fig. 5: Two rivers vertical slope line.
The parameter e in the equation is the stable vertical osmotic supply rate occurring in the irrigation section, e = 0.0003 m/d for the problem. For the impervious layer cov-ered sections without irrigation and precipitation, the basic equation could be expressed as:
∂∂
∂∂
ÊËÁ
ˆ¯̃
+∂∂
∂∂
ÊËÁ
ˆ¯̃
=x
TH
X yT
H
y0 …(4)
Planar two-dimensional unsteady flow problem: The planar two-dimensional unsteady flow problem has been deduced in the books of engineering groundwater. In terms of the unsteady flow problem, whether it is the unconfined flow or the confined flow, the basic equations could be ex-pressed as:
∂∂
∂∂
ÊËÁ
ˆ¯̃
+∂∂
∂∂
ÊËÁ
ˆ¯̃
+ =∂∂x
TH
x yT
H
yS
H
te …(5)
If the unsteady flow is the unconfined flow, in the Equa-tion (5), T = ch, S = μ, where K is the osmotic coefficient, k = 50; h is the depth of water, h = 80, therefore, T = kh = 4000, μ is the yield of water, μ = 0.17. If the unsteady flow is the confined flow, in the equation, T = kM, S = SS ∙ M, where, K is the osmotic coefficient, SS is the vertical hydraulic conductivity that approximates 0 here, M is the thickness of the aquifer.
For the sections that are covered with impervious layers (or the non-irrigation and non-precipitation sections), the basic equation is:
∂∂
∂∂
ÊËÁ
ˆ¯̃
+∂∂
∂∂
ÊËÁ
ˆ¯̃
=∂∂x
TH
x yT
H
yS
H
t …(6)
The equation for such groundwater problems in engineer-ing belongs to the parabolic partial differential equations. The basic form of the parabolic equation is:
du
tc u au f
∂∂
- —◊ —( ) + = …(7)
The c, a, f, and d in the equation corresponds to equation (6), c = T = 4000, a = 0, f = 0, and d = S = μ = 0.17.
Plane three-dimensional groundwater problem: The groundwater aquiferous system in nature is often a trans-boundary aquifer system that contains various aquitards and aquifers. While pumping water from a certain aquifer, variations would happen to the aquifer and its adjacent aquitards and aquifers. Since the whole system is real and the groundwater flow field is three-dimensional, theoretically, the closest situation to the actual situation is to establish a three-dimensional mathematical model for the multi-layer aquifer system, the aquitards and the aquifers in the three-
1613GROUNDWATER POLLUTION DIFFUSION MODEL
Nature Environment and Pollution Technology • Vol. 18, No. 5 (Special Issue), 2019
dimensional groundwater aquiferous system with the porous medium are generally in alternative layer distribution. The clay with a small osmotic coefficient and the sand with a large osmotic coefficient respectively constitute the aquitard and the aquifer, therefore, the parameters in the vertical direction are mutagenic. Meanwhile, each aquitard and each aquifer simultaneously on the plane is often heterogeneous, hence, the parameters are gradual in the horizontal direction. The PDE toolbox method could be applied to solve three-dimensional groundwater flow problems.
M file for PDE: In terms of the certain practical problems of engineering and scientific fields, it is often necessary to communicate with other finite elements and plotting software to complement the solutions.
The most commonly applied method is to convert each other through DXF files, while the transmission requires graphics. The DXF file is a graphical interactive file. It is a graphical interactive file that can be accepted by software such as MICROSTATION, SSAP, and AUTOCAD. DXF is a writable ASCII format. The M file and DXF file format in PDE are identical. Therefore, if the geometric descriptions of the M file of the partial differential equation is generated and then written into the DXF physical segment, the interface of the M file of the partial differential equation to the DXF file could be formed; through reversing the process, the interface of the DXF file to the M file of the partial differential equation could be formed. In terms of solving the problems by using the graphical user interface of the toolbox software, the M file of the solving processes could be generated by clicking the command “Save As” under the menu File to open the Save As dialogue box, selecting the save path of the file, naming the file such as pmwdl input by the keyboard, and then clicking the “Save” button to generate the file pmwdl.m. M files of such type could be saved and opened through the file menu. The MATLAB function is not an M file of the script type. Such kind of file avoids the use of functions and name conflicts between variables in the main workspace. The name of the file must match the model name so that it can be called by other programs.
CONCLUSION
The paper has mainly introduced the relevant knowledge principles of PDE toolbox and finite element method, as well as applying the graphical user interface (GUI) of PDE toolbox to groundwater. The paper has performed numerical calculations of problems including the planar two-dimension-al steady flow and the planar two-dimensional unsteady flow of groundwater. It can be inferred from the problem-solving
processes and results that the method proposed in the paper is simple and convenient in the application; besides, it also shows great advantages in both calculation accuracy and calculation efficiency. However, the method is also of several deficiencies including the difficulty in storing the solutions, which would in further affect the subsequent calculations. In addition, in the calculation processes of the inverse problems, it is necessary to continuously call the original files and apply the calculated results.
In terms of solving the problem of partial differential equations related to groundwater pollution, in addition to the graphical user interface of MATLAB PDE toolbox soft-ware, the command function in the toolbox software could also be applied to solve the problem by creating an M file that describes the geometry. There are some difficulties in solving specific problems which cannot be solved by using the PDE tool graphical user interface. For example, when the geometric areas are not composed of lines, arcs, elliptical arcs, and the combined graphics of them, in order to solve the problem, only the command function in the toolbox could be applied to perform the numerical calculations, which is much simpler and faster than programming the original program directly.
REFERENCES
Abdelrahman, E.M., Mutanga, O. and Odindi, J. 2017. Estimating Swiss chard foliar macro- and micronutrient concentrations under different irrigation water sources using ground-based hyperspectral data and four partial least squares (PLS)-based (PLS1, PLS2, SPLS1 and SPLS2) regression algorithms. Comput. Electron. Agr., 132: 21-33.
Augeraud-Véron, E., Choquet, C. and Éloïse, Comte. 2017. Optimal control for a groundwater pollution ruled by a convection-diffusion-reaction problem. J. Optimiz. Theory App., 173(3): 941-966.
Bo, D., Lian, X. and Cheng, X. 2018. Partial differential equation modeling with Dirichlet boundary conditions on social networks. Bound. Value Probl., 2018(1): 50.
Kovacic, M., Kopcic, N. and Kusic, H. 2017. Reactivation and reuse of TiO2-SnS2 composite catalyst for solar-driven water treatment. Environ. Sci. Pollut. R., 25(2): 1-14.
Martelloni, G., Bagnoli, F. and Guarino, A. 2017. A 3D model for rain-in-duced landslides based on molecular dynamics with fractal and frac-tional water diffusion. Commun. Nonlinear Sci., 50: 311-329.
Meng, X.Y., Che, L. and Liu, Z.H. 2017. Towards a partial differential equation remote sensing image method based on adaptive degradation diffusion parameter. Multimed. Tools Appl., 76(17): 17651-17667.
Nnolim, U.A. 2017. Improved partial differential equation-based enhance-ment for underwater images using local-global contrast operators and fuzzy homomorphic processes. IET Image Processing, 11(11): 1059-1067.
Wang, D. and Gao, J. 2017. An improved noise removal model based on nonlinear fourth-order partial differential equations. Int. J. Comput. Appl., 93(6): 942-954.
Wei, F., Geritz, S.A.H. and Cai, J.A. 2017. Stochastic single-species popu-lation model with partial pollution tolerance in a polluted environment. Appl. Math Lett., 63: 130-136.

Vol. 18, No. 5 (Special Issue), 2019 • Nature Environment and Pollution Technology
1614

Research on Underground Sewage Monitoring System Based on Intelligent Algorithm
Hongxin WangPuyang Institute of Engineering, Henan University, Puyang Henan 457000, China
ABSTRACT
Using 4G network intelligence as the data transmission channel of field and monitoring centre, a sewage treatment monitoring system with simple structure, stable performance, fast transmission rate and high accuracy is established. In this paper, USR-G780 DTU is selected as the transceiver of network equipment. PLC was initialized through ladder diagram programming, and information such as water quality parameters in sewage treatment and online operation status of each equipment was transmitted to the monitoring centre, and remote connection between S7-1200 and the monitoring centre was completed. In addition, Modbus RTU communication protocol is used to complete the communication between the field PLC and the slave station, as well as TCP/IP to complete the data network transmission, and finally complete the design of the whole communication process. The experiment proves that the data based on 4G intelligence is more accurate, the transmission efficiency is greatly improved, and the feasibility, accuracy and security of the system design scheme are also verified.
INTRODUCTION
As a wireless data transmission link, 4G network transmits the detection data from each sewage treatment plant site in villages and towns to the monitoring centre for real-time monitoring and strengthening the supervision (Samkaria et al. 2018). The original sewage treatment control system is mainly used for the control of related pumps and valves in the drainage buffer pool, aeration pool, lifting pump room and clearing pool. In order to strengthen the monitoring of ef-fluent quality, the environmental protection bureau increased the detection of COD value, BOD value, NH3N, dissolved oxygen content and other related data of inlet and outlet water (Song et al. 2017). Due to the limited economic conditions of villages and towns, most of the sewage treatment plant sites are in remote locations, the terrain is complex and the manual field operation is difficult. The original wired mode is adopted to arrange the wiring of the new equipment, which extends the construction cycle and construction cost of the system to a certain extent.
Therefore, the research and design of remote monitoring system based on 4G intelligent technology not only solves the access problem of new equipment in sewage treatment stations, but also speeds up the efficient transmission of data.
The innovation of this paper is that the traditional sewage treatment monitoring system is optimized to wireless remote monitoring by integrating communication technology, com-puter technology and power electronic technology on the basis of not changing the traditional original monitoring
equipment, which reduces the cost, simplifies the control strategy reasonably and makes the remote area sewage monitoring possible.
PAST STUDIES
A study developed the intelligent distribution network remote monitoring system on the basis of 4G network, which ensures the reliability of power supply and improves the automation level of distribution network system information (Cao et al. 2017). In order to avoid disputes arising from law enforce-ment in some key urban areas, Rong et al. (2017) proposed a remote on-board monitoring system under 4G network, which improved the efficiency and management of law enforcement. In order to better manage vehicle information, Li & Kai (2018) used the advantages of 4G network to put forward a wireless vehicle monitoring system to lock vehicle location information and realize the process of real-time information transmission to the remote server. Through scien-tific and technological progress, the monitoring system based on 4G intelligent technology has been constantly improved and has been applied in different fields.
Design of Remote Monitoring System for Sewage Treatment
Remote monitoring system structure of sewage treatment: The traditional sewage treatment monitoring system realizes the effective connection between the monitoring centre and the field control layer through laying cable, which is mainly
Nat. Env. & Poll. Tech.Website: www.neptjournal.com
Received: 05-08-2019Accepted: 03-10-2019
Key Words:4G network intelligence Underground sewageMonitoring systemWater quality parameters
2019pp. 1615-1620 Vol. 18
p-ISSN: 0972-6268 No. 5 (Special Issue)
Nature Environment and Pollution Technology An International Quarterly Scientific Journal
Original Research Paper
e-ISSN: 2395-3454
Open Access
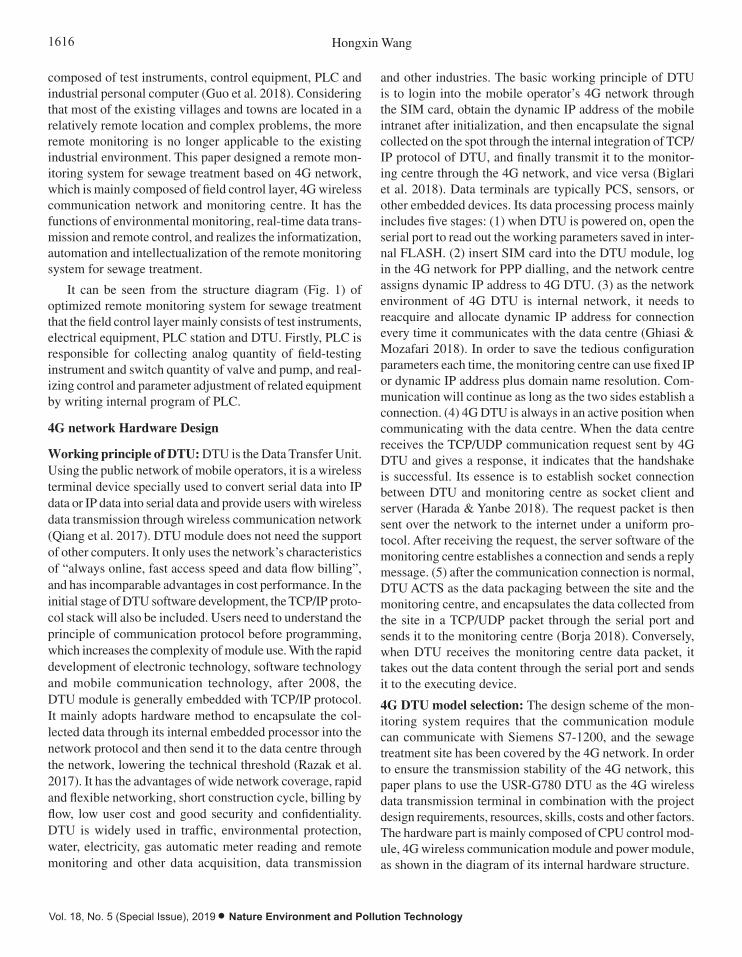
1616 Hongxin Wang
Vol. 18, No. 5 (Special Issue), 2019 • Nature Environment and Pollution Technology
composed of test instruments, control equipment, PLC and industrial personal computer (Guo et al. 2018). Considering that most of the existing villages and towns are located in a relatively remote location and complex problems, the more remote monitoring is no longer applicable to the existing industrial environment. This paper designed a remote mon-itoring system for sewage treatment based on 4G network, which is mainly composed of field control layer, 4G wireless communication network and monitoring centre. It has the functions of environmental monitoring, real-time data trans-mission and remote control, and realizes the informatization, automation and intellectualization of the remote monitoring system for sewage treatment.
It can be seen from the structure diagram (Fig. 1) of optimized remote monitoring system for sewage treatment that the field control layer mainly consists of test instruments, electrical equipment, PLC station and DTU. Firstly, PLC is responsible for collecting analog quantity of field-testing instrument and switch quantity of valve and pump, and real-izing control and parameter adjustment of related equipment by writing internal program of PLC.
4G network Hardware Design
Working principle of DTU: DTU is the Data Transfer Unit. Using the public network of mobile operators, it is a wireless terminal device specially used to convert serial data into IP data or IP data into serial data and provide users with wireless data transmission through wireless communication network (Qiang et al. 2017). DTU module does not need the support of other computers. It only uses the network’s characteristics of “always online, fast access speed and data flow billing”, and has incomparable advantages in cost performance. In the initial stage of DTU software development, the TCP/IP proto-col stack will also be included. Users need to understand the principle of communication protocol before programming, which increases the complexity of module use. With the rapid development of electronic technology, software technology and mobile communication technology, after 2008, the DTU module is generally embedded with TCP/IP protocol. It mainly adopts hardware method to encapsulate the col-lected data through its internal embedded processor into the network protocol and then send it to the data centre through the network, lowering the technical threshold (Razak et al. 2017). It has the advantages of wide network coverage, rapid and flexible networking, short construction cycle, billing by flow, low user cost and good security and confidentiality. DTU is widely used in traffic, environmental protection, water, electricity, gas automatic meter reading and remote monitoring and other data acquisition, data transmission
and other industries. The basic working principle of DTU is to login into the mobile operator’s 4G network through the SIM card, obtain the dynamic IP address of the mobile intranet after initialization, and then encapsulate the signal collected on the spot through the internal integration of TCP/IP protocol of DTU, and finally transmit it to the monitor-ing centre through the 4G network, and vice versa (Biglari et al. 2018). Data terminals are typically PCS, sensors, or other embedded devices. Its data processing process mainly includes five stages: (1) when DTU is powered on, open the serial port to read out the working parameters saved in inter-nal FLASH. (2) insert SIM card into the DTU module, log in the 4G network for PPP dialling, and the network centre assigns dynamic IP address to 4G DTU. (3) as the network environment of 4G DTU is internal network, it needs to reacquire and allocate dynamic IP address for connection every time it communicates with the data centre (Ghiasi & Mozafari 2018). In order to save the tedious configuration parameters each time, the monitoring centre can use fixed IP or dynamic IP address plus domain name resolution. Com-munication will continue as long as the two sides establish a connection. (4) 4G DTU is always in an active position when communicating with the data centre. When the data centre receives the TCP/UDP communication request sent by 4G DTU and gives a response, it indicates that the handshake is successful. Its essence is to establish socket connection between DTU and monitoring centre as socket client and server (Harada & Yanbe 2018). The request packet is then sent over the network to the internet under a uniform pro-tocol. After receiving the request, the server software of the monitoring centre establishes a connection and sends a reply message. (5) after the communication connection is normal, DTU ACTS as the data packaging between the site and the monitoring centre, and encapsulates the data collected from the site in a TCP/UDP packet through the serial port and sends it to the monitoring centre (Borja 2018). Conversely, when DTU receives the monitoring centre data packet, it takes out the data content through the serial port and sends it to the executing device.
4G DTU model selection: The design scheme of the mon-itoring system requires that the communication module can communicate with Siemens S7-1200, and the sewage treatment site has been covered by the 4G network. In order to ensure the transmission stability of the 4G network, this paper plans to use the USR-G780 DTU as the 4G wireless data transmission terminal in combination with the project design requirements, resources, skills, costs and other factors. The hardware part is mainly composed of CPU control mod-ule, 4G wireless communication module and power module, as shown in the diagram of its internal hardware structure.
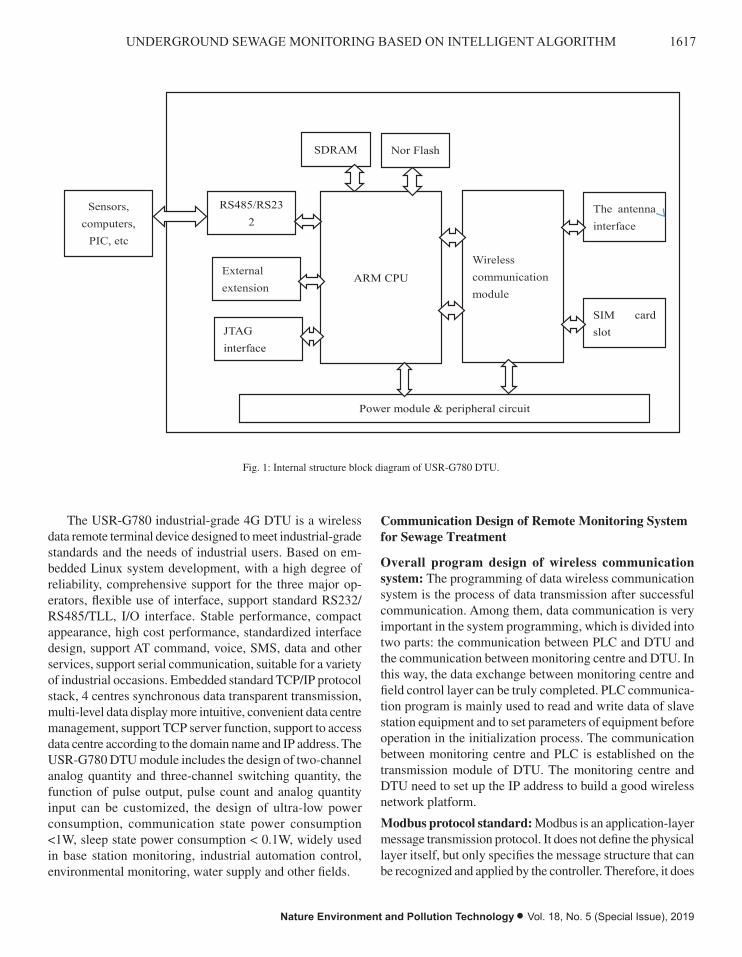
1617UNDERGROUND SEWAGE MONITORING BASED ON INTELLIGENT ALGORITHM
Nature Environment and Pollution Technology • Vol. 18, No. 5 (Special Issue), 2019
Fig. 1: Internal structure block diagram of USR-G780 DTU.
The USR-G780 industrial-grade 4G DTU is a wireless data remote terminal device designed to
meet industrial-grade standards and the needs of industrial users. Based on embedded Linux system
development, with a high degree of reliability, comprehensive support for the three major operators,
flexible use of interface, support standard RS232/RS485/TLL, I/O interface. Stable performance,
compact appearance, high cost performance, standardized interface design, support AT command, voice,
SMS, data and other services, support serial communication, suitable for a variety of industrial occasions.
Embedded standard TCP/IP protocol stack, 4 centres synchronous data transparent transmission, multi-
level data display more intuitive, convenient data centre management, support TCP server function,
support to access data centre according to the domain name and IP address. The USR-G780 DTU module
includes the design of two-channel analog quantity and three-channel switching quantity, the function of
pulse output, pulse count and analog quantity input can be customized, the design of ultra-low power
consumption, communication state power consumption <1W, sleep state power consumption < 0.1W,
widely used in base station monitoring, industrial automation control, environmental monitoring, water
supply and other fields.
Communication design of remote monitoring system for sewage treatment:
Overall program design of wireless communication system: The programming of data wireless
communication system is the process of data transmission after successful communication. Among them,
data communication is very important in the system programming, which is divided into two parts: the
communication between PLC and DTU and the communication between monitoring centre and DTU. In
Sensors, computers,
PIC, etc
RS485/RS232
External extension
JTAG interface
ARM CPU
Wireless communication module
The antenna interface
SIM card slot
Power module & peripheral circuit
SDRAM Nor Flash
Fig. 1: Internal structure block diagram of USR-G780 DTU.
The USR-G780 industrial-grade 4G DTU is a wireless data remote terminal device designed to meet industrial-grade standards and the needs of industrial users. Based on em-bedded Linux system development, with a high degree of reliability, comprehensive support for the three major op-erators, flexible use of interface, support standard RS232/RS485/TLL, I/O interface. Stable performance, compact appearance, high cost performance, standardized interface design, support AT command, voice, SMS, data and other services, support serial communication, suitable for a variety of industrial occasions. Embedded standard TCP/IP protocol stack, 4 centres synchronous data transparent transmission, multi-level data display more intuitive, convenient data centre management, support TCP server function, support to access data centre according to the domain name and IP address. The USR-G780 DTU module includes the design of two-channel analog quantity and three-channel switching quantity, the function of pulse output, pulse count and analog quantity input can be customized, the design of ultra-low power consumption, communication state power consumption <1W, sleep state power consumption < 0.1W, widely used in base station monitoring, industrial automation control, environmental monitoring, water supply and other fields.
Communication Design of Remote Monitoring System for Sewage Treatment
Overall program design of wireless communication system: The programming of data wireless communication system is the process of data transmission after successful communication. Among them, data communication is very important in the system programming, which is divided into two parts: the communication between PLC and DTU and the communication between monitoring centre and DTU. In this way, the data exchange between monitoring centre and field control layer can be truly completed. PLC communica-tion program is mainly used to read and write data of slave station equipment and to set parameters of equipment before operation in the initialization process. The communication between monitoring centre and PLC is established on the transmission module of DTU. The monitoring centre and DTU need to set up the IP address to build a good wireless network platform.
Modbus protocol standard: Modbus is an application-layer message transmission protocol. It does not define the physical layer itself, but only specifies the message structure that can be recognized and applied by the controller. Therefore, it does
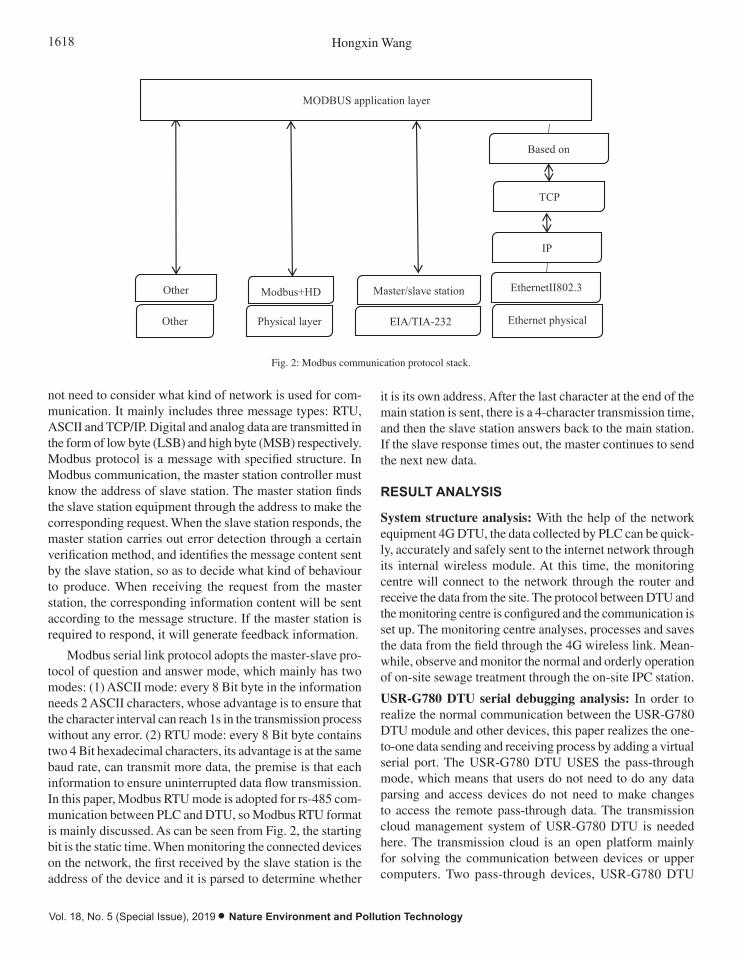
1618 Hongxin Wang
Vol. 18, No. 5 (Special Issue), 2019 • Nature Environment and Pollution Technology
this way, the data exchange between monitoring centre and field control layer can be truly completed.
PLC communication program is mainly used to read and write data of slave station equipment and to set
parameters of equipment before operation in the initialization process. The communication between
monitoring centre and PLC is established on the transmission module of DTU. The monitoring centre
and DTU need to set up the IP address to build a good wireless network platform.
Modbus protocol standard: Modbus is an application-layer message transmission protocol. It does not
define the physical layer itself, but only specifies the message structure that can be recognized and
applied by the controller. Therefore, it does not need to consider what kind of network is used for
communication. It mainly includes three message types: RTU, ASCII and TCP/IP. Digital and analog
data are transmitted in the form of low byte (LSB) and high byte (MSB) respectively. Modbus protocol
is a message with specified structure. In Modbus communication, the master station controller must know
the address of slave station. The master station finds the slave station equipment through the address to
make the corresponding request. When the slave station responds, the master station carries out error
detection through a certain verification method, and identifies the message content sent by the slave
station, so as to decide what kind of behaviour to produce. When receiving the request from the master
station, the corresponding information content will be sent according to the message structure. If the
master station is required to respond, it will generate feedback information.
Fig. 2: Modbus communication protocol stack.
Modbus serial link protocol adopts the master-slave protocol of question and answer mode, which
mainly has two modes: ASCII mode: every 8 Bit byte in the information needs 2 ASCII characters,
whose advantage is to ensure that the character interval can reach 1s in the transmission process without
any error. RTU mode: every 8 Bit byte contains two 4 Bit hexadecimal characters, its advantage is at
the same baud rate, can transmit more data, the premise is that each information to ensure uninterrupted
data flow transmission. In this paper, Modbus RTU mode is adopted for rs-485 communication between
MODBUS application layer
Other
Other
Modbus+HD
Physical layer
Master/slave station
EIA/TIA-232
EthernetII802.3
Ethernet physical layer
Based on Modbus
TCP
IP
Fig. 2: Modbus communication protocol stack.
not need to consider what kind of network is used for com-munication. It mainly includes three message types: RTU, ASCII and TCP/IP. Digital and analog data are transmitted in the form of low byte (LSB) and high byte (MSB) respectively. Modbus protocol is a message with specified structure. In Modbus communication, the master station controller must know the address of slave station. The master station finds the slave station equipment through the address to make the corresponding request. When the slave station responds, the master station carries out error detection through a certain verification method, and identifies the message content sent by the slave station, so as to decide what kind of behaviour to produce. When receiving the request from the master station, the corresponding information content will be sent according to the message structure. If the master station is required to respond, it will generate feedback information.
Modbus serial link protocol adopts the master-slave pro-tocol of question and answer mode, which mainly has two modes: (1) ASCII mode: every 8 Bit byte in the information needs 2 ASCII characters, whose advantage is to ensure that the character interval can reach 1s in the transmission process without any error. (2) RTU mode: every 8 Bit byte contains two 4 Bit hexadecimal characters, its advantage is at the same baud rate, can transmit more data, the premise is that each information to ensure uninterrupted data flow transmission. In this paper, Modbus RTU mode is adopted for rs-485 com-munication between PLC and DTU, so Modbus RTU format is mainly discussed. As can be seen from Fig. 2, the starting bit is the static time. When monitoring the connected devices on the network, the first received by the slave station is the address of the device and it is parsed to determine whether
it is its own address. After the last character at the end of the main station is sent, there is a 4-character transmission time, and then the slave station answers back to the main station. If the slave response times out, the master continues to send the next new data.
RESULT ANALYSIS
System structure analysis: With the help of the network equipment 4G DTU, the data collected by PLC can be quick-ly, accurately and safely sent to the internet network through its internal wireless module. At this time, the monitoring centre will connect to the network through the router and receive the data from the site. The protocol between DTU and the monitoring centre is configured and the communication is set up. The monitoring centre analyses, processes and saves the data from the field through the 4G wireless link. Mean-while, observe and monitor the normal and orderly operation of on-site sewage treatment through the on-site IPC station.
USR-G780 DTU serial debugging analysis: In order to realize the normal communication between the USR-G780 DTU module and other devices, this paper realizes the one-to-one data sending and receiving process by adding a virtual serial port. The USR-G780 DTU USES the pass-through mode, which means that users do not need to do any data parsing and access devices do not need to make changes to access the remote pass-through data. The transmission cloud management system of USR-G780 DTU is needed here. The transmission cloud is an open platform mainly for solving the communication between devices or upper computers. Two pass-through devices, USR-G780 DTU
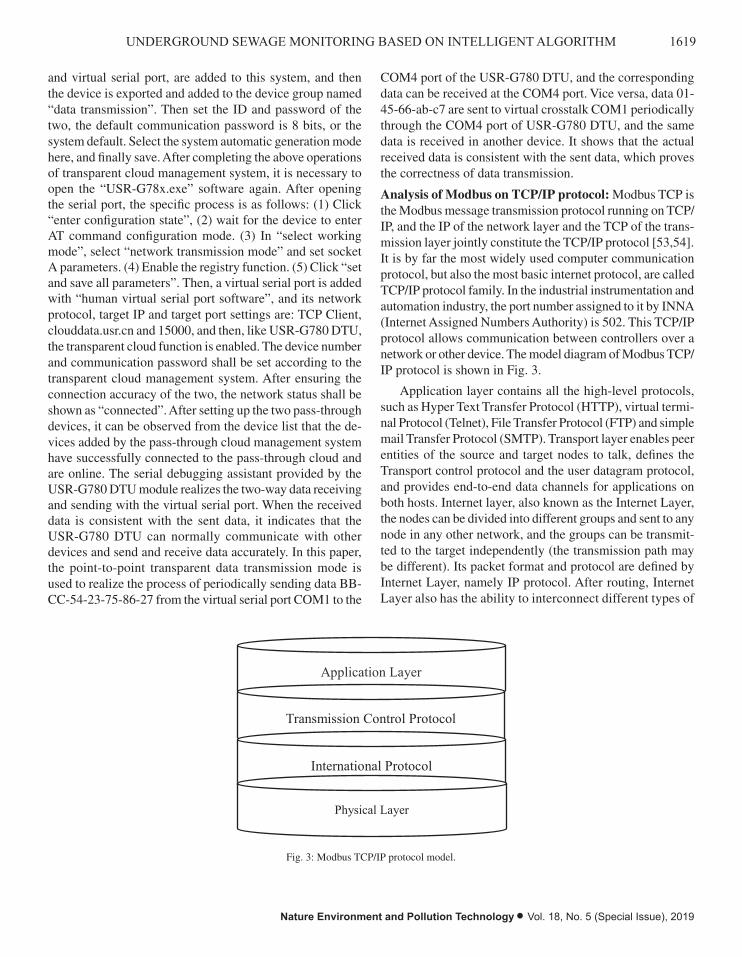
1619UNDERGROUND SEWAGE MONITORING BASED ON INTELLIGENT ALGORITHM
Nature Environment and Pollution Technology • Vol. 18, No. 5 (Special Issue), 2019
and virtual serial port, are added to this system, and then the device is exported and added to the device group named “data transmission”. Then set the ID and password of the two, the default communication password is 8 bits, or the system default. Select the system automatic generation mode here, and finally save. After completing the above operations of transparent cloud management system, it is necessary to open the “USR-G78x.exe” software again. After opening the serial port, the specific process is as follows: (1) Click “enter configuration state”, (2) wait for the device to enter AT command configuration mode. (3) In “select working mode”, select “network transmission mode” and set socket A parameters. (4) Enable the registry function. (5) Click “set and save all parameters”. Then, a virtual serial port is added with “human virtual serial port software”, and its network protocol, target IP and target port settings are: TCP Client, clouddata.usr.cn and 15000, and then, like USR-G780 DTU, the transparent cloud function is enabled. The device number and communication password shall be set according to the transparent cloud management system. After ensuring the connection accuracy of the two, the network status shall be shown as “connected”. After setting up the two pass-through devices, it can be observed from the device list that the de-vices added by the pass-through cloud management system have successfully connected to the pass-through cloud and are online. The serial debugging assistant provided by the USR-G780 DTU module realizes the two-way data receiving and sending with the virtual serial port. When the received data is consistent with the sent data, it indicates that the USR-G780 DTU can normally communicate with other devices and send and receive data accurately. In this paper, the point-to-point transparent data transmission mode is used to realize the process of periodically sending data BB-CC-54-23-75-86-27 from the virtual serial port COM1 to the
COM4 port of the USR-G780 DTU, and the corresponding data can be received at the COM4 port. Vice versa, data 01-45-66-ab-c7 are sent to virtual crosstalk COM1 periodically through the COM4 port of USR-G780 DTU, and the same data is received in another device. It shows that the actual received data is consistent with the sent data, which proves the correctness of data transmission.
Analysis of Modbus on TCP/IP protocol: Modbus TCP is the Modbus message transmission protocol running on TCP/IP, and the IP of the network layer and the TCP of the trans-mission layer jointly constitute the TCP/IP protocol [53,54]. It is by far the most widely used computer communication protocol, but also the most basic internet protocol, are called TCP/IP protocol family. In the industrial instrumentation and automation industry, the port number assigned to it by INNA (Internet Assigned Numbers Authority) is 502. This TCP/IP protocol allows communication between controllers over a network or other device. The model diagram of Modbus TCP/IP protocol is shown in Fig. 3.
Application layer contains all the high-level protocols, such as Hyper Text Transfer Protocol (HTTP), virtual termi-nal Protocol (Telnet), File Transfer Protocol (FTP) and simple mail Transfer Protocol (SMTP). Transport layer enables peer entities of the source and target nodes to talk, defines the Transport control protocol and the user datagram protocol, and provides end-to-end data channels for applications on both hosts. Internet layer, also known as the Internet Layer, the nodes can be divided into different groups and sent to any node in any other network, and the groups can be transmit-ted to the target independently (the transmission path may be different). Its packet format and protocol are defined by Internet Layer, namely IP protocol. After routing, Internet Layer also has the ability to interconnect different types of
from the virtual serial port COM1 to the COM4 port of the USR-G780 DTU, and the corresponding data
can be received at the COM4 port. Vice versa, data 01-45-66-ab-c7 are sent to virtual crosstalk COM1
periodically through the COM4 port of USR-G780 DTU, and the same data is received in another device.
It shows that the actual received data is consistent with the sent data, which proves the correctness of
data transmission.
Analysis of Modbus on TCP/IP protocol: Modbus TCP is the Modbus message transmission protocol
running on TCP/IP, and the IP of the network layer and the TCP of the transmission layer jointly
constitute the TCP/IP protocol [53,54]. It is by far the most widely used computer communication
protocol, but also the most basic internet protocol, are called TCP/IP protocol family. In the industrial
instrumentation and automation industry, the port number assigned to it by INNA (Internet Assigned
Numbers Authority) is 502. This TCP/IP protocol allows communication between controllers over a
network or other device. The model diagram of Modbus TCP/IP protocol is shown in Fig. 3.
Fig. 3: Modbus TCP/IP protocol model.
Application layer contains all the high-level protocols, such as Hyper Text Transfer Protocol (HTTP),
virtual terminal Protocol (Telnet), File Transfer Protocol (FTP) and simple mail Transfer Protocol
(SMTP). Transport layer enables peer entities of the source and target nodes to talk, defines the Transport
control protocol and the user datagram protocol, and provides end-to-end data channels for applications
on both hosts. Internet layer, also known as the Internet Layer, the nodes can be divided into different
groups and sent to any node in any other network, and the groups can be transmitted to the target
independently (the transmission path may be different). Its packet format and protocol are defined by
Internet Layer, namely IP protocol. After routing, Internet Layer also has the ability to interconnect
different types of networks and congestion control. Compared with Modbus serial link protocol, Modbus
TCP/IP applies a special packet header called MBAP packet header to TCP/IP. Because of the existence
of this header, Modbus format data is divided into multiple packets for transmission over TCP, and the
receiver can also recognize the packet boundary. TCP/IP is used in 93% of the global network, which has
become the DE facto standard in the data information industry. As long as Modbus TCP is implemented
in the application layer, data exchange of industrial Ethernet can be achieved.
CONCLUSION
This paper, based on the remote monitoring system of 4G intelligent network, realizes the real-time
monitoring of sewage treatment, avoids the problem of wired line laying, and studies the remote
Application Layer
Transmission Control Protocol
International Protocol
Physical Layer
Fig. 3: Modbus TCP/IP protocol model.

1620 Hongxin Wang
Vol. 18, No. 5 (Special Issue), 2019 • Nature Environment and Pollution Technology
networks and congestion control. Compared with Modbus serial link protocol, Modbus TCP/IP applies a special packet header called MBAP packet header to TCP/IP. Because of the existence of this header, Modbus format data is divided into multiple packets for transmission over TCP, and the receiver can also recognize the packet boundary. TCP/IP is used in 93% of the global network, which has become the DE facto standard in the data information industry. As long as Modbus TCP is implemented in the application layer, data exchange of industrial Ethernet can be achieved.
CONCLUSION
This paper, based on the remote monitoring system of 4G intelligent network, realizes the real-time monitoring of sew-age treatment, avoids the problem of wired line laying, and studies the remote monitoring system with the combination of practical projects and related technologies, and introduc-es the importance of wireless communication technology in remote monitoring of sewage treatment. The system is stable, safe and reliable to complete the data transmission at the remote end, which greatly reduces the construction cost and has better system compatibility, and effectively over-comes various problems encountered in the late expansion. In the future, the technology will be more mature, and the detection of underground sewage will be more convenient, which will also be better for the detection and distribution of underground sewage.
REFERENCES
Biglari, H., Saeidi, M., Karimyan, K., Narooie, M. R. and Sharafi, H. 2018. Data for factor analysis of hydro-geochemical characteristics of ground-water resources in Iranshahr. Data in Brief, 19: S2352340918305456.
Borja, A. 2018. Testing the efficiency of a bacterial community-based index (Microgambi) to assess distinct impact sources in six locations around the world. Ecological Indicators, 85: 594-602.
Cao, J., Wang, T., Shang, L., Lai, X., Vong, C. M. and Chen, B. 2017. An intelligent propagation distance estimation algorithm based on fundamental frequency energy distribution for periodic vibration localization. J. Franklin Inst., S0016003217300728.
Ghiasi, V. and Mozafari, V. 2018. Seismic response of buried pipes to micro tunnelling method under earthquake loads. Soil Dynamics and Earthquake Engineering, 113: 193-201.
Guo, J., Du, J. and Xu, D. 2018. Navigation and positioning system applied in underground driverless vehicle based on IMU. In: 2018 International Conference on Robots and Intelligent System (ICRIS).
Harada, S. and Yanbe, M. 2018. Adsorption by and artificial release of zinc and lead from porous concrete for recycling of adsorbed zinc and lead and of porous concrete to reduce urban non-point heavy metal runoff. Chemosphere, 197: 451-456.
Li, J. and Kai, Z. 2018. Intelligent mining technology for an underground metal mine based on unmanned equipment. Engineering, 4(3): S2095809917307853.
Qiang, W. U., Jun, S. J., Yang, W. and Beijing, T. 2017. Mining techniques and engineering application for “coal-water” dual-resources mine. Jour-nal of China Coal Society.
Razak, A. A. A., Abdullah, A. H., Kamarudin, K., Saad, F. S. A., Shukor, S. A. and Mustafa, H. 2017. Mobile robot structure design, modelling and simulation for confined space application. In: 2016 2nd IEEE International Symposium on Robotics and Manufacturing Automation (ROMA), pp. 1-5.
Rong, L., Wang, J., Wang, T., Cao, J. and Zeng, H. 2017. An intelligent distance estimation algorithm based on attenuation property of acoustic signal for excavation devices localization. In: 2017 International Sym-posium on Intelligent Signal Processing and Communication Systems (ISPACS), pp. 114-119.
Samkaria, R., Singh, R., Gehlot, A., Yadav, M. S., Kumar, A. and Choud-hary, V. 2018. Embedded-based smart solar grid of 2 × 2 monitoring system using smart sensors. In: Intelligent Communication, Control and Devices, pp. 1777-1788. Springer, Singapore.
Song, M., Zhou, H., Liang, S., Liu, J., Cai, J. and Feng, W. 2017. Research on performance and microstructure of sewage pipe mortar strengthened with different anti-corrosion technologies. In: IOP Conference Series: Materials Science and Engineering, 250(1): 012036.
Research on Integrated Technology of Desulphurization, Denitration and Waste Heat Recovery of Coke Oven Flue Gas
Haiying Zhang* and Ahmed Jalal Khan Chowdhury***China University of Petroleum, Shandong, China**Department of Marine Science, Kulliyyah of Science, International Islamic University, Malaysia
ABSTRACT
The main pollution components of coke oven flue gas are SO2 and NOx. The SO2 and NOx not only harm human health, but also cause serious environmental pollution. Combined with the new type of denitration catalyst, magnesium flue gas desulphurization process and radial heat pipe waste, heat boiler and other core patented technologies, this paper creatively put forward the integrated technology of coke oven flue gas desulphurization, denitration, and waste heat recovery and utilization. This method can fundamentally solve the problems of environmental pollution caused by coke oven flue gas emission and waste heat recovery and utilization in China. The denitration efficiency is always stable above 98%, which reflects the super-high denitration efficiency of catalyst. It not only has the remarkable economic efficiency, but also has huge social efficiency.
INTRODUCTION
SO2, NOx, belongs to the main pollutant indexes in the coke oven flue gas. These kind of components will not only endanger human body health, but to create a resource-con-serving and environment-friendly society in our country will also be affected by certain negative influence; and in order to minimize these negative effects, in this paper, the integration of coke oven flue gas desulphurization and deni-tration waste heat recycling technology is studied (Tang et al. 2017). Coking plant is specialized in metallurgical coke production and metallurgical coking products processing and recovery of professional factories. Among them, the mature magnesium oxide desulphurization technology is a kind of desulphurization technology second only to the calcium process in terms of maturity. The magnesium oxide desulphurization technology has been widely applied all over the world, among which more than 100 projects have been applied in Japan, and 95% of power stations in Taiwan use magnesium oxide (Wang et al. 2017). Abundant sources of raw materials in China’s magnesium oxide reserves are very considerable, the amount of proven magnesium oxide reserves is about 16 billion-ton, accounting for about 80% of the world. Its resources are mainly distributed in Liaoning, Shandong, Sichuan, Hebei and other provinces, of which Liaoning accounts for 84.7%. Coke oven flue gas is mainly the waste gas produced after combustion of coke oven gas, and its main components include SO2 and NOx. In China, sulphur dioxide and nitrogen oxide are the main pollutants in
the atmosphere, and they are important indicators to measure whether the atmosphere is polluted (Li et al. 2016).
The innovation of this paper lies in the integration and innovation of new denitrification catalyst, magnesium flue gas desulphurization process, radial heat pipe waste heat boiler and other core patented technologies and puts forward the solutions for coke oven flue gas desulphurization, deni-trification and waste heat recovery and utilization.
PAST RESEARCH
The harm of SO2 and NOx in the atmosphere of some towns discovered by Wei et al. (2016) is common and very serious. In June 2012, the ministry of environmental protection and the state administration for quality supervision, inspection and quarantine jointly issued the GB16171-2012 “coking chemical industry pollutant emission standard”, which clear-ly stipulated the atmospheric pollutant emission standard for coking industry. A study found that Sinosteel Anshan Ther-mal Energy Research Institute Co. Ltd. and technicians from the Chinese Academy of Sciences integrated low-temperature SCR flue gas denitrification technology, magnesium flue gas desulphurization process and radial heat pipe waste heat boiler and other proprietary core technologies, and proposed a comprehensive solution for coke oven flue gas desulphuri-zation, denitrification and waste heat recovery (Gamrat et al. 2017). A steel thermal energy research institute, investigated the development of waste heat recovery of coke oven flue
Nat. Env. & Poll. Tech.Website: www.neptjournal.com
Received: 26-08-2019Accepted: 25-10-2019
Key Words:Coke oven flue gasDesulphurizationDenitrationHeat recoveryIntegrated technology
2019pp. 1621-1625 Vol. 18
p-ISSN: 0972-6268 No. 5 (Special Issue)
Nature Environment and Pollution Technology An International Quarterly Scientific Journal
Original Research Paper
e-ISSN: 2395-3454
Open Access
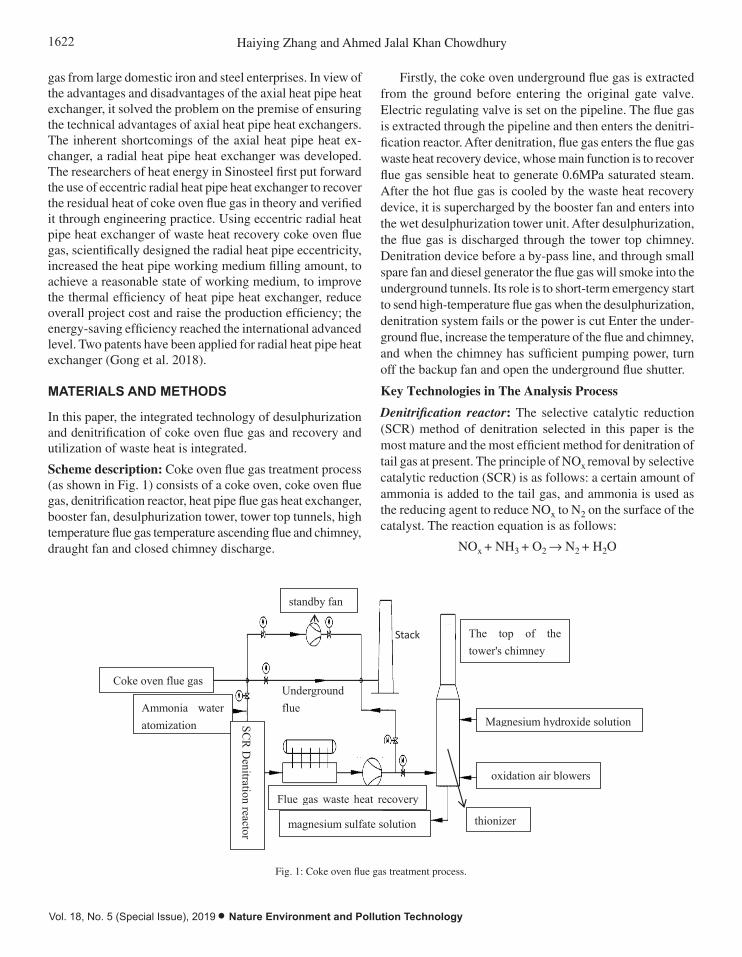
1622 Haiying Zhang and Ahmed Jalal Khan Chowdhury
Vol. 18, No. 5 (Special Issue), 2019 • Nature Environment and Pollution Technology
gas from large domestic iron and steel enterprises. In view of the advantages and disadvantages of the axial heat pipe heat exchanger, it solved the problem on the premise of ensuring the technical advantages of axial heat pipe heat exchangers. The inherent shortcomings of the axial heat pipe heat ex-changer, a radial heat pipe heat exchanger was developed. The researchers of heat energy in Sinosteel first put forward the use of eccentric radial heat pipe heat exchanger to recover the residual heat of coke oven flue gas in theory and verified it through engineering practice. Using eccentric radial heat pipe heat exchanger of waste heat recovery coke oven flue gas, scientifically designed the radial heat pipe eccentricity, increased the heat pipe working medium filling amount, to achieve a reasonable state of working medium, to improve the thermal efficiency of heat pipe heat exchanger, reduce overall project cost and raise the production efficiency; the energy-saving efficiency reached the international advanced level. Two patents have been applied for radial heat pipe heat exchanger (Gong et al. 2018).
MATERIALS AND METHODS
In this paper, the integrated technology of desulphurization and denitrification of coke oven flue gas and recovery and utilization of waste heat is integrated.
Scheme description: Coke oven flue gas treatment process (as shown in Fig. 1) consists of a coke oven, coke oven flue gas, denitrification reactor, heat pipe flue gas heat exchanger, booster fan, desulphurization tower, tower top tunnels, high temperature flue gas temperature ascending flue and chimney, draught fan and closed chimney discharge.
Firstly, the coke oven underground flue gas is extracted from the ground before entering the original gate valve. Electric regulating valve is set on the pipeline. The flue gas is extracted through the pipeline and then enters the denitri-fication reactor. After denitration, flue gas enters the flue gas waste heat recovery device, whose main function is to recover flue gas sensible heat to generate 0.6MPa saturated steam. After the hot flue gas is cooled by the waste heat recovery device, it is supercharged by the booster fan and enters into the wet desulphurization tower unit. After desulphurization, the flue gas is discharged through the tower top chimney. Denitration device before a by-pass line, and through small spare fan and diesel generator the flue gas will smoke into the underground tunnels. Its role is to short-term emergency start to send high-temperature flue gas when the desulphurization, denitration system fails or the power is cut Enter the under-ground flue, increase the temperature of the flue and chimney, and when the chimney has sufficient pumping power, turn off the backup fan and open the underground flue shutter.
Key Technologies in The Analysis Process
Denitrification reactor: The selective catalytic reduction (SCR) method of denitration selected in this paper is the most mature and the most efficient method for denitration of tail gas at present. The principle of NOx removal by selective catalytic reduction (SCR) is as follows: a certain amount of ammonia is added to the tail gas, and ammonia is used as the reducing agent to reduce NOx to N2 on the surface of the catalyst. The reaction equation is as follows:
NOx + NH3 + O2 Æ N2 + H2O
tower, tower top tunnels, high temperature flue gas temperature ascending flue and chimney, draught fan and closed chimney discharge.
Firstly, the coke oven underground flue gas is extracted from the ground before entering the original
gate valve. Electric regulating valve is set on the pipeline. The flue gas is extracted through the pipeline
and then enters the denitrification reactor. After denitration, flue gas enters the flue gas waste heat
recovery device, whose main function is to recover flue gas sensible heat to generate 0.6MPa saturated
steam. After the hot flue gas is cooled by the waste heat recovery device, it is supercharged by the booster
fan and enters into the wet desulfurization tower unit. After desulfurization, the flue gas is discharged
through the tower top chimney. Denitration device before a by-pass line, and through small spare fan and
diesel generator the flue gas will smoke into the underground tunnels. Its role is to short-term emergency
start to send high-temperature flue gas when the desulfurization, denitration system fails or the power is
cut Enter the underground flue, increase the temperature of the flue and chimney, and when the chimney
has sufficient pumping power, turn off the backup fan and open the underground flue shutter.
oxidation air blowers
Figure 1 process flow chart
Fig. 1: Coke oven flue gas treatment process.
Key technologies in the analysis process
Denitrification Reactor: The selective catalytic reduction (SCR) method of denitration selected in this
paper is the most mature and the most efficient method for denitration of tail gas at present. The principle
of NOx removal by selective catalytic reduction (SCR) is as follows: a certain amount of ammonia is
added to the tail gas, and ammonia is used as the reducing agent to reduce NOx to N2 on the surface of
the catalyst. The reaction equation is as follows:
NOx+NH3+O2→N2+H2O
(1) Ammonia Source
In the denitrification reaction, ammonia source uses liquid ammonia or steam ammonia section to
produce concentrated ammonia water with a concentration of 20%, which is introduced into the
Coke oven flue gas
Ammonia water atomization SCR
Denitration reactor
Flue gas waste heat recovery device
magnesium sulfate solution
standby fan
Underground flue
Stack
The top of the tower's chimney
Magnesium hydroxide solution
oxidation air blowers
thionizer
Fig. 1: Coke oven flue gas treatment process.
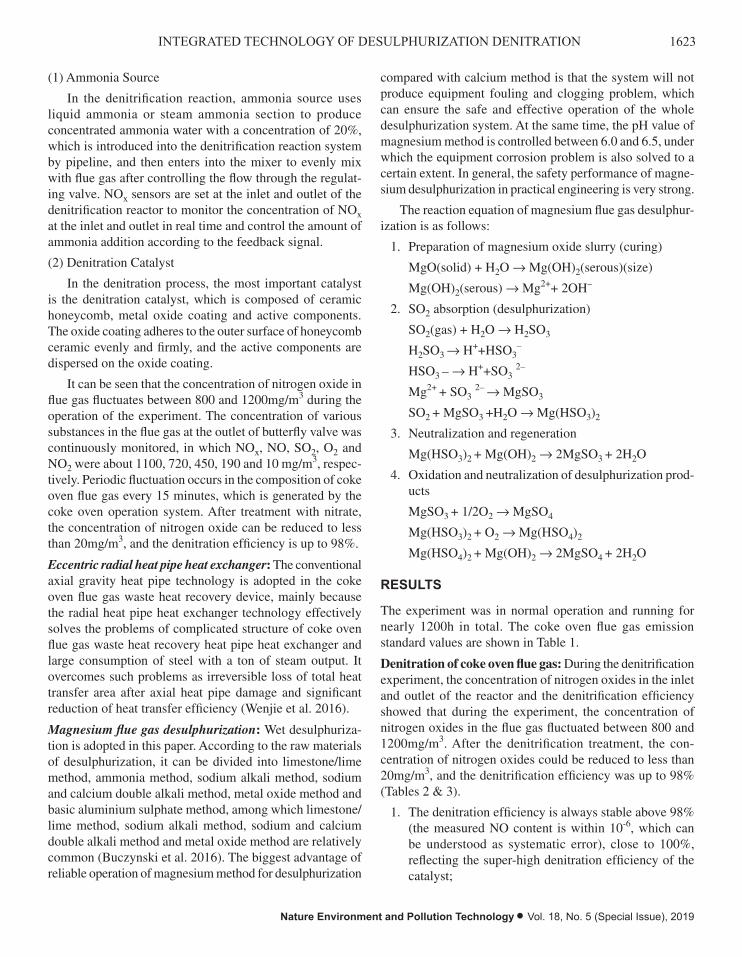
1623INTEGRATED TECHNOLOGY OF DESULPHURIZATION DENITRATION
Nature Environment and Pollution Technology • Vol. 18, No. 5 (Special Issue), 2019
(1) Ammonia Source
In the denitrification reaction, ammonia source uses liquid ammonia or steam ammonia section to produce concentrated ammonia water with a concentration of 20%, which is introduced into the denitrification reaction system by pipeline, and then enters into the mixer to evenly mix with flue gas after controlling the flow through the regulat-ing valve. NOx sensors are set at the inlet and outlet of the denitrification reactor to monitor the concentration of NOx at the inlet and outlet in real time and control the amount of ammonia addition according to the feedback signal.
(2) Denitration Catalyst
In the denitration process, the most important catalyst is the denitration catalyst, which is composed of ceramic honeycomb, metal oxide coating and active components. The oxide coating adheres to the outer surface of honeycomb ceramic evenly and firmly, and the active components are dispersed on the oxide coating.
It can be seen that the concentration of nitrogen oxide in flue gas fluctuates between 800 and 1200mg/m3 during the operation of the experiment. The concentration of various substances in the flue gas at the outlet of butterfly valve was continuously monitored, in which NOx, NO, SO2, O2 and NO2 were about 1100, 720, 450, 190 and 10 mg/m3, respec-tively. Periodic fluctuation occurs in the composition of coke oven flue gas every 15 minutes, which is generated by the coke oven operation system. After treatment with nitrate, the concentration of nitrogen oxide can be reduced to less than 20mg/m3, and the denitration efficiency is up to 98%.
Eccentric radial heat pipe heat exchanger: The conventional axial gravity heat pipe technology is adopted in the coke oven flue gas waste heat recovery device, mainly because the radial heat pipe heat exchanger technology effectively solves the problems of complicated structure of coke oven flue gas waste heat recovery heat pipe heat exchanger and large consumption of steel with a ton of steam output. It overcomes such problems as irreversible loss of total heat transfer area after axial heat pipe damage and significant reduction of heat transfer efficiency (Wenjie et al. 2016).
Magnesium flue gas desulphurization: Wet desulphuriza-tion is adopted in this paper. According to the raw materials of desulphurization, it can be divided into limestone/lime method, ammonia method, sodium alkali method, sodium and calcium double alkali method, metal oxide method and basic aluminium sulphate method, among which limestone/lime method, sodium alkali method, sodium and calcium double alkali method and metal oxide method are relatively common (Buczynski et al. 2016). The biggest advantage of reliable operation of magnesium method for desulphurization
compared with calcium method is that the system will not produce equipment fouling and clogging problem, which can ensure the safe and effective operation of the whole desulphurization system. At the same time, the pH value of magnesium method is controlled between 6.0 and 6.5, under which the equipment corrosion problem is also solved to a certain extent. In general, the safety performance of magne-sium desulphurization in practical engineering is very strong.
The reaction equation of magnesium flue gas desulphur-ization is as follows:
1. Preparation of magnesium oxide slurry (curing)
MgO(solid) + H2O Æ Mg(OH)2(serous)(size)
Mg(OH)2(serous) Æ Mg2++ 2OH–
2. SO2 absorption (desulphurization)
SO2(gas) + H2O Æ H2SO3
H2SO3 Æ H++HSO3–
HSO3 – Æ H++SO3 2–
Mg2+ + SO3 2– Æ MgSO3
SO2 + MgSO3 +H2O Æ Mg(HSO3)2
3. Neutralization and regeneration
Mg(HSO3)2 + Mg(OH)2 Æ 2MgSO3 + 2H2O
4. Oxidation and neutralization of desulphurization prod-ucts
MgSO3 + 1/2O2 Æ MgSO4
Mg(HSO3)2 + O2 Æ Mg(HSO4)2
Mg(HSO4)2 + Mg(OH)2 Æ 2MgSO4 + 2H2O
RESULTS
The experiment was in normal operation and running for nearly 1200h in total. The coke oven flue gas emission standard values are shown in Table 1.
Denitration of coke oven flue gas: During the denitrification experiment, the concentration of nitrogen oxides in the inlet and outlet of the reactor and the denitrification efficiency showed that during the experiment, the concentration of nitrogen oxides in the flue gas fluctuated between 800 and 1200mg/m3. After the denitrification treatment, the con-centration of nitrogen oxides could be reduced to less than 20mg/m3, and the denitrification efficiency was up to 98% (Tables 2 & 3).
1. The denitration efficiency is always stable above 98% (the measured NO content is within 10-6, which can be understood as systematic error), close to 100%, reflecting the super-high denitration efficiency of the catalyst;
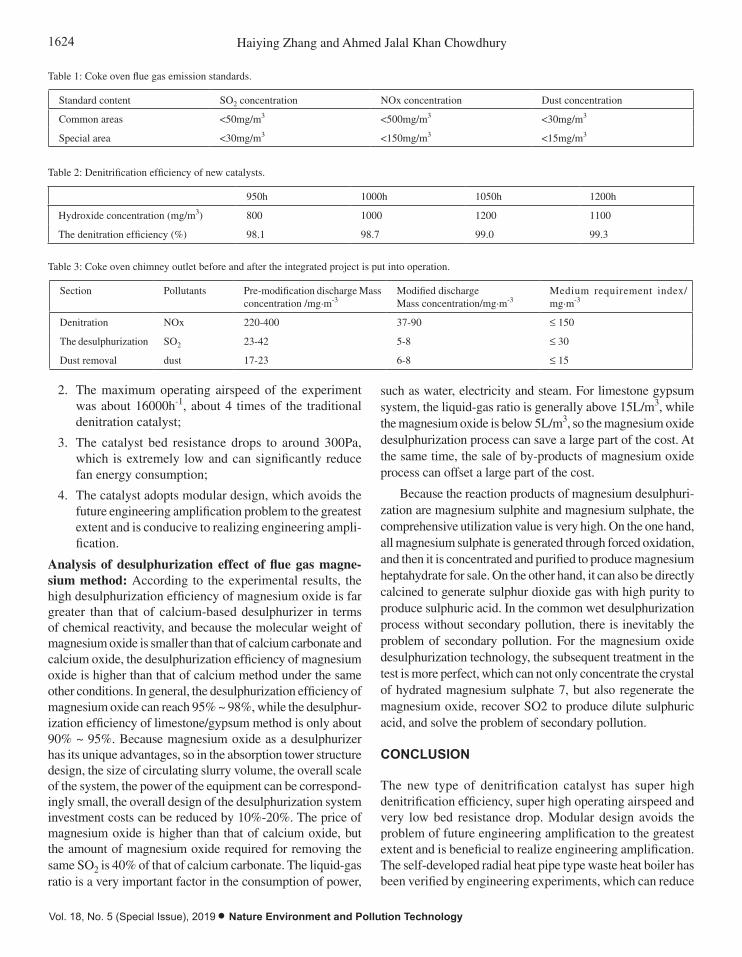
1624 Haiying Zhang and Ahmed Jalal Khan Chowdhury
Vol. 18, No. 5 (Special Issue), 2019 • Nature Environment and Pollution Technology
2. The maximum operating airspeed of the experiment was about 16000h-1, about 4 times of the traditional denitration catalyst;
3. The catalyst bed resistance drops to around 300Pa, which is extremely low and can significantly reduce fan energy consumption;
4. The catalyst adopts modular design, which avoids the future engineering amplification problem to the greatest extent and is conducive to realizing engineering ampli-fication.
Analysis of desulphurization effect of flue gas magne-sium method: According to the experimental results, the high desulphurization efficiency of magnesium oxide is far greater than that of calcium-based desulphurizer in terms of chemical reactivity, and because the molecular weight of magnesium oxide is smaller than that of calcium carbonate and calcium oxide, the desulphurization efficiency of magnesium oxide is higher than that of calcium method under the same other conditions. In general, the desulphurization efficiency of magnesium oxide can reach 95% ~ 98%, while the desulphur-ization efficiency of limestone/gypsum method is only about 90% ~ 95%. Because magnesium oxide as a desulphurizer has its unique advantages, so in the absorption tower structure design, the size of circulating slurry volume, the overall scale of the system, the power of the equipment can be correspond-ingly small, the overall design of the desulphurization system investment costs can be reduced by 10%-20%. The price of magnesium oxide is higher than that of calcium oxide, but the amount of magnesium oxide required for removing the same SO2 is 40% of that of calcium carbonate. The liquid-gas ratio is a very important factor in the consumption of power,
such as water, electricity and steam. For limestone gypsum system, the liquid-gas ratio is generally above 15L/m3, while the magnesium oxide is below 5L/m3, so the magnesium oxide desulphurization process can save a large part of the cost. At the same time, the sale of by-products of magnesium oxide process can offset a large part of the cost.
Because the reaction products of magnesium desulphuri-zation are magnesium sulphite and magnesium sulphate, the comprehensive utilization value is very high. On the one hand, all magnesium sulphate is generated through forced oxidation, and then it is concentrated and purified to produce magnesium heptahydrate for sale. On the other hand, it can also be directly calcined to generate sulphur dioxide gas with high purity to produce sulphuric acid. In the common wet desulphurization process without secondary pollution, there is inevitably the problem of secondary pollution. For the magnesium oxide desulphurization technology, the subsequent treatment in the test is more perfect, which can not only concentrate the crystal of hydrated magnesium sulphate 7, but also regenerate the magnesium oxide, recover SO2 to produce dilute sulphuric acid, and solve the problem of secondary pollution.
CONCLUSION
The new type of denitrification catalyst has super high denitrification efficiency, super high operating airspeed and very low bed resistance drop. Modular design avoids the problem of future engineering amplification to the greatest extent and is beneficial to realize engineering amplification. The self-developed radial heat pipe type waste heat boiler has been verified by engineering experiments, which can reduce
Table 1: Coke oven flue gas emission standards.
Standard content SO2 concentration NOx concentration Dust concentration
Common areas <50mg/m3 <500mg/m3 <30mg/m3
Special area <30mg/m3 <150mg/m3 <15mg/m3
Table 2: Denitrification efficiency of new catalysts.
950h 1000h 1050h 1200h
Hydroxide concentration (mg/m3) 800 1000 1200 1100
The denitration efficiency (%) 98.1 98.7 99.0 99.3
Table 3: Coke oven chimney outlet before and after the integrated project is put into operation.
Section Pollutants Pre-modification discharge Mass concentration /mg·m-3
Modified dischargeMass concentration/mg·m-3
Medium requirement index/mg·m-3
Denitration NOx 220-400 37-90 £ 150
The desulphurization SO2 23-42 5-8 £ 30
Dust removal dust 17-23 6-8 £ 15

1625INTEGRATED TECHNOLOGY OF DESULPHURIZATION DENITRATION
Nature Environment and Pollution Technology • Vol. 18, No. 5 (Special Issue), 2019
the complexity of the overall equipment manufacturing, further reduce the equipment cost, reduce the steel consumption of tons of steam output, and greatly improve the economic benefits of the heat exchanger (Jin et al. 2018). It overcomes the loss of total heat transfer area after the axial heat pipe is damaged. At the same time, all the advantages of axial heat pipe heat exchanger are maintained to a great extent. Magnesium flue gas desulphurization process has the advantages of simple absorption liquid circulation system, stable process operation, simple maintenance, small occupation area, no need to discharge wastewater, and small system resistance, high desulphurization efficiency (≥ 95%), quick and easy start-up and exit operation, high by-product utilization value. The method proposed in this study can fundamentally solve the current domestic coke oven flue gas emission pollution of the environment and waste heat not been recycled. It not only has significant economic benefits, but also has great social benefits.
REFERENCES
Buczynski, R., Weber, R., Kim, R. and Schwöppe, P. 2016. One-dimensional model of heat-recovery, non-recovery coke ovens. Part ii: coking-bed
sub-model. Fuel, 181: S0016236116001083.Gamrat S., Cheng, X., Wang, Z., Ma, C. and Qin, Y. 2017. Investigation on
Fe-Co binary metal oxides supported on activated semi-coke for NO reduction by CO. Applied Catalysis B Environmental, 201: 36-651.
Gong, Z., Wu, W., Zhao, Z. and Li, B. 2018. Combination of catalytic combustion and catalytic denitration on semi-coke with Fe2O3 and CeO2. Catalysis Today, 318: 59-65.
Jin, Y., Xia, J., Dong, C., Jiang, W. and Li, J. 2018. Evolution of sulfur species on titanium ore modified activated coke during flue gas desul-phurization. Energy & Fuels, 32(8): 8623-8630.
Li, Y., Wang, X. and Jie, T. 2016. Modeling of integrated processes for coking flue gas desulphurization and denitrification based on RBFNN. In: 2016 IEEE/ACIS 15th International Conference on Computer and Information Science (ICIS), pp. 1-6.
Tang, Z., Zhimin, H. E., Ebrahim, Guo, D., Zhao, Z. and Xing, X. et al. 2017. Desulphurization and denitration integrative process for coke oven flue gas using dual ammonia solution: from laboratory to industrial test. CIESC Journal.
Wang, L., Cheng, X., Wang, Z., Zhang, X. and Ma, C. 2017. NO reduction by CO over iron‐based catalysts supported by activated semi-coke. Canadian Journal of Chemical Engineering, 95(3).
Wei, F.H., Zhou, Y., Jie, W. and Wang, T. 2016. 3d simulation of sintering flue gas desulphurization and denitration in a bubbling gas absorbing tower. Powder Technology, 314: S0032591016306350.
Wenjie, F. U., Tong, C., Mingming, X. U., Hao, J. and Zhao, R. 2016. Study on denitration technology of coal char reduction method. Journal of Hebei University of Science & Technology, 37(3).

Vol. 18, No. 5 (Special Issue), 2019 • Nature Environment and Pollution Technology
1626

Coal-Rock Interface Recognition Method Based on Image Recognition
Guo Huiling* and Liu Xin***School of Computer Science and Technology, Zhoukou Normal University, Zhoukou, 466001, China**School of Network Engineering, Zhoukou Normal University, Zhoukou, 466001, China
ABSTRACT
In view of the existing problems of coal and rock recognition, the key technologies of coal and rock recognition based on image were studied. To improve the error of BP neural network, it is proposed to use wavelet transform to extract the characteristic values of coal and rock image and build a wavelet neural network with neural network to realize the recognition of coal and rock. Simulation results show that the improved wavelet neural network has a better recognition rate for coal and rock classification. When the number of hidden layer nodes is 30 and the number of iterations is 800, the recognition rate is ideal and stable, even reaching 100%. It can be widely used in specific underground coal mine conditions.
INTRODUCTION
With the development of economy, coal will be the main energy source for a long time in the future. How to effectively identify coal and rock is of great significance not only to the safe production, safe transportation and safe utilization involved in the processes of coal mining, transportation, utilization and processing and reuse, but also to the guarantee of economic and social benefits (Yunxia et al. 2018). Coal and rock identification have been the main coal-producing countries’ research hotspots and a variety of around 20 recognition methods have been proposed by different scholars. However, it is difficult to explore as the methods are not mature enough, accurate, and the reliability is not high, also it is difficult to identify the method that can meet the Chinese large-scale complicated geological conditions and characteristics of coal and rock (Song et al. 2017). Therefore, a lot of research work that can use coal and rock identification technology to improve the key link of technology innovation cannot be effectively implemented. Therefore, coal and rock identification still have a strong theoretical research value and practical economic and social needs.
PAST STUDIES
With the help of image processing technology and feature extraction method, Zhang et al. (2018) proposed a coal and rock identification method based on transform domain and gaussian mixture model clustering. Discrete cosine transform and discrete wavelet transform were used to extract the
content and texture information of coal and rock images respectively. Sun et al. (2017) through the selection of cutting tooth in the process of cutting vibration signals and infrared thermal image signals as the characteristics of coal and rock identification, aimed at cutting cutter tooth in the process of x, y, z three directions of vibration acceleration signal, vibration spectrum, tooth infrared flash temperature value and temperature - frequency real-time image acquisition, the cutting gear vibration signal, the infrared thermal image signals and the change rule between different proportion of coal and rock specimens. Xue et al. (2017) proposed a new coal-rock interface recognition method based on wavelet packet singular value (WPSV) and BP neural network (BPNN). WPSV was used to construct the feature vector, and then combined with BPNN to perform automatic recognition of coal-rock interface. Based on the dielectric properties of coal and rock, Li et al. (2017a) established the coal-rock boundary model based on coal content detection by using Bruggeman effective medium theory. Cheng et al. (2017) used the acoustic impedance difference between coal and rock and phased-array technology to propose the coal-rock interface recognition method based on ultrasonic phased-array. Based on the analysis of coal samples and the velocity of the rock and the ultrasonic attenuation coefficient, on the basis of parameters, such as scattering field theory based on the heterogeneity, an ultrasonic phased array coal and rock identification model is set up. A variety of frequency ultrasonic phased array of different types of scans numerical simulation research of coal and rock model are carried out,
Nat. Env. & Poll. Tech.Website: www.neptjournal.com
Received: 04-08-2019Accepted: 17-10-2019
Key Words:Coal and rockImage recognitionTexture featuresPattern recognitionNeural network
2019pp. 1627-1633 Vol. 18
p-ISSN: 0972-6268 No. 5 (Special Issue)
Nature Environment and Pollution Technology An International Quarterly Scientific Journal
Original Research Paper
e-ISSN: 2395-3454
Open Access

1628 Guo Huiling and Liu Xin
Vol. 18, No. 5 (Special Issue), 2019 • Nature Environment and Pollution Technology
the coal rock interface echo signal and the ultrasonic phased array imaging, image of the coal rock interface recognition is realized.
In this paper, the error of BP neural network is improved, and it is proposed to use wavelet transform to extract the characteristic value of coal image and combine with BP neural network to construct the wavelet neural network to realize the recognition of coal and rock.
MATERIALS AND METHODS
Extraction of Texture Feature Values of Coal and Rock Images
Existing texture feature extraction methods have been widely used, and their advantages and disadvantages are shown in Table 1.
Considering the common defects of existing texture features, this paper extracts the texture features of coal and rock images by multi-scale decomposition on the basis of grey symbiosis matrix, so as to adapt to the classification of coal and rock textures.
This method firstly extracted the features of the initial images of coal and rock, then analysed the characteristics of coal and rock images after multi-scale decomposition, and finally extracted the features of the decomposed coal and rock images. After multi-scale decomposition of coal and rock images, it will be better than the existing methods of texture feature extraction in terms of accuracy and calculation.
An Improved Wavelet Neural Network
BP neural network is generally multi-layer. Multi-layer perceptive network includes input layer, output layer and several hidden layers (Liu et al. 2017). The multi-layer perception network emphasizes that the structure is composed of multiple layers, and the core of BP neural network is a learning algorithm using error back-propagation (Yiming et al. 2017). In most cases, the multi-layer perceptive network adopts error back propagation to carry out weight adjustment, so it is generally considered that they are the same kind of network.
BP network is used in many fields. However, BP neural network also has shortcomings in the recognition of coal-rock interface, such as easy access to local minimum points, lead-ing to paralysis of the system, etc. We propose to combine BP neural network with wavelet analysis, namely wavelet neural network. At the same time, the image is decomposed at multiple scales and the corresponding feature vectors are extracted and then input into the wavelet neural network for processing (Li et al. 2017b). At present, wavelet neural networks can be summarized into two categories:
(1) Loose combination: Feature vectors are provided for the neural network through wavelet analysis. The two are related to each other and independent of each other. Its structure is shown in Fig. 1.
(2) Close combination: the wavelet function is used to replace the hidden node function of the conventional single hidden layer neural network, the weight from the input layer to the hidden layer is replaced by the scale of the wavelet function, and the hidden layer threshold is replaced by the translation parameter, as shown in Fig. 2. The reason why wavelet neural network can complete pattern recognition is that it can well realize nonlinear transformation and transform the input signal space into a new space to solve the classification problem.
The linear output multilayer perceptron with the minimum mean square error criterion is composed of two parts, the first part is that the input layer and the hidden layer complete the nonlinear feature extraction of the input signal, and transform the input space into the output space of the hidden layer to maximize the function, so that the sample has the best separability in the new space; The second part is that the output node completes the linear classification decision. The traditional method is to extract the features first and then design the classifier, while the wavelet neural network is carried out simultaneously. The performance of neural network is determined by topology, node characteristics and training rules. The wavelet neural network transforms the input signal into a new feature space and the mapping relation can automatically adapt to the change of input to achieve the approximation of input and output. Fig. 3 is the flow chart of wavelet neural network algorithm.
Table 1: Advantages and disadvantages of common feature extraction methods.
Method type Advantages Disadvantages
Texture features based on greyscale co- occurrence matrix
It better reflects the relationship between pixels Calculation amount is large and there are many relevant features
Texture features based on local greyscale statistics
Implementation is simple Spatial relationship between pixels is not reflected and the discrimination performance is general
Texture features based on fractal models Texture discrimination performance is better Heavy computation
Texture features based on CDTM matrix Feature correlation is not significant Heavy computation
Texture features based on Gabor filter Banks Simple feature extraction Heavy computation

1629COAL-ROCK INTERFACE RECOGNITION METHOD BASED ON IMAGE RECOGNITION
Nature Environment and Pollution Technology • Vol. 18, No. 5 (Special Issue), 2019
feature extraction in terms of accuracy and calculation. An improved wavelet neural network
BP neural network is generally multi-layer. Multi-layer perceptive network includes input layer, output layer and several hidden layers (Liu et al. 2017). The multi-layer perception network emphasizes that the structure is composed of multiple layers, and the core of BP neural network is a learning algorithm using error back-propagation (Yiming et al. 2017). In most cases, the multi-layer perceptive network adopts error back propagation to carry out weight adjustment, so it is generally considered that they are the same kind of network.
BP network is used in many fields. However, BP neural network also has shortcomings in the recognition of coal-rock interface, such as easy access to local minimum points, leading to paralysis of the system, etc. We propose to combine BP neural network with wavelet analysis, namely wavelet neural network. At the same time, the image is decomposed at multiple scales and the corresponding feature vectors are extracted and then input into the wavelet neural network for processing (Li et al. 2017b). At present, wavelet neural networks can be summarized into two categories:
(1) Loose combination: Feature vectors are provided for the neural network through wavelet analysis. The two are related to each other and independent of each other. Its structure is shown in Fig. 1.
Fig. 1: Loosely coupled wavelet neural network. (2) Close combination: the wavelet function is used to replace the hidden node function of the conventional single hidden layer neural network, the weight from the input layer to the hidden layer is replaced by the scale of the wavelet function, and the hidden layer threshold is replaced by the translation parameter, as shown in Fig. 2. The reason why wavelet neural network can complete pattern recognition is that it can well realize nonlinear transformation and transform the input signal space into a new space to solve the classification problem.
Fig. 2: Closely combines the wavelet neural network.
The linear output multilayer perceptron with the minimum mean square error criterion is composed of two parts, the first part is that the input layer and the hidden layer complete the nonlinear feature extraction of the input signal, and
Wavelet change
Conventional neural network
Output Input
x1
X2
xd
f1(x)
fd(x)
f2(x)
Ф1(x)
Ф2(x)
Фd(x)
Fig. 1: Loosely coupled wavelet neural network.
feature extraction in terms of accuracy and calculation. An improved wavelet neural network
BP neural network is generally multi-layer. Multi-layer perceptive network includes input layer, output layer and several hidden layers (Liu et al. 2017). The multi-layer perception network emphasizes that the structure is composed of multiple layers, and the core of BP neural network is a learning algorithm using error back-propagation (Yiming et al. 2017). In most cases, the multi-layer perceptive network adopts error back propagation to carry out weight adjustment, so it is generally considered that they are the same kind of network.
BP network is used in many fields. However, BP neural network also has shortcomings in the recognition of coal-rock interface, such as easy access to local minimum points, leading to paralysis of the system, etc. We propose to combine BP neural network with wavelet analysis, namely wavelet neural network. At the same time, the image is decomposed at multiple scales and the corresponding feature vectors are extracted and then input into the wavelet neural network for processing (Li et al. 2017b). At present, wavelet neural networks can be summarized into two categories:
(1) Loose combination: Feature vectors are provided for the neural network through wavelet analysis. The two are related to each other and independent of each other. Its structure is shown in Fig. 1.
Fig. 1: Loosely coupled wavelet neural network. (2) Close combination: the wavelet function is used to replace the hidden node function of the conventional single hidden layer neural network, the weight from the input layer to the hidden layer is replaced by the scale of the wavelet function, and the hidden layer threshold is replaced by the translation parameter, as shown in Fig. 2. The reason why wavelet neural network can complete pattern recognition is that it can well realize nonlinear transformation and transform the input signal space into a new space to solve the classification problem.
Fig. 2: Closely combines the wavelet neural network.
The linear output multilayer perceptron with the minimum mean square error criterion is composed of two parts, the first part is that the input layer and the hidden layer complete the nonlinear feature extraction of the input signal, and
Wavelet change
Conventional neural network
Output Input
x1
X2
xd
f1(x)
fd(x)
f2(x)
Ф1(x)
Ф2(x)
Фd(x)
Fig. 2: Closely combines the wavelet neural network.
transform the input space into the output space of the hidden layer to maximize the function, so that the sample has the best separability in the new space; The second part is that the output node completes the linear classification decision. The traditional method is to extract the features first and then design the classifier, while the wavelet neural network is carried out simultaneously. The performance of neural network is determined by topology, node characteristics and training rules. The wavelet neural network transforms the input signal into a new feature space and the mapping relation can automatically adapt to the change of input to achieve the approximation of input and output. Fig. 3 is the flow chart of wavelet neural network algorithm.
Fig. 3: Flow chart of wavelet neural network algorithm.
Classification and recognition of coal and rock images based on neural network
The wavelet neural network is selected to determine the number of neurons in the input layer according to the dimension of characteristic input, while the number of neurons in the output layer is determined by the number of coal and rock types. In this experiment, the number of neurons in the input layer was 27. When the output layer is of four types of coal-rock images, the number of neurons in the output layer is divided into 4. At this time, the expected output of the network is set as 1 represents bituminous coal, 2 represents anthracite, 3 represents sandstone and 4 represents shale. When the output layer type is coal (bituminous coal and anthracite are classified into one category) and rock (sandstone and shale are classified into one category), the number of neurons in the output layer is 2. At this time, the expected output of the network can be set as 1 to represent coal and 2 to represent rock. The number of nodes in the hidden layer will be tested by experiments. The following is the weight correction process of the wavelet neural network:
𝑒𝑒 = ∑ 𝑦𝑦𝑦𝑦(𝑘𝑘) − 𝑦𝑦(𝑘𝑘)𝑚𝑚𝑘𝑘=1 …(1)
Where, e is network prediction error, yn(k) and y(k) are expected output and predicted output respectively. The correlation
Fig. 3: Flow chart of wavelet neural network algorithm.

1630 Guo Huiling and Liu Xin
Vol. 18, No. 5 (Special Issue), 2019 • Nature Environment and Pollution Technology
Classification and Recognition of Coal and Rock Iimages Based on Neural Network
The wavelet neural network is selected to determine the number of neurons in the input layer according to the dimension of characteristic input, while the number of neurons in the output layer is determined by the number of coal and rock types. In this experiment, the number of neurons in the input layer was 27. When the output layer is of four types of coal-rock images, the number of neurons in the output layer is divided into 4. At this time, the expected output of the network is set as 1 represents bituminous coal, 2 represents anthracite, 3 represents sandstone and 4 represents shale. When the output layer type is coal (bituminous coal and anthracite are classified into one category) and rock (sandstone and shale are classified into one category), the number of neurons in the output layer is 2. At this time, the expected output of the network can be set as 1 to represent coal and 2 to represent rock. The number of nodes in the hidden layer will be tested by experiments.
The following is the weight correction process of the wavelet neural network:
e yn k y kk
m= ( ) - ( )=Â 1 …(1)
Where, e is network prediction error, yn(k) and y(k) are expected output and predicted output respectively. The correlation weights and coefficients were corrected by the prediction error e.
w w wn ki
n ki
n ki
, , ,+( ) +( )= +1 1D …(2)
a a aki
ki
ki+( ) +( )= +1 1D …(3)
b b bki
ki
ki+( ) +( )= +1 1D …(4)
Where D D Dwn ki
ki
ki
a b, , ,+( ) +( ) +( )1 1 1can be obtained from the
following formula:
Dw hn ki
n ki
e
w,
,
+( )( )= -
∂
∂1 …(5)
Dae
aki
ki
+( )( )= -
∂
∂1 h …(6)
Dbe
bki
ki
+( )( )= -
∂
∂1 h …(7)
(3) The training samples are used to train the neural network to determine the network model and make the actual output as close as possible to the ideal output.
The training steps of the wavelet neural network algorithm are as follows:
Step 1: Random initialization of ak, bk, wij, wjk, h, where ak and bk are the scaling and translation factors of wavelet
function respectively, wij, wjk are the weight of network connection, and h is the learning rate.
Step 2: Training samples and test samples are used to train the network and test the network classification performance, respectively.
Step 3: Input the training sample and calculate the error e between its output and the expected output.
Step 4: Modify the network weight according to e.
Step 5: Determine whether the algorithm is finished or return to step 3.
(4) Input the test samples into the final trained neural network to test the classification performance of the network.
A total of 180 coal and rock images (bituminous coal, anthracite, sandstone and shale) were collected, including 45 bituminous coal, anthracite, sandstone and shale respec-tively. The image size was 247×215, and the grey scale was 256, which was in BMP format. The software environment is MATLAB2010 software simulation experiment system.
ANALYSIS OF EXPERIMENTAL RESULTS
This experiment is also divided into two groups. The first group is divided into coal and rock. Bituminous coal and anthracite are classified as coal, while sandstone and shale are classified as rocks. The second group is subdivided into four categories namely bituminous coal, anthracite, sandstone and shale. Coal and rock images (bituminous coal, anthracite, sandstone and shale) were decomposed at multiple scales and corresponding feature vectors were extracted. They were randomly divided into training samples and test samples, respectively, for the training of neural network to determine the threshold and network weight and the classification performance of test network.
Table 2 shows the recognition rate of wavelet neural network in classifying four coal rocks when the node number of hidden layers is 30 and the number of iterations is 100.
Table 3 shows the recognition rate of wavelet neural net-work in classifying four coal rocks when the node number of hidden layers is 30 and the iteration number is 160.
Table 4 shows the recognition rate of wavelet neural net-work in classifying four coal rocks when the node number of hidden layers is 30 and the iteration number is 210.
Table 5 shows the recognition rate of wavelet neural network in classifying four coal rocks when the node number of hidden layers is 30 and the number of iterations is 320.
Table 6 shows the recognition rate of wavelet neural network in classifying four coal rocks when the node number of hidden layers is 30 and the number of iterations is 500.
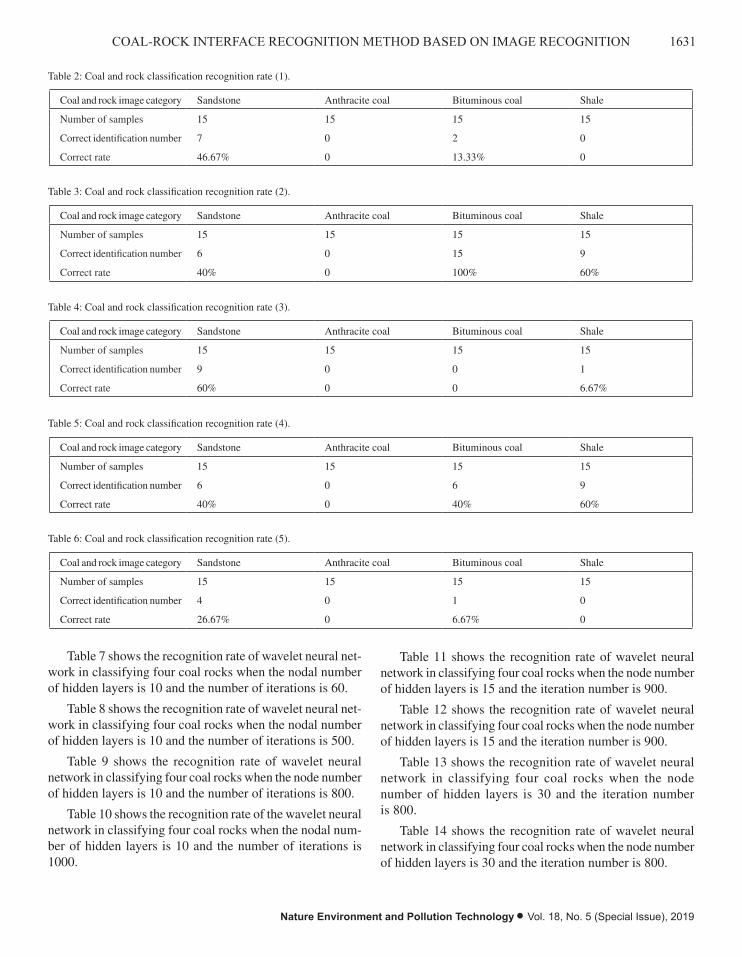
1631COAL-ROCK INTERFACE RECOGNITION METHOD BASED ON IMAGE RECOGNITION
Nature Environment and Pollution Technology • Vol. 18, No. 5 (Special Issue), 2019
Table 2: Coal and rock classification recognition rate (1).
Coal and rock image category Sandstone Anthracite coal Bituminous coal Shale
Number of samples 15 15 15 15
Correct identification number 7 0 2 0
Correct rate 46.67% 0 13.33% 0
Table 3: Coal and rock classification recognition rate (2).
Coal and rock image category Sandstone Anthracite coal Bituminous coal Shale
Number of samples 15 15 15 15
Correct identification number 6 0 15 9
Correct rate 40% 0 100% 60%
Table 4: Coal and rock classification recognition rate (3).
Coal and rock image category Sandstone Anthracite coal Bituminous coal Shale
Number of samples 15 15 15 15
Correct identification number 9 0 0 1
Correct rate 60% 0 0 6.67%
Table 5: Coal and rock classification recognition rate (4).
Coal and rock image category Sandstone Anthracite coal Bituminous coal Shale
Number of samples 15 15 15 15
Correct identification number 6 0 6 9
Correct rate 40% 0 40% 60%
Table 6: Coal and rock classification recognition rate (5).
Coal and rock image category Sandstone Anthracite coal Bituminous coal Shale
Number of samples 15 15 15 15
Correct identification number 4 0 1 0
Correct rate 26.67% 0 6.67% 0
Table 7 shows the recognition rate of wavelet neural net-work in classifying four coal rocks when the nodal number of hidden layers is 10 and the number of iterations is 60.
Table 8 shows the recognition rate of wavelet neural net-work in classifying four coal rocks when the nodal number of hidden layers is 10 and the number of iterations is 500.
Table 9 shows the recognition rate of wavelet neural network in classifying four coal rocks when the node number of hidden layers is 10 and the number of iterations is 800.
Table 10 shows the recognition rate of the wavelet neural network in classifying four coal rocks when the nodal num-ber of hidden layers is 10 and the number of iterations is 1000.
Table 11 shows the recognition rate of wavelet neural network in classifying four coal rocks when the node number of hidden layers is 15 and the iteration number is 900.
Table 12 shows the recognition rate of wavelet neural network in classifying four coal rocks when the node number of hidden layers is 15 and the iteration number is 900.
Table 13 shows the recognition rate of wavelet neural network in classifying four coal rocks when the node number of hidden layers is 30 and the iteration number is 800.
Table 14 shows the recognition rate of wavelet neural network in classifying four coal rocks when the node number of hidden layers is 30 and the iteration number is 800.
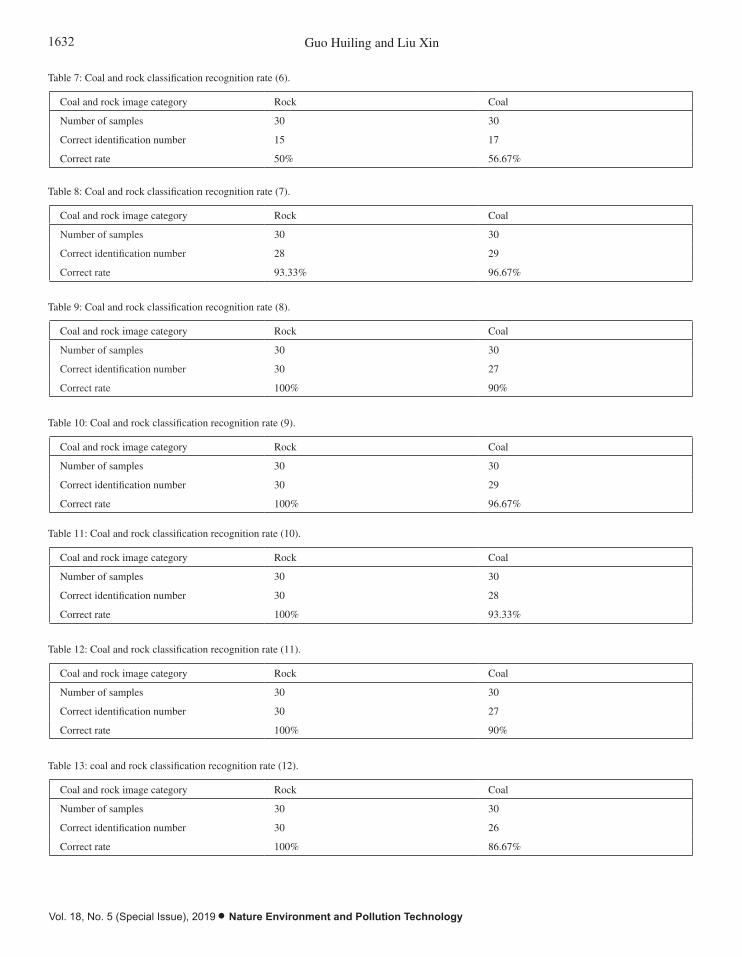
1632 Guo Huiling and Liu Xin
Vol. 18, No. 5 (Special Issue), 2019 • Nature Environment and Pollution Technology
Table 7: Coal and rock classification recognition rate (6).
Coal and rock image category Rock Coal
Number of samples 30 30
Correct identification number 15 17
Correct rate 50% 56.67%
Table 8: Coal and rock classification recognition rate (7).
Coal and rock image category Rock Coal
Number of samples 30 30
Correct identification number 28 29
Correct rate 93.33% 96.67%
Table 9: Coal and rock classification recognition rate (8).
Coal and rock image category Rock Coal
Number of samples 30 30
Correct identification number 30 27
Correct rate 100% 90%
Table 10: Coal and rock classification recognition rate (9).
Coal and rock image category Rock Coal
Number of samples 30 30
Correct identification number 30 29
Correct rate 100% 96.67%
Table 11: Coal and rock classification recognition rate (10).
Coal and rock image category Rock Coal
Number of samples 30 30
Correct identification number 30 28
Correct rate 100% 93.33%
Table 12: Coal and rock classification recognition rate (11).
Coal and rock image category Rock Coal
Number of samples 30 30
Correct identification number 30 27
Correct rate 100% 90%
Table 13: coal and rock classification recognition rate (12).
Coal and rock image category Rock Coal
Number of samples 30 30
Correct identification number 30 26
Correct rate 100% 86.67%

1633COAL-ROCK INTERFACE RECOGNITION METHOD BASED ON IMAGE RECOGNITION
Nature Environment and Pollution Technology • Vol. 18, No. 5 (Special Issue), 2019
Table 14: Coal and rock classification recognition rate (13).
Coal and rock image category Rock Coal
Number of samples 30 30
Correct identification number 30 30
Correct rate 100% 100%
It can be seen from the above simulation results that the improved wavelet neural network has an ideal recognition rate for bituminous coal, but a low recognition rate for sandstone, anthracite and shale. After the improvement, the wavelet neural network has an ideal and stable recognition rate when it classifies coal and rock, and even reaches 100% recognition rate when the node number of hidden layers is 30 and the number of iterations is 800. Compared with other recognition methods, the wavelet neural network has a more perfect recognition rate. In general, the improved wavelet neural network proposed in this paper achieves an ideal effect in coal and rock classification.
CONCLUSION
The paper puts forward using wavelet transform to extract characteristic values of coal and rock image wavelet neural network combined with BP neural network theory, using MATLAB software to simulation experiment. The results show that the improved wavelet neural network used to identify the two classification of coal and rock, compared with other identification method has better recognition rate. When the number of hidden layer nodes is 30 and the number of iterations is 800, the recognition rate is ideal and stable, even reaching 100%. Therefore, in a specific underground coal mine, the coal and rock image classification and recog-nition method can be widely used.
REFERENCES
Cheng, Y., Han, N., Ding, E., Zhao, D. and Wang, X. 2017. Study on rec-ognition method of coal and rock interface based on effective medium theory. Coal Science & Technology, 39(2): 77-79.
Li, C., Ai, D., Sun, X. and Xie, B. 2017a. Crack identification and evolution law in the vibration failure process of loaded coal. Journal of Geophys-ics & Engineering, 14(4): 975-986.
Li, L.I. and Ouyang, C. 2017b. Research on coal-rock interface recognition based on ultrasonic phased array. Journal of China University of Mining & Technology, 46(3): 485-492.
Liu, C., Li, S., Cheng, C. and Cheng, X. 2017. Identification methods for anomalous stress region in coal roadways based on microseismic in-formation and numerical simulation. International Journal of Mining Science & Technology, 27(3): S2095268617302501.
Song, Q., Jiang, H., Zhao, X. and Li, D. 2017. An automatic decision approach to coal–rock recognition in top coal caving based on MF-score. Pattern Analysis & Applications, 20(4): 1307-1315.
Sun, J. and Chen, B. Technology. 2017. Coal-rock recognition approach based on CLPB and support vector guided dictionary learning. Journal of China Coal Society, 42(12): 3338-3348.
Xue, G., Liu, E., Jiao, Y., Yiming, L.I. and Baohua, H.U. 2017. Coal-rock character recognition based on wavelet packet frequency band energy of acoustic pressure signal in mechanized caving face. Journal of Liaoning Technical University, 36(4): 337-342.
Yiming, L.I., Shichen, F.U., Zhou, J., Zong, K., Rui, L.I. and Miao, W.U. 2017. Collapsing coal-rock identification based on wavelet packet entropy and manifold learning. Journal of China Coal Society.
Yun xia, W.U. and Tian, Y.M. 2018. Method of coal-rock image feature extraction and recognition based on dictionary learning. Journal of China Coal Society, (12): 35.
Zhang, Q., Wang, H., Jing, W., Mao, J., Yuan, Z. and Hu, D. 2018. Shearer’s coal-rock recognition system based on fuzzy neural network informa-tion fusion. China Mechanical Engineering, 27(2): 201-208.

Vol. 18, No. 5 (Special Issue), 2019 • Nature Environment and Pollution Technology
1634

Research on the Early Warning Model of Environmental Desertification Based on Grid Scale
Yan ZhangCollege of educational science, Xinjiang Normal University, Urumqi, Xinjiang, China
ABSTRACT
Based on the causes of environmental desertification in the three aspects of climate, surface and human culture, the early-warning index system of desertification was constructed, and the early-warning model was established. Arc GIS was used to quantify and rasterize the data of each factor. In the past 60 years, the area of desertification increased from 53,000 km 2 to 114,000 km 2, bringing great harm to the ecological environment and social economy. The early warning model was used to realize the desertification degree distribution on the raster scale (30 m 30 m), in the three periods, in the research area. The results of the first two periods and the third period were respectively used for parameter correction and verification. On this basis, the development trend of desertification in the study area in 2021, under the condition of “intermittent water transfer” and “no water transfer”, is predicted. The simulation accuracy of desertification degree distribution in the study area is over 90% through parameter correction and early warning model, which has good applicability.
INTRODUCTION
Desertification is a process of land degradation in arid, semi-arid and partly semi-humid areas, which is mainly marked by wind-sand activities due to the incoordination between excessive human activities and resources and environment. In the past 60 years, the area of desertification increased from 53,000 km2 to 114,000 km2, and this land degradation has brought great harm to the ecological environment and social economy (Song & Yan 2017).
Based on the above problems, this article on grid scale research, considering the deficiency of the early warning system for desertification from desertification formation factors, to the lower reaches of Tarim river as the study area, plans to build early warning index system and warning model of high precision, based on the climate, surface, and cultural aspects of the data in the study area.
PAST STUDIES
At home and abroad, the relevant research on desertification early warning is far less than the research on its cause analysis, dynamic evaluation, remote sensing monitoring, physical and biological processes and other aspects. Yassoglou et al. (2017) performed the desertification monitoring by using decision tree classification based on Landsat 8 OLI image, and introduced the monitoring results into the “pressure-state-response” model, integrated the influencing
factors of desertification and human response measures, and realized desertification warning. Based on Envi5.1 software, a recent study used TM image data from 1995 and 2015 to monitor and classify desertification land in Turpan region through the combination of maximum likelihood method and visual interpretation method (Ajaj et al. 2017). A study used field survey combined with remote sensing technology to monitor the development of desertification in Ningxia, and Arc GIS software was used to interpret and draw the current situation and classification of desertification (Ahmadybirgani et al. 2017). The human-computer interactive visual interpretation method was used to extract the land information of different degrees of desertification in the research area from 2000 to 2015 and analyse the distribution characteristics and change trend of different degrees of desertification in different elevations, slopes and upward slopes (Dai et al. 2017).
MATERIALS AND METHODS
Analysis of Influencing Factors of Desertification
The main research object of this paper is the lower reaches of Tarim river in Xinjiang. According to the previous research results on desertification, the causes of desertification can be divided into two aspects: natural factors and human factors, among which natural factors are divided into climatic factors and surface factors.
Nat. Env. & Poll. Tech.Website: www.neptjournal.com
Received: 13-08-2019Accepted: 19-10-2019
Key Words:DesertificationEarly warning modelGrid scaleLower Tarim river
2019pp. 1635-1640 Vol. 18
p-ISSN: 0972-6268 No. 5 (Special Issue)
Nature Environment and Pollution Technology An International Quarterly Scientific Journal
Original Research Paper
e-ISSN: 2395-3454
Open Access

1636 Yan Zhang
Vol. 18, No. 5 (Special Issue), 2019 • Nature Environment and Pollution Technology
In terms of climate, this area is an extremely arid area, which is located in the middle of two deserts. The perenni-al precipitation is rare, and the summer high temperature evaporation is very strong. Such a climate with much less precipitation than evaporation makes the vegetation growth environment harsh, providing favourable underlying surface conditions for the activation of fixed dunes. At the same time, the huge diurnal temperature difference in the study area makes the wind speed very large, which provides a good dynamic condition for sand erosion. Therefore, the climatic factors affecting desertification in the study area are mainly precipitation, temperature and wind speed (Sherratt & Synodinos 2017).
On the surface, vegetation coverage, surface water resources and groundwater level are representative factors affecting desertification in the study area. In the case of nor-mal sand-raising wind speed, the vegetation coverage of 30% ~ 50% of the land surface can play an obvious sand-fixing effect, but when the vegetation coverage is less than 20%, the sand-raising phenomenon is more serious, and when the local surface vegetation coverage is more than 60%, even if the wind speed is more than 10m·s–1, sediment transport rate is very small. Since the construction of Daxi Haizi reservoir
in 1972, the source of surface water in the study area has been controlled, which has played a great role in promoting the development of desertification. In the study area, even in most arid and semi-arid areas, the groundwater level plays an important role in controlling desertification (Zhang et al. 2018).
With the increase of the population, the cultivated area increases year by year and the livestock increases year by year, resulting in the barren land and the serious destruction of vegetation. Therefore, the human factors that can repre-sent its desertification, are the number of population and the number of livestock.
Establishment of Early Warning Index System and Early Warning Model
According to the above analysis, considering the occurrence and development of desertification has a strong seasonal, mainly concentrated in the summer and winter, and the characteristics of remote sensing data acquisition period Sep-tember, this study applied three aspects i.e. the desert climate, surface, and cultural of the nine factors extracted indicators and built an early warning index system, as shown in Fig. 1.
development of desertification. In the study area, even in most arid and semi-arid areas, the groundwater
level plays an important role in controlling desertification (Zhang et al. 2018).
With the increase of the population, the cultivated area increases year by year and the livestock
increases year by year, resulting in the barren land and the serious destruction of vegetation. Therefore,
the human factors that can represent its desertification, are the number of population and the number of
livestock.
Establishment of early warning index system and early warning model
According to the above analysis, considering the occurrence and development of desertification has a
strong seasonal, mainly concentrated in the summer and winter, and the characteristics of remote sensing
data acquisition period September, this study applied three aspects i.e. the desert climate, surface, and
cultural of the nine factors extracted indicators and built an early warning index system, as shown in Fig.
1.
Fig. 1: Desertification warning indicator system.
Different indicator factors have different effects on desertification. Weight (WCi) is used to represent the
contribution of factors in the indicator system to desertification, and the greater the weight value is, the
Desertification early warning system A
Climatic factor B1
Cultural factors B3
Surface factors B2
Average wind speed C1
Precipitation C2
The average temperature C3
Vegetation coverage C4
The surface of water C5
Groundwater depth C6
The population density C7
The density of livestock C8
Per capita net income C9
Fig. 1: Desertification warning indicator system.
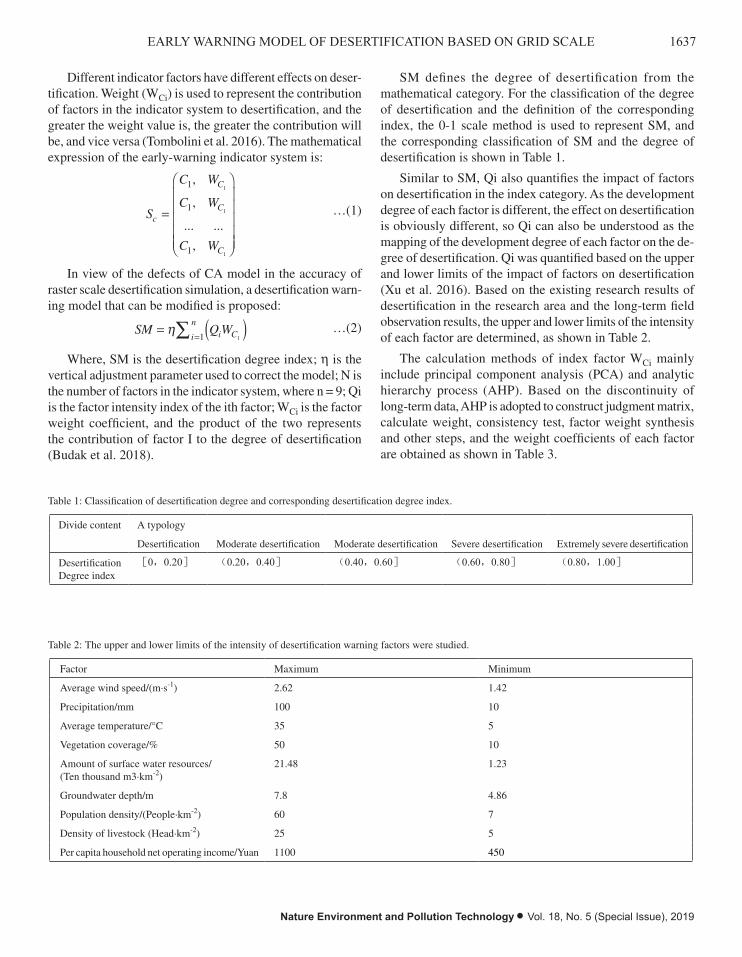
1637EARLY WARNING MODEL OF DESERTIFICATION BASED ON GRID SCALE
Nature Environment and Pollution Technology • Vol. 18, No. 5 (Special Issue), 2019
Different indicator factors have different effects on deser-tification. Weight (WCi) is used to represent the contribution of factors in the indicator system to desertification, and the greater the weight value is, the greater the contribution will be, and vice versa (Tombolini et al. 2016). The mathematical expression of the early-warning indicator system is:
S
C W
C W
C W
c
C
C
C
=
Ê
Ë
ÁÁÁÁÁ
ˆ
¯
˜˜˜˜˜
1
1
1
1
1
1
,
,
... ...
,
…(1)
In view of the defects of CA model in the accuracy of raster scale desertification simulation, a desertification warn-ing model that can be modified is proposed:
SM Q Wi Ci
n= ( )=Âh11
…(2)
Where, SM is the desertification degree index; h is the vertical adjustment parameter used to correct the model; N is the number of factors in the indicator system, where n = 9; Qi is the factor intensity index of the ith factor; WCi is the factor weight coefficient, and the product of the two represents the contribution of factor I to the degree of desertification (Budak et al. 2018).
SM defines the degree of desertification from the mathematical category. For the classification of the degree of desertification and the definition of the corresponding index, the 0-1 scale method is used to represent SM, and the corresponding classification of SM and the degree of desertification is shown in Table 1.
Similar to SM, Qi also quantifies the impact of factors on desertification in the index category. As the development degree of each factor is different, the effect on desertification is obviously different, so Qi can also be understood as the mapping of the development degree of each factor on the de-gree of desertification. Qi was quantified based on the upper and lower limits of the impact of factors on desertification (Xu et al. 2016). Based on the existing research results of desertification in the research area and the long-term field observation results, the upper and lower limits of the intensity of each factor are determined, as shown in Table 2.
The calculation methods of index factor WCi mainly include principal component analysis (PCA) and analytic hierarchy process (AHP). Based on the discontinuity of long-term data, AHP is adopted to construct judgment matrix, calculate weight, consistency test, factor weight synthesis and other steps, and the weight coefficients of each factor are obtained as shown in Table 3.
Table 1: Classification of desertification degree and corresponding desertification degree index.
Divide content A typology
Desertification Moderate desertification Moderate desertification Severe desertification Extremely severe desertification
DesertificationDegree index
[0,0.20] (0.20,0.40] (0.40,0.60] (0.60,0.80] (0.80,1.00]
Table 2: The upper and lower limits of the intensity of desertification warning factors were studied.
Factor Maximum Minimum
Average wind speed/(m·s-1) 2.62 1.42
Precipitation/mm 100 10
Average temperature/°C 35 5
Vegetation coverage/% 50 10
Amount of surface water resources/ (Ten thousand m3·km-2)
21.48 1.23
Groundwater depth/m 7.8 4.86
Population density/(People·km-2) 60 7
Density of livestock (Head·km-2) 25 5
Per capita household net operating income/Yuan 1100 450
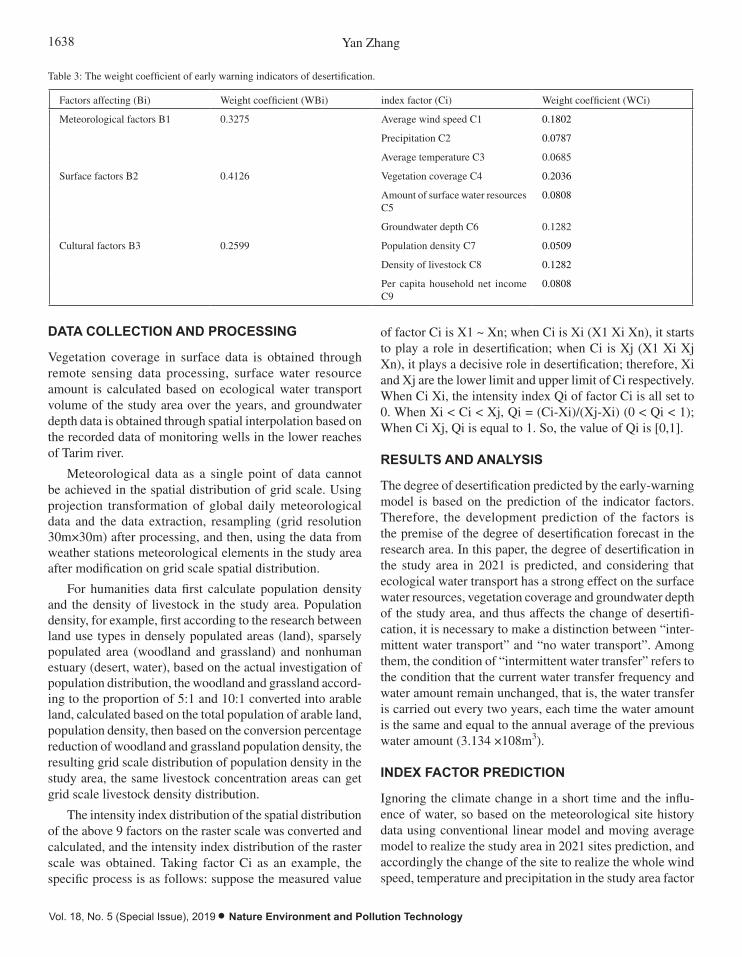
1638 Yan Zhang
Vol. 18, No. 5 (Special Issue), 2019 • Nature Environment and Pollution Technology
Table 3: The weight coefficient of early warning indicators of desertification.
Factors affecting (Bi) Weight coefficient (WBi) index factor (Ci) Weight coefficient (WCi)
Meteorological factors B1 0.3275 Average wind speed C1 0.1802
Precipitation C2 0.0787
Average temperature C3 0.0685
Surface factors B2 0.4126 Vegetation coverage C4 0.2036
Amount of surface water resources C5
0.0808
Groundwater depth C6 0.1282
Cultural factors B3 0.2599 Population density C7 0.0509
Density of livestock C8 0.1282
Per capita household net income C9
0.0808
DATA COLLECTION AND PROCESSING
Vegetation coverage in surface data is obtained through remote sensing data processing, surface water resource amount is calculated based on ecological water transport volume of the study area over the years, and groundwater depth data is obtained through spatial interpolation based on the recorded data of monitoring wells in the lower reaches of Tarim river.
Meteorological data as a single point of data cannot be achieved in the spatial distribution of grid scale. Using projection transformation of global daily meteorological data and the data extraction, resampling (grid resolution 30m×30m) after processing, and then, using the data from weather stations meteorological elements in the study area after modification on grid scale spatial distribution.
For humanities data first calculate population density and the density of livestock in the study area. Population density, for example, first according to the research between land use types in densely populated areas (land), sparsely populated area (woodland and grassland) and nonhuman estuary (desert, water), based on the actual investigation of population distribution, the woodland and grassland accord-ing to the proportion of 5:1 and 10:1 converted into arable land, calculated based on the total population of arable land, population density, then based on the conversion percentage reduction of woodland and grassland population density, the resulting grid scale distribution of population density in the study area, the same livestock concentration areas can get grid scale livestock density distribution.
The intensity index distribution of the spatial distribution of the above 9 factors on the raster scale was converted and calculated, and the intensity index distribution of the raster scale was obtained. Taking factor Ci as an example, the specific process is as follows: suppose the measured value
of factor Ci is X1 ~ Xn; when Ci is Xi (X1 Xi Xn), it starts to play a role in desertification; when Ci is Xj (X1 Xi Xj Xn), it plays a decisive role in desertification; therefore, Xi and Xj are the lower limit and upper limit of Ci respectively. When Ci Xi, the intensity index Qi of factor Ci is all set to 0. When Xi < Ci < Xj, Qi = (Ci-Xi)/(Xj-Xi) (0 < Qi < 1); When Ci Xj, Qi is equal to 1. So, the value of Qi is [0,1].
RESULTS AND ANALYSIS
The degree of desertification predicted by the early-warning model is based on the prediction of the indicator factors. Therefore, the development prediction of the factors is the premise of the degree of desertification forecast in the research area. In this paper, the degree of desertification in the study area in 2021 is predicted, and considering that ecological water transport has a strong effect on the surface water resources, vegetation coverage and groundwater depth of the study area, and thus affects the change of desertifi-cation, it is necessary to make a distinction between “inter-mittent water transport” and “no water transport”. Among them, the condition of “intermittent water transfer” refers to the condition that the current water transfer frequency and water amount remain unchanged, that is, the water transfer is carried out every two years, each time the water amount is the same and equal to the annual average of the previous water amount (3.134 ×10⁸m3).
INDEX FACTOR PREDICTION
Ignoring the climate change in a short time and the influ-ence of water, so based on the meteorological site history data using conventional linear model and moving average model to realize the study area in 2021 sites prediction, and accordingly the change of the site to realize the whole wind speed, temperature and precipitation in the study area factor

1639EARLY WARNING MODEL OF DESERTIFICATION BASED ON GRID SCALE
Nature Environment and Pollution Technology • Vol. 18, No. 5 (Special Issue), 2019
grid scale data transformation. Surface factors, which involve vegetation coverage, groundwater depth and surface water resources, are strongly affected by water transport and must be analysed differently. Under the condition of “intermittent water transfer”, vegetation coverage improved to a certain extent. Based on the vegetation coverage distribution in 2012, the vegetation coverage distribution in the study area in 2021 was calculated according to the average annual change of the raster vegetation coverage. Under the condition of no water conveyance, vegetation coverage was calculated by using the difference of vegetation coverage in 1996 and 2006. Because only one water conveyance was completed before the image (September 4, 2006), the water conveyance this time was small and short, which had a negligible impact on vegetation coverage. Therefore, vegetation coverage distribution in 2021 under the condition of no water conveyance was calculated. According to the changes of monitoring data of groundwater between the eighth water conveyance (September 25, 2012) and the ninth water conveyance (October 10, 2013), the av-erage annual decrease rate of groundwater depth is deduced, and then the groundwater depth distribution in 2021 without water conveyance is calculated. In the prediction of human factor population density and livestock density, the data are also obtained based on the statistical data and predicted by the linear regression model, which is not affected by the water transmission conditions, so as to obtain the above distribution on the grid scale. Under the condition of intermittent water transfer, the amount of surface water resources is calculated according to the set annual average water transfer volume. The distribution of surface water resources under the condi-tion of no water transfer is the same as that in 1996.
PREDICTION OF DESERTIFICATION DEGREE
Based on the modified parameters and warning model, the desertification degree distribution of each grid scale in 2015 was calculated according to the distribution data of indica-tor factors under the two conditions of “intermittent water transfer” and “no water transfer”.
ANALYSIS OF PREDICTION RESULTS
It can be seen from the analysis of Fig. 2, that under the condition of “intermittent water transfer”, the land area of the study area increased by 57.16km2 due to extremely severe desertification during the period of 2012-2021; increased land area by about 42.24km2 due to mild desertification; moderate desertification with a reduction of about 85.89km2; The other two changes are smaller. This indicates that the ecological water transfer has a great impact on the land of mild and moderate desertification in the study area, alleviating the
continuous deterioration of desertification to a certain extent, but has a weak impact on the reversal of severe desertifica-tion, and even cannot prevent the continuous expansion of the land caused by extremely severe desertification.
Under the condition of “no water transfer”, the non-de-sertification, mild desertification and moderate desertification land volume in the study area in 2021 were reduced, with the mild desertification land volume decreased the fastest and the most, reducing about 102.91km2. At the same time, the volume increased by about 15.74km2 in the case of severe desertification, and the volume increased significantly in the case of extremely severe desertification compared to the former, reaching 142.41km2. The above changes indicate that the desertification process in the study area will accel-erate under the current state after stopping the ecological water transfer.
In general, under the condition of “intermittent water transfer”, the degree of desertification in the study area is partially reversed. Under the condition of “no water con-veyance”, the degree of desertification in the study area was completely deteriorated. The reverse effect of ecological water transfer on the degree of desertification in the study area is mainly manifested in the reverse transformation of land desertification type along the river. The effect on the degree of desertification is weak, which is reflected in the continuous deterioration of the severe desertification areas outside the river channel area. If the “intermittent water transfer”, then the degree of desertification along the river will continue to improve, the two sides of the desert will not be connected, “green corridor” will be full of vitality. If the water is no longer transported, the degree of desertification in all areas in the study area will increase rapidly, and the areas along the river will be reduced to moderate or even severe desertification, the desertification on both sides of the river will be integrated, the “green corridor” will no longer exist, and the residents will be forced to move. Then, the abandoned farmland will soon be controlled by desertification, and the entire research area will become a complete desert.
CONCLUSION
According to the results of this paper, contrast “intermittent water” and “free water” two cases of desertification and slight desertification types of land of ecological water con-veyance of the most significant response: the area to increase the “intermittent water”, “water” the area is reduced, the manifestation of the geographical position of Daxi Haizi reservoir area along the river, under this also demonstrates the regional ecological environment vulnerability and the strong dependence of surface water resources.

1640 Yan Zhang
Vol. 18, No. 5 (Special Issue), 2019 • Nature Environment and Pollution Technology
Fig. 2: Land area change map of different desertification degree types in the study area from 2012 to
2021.
Analysis of prediction results
It can be seen from the analysis of Fig. 2, that under the condition of "intermittent water transfer", the
land area of the study area increased by 57.16km2 due to extremely severe desertification during the
period of 2012-2021; increased land area by about 42.24km2 due to mild desertification; moderate
desertification with a reduction of about 85.89km2; The other two changes are smaller. This indicates
that the ecological water transfer has a great impact on the land of mild and moderate desertification in
the study area, alleviating the continuous deterioration of desertification to a certain extent, but has a
weak impact on the reversal of severe desertification, and even cannot prevent the continuous expansion
of the land caused by extremely severe desertification.
Under the condition of "no water transfer", the non-desertification, mild desertification and
moderate desertification land volume in the study area in 2021 were reduced, with the mild desertification
land volume decreased the fastest and the most, reducing about 102.91km2. At the same time, the volume
increased by about 15.74km2 in the case of severe desertification, and the volume increased significantly
in the case of extremely severe desertification compared to the former, reaching 142.41km2. The above
The desertification
Mild desertification
Moderate desertification
Severe desertification
Extremely severe desertification
Fig. 2: Land area change map of different desertification degree types in the study area from 2012 to 2021.
According to the prediction results, it can be seen that the method can simulate the distribution of the degree of desertification in the study area with more than 90% accuracy through parameter correction and early warning model, and the early warning model has good applicability.
REFERENCES
Ahmadybirgani, H., Mcqueen, K. G., Moeinaddini, M. and Naseri, H. 2017. Sand dune encroachment and desertification processes of the Rigboland sand sea, Central Iran. Sci Rep., 7(1): 1523.
Ajaj, Q. M., Pradhan, B., Noori, A. M. and Jebur, M. N. 2017. Spatial mon-itoring of desertification extent in western Iraq using landsat images and GIS. Land Degradation & Development, Vol. 28.
Budak, M., Günal, H., Yıldız, H., Acir, N. and Acar, M. 2018. Environmental sensitivity to desertification in northern Mesopotamia; application of modified MEDALUS by using analytical hierarchy process. Arabian Journal of Geosciences, 11(17): 481.
Dai, Q., Peng, X., Zhi, Y. and Zhao, L. 2017. Runoff and erosion processes on bare slopes in the karst rocky desertification area. Catena, 152: 218-226.
Sherratt, J. and Synodinos, A. 2017. Vegetation patterns and desertification waves in semi-arid environments: mathematical models based on local facilitation in plants. Discrete and Continuous Dynamical Systems - Series B (DCDS-B), 17(8): 2815-2827.
Song, Y. and Yan, C. 2017. A review of desertification early warning meth-ods. Journal of Desert Research.
Tombolini, I., Colantoni, A., Renzi, G., Sateriano, A., Sabbi, A. and Morrow, N. et al. 2016. Lost in convergence, found in vulnerability: a spatially-dynamic model for desertification risk assessment in Med-iterranean agro-forest districts. Science of the Total Environment, 569-570: 973-981.
Xu, D., Song, A., Tong, H., Ren, H., Hu, Y. and Shao, Q. 2016. A spatial system dynamic model for regional desertification simulation-a case study of ordos, china. Environmental Modelling and Software, 83(C): 179-192.
Yassoglou, N., Tsadilas, C. and Kosmas, C. 2017. Land degradation and desertification. In: The Soils of Greece, Springer, Cham, pp. 87-96
Zhang, Z., Zhou, Y., Wang, S. and Huang, X. 2018. Spatial distribution of stony desertification and key influencing factors on different sampling scales in small karst watersheds. International Journal of Environmental Research & Public Health, 15(4): 743.

Research on Green Building Energy Management Based on BIM and FM
Caijun Wang*, Wenjun Lu*, Chuanchuan Xi* and Xuan Phuong Nguyen***China University of Mining and Technology, Yinchuan College,Nixia750001, China**Ho Chi Minh City University of Transport, Ho Chi Minh, Vietnam
ABSTRACT
Aiming at the problem of building energy consumption, based on the conceptual model of BIM (Building Information Modelling) and FM (Facility Management) and the concept of green building, this paper expounds the advantages of BIM in energy management and building performance evaluation and optimize from the strategic aspect through FM concept. Research shows that building information modelling (BIM) can play a key role in achieving close cooperation between customers and the construction industry, minimizing building energy consumption and achieving low-carbon and environmental goals.
INTRODUCTION
Energy is the material basis for human survival and the spir-itual foundation for human civilization. The rapid develop-ment of the world economy cannot be achieved without the supply of energy such as oil and natural gas (Pishdadbozorgi et al. 2018). According to statistics, this resource-driven economic system will rapidly collapse in the second half of the 21st century, and the energy crisis is imminent. As a developing country with a large population base, China’s per capita energy consumption is less than half that of the world’s per capita energy consumption, and its total energy consumption ranks second (Ilhan & Yaman 2016). At present, through the energy consumption design of new buildings and the energy conservation transformation of existing buildings, the total energy consumption of the building can be reduced compared with the original under the conditions of annual increase of the total building area and moderate improvement of indoor comfort, and the national energy conservation goal, namely, to complete the energy conservation planning of most new buildings and the energy conservation transformation of existing buildings by 2020. The sustainable development of building energy has become a national strategic goal, and building energy management becomes more important. At present, how to realize building energy conservation and emission reduction and reduce energy consumption has become the most important part of building research field, which has important research value.
PAST RESEARCH
Mcglinn et al. (2017) discussed in BIM platform with different design process on the performance of building energy efficiency design and application of simulation software and the method, thus effectively improve the efficiency of building energy efficiency design. BIM technology in our country is mostly applied in the simulation of construction process, through the BIM to the use of all kinds of building materials in the statistics; the quality of the potential risks of the project, safety and cost risk, and the key management to achieve the quality, safety, and cost of the project in accurate control, to ensure quality, time limit for a project, at the same time reduce the cost of construction, improving the efficiency of building.
It is of great practical significance to study the application of BIM and FM technology in green building and comprehensively improve building performance. This paper aims to explore the advantages of BIM and FM technology in the application of building energy management and building performance evaluation and strive to find a set of management mode that is suitable for the combination of BIM and FM in building energy management in China.
BIM AND FM CONCEPT AND ITS MODEL
BIM technology is a 3D digital technology, which uses a common data format throughout the life cycle to create and collect all relevant information of building facilities and
Nat. Env. & Poll. Tech.Website: www.neptjournal.com
Received: 17-08-2019Accepted: 01-10-2019
Key Words:BIM and FMGreen BuildingEnergy managementBuilding performance
2019pp. 1641-1646 Vol. 18
p-ISSN: 0972-6268 No. 5 (Special Issue)
Nature Environment and Pollution Technology An International Quarterly Scientific Journal
Original Research Paper
e-ISSN: 2395-3454
Open Access
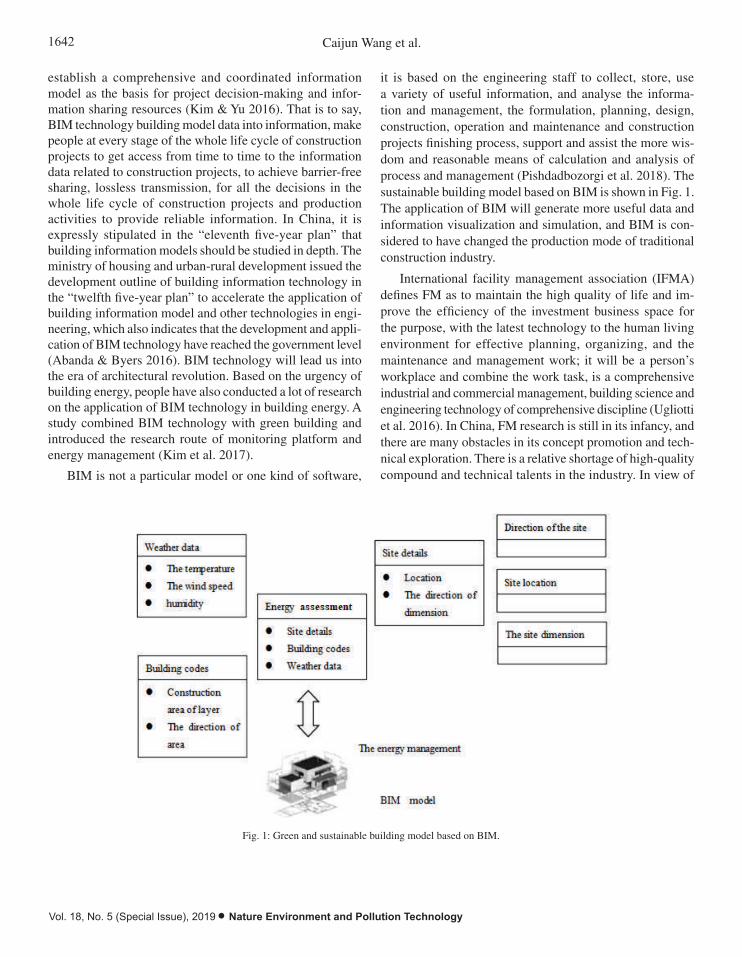
1642 Caijun Wang et al.
Vol. 18, No. 5 (Special Issue), 2019 • Nature Environment and Pollution Technology
establish a comprehensive and coordinated information model as the basis for project decision-making and infor-mation sharing resources (Kim & Yu 2016). That is to say, BIM technology building model data into information, make people at every stage of the whole life cycle of construction projects to get access from time to time to the information data related to construction projects, to achieve barrier-free sharing, lossless transmission, for all the decisions in the whole life cycle of construction projects and production activities to provide reliable information. In China, it is expressly stipulated in the “eleventh five-year plan” that building information models should be studied in depth. The ministry of housing and urban-rural development issued the development outline of building information technology in the “twelfth five-year plan” to accelerate the application of building information model and other technologies in engi-neering, which also indicates that the development and appli-cation of BIM technology have reached the government level (Abanda & Byers 2016). BIM technology will lead us into the era of architectural revolution. Based on the urgency of building energy, people have also conducted a lot of research on the application of BIM technology in building energy. A study combined BIM technology with green building and introduced the research route of monitoring platform and energy management (Kim et al. 2017).
BIM is not a particular model or one kind of software,
it is based on the engineering staff to collect, store, use a variety of useful information, and analyse the informa-tion and management, the formulation, planning, design, construction, operation and maintenance and construction projects finishing process, support and assist the more wis-dom and reasonable means of calculation and analysis of process and management (Pishdadbozorgi et al. 2018). The sustainable building model based on BIM is shown in Fig. 1. The application of BIM will generate more useful data and information visualization and simulation, and BIM is con-sidered to have changed the production mode of traditional construction industry.
International facility management association (IFMA) defines FM as to maintain the high quality of life and im-prove the efficiency of the investment business space for the purpose, with the latest technology to the human living environment for effective planning, organizing, and the maintenance and management work; it will be a person’s workplace and combine the work task, is a comprehensive industrial and commercial management, building science and engineering technology of comprehensive discipline (Ugliotti et al. 2016). In China, FM research is still in its infancy, and there are many obstacles in its concept promotion and tech-nical exploration. There is a relative shortage of high-quality compound and technical talents in the industry. In view of
Fig. 1: Green and sustainable building model based on BIM.
International facility management association (IFMA) defines FM as to maintain the high quality of life and improve the efficiency of the investment business space for the purpose, with the latest technology to the human living environment for effective planning, organizing, and the maintenance and management work; it will be a person's workplace and combine the work task, is a comprehensive industrial and commercial management, building science and engineering technology of comprehensive discipline (Ugliotti et al. 2016). In China, FM research is still in its infancy, and there are many obstacles in its concept promotion and technical exploration. There is a relative shortage of high-quality compound and technical talents in the industry. In view of this situation, many domestic experts and scholars put forward many constructive suggestions on accelerating the development of FM to ensure that FM plays an active role in building energy management. Royal Australian Institute of Architects (RAIA) proposed in 2007 the role of FM in database and the benefits it can bring in digitization (Nicał &Wodyński 2016). FM is a combination of space, environment and management. FM focuses on energy and facility management, including energy consumption, data statistics, equipment update, etc. (Ilhan & Yaman 2016). It can be applied not only to various types of buildings, but also to various departments and organizations inside buildings, which can help enhance competitiveness, reduce non-core operating costs, increase the value of buildings and maintain their value, thus improving the economic benefits of enterprises (Ahmad et al. 2017). FM covers a lot of management work, such as property management, space management, facilities and equipment management, energy management, etc., as shown in Fig.2.
Fig. 1: Green and sustainable building model based on BIM.
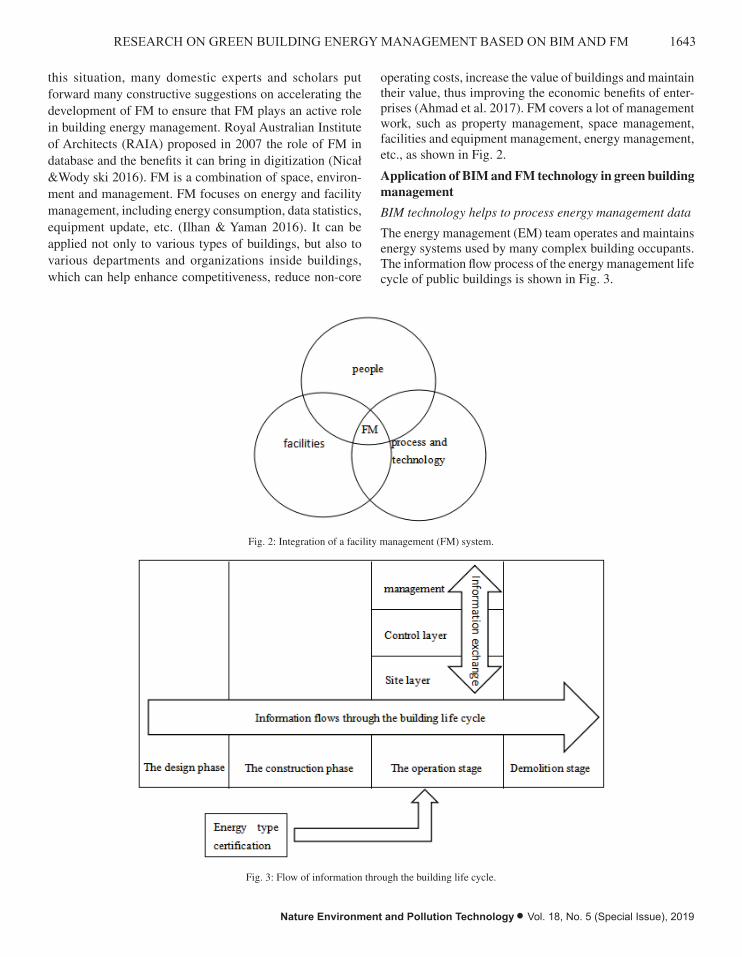
1643RESEARCH ON GREEN BUILDING ENERGY MANAGEMENT BASED ON BIM AND FM
Nature Environment and Pollution Technology • Vol. 18, No. 5 (Special Issue), 2019
this situation, many domestic experts and scholars put forward many constructive suggestions on accelerating the development of FM to ensure that FM plays an active role in building energy management. Royal Australian Institute of Architects (RAIA) proposed in 2007 the role of FM in database and the benefits it can bring in digitization (Nicał &Wodyński 2016). FM is a combination of space, environ-ment and management. FM focuses on energy and facility management, including energy consumption, data statistics, equipment update, etc. (Ilhan & Yaman 2016). It can be applied not only to various types of buildings, but also to various departments and organizations inside buildings, which can help enhance competitiveness, reduce non-core
operating costs, increase the value of buildings and maintain their value, thus improving the economic benefits of enter-prises (Ahmad et al. 2017). FM covers a lot of management work, such as property management, space management, facilities and equipment management, energy management, etc., as shown in Fig. 2.
Application of BIM and FM technology in green building management
BIM technology helps to process energy management data
The energy management (EM) team operates and maintains energy systems used by many complex building occupants. The information flow process of the energy management life cycle of public buildings is shown in Fig. 3.
Fig. 2: Integration of a facility management (FM) system.
Application of BIM and FM technology in green building management
BIM technology helps to process energy management data
The energy management (EM) team operates and maintains energy systems used by many complex
building occupants. The information flow process of the energy management life cycle of public
buildings is shown in Fig. 3.
Fig. 3: Flow of information through the building life cycle.
As can be seen from Fig. 3, the realization of green building design and sustainable goals requires
a good information flow exchange between the site level, control level and management level. On the
Fig. 2: Integration of a facility management (FM) system.
Fig. 2: Integration of a facility management (FM) system.
Application of BIM and FM technology in green building management
BIM technology helps to process energy management data
The energy management (EM) team operates and maintains energy systems used by many complex
building occupants. The information flow process of the energy management life cycle of public
buildings is shown in Fig. 3.
Fig. 3: Flow of information through the building life cycle.
As can be seen from Fig. 3, the realization of green building design and sustainable goals requires
a good information flow exchange between the site level, control level and management level. On the
Fig. 3: Flow of information through the building life cycle.
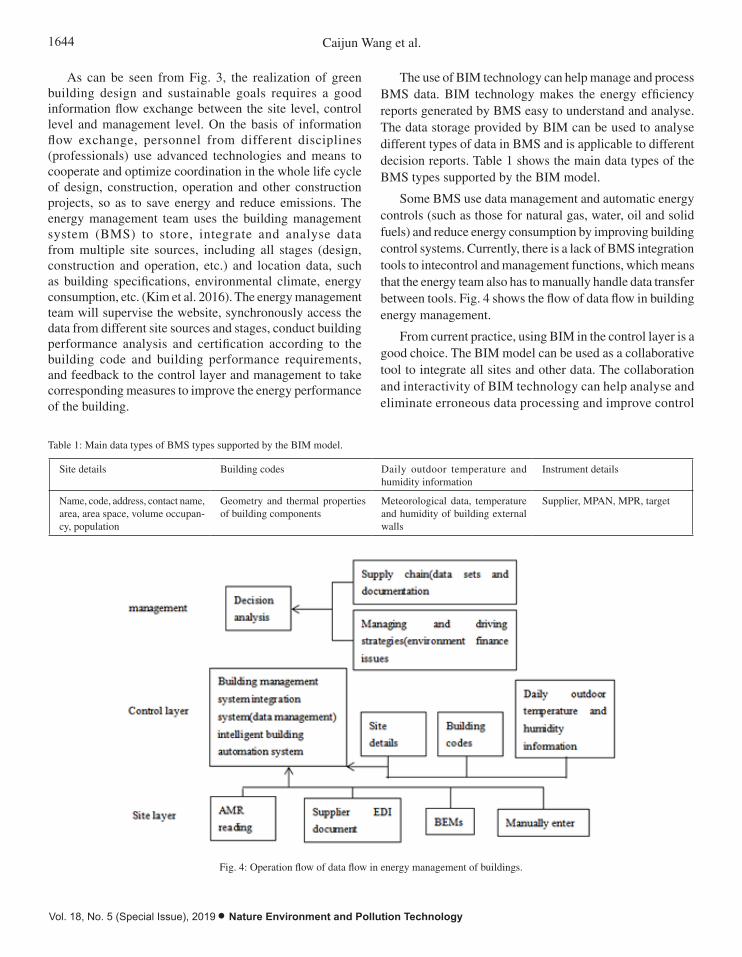
1644 Caijun Wang et al.
Vol. 18, No. 5 (Special Issue), 2019 • Nature Environment and Pollution Technology
As can be seen from Fig. 3, the realization of green building design and sustainable goals requires a good information flow exchange between the site level, control level and management level. On the basis of information flow exchange, personnel from different disciplines (professionals) use advanced technologies and means to cooperate and optimize coordination in the whole life cycle of design, construction, operation and other construction projects, so as to save energy and reduce emissions. The energy management team uses the building management system (BMS) to store, integrate and analyse data from multiple site sources, including all stages (design, construction and operation, etc.) and location data, such as building specifications, environmental climate, energy consumption, etc. (Kim et al. 2016). The energy management team will supervise the website, synchronously access the data from different site sources and stages, conduct building performance analysis and certification according to the building code and building performance requirements, and feedback to the control layer and management to take corresponding measures to improve the energy performance of the building.
The use of BIM technology can help manage and process BMS data. BIM technology makes the energy efficiency reports generated by BMS easy to understand and analyse. The data storage provided by BIM can be used to analyse different types of data in BMS and is applicable to different decision reports. Table 1 shows the main data types of the BMS types supported by the BIM model.
Some BMS use data management and automatic energy controls (such as those for natural gas, water, oil and solid fuels) and reduce energy consumption by improving building control systems. Currently, there is a lack of BMS integration tools to intecontrol and management functions, which means that the energy team also has to manually handle data transfer between tools. Fig. 4 shows the flow of data flow in building energy management.
From current practice, using BIM in the control layer is a good choice. The BIM model can be used as a collaborative tool to integrate all sites and other data. The collaboration and interactivity of BIM technology can help analyse and eliminate erroneous data processing and improve control
Table 1: Main data types of BMS types supported by the BIM model.
Site details Building codes Daily outdoor temperature and humidity information
Instrument details
Name, code, address, contact name, area, area space, volume occupan-cy, population
Geometry and thermal properties of building components
Meteorological data, temperature and humidity of building external walls
Supplier, MPAN, MPR, target
From current practice, using BIM in the control layer is a good choice. The BIM model can be used
as a collaborative tool to integrate all sites and other data. The collaboration and interactivity of BIM
technology can help analyse and eliminate erroneous data processing and improve control results. BIM
technology emphasizes information sharing. Through BIM technology, the management team can better
transfer and use data flow and improve communication efficiency. It can also solve many typical special
problems, such as convenient query and call historical building site data. In addition, BIM technology
can improve the value of the BMS system used and better realize energy emission reduction and energy
conservation management.
BIM technology assists building performance evaluation
State calculation method (sliding) is defined as the collective negotiation of community and government
departments at all levels, through the evaluation method to compute the actual simulation software, at
present is mainly used in non-residential construction building performance assessment as shown in Fig.
5. The calculation method by accessing BIM model to extract the information flow of architectural
geometry, structure, usage patterns, as well as the related parameters in the Hvac and lighting, transcribed
into a spreadsheet format, uploaded to the energy performance analysis program, the energy consumption
and energy emissions data calculation, compared with "normal" annual data, and finally form the
evaluation results.
The NCM algorithm has steady-state performance, and its advanced performance is also reflected
in that it can conduct dynamic evaluation of building performance based on three-dimensional intuitive
BIM building model.When the model was applied to shading factor analysis, it was directly imported
into DSM (Dynamic SimulationModelling) program from the BIM system to calculate and analyse.
Fig. 4: Operation flow of data flow in energy management of buildings.
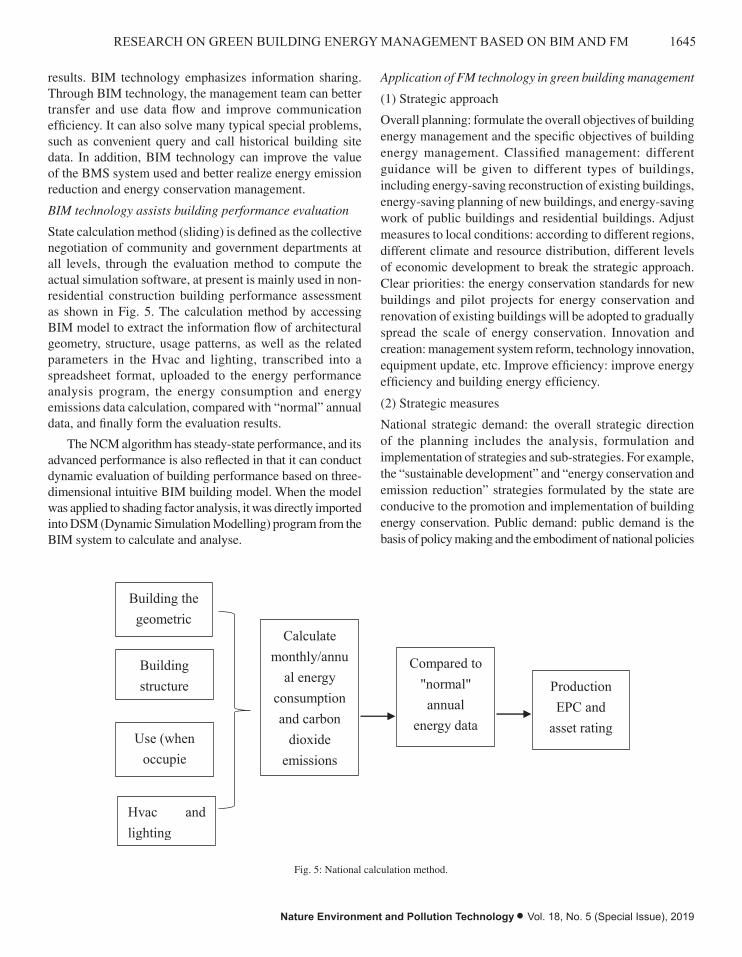
1645RESEARCH ON GREEN BUILDING ENERGY MANAGEMENT BASED ON BIM AND FM
Nature Environment and Pollution Technology • Vol. 18, No. 5 (Special Issue), 2019
results. BIM technology emphasizes information sharing. Through BIM technology, the management team can better transfer and use data flow and improve communication efficiency. It can also solve many typical special problems, such as convenient query and call historical building site data. In addition, BIM technology can improve the value of the BMS system used and better realize energy emission reduction and energy conservation management.
BIM technology assists building performance evaluation
State calculation method (sliding) is defined as the collective negotiation of community and government departments at all levels, through the evaluation method to compute the actual simulation software, at present is mainly used in non-residential construction building performance assessment as shown in Fig. 5. The calculation method by accessing BIM model to extract the information flow of architectural geometry, structure, usage patterns, as well as the related parameters in the Hvac and lighting, transcribed into a spreadsheet format, uploaded to the energy performance analysis program, the energy consumption and energy emissions data calculation, compared with “normal” annual data, and finally form the evaluation results.
The NCM algorithm has steady-state performance, and its advanced performance is also reflected in that it can conduct dynamic evaluation of building performance based on three-dimensional intuitive BIM building model. When the model was applied to shading factor analysis, it was directly imported into DSM (Dynamic Simulation Modelling) program from the BIM system to calculate and analyse.
Application of FM technology in green building management
(1) Strategic approach
Overall planning: formulate the overall objectives of building energy management and the specific objectives of building energy management. Classified management: different guidance will be given to different types of buildings, including energy-saving reconstruction of existing buildings, energy-saving planning of new buildings, and energy-saving work of public buildings and residential buildings. Adjust measures to local conditions: according to different regions, different climate and resource distribution, different levels of economic development to break the strategic approach. Clear priorities: the energy conservation standards for new buildings and pilot projects for energy conservation and renovation of existing buildings will be adopted to gradually spread the scale of energy conservation. Innovation and creation: management system reform, technology innovation, equipment update, etc. Improve efficiency: improve energy efficiency and building energy efficiency.
(2) Strategic measures
National strategic demand: the overall strategic direction of the planning includes the analysis, formulation and implementation of strategies and sub-strategies. For example, the “sustainable development” and “energy conservation and emission reduction” strategies formulated by the state are conducive to the promotion and implementation of building energy conservation. Public demand: public demand is the basis of policy making and the embodiment of national policies
Fig. 5: National calculation method.
Application of FM technology in green building management
(1) Strategic approach
Overall planning: formulate the overall objectives of building energy management and the specific
objectives of building energy management. Classified management: different guidance will be given to
different types of buildings, including energy-saving reconstruction of existing buildings, energy-saving
planning of new buildings, and energy-saving work of public buildings and residential buildings. Adjust
measures to local conditions: according to different regions, different climate and resource distribution,
different levels of economic development to break the strategic approach. Clear priorities: the energy
conservation standards for new buildings and pilot projects for energy conservation and renovation of
existing buildings will be adopted to gradually spread the scale of energy conservation. Innovation and
creation: management system reform, technology innovation, equipment update, etc. Improve efficiency:
improve energy efficiency and building energy efficiency.
(2) Strategic measures
National strategic demand: the overall strategic direction of the planning includes the analysis,
formulation and implementation of strategies and sub-strategies. For example, the "sustainable
development" and "energy conservation and emission reduction" strategies formulated by the state are
conducive to the promotion and implementation of building energy conservation. Public demand: public
demand is the basis of policy making and the embodiment of national policies at the grassroots level.
Local demand: between national strategy and people's demand, local demand can carry out energy
conservation work in a targeted way, which not only has reasonable planning and overall arrangement,
but also has the micro foundation of people. In order to carry out building energy conservation work in
various regions, it is necessary to combine regional climate, resource distribution and economic
development, and adapt measures to local conditions, so as to select the economic system and technical
methods in line with China's national conditions. Only in this way can energy saving work be effective.
The whole process control strategy is an important link of building energy conservation work, which
Building the geometric
Building structure
Use (when occupie
Hvac and lighting
Calculate monthly/annu
al energy consumption and carbon
dioxide emissions
Compared to "normal" annual
energy data
Production EPC and
asset rating
Fig. 5: National calculation method.
1646 Caijun Wang et al.
Vol. 18, No. 5 (Special Issue), 2019 • Nature Environment and Pollution Technology
at the grassroots level. Local demand: between national strategy and people’s demand, local demand can carry out energy conservation work in a targeted way, which not only has reasonable planning and overall arrangement, but also has the micro foundation of people. In order to carry out building energy conservation work in various regions, it is necessary to combine regional climate, resource distribution and economic development, and adapt measures to local conditions, so as to select the economic system and technical methods in line with China’s national conditions. Only in this way can energy saving work be effective. The whole process control strategy is an important link of building energy conservation work, which mainly includes four stages: research, planning, implementation and post-evaluation, forming a whole set of energy conservation process.
CONCLUSION
In public building management, various information will be generated in different stages of the building life cycle, and different management teams will also create and use a large amount of architectural information in the design, construction and operation stages. It is crucial to aggregate the vast amounts of information that are often scattered across different energy operations and maintenance systems. BIM model and BMS system can effectively solve the problem of data dispersion.
The practice shows that the BIM technology and energy management system (EMS), can be in 3 d models in real-time running status and intuitively show the whole building energy consumption information, help management find large public buildings energy consumption problem and call the police, energy-saving renovation suggestions are given, so that the user is more accurate and efficient for safety control, analysis of energy consumption, energy transformation, energy performance evaluation, such as energy management decision-making to provide the reference for managers.
The introduction of BIM technology, according to its visual function, information integration, simulation technology and other characteristics, starting from the design stage of building energy management, focusing on the control of design errors, inadequate research, data mismatch and other congenital problems. Secondly, FM concept will be brought into the later construction energy management to optimize from the aspects of strategic principles and measures.
REFERENCES
Abanda, F. H., and Byers, L. 2016. An investigation of the impact of building orientation on energy consumption in a domestic building using emerging BIM (building information modelling). Energy, 97: 517-527.
Ahmad, T., Aibinu, A., and Thaheem, M. J. 2017. BIM-based iterative tool for sustainable building design: a conceptual framework. Procedia Engineering, 180: 782-792.
Ilhan, B., and Yaman, H. 2016. Green building assessment tool (GBAT) for integrated BIM-based design decisions. Automation in Construc-tion, 70, S0926580516300814.
Kim, K., and Yu, J. 2016. BIM-based building energy load calculation system for designers. KSCE Journal of Civil Engineering, 20(2): 549-563.
Kim, S., Zadeh, P. A., Staub-French, S., Froese, T., and Cavka, B. T. 2016. Assessment of the impact of window size, position and orientation on building energy load using BIM. Procedia Engineering, 145: 1424-1431.
Kim, Y. C., Hong, W. H., Park, J. W., and Cha, G. W. 2017. An estima-tion framework for building information modelling (BIM)-based demolition waste by type. Waste Management and Research, 35(12): 0734242X1773638.
Mcglinn, K., Yuce, B., Wicaksono, H., Howell, S., and Rezgui, Y. 2017. Usability evaluation of a web-based tool for supporting holistic build-ing energy management. Automation in Construction, 84: 154-165.
Nicał, A. K., and Wodyński, W. 2016. Enhancing facility management through BIM 6d. Procedia Engineering, 164: 299-306.
Pishdadbozorgi, P., Gao, X., Eastman, C., and Self, A. P. 2018. Planning and developing facility management-enabled building information model (FM-enabled BIM). Automation in Construction, 87: 22-38.
Ugliotti, F. M., Dellosta, M., and Osello, A. 2016. BIM-based energy analysis using edilclima ec770 plug-in, case study archimede library EEB project. Procedia Engineering, 161: 3-8.

Study on Mathematical Modelling of Geological Hazard Assessment
Bin Zhou*, Dan He*† and Rodeano Roslee***Hunan Institute of Technology, Hunan 421002, China**Faculty of Science and Natural resources, University Malaysia Sabah, Malaysia†Corresponding author: Dan He
ABSTRACT
Zhijin county is one of the areas with fragile geological environment and frequent natural disasters in China. In recent years, with the intensification of human activities, the geological environment has been continuously damaged, causing geological disasters of different scales and serious life threats and property losses to people. Therefore, the purpose of introducing this mathematical model is to make the data more intelligent and professional by combining the data of geological disasters in mathematics. Based on the geological disaster monitoring, warning and decision support system of Guizhou province, this paper takes Zhijin county as the research object and uses Oracle database to manage the data by building and designing data structure and data model. The results show that geological hazard assessment can not only provide reliable data for analysis and research, but also provide reference value for similar database construction: (1) to construct spatial data model to realize effective correlation between spatial data and business data. (2) spatial entity objects have the characteristics of multi-dimension and polysemy, and “relational-object” mathematical modelling is adopted.
INTRODUCTION
Guizhou is a plateau slope zone, east to the department with more low mountain hills, has a strong karst terrain, there always erosion along the river in the direction of cutting, surfaces are broken seriously, residues of mountains, deep canyons, topographical features visible at any time. Guizhou has a unique karst geological environment, strong karst action; it has widely distributed variety of karst landforms, a variety of karst engineering geological problems and karst geological disasters. Because of these special geological features and geological structure, it has become a national key geological disaster management area. Zhijin county is located in Bijie area of Guizhou province, in the middle of the plateau, where the Liuchong river in the north source meets the Yanchi river in the upper reaches of the Wujiang river system in the south source mountain. Due to the relatively poor geographical conditions, geological structure and topography and other conditions are quite complex, located in a very fragile environment. With the rapid development of economy, the lack of attention to the environment in the process of economic construction and resource development, has led to frequent geological disasters and accidents. The scale and scope of disaster have been continuously expanded, causing great losses and inconvenience to local people and great losses to national property. The research object of this paper is Zhijin county, Guizhou province, where the disaster area is relatively wide and the frequency
of geological disasters is high, and the people are seriously threatened. According to the survey, as of December 2009, the county has a total of 211 potential geological disasters, including 3 debris flows, 43 collapses, 80 ground cracks and 81 landslides. According to preliminary statistics, by 2009, 6 people had died, over 3,000 houses had been destroyed, over 4,000 mu of farmland had been destroyed, and the direct economic loss reached 98 million yuan. In addition, there are many potential disaster spots in the region, including houses, schools, bridges, roads, farmland and so on. Threatened economic losses of up to 200 million yuan.
This paper takes the key scientific research project of Guizhou province “decision-making support system and geological disaster monitoring and warning” as the background, and takes “the construction of geological disaster database of Zhijin county” as the theme, discusses the construction process and application of geological disaster database, hoping to provide reference for the prediction and prevention of geological disasters in the future.
EARLIER RESEARCH
Mathematical modelling is the process of how to apply mathematics to real life (Sivakumar & Ghosh 2017). Mathematical modelling technology provides a basic evaluation mechanism for people to solve problems on the basis of collecting information and mining rules (Ismail-Zadeh et al. 2017). ArcGIS
Nat. Env. & Poll. Tech.Website: www.neptjournal.com
Received: 19-08-2019Accepted: 12-10-2019
Key Words:Geological disasterSpatial databaseData modelMathematical modelZhijin county
2019pp. 1647-1654 Vol. 18
p-ISSN: 0972-6268 No. 5 (Special Issue)
Nature Environment and Pollution Technology An International Quarterly Scientific Journal
Original Research Paper
e-ISSN: 2395-3454
Open Access
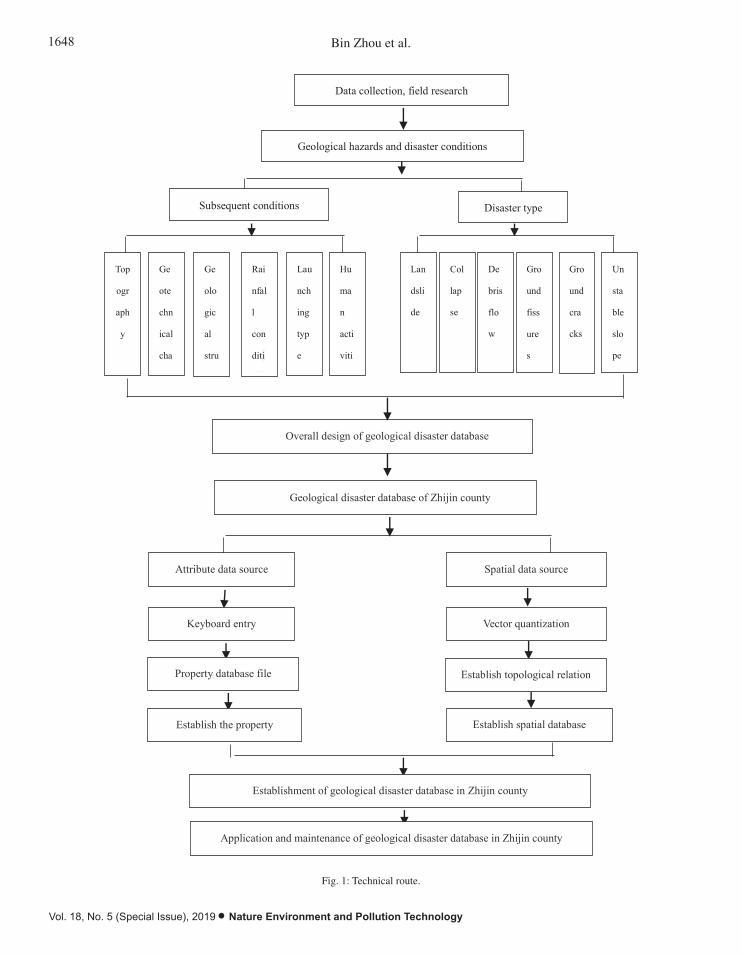
1648 Bin Zhou et al.
Vol. 18, No. 5 (Special Issue), 2019 • Nature Environment and Pollution Technology
a good way to
Fig.1: Technical route.
Results and Discussion
Data model design: Database is a place to store data. By formalizing data to describe the logical structure and operation of data, it is more convenient for users to process spatial data. The database model designer
Data collection, field research
Geological hazards and disaster conditions
Subsequent conditions Disaster type
Ge
ote
chn
ical
cha
ract
Ge
olo
gic
al
stru
ctur
Rai
nfal
l
con
diti
ons
Lau
nch
ing
typ
e
Hu
ma
n
acti
viti
es
Top
ogr
aph
y
Lan
dsli
de
Col
lap
se
De
bris
flo
w
Gro
und
fiss
ure
s
Gro
und
cra
cks
Un
sta
ble
slo
pe
Overall design of geological disaster database
Geological disaster database of Zhijin county
Attribute data source Spatial data source
Keyboard entry Vector quantization
Property database file Establish topological relation
Establish the property Establish spatial database
Establishment of geological disaster database in Zhijin county
Application and maintenance of geological disaster database in Zhijin county
Fig. 1: Technical route.

1649STUDY ON MATHEMATICAL MODELLING OF GEOLOGICAL HAZARD ASSESSMENT
Nature Environment and Pollution Technology • Vol. 18, No. 5 (Special Issue), 2019
spatial analysis and MATLAB mathematical modelling functions to build GIS-based GA-BP model (that is, genetic algorithm optimized BP neural network) to conduct nonlinear quantitative evaluation of the geological ecological environ-ment in the research area (Tao et al. 2017). Specifically, a previous study adopted construction operation results and ef-ficiency ratio to construct a scientific index system, combined subjective and objective evaluation methods, and carried out mathematical modelling and simulation calculation accord-ing to index weight and characteristic preference (Yepes et al. 2018). A study established a variable weight model based on incentive punishment and calculated the variable weight of each factor. On this basis, the EEGPs partition mathematical model is established (Echavarribravo et al. 2017). Karamouz (2017) used the performance evaluation model (k-pam) of Korea Atomic Energy Research Institute (KAERI) to carry out a new risk-based safety assessment method for the ge-ological disposal system of nuclear waste. A recent study combined the weighting method with the conventional cloud model and proposed a new water inrush evaluation method. In the evaluation of geological hazards, it is necessary to use artificial intelligence to accurately evaluate severe geologi-cal hazards (Manea et al. 2017). A research proposed a risk assessment method for geological disasters. By calculating the threat degree of geological hazards and the vulnerability of the subject affected by the hazards, the risk of geological hazards in counties and regions was evaluated by qualitative comprehensive evaluation (Filatov et al. 2019). Specifically, the evaluation index system is constructed and each index is quantitatively divided into four grades (Furlan et al. 2018). In addition, the discipline of geostatistics provides a variety of quantitative methods for the establishment of random models that conform to the measured data and spatial correlation (Xiao et al. 2018).
MATERIALS AND METHODS
With the rapid development of science and technology and the increasing amount of data, how to store and manage these data well becomes a question. Data types are also diverse, not only numbers, pictures, graphics and code. So, the applica-tion needs to have a high compatibility, different data types are stored and effectively combined, can be in a large number of data efficient, fast query their needs. Due to the large and diverse geological disaster data, how to process and manage this batch of data quickly and efficiently has become the primary problem of how to make use of geological disaster data. According to the national standards, industry standards and the actual application requirements, complete database design and construction of Zhijin county geological disaster, the data to make use of the Oracle database management, is a good way to manage database of Zhijin county geological
disaster, to better manage the geological disaster data, by constructing and designing the data structure, data model to manage the geological disaster data, technical route as shown in Fig. 1.
RESULTS AND DISCUSSION
Data model design: Database is a place to store data. By for-malizing data to describe the logical structure and operation of data, it is more convenient for users to process spatial data. The database model designer describes and expresses views through the Moaishu7 data logical relationships. In general, the data model consists of four parts: data structure, operation set and integrity rule set, as shown in Fig. 2:
The development of data model mainly goes through three stages: hierarchical model, mesh model and relational model. Moreover, the establishment of data model needs a high clear concept, mathematical basis and independent data as the foundation. Therefore, for the general database it is difficult to extend, cannot do too much operation, also cannot provide a good index mechanism between the ground and space data. The integration of spatial data was also very difficult and the performance was poor, so people started to try it with object orientation.
But, at present the object oriented database is not mature enough, cannot compare with general theoretical basis for solid data model, but it has some common data types and features, such as it has a certain scalability, it also has a cer-tain advantage in data query, so the GIS software integration data also begin ripping into objects to relational databases, such as MapInfo Spatial Ware, ESRI SDE, etc.
Conceptual model design: In other words, the conceptual data model, called information model, is developed and expanded based on the entity-relationship (E-R) theory. This model is mainly used for the conceptual design of data modelling.
When people do conceptual design for data modelling, the first step is to transform the real world into a conceptual world, and the second step is to transform the conceptual world into a machine world. It can also be understood that objective things can be analysed as Entity first. For the so-called CDM model, it does not need specific requirements for the computer system and DBNS system. The physical data model is the data model that CDM transforms into that a DBMS can support on the computer, namely CDM (Fig. 3).
CDM is a set of strictly defined model elements, through which the static and dynamic characteristics and constraints of the system can be accurately described. CDM mainly consists of three parts: data operation, data structure and integrity constraints.

1650 Bin Zhou et al.
Vol. 18, No. 5 (Special Issue), 2019 • Nature Environment and Pollution Technology
describes and expresses views through the Moaishu7 data logical relationships. In general, the data model consists of four parts: data structure, operation set and integrity rule set, as shown in Fig. 2:
Fig. 2: Geo Data Base model.
The development of data model mainly goes through three stages: hierarchical model, mesh model and relational model. Moreover, the establishment of data model needs a high clear concept, mathematical basis and independent data as the foundation. Therefore, for the general database it is difficult to extend, cannot do too much operation, also cannot provide a good index mechanism between the ground and space data. The integration of spatial data was also very difficult and the performance was poor, so people started to try it with object orientation.
But, at present the object oriented database is not mature enough, cannot compare with general theoretical basis for solid data model, but it has some common data types and features, such as it has a certain scalability, it also has a certain advantage in data query, so the GIS software integration data also begin ripping into objects to relational databases, such as MapInfo Spatial Ware, ESRI SDE, etc.
Conceptual Model Design: In other words, the conceptual data model, called information model, is developed and expanded based on the entity-relationship (E-R) theory. This model is mainly used for the conceptual design of data modelling.
When people do conceptual design for data modelling, the first step is to transform the real world into a conceptual world, and the second step is to transform the conceptual world into a machine world. It can also be understood that objective things can be analysed as Entity first. For the so-called CDM model, it does not need specific requirements for the computer system and DBNS system. The physical
Geo Data Base Data Set
Geographic Data Set Table
Tin Data Set Feature Data Set
Raster Data Set
Figure
Geometric network
Relationship Class
Attribute Object Class
Planning
Characteristics Class
Fig. 2: Geo Data Base model.
data model is the data model that CDM transforms into that a DBMS can support on the computer, namely CDM (Fig. 3).
CDM is a set of strictly defined model elements, through which the static and dynamic characteristics and constraints of the system can be accurately described. CDM mainly consists of three parts: data operation, data structure and integrity constraints.
(1) According to the expression form of data structure, it is divided into data entity and data attribute;
(2) Data operation expression is made by recording operations in the data entity, including deletion, insertion, query, modification, etc.;
(3) Data integrity constraints are used for complete constraint expression and referential integrity constraints between different data
Fig. 3: Conceptual data model diagram.
Logical Model Design: Logical data model is transformed from conceptual model, but it can describe the logical structure of geographical data representation in GIS and the content of database, which is the middle level of abstract data. Common logical data models include network data model, relational data model and hierarchical data model. The database design model is mainly determined by the management system. The geological disaster database of Zhijin county is managed by oracle database. Therefore, the logical model design is selected for this database design.
GIS spatial data model
Distributed data Spatiotemporal
Network data Digital elevation
Conceptual design model
Object Model
Entity
Entity
Unified
Data Organization
Attribute data model
Object Relational model
Vector Data model Raster data model
Conceptual data model
Fig. 3: Conceptual data model diagram.
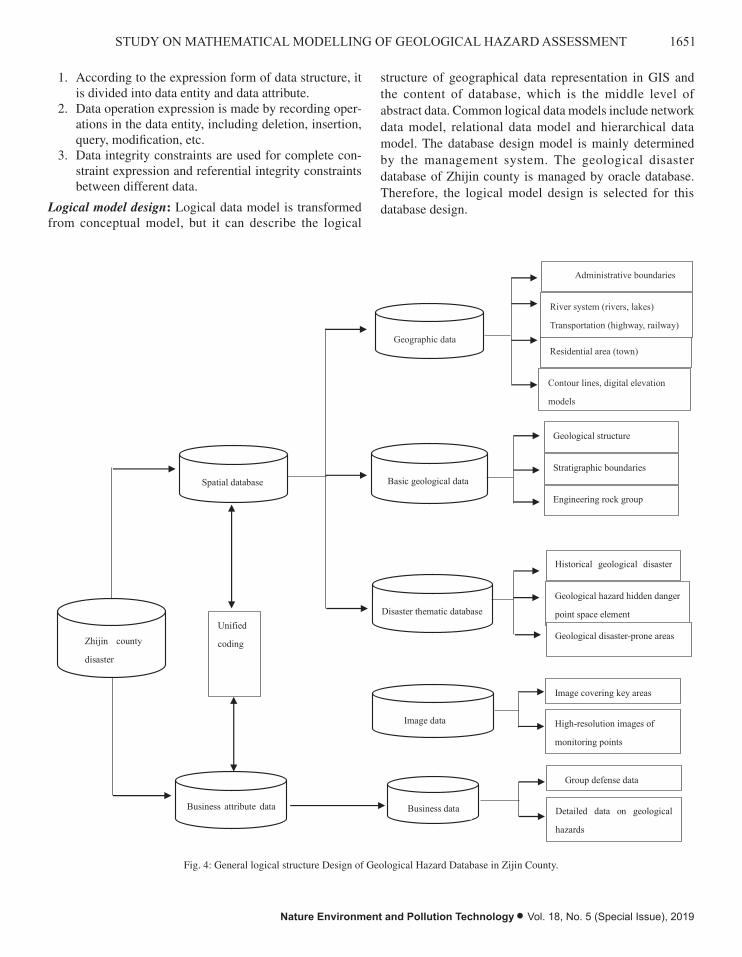
1651STUDY ON MATHEMATICAL MODELLING OF GEOLOGICAL HAZARD ASSESSMENT
Nature Environment and Pollution Technology • Vol. 18, No. 5 (Special Issue), 2019
1. According to the expression form of data structure, it is divided into data entity and data attribute.
2. Data operation expression is made by recording oper-ations in the data entity, including deletion, insertion, query, modification, etc.
3. Data integrity constraints are used for complete con-straint expression and referential integrity constraints between different data.
Logical model design: Logical data model is transformed from conceptual model, but it can describe the logical
structure of geographical data representation in GIS and the content of database, which is the middle level of abstract data. Common logical data models include network data model, relational data model and hierarchical data model. The database design model is mainly determined by the management system. The geological disaster database of Zhijin county is managed by oracle database. Therefore, the logical model design is selected for this database design.
Fig. 4: General logical structure Design of Geological Hazard Database in Zijin County. Physical Model Design: Physical model is an abstract data model, including spatial storage and acquisition methods of spatial data as well as its physical organization and database information storage structure. File index is one of the commonly used access methods, file index general methods are R tree, B tree, quadtree, etc. Only by understanding the relationship between entities in the real world can the established data model accurately reflect the relationship in the real world. Among the conceptual models, the E-R model is one of the most powerful tools of E, the connection between E-entities and R-entities (E), so it is also called the entity-connection model. Using the E-R model, the E-R graph can express the entities in the real world and their relations directly. Entity, attribute and relation are the three basic components of E-R graph. Without information storage structure and access paths, and questions about the computer case, E-R model to describe the real world is better, the E-R model as a conceptual model,
空间数据库
Geographic data
Administrative boundaries
River system (rivers, lakes)
Transportation (highway, railway)
Residential area (town)
Contour lines, digital elevation
models
Basic geological data Stratigraphic boundaries
Geological structure
Engineering rock group
Zhijin county
disaster
Unified
coding
Spatial database
Disaster thematic database
Historical geological disaster
space point Geological hazard hidden danger
point space element
Geological disaster-prone areas
Image data
Image covering key areas
High-resolution images of
monitoring points
Business data Business attribute data
Group defense data
Detailed data on geological
hazards
Fig. 4: General logical structure Design of Geological Hazard Database in Zijin County.
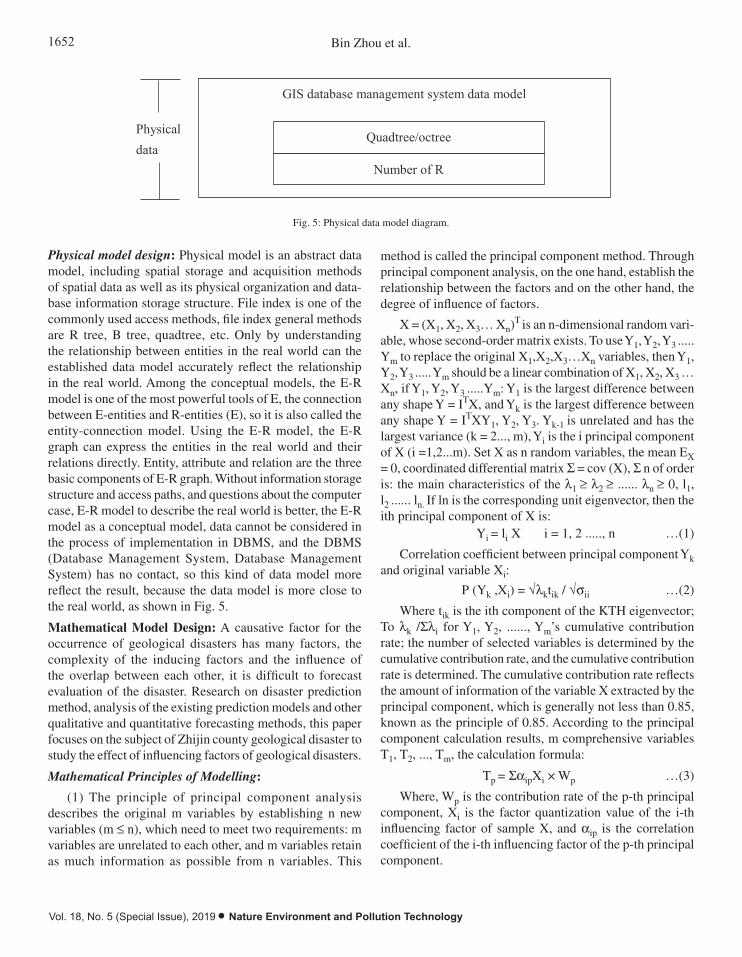
1652 Bin Zhou et al.
Vol. 18, No. 5 (Special Issue), 2019 • Nature Environment and Pollution Technology
data cannot be considered in the process of implementation in DBMS, and the DBMS (Database Management System, Database Management System) has no contact, so this kind of data model more reflect the result, because the data model is more close to the real world, as shown in Fig. 5.
Fig. 5: Physical data model diagram.
Mathematical Model Design: A causative factor for the occurrence of geological disasters has many factors, the complexity of the inducing factors and the influence of the overlap between each other, it is difficult to forecast evaluation of the disaster. Research on disaster prediction method, analysis of the existing prediction models and other qualitative and quantitative forecasting methods, this paper focuses on the subject of Zhijin county geological disaster to study the effect of influencing factors of geological disasters.
Mathematical Principles of Modelling:
(1) The principle of principal component analysis describes the original m variables by establishing n new variables (m≤n), which need to meet two requirements: m variables are unrelated to each other, and m variables retain as much information as possible from n variables. This method is called the principal component method. Through principal component analysis, on the one hand, establish the relationship between the factors and on the other hand, the degree of influence of factors.
X= (X1,X2,X3…Xn)T is an n-dimensional random variable, whose second-order matrix exists. To use Y1,Y2,Y3.....Ym to replace the original X1,X2,X3…Xn variables, then Y1,Y2,Y3.....Ym should be a linear combination of X1,X2,X3…Xn, if Y1,Y2,Y3.....Ym: Y1 is the largest difference between any shape Y=ITX, and Yk is the largest difference between any shape Y=ITXY1,Y2,Y3.Yk-1 is unrelated and has the largest variance (k=2...,m), Yi is the i principal component of X (i =1,2...m). Set X as n random variables, the mean EX = 0, coordinated differential matrix Σ=cov (X), Σ n of order is: the main characteristics of the λ1 ≥ λ2 ≥......≥ λn≥ 0, l1, l2......ln. If ln is the corresponding unit eigenvector, then the ith principal component of X is:
Yi=li X i=1,2.....,n …(1)
Correlation coefficient between principal component Yk and original variable Xi:
Ρ (Yk ,Xi) =√λktik / √σii …(2)
Where tik is the ith component of the KTH eigenvector; Toλk /Σλi for Y1, Y2,......,Ym's cumulative contribution rate; the number of selected variables is determined by the cumulative contribution rate, and the cumulative contribution rate is determined. The cumulative contribution rate reflects the amount of
GIS database management system data model
Quadtree/octree
Number of R
Physical data
Fig. 5: Physical data model diagram.
Physical model design: Physical model is an abstract data model, including spatial storage and acquisition methods of spatial data as well as its physical organization and data-base information storage structure. File index is one of the commonly used access methods, file index general methods are R tree, B tree, quadtree, etc. Only by understanding the relationship between entities in the real world can the established data model accurately reflect the relationship in the real world. Among the conceptual models, the E-R model is one of the most powerful tools of E, the connection between E-entities and R-entities (E), so it is also called the entity-connection model. Using the E-R model, the E-R graph can express the entities in the real world and their relations directly. Entity, attribute and relation are the three basic components of E-R graph. Without information storage structure and access paths, and questions about the computer case, E-R model to describe the real world is better, the E-R model as a conceptual model, data cannot be considered in the process of implementation in DBMS, and the DBMS (Database Management System, Database Management System) has no contact, so this kind of data model more reflect the result, because the data model is more close to the real world, as shown in Fig. 5.
Mathematical Model Design: A causative factor for the occurrence of geological disasters has many factors, the complexity of the inducing factors and the influence of the overlap between each other, it is difficult to forecast evaluation of the disaster. Research on disaster prediction method, analysis of the existing prediction models and other qualitative and quantitative forecasting methods, this paper focuses on the subject of Zhijin county geological disaster to study the effect of influencing factors of geological disasters.
Mathematical Principles of Modelling:
(1) The principle of principal component analysis describes the original m variables by establishing n new variables (m £ n), which need to meet two requirements: m variables are unrelated to each other, and m variables retain as much information as possible from n variables. This
method is called the principal component method. Through principal component analysis, on the one hand, establish the relationship between the factors and on the other hand, the degree of influence of factors.
X = (X1, X2, X3… Xn)T is an n-dimensional random vari-
able, whose second-order matrix exists. To use Y1, Y2, Y3 ..... Ym to replace the original X1,X2,X3…Xn variables, then Y1, Y2, Y3 ..... Ym should be a linear combination of X1, X2, X3 … Xn, if Y1, Y2, Y3 .....Ym: Y1 is the largest difference between any shape Y = ITX, and Yk is the largest difference between any shape Y = ITXY1, Y2, Y3. Yk-1 is unrelated and has the largest variance (k = 2..., m), Yi is the i principal component of X (i =1,2...m). Set X as n random variables, the mean EX = 0, coordinated differential matrix S = cov (X), S n of order is: the main characteristics of the l1 ≥ l2 ≥ ...... ln ≥ 0, l1, l2 ...... ln. If ln is the corresponding unit eigenvector, then the ith principal component of X is:
Yi = li X i = 1, 2 ....., n …(1)
Correlation coefficient between principal component Yk and original variable Xi:
P (Yk ,Xi) = ÷lktik / ÷sii …(2)
Where tik is the ith component of the KTH eigenvector; To lk /Sli for Y1, Y2, ......, Ym’s cumulative contribution rate; the number of selected variables is determined by the cumulative contribution rate, and the cumulative contribution rate is determined. The cumulative contribution rate reflects the amount of information of the variable X extracted by the principal component, which is generally not less than 0.85, known as the principle of 0.85. According to the principal component calculation results, m comprehensive variables T1, T2, ..., Tm, the calculation formula:
Tp = SaipXi × Wp …(3)
Where, Wp is the contribution rate of the p-th principal component, Xi is the factor quantization value of the i-th influencing factor of sample X, and aip is the correlation coefficient of the i-th influencing factor of the p-th principal component.
1653STUDY ON MATHEMATICAL MODELLING OF GEOLOGICAL HAZARD ASSESSMENT
Nature Environment and Pollution Technology • Vol. 18, No. 5 (Special Issue), 2019
(2) Markov Distance Test
Let’s say m (m > 2) population G1, G2, …Gm, mean codif-ference matrices are μ1, μ2, …μm and S1, S2, … Sm and its value to calculate unbiased estimator known or according to the sample. A sample X is discriminated, and the distances from X to m populations are calculated respectively
D2 (X, Gi) = (X - μi) TS-1 (X - μi) i = 1, 2 ... m …(4)
Let Gi’s total Ri = {X: D2 (X, Gj) £ minD2 (X, Gj)}, and the discriminant rule is: XŒGi, when X falls in Ri (i = 1, 2 ... m)
Establishment of the model: Based on principal component analysis and discriminant analysis, a regional disaster prediction model is established. The modelling steps are as follows:
1. Determine the influencing factors of disasters and determine the influencing factors according to the mechanism of the influencing factors;
2. Taking the influencing factors as random variables and the factor factors as the specific values of variables, the quantitative criteria of influencing factors were established according to the role degree of the factor factors by random assignment;
3. Collect disaster data of the study area, analyse the factors affecting the factors, quantify the published disaster samples according to the quantitative criteria, and obtain the quantitative matrix of the disasters, denoted as A1;
4. Conduct principal component analysis onA1, extract principal components F1, F2, ....Fm (m £ n, n is the number of influencing factors), and calculate factor load matrix A2 and the contribution rate of each principal component W1,W2,.....Wm;
5. According to the formula (3), the specific expressions of the comprehensive variables are calculated to obtain the simplified data matrix A3(Te);
6. To simplify the A3 for disaster similar data matrix eigenvalue μ and S unbiased estimator û;
7. The existing geological disaster points are judged back, and the discriminant function adopts the Markov distance, takes the threshold Dk and estimates the error rate, divides the Dk, and links it with the hazard degree;
8. For any area to be forecasted, the geological conditions are analysed to determine the factor states of influencing factors. The factor factors are quantified by quantitative criteria. According to the load matrix A2 of disaster factors and the corresponding principal component
contribution rate, the comprehensive variable vector H = (T1, T2 ,... TP), and calculate the Markov distance between the vector and the disaster occurrence class according to the following formula
DH = (H - û)TS-1(H - û) …(5)
CONCLUSION
In this paper, the related standards of geological disaster database in Zhijin county are studied, and the standards of geological disaster database are established. The characteris-tics of basic geological disaster data are analysed. The design and construction of the basic geological disaster database are completed. This paper studies the optimization technology of geological disaster data access based on cache.
The integrated processing of geological disaster spatial data and attribute data is realized through database research and development, the correlation between thematic data is enhanced, the effective management, maintenance and efficient utilization of geological disaster information are realized, and effective data service and technical support are provided for various functional systems of the monitoring and warning platform.
The main achievements of this paper are as follows:
1. To study the data standards of geological hazards and establish the data standards of the basic database of geological hazards in Zhijin county according to the actual situation of the basic data of geological hazards in Zhijin county.
2. The mathematical model was constructed to extract the principal component, which was the comprehensive variable of each factor, and the relationship between the influencing factors and the principal component was reflected by the load of each factor, and the mathematical expression between the principal component and the variables of each influencing factor was determined.
REFERENCES
Echavarribravo, V., Paterson, L., Aspray, T. J., Porter, J. S., Winson, M. K. and Hartl, M. 2017. Natural marine bacteria as model organisms for the hazard-assessment of consumer products containing silver nanopar-ticles. Marine Environmental Research, 130: S0141113617303653.
Filatov, D. M. and Lyubushin, A. A. 2019. Precursory analysis of GPS time series for seismic hazard assessment. Pure and Applied Geophysics, pp. 22-1.
Furlan, E., Torresan, S., Critto, A. and Marcomini, A. 2018. Spatially explicit risk approach for multi-hazard assessment and management in marine environment: the case study of the Adriatic sea. Science of the Total Environment, 618: 1008-1023.

1654 Bin Zhou et al.
Vol. 18, No. 5 (Special Issue), 2019 • Nature Environment and Pollution Technology
Ismail-Zadeh, A., Soloviev, A., Sokolov, V., Vorobieva, I., Müller, B. and Schilling, F. 2017. Quantitative modelling of the lithosphere dynamics, earthquakes and seismic hazard. Tectonophysics, S0040195117301415.
Karamouz, M., Razmi, A., Nazif, S. and Zahmatkesh, Z. 2017. Integration of inland and coastal storms for flood hazard assessment using a dis-tributed hydrologic model. Environmental Earth Sciences, 76(11): 395.
Manea, E.F., Michel, C., Hobiger, M., Fäh, D., Cioflan, C.O. and Radulian, M. 2017. Analysis of the seismic wavefield in the Moesian platform (Bucharest area) for hazard assessment purposes. Geophysical Journal International, 210(3): 1609-1622.
Sivakumar, R. and Ghosh, S. 2017. Earthquake hazard assessment through geospatial model and development of Eahaas to tool for visualization:
an integrated geological and geoinformatics approach. Environmental Earth Sciences, 76(12): 442.
Tao, W., Liu, J., Shi, J. and Wu, S. 2017. The influence of DEM resolution on seismic landslide hazard assessment based upon the Newmark displacement method: a case study in the loess area of Tianshui, Chi-na. Environmental Earth Sciences, 76(17): 604.
Xiao, Y., Yi, S. and Tang, Z. 2018. A spatially explicit multi-criteria analysis method on solving spatial heterogeneity problems for flood hazard assessment. Water Resources Management, 32(10): 1-19.
Yepes, H., Audin, L., Alvarado, A., Beauval, C., Aguilar, J. and Font, Y. et al. 2018. A new view for the geodynamics of Ecuador: implication in seismogenic source definition and seismic hazard assessment. Tecton-ics, 35(5): 1249-1279.
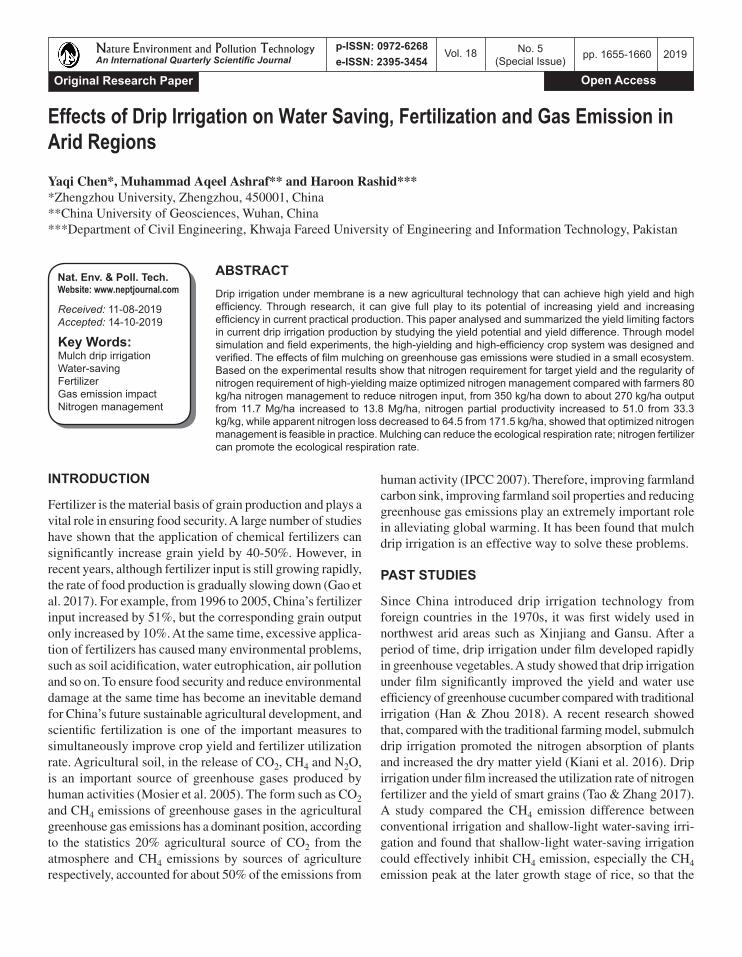
Effects of Drip Irrigation on Water Saving, Fertilization and Gas Emission in Arid Regions
Yaqi Chen*, Muhammad Aqeel Ashraf** and Haroon Rashid****Zhengzhou University, Zhengzhou, 450001, China**China University of Geosciences, Wuhan, China***Department of Civil Engineering, Khwaja Fareed University of Engineering and Information Technology, Pakistan
ABSTRACT
Drip irrigation under membrane is a new agricultural technology that can achieve high yield and high efficiency. Through research, it can give full play to its potential of increasing yield and increasing efficiency in current practical production. This paper analysed and summarized the yield limiting factors in current drip irrigation production by studying the yield potential and yield difference. Through model simulation and field experiments, the high-yielding and high-efficiency crop system was designed and verified. The effects of film mulching on greenhouse gas emissions were studied in a small ecosystem. Based on the experimental results show that nitrogen requirement for target yield and the regularity of nitrogen requirement of high-yielding maize optimized nitrogen management compared with farmers 80 kg/ha nitrogen management to reduce nitrogen input, from 350 kg/ha down to about 270 kg/ha output from 11.7 Mg/ha increased to 13.8 Mg/ha, nitrogen partial productivity increased to 51.0 from 33.3 kg/kg, while apparent nitrogen loss decreased to 64.5 from 171.5 kg/ha, showed that optimized nitrogen management is feasible in practice. Mulching can reduce the ecological respiration rate; nitrogen fertilizer can promote the ecological respiration rate.
INTRODUCTION
Fertilizer is the material basis of grain production and plays a vital role in ensuring food security. A large number of studies have shown that the application of chemical fertilizers can significantly increase grain yield by 40-50%. However, in recent years, although fertilizer input is still growing rapidly, the rate of food production is gradually slowing down (Gao et al. 2017). For example, from 1996 to 2005, China’s fertilizer input increased by 51%, but the corresponding grain output only increased by 10%. At the same time, excessive applica-tion of fertilizers has caused many environmental problems, such as soil acidification, water eutrophication, air pollution and so on. To ensure food security and reduce environmental damage at the same time has become an inevitable demand for China’s future sustainable agricultural development, and scientific fertilization is one of the important measures to simultaneously improve crop yield and fertilizer utilization rate. Agricultural soil, in the release of CO2, CH4 and N2O, is an important source of greenhouse gases produced by human activities (Mosier et al. 2005). The form such as CO2 and CH4 emissions of greenhouse gases in the agricultural greenhouse gas emissions has a dominant position, according to the statistics 20% agricultural source of CO2 from the atmosphere and CH4 emissions by sources of agriculture respectively, accounted for about 50% of the emissions from
human activity (IPCC 2007). Therefore, improving farmland carbon sink, improving farmland soil properties and reducing greenhouse gas emissions play an extremely important role in alleviating global warming. It has been found that mulch drip irrigation is an effective way to solve these problems.
PAST STUDIES
Since China introduced drip irrigation technology from foreign countries in the 1970s, it was first widely used in northwest arid areas such as Xinjiang and Gansu. After a period of time, drip irrigation under film developed rapidly in greenhouse vegetables. A study showed that drip irrigation under film significantly improved the yield and water use efficiency of greenhouse cucumber compared with traditional irrigation (Han & Zhou 2018). A recent research showed that, compared with the traditional farming model, submulch drip irrigation promoted the nitrogen absorption of plants and increased the dry matter yield (Kiani et al. 2016). Drip irrigation under film increased the utilization rate of nitrogen fertilizer and the yield of smart grains (Tao & Zhang 2017). A study compared the CH4 emission difference between conventional irrigation and shallow-light water-saving irri-gation and found that shallow-light water-saving irrigation could effectively inhibit CH4 emission, especially the CH4 emission peak at the later growth stage of rice, so that the
Nat. Env. & Poll. Tech.Website: www.neptjournal.com
Received: 11-08-2019Accepted: 14-10-2019
Key Words:Mulch drip irrigationWater-savingFertilizerGas emission impactNitrogen management
2019pp. 1655-1660 Vol. 18
p-ISSN: 0972-6268 No. 5 (Special Issue)
Nature Environment and Pollution Technology An International Quarterly Scientific Journal
Original Research Paper
e-ISSN: 2395-3454
Open Access
1656 Yaqi Chen et al.
Vol. 18, No. 5 (Special Issue), 2019 • Nature Environment and Pollution Technology
emissions of early rice and late rice were significantly lower than the control, and the emission reduction range of late rice was larger (Wang et al. 2018a).
The innovation of this paper is to design and test the high-yielding and high-efficiency film drip irrigation system. Compared with the traditional high-yielding system, under the condition of maintaining the high-yielding level, the in-put of fertilizer and irrigation is greatly reduced, which has better environmental benefits. The above high yield system was verified and adjusted in the field from the aspects of nitrogen fertilizer management and fertilization times, and the comprehensive management system of submulch drip 2 irrigation in arid areas was finally established. Soil CH4 emissions of each treatment in the two-year growth season were regularly observed by the static-black box method, and the seasonal and annual changes of soil CH4 emissions of each treatment were analysed. The annual cumulative emissions of CH4 in each treatment were estimated, and the effects of mulching and fertilization on CH4 were analysed and compared.
SYSTEM DESIGN METHOD
Effects of Drip Irrigation on Maize yield Difference
Study area overview: Generally speaking, China’s corn pro-duction areas can be divided into four regions, of which the corn sown area in the main corn producing areas in northeast China is 10.3 million hectares, with a total yield of 581 mil-lion tons. Northeast corn production area is mainly located in Beishen 40 degrees W North. The region belongs to the cold temperate zone, humid, semi-humid stream climate, low temperature in winter and short frost-free period. 72 weather stations in the region from 1970 to 2009 data show that the average temperature of 4.9°C, the highest 11.1°C, lowest 0.5°C. The average annual rainfall in the region is 4mm, %60 concentrated in June to September. Because early frost often occurs in late September and early October, corn is usually planted in the spring (April to May). In recent years, drip irrigation under membrane has developed rapidly in this area.
The data source: The model needs to input meteorological data, mainly including solar radiation, maximum and mini-mum temperature (Wang et al. 2018b). In order to simulate effectively, the model also needs accurate planting and har-vest dates of crops, as well as the density. In this study, 14 experimental sites, easy to achieve high yield of maize, were selected in the northeast spring maize production area. Solar radiation, highs and lows come from weather stations near each point. Sowing and harvesting times and densities were derived from plot data in the literature, and the missing data were consulted with local agronomists. In order to understand
the yield potential of drip irrigation under mulch in northeast spring maize, this study selected the model-based yield dif-ference calculation method. The specific calculation method is as follows: model-based yield difference = simulated yield potential - average yield of farmers (Wu et al. 2017).
Design of Optimal Nitrogen Management for Drip Irrigation Maize under Membrane
Study area profile: Field trials were conducted in Ganan county, Jilin province from 2014 to 2015. The soil type is pennaceous calcium black soil with pH of 7.9, organic matter content of 18.2 g/kg, total nitrogen of 1.32 g/kg and total scale of 0.49 g/kg. The climate of this region belongs to temperate continental monsoon climate, cold in winter and hot in sum-mer. Corn in this area is planted in April and ripens in early October. The annual average temperature of corn growing season in this region is 16.2-20.9°C, and the average annual rainfall is about 320mm. More than 70% of the rainfall is con-centrated in the corn growing season from May to September. The rainfall, average temperature and average sunshine in the test year (2014-2015) are shown in Fig.1.
This experiment is a completely randomized block group experiment, with 6 treatments: (1) control treatment without nitrogen fertilizer (CK); (2) optimize nitrogen application (ONR), and determine the total amount of ni-trogen fertilizer and the proportion of each use according to the target yield and the nitrogen fertilizer demand rule in each key growth period; (3) nitrogen application was optimized and up-regulated; (4) nitrogen application was optimized and down-regulated; (5) optimize and increase nitrogen application; (6) traditional fertilization treatment for farmers. Based on the investigation of local farmers, 350kg/ha of nitrogen fertilizer was applied once before sowing. Each treatment is set to be repeated for three times, and the residential area is 300m2. The maize variety is Limin Qiao with planting density of 85,000 plants per hectare. In the experiment, 30% was used as the base fertilizer and the rest 70% was used as the top fertilizer. Nitrogen fertilizer was applied six times, before sowing, six leaf stage, ten leaf stage, silking stage, ten days after silking stage and milk ripening stage. The optimal nitrogen fertilizer amount was determined according to the nitrogen absorption amount in the six growing stages of maize. In this study, the theoret-ical nitrogen demand for yield potential 115.7 Mg/ha was 273 kg/ha. Therefore, the total amount of nitrogen fertilizer controlled in this experiment was 270 kg/ha. In 2014 and 2015, the nitrogen fertilizer with optimized nitrogen ap-plication was divided into 6 times for application, and 81, 27, 54, 54, 27 and 27 kg/ha were applied in pre-sowing, six leaf stage, ten leaf stage, silking stage, 10 days after silking stage and milk ripening stage. The fertilization time of the
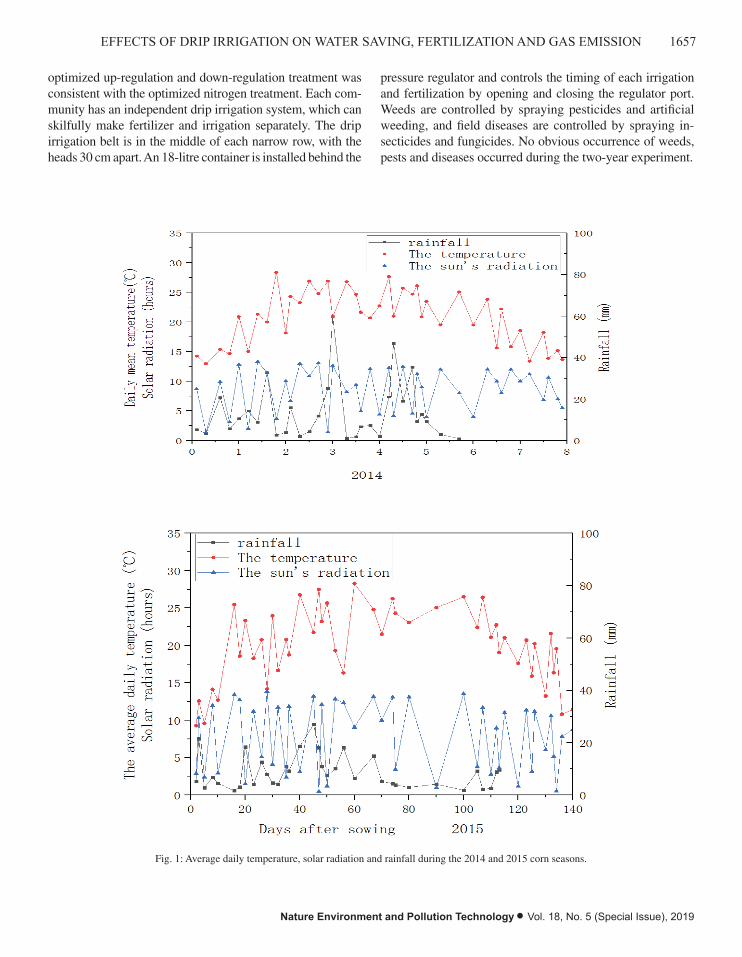
1657EFFECTS OF DRIP IRRIGATION ON WATER SAVING, FERTILIZATION AND GAS EMISSION
Nature Environment and Pollution Technology • Vol. 18, No. 5 (Special Issue), 2019
optimized up-regulation and down-regulation treatment was consistent with the optimized nitrogen treatment. Each com-munity has an independent drip irrigation system, which can skilfully make fertilizer and irrigation separately. The drip irrigation belt is in the middle of each narrow row, with the heads 30 cm apart. An 18-litre container is installed behind the
pressure regulator and controls the timing of each irrigation and fertilization by opening and closing the regulator port. Weeds are controlled by spraying pesticides and artificial weeding, and field diseases are controlled by spraying in-secticides and fungicides. No obvious occurrence of weeds, pests and diseases occurred during the two-year experiment.
degrees W North. The region belongs to the cold temperate zone, humid, semi-humid stream climate, low temperature in winter and short frost-free period. 72 weather stations in the region from 1970 to 2009 data show that the average temperature of 4.9°C, the highest 11.1°C, lowest 0.5°C. The average annual rainfall in the region is 4mm, 60% concentrated in June to September. Because early frost often occurs in late September and early October, corn is usually planted in the spring (April to May). In recent years, drip irrigation under membrane has developed rapidly in this area.
The data source: The model needs to input meteorological data, mainly including solar radiation, maximum and minimum temperature (Wang et al. 2018b). In order to simulate effectively, the model also needs accurate planting and harvest dates of crops, as well as the density. In this study, 14 experimental sites, easy to achieve high yield of maize, were selected in the northeast spring maize production area. Solar radiation, highs and lows come from weather stations near each point. Sowing and harvesting times and densities were derived from plot data in the literature, and the missing data were consulted with local agronomists. In order to understand the yield potential of drip irrigation under mulch in northeast spring maize, this study selected the model-based yield difference calculation method. The specific calculation method is as follows: model-based yield difference = simulated yield potential - average yield of farmers (Wu et al. 2017).
Design of optimal nitrogen management for drip irrigation maize under membrane
Study area profile: Field trials were conducted in Ganan county, Jilin province from 2014 to 2015. The soil type is pennaceous calcium black soil with pH of 7.9, organic matter content of 18.2g/kg, total nitrogen of 1.32g/kg and total scale of 0.49g/kg. The climate of this region belongs to temperate continental monsoon climate, cold in winter and hot in summer. Corn in this area is planted in April and ripens in early October. The annual average temperature of corn growing season in this region is 16.2-20.9°C, and the average annual rainfall is about 320mm. More than 70% of the rainfall is concentrated in the corn growing season from May to September. The rainfall, average temperature and average sunshine in the test year (2014-2015) are shown in Fig.1.
Fig. 1: Average daily temperature, solar radiation and rainfall during the 2014 and 2015 corn seasons.
This experiment is a completely randomized block group experiment, with 6 treatments: (1) control treatment without nitrogen fertilizer (CK); (2) optimize nitrogen application (ONR), and determine the total amount of nitrogen fertilizer and the proportion of each use according to the target yield and the nitrogen fertilizer demand rule in each key growth period; (3) nitrogen application was optimized and up-regulated; (4) nitrogen application was optimized and down-regulated; (5) optimize and increase nitrogen application; (6) traditional fertilization treatment for farmers. Based on the investigation of local farmers, 350kg/ha of nitrogen fertilizer was applied once before sowing. Each treatment is set to be repeated for three times, and the residential area is 300m2. The maize variety is Limin Qiao with planting density of 85,000 plants per hectare. In the experiment, 30% was used as the base fertilizer and the rest 70% was used as the top fertilizer. Nitrogen fertilizer was applied six times, before sowing, six leaf stage, ten leaf stage, silking stage, ten days after silking stage and milk ripening stage. The optimal nitrogen fertilizer amount was determined according to the nitrogen absorption amount in the six growing stages of maize. In this study, the theoretical nitrogen demand for yield potential 115.7Mg/ha was 273kg/ha. Therefore, the total amount of nitrogen fertilizer controlled in this experiment was 270kg/ha. In 2014 and 2015, the nitrogen fertilizer with optimized nitrogen application was divided into 6 times for application, and 81, 27, 54, 54, 27 and 27kg/ha were applied in pre-sowing, six leaf stage, ten leaf stage, silking stage, 10 days after silking stage and milk ripening stage. The fertilization time of the optimized up-regulation and down-regulation treatment was consistent with the optimized nitrogen treatment. Each community has an independent drip irrigation system, which can skilfully make fertilizer and irrigation separately. The drip irrigation belt is in the middle of each narrow row, with the heads 30cm apart. An 18-litre container is installed behind the pressure regulator and controls the timing of each irrigation and fertilization by opening and closing the regulator port. Weeds are controlled by spraying pesticides and artificial weeding, and field diseases are controlled by spraying insecticides and fungicides. No obvious occurrence of weeds, pests and diseases occurred during the two-year experiment.
Gas collection design
Fig. 1: Average daily temperature, solar radiation and rainfall during the 2014 and 2015 corn seasons.
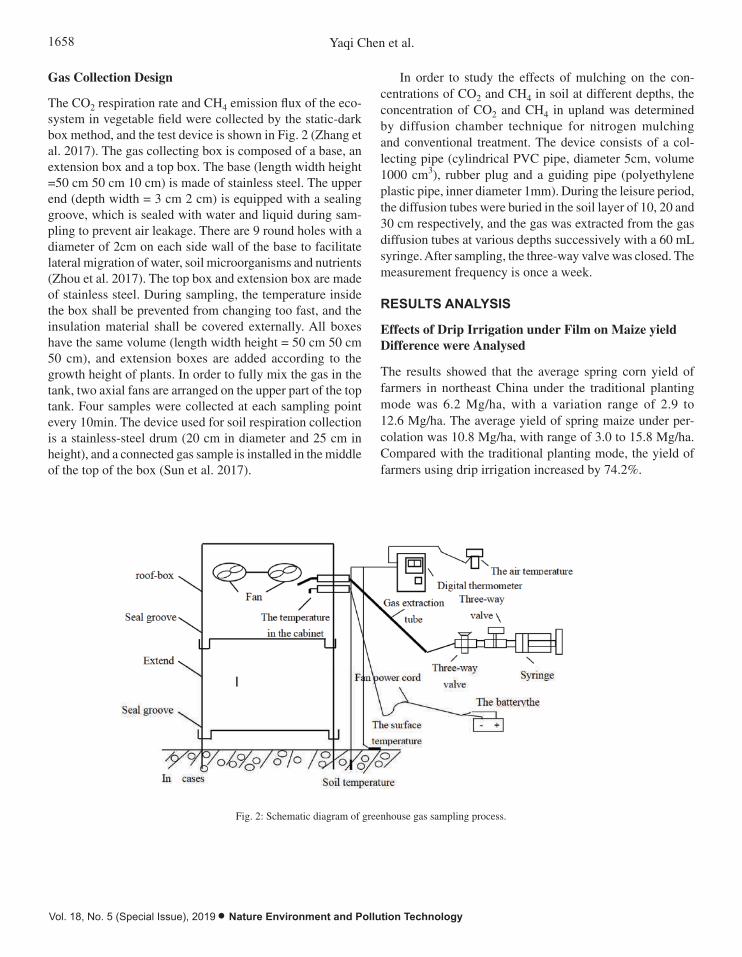
1658 Yaqi Chen et al.
Vol. 18, No. 5 (Special Issue), 2019 • Nature Environment and Pollution Technology
Gas Collection Design
The CO2 respiration rate and CH4 emission flux of the eco-system in vegetable field were collected by the static-dark box method, and the test device is shown in Fig. 2 (Zhang et al. 2017). The gas collecting box is composed of a base, an extension box and a top box. The base (length width height =50 cm 50 cm 10 cm) is made of stainless steel. The upper end (depth width = 3 cm 2 cm) is equipped with a sealing groove, which is sealed with water and liquid during sam-pling to prevent air leakage. There are 9 round holes with a diameter of 2cm on each side wall of the base to facilitate lateral migration of water, soil microorganisms and nutrients (Zhou et al. 2017). The top box and extension box are made of stainless steel. During sampling, the temperature inside the box shall be prevented from changing too fast, and the insulation material shall be covered externally. All boxes have the same volume (length width height = 50 cm 50 cm 50 cm), and extension boxes are added according to the growth height of plants. In order to fully mix the gas in the tank, two axial fans are arranged on the upper part of the top tank. Four samples were collected at each sampling point every 10min. The device used for soil respiration collection is a stainless-steel drum (20 cm in diameter and 25 cm in height), and a connected gas sample is installed in the middle of the top of the box (Sun et al. 2017).
In order to study the effects of mulching on the con-centrations of CO2 and CH4 in soil at different depths, the concentration of CO2 and CH4 in upland was determined by diffusion chamber technique for nitrogen mulching and conventional treatment. The device consists of a col-lecting pipe (cylindrical PVC pipe, diameter 5cm, volume 1000 cm3), rubber plug and a guiding pipe (polyethylene plastic pipe, inner diameter 1mm). During the leisure period, the diffusion tubes were buried in the soil layer of 10, 20 and 30 cm respectively, and the gas was extracted from the gas diffusion tubes at various depths successively with a 60 mL syringe. After sampling, the three-way valve was closed. The measurement frequency is once a week.
RESULTS ANALYSIS
Effects of Drip Irrigation under Film on Maize yield Difference were Analysed
The results showed that the average spring corn yield of farmers in northeast China under the traditional planting mode was 6.2 Mg/ha, with a variation range of 2.9 to 12.6 Mg/ha. The average yield of spring maize under per-colation was 10.8 Mg/ha, with range of 3.0 to 15.8 Mg/ha. Compared with the traditional planting mode, the yield of farmers using drip irrigation increased by 74.2%.
Fig. 2: Schematic diagram of greenhouse gas sampling process.

1659EFFECTS OF DRIP IRRIGATION ON WATER SAVING, FERTILIZATION AND GAS EMISSION
Nature Environment and Pollution Technology • Vol. 18, No. 5 (Special Issue), 2019
However, the average nitrogen application rate under drip irrigation was 335 Mg/ha, compared with the 184 kg/ha under conventional drip irrigation. The yield of drip irrigation maize under film was further analysed. The yield of drip irrigation maize under film was mainly distributed between 9-10 mg/ha with a distribution ratio of 48%, followed by 10-11 mg/ha with a distribution ratio of 19% and 8-9 mg/ha with a distribution ratio of 16%. Other intervals are less distributed. The main factors causing the current low yield of drip irrigation under film are as follows:
1. Nitrogen fertilizer management: The results showed the average nitrogen application amount of farmers under drip irrigation was 335 kg/ha and the amount of fertilizer application varied greatly among farmers, ranging from 206 kgN/ha to 570 kgN/ha, with 94% of farmers’ nitrogen application amount exceeding 250 kg/ha. Further analysis showed that the nitrogen application amount was mainly distributed between 300- 400 kgN/ha, with a distribution ratio of 80%. In addition, 51% of the farmers applied basic nitrogen fertilizer once before sowing, and only 36% applied it. The farmers applied fertilizer twice, applying base fertilizer before sowing and top-dressing fertilizer at jointing stage.
2. Planting density: The results showed that under drip irrigation, the average planting density of farmers was 64,500 plants/ha and the range was 48,000 to 82,500 plants/ha. 97% of the farmers planted less than 75,000 plants per hectare. The maximum planting density was 60,000 plants/ha, with a distribution ratio of 29%.
3. Irrigation times: Under drip irrigation, the most frequent irrigation times were 3 times, with a distribution ratio of 33%. It was followed by two, with a distribution ratio of 23%. Again, 4 times, with distribution ratio of 20%. Other intervals are less distributed.
Analysis on optimal nitrogen management of drip irrigation maize under membrane
The application of nitrogen fertilizer significantly affected the grain yield, grain number per ear, 1000-grain weight and harvest index. Compared with no N treatment, N treatment increased yield by 19-48% and 80-145% respectively in 2014 and 2015, with significant difference. The yield difference was caused by the grain number per ear, 1000-grain weight and harvest index under nitrogen treatment were significantly higher than those without nitrogen treatment. The optimized yields in the two years were 13.0 and 14.6 Mg/ha, respec-tively, realizing 89% and 90% of the production potential of the year. Compared with 2014, the higher yield in 2015 was due to the higher accumulated temperature of the year.
Analysis found that in 2015 > 10°C accumulated temperature is 30.16°C and 29.22°C is significantly higher than in 2014. Optimization of clever grain output by an average of 40%, two years ONR and 70% ONR treatment increased by 30% and 19% respectively. However, after optimization further increase in the amount of nitrogen fertilizer application rate showed no corresponding improvement in the clever grain output. At the same time, compared with the play washed processing, ONR processing Qiao grain yield significantly increased from 11.7 to 13.8 Mg/ha, with 2.1 Mg/ha increased yield, nitrogen fertilizer at the same time use to reduce the amount of 8 0kg/ha. In 2014 and 2015, to achieve maximum output the required minimum nitrogen respectively is 274 kg/ha and 272 kg/ha respectively. Optimal management of nitrogen fertilizer under submulch drip irrigation can greatly realize yield potential.
ANALYSIS OF GAS EMISSION
The change trend of mulching was consistent with that of conventional seasons, and the change trend of surface, un-derground 10, 20 and 30cm was similar. During the two-year planting period, the concentrations of 10 and 20 cm CH4 on the surface and underground were relatively stable, and the concentration of CH4 fluctuated between 1.5 and 3.0 ppm (1 ppm =10-6 V/V, the same below), while the concentration of 30 cm underground generally showed a trend of first ris-ing and then falling, with the same rule in the second year. Single factor analysis of variance showed that the growing period of two years, under the effect of processing surface, underground 10, 20 and 30 cm CH4 concentration difference significance (P < 0.05), the concentrations were 2.48, 2.31, 2.18, and 1.92 ppm; also under the normal processing surface, underground 10, 20 and 30 cm CH4 concentration difference significance (P < 0.05), the concentrations were 2.48, 2.33, 2.20, and 1.97 ppm, therefore, CH4 concentration decreased with soil depth deepening. For two years, cultivation of the soil CH4 concentration matching t test, the effect of the soil CH4 concentration decreases, but the effect of 10, 20, 30 cm underground CH4 concentration difference was not significant. The effect of the underground CH4 concentra-tion effect is not obvious in the first year of planting period, coated surface, underground 10, 20 and 30 cm average CH4 concentration were 2.34, 2.20, 2.06, and 1.80 ppm, conven-tional were 2.34, 2.18, 2.15 and 1.90 parts per million. In the second year, the average CH4 concentrations of 10, 20 and 30 cm underground and surface were 2.59, 2.40, 2.28 and 2.03 ppm, respectively, while the conventional concen-trations were 2.59, 2.47, 2.25 and 2.05 ppm, respectively. Paired t-test showed that in the first year, the concentration of 20 and 30 cm underground was significantly lower than that of conventional CH4 (P < 0.01), while the concentration
1660 Yaqi Chen et al.
Vol. 18, No. 5 (Special Issue), 2019 • Nature Environment and Pollution Technology
of 10cm underground had no significant effect. In the second year, the difference between different soil layers was not sig-nificant. CH4 concentration decreases with the deepening of soil depth in two years. In the first and second years, the CH4 concentration of 20 and 30 cm underground is significantly different from that of the surface (P < 0.05), while the CH4 concentration of 10 cm is not significantly different from that of the surface (P < 0.05).The CH4 concentration of 10 cm, 20 cm and 30 cm underground was significantly different from that on the surface (P<0.05). In the first year, the av-erage annual concentration of 10, 20 and 30 cm CH4 on the surface and underground was 2.24, 2.27, 2.21 and 2.06 ppm, respectively, while the conventional concentration was 2.24, 2.24, 2.24 and 2.19 ppm, respectively. In the second year, the average CH4 concentration at the surface, 10, 20 and 30 cm underground was 2.52, 2.26, 2.11 and 1.84 ppm, respec-tively, while the conventional concentration was 2.52, 2.36, 2.09 and 1.98 ppm, respectively. Paired t test showed that the first year was significantly lower than the conventional 30 cm underground (P < 0.05), and the second year was not significantly different. In the first year, the annual average concentration of CH4 on the surface and underground of 10, 20 and 30 cm was 2.41, 2.15, 1.95 and 1.61 ppm, respectively, while the conventional concentration was 2.41, 2.14, 2.08 and 1.68 ppm, respectively. In the second year, the annual mean concentration of CH4 at 10, 20 and 30 cm underground was 2.66, 2.54, 2.43 and 2.18 ppm, respectively, while the con-ventional concentration was 2.66, 2.58, 2.40 and 2.10 ppm, respectively. Paired t test showed that the CH4 concentration 20 cm underground in the first year was significantly lower than that in the conventional one (P<0.05), and the difference between the two was not significant in the second year.
CONCLUSION
Mulch drip irrigation can improve crop yield through rational fertilization, and it is found that the crop yield of one-time fertilization is higher than that of multiple fertilization, and effective nutrient management can improve yield potential. The CH4 concentration in the sections treated with plas-tic-film mulching and conventional treatment decreased with the deepening of soil depth, but there was no significant difference in CH4 concentration between the sections treated with plastic-film mulching and conventional treatment, that is, plastic-film mulching had no significant effect on the CH4
concentration in the sections. The CH4 concentration in the soil layer 10 and 20 cm underground is mainly affected by the surface CH4 concentration. The CH4 concentration in the soil layer 30 cm underground is not only affected by the surface CH4 concentration, but also affected by the surface and underground temperature. In the future, it is necessary to improve the environmental effect evaluation of the integrated management system of drip irrigation under membrane and further integrate it with international work.
REFERENCES
Gao, P., Yingying, X.U., Yang, H., Liu, Y., Wang, Y. and Wang, J. 2017. Effect of drip irrigation under plastic film on soil? and maize growth in semi arid region. Heilongjiang Agricultural Sciences.
Han, D. and Zhou, T. 2018. Soil water movement in the unsaturated zone of an inland arid region: mulched drip irrigation experiment. Journal of Hydrology, 559: 13-29.
Kiani, M., Gheysari, M., Mostafazadeh-Fard, B., Majidi, M.M., Karchani, K. and Hoogenboom, G. 2016. Effect of the interaction of water and nitrogen on sunflower under drip irrigation in an arid region. Agricul-tural Water Management, 171: 162-172.
Mosier, A. R., Halvorson, A. D., Peterson, G. A., Robertson, G. P., & Sher-rod, L. (2005). Measurement of net global warming potential in three agroecosystems. Nutrient Cycling in Agroecosystems, 72(1), 67-76.
Sun, G., Qu, Z., Du, B., Ren, Z. and Liu, A. 2017. Water-heat-salt effects of mulched drip irrigation maize with different irrigation scheduling in Hetao irrigation district. Transactions of the Chinese Society of Agricultural Engineering, 33(12): 144-152.
Tao, L. and Zhang, J. 2017. Effect of pit irrigation on soil water content, vigor, and water use efficiency within vineyards in extremely arid regions. Scientia Horticulturae, 218: 30-37.
Wang, D., Hao, F., Liu, X., Yi, L., Zhou, L. and Zhang, A. 2018a. Effects of gravel mulching on yield and multilevel water use efficiency of wheat-maize cropping system in semi-arid region of northwest China. Field Crops Research, 218: 201-212.
Wang, X., Huo, Z., Guan, H., Ping, G. and Qu, Z. 2018b. Drip irrigation enhances shallow groundwater contribution to crop water consumption in an arid area. Hydrological Processes, 32(6): 747-758
Wu, Q., Wang, Z., Zheng, X., Zhang, J. and Li, W. 2017. Effects of biodeg-radation film mulching on soil temperature, moisture and yield of cotton under drip irrigation in typical oasis area. Transactions of the Chinese Society of Agricultural Engineering, 33(16): 135-143.
Zhang, Y.L., Wang, F.X., Shock, C.C., Yang, K.J., Kang, S.Z. and Qin, J.T. 2017. Effects of plastic mulch on the radiative and thermal conditions and potato growth under drip irrigation in arid northwest China. Soil and Tillage Research, 172: 1-11.
Zhou, L., Feng, H., Zhao, Y., Qi, Z., Zhang, T. and He, J. 2017. Drip irrigation lateral spacing and mulching affects the wetting pattern, shoot-root regulation, and yield of maize in a sand-layered soil. Agricultural Water Management, 184: 114-123.
Application of Fuzzy Mathematical Evaluation Method in Classification and Evaluation of Condensate Gas Reservoir
Haijuan JinDepartment of Mathematics, Changzhi College, 046000, China
ABSTRACT
In order to comprehensively reflect the influence of seven parameters, such as permeability, porosity, reserves abundance, reservoir depth, condensate oil content, edge and bottom water energy, and development mode, on the development effect of condensate gas reservoirs, fuzzy mathematics method was applied to classify and evaluate typical condensate gas reservoirs in China. The classification of condensate gas reservoirs considering the content of condensate oil and other single factors cannot objectively and accurately characterize the quality of condensate gas reservoirs. By selecting the relevant parameters of 18 condensate gas reservoirs in China, the comprehensive evaluation value B is obtained by using fuzzy mathematical evaluation method on the basis of single factor evaluation, and then the condensate gas reservoirs are divided into four categories: B 0.6, which is a type of condensate gas reservoir; 0.5 B < 0.6 is a type two condensate gas reservoir; 0.4 B < 0.5, third type of condensate gas reservoir; B < 0.4 is the fourth type of condensate gas reservoirs. The practice shows that the factors considered in this classification and evaluation method are more comprehensive and the evaluation results are more scientific, so the evaluation results can lay a theoretical foundation for the evaluation of the development effect of condensate gas reservoirs in China.
INTRODUCTION
Condensate gas reservoir is an important natural gas resource in China, which is widely distributed in Bohai bay, Tarim basin, Tuha basin and east and south coastal shelf area. However, they (such as Yaha, Yakla-Dalawaba, Mahe, Kelameili, Hutubi and other condensate gas reservoirs) have different reservoir types, condensate oil content and water activity (Behmanesh et al. 2017). The geological and engineering production conditions of condensate gas reservoirs differ greatly in the development effect. At present, the types of condensate gas reservoirs in China are mainly classified according to the content of condensate oil. In addition to the content of condensate oil, there are many factors affecting the development effect of condensate gas reservoirs (Ming et al. 2017). Under ideal conditions, the factors affecting the development of condensate gas reservoirs are mainly divided into geological conditions and production conditions. Among them, geological conditions mainly include original pressure, reservoir permeability, porosity, gas saturation, effective thickness, fracture development, edge and bottom water energy, condensate oil content, etc. (Liu 2017). Production condition basically has development means, abandon yield to wait. Therefore, the classification with condensate oil content as the standard will bring many problems to the determination
of condensate gas development plan and development index (Wang et al. 2017).
In recent years, although many scholars have carried out a large number of studies on the evaluation and prediction of condensate gas reservoir development indicators by using reservoir engineering method and numerical simulation method respectively, they have not comprehensively considered the type of condensate gas reservoir under multiple influencing factors, so they cannot scientifically evaluate the development of condensate gas reservoir. The classification results of condensate gas reservoirs are different according to different goals and development standards. In the process of classification, it is necessary to seek a standard that can better reflect the geological characteristics of the actual gas reservoir, so as to have guiding significance in the actual production.
In order to better guide the development of condensate gas reservoirs, it is necessary to establish a set of classification and evaluation methods for condensate gas reservoirs under the consideration of multiple factors (such as gas reservoir geology, production conditions, etc.). Therefore, on the basis of analysing the influencing factors of condensate gas reservoir development indexes, combining with a large number of actual data of condensate gas reservoirs, this
Nat. Env. & Poll. Tech.Website: www.neptjournal.com
Received: 29-08-2019Accepted: 24-10-2019
Key Words:Fuzzy mathematics evaluation methodCondensate gas reservoirClassification evaluation
2019pp. 1661-1666 Vol. 18
p-ISSN: 0972-6268 No. 5 (Special Issue)
Nature Environment and Pollution Technology An International Quarterly Scientific Journal
Original Research Paper
e-ISSN: 2395-3454
Open Access
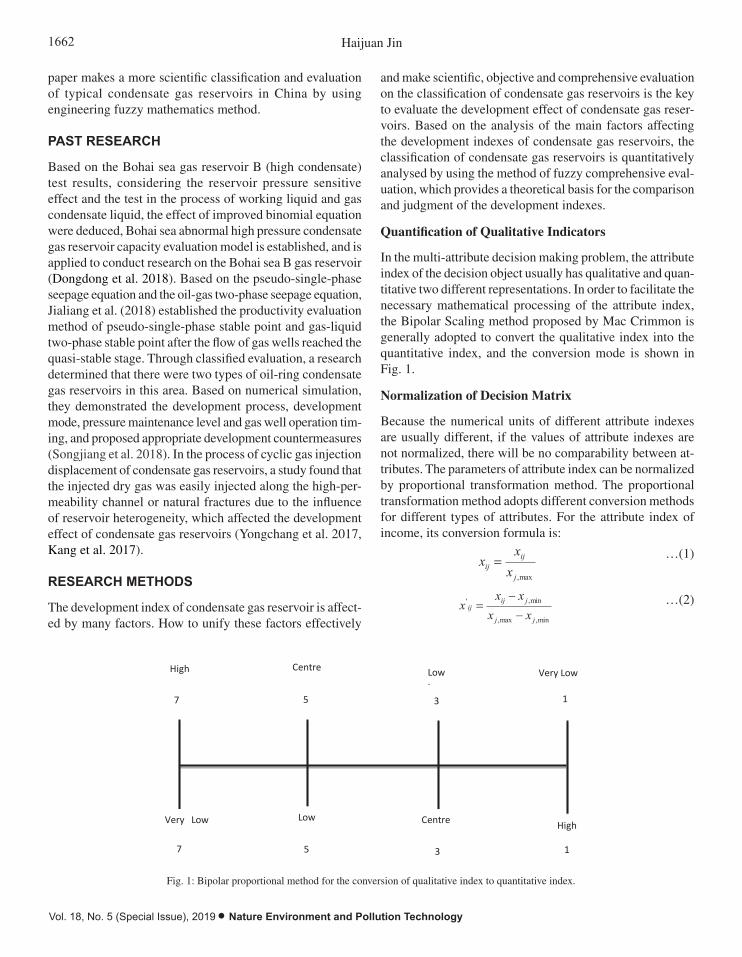
1662 Haijuan Jin
Vol. 18, No. 5 (Special Issue), 2019 • Nature Environment and Pollution Technology
paper makes a more scientific classification and evaluation of typical condensate gas reservoirs in China by using engineering fuzzy mathematics method.
PAST RESEARCH
Based on the Bohai sea gas reservoir B (high condensate) test results, considering the reservoir pressure sensitive effect and the test in the process of working liquid and gas condensate liquid, the effect of improved binomial equation were deduced, Bohai sea abnormal high pressure condensate gas reservoir capacity evaluation model is established, and is applied to conduct research on the Bohai sea B gas reservoir (Dongdong et al. 2018). Based on the pseudo-single-phase seepage equation and the oil-gas two-phase seepage equation, Jialiang et al. (2018) established the productivity evaluation method of pseudo-single-phase stable point and gas-liquid two-phase stable point after the flow of gas wells reached the quasi-stable stage. Through classified evaluation, a research determined that there were two types of oil-ring condensate gas reservoirs in this area. Based on numerical simulation, they demonstrated the development process, development mode, pressure maintenance level and gas well operation tim-ing, and proposed appropriate development countermeasures (Songjiang et al. 2018). In the process of cyclic gas injection displacement of condensate gas reservoirs, a study found that the injected dry gas was easily injected along the high-per-meability channel or natural fractures due to the influence of reservoir heterogeneity, which affected the development effect of condensate gas reservoirs (Yongchang et al. 2017, Kang et al. 2017).
RESEARCH METHODS
The development index of condensate gas reservoir is affect-ed by many factors. How to unify these factors effectively
and make scientific, objective and comprehensive evaluation on the classification of condensate gas reservoirs is the key to evaluate the development effect of condensate gas reser-voirs. Based on the analysis of the main factors affecting the development indexes of condensate gas reservoirs, the classification of condensate gas reservoirs is quantitatively analysed by using the method of fuzzy comprehensive eval-uation, which provides a theoretical basis for the comparison and judgment of the development indexes.
Quantification of Qualitative Indicators
In the multi-attribute decision making problem, the attribute index of the decision object usually has qualitative and quan-titative two different representations. In order to facilitate the necessary mathematical processing of the attribute index, the Bipolar Scaling method proposed by Mac Crimmon is generally adopted to convert the qualitative index into the quantitative index, and the conversion mode is shown in Fig. 1.
Normalization of Decision Matrix
Because the numerical units of different attribute indexes are usually different, if the values of attribute indexes are not normalized, there will be no comparability between at-tributes. The parameters of attribute index can be normalized by proportional transformation method. The proportional transformation method adopts different conversion methods for different types of attributes. For the attribute index of income, its conversion formula is:
The development index of condensate gas reservoir is affected by many factors. How to unify these factors effectively and make scientific, objective and comprehensive evaluation on the classification of condensate gas reservoirs is the key to evaluate the development effect of condensate gas reservoirs. Based on the analysis of the main factors affecting the development indexes of condensate gas reservoirs, the classification of condensate gas reservoirs is quantitatively analysed by using the method of fuzzy comprehensive evaluation, which provides a theoretical basis for the comparison and judgment of the development indexes.
Quantification of qualitative indicators
In the multi-attribute decision making problem, the attribute index of the decision object usually has qualitative and quantitative two different representations. In order to facilitate the necessary mathematical processing of the attribute index, the Bipolar Scaling method proposed by Mac Crimmon is generally adopted to convert the qualitative index into the quantitative index, and the conversion mode is shown in Fig. 1.
Fig. 1: Bipolar proportional method for the conversion of qualitative index to quantitative index.
Normalization of decision matrix
Because the numerical units of different attribute indexes are usually different, if the values of attribute indexes are not normalized, there will be no comparability between attributes. The parameters of attribute index can be normalized by proportional transformation method. The proportional transformation method adopts different conversion methods for different types of attributes. For the attribute index of income, its conversion formula is:
…(1)
High
7
Centre
5
Low Low
1
wwwwy Low
1
w
3
Very Low
1
Very Low 7
Low
5
Centre
3
High
1
max,j
ijij x
xx …(1)
…(2)
For expenditure attribute indicators, the corresponding conversion formula is:
…(3)
…(4)
In formula (1) ~ (4), xij is the jth target data obtained in the ith series.
Fuzzy comprehensive evaluation
Fuzzy comprehensive evaluation method is a method based on fuzzy transformation principle, maximum membership principle analysis and fuzzy evaluation. It is also a quantitative and qualitative evaluation method with fuzzy reasoning as the main method. It is according to the requirements of the evaluation problem, each object to judge, judge the size of the corresponding index, and sort, so as to classify the object or sentenced the best. Definition of fuzzy comprehensive evaluation method: Let U and V be two non-empty sets. If there is A corresponding rule T for the fuzzy power set P(U) to the fuzzy power set P(V) of U, then T is the fuzzy transformation from U to V, denoted as:
…(5)
Due to the different roles of various factors in the comprehensive evaluation, a fuzzy set A= a1,a2,a3... + an= 1, A is called the weight vector of the comprehensive evaluation (referred to as the weight), and ai represents the weight of factor xi in the comprehensive evaluation. For the given weight A, the comprehensive evaluation is a fuzzy transformation from the factor set U to the comment set V:
…(6)
Let the domain be U, A1, A2... An is n fuzzy sets of U, for x0 in U, if
…(7)
Hence, we can say that x0 is relative to Ak.
Fuzzy comprehensive evaluation method adopts the most basic idea in fuzzy mathematics, i.e. fuzzy set theory. Classic collection (general collection) is a research GUI absolutely belonging to the concept of things, and in the fuzzy set is the concept of relative research GUI belonging to the fuzzy set theory,
min,max,
min,'
jj
jijij
xxxx
x
ij
jij
xx
x min,'
min,max,
max,'
jj
ijjij
xxxx
x
)()()()(:
VPBATAVPUPT
RAATBAT ff )(:
)}(),...(),(max{)( 002010 xxxx AnAAAk
…(2)
The development index of condensate gas reservoir is affected by many factors. How to unify these factors effectively and make scientific, objective and comprehensive evaluation on the classification of condensate gas reservoirs is the key to evaluate the development effect of condensate gas reservoirs. Based on the analysis of the main factors affecting the development indexes of condensate gas reservoirs, the classification of condensate gas reservoirs is quantitatively analysed by using the method of fuzzy comprehensive evaluation, which provides a theoretical basis for the comparison and judgment of the development indexes.
Quantification of qualitative indicators
In the multi-attribute decision making problem, the attribute index of the decision object usually has qualitative and quantitative two different representations. In order to facilitate the necessary mathematical processing of the attribute index, the Bipolar Scaling method proposed by Mac Crimmon is generally adopted to convert the qualitative index into the quantitative index, and the conversion mode is shown in Fig. 1.
Fig. 1: Bipolar proportional method for the conversion of qualitative index to quantitative index.
Normalization of decision matrix
Because the numerical units of different attribute indexes are usually different, if the values of attribute indexes are not normalized, there will be no comparability between attributes. The parameters of attribute index can be normalized by proportional transformation method. The proportional transformation method adopts different conversion methods for different types of attributes. For the attribute index of income, its conversion formula is:
…(1)
High
7
Centre
5
Low Low
1
wwwwy Low
1
w
3
Very Low
1
Very Low 7
Low
5
Centre
3
High
1
max,j
ijij x
xx
Fig. 1: Bipolar proportional method for the conversion of qualitative index to quantitative index.
1663FUZZY MATHEMATICAL EVALUATION IN EVALUATION OF CONDENSATE GAS RESERVOIR
Nature Environment and Pollution Technology • Vol. 18, No. 5 (Special Issue), 2019
For expenditure attribute indicators, the corresponding conversion formula is:
…(2)
For expenditure attribute indicators, the corresponding conversion formula is:
…(3)
…(4)
In formula (1) ~ (4), xij is the jth target data obtained in the ith series.
Fuzzy comprehensive evaluation
Fuzzy comprehensive evaluation method is a method based on fuzzy transformation principle, maximum membership principle analysis and fuzzy evaluation. It is also a quantitative and qualitative evaluation method with fuzzy reasoning as the main method. It is according to the requirements of the evaluation problem, each object to judge, judge the size of the corresponding index, and sort, so as to classify the object or sentenced the best. Definition of fuzzy comprehensive evaluation method: Let U and V be two non-empty sets. If there is A corresponding rule T for the fuzzy power set P(U) to the fuzzy power set P(V) of U, then T is the fuzzy transformation from U to V, denoted as:
…(5)
Due to the different roles of various factors in the comprehensive evaluation, a fuzzy set A= a1,a2,a3... + an= 1, A is called the weight vector of the comprehensive evaluation (referred to as the weight), and ai represents the weight of factor xi in the comprehensive evaluation. For the given weight A, the comprehensive evaluation is a fuzzy transformation from the factor set U to the comment set V:
…(6)
Let the domain be U, A1, A2... An is n fuzzy sets of U, for x0 in U, if
…(7)
Hence, we can say that x0 is relative to Ak.
Fuzzy comprehensive evaluation method adopts the most basic idea in fuzzy mathematics, i.e. fuzzy set theory. Classic collection (general collection) is a research GUI absolutely belonging to the concept of things, and in the fuzzy set is the concept of relative research GUI belonging to the fuzzy set theory,
min,max,
min,'
jj
jijij
xxxx
x
ij
jij
xx
x min,'
min,max,
max,'
jj
ijjij
xxxx
x
)()()()(:
VPBATAVPUPT
RAATBAT ff )(:
)}(),...(),(max{)( 002010 xxxx AnAAAk
…(3)
…(2)
For expenditure attribute indicators, the corresponding conversion formula is:
…(3)
…(4)
In formula (1) ~ (4), xij is the jth target data obtained in the ith series.
Fuzzy comprehensive evaluation
Fuzzy comprehensive evaluation method is a method based on fuzzy transformation principle, maximum membership principle analysis and fuzzy evaluation. It is also a quantitative and qualitative evaluation method with fuzzy reasoning as the main method. It is according to the requirements of the evaluation problem, each object to judge, judge the size of the corresponding index, and sort, so as to classify the object or sentenced the best. Definition of fuzzy comprehensive evaluation method: Let U and V be two non-empty sets. If there is A corresponding rule T for the fuzzy power set P(U) to the fuzzy power set P(V) of U, then T is the fuzzy transformation from U to V, denoted as:
…(5)
Due to the different roles of various factors in the comprehensive evaluation, a fuzzy set A= a1,a2,a3... + an= 1, A is called the weight vector of the comprehensive evaluation (referred to as the weight), and ai represents the weight of factor xi in the comprehensive evaluation. For the given weight A, the comprehensive evaluation is a fuzzy transformation from the factor set U to the comment set V:
…(6)
Let the domain be U, A1, A2... An is n fuzzy sets of U, for x0 in U, if
…(7)
Hence, we can say that x0 is relative to Ak.
Fuzzy comprehensive evaluation method adopts the most basic idea in fuzzy mathematics, i.e. fuzzy set theory. Classic collection (general collection) is a research GUI absolutely belonging to the concept of things, and in the fuzzy set is the concept of relative research GUI belonging to the fuzzy set theory,
min,max,
min,'
jj
jijij
xxxx
x
ij
jij
xx
x min,'
min,max,
max,'
jj
ijjij
xxxx
x
)()()()(:
VPBATAVPUPT
RAATBAT ff )(:
)}(),...(),(max{)( 002010 xxxx AnAAAk
…(4)
In formula (1) ~ (4), xij is the jth target data obtained in the ith series.
Fuzzy Comprehensive Evaluation
Fuzzy comprehensive evaluation method is a method based on fuzzy transformation principle, maximum membership principle analysis and fuzzy evaluation. It is also a quantitative and qualitative evaluation method with fuzzy reasoning as the main method. It is according to the requirements of the evaluation problem, each object to judge, judge the size of the corresponding index, and sort, so as to classify the object or sentenced the best. Definition of fuzzy comprehensive evaluation method: Let U and V be two non-empty sets. If there is A corresponding rule T for the fuzzy power set P(U) to the fuzzy power set P(V) of U, then T is the fuzzy transformation from U to V, denoted as:
…(2)
For expenditure attribute indicators, the corresponding conversion formula is:
…(3)
…(4)
In formula (1) ~ (4), xij is the jth target data obtained in the ith series.
Fuzzy comprehensive evaluation
Fuzzy comprehensive evaluation method is a method based on fuzzy transformation principle, maximum membership principle analysis and fuzzy evaluation. It is also a quantitative and qualitative evaluation method with fuzzy reasoning as the main method. It is according to the requirements of the evaluation problem, each object to judge, judge the size of the corresponding index, and sort, so as to classify the object or sentenced the best. Definition of fuzzy comprehensive evaluation method: Let U and V be two non-empty sets. If there is A corresponding rule T for the fuzzy power set P(U) to the fuzzy power set P(V) of U, then T is the fuzzy transformation from U to V, denoted as:
…(5)
Due to the different roles of various factors in the comprehensive evaluation, a fuzzy set A= a1,a2,a3... + an= 1, A is called the weight vector of the comprehensive evaluation (referred to as the weight), and ai represents the weight of factor xi in the comprehensive evaluation. For the given weight A, the comprehensive evaluation is a fuzzy transformation from the factor set U to the comment set V:
…(6)
Let the domain be U, A1, A2... An is n fuzzy sets of U, for x0 in U, if
…(7)
Hence, we can say that x0 is relative to Ak.
Fuzzy comprehensive evaluation method adopts the most basic idea in fuzzy mathematics, i.e. fuzzy set theory. Classic collection (general collection) is a research GUI absolutely belonging to the concept of things, and in the fuzzy set is the concept of relative research GUI belonging to the fuzzy set theory,
min,max,
min,'
jj
jijij
xxxx
x
ij
jij
xx
x min,'
min,max,
max,'
jj
ijjij
xxxx
x
)()()()(:
VPBATAVPUPT
RAATBAT ff )(:
)}(),...(),(max{)( 002010 xxxx AnAAAk
…(5)
Due to the different roles of various factors in the comprehensive evaluation, a fuzzy set A= a1, a2, a3... + an = 1, A is called the weight vector of the comprehensive evaluation (referred to as the weight), and ai represents the weight of factor xi in the comprehensive evaluation. For the given weight A, the comprehensive evaluation is a fuzzy transformation from the factor set U to the comment set V:
…(2)
For expenditure attribute indicators, the corresponding conversion formula is:
…(3)
…(4)
In formula (1) ~ (4), xij is the jth target data obtained in the ith series.
Fuzzy comprehensive evaluation
Fuzzy comprehensive evaluation method is a method based on fuzzy transformation principle, maximum membership principle analysis and fuzzy evaluation. It is also a quantitative and qualitative evaluation method with fuzzy reasoning as the main method. It is according to the requirements of the evaluation problem, each object to judge, judge the size of the corresponding index, and sort, so as to classify the object or sentenced the best. Definition of fuzzy comprehensive evaluation method: Let U and V be two non-empty sets. If there is A corresponding rule T for the fuzzy power set P(U) to the fuzzy power set P(V) of U, then T is the fuzzy transformation from U to V, denoted as:
…(5)
Due to the different roles of various factors in the comprehensive evaluation, a fuzzy set A= a1,a2,a3... + an= 1, A is called the weight vector of the comprehensive evaluation (referred to as the weight), and ai represents the weight of factor xi in the comprehensive evaluation. For the given weight A, the comprehensive evaluation is a fuzzy transformation from the factor set U to the comment set V:
…(6)
Let the domain be U, A1, A2... An is n fuzzy sets of U, for x0 in U, if
…(7)
Hence, we can say that x0 is relative to Ak.
Fuzzy comprehensive evaluation method adopts the most basic idea in fuzzy mathematics, i.e. fuzzy set theory. Classic collection (general collection) is a research GUI absolutely belonging to the concept of things, and in the fuzzy set is the concept of relative research GUI belonging to the fuzzy set theory,
min,max,
min,'
jj
jijij
xxxx
x
ij
jij
xx
x min,'
min,max,
max,'
jj
ijjij
xxxx
x
)()()()(:
VPBATAVPUPT
RAATBAT ff )(:
)}(),...(),(max{)( 002010 xxxx AnAAAk
…(6)
Let the domain be U, A1, A2... An is n fuzzy sets of U, for x0 in U, if
…(2)
For expenditure attribute indicators, the corresponding conversion formula is:
…(3)
…(4)
In formula (1) ~ (4), xij is the jth target data obtained in the ith series.
Fuzzy comprehensive evaluation
Fuzzy comprehensive evaluation method is a method based on fuzzy transformation principle, maximum membership principle analysis and fuzzy evaluation. It is also a quantitative and qualitative evaluation method with fuzzy reasoning as the main method. It is according to the requirements of the evaluation problem, each object to judge, judge the size of the corresponding index, and sort, so as to classify the object or sentenced the best. Definition of fuzzy comprehensive evaluation method: Let U and V be two non-empty sets. If there is A corresponding rule T for the fuzzy power set P(U) to the fuzzy power set P(V) of U, then T is the fuzzy transformation from U to V, denoted as:
…(5)
Due to the different roles of various factors in the comprehensive evaluation, a fuzzy set A= a1,a2,a3... + an= 1, A is called the weight vector of the comprehensive evaluation (referred to as the weight), and ai represents the weight of factor xi in the comprehensive evaluation. For the given weight A, the comprehensive evaluation is a fuzzy transformation from the factor set U to the comment set V:
…(6)
Let the domain be U, A1, A2... An is n fuzzy sets of U, for x0 in U, if
…(7)
Hence, we can say that x0 is relative to Ak.
Fuzzy comprehensive evaluation method adopts the most basic idea in fuzzy mathematics, i.e. fuzzy set theory. Classic collection (general collection) is a research GUI absolutely belonging to the concept of things, and in the fuzzy set is the concept of relative research GUI belonging to the fuzzy set theory,
min,max,
min,'
jj
jijij
xxxx
x
ij
jij
xx
x min,'
min,max,
max,'
jj
ijjij
xxxx
x
)()()()(:
VPBATAVPUPT
RAATBAT ff )(:
)}(),...(),(max{)( 002010 xxxx AnAAAk …(7)
Hence, we can say that x0 is relative to Ak.
Fuzzy comprehensive evaluation method adopts the most basic idea in fuzzy mathematics, i.e. fuzzy set theory. Classic collection (general collection) is a research GUI absolutely belonging to the concept of things, and in the fuzzy set is the concept of relative research GUI belonging to the fuzzy set theory, because the things of a certain variability (random), argues that the development of things are not absolute, but rather from absolute to relative to a gradual process. Relative to the number or size of a set, the degree of membership mentioned above fully proves that fuzzy comprehensive
evaluation method is a qualitative to quantitative analysis method. Since fuzzy comprehensive evaluation method adopts fuzzy set theory, which is the method to study the change process of things, its result is expressed by a vector, which further indicates the biggest feature of this method: intuitive understanding of the transition change of fuzzy property of things.
Determination of Membership Function
Membership function is a function that reflects the degree to which an element belongs to a certain characteristic. In the determination of membership function, because everyone has different understanding of the characteristics, and the membership function itself has certain complexity, so it can’t be evaluated or selected subjectively in the determination of membership function, but must have certain objective laws. In general, the membership function is usually determined by experience or statistics, but can be determined after eval-uation by experts.
Fuzzy statistical method
In a certain kind of random problem, a lot of experiments can be done. The results of each experiment can determine whether the selected element X belongs to the fuzzy set. However, it can be found that every confirmed result is a classical set, and there is a relationship between the fuzzy sets studied. However, as the number of experiments increases, the boundary of the classical set changes all the time, and the element can be included or not included.
because the things of a certain variability (random), argues that the development of things are not absolute, but rather from absolute to relative to a gradual process. Relative to the number or size of a set, the degree of membership mentioned above fully proves that fuzzy comprehensive evaluation method is a qualitative to quantitative analysis method. Since fuzzy comprehensive evaluation method adopts fuzzy set theory, which is the method to study the change process of things, its result is expressed by a vector, which further indicates the biggest feature of this method: intuitive understanding of the transition change of fuzzy property of things.
Determination of membership function
Membership function is a function that reflects the degree to which an element belongs to a certain characteristic. In the determination of membership function, because everyone has different understanding of the characteristics, and the membership function itself has certain complexity, so it can't be evaluated or selected subjectively in the determination of membership function, but must have certain objective laws. In general, the membership function is usually determined by experience or statistics, but can be determined after evaluation by experts.
Fuzzy statistical method
In a certain kind of random problem, a lot of experiments can be done. The results of each experiment can determine whether the selected element X belongs to the fuzzy set. However, it can be found that every confirmed result is a classical set, and there is a relationship between the fuzzy sets studied. However, as the number of experiments increases, the boundary of the classical set changes all the time, and the element can be included or not included.
…(8)
In the formula, n (A) is the number of events A, and n is the total number of trials. In probability statistics, when the number of trials increases gradually, the result of frequency will gradually become stable, that is, the so-called probability. Therefore, when the number of experiments increases gradually, the value when the frequency of elements belonging to the set tends to be stable and can be regarded as the membership degree.
Expert determination method
The determination of membership function has a certain subjectivity. If fuzzy statistical method can be used for the research content, defield method, also known as expert determination method, can be used. It is by the authority of experts based on experience and understanding to get the corresponding value, so as to determine the membership function. Although this kind of numerical value exists certain subjectivity, but it is a kind of numerical approximation. Authoritative experts will modify with the difference of things and a lot of practical experience, and each modification is the approximation of the target with high credibility.
Comparative sorting method
For some complex or relatively fuzzy sets, the membership degree can be determined by pairwise comparison.
Make use of existing membership functions
nAnn /)( …(8)
In the formula, n (A) is the number of events A, and n is the total number of trials. In probability statistics, when the number of trials increases gradually, the result of fre-quency will gradually become stable, that is, the so-called probability. Therefore, when the number of experiments increases gradually, the value when the frequency of elements belonging to the set tends to be stable and can be regarded as the membership degree.
Expert determination method
The determination of membership function has a certain subjectivity. If fuzzy statistical method can be used for the research content, defield method, also known as expert determination method, can be used. It is by the authority of experts based on experience and understanding to get the corresponding value, so as to determine the membership function. Although this kind of numerical value exists certain subjectivity, but it is a kind of numerical approximation. Authoritative experts will modify with the difference of things and a lot of practical experience, and each modification is the approximation of the target with high credibility.
1664 Haijuan Jin
Vol. 18, No. 5 (Special Issue), 2019 • Nature Environment and Pollution Technology
Comparative sorting method
For some complex or relatively fuzzy sets, the membership degree can be determined by pairwise comparison.
Make use of existing membership functions
In some practical projects, some membership functions have become stable. In addition, with the long-term practice and after a lot of modification and judgment, this membership function has reached maturity and can be the description of some objective things. Then the membership function can be directly adopted to represent the membership degree of the studied things.
Taking condensate gas reservoirs in China as an exam-ple, this paper classifies condensate gas reservoirs by fuzzy mathematics method. In this paper, 7 parameters including porosity, permeability, condensate content, energy of edge and bottom water, reserve abundance, medium depth of output and development mode were selected to participate in the evaluation.
Due to the different effects of various parameters on the development of condensate gas reservoirs, the determination principles of membership functions in the comprehensive evaluation classification are different. Generally, the higher the porosity, permeability and reserves abundance, the more favourable it is for gas reservoir development. Then its mem-bership function is:
In some practical projects, some membership functions have become stable. In addition, with the long-term practice and after a lot of modification and judgment, this membership function has reached maturity and can be the description of some objective things. Then the membership function can be directly adopted to represent the membership degree of the studied things.
Taking condensate gas reservoirs in China as an example, this paper classifies condensate gas reservoirs by fuzzy mathematics method. In this paper, 7 parameters including porosity, permeability, condensate content, energy of edge and bottom water, reserve abundance, medium depth of output and development mode were selected to participate in the evaluation.
Due to the different effects of various parameters on the development of condensate gas reservoirs, the determination principles of membership functions in the comprehensive evaluation classification are different. Generally, the higher the porosity, permeability and reserves abundance, the more favourable it is for gas reservoir development. Then its membership function is:
…(9)
There is a negative correlation between reservoir depth, condensate oil content and gas reservoir development effect, and its membership function is:
…(10)
The membership function of edge and bottom water strength is converted into a quantitative index according to Fig. 1, and the membership function of the situation of edge and bottom water is:
…(11)
According to the development method, gas injection development can play a better pressure holding effect, so that its development effect converts to quantitative indicators as shown in Fig. 1. The development mode membership function can be obtained as follows:
…(12)
Results and analysis
On the basis of fuzzy mathematical decision theory and the determination of the membership function of related parameters, and further combining with the parameter values of related indicators of condensate gas reservoirs in China (see Table 1), the classified evaluation values of condensate gas reservoirs can be determined.
max,j
ij
xx
max,
1j
ij
xx
7ijx
5ijx
…(9)
There is a negative correlation between reservoir depth, condensate oil content and gas reservoir development effect, and its membership function is:
In some practical projects, some membership functions have become stable. In addition, with the long-term practice and after a lot of modification and judgment, this membership function has reached maturity and can be the description of some objective things. Then the membership function can be directly adopted to represent the membership degree of the studied things.
Taking condensate gas reservoirs in China as an example, this paper classifies condensate gas reservoirs by fuzzy mathematics method. In this paper, 7 parameters including porosity, permeability, condensate content, energy of edge and bottom water, reserve abundance, medium depth of output and development mode were selected to participate in the evaluation.
Due to the different effects of various parameters on the development of condensate gas reservoirs, the determination principles of membership functions in the comprehensive evaluation classification are different. Generally, the higher the porosity, permeability and reserves abundance, the more favourable it is for gas reservoir development. Then its membership function is:
…(9)
There is a negative correlation between reservoir depth, condensate oil content and gas reservoir development effect, and its membership function is:
…(10)
The membership function of edge and bottom water strength is converted into a quantitative index according to Fig. 1, and the membership function of the situation of edge and bottom water is:
…(11)
According to the development method, gas injection development can play a better pressure holding effect, so that its development effect converts to quantitative indicators as shown in Fig. 1. The development mode membership function can be obtained as follows:
…(12)
Results and analysis
On the basis of fuzzy mathematical decision theory and the determination of the membership function of related parameters, and further combining with the parameter values of related indicators of condensate gas reservoirs in China (see Table 1), the classified evaluation values of condensate gas reservoirs can be determined.
max,j
ij
xx
max,
1j
ij
xx
7ijx
5ijx
…(10)
The membership function of edge and bottom water strength is converted into a quantitative index according to Fig. 1, and the membership function of the situation of edge and bottom water is:
In some practical projects, some membership functions have become stable. In addition, with the long-term practice and after a lot of modification and judgment, this membership function has reached maturity and can be the description of some objective things. Then the membership function can be directly adopted to represent the membership degree of the studied things.
Taking condensate gas reservoirs in China as an example, this paper classifies condensate gas reservoirs by fuzzy mathematics method. In this paper, 7 parameters including porosity, permeability, condensate content, energy of edge and bottom water, reserve abundance, medium depth of output and development mode were selected to participate in the evaluation.
Due to the different effects of various parameters on the development of condensate gas reservoirs, the determination principles of membership functions in the comprehensive evaluation classification are different. Generally, the higher the porosity, permeability and reserves abundance, the more favourable it is for gas reservoir development. Then its membership function is:
…(9)
There is a negative correlation between reservoir depth, condensate oil content and gas reservoir development effect, and its membership function is:
…(10)
The membership function of edge and bottom water strength is converted into a quantitative index according to Fig. 1, and the membership function of the situation of edge and bottom water is:
…(11)
According to the development method, gas injection development can play a better pressure holding effect, so that its development effect converts to quantitative indicators as shown in Fig. 1. The development mode membership function can be obtained as follows:
…(12)
Results and analysis
On the basis of fuzzy mathematical decision theory and the determination of the membership function of related parameters, and further combining with the parameter values of related indicators of condensate gas reservoirs in China (see Table 1), the classified evaluation values of condensate gas reservoirs can be determined.
max,j
ij
xx
max,
1j
ij
xx
7ijx
5ijx
…(11)
According to the development method, gas injection development can play a better pressure holding effect, so that its development effect converts to quantitative indicators as shown in Fig. 1. The development mode membership function can be obtained as follows:
In some practical projects, some membership functions have become stable. In addition, with the long-term practice and after a lot of modification and judgment, this membership function has reached maturity and can be the description of some objective things. Then the membership function can be directly adopted to represent the membership degree of the studied things.
Taking condensate gas reservoirs in China as an example, this paper classifies condensate gas reservoirs by fuzzy mathematics method. In this paper, 7 parameters including porosity, permeability, condensate content, energy of edge and bottom water, reserve abundance, medium depth of output and development mode were selected to participate in the evaluation.
Due to the different effects of various parameters on the development of condensate gas reservoirs, the determination principles of membership functions in the comprehensive evaluation classification are different. Generally, the higher the porosity, permeability and reserves abundance, the more favourable it is for gas reservoir development. Then its membership function is:
…(9)
There is a negative correlation between reservoir depth, condensate oil content and gas reservoir development effect, and its membership function is:
…(10)
The membership function of edge and bottom water strength is converted into a quantitative index according to Fig. 1, and the membership function of the situation of edge and bottom water is:
…(11)
According to the development method, gas injection development can play a better pressure holding effect, so that its development effect converts to quantitative indicators as shown in Fig. 1. The development mode membership function can be obtained as follows:
…(12)
Results and analysis
On the basis of fuzzy mathematical decision theory and the determination of the membership function of related parameters, and further combining with the parameter values of related indicators of condensate gas reservoirs in China (see Table 1), the classified evaluation values of condensate gas reservoirs can be determined.
max,j
ij
xx
max,
1j
ij
xx
7ijx
5ijx
…(12)
RESULTS AND ANALYSIS
On the basis of fuzzy mathematical decision theory and the determination of the membership function of related param-eters, and further combining with the parameter values of related indicators of condensate gas reservoirs in China (see Table 1), the classified evaluation values of condensate gas reservoirs can be determined.
Based on the statistical data in Table 1, the corresponding membership degree is calculated according to each member-ship function, and the normalized matrix can be obtained by normalization processing.
water
Tahe AT1 23.46 829.12 354
Strong
bottom
water
4.17 4400 Failure to
develop
The British buy 7 19.68 1078 186 Bottom
water 13.8 4690
Failure to
develop
YuDong 2 17.43 73 198 Edge
water 7.19 4690
Failure to
develop
YangDaKe 18.26 174 121
Edge-
bottom
water
16.35 5050 Failure to
develop
Shaxi temple,
Xinchang 10.43 0.2 4.6 Nothing 2.42 2400
Failure to
develop
Based on the statistical data in Table 1, the corresponding membership degree is calculated according to each membership function, and the normalized matrix can be obtained by normalization processing.
Further, according to the importance of the influencing factors, the decision vectors corresponding to porosity, permeability, condensate content, edge and bottom water strength, reserves abundance, reservoir depth and development mode are determined by combining expert opinions, data and the subjective and objective judgment of the analyst:
A=[0.225 0.255 0.075 0.15 0.05 0.075 0.20]
Therefore, according to equation (6), comprehensive evaluation values of different gas reservoir classification can be obtained:
B= [0.46 0.40 0.36 0.36 0.61 0.44 0.47 0.43 0.65 0.60 0.57 0.50 0.41 0.60 0.66 0.54 0.61 0.40]
Gas reservoirs can be classified based on fuzzy comprehensive evaluation results and the maximum membership principle. The comprehensive evaluation result is <0.6, which is a type ii condensate gas reservoir. Comprehensive evaluation result value <0.5, is third kind of condensate gas reservoirs. The comprehensive evaluation result value <0.4 is fourth kind of condensate gas reservoirs. The specific classification statistics are shown in Table 2.
Table 2: Results of comprehensive classification and evaluation of different condensate gas reservoirs.
Name of condensate gas reservoir
Comprehensive evaluation results
Type of condensate gas reservoir
2.02.02.02.02.02.02.0112.02.02.02.02.02.02.02.02.072.097.090.090.085.010.000.183.099.095.062.3069.081.048.070.070.071.059.0
08.089.039.075.023.030.034.014.034.018.029.033.020.043.098.018.091.027.043.043.043.043.014.043.043.014.043.043.043.071.071.071.043.043.043.01
88.081.069.071.044.007.060.043.010.000.088.093.062.079.083.088.086.094.045.069.058.094.090.055.057.084.046.070.039.020.024.064.035.021.002.022.0
32.077.074.084.000.171.056.099.058.066.049.062.053.088.041.057.044.045.0
G
Further, according to the importance of the influencing factors, the decision vectors corresponding to porosity, permeability, condensate content, edge and bottom water strength, reserves abundance, reservoir depth and develop-ment mode are determined by combining expert opinions, data and the subjective and objective judgment of the analyst:
A = [0.225 0.255 0.075 0.15 0.05 0.075 0.20]Therefore, according to equation (6), comprehensive
evaluation values of different gas reservoir classification can be obtained:
B = [0.46 0.40 0.36 0.36 0.61 0.44 0.47 0.43 0.65 0.60 0.57 0.50 0.41 0.60 0.66 0.54 0.61 0.40]
Gas reservoirs can be classified based on fuzzy comprehensive evaluation results and the maximum membership principle. The comprehensive evaluation result is <0.6, which is a type ii condensate gas reservoir. Comprehensive evaluation result value <0.5, is third kind of condensate gas reservoirs. The comprehensive evaluation result value <0.4 is fourth kind of condensate gas reservoirs. The specific classification statistics are shown in Table 2.
1665FUZZY MATHEMATICAL EVALUATION IN EVALUATION OF CONDENSATE GAS RESERVOIR
Nature Environment and Pollution Technology • Vol. 18, No. 5 (Special Issue), 2019
Table 1: Statistical table of influencing factors of development indexes of different types of condensate gas reservoirs.
The name of the gas reservoir
Porosity % Permeability 10-5μm3
Condensate content g/m3
Edge and bottom water strength
Reservesabundance 108m3/km3
Reservoir in deep m
The development way
DX10 10.56 0.21 38 Nothing 0.26 3060 Failure to develop
DX14 10.33 0.83 91 Edge-bottom water
16.86 3715 Failure to develop
DX17 13.28 0.22 76 Edge-bottom water
3.35 3650 Failure to develop
DX18 9.53 0.08 107 Edge-bottom water
17.89 3645 Failure to develop
River 20.62 116 133 Weak water invasion
8.03 2480 Failure to develop
The basin 5 12.63 5.98 242 Weak water invasion
3.78 4235 Failure to develop
Shout wall shout 2 14.61 4.3 47.2 Weak water invasion
6.05 3600 Failure to develop
75 grams of gas reservoir
11.75 17.57 79.02 Edge water 5.31 3200 Failure to develop
23 n1j YaHa 15.56 184.6 633 Edge water 3.35 4965 Gas injection devel-opment
YaHa 23 e + K 13.78 3.08 572 Bottom water 6.28 5152 Gas injection devel-opment
DE 23.21 352.42 36 Strong bot-tom water
2.61 4340 Failure to develop
YaKeLa 13.24 70.26 252 Edge-bottom water
6.36 5200 Failure to develop
Big dalaoba 16.64 59.36 593.6 Edge-bottom water
5.47 5000 Failure to develop
Tahe AT1 23.46 829.12 354 Strong bot-tom water
4.17 4400 Failure to develop
The British buy 7 19.68 1078 186 Bottom water 13.8 4690 Failure to develop
YuDong 2 17.43 73 198 Edge water 7.19 4690 Failure to develop
YangDaKe 18.26 174 121 Edge-bottom water
16.35 5050 Failure to develop
Shaxi temple, Xinchang
10.43 0.2 4.6 Nothing 2.42 2400 Failure to develop
CONCLUSION
In this paper, seven parameters including porosity, permeability, reserves abundance value, reservoir depth, condensate oil content, edge and bottom water energy and development mode are selected to establish the membership criteria for the fuzzy evaluation of condensate gas reservoirs. By selecting the relevant parameters of 18 condensate gas reservoirs in China, the comprehensive evaluation value B is obtained by using fuzzy mathematical evaluation method on the basis of single factor evaluation, and then the
condensate gas reservoirs are divided into four categories: B 0.6, which is A type of condensate gas reservoir; 0.5 B < 0.6 is a type two condensate gas reservoir; 0.4 B < 0.5, third type of condensate gas reservoirs; B < 0.4 is fourth type of condensate gas reservoirs. The practice shows that the factors considered in this classification and evaluation method are more comprehensive and the evaluation results are more scientific, so the evaluation results can lay a theoretical foundation for the evaluation of the development effect of condensate gas reservoirs in China.

1666 Haijuan Jin
Vol. 18, No. 5 (Special Issue), 2019 • Nature Environment and Pollution Technology
Table 2: Results of comprehensive classification and evaluation of different condensate gas reservoirs.
Name of condensate gas reservoir Comprehensive evaluation results Type of condensate gas reservoir
The British buy 7 0.66 A class
23 n1j YaHa 0.65
River 0.61
YangDaKe 1 0.61
YaHa 23 e + K 0.60
Tahe AT1 0.60 The second
DE 0.57
YuDong 2 0.54
YaKeLa 0.50
Call graph wall call 2 0.47 Third type
Basin of 5 0.44
75 grams of gas reservoir 0.43
Big Dalaoba 0.41
DX10 0.37 Fourth type
DX14 0.36
Shaxi temple, Xinchang 0.36
DX17 0.31
DX18 0.28
REFERENCES
Behmanesh, H., Hamdi, H. and Clarkson, C.R. 2017. Reservoir and fluid characterization of a tight gas condensate well in the Montney formation using recombination of separator samples and black oil history matching. Journal of Natural Gas Science and Engineering, 49: 227-240.
Dongdong, Y., Yu, D., Meinan, W., Xiaoqi, C. and Xinrong, H. 2018. Establishment and application of productivity evaluation model for abnormal high pressure condensate gas reservoirs in Bohai Sea Petrochemical applications, 37 (07): 1/4.
Jialiang, L., Hao, Z., Baohua, C., Wen, C. and Hedong, S. 2018. A new method for productivity evaluation of condensate gas wells in gas-liquid two-phase state. Natural Gas Industry, 38 (04): 111 -116.
Kang, B., Zhang, L., Wang, J., Fan, K. and Wang, H. 2017. Features and forecast of water output in fractured Vuggy carbonate condensate reservoir. Journal of Southwest Petroleum University, 39(1): 107-113.
Liu, H.X. 2017. Evaluation of oil and gas constituency in basins of southern Songnan area based on fuzzy mathematics. Bulletin of Mineralogy
Petrology and Geochemistry, 36(5): 807-812.Ming, Z., Hou, L., Nie, X., Lei, Z., Zhao, J. and Xiao, G. 2017. Study
on wettability variation for removing liquid block in condensate gas reservoir. Journal of Surfactants and Detergents, 20(5): 1019-1026.
Songjiang, D., Chao-nan, S. and Xiaoli, Z. 2018. Classification and development countermeasures of condensate reservoirs in Shahejie formation, Chenghai area, Xinjiang. Oil and Gas, 14 (01): 56 × 664.
Wang, Y., Tang, C., Weile, L.I. and Chu, H.E. 2017. Application of GIS-based fuzzy mathematics model to sensitivity evaluation of debris flow. Journal of Natural Disasters, 26(1): 19-26.
Yongchang, Z., Xiangfang, L., Zheng, S., Zongyu, L., Wenyuan, L. and Yi, Z. 2017. Quantitative evaluation method and application of gas channelling for gas injection development in condensate gas reservoirs. Oil drilling and production technology, 39(06): 667/672.
Zhang, X., Zhang, S., Sun, Q., Yang, Y., Yang, Y. and Petro China. 2017. Evaluating the influence of geological structure to CBM productivity based on AHP and fuzzy mathematics, Journal of China Coal Society, 42(9): 2385-2392.
Environmental Monitoring Wireless Sensor Network Node Energy Technology Analysis
Xiaoli Cai*, Shahreen Kassim** and Van Huong Dong****Chongqing Chemical Industry Vocational College, Chongqing 400020, China**University Tun Hussin Onn, Malaysia***Ho Chi Minh City, University of Transport, Vietnam
ABSTRACT
At present, the energy problem has become one of the hotspots in the research of wireless sensor networks. In this paper, the design scheme of low-power technology is adopted by using real-time clock to control the on-off power supply, so that the dormancy power consumption of sensor nodes can be reduced to uA level, and the energy consumption of sensor nodes can be solved to the maximum extent. At the same time, the sensor interface of the sensor node designed in this paper has universality and is very suitable for environmental monitoring applications. After systematic test, it can be proved that the maximum working current of sensor nodes can reach 34.75mA and 0.0008mA in the system sleep state. If the acquisition is carried out every half hour, each time only needs 150s, and the power consumed by the sensor node every half hour is 1.4454mAh. The capacity of lithium battery is calculated according to the nominal value of 3800mAh. Without considering the self-discharge of the battery, the sensor node can work for 55 days without energy supplement. It is further verified that the wireless sensor network nodes can meet the requirements of long-term environmental data acquisition tasks in the field.
INTRODUCTION
Because wireless network sensor technology has been widely used in industry, commerce, medicine, consumption, military and other fields (Li et al. 2019), the energy problem has been the key to extend the service life of wireless network sensor and reduce the cost. It is very difficult or even impossible to change the battery when the environment is harsh or when the network nodes are moving or changing, so it is a wise choice to effectively reduce the power consumption of wireless sensor networks, especially the power consumption of wireless sensor networks that are dormant most of the time (Mukherjee et al. 2019). Although there are many node scheduling algorithms, these nodes fail to consider the energy consumption of a single node, which leads to excessive energy consumption of the node and seriously affects the network coverage effect and the life cycle of the whole network (Zhang & Chen 2019, Abella et al. 2019, Sheikhi et al. 2019). In this paper, the design scheme of low-power technology is adopted by using real-time clock to control the on-off power supply, so that the dormancy power consumption of sensor nodes can be reduced to uA level and the energy consumption of sensor nodes can be solved to the maximum extent. At the same time, the sensor interface of the sensor node designed in this paper has universality and is very suitable for environmental monitoring applications.
PAST RESEARCH
The research of sensor network started in the late 1990s. At the very beginning, wireless sensor networks have obtained abundant research results in the university of California, Berkeley, University of California, Los Angeles and Cornell University (Wang et al. 2019, Amini et al. 2019, Abella et al. 2019). Many famous companies have researched and developed sensor networks from different levels and perspectives. The United States has proposed the “national intelligent transportation system project plan”, and the United States Intel Corporation has released the “new computing development plan based on the micro-sensor network”. The natural science foundation of the United States of America has developed a research program for wireless sensor networks to support basic research. Intel Corp. demonstrated a wireless sensor network system for home care. By embedding semiconductor sensors in props and equipment such as shoes, furniture and household appliances, the system helps elderly people, Alzheimer’s patients and disabled people in their family life, and uses wireless communication to connect the sensors to efficiently transmit necessary information so as to facilitate nursing (Roch et al. 2019, Li et al. 2019).
Nat. Env. & Poll. Tech.Website: www.neptjournal.com
Received: 21-08-2019Accepted: 01-10-2019
Key Words:Environmental MonitoringWireless sensorNode energySensor node
2019pp. 1667-1673 Vol. 18
p-ISSN: 0972-6268 No. 5 (Special Issue)
Nature Environment and Pollution Technology An International Quarterly Scientific Journal
Original Research Paper
e-ISSN: 2395-3454
Open Access
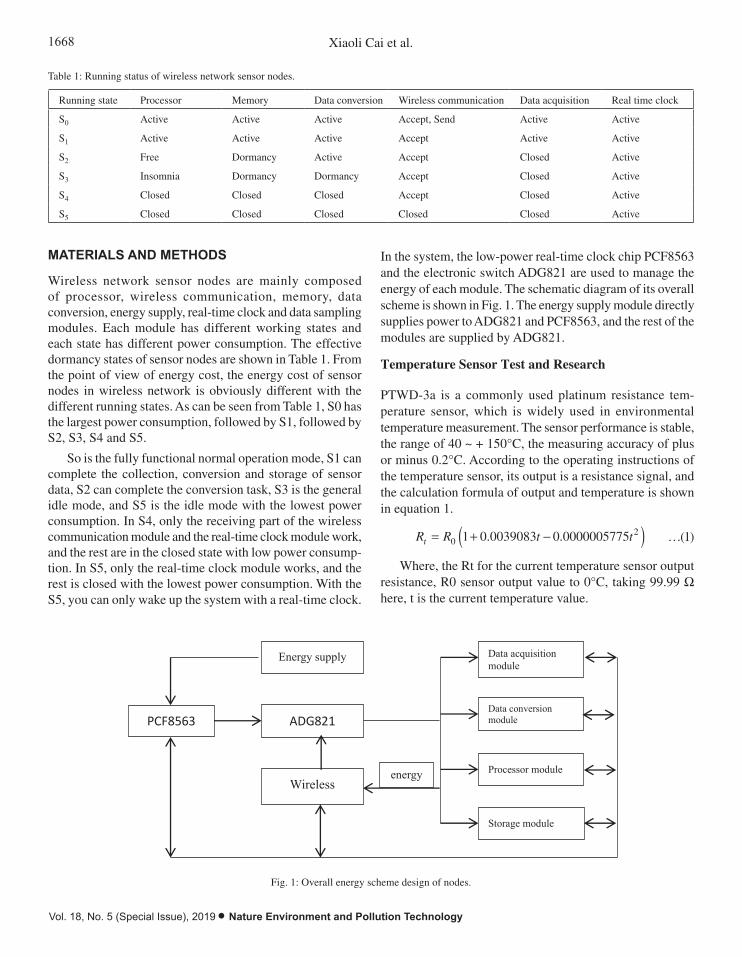
1668 Xiaoli Cai et al.
Vol. 18, No. 5 (Special Issue), 2019 • Nature Environment and Pollution Technology
Table 1: Running status of wireless network sensor nodes.
Running state Processor Memory Data conversion Wireless communication Data acquisition Real time clock
S0 Active Active Active Accept, Send Active Active
S1 Active Active Active Accept Active Active
S2 Free Dormancy Active Accept Closed Active
S3 Insomnia Dormancy Dormancy Accept Closed Active
S4 Closed Closed Closed Accept Closed Active
S5 Closed Closed Closed Closed Closed Active
MATERIALS AND METHODS
Wireless network sensor nodes are mainly composed of processor, wireless communication, memory, data conversion, energy supply, real-time clock and data sampling modules. Each module has different working states and each state has different power consumption. The effective dormancy states of sensor nodes are shown in Table 1. From the point of view of energy cost, the energy cost of sensor nodes in wireless network is obviously different with the different running states. As can be seen from Table 1, S0 has the largest power consumption, followed by S1, followed by S2, S3, S4 and S5.
So is the fully functional normal operation mode, S1 can complete the collection, conversion and storage of sensor data, S2 can complete the conversion task, S3 is the general idle mode, and S5 is the idle mode with the lowest power consumption. In S4, only the receiving part of the wireless communication module and the real-time clock module work, and the rest are in the closed state with low power consump-tion. In S5, only the real-time clock module works, and the rest is closed with the lowest power consumption. With the S5, you can only wake up the system with a real-time clock.
In the system, the low-power real-time clock chip PCF8563 and the electronic switch ADG821 are used to manage the energy of each module. The schematic diagram of its overall scheme is shown in Fig. 1. The energy supply module directly supplies power to ADG821 and PCF8563, and the rest of the modules are supplied by ADG821.
Temperature Sensor Test and Research
PTWD-3a is a commonly used platinum resistance tem-perature sensor, which is widely used in environmental temperature measurement. The sensor performance is stable, the range of 40 ~ + 150°C, the measuring accuracy of plus or minus 0.2°C. According to the operating instructions of the temperature sensor, its output is a resistance signal, and the calculation formula of output and temperature is shown in equation 1.
R R t tt = + -( )021 0 0039083 0 0000005775. . …(1)
Where, the Rt for the current temperature sensor output resistance, R0 sensor output value to 0°C, taking 99.99 W here, t is the current temperature value.
energy
So is the fully functional normal operation mode, S1 can complete the collection, conversion and
storage of sensor data, S2 can complete the conversion task, S3 is the general idle mode, and S5 is the
idle mode with the lowest power consumption. In S4, only the receiving part of the wireless
communication module and the real-time clock module work, and the rest are in the closed state with
low power consumption. In S5, only the real-time clock module works, and the rest is closed with the
lowest power consumption. With the S5, you can only wake up the system with a real-time clock. In the
system, the low-power real-time clock chip PCF8563 and the electronic switch ADG821 are used to
manage the energy of each module. The schematic diagram of its overall scheme is shown in Fig. 1. The
energy supply module directly supplies power to ADG821 and PCF8563, and the rest of the modules are
supplied by ADG821.
Fig. 1: Overall energy scheme design of nodes.
Temperature sensor test and research
PTWD-3a is a commonly used platinum resistance temperature sensor, which is widely used in
environmental temperature measurement. The sensor performance is stable, the range of 40 ~ + 150°C,
the measuring accuracy of plus or minus 0.2°C. According to the operating instructions of the
temperature sensor, its output is a resistance signal, and the calculation formula of output and temperature
is shown in equation 1.
𝑅𝑅𝑡𝑡 = 𝑅𝑅0(1 + 0.0039083𝑡𝑡 − 0.0000005775𝑡𝑡2) …(1)
Where, the Rt for the current temperature sensor output resistance, R0 sensor output value to 0°C, taking
99.99 Ω here, t is the current temperature value.
The test method of the temperature sensor is as follows: First, calibrate the amplification factor of the
temperature sensor, perform linear fitting, that is, randomly measure a standard temperature and modify
the amplification factor of ADC. Then, three random temperature points were selected for measurement,
and the difference between the collected temperature value of the sensor and the actual temperature value
was observed to obtain the collection accuracy of the sensor node. In actual measurement, electrothermic
constant temperature water bath pan and precision temperature and humidity meter are selected.
PCF8563
Energy supply
module
Wireless communication module
ADG821
Storage module
Processor module
Data conversion module
Data acquisition module
energy
Fig. 1: Overall energy scheme design of nodes.
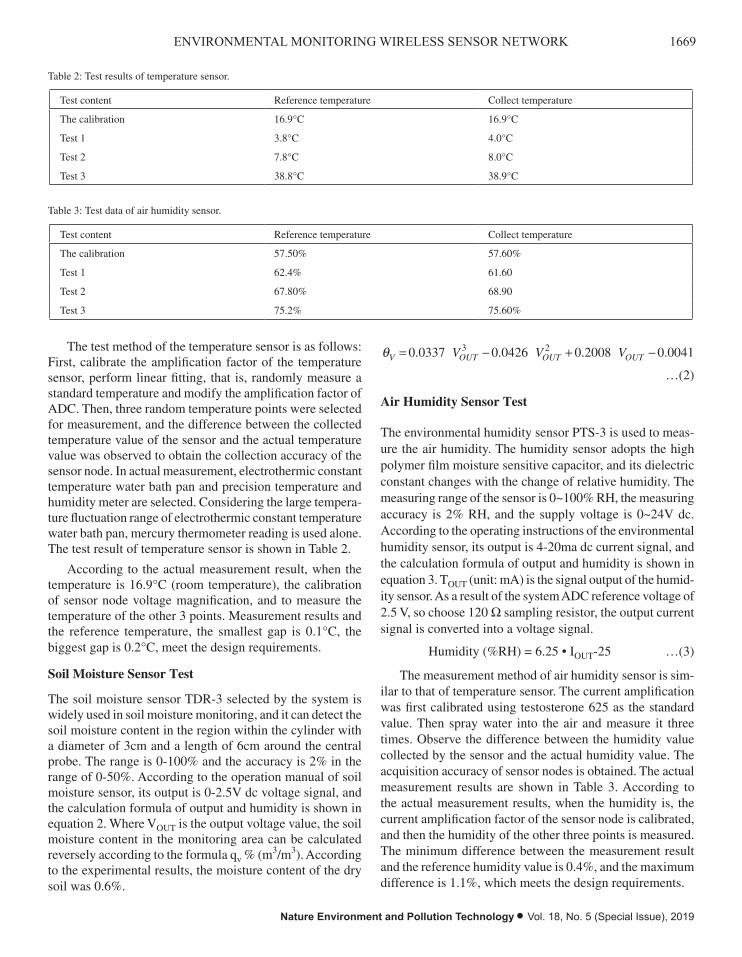
1669ENVIRONMENTAL MONITORING WIRELESS SENSOR NETWORK
Nature Environment and Pollution Technology • Vol. 18, No. 5 (Special Issue), 2019
Table 2: Test results of temperature sensor.
Test content Reference temperature Collect temperature
The calibration 16.9°C 16.9°C
Test 1 3.8°C 4.0°C
Test 2 7.8°C 8.0°C
Test 3 38.8°C 38.9°C
In the system, the low-power real-time clock chip PCF8563 and the electronic switch ADG821 are used to manage the energy of each module. The schematic diagram of its overall scheme is shown in Fig. 1. The energy supply module directly supplies power to ADG821 and PCF8563, and the rest of the modules are supplied by ADG821.
Temperature Sensor Test and Research
PTWD-3a is a commonly used platinum resistance tem-perature sensor, which is widely used in environmental temperature measurement. The sensor performance is stable, the range of 40 ~ + 150°C, the measuring accuracy of plus or minus 0.2°C. According to the operating instructions of the temperature sensor, its output is a resistance signal, and the calculation formula of output and temperature is shown in equation 1.
R R t tt = + -( )021 0 0039083 0 0000005775. . …(1)
Where, the Rt for the current temperature sensor output resistance, R0 sensor output value to 0°C, taking 99.99 W here, t is the current temperature value.
energy
The test method of the temperature sensor is as follows: First, calibrate the amplification factor of the temperature sensor, perform linear fitting, that is, randomly measure a standard temperature and modify the amplification factor of ADC. Then, three random temperature points were selected for measurement, and the difference between the collected temperature value of the sensor and the actual temperature value was observed to obtain the collection accuracy of the sensor node. In actual measurement, electrothermic constant temperature water bath pan and precision temperature and humidity meter are selected. Considering the large tempera-ture fluctuation range of electrothermic constant temperature water bath pan, mercury thermometer reading is used alone. The test result of temperature sensor is shown in Table 2.
According to the actual measurement result, when the temperature is 16.9°C (room temperature), the calibration of sensor node voltage magnification, and to measure the temperature of the other 3 points. Measurement results and the reference temperature, the smallest gap is 0.1°C, the biggest gap is 0.2°C, meet the design requirements.
Soil Moisture Sensor Test
The soil moisture sensor TDR-3 selected by the system is widely used in soil moisture monitoring, and it can detect the soil moisture content in the region within the cylinder with a diameter of 3cm and a length of 6cm around the central probe. The range is 0-100% and the accuracy is 2% in the range of 0-50%. According to the operation manual of soil moisture sensor, its output is 0-2.5V dc voltage signal, and the calculation formula of output and humidity is shown in equation 2. Where VOUT is the output voltage value, the soil moisture content in the monitoring area can be calculated reversely according to the formula qv % (m3/m3). According to the experimental results, the moisture content of the dry soil was 0.6%.
qV OUT OUT OUTV V V= - + -0 0337 0 0426 0 2008 0 00413 2. . . . …(2)
Air Humidity Sensor Test
The environmental humidity sensor PTS-3 is used to meas-ure the air humidity. The humidity sensor adopts the high polymer film moisture sensitive capacitor, and its dielectric constant changes with the change of relative humidity. The measuring range of the sensor is 0~100% RH, the measuring accuracy is 2% RH, and the supply voltage is 0~24V dc. According to the operating instructions of the environmental humidity sensor, its output is 4-20ma dc current signal, and the calculation formula of output and humidity is shown in equation 3. TOUT (unit: mA) is the signal output of the humid-ity sensor. As a result of the system ADC reference voltage of 2.5 V, so choose 120 W sampling resistor, the output current signal is converted into a voltage signal.
Humidity (%RH) = 6.25 • IOUT-25 …(3)
The measurement method of air humidity sensor is sim-ilar to that of temperature sensor. The current amplification was first calibrated using testosterone 625 as the standard value. Then spray water into the air and measure it three times. Observe the difference between the humidity value collected by the sensor and the actual humidity value. The acquisition accuracy of sensor nodes is obtained. The actual measurement results are shown in Table 3. According to the actual measurement results, when the humidity is, the current amplification factor of the sensor node is calibrated, and then the humidity of the other three points is measured. The minimum difference between the measurement result and the reference humidity value is 0.4%, and the maximum difference is 1.1%, which meets the design requirements.
Table 3: Test data of air humidity sensor.
Test content Reference temperature Collect temperature
The calibration 57.50% 57.60%
Test 1 62.4% 61.60
Test 2 67.80% 68.90
Test 3 75.2% 75.60%
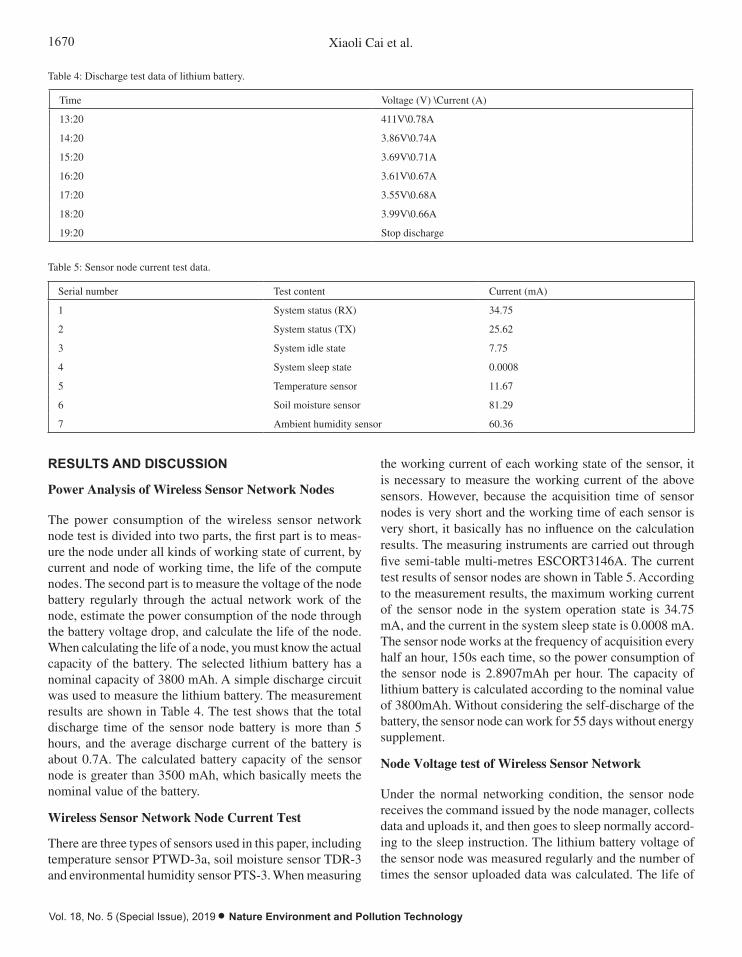
1670 Xiaoli Cai et al.
Vol. 18, No. 5 (Special Issue), 2019 • Nature Environment and Pollution Technology
Table 4: Discharge test data of lithium battery.
Time Voltage (V) \Current (A)
13:20 411V\0.78A
14:20 3.86V\0.74A
15:20 3.69V\0.71A
16:20 3.61V\0.67A
17:20 3.55V\0.68A
18:20 3.99V\0.66A
19:20 Stop discharge
Table 5: Sensor node current test data.
Serial number Test content Current (mA)
1 System status (RX) 34.75
2 System status (TX) 25.62
3 System idle state 7.75
4 System sleep state 0.0008
5 Temperature sensor 11.67
6 Soil moisture sensor 81.29
7 Ambient humidity sensor 60.36
RESULTS AND DISCUSSION
Power Analysis of Wireless Sensor Network Nodes
The power consumption of the wireless sensor network node test is divided into two parts, the first part is to meas-ure the node under all kinds of working state of current, by current and node of working time, the life of the compute nodes. The second part is to measure the voltage of the node battery regularly through the actual network work of the node, estimate the power consumption of the node through the battery voltage drop, and calculate the life of the node. When calculating the life of a node, you must know the actual capacity of the battery. The selected lithium battery has a nominal capacity of 3800 mAh. A simple discharge circuit was used to measure the lithium battery. The measurement results are shown in Table 4. The test shows that the total discharge time of the sensor node battery is more than 5 hours, and the average discharge current of the battery is about 0.7A. The calculated battery capacity of the sensor node is greater than 3500 mAh, which basically meets the nominal value of the battery.
Wireless Sensor Network Node Current Test
There are three types of sensors used in this paper, including temperature sensor PTWD-3a, soil moisture sensor TDR-3 and environmental humidity sensor PTS-3. When measuring
the working current of each working state of the sensor, it is necessary to measure the working current of the above sensors. However, because the acquisition time of sensor nodes is very short and the working time of each sensor is very short, it basically has no influence on the calculation results. The measuring instruments are carried out through five semi-table multi-metres ESCORT3146A. The current test results of sensor nodes are shown in Table 5. According to the measurement results, the maximum working current of the sensor node in the system operation state is 34.75 mA, and the current in the system sleep state is 0.0008 mA. The sensor node works at the frequency of acquisition every half an hour, 150s each time, so the power consumption of the sensor node is 2.8907mAh per hour. The capacity of lithium battery is calculated according to the nominal value of 3800mAh. Without considering the self-discharge of the battery, the sensor node can work for 55 days without energy supplement.
Node Voltage test of Wireless Sensor Network
Under the normal networking condition, the sensor node receives the command issued by the node manager, collects data and uploads it, and then goes to sleep normally accord-ing to the sleep instruction. The lithium battery voltage of the sensor node was measured regularly and the number of times the sensor uploaded data was calculated. The life of
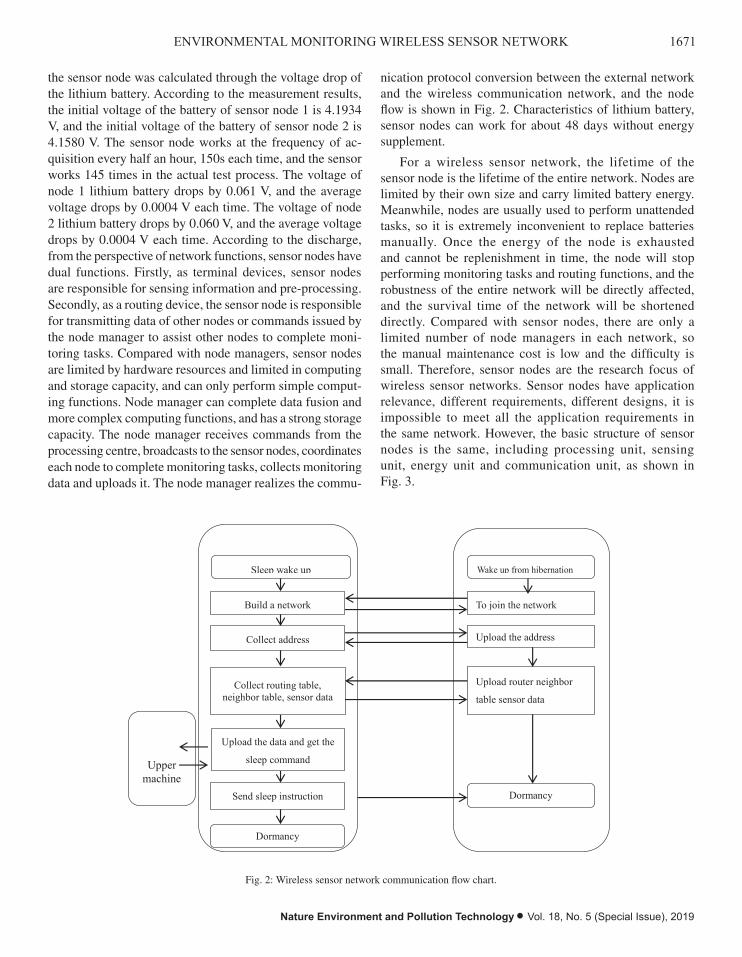
1671ENVIRONMENTAL MONITORING WIRELESS SENSOR NETWORK
Nature Environment and Pollution Technology • Vol. 18, No. 5 (Special Issue), 2019
the sensor node was calculated through the voltage drop of the lithium battery. According to the measurement results, the initial voltage of the battery of sensor node 1 is 4.1934 V, and the initial voltage of the battery of sensor node 2 is 4.1580 V. The sensor node works at the frequency of ac-quisition every half an hour, 150s each time, and the sensor works 145 times in the actual test process. The voltage of node 1 lithium battery drops by 0.061 V, and the average voltage drops by 0.0004 V each time. The voltage of node 2 lithium battery drops by 0.060 V, and the average voltage drops by 0.0004 V each time. According to the discharge, from the perspective of network functions, sensor nodes have dual functions. Firstly, as terminal devices, sensor nodes are responsible for sensing information and pre-processing. Secondly, as a routing device, the sensor node is responsible for transmitting data of other nodes or commands issued by the node manager to assist other nodes to complete moni-toring tasks. Compared with node managers, sensor nodes are limited by hardware resources and limited in computing and storage capacity, and can only perform simple comput-ing functions. Node manager can complete data fusion and more complex computing functions, and has a strong storage capacity. The node manager receives commands from the processing centre, broadcasts to the sensor nodes, coordinates each node to complete monitoring tasks, collects monitoring data and uploads it. The node manager realizes the commu-
nication protocol conversion between the external network and the wireless communication network, and the node flow is shown in Fig. 2. Characteristics of lithium battery, sensor nodes can work for about 48 days without energy supplement.
For a wireless sensor network, the lifetime of the sensor node is the lifetime of the entire network. Nodes are limited by their own size and carry limited battery energy. Meanwhile, nodes are usually used to perform unattended tasks, so it is extremely inconvenient to replace batteries manually. Once the energy of the node is exhausted and cannot be replenishment in time, the node will stop performing monitoring tasks and routing functions, and the robustness of the entire network will be directly affected, and the survival time of the network will be shortened directly. Compared with sensor nodes, there are only a limited number of node managers in each network, so the manual maintenance cost is low and the difficulty is small. Therefore, sensor nodes are the research focus of wireless sensor networks. Sensor nodes have application relevance, different requirements, different designs, it is impossible to meet all the application requirements in the same network. However, the basic structure of sensor nodes is the same, including processing unit, sensing unit, energy unit and communication unit, as shown in Fig. 3.
network and the wireless communication network, and the node flow is shown in Fig. 2. Characteristics
of lithium battery, sensor nodes can work for about 48 days without energy supplement.
Fig. 2: Wireless sensor network communication flow chart.
For a wireless sensor network, the lifetime of the sensor node is the lifetime of the entire network.
Nodes are limited by their own size and carry limited battery energy. Meanwhile, nodes are usually used
to perform unattended tasks, so it is extremely inconvenient to replace batteries manually. Once the
energy of the node is exhausted and cannot be replenishment in time, the node will stop performing
monitoring tasks and routing functions, and the robustness of the entire network will be directly affected,
and the survival time of the network will be shortened directly. Compared with sensor nodes, there are
only a limited number of node managers in each network, so the manual maintenance cost is low and the
difficulty is small. Therefore, sensor nodes are the research focus of wireless sensor networks. Sensor
nodes have application relevance, different requirements, different designs, it is impossible to meet all
the application requirements in the same network. However, the basic structure of sensor nodes is the
same, including processing unit, sensing unit, energy unit and communication unit, as shown in Fig. 3.
Fig. 3: Sensor node structure.
Wake up from hibernation
To join the network
Upload the address
Dormancy
Upload router neighbor
table sensor data
Sleep wake up
Build a network
Collect address
Collect routing table, neighbor table, sensor data
Upload the data and get the
sleep command
Send sleep instruction
Dormancy
Upper machine
Fig. 2: Wireless sensor network communication flow chart.
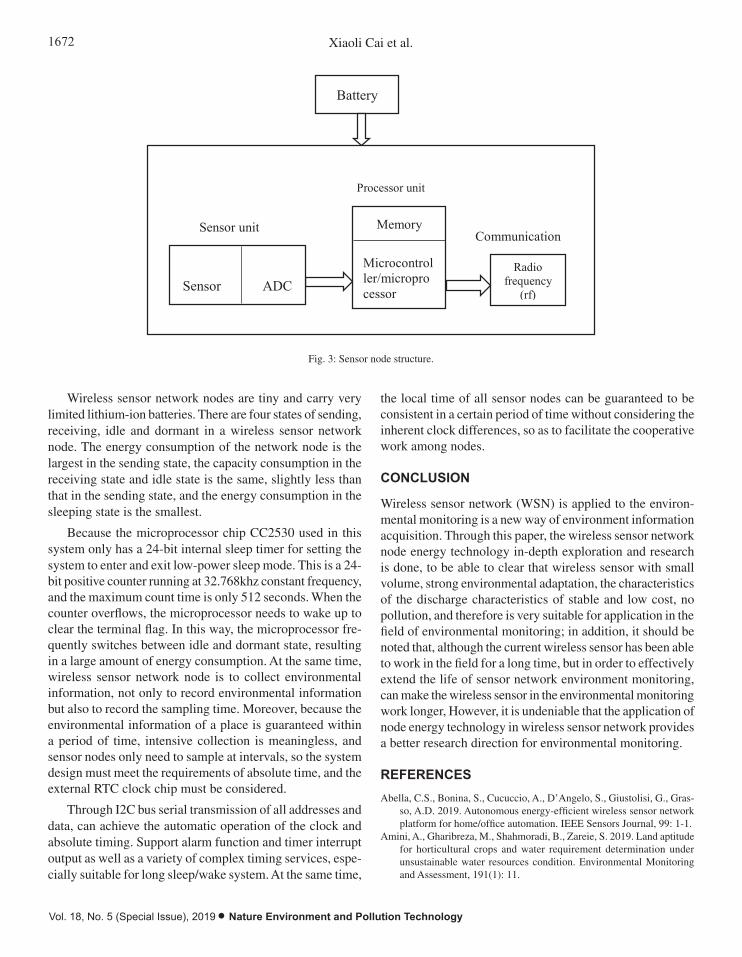
1672 Xiaoli Cai et al.
Vol. 18, No. 5 (Special Issue), 2019 • Nature Environment and Pollution Technology
Wireless sensor network nodes are tiny and carry very limited lithium-ion batteries. There are four
states of sending, receiving, idle and dormant in a wireless sensor network node. The energy consumption
of the network node is the largest in the sending state, the capacity consumption in the receiving state
and idle state is the same, slightly less than that in the sending state, and the energy consumption in the
sleeping state is the smallest.
Because the microprocessor chip CC2530 used in this system only has a 24-bit internal sleep timer
for setting the system to enter and exit low-power sleep mode. This is a 24-bit positive counter running
at 32.768khz constant frequency, and the maximum count time is only 512 seconds. When the counter
overflows, the microprocessor needs to wake up to clear the terminal flag. In this way, the microprocessor
frequently switches between idle and dormant state, resulting in a large amount of energy consumption.
At the same time, wireless sensor network node is to collect environmental information, not only to
record environmental information but also to record the sampling time. Moreover, because the
environmental information of a place is guaranteed within a period of time, intensive collection is
meaningless, and sensor nodes only need to sample at intervals, so the system design must meet the
requirements of absolute time, and the external RTC clock chip must be considered.
Through I2C bus serial transmission of all addresses and data, can achieve the automatic operation
of the clock and absolute timing. Support alarm function and timer interrupt output as well as a variety
of complex timing services, especially suitable for long sleep/wake system. At the same time, the local
time of all sensor nodes can be guaranteed to be consistent in a certain period of time without considering
the inherent clock differences, so as to facilitate the cooperative work among nodes.
Conclusion
Wireless sensor network (WSN) is applied to the environmental monitoring is a new way of environment
information acquisition. Through this paper, the wireless sensor network node energy technology in-
depth exploration and research is done, to be able to clear that wireless sensor with small volume, strong
environmental adaptation, the characteristics of the discharge characteristics of stable and low cost, no
pollution, and therefore is very suitable for application in the field of environmental monitoring; in
addition, it should be noted that, although the current wireless sensor has been able to work in the field
Battery
Memory
Microcontroller/microprocessor
Radio frequency
(rf)
Sensor ADC
Sensor unit
Processor unit
Communication
Fig. 3: Sensor node structure.
Wireless sensor network nodes are tiny and carry very limited lithium-ion batteries. There are four states of sending, receiving, idle and dormant in a wireless sensor network node. The energy consumption of the network node is the largest in the sending state, the capacity consumption in the receiving state and idle state is the same, slightly less than that in the sending state, and the energy consumption in the sleeping state is the smallest.
Because the microprocessor chip CC2530 used in this system only has a 24-bit internal sleep timer for setting the system to enter and exit low-power sleep mode. This is a 24-bit positive counter running at 32.768khz constant frequency, and the maximum count time is only 512 seconds. When the counter overflows, the microprocessor needs to wake up to clear the terminal flag. In this way, the microprocessor fre-quently switches between idle and dormant state, resulting in a large amount of energy consumption. At the same time, wireless sensor network node is to collect environmental information, not only to record environmental information but also to record the sampling time. Moreover, because the environmental information of a place is guaranteed within a period of time, intensive collection is meaningless, and sensor nodes only need to sample at intervals, so the system design must meet the requirements of absolute time, and the external RTC clock chip must be considered.
Through I2C bus serial transmission of all addresses and data, can achieve the automatic operation of the clock and absolute timing. Support alarm function and timer interrupt output as well as a variety of complex timing services, espe-cially suitable for long sleep/wake system. At the same time,
the local time of all sensor nodes can be guaranteed to be consistent in a certain period of time without considering the inherent clock differences, so as to facilitate the cooperative work among nodes.
CONCLUSION
Wireless sensor network (WSN) is applied to the environ-mental monitoring is a new way of environment information acquisition. Through this paper, the wireless sensor network node energy technology in-depth exploration and research is done, to be able to clear that wireless sensor with small volume, strong environmental adaptation, the characteristics of the discharge characteristics of stable and low cost, no pollution, and therefore is very suitable for application in the field of environmental monitoring; in addition, it should be noted that, although the current wireless sensor has been able to work in the field for a long time, but in order to effectively extend the life of sensor network environment monitoring, can make the wireless sensor in the environmental monitoring work longer, However, it is undeniable that the application of node energy technology in wireless sensor network provides a better research direction for environmental monitoring.
REFERENCES
Abella, C.S., Bonina, S., Cucuccio, A., D’Angelo, S., Giustolisi, G., Gras-so, A.D. 2019. Autonomous energy-efficient wireless sensor network platform for home/office automation. IEEE Sensors Journal, 99: 1-1.
Amini, A., Gharibreza, M., Shahmoradi, B., Zareie, S. 2019. Land aptitude for horticultural crops and water requirement determination under unsustainable water resources condition. Environmental Monitoring and Assessment, 191(1): 11.

1673ENVIRONMENTAL MONITORING WIRELESS SENSOR NETWORK
Nature Environment and Pollution Technology • Vol. 18, No. 5 (Special Issue), 2019
Li, G., Peng, S., Wang, C., Niu, J., Yuan, Y. 2019. An energy-efficient data collection scheme using denoising auto encoder in wireless sensor net-works. Tsinghua Science and Technology, 24(1): 86-96.
Mukherjee, M., Shu, L., Prasad, R.V., Wang, D., Hancke, G.P. 2019. Sleep scheduling for unbalanced energy harvesting in industrial wireless sensor networks. IEEE Communications Magazine, 99:. 1-8.
Roch, A.L., Virmontois, C., Paillet, P., Belloir, J.M., Rizzolo, S., Pace, F. 2019. Radiation induced leakage current and electric field enhancement in CMOS image sensor sense node floating diffusions. IEEE Transactions
on Nuclear Science, 99: 1-1.Sheikhi, M., Kashi, S.S., Samaee, Z. 2019. Energy provisioning in wireless
rechargeable sensor networks with limited knowledge. Wireless Net-works, 2: 1-14.
Wang, Y., Dong, Z., Hu, H., Yang, Q., Hou, X., Wu, P. 2019. DNA-modulated photo sensitization: current status and future aspects in bio sensing and en-vironmental monitoring. Analytical and Bioanalytical Chemistry, pp. 1-9.
Zhang, J. and Chen, J. 2019. An adaptive clustering algorithm for dynamic heterogeneous wireless sensor networks. Wireless Networks, 8: 1-16.

Vol. 18, No. 5 (Special Issue), 2019 • Nature Environment and Pollution Technology
1674
Analysis of the Complementary Property of Solar Energy and Thermal Power Based on Coupling Model
Jinpu Liu*, Rui Song*, Saima Nasreen** and Anh Tuan Hoang****Yellow River Conservancy Technical Institute, Kaifeng 475000, China**Department of Environmental Sciences, The Women University, Multan, Pakistan***Ho Chi Minh City University of Transport, Ho Chi Minh, Vietnam
ABSTRACT
To further improve the traditional coal-fired power generation, lower the pollutant emission, and comprehensively implement the energy saving and emission reduction policy, the view that the solar-assisted coal-fired power generation system is the complementary and integrated power system of clean energy and traditional fossil energy has been put forward in the paper. Due to the complexity of solar-assisted coal-fired power generation system, the unified integration principles of the system haven’t been established yet. On the basis of the energy conversion happened in the solar-assisted coal-fired power generation system and the simple coal-fired power generation system, a physical model of two different power input of the power generation system is established, the instantaneous photoelectric efficiency expression of solar-assisted coal-fired power generation system is obtained, and the major factors that affect the solar-assisted coal-fired power generation system are concluded. The results provide the practical in-progress solar-assisted coal-fired power generation system with a basic theoretical basis. Therefore, on the one hand, the solar-assisted coal-fired power generation system helps the large-scale and low-cost development and exploitation of solar thermal power systems; on the other hand, it accelerates the implementation of energy saving and emission reduction policy in traditional coal-fired power plants. It is an effective solution to the problems of ever-increasing environmental pollutions and the limited traditional fossil energy supplies.
INTRODUCTION
Energy is the lifeblood of the national economy. It is closely related to the livelihood of people and the survival of human being. It is of great significance to the sustainable development of a society. Being the most important component of energy resource structure, coal is the most stored fossil fuel worldwide and is distributed more evenly all over the world than other fuels (like gasoline and natural gas). Considering the storage of coal and the economic situation worldwide, the role of coal would have no substantial transformations over a long period of time in the future. In terms of the Chinese power system, the coal-fired units occupied more than 70% of the total power units and approximately 60% of the total coal consumption. Therefore, coal-fired power plants would be one of the major power supplies in China over a long period of time in the future (Zhai et al. 2015). In recent years, the Chinese government has introduced a series of energy consumption control policies and environmental protection requirements, which brings not only new challenges but also limitations to the development of coal-fired power plants. Coal-fired power plants are under great pressure of energy saving and emission reduction (Yu et al. 2015).
Therefore, introducing the photo-thermal system to the regular coal-fired power plants for composing a photo-coal complementary power generation system would utilize the advantages of wide adjustment ranges of power units, making it unnecessary to apply the heat accumulation and turbine systems of solar thermal power plants. In addition, the solar-assisted coal-fired power plants would lower the coal consumption of coal-fired units and relieve the fossil energy shortages on the one hand; if the solar power supply is in scarce need, on the other hand, the coal-fired units are able to supply the power separately, which would effectively solve the problem of intermittency of solar power application, lowering the investment costs of developing and utilizing the solar power. Meanwhile, compared with other renewable resources, solar thermal power system takes the heat as the medium of intermediate energy, making it relatively easy to couple with the coal-fired power system.
PAST RESEARCH
The photo-coal complementary power plant is the integrated energy system of the solar energy collector system and coal-fired power plant. Researches on the complementary
Nat. Env. & Poll. Tech.Website: www.neptjournal.com
Received: 14-08-2019Accepted: 09-10-2019
Key Words:Solar powerPhoto-thermalPhoto-coalComplementary power generationCoupling model
2019pp. 1675-1681 Vol. 18
p-ISSN: 0972-6268 No. 5 (Special Issue)
Nature Environment and Pollution Technology An International Quarterly Scientific Journal
Original Research Paper
e-ISSN: 2395-3454
Open Access
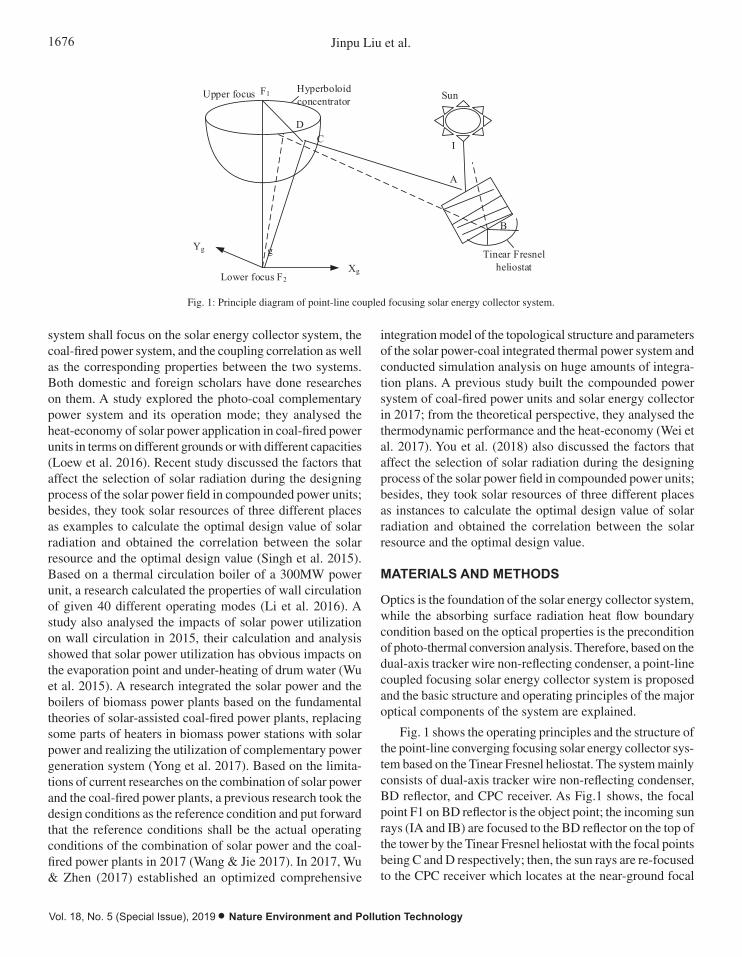
1676 Jinpu Liu et al.
Vol. 18, No. 5 (Special Issue), 2019 • Nature Environment and Pollution Technology
Xg
Yg g
F1
DC
A
B
I
Lower focus F2
Upper focus Hyperboloidconcentrator Sun
Tinear Fresnel heliostat
Fig. 1: Principle diagram of point-line coupled focusing solar energy collector system.
Fig. 1 shows the operating principles and the structure of the point-line converging focusing solar energy collector system based on the Tinear Fresnel heliostat. The system mainly consists of dual-axis tracker wire non-reflecting condenser, BD reflector, and CPC receiver. As Fig.1 shows, the focal point F1 on BD reflector is the object point; the incoming sun rays (IA and IB) are focused to the BD reflector on the top of the tower by the Tinear Fresnel heliostat with the focal points being C and D respectively; then, the sun rays are re-focused to the CPC receiver which locates at the near-ground focal point F. Consequently, a photo-thermal energy conversion process is completed. In the system, the Tinear Fresnel heliostat is a line-focusing condenser, BD reflector, and CPC condenser are all point-focusing condensers. Therefore, the system is called point-line converging focusing heat collector system. The Tinear Fresnel heliostat with dual-axis tracker wire possesses the advantages of good resistance to wind damage and simple structure of traditional Tinear Fresnel condenser; in terms of the differences of tracking modes between the two kinds of condensers, the Tinear Fresnel heliostat is of more compact layout and less land occupation compared with a traditional heliostat.
Regular coal-fired power systems mainly consist of a boiler, steam turbine, and regenerative heater. These components are attached to pipes successively, and transport the working fluids of heat transfer and work applied. The steam generated in the boiler first works in the high-pressure cylinder of steam turbine; then the steam discharged from the high-pressure cylinder goes into the regenerative heater for re-heating; the reheated steam then successively goes to the mid-pressure cylinder and low-pressure cylinder to work and the exhaust steam is discharged into the condenser and is condensed into steam condensate; the steam condensate is pumped into each low-pressure regenerative heater successively by the condensate pump, and is transported to each high-pressure regenerative heater in succession through feedwater pump. Consequently, it enters the boiler again and starts a new circulation. The energy balance model of the coal-fired power system is established in accordance with the first law of thermodynamics. The boiler is the major device to achieve the transmission of fuels from chemical energy into thermal energy; its heat balance equation is:
𝑚𝑚𝑐𝑐 × 𝑞𝑞𝑠𝑠 × 𝜂𝜂𝑏𝑏 = 𝑚𝑚𝑚𝑚𝑠𝑠 × (ℎ𝑚𝑚𝑠𝑠 −ℎ𝑖𝑖𝑖𝑖) + 𝑚𝑚𝑟𝑟𝑠𝑠 × (ℎ𝑟𝑟𝑟𝑟 −ℎ𝑟𝑟𝑖𝑖) … (1)
In the equation, mc is the fuel mass, kg/s; qs is the fuel calorific capacity, kJ/kg; 𝜂𝜂𝑏𝑏 is the thermal efficiency of the boiler; mms is the steam flow at boiler outlet, kg/s; hms is the steam specific enthalpy at the boiler outlet, kJ/kg; hiw is the feedwater specific enthalpy at boiler inlet, kJ/kg; mrs is the reheated steam flow, kg/s; hro is the steam specific enthalpy in regenerative hot section, kJ/kg; hri is the steam specific enthalpy in regenerative cold section, kJ/kg.
Superheated steam generated in the boiler expands and works in the steam turbine, as the following equation shows:
𝑤𝑤 = 𝑚𝑚𝑠𝑠 × (ℎ𝑠𝑠𝑖𝑖 −ℎ𝑠𝑠𝑟𝑟) × 𝜂𝜂𝑖𝑖 (2)
Fig. 1: Principle diagram of point-line coupled focusing solar energy collector system.
system shall focus on the solar energy collector system, the coal-fired power system, and the coupling correlation as well as the corresponding properties between the two systems. Both domestic and foreign scholars have done researches on them. A study explored the photo-coal complementary power system and its operation mode; they analysed the heat-economy of solar power application in coal-fired power units in terms on different grounds or with different capacities (Loew et al. 2016). Recent study discussed the factors that affect the selection of solar radiation during the designing process of the solar power field in compounded power units; besides, they took solar resources of three different places as examples to calculate the optimal design value of solar radiation and obtained the correlation between the solar resource and the optimal design value (Singh et al. 2015). Based on a thermal circulation boiler of a 300MW power unit, a research calculated the properties of wall circulation of given 40 different operating modes (Li et al. 2016). A study also analysed the impacts of solar power utilization on wall circulation in 2015, their calculation and analysis showed that solar power utilization has obvious impacts on the evaporation point and under-heating of drum water (Wu et al. 2015). A research integrated the solar power and the boilers of biomass power plants based on the fundamental theories of solar-assisted coal-fired power plants, replacing some parts of heaters in biomass power stations with solar power and realizing the utilization of complementary power generation system (Yong et al. 2017). Based on the limita-tions of current researches on the combination of solar power and the coal-fired power plants, a previous research took the design conditions as the reference condition and put forward that the reference conditions shall be the actual operating conditions of the combination of solar power and the coal-fired power plants in 2017 (Wang & Jie 2017). In 2017, Wu & Zhen (2017) established an optimized comprehensive
integration model of the topological structure and parameters of the solar power-coal integrated thermal power system and conducted simulation analysis on huge amounts of integra-tion plans. A previous study built the compounded power system of coal-fired power units and solar energy collector in 2017; from the theoretical perspective, they analysed the thermodynamic performance and the heat-economy (Wei et al. 2017). You et al. (2018) also discussed the factors that affect the selection of solar radiation during the designing process of the solar power field in compounded power units; besides, they took solar resources of three different places as instances to calculate the optimal design value of solar radiation and obtained the correlation between the solar resource and the optimal design value.
MATERIALS AND METHODS
Optics is the foundation of the solar energy collector system, while the absorbing surface radiation heat flow boundary condition based on the optical properties is the precondition of photo-thermal conversion analysis. Therefore, based on the dual-axis tracker wire non-reflecting condenser, a point-line coupled focusing solar energy collector system is proposed and the basic structure and operating principles of the major optical components of the system are explained.
Fig. 1 shows the operating principles and the structure of the point-line converging focusing solar energy collector sys-tem based on the Tinear Fresnel heliostat. The system mainly consists of dual-axis tracker wire non-reflecting condenser, BD reflector, and CPC receiver. As Fig.1 shows, the focal point F1 on BD reflector is the object point; the incoming sun rays (IA and IB) are focused to the BD reflector on the top of the tower by the Tinear Fresnel heliostat with the focal points being C and D respectively; then, the sun rays are re-focused to the CPC receiver which locates at the near-ground focal
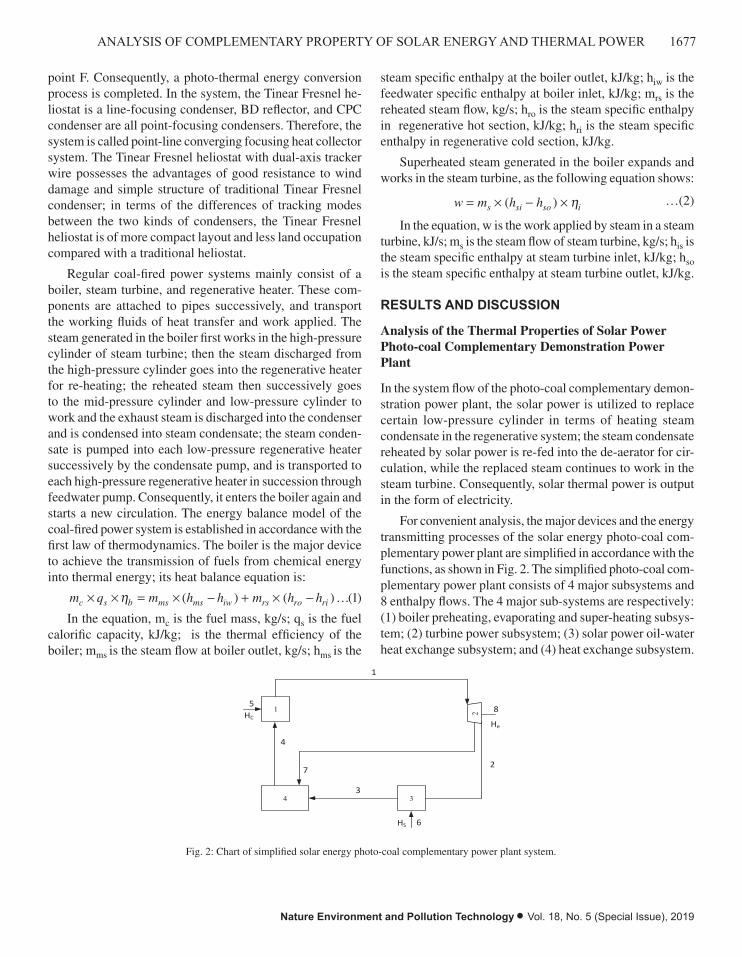
1677ANALYSIS OF COMPLEMENTARY PROPERTY OF SOLAR ENERGY AND THERMAL POWER
Nature Environment and Pollution Technology • Vol. 18, No. 5 (Special Issue), 2019
point F. Consequently, a photo-thermal energy conversion process is completed. In the system, the Tinear Fresnel he-liostat is a line-focusing condenser, BD reflector, and CPC condenser are all point-focusing condensers. Therefore, the system is called point-line converging focusing heat collector system. The Tinear Fresnel heliostat with dual-axis tracker wire possesses the advantages of good resistance to wind damage and simple structure of traditional Tinear Fresnel condenser; in terms of the differences of tracking modes between the two kinds of condensers, the Tinear Fresnel heliostat is of more compact layout and less land occupation compared with a traditional heliostat.
Regular coal-fired power systems mainly consist of a boiler, steam turbine, and regenerative heater. These com-ponents are attached to pipes successively, and transport the working fluids of heat transfer and work applied. The steam generated in the boiler first works in the high-pressure cylinder of steam turbine; then the steam discharged from the high-pressure cylinder goes into the regenerative heater for re-heating; the reheated steam then successively goes to the mid-pressure cylinder and low-pressure cylinder to work and the exhaust steam is discharged into the condenser and is condensed into steam condensate; the steam conden-sate is pumped into each low-pressure regenerative heater successively by the condensate pump, and is transported to each high-pressure regenerative heater in succession through feedwater pump. Consequently, it enters the boiler again and starts a new circulation. The energy balance model of the coal-fired power system is established in accordance with the first law of thermodynamics. The boiler is the major device to achieve the transmission of fuels from chemical energy into thermal energy; its heat balance equation is:
m q m h h m h hc s b ms ms iw rs ro ri¥ ¥ = ¥ - + ¥ -h ( ) ( )… (1)
In the equation, mc is the fuel mass, kg/s; qs is the fuel calorific capacity, kJ/kg; is the thermal efficiency of the boiler; mms is the steam flow at boiler outlet, kg/s; hms is the
steam specific enthalpy at the boiler outlet, kJ/kg; hiw is the feedwater specific enthalpy at boiler inlet, kJ/kg; mrs is the reheated steam flow, kg/s; hro is the steam specific enthalpy in regenerative hot section, kJ/kg; hri is the steam specific enthalpy in regenerative cold section, kJ/kg.
Superheated steam generated in the boiler expands and works in the steam turbine, as the following equation shows:
w m h hs si so i= ¥ - ¥( ) h …(2)
In the equation, w is the work applied by steam in a steam turbine, kJ/s; ms is the steam flow of steam turbine, kg/s; his is the steam specific enthalpy at steam turbine inlet, kJ/kg; hso is the steam specific enthalpy at steam turbine outlet, kJ/kg.
RESULTS AND DISCUSSION
Analysis of the Thermal Properties of Solar Power Photo-coal Complementary Demonstration Power Plant
In the system flow of the photo-coal complementary demon-stration power plant, the solar power is utilized to replace certain low-pressure cylinder in terms of heating steam condensate in the regenerative system; the steam condensate reheated by solar power is re-fed into the de-aerator for cir-culation, while the replaced steam continues to work in the steam turbine. Consequently, solar thermal power is output in the form of electricity.
For convenient analysis, the major devices and the energy transmitting processes of the solar energy photo-coal com-plementary power plant are simplified in accordance with the functions, as shown in Fig. 2. The simplified photo-coal com-plementary power plant consists of 4 major subsystems and 8 enthalpy flows. The 4 major sub-systems are respectively: (1) boiler preheating, evaporating and super-heating subsys-tem; (2) turbine power subsystem; (3) solar power oil-water heat exchange subsystem; and (4) heat exchange subsystem.
In the equation, w is the work applied by steam in a steam turbine, kJ/s; ms is the steam flow of steam turbine, kg/s; his is the steam specific enthalpy at steam turbine inlet, kJ/kg; hso is the steam specific enthalpy at steam turbine outlet, kJ/kg.
Results and Discussion
Analysis of the thermal properties of solar power photo-coal complementary demonstration power plant
In the system flow of the photo-coal complementary demonstration power plant, the solar power is utilized to replace certain low-pressure cylinder in terms of heating steam condensate in the regenerative system; the steam condensate reheated by solar power is re-fed into the deaerator for circulation, while the replaced steam continues to work in the steam turbine. Consequently, solar thermal power is output in the form of electricity.
For convenient analysis, the major devices and the energy transmitting processes of the solar energy photo-coal complementary power plant are simplified in accordance with the functions, as shown in Fig. 2. The simplified photo-coal complementary power plant consists of 4 major subsystems and 8 enthalpy flows. The 4 major sub-systems are respectively: (1) boiler preheating, evaporating and superheating subsystem; (2) turbine power subsystem; (3) solar power oil-water heat exchange subsystem; and (4) heat exchange subsystem.
Fig. 2: Chart of simplified solar energy photo-coal complementary power plant system.
1
4 3
2
1
2
3
4
5HC
6HS
7
8
He
Through the simulation model of solar energy photo-coal complementary power plant established before, the parameter distribution properties of major devices of the system in the complementary powering operating mode are analysed. Based on the simplified system structure demonstrated in Fig. 2, the corresponding thermodynamic parameters of the system are calculated. The values of enthalpy flow of the demonstration power plant are shown in Fig. 3, and the proportion of solar energy is shown in Table 1.
Fig. 3: Enthalpy flow value of each unit in demonstration power plant.
H1 H2 H3 H4 H5 H6 H7 H80
200000
400000
600000
800000
Table 1: Proportion of solar energy in the demonstration power plant.
The proportion of solar energy a % a1 0.1 a2 0.1 a3 6.3
Fig. 2: Chart of simplified solar energy photo-coal complementary power plant system.
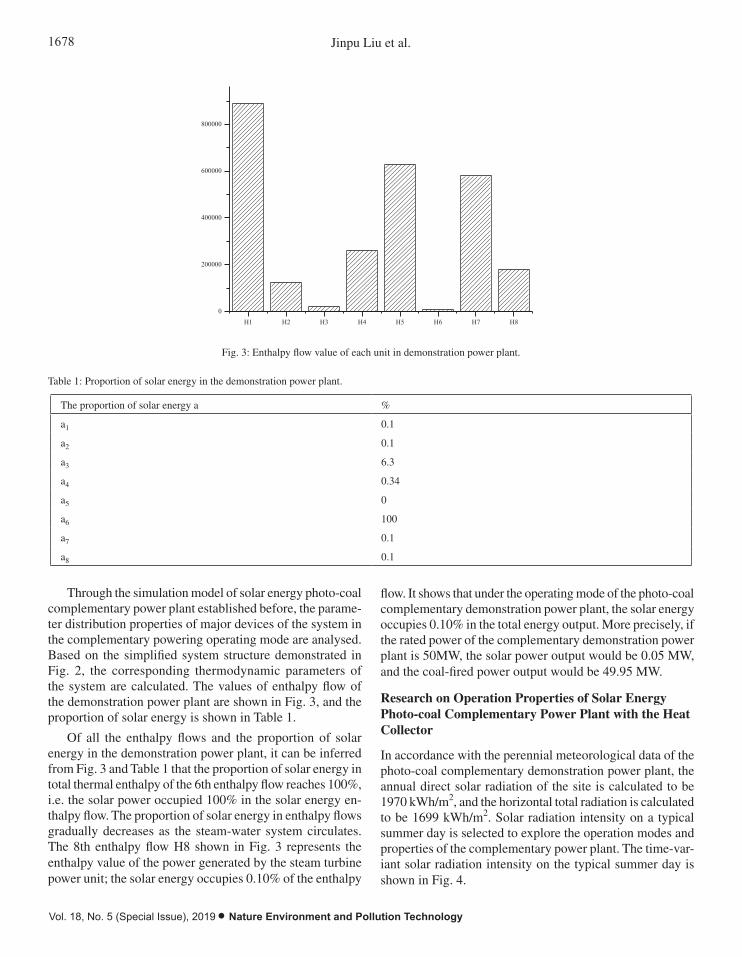
1678 Jinpu Liu et al.
Vol. 18, No. 5 (Special Issue), 2019 • Nature Environment and Pollution Technology
In the equation, w is the work applied by steam in a steam turbine, kJ/s; ms is the steam flow of steam turbine, kg/s; his is the steam specific enthalpy at steam turbine inlet, kJ/kg; hso is the steam specific enthalpy at steam turbine outlet, kJ/kg.
Results and Discussion
Analysis of the thermal properties of solar power photo-coal complementary demonstration power plant
In the system flow of the photo-coal complementary demonstration power plant, the solar power is utilized to replace certain low-pressure cylinder in terms of heating steam condensate in the regenerative system; the steam condensate reheated by solar power is re-fed into the deaerator for circulation, while the replaced steam continues to work in the steam turbine. Consequently, solar thermal power is output in the form of electricity.
For convenient analysis, the major devices and the energy transmitting processes of the solar energy photo-coal complementary power plant are simplified in accordance with the functions, as shown in Fig. 2. The simplified photo-coal complementary power plant consists of 4 major subsystems and 8 enthalpy flows. The 4 major sub-systems are respectively: (1) boiler preheating, evaporating and superheating subsystem; (2) turbine power subsystem; (3) solar power oil-water heat exchange subsystem; and (4) heat exchange subsystem.
Fig. 2: Chart of simplified solar energy photo-coal complementary power plant system.
1
4 3
2
1
2
3
4
5HC
6HS
7
8
He
Through the simulation model of solar energy photo-coal complementary power plant established before, the parameter distribution properties of major devices of the system in the complementary powering operating mode are analysed. Based on the simplified system structure demonstrated in Fig. 2, the corresponding thermodynamic parameters of the system are calculated. The values of enthalpy flow of the demonstration power plant are shown in Fig. 3, and the proportion of solar energy is shown in Table 1.
Fig. 3: Enthalpy flow value of each unit in demonstration power plant.
H1 H2 H3 H4 H5 H6 H7 H80
200000
400000
600000
800000
Table 1: Proportion of solar energy in the demonstration power plant.
The proportion of solar energy a % a1 0.1 a2 0.1 a3 6.3
Fig. 3: Enthalpy flow value of each unit in demonstration power plant.
Table 1: Proportion of solar energy in the demonstration power plant.
The proportion of solar energy a %
a1 0.1
a2 0.1
a3 6.3
a4 0.34
a5 0
a6 100
a7 0.1
a8 0.1
Through the simulation model of solar energy photo-coal complementary power plant established before, the parame-ter distribution properties of major devices of the system in the complementary powering operating mode are analysed. Based on the simplified system structure demonstrated in Fig. 2, the corresponding thermodynamic parameters of the system are calculated. The values of enthalpy flow of the demonstration power plant are shown in Fig. 3, and the proportion of solar energy is shown in Table 1.
Of all the enthalpy flows and the proportion of solar energy in the demonstration power plant, it can be inferred from Fig. 3 and Table 1 that the proportion of solar energy in total thermal enthalpy of the 6th enthalpy flow reaches 100%, i.e. the solar power occupied 100% in the solar energy en-thalpy flow. The proportion of solar energy in enthalpy flows gradually decreases as the steam-water system circulates. The 8th enthalpy flow H8 shown in Fig. 3 represents the enthalpy value of the power generated by the steam turbine power unit; the solar energy occupies 0.10% of the enthalpy
flow. It shows that under the operating mode of the photo-coal complementary demonstration power plant, the solar energy occupies 0.10% in the total energy output. More precisely, if the rated power of the complementary demonstration power plant is 50MW, the solar power output would be 0.05 MW, and the coal-fired power output would be 49.95 MW.
Research on Operation Properties of Solar Energy Photo-coal Complementary Power Plant with the Heat Collector
In accordance with the perennial meteorological data of the photo-coal complementary demonstration power plant, the annual direct solar radiation of the site is calculated to be 1970 kWh/m2, and the horizontal total radiation is calculated to be 1699 kWh/m2. Solar radiation intensity on a typical summer day is selected to explore the operation modes and properties of the complementary power plant. The time-var-iant solar radiation intensity on the typical summer day is shown in Fig. 4.
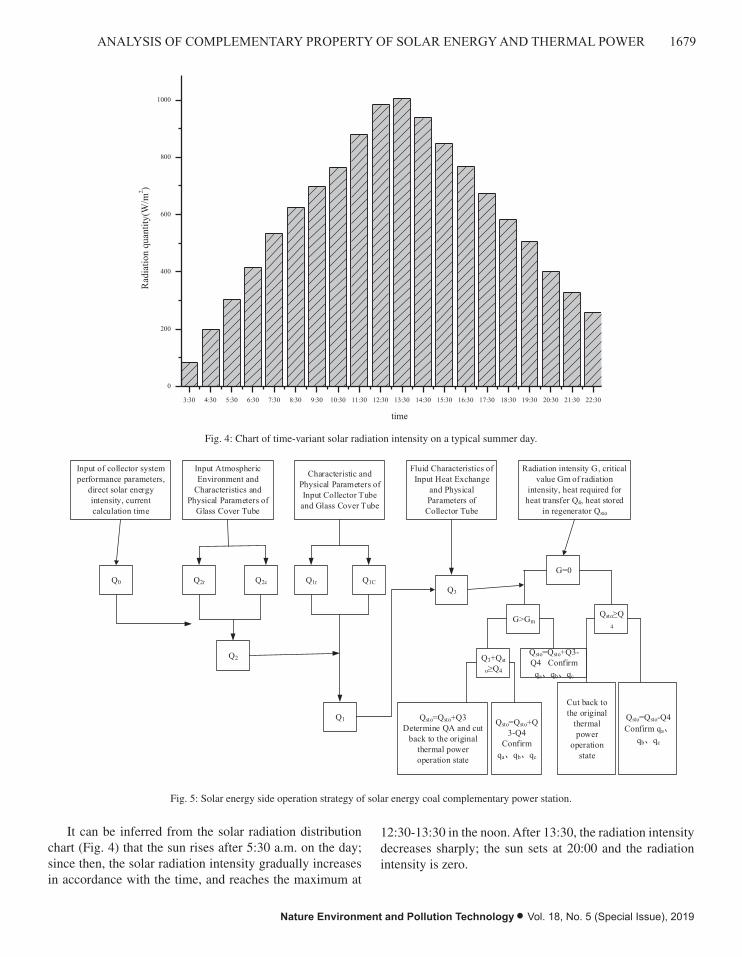
1679ANALYSIS OF COMPLEMENTARY PROPERTY OF SOLAR ENERGY AND THERMAL POWER
Nature Environment and Pollution Technology • Vol. 18, No. 5 (Special Issue), 2019
a4 0.34 a5 0 a6 100 a7 0.1 a8 0.1
Of all the enthalpy flows and the proportion of solar energy in the demonstration power plant, it can be inferred from Fig. 3 and Table 1 that the proportion of solar energy in total thermal enthalpy of the 6th enthalpy flow reaches 100%, i.e. the solar power occupied 100% in the solar energy enthalpy flow. The proportion of solar energy in enthalpy flows gradually decreases as the steam-water system circulates. The 8th enthalpy flow H8 shown in Fig. 3 represents the enthalpy value of the power generated by the steam turbine power unit; the solar energy occupies 0.10% of the enthalpy flow. It shows that under the operating mode of the photo-coal complementary demonstration power plant, the solar energy occupies 0.10% in the total energy output. More precisely, if the rated power of the complementary demonstration power plant is 50MW, the solar power output would be 0.05MW, and the coal-fired power output would be 49.95MW.
Research on operation properties of solar energy photo-coal complementary power plant with the heat collector
In accordance with the perennial meteorological data of the photo-coal complementary demonstration power plant, the annual direct solar radiation of the site is calculated to be 1970kWh/m2, and the horizontal total radiation is calculated to be 1699kWh/m2. Solar radiation intensity on a typical summer day is selected to explore the operation modes and properties of the complementary power plant. The time-variant solar radiation intensity on the typical summer day is shown in Fig. 4.
Fig. 4: Chart of time-variant solar radiation intensity on a typical summer day.
3:30 4:30 5:30 6:30 7:30 8:30 9:30 10:30 11:30 12:30 13:30 14:30 15:30 16:30 17:30 18:30 19:30 20:30 21:30 22:30
0
200
400
600
800
1000
Rad
iatio
n qu
antit
y(W
/m2 )
time
It can be inferred from the solar radiation distribution chart (Fig. 4) that the sun rises after 5:30 a.m. on the day; since then, the solar radiation intensity gradually increases in accordance with the time, and reaches the maximum at 12:30-13:30 in the noon. After 13:30, the radiation intensity decreases sharply; the sun sets at 20:00 and the radiation intensity is zero.
Fig. 4: Chart of time-variant solar radiation intensity on a typical summer day.
Input of collector system performance parameters,
direct solar energy intensity, current calculation time
Radiation intensity G, critical value Gm of radiation
intensity, heat required for heat transfer Q4, heat stored
in regenerator Qsto
Input Atmospheric Environment and
Characteristics and Physical Parameters of
Glass Cover Tube
Characteristic and Physical Parameters of Input Collector Tube
and Glass Cover Tube
Fluid Characteristics of Input Heat Exchange
and Physical Parameters of
Collector Tube
Q0 Q2r Q2c Q1r Q1C
Q2
Q1
Q3
G=0
G>GmQsto≥Q
4
Qsto=Qsto+Q3-Q4 Confirm qa、qb、qc
Q3+Qst
o≥Q4
Qsto=Qsto+Q3 Determine QA and cut
back to the original thermal power operation state
Qsto=Qsto+Q3-Q4
Confirm qa、qb、qc
Cut back to the original
thermal power
operation state
Qsto=Qsto-Q4 Confirm qa、
qb、qc
Fig. 5: Solar energy side operation strategy of solar energy coal complementary power station.
Due to the intrinsic fluctuation property of solar radiation, when the solar energy photo-coal complementary power plant is in stable operation, the solar power demanded by the coal-fired power units is constant, then the corresponding total solar radiation intensity of demanded solar power Gm is defined as the radiation threshold. In accordance with the total radiation intensity, the actual operation mode of the photo-coal complementary power plant with heat collector are categorized into following 3 categories: (1) the total radiation intensity is higher than the threshold; (2) the total radiation intensity is lower than the threshold; and (3) the radiation intensity is zero. Under the 3 operation modes, the operation control strategies of the complementary power plant are shown in Fig. 5.
Analysis of the radiation properties of the photo-coal complementary compounded power system
The section mainly focuses on the analysis of the integrated properties and the thermodynamic properties of the capacity expansion solar steam direct generation system and the coal-fired power units under different integrated modes of single radiation intensity. The analysis follows the principle of “proper temperature and gradient utilization of energy”. Certain amount of steam condensate is collected at the condensate pump outlet; after being pressurized by the booster, it is heated by the heat collector fields to certain section of steam extraction parameter, and then returns to the thermal system of the coal-fired power unit; in the thermal system, it is mixed with the steam extraction for getting heated in the heater; meanwhile, the drain generated in capacity expansion evaporator possesses the same pressure as superheat steam, therefore, it is basically the same as the pressure of drain generated in the replaced heater. The replaced steam extraction continues to work in the steam turbine, increasing the system power output. The inlet steam flow, pressure, and temperature are directly related to the steam extraction parameter when solar steam is inlet into different sections of the coal-fired power units. Therefore, the steam extraction flow of the unit varies, which would cause the parameter variations and the property variations in terms of thermodynamic properties and heat-economy in the compounded power system. Based on the 600MW coal-fired power unit, the operation modes of replacing the 8 steam extraction sections are simulated. Calculations are based on the parameters of the steam turbine unit, the heat collector field, and the compounded system. The variation tendency of thermodynamic properties of the coal-fired power unit aided by capacity expansion evaporative parabolic trough solar power collector system is explored.
Fig. 5: Solar energy side operation strategy of solar energy coal complementary power station.
It can be inferred from the solar radiation distribution chart (Fig. 4) that the sun rises after 5:30 a.m. on the day; since then, the solar radiation intensity gradually increases in accordance with the time, and reaches the maximum at
12:30-13:30 in the noon. After 13:30, the radiation intensity decreases sharply; the sun sets at 20:00 and the radiation intensity is zero.
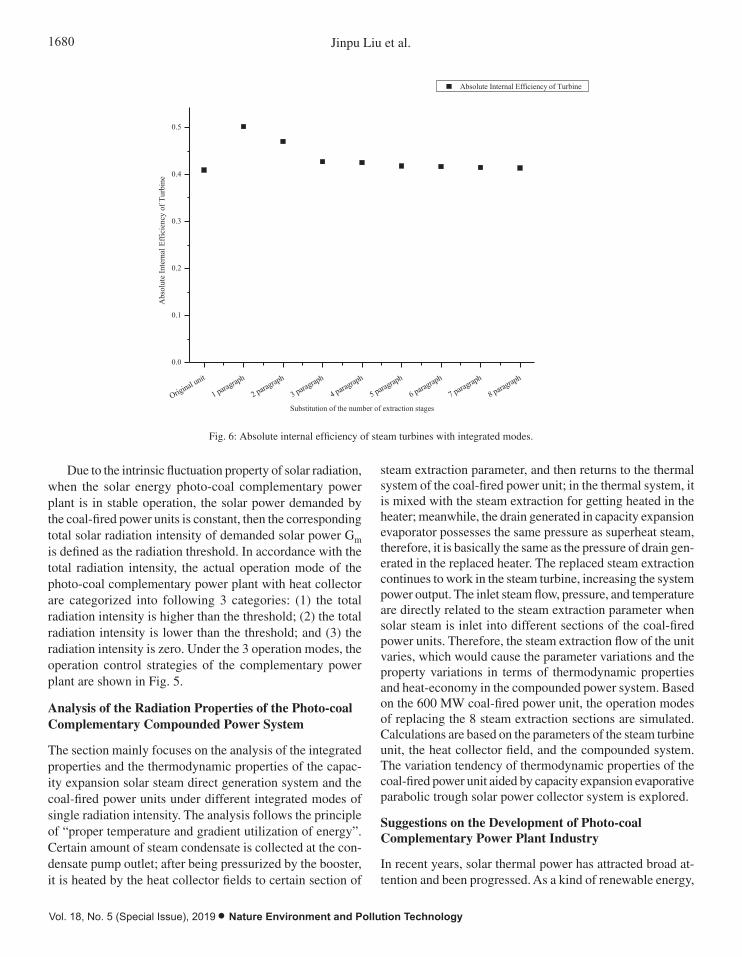
1680 Jinpu Liu et al.
Vol. 18, No. 5 (Special Issue), 2019 • Nature Environment and Pollution Technology
Original unit
1 paragraph
2 paragraph
3 paragraph
4 paragraph
5 paragraph
6 paragraph
7 paragraph
8 paragraph
0.0
0.1
0.2
0.3
0.4
0.5
Abs
olut
e In
tern
al E
ffic
ienc
y of
Tur
bine
Substitution of the number of extraction stages
Absolute Internal Efficiency of Turbine
Fig. 6: Absolute internal efficiency of steam turbines with integrated modes.
Suggestions on the development of photo-coal complementary power plant industry
In recent years, solar thermal power has attracted broad attention and been progressed. As a kind of renewable energy, solar thermal power possesses lots of advantages, such as good power quality and suitable for being built in desolate Northeastern China, etc. However, the solar thermal power industry in China hasn’t been industrialized yet; in addition, its supporting system still needs improving and its price policy hasn’t been issued. Therefore, the comprehensive promotion and large-scale application of solar thermal power are relatively difficult in China. Due to the sharp decrease in the construction cost of solar photovoltaic (PV) power generation, the return on investment of solar PV power generation is much higher than that of solar thermal power. Thus, in accordance with the development of photo-thermal industries in China, the balanced development of solar thermal power and solar PV power, and the project development of power supply corporations, it is suggested that governmental departments decide the sample solar thermal power price as soon as possible to attract investments on the solar thermal projects, as well as pushing forward the organized development of the solar industry in China.
Conclusion
The objective of the present work is to explore the photo-coal complementary compounded power generation system by means of theoretical researches, numerical modelling and simulation calculations, etc. The capacity expansion evaporative solar power direct evaporation generation system is proposed. The general calculation equation of photo-coal complementary compounded power generation system is obtained. The rated radiation and radiation variation model of the photo-coal complementary power system is established. The thermodynamic properties, the operational laws and the impacts of solar-assisted heating system on the performance of the power unit are discussed and explored. Besides, the technical economy and the commercial opportunity of the system are analysed, providing a new approach to optimize the energy structure in China. In summary, the major achievements are demonstrated as follows:
Based on analysing the solar resource properties of the demonstration plant site, the heat collecting properties of the system under the conditions of designed operation modes, array spacing variation, axial installation angel variations and loss of vacuum of heat collecting pipes of the parabolic trough solar power collector system are analysed theoretically. Besides, the environment-variant mechanism and properties of the heat collecting system are also analysed. Next, through analysing 3 typical power generation properties of the solar power system and the solar radiation resources of the demonstration power plant, the environment adaptabilities of different technologies of the solar power system including heat collecting properties are discussed. From the perspective of technology selection, based on demonstration power plant site, the power capacities and systematic heat collecting properties
Fig. 6: Absolute internal efficiency of steam turbines with integrated modes.
Due to the intrinsic fluctuation property of solar radiation, when the solar energy photo-coal complementary power plant is in stable operation, the solar power demanded by the coal-fired power units is constant, then the corresponding total solar radiation intensity of demanded solar power Gm is defined as the radiation threshold. In accordance with the total radiation intensity, the actual operation mode of the photo-coal complementary power plant with heat collector are categorized into following 3 categories: (1) the total radiation intensity is higher than the threshold; (2) the total radiation intensity is lower than the threshold; and (3) the radiation intensity is zero. Under the 3 operation modes, the operation control strategies of the complementary power plant are shown in Fig. 5.
Analysis of the Radiation Properties of the Photo-coal Complementary Compounded Power System
The section mainly focuses on the analysis of the integrated properties and the thermodynamic properties of the capac-ity expansion solar steam direct generation system and the coal-fired power units under different integrated modes of single radiation intensity. The analysis follows the principle of “proper temperature and gradient utilization of energy”. Certain amount of steam condensate is collected at the con-densate pump outlet; after being pressurized by the booster, it is heated by the heat collector fields to certain section of
steam extraction parameter, and then returns to the thermal system of the coal-fired power unit; in the thermal system, it is mixed with the steam extraction for getting heated in the heater; meanwhile, the drain generated in capacity expansion evaporator possesses the same pressure as superheat steam, therefore, it is basically the same as the pressure of drain gen-erated in the replaced heater. The replaced steam extraction continues to work in the steam turbine, increasing the system power output. The inlet steam flow, pressure, and temperature are directly related to the steam extraction parameter when solar steam is inlet into different sections of the coal-fired power units. Therefore, the steam extraction flow of the unit varies, which would cause the parameter variations and the property variations in terms of thermodynamic properties and heat-economy in the compounded power system. Based on the 600 MW coal-fired power unit, the operation modes of replacing the 8 steam extraction sections are simulated. Calculations are based on the parameters of the steam turbine unit, the heat collector field, and the compounded system. The variation tendency of thermodynamic properties of the coal-fired power unit aided by capacity expansion evaporative parabolic trough solar power collector system is explored.
Suggestions on the Development of Photo-coal Complementary Power Plant Industry
In recent years, solar thermal power has attracted broad at-tention and been progressed. As a kind of renewable energy,

1681ANALYSIS OF COMPLEMENTARY PROPERTY OF SOLAR ENERGY AND THERMAL POWER
Nature Environment and Pollution Technology • Vol. 18, No. 5 (Special Issue), 2019
solar thermal power possesses lots of advantages, such as good power quality and suitable for being built in desolate Northeastern China, etc. However, the solar thermal power industry in China hasn’t been industrialized yet; in addition, its supporting system still needs improving and its price policy hasn’t been issued. Therefore, the comprehensive promotion and large-scale application of solar thermal power are relatively difficult in China. Due to the sharp decrease in the construction cost of solar photovoltaic (PV) power generation, the return on investment of solar PV power generation is much higher than that of solar thermal power. Thus, in accordance with the development of photo-thermal industries in China, the balanced development of solar ther-mal power and solar PV power, and the project development of power supply corporations, it is suggested that govern-mental departments decide the sample solar thermal power price as soon as possible to attract investments on the solar thermal projects, as well as pushing forward the organized development of the solar industry in China.
CONCLUSION
The objective of the present work is to explore the photo-coal complementary compounded power generation system by means of theoretical researches, numerical modelling and simulation calculations, etc. The capacity expansion evap-orative solar power direct evaporation generation system is proposed. The general calculation equation of photo-coal complementary compounded power generation system is obtained. The rated radiation and radiation variation model of the photo-coal complementary power system is established. The thermodynamic properties, the operational laws and the impacts of solar-assisted heating system on the performance of the power unit are discussed and explored. Besides, the technical economy and the commercial opportunity of the system are analysed, providing a new approach to optimize the energy structure in China. In summary, the major achieve-ments are demonstrated as follows:
Based on analysing the solar resource properties of the demonstration plant site, the heat collecting properties of the system under the conditions of designed operation modes, array spacing variation, axial installation angel variations and loss of vacuum of heat collecting pipes of the parabolic
trough solar power collector system are analysed theoretical-ly. Besides, the environment-variant mechanism and prop-erties of the heat collecting system are also analysed. Next, through analysing 3 typical power generation properties of the solar power system and the solar radiation resources of the demonstration power plant, the environment adaptab-ilities of different technologies of the solar power system including heat collecting properties are discussed. From the perspective of technology selection, based on demonstration power plant site, the power capacities and systematic heat collecting properties of both trough and tower systems are analysed given the same operating performance, the same heat collecting area, the same collecting hours, and the same installed capacity.
REFERENCES
Li, J., Yu, X., Wang, J. 2016. Coupling performance analysis of a solar aided coal-fired power plant. Applied Thermal Engineering, 106: 613-624.
Loew, A, Jaramillo, P., Zhai, H. 2016. Marginal costs of water savings from cooling system retrofits: a case study for Texas power plants. Environmental Research Letters, 11(10): 104004.
Singh, L.M., Kumar, M., Sahoo, B.K. 2015. Study of natural radioactivity, radon exhalation rate and radiation doses in coal and fly ash samples from thermal power plants, India. Physics Procedia, 80: 120-124.
Wang, R.L. and Jie, S. 2017. Theoretical analysis of integration of solar-coal hybrid power generation system based on energy level coupling. Chi-nese Science Bulletin, 62(22): 2564-2576.
Wei, F., Qiang, H., Huang, S. 2017. Optimal sizing of utility-scale photo-voltaic power generation complementarily operating with hydropower: A case study of the world’s largest hydro-photovoltaic plant. Energy Conversion & Management, 136: 161-172.
Wu, J., Hou, H., Yang, Y. 2015. Annual performance of a solar aided coal-fired power generation system (SACPG) with various solar field areas and thermal energy storage capacity. Applied Energy, 157: 123-133.
Wu, Y. and Zhen, W. 2017. The decision-making of agriculture & solar complementary roof power generation project in rural area. Energy Procedia, 105: 3663-3672.
Yong, Z., Zhai, R., Qi, J. 2017. Annual performance of solar tower aided coal-fired power generation system. Energy, 119: 662-674.
You, H., Hong, F., Xu, W. 2018. Environmental efficiency of photovoltaic power plants in China-a comparative study of different economic zones and plant types. Sustainability, 10(7): 2551.
Yu, S.C, Chen, L, Zhao, Y. 2015. A brief review study of various thermody-namic cycles for high temperature power generation systems. Energy Conversion & Management, 94: 68-83.
Zhai, R., Zhao, M., Chao, L. 2015. Improved optimization study of inte-gration strategies in solar aided coal-fired power generation system. Renewable Energy, 68(3): 80-86.

Vol. 18, No. 5 (Special Issue), 2019 • Nature Environment and Pollution Technology
1682
Performance of New Permeable Concrete Materials based on Mechanical Strength
Wenjuan LiuPuyang Vocational and Technical College, Henan 457000, China
ABSTRACT
The purpose of this study was to improve the application effect of pervious concrete in practical engineering. Firstly, recycled brick aggregate was prepared by crushing of waste clay bricks, and then a new type of pervious concrete was prepared after secondary grouting treatment. The effects of the content of polypropylene steel fibre, target porosity, water cement ratio and particle size of recycled brick aggregate on the new type of pervious concrete were studied. The results showed that the target porosity had the most significant effect on the mechanical strength of the regenerated brick specimens, and the smaller the target porosity was, the higher the compressive strength was, and vice versa. The particle size of recycled brick aggregate had little influence on the mechanical strength value of the specimen. Appropriate amount of polypropylene steel fibre can significantly improve the mechanical strength of the pervious concrete, and the flexural strength was higher than the compressive strength. Therefore, when the target porosity was 24%, the water cement ratio was 0.32, the content of polypropylene steel fibre was 3 kg/m3, and the particle size of recycled brick aggregate was 9.5 mm-13.2 mm, the concrete can achieve a good balance between mechanical properties and water permeability.
INTRODUCTION
At present, the surface of many cities is covered by hardened concrete pavement and buildings with reinforced concrete structures, so it is difficult for precipitation to infiltrate into the soil, resulting in excessive subsidence of groundwater level (Richards et al. 2018). In addition, the hardened pave-ment can’t effectively regulate the urban surface temper-ature and humidity, which also aggravates the urban heat island effect. The hard ground brought by the urbanization process makes the urban roads lose the functions of water seepage, water storage and water discharge, and it is also very difficult for green plants to grow in the environment surrounded by the traditional hardened road surface. In the global context of maintaining ecological balance and living in harmony with the environment, as a new kind of environment-friendly pavement material, pervious concrete has been paid attention to and applied (Sutikulsombat et al. 2018). The porous properties of pervious concrete enable it to store water, reduce temperature and noise, and perform biological degradation (Akhtar & Sarmah 2018). Today, with the increasing awareness of environmental protection, the use of permeable concrete brings people more choices and more comfortable life experience. However, it is also due to the porous characteristics of pervious concrete that its strength
is generally lower than that of traditional concrete, which has brought a certain degree of influence on its promotion and application. In this situation, the research and development of high-performance pervious concrete has become an im-portant research topic for domestic scholars and municipal construction workers.
Sintered clay bricks have all-weather resistance, and the waste bricks still have a certain strength and can be re-cycled and reused. The coarse aggregate which is crushed, decomposed, cleaned and re-classified as concrete is called recycled brick aggregate, and it can be replaced with nat-ural coarse aggregate to prepare a new type of permeable concrete. Domestic research shows that the performance of recycled aggregate of clay brick is close to that of lightweight aggregate, which has a negative impact on the workability of fresh concrete. Aggregate properties and mix proportion parameters have an impact on the strength of concrete. The concrete strength can reach 40 MPa - 50 MPa with proper mix ratio, which has good thermal performance and durability. At the same time, the recycled brick and tile aggregate has the characteristics of large porosity and high-water absorp-tion, which is suitable for being a permeable material. In addition, there are more connected pores in the concrete, so that the prepared porous concrete has the characteristics of high-water permeability and high air permeability.
Nat. Env. & Poll. Tech.Website: www.neptjournal.com
Received: 10-08-2019Accepted: 24-10-2019
Key Words:Pervious concreteFlexural strengthCompressive strengthTarget porosityWater cement ratio
2019pp. 1683-1689 Vol. 18
p-ISSN: 0972-6268 No. 5 (Special Issue)
Nature Environment and Pollution Technology An International Quarterly Scientific Journal
Original Research Paper
e-ISSN: 2395-3454
Open Access
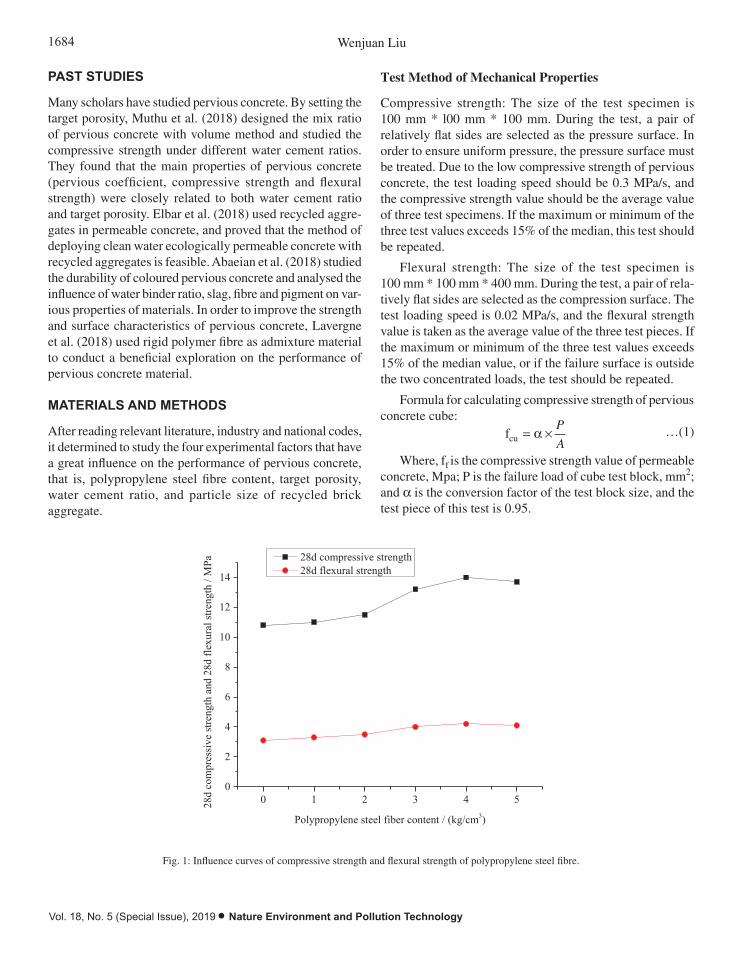
1684 Wenjuan Liu
Vol. 18, No. 5 (Special Issue), 2019 • Nature Environment and Pollution Technology
PAST STUDIES
Many scholars have studied pervious concrete. By setting the target porosity, Muthu et al. (2018) designed the mix ratio of pervious concrete with volume method and studied the compressive strength under different water cement ratios. They found that the main properties of pervious concrete (pervious coefficient, compressive strength and flexural strength) were closely related to both water cement ratio and target porosity. Elbar et al. (2018) used recycled aggre-gates in permeable concrete, and proved that the method of deploying clean water ecologically permeable concrete with recycled aggregates is feasible. Abaeian et al. (2018) studied the durability of coloured pervious concrete and analysed the influence of water binder ratio, slag, fibre and pigment on var-ious properties of materials. In order to improve the strength and surface characteristics of pervious concrete, Lavergne et al. (2018) used rigid polymer fibre as admixture material to conduct a beneficial exploration on the performance of pervious concrete material.
MATERIALS AND METHODS
After reading relevant literature, industry and national codes, it determined to study the four experimental factors that have a great influence on the performance of pervious concrete, that is, polypropylene steel fibre content, target porosity, water cement ratio, and particle size of recycled brick aggregate.
Test Method of Mechanical Properties
Compressive strength: The size of the test specimen is 100 mm * l00 mm * 100 mm. During the test, a pair of relatively flat sides are selected as the pressure surface. In order to ensure uniform pressure, the pressure surface must be treated. Due to the low compressive strength of pervious concrete, the test loading speed should be 0.3 MPa/s, and the compressive strength value should be the average value of three test specimens. If the maximum or minimum of the three test values exceeds 15% of the median, this test should be repeated.
Flexural strength: The size of the test specimen is 100 mm * 100 mm * 400 mm. During the test, a pair of rela-tively flat sides are selected as the compression surface. The test loading speed is 0.02 MPa/s, and the flexural strength value is taken as the average value of the three test pieces. If the maximum or minimum of the three test values exceeds 15% of the median value, or if the failure surface is outside the two concentrated loads, the test should be repeated.
Formula for calculating compressive strength of pervious concrete cube:
fcu = ¥aP
A …(1)
Where, ff is the compressive strength value of permeable concrete, Mpa; P is the failure load of cube test block, mm2; and a is the conversion factor of the test block size, and the test piece of this test is 0.95.
Where, ff is the flexural strength value of permeable concrete, Mpa; P is the failure load of prismatic block, N; L is the support spacing (span), L = 3h, mm; and α is the conversion factor of the test block size, and the test piece of this test is 0.85.
In addition, DY-2008 automatic concrete pressure testing machine and WA-100 universal testing machine are selected for compressive strength testing and flexural strength testing.
Results and discussion
The influence of polypropylene steel fibre content on mechanical properties of recycled brick pervious concrete
The content of polypropylene steel fibre was determined to be 0 -5 kg/m3. The influence of polypropylene steel fibre on compressive strength and flexural strength is shown in Fig. 1.
Fig. 1: Influence curves of compressive strength and flexural strength of polypropylene steel fibre.
0 1 2 3 4 50
2
4
6
8
10
12
14
28d
com
pres
sive
stre
ngth
and
28d
flex
ural
stre
ngth
/ M
Pa
Polypropylene steel fiber content / (kg/cm3)
28d compressive strength 28d flexural strength
The mechanical properties of recycled brick pervious concrete were much lower than that of dense concrete due to the unfavourable strength factors such as high crushed value of recycled brick aggregate and large porosity of pervious concrete. As can be concluded from Fig. 1, the compressive strength and flexural strength of the concrete showed an increasing trend with the increase of polypropylene steel fibre content. When polypropylene steel fibre content was 3 - 4 kg/m3, the addition of an imitation steel fibre was equivalent to connecting a number of rebars between the recycled brick aggregates, it increased the bridging role between aggregate and binder surface and limited the deformation and stress of the concrete specimen. The test results showed that the appropriate amount of polypropylene steel fibre can significantly improve the mechanical strength of recycled brick aggregate pervious concrete specimens.
Influence of target porosity on mechanical properties of recycled brick aggregate pervious concrete
According to CJJ / T235-2016, when the measured effective porosity of pervious concrete was more than 10%, it can meet the requirement of water permeability. The effects of target porosity on compressive strength and flexural strength are shown in Fig. 2 and Fig. 3.
Fig. 2: Influence curve of target porosity on compressive strength.
Fig. 1: Influence curves of compressive strength and flexural strength of polypropylene steel fibre.
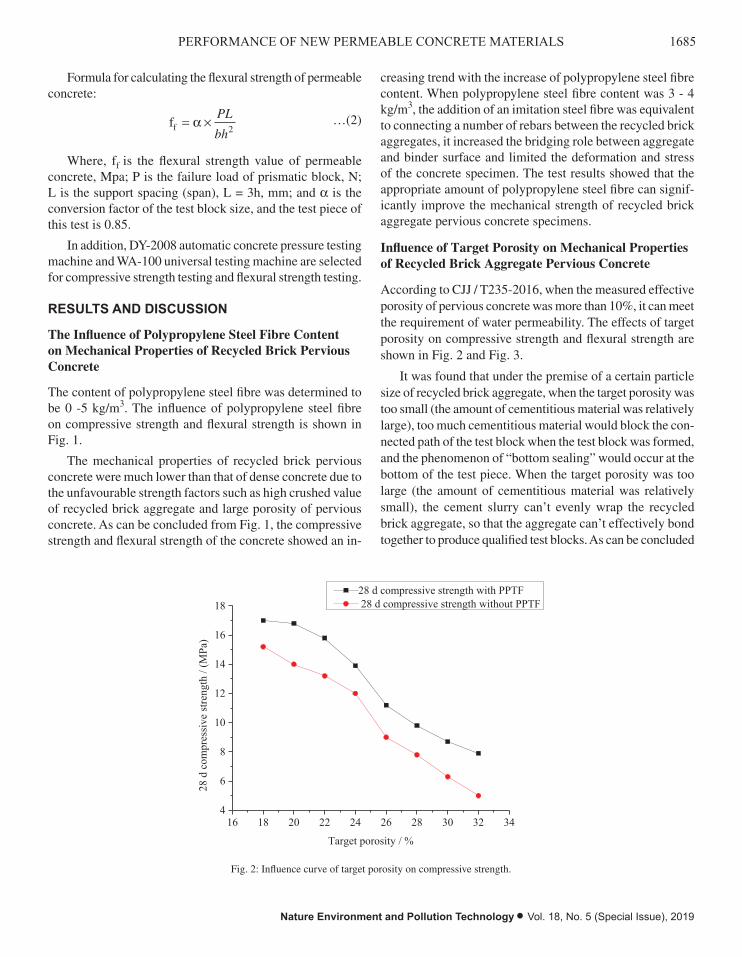
1685PERFORMANCE OF NEW PERMEABLE CONCRETE MATERIALS
Nature Environment and Pollution Technology • Vol. 18, No. 5 (Special Issue), 2019
Formula for calculating the flexural strength of permeable concrete:
ff = ¥aPL
bh2 …(2)
Where, ff is the flexural strength value of permeable concrete, Mpa; P is the failure load of prismatic block, N; L is the support spacing (span), L = 3h, mm; and a is the conversion factor of the test block size, and the test piece of this test is 0.85.
In addition, DY-2008 automatic concrete pressure testing machine and WA-100 universal testing machine are selected for compressive strength testing and flexural strength testing.
RESULTS AND DISCUSSION
The Influence of Polypropylene Steel Fibre Content on Mechanical Properties of Recycled Brick Pervious Concrete
The content of polypropylene steel fibre was determined to be 0 -5 kg/m3. The influence of polypropylene steel fibre on compressive strength and flexural strength is shown in Fig. 1.
The mechanical properties of recycled brick pervious concrete were much lower than that of dense concrete due to the unfavourable strength factors such as high crushed value of recycled brick aggregate and large porosity of pervious concrete. As can be concluded from Fig. 1, the compressive strength and flexural strength of the concrete showed an in-
creasing trend with the increase of polypropylene steel fibre content. When polypropylene steel fibre content was 3 - 4 kg/m3, the addition of an imitation steel fibre was equivalent to connecting a number of rebars between the recycled brick aggregates, it increased the bridging role between aggregate and binder surface and limited the deformation and stress of the concrete specimen. The test results showed that the appropriate amount of polypropylene steel fibre can signif-icantly improve the mechanical strength of recycled brick aggregate pervious concrete specimens.
Influence of Target Porosity on Mechanical Properties of Recycled Brick Aggregate Pervious Concrete
According to CJJ / T235-2016, when the measured effective porosity of pervious concrete was more than 10%, it can meet the requirement of water permeability. The effects of target porosity on compressive strength and flexural strength are shown in Fig. 2 and Fig. 3.
It was found that under the premise of a certain particle size of recycled brick aggregate, when the target porosity was too small (the amount of cementitious material was relatively large), too much cementitious material would block the con-nected path of the test block when the test block was formed, and the phenomenon of “bottom sealing” would occur at the bottom of the test piece. When the target porosity was too large (the amount of cementitious material was relatively small), the cement slurry can’t evenly wrap the recycled brick aggregate, so that the aggregate can’t effectively bond together to produce qualified test blocks. As can be concluded
16 18 20 22 24 26 28 30 32 344
6
8
10
12
14
16
18
28 d
com
pres
sive
stre
ngth
/ (M
Pa)
Target porosity / %
28 d compressive strength with PPTF 28 d compressive strength without PPTF
Fig. 2: Influence curve of target porosity on compressive strength.
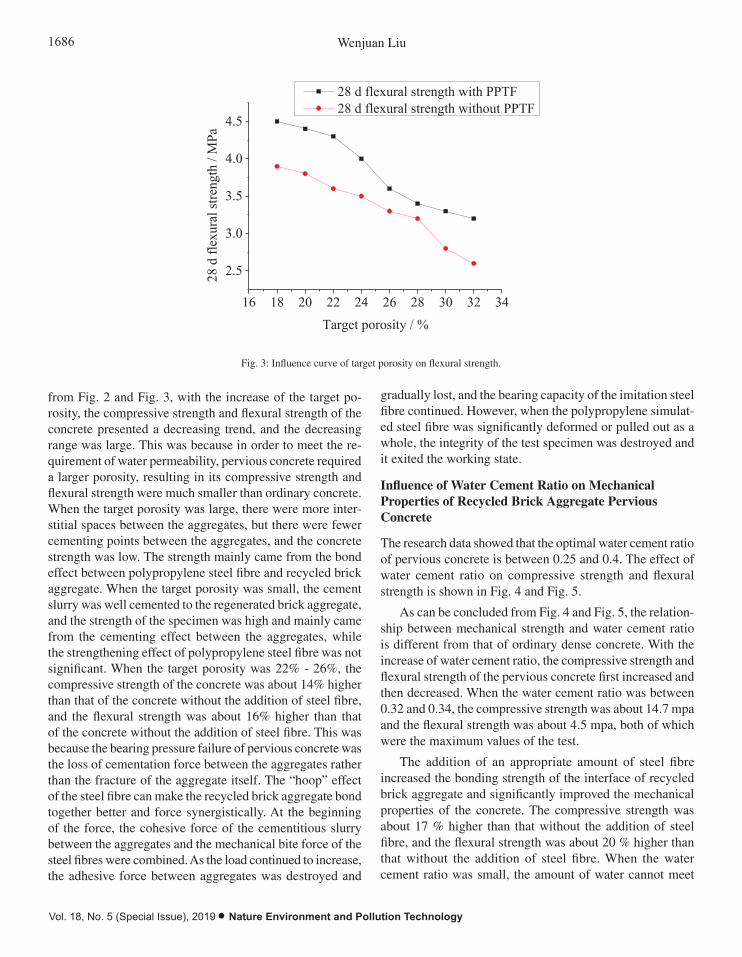
1686 Wenjuan Liu
Vol. 18, No. 5 (Special Issue), 2019 • Nature Environment and Pollution Technology
Fig. 3: Influence curve of target porosity on flexural strength.
16 18 20 22 24 26 28 30 32 34
2.5
3.0
3.5
4.0
4.5
28 d
flex
ural
stre
ngth
/ M
Pa
Target porosity / %
28 d flexural strength with PPTF 28 d flexural strength without PPTF
It was found that under the premise of a certain particle size of recycled brick aggregate, when the target porosity was too small (the amount of cementitious material was relatively large), too much cementitious material would block the connected path of the test block when the test block was formed, and the phenomenon of “bottom sealing” would occur at the bottom of the test piece. When the target porosity was too large (the amount of cementitious material was relatively small), the cement slurry can’t evenly wrap the recycled brick aggregate, so that the aggregate can’t effectively bond together to produce qualified test blocks. As can be concluded from Fig. 2 and Fig. 3, with the increase of the target porosity, the compressive strength and flexural strength of the concrete presented a decreasing trend, and the decreasing range was large. This was because in order to meet the requirement of water permeability, pervious concrete required a larger porosity, resulting in its compressive strength and flexural strength were much smaller than ordinary concrete. When the target porosity was large, there were more interstitial spaces between the aggregates, but there were fewer cementing points between the aggregates, and the concrete strength was low. The strength mainly came from the bond effect between polypropylene steel fibre and recycled brick aggregate. When the target porosity was small, the cement slurry was well cemented to the regenerated brick aggregate, and the strength of the specimen was high and mainly came from the cementing effect between the aggregates, while the strengthening effect of polypropylene steel fibre was not significant. When the target porosity was 22% - 26%, the compressive strength of the concrete was about 14% higher than that of the concrete without the addition of steel fibre, and the flexural strength was about 16% higher than that of the concrete without the addition of steel fibre. This was because the bearing pressure failure of pervious concrete was the loss of cementation force between the aggregates rather than the fracture of the aggregate itself. The “hoop” effect of the steel fibre can make the recycled brick aggregate bond together better and force synergistically. At the beginning of the force, the cohesive force of the cementitious slurry between the aggregates and the mechanical bite force of the steel fibres were combined. As the load continued to increase, the adhesive force between aggregates was destroyed and gradually lost, and the bearing capacity of the imitation steel fibre continued. However, when the polypropylene simulated steel fibre was significantly deformed or pulled out as a whole, the integrity of the test specimen was destroyed and it exited the working state.
Influence of water cement ratio on mechanical properties of recycled brick aggregate pervious concrete
The research data showed that the optimal water cement ratio of pervious concrete is between 0.25 and 0.4. The effect of water cement ratio on compressive strength and flexural strength is shown in Fig. 4 and Fig. 5.
Fig. 3: Influence curve of target porosity on flexural strength.
from Fig. 2 and Fig. 3, with the increase of the target po-rosity, the compressive strength and flexural strength of the concrete presented a decreasing trend, and the decreasing range was large. This was because in order to meet the re-quirement of water permeability, pervious concrete required a larger porosity, resulting in its compressive strength and flexural strength were much smaller than ordinary concrete. When the target porosity was large, there were more inter-stitial spaces between the aggregates, but there were fewer cementing points between the aggregates, and the concrete strength was low. The strength mainly came from the bond effect between polypropylene steel fibre and recycled brick aggregate. When the target porosity was small, the cement slurry was well cemented to the regenerated brick aggregate, and the strength of the specimen was high and mainly came from the cementing effect between the aggregates, while the strengthening effect of polypropylene steel fibre was not significant. When the target porosity was 22% - 26%, the compressive strength of the concrete was about 14% higher than that of the concrete without the addition of steel fibre, and the flexural strength was about 16% higher than that of the concrete without the addition of steel fibre. This was because the bearing pressure failure of pervious concrete was the loss of cementation force between the aggregates rather than the fracture of the aggregate itself. The “hoop” effect of the steel fibre can make the recycled brick aggregate bond together better and force synergistically. At the beginning of the force, the cohesive force of the cementitious slurry between the aggregates and the mechanical bite force of the steel fibres were combined. As the load continued to increase, the adhesive force between aggregates was destroyed and
gradually lost, and the bearing capacity of the imitation steel fibre continued. However, when the polypropylene simulat-ed steel fibre was significantly deformed or pulled out as a whole, the integrity of the test specimen was destroyed and it exited the working state.
Influence of Water Cement Ratio on Mechanical Properties of Recycled Brick Aggregate Pervious Concrete
The research data showed that the optimal water cement ratio of pervious concrete is between 0.25 and 0.4. The effect of water cement ratio on compressive strength and flexural strength is shown in Fig. 4 and Fig. 5.
As can be concluded from Fig. 4 and Fig. 5, the relation-ship between mechanical strength and water cement ratio is different from that of ordinary dense concrete. With the increase of water cement ratio, the compressive strength and flexural strength of the pervious concrete first increased and then decreased. When the water cement ratio was between 0.32 and 0.34, the compressive strength was about 14.7 mpa and the flexural strength was about 4.5 mpa, both of which were the maximum values of the test.
The addition of an appropriate amount of steel fibre increased the bonding strength of the interface of recycled brick aggregate and significantly improved the mechanical properties of the concrete. The compressive strength was about 17 % higher than that without the addition of steel fibre, and the flexural strength was about 20 % higher than that without the addition of steel fibre. When the water cement ratio was small, the amount of water cannot meet
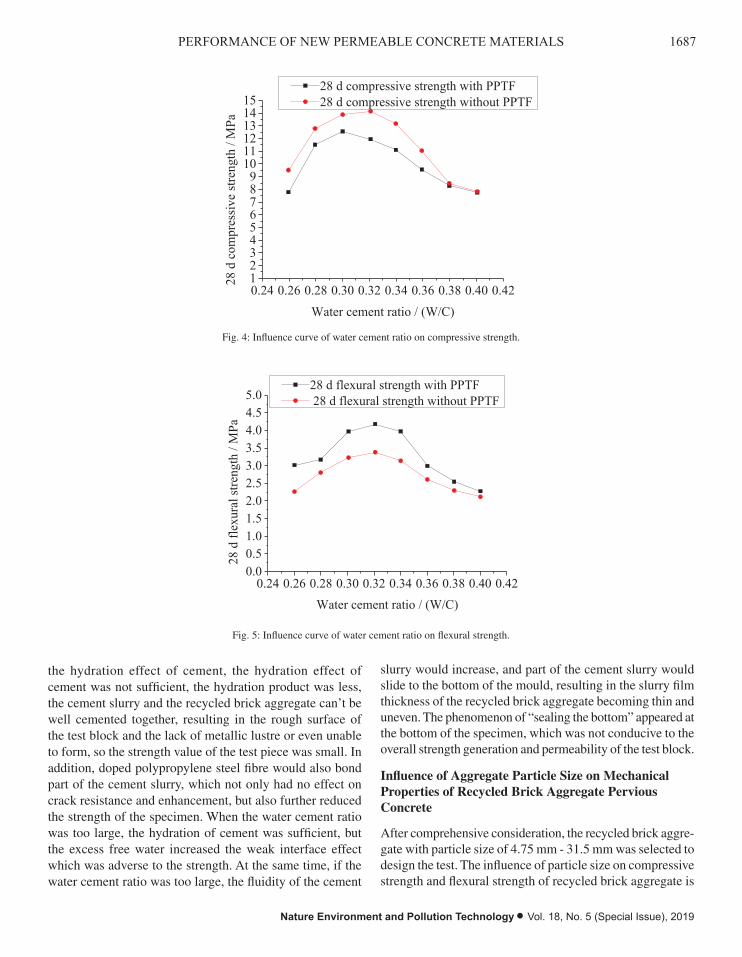
1687PERFORMANCE OF NEW PERMEABLE CONCRETE MATERIALS
Nature Environment and Pollution Technology • Vol. 18, No. 5 (Special Issue), 2019
Fig. 4: Influence curve of water cement ratio on compressive strength.
0.24 0.26 0.28 0.30 0.32 0.34 0.36 0.38 0.40 0.42123456789
101112131415
28 d
com
pres
sive
stre
ngth
/ M
Pa
Water cement ratio / (W/C)
28 d compressive strength with PPTF28 d compressive strength without PPTF
Fig. 5: Influence curve of water cement ratio on flexural strength.
0.24 0.26 0.28 0.30 0.32 0.34 0.36 0.38 0.40 0.420.00.51.01.52.02.53.03.54.04.55.0
28 d
flex
ural
stre
ngth
/ M
Pa
Water cement ratio / (W/C)
28 d flexural strength with PPTF 28 d flexural strength without PPTF
As can be concluded from Fig. 4 and Fig. 5, the relationship between mechanical strength and water cement ratio is different from that of ordinary dense concrete. With the increase of water cement ratio, the compressive strength and flexural strength of the pervious concrete first increased and then decreased. When the water cement ratio was between 0.32 and 0.34, the compressive strength was about 14.7mpa and the flexural strength was about 4.5mpa, both of which were the maximum values of the test.
The addition of an appropriate amount of steel fibre increased the bonding strength of the interface of recycled brick aggregate and significantly improved the mechanical properties of the concrete. The compressive strength was about 17 % higher than that without the addition of steel fibre, and the flexural strength was about 20 % higher than that without the addition of steel fibre. When the water cement ratio was small, the amount of water can’t meet the hydration effect of cement, the hydration effect of cement was not sufficient, the hydration product was less, the cement slurry and the recycled brick aggregate can’t be well cemented together, resulting in the rough surface of the test block and the lack of metallic lustre or even unable to form, so the strength value of the test piece was small. In addition, doped polypropylene steel fibre would also bond part of the cement slurry, which not only had no effect on crack resistance and enhancement, but also further reduced the strength of the specimen. When the water cement ratio was too large, the hydration of cement was sufficient, but the excess free water increased the weak interface effect which was adverse to the strength. At the same time, if the water cement ratio was too large, the fluidity of the cement slurry would increase, and part of the cement slurry would slide to the bottom of the mould, resulting in the slurry film thickness of the recycled brick aggregate becoming thin and uneven. The phenomenon of “sealing the bottom” appeared at the bottom of the specimen, which was not conducive to the overall strength generation and permeability of the test block.
Fig. 4: Influence curve of water cement ratio on compressive strength.
Fig. 4: Influence curve of water cement ratio on compressive strength.
0.24 0.26 0.28 0.30 0.32 0.34 0.36 0.38 0.40 0.42123456789
101112131415
28 d
com
pres
sive
stre
ngth
/ M
Pa
Water cement ratio / (W/C)
28 d compressive strength with PPTF28 d compressive strength without PPTF
Fig. 5: Influence curve of water cement ratio on flexural strength.
0.24 0.26 0.28 0.30 0.32 0.34 0.36 0.38 0.40 0.420.00.51.01.52.02.53.03.54.04.55.0
28 d
flex
ural
stre
ngth
/ M
Pa
Water cement ratio / (W/C)
28 d flexural strength with PPTF 28 d flexural strength without PPTF
As can be concluded from Fig. 4 and Fig. 5, the relationship between mechanical strength and water cement ratio is different from that of ordinary dense concrete. With the increase of water cement ratio, the compressive strength and flexural strength of the pervious concrete first increased and then decreased. When the water cement ratio was between 0.32 and 0.34, the compressive strength was about 14.7mpa and the flexural strength was about 4.5mpa, both of which were the maximum values of the test.
The addition of an appropriate amount of steel fibre increased the bonding strength of the interface of recycled brick aggregate and significantly improved the mechanical properties of the concrete. The compressive strength was about 17 % higher than that without the addition of steel fibre, and the flexural strength was about 20 % higher than that without the addition of steel fibre. When the water cement ratio was small, the amount of water can’t meet the hydration effect of cement, the hydration effect of cement was not sufficient, the hydration product was less, the cement slurry and the recycled brick aggregate can’t be well cemented together, resulting in the rough surface of the test block and the lack of metallic lustre or even unable to form, so the strength value of the test piece was small. In addition, doped polypropylene steel fibre would also bond part of the cement slurry, which not only had no effect on crack resistance and enhancement, but also further reduced the strength of the specimen. When the water cement ratio was too large, the hydration of cement was sufficient, but the excess free water increased the weak interface effect which was adverse to the strength. At the same time, if the water cement ratio was too large, the fluidity of the cement slurry would increase, and part of the cement slurry would slide to the bottom of the mould, resulting in the slurry film thickness of the recycled brick aggregate becoming thin and uneven. The phenomenon of “sealing the bottom” appeared at the bottom of the specimen, which was not conducive to the overall strength generation and permeability of the test block.
Fig. 5: Influence curve of water cement ratio on flexural strength.
the hydration effect of cement, the hydration effect of cement was not sufficient, the hydration product was less, the cement slurry and the recycled brick aggregate can’t be well cemented together, resulting in the rough surface of the test block and the lack of metallic lustre or even unable to form, so the strength value of the test piece was small. In addition, doped polypropylene steel fibre would also bond part of the cement slurry, which not only had no effect on crack resistance and enhancement, but also further reduced the strength of the specimen. When the water cement ratio was too large, the hydration of cement was sufficient, but the excess free water increased the weak interface effect which was adverse to the strength. At the same time, if the water cement ratio was too large, the fluidity of the cement
slurry would increase, and part of the cement slurry would slide to the bottom of the mould, resulting in the slurry film thickness of the recycled brick aggregate becoming thin and uneven. The phenomenon of “sealing the bottom” appeared at the bottom of the specimen, which was not conducive to the overall strength generation and permeability of the test block.
Influence of Aggregate Particle Size on Mechanical Properties of Recycled Brick Aggregate Pervious Concrete
After comprehensive consideration, the recycled brick aggre-gate with particle size of 4.75 mm - 31.5 mm was selected to design the test. The influence of particle size on compressive strength and flexural strength of recycled brick aggregate is
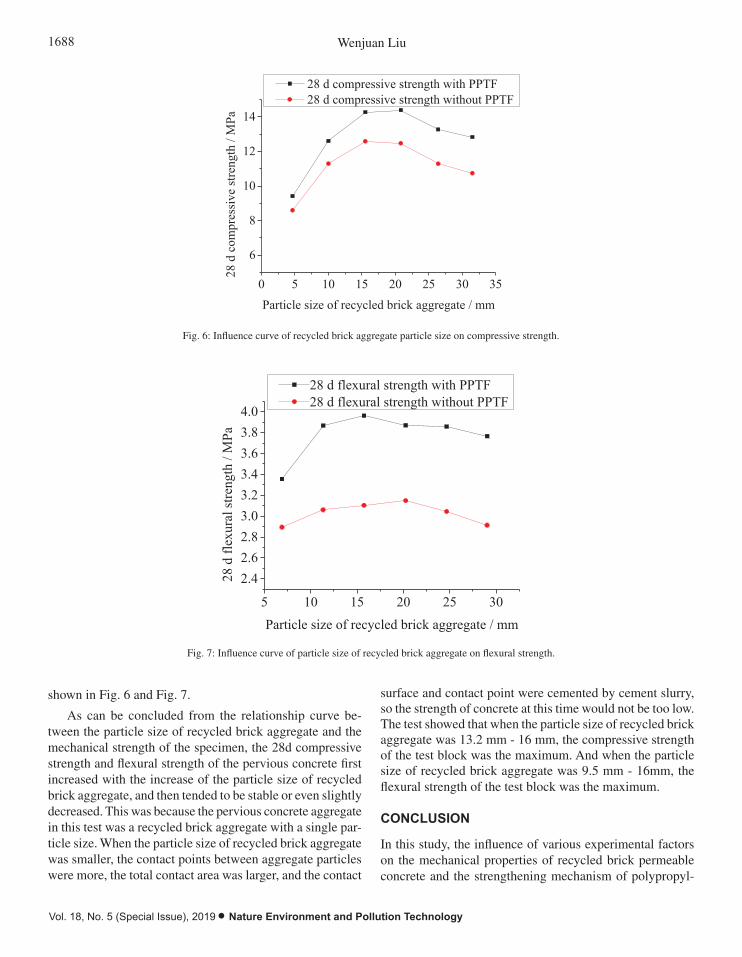
1688 Wenjuan Liu
Vol. 18, No. 5 (Special Issue), 2019 • Nature Environment and Pollution Technology
Influence of aggregate particle size on mechanical properties of recycled brick aggregate pervious concrete
After comprehensive consideration, the recycled brick aggregate with particle size of 4.75 mm - 31.5 mm was selected to design the test. The influence of particle size on compressive strength and flexural strength of recycled brick aggregate is shown in Fig. 6 and Fig. 7.
Fig. 6: Influence curve of recycled brick aggregate particle size on compressive strength.
0 5 10 15 20 25 30 35
6
8
10
12
14
28 d
com
pres
sive
stre
ngth
/ M
Pa
Particle size of recycled brick aggregate / mm
28 d compressive strength with PPTF 28 d compressive strength without PPTF
Fig. 7: Influence curve of particle size of recycled brick aggregate on flexural strength.
5 10 15 20 25 30
2.42.62.83.03.23.43.63.84.0
28 d
flex
ural
stre
ngth
/ M
Pa
Particle size of recycled brick aggregate / mm
28 d flexural strength with PPTF28 d flexural strength without PPTF
As can be concluded from the relationship curve between the particle size of recycled brick aggregate and the mechanical strength of the specimen, the 28d compressive strength and flexural strength of the pervious concrete first increased with the increase of the particle size of recycled brick aggregate, and then tended to be stable or even slightly decreased. This was because the pervious concrete aggregate in this test was a recycled brick aggregate with a single particle size. When the particle size of recycled brick aggregate was smaller, the contact points between aggregate particles were more, the total contact area was larger, and the contact surface and contact point were cemented by cement slurry, so the strength of concrete at this time would not be too low. The test showed that when the particle size of recycled brick aggregate was 13.2 mm - 16mm, the compressive strength of the test block was the maximum. And when the particle size of recycled brick aggregate was 9.5 mm - 16mm, the flexural strength of the test block was the maximum.
Conclusion
In this study, the influence of various experimental factors on the mechanical properties of recycled brick permeable concrete and the strengthening mechanism of polypropylene steel fibre were introduced, which provided a certain theoretical basis for the selection of target porosity and water cement ratio of recycled brick
Fig. 6: Influence curve of recycled brick aggregate particle size on compressive strength.
Influence of aggregate particle size on mechanical properties of recycled brick aggregate pervious concrete
After comprehensive consideration, the recycled brick aggregate with particle size of 4.75 mm - 31.5 mm was selected to design the test. The influence of particle size on compressive strength and flexural strength of recycled brick aggregate is shown in Fig. 6 and Fig. 7.
Fig. 6: Influence curve of recycled brick aggregate particle size on compressive strength.
0 5 10 15 20 25 30 35
6
8
10
12
14
28 d
com
pres
sive
stre
ngth
/ M
Pa
Particle size of recycled brick aggregate / mm
28 d compressive strength with PPTF 28 d compressive strength without PPTF
Fig. 7: Influence curve of particle size of recycled brick aggregate on flexural strength.
5 10 15 20 25 30
2.42.62.83.03.23.43.63.84.0
28 d
flex
ural
stre
ngth
/ M
Pa
Particle size of recycled brick aggregate / mm
28 d flexural strength with PPTF28 d flexural strength without PPTF
As can be concluded from the relationship curve between the particle size of recycled brick aggregate and the mechanical strength of the specimen, the 28d compressive strength and flexural strength of the pervious concrete first increased with the increase of the particle size of recycled brick aggregate, and then tended to be stable or even slightly decreased. This was because the pervious concrete aggregate in this test was a recycled brick aggregate with a single particle size. When the particle size of recycled brick aggregate was smaller, the contact points between aggregate particles were more, the total contact area was larger, and the contact surface and contact point were cemented by cement slurry, so the strength of concrete at this time would not be too low. The test showed that when the particle size of recycled brick aggregate was 13.2 mm - 16mm, the compressive strength of the test block was the maximum. And when the particle size of recycled brick aggregate was 9.5 mm - 16mm, the flexural strength of the test block was the maximum.
Conclusion
In this study, the influence of various experimental factors on the mechanical properties of recycled brick permeable concrete and the strengthening mechanism of polypropylene steel fibre were introduced, which provided a certain theoretical basis for the selection of target porosity and water cement ratio of recycled brick
Fig. 7: Influence curve of particle size of recycled brick aggregate on flexural strength.
shown in Fig. 6 and Fig. 7.
As can be concluded from the relationship curve be-tween the particle size of recycled brick aggregate and the mechanical strength of the specimen, the 28d compressive strength and flexural strength of the pervious concrete first increased with the increase of the particle size of recycled brick aggregate, and then tended to be stable or even slightly decreased. This was because the pervious concrete aggregate in this test was a recycled brick aggregate with a single par-ticle size. When the particle size of recycled brick aggregate was smaller, the contact points between aggregate particles were more, the total contact area was larger, and the contact
surface and contact point were cemented by cement slurry, so the strength of concrete at this time would not be too low. The test showed that when the particle size of recycled brick aggregate was 13.2 mm - 16 mm, the compressive strength of the test block was the maximum. And when the particle size of recycled brick aggregate was 9.5 mm - 16mm, the flexural strength of the test block was the maximum.
CONCLUSION
In this study, the influence of various experimental factors on the mechanical properties of recycled brick permeable concrete and the strengthening mechanism of polypropyl-

1689PERFORMANCE OF NEW PERMEABLE CONCRETE MATERIALS
Nature Environment and Pollution Technology • Vol. 18, No. 5 (Special Issue), 2019
ene steel fibre were introduced, which provided a certain theoretical basis for the selection of target porosity and water cement ratio of recycled brick aggregate permeable concrete. The results showed that the compressive strength and flexural strength of recycled brick aggregate pervious concrete were lower than that of ordinary aggregate pervious concrete, especially the compressive strength was about half of that of crushed stone aggregate pervious concrete (about 14.7 MPa), which was determined by the physical and mechanical properties of recycled brick aggregate. Target porosity had the most significant effect on the mechanical strength of the regenerated brick specimens, and the smaller the target porosity was, the higher the compressive strength was, and vice versa. The particle size of recycled brick ag-gregate had little influence on the mechanical strength value of the specimen. Appropriate amount of polypropylene steel fibre can significantly improve the mechanical strength of the pervious concrete, and the flexural strength was higher than the compressive strength. Therefore, the new type of pervious concrete made of recycled brick aggregate mixed with polypropylene steel fibre can make solid construction waste be recycled, save natural resources and reduce the pollution of construction waste to the urban environment. In addition, it helps to improve the urban and rural ecological environment and rainwater utilization, reduce the environ-
mental burden, conducive to water and soil conservation, and build a comfortable living environment for human beings.
REFERENCES
Abaeian, R., Behbahani, H. P. and Moslem, S.J. 2018. Effects of high tem-peratures on mechanical behaviour of high strength concrete reinforced with high performance synthetic macro polypropylene (hpp) fibres. Construction and Building Materials, 165: 631-638.
Akhtar, A. and Sarmah, A.K. 2018. Strength improvement of recycled ag-gregate concrete through silicon rich char derived from organic waste. Journal of Cleaner Production, 196: 411-423.
Elbar, M., Senhadji, Y., Benosman, A.S., Khelafi, H. and Mouli, M. 2018. Effect of thermo-activation on mechanical strengths and chlorides permeability in pozzolanic materials. Case Studies in Construction Materials, 8: 459-468.
Lavergne, F., Fraj, A.B., Bayane, I. and Barthélémy, J.F. 2018. Estimating the mechanical properties of hydrating blended cementitious materi-als: an investigation based on micromechanics. Cement and Concrete Research, 104: 37-60.
Muthu, M., Santhanam, M. and Kumar, M. 2018. Pb removal in pervious concrete filter: effects of accelerated carbonation and hydraulic retention time. Construction and Building Materials, 174: 224-232.
Richards, O., Rickard, I., Orr, J. and Bisby, L. 2018. Response of concrete cast in permeable moulds to severe heating. Construction and Building Materials, 160: 526-538.
Sutikulsombat, S., Srichumpong, T., Boonanunwong, P., Tippayasam, C., Leonelli, Cristina, and Chindaprasirt, Prinya 2018. Development of Thai lignite fly ash and metakaolin for pervious geopolymer concrete. Key Engineering Materials, 766: 294-299.

Vol. 18, No. 5 (Special Issue), 2019 • Nature Environment and Pollution Technology
1690

Carbon Regulation and Trading Supply Chain Factory Production and Emission Reduction Decision System
Gan Wan*and Jun Zhang***University of Electronic Science and Technology of China, School of Management and Economics, Chengdu, Sichuan, 611731, China**Kunming Metallurgy College, Logistics Engineering and Management Faculty, Kunming, Yunnan, 650033, China
ABSTRACT
In order to optimize the carbon tax constraints and consumer business strategy under the influence of the environmental protection consciousness, this article looks into the time factor, by means of differential game, based on supply chain upstream enterprise R & D subsidy object under long-term carbon tax policy. When there is a R & D subsidy with no cooperation between the manufacturers in emission reduction technology research and development, semi-cooperation and complete cooperation R & D, the three cases of decision making with respect to carbon tax, environmental effects, research and development effects and economic effects; R & D subsidy levels are discussed to provide advice to the manufacturers to choose a development strategy.
INTRODUCTION
Global warming is an important problem faced by all mankind today. The increasing greenhouse gases and their impacts on climate change have drawn the attention of world leaders and scientists. Issued by the state council in 2011 (The 12th five-year plan for controlling greenhouse gas emissions), it calls for a substantial reduction in carbon dioxide emissions per unit of gross domestic product by 17 percent from 2010 levels by 2015. The indicators of carbon tax collection, emission reduction and emission trading are finally decomposed and implemented to enterprises, so as to change the cost function of enterprises, change the decision-making behaviour of upstream and downstream enterprises and have an impact on the performance of supply chain (Balachandran & Nguyen 2017). At the same time, con-sumers’ awareness of environmental protection is becoming stronger and stronger, and their consumption behaviour also changes due to their environmental orientation. In order to reduce the carbon label of products, enterprises should not only consider their own operation and emission decisions, but also consider the optimal allocation of resources and carbon emissions in each link from the whole supply chain (Yi et al. 2016). In this way, the behaviour decisions of the upstream and downstream parties of the supply chain should not only consider the constraints of national carbon emission
policies and regulations, but also consider the pressure from market demand and competition, which will complicate the economic decisions of enterprises in emission level, pricing and even coordination (Yamazaki 2017).
To solve above problems, this article looks into the time factor, by means of differential game, based on supply chain upstream enterprise r & d subsidy object under long-term carbon tax policy. When there is a r & d subsidy with no cooperation between the manufacturers in emission reduction technology research and development, semi-cooperation and complete cooperation r & d; the three cases of decision making with respect to carbon tax, environmental effects, research and development effects and economic effects, r & d subsidy levels are discussed to provide advice to the manufacturers to choose a development strategy.
PAST STUDIES
A study analysed the low-carbon technology selection strat-egies of upstream and downstream enterprises in the supply chain under the carbon tax policy, and found that the optimal strategy of upstream enterprises is comprehensive research and development cooperation, while the optimal strategy of downstream enterprises is vertical cooperation or hori-zontal cooperation (Yang & Yu 2016). A research analysed
Nat. Env. & Poll. Tech.Website: www.neptjournal.com
Received: 05-08-2019Accepted: 16-10-2019
Key Words:Carbon regulationSupply chainCarbon tax policyEmission reduction strategyDecision-making optimization
2019pp. 1691-1699 Vol. 18
p-ISSN: 0972-6268 No. 5 (Special Issue)
Nature Environment and Pollution Technology An International Quarterly Scientific Journal
Original Research Paper
e-ISSN: 2395-3454
Open Access
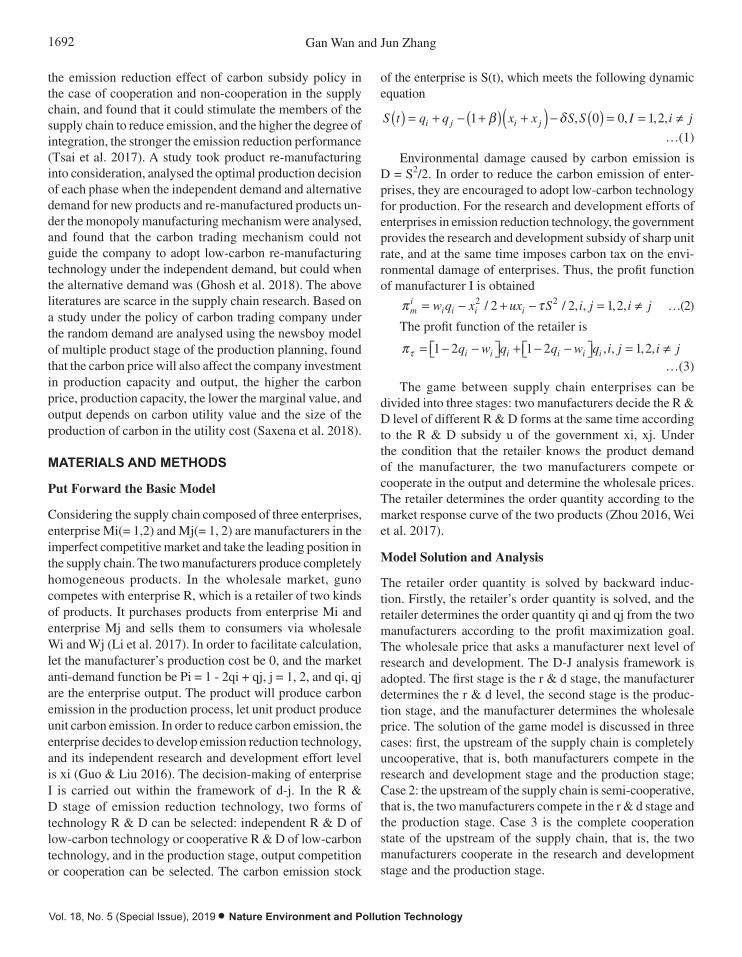
1692 Gan Wan and Jun Zhang
Vol. 18, No. 5 (Special Issue), 2019 • Nature Environment and Pollution Technology
the emission reduction effect of carbon subsidy policy in the case of cooperation and non-cooperation in the supply chain, and found that it could stimulate the members of the supply chain to reduce emission, and the higher the degree of integration, the stronger the emission reduction performance (Tsai et al. 2017). A study took product re-manufacturing into consideration, analysed the optimal production decision of each phase when the independent demand and alternative demand for new products and re-manufactured products un-der the monopoly manufacturing mechanism were analysed, and found that the carbon trading mechanism could not guide the company to adopt low-carbon re-manufacturing technology under the independent demand, but could when the alternative demand was (Ghosh et al. 2018). The above literatures are scarce in the supply chain research. Based on a study under the policy of carbon trading company under the random demand are analysed using the newsboy model of multiple product stage of the production planning, found that the carbon price will also affect the company investment in production capacity and output, the higher the carbon price, production capacity, the lower the marginal value, and output depends on carbon utility value and the size of the production of carbon in the utility cost (Saxena et al. 2018).
MATERIALS AND METHODS
Put Forward the Basic Model
Considering the supply chain composed of three enterprises, enterprise Mi(= 1,2) and Mj(= 1, 2) are manufacturers in the imperfect competitive market and take the leading position in the supply chain. The two manufacturers produce completely homogeneous products. In the wholesale market, guno competes with enterprise R, which is a retailer of two kinds of products. It purchases products from enterprise Mi and enterprise Mj and sells them to consumers via wholesale Wi and Wj (Li et al. 2017). In order to facilitate calculation, let the manufacturer’s production cost be 0, and the market anti-demand function be Pi = 1 - 2qi + qj, j = 1, 2, and qi, qj are the enterprise output. The product will produce carbon emission in the production process, let unit product produce unit carbon emission. In order to reduce carbon emission, the enterprise decides to develop emission reduction technology, and its independent research and development effort level is xi (Guo & Liu 2016). The decision-making of enterprise I is carried out within the framework of d-j. In the R & D stage of emission reduction technology, two forms of technology R & D can be selected: independent R & D of low-carbon technology or cooperative R & D of low-carbon technology, and in the production stage, output competition or cooperation can be selected. The carbon emission stock
of the enterprise is S(t), which meets the following dynamic equation
S t q q x x S S I i ji j i j( ) = + - +( ) +( ) - ( ) = = π1 0 0 1 2b d , , , ,
…(1)
Environmental damage caused by carbon emission is D = S2/2. In order to reduce the carbon emission of enter-prises, they are encouraged to adopt low-carbon technology for production. For the research and development efforts of enterprises in emission reduction technology, the government provides the research and development subsidy of sharp unit rate, and at the same time imposes carbon tax on the envi-ronmental damage of enterprises. Thus, the profit function of manufacturer I is obtained
p tmi
i i i iw q x ux S i j i j= - + - = π2 22 2 1 2/ / , , , , …(2)
The profit function of the retailer is
pt = - -ÈÎ ˘̊ + - -ÈÎ ˘̊ = π1 2 1 2 1 2q w q q w q i j i ji i i i i i , , , ,…(3)
The game between supply chain enterprises can be divided into three stages: two manufacturers decide the R & D level of different R & D forms at the same time according to the R & D subsidy u of the government xi, xj. Under the condition that the retailer knows the product demand of the manufacturer, the two manufacturers compete or cooperate in the output and determine the wholesale prices. The retailer determines the order quantity according to the market response curve of the two products (Zhou 2016, Wei et al. 2017).
Model Solution and Analysis
The retailer order quantity is solved by backward induc-tion. Firstly, the retailer’s order quantity is solved, and the retailer determines the order quantity qi and qj from the two manufacturers according to the profit maximization goal. The wholesale price that asks a manufacturer next level of research and development. The D-J analysis framework is adopted. The first stage is the r & d stage, the manufacturer determines the r & d level, the second stage is the produc-tion stage, and the manufacturer determines the wholesale price. The solution of the game model is discussed in three cases: first, the upstream of the supply chain is completely uncooperative, that is, both manufacturers compete in the research and development stage and the production stage; Case 2: the upstream of the supply chain is semi-cooperative, that is, the two manufacturers compete in the r & d stage and the production stage. Case 3 is the complete cooperation state of the upstream of the supply chain, that is, the two manufacturers cooperate in the research and development stage and the production stage.

1693CARBON REGULATION AND TRADING SUPPLY CHAIN
Nature Environment and Pollution Technology • Vol. 18, No. 5 (Special Issue), 2019
According to qi and qj, equation (2) can be rearranged
p tmi i i j i
i i
w w w wx ux S i j i j= -
+- + - = π
2
2
62 2 1 2
22 2/ / , , , ,
…(4)
A manufacturer i, the value function of profit maximi-zation is Vi(S), the feedback strategy implemented by the government in the above three corresponding situations must satisfy the respective HJB(Hamilton-Jacobi-Bellman) equation.
The two manufacturers do not cooperate at all. The equation of HJB is
rV Sw w w w
x ux Sii i i i
i i( ) = ÏÌÓ
-+
- + -2
2
62 2
22 2/ /t
+ ¢( ) -+
- +( ) +( ) -È
ÎÍ
˘
˚˙ = πV S
w wx x S i j i ji
i ji j1
21 1 2b d , , , ,
…(5)
The two manufacturers are semi-cooperative, and the wholesale price is determined first, and then the research and development level is determined. At this stage, the joint
profit of the two companies is p̂ p p= +m m1 2 .
ˆ [ ],
, , ,
p t= -+
- + -
= π=Âi
i i i ii i
w w w wx ux S
i j i j1
2 22 2
2
2
62 2
1 2
/ / …(6)
HJB equation is
rV S V Sw w
iwi wj
ii j( ) = { } + ¢( ) -
+max [
,p� 1
2
- +( ) +( ) - = π1 1 2b dx x S i j i ji j ], , , , …(7)
It’s given by first order conditions wV S w
ii j=
- ¢( )ÈÎ ˘̊ -3 1 2
4
by symmetry wV S w
ji i=
- ¢( )ÈÎ ˘̊ -3 1 2
4
Equation (5) can be rewritten as
rV S max w q x ux S
V SV
ixi
ii i i i
i
( ) =ÏÌÔ
ÓÔ- + -
˘
˚˙˙
+ ¢( )+ ¢
=Â
1
22 22 2
2
[ / /t
ii ji j
S V Sx x S
i j i j
( ) + ¢( )- +( ) +( ) -
È
ÎÍ
= π4
1
1 2
b d ],
, , ,
…(8)
The two manufacturers fully cooperate with each other in these two stages for the joint profit of the two companies.
ˆ [ ], ,p t= - + - ==Â w q x ux S ii i i ii
2 21
22 2 1 2/ / …(9)
HJB equation is
rV S V Sw w
iwi wj
ii j( ) = { } + ( ) -
+max [
,
’p 12
- +( ) +( ) - = π1 1 2b dx x S i j i ji j ], , , , …(10)
Research and development level, after finishing
rV S A A S
AB Bu
i ( ) = ÏÌÓ
+ +( ˘̊ - - }
++ +Ï
ÌÔ
ÓÔ- +
-
[ )
( )
1
41
1 4 1
2
1 4
2 2 2
2
b d t
bd
11
2
1
41
1
22 1
1
4
2 2
2
+( ) }
+ + +( ˘̊ + - +( )ÈÎÍ
˘˚̇
+ +
b
b b
A S
B u B
u
[ )
…(11)
ANALYSIS OF EFFECT RESULTS
Economic Effects of Carbon Emission Reduction Technology Research and Development
The manufacturer’s profit under the two kinds of technology is compared by numerical simulation. Take r = 0.05, b = 0, d = 0.002, u = 0.007, t = 0.005. Fig. 1 is obtained by using MATLAB2014a simulation. Fig. 1 shows that under the R & D cooperation of manufacturers on low-carbon emission reduction technology, their respective profits are higher than that under the R & D competition, and manufacturers are motivated to conduct R & D cooperation on emission reduction technology.
Take r = 0.05, b = 0, d = 0.002, u = 0.007, t = 0.005, b = {0,0.5,1}. It is found that manufacturers’ profits increase with the increase of r &d spillover rate, as shown in Fig. 2 and Fig. 3.
R & D Level Effect of Carbon Tax Policy
The R & D level effect of manufacturer R & D competition is simulated and the carbon tax rate is calculated t = 0, t = 0.0025, t = 0.005, u = 0.007. When calculating the corresponding R & D level, it is found that the R & D level of emission reduction technology of manufacturers increases with the increase of carbon tax rate, when the government
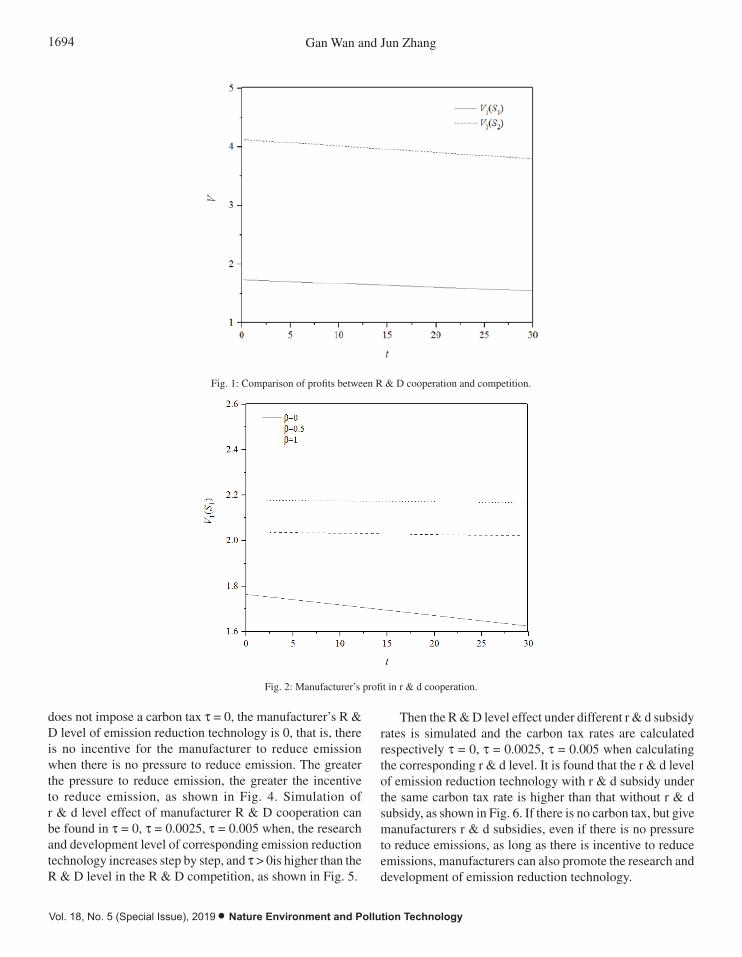
1694 Gan Wan and Jun Zhang
Vol. 18, No. 5 (Special Issue), 2019 • Nature Environment and Pollution Technology
𝑟𝑟𝑉𝑉𝑖𝑖(𝑆𝑆) = 𝑚𝑚𝑚𝑚𝑚𝑚𝑤𝑤𝑖𝑖,𝑤𝑤𝑤𝑤
{�̂�𝜋} + 𝑉𝑉𝑖𝑖′(𝑆𝑆)[1 −𝑤𝑤𝑖𝑖 + 𝑤𝑤𝑤𝑤
2−(1 + 𝛽𝛽)(𝑚𝑚𝑖𝑖 + 𝑚𝑚𝑤𝑤) − 𝛿𝛿𝑆𝑆], 𝑖𝑖, 𝑗𝑗 = 1,2, 𝑖𝑖 ≠ 𝑗𝑗 …(10)
Research and development level, after finishing
𝑟𝑟𝑉𝑉𝑖𝑖(𝑆𝑆) = {[14 + (1 + 𝛽𝛽)2]𝐴𝐴2 − 𝛿𝛿𝐴𝐴 − 𝜏𝜏}𝑆𝑆2 + {1 + 4(1 + 𝛽𝛽)22 𝐴𝐴𝐴𝐴 − 𝛿𝛿𝐴𝐴
+ 1−4𝑢𝑢(1+𝛽𝛽)2 𝐴𝐴}𝑆𝑆 + [14 + (1 + 𝛽𝛽)2]𝐴𝐴2 + [12 − 2𝑢𝑢(1 + 𝛽𝛽)]𝐴𝐴 + 1
4 + 𝑢𝑢2 …(11)
Analysis of effect results
Economic effects of carbon emission reduction technology research and development
The manufacturer's profit under the two kinds of technology is compared by numerical simulation.
Take r=0.05, β=0, δ=0.002, u=0.007, τ=0.005. Fig. 1 is obtained by using MATLAB2014a simulation.
Fig. 1 shows that under the R & D cooperation of manufacturers on low-carbon emission reduction
technology, their respective profits are higher than that under the R & D competition, and manufacturers
are motivated to conduct R & D cooperation on emission reduction technology.
Fig. 1: Comparison of profits between R & D cooperation and competition.
Take r=0.05, β=0, δ=0.002, u=0.007, τ=0.005, β={0,0.5,1}. It is found that manufacturers' profits
increase with the increase of r &d spillover rate, as shown in Fig. 2 and Fig. 3.
Fig. 2: Manufacturer's profit in r & d cooperation.
Fig. 1: Comparison of profits between R & D cooperation and competition.
Fig. 2: Manufacturer’s profit in r & d cooperation.
does not impose a carbon tax t = 0, the manufacturer’s R & D level of emission reduction technology is 0, that is, there is no incentive for the manufacturer to reduce emission when there is no pressure to reduce emission. The greater the pressure to reduce emission, the greater the incentive to reduce emission, as shown in Fig. 4. Simulation of r & d level effect of manufacturer R & D cooperation can be found in t = 0, t = 0.0025, t = 0.005 when, the research and development level of corresponding emission reduction technology increases step by step, and t > 0is higher than the R & D level in the R & D competition, as shown in Fig. 5.
Then the R & D level effect under different r & d subsidy rates is simulated and the carbon tax rates are calculated respectively t = 0, t = 0.0025, t = 0.005 when calculating the corresponding r & d level. It is found that the r & d level of emission reduction technology with r & d subsidy under the same carbon tax rate is higher than that without r & d subsidy, as shown in Fig. 6. If there is no carbon tax, but give manufacturers r & d subsidies, even if there is no pressure to reduce emissions, as long as there is incentive to reduce emissions, manufacturers can also promote the research and development of emission reduction technology.
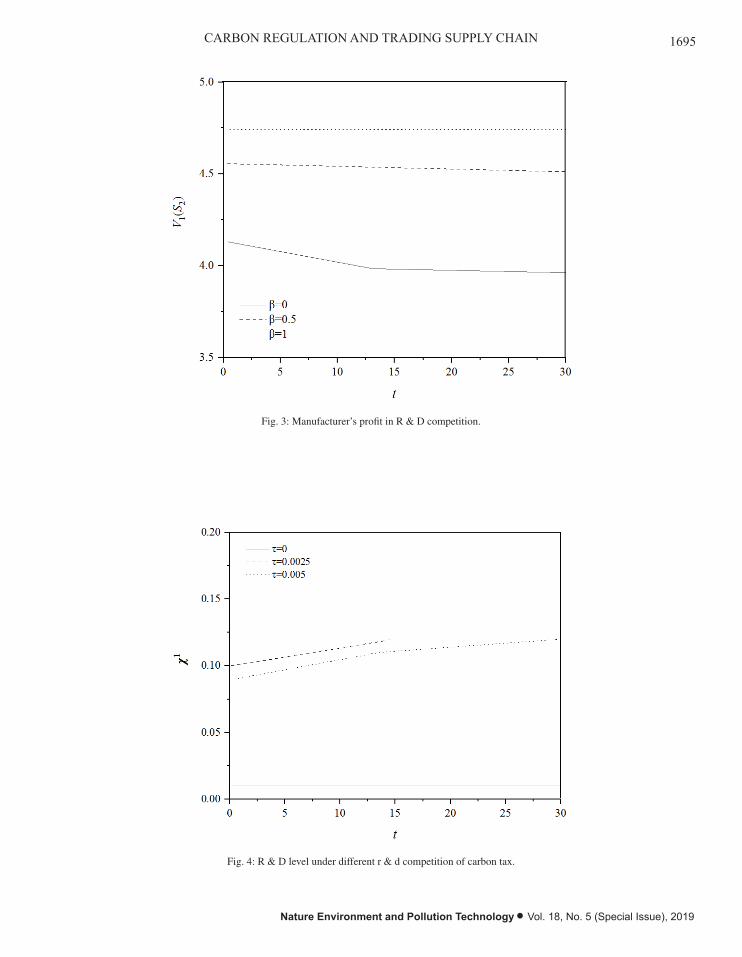
1695CARBON REGULATION AND TRADING SUPPLY CHAIN
Nature Environment and Pollution Technology • Vol. 18, No. 5 (Special Issue), 2019
Fig. 3: Manufacturer's profit in R & D competition.
R & D level effect of carbon tax policy
The R & D level effect of manufacturer R & D competition is simulated and the carbon tax rate is
calculated τ=0, τ=0.0025, τ=0.005,u=0.007.When calculating the corresponding R & D level, it is found
that the R & D level of emission reduction technology of manufacturers increases with the increase of
carbon tax rate, when the government does not impose a carbon tax τ=0, the manufacturer's R & D level
of emission reduction technology is 0, that is, there is no incentive for the manufacturer to reduce
emission when there is no pressure to reduce emission. The greater the pressure to reduce emission, the
greater the incentive to reduce emission, as shown in Fig. 4. Simulation of r & d level effect of
manufacturer R & D cooperation can be found in τ=0, τ=0.0025, τ=0.005 when, the research and
development level of corresponding emission reduction technology increases step by step, and τ>0is
higher than the R & D level in the R & D competition, as shown in Fig. 5.
Fig. 3: Manufacturer’s profit in R & D competition.
Fig. 4: R & d level under different r & d competition of carbon tax.
Fig. 5: R & d level under different r & d cooperation of carbon tax.
Then the r & d level effect under different r & d subsidy rates is simulated and the carbon tax rates
are calculated respectively τ=0, τ=0.0025, τ=0.005 when calculating the corresponding r & d level. It is
found that the r & d level of emission reduction technology with r & d subsidy under the same carbon
tax rate is higher than that without r & d subsidy, as shown in Fig. 6. If there is no carbon tax, but give
manufacturers r & d subsidies, even if there is no pressure to reduce emissions, as long as there is
Fig. 4: R & D level under different r & d competition of carbon tax.

1696 Gan Wan and Jun Zhang
Vol. 18, No. 5 (Special Issue), 2019 • Nature Environment and Pollution Technology
Fig. 4: R & d level under different r & d competition of carbon tax.
Fig. 5: R & d level under different r & d cooperation of carbon tax.
Then the r & d level effect under different r & d subsidy rates is simulated and the carbon tax rates
are calculated respectively τ=0, τ=0.0025, τ=0.005 when calculating the corresponding r & d level. It is
found that the r & d level of emission reduction technology with r & d subsidy under the same carbon
tax rate is higher than that without r & d subsidy, as shown in Fig. 6. If there is no carbon tax, but give
manufacturers r & d subsidies, even if there is no pressure to reduce emissions, as long as there is
Fig. 5: R & d level under different r & d cooperation of carbon tax.
Influence of Carbon Tax Policy on Retailer’s Ordering Decision
Newsboy model with the needs of normal distribution function, due to the particularity of normal distribution function and solving, result and solving process is expressed by the mathematical formula. This paper adopts the method of case analysis to verify proposition conclusion, analysis of carbon tax policy on the retailer’s order decision and supplier lead time strategy impact on emissions.
By calculation, it can be seen from Table 1 and Table 2 that with the gradual increase of carbon tax, the corresponding situation is that under the carbon tax policy, the retailer’s ordering time is more and more advanced, the order quantity under the carbon tax policy is lt <1/2, the monotone gets smaller, gets bigger and bigger and then gets smaller. When there is carbon tax, the length of lead time is proportional to the carbon tax rate. When tighter carbon policies are put in place (raising the carbon tax rate), retailers order at the earliest possible moment. When the carbon tax rate is 0, the tt in Table 1 is 7.17, and the tt in Table 2 is 0, which is the same as the lead time when there is no carbon emission reduction policy, but still earlier than the latest ordering time. The supplier’s lead time strategy is effective, and the effect of lead time strategy is further improved with the increasingly stringent carbon tax policy. It can also be seen from Table
1 and Table 2 that under the carbon tax policy, the retailer’s optimal order decision is to increase the lead time, and the order quantity is determined according to the product profit attribute. For high-profit products, the order quantity is first increased and then decreased, while for low-profit products, the order quantity is monotonously reduced. From a policy maker’s point of view, as long as the carbon price is positive, retailers will always be able to bring forward the ordering time.
RESULT ANALYSIS
Found through the analysis that the effect of competition is located in the upstream of the manufacturer’s optimal deci-sion for cooperative research and development of low carbon technology, cooperative production. But when the supply chain upstream manufacturers choose the optimal technology research and development form, does not necessarily for the reduced carbon emissions of the whole society, in the long term cooperation r & d environmental effect is better than that of independent research and development, cooperative research and development of the environment in the short term effect to independent research and development of the situation. The r & d level effect of the optimal technology r & d form depends on the size of the r & d spillover level of emission reduction and the level of subsidy rate. The higher the spillover level is, the lower the enterprise’s r & d
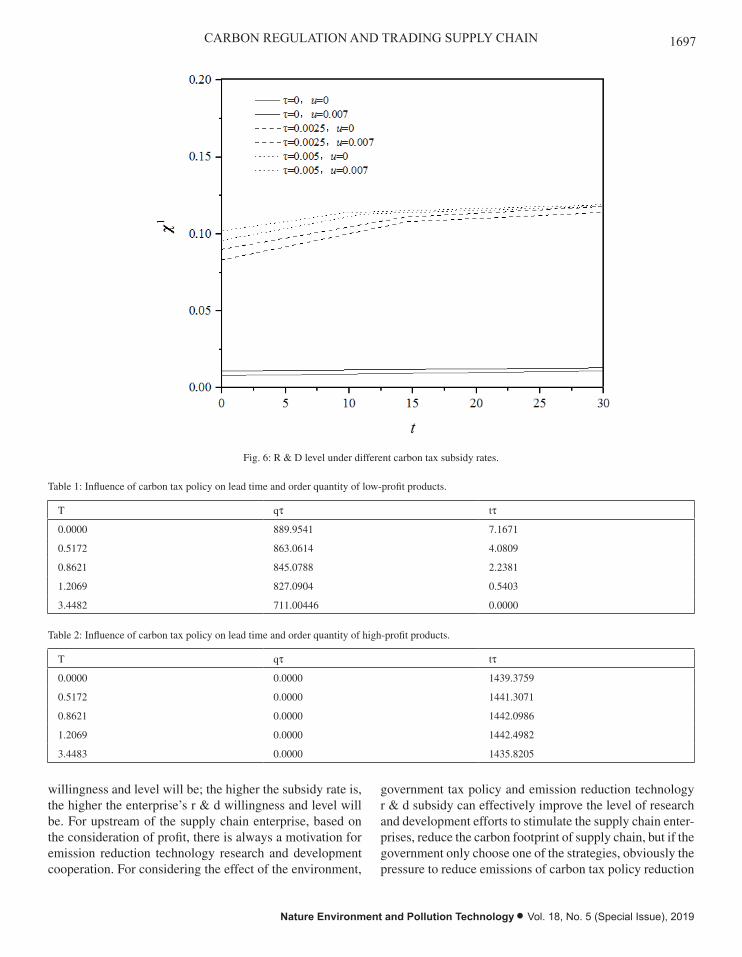
1697CARBON REGULATION AND TRADING SUPPLY CHAIN
Nature Environment and Pollution Technology • Vol. 18, No. 5 (Special Issue), 2019
incentive to reduce emissions, manufacturers can also promote the research and development of emission
reduction technology.
Fig. 6: R & D level under different carbon tax subsidy rates.
Influence of carbon tax policy on retailer's ordering decision
Newsboy model with the needs of normal distribution function, due to the particularity of normal
distribution function and solving, result and solving process is expressed by the mathematical formula.
This paper adopts the method of case analysis to verify proposition conclusion, analysis of carbon tax
policy on the retailer's order decision and supplier lead time strategy impact on emissions.
By calculation, it can be seen from Table 1 and Table 2 that with the gradual increase of carbon tax,
the corresponding situation is that under the carbon tax policy, the retailer's ordering time is more and
more advanced, the order quantity under the carbon tax policy is λτ<1/2, the monotone gets smaller, gets
bigger and bigger and then gets smaller. When there is carbon tax, the length of lead time is proportional
to the carbon tax rate. When tighter carbon policies are put in place (raising the carbon tax rate), retailers
order at the earliest possible moment. When the carbon tax rate is 0, the tτ in Table 1 is 7.17, and the tτ
in Table 2 is 0, which is the same as the lead time when there is no carbon emission reduction policy, but
still earlier than the latest ordering time. The supplier's lead time strategy is effective, and the effect of
lead time strategy is further improved with the increasingly stringent carbon tax policy. It can also be
seen from Table 1 and Table 2 that under the carbon tax policy, the retailer's optimal order decision is to
increase the lead time, and the order quantity is determined according to the product profit attribute. For
high-profit products, the order quantity is first increased and then decreased, while for low-profit
products, the order quantity is monotonously reduced. From a policy maker's point of view, as long as
Fig. 6: R & D level under different carbon tax subsidy rates.
Table 1: Influence of carbon tax policy on lead time and order quantity of low-profit products.
T qt tt
0.0000 889.9541 7.1671
0.5172 863.0614 4.0809
0.8621 845.0788 2.2381
1.2069 827.0904 0.5403
3.4482 711.00446 0.0000
Table 2: Influence of carbon tax policy on lead time and order quantity of high-profit products.
T qt tt
0.0000 0.0000 1439.3759
0.5172 0.0000 1441.3071
0.8621 0.0000 1442.0986
1.2069 0.0000 1442.4982
3.4483 0.0000 1435.8205
willingness and level will be; the higher the subsidy rate is, the higher the enterprise’s r & d willingness and level will be. For upstream of the supply chain enterprise, based on the consideration of profit, there is always a motivation for emission reduction technology research and development cooperation. For considering the effect of the environment,
government tax policy and emission reduction technology r & d subsidy can effectively improve the level of research and development efforts to stimulate the supply chain enter-prises, reduce the carbon footprint of supply chain, but if the government only choose one of the strategies, obviously the pressure to reduce emissions of carbon tax policy reduction
1698 Gan Wan and Jun Zhang
Vol. 18, No. 5 (Special Issue), 2019 • Nature Environment and Pollution Technology
technology research and development effect is better than that of emission reduction technology r & d subsidy of emission reduction technology research and development results. If the implementation of carbon tax policy aims at reducing carbon emissions in the long run, enterprises should be encouraged to carry out r & d cooperation according to the overflow level of r & d. If the implementation of carbon tax policy aims to achieve the target emission reduction task in the short term, enterprises should be encouraged to carry out research and development competition according to the overflow level of research and development.
The impact of the increase of carbon tax on the output decision of the manufacturer is related to the initial carbon footprint of the product and the channel structure. When the initial carbon footprint of the product is high, the manufac-turer’s output decision under the carbon tax policy is always to reduce production. When the initial carbon footprint of products is low, under the carbon tax policy, when the retailer dominates the channel structure, the manufacturer’s output decision is to reduce production; under other structures, when the carbon tax does not exceed the threshold, the manufactur-er’s output decision is to reduce production; when the carbon tax exceeds the threshold, the manufacturer’s output decision is to increase production. If the upstream and downstream of the supply chain can reach a cooperative emission reduction agreement in the form of bargaining, the manufacturer’s opti-mal decision is always to increase the output in the dominant position. When the retailer is dominant, the manufacturer’s optimal decision is always to reduce the output. Under the leaderless structure, the manufacturer’s optimal output de-cision depends on the tax rate.
The carbon tax policy itself does not affect the cooper-ative emission reduction strategy of supply chain members, but the channel structure does. When manufacturers dominate the channel structure, both sides have cooperation motivation, and the optimal decision of supply chain is cooperation. When retailers dominate the channel structure, the emission reduction under the cooperative strategy is lower than that under the decentralized emission reduction strategy, and both parties have no cooperation motivation. The optimal emission reduction strategy for the supply chain is decentralized emis-sion reduction. In the leaderless channel structure, different from carbon tax, one party is willing to cooperate in emission reduction while the other party is not willing, and there is no consistent emission reduction strategy. For the clean industry with low initial carbon footprint of products, it can reduce emissions with high carbon tax. For the polluting industry with high initial carbon footprint of products, the threshold of tax rate should be considered when carbon tax policy is used to reduce emissions, and the effect of emission reduction will be counterproductive if the tax rate exceeds the threshold.
CONCLUSION
There exists in emission reduction technology research and development of the supply chain link, the emission reduction technology research and development subsidies carbon tax competition policy under the manufacturer’s optimal decision for the low carbon technology research and development, cooperative production cooperation, cooperation mode of research and development level and profits were higher than competition mode. But when selecting supply chain cooperative r & d not necessarily conducive to the environ-mental improvement of the whole society, in the long-term cooperation r & d environment effect is better than that of independent research and development, cooperative research and development of the environment in the short-term effect to independent research and development of the situation. The r & d level effect of the optimal technology r & d form depends on the size of the r & d spillover level of emission reduction and the level of subsidy rate. The higher the spill-over level is, the lower the enterprise’s r & d willingness and level will be; the higher the subsidy rate is, the higher the enterprise’s r & d willingness and level will be.
In the production link of the supply chain, the impact of the carbon tax increase on the output decision of the manufacturer is related to the initial carbon footprint of the product and the channel structure. When the initial carbon footprint of the product is high, the manufacturer always decides to reduce the output. When the initial carbon footprint of products is low, under the carbon tax policy, when the retailer dominates the channel structure, the manufacturer’s output decision is to reduce production; under other struc-tures, when the carbon tax does not exceed the threshold, the manufacturer’s output decision is to reduce production; when the carbon tax exceeds the threshold, the manufacturer’s output decision is to increase production. If the upstream and downstream of the supply chain can reach a cooperative emission reduction agreement in the form of bargaining, the manufacturer’s optimal decision is always to increase the out-put in the dominant position. When the retailer is dominant, the manufacturer’s optimal decision is always to reduce the output. Under the leaderless structure, the manufacturer’s optimal output decision depends on the tax rate.
REFERENCES
Balachandran, B. and Nguyen, J.H. 2017. Carbon risk and dividend policy in an imputation tax regime. Social Science Electronic Publishing.
Ghosh, A., Sarmah, S.P. and Jha, J.K. 2018. Collaborative model for a two-echelon supply chain with uncertain demand under carbon tax policy. Sādhanā, 43(9): 144.
Guo, Z.Q. and Liu, H.B. 2016. The impact of carbon tax policy on energy consumption and CO2 emission in China. Energy Sources Part B Economics Planning and Policy, 11(8): 7.

1699CARBON REGULATION AND TRADING SUPPLY CHAIN
Nature Environment and Pollution Technology • Vol. 18, No. 5 (Special Issue), 2019
Li, X., Peng, Y. and Zhang, J. 2017. A mathematical/physics carbon emission reduction strategy for building supply chain network based on carbon tax policy. Open Physics, 15(1): 97-107.
Saxena, L.K., Jain, P.K. and Sharma, A.K. 2018. Tactical supply chain plan-ning for tyre remanufacturing considering carbon tax policy. International Journal of Advanced Manufacturing Technology, 97(1-4): 1505-1528.
Tsai, W.H., Yang, C.H., Huang, C.T. and Wu, Y.Y. 2017. The impact of the carbon tax policy on green building strategy. Journal of Environmental Planning and Management, 60(8): 1-27.
Wei, L. and Jia, Z. 2017. Carbon tax, emission trading, or the mixed policy: which is the most effective strategy for climate change mitigation in Chi-na? Mitigation and Adaptation Strategies for Global Change, 22(6): 1-20.
Yamazaki, A. 2017. Jobs and climate policy: evidence from British Columbia’s revenue-neutral carbon tax. Journal of Environmental Economics and Management, 83: 197-216.
Yang, S. and Yu, J. 2016. Low-carbonization game analysis and optimization in a two-echelon supply chain under the carbon-tax policy. Journal of Chinese Economic and Foreign Trade Studies, 9(2): 113-130.
Yi, J., Zhao, D., Hu, X. and Cai, G. 2016. An integrated CO2 tax and subsidy policy for low carbon electricity in Guangdong, China. Energy Sources Part B Economics Planning and Policy, 11(1): 44-50.
Zhou, X. 2016. Assessment of carbon tax policy and border carbon adjustment: implications for industrial competitiveness, carbon leakage and trade. Plastic and Reconstructive Surgery, 137(4): 690e-699e.

Vol. 18, No. 5 (Special Issue), 2019 • Nature Environment and Pollution Technology
1700
Study on Dye-Sensitized Solar Cells Based on TiO2 Composite Nanomaterials
Cuiping Kang*, Muhammad Aqeel Ashraf** and Yung-Tse Hung****Baoji University of Arts and Sciences, Baoji, Shaanxi Province, China ** School of Environmental Studies, China University of Geosciences, Wuhan, China ***Department of Civil and Environmental Engineering, Cleveland State University, Cleveland, Ohio, 44115 USA
ABSTRACT
With the continuous development of nanomaterials, how to improve the conversion efficiency of DSSCs has been the focus of scholars. Nano-TiO2 material is a wide bandgap semiconductor with a bandgap of 3.2eV. It exhibits good performance in dye adsorption, charge separation, electron transport, etc., and has good chemical stability and strong acid and alkali resistance. Therefore, it was always the material of choice for the preparation of photoanodes. In this paper, different thicknesses of TiO2 NRs barrier layers were prepared on FTO substrates by solvothermal method and two-step spin coating method, and their electrochemical and photoelectric properties were tested by using relevant test instruments. The effects of barrier layers with different thicknesses of TiO2 NRs on the performance of DSSCs were analysed. The anatase TiO2 NRs with an average length of 28±10nm and a diameter of 2±1nm were obtained. The concentration of TiO2 NRs was 0.245mol·L-1 (TiO2 NRs-12). When the thickness is 88.58nm, DSSCs exhibit the best photoelectric performance.
INTRODUCTION
Since 1991, Grätzel first proposed the development of dye-sensitized solar cells (DSSCs), improving the conversion efficiency of DSSCs has been the focus of scholars. After a lot of theoretical and experimental explorations, it is found that due to the poor adhesion between the photoanode and the conductive substrate, I3- in the electrolyte and D+ in the dye easily diffuse onto the conductive substrate, thereby re-combining with the photogenerated electrons to form a dark current. Therefore, in the photoanode, the interface between the conductive substrate and the semiconductor material is regulated, and the photoelectric conversion efficiency of the DSSCs is effectively improved (Hu et al. 2016). Generally, a dense barrier layer can be constructed between the inter-faces to passivate the surface of the transparent conductive material, and a potential barrier is directly generated between the semiconductor and the conductive glass, which can effec-tively suppress the electronic recombination at the interface and improve the performance of the DSSCs.
Nano-TiO2 material is a wide bandgap semiconductor with a band gap of 3.2eV. It exhibits good performance in dye adsorption, charge separation, electron transport, etc., and has good chemical stability and strong acid and alkali resistance. Therefore, it has always been the material of choice for the preparation of photoanodes (Lee et al. 2016).
In this paper, TiO2 NRs barrier layers with different thicknesses were prepared on the FTO substrate by solvo-thermal method and two-step spin coating method, and their
electrochemical and photoelectric properties were tested by using relevant test instruments, the effects of barrier layers with different thicknesses of TiO2NRs on the performance of DSSCs were analysed.
EARLIER STUDIES
A recent study conducted detailed research on various components constituting dye-sensitized solar cells, and achieved phased results, which promoted the development and practical application of dye-sensitized solar cells (Hu et al. 2016). The TiO2/CeO2 composite photoanode is taken as an example to illustrate the development of photoanode film materials for dye-sensitized solar cells, and summarized the light scattering effect, up-conversion properties, specific sur-face area, the impact of optical responsiveness and electronic transmission performance on overall battery performance optimization (Lee et al. 2016). Saini et al. (2016) prepared a POM@TiO2 composite photoanode by a sol-gel method in which a sandwich type polyacid compound K15{K3[(A--PW9O34)2Fe2(C2O4)2]}·29H2O having intramolecular electron transfer characteristics was combined with TiO2. Previous research studied the effects of TiO2 nanoparticles, one-dimensional TiO2 nanorod arrays and nano-forest struc-tures on the performance of photoanodes and DSSCs (Ran et al. 2017). The experimental results show that the TiO2 nano-forest structure can improve the utilization of incident and scattered light by photoanodes and the collection and transmission rate of photo generated carriers. A study pre-
Nat. Env. & Poll. Tech.Website: www.neptjournal.com
Received: 03-08-2019 Accepted: 30-10-2019
Key Words:Dye-sensitized solar cell TiO2 nanomaterial PhotoanodeDye adsoption
2019pp. 1701-1704 Vol. 18
p-ISSN: 0972-6268 No. 5 (Special Issue)
Nature Environment and Pollution Technology An International Quarterly Scientific Journal
Original Research Paper
e-ISSN: 2395-3454
Open Access
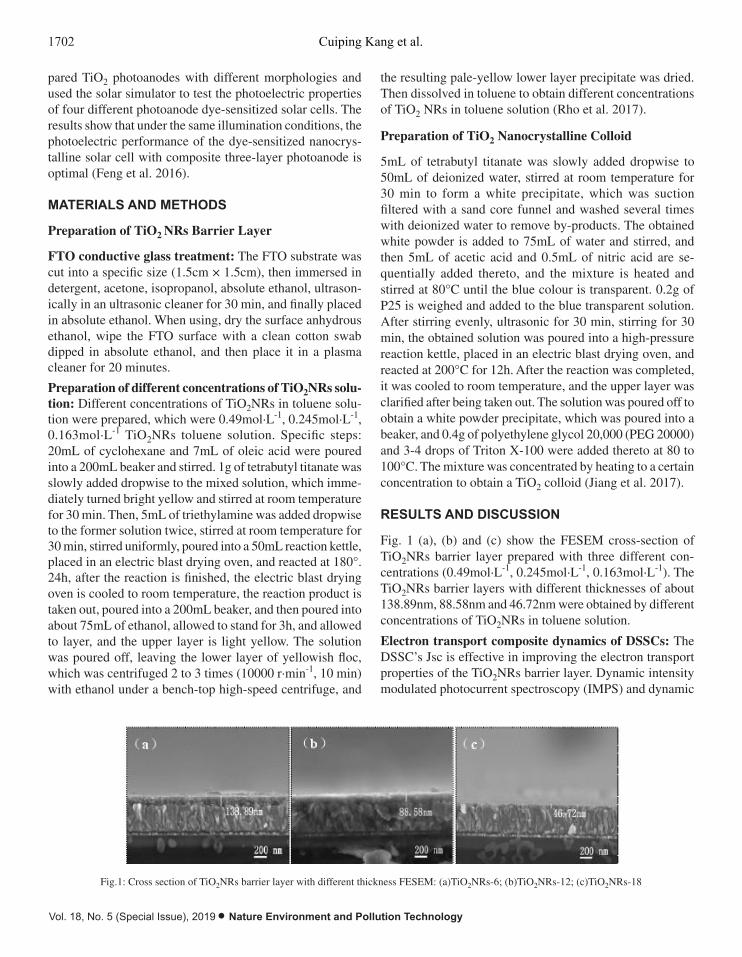
1702 Cuiping Kang et al.
Vol. 18, No. 5 (Special Issue), 2019 • Nature Environment and Pollution Technology
pared TiO2 photoanodes with different morphologies and used the solar simulator to test the photoelectric properties of four different photoanode dye-sensitized solar cells. The results show that under the same illumination conditions, the photoelectric performance of the dye-sensitized nanocrys-talline solar cell with composite three-layer photoanode is optimal (Feng et al. 2016).
MATERIALS AND METHODS
Preparation of TiO2 NRs Barrier Layer
FTO conductive glass treatment: The FTO substrate was cut into a specific size (1.5cm × 1.5cm), then immersed in detergent, acetone, isopropanol, absolute ethanol, ultrason-ically in an ultrasonic cleaner for 30 min, and finally placed in absolute ethanol. When using, dry the surface anhydrous ethanol, wipe the FTO surface with a clean cotton swab dipped in absolute ethanol, and then place it in a plasma cleaner for 20 minutes.
Preparation of different concentrations of TiO2NRs solu-tion: Different concentrations of TiO2NRs in toluene solu-tion were prepared, which were 0.49mol·L-1, 0.245mol·L-1, 0.163mol·L-1 TiO2NRs toluene solution. Specific steps: 20mL of cyclohexane and 7mL of oleic acid were poured into a 200mL beaker and stirred. 1g of tetrabutyl titanate was slowly added dropwise to the mixed solution, which imme-diately turned bright yellow and stirred at room temperature for 30 min. Then, 5mL of triethylamine was added dropwise to the former solution twice, stirred at room temperature for 30 min, stirred uniformly, poured into a 50mL reaction kettle, placed in an electric blast drying oven, and reacted at 180°. 24h, after the reaction is finished, the electric blast drying oven is cooled to room temperature, the reaction product is taken out, poured into a 200mL beaker, and then poured into about 75mL of ethanol, allowed to stand for 3h, and allowed to layer, and the upper layer is light yellow. The solution was poured off, leaving the lower layer of yellowish floc, which was centrifuged 2 to 3 times (10000 r·min-1, 10 min) with ethanol under a bench-top high-speed centrifuge, and
the resulting pale-yellow lower layer precipitate was dried. Then dissolved in toluene to obtain different concentrations of TiO2 NRs in toluene solution (Rho et al. 2017).
Preparation of TiO2 Nanocrystalline Colloid
5mL of tetrabutyl titanate was slowly added dropwise to 50mL of deionized water, stirred at room temperature for 30 min to form a white precipitate, which was suction filtered with a sand core funnel and washed several times with deionized water to remove by-products. The obtained white powder is added to 75mL of water and stirred, and then 5mL of acetic acid and 0.5mL of nitric acid are se-quentially added thereto, and the mixture is heated and stirred at 80°C until the blue colour is transparent. 0.2g of P25 is weighed and added to the blue transparent solution. After stirring evenly, ultrasonic for 30 min, stirring for 30 min, the obtained solution was poured into a high-pressure reaction kettle, placed in an electric blast drying oven, and reacted at 200°C for 12h. After the reaction was completed, it was cooled to room temperature, and the upper layer was clarified after being taken out. The solution was poured off to obtain a white powder precipitate, which was poured into a beaker, and 0.4g of polyethylene glycol 20,000 (PEG 20000) and 3-4 drops of Triton X-100 were added thereto at 80 to 100°C. The mixture was concentrated by heating to a certain concentration to obtain a TiO2 colloid (Jiang et al. 2017).
RESULTS AND DISCUSSION
Fig. 1 (a), (b) and (c) show the FESEM cross-section of TiO2NRs barrier layer prepared with three different con-centrations (0.49mol·L-1, 0.245mol·L-1, 0.163mol·L-1). The TiO2NRs barrier layers with different thicknesses of about 138.89nm, 88.58nm and 46.72nm were obtained by different concentrations of TiO2NRs in toluene solution.
Electron transport composite dynamics of DSSCs: The DSSC’s Jsc is effective in improving the electron transport properties of the TiO2NRs barrier layer. Dynamic intensity modulated photocurrent spectroscopy (IMPS) and dynamic
Fig.1: Cross section of TiO2NRs barrier layer with different thickness FESEM: (a)TiO2NRs-6; (b)TiO2NRs-12; (c)TiO2NRs-18
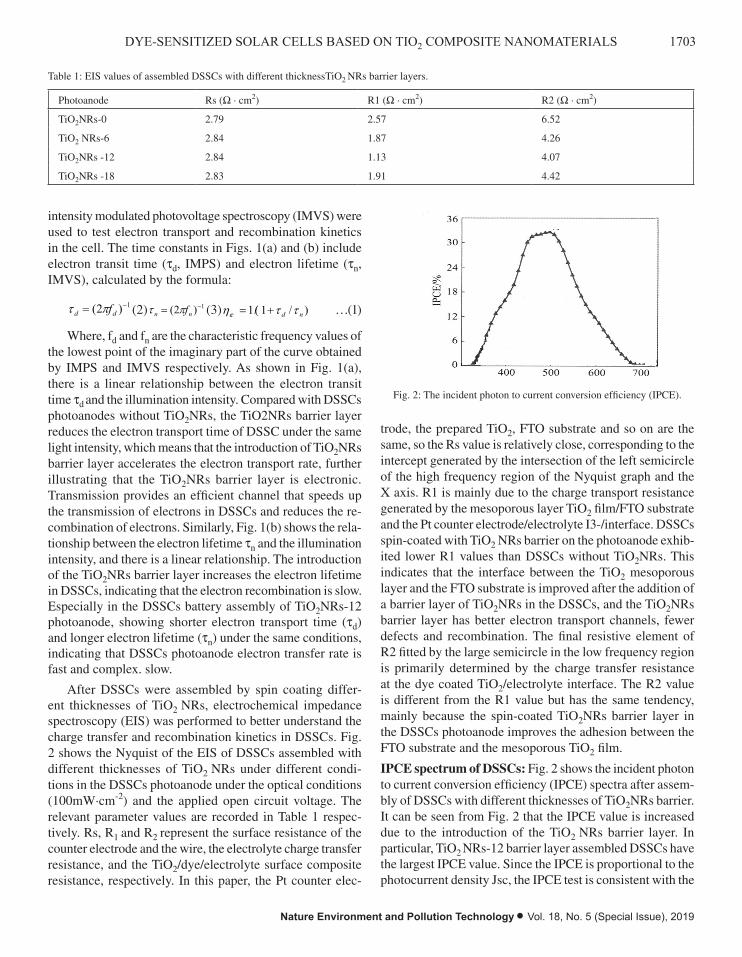
1703DYE-SENSITIZED SOLAR CELLS BASED ON TIO2 COMPOSITE NANOMATERIALS
Nature Environment and Pollution Technology • Vol. 18, No. 5 (Special Issue), 2019
intensity modulated photovoltage spectroscopy (IMVS) were used to test electron transport and recombination kinetics in the cell. The time constants in Figs. 1(a) and (b) include electron transit time (td, IMPS) and electron lifetime (tn, IMVS), calculated by the formula:
1)2( −= dd fπτ (2) 1)2( −= nn fπτ (3) )/1/(1 ndcc ττη += …(1)
Where, fd and fn are the characteristic frequency values of the lowest point of the imaginary part of the curve obtained by IMPS and IMVS respectively. As shown in Fig. 1(a), there is a linear relationship between the electron transit time td and the illumination intensity. Compared with DSSCs photoanodes without TiO2NRs, the TiO2NRs barrier layer reduces the electron transport time of DSSC under the same light intensity, which means that the introduction of TiO2NRs barrier layer accelerates the electron transport rate, further illustrating that the TiO2NRs barrier layer is electronic. Transmission provides an efficient channel that speeds up the transmission of electrons in DSSCs and reduces the re-combination of electrons. Similarly, Fig. 1(b) shows the rela-tionship between the electron lifetime tn and the illumination intensity, and there is a linear relationship. The introduction of the TiO2NRs barrier layer increases the electron lifetime in DSSCs, indicating that the electron recombination is slow. Especially in the DSSCs battery assembly of TiO2NRs-12 photoanode, showing shorter electron transport time (td) and longer electron lifetime (tn) under the same conditions, indicating that DSSCs photoanode electron transfer rate is fast and complex. slow.
After DSSCs were assembled by spin coating differ-ent thicknesses of TiO2 NRs, electrochemical impedance spectroscopy (EIS) was performed to better understand the charge transfer and recombination kinetics in DSSCs. Fig. 2 shows the Nyquist of the EIS of DSSCs assembled with different thicknesses of TiO2 NRs under different condi-tions in the DSSCs photoanode under the optical conditions (100mW·cm-2) and the applied open circuit voltage. The relevant parameter values are recorded in Table 1 respec-tively. Rs, R1 and R2 represent the surface resistance of the counter electrode and the wire, the electrolyte charge transfer resistance, and the TiO2/dye/electrolyte surface composite resistance, respectively. In this paper, the Pt counter elec-
trode, the prepared TiO2, FTO substrate and so on are the same, so the Rs value is relatively close, corresponding to the intercept generated by the intersection of the left semicircle of the high frequency region of the Nyquist graph and the X axis. R1 is mainly due to the charge transport resistance generated by the mesoporous layer TiO2 film/FTO substrate and the Pt counter electrode/electrolyte I3-/interface. DSSCs spin-coated with TiO2 NRs barrier on the photoanode exhib-ited lower R1 values than DSSCs without TiO2NRs. This indicates that the interface between the TiO2 mesoporous layer and the FTO substrate is improved after the addition of a barrier layer of TiO2NRs in the DSSCs, and the TiO2NRs barrier layer has better electron transport channels, fewer defects and recombination. The final resistive element of R2 fitted by the large semicircle in the low frequency region is primarily determined by the charge transfer resistance at the dye coated TiO2/electrolyte interface. The R2 value is different from the R1 value but has the same tendency, mainly because the spin-coated TiO2NRs barrier layer in the DSSCs photoanode improves the adhesion between the FTO substrate and the mesoporous TiO2 film.
IPCE spectrum of DSSCs: Fig. 2 shows the incident photon to current conversion efficiency (IPCE) spectra after assem-bly of DSSCs with different thicknesses of TiO2NRs barrier. It can be seen from Fig. 2 that the IPCE value is increased due to the introduction of the TiO2 NRs barrier layer. In particular, TiO2 NRs-12 barrier layer assembled DSSCs have the largest IPCE value. Since the IPCE is proportional to the photocurrent density Jsc, the IPCE test is consistent with the
Table 1: EIS values of assembled DSSCs with different thicknessTiO2 NRs barrier layers.
Photoanode Rs (W · cm2) R1 (W · cm2) R2 (W · cm2)
TiO2NRs-0 2.79 2.57 6.52
TiO2 NRs-6 2.84 1.87 4.26
TiO2NRs -12 2.84 1.13 4.07
TiO2NRs -18 2.83 1.91 4.42
Fig. 2: The incident photon to current conversion efficiency (IPCE).

1704 Cuiping Kang et al.
Vol. 18, No. 5 (Special Issue), 2019 • Nature Environment and Pollution Technology
IV test results. The IPCE value is related to light trapping efficiency, electron injection efficiency, and electron collec-tion efficiency. The electron injection efficiency is related to the electron transport and electron recombination. DSSCs reduce the electron transport time and electron recombination due to the introduction of the TiO2NRs barrier layer, thereby improving the electron collection efficiency, corresponding to the IMVS and IMPS test results, and further increasing the IPCE value.
CONCLUSION
After a lot of theoretical and experimental explorations, it is found that due to the poor adhesion between the photoanode and the conductive substrate, I3- in the electrolyte and D+ in the dye easily diffuse onto the conductive substrate, thereby recombining with the photogenerated electrons to form a dark current. Anatase TiO2NRs with an average length of 28±10nm and a diameter of 2±1nm were successfully synthesized by one-pot solvothermal method. With the concentration of TiO2NRs as 0.245mol·L-1 (TiO2NRs-12) and the thickness as 88.58nm, DSSCs showed the best photoelectric performance. The PCE of the DSSCs was 8.44%, the Voc was 0.79 V, the Jsc was 16.1 m A·cm-2, and the FF was 66%.
The TiO2 NR barrier layer has good electron transport channels and less electron recombination, which helps to improve electron transport rate, electron lifetime, charge collection efficiency and electronic recombination reaction, and it is beneficial to improve the photoelectric conversion performance of DSSCs.
ACKNOWLEDGEMENT
Scientific research plan projects of Education Department of Shaanxi province of China (Grant No. 12JK0983) Natural Science Basic Research plan in Shaanxi Province of China (Grant No. 2012JQ1011) and Key project of Baoji university of arts and science (Grant No. ZK2017036).
REFERENCES
Feng, Y., Chen, J., Huang, X., Liu, W., Zhu, Y. and Qin, W. 2016. A ZnO/TiO2 composite nanorods photoanode with improved performance for dye-sen-sitized solar cells. Crystal Research and Technology, 51(10): 548-553.
Hu, J., Cheng, J., Tong, S., Li, Z., Duan, J. and Yang, Y. 2016. Dye-sensitized solar cells based on p25 nanoparticles/TiO2 nanotube arrays/hollow TiO2 boxes three-layer composite film. Journal of Materials Science Materials in Electronics, 27(5): 1-9.
Jiang, L., Sun, L., Yang, D., Zhang, J., Li, Y. J., and Deng, W.Q. 2017. Niobi-um-doped (001) dominated anatase TiO2 nanosheets as photoelectrode for efficient dye-sensitized solar cells. Acs. Appl. Mater. Interfaces, 9(11): 9576.
Lee, K.W., Kim, M., Kim, J.M., Kim, J.J. and Lee, I.H. 2016. Enhanced photovoltaic performance of back-illuminated dye-sensitized solar cell based on TiO2 nanoparticle/nanowire composite film in cobalt redox system. Journal of Alloys and Compounds, 656: 568-572.
Ran, H., Fan, J., Zhang, X., Jing, M., and Shao, G. 2017. Enhanced perfor-mances of dye-sensitized solar cells based on Au-TiO2 and Ag-TiO2 plasmonic hybrid nanocomposites. Applied Surface Science, 430.
Rho, W. Y., Da, H. S., Sang, H. L. and Jun, B. H. 2017. Enhanced efficiency in dye-sensitized solar cells by electron transport and light scattering on freestanding TiO2 nanotube arrays. Nanomaterials, 7(10): 345.
Saini, R.K., Singh, D., Bhagwan, S., Sonika, Singh, I. and Kadyan, P.S. 2016. Photovoltaic characterization of dye sensitized solar cells based on tio2 nanoparticles using triarylmethane dyes as photosensitizers. Journal of Nanoelectronics and Optoelectronics, 11(2): 175-182.
Wei, L., Chen, S., Yang, Y., Dong, Y., Song, W. and Fan, R. 2018. Effect of graphene/TiO2 composite layer on the performance of dye-sensitized solar cells. Journal of Nanoscience and Nanotechnology, 18(2): 973-978.
Water Pollution in Old Towns Affecting the Environment and Ecological restoration
Zou Hang*, Muhammad Aqeel Ashraf** and Yung-Tse Hung****Southwest Forestry University, Yunnan, China**China University of Geosciences, Wuhan, China***Department of Civil and Environmental Engineering, Cleveland State University, Cleveland, Ohio, 44115 USA
ABSTRACT
In order to solve the problem that the traditional activated sludge method is not effective in recovering the ecological process of water pollution in urban areas, the membrane bioreactor-based sewage treatment process was studied experimentally. Two flat-plate ultrafiltration membranes were used to form the ultrafilter tank in the experimental device sampled, and the processes of nitrate cycle and sludge cycle were adopted. Ozonation and granular activated carbon filtration were adopted to treat the micropollutants. After repeated experiments in 17 experimental cycles, the obtained experimental data were analysed, and it was found that under different sewage treatment loads, the treatment quality of the device could reach p concentration < 0.2mg/L and n concentration < 6mg/L. Compared with the traditional sewage treatment process, the experimental device can better remove the common nutrient rich substances and micro-pollutants in urban sewage, better control the greenhouse gas emissions, and meet the demand for efficient ecological recovery of urban sewage.
INTRODUCTION
Urban water environment metabolic system is a cycle chain of urban water resources utilization and protection composed of water source, water supply, water use and drainage, and is the source of urban life and vitality. Its overall function is to meet the reasonable water demand of the city, that is, the living and social water demand of urban residents, the production water demand of urban development and the environmental water demand of urban landscape and mu-nicipal administration. With the improvement of people’s requirements on environmental quality and their attention to the urban ecological environment, the urban water en-vironment system, as an important subsystem, has become the green lifeline of the urban system, which can effectively weaken the urban “heat island effect” and reduce the degree of pollution, and is of great significance to the construction of high-grade ecological city. Due to the growth of urban pop-ulation and stricter water quality requirements, the urgency of ecological restoration of water pollution in urban areas has increased. The main passive means of water ecological restoration is the removal of drug residues, suspended mi-cro-solids, microorganisms, nitrogen and phosphorus and other nutrient-rich substances in regional water bodies by using efficient sewage treatment equipment (Zhou et al. 2018). Because the traditional sewage treatment plant usually cannot effectively remove drug residues and some organic pollutants in the polluted water in cities, substances such
as pesticides, antibiotics, biological agent, pose a threat to aquatic organisms, aquatic food webs and higher biolog-ical potential negative effects, to our environment, health and society, so there is a need to adopt effective treatment means to remove them. (Yang et al. 2018, Koch et al. 2018, Stanford et al. 2018). In this paper, the wastewater treatment process based on membrane bioreactor is studied in view of the problem that the traditional activated sludge method is not effective in recovering the ecological process of water pollution in urban areas.
EARLIER STUDIES
A study evaluated the impact of land use and point source on water quality in the river system of Shunde district from 2000 to 2010 by using Pearson regression analysis, redun-dancy analysis and multiple regression analysis. Garner et al. (2018) used EFDC model to analyse the scope, time and degree of pollution damage of sudden water pollution event under different hydrological conditions in Shenzhen estuary. A method is proposed to accurately analyse the main hydrodynamic factors in sudden water pollution events in estuaries (Tao et al. 2017). Kalogianni et al. (2017) studied the effects of water level and nitrogen load (ammonium nitrogen and nitrate nitrogen) on seedling emergence and regeneration of riparian seed banks in this basin. Another increasingly important issue for sewage treatment is green-house gas emissions. In the process of sewage treatment, the
Nat. Env. & Poll. Tech.Website: www.neptjournal.com
Received: 16-08-2019 Accepted: 02-10-2019
Key Words:Water pollution Surrounding residents Governance measures Water ecological restoration
2019pp. 1705-1711 Vol. 18
p-ISSN: 0972-6268 No. 5 (Special Issue)
Nature Environment and Pollution Technology An International Quarterly Scientific Journal
Original Research Paper
e-ISSN: 2395-3454
Open Access
1706 Zou Hang et al.
Vol. 18, No. 5 (Special Issue), 2019 • Nature Environment and Pollution Technology
emission of greenhouse gases with nitrous oxide (N2O) as the main component is usually not taken seriously. However, the greenhouse effect of N2O is 298 times higher than that of carbon dioxide (CO2). At the same time, in the process of incomplete nitrification and denitrification, the emission of N2O cannot be avoided. For this reason, new solutions with high efficiency, high capacity and flexible municipal wastewater treatment technology are needed. A study cal-culated the water footprint grey component (GWF P) of the four most common drug compounds (CBZ, DCF, KTP and NPX).In addition, GWF C of major conventional pollutants (nitrate, phosphate and organic matter) was also calculated (Martínezalcalá et al. 2018). A research evaluated water quality with comprehensive nutritional status index (TLI) and Shannon-Wiener diversity index (H) (Chen et al. 2017).
Membrane bioreactor (MBR) will be used to replace the existing traditional activated sludge process (CAS), and the treatment capacity of the MBR based sewage treatment device will be verified through experiments. MBR technol-ogy has been used in the chemical industry for decades, but only in the past decade has it gained more application in the ecological restoration of polluted water bodies in urban areas. This is mainly due to the cost of membrane greatly reduced and process optimization development reduces the demand for energy. Existing research data show that MBR combines bioactive sludge process with membrane separa-tion, and it has obvious advantages over CAS. Advantages include significantly better particle water (osmosis) quality, disinfection capability due to membrane pore size, higher sludge concentration in organisms, higher volume load, smaller footprint, and flexibility of influent change process. The disadvantages of the MBR process are the high energy consumption in the aeration process and the need to use cleaning chemicals in the filtration process to inhibit the fouling on the membrane surface to improve the membrane permeability. Based on the consideration of introducing MBR into urban sewage ecological restoration process, this paper studies the availability and resource utilization effi-ciency of MBR technology in the field of sewage treatment, and focuses on the removal effect of MBR technology on the most important pollutants in urban sewage (including nutrients, micro-pollutants and greenhouse gas emissions). The proposed framework incorporates the mean urban storm event concentration (EMC) data into the existing LCA impact category to illustrate the environmental impacts associated with urban land occupation over the entire system life cycle (Matta et al. 2018).
MATERIALS AND METHODS
At present, the common techniques for improving water quality of urban landscape water at home and abroad
include physical restoration, chemical restoration and bi-ological-ecological restoration. Biofiltration technology (percolation biofilm technology) on the surface of aquatic plants, sand and sediments in rivers usually has a layer of biofilm that can degrade and purify organic pollutants. It is mainly composed of algae, bacteria and protozoa, which are called peripheral plexus organisms. In order to strengthen the removal of organic pollutants from river water by sur-rounding organisms, a percolating biofilm purification bed can be constructed on the beach or riverbank with pebbles as the filler. Due to the different materials and particle sizes of the packing materials, the seepage biological membrane purification bed may have physical adsorption, sedimenta-tion, filtration and other effects in addition to the biological degradation of organic matter, to remove suspended matter and nitrogen, phosphorus, heavy metals and so on. The per-meable biofilm purification bed is suitable for small rivers with less serious organic pollution. The percolation biofilm purification bed technology has been studied and applied in the river purification of Edogawa, Sakagawa and Jingdu in Japan, Liangzechuan in Korea and Thailand, and has achieved good results.
The process flow of membrane biological reaction ex-periment applied to water pollution treatment in urban areas is shown in Fig. 1.
The experimental device shown in Fig. 1 is a membrane bioreactor with a total volume of about 29m3, which is composed of pre-aerated sedimentation tank, main sedi-mentation tank, nitrification zone and denitrification zone, and 13.2m3 ultrafilter tank. Sewage flows into the equipment through a 3mm filter. The nitrate begins to circulate from the post-denitrification zone to the pre-denitrification zone, and the sludge begins to circulate from the ultrafilter tank to the pre-denitrification zone. A separate degasifier was used to reduce oxygen concentration in the returned sludge through nitrification and respiration. Supernatant from sludge dewa-tering is added continuously to the pre-denitrification zone. The ultrafiltration tank is composed of two ultrafiltration modules, and the ultrafiltration module adopts the flat mem-brane type MFM100. The ultrafiltration module is running for 10 minutes and needs an interval of 2 minutes. The nominal pore size of ultrafiltration membrane is 0.2 micron, and the minimum and maximum pore sizes are 0.17 micron and 0.26 micron respectively. The total membrane area of each module is 79.64 square meters, distributed on 44 diaphragms. Transmembrane pressure (TMP) control strategy was used for membrane operation. Membrane cleaning is performed when the permeability decreases by approximately 30% from the initial value. Sodium hypochlorite is used to remove organic matter and oxalic acid from inorganic coating in membrane cleaning operation.
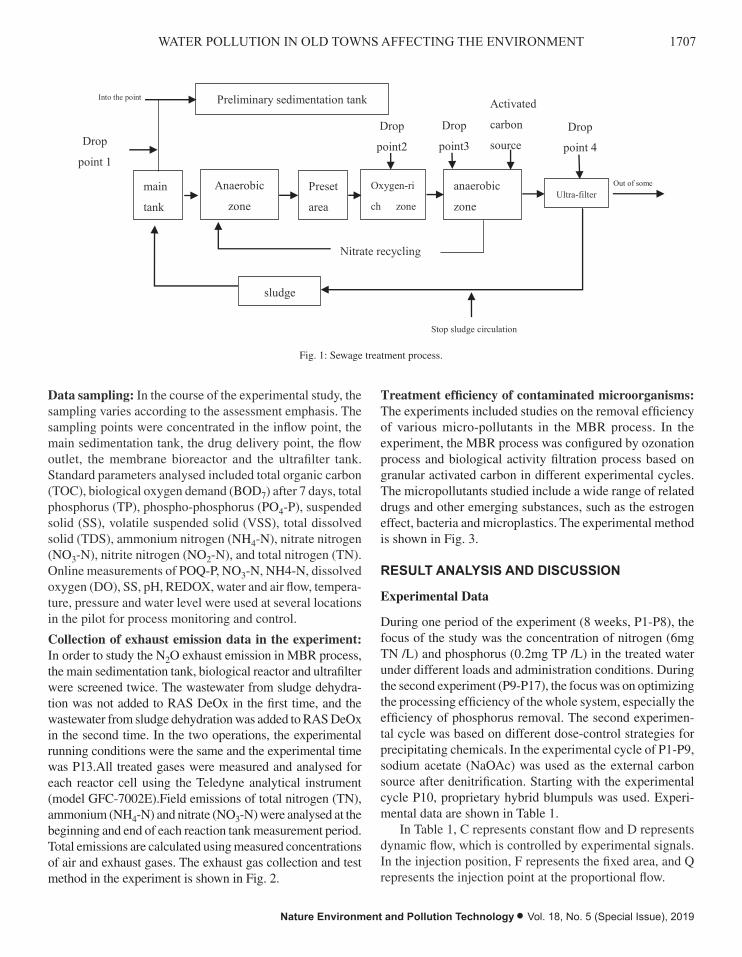
1707WATER POLLUTION IN OLD TOWNS AFFECTING THE ENVIRONMENT
Nature Environment and Pollution Technology • Vol. 18, No. 5 (Special Issue), 2019
Data sampling: In the course of the experimental study, the sampling varies according to the assessment emphasis. The sampling points were concentrated in the inflow point, the main sedimentation tank, the drug delivery point, the flow outlet, the membrane bioreactor and the ultrafilter tank. Standard parameters analysed included total organic carbon (TOC), biological oxygen demand (BOD7) after 7 days, total phosphorus (TP), phospho-phosphorus (PO4-P), suspended solid (SS), volatile suspended solid (VSS), total dissolved solid (TDS), ammonium nitrogen (NH4-N), nitrate nitrogen (NO3-N), nitrite nitrogen (NO2-N), and total nitrogen (TN). Online measurements of POQ-P, NO3-N, NH4-N, dissolved oxygen (DO), SS, pH, REDOX, water and air flow, tempera-ture, pressure and water level were used at several locations in the pilot for process monitoring and control.
Collection of exhaust emission data in the experiment: In order to study the N2O exhaust emission in MBR process, the main sedimentation tank, biological reactor and ultrafilter were screened twice. The wastewater from sludge dehydra-tion was not added to RAS DeOx in the first time, and the wastewater from sludge dehydration was added to RAS DeOx in the second time. In the two operations, the experimental running conditions were the same and the experimental time was P13.All treated gases were measured and analysed for each reactor cell using the Teledyne analytical instrument (model GFC-7002E).Field emissions of total nitrogen (TN), ammonium (NH4-N) and nitrate (NO3-N) were analysed at the beginning and end of each reaction tank measurement period. Total emissions are calculated using measured concentrations of air and exhaust gases. The exhaust gas collection and test method in the experiment is shown in Fig. 2.
Treatment efficiency of contaminated microorganisms: The experiments included studies on the removal efficiency of various micro-pollutants in the MBR process. In the experiment, the MBR process was configured by ozonation process and biological activity filtration process based on granular activated carbon in different experimental cycles. The micropollutants studied include a wide range of related drugs and other emerging substances, such as the estrogen effect, bacteria and microplastics. The experimental method is shown in Fig. 3.
RESULT ANALYSIS AND DISCUSSION
Experimental Data
During one period of the experiment (8 weeks, P1-P8), the focus of the study was the concentration of nitrogen (6mg TN /L) and phosphorus (0.2mg TP /L) in the treated water under different loads and administration conditions. During the second experiment (P9-P17), the focus was on optimizing the processing efficiency of the whole system, especially the efficiency of phosphorus removal. The second experimen-tal cycle was based on different dose-control strategies for precipitating chemicals. In the experimental cycle of P1-P9, sodium acetate (NaOAc) was used as the external carbon source after denitrification. Starting with the experimental cycle P10, proprietary hybrid blumpuls was used. Experi-mental data are shown in Table 1.
In Table 1, C represents constant flow and D represents dynamic flow, which is controlled by experimental signals. In the injection position, F represents the fixed area, and Q represents the injection point at the proportional flow.
Out of some
Preliminary sedimentation tank
main
tank
Drop
point 1
Into the point
sludge
Ultra-filter Oxygen-ri
ch zone
Preset
area
Anaerobic
zone
anaerobic
zone
Drop
point2
Drop
point3
Activated
carbon
source Drop
point 4
Stop sludge circulation
Nitrate recycling
Fig. 1: Sewage treatment process.
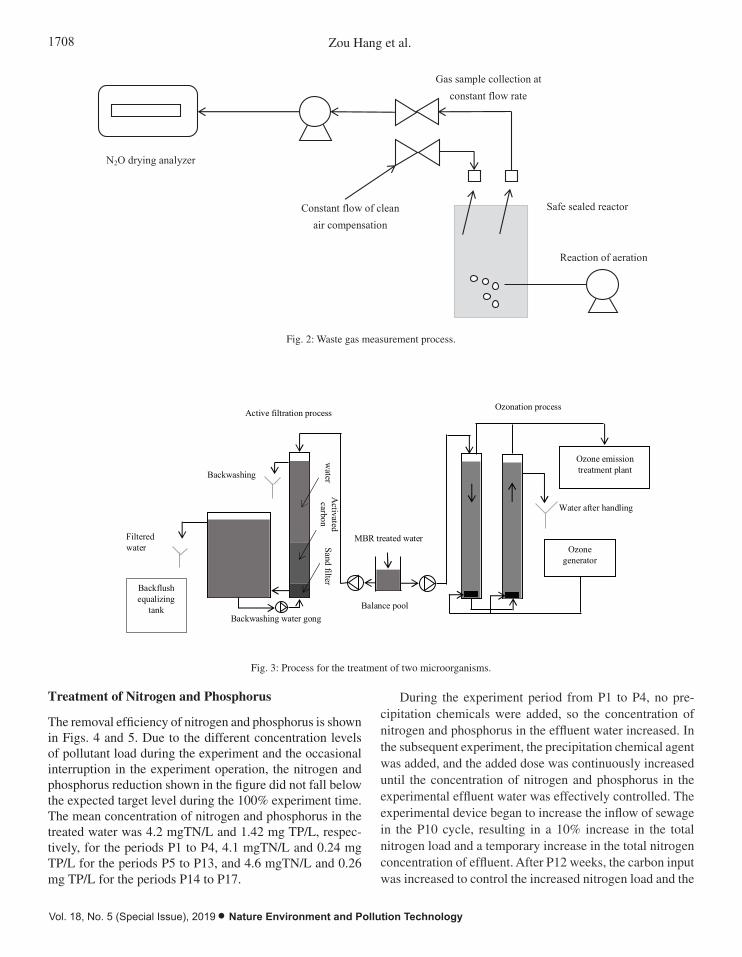
1708 Zou Hang et al.
Vol. 18, No. 5 (Special Issue), 2019 • Nature Environment and Pollution Technology
Treatment of Nitrogen and Phosphorus
The removal efficiency of nitrogen and phosphorus is shown in Figs. 4 and 5. Due to the different concentration levels of pollutant load during the experiment and the occasional interruption in the experiment operation, the nitrogen and phosphorus reduction shown in the figure did not fall below the expected target level during the 100% experiment time. The mean concentration of nitrogen and phosphorus in the treated water was 4.2 mgTN/L and 1.42 mg TP/L, respec-tively, for the periods P1 to P4, 4.1 mgTN/L and 0.24 mg TP/L for the periods P5 to P13, and 4.6 mgTN/L and 0.26 mg TP/L for the periods P14 to P17.
During the experiment period from P1 to P4, no pre-cipitation chemicals were added, so the concentration of nitrogen and phosphorus in the effluent water increased. In the subsequent experiment, the precipitation chemical agent was added, and the added dose was continuously increased until the concentration of nitrogen and phosphorus in the experimental effluent water was effectively controlled. The experimental device began to increase the inflow of sewage in the P10 cycle, resulting in a 10% increase in the total nitrogen load and a temporary increase in the total nitrogen concentration of effluent. After P12 weeks, the carbon input was increased to control the increased nitrogen load and the
water
Activated carbon
Sand filter
Backwashing water
Filtered water
Backflush equalizing
tank
MBR treated water
Ozone emission treatment plant
Water after handling
Ozone generator
Active filtration process Ozonation process
Backwashing water gong Balance pool
Fig. 3: Process for the treatment of two microorganisms.
Fig. 2: Waste gas measurement process.
Treatment efficiency of contaminated microorganisms
The experiments included studies on the removal efficiency of various micro-pollutants in the MBR
process. In the experiment, the MBR process was configured by ozonation process and biological
activity filtration process based on granular activated carbon in different experimental cycles. The
micropollutants studied include a wide range of related drugs and other emerging substances, such as the
estrogen effect, bacteria and microplastics. The experimental method is shown in Fig. 3.
N2O drying analyzer
Constant flow of clean air compensation
Gas sample collection at constant flow rate
Safe sealed reactor
Reaction of aeration
water
Activated
carbon Sand filter
Backwashing
Filtered
water
Backflush
equalizing
tank
MBR treated water
Ozone emission
treatment plant
Water after handling
Ozone
generator
Active filtration process Ozonation process
Backwashing water gong Balance pool
Fig. 2: Waste gas measurement process.
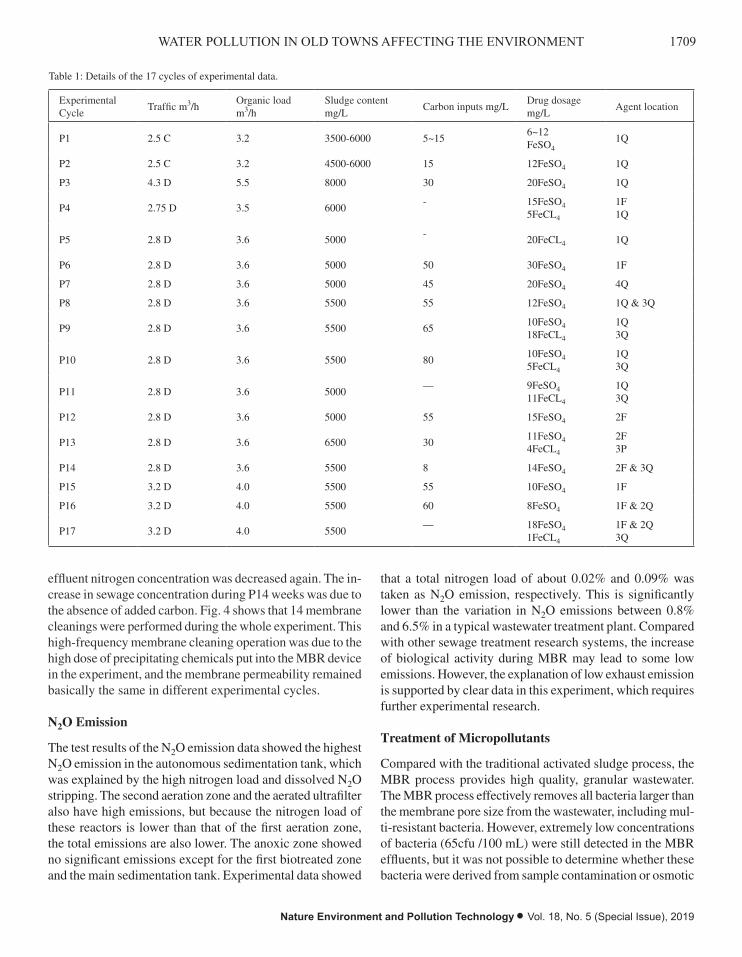
1709WATER POLLUTION IN OLD TOWNS AFFECTING THE ENVIRONMENT
Nature Environment and Pollution Technology • Vol. 18, No. 5 (Special Issue), 2019
effluent nitrogen concentration was decreased again. The in-crease in sewage concentration during P14 weeks was due to the absence of added carbon. Fig. 4 shows that 14 membrane cleanings were performed during the whole experiment. This high-frequency membrane cleaning operation was due to the high dose of precipitating chemicals put into the MBR device in the experiment, and the membrane permeability remained basically the same in different experimental cycles.
N2O Emission
The test results of the N2O emission data showed the highest N2O emission in the autonomous sedimentation tank, which was explained by the high nitrogen load and dissolved N2O stripping. The second aeration zone and the aerated ultrafilter also have high emissions, but because the nitrogen load of these reactors is lower than that of the first aeration zone, the total emissions are also lower. The anoxic zone showed no significant emissions except for the first biotreated zone and the main sedimentation tank. Experimental data showed
that a total nitrogen load of about 0.02% and 0.09% was taken as N2O emission, respectively. This is significantly lower than the variation in N2O emissions between 0.8% and 6.5% in a typical wastewater treatment plant. Compared with other sewage treatment research systems, the increase of biological activity during MBR may lead to some low emissions. However, the explanation of low exhaust emission is supported by clear data in this experiment, which requires further experimental research.
Treatment of Micropollutants
Compared with the traditional activated sludge process, the MBR process provides high quality, granular wastewater. The MBR process effectively removes all bacteria larger than the membrane pore size from the wastewater, including mul-ti-resistant bacteria. However, extremely low concentrations of bacteria (65cfu /100 mL) were still detected in the MBR effluents, but it was not possible to determine whether these bacteria were derived from sample contamination or osmotic
Table 1: Details of the 17 cycles of experimental data.
Experimental Cycle
Traffic m3/hOrganic loadm3/h
Sludge content mg/L
Carbon inputs mg/LDrug dosagemg/L
Agent location
P1 2.5 C 3.2 3500-6000 5~156~12FeSO4
1Q
P2 2.5 C 3.2 4500-6000 15 12FeSO4 1Q
P3 4.3 D 5.5 8000 30 20FeSO4 1Q
P4 2.75 D 3.5 6000- 15FeSO4
5FeCL4
1F1Q
P5 2.8 D 3.6 5000-
20FeCL4 1Q
P6 2.8 D 3.6 5000 50 30FeSO4 1F
P7 2.8 D 3.6 5000 45 20FeSO4 4Q
P8 2.8 D 3.6 5500 55 12FeSO4 1Q & 3Q
P9 2.8 D 3.6 5500 6510FeSO418FeCL4
1Q3Q
P10 2.8 D 3.6 5500 8010FeSO45FeCL4
1Q3Q
P11 2.8 D 3.6 5000— 9FeSO4
11FeCL4
1Q3Q
P12 2.8 D 3.6 5000 55 15FeSO4 2F
P13 2.8 D 3.6 6500 3011FeSO44FeCL4
2F3P
P14 2.8 D 3.6 5500 8 14FeSO4 2F & 3Q
P15 3.2 D 4.0 5500 55 10FeSO4 1F
P16 3.2 D 4.0 5500 60 8FeSO4 1F & 2Q
P17 3.2 D 4.0 5500— 18FeSO4
1FeCL4
1F & 2Q3Q
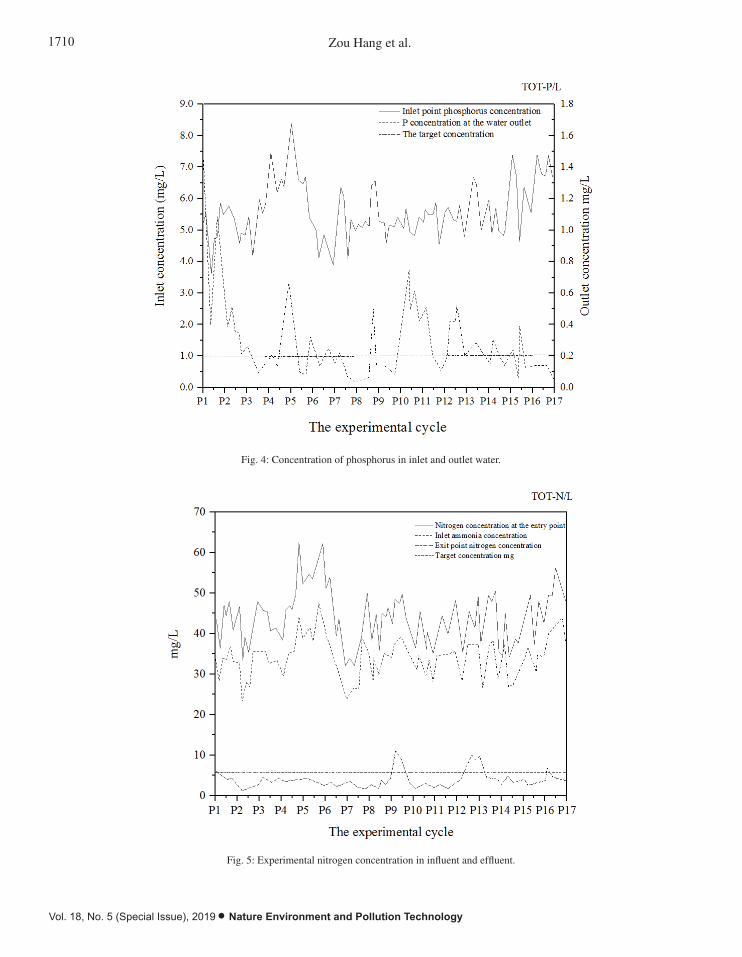
1710 Zou Hang et al.
Vol. 18, No. 5 (Special Issue), 2019 • Nature Environment and Pollution Technology
Fig. 5: Experimental nitrogen concentration in influent and effluent.
Fig. 4: Concentration of phosphorus in inlet and outlet water.
Fig. 5: Experimental nitrogen concentration in influent and effluent.
Fig. 4: Concentration of phosphorus in inlet and outlet water.
1711WATER POLLUTION IN OLD TOWNS AFFECTING THE ENVIRONMENT
Nature Environment and Pollution Technology • Vol. 18, No. 5 (Special Issue), 2019
contact with the atmosphere, because in the sewage treatment environment, it is almost impossible to absolutely guarantee that the sample is free from external pollution. No single elastic particles (100% removal efficiency) were detected in the MBR effluent bodies, while the effluent from the full-size CAS process consisted of a final sand filter containing plastic fibres and plastic debris (90.7% removal efficiency).Non-syn-thetic fibres were found in both MBR and the treated water by the universal activated sludge process (CAS).Analysis of drug residues in the MBR effluent water showed similar lev-els to those in the CAS effluent water (except amlodipine and sertralin, which were reduced to slightly higher levels during the MBR process). This indicated that the effect of MBR on drug removal was not increased compared with the CAS method. Other microorganisms and estrogen effects in MBR effluent water were treated with ozonation or total coliform supplementation. All microorganisms sampled and measured can only be removed by more than 90% through the supple-mental treatment step. The phenolic compounds triclosan and bisphenol A studied in the experiment were reduced below the detection threshold by ozonation or biological activity filter. Approximately 80% of total coliforms were ozonated in the treated MBR effluents and approximately 85% were treated with bioactive filter technology. Compared with the low cost of similar CAS treatment of microorganisms in the effluent water, a certain amount of ozone dose is required in the membrane treatment experiment to achieve a high reduction of the persistent substances during the ozonization period, and the bioactive filter needs to increase the washing frequency of the filter membrane in the treatment of MBR effluent water. However, both of these aspects increase the cost of membrane bioreactor-based wastewater treatment to some extent.
CONCLUSION
The wastewater treatment experiment of membrane bio-reactor shows that the treatment quality of this device can reach the phosphorus concentration < 0.2mg /L and nitrogen concentration < 6mg /L under different sewage treatment loads. At the same time, experiments show that relatively high precipitated chemicals and external carbon dose are required under the maximum sewage treatment load. The membrane exhibited high average permeability and the suspended solids were completely removed in the whole
experimental cycle. Therefore, bioremediation technology is a technology with broad development space. Although there are some limitations, but it has less investment, small impact on the environment, the permanent elimination of pollutants and other technology cannot be compared with the advantages. Although the landscape water body is a small water body system, according to the specific conditions, it will be a better development direction for the future landscape water pollution control to adopt the optimization combination method with the core of bio-ecology technology.
REFERENCES
Chen, H., Zuo, Q. T., and Zhang, Y. Y. 2017. Preliminary results of water quality assessment using phytoplankton and physicochemical approach-es in the Huai river basin, China. Water Science and Technology A Journal of the International Association on Water Pollution Research, 76(9): 2554.
Garner, E., Mclain, J., Bowers, J., David M. Engelthaler, Marc A. Edwards, and Amy Pruden 2018. Microbial ecology and water chemistry impact regrowth of opportunistic pathogens in full-scale reclaimed water distribution systems. Environmental Science and Technology, 52(16): 9056-9068.
Kalogianni, E., Vourka, A., Karaouzas, I., Vardakas, L., Laschou, S., and Skoulikidis, N. T. 2017. Combined effects of water stress and pollu-tion on macroinvertebrate and fish assemblages in a Mediterranean intermittent river. Science of the Total Environment, 603-604: 639.
Koch, J. C., Carey, M., O’Donnell, J., Sjoberg, Y., and Zimmerman, C. E. 2018. Changing Groundwater-Surface Water Interactions Impact Stream Chemistry and Ecology at the Arctic-Boreal Transition in Western Alaska. In: AGU Fall Meeting Abstracts.
Martínezalcalá, I., Pellicermartínez, F., and Fernándezlópez, C. 2018. Phar-maceutical grey water footprint: accounting, influence of wastewater treatment plants and implications of the reuse. Water Research, 135: 278-287.
Matta, G., Kumar, A., Kumar, A., Naik, P. K., Kumar, A., and Srivastava, N. 2018. Assessment of heavy metals toxicity and ecological impact on surface water quality using HPI in Ganga river. INAE Letters, 2: 1-7.
Stanford, B., Zavaleta, E., and Millard-Ball, A. 2018. Where and why does restoration happen? Ecological and socio-political influences on stream restoration in coastal California. Biological Conservation, 221: 219-227.
Tao, Y., Lei, K., and Xia, J. 2017. Main hydrodynamic factors identification for pollutant transport in sudden water pollution accident in Shenzhen bay. Advances in Water Science.
Yang, S., Zhao, W., Liu, Y., Wang, S., Wang, J., and Zhai, R. 2018) Influence of land use change on the ecosystem service trade-offs in the ecolog-ical restoration area: dynamics and scenarios in the Yanhe watershed, China. Science of The Total Environment, 644: 556-566.
Zhou, T., Akiyama, T., Horita, M., Kharrazi, A., Kraines, S., and Jia, L. 2018. The impact of ecological restoration projects in dry lands: data-based assessment and human perceptions in the lower reaches of Heihe river basin, China. Sustainability, 10(5): 1471-1487.

Vol. 18, No. 5 (Special Issue), 2019 • Nature Environment and Pollution Technology
1712

Application of Rb/Sr Ratio in Paleo-climate Inversion
Shupei Ouyang*, Muhammad Aqeel Ashraf** and Yung-Tse Hung****Chengdu University of Technology, Chengdu, 610059, China**China University of Geosciences, Wuhan, China***Department of Civil and Environmental Engineering, Cleveland State University, Cleveland, Ohio, 44115 USA
ABSTRACT
In order to study the intensity of chemical weathering during the formation of sedimentary strata in the site profile, the evolution of climatic environment in the region where the site profile is located was revealed. The rubidium (Rb) and strontium (Sr) values in the rubidium (Rb) and strontium (Sr) were tested and analysed. The Rb/Sr ratio has become an ideal alternative indicator in the study of regional environmental evolution. The Rb value in the strata section of Zhongba site is low, and the average value (calculated based on 202 sample values) is only 80 g/g. The Sr value was higher, averaging 866 g/g. The average Rb/Sr ratio is 0.19.
INTRODUCTION
Since the quaternary period, the world has experienced many important climate changes, which had an important impact on the formation of modern climate and the formation and development of early human society. There are a variety of research methods for paleoclimate and paleo environment, among which geochemical parameters are one of the im-portant indexes for the study of climate and environmental evolution. Rb and Sr elements are widely used in the study of paleo environmental changes due to their unique geo-chemical properties in the supergene environment (Chen et al. 2017). Rb is a typical dispersed element, which is mainly distributed in all kinds of rock-building minerals in the form of homogeneity in nature, rarely forming independent min-erals. According to the geochemical characteristics of Rb+, the ion radius is relatively large (147 PM), which is close to that of K+(123 PM). Therefore, Rb is mainly dispersed in minerals containing K in the form of homogeneity and image in various rocks, such as biotite, muscovite and potash feldspar. In the process of supergene weathering, these min-erals are decomposed and release Rb, and the released Rb is easily adsorbed by the clay rich in K, only a small part of it is transported or leached, which determines that Rb cannot have a very strong leaching migration during weathering into soil (Fei et al. 2017). Sr is also a typical dispersed element. The ionic radius (112 PM) of Sr2+ is between Ca2+(99 PM) and K+(123pm), and it is often found in calcite, plagioclase, potash feldspar, mica and other minerals as trace elements in nature. Since the geochemical behaviour of Sr2+ in the supergene environment is more similar to that of Ca2+, it is
easier to migrate with soil solution or surface water in the form of free Sr (mainly in the form of carbonate), resulting in a large amount of Sr in the formation being leached. The geochemical properties of Rb and Sr determines that the su-pergene geochemical behaviour not only has a certain degree of similarity, but also embodies the supergene geochemical behaviour of the differences between the two, although certain condition of climate environment both showed a different degree of leaching migration patterns, but the Sr leaching transference is higher than Rb (Oster et al. 2017).
The innovation of this paper is to select the typical sec-tion stratum of Zhongba site to test and analyse Rb, Sr and Rb/Sr ratio, and study the intensity of chemical weathering in the formation process of the sedimentary stratum of the site section, so as to reveal the climatic and environmental evolution of the area where the site section is located since the middle and late Holocene in the Three Gorges area of the Yangtze river.
EARLIER STUDIES
Rb/Sr ratio in the loess, paleosol and application in lake sediments in the early 1960s, western scholars through the study found that Rb/Sr ratio can reflect the parent rock weathering degree. Martin-Chivelet et al. (2017) applied theRb, Sr element to the loess in the study of ancient cli-mate and lake sediments. The Rb/Sr ratio has become a regional climate environment evolution in the study of ideal alternative indicators. Rubidium (Rb) and strontium (Sr) are trace elements with obvious difference and connection in geochemical behaviour. Carlson et al. (2018) have carried
Nat. Env. & Poll. Tech.Website: www.neptjournal.com
Received: 06-08-2019 Accepted: 21-10-2019
Key Words:Rb/Sr ratio Paleoclimate Environmental evolution
2019pp. 1713-1718 Vol. 18
p-ISSN: 0972-6268 No. 5 (Special Issue)
Nature Environment and Pollution Technology An International Quarterly Scientific Journal
Original Research Paper
e-ISSN: 2395-3454
Open Access
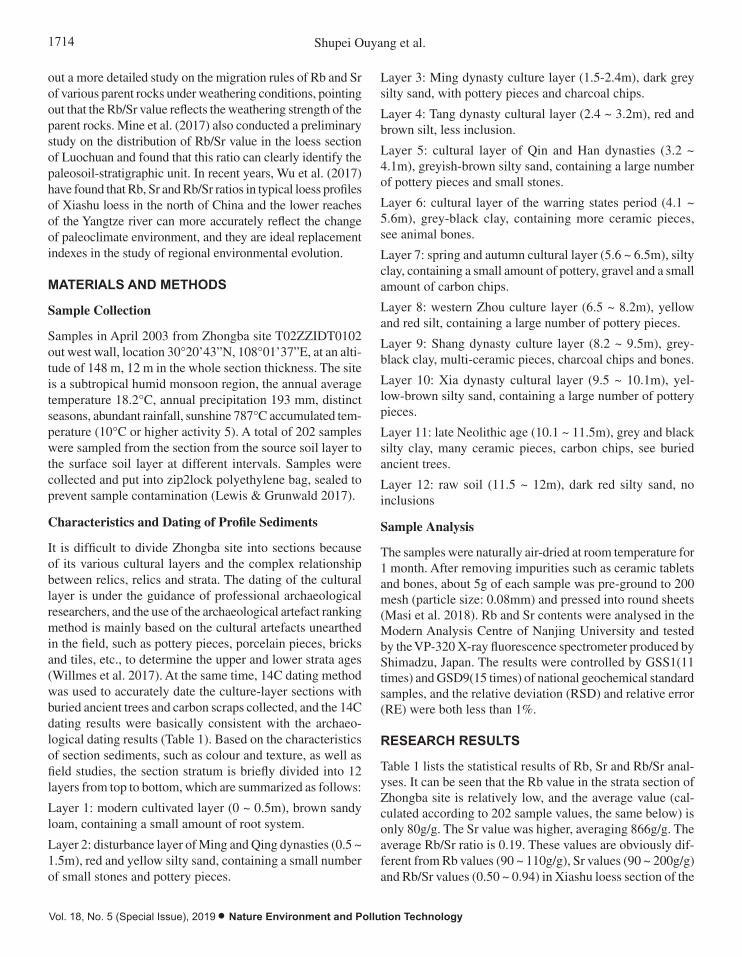
1714 Shupei Ouyang et al.
Vol. 18, No. 5 (Special Issue), 2019 • Nature Environment and Pollution Technology
out a more detailed study on the migration rules of Rb and Sr of various parent rocks under weathering conditions, pointing out that the Rb/Sr value reflects the weathering strength of the parent rocks. Mine et al. (2017) also conducted a preliminary study on the distribution of Rb/Sr value in the loess section of Luochuan and found that this ratio can clearly identify the paleosoil-stratigraphic unit. In recent years, Wu et al. (2017) have found that Rb, Sr and Rb/Sr ratios in typical loess profiles of Xiashu loess in the north of China and the lower reaches of the Yangtze river can more accurately reflect the change of paleoclimate environment, and they are ideal replacement indexes in the study of regional environmental evolution.
MATERIALS AND METHODS
Sample Collection
Samples in April 2003 from Zhongba site T02ZZIDT0102 out west wall, location 30°20’43”N, 108°01’37”E, at an alti-tude of 148 m, 12 m in the whole section thickness. The site is a subtropical humid monsoon region, the annual average temperature 18.2°C, annual precipitation 193 mm, distinct seasons, abundant rainfall, sunshine 787°C accumulated tem-perature (10°C or higher activity 5). A total of 202 samples were sampled from the section from the source soil layer to the surface soil layer at different intervals. Samples were collected and put into zip2lock polyethylene bag, sealed to prevent sample contamination (Lewis & Grunwald 2017).
Characteristics and Dating of Profile Sediments
It is difficult to divide Zhongba site into sections because of its various cultural layers and the complex relationship between relics, relics and strata. The dating of the cultural layer is under the guidance of professional archaeological researchers, and the use of the archaeological artefact ranking method is mainly based on the cultural artefacts unearthed in the field, such as pottery pieces, porcelain pieces, bricks and tiles, etc., to determine the upper and lower strata ages (Willmes et al. 2017). At the same time, 14C dating method was used to accurately date the culture-layer sections with buried ancient trees and carbon scraps collected, and the 14C dating results were basically consistent with the archaeo-logical dating results (Table 1). Based on the characteristics of section sediments, such as colour and texture, as well as field studies, the section stratum is briefly divided into 12 layers from top to bottom, which are summarized as follows:
Layer 1: modern cultivated layer (0 ~ 0.5m), brown sandy loam, containing a small amount of root system.
Layer 2: disturbance layer of Ming and Qing dynasties (0.5 ~ 1.5m), red and yellow silty sand, containing a small number of small stones and pottery pieces.
Layer 3: Ming dynasty culture layer (1.5-2.4m), dark grey silty sand, with pottery pieces and charcoal chips.
Layer 4: Tang dynasty cultural layer (2.4 ~ 3.2m), red and brown silt, less inclusion.
Layer 5: cultural layer of Qin and Han dynasties (3.2 ~ 4.1m), greyish-brown silty sand, containing a large number of pottery pieces and small stones.
Layer 6: cultural layer of the warring states period (4.1 ~ 5.6m), grey-black clay, containing more ceramic pieces, see animal bones.
Layer 7: spring and autumn cultural layer (5.6 ~ 6.5m), silty clay, containing a small amount of pottery, gravel and a small amount of carbon chips.
Layer 8: western Zhou culture layer (6.5 ~ 8.2m), yellow and red silt, containing a large number of pottery pieces.
Layer 9: Shang dynasty culture layer (8.2 ~ 9.5m), grey-black clay, multi-ceramic pieces, charcoal chips and bones.
Layer 10: Xia dynasty cultural layer (9.5 ~ 10.1m), yel-low-brown silty sand, containing a large number of pottery pieces.
Layer 11: late Neolithic age (10.1 ~ 11.5m), grey and black silty clay, many ceramic pieces, carbon chips, see buried ancient trees.
Layer 12: raw soil (11.5 ~ 12m), dark red silty sand, no inclusions
Sample Analysis
The samples were naturally air-dried at room temperature for 1 month. After removing impurities such as ceramic tablets and bones, about 5g of each sample was pre-ground to 200 mesh (particle size: 0.08mm) and pressed into round sheets (Masi et al. 2018). Rb and Sr contents were analysed in the Modern Analysis Centre of Nanjing University and tested by the VP-320 X-ray fluorescence spectrometer produced by Shimadzu, Japan. The results were controlled by GSS1(11 times) and GSD9(15 times) of national geochemical standard samples, and the relative deviation (RSD) and relative error (RE) were both less than 1%.
RESEARCH RESULTS
Table 1 lists the statistical results of Rb, Sr and Rb/Sr anal-yses. It can be seen that the Rb value in the strata section of Zhongba site is relatively low, and the average value (cal-culated according to 202 sample values, the same below) is only 80g/g. The Sr value was higher, averaging 866g/g. The average Rb/Sr ratio is 0.19. These values are obviously dif-ferent from Rb values (90 ~ 110g/g), Sr values (90 ~ 200g/g) and Rb/Sr values (0.50 ~ 0.94) in Xiashu loess section of the
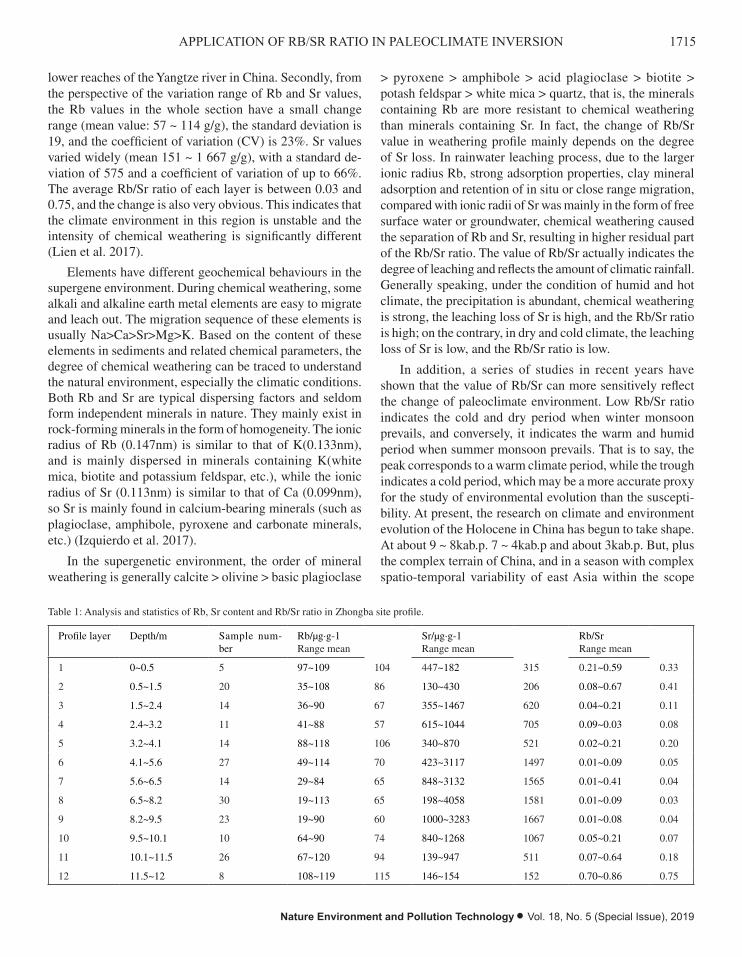
1715APPLICATION OF RB/SR RATIO IN PALEOCLIMATE INVERSION
Nature Environment and Pollution Technology • Vol. 18, No. 5 (Special Issue), 2019
lower reaches of the Yangtze river in China. Secondly, from the perspective of the variation range of Rb and Sr values, the Rb values in the whole section have a small change range (mean value: 57 ~ 114 g/g), the standard deviation is 19, and the coefficient of variation (CV) is 23%. Sr values varied widely (mean 151 ~ 1 667 g/g), with a standard de-viation of 575 and a coefficient of variation of up to 66%. The average Rb/Sr ratio of each layer is between 0.03 and 0.75, and the change is also very obvious. This indicates that the climate environment in this region is unstable and the intensity of chemical weathering is significantly different (Lien et al. 2017).
Elements have different geochemical behaviours in the supergene environment. During chemical weathering, some alkali and alkaline earth metal elements are easy to migrate and leach out. The migration sequence of these elements is usually Na>Ca>Sr>Mg>K. Based on the content of these elements in sediments and related chemical parameters, the degree of chemical weathering can be traced to understand the natural environment, especially the climatic conditions. Both Rb and Sr are typical dispersing factors and seldom form independent minerals in nature. They mainly exist in rock-forming minerals in the form of homogeneity. The ionic radius of Rb (0.147nm) is similar to that of K(0.133nm), and is mainly dispersed in minerals containing K(white mica, biotite and potassium feldspar, etc.), while the ionic radius of Sr (0.113nm) is similar to that of Ca (0.099nm), so Sr is mainly found in calcium-bearing minerals (such as plagioclase, amphibole, pyroxene and carbonate minerals, etc.) (Izquierdo et al. 2017).
In the supergenetic environment, the order of mineral weathering is generally calcite > olivine > basic plagioclase
> pyroxene > amphibole > acid plagioclase > biotite > potash feldspar > white mica > quartz, that is, the minerals containing Rb are more resistant to chemical weathering than minerals containing Sr. In fact, the change of Rb/Sr value in weathering profile mainly depends on the degree of Sr loss. In rainwater leaching process, due to the larger ionic radius Rb, strong adsorption properties, clay mineral adsorption and retention of in situ or close range migration, compared with ionic radii of Sr was mainly in the form of free surface water or groundwater, chemical weathering caused the separation of Rb and Sr, resulting in higher residual part of the Rb/Sr ratio. The value of Rb/Sr actually indicates the degree of leaching and reflects the amount of climatic rainfall. Generally speaking, under the condition of humid and hot climate, the precipitation is abundant, chemical weathering is strong, the leaching loss of Sr is high, and the Rb/Sr ratio is high; on the contrary, in dry and cold climate, the leaching loss of Sr is low, and the Rb/Sr ratio is low.
In addition, a series of studies in recent years have shown that the value of Rb/Sr can more sensitively reflect the change of paleoclimate environment. Low Rb/Sr ratio indicates the cold and dry period when winter monsoon prevails, and conversely, it indicates the warm and humid period when summer monsoon prevails. That is to say, the peak corresponds to a warm climate period, while the trough indicates a cold period, which may be a more accurate proxy for the study of environmental evolution than the suscepti-bility. At present, the research on climate and environment evolution of the Holocene in China has begun to take shape. At about 9 ~ 8kab.p. 7 ~ 4kab.p and about 3kab.p. But, plus the complex terrain of China, and in a season with complex spatio-temporal variability of east Asia within the scope
Table 1: Analysis and statistics of Rb, Sr content and Rb/Sr ratio in Zhongba site profile.
Profile layer Depth/m Sample num-ber
Rb/μg·g-1Range mean
Sr/μg·g-1Range mean
Rb/SrRange mean
1 0~0.5 5 97~109 104 447~182 315 0.21~0.59 0.33
2 0.5~1.5 20 35~108 86 130~430 206 0.08~0.67 0.41
3 1.5~2.4 14 36~90 67 355~1467 620 0.04~0.21 0.11
4 2.4~3.2 11 41~88 57 615~1044 705 0.09~0.03 0.08
5 3.2~4.1 14 88~118 106 340~870 521 0.02~0.21 0.20
6 4.1~5.6 27 49~114 70 423~3117 1497 0.01~0.09 0.05
7 5.6~6.5 14 29~84 65 848~3132 1565 0.01~0.41 0.04
8 6.5~8.2 30 19~113 65 198~4058 1581 0.01~0.09 0.03
9 8.2~9.5 23 19~90 60 1000~3283 1667 0.01~0.08 0.04
10 9.5~10.1 10 64~90 74 840~1268 1067 0.05~0.21 0.07
11 10.1~11.5 26 67~120 94 139~947 511 0.07~0.64 0.18
12 11.5~12 8 108~119 115 146~154 152 0.70~0.86 0.75
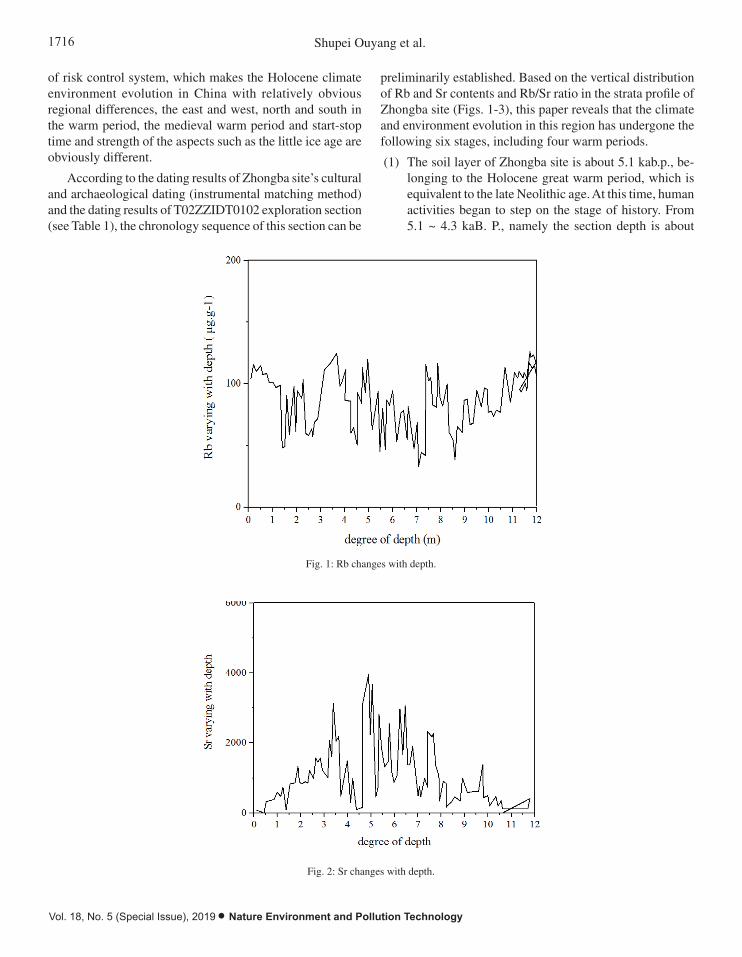
1716 Shupei Ouyang et al.
Vol. 18, No. 5 (Special Issue), 2019 • Nature Environment and Pollution Technology
of risk control system, which makes the Holocene climate environment evolution in China with relatively obvious regional differences, the east and west, north and south in the warm period, the medieval warm period and start-stop time and strength of the aspects such as the little ice age are obviously different.
According to the dating results of Zhongba site’s cultural and archaeological dating (instrumental matching method) and the dating results of T02ZZIDT0102 exploration section (see Table 1), the chronology sequence of this section can be
preliminarily established. Based on the vertical distribution of Rb and Sr contents and Rb/Sr ratio in the strata profile of Zhongba site (Figs. 1-3), this paper reveals that the climate and environment evolution in this region has undergone the following six stages, including four warm periods.
(1) The soil layer of Zhongba site is about 5.1 kab.p., be-longing to the Holocene great warm period, which is equivalent to the late Neolithic age. At this time, human activities began to step on the stage of history. From 5.1 ~ 4.3 kaB. P., namely the section depth is about
Fig. 1: Rb changes with depth.
Fig. 2: Sr changes with depth.
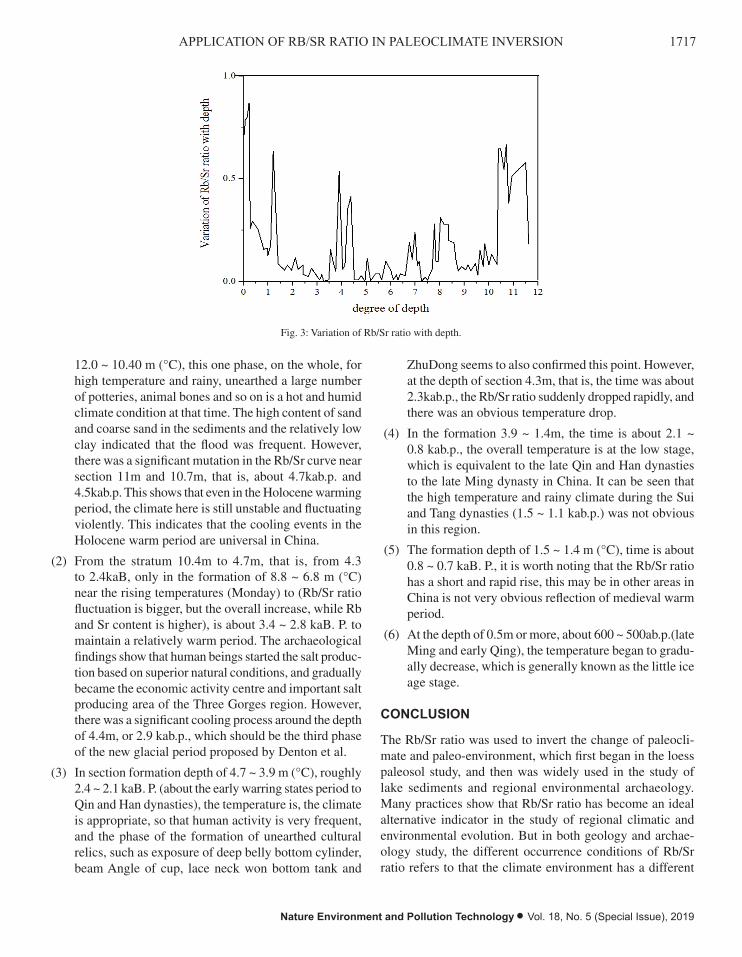
1717APPLICATION OF RB/SR RATIO IN PALEOCLIMATE INVERSION
Nature Environment and Pollution Technology • Vol. 18, No. 5 (Special Issue), 2019
12.0 ~ 10.40 m (°C), this one phase, on the whole, for high temperature and rainy, unearthed a large number of potteries, animal bones and so on is a hot and humid climate condition at that time. The high content of sand and coarse sand in the sediments and the relatively low clay indicated that the flood was frequent. However, there was a significant mutation in the Rb/Sr curve near section 11m and 10.7m, that is, about 4.7kab.p. and 4.5kab.p. This shows that even in the Holocene warming period, the climate here is still unstable and fluctuating violently. This indicates that the cooling events in the Holocene warm period are universal in China.
(2) From the stratum 10.4m to 4.7m, that is, from 4.3 to 2.4kaB, only in the formation of 8.8 ~ 6.8 m (°C) near the rising temperatures (Monday) to (Rb/Sr ratio fluctuation is bigger, but the overall increase, while Rb and Sr content is higher), is about 3.4 ~ 2.8 kaB. P. to maintain a relatively warm period. The archaeological findings show that human beings started the salt produc-tion based on superior natural conditions, and gradually became the economic activity centre and important salt producing area of the Three Gorges region. However, there was a significant cooling process around the depth of 4.4m, or 2.9 kab.p., which should be the third phase of the new glacial period proposed by Denton et al.
(3) In section formation depth of 4.7 ~ 3.9 m (°C), roughly 2.4 ~ 2.1 kaB. P. (about the early warring states period to Qin and Han dynasties), the temperature is, the climate is appropriate, so that human activity is very frequent, and the phase of the formation of unearthed cultural relics, such as exposure of deep belly bottom cylinder, beam Angle of cup, lace neck won bottom tank and
ZhuDong seems to also confirmed this point. However, at the depth of section 4.3m, that is, the time was about 2.3kab.p., the Rb/Sr ratio suddenly dropped rapidly, and there was an obvious temperature drop.
(4) In the formation 3.9 ~ 1.4m, the time is about 2.1 ~ 0.8 kab.p., the overall temperature is at the low stage, which is equivalent to the late Qin and Han dynasties to the late Ming dynasty in China. It can be seen that the high temperature and rainy climate during the Sui and Tang dynasties (1.5 ~ 1.1 kab.p.) was not obvious in this region.
(5) The formation depth of 1.5 ~ 1.4 m (°C), time is about 0.8 ~ 0.7 kaB. P., it is worth noting that the Rb/Sr ratio has a short and rapid rise, this may be in other areas in China is not very obvious reflection of medieval warm period.
(6) At the depth of 0.5m or more, about 600 ~ 500ab.p.(late Ming and early Qing), the temperature began to gradu-ally decrease, which is generally known as the little ice age stage.
CONCLUSION
The Rb/Sr ratio was used to invert the change of paleocli-mate and paleo-environment, which first began in the loess paleosol study, and then was widely used in the study of lake sediments and regional environmental archaeology. Many practices show that Rb/Sr ratio has become an ideal alternative indicator in the study of regional climatic and environmental evolution. But in both geology and archae-ology study, the different occurrence conditions of Rb/Sr ratio refers to that the climate environment has a different
Fig. 3: Variation of Rb/Sr ratio with depth.

1718 Shupei Ouyang et al.
Vol. 18, No. 5 (Special Issue), 2019 • Nature Environment and Pollution Technology
degree of difference and Rb/Sr ratio in the process of spe-cific research along with the soil magnetic susceptibility, sediment particle size, clay mineral, heavy mineral analysis and various environmental parameters recorded commonly used in paleoclimate and paleo-environment study, improve the science and accuracy.
REFERENCES
Carlson, P. E., Miller, N. R., Banner, J. L. 2018. The potential of near-en-trance stalagmites as high-resolution terrestrial paleoclimate proxies: Application of isotope and trace-element geochemistry to seasonally-re-solved chronology. Geochimica Et Cosmochimica Acta, 235: 55-75.
Chen, J.H., Feiya, L.V., Huang, X.Z., Birks, H.J.B., Telford, R.J., and Zhang, S.R. 2017. A novel procedure for pollen-based quantitative paleoclimate reconstructions and its application in China. Science China Earth Sciences, 60(11): 1-8.
Fei, G., Hao, T., Yue, L., Liu, X., Zhang, D., and Zhang, X. 2017. Evidence for paleoclimate changes from lignin records of sediment core a02 in the southern yellow sea since~9.5 cal.kyr b.p. Palaeogeography Palae-oclimatology Palaeoecology, 479: S0031018216307350.
Izquierdo, T., Abad, M., and Larrondo, L. 2017. Paleohydrology of late quaternary floods in the Atacama Desert and their paleoclimate impli-cations. European Geosciences Union General Assembly.
Lewis, N., and Grünwald, P. 2017. Objectively combining ar5 instrumental period and paleoclimate climate sensitivity evidence. Climate Dynamics
(D19), 1-18.Lien, W.Y., Li, H.C., and Mii, H.S. 2017. Paleoclimate reconstruction of
Guangxi in SW China during the past 2000-year: Stalagmite Records from Two Caves. Agu Fall Meeting.
Martín-Chivelet, J., Muñoz-García, M.B., Cruz, J.A., Ortega, A.I., and Turrero, M.J. 2017. Speleothem architectural analysis: integrated approach for stalagmite-based paleoclimate research. Sedimentary Geology, 353: 28-45.
Masi, A., Francke, A., Pepe, C., Thienemann, M., Wagner, B., and Sadori, L. 2018. Vegetation history and paleoclimate at lake Dojran (Fyrom/Greece) during the late glacial and holocene. Climate of the Past, 14(3): 1-25.
Mine, A.H., Waldeck, A., Olack, G., Hoerner, M.E., Alex, S., and Colman, A.S. 2017. Microprecipitation and δ18o analysis of phosphate for paleoclimate and biogeochemistry research. Chemical Geology, 460: S0009254117301730.
Oster, J.L., Kitajima, K., Valley, J.W., Rogers, B., and Maher, K. 2017. An evaluation of paired δ18o and (234 u/238 u) 0 in opal as a tool for paleoclimate reconstruction in semi-arid environments. Chemical Geology, 449: 236-252.
Willmes, C., Becker, D., Brocks, S., Hütt, C., and Bareth, G. 2017. High resolution KöppenδGeiger classifications of paleoclimate simulations. Transactions in GIS, 21(1): 57-73.
Wu, X., Li, R., Hu, J., Li, D., Zhao, B., and Liu, F. 2017. Late paleogene saline lake evolution of the Ningnan basin and its response to the regional paleoclimate and uplift of the Tibetan plateau: evidence from sedimentary strata, and s and sr isotopes. Geological Journal, 53: 405-416.
Research on Coal Mine Gas Concentration Prediction Based on Cloud Computing Technology Under the Background of Internet
Lei Wang, Wei Li and Yan LiHebei Institute of Communications, Shijiazhuang Hebei, 051430, China
ABSTRACT
With the continuous expansion of the scale of gas concentration data, in order to meet the requirements of mass data processing, this paper used the strong advantages of cloud computing in the processing of large data sets to build the framework of coal mine gas concentration under the cloud platform, proposed a genetic optimization Elma neural network model based on cloud computing, and carried out experiments based on the massive data of a coal mine in Tangshan. It has been proved that its mean square error is basically stable within 0.05, reaching the acceptable error range. This algorithm is both efficient and feasible in short-term prediction of coal mine gas concentration.
INTRODUCTION
Coal has long been China’s main energy source and will continue to occupy an important position in the long term. In China, most of the coal production is underground mining, the mine environment is complex and changeable, and the threat of natural disasters such as water, gas, fire, geothermal heat and dust has caused frequent gas accidents. Gas disasters not only seriously endanger the lives of employees, but also have a very bad impact on coal production (Yuan et al. 2018, Qiang et al. 2018). As a key indicator for evaluating coal mine safety production, real-time and accurate prediction of gas concentration can provide a strong guarantee for coal mine production.
With the rise of the Internet of Things and the rise of the mobile internet, coal mining companies have already experi-enced data explosions. Traditional algorithms are extremely inferior in the processing of massive data and will continue to increase with the amount of computation, and eventually collapse due to insufficient resources. Cloud computing, represented by the Map reduce distributed platform, can simultaneously use multiple processors for parallel com-puting and distributed processing, with huge storage space, ultra-large processing speed and many other advantages. In the cloud computing mode, the data acquisition layer con-tinuously collects various gas-related monitoring data from the downhole, and the amount of data in the intermediate process of the prediction system can be up to 1PB per day. In this paper, cloud computing is applied to the prediction
of gas concentration. The Elman neural network is used to establish the gas prediction model. Since it is difficult to ob-tain the global optimal solution by using the gradient descent method for network training, it is proposed to optimize the nerve with genetic algorithm (GA). The weights and thresh-olds of the network, and based on cloud computing big data processing techniques, speed up network convergence and generate thresholds. Based on the massive data of a mining area in Tangshan City, the experimental results show that the algorithm is efficient and feasible in the short-term predic-tion of massive gas concentration data, and the prediction accuracy is guaranteed.
EARLIER STUDIES
Over the years, the theory and methods of gas concentration prediction have emerged. Zhao et al. (2016) have fully studied the influence of gas concentration on coal safety accidents and the principle of gas sensors, and used self-correction technology to improve the accuracy of gas sensor measure-ment data. After fully studying the working environment of coal mine equipment. A study established a wireless sensor network management system for coal mine on-site using a wireless sensor network with simpler structure and higher transmission efficiency, which improved the reliability of coal mine equipment (Lin et al. 2015, Temel et al. 2018). A study built a real-time flow data processing framework spark streaming to construct a real-time prediction system for gas concentration based on flow regression (Che et al. 2017).
Nat. Env. & Poll. Tech.Website: www.neptjournal.com
Received: 31-08-2019 Accepted: 27-10-2019
Key Words:Coal mine Gas concentration Elma neural network Genetic algorithm Cloud computing
2019pp. 1719-1725 Vol. 18
p-ISSN: 0972-6268 No. 5 (Special Issue)
Nature Environment and Pollution Technology An International Quarterly Scientific Journal
Original Research Paper
e-ISSN: 2395-3454
Open Access
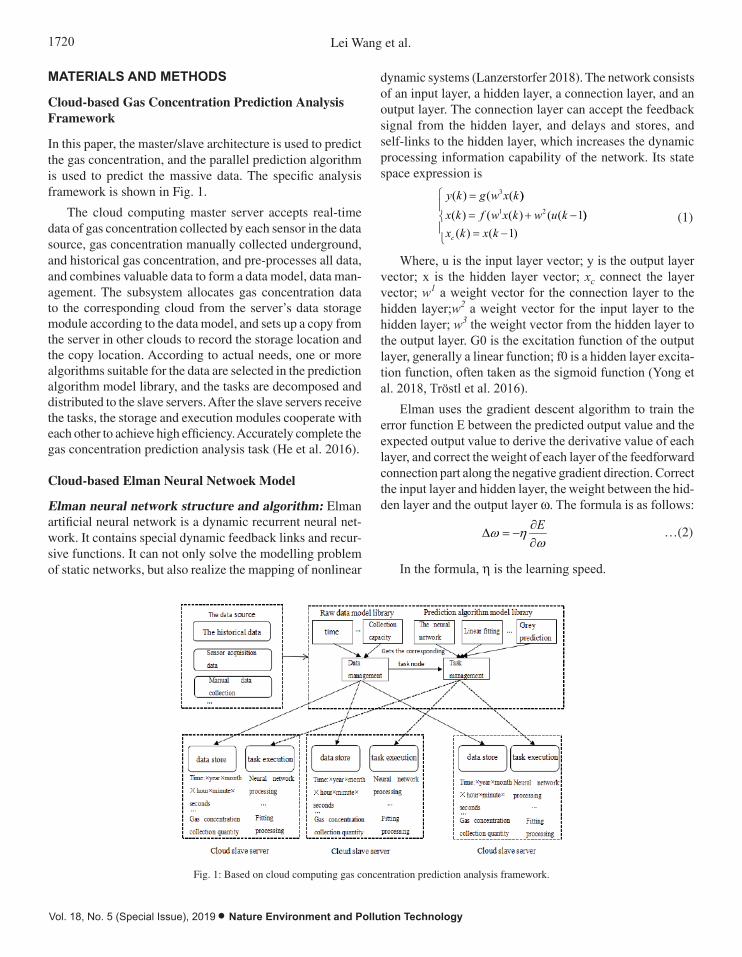
1720 Lei Wang et al.
Vol. 18, No. 5 (Special Issue), 2019 • Nature Environment and Pollution Technology
MATERIALS AND METHODS
Cloud-based Gas Concentration Prediction Analysis Framework
In this paper, the master/slave architecture is used to predict the gas concentration, and the parallel prediction algorithm is used to predict the massive data. The specific analysis framework is shown in Fig. 1.
The cloud computing master server accepts real-time data of gas concentration collected by each sensor in the data source, gas concentration manually collected underground, and historical gas concentration, and pre-processes all data, and combines valuable data to form a data model, data man-agement. The subsystem allocates gas concentration data to the corresponding cloud from the server’s data storage module according to the data model, and sets up a copy from the server in other clouds to record the storage location and the copy location. According to actual needs, one or more algorithms suitable for the data are selected in the prediction algorithm model library, and the tasks are decomposed and distributed to the slave servers. After the slave servers receive the tasks, the storage and execution modules cooperate with each other to achieve high efficiency. Accurately complete the gas concentration prediction analysis task (He et al. 2016).
Cloud-based Elman Neural Netwoek Model
Elman neural network structure and algorithm: Elman artificial neural network is a dynamic recurrent neural net-work. It contains special dynamic feedback links and recur-sive functions. It can not only solve the modelling problem of static networks, but also realize the mapping of nonlinear
dynamic systems (Lanzerstorfer 2018). The network consists of an input layer, a hidden layer, a connection layer, and an output layer. The connection layer can accept the feedback signal from the hidden layer, and delays and stores, and self-links to the hidden layer, which increases the dynamic processing information capability of the network. Its state space expression is
−=−+=
=
)1()())1(()(()(
))(()(21
3
kxkxkuwkxwfkx
kxwgky
c
(1)
Where, u is the input layer vector; y is the output layer vector; x is the hidden layer vector; xc connect the layer vector; w1 a weight vector for the connection layer to the hidden layer;w2 a weight vector for the input layer to the hidden layer; w3 the weight vector from the hidden layer to the output layer. G0 is the excitation function of the output layer, generally a linear function; f0 is a hidden layer excita-tion function, often taken as the sigmoid function (Yong et al. 2018, Tröstl et al. 2016).
Elman uses the gradient descent algorithm to train the error function E between the predicted output value and the expected output value to derive the derivative value of each layer, and correct the weight of each layer of the feedforward connection part along the negative gradient direction. Correct the input layer and hidden layer, the weight between the hid-den layer and the output layer w. The formula is as follows:
ω
ηω∂∂
−=∆E
…(2)
In the formula, h is the learning speed.
Fig. 1: Based on cloud computing gas concentration prediction analysis framework.
1721COAL MINE GAS CONCENTRATION PREDICTION BASED ON CLOUD COMPUTING
Nature Environment and Pollution Technology • Vol. 18, No. 5 (Special Issue), 2019
Genetic algorithm optimized Elman neural network: Genet-ic algorithm is a parallel randomized search optimal solution which simulates the evolution process of biology in nature. It can be summarized as two operations: genetic operation (cross and mutation) and evolutionary operation (selection).
The genetic optimization Elman neural network first uses the genetic algorithm to find the optimal solution of the connection weight and threshold, and feeds it back into the network, and the optimal solution is obtained through sample training. Specific steps are as follows:
1. The weights and thresholds of the Elman neural net-work are randomly generated as the initial population individuals, and each individual is a binary coded symbol string form in which the connection weights of the layers are connected in a certain order with the threshold. Set the population size to N, the probability of hybridization pc and variation probability pm as the algorithm parameters.
2. Perform network learning, and the learning error e is taken as the fitness f after taking the reciprocal.
( )
−== ∑∑
==
M
k
pk
pk
N
PoyEF
1
2
121/1/1 …(3)
The fitness function F is the basis for evaluating the pros and cons of individuals in the population. Where y and o are the actual and expected values of the neural network, respectively; p is the individual label and k is the output node label.
3. Individuals with higher fitness carry good genes, have good adaptability in inheritance, and have a greater chance of producing excellent offspring. Individuals with large fitness values are selected as genetic parents with a certain probability.
The probability that the i-th individual is selected as a genetic parent:
∑=
=N
iiii FFP
1/ …(4)
4. The individual’s reproductive process, the selected su-perior individuals are single-point crossover operation, and the intermediate individuals are obtained, and the basic position mutation operation is performed, that is, several genetic position points are randomly selected and inverted by the probability pm to generate a new generation genetic group.
5. When the set number of iterations or iteration precision is satisfied, the optimization process is ended, and the optimized solution obtained by the search is decoded and used as the weight and threshold of the Elman neural network. After the training iteration, the weights and
thresholds are updated again, and the prediction results of the network are output.
Cloud-based GA-Enn algorithm implementation: When genetic algorithm is used to optimize the neural network, if the individual data of the population is selected, the process of calculating the individual fitness value will consume a lot of time. This article uses Hadoop, the most popular open source cloud computing platform, to parallelize the genetic algorithm, which greatly saves the operation time. It is mainly composed of HDFS (Distributed File System) and Map Reduce. HDFS adopts master/slave architecture. HDFS cluster consists of a Namenode (management node) and several Datanodes (data nodes). Map Reduce is a par-allel programming mode, including the Map phase and the Reduce phase. In the Map phase, each node server takes the split data block split as input and executes the map function on all records in each block to generate intermediate results.
The <key, value> key-value pair, in the Reduce phase, takes the key-value pairs generated by the Map as input, executes the Reduce function, processes it to generate a new key-value pair, and finally writes the result to HDFS. The realization of parallelization of genetic algorithms is divided into three stages, namely Map.
The phase, the Combine phase and the Reduce phase are as follows:
1. In the Map stage, the training set of the individual infor-mation of the population is divided into data blocks and allocated to each data node. The Map function converts it into a vector <key, value>. All Map tasks perform neural network learning in parallel to adjust the con-nection right of the network. Value and threshold, when the output error reaches the set value, the <individual, error value> key-value pair is output.
Pseudo code
Input: key, value
Output: individual, error value
Map(key, value)
{
Do{
Elman neural network iterative training
}While (output error does not reach the set value of 0.01)
Obtain individual and error values;
Emit (individual, error value)
}
2. In the Combine phase, the data is aggregated, and key-value pairs with the same individual are merged and sent to the Reduce function.
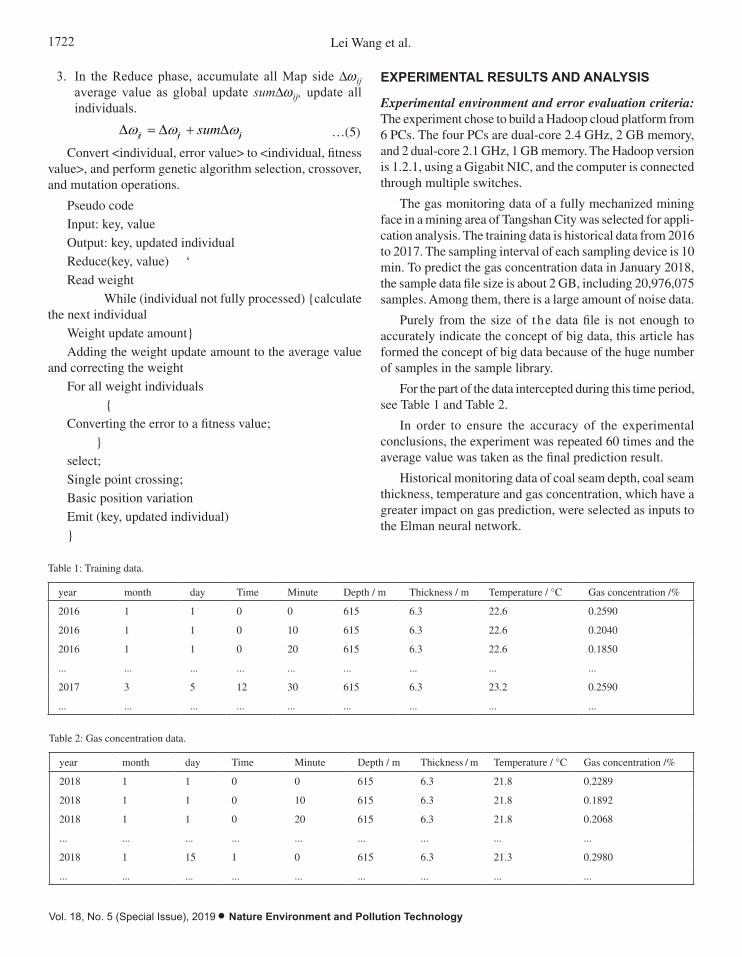
1722 Lei Wang et al.
Vol. 18, No. 5 (Special Issue), 2019 • Nature Environment and Pollution Technology
3. In the Reduce phase, accumulate all Map side Dwij average value as global update sumDwij, update all individuals.
ijijij sum ωωω ∆+∆=∆ …(5)
Convert <individual, error value> to <individual, fitness value>, and perform genetic algorithm selection, crossover, and mutation operations.
Pseudo code
Input: key, value
Output: key, updated individual
Reduce(key, value) ‘
Read weight
While (individual not fully processed) {calculate the next individual
Weight update amount}
Adding the weight update amount to the average value and correcting the weight
For all weight individuals
{
Converting the error to a fitness value;
}
select;
Single point crossing;
Basic position variation
Emit (key, updated individual)
}
EXPERIMENTAL RESULTS AND ANALYSIS
Experimental environment and error evaluation criteria: The experiment chose to build a Hadoop cloud platform from 6 PCs. The four PCs are dual-core 2.4 GHz, 2 GB memory, and 2 dual-core 2.1 GHz, 1 GB memory. The Hadoop version is 1.2.1, using a Gigabit NIC, and the computer is connected through multiple switches.
The gas monitoring data of a fully mechanized mining face in a mining area of Tangshan City was selected for appli-cation analysis. The training data is historical data from 2016 to 2017. The sampling interval of each sampling device is 10 min. To predict the gas concentration data in January 2018, the sample data file size is about 2 GB, including 20,976,075 samples. Among them, there is a large amount of noise data.
Purely from the size of the data file is not enough to accurately indicate the concept of big data, this article has formed the concept of big data because of the huge number of samples in the sample library.
For the part of the data intercepted during this time period, see Table 1 and Table 2.
In order to ensure the accuracy of the experimental conclusions, the experiment was repeated 60 times and the average value was taken as the final prediction result.
Historical monitoring data of coal seam depth, coal seam thickness, temperature and gas concentration, which have a greater impact on gas prediction, were selected as inputs to the Elman neural network.
Table 2: Gas concentration data.
year month day Time Minute Depth / m Thickness / m Temperature / °C Gas concentration /%
2018 1 1 0 0 615 6.3 21.8 0.2289
2018 1 1 0 10 615 6.3 21.8 0.1892
2018 1 1 0 20 615 6.3 21.8 0.2068
... ... ... ... ... ... ... ... ...
2018 1 15 1 0 615 6.3 21.3 0.2980
... ... ... ... ... ... ... ... ...
Table 1: Training data.
year month day Time Minute Depth / m Thickness / m Temperature / °C Gas concentration /%
2016 1 1 0 0 615 6.3 22.6 0.2590
2016 1 1 0 10 615 6.3 22.6 0.2040
2016 1 1 0 20 615 6.3 22.6 0.1850
... ... ... ... ... ... ... ... ...
2017 3 5 12 30 615 6.3 23.2 0.2590
... ... ... ... ... ... ... ... ...
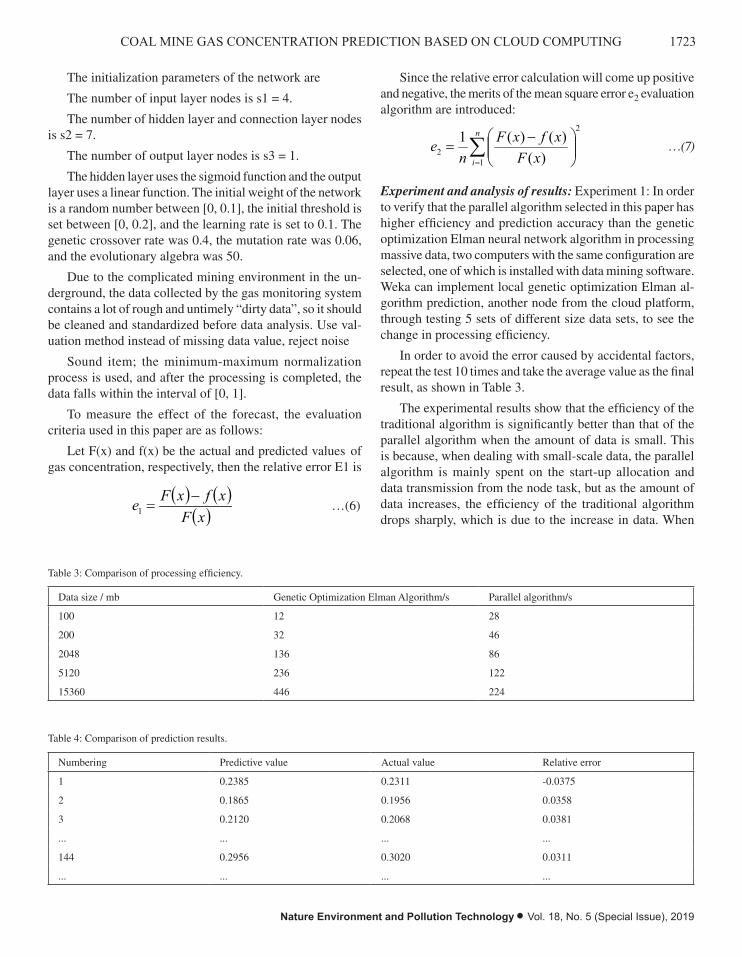
1723COAL MINE GAS CONCENTRATION PREDICTION BASED ON CLOUD COMPUTING
Nature Environment and Pollution Technology • Vol. 18, No. 5 (Special Issue), 2019
The initialization parameters of the network are
The number of input layer nodes is s1 = 4.
The number of hidden layer and connection layer nodes is s2 = 7.
The number of output layer nodes is s3 = 1.
The hidden layer uses the sigmoid function and the output layer uses a linear function. The initial weight of the network is a random number between [0, 0.1], the initial threshold is set between [0, 0.2], and the learning rate is set to 0.1. The genetic crossover rate was 0.4, the mutation rate was 0.06, and the evolutionary algebra was 50.
Due to the complicated mining environment in the un-derground, the data collected by the gas monitoring system contains a lot of rough and untimely “dirty data”, so it should be cleaned and standardized before data analysis. Use val-uation method instead of missing data value, reject noise
Sound item; the minimum-maximum normalization process is used, and after the processing is completed, the data falls within the interval of [0, 1].
To measure the effect of the forecast, the evaluation criteria used in this paper are as follows:
Let F(x) and f(x) be the actual and predicted values of gas concentration, respectively, then the relative error E1 is
( ) ( )
( )xFxfxFe −
=1 …(6)
Since the relative error calculation will come up positive and negative, the merits of the mean square error e2 evaluation algorithm are introduced:
2
12 )(
)()(1∑=
−=
n
i xFxfxF
ne …(7)
Experiment and analysis of results: Experiment 1: In order to verify that the parallel algorithm selected in this paper has higher efficiency and prediction accuracy than the genetic optimization Elman neural network algorithm in processing massive data, two computers with the same configuration are selected, one of which is installed with data mining software. Weka can implement local genetic optimization Elman al-gorithm prediction, another node from the cloud platform, through testing 5 sets of different size data sets, to see the change in processing efficiency.
In order to avoid the error caused by accidental factors, repeat the test 10 times and take the average value as the final result, as shown in Table 3.
The experimental results show that the efficiency of the traditional algorithm is significantly better than that of the parallel algorithm when the amount of data is small. This is because, when dealing with small-scale data, the parallel algorithm is mainly spent on the start-up allocation and data transmission from the node task, but as the amount of data increases, the efficiency of the traditional algorithm drops sharply, which is due to the increase in data. When
Table 3: Comparison of processing efficiency.
Data size / mb Genetic Optimization Elman Algorithm/s Parallel algorithm/s
100 12 28
200 32 46
2048 136 86
5120 236 122
15360 446 224
Table 4: Comparison of prediction results.
Numbering Predictive value Actual value Relative error
1 0.2385 0.2311 -0.0375
2 0.1865 0.1956 0.0358
3 0.2120 0.2068 0.0381
... ... ... ...
144 0.2956 0.3020 0.0311
... ... ... ...
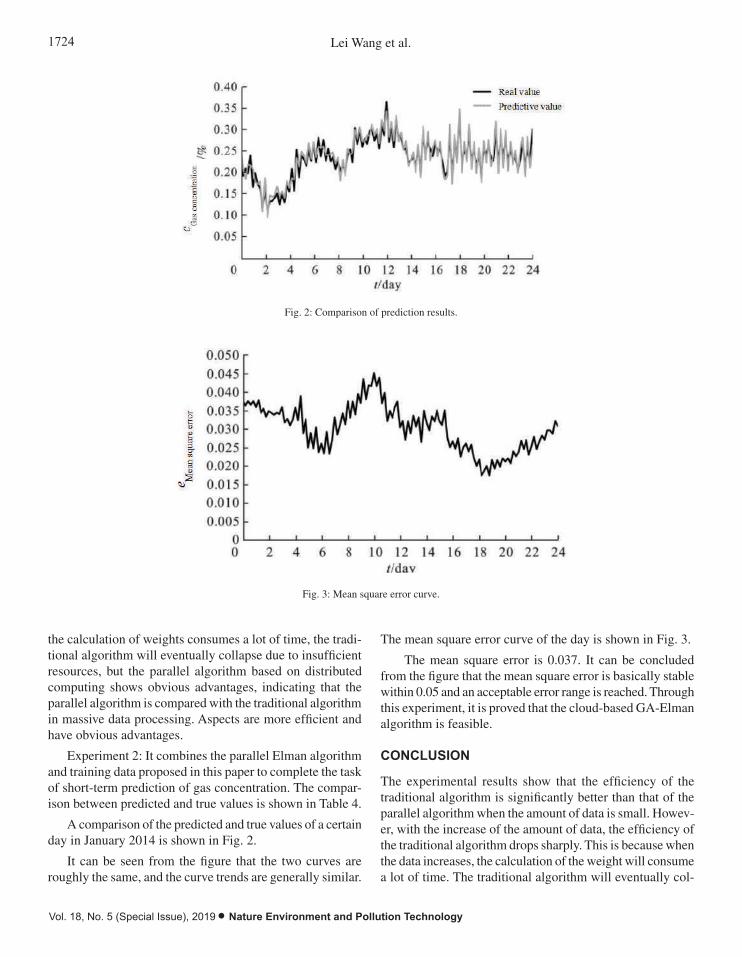
1724 Lei Wang et al.
Vol. 18, No. 5 (Special Issue), 2019 • Nature Environment and Pollution Technology
the calculation of weights consumes a lot of time, the tradi-tional algorithm will eventually collapse due to insufficient resources, but the parallel algorithm based on distributed computing shows obvious advantages, indicating that the parallel algorithm is compared with the traditional algorithm in massive data processing. Aspects are more efficient and have obvious advantages.
Experiment 2: It combines the parallel Elman algorithm and training data proposed in this paper to complete the task of short-term prediction of gas concentration. The compar-ison between predicted and true values is shown in Table 4.
A comparison of the predicted and true values of a certain day in January 2014 is shown in Fig. 2.
It can be seen from the figure that the two curves are roughly the same, and the curve trends are generally similar.
The mean square error curve of the day is shown in Fig. 3.
The mean square error is 0.037. It can be concluded from the figure that the mean square error is basically stable within 0.05 and an acceptable error range is reached. Through this experiment, it is proved that the cloud-based GA-Elman algorithm is feasible.
CONCLUSION
The experimental results show that the efficiency of the traditional algorithm is significantly better than that of the parallel algorithm when the amount of data is small. Howev-er, with the increase of the amount of data, the efficiency of the traditional algorithm drops sharply. This is because when the data increases, the calculation of the weight will consume a lot of time. The traditional algorithm will eventually col-
Fig. 3: Mean square error curve.
Fig. 2: Comparison of prediction results.

1725COAL MINE GAS CONCENTRATION PREDICTION BASED ON CLOUD COMPUTING
Nature Environment and Pollution Technology • Vol. 18, No. 5 (Special Issue), 2019
lapse due to insufficient resources, but the parallel algorithm based on distributed computing. However, it shows obvious advantages, which shows that the parallel algorithm is more efficient and obviously superior to the traditional algorithm in massive data processing. Experiments show that the cloud-based genetic optimization Elman prediction algorithm has greatly improved processing speed and prediction accuracy.
REFERENCES
Che, H. C., Zhang, X. Y., Zhang, L., Wang, Y. Q., Zhang, Y. M., and Shen, X. J. 2017. Prediction of size-resolved number concentration of cloud condensation nuclei and long-term measurements of their activation characteristics. Scientific Reports, 7(1): 334-347.
He, J., Duan, C., Lei, M., and Zhu, X. 2016. The secondary release of mercury in coal fly ash-based flue-gas mercury removal technology. Environmental Technology, 37(1): 28-38.
Lanzerstorfer, C. 2018. Fly ash from coal combustion: dependence of the concentration of various elements on the particle size. Fuel, 228: 263-271.
Lin, M., Peng, W., and Gui, H. 2016. Heavy metals in deep groundwater within coal mining area, northern Anhui province, china: concen-
tration, relationship, and source apportionment. Arabian Journal of Geosciences, 9(4): 1-10.
Qiang, Z., Li, C., Qiang, W., and Zhang, B. 2018. Effect of dry water on methane separation and recovery from coal mine gas based on hydrate. Rsc. Advances, 8(48): 27171-27180.
Temel, N. K., Sertakan, K., and Gürkan, R. 2018. Preconcentration and determination of trace nickel and cobalt in milk-based samples by ultrasound-assisted cloud point extraction coupled with flame atomic absorption spectrometry. Biological Trace Element Research, 186(2): 597-607.
Tröstl, J., Chuang, W. K., Gordon, H., Heinritzi, M., Yan, C., and Molteni, U. 2016. The role of low-volatility organic compounds in initial par-ticle growth in the atmosphere. Nature, 533(7604): 527.
Yong, J., Wang, L., Zhang, L., An, W., Wei, W., and Wei, Z. 2018. Direct operation of solid oxide fuel cells on low-concentration oxygen-bear-ing coal-bed methane with high stability. Energy and Fuels, 32(4): 7b02968.
Yuan, D., Zheng, Y., Li, Q., Lin, B., Zhang, G., and Liu, J. 2018. Effects of pore structure of prepared coal-based activated carbons on CH 4 enrichment from low concentration gas by IAST method. Powder Technology, 333: 377-384.
Zhao, J., Zhao, Y., and Liang, W. 2016. Hydrate‐based gas separation for methane recovery from coal mine gas using tetrahydrofuran. Energy Technology, 4(7): 864-869.

Vol. 18, No. 5 (Special Issue), 2019 • Nature Environment and Pollution Technology
1726
Research on Sewage Treatment Computer System Based on ADP Iterative Algorithm
Fu-Xing Liu*, Jun-Tao Zhu* and Van Huong Dong***Zheng Zhou Railway, Vocational &Technical College, Zheng Zhou, 451460, China**Ho Chi Minh City University of Transport, Ho Chi Minh, Vietnam
ABSTRACT
In order to solve the problem of wastewater treatment control, a computer system based on ADP iterative algorithm is proposed. Sewage treatment system is a highly nonlinear industrial process control system, because of the uncertainty of the water into the component, and the surrounding environment such as weather, temperature and pH influence factors such as mixture, the sewage treatment process is extremely complex, present a big time delay, strong coupling, time-varying and serious interference, etc. Therefore, this paper aims to control and optimize the concentration of dissolved oxygen and nitrate nitrogen in the process of sewage treatment, proposes an optimal control strategy for sewage treatment based on the iterative ADP algorithm, and realizes the online control and optimization of sewage treatment by combining the basic principle of adaptive dynamic programming and the characteristics of neural network.
INTRODUCTION
China’s freshwater resources are extremely scarce, and the per capita freshwater resources account for only a quarter of the world. According to the “Regulations on the Implemen-tation of the Strict Water Resources Management System” issued by the State Council, the current shortage of water resources, serious water pollution, and deterioration of the water ecological environment have seriously hindered the sustainable development of China’s economy and society (Asghar & Khan 2018, He & Zhang 2018). In the 2016 statistical analysis of urban water resources in China, it is pointed out that China’s water resources problem has become a major strategic issue that restricts the sustainable devel-opment of the country’s economy and society. The number of people drinking water in rural areas that do not meet the national standards is about 360 million (Liu 2017a). It is also pointed out in the report on the market assessment and prospect trend of China’s water resources management in 2015-2020 issued by the industry information network that in cities, various industries related to the development of national economy, such as agriculture, industry, construction and residents’ life have great demand for water resources. China’s annual urban water shortage is up to 6 billion m3, and the severe water shortage has greatly limited the country’s GDP growth, urban modernization and the improvement of residents’ living standards (Thiruchelvam et al. 2018). According to statistics, the economic loss caused by water
shortage in various aspects has reached 200 billion yuan. Therefore, China’s urban water resources are facing a seri-ous shortage and wide coverage of serious problems. In its 12th five-year plan, the state has made water conservation an important part of its plans, stressing the need to build a water-saving society, strictly implement water resources protection measures and improve water-saving technologies (Wei 2017). In the 13th Five-Year Plan proposal, saving water resources and protecting the water environment is our basic national policy. It not only saves water and severely punishes waste, but also studies water-saving technologies and builds resources such as rainwater and floods, utilization of the projects and emphasize that China must follow the path of sustainable development.
In this paper, the wastewater treatment control and wastewater set point optimization based on ADP iterative algorithm are studied and simulated. The experimental results are analysed to verify the effectiveness of the platform and provide technical support for the development of new control strategies and optimization algorithms.
EARLIER STUDIES
A recent study proposed a fuzzy expert system for the di-agnosis and management of anaerobic digester. According to this expert system, it is judged whether the indicator set by the state trend machine at the water plant terminal is the best control point in the process (Zhu et al. 2017). A study
Nat. Env. & Poll. Tech.Website: www.neptjournal.com
Received: 29-08-2019 Accepted: 27-10-2019
Key Words:Sewage treatment ADP iterative algorithm Water ecologyDissolved oxygenNitrate
2019pp. 1727-1732 Vol. 18
p-ISSN: 0972-6268 No. 5 (Special Issue)
Nature Environment and Pollution Technology An International Quarterly Scientific Journal
Original Research Paper
e-ISSN: 2395-3454
Open Access
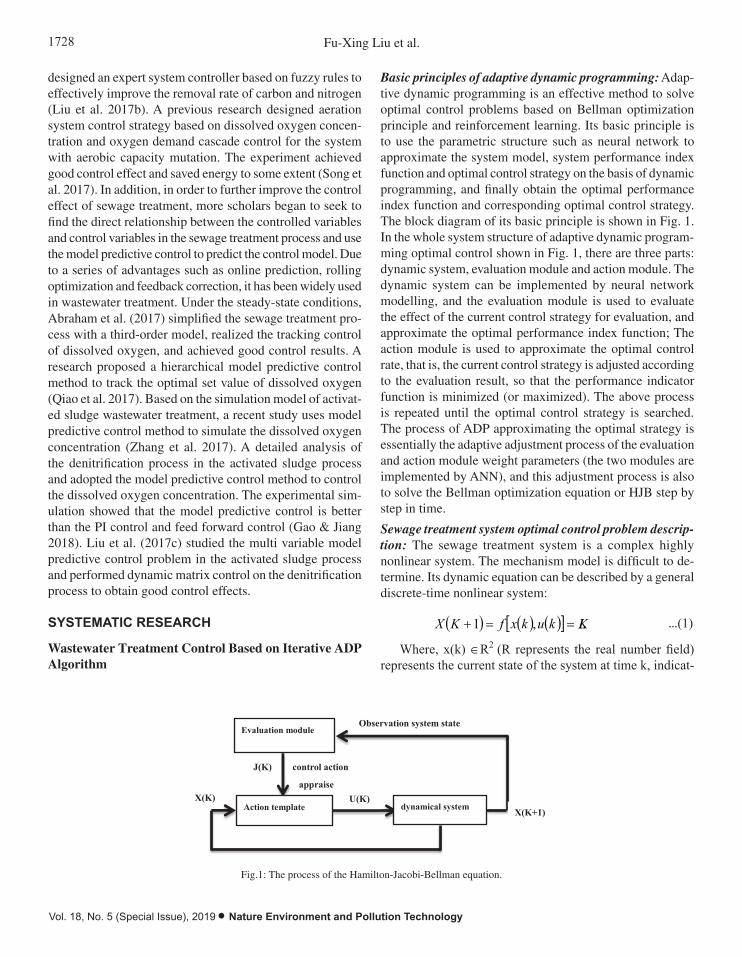
1728 Fu-Xing Liu et al.
Vol. 18, No. 5 (Special Issue), 2019 • Nature Environment and Pollution Technology
designed an expert system controller based on fuzzy rules to effectively improve the removal rate of carbon and nitrogen (Liu et al. 2017b). A previous research designed aeration system control strategy based on dissolved oxygen concen-tration and oxygen demand cascade control for the system with aerobic capacity mutation. The experiment achieved good control effect and saved energy to some extent (Song et al. 2017). In addition, in order to further improve the control effect of sewage treatment, more scholars began to seek to find the direct relationship between the controlled variables and control variables in the sewage treatment process and use the model predictive control to predict the control model. Due to a series of advantages such as online prediction, rolling optimization and feedback correction, it has been widely used in wastewater treatment. Under the steady-state conditions, Abraham et al. (2017) simplified the sewage treatment pro-cess with a third-order model, realized the tracking control of dissolved oxygen, and achieved good control results. A research proposed a hierarchical model predictive control method to track the optimal set value of dissolved oxygen (Qiao et al. 2017). Based on the simulation model of activat-ed sludge wastewater treatment, a recent study uses model predictive control method to simulate the dissolved oxygen concentration (Zhang et al. 2017). A detailed analysis of the denitrification process in the activated sludge process and adopted the model predictive control method to control the dissolved oxygen concentration. The experimental sim-ulation showed that the model predictive control is better than the PI control and feed forward control (Gao & Jiang 2018). Liu et al. (2017c) studied the multi variable model predictive control problem in the activated sludge process and performed dynamic matrix control on the denitrification process to obtain good control effects.
SYSTEMATIC RESEARCH
Wastewater Treatment Control Based on Iterative ADP Algorithm
Basic principles of adaptive dynamic programming: Adap-tive dynamic programming is an effective method to solve optimal control problems based on Bellman optimization principle and reinforcement learning. Its basic principle is to use the parametric structure such as neural network to approximate the system model, system performance index function and optimal control strategy on the basis of dynamic programming, and finally obtain the optimal performance index function and corresponding optimal control strategy. The block diagram of its basic principle is shown in Fig. 1. In the whole system structure of adaptive dynamic program-ming optimal control shown in Fig. 1, there are three parts: dynamic system, evaluation module and action module. The dynamic system can be implemented by neural network modelling, and the evaluation module is used to evaluate the effect of the current control strategy for evaluation, and approximate the optimal performance index function; The action module is used to approximate the optimal control rate, that is, the current control strategy is adjusted according to the evaluation result, so that the performance indicator function is minimized (or maximized). The above process is repeated until the optimal control strategy is searched. The process of ADP approximating the optimal strategy is essentially the adaptive adjustment process of the evaluation and action module weight parameters (the two modules are implemented by ANN), and this adjustment process is also to solve the Bellman optimization equation or HJB step by step in time.
Sewage treatment system optimal control problem descrip-tion: The sewage treatment system is a complex highly nonlinear system. The mechanism model is difficult to de-termine. Its dynamic equation can be described by a general discrete-time nonlinear system:
( ) ( ) ( )[ ] KLkukxfKX ==+ ,1 …(1)
Where, x(k) ÎR2 (R represents the real number field) represents the current state of the system at time k, indicat-
Evaluation module
Action template dynamical system
Observation system state
J(K) control action
appraise X(K) U(K)
X(K+1)
Fig.1: The process of the Hamilton-Jacobi-Bellman equation.
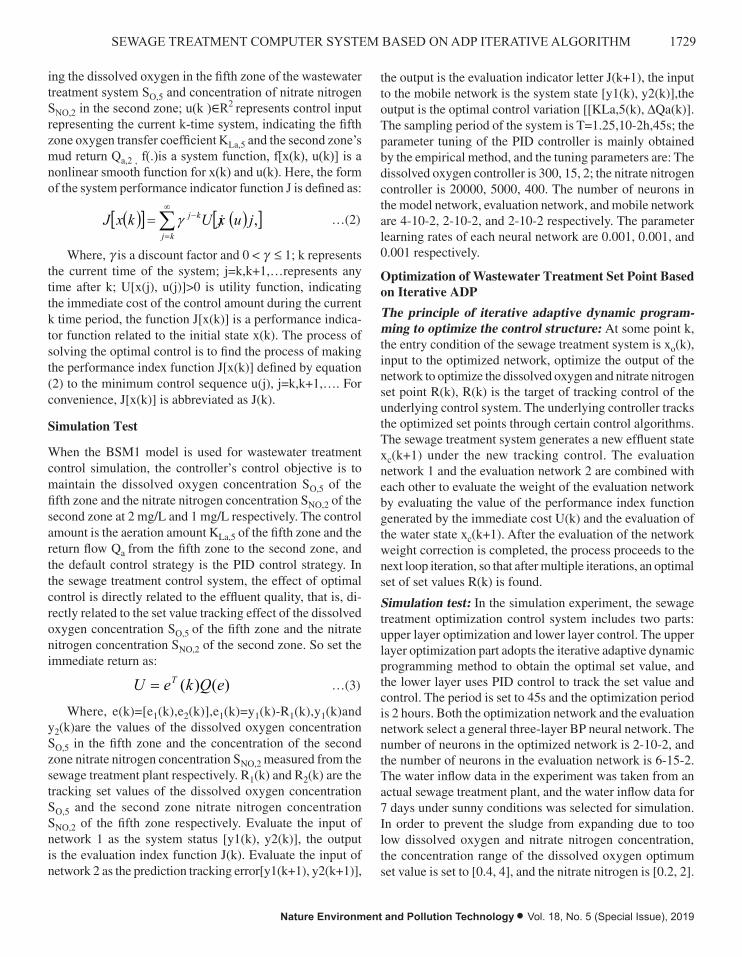
1729SEWAGE TREATMENT COMPUTER SYSTEM BASED ON ADP ITERATIVE ALGORITHM
Nature Environment and Pollution Technology • Vol. 18, No. 5 (Special Issue), 2019
ing the dissolved oxygen in the fifth zone of the wastewater treatment system SO,5 and concentration of nitrate nitrogen SNO,2 in the second zone; u(k )∈R2 represents control input representing the current k-time system, indicating the fifth zone oxygen transfer coefficient KLa,5 and the second zone’s mud return Qa,2 , f(.)is a system function, f[x(k), u(k)] is a nonlinear smooth function for x(k) and u(k). Here, the form of the system performance indicator function J is defined as:
( )[ ] ( )[ ],juxjUkxJkj
kj∑∞
=
−= γ …(2)
Where, g is a discount factor and 0 < g £ 1; k represents the current time of the system; j=k,k+1,…represents any time after k; U[x(j), u(j)]>0 is utility function, indicating the immediate cost of the control amount during the current k time period, the function J[x(k)] is a performance indica-tor function related to the initial state x(k). The process of solving the optimal control is to find the process of making the performance index function J[x(k)] defined by equation (2) to the minimum control sequence u(j), j=k,k+1,…. For convenience, J[x(k)] is abbreviated as J(k).
Simulation Test
When the BSM1 model is used for wastewater treatment control simulation, the controller’s control objective is to maintain the dissolved oxygen concentration SO,5 of the fifth zone and the nitrate nitrogen concentration SNO,2 of the second zone at 2 mg/L and 1 mg/L respectively. The control amount is the aeration amount KLa,5 of the fifth zone and the return flow Qa from the fifth zone to the second zone, and the default control strategy is the PID control strategy. In the sewage treatment control system, the effect of optimal control is directly related to the effluent quality, that is, di-rectly related to the set value tracking effect of the dissolved oxygen concentration SO,5 of the fifth zone and the nitrate nitrogen concentration SNO,2 of the second zone. So set the immediate return as:
)()( eQkeU T= …(3)
Where, e(k)=[e1(k),e2(k)],e1(k)=y1(k)-R1(k),y1(k)and y2(k)are the values of the dissolved oxygen concentration SO,5 in the fifth zone and the concentration of the second zone nitrate nitrogen concentration SNO,2 measured from the sewage treatment plant respectively. R1(k) and R2(k) are the tracking set values of the dissolved oxygen concentration SO,5 and the second zone nitrate nitrogen concentration SNO,2 of the fifth zone respectively. Evaluate the input of network 1 as the system status [y1(k), y2(k)], the output is the evaluation index function J(k). Evaluate the input of network 2 as the prediction tracking error[y1(k+1), y2(k+1)],
the output is the evaluation indicator letter J(k+1), the input to the mobile network is the system state [y1(k), y2(k)],the output is the optimal control variation [[KLa,5(k), DQa(k)]. The sampling period of the system is T=1.25,10-2h,45s; the parameter tuning of the PID controller is mainly obtained by the empirical method, and the tuning parameters are: The dissolved oxygen controller is 300, 15, 2; the nitrate nitrogen controller is 20000, 5000, 400. The number of neurons in the model network, evaluation network, and mobile network are 4-10-2, 2-10-2, and 2-10-2 respectively. The parameter learning rates of each neural network are 0.001, 0.001, and 0.001 respectively.
Optimization of Wastewater Treatment Set Point Based on Iterative ADP
The principle of iterative adaptive dynamic program-ming to optimize the control structure: At some point k, the entry condition of the sewage treatment system is xo(k), input to the optimized network, optimize the output of the network to optimize the dissolved oxygen and nitrate nitrogen set point R(k), R(k) is the target of tracking control of the underlying control system. The underlying controller tracks the optimized set points through certain control algorithms. The sewage treatment system generates a new effluent state xc(k+1) under the new tracking control. The evaluation network 1 and the evaluation network 2 are combined with each other to evaluate the weight of the evaluation network by evaluating the value of the performance index function generated by the immediate cost U(k) and the evaluation of the water state xc(k+1). After the evaluation of the network weight correction is completed, the process proceeds to the next loop iteration, so that after multiple iterations, an optimal set of set values R(k) is found.
Simulation test: In the simulation experiment, the sewage treatment optimization control system includes two parts: upper layer optimization and lower layer control. The upper layer optimization part adopts the iterative adaptive dynamic programming method to obtain the optimal set value, and the lower layer uses PID control to track the set value and control. The period is set to 45s and the optimization period is 2 hours. Both the optimization network and the evaluation network select a general three-layer BP neural network. The number of neurons in the optimized network is 2-10-2, and the number of neurons in the evaluation network is 6-15-2. The water inflow data in the experiment was taken from an actual sewage treatment plant, and the water inflow data for 7 days under sunny conditions was selected for simulation. In order to prevent the sludge from expanding due to too low dissolved oxygen and nitrate nitrogen concentration, the concentration range of the dissolved oxygen optimum set value is set to [0.4, 4], and the nitrate nitrogen is [0.2, 2].
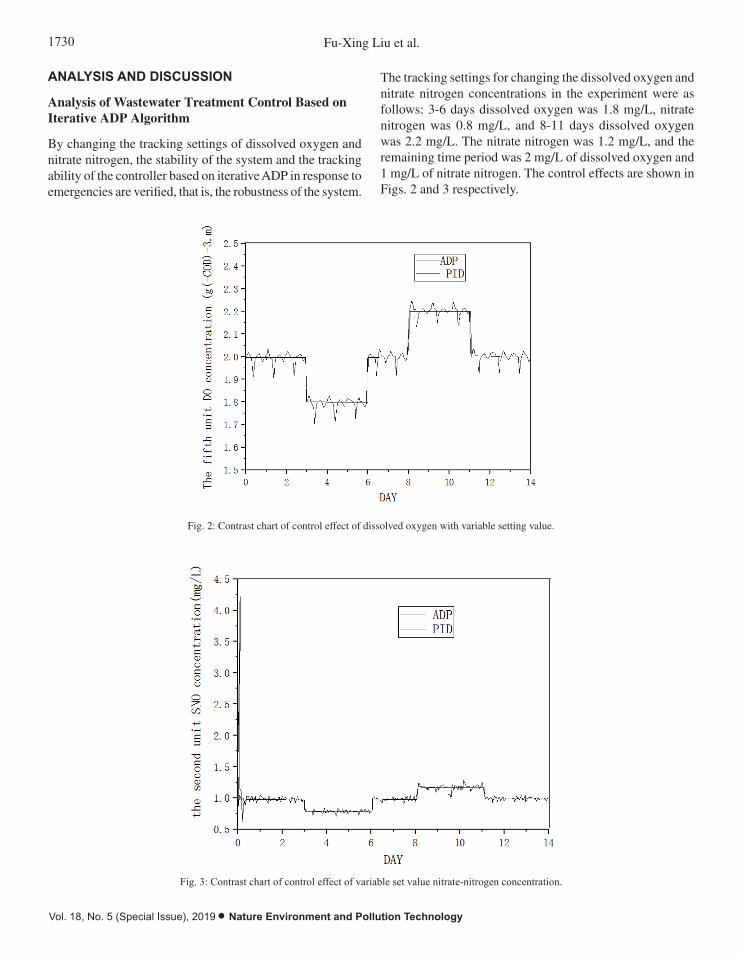
1730 Fu-Xing Liu et al.
Vol. 18, No. 5 (Special Issue), 2019 • Nature Environment and Pollution Technology
ANALYSIS AND DISCUSSION
Analysis of Wastewater Treatment Control Based on Iterative ADP Algorithm
By changing the tracking settings of dissolved oxygen and nitrate nitrogen, the stability of the system and the tracking ability of the controller based on iterative ADP in response to emergencies are verified, that is, the robustness of the system.
The tracking settings for changing the dissolved oxygen and nitrate nitrogen concentrations in the experiment were as follows: 3-6 days dissolved oxygen was 1.8 mg/L, nitrate nitrogen was 0.8 mg/L, and 8-11 days dissolved oxygen was 2.2 mg/L. The nitrate nitrogen was 1.2 mg/L, and the remaining time period was 2 mg/L of dissolved oxygen and 1 mg/L of nitrate nitrogen. The control effects are shown in Figs. 2 and 3 respectively.
Fig. 3: Contrast chart of control effect of variable set value nitrate-nitrogen concentration.
Fig. 2: Contrast chart of control effect of dissolved oxygen with variable setting value.
1731SEWAGE TREATMENT COMPUTER SYSTEM BASED ON ADP ITERATIVE ALGORITHM
Nature Environment and Pollution Technology • Vol. 18, No. 5 (Special Issue), 2019
It can be seen from Fig. 2 and Fig. 3 that when the set values of dissolved oxygen and nitrate nitrogen change, the controller based on the iterative ADP optimal control can better track the dissolved oxygen and nitrate nitrogen con-centration settings, indicating controllers based on iterative ADP optimal control are more robust and adaptive.
Optimization Analysis of Set point Value of Sewage Treatment Based on Iterative ADP
In this optimized control system, the immediate cost of op-timizing the problem is shown in 4-4. In the upper iterative adaptive dynamic programming optimization structure, the input of the optimized network is xo(k)=[Q0(k), S′NH(k)] T, the output is R(k)=[SO,5(k), SNO,2(k)]. The input to the eval-uation network 1 is [SO,5(k), SNO,2(k), Ntot(k+1), SNH(k+1), KLa5(k+1), Qa(k+1)], the output is Jk(1). The input to the evaluation network 2 is [SO,5(k-1), SNO,2(k-1), Ntot(k), SNH(k), KLa5(k), Qa(k)]. The simulation experiment is based on the BSM1 benchmark model, which is based on an iterative adaptive dynamic programming to optimize the set values of dissolved oxygen and nitrate nitrogen concentration. In order to verify the optimal control effect based on the iter-ative adaptive dynamic programming method, the effluent quality effects of the two methods were compared in the simulation experiment. Since the set values of dissolved oxygen and nitrate nitrogen mainly affect the effluent ef-fect of total nitrogen and ammonia nitrogen in the effluent, this experiment compared the effects of total nitrogen and ammonia nitrogen under the optimal control based on iter-ative adaptive dynamic programming and the PID control based on fixed values; lists the parameter comparison of several optimization control strategies, namely the default fixed value PID control strategy, the neural network based optimal control strategy NNOMC, and the iterative adaptive dynamic programming ADP optimized control strategy. Table 1 shows aeration energy AE for several strategies, pumping energy consumption PE, total energy consumption, and total nitrogen concentration in effluent water Ntot and ammonia nitrogen concentration SNH. It can be seen from Table 1 that the optimal control based on iterative adaptive dynamic programming has a significant decrease in dissolved oxygen concentration compared to other optimized control
strategies, the concentration of dissolved oxygen decreased significantly, while the concentration of nitrate nitrogen increased significantly. At the same time, from the perspec-tive of energy consumption of sewage treatment, the energy consumption of aeration decreased significantly, the energy consumption of pumping increased, and the total energy consumption of the system decreased by 18.3%. From the perspective of effluent quality, total nitrogen concentration and ammonia nitrogen concentration are up to standard. In general, the optimal control strategy based on iterative adaptive dynamic programming is more effective.
CONCLUSION
Sewage treatment is a practical industrial process that not only meets national effluent water quality standards, but also considers actual operating costs. The cost of sewage treat-ment mainly includes the subsequent costs caused by energy consumption and water quality factors. In this paper, an optimal control strategy based on iterative adaptive dynamic programming is designed and implemented to optimize the set values of dissolved oxygen and nitrate nitrogen for the control of dissolved oxygen and nitrate nitrogen in sewage treatment from the perspective of the operation cost of sew-age treatment plants. Through the sewage treatment process to analyse the main factors affecting energy consumption and effluent quality, and through simulation experiments, the set values of dissolved oxygen and nitrate nitrogen concentra-tion mainly affect the concentration of total nitrogen and ammonia nitrogen in the effluent quality, combined with the optimization performance of BSM1 upper layer. The index establishes the objective function of the upper layer of wastewater treatment optimization and the immediate cost model of the iterative adaptive dynamic programming optimization controller. Finally, the simulation compari-son experiment is carried out. Experiments show that the optimal control strategy for wastewater treatment based on iterative adaptive dynamic programming is reduced compared with other optimized control strategies based on the effluent water quality standards. Although this paper puts forward corresponding countermeasures for different problems of sewage treatment process, it has also achieved certain results. However, due to the limitations of realistic
Table 1: Comparison of performance indicators of several optimization control strategies.
SO,5 SNO,2 AE PE Energy Ntot SNH
PID 2 1 3676.28 231.38 3907.66 18.1001 2.9297
NNOMC 1.75 1.42 3498.62 283.82 3782.44 17.1512 2.7998
ADP optimization control strategy 1.56 1.63 3254.65 302.56 3557.21 16.8564 2.9125
Rise and fall Ø 22% ≠ 63% Ø 11.5% ≠ 30.8% Ø 18.3% ≠6.9% Ø0.1%

1732 Fu-Xing Liu et al.
Vol. 18, No. 5 (Special Issue), 2019 • Nature Environment and Pollution Technology
conditions and research time, the research content needs further research and exploration.
REFERENCES
Abraham, I., Abraham, R., Bergounioux, M. and Carlier, G. 2017. Tomo-graphic reconstruction from a few views: a multi-marginal optimal transport approach. Applied Mathematics and Optimization, 75(1): 55-73.
Asghar, Z. and Khan, S. 2018. Preliminary monitoring of particulate matter and gaseous emissions released from vehicles near railway station Lahore, Pakistan. Acta Chemica Malaysia, 2(2):06-08.
Gao, W. and Jiang, Z.P. 2018. Learning-based adaptive optimal tracking control of strict-feedback nonlinear systems. IEEE Transactions on Neural Networks and Learning Systems, 29(6): 2614-2624.
He, J. and Zhang, H. 2018. Iterative ADP learning algorithms for dis-crete-time multi-player games. Artificial Intelligence Review,50(1): 1-17.
Liu, D., Li, H. and Wang, D. 2017a. Error bounds of adaptive dynamic programming algorithms for solving undiscounted optimal control problems. IEEE Transactions on Neural Networks and Learning Sys-tems, 26(6): 1323-1334.
Liu, D., Wei, Q. and Yan, P. 2017b. Generalized policy iteration adaptive dynamic programming for discrete-time nonlinear systems. IEEE Trans-actions on Systems Man and Cybernetics Systems, 45(12): 1577-1591.
Liu, D., Wei, Q., Ding, W., Xiong, Y. and Li, H. 2017c. Finite approximation error-based value iteration ADP. Adaptive Dynamic Programming with Applications in Optimal Control.
Qiao, L., Wei, Q. and Liu, D. 2017. A novel optimal tracking control scheme for a class of discrete-time nonlinear systems using generalised policy iteration adaptive dynamic programming algorithm. International Journal of Systems Science, 48(3): 525-534.
Song, R., Lewis, F. L. and Wei, Q. 2017. Off-policy integral reinforcement learning method to solve nonlinear continuous-time multiplayer nonze-ro-sum games. IEEE Transactions on Neural Networks and Learning Systems, 28(3): 704-713.
Thiruchelvam, S., Muda, R.S., Ghazali, A., Norkhairi, F.F., Mustapha, K.N., Yahya, N., Sulaiman, R. and Che Muda, Z. 2018. Inception of 3es in promoting disaster resilient communities living near hydropower dams of peninsular Malaysia. Malaysian Journal of Geosciences, 2(2): 17-21.
Wei, Q., Wang, F. Y., Liu, D. and Yang, X. 2017. Finite-approximation-er-ror-based discrete-time iterative adaptive dynamic programming. IEEE Transactions on Cybernetics, 44(12): 2820-2833.
Zhang, H., He, J., Luo, Y. and Xiao, G. 2017. Data-driven optimal consensus control for discrete-time multi-agent systems with unknown dynamics using reinforcement learning method. IEEE Transactions on Industrial Electronics, 64(5): 4091-4100.
Zhu, Y., Zhao, D. and Li, X. 2017. Iterative adaptive dynamic programming for solving unknown nonlinear zero-sum game based on online data. IEEE Transactions on Neural Networks and Learning Systems, 28(3): 714-725.
Study on Ancient Chu Town Urban Green Space Evolution and Ecological and Environmental Benefits
Chen Chen*, Noshabah Tabssum** and Hoang Phuong Nguyen****Yangtze University School of Art, Hubei Jingzhou,434100, China**Department of Environmental Science, Fatima Jinaah Women University, Pakistan***Regional Political Academy II, Ho Chi Minh City University of Transport, Ho Chi Minh, Vietnam
ABSTRACT
In order to deeply analyse the law of urban green space evolution, this paper discusses the change of urban ecological environment effect brought about by green space evolution and its interaction and mechanism. Based on 2007-2018, four remote sensing images of GUI area, the application of remote sensing and GIS spatial information technology, the basic data and sample plot survey, realized based on green space classification diagram. The landscape index, gradient analysis, spatial dynamic analysis methods, such as statistics, quantitative analysis of the urban green space landscape spatial structure evolution and its law of development, with the urban development of green space change of gradient explicit study can be a deeper understanding of the process of landscape pattern, provides the basis for the research of function. The experimental results show that from 2,031 square kilometres in 2007 to 1,364 square kilometres in 2018, the proportion of farmland in urban suburbs decreased by more than 50%. Urban green space has a rising trend in the core urban areas, but changes in the fringe urban areas and suburban areas are complex. With the advancement of urbanization, the total vegetation coverage has decreased by more than 50%, in which the area with high and full vegetation coverage levels has decreased significantly, while the area with no, low and medium vegetation coverage levels has increased.
INTRODUCTION
City is a kind of socio-economic natural complex ecosystem composed of urban built-up area and its surrounding sub-urbs. Compared with natural ecosystem, urban ecosystem has prominent characteristics of vulnerability, instability, opening and dependence. Green space is an important component of urban ecosystem with important ecological functions. With the acceleration of urbanization worldwide and a series of environmental problems caused by it, people pay more and more attention to the important role of urban green space in coordinating urban space development, controlling urban sprawl, adjusting ecological balance, improving environmental quality and beautifying land-scape. As a living urban infrastructure, urban green space is the key to the coupling of urban space development and ecological environment, and also an important symbol to measure the level of urban sustainable development and civilization (Schell 2018). Urban green space research is an important component of urban planning, urban environmen-tal construction, and the enhancement of urban ecosystem self-regulation and self-balancing ability. The enhancement of research on ecological function, structural layout and spatial correlation of green space, as well as the develop-ment and application of ecological planning concept, green network concept and ecological infrastructure concept,
make the construction of green space system become an important way to balance the contradiction between urban ecosystem and urbanization and restrain urban expansion (Chu et al. 2018).
The innovation of this article is from the perspective of ecological integrity and overall space based on landscape ecology theory and method and related disciplines, building town scale evolution of green space and ecological environ-ment effect of fit on methodology, the research framework and system build based on multi-source data of urban green space landscape structure, spatial pattern evolution and the response of ecological environment of diversified and mul-ti-level comprehensive quantitative evaluation techniques and methods. From the space-time dimension of the rapid urbanization process, the comprehensive evaluation of urban green space evolution and ecological environment effect is carried out, which provides a reference case for the quantitative research on the process and function of urban green space landscape pattern in other rapidly urbanized regions.
EARLIER STUDIES
A study proposed that urban green space is a kind of arti-ficial or natural ecological system with soil as the matrix, vegetation as the main body, human disturbance as the
Nat. Env. & Poll. Tech.Website: www.neptjournal.com
Received: 13-08-2019 Accepted: 03-10-2019
Key Words:Green space Evolution Ecology Environmental benefits
2019pp. 1733-1738 Vol. 18
p-ISSN: 0972-6268 No. 5 (Special Issue)
Nature Environment and Pollution Technology An International Quarterly Scientific Journal
Original Research Paper
e-ISSN: 2395-3454
Open Access
1734 Chen Chen et al.
Vol. 18, No. 5 (Special Issue), 2019 • Nature Environment and Pollution Technology
feature, and symbiosis with biological community. It is a green space network including urban garden, urban forest, urban agriculture, waterfront green space and three-di-mensional space greening, etc. (Chu et al. 2018, Dey et al. 2017). Previous research believed that urban green space is the space covered with living plants in urban areas, and it is the sum of forests, shrubs, hedges, flower beds, grasslands and other plants in urban areas, and its scope includes the central city and surrounding areas, which is a narrow un-derstanding of green space (Steyven et al. 2018). In foreign urban planning, landscape planning and relevant laws and regulations, the concept of green space is rarely mentioned, while the concept of urban open space is often mentioned. British, American, Japanese and Polish scholars have pro-posed different concepts of urban open space (Archibald et al. 2017). In China’s accelerating urbanization process, under the guidance of policies such as urban-rural overall planning and regional overall planning, especially in the process of increasingly transforming the urban-rural dual opposition structure into urban integration, green space should become an important carrier for the overall regional development and harmonious development between man and nature.
SYSTEM DESIGN METHOD
Urban Green Space Information Extraction Design
In this study, four annual remote sensing data were used, and the data were acquired on April 11, 2007, April 27, 2010, August 15, 2014 and March 24, 2018, respectively. The evolution process and laws of green space in Shanghai were studied through the analysis of multiple annual data. The four U.S. Landsat TM and ETM+ images with different phases have the orbital number of 118/38. TM images have a total of 7 bands. The resolution of TM6 thermal band is 120 meters, and the resolution of other bands is 30m. The four images are of low cloud cover and good quality, providing a good data basis for the interpretation of green space in different periods. A series of auxiliary data were used in the extraction process of green space information, including the land use classification map of Shanghai, the map of Shanghai administrative region, the greening map of Shanghai urban area, field survey data, relevant research results and statistical data. Basic contents and processes of pre-processing of orig-inal remote sensing images include atmospheric correction, geometric correction, image enhancement, colour synthesis and image cutting of research area. The Landsat TM/ETM+ data obtained was a coarse corrected image of the satellite receiving station using the calibration data of the standard calibration field. Because the extraction of the biological in-dicators of green land resource objects, such as temperature,
vegetation leaf area index, chlorophyll, etc. requires accurate atmospheric correction to enhance the minor differences in the reflectivity of important components. In this paper, the ATCOR2 atmospheric correction module in ERDAS9.2 was used for image radiometric correction to eliminate the influence of atmospheric factors. Image registration was conducted based on the 1:250,000 map of Shanghai admin-istrative region (Pham & Labbe 2017, Hendry et al. 2017). The topographic map was used as the reference data source to carry out geometric correction for TM images in 2007. The bilinear interpolation method was adopted for the cor-rection resampling to carry out the geometric correction of the images, and the geometric precision correction error was controlled within 1 pixel. The corrected image is projected on the map to the local coordinate system of Shanghai urban construction (Kuebbing et al. 2018). TM/ETM+ images in 2010, 2014 and 2018 were precisely registered with the corrected 1997 TM image as the reference image, and the geometric precision correction error was within half of the pixel, providing assurance and strong operability for spatial information superposition and analysis in the future. Treated with the support of ENVI4.6 good image, the application sub-set function cut out the image of Grind Gui area, to enhance the image and colour composite processing, to improve its interpretation as far as possible to ensure the precision of image interpretation (Parker et al. 2018).
Urban Green Space Interpretation Classification System
The establishment of land use classification system affects the result analysis and the corresponding follow-up research. Released in 2001 by the ministry of land and resources of land use can be divided into the national land classification of farmland (including cultivated land, garden land, forest land, grassland and farmland), construction land, indus-trial and mining warehouse (Shang Fu land use of land, land for public facilities, public building land, residential land and transportation land, land for water facilities and special) and unused (unused land and other land types). The “classification standard of urban green space” issued by the ministry of construction divides the urban green space into five categories, including park green space, production green space, protection green space, attached green space and other green space. The urban green space system includes forest land, highway greening, farmland forest network, scenic and historic interest area, water source protection area, country park, forest park, nature protection area, wetland, landfill restoration green space, urban green belt and urban green land, etc. To the present situation of land use classification, the urban green space classification standard and area green space system on the

1735CHU TOWN URBAN GREEN SPACE EVOLUTION
Nature Environment and Pollution Technology • Vol. 18, No. 5 (Special Issue), 2019
basis of the connotation, considering the research on Gui basic data source of remote sensing image spatial resolution is low, and this study focuses on the research under the influence of urbanization, urban green space, it will grind Gui area divided into two categories, green space and non-green space; green space including woodlands, shrubland, farmland and water body and non-green space includes construction land and other land use type as a background for the analysis (Meade et al. 2017, Brashears et al. 2017, Villegas et al. 2017).
Green space remote sensing interpretation refers to the corresponding classification rules (Table 1) and adopts the supervised class method. The principle of supervised clas-sification is to determine the discriminant function and the corresponding discriminant criterion according to the prior knowledge of the category. The main process is to first select a certain number of training areas for each category on the image, determine the undetermined parameters in the discri-minant function according to the observed values of a certain number of known samples, calculate the statistics or other information of each category, and construct the discriminant criteria. Each pixel is divided into different categories ac-cording to the criterion. The maximum likelihood method is based on the probability of the pixel values of each category obtained by calculation, and the corresponding probability density function is applied to classify the undetermined pixel. The scatter diagram on the schematic diagram shows the circular “isprobability” line, and the shape of isprobability line shows the sensitivity and coordination of the maximum likelihood method to classification. 250 training samples were selected for each image, and the method of combin-ing field sampling points and random sampling points was adopted. The main principle was to evenly distribute the sample points in the study area and ensure that each coverage category was included.
Research Methods of Ecological Environmental Effects
Regional Ecosystem Analysis (RCA) is an urban forest
ecosystem assessment method proposed by the US forest service. It is proposed in the context of better understanding of the contribution of green space to urban environment and urban construction in urban areas. REAs help local policy makers make the most of the region’s natural capital in order to develop better public policies. This method combines remote sensing image and sample land survey statistical data, applies GIS technology to analyse and research area forest coverage information, uses the model formed by the analysis to calculate the ecological value and economic value of urban forest sample area in the research area, and applies to different scope areas through scale conversion. The basic analysis process of REAs can be divided into five steps:
(1) To determine the scope of research area, CITYgreen software needs to first determine a research area with a boundary range when conducting large-scale analysis, and then all environmental effects and ecological benefits are only carried out within the boundary range of the research area.
(2) Determine the land use/cover map and forest cover map of the research area to obtain the urban land use/cover map by using remote sensing images. The land use type can be set according to the situation of the research area and the precision of remote sensing images, mainly including forest, shrub, water body, farmland, urban construction land, etc., and the required format is grid format.
(3) Generate CITYgreen ecological structure map of the re-search area by combining land use/cover information map and urban forest cover map. Ecological structure is a landscape type, which describes the ecological components of land and the characteristics of building land. CITYgreen provides the types of ecological structure matching different land types. For example, woodland corresponds to three types of ecological structure: Woodland with dead branches and deciduous layers, woodland with shrub grassland, and woodland with imperme-able ground. Ecological structure map can be combined with land cover data to make green space planning.
Table 1: Urban green space interpretation classification system.
The primary classification The secondary classification Contains the content
Green space Woodland Including all areas with a certain forest coverage, the main types are park green space, protective green space, forest, etc.
Shrubland Including shrubs, grass, and so on, generally no trees or few trees
Farmland Include farmland, paddy field, vegetable field to wait
Water body Including natural and artificial lakes, canals, reservoirs, ponds and tidal flats and other waters
Non-green space Urban construction land All kinds of land have been built, including land for urban and rural residential areas, mining, transportation facilities and other construction land
Other land Including bare soil, bare rock, toil land, saline-alkali land and other land under con-struction or unused
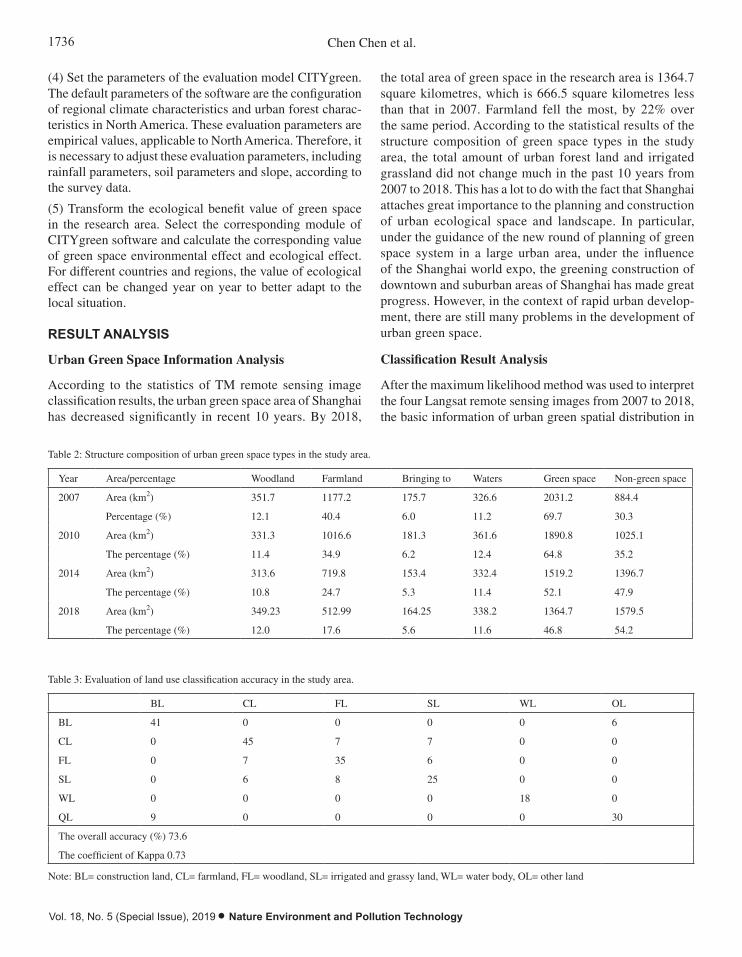
1736 Chen Chen et al.
Vol. 18, No. 5 (Special Issue), 2019 • Nature Environment and Pollution Technology
(4) Set the parameters of the evaluation model CITYgreen. The default parameters of the software are the configuration of regional climate characteristics and urban forest charac-teristics in North America. These evaluation parameters are empirical values, applicable to North America. Therefore, it is necessary to adjust these evaluation parameters, including rainfall parameters, soil parameters and slope, according to the survey data.
(5) Transform the ecological benefit value of green space in the research area. Select the corresponding module of CITYgreen software and calculate the corresponding value of green space environmental effect and ecological effect. For different countries and regions, the value of ecological effect can be changed year on year to better adapt to the local situation.
RESULT ANALYSIS
Urban Green Space Information Analysis
According to the statistics of TM remote sensing image classification results, the urban green space area of Shanghai has decreased significantly in recent 10 years. By 2018,
the total area of green space in the research area is 1364.7 square kilometres, which is 666.5 square kilometres less than that in 2007. Farmland fell the most, by 22% over the same period. According to the statistical results of the structure composition of green space types in the study area, the total amount of urban forest land and irrigated grassland did not change much in the past 10 years from 2007 to 2018. This has a lot to do with the fact that Shanghai attaches great importance to the planning and construction of urban ecological space and landscape. In particular, under the guidance of the new round of planning of green space system in a large urban area, under the influence of the Shanghai world expo, the greening construction of downtown and suburban areas of Shanghai has made great progress. However, in the context of rapid urban develop-ment, there are still many problems in the development of urban green space.
Classification Result Analysis
After the maximum likelihood method was used to interpret the four Langsat remote sensing images from 2007 to 2018, the basic information of urban green spatial distribution in
Table 2: Structure composition of urban green space types in the study area.
Year Area/percentage Woodland Farmland Bringing to Waters Green space Non-green space
2007 Area (km2) 351.7 1177.2 175.7 326.6 2031.2 884.4
Percentage (%) 12.1 40.4 6.0 11.2 69.7 30.3
2010 Area (km2) 331.3 1016.6 181.3 361.6 1890.8 1025.1
The percentage (%) 11.4 34.9 6.2 12.4 64.8 35.2
2014 Area (km2) 313.6 719.8 153.4 332.4 1519.2 1396.7
The percentage (%) 10.8 24.7 5.3 11.4 52.1 47.9
2018 Area (km2) 349.23 512.99 164.25 338.2 1364.7 1579.5
The percentage (%) 12.0 17.6 5.6 11.6 46.8 54.2
Table 3: Evaluation of land use classification accuracy in the study area.
BL CL FL SL WL OL
BL 41 0 0 0 0 6
CL 0 45 7 7 0 0
FL 0 7 35 6 0 0
SL 0 6 8 25 0 0
WL 0 0 0 0 18 0
QL 9 0 0 0 0 30
The overall accuracy (%) 73.6
The coefficient of Kappa 0.73
Note: BL= construction land, CL= farmland, FL= woodland, SL= irrigated and grassy land, WL= water body, OL= other land
1737CHU TOWN URBAN GREEN SPACE EVOLUTION
Nature Environment and Pollution Technology • Vol. 18, No. 5 (Special Issue), 2019
Shanghai was obtained. The test of classification accuracy of remote sensing image is generally to compare and ana-lyse the classification image with the standard map, data or ground measured value, etc., and to express the classification accuracy with the percentage of correct classification (Ta-ble 2). With the support of ENVI4.6, the error obfuscation matrix was established by using the function of middle and middle obfuscation matrix in the classification module post processing, and the overall accuracy and Kappa coefficient were calculated. Taking 2018 as an example, the results show that the overall classification accuracy is 73.6%, and the Kappa coefficient is 0.73 (Table 3). Among them, the mixed classification of woodland, shrub grassland and farmland is larger, and the probability of misclassification of building land and woodland landscape is smaller.
Analysis of Ecological Environment Effect
According to the calculation of carbon sequestration module, air pollution removal module and rainstorm runoff reduction module of CITYgreen software, the total ecological effects in the research area were obtained. According to the affores-tation cost of 250 yuan/tc proposed by Xue Dayuan, the carbon sequestration value was evaluated. The benefit of water and soil conservation can be replaced by the shadow project price, that is, the cost of each 1m3 of reservoir con-struction calculated by the national reservoir construction investment from 1988 to 1991 is 0.67 yuan. The carbon sequestration effect and air pollutant removal effect in the study area generally show a monotonic downward trend. The specific analysis results are as follows: the annual carbon storage, absorption and consumption decreases from 5650636.31t in 2007 to 4965038.55t in 2018, and the ecological benefit value generated decreases by 171399440 yuan. The capacity of purifying air includes the amount of absorbing O3, SO2, NO2, PM10 and CO, which decreased from 5481391.69kg in 2007 to 4816328.56kg in 2018, and its ecological benefit value decreased by 21911571.49 yuan. The rainstorm runoff reduction capacity decreased from 48861311.68cm in 2007 to 43996315.86cm in 2018, and the ecological benefit value decreased by 3259547.20 yuan. The total value of ecological benefits decreased by 196,570,558.68 yuan.
CONCLUSION
Overall, the total area of urban green space in Shanghai dur-ing the study period decreased significantly, from 69.7% in 2007 to 46.8% in 2018, among which farmland saw the larg-est decline. In the process of urbanization, the urban green space in the core urban area shows the trend of first rising and then falling, and the overall trend of rising. During the
study period, farmland has basically disappeared in the core urban area, and there is little left in the fringe urban area. The water landscape shows an overall upward trend in each administrative region of the study area. Vegetation coverage in the study area decreased rapidly due to the shrinking of green space. From the change of vegetation coverage grade composition, the areas of no vegetation coverage, low vegetation coverage and medium vegetation coverage, all showed an overall upward trend, while the areas of high vegetation coverage and total vegetation coverage all showed a sharp downward trend. From the perspective of the transfer trend, the whole vegetation coverage level and the high vegetation coverage level are mainly transformed to the middle and low vegetation coverage level. The middle vegetation cover grade was mainly transformed to low vegetation cover grade and no vegetation cover grade. Low vegetation cover grade is mainly transformed into no vegetation cover grade. Outlook is due to the impact of human activities in the rapid urbanization area, green space dramatic evolution of a complex series of mutual interaction of ecological environment effect, the response to the specific process and mechanism of research, needs the support of the basis of more detailed data, under the effect of multidisciplinary collaboration, a more compre-hensive exploration on different spatial and temporal scale of landscape ecological process and mechanisms.
REFERENCES
Archibald, C.L., Mckinney, M., Mustin, K., Shanahan, D.F., Possin-gham, H.P. 2017. Assessing the impact of revegetation and weed control on urban sensitive bird species. Ecology & Evolution, 7(12): 4200-4208.
Brashears, J.A., Tcm, H., Denardo, D.F. 2017. Modeling the costs and benefits associated with the evolution of endothermy using a robotic python. Journal of Experimental Biology, 220(13): 2409.
Chu, H.Y., Sprouffske, K., Wagner, A. 2018. Assessing the benefits of horizontal gene transfer by laboratory evolution and genome sequenc-ing. BMC Evolutionary Biology, 18(1): 54.
Dey, C.J., O’Connor, C.M., Wilkinson, H., Shultz, S., Balshine, S., Fitzpat-rick, J.L. 2017. Direct benefits and evolutionary transitions to complex societies. Nature Ecology & Evolution, 1(5): 137.
Hendry, A.P., Gotanda, K.M., Svensson, E.I. 2017. Human influences on evolution, and the ecological and societal consequences. Philos. Trans. R Soc. Lond. B Biol. Sci., 372(1712): 20160028.
Kuebbing, S.E., Reimer, A.P., Rosenthal, S.A., Feinberg, G., Leiserowitz, A., Lau, J.A. 2018. Long term research in ecology and evolution: a survey of challenges and opportunities. Ecological Monographs, 88(2).
Meade, L., Harley, E., Cotton, A., Howie, J.M., Pomiankowski, A., Fowler, K. 2017. Variation in the benefits of multiple mating on female fertility in wilds talk Eyed flies. Ecology & Evolution, 7(23): 10103-10115.
Parker, I.D., Facka, A.N., Catanach, T.A., Lyons, E.K. 2018. The benefits of evolution education for natural resources managers. Perspectives in Ecology & Conservation, S2530064417301244.
Pham, T.T., Labbé, D. 2017. Spatial logic and the distribution of open and green public spaces in Hanoi: planning in a dense and rapidly changing city. Urban Policy & Research, 4: 1-18.

1738 Chen Chen et al.
Vol. 18, No. 5 (Special Issue), 2019 • Nature Environment and Pollution Technology
Schell, C.J. 2018. Urban evolutionary ecology and the potential benefits of implementing genomics. Journal of Heredity, 109(2).
Steyven, A., Hart, E., Paechter, B. 2018. An investigation of environmental influence on the benefits of adaptation mechanisms in evolutionary swarm robotics. In Proceedings of the Genetic and Evolutionary
Computation Conference, pp. 155-162.Villegas, R.D., Moland, E., Olsen, E.M. 2017. Potential of contemporary
evolution to erode fishery benefits from marine reserves. Fish & Fisheries, 18(3).

Air Treatment Effect Assessment for Improving Vehicle Emission Standards: Counterfactual Analysis Based on Machine Learning
Yunan Zhang*, Bilin Xu**† and Haroon Rashid****Tianjin University of Finance and Economics, Complex Network System and Innovation Research Center, Tianjin 300022, China**Department of Economics and Management, Tianjin Electronic Information Vocational and Technical College, Tianjin 300350, China***Department of Civil Engineering, Khwaja Fareed University of Engineering and Information Technology, Pakistan †Corresponding author: Bilin Xu
ABSTRACT
Automobile exhaust has become an important source of urban air pollution. Improving vehicle emission standards is one of the key measures to control air pollution. This paper takes Tianjin’s implementation of the “National V” motor vehicle emission standard as an example. The study found that this policy is an indispensable condition for improving air quality, which helps to reduce carbon monoxide (CO) and nitrogen dioxide (NO2) in the atmosphere, but the effect on the treatment of atmospheric pollutants such as particulate matter (PM2.5) and respirable particulate matter (PM10) is not significant. It can be seen that while continuously improving the emission standards of motor vehicles, it should also cooperate with the improvement of public transportation systems, the development of new energy vehicles and alternative fuels, and the targeted regulation of air pollution control measures in other high-energy-consuming industries.
INTRODUCTION
Since the reform and opening up, the number of Chinese residents’ car ownership has shown a rapid growth. Accord-ing to data released by the National Bureau of Statistics, China’s auto sales have been ranked first in the world for nine consecutive years. It has gradually become the largest sales market for global autos from small auto countries. By the end of 2017, the number of civilian vehicles in the country was 217.43 million, an increase of 11.8%. However, while national travel is becoming more and more convenient, large-scale motor vehicle exhaust emissions have gradually become an important cause of urban air pollution and haze, seriously jeopardizing the health of the people (Song et al. 2007).
Since September 1, 2015, Tianjin has taken the lead in implementing the fifth phase of National Motor Vehicle Air Pollutant Emission Standards (referred to as “Country V”), further reducing the limits of pollutants in motor vehicle exhaust. This paper takes the implementation of the National V Standard as an example. Based on the monthly data of air quality during the period from December 2013 to December 2016 in 21 cities such as Tianjin, using Lasso’s counterfactual inference research method to evaluate the improvement of vehicle emission standards for governance of the effect of air pollution.
EARLIER STUDIES
In order to prevent automobile exhaust pollution, govern-ments have introduced many urgent policies and measures. Among them, according to their different mechanisms of action, the existing vehicle exhaust gas treatment measures can be divided into two categories: “market regulation type” and “command control type”. Many scholars have also con-ducted extensive research on this.
Market regulation type: In theory, the “market-regulated” policy can increase the cost of motor vehicles by directly increasing fuel prices or indirectly reducing the price of alternative goods, thereby reducing the use and possession of non-public vehicles to improve the environment. For ex-ample, a research studied the impact of gasoline prices on automobile demand based on US motor vehicle registration data from 1997 to 2005. It was found that the increase in fuel cost can significantly reduce the demand for motor vehicles with high fuel consumption (Li & Haefen 2009). In addition, Chinese scholars found that the fuel consumption of private motor vehicles with a large proportion is not affected by price factors (Penghui & Ruobing 2015). In summary, the air control effect of the “market regulation type” policy is not significant, and it is easy to cause consumer welfare losses.
Command control type: Some scholars have pointed out
Nat. Env. & Poll. Tech.Website: www.neptjournal.com
Received: 30-08-2019 Accepted: 31-10-2019
Key Words:Air treatmentMotor vehicle emission standards Counterfactual analysis Machine learning
2019pp. 1739-1745 Vol. 18
p-ISSN: 0972-6268 No. 5 (Special Issue)
Nature Environment and Pollution Technology An International Quarterly Scientific Journal
Original Research Paper
e-ISSN: 2395-3454
Open Access

1740 Yunan Zhang et al.
Vol. 18, No. 5 (Special Issue), 2019 • Nature Environment and Pollution Technology
that air governance by the government-led “command-con-trolled” policy is more effective. For example, Xiaoguang et al. (2010) used Beijing air quality data to evaluate the effect of the Olympic limit policy. During the implementation of the restricted policy, the concentration of nitrogen dioxide (NO2) and respirable particulate matter in Beijing’s atmosphere was significantly reduced. However, other scholars are sceptical, despite the rapid effect of the “command-controlled” policy, the persistence of policy effects is limited and seriously dis-tort consumer buying behaviour (Davis 2008).
Therefore, in order to scientifically and accurately eval-uate the air treatment effect of improving vehicle emission standards, and in view of the fact that the number of indi-viduals in the reference group is far greater than the number of observable pre-existing periods, this paper combines the machine learning Lasso method with the counterfactual inference method, conducted individual selection and coun-terfactual prediction of control groups.
RESEARCH DESIGN
Principle of counterfactual result estimation: Suppose there are n+1 cities, and each city has a total of T balanced panel observation data for air quality; assume that city 1 is at T0(1 < T0< T). During the period, the implementation of the National V policy began, and the other n regions did not im-plement the National V policy. So, order Dit = 1 representing cityiint. The period was affected by the intervention of the National V policy, Dit = 0. Indicating individual iint. Period is not affected by National V policy intervention.
D
i t T
elseit �� � ��
��
1 1 1
00� ���
� ������������������ �, ,
, Replace Yit(1) with Yit(0) representing the cityiint. If you accept policy intervention and if you do not accept the po-tential consequences of policy intervention, the two cannot be observed at the same time. Yit representing the actual observed results, then the relationship between the potential results and the observations is
YY DY Ditit it
it it
���
���
( )
( )
0 0
1 1
����������
Therefore, the treatment effect of the treatment group in-dividuals who accept the policy intervention of the recipient country can be expressed as follows: τ1 1 1 0 01 0 1 2t t tY Y t T T T� � � � �( ) ( ) , ,...,���� (1)
Since the first city implemented the National V policy, t ≥ T0 period, potential results can be observed Y1t(1), but cannot observe the potential consequences if it is not subject
to policy intervention Y1t(0). In order to estimate the coun-terfactual results of City 1, Y1t(0) can be represented by the following model:
Y b f u i J t Tit i i t it( ) ,..., ; ,...,0 1 1 1� � � � � � �m ����� �� (2)
Where, mi indicates individual i fixed effect, ft is a com-mon factor that represents unobservable, bi indicates the corresponding factor load, uit is a random error term, and E(uit) = 0.
The key to estimating the counterfactual results by re-gression synthesis is that all individuals are affected by the time-varying common factor, and this relationship will be maintained between the cross-section individuals. The ob-servations of the control group interventions are estimated to be the opposite of the intervention group. The following regression model can be established Y Yit t t( ) , ,0 1 1 1 1� � � �� �β β ξ (3)
Where,Y Y Y Y Yt t J t t J t� � �� � � �1 2 1 2 10 0, , ,( ( ),..., ( )) ( ,..., ) , Regres-
sion coefficient β β β� �� �1 2 1( ,..., )J In order to synthesize the weights of the control with the control group individual, specifically, first use before intervention (t = 1,….T0), the
data estimate (3) is obtained β̂1 with β̂−1 . If the treatment group individual does not receive policy intervention, then after the intervention (t = T0 +1, T0+2, ….T) the relationship should also be maintained. Therefore, the counterfactual results of the individual can be processed using the formula (3) prediction. The prediction model is as follows:
ˆ ( ) ˆ ˆ ,...,,Y Y t T Tt t1 1 1 1 00 1� � � � �� �β β ������� (4)
Control group selection: The key to ensuring that formula (4) can better predict counterfactual results is to select which individuals enter the control group. In fact, the number of individual control groups entering the model is not as good as possible. More control group individuals mean a greater loss of degrees of freedom, which in turn reduces the es-timation accuracy. Therefore, this paper uses the machine learning Lasso method to control the selection of individual individuals. Without loss of generality, rewrite equation (3) into a normal regression model, as follows
Y X u t Tt t t� � � �β ����� 1 0,..., ) (5)
Thus, the Lasso method is used to estimate the parame-ters. First, establish the objective function,
( ) | |Y Xt t ii
N
t
T
� � ��
�
��� β l β2
2
1
1
0 (6)
Where, βi is the coefficient of all the independent vari-ables in the initial model (Eq. (5)), | |βii
J
��� 2
1
for L1 norm,
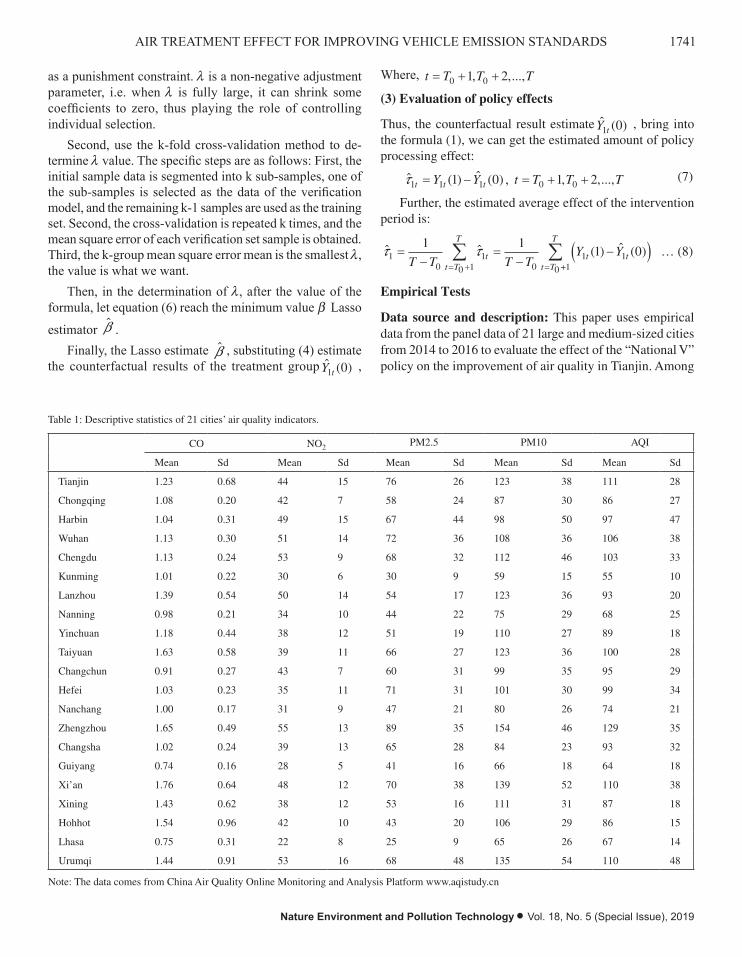
1741AIR TREATMENT EFFECT FOR IMPROVING VEHICLE EMISSION STANDARDS
Nature Environment and Pollution Technology • Vol. 18, No. 5 (Special Issue), 2019
as a punishment constraint. l is a non-negative adjustment parameter, i.e. when l is fully large, it can shrink some coefficients to zero, thus playing the role of controlling individual selection.
Second, use the k-fold cross-validation method to de-termine l value. The specific steps are as follows: First, the initial sample data is segmented into k sub-samples, one of the sub-samples is selected as the data of the verification model, and the remaining k-1 samples are used as the training set. Second, the cross-validation is repeated k times, and the mean square error of each verification set sample is obtained. Third, the k-group mean square error mean is the smallest l, the value is what we want.
Then, in the determination of l, after the value of the formula, let equation (6) reach the minimum value b Lasso
estimator β̂ .Finally, the Lasso estimate β̂ , substituting (4) estimate
the counterfactual results of the treatment group ˆ ( )Y t1 0 ,
Where, t T T T� � �0 01 2, ,...,
(3) Evaluation of policy effects
Thus, the counterfactual result estimate ˆ ( )Y t1 0 , bring into the formula (1), we can get the estimated amount of policy processing effect:
ˆ ( ) ˆ ( ) , ,...,τ1 1 1 0 01 0 1 2t t tY Y t T T T� � � � ����� (7)
Further, the estimated average effect of the intervention period is:
ˆ ˆ ( ) ˆ ( )τ τ10
1
0 1 01 1
0 1
1 11 0�
��
��� �
� � �� �
T T T TY Yt
t T
T
t tt T
T
+
… (8)
Empirical Tests
Data source and description: This paper uses empirical data from the panel data of 21 large and medium-sized cities from 2014 to 2016 to evaluate the effect of the “National V” policy on the improvement of air quality in Tianjin. Among
Table 1: Descriptive statistics of 21 cities’ air quality indicators.
CO NO2 PM2.5 PM10 AQI
Mean Sd Mean Sd Mean Sd Mean Sd Mean Sd
Tianjin 1.23 0.68 44 15 76 26 123 38 111 28
Chongqing 1.08 0.20 42 7 58 24 87 30 86 27
Harbin 1.04 0.31 49 15 67 44 98 50 97 47
Wuhan 1.13 0.30 51 14 72 36 108 36 106 38
Chengdu 1.13 0.24 53 9 68 32 112 46 103 33
Kunming 1.01 0.22 30 6 30 9 59 15 55 10
Lanzhou 1.39 0.54 50 14 54 17 123 36 93 20
Nanning 0.98 0.21 34 10 44 22 75 29 68 25
Yinchuan 1.18 0.44 38 12 51 19 110 27 89 18
Taiyuan 1.63 0.58 39 11 66 27 123 36 100 28
Changchun 0.91 0.27 43 7 60 31 99 35 95 29
Hefei 1.03 0.23 35 11 71 31 101 30 99 34
Nanchang 1.00 0.17 31 9 47 21 80 26 74 21
Zhengzhou 1.65 0.49 55 13 89 35 154 46 129 35
Changsha 1.02 0.24 39 13 65 28 84 23 93 32
Guiyang 0.74 0.16 28 5 41 16 66 18 64 18
Xi’an 1.76 0.64 48 12 70 38 139 52 110 38
Xining 1.43 0.62 38 12 53 16 111 31 87 18
Hohhot 1.54 0.96 42 10 43 20 106 29 86 15
Lhasa 0.75 0.31 22 8 25 9 65 26 67 14
Urumqi 1.44 0.91 53 16 68 48 135 54 110 48
Note: The data comes from China Air Quality Online Monitoring and Analysis Platform www.aqistudy.cn

1742 Yunan Zhang et al.
Vol. 18, No. 5 (Special Issue), 2019 • Nature Environment and Pollution Technology
them, the “National V” policy can be regarded as an air governance policy experiment implemented by the Tianjin Municipal Government, with Tianjin as the processing group individual and the remaining 20 cities that have not implemented the “National V” policy as the control group individual. Therefore, after the implementation of the pol-icy (after September 1, 2015), the air quality status of the “National V” standard was not implemented in Tianjin. After the implementation of the policy, and then the “National V” standard was implemented. After implementing, Tianjin’s actual air quality situation is compared to estimate the impact of the “National V” standard on Tianjin air quality. Among them, the main measures of this policy for carbon monoxide (CO), nitrogen dioxide (NO2), particulate matter (PM2.5), respirable particulate matter (PM10) and other air pollutants and air quality (AQI) Governance effect. Table 1 is a descrip-tive statistical analysis of five air quality indicators for 21 cities, where Mean represents the mean and Sd represents the standard deviation.
Inspection analysis: This paper draws on the similar dis-placement test method proposed by Abadie et al. (2010), that is, the individual placebo test, to test the average causal effect to determine whether there are other cities with no V standard in the country; the situation, and how likely it is to appear. The test ideas and implementation steps are as follows:
First of all, the original hypothesis is that the air govern-ance effect of the National V standard is not significant, so that Tianjin can be regarded as a control group individual. Then, a city is randomly selected from the remaining 20 cities as the processing group individual, and the policy effect of the city is estimated. In addition, 20 cities outside Tianjin were selected as treatment group individuals, and the synthetic
objects based on Lasso were used to construct the synthetic objects of the corresponding cities, thus obtaining 20 policy effect estimates. Finally, compare the policy effects of Tian-jin’s actual production and the policy effects of the control group’s urban assumptions. If the policy effect gap between the two is large enough, then there is reason to believe that the policy effect of the National V standard is significant.
Placebo tests for CO, NO2, PM2.5, PM10, and AQI were performed in this paper. The results are shown in Figs. 1-5. The left side of each figure shows the placebo test results of the variables of interest, the solid line shows the counterfac-tual results obtained by Tianjin as the treatment group, and the dotted line shows the estimated results obtained by other cities as treatment groups.
In Fig. 1, before June 2015, the gap between the CO-con-tent changes of Tianjin and other cities was not large, but after the implementation of the National V standard, the gap between the CO-content changes of Tianjin and other cities gradually widened, and its distribution was located outside the other cities. This indicates that the National V policy significantly reduces the CO-content in the atmosphere. Similarly, as can be seen from Fig. 2, before June 2015, the difference in NO2 content between Tianjin and other cities was not large, but after the implementation of the National V standard, the NO2 content of Tianjin and other cities changed. The gap has gradually widened and its distribution is also outside the other cities. To a certain extent, it is shown that the reduction of CO and NO2 content in the atmosphere is significant after the implementation of the National V standard in Tianjin.
However, as shown in Figs. 3-5, after the implementation of the National V standard, the gap between PM2.5, PM10
-1.6
-1.2
-0.8
-0.4
0.0
0.4
0.8
1.2
1.6
Q4 Q1 Q2 Q3 Q4 Q1 Q2 Q3 Q4 Q1 Q2 Q3 Q4
2014 2015 2016
Fig. 1: Difference distribution of cities in CO.
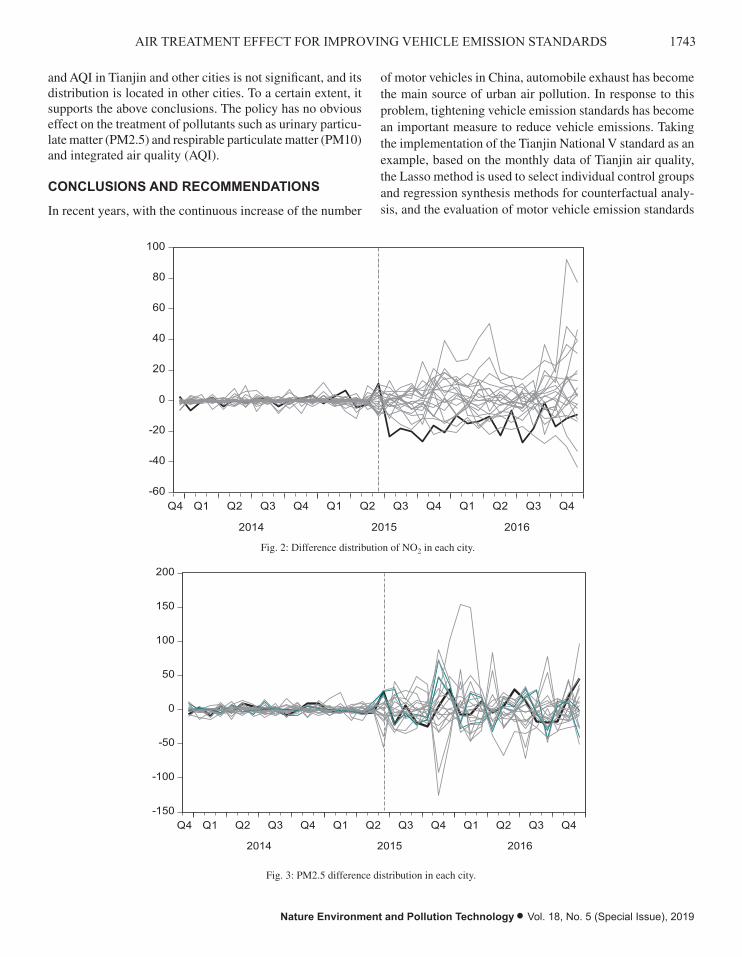
1743AIR TREATMENT EFFECT FOR IMPROVING VEHICLE EMISSION STANDARDS
Nature Environment and Pollution Technology • Vol. 18, No. 5 (Special Issue), 2019
and AQI in Tianjin and other cities is not significant, and its distribution is located in other cities. To a certain extent, it supports the above conclusions. The policy has no obvious effect on the treatment of pollutants such as urinary particu-late matter (PM2.5) and respirable particulate matter (PM10) and integrated air quality (AQI).
CONCLUSIONS AND RECOMMENDATIONS
In recent years, with the continuous increase of the number
of motor vehicles in China, automobile exhaust has become the main source of urban air pollution. In response to this problem, tightening vehicle emission standards has become an important measure to reduce vehicle emissions. Taking the implementation of the Tianjin National V standard as an example, based on the monthly data of Tianjin air quality, the Lasso method is used to select individual control groups and regression synthesis methods for counterfactual analy-sis, and the evaluation of motor vehicle emission standards
-60
-40
-20
0
20
40
60
80
100
Q4 Q1 Q2 Q3 Q4 Q1 Q2 Q3 Q4 Q1 Q2 Q3 Q4
2014 2015 2016
Fig. 2: Difference distribution of NO2 in each city.
-150
-100
-50
0
50
100
150
200
Q4 Q1 Q2 Q3 Q4 Q1 Q2 Q3 Q4 Q1 Q2 Q3 Q4
2014 2015 2016
Fig. 3: PM2.5 difference distribution in each city.
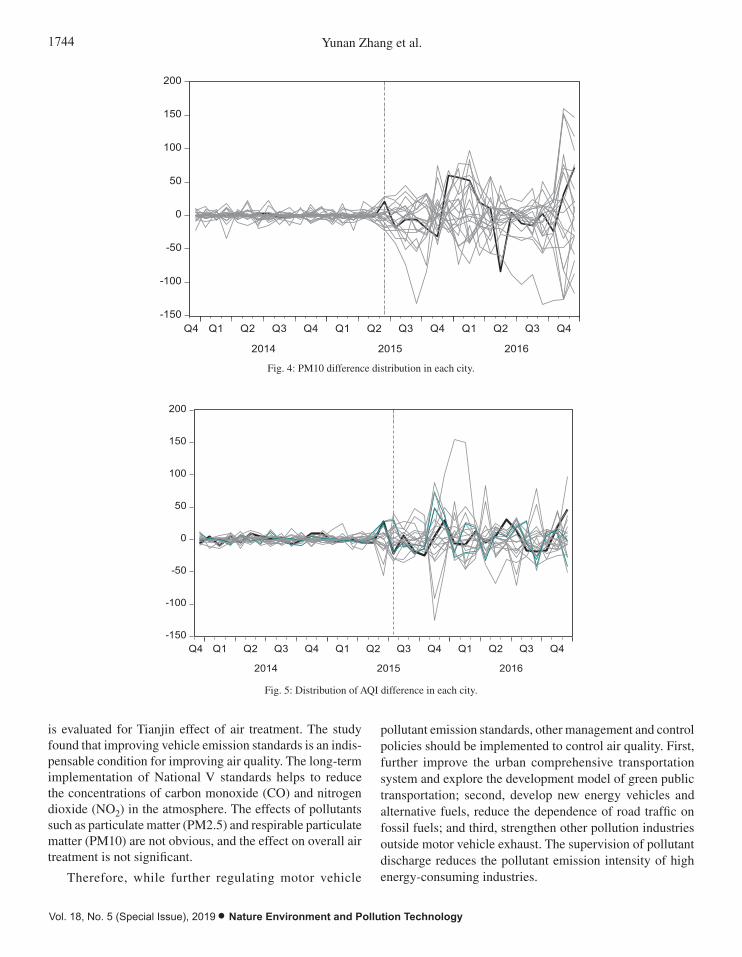
1744 Yunan Zhang et al.
Vol. 18, No. 5 (Special Issue), 2019 • Nature Environment and Pollution Technology
is evaluated for Tianjin effect of air treatment. The study found that improving vehicle emission standards is an indis-pensable condition for improving air quality. The long-term implementation of National V standards helps to reduce the concentrations of carbon monoxide (CO) and nitrogen dioxide (NO2) in the atmosphere. The effects of pollutants such as particulate matter (PM2.5) and respirable particulate matter (PM10) are not obvious, and the effect on overall air treatment is not significant.
Therefore, while further regulating motor vehicle
pollutant emission standards, other management and control policies should be implemented to control air quality. First, further improve the urban comprehensive transportation system and explore the development model of green public transportation; second, develop new energy vehicles and alternative fuels, reduce the dependence of road traffic on fossil fuels; and third, strengthen other pollution industries outside motor vehicle exhaust. The supervision of pollutant discharge reduces the pollutant emission intensity of high energy-consuming industries.
-150
-100
-50
0
50
100
150
200
Q4 Q1 Q2 Q3 Q4 Q1 Q2 Q3 Q4 Q1 Q2 Q3 Q4
2014 2015 2016
Fig. 4: PM10 difference distribution in each city.
-150
-100
-50
0
50
100
150
200
Q4 Q1 Q2 Q3 Q4 Q1 Q2 Q3 Q4 Q1 Q2 Q3 Q4
2014 2015 2016
Fig. 5: Distribution of AQI difference in each city.

1745AIR TREATMENT EFFECT FOR IMPROVING VEHICLE EMISSION STANDARDS
Nature Environment and Pollution Technology • Vol. 18, No. 5 (Special Issue), 2019
ACKNOWLEDGEMENTS
Project supported by National Natural Science Foundation of China (Grant No. 71502121)
REFERENCES
Davis, L.W. 2008. The effect of driving restrictions on air quality in Mexico City. Journal of Political Economy, pp. 116.
Jing, C., Xin, W. and Xiaohan, Z. 2014. Does the restriction policy improve the air quality in Beijing? Economics 3: 1091-1126.
Li, S. and Haefen, T.R.H.V. 2009. How do gasoline prices affect fleet fuel
economy? American Economic Journal: Economic Policy, 1(2): 113-137.Penghui, X. and Ruobing, L. 2015 Impact of oil price changes on air pollution:
using motor vehicles as a transmission path. China Industrial Economy, 10: 100-114.
Song, Y., Shao, M. and Liu, Y. 2007. Source apportionment of ambient volatile organic compounds in Beijing. Environmental Science &Technology, 41(12): 4348-4353.
Wu, Y., Wang, R. and Zhou, Y. 2011. On road vehicle emission control in Beijing: past, present, and future. Environmental Science & Technology, 45(1): 147-53.
Xiaoguang, Z., Zhencheng, X. and Xuan, W. 2010. Analysis of the impact of Beijing motor vehicle restrictions on air quality. Journal of Safety and Environment, 4: 82-87.

Vol. 18, No. 5 (Special Issue), 2019 • Nature Environment and Pollution Technology
1746
Effects of Different Microbial Treatments on the Removal of Petroleum Hydrocarbons from Soil
Hong Liu*, Pengfei Gao*, Jing Fu* and Haroon Rashid***School of Resources and Environment Engineering, Jilin Institute of Chemical Technology, Jilin 132022, China**Department of Civil Engineering, Khwaja Fareed University of Engineering and Information Technology, Rahim Yar Khan, Pakistan
ABSTRACT
In order to study the effect of different microbial treatment methods on the removal of petroleum hydrocarbons in soil, microbial remediation of Zichang oil-polluted soil in northern Shaanxi province was studied by means of bacterial inoculation and biological stimulation. By using infrared spectrophotometry to determine the removal effect of different treatment methods on petroleum hydrocarbon, the best scheme for remediation of oil-polluted soil in northern Shaanxi province was determined. In the restoration process, the maximum possible count method (MPN), PCR-agar-electrophoresis, and PCR-DGGE were used to determine the number of oil-hydrocarbon degrading bacteria, catalytic genes, and soil microbial diversity to study the ecological effects of soil microorganisms. The results showed that the remediation effects of different biological treatments on oil-contaminated soil were as follows: biological stimulation (N and P nutrients were added) > biological enhancement (degradation bacteria were added) > and others. There was a positive correlation between the degradation rate of petroleum hydrocarbon in soil and the catalytic gene content of degradable petroleum hydrocarbon. During the restoration process, the number of petroleum hydrocarbons and alkane degrading bacteria in soil was significantly higher than that of PAHs degrading bacteria. The addition of exogenous degrading bacteria sz-1 could significantly improve the diversity of soil bacterial community. The results are helpful to understand the change of microbial ecological effect in bioremediation of petroleum soil.
INTRODUCTION
Petroleum is mainly composed of alkanes, aromatic hydro-carbons and cycloalkanes, in addition to a small number of non-hydrocarbon compounds. In the process of oil exploita-tion, transportation and use, various kinds of environmental pollution are caused by leakage. The strong adhesion of petroleum will affect the composition and structure of microorganisms in the soil after it enters the soil. On the other hand, it will hinder the respiration of plant roots and the absorption of nutrients, leading to poor growth and even death of plants (Tariq et al. 2018, Razzak et al. 2018). Harmful substances in petroleum can enter the human body through the food chain and directly harm human health. In particular, polycyclic aromatic hydrocarbons (PAHs) have carcinogenic, teratogenic and mutagenic effects (Onwuka et al. 2019, Randhawa et al. 2019). Microbial remediation has become an important technique for remediation of soil oil pollution due to its advantages such as simple operation, low cost, little pollution to the surrounding environment and basically no secondary pollution. At present, many research-ers are devoted to the research of bioremediation of oily soil by screening highly effective oil-degrading bacteria. In this paper, microbial remediation of Zichang oil-polluted soil in northern Shaanxi province was studied by means of microbial
inoculation and biological stimulation (Sarwar et al. 2019, Man & Hwang 2017).
EARLIER STUDIES
There are many research methods for petroleum hydrocar-bon in soil, such as soxhlet extraction, ultrasonic extraction and accelerated solvent extraction for pre-treatment of total petroleum hydrocarbon in soil (Ibrahim et al. 2018). Effects of different plant species, different soil conditioner and microbial agents and other conditions on the phytoreme-diation effect of petroleum hydrocarbon in soil and effects of complexation Fe2+catalysed H2O2 on the removal rate of petroleum hydrocarbon (TPH) and organic matter (SOM) (Li et al. 2018). These methods are feasible, but the spe-cific implementation is more complex and requires certain equipment, different raw materials, etc., for the application.
Microbial remediation is a new, economical, efficient and ecologically sustainable green and clean technology for treating oil-contaminated soil (Chen et al. 2017). A study has shown that immobilization techniques, particularly in harsh environments, can improve biodegradation rates (Partovinia & Rasekh 2018). Previous research carried out laboratory simulated remediation study on oil-polluted yellow soil by
Nat. Env. & Poll. Tech.Website: www.neptjournal.com
Received: 07-08-2019 Accepted: 18-10-2019
Key Words:Petroleum hydrocarbonsPetroleum contaminated soil Microbial remediation Maximum possible count
2019pp. 1747-1755 Vol. 18
p-ISSN: 0972-6268 No. 5 (Special Issue)
Nature Environment and Pollution Technology An International Quarterly Scientific Journal
Original Research Paper
e-ISSN: 2395-3454
Open Access

1748 Hong Liu et al.
Vol. 18, No. 5 (Special Issue), 2019 • Nature Environment and Pollution Technology
using microbial method, and evaluated the remediation effect and influencing factors by measuring the contents of different hydrocarbon components, nitrogen and available phospho-rus in different forms and the number of oil-hydrocarbon degrading bacteria in the remediation process (Alhawash et al. 2018). Alavi et al. (2017) studied the remediation effect of different bioremediation methods on long-term contam-inated soil in oil field area and analysed the typical correla-tion between petroleum pollutants and microbial variables and soil physical and chemical properties variables. Liu et al. (2017) studied the response of microbial communities and selected petroleum hydrocarbon (pH) degradation genes in soil/sediments at different geographical locations to simulated pH overflow. A recent study used a variety of microbial binders to generate peroxidase and biosurfactant in the original position of SCR, promoting the enzymatic biodegradation of TPH and accelerating the biodegradation of petroleum hydrocarbon and COD removal (Moussavi et al. 2017). Maddela et al. (2017) conducted a field feasibility study on the total petroleum hydrocarbon (TPH) degradation potential of Bacillus thuringiensis B3, Bacillus cereus B6 and two fungi (Geomyces pannulum HR and Geomyces sp.).
In this paper, microbial remediation of Zichang oil-pol-luted soil in northern Shaanxi province was studied by means of microbial inoculation and biological stimulation. In the restoration process, the maximum possible count method (MPN), PCR-agar-electrophoresis, and PCR-DGGE were used to determine the number of oil-hydrocarbon degrading bacteria, catalytic genes, and soil microbial diversity to study the ecological effects of soil microorganisms.
MATERIALS AND METHODS
Tested Soil and Oil-Hydrocarbon Degrading Bacteria
Petroleum contaminated soil around an oil well in Zichang
county, northern Shaanxi was selected, screened and mixed with 20-mesh sieve, and then used as soil for oil pollution degradation and remediation. Bush-hass medium was used to isolate and screen out the oil-hydrocarbon degrading bacteria SZ-1 (Acinetobacter) from the soil for remediation study.
Medium and Reagents
Bush-hass medium, 1.2 % agarose gel, 50×TAE buffer; the preparation method of PBS buffer solution is shown in literature [21]. Soil DNA extraction kit: PowerSoil DNA Iso-lationKit, MOBIO; Cloning kit: PMD19t, TAKARA;Mixed PAHs solution: phenanthrene (10g), anthracene (1g), pyrene (1g), dibenzothiophene (1g), dissolved with dichloromethane (1L). Iodonitrotetrazolium (INT) (3g·L-1) solution:3g of Iodonitrotetrazolium powder was accurately weighed, and the volume was fixed to 1L with sterilized pure water. 1.5% agarose gel:1×TAE buffer (50mL) was placed in a 250mL conical flask, and agar-agar powder (0.75g) was added to the buffer. The bottle was sealed with tin foil, and the agar-agar powder was completely dissolved after heating in the microwave oven for 2 minutes.
Experimental Scheme for Microbial Remediation of Oil-Contaminated Soil
500g of tested soil was respectively weighed and divided into a round porcelain basin. The soil was treated with bioreme-diation for 8 weeks according to the scheme shown in Table 1. During the restoration, the soil was turned evenly every day to maintain air permeability.
Methods for Determination of Petroleum Hydrocarbons in Soil Under Different Remediation Treatments
Soil samples of the above treatments were taken, dried and ground, and 1g of soil samples of each treatment were accurately weighed in a weighing flask, and 25mL carbon
Table 1: Microbial remediation treatment scheme for petroleum contaminated soil.
Repair treatment number Soil remediation treatment program
1 Natural state test soil + sterilized pure water (soil moisture content 40%)
2 Sterilized test soil + sterilized pure water (soil moisture content 40%)
3 Natural state test soil + SZ-1 bacterial suspension + sterilized pure water (soil moisture content 40%)
4 Natural state test soil + nitrogen and phosphorus nutrient solution (soil C: N: P = 100:10:1) + sterilized pure water (soil moisture
5 Test soil in natural state + SZ-1 bacterial suspension + nitrogen and phosphorus nutrition (soil C: N: P = 100:10:1) + sterilized pure water (soil moisture content 40%)
6 Sterilized test soil + sz-1 suspension + sterilized pure water (soil moisture content 40%)
1) Sterilization soil using 0.103 MPa, 121°C, 1h pressure steam sterilization; SZ-1 bacterial suspension: inoculated bacterial suspension (20mL of D620= 2.0) was placed in the test soil, and the number of degraded bacteria in the test soil was guaranteed to reach 109 ·g-1.Soil C: N: P =100:10:1 [add (NH4)2SO4 and KH2PO4 respectively as 19.6 g·kg-1 and 0.9 g·kg-1]; keep 40% soil water content (187.5mL sterilized pure water)
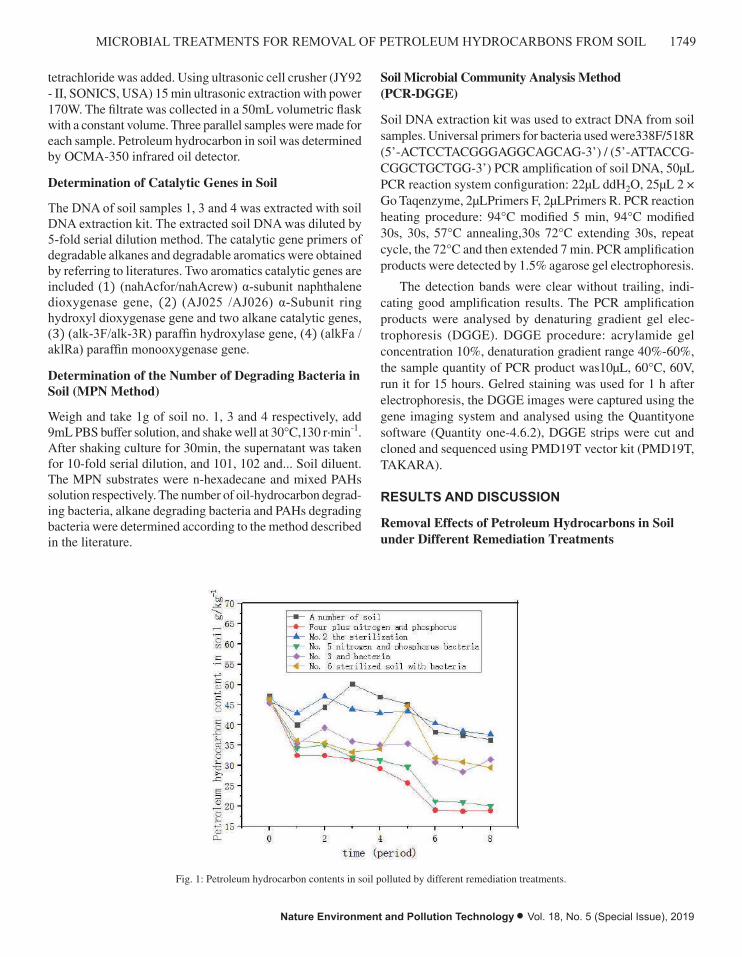
1749MICROBIAL TREATMENTS FOR REMOVAL OF PETROLEUM HYDROCARBONS FROM SOIL
Nature Environment and Pollution Technology • Vol. 18, No. 5 (Special Issue), 2019
tetrachloride was added. Using ultrasonic cell crusher (JY92 - II, SONICS, USA) 15 min ultrasonic extraction with power 170W. The filtrate was collected in a 50mL volumetric flask with a constant volume. Three parallel samples were made for each sample. Petroleum hydrocarbon in soil was determined by OCMA-350 infrared oil detector.
Determination of Catalytic Genes in Soil
The DNA of soil samples 1, 3 and 4 was extracted with soil DNA extraction kit. The extracted soil DNA was diluted by 5-fold serial dilution method. The catalytic gene primers of degradable alkanes and degradable aromatics were obtained by referring to literatures. Two aromatics catalytic genes are included (1) (nahAcfor/nahAcrew) α-subunit naphthalene dioxygenase gene, (2) (AJ025 /AJ026) α-Subunit ring hydroxyl dioxygenase gene and two alkane catalytic genes, (3) (alk-3F/alk-3R) paraffin hydroxylase gene, (4) (alkFa /aklRa) paraffin monooxygenase gene.
Determination of the Number of Degrading Bacteria in Soil (MPN Method)
Weigh and take 1g of soil no. 1, 3 and 4 respectively, add 9mL PBS buffer solution, and shake well at 30°C,130 r·min-1. After shaking culture for 30min, the supernatant was taken for 10-fold serial dilution, and 101, 102 and... Soil diluent. The MPN substrates were n-hexadecane and mixed PAHs solution respectively. The number of oil-hydrocarbon degrad-ing bacteria, alkane degrading bacteria and PAHs degrading bacteria were determined according to the method described in the literature.
Soil Microbial Community Analysis Method (PCR-DGGE)
Soil DNA extraction kit was used to extract DNA from soil samples. Universal primers for bacteria used were338F/518R (5’-ACTCCTACGGGAGGCAGCAG-3’) / (5’-ATTACCG-CGGCTGCTGG-3’) PCR amplification of soil DNA, 50μL PCR reaction system configuration: 22μL ddH2O, 25μL 2 × Go Taqenzyme, 2μLPrimers F, 2μLPrimers R. PCR reaction heating procedure: 94°C modified 5 min, 94°C modified 30s, 30s, 57°C annealing,30s 72°C extending 30s, repeat cycle, the 72°C and then extended 7 min. PCR amplification products were detected by 1.5% agarose gel electrophoresis.
The detection bands were clear without trailing, indi-cating good amplification results. The PCR amplification products were analysed by denaturing gradient gel elec-trophoresis (DGGE). DGGE procedure: acrylamide gel concentration 10%, denaturation gradient range 40%-60%, the sample quantity of PCR product was10μL, 60°C, 60V, run it for 15 hours. Gelred staining was used for 1 h after electrophoresis, the DGGE images were captured using the gene imaging system and analysed using the Quantityone software (Quantity one-4.6.2), DGGE strips were cut and cloned and sequenced using PMD19T vector kit (PMD19T, TAKARA).
RESULTS AND DISCUSSION
Removal Effects of Petroleum Hydrocarbons in Soil under Different Remediation Treatments
Fig. 1: Petroleum hydrocarbon contents in soil polluted by different remediation treatments.
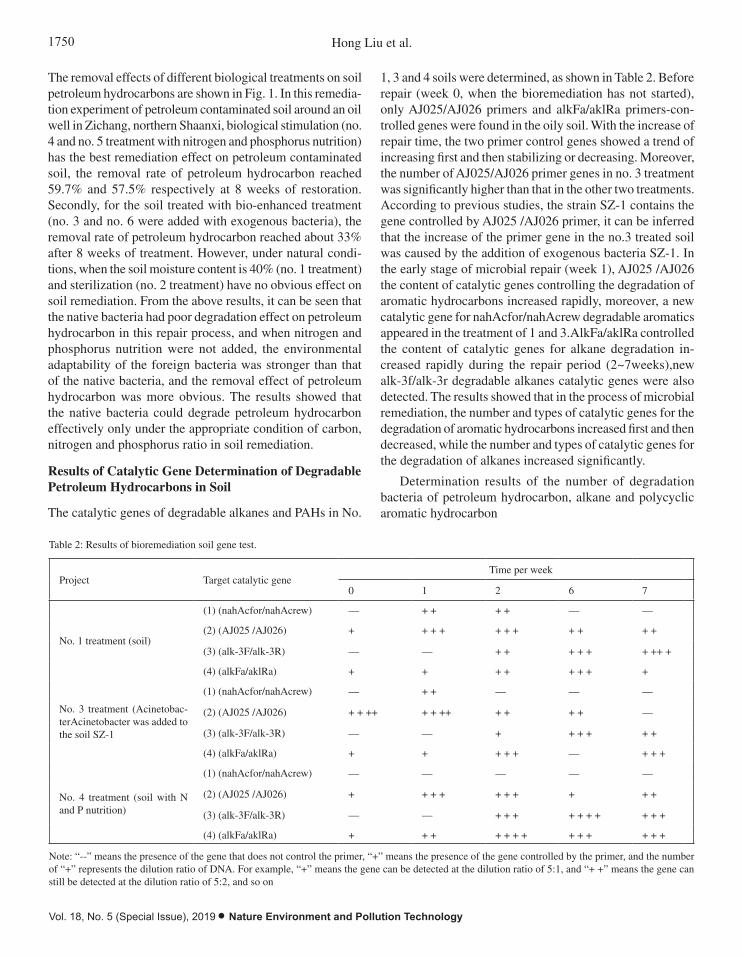
1750 Hong Liu et al.
Vol. 18, No. 5 (Special Issue), 2019 • Nature Environment and Pollution Technology
The removal effects of different biological treatments on soil petroleum hydrocarbons are shown in Fig. 1. In this remedia-tion experiment of petroleum contaminated soil around an oil well in Zichang, northern Shaanxi, biological stimulation (no. 4 and no. 5 treatment with nitrogen and phosphorus nutrition) has the best remediation effect on petroleum contaminated soil, the removal rate of petroleum hydrocarbon reached 59.7% and 57.5% respectively at 8 weeks of restoration. Secondly, for the soil treated with bio-enhanced treatment (no. 3 and no. 6 were added with exogenous bacteria), the removal rate of petroleum hydrocarbon reached about 33% after 8 weeks of treatment. However, under natural condi-tions, when the soil moisture content is 40% (no. 1 treatment) and sterilization (no. 2 treatment) have no obvious effect on soil remediation. From the above results, it can be seen that the native bacteria had poor degradation effect on petroleum hydrocarbon in this repair process, and when nitrogen and phosphorus nutrition were not added, the environmental adaptability of the foreign bacteria was stronger than that of the native bacteria, and the removal effect of petroleum hydrocarbon was more obvious. The results showed that the native bacteria could degrade petroleum hydrocarbon effectively only under the appropriate condition of carbon, nitrogen and phosphorus ratio in soil remediation.
Results of Catalytic Gene Determination of Degradable Petroleum Hydrocarbons in Soil
The catalytic genes of degradable alkanes and PAHs in No.
Table 2: Results of bioremediation soil gene test.
Project Target catalytic gene Time per week
0 1 2 6 7
No. 1 treatment (soil)
(1) (nahAcfor/nahAcrew) — + + + + — —
(2) (AJ025 /AJ026) + + + + + + + + + + +
(3) (alk-3F/alk-3R) — — + + + + + + ++ +
(4) (alkFa/aklRa) + + + + + + + +
No. 3 treatment (Acinetobac-terAcinetobacter was added to the soil SZ-1
(1) (nahAcfor/nahAcrew) — + + — — —
(2) (AJ025 /AJ026) + + ++ + + ++ + + + + —
(3) (alk-3F/alk-3R) — — + + + + + +
(4) (alkFa/aklRa) + + + + + — + + +
No. 4 treatment (soil with N and P nutrition)
(1) (nahAcfor/nahAcrew) — — — — —
(2) (AJ025 /AJ026) + + + + + + + + + +
(3) (alk-3F/alk-3R) — — + + + + + + + + + +
(4) (alkFa/aklRa) + + + + + + + + + + + + +
Note: “--” means the presence of the gene that does not control the primer, “+” means the presence of the gene controlled by the primer, and the number of “+” represents the dilution ratio of DNA. For example, “+” means the gene can be detected at the dilution ratio of 5:1, and “+ +” means the gene can still be detected at the dilution ratio of 5:2, and so on
1, 3 and 4 soils were determined, as shown in Table 2. Before repair (week 0, when the bioremediation has not started), only AJ025/AJ026 primers and alkFa/aklRa primers-con-trolled genes were found in the oily soil. With the increase of repair time, the two primer control genes showed a trend of increasing first and then stabilizing or decreasing. Moreover, the number of AJ025/AJ026 primer genes in no. 3 treatment was significantly higher than that in the other two treatments. According to previous studies, the strain SZ-1 contains the gene controlled by AJ025 /AJ026 primer, it can be inferred that the increase of the primer gene in the no.3 treated soil was caused by the addition of exogenous bacteria SZ-1. In the early stage of microbial repair (week 1), AJ025 /AJ026 the content of catalytic genes controlling the degradation of aromatic hydrocarbons increased rapidly, moreover, a new catalytic gene for nahAcfor/nahAcrew degradable aromatics appeared in the treatment of 1 and 3.AlkFa/aklRa controlled the content of catalytic genes for alkane degradation in-creased rapidly during the repair period (2~7weeks),new alk-3f/alk-3r degradable alkanes catalytic genes were also detected. The results showed that in the process of microbial remediation, the number and types of catalytic genes for the degradation of aromatic hydrocarbons increased first and then decreased, while the number and types of catalytic genes for the degradation of alkanes increased significantly.
Determination results of the number of degradation bacteria of petroleum hydrocarbon, alkane and polycyclic aromatic hydrocarbon
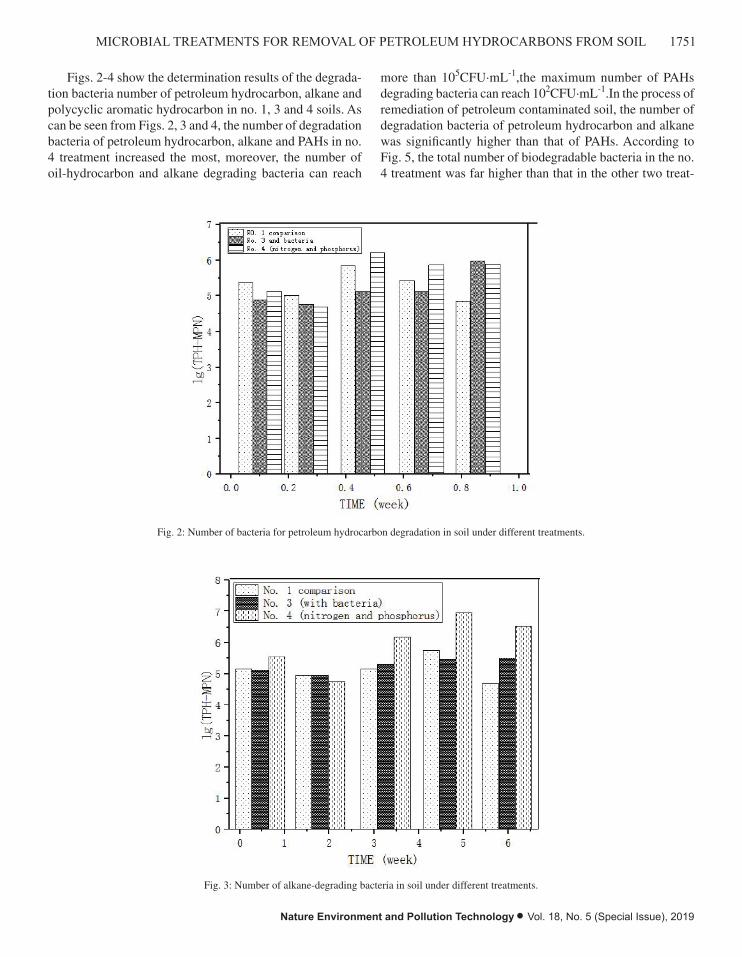
1751MICROBIAL TREATMENTS FOR REMOVAL OF PETROLEUM HYDROCARBONS FROM SOIL
Nature Environment and Pollution Technology • Vol. 18, No. 5 (Special Issue), 2019
Figs. 2-4 show the determination results of the degrada-tion bacteria number of petroleum hydrocarbon, alkane and polycyclic aromatic hydrocarbon in no. 1, 3 and 4 soils. As can be seen from Figs. 2, 3 and 4, the number of degradation bacteria of petroleum hydrocarbon, alkane and PAHs in no. 4 treatment increased the most, moreover, the number of oil-hydrocarbon and alkane degrading bacteria can reach
more than 105CFU·mL-1,the maximum number of PAHs degrading bacteria can reach 102CFU·mL-1.In the process of remediation of petroleum contaminated soil, the number of degradation bacteria of petroleum hydrocarbon and alkane was significantly higher than that of PAHs. According to Fig. 5, the total number of biodegradable bacteria in the no. 4 treatment was far higher than that in the other two treat-
Fig. 2: Number of bacteria for petroleum hydrocarbon degradation in soil under different treatments.
Fig. 3: Number of alkane-degrading bacteria in soil under different treatments.
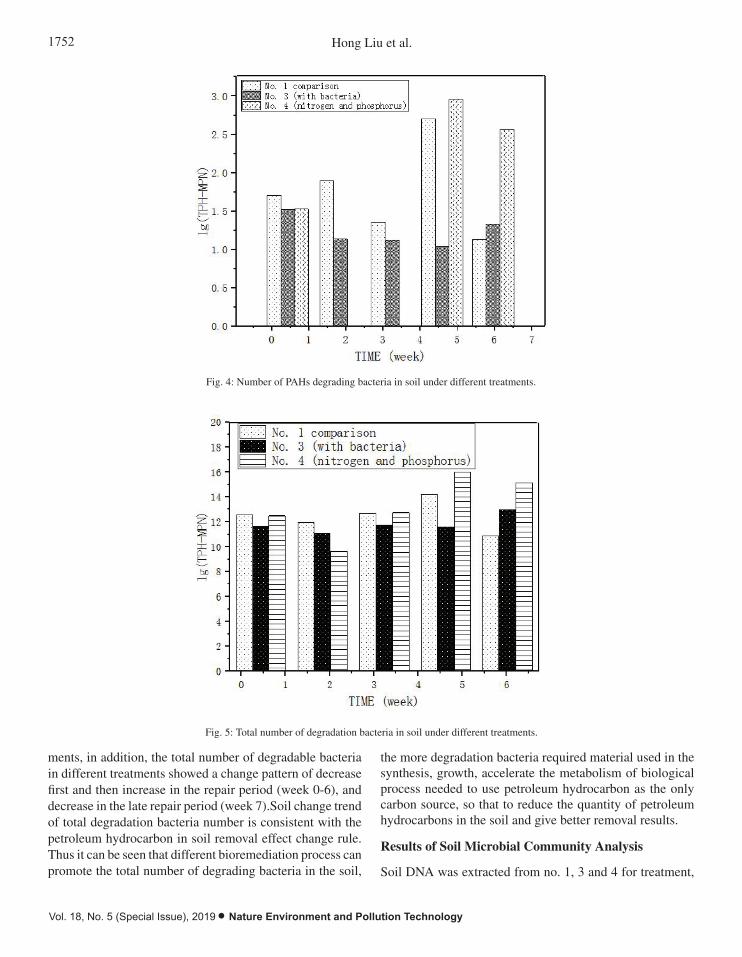
1752 Hong Liu et al.
Vol. 18, No. 5 (Special Issue), 2019 • Nature Environment and Pollution Technology
ments, in addition, the total number of degradable bacteria in different treatments showed a change pattern of decrease first and then increase in the repair period (week 0-6), and decrease in the late repair period (week 7).Soil change trend of total degradation bacteria number is consistent with the petroleum hydrocarbon in soil removal effect change rule. Thus it can be seen that different bioremediation process can promote the total number of degrading bacteria in the soil,
Fig. 4: Number of PAHs degrading bacteria in soil under different treatments.
the more degradation bacteria required material used in the synthesis, growth, accelerate the metabolism of biological process needed to use petroleum hydrocarbon as the only carbon source, so that to reduce the quantity of petroleum hydrocarbons in the soil and give better removal results.
Results of Soil Microbial Community Analysis
Soil DNA was extracted from no. 1, 3 and 4 for treatment,
Fig. 5: Total number of degradation bacteria in soil under different treatments.
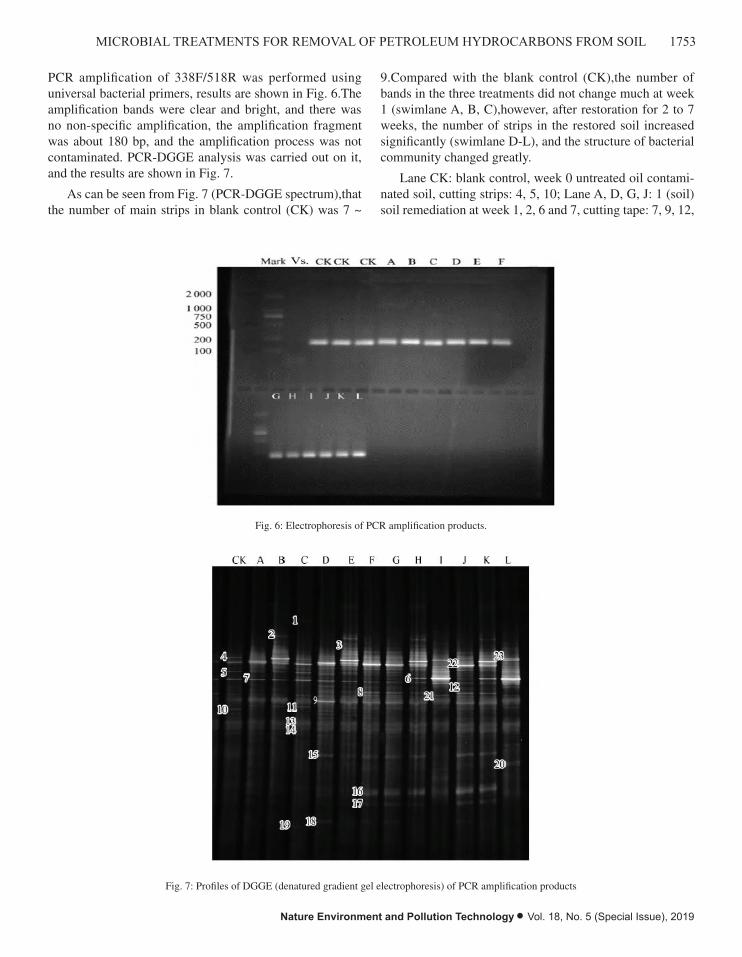
1753MICROBIAL TREATMENTS FOR REMOVAL OF PETROLEUM HYDROCARBONS FROM SOIL
Nature Environment and Pollution Technology • Vol. 18, No. 5 (Special Issue), 2019
PCR amplification of 338F/518R was performed using universal bacterial primers, results are shown in Fig. 6.The amplification bands were clear and bright, and there was no non-specific amplification, the amplification fragment was about 180 bp, and the amplification process was not contaminated. PCR-DGGE analysis was carried out on it, and the results are shown in Fig. 7.
As can be seen from Fig. 7 (PCR-DGGE spectrum),that the number of main strips in blank control (CK) was 7 ~
9.Compared with the blank control (CK),the number of bands in the three treatments did not change much at week 1 (swimlane A, B, C),however, after restoration for 2 to 7 weeks, the number of strips in the restored soil increased significantly (swimlane D-L), and the structure of bacterial community changed greatly.
Lane CK: blank control, week 0 untreated oil contami-nated soil, cutting strips: 4, 5, 10; Lane A, D, G, J: 1 (soil) soil remediation at week 1, 2, 6 and 7, cutting tape: 7, 9, 12,
Fig. 6: Electrophoresis of PCR amplification products.
Fig. 7: Profiles of DGGE (denatured gradient gel electrophoresis) of PCR amplification products

1754 Hong Liu et al.
Vol. 18, No. 5 (Special Issue), 2019 • Nature Environment and Pollution Technology
15, 18, 22; Lane B, E, H, K: No. 3 (soil bacteria SZ-1) soil remediation at week 1, 2, 6 and 7, cutting tape: 2, 3, 6; Lane C, F, I, L: 4 (nitrogen and phosphorus added to soil) soil remediation at week 1, 2, 6 and 7, cutting tape: 1, 8, 11, 13, 14, 16, 17, 19, 20, 21, 23
Lane CK: blank control, week 0 untreated oil contam-inated soil, cutting strips: 4, 5, 10;Lane A, D, G, J: 1 (soil)soil remediation at week 1, 2, 6 and 7,cutting tape: 7, 9, 12, 15, 18, 22;Lane B, E, H, K: no. 3 (soil bacteria SZ-1)soil remediation at week 1, 2, 6 and 7,cutting tape: 2, 3, 6;Lane C, F, I, L: 4 (nitrogen and phosphorus added to soil)soil remediation at week 1, 2, 6 and 7,cutting tape: 1, 8, 11, 13, 14, 16, 17, 19, 20, 21, 23
Strip 2 in week 1, 2, 6 and 7 (corresponding to swim-ming lanes B, E, H and K) of no. 3 treatment was cut and cloned and sequenced, it was found that this band belongs to Acinetobacter. Blast alignment results showed that the similarity between band 2 and degradation bacteria SZ-1 was more than 99%, therefore, it can be preliminarily concluded that this article may contain additional degradation bacteria SZ-1. Quantityone software quantitatively analysed the DNA concentration of the main strip of the DGGE swimming lane (trace),the results are shown in Fig. 8. At week 1 of restoration, compared with blank control (CK), the DNA concentration in soil samples with different treatments did not change much (swimlane A, B, C), but with the increase of restoration time, the total concentration of DNA in soil with different treatments basically showed an increasing trend.
CONCLUSION
In this paper, microbial remediation of Zichang oil-polluted soil in northern Shaanxi province was studied by means of microbial inoculation and biological stimulation. The con-clusions are as follows:
(1) The order of restoration effect of oil contaminated soil samples in Zichang, northern Shaanxi is from good to bad: add N and P nutrients to the soil> add Acinetobacter SZ-1 > and other treatments to the soil. The native bacteria can degrade petroleum hydrocarbon effectively only under the suitable condition of carbon, nitrogen and phosphorus ratio. Exogenous bacteria SZ-1 has stronger environmental adaptability than native bacteria and can effectively degrade petroleum hydrocarbons in soil.
(2) The more the total number of catalytic genes and the total number of degrading bacteria in the soil, the better the removal effect of petroleum hydrocarbons in the soil. The number of PAHs degrading bacteria in the remediation soil was significantly higher than that of PAHs degrading bacteria.
REFERENCES
Alavi, N., Parseh, I., Ahmadi, M., Jafarzadeh, N., Yari, A.R., Chehrazi, M. and Chorom, M. 2017. Phytoremediation of total petroleum hydro-carbons from highly saline and clay soil using Sorghum halepense (L.) Pers. and Aeluropus littoralis (Guna) Parl. Soil and Sediment Contamination: An International Journal, 26(1): 127-140.
Alhawash, A.B., Zhang, X. and Ma, F. 2018. Removal and biodegradation of different petroleum hydrocarbons using the filamentous fungus aspergillus sp. RFC-1. Microbiologyopen, 6: e00619.
Fig. 8: Quantitative analysis results of DGGE swimlane strips.

1755MICROBIAL TREATMENTS FOR REMOVAL OF PETROLEUM HYDROCARBONS FROM SOIL
Nature Environment and Pollution Technology • Vol. 18, No. 5 (Special Issue), 2019
Chen, K.L., Man-Li, W.U., Xi-Qiong, Y.E., Wei, L.I. and Yuan, J. 2017. Impacts of bioremediation on microbial activities in petroleum con-taminated soil. Journal of Agro-Environment Science, 36: 279-285.
Ibrahim, M., Makky, E.A., Azmi, N.S. and Ismail, J. 2018. Impact of incuba-tion period on biodegradation of petroleum hydrocarbons from refinery wastewater in Kuantan, Malaysia by indigenous bacteria. Bioremedi-ation Journal, 5: 1-10.
Li, X., Fan, F., Zhang, B., Zhang, K. and Bing, C. 2018. Biosurfactant enhanced soil bioremediation of petroleum hydrocarbons: design of experiments (DOE) based system optimization and phospholipid fatty acid (PLFA) based microbial community analysis. International Bio-deterioration & Biodegradation, S0964830517315615.
Liu, Q., Tang, J., Liu, X., Song, B., Zhen, M. and Ashbolt, N.J. 2017. Response of microbial community and catabolic genes to simulated petroleum hydrocarbon spills in soils/sediments from different geographic loca-tions. Journal of Applied Microbiology, 123: 4.
Maddela, N.R., Scalvenzi, L. and Venkateswarlu, K. 2017. Microbial degrada-tion of total petroleum hydrocarbons in crude oil: a field-scale study at the low-land rainforest of Ecuador. Environmental Technology, 38(20): 1-8.
Man, J.K. and Hwang, Y. 2017. Assessing the potential of organic solvents on total petroleum hydrocarbon extraction from diesel-contaminated soils. Water Air & Soil Pollution, 228(5): 189.
Moussavi, G., Shekoohiyan, S. and Naddafi, K. 2017. The accelerated enzymatic biodegradation and cod removal of petroleum hydrocarbons
in the SCR using active bacterial biomass capable of in-situ generating peroxidase and biosurfactants. Chemical Engineering Journal, 308: 1081-1089.
Onwuka, O.S., Ezugwu, C.K. and Ifediegwu, S.I. 2019. Assessment of the impact of onsite sanitary sewage system and agricultural wastes on groundwater quality in Ikem and its environs, south-eastern Nigeria, Geology, Ecology, and Landscapes, 81-65 ,3:1.
Partovinia, A. and Rasekh, B. 2018. Review of the immobilized microbial cell systems for bioremediation of petroleum hydrocarbons polluted environments. Critical Reviews in Environmental Science & Technol-ogy, pp. 1-38.
Randhawa, I.A., Ijaz, U., Ijaz, A., Butt, A.D. and Malik, M. 2019. Efficient energy solution for Wasa Faisalabad taking into consideration the en-vironmental impact assessment. Earth Sciences Pakistan, 3(2): 09-13.
Razzak, M.A., Islam, M.A., Rahman, M.H., Sathi, M.A. and Atikuzzamman, M. 2018. Screening of lentil germplasm against stemphylium blight by observing disease reaction in three different stages. Malaysian Journal of Halal Research, 1(2): 15-18.
Sarwar, M.T., Zhan, H.H., Adrees, M., Yang, J.X. and Rong, L. 2019. Effects of different type of black smoke originate from kilns on the natural environment. Journal Clean Was, 3(2): 11-13.
Tariq, W., Saifullah, M., Anjum, T., Javed, M., Tayyab, N. and Shoukat, I. 2018. Removal of heavy metals from chemical industrial wastewater using agro based bio-sorbents. Acta Checmica Malaysia, 2(2):09-14.

• The text of the manuscript should run into Abstract, Introduction, Materials & Methods, Results,Discussion, Acknowledgement (if any) and References or other suitable headings in case ofreviews and theoretically oriented papers. However, short communication can be submitted in runningwith Abstract and References. The references should be in full with the title of the paper.
• The figures should preferably be made on a computer with high resolution and should be capable ofwithstanding a reasonable reduction with the legends provided separately outside the figures.Photographs may be black and white or colour.
• Tables should be typed separately bearing a short title, preferably in vertical form. They should be ofa size, which could easily be accommodated in the page of the Journal.
• References in the text should be cited by the authors’ surname and year. In case of more than onereference of the same author in the same year, add suffix a,b,c,.... to the year. For example: (Tho-mas 1969, Mass 1973a, 1973b, Madony et al. 1990, Abasi & Soni 1991).
List of ReferencesThe references cited in the text should be arranged alphabetically by authors’ surname in the followingmanner: (Note: The titles of the papers should be in running ‘sentence case’, while the titles of thebooks, reports, theses, journals, etc. should be in ‘title case’ with all words starting with CAPITALletter.)
Dutta, A. and Chaudhury, M. 1991. Removal of arsenic from groundwater by lime softening withpowdered coal additive. J. Water Supply Res. Techno. Aqua., 40(1) : 25-29.
Hammer, D.A. (ed.) 1989. Constructed Wetlands for Wastewater Treatment-Municipal, Industrial andAgricultural. Lewis Publishers Inc., pp. 831.
Haynes, R. J. 1986. Surface mining and wetland reclamation. In: Harper, J. and Plass, B. (eds.) NewHorizons for Mined Land Reclamation. Proceedings of a National Meeting of the American Societyfor Surface Reclamation, Princeton, W.V.
Submission of Papers• The paper can be submitted by e-mail as an attachment in a single WORD file at
[email protected]• The paper can also be submitted online in a single WORD file through the journal’s website:
www.neptjournal.com
Attention
1. Any change in the authors’ affiliation may please be notified at the earliest.2. Please make all the correspondence by e-mail, and authors should always quote the manuscript ID
(number).
Note: In order to speed up the publication, authors are requested to send the publication charges assoon as they get the ‘initial acceptance’ letter, and also correct the galley proof immediately afterreceipt. The galley proof must be checked with utmost care, as publishers owe no responsibility formistakes. The papers will be put on priority for publication only after receiving the processing andpublication charges.
... Continued from inner front cover

Published by
Technoscience PublicationsA-504, Bliss Avenue, Opp. SKP Campus
Balewadi, Pune-411 045, Maharashtra, India
In association withTechnoscience Knowledge Communications
Mira Road, Mumbai, India
Published for Proprietor, Printer and Publisher: Mrs. T. P. Goel, B-34, Dev Nagar, TonkRoad, Jaipur, Rajasthan, India; Editors: Dr. P. K. Goel and Prof. K. P. Sharma
(Abbreviation: Nat. Env. Poll. Tech.)(An International Quarterly Scientific Journal)
©Technoscience Publications: The consent is hereby given that the copies of the articles publishedin this Journal can be made only for purely personal or internal use. The consent does not includecopying for general distribution or sale of reprints.
For further details of the Journal please visit the website. All the papers published ona particular subject/topic or by any particular author in the journal can be searchedand accessed by typing a keyword or name of the author in the ‘Search’ option onthe Home page of the website. All the papers containing that keyword or author willbe shown on the home page from where they can be directly downloaded.
www.neptjournal.com
Related Documents