ISSN 2229 ISSN 2229 ISSN 2229 ISSN 2229-6891 6891 6891 6891 INTERNATIONAL RESEARCH JOURNAL OF APPLIED FINANCE Volume. IV Issue. 6 June 2013 Contents The Impact of Increased Dividend Announcements on Stock Price: A Test Of Market Efficiency Laabs, Douglas S, & Bacon, Frank W 775 - 784 An Analysis of The Perceptions of The Usefulness of Annual Reports and Other Information By Individual Investors In Hong Kong Shimin Chen, Kathy H. Y. Hsu, & Harlan Etheridge 785 – 805 Assessment Ratios and the Consequences of Buying into the Housing Bubble Russ Kashian & Jeremy Peterson 806 – 814 An Economic Model for the Determination of the Efficiency of Outsourcing Swapan Sen, & Niazur Rahim 815 – 826 Cost of Equity Adjustment for Wholly Owned Subsidiaries H. Christine Hsu 827 – 838 On the constitutionality and Rationality of Dividend Distribution Tax J P Singh 839 – 844 www.irjaf.com

Welcome message from author
This document is posted to help you gain knowledge. Please leave a comment to let me know what you think about it! Share it to your friends and learn new things together.
Transcript

ISSN 2229ISSN 2229ISSN 2229ISSN 2229----6891689168916891
INTERNATIONAL RESEARCH JOURNAL OF
APPLIED FINANCE Volume. IV Issue. 6 June 2013
Contents
The Impact of Increased Dividend Announcements on Stock Price: A Test Of Market Efficiency Laabs, Douglas S, & Bacon, Frank W 775 - 784 An Analysis of The Perceptions of The Usefulness of Annual Reports and Other Information By Individual Investors In Hong Kong Shimin Chen, Kathy H. Y. Hsu, & Harlan Etheridge 785 – 805 Assessment Ratios and the Consequences of Buying into the Housing Bubble Russ Kashian & Jeremy Peterson 806 – 814 An Economic Model for the Determination of the Efficiency of Outsourcing Swapan Sen, & Niazur Rahim 815 – 826 Cost of Equity Adjustment for Wholly Owned Subsidiaries H. Christine Hsu 827 – 838 On the constitutionality and Rationality of Dividend Distribution Tax J P Singh 839 – 844
www.irjaf.com

International Research Journal of Applied Finance ISSN 2229 – 6891 Vol. IV Issue – 6 June, 2013
774
Call for Papers
International Research Journal of Applied Finance (IRJAF) is a double blind peer-reviewed open access online journal. Every month a copy of IRJAF reaches faculty members in the areas of accounting, finance, and economics working in 80% of AACSB accredited Business Schools across the world. The journal provides a dedicated forum for Academicians, practitioners, policy makers and researchers working in the areas of finance, investment, accounting, and economics. The Editor of the Journal invites papers with theoretical research/conceptual work or applied research/applications on topics related to research, practice, and teaching in all subject areas of Finance, Accounting, Investments, Money, Banking and Economics. The original research papers and articles (not currently under review or published in other publications) will be considered for publication in International Research Journal of Applied Finance.
Topics covered include:
*Portfolio Management *Shareholder Responsibilities *Investors and corporate Social Responsibility *Emerging Markets *Financial Forecasting *Equity Analysis *Derivatives *Currency Markets *International Finance *Behavioral Finance Financial Accounting *Financial Management *Cost Accounting *Applied Economics *Econometrics *Financial Engineering
All paper will be double blind reviewed on a continual basis. Normally the review process will be completed in about 4 weeks after the submission and the author(s) will be informed of the result of the review process. If the paper is accepted, it will be published in the next month issue.
By the final submission for publications, the authors assign all the copyrights to the Kaizen Publications. The Editorial Board reserves the right to change/alter the final submissions for IRJAF for editorial purposes.
Copyright: Articles, papers or cases submitted for publication should be original contributions and should not be under consideration for any other publication at the same time. Authors submitting articles/papers/cases for publication warrant that the work is not an infringement of any existing copyright, infringement of proprietary right, invasion of privacy, or libel and will indemnify, defend, and hold IRJAF or sponsor(s) harmless from any damages, expenses, and costs against any breach of such warranty. For ease of dissemination and to ensure proper policing of use, papers/articles/cases and contributions become the legal copyright of the IRJAF unless otherwise agreed in writing.
Click here to submit your paper: http://irjaf.com/Submission.html
Click here to submit your case study: http://www.irjaf.com/Submit_Case_Study.html

International Research Journal of Applied Finance ISSN 2229 – 6891 Vol. IV Issue – 6 June, 2013
775
The Impact of Increased Dividend Announcements on Stock Price: A Test
Of Market Efficiency
Laabs, Douglas S. Longwood University
Bacon, Frank W.*
Longwood University [email protected]
*Corresponding Author

International Research Journal of Applied Finance ISSN 2229 – 6891 Vol. IV Issue – 6 June, 2013
776
Abstract
The purpose of this study is to test the semi-strong form efficient market hypothesis by analyzing the effects of increased dividend announcements on stock price. Specifically, is it possible to earn an above normal return on a publicly traded stock when the firm announces an increased dividend? Numerous past studies suggest that with a company’s increased dividend announcement goes a positive signal about the firm’s future, thereby significantly increasing the firm’s stock price. Likewise, the positive signal implies that the firm now attracts a new breed of investors, thus driving up demand for the firm’s stock. According to the semi-strong form efficient market hypothesis, it is not possible to consistently outperform the market — appropriately adjusted for risk — by using public information such as increased dividend announcements. This type of information should impound stock price sufficiently fast to disallow any investor’s earning an above normal risk adjusted return. Evidence here supports the positive signal associated with the sample of increased dividend announcements examined. However, the study results fail to support the semi-strong form efficient market hypothesis.
Introduction
Dividend announcements are one of the most highly studied and meaningful events for investors to research. They can be used as a direct signal of strength regarding a company’s liquidity in today’s market. A dividend can be thought of as the cost of equity capital to equity shareholders. The announcement of a dividend can be seen in two perspectives: if the dividend that is announced is up to expectations of shareholders, the market price of the shares will be positively affected. Whereas, if the dividend that is announced is not up to expectations of the equity investors, the market price of the shares will be negatively affected.
Market efficiency is defined as the amount of time it takes for the stock market to react to announced public information. Thus, there are three different levels of market efficiency. If a market is weak-form efficient, then the market reacts so fast to the announced information that no investor is able to earn a substantial return or a return higher than that of the S&P 500 Market Index. Semi-strong market efficiency is similar, but is defined as the impracticality of gaining an above average return based on announcements of public information. Finally, when a market is strong-form efficient, investors are unable to earn above normal returns by relying on both public and private information. The only possible way an investor would be able to benefit would be to engage in the illegal act of insider trading. Investors in the past have been able to obtain gains based off public information, so it is safe to say that the market is not strong-form efficient. Is the market semi-strong efficient with respect to dividend announcements? To answer this question, this study will analyze stock prices before the public dividend announcements and examine how this type of information affects trading, and how in advance investors can earn a return before the announcement is made. Is it possible for investors to “beat” the market relying solely on public information? In order to test the semi-strong efficient market hypothesis, this research will analyze how increased dividend announcements affect stock up to 30 days price before and after the announcement.
I. Background and Purpose
The purpose of this event study is to test market efficiency theory by analyzing the impact of a sample of 30 increased dividend announcements on the firm’s stock price. Specifically, how fast does the market price of the firms’ stock react to the sample of increased dividend announcements examined? This research tests whether the announcement of increased dividends directly incorporates the strong form, semi-strong form, or weak form of the

International Research Journal of Applied Finance ISSN 2229 – 6891 Vol. IV Issue – 6 June, 2013
777
efficient market hypothesis based on the timing of the announcements and the modifications in stock price that occur.
This study tests the effects of a sample of 30 increased dividend announcements on stock price using the standard risk adjusted event study methodology. If a strong correlation exists between an announcement and an immediate equity market price change, there may not be opportunity to earn an above normal return and such evidence would support efficient market theory.
II. Literature Review
Fama defined market efficiency in respect to how quickly the stock market reacts to announced public information and proposed three levels of market efficiency. These three levels are characterized by how quickly the stock market responds as well as the amount of returns investors can possibly seek from carrying out legal trading actions. Weak-form, semi-strong form, and strong-form efficiency are the three different ways a market can be differentiated. The impact of an increased dividend announcement on stock prices has been widely researched and documented.
Mehndiratta and Gupta (2010) stated that the semi-strong form of efficient market hypotheses (EMH) states that stock prices reflect all the publicly available information instantaneously and accurately. An increased dividend announcement normally signals higher future earnings, which is seen in investor’s eyes as a signal of strength. Fracassi (2008) however found interesting information when examining stock price reactions to increased dividend announcements. On a short time scale, Fracassi found a 3-day cumulative abnormal return of 1.34% for dividend increases. However, among companies that announce a dividend increase 42% have actually seen a negative stock price reaction. The reasoning behind this dispersion of returns is thought to be due to daily idiosyncratic and systematic volatility in respect to the dividend announcement.
Sheikhbahaei and Mohd investigated the market reaction of 356 dividend announcements by 138 firms at the Malaysia stock exchange. The result of their study concluded, “The market reacts positively to dividend increasing stocks but no significant react to the constant dividend or the decreasing group of dividend announcements. It was also observed from the information in a day prior to the announcement day that there is a probable leakage of information by the excess access to the insider information of the firms.”
Dividend announcements, whether a surprise or an increase to an already existing dividend, are one of the most common actions firms take in order to attract new investors. These announcements by firms are usually seen as a sign of strength, suggesting that the firm has a substantial amount of excess capital. This study will test the efficiency and effect of the public announcement of an increased dividend on stock price.
III. Methodology and Study Sample
This study sample includes 30 randomly selected increased dividend announcements between the time period May 10, 2005 and February 5, 2013. The random sample was selected from increased dividend announcements in which the company is traded either on the NYSE or NASDAQ. Table 1 describes the sample.

International Research Journal of Applied Finance ISSN 2229 – 6891 Vol. IV Issue – 6 June, 2013
778
Table 1: Description of Study Sample
Ticker Firm name Announcement Date Traded index
BA The Boeing Company December 12 2011 NYSE
DIS Walt Disney November 30 2011 NYSE
AAPL Apple July 24 2012 NASDAQ
XOM ExxonMobil Corp April 25 2012 NYSE
NVS Novartis February 1 2012 NYSE
SO Southern Company April 16 2012 NYSE
CAT Caterpillar, Inc. June 13 2012 NYSE
IBM International Business Machines April 24 2012 NYSE
JNJ Johnson & Johnson April 23 2009 NYSE
NKE Nike November 20 2008 NYSE
MCD McDonalds Corporation September 22 2010 NYSE
AEP American Electric Power Company Inc.
October 26 2010 NYSE
MSFT Microsoft Corporation September 20 2011 NASDAQ
PM Philip Morris International Inc. September 14 2011 NYSE
INTC Intel Corporation July 26 2012 NASDAQ
WMT Wal-Mart Stores Inc. March 3 2011 NYSE
MO Altria Group Inc. August 26 2011 NYSE
KMB Kimberly-Clark Corporation February 23 2010 NYSE
WAG Walgreen Company June 19 2012 NYSE
SWK Stanley Black & Decker, Inc. July 18 2012 NYSE
KO The Coca-Cola Company February 21 2008 NYSE
MMM 3M Company February 5 2013 NYSE
AWR American States Water Company August 1 2012 NYSE
EMR Emerson Electric Company November 1 2011 NYSE
ITW Illinois Tool Works Inc. August 3 2007 NYSE
HRL Hormel Foods Corporation November 22 2010 NYSE
SYY Sysco Corporation November 10 2005 NYSE
BDX Becton, Dickinson, and Company November 20 2012 NYSE
LEG Leggett & Platt, Incorporated August 8 2012 NYSE
MSA Mine Safety Appliances Company May 10 2005 NYSE
International Research Journal of Applied Finance ISSN 2229 – 6891 Vol. IV Issue – 6 June, 2013
779
To test semi-strong market efficiency with respect to public announcements of increased dividends and to examine the effect of increased dividends on stock return around the announcement date, this study proposes the following null and alternate hypotheses:
H10: The risk adjusted return of the stock price of the sample of firms announcing a dividend is not significantly affected by this type of information on the announcement date.
H11: The risk adjusted return of the stock price of the sample of firms announcing a dividend is significantly positively affected by this type of information on the announcement date.
H12: The risk adjusted return of the stock price of the sample of firms announcing a dividend is significantly negatively affected by this type of information on the announcement date.
H20: The risk adjusted return of the stock price of the sample of firms announcing a dividend is not significantly affected by this type of information around the announcement date as defined by the event period.
H21: The risk adjusted return of the stock price of the sample of firms announcing a dividend is significantly affected by this type of information around the announcement date as defined by the event period.
This study uses the standard risk adjusted event study methodology from the finance literature. The announcement date (day 0), obtained from http://finance.yahoo.com/, is the date of the firm’s announcement of the increased dividend. The required historical financial data, i.e. the stock price and S&P500 index during the event study period was also obtained from the internet website http://finance.yahoo.com/.
1. The historical stock prices of the sample companies, and S&P 500 index, for the event study duration of -180 to +30 days (with day –30 to day +30 defined as the event period and day 0 the announcement date) were obtained.
2. Then, holding period returns of the companies (R) and the corresponding S&P 500 index (Rm) for each day in this study period were calculated using the following formula:
Current daily return = (current day close price – previous day close price)
previous day close price
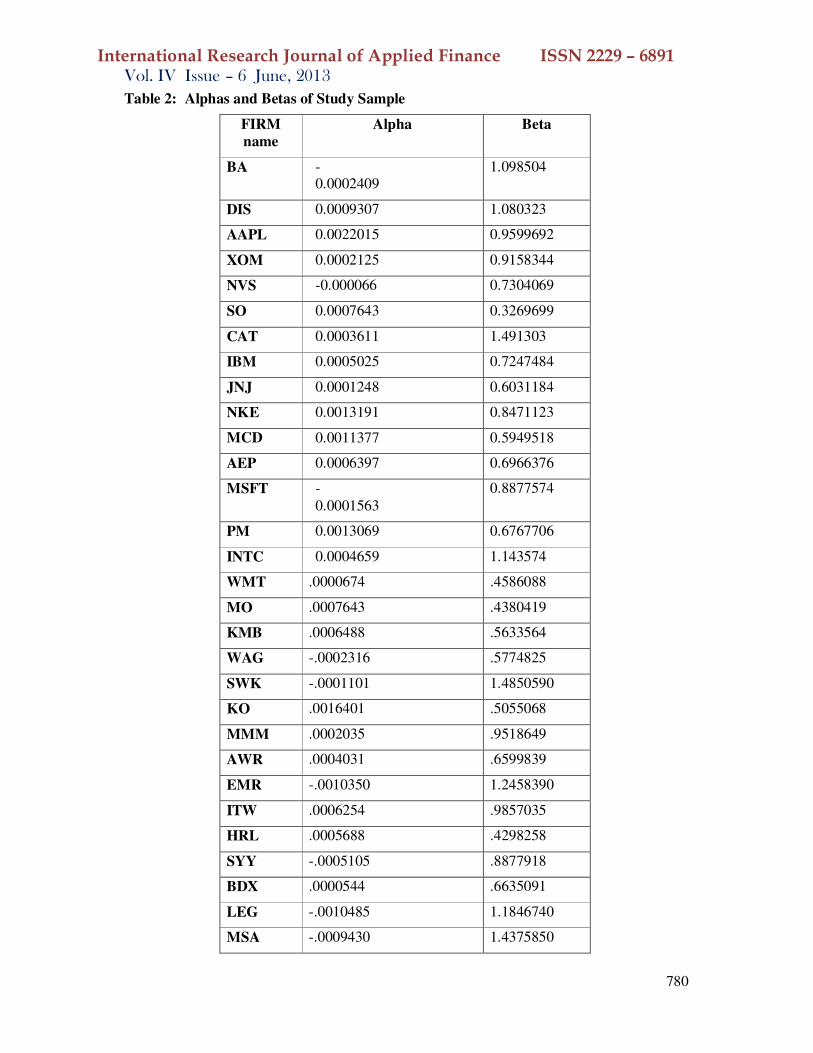
A regression analysis was performed using the actual daily return of each company (dependent variable) and the corresponding S&P 500 daily return (independent variable) over the pre-event period (day –180 to –31 or period prior to the event period of day –30 to day +30) to obtain the intercept alpha and the standardized coefficient beta. Table 2 shows alphas and betas for each firm.
3. For this study, in order to get the normal expected returns, the risk-adjusted method (market model) was used. The expected return for each stock, for each day of the event period from
day -30 to day +30, was calculated as:
E(R) = alpha + Beta (Rm),
where Rm is the return on the market i.e. the S&P 500 index.
4. Then, the Excess return (ER) was calculated as:
ER = the Actual Return (R) – Expected Return E(R)
International Research Journal of Applied Finance ISSN 2229 – 6891 Vol. IV Issue – 6 June, 2013
780
Table 2: Alphas and Betas of Study Sample
FIRM
name
Alpha Beta
BA -0.0002409
1.098504
DIS 0.0009307
1.080323
AAPL 0.0022015
0.9599692
XOM 0.0002125
0.9158344
NVS -0.000066
0.7304069
SO 0.0007643
0.3269699
CAT 0.0003611
1.491303
IBM 0.0005025
0.7247484
JNJ 0.0001248
0.6031184
NKE 0.0013191
0.8471123
MCD 0.0011377
0.5949518
AEP 0.0006397
0.6966376
MSFT -0.0001563
0.8877574
PM 0.0013069
0.6767706
INTC 0.0004659
1.143574
WMT .0000674 .4586088
MO .0007643 .4380419
KMB .0006488 .5633564
WAG -.0002316 .5774825
SWK -.0001101 1.4850590
KO .0016401 .5055068
MMM .0002035 .9518649
AWR .0004031 .6599839
EMR -.0010350 1.2458390
ITW .0006254 .9857035
HRL .0005688 .4298258
SYY -.0005105 .8877918
BDX .0000544 .6635091
LEG -.0010485 1.1846740
MSA -.0009430 1.4375850

International Research Journal of Applied Finance ISSN 2229 – 6891 Vol. IV Issue – 6 June, 2013
781
5. Average Excess Returns (AER) were calculated (for each day from -30 to +30) by averaging the excess returns for all the firms for given day.
AER = Sum of Excess Return for given day / n,
where n = number of firms is sample i.e. 30 in this case
6. Also, Cumulative AER (CAER) was calculated by adding the AERs for each day from -30 to +30.
7. Graphs of AER and Cumulative AER were plotted for the event period i.e. day -30 to day +30. Chart 1 below depicts Average Excess Return (AER) plotted against time. Chart 2 below depicts Cumulative Average Excess Return (CAER) plotted against time.
IV. Quantitative Tests And Results
Did the market react to the announcements of increased dividends? Was the information surrounding the event significant? One would expect there to be a significant difference in the Actual Average Daily Returns (Day -30 to Day +30) and the Expected Average Daily Returns (Day -30 to Day +30) if the information surrounding the event impounds new, significant information on the market price of the firms' stock (see AER graph in Chart 1 below). If a significant risk adjusted difference is observed, then we support our hypothesis that this type of information did in fact significantly either increase or decrease stock price. To statistically test for a difference in the Actual Daily Average Returns (for the firms over the time periods day -30 to day +30) and the Expected Daily Average Returns (for the firms over the time periods day -30 to day +30), we conducted a paired sample t-test and found a significant difference at the 5% level between actual average daily returns and the risk adjusted expected average daily returns. Results here support the alternate hypothesis H21: The risk adjusted return of the stock price of the sample of firms announcing increased dividends is significantly positively affected around the announcement date as defined by the event period. This finding supports the significance of the information around the event since the market’s reaction was observed.
Is it possible to isolate and observe the sample’s daily response to the announcement of an increased dividend from day -30 to day +30? If so, at what level of efficiency (weak, semi-strong, strong form according to efficient market theory) did the market respond to the information and what are the implications for market efficiency?
Another purpose of this analysis was to test the efficiency of the market in reacting to the announcement of an increased dividend event. Specifically, do we observe weak, semi-strong, or strong form market efficiency as defined by Fama, 1970, in the efficient market hypothesis? The key in the analysis or tests is to determine if the AER (Average Excess Return) and CAER (Cumulative Average Excess Return) are significantly different from zero or that there is a visible graphical or statistical relationship between time and either AER or CAER. See AER and CAER graphs in Charts 1 and 2 below. T-tests of AER and CAER both tested different from zero at the 5% level of significance. Likewise, observation of Chart 2 (graph of CAER from day –30 to day +30) confirms the significant positive reaction of the risk adjusted returns of the sample of firms tested, up to 10 days prior and 26 days after to the announcement of an increased dividend.

International Research Journal of Applied Finance ISSN 2229 – 6891 Vol. IV Issue – 6 June, 2013
782
Chart 1: Average Excess Return over Event Period
Chart 2: Cumulative Average Excess Return over Event Period
The graph in Chart 2 demonstrates that the announcements of increased dividends had a significant positive impact on the firm’s share price up to twelve days prior and ten days after to announcement day 0, the increased dividend announcement date. The evidence rejects the
-0.003
-0.002
-0.001
0
0.001
0.002
0.003
0.004
0.005
0.006
0.007
0.008TIME vs AER
-30 -26 -22 -18 -14 -10 -6 -2 0 2 6 10 14 18 22 26 30
0
0.005
0.01
0.015
0.02
0.025
0.03
0.035
TIME vs CAER
-30 -26 -22 -18 -14 -10 -6 -2 0 2 6 10 14 18 22 26 30

International Research Journal of Applied Finance ISSN 2229 – 6891 Vol. IV Issue – 6 June, 2013
783
null hypothesis H10: The risk adjusted return of the stock price of the sample of firms announcing increased dividends is not significantly affected by this type of information on the announcement date when made public. Instead, it supports the alternate hypothesis H11: The risk adjusted return of the stock price of the sample of firms announcing an increased dividend is significantly positively affected by this type of information on the announcement date.
For the sample of firms analyzed, an investor is able to earn an above normal risk adjusted return by acting on the public announcement of an increased dividend. As of the announcement date, the firms’ stock prices had not yet adjusted to the new information embedded in the increased dividend news. In fact, after the announcement, stock price increased from days +1 to +10, then returning to announcement day equilibrium on day +30. This is consistent with the semi-strong form market efficiency hypothesis which states that the stock price reflects all publicly available information. Interestingly, the results for this sample suggest significant insider trading activity up to 12 days prior to the announcement of the increased dividend.
V. Conclusion
This study tested the effect of announcing an increased dividend on the stock price’s risk adjusted rate of return for a randomly selected sample of 30 firms from the time period May 10, 2005 to February 5, 2013. These stocks were traded on the NYSE or NASDAQ. Using standard risk adjusted event study methodology with the market model, the study analyzed 8,130 recent observations on the fifteen publicly traded firms and the S&P 500 market index. Appropriate statistical tests for significance were conducted. Results show a significant positive market reaction prior to the firms’ announcement of increased dividends. Findings also support efficient market theory at the semi-strong form level as documented by Fama (1970). Similar to many other event study’s findings in the finance literature (stock options, repurchase, dividend announcements etc.), apparently trading activity on the basis of this information surfaced prior to it being made public.
Specifically, for this study the announcement of the increased dividend is viewed as a signal of good news. Investors appear to receive the increased dividend news as an implicit signal from management that the firm’s future cash flows and growth look bright and will culminate into continuously rising stock price. The market’s positive reaction to the announcement suggests that management and stockholders have little to fear from initiating increased dividends.
References
Aamir, Muhammad, and Syed Zullfiqar Ali Shah. “Dividend Announcements And The Abnormal Stock Returns For The Event Firm And Its Rivals.” Australian Journal Of Business Management Research 1.8 (2011): 72-76. Business Source Complete. Web. 17 Oct. 2012.
Fama, Eugene F. "Efficient Capital Markets: a Review of Theory and Empirical Work." The Journal of Finance, 25 (1970): 383-417. 9 Dec. 2007
<http://links.jstor.org/sici?sici=0022-1082%28197005%2925%3A2%3C383%3AECMARO%3E2.0.CO%3B2-V>.
Fama, Eugene F., Lawrence Fisher, Michael C. Jensen, and Richard Roll. "The Adjustment of Stock Prices to New Information." International Economic Review 10 (1969): 1-21. 9 Dec. 2007
<http://links.jstor.org/sici?sici=0020-6598%28196902%2910%3A1%3C1%3ATAOSPT%3E2.0.CO%3B2-P>.

International Research Journal of Applied Finance ISSN 2229 – 6891 Vol. IV Issue – 6 June, 2013
784
Fracassi, Cesare. "Stock Price Sensitivity to Dividend Changes." Diss. University of California Los Angeles , 2008. Web.
Mehndiratta, Neetu, and Shuchi Gupta. "Impact of Dividend Announcement on Stock Prices." International Journal of Information Technology and Knowledge Management. 2.2 (2010): 405-10. Web. 16 Apr. 2012. <http://www.csjournals.com/IJITKM/PDF 3-1/47.pdf>.
Sheikhbahaei, Ali, Mohd. Hassan Mohd. Osman, and Ismail Abd Rahman. “Information Content In Dividend Announcements, A Test Of Market Efficiency In Malaysian Market.” International Business Research 5.12 (2012): 38-45. Business Source Complete. Web. 9 May 2013.

International Research Journal of Applied Finance ISSN 2229 – 6891 Vol. IV Issue – 6 June, 2013
785
An Analysis of The Perceptions of The Usefulness of Annual Reports and
Other Information By Individual Investors In Hong Kong
Shimin Chen
Professor of Accounting China Europe International Business School
Kathy H. Y. Hsu
Associate Professor of Accounting University of Louisiana at Lafayette
Harlan Etheridge* Associate Professor of Accounting
University of Louisiana at Lafayette [email protected]
*Corresponding Author

International Research Journal of Applied Finance ISSN 2229 – 6891 Vol. IV Issue – 6 June, 2013
786
Abstract This study reports the results of a survey of individual investors in Hong Kong with respect to their perceptions of information usefulness. First, we find that although investors use annual reports, they rank usefulness of annual reports lower than that of other alternative information sources. Second, consistent with the FASB's Conceptual Framework, individual investors view relevance and reliability as the two primary characteristics of useful financial reporting. However, they perceive relevance to be more important than reliability. Third, we provide evidence that the perceived usefulness of annual reports is affected not only by investor characteristics, but also by company type. Finally, we demonstrate that Hong Kong investors desire additional information, in particular relevant non-financial information, to be disclosed in annual reports to help them make better investment decisions. These findings help us better understand why and how financial reporting can be improved.
Key Words: Value-relevance, Financial Reporting, Hong Kong, Individual Investors.
The usefulness of financial reports has been one of the most important areas of research in accounting. Empirical accounting literature has documented the usefulness of accounting information in capital markets around the global (e.g., Amir et al. 1993; Barth and Clinch 1996; Graham and King 2000; Chen et al. 2001, Pouraghajan et al. 2012). While most of the studies conclude that financial reports provide important information to investors, the reported associations between accounting numbers and stock prices and/or returns are generally low. Some studies even report a decreasing trend in the value-relevance of financial statement information over the past decades (e.g., Francis and Schipper, 1999; Lev and Zarowin 1999, Lim and Park 2011). These findings, along with the discontent expressed by practicing accountants toward the current financial reporting model, provide support for suggestions that financial reports also should include other information such as better measures of intangible assets, fair value measurements, high-level financial and operational data that are used by management, and more forward-looking information (e.g., AICPA, 1994; Lev and Zarowin, 1999; Entwistle and Phillips, 2003; Bricker and Chandar, 2012). Although these concerns and suggestions seem appealing, it remains unclear how investors perceive the usefulness of these other information sources compared to what currently is contained in annual reports, and whether the qualitative characteristics of financial reporting, or even specific investor and investee characteristics, would affect these perceptions.
Though important, these questions cannot be effectively addressed by the existing capital market-based studies that rely on statistical association of reported accounting numbers with stock prices and/or stock returns to evaluate the usefulness of financial reporting. Hodge (2003) suggests that survey-based research can complement the archival-based research in that it gathers data on a multitude of individual beliefs and practices to provide the underlying reasons for investor behaviors. Using a survey approach, this study examines the perceived usefulness of annual reports and other information sources by individual investors in Hong Kong.
Based on 88 useful responses from a mail survey, this paper reports the following findings. First, although individual investors in Hong Kong use annual reports, they rank the usefulness of annual reports lower than other alternative information sources such as historical information on stock price, dividends and earnings, company news, as well as advice from analysts, newspapers and magazines. Second, consistent with the FASB Conceptual Framework, investors view relevance and reliability as the two primary characteristics of useful financial reporting. However, these investors perceive relevance as more important than reliability in determining the usefulness of annual reports. Third, this

International Research Journal of Applied Finance ISSN 2229 – 6891 Vol. IV Issue – 6 June, 2013
787
paper provides evidence that the perceived usefulness of annual reports is affected not only by investor characteristics such as education, investment experience, investment horizon, and etc., but also by the type of companies in which they invest. Finally, this paper demonstrates that Hong Kong investors demand additional information, in particular relevant non-financial information, to be disclosed in annual reports to help them make better investment decisions.
I. Research Questions
Prior research has generally established the usefulness or value-relevance of financial reporting to equity investors in global stock markets through the examination of the association of accounting information with stock valuation (e.g., Alford and Jones 1993; Amir et al. 1993; Barth and Clinch 1996; Graham and King 2000; Chen et al. 2001; Pouraghajan et al. 2012). Over the years, however, practitioners and academicians have raised concerns about the extent of the usefulness of financial statement information. For example, in 1994, the AICPA Special Committee on Financial Reporting issued a report to address the loss of relevance of financial reporting. Entwistle and Phillips (2003) discussed many of the same concerns expressed in the AICPA report. Several studies (e.g., Lev and Zarowin, 1999; Francis and Shipper, 1999; Ely and Maymire, 1999; Lim and Park 2011) also demonstrated empirically that the usefulness of accounting information has deteriorated over the years.
Researchers often attribute this deterioration in value-relevance (usefulness) to the inability of the current accounting model to capture the changing business environment. This study examines four research questions that are logically related and motivated by the extant conceptual, as well as empirical, literature. First, to better understand the decrease in value-relevance of financial reporting as reported in archival-based research, the following question is asked:
Q1: How do individual investors perceive the usefulness of annual reports in comparison to other sources of commonly available information?
Next, an attempt is made to assess individual investors’ perceptions about the relevance and reliability of financial reporting. Much of the debate and concern about the decreasing usefulness of financial reporting centers on the well-known “tradeoff” between relevance and reliability: the two primary characteristics of useful information as elaborated in the Financial Accounting Standards Board’s Conceptual Framework (FASB, 1978). Some critics argue that accounting has lost its relevance because it fails to capture the values of internally generated intangible assets, while others suggest that accounting numbers have become less useful because of their decreasing reliability (Entwistle and Phillips, 2003). This study assesses individual investors’ perceptions about the impact of relevance and reliability on financial reporting by asking the following question:
Q2: How is the perceived usefulness of annual reports affected by the two primary qualitative characteristics of accounting information: relevance and reliability?
Third, an important area of inquiry that is largely missing from the extant literature is that the usefulness of information is a joint function of both information and decision maker attributes. In Statement of Financial Accounting Concepts No. 1 (FASB, 1978), the FASB states that decision usefulness is subject to user-specific constraints. Investor characteristics can influence how accounting information is used, and therefore, should affect investors’ perceived usefulness of such information. Epstein and Pava (1995) examined the relationship between investor characteristics and usefulness of the management discussion and analysis (MD&A) section in the annual report, but found some conflicting results in that only wealthy (shareholders with more than $50,000 invested in stocks), but inexperienced (with no formal
International Research Journal of Applied Finance ISSN 2229 – 6891 Vol. IV Issue – 6 June, 2013
788
education or training in accounting, finance or investing), investors made substantial use of the MD&A. This current study incorporates investor characteristics into the research design in a more comprehensive manner as discussed in the Questionnaire Design and Sample section of the paper.
Furthermore, recent accounting literature often attributes the decline in the value relevance of accounting information to the fact that there is an increasing number of technology-intensive firms in the economy and that the current financial reporting model does not adequately capture the intangible value-drivers of these firms (e.g., Lev and Zarowin, 1999). Empirical evidence has been mixed in support of this claim that high-tech firms have suffered greater loss of the usefulness of their financial reports compared to other firms (Francis and Schipper 1999; Lev and Zarowin 1999). Consequently, it appears that both investor and investee characteristics may influence the perceived usefulness of financial accounting reports. As a result, this study asks the following question:
Q3: How do investor and investee characteristics affect the perceived usefulness of annual reports?
Finally, this study evaluates investors’ perceptions about the usefulness of additional information included in annual reports. To improve the usefulness of financial reporting, both the practicing and academic accounting communities have recommended an increase in the current reporting content by including non-financial measures of key business processes and by providing more information about plans, opportunities, risks and uncertainties as well as information used by management to manage the business (e.g., AICPA. 1994, Lev and Zarowin 1999). This study attempts to provide some preliminary answers to this issue by asking the following question:
Q4: How do investors perceive the potential usefulness of some information that is not currently included in the annual report?
II. Data
A survey was conducted of individual investors in Hong Kong in order to gather evidence regarding our four research questions. As one of the most important financial centers in the World, Hong Kong has well-established accounting, auditing and corporate governance frameworks to help ensure the quality of published financial statements. The disclosure requirements for publicly held companies also ensure that financial information is available to the investing public via various communication channels on a timely basis. Young and Guenther (2003) compared the accounting disclosure requirements 23 countries, including the U.S. and Hong Kong, and concluded that Hong Kong has an accounting disclosure environment comparable to those of the U.S. and Canada.
The listing of securities in Hong Kong is primarily regulated by the Rules Governing the
Listing of Securities on the Stock Exchange of Hong Kong Limited (the "Exchange Listing Rules"). Companies whose stock is listed on the Hong Kong Exchange must prepare an annual report and audited financial statements within 5 months of the end of their financial year. These must be circulated to shareholders not less than 21 days before the company's annual meeting, which must be held within 6 months of the end of each fiscal year. The annual report must include, at a minimum, a balance sheet, income statement, statement of cash flows, a statement of movements in equity, other than those arising from capital transactions with shareholders and distributions to shareholders, accounting policies, and explanatory notes (Appendix of the Listing Rules, APP 16.2). In addition, corresponding financial statements from the previous fiscal year are required to be presented for each of the current, primary financial statements reported in the annual report, and each set of financial

International Research Journal of Applied Finance ISSN 2229 – 6891 Vol. IV Issue – 6 June, 2013
789
statements in an annual report must provide a true and fair view of the state of affairs of the listed enterprise and of the results of its operation (Deloitte Touche Tohmatsu, Hong Kong GAAP).
Listed companies are also required to provide Management Discussion and Analysis (MD&A) statement (APP 16.32). In “A Guide for Directors’ Business Review in the Annual Report” published by the HKSA in 1998, a recommendation was made that the Business Review be divided into an Operating Review and a Financial Review. Other detailed disclosures required for the listed companies include information about customers and suppliers, directors' interests in the company's shares and any contracts directors have with the company, and the details of significant contracts between the company and its controlling shareholders (APP 16.31).
In addition to the published annual report, newspaper reports also are a recognized channel for dissemination of information about listed companies. Listed companies are required to provide preliminary announcements of their full-year results in the newspaper the next business day after approval of their financial statements by the board of directors (APP 7A). A semi-annual report also must be published in the newspapers and sent to shareholders within 3 months of the end of the interim period. Additionally, listed companies also are subject to numerous disclosure requirements relating to matters such as the announcement of financial results, dividends, and changes to the company's capital structure or its constitutional documents (Deloitte Touche Tohmatsu, Hong Kong GAAP). These requirements generally are satisfied by a press announcement. In summary, Hong Kong has a rich institutional and financial reporting environment that allows us to investigate the four research questions listed above.
III. Questionnaire Design and Sample
The questionnaire used to gather data for our study was designed after an extensive review of the extant literature on the value-relevance (usefulness) of accounting information and investor perception surveys (e.g., AICPA, 1994; Epstein and Pava, 1995; Anderson and Epstein, 1996; Francis and Schipper, 1999; Lev and Zarowin, 1999). The questionnaire is four pages long and consists of four separate parts. Part I collects information on the perceived usefulness of annual report items such as the chairman and director reports, audit report, operations review, financial statements and notes, in addition to the perceived usefulness of other commonly available sources of information such as industry trends, market share, competitor position, historical information on dividends, share price and earnings, advice of financial analysts, newspapers, magazines, friends and stockbrokers, company news, and company officer and director information. Altogether, respondents were asked to rate the usefulness of 20 information items on a Likert scale ranging from 0 (never used) to 5 (the most useful).
Part II contains six statements used to assess investor perceptions about the relevance and reliability of financial statements. Respondents were asked to indicate their level of agreement with six statements on a Likert scale ranging from 1 (strongly disagree) to 5 (strongly agree). The first four statements require respondents to evaluate the relevance of financial statements in terms of whether they provide information that helps investors evaluate a company’s performance and financial position, dividend-paying ability, and future prospects. The next two statements require respondents to assess their perceptions about the reliability of financial statements using a similar five-point Likert scale.
Part III of the questionnaire examines investor perceptions of the usefulness of additional information disclosures in annual reports. Specifically, respondents were asked to evaluate,
International Research Journal of Applied Finance ISSN 2229 – 6891 Vol. IV Issue – 6 June, 2013
790
on a five-point Likert scale, their perceptions of the necessity of disclosing additional financial items such as (1) high-level operating data and performance measures, (2) the effects of core and non-core activities and events on financial performance, and (3) the fair values of core and non-core assets and liabilities, as well as nonfinancial items such as (1) more complete product information, (2) forward-looking information, (3) dividend policy, (4) quality of management, and (5) competitive position. Finally, Part IV of the questionnaire collects demographic information from respondents including educational background, investment experience, investment objectives, number of stocks held, investment horizon, dollar amount invested, and investment training.
Overall the questionnaire demonstrates good reliability and validity. As reported in the next section, the average Cronbach alpha of various multi-item questions is .862, suggesting high internal reliability. The content validity of the instrument relies on previous studies (e.g., Streuly, 1994; Epstein and Pava, 1995; Anderson and Epstein, 1996) and professional literature (e.g., the U.S. and Hong Kong conceptual framework documents; the AICPA 1994 Special Committee Report on Financial Reporting) from which most of the survey questions were drawn. The construct validity of the instrument is assessed by factor analysis and, as reported in the next section, the factor solutions of various parts of the survey satisfactorily confirm the underlying constructs these questions are intended to measure, with factors explaining more than 72% of the variance for all constructs.
The questionnaire was sent to 1,062 individual investors whose names and addresses were provided by two share registrars in Hong Kong, Tengis Ltd. and Hong Kong Registrar Ltd. The sample of investors was randomly selected by the share registrars from seven companies that are typical of (1) conglomerates, (2) technology firms, and (3) traditional, non-diversified, industrial firms. The rationale behind sampling from these three types of firms is to measure investee characteristics that may affect the usefulness of annual reports. Financial reporting has been criticized for failing to capture and measure increasing complexity and intangibles in the business world (AICPA, 1994; Francis and Schipper, 1999; Lev and Zarowin, 1999; Entwistle and Phillips, 2003). Thus, conglomerates and technology companies seem more likely to present difficulties for financial reporting than traditional, non-diversified, industrial firms.
The survey was sent out in early March, and respondents were asked to respond by April 15th. Sixty nine responses were returned before the “nominal” deadline and 19 were returned after, resulting in a total of 88 usable responses. While this response rate of slightly over 8% is not very high, it is comparable to those of similar surveys found in the literature (e.g., Hodge, 2003). According to Wallace and Mellor (1988), potential non-response biases is analyzed by comparing the 69 “early” and 19 “late” responses. For all the variables in this study, only two differ at the 10 percent level. The early respondents tend to have a shorter investment time horizon than the late respondents, but have, on average, more money invested in the market than the late respondents, suggesting that the early respondents are likely to be more active investors relative to the late respondents.
IV. Results and Analyses
A. Usefulness of Annual Reports and Other Information Sources
Table I, Panel A presents descriptive statistics for the perceived usefulness of 20 information items from annual reports or other information sources. It appears that Hong Kong individual investors do not rank the usefulness of annual reports high; instead, (1) share price history, (2) prior year earnings, (3) dividend history, (4) company news, and (5) advice from analysts, newspapers, and magazines are perceived by respondents as the top five useful information

International Research Journal of Applied Finance ISSN 2229 – 6891 Vol. IV Issue – 6 June, 2013
791
sources. While Panel A provides interesting descriptive information, further analysis becomes difficult due to the large number of items involved, some of which clearly measure the same dimension of an information source. To extract unique measurement constructs, factor analysis is conducted on the 20 information items and the results are presented in Table I, Panel B.
Refer Table I
Our factor analysis methodology uses procedures suggested by Hair et al. (1998) and Field (2000). First, the overall and individual Kaiser-Meyer-Olkin measures of sampling adequacy (MSA) were examined from an initial solution. While the overall MSA was sufficiently large, six variables showed an MSA of less than .5, suggesting a low level of communality. As a result, these six variables were deleted. Second, the 14 remaining variables were examined again using factor analysis, and, as a result, one more variable was lost. The seven deleted variables having less than a .6 factor loading are: (1) Footnotes, (2) Industry Trends, (3) Advice from Analysts, (4) Advice from Friends, (5) Advice from Stockbrokers, (6) Company News, and (7) Officer and Director Information. Third, common factors were extracted based on eigenvalues greater than .7, together with an inspection of the scree plot for the tailing-off point. Table I, Panel B reveals three clearly interpretable factors with factor I measuring the perceived usefulness of annual reports, factor II measuring the perceived usefulness of market analysis, and factor III measuring the perceived usefulness of historical information on prices, dividends, and earnings.
To further analyze and compare these information sources, an average score for each factor was computed. As shown in Table II, all three average measures appear to have high reliability based on the Cronbach’s alpha values. Some of the items excluded from the factor analysis solution, i.e., items p, q, and r in Table I (advice from analysts, newspapers and magazines, advice from friends, and advice from stockbrokers), seem conceptually related, as do items i, j, s and t, which are also excluded from the factor analysis solution. However, due to the relatively low Cronbach’s alpha (.689), item p (advice from analysts, newspapers and magazines) which has the largest mean score was selected to serve as a surrogate variable for this group. For the same reason, item s (company news) was used as a surrogate variable for items i, j, s and t. Table II reports descriptive statistics and mean comparisons.
Refer Table II
As shown in Table II, Panel A, Hong Kong individual investors rank the usefulness of these five information sources in the following descending order: (1) historical price, dividends, and earnings information (HisInf), (2) company news (ComNew), (3) advice from analysts, newspapers and magazines (AdvANM), (4) annual reports (AnlRpt), and (5) market analysis (MktAna). The ANOVA and Friedman tests results reported in Table II, Panel B clearly demonstrate significant differences among these five information sources. Furthermore, the pairwise comparisons reveal that while there is no significant difference among HisInf, ComNew, and AdvANM, they are all perceived to be significantly more useful than either AnlRpt or MktAna. No difference is found between AnlRpt and MktAna.
In summary, two basic findings are reported in Tables I and II. First, five useful information sources for individual investors in Hong Kong are identified. Second, the usefulness of these five information sources is clearly stratified into two tiers by investors, with the first tier information (historical information, company news, and advice from various channels) perceived as being more useful than the second tier information (annual reports and market analysis). Based on these results, we conclude that although Hong Kong investors use annual reports, they rank the usefulness of annual reports lower than other alternative information

International Research Journal of Applied Finance ISSN 2229 – 6891 Vol. IV Issue – 6 June, 2013
792
sources. In the following sections, this paper provides evidence to explain why annual reports are not as important as they could be.
B. Role of Relevance and Reliability
Table III, Panel A reports descriptive statistics of investor perceptions of the relevance and reliability of financial statements. The results suggest that investors perceive that financial statements provide information that is most useful for assessing performance and financial position. Investors perceive financial statements also as providing information useful for assessing (listed in order of decreasing perceived usefulness) dividend-paying ability, forward-looking information, and capital allocation and possible investment. Finally, the results indicate that financial statements are perceived by investors as providing, to a lesser degree, information that is faithful and reliable. Table III, Panel B contains the factor analysis results which yield two interpretable common factors, with the first four factors measuring relevance of financial statements and the last two factors measuring reliability of financial statements.
Refer Table III
Average scores were then computed for the two factors identified in Table III, Panel B and further analyzed. As shown in Table IV, Panels A and B, investors perceive the financial statements to contain information that is more relevant than reliable, and the difference between investor perceptions of these two financial statement characteristics is highly significant according to the T test and the Wilcoxon test.
Refer Table IV
Table IV, Panels C and D report results from the analysis of the relationships between relevance and reliability and the perceived usefulness of annual reports. Based on the reported correlations, it appears that both relevance and reliability are positively related to the usefulness of annual reports at the 10% level (two-tailed), which suggests that enhancing the relevance and reliability of financial statements will likely improve the usefulness of financial reporting. However, as reported in Table IV, Panel D, the impact of relevance on financial statement usefulness is clearly greater than that of reliability. While the effect of relevance on financial statement usefulness is highly significant, the effect of reliability is not. The high level of correlation between these two characteristics (.639 in Table IV, Panel C) probably causes reliability to lose significance, although the VIF measure does not indicate serious multicollinearity. Considering these results, we conclude that relevance is perceived as more important than reliability for improving the usefulness of financial reporting.
C. Investor and Investee Characteristics and Usefulness of Annual Reports
Table V, Panel A reports six investor demographic characteristics that primarily represent investment experience and education. These characteristics are important because more experienced and/or highly educated investors may have the necessary knowledge and feel more comfortable using annual reports in investment decisions. Again, factor analysis was conducted to identify unique constructs underlying these six demographic variables. After two separate attempts, one variable (investment training) was dropped and two common factors emerged. While Factor I clearly measures investment experience, Factor II is difficult to interpret because it combines investor education and investment horizon. Furthermore, the Cronbach’s Alpha of .730 for Factor I suggests a much higher level of reliability than that of 0.548 for Factor II. Consequently, due to the aforementioned reasons, Factor II will not be further explored in the following analyses.
International Research Journal of Applied Finance ISSN 2229 – 6891 Vol. IV Issue – 6 June, 2013
793
Refer Table V
Table V, Panel B reports the distribution of respondents’ investment objectives ranging from safety of capital to speculation. While we lack a theoretical basis to predict a relationship between investment objectives and perceived usefulness of annual reports, it appears that investors speculating in the stock market may perceive annual reports as less useful than investors with other investment objectives. Table V, Panel C presents the distribution of types of companies in which the respondents are invested (investee types). After eliminating respondents that invest in more than one type of company, the results indicate that 20 respondents invested in conglomerates, 29 respondents invested in high tech firms, and 18 respondents invested in traditional, non-diversified, industrial firms. Due to the complexity of conglomerates, the importance of intangible assets to technological firms, and the perceived inability of financial statements to capture and measure increasing complexity and intangibles in the business world, we expect that investors in conglomerates and high tech firms will perceive annual reports as less useful than investors with investments exclusively in traditional, non-diversified, companies.
The correlations of investor and investee characteristics with the usefulness of annual reports are presented in Table VI, Panel A. Many of the variables are significantly associated with annual reports with anticipated signs. The perceived usefulness of annual reports is higher for more experienced investors that (1) hold a larger number of stocks, (2) have longer investing histories, (3) invest more resources in the market, or (4) have formal investment training. In addition, investor educational background has a positive relationship with the perceived usefulness of annual reports. Although none of the three investment objectives (safety of capital, steady income, speculation) are associated with perceived annual report usefulness, investee types are evidently an important factor. As expected, investors perceive the usefulness of annual reports to be higher for traditional non-diversified industrial companies and lower for high tech firms. There is a negative, but insignificant, correlation between conglomerate investees and the perceived usefulness of annual reports.
Refer Table VI
To control for the correlations that exist among the investor and investee characteristics as well as the impact of relevance and reliability, regression analysis was conducted as reported in Table VI, Panel B. Model 1 includes relevance, reliability, all of the six investor characteristics, and two indicator variables for traditional and tech firms. The investment objectives are excluded because of their insignificant correlations with perceived usefulness of annual reports. The model is highly significant with an R2 of 46%. Only two independent variables, relevance and traditional, are significant at the 5% level (one-tailed t-test with anticipated signs). The moderately high VIF measures suggest that multicollinearity may have caused some of the variables to be insignificant. Model 2 replaces the individual investment experience variables (stocks, history, money) by a composite average score based on the factor analysis in Table V and excludes the insignificant variables from Model 1. The performance of the model improves substantially with the adjusted R2 exceeding 50% and most of the independent variables significant with anticipated signs.1
In summary, the correlation and regression analyses demonstrate that the perceived usefulness of annual reports is determined not only by relevance of financial statement information, but also by investor characteristics such as experience, education, and investment horizon. In addition, the current financial reporting model appears more
1 Given the anticipated sign, the Education variable is significant at the 10% level based on a one-tailed t-test.

International Research Journal of Applied Finance ISSN 2229 – 6891 Vol. IV Issue – 6 June, 2013
794
appropriate for measuring business activities of traditional, non-diversified, companies than those of either conglomerates or high tech companies.
D. Investor Demand for Additional Information
Given our finding of the relatively low usefulness of annual reports, this section presents evidence on additional information that investors would like to see in annual reports. As reported in Table VII, Panel A, items a to c intend to measure the perceived usefulness of additional financial information, while items d through h capture perceived usefulness of additional non-financial information. A casual inspection reveals that investors appear to perceive that additional nonfinancial information has greater levels of usefulness than additional financial information. The factor analysis results in Table VII, Panel B confirm the existence of the two underlying informational dimensions, with factor I measuring financial information and factor II measuring nonfinancial information. Item h was excluded in the final solution due to its low factor loading of less than .6.
Refer Table VII
Finally, Table VIII presents a further analysis based on summated scores for the two factors. It seems that investors’ perceived usefulness of both additional financial and nonfinancial information indicates a desire for additional information of both types in annual reports. However, the perceived usefulness and corresponding demand for additional non-financial information is significantly higher than that for financial information based on both the T test and the Wilcoxon test. These findings, together with the results of the previous sections, lead us to conclude that Hong Kong investors are not satisfied with the usefulness of information they receive from current annual reports, and as a result, they have a demand for additional information. In particular, they perceive relevant non-financial information to be particularly useful and desire that such information be disclosed in addition to information contained in annual reports.
Refer Table VIII
V. Conclusions
Using a survey approach, this study examines the perceptions of the usefulness of information to individual investors in Hong Kong. This paper reports some interesting findings that not only complement archival-based research on the value-relevance (usefulness) of accounting information, but also offer implications on how to improve financial reporting.
First, the results show that while investors make use of annual reports, they rank the usefulness of financial statements lower than other alternative information sources such as historical information on stock prices, dividends and earnings, company news, as well as advice from analysts, newspapers and magazines. This result may explain why the value-relevance literature finds accounting information useful, but the reported R2s are generally low. Second, consistent with the FASB Conceptual Framework (FASB, 1978), individual investors view relevance and reliability as the two primary characteristics of useful financial reporting. However, relevance is more important than reliability in influencing investor perceptions of the usefulness of annual reports. This result complements the findings of studies that indicate that fair value accounting reports are value relevant in the sense that fair value numbers have been found to be value relevant, even though reliability is a concern (Barth et al. 2001). In addition, our second result is consistent with the accounting profession’s move toward emphasizing relevance over reliability as reflected in the FASB and IASB Joint Conceptual Framework Project (Heffes, 2005).
International Research Journal of Applied Finance ISSN 2229 – 6891 Vol. IV Issue – 6 June, 2013
795
Our results also show that investor characteristics, such as education, investment experience, and investment horizon, affect investors’ perceptions of annual report usefulness. In addition, the type of companies in which they invest also has a significant impact on investors’ perceived usefulness of annual reports. Our results also demonstrate that the current financial reporting model appears to be more appropriate for measuring business activities of traditional, non-diversified, companies than for either conglomerates or high tech companies. These two results suggest that the usefulness of annual reports will likely improve with both enhanced investor education and improved financial reporting models capable of measuring business activities across different types of companies.
Finally, consistent with investor discontent with current financial reporting, this study finds a strong demand by individual investors for the disclosure of additional financial and non-financial information in annual reports. Additionally, our results indicate that investor demand for non-financial information, such as quality of management and forward-looking information, is significantly higher than that for financial information, such as fair value of assets and liabilities and performance measures. These results indicate possible ways by which the current financial reporting model can be improved.
While this study presents new evidence about user perception of the usefulness of annual reports and other information, several limitations should be noted when evaluating the findings. First, a relatively low response rate is a cause for concern. While the non-response analysis did not reveal any major differences between the early and late respondents, the analysis was limited in that the classification of early vs. late respondents was based on an arbitrary submission date. Second, measurement errors inherent in survey studies cannot be ruled out. There is no direct control over whether respondents interpret the survey questions in the manner intended. Although the survey instrument was designed after an extensive review of the user perception literature, it is difficult to eliminate response errors that might result from the possibility that people answer questions erroneously, either deliberately or unconsciously. Third, while the selection of individual investors in the seven companies representing conglomerate, technological, and traditional, non-diversified firms was random, these companies were not randomly selected. Instead, they were chosen by the two share registrars that helped with the sampling process. Finally, the current survey is limited to individual investors. While an important user group, individual investors are generally believed to be less sophisticated than institutional investors which may have different perceptions of financial reporting usefulness. Future studies may want to compare the perceptions of financial statement usefulness among different user groups and identify the reasons for such differences, if they exist.
References
Alford, A. and J. Jones, 1993, The Relative Informativeness of Accounting Disclosures in Different Countries, Journal of Accounting Research 31Issue 3: 183.
American Institute of Certified Public Accountants, 1994, A Model Of Business Reporting: Responsive To The Information Needs Of Investors And Creditors As Understood By The AICPA Special Committee On Financial Reporting. (AICPA, New York, NY).
American Institute of Certified Public Accountants, 1994, Special Committee on Financial Reporting: Improving Business Reporting-A Customer Focus. (AICPA, New York, NY).
Amir, A., T. S. Harris, and E. K. Venuti,1993, A Comparison of the Value-Relevance of US Versus Non-US GAAP Accounting Measures Using Form 20-F Reconciliations, Journal of Accounting Research, 31(Supplement), 230-264.

International Research Journal of Applied Finance ISSN 2229 – 6891 Vol. IV Issue – 6 June, 2013
796
Anderson, R. and M. J. Epstein,1995, The Usefulness of Annual Reports, Australian
Accountant, April, 25-28. Barth, M., W.H. Beaver, and W. Landsman 2001, The Relevance of Value-Relevance
Literature for Financial Accounting Standard Setting: Another View, Journal of
Accounting and Economics, 31, 77-104. Barth, M. and G. Clinch,1996, International Accounting Differences and Their Relation to
Share Prices: Evidence from U.K., Australian, And Canadian Firms, Contemporary
Accounting Research, 13, 135-171. Bricker, R. and N. Chanda, 2012, Relevance, reliability and restricted security fair values: a
look at investment trust, Managerial Finance, 38(12), 1203-1225. Chen, J. P., S. Chen, and X. Su, 2001, Is Accounting Information Value-Relevant in the
Emerging Chinese Stock Market?, Journal of International Accounting Auditing &
Taxation, 10(1), 1. Deloitte Touche Tohmatsu, 2001, Hong Kong GAAP: A Practical Guide to Generally
Accepted Accounting Practice, (Sweet & Maxwell Asia, Hong Kong, Singapore, Malaysia).
Ely, K. and G. Maymire, 1999, Accounting Standard Setting Organizations and Earnings Relevance: Longitudinal Evidence from NYSE Common Stocks, Journal of
Accounting Research, 37, 293-318. Entwistle, G. M. and F. Phillips, 2003, Relevance, Reliability, and the Earnings Quality
Debate, Issues in Accounting Education, 18 1, 79-92. Epstein, M. J. and M. L. Pava, 1995, Shareholders' Perceptions on the Usefulness of
MD&AS, Managerial Finance, 68. Field, A., 2000, Discovering Statistics using SPSS for Windows, (Sage Publications, London
-Thousand Oaks –New Delhi). Financial Accounting Standards Board, 1978, Statement of Financial Accounting Concept
No. 1, (FASB, Stamford, CT). Financial Accounting Standards Board, 1980, Statement of Financial Accounting Concepts
No. 2. (FASB, Stamford, CT). Francis, J. and K. Schipper, 1999, Have financial statements lost their relevance?, Journal of
Accounting Research, 37(2), 319. Graham, R. C. and R. D. King, 2000, Accounting Practices and the Market Valuation of
Accounting Numbers: Evidence from Indonesia, Korea, Malaysia, the Philippines, Taiwan, and Thailand, International Journal of Accounting, 35(4), 445.
Hair, J. F. J., R. E. Anderson, R. L. Tatham, and W. C. Black, 1998, Multivariate data
analysis, (Prentice Hall, Upper Saddle River, NJ). Heffes, E. M, 2005, The Relevance of Reliability: An Update on the FASB and IASB Joint
Concept Framework Project, Financial Executives, 21(10), 15-18. Ho, S. M. and K. S. Wong, 2004, Investment Analysts’ Usage and Perceived Usefulness of
Corporate Annual Reports, Corporate Ownership & Control, (3), 61. Hodge, F. D., 2003, Investors' Perceptions of Earnings Quality, Auditor Independence, and
the Usefulness of Audited Financial Information, Accounting Horizons, 17, 37. Holthausen, R. and R. Watts, 2001, The Relevance of the Value-Relevance Literature for
Financial Accounting Standard Setting, Journal of Accounting and Economics, 31, 3-76.
Hong Kong Society of Accountants, 1997, Framework for the Preparation and Presentation of Financial Statements
Lee, T. A. and D. P. Tweedie, 1975, Accounting Investigation of Private Shareholder Understanding, Accounting and Business Research, Winter, 3-17.

International Research Journal of Applied Finance ISSN 2229 – 6891 Vol. IV Issue – 6 June, 2013
797
Lev, B. and P. Zarowin, 1999, The boundaries of financial reporting and how to extend them, Journal of Accounting Research, Autumn, 353-385.
Lim, S.C. & T. Park, 2011, The declining association between earnings and returns: Diminishing value relevance of earnings or noisier markets?, Management Research
Review, 34(8), 947-960. Naser, K. and R. Nuseibeh, 2003, Quality of Financial Reporting: Evidence from the Listed
Saudi Non-Financial Companies, International Journal of Accounting.
Pouraghajan, A., M. Emamgholipour, F. Niazi, and A. Samakosh, 2012, Information Content of Earnings and Operating Cash Flows: Evidence from the Tehran Stock Exchange, International Journal of Economics and Finance , 4 (7), 41-51.
Riley, R. A., T. Pearson, A. Timothy, and G. Trompeter, 2003, The value relevance of non-financial performance variables and accounting information: the case of the airline industry, Journal of Accounting & Public Policy, 22(3), 231.
Streuly, A. C., 1994, The Primary Objective of Financial Reporting: How Are We Doing?, The Ohio CPA Journal, December, 15-22.
Wallace, R. and C. J. Mellor, 1988, Nonresponse Bias in Mail Accounting Surveys: A Pedagogical Note, British Accounting Review, 20, 131-139.
Young, D. and D. Guenther, 2003, Financial Reporting Environments and International Capital Mobility, Journal of Accounting Research, 41(3), 553-579.
Table I: Usefulness of Annual Reports and Other Information Sources (n = 88)
Panel A: Descriptive Statistics Items Rank Mean Median SD Min Max a. Chairman Report 14 2.32 3.00 1.95 0 5 b. Auditor Report 19 2.00 1.50 2.11 0 5 c. Director Report 17 2.16 3.00 1.95 0 5 d. Operational Review 10 2.50 3.00 2.04 0 5 e. Financial Review 9 2.59 3.00 1.93 0 5 f. Balance Sheet 8 2.73 3.00 2.00 0 5 g. Cash Flow Statement 10 2.50 3.00 2.17 0 5 h. Income Statement 7 2.98 3.50 1.99 0 5 i. Footnotes 19 2.00 1.50 2.00 0 5 j. Industry Trends 15 2.30 3.00 1.89 0 5 k. Company Market Share 13 2.43 2.50 1.84 0 5 l. Competitor Position 18 2.09 2.00 1.92 0 5 m. Dividends History 3 3.64 4.00 1.59 0 5 n. Share Prices History 1 3.75 4.00 1.39 0 5 o. Prior Years Earnings 2 3.68 4.00 1.62 0 5 p. Advice from Analysts, Newspapers, and Magazines
5
3.27
4.00
1.55
0
5
q. Advice from Friends 12 2.45 3.00 1.58 0 5 r. Advice from Stockbrokers 16 2.20 3.00 1.79 0 5 s. Company News 4 3.39 4.00 1.61 0 5 t. Officer and Director Information 6 3.05 3.00 1.60 0 5
Panel B: Factor Analysis Factor Loadings > .6 Factors and Questionnaire Items I II III MSA Factor I: Eigenvalue = 6.986 Director Report .901 .817 Chairman Report .837 .790 Balance Sheet .788 .886 Income Statement .739 .850 Auditor Report .738 .914 Financial Review .704 .845 Operational Review .699 .879

International Research Journal of Applied Finance ISSN 2229 – 6891 Vol. IV Issue – 6 June, 2013
798
Cash Flows Statement .683 .836 Factor II: Eigenvalue = 1.712 Competitor Position .931 .615 Company Market Share .877 .614 Factor III: Eigenvalue = 1.419 Share Prices History .871 .713 Dividends History .840 .679 Prior Years Earnings .826 .765 Kaiser’s Overall MSA .805 Cumulative % of Variance Explained 77.89%

International Research Journal of Applied Finance ISSN 2229 – 6891 Vol. IV Issue – 6 June, 2013
799
Table II: Mean Comparisons - Annual Reports and Other Information Sources (n = 88)
Panel A: Descriptive Statistics
Rank Mean Median SD Min Max
HisInf 1 3.69 4.00 1.35 0 5 ComNew 2 3.39 4.00 1.61 0 5 AdvANM 3 3.27 4.00 1.55 0 5 AnlRpt 4 2.47 2.81 1.70 0 5 MktAna 5 2.26 2.00 1.80 0 5
Panel B: Repeated Measures Analysis
ANOVA: F = 17.539, p = .000 Friedman Test: Chi-Square = 50.819, p = .000 Bonferroni Pairwise Comparison: Mean Diff Std Error p HisInf vs. ComNew .303 .188 1.000 AdvANM .417 .175 .192 AnlRpt 1.218 .168 .000 MktAna 1.428 .211 .000 ComNew vs. AdvANM .114 .201 1.000
AnlRpt .915 .247 .004 MktAna 1.125 .243 .000
AdvANM vs. AnlRpt .801 .225 .006 MktAna 1.011 .223 .000 AnlRpt vs. MktAna .210 .187 1.000
All p-values are 2-tailed. HisInf: Average score of items for Factor III in Table I, Cronbach’s alpha = .848 ComNew: Original score for Company News in Table I AdvANM: Original score for Advice from Analysts, Newspapers, and Magazines in Table I AnlRpt: Average score of items for Factor I in Table I, Cronbach’s alpha = .941 MktAna: Average score of items for Factor II in Table I, Cronbach’s alpha = .911

International Research Journal of Applied Finance ISSN 2229 – 6891 Vol. IV Issue – 6 June, 2013
800
Table III: Relevance and Reliability of Financial Statements (n = 88)
Panel A: Descriptive Statistics Items Rank Mean Median SD Min Max
a. Information for assessing performance and financial position
1 3.57 3.50 1.20 1 5
b. Information for assessing dividend-paying ability
2 3.23 3.00 1.30 1 5
c. Forward-looking information 3 2.98 3.00 1.06 1 5 d. Information for capital allocation and
possible investment
4
2.93
3.00
1.18
1
5 e. Faithful information 5 2.91 3.00 1.13 1 5 f. Reliable information 6 2.89 3.00 .89 1 5
Panel B: Factor Analysis (Factor Loading > .6)
Factors and Questionnaire Items I II MSA Factor I: Eigenvalue = 4.161 Information for assessing performance and financial position .913 .863 Information for assessing dividend-paying ability .868 .822 Forward-looking information .783 .911 Information for capital allocation and possible investment .735 .871 Factor II: Eigenvalue = .886 Faithful information .918 .793 Reliable information .865 .807 Kaiser’s Overall MSA .846 Cumulative % of Variance Explained 84.11%

International Research Journal of Applied Finance ISSN 2229 – 6891 Vol. IV Issue – 6 June, 2013
801
Table IV Analysis of Relevance and Reliability (n = 88)
Panel A: Descriptive Statistics
Rank Mean Median SD Min Max
Relevance 1 3.176 3.13 1.06 1.00 5.00 Reliability 2 2.898 3.00 0.95 1.00 5.00
Panel B: Pairwise Comparison
Mean Std T-Test Wilcoxon Ranks Test
Diff Error t p z P
Relevance vs. Reliability .278 .009 3.038 .003 -2.658 .008
Panel C: Correlations
AnlRpt Relevance Reliability AnlRpt 1 Relevance .387 (.000) 1 Reliability .184 (.086) .639 (.000) 1
Panel D: Regression (AnlRpt as Dependent Variable)
β t (p-value) VIF Relevance .730 3.517 (.001) 1.692 Reliability -.192 -.827 (.410) 1.692 Adjusted R2 = .137, F = 7.893 (.001), All p-values are 2-tailed.
Relevance: Average score of items for Factor I in Table III, Cronbach’s alpha = .914 Reliability: Average score of items for Factor II in Table III, Cronbach’s alpha = .854 AnlRpt: Average score of items for Factor I in Table I
Table V Investor and Investee Characteristics
Panel A: Investor Demographics
Counts Factor Loading > .6
One Zero Total I II MSA
Stocks 30 55 85 .865 .585 History 34 28 62 .837 .691 Money 63 20 83 .646 .640 Education 51 32 83 .857 .554 Horizon 42 43 85 .803 .653 Training 20 66 86 Eigenvalue 2.202 1.418 Kaiser’s Overall MSA .620 Cumulative % of Variance Explained 72.34%
Panel B: Investment Goal
Safety of Capital Steady Income Speculation Total
Counts 18 53 13 84
Panel C: Type of Companies Invested Conglomerate Technology Traditional Total
Counts 20 29 18 67
Stocks: 1 for numbers of stocks held over 10 History: 1 for investing history over 10 years Money: 1 for total investment over HK$100,000 Education: 1 for education above the university level Horizon: 1 for average holding period over 2 years Training: 1 for any formal training in securities investment

International Research Journal of Applied Finance ISSN 2229 – 6891 Vol. IV Issue – 6 June, 2013
802
Table VI: Relationship of Investor and Investee Characteristics and Financial Reporting
Panel A: Correlations 1 2 3 4 5 6 7 8 9 10 11 12
1 AnlRpt 1.000
2 Stocks .314 (.003)
1.000
3 History .296 (.019)
.538 (.000)
1.000
4 Money .365 (.001)
.417 (.000)
.451 (.000)
1.000
5Education .259 (.018)
.070 (.532)
.210 (.101)
.417 (.000)
1.000
6 Horizon -.043 (.695)
.050 (.654)
.029 (.821)
.205 (.063)
.377 (.000)
1.000
7 Training .201 (.063)
.287 (.008)
.387 (.002)
.307 (.005)
.099 (.373)
.148 (.178)
1.000
8 Safety .061 (.580)
-.009 (.936)
-.231 (.071)
-.125 (.268)
.070 (.532)
.169 (.126)
-.292 (.007)
1.000
9 Income -.099 (.369)
-.060 (.588)
-.072 (.580)
.104 (.357)
-.081 (.468)
-.115 (.300)
.080 (.469)
-.683 (.000)
1.000
10 Spec .063 (.570)
.090 (.420)
.281 (.027)
.004 (.972)
-.067 (.546)
-.038 (.731)
.224 (.040)
-.223 (.041)
-.559 (.000)
1.000
11Conglom -.059 (.633)
.284 (.022)
.251 (.082)
.301 (.017)
.369 (.003)
.271 (.030)
.078 (.537)
.110 (.391)
.042 (.746)
-.149 (.244)
1.000
12.Tech -.333 (.006)
-.642 (.000)
-.590 (.000)
-.376 (.003)
-.379 (.002)
-.399 (.001)
-.279 (.025)
-201 (.115)
.057 (.657)
.113 (.377)
-570 (.000)
1.000
13.Traditional .433 (.000)
.429 (.000)
.439 (.002)
.118 (.361)
.046 (.720)
.174 (.170)
.232 (.063)
.110 (.391)
-.104 (.416)
.025 (.847)
-.395 (.001)
-.529 (.000)

International Research Journal of Applied Finance ISSN 2229 – 6891 Vol. IV Issue – 6 June, 2013
803
Table VI Relationship of Investor and Investee Characteristics and Financial Reporting
Panel B: Regressions (AnlRpt as Dependent Variable, n = 47)
Model 1 Model 2
Indep. Var β t (p-value) VIF Indep. Var β t (p-value) VIF
Relevance .836 1.875 (.069) 4.606 Relevance .971 4.632 (.000) 1.102 Reliability .289 .661 (.513) 3.752 Experience 1.161 2.032 (.049) 1.606 Stocks .637 1.036 (.307) 2.862 Education .636 1.406 (.167) 1.342 History .217 .356 (.724) 3.064 Horizon -.642 -1.722 (.093) 1.222 Money .633 .944 (.352) 2.144 Traditional 1.015 2.094 (.042) 1.437 Education .739 1.411 (.167) 1.658 Horizon -.580 -1.267
(.213) 1.704
Training -.004 -.009 (.993) 1.647 Traditional 1.045 1.923 (.062) 1.668 Tech .358 .425 (.673) 5.984 Adjusted R2 = .461 F = 4.936 (.000)
Adjusted R2 = .502 F = 10.285 (.000)
All p-values are 2-tailed. AnlRpt: Average score of items for Factor I in Table I Experience: Average score of items for Factor I in Table VI, Cronbach’s alpha = .730 Relevance: Average score of items for Factor I in Table III Reliability: Average score of items for Factor II in Table III Traditional: 1 for holding stocks in an ordinary business Stocks: 1 for numbers of stocks held over 10 Tech: 1 for holding stocks in a tech company History: 1 for investing history over 10 years Conglom: 1 for holding stocks in a conglomerate Money: 1 for total investment over HK$100,000 Safety: 1 for safety of capital as the investment goal Education: 1 for education above the university level Income: 1 for steady income as the investment goal Horizon: 1 for average holding period over 2 years Spec: 1 for speculation as the investment goal Training: 1 for any formal training in securities investment
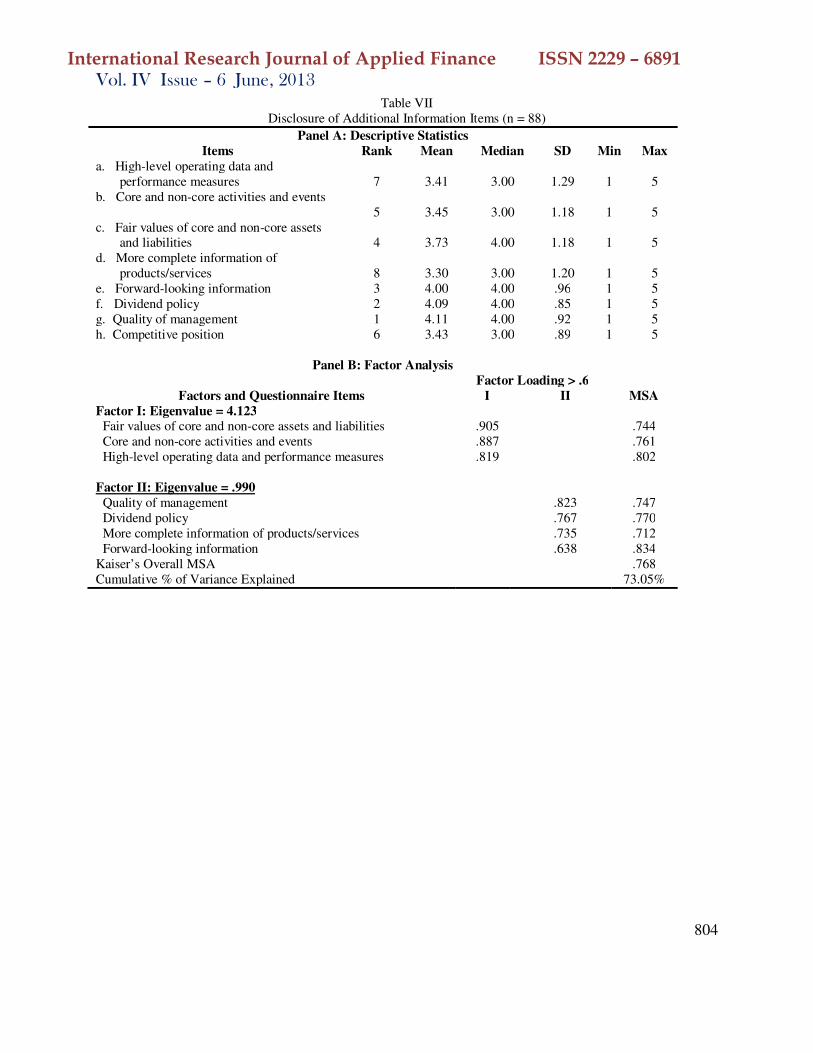
International Research Journal of Applied Finance ISSN 2229 – 6891 Vol. IV Issue – 6 June, 2013
804
Table VII Disclosure of Additional Information Items (n = 88)
Panel A: Descriptive Statistics Items Rank Mean Median SD Min Max
a. High-level operating data and performance measures
7
3.41
3.00
1.29
1
5
b. Core and non-core activities and events 5
3.45
3.00
1.18
1
5
c. Fair values of core and non-core assets and liabilities
4
3.73
4.00
1.18
1
5
d. More complete information of products/services
8
3.30
3.00
1.20
1
5
e. Forward-looking information 3 4.00 4.00 .96 1 5 f. Dividend policy 2 4.09 4.00 .85 1 5 g. Quality of management 1 4.11 4.00 .92 1 5 h. Competitive position 6 3.43 3.00 .89 1 5
Panel B: Factor Analysis
Factor Loading > .6 Factors and Questionnaire Items I II MSA
Factor I: Eigenvalue = 4.123 Fair values of core and non-core assets and liabilities .905 .744 Core and non-core activities and events .887 .761 High-level operating data and performance measures .819 .802 Factor II: Eigenvalue = .990
Quality of management .823 .747 Dividend policy .767 .770 More complete information of products/services .735 .712 Forward-looking information .638 .834 Kaiser’s Overall MSA .768 Cumulative % of Variance Explained 73.05%

International Research Journal of Applied Finance ISSN 2229 – 6891 Vol. IV Issue – 6 June, 2013
805
Table VIII Mean Comparisons: Disclosure of Additional Information Items (n = 88)
Panel A: Descriptive Statistics
Rank Mean Median SD Min Max
Financial 2 3.53 3.67 1.12 1.00 5.00 NonFin 1 3.88 4.00 0.78 2.25 5.00
Panel B: Pairwise Comparison
Mean Std T-Test Wilcoxon Ranks Test Diff Error t p z P
Financial vs. NonFin -.345 .094 -3.656 .000 -3.373 .001
All p-values are 2-tailed. Financial: Average score of items for Factor I in Table VII, Cronbach’s alpha = .904 NonFin: Average score of items for Factor II in Table VII, Cronbach’s alpha =.796

International Research Journal of Applied Finance ISSN 2229 – 6891 Vol. IV Issue – 6 June, 2013
806
Assessment Ratios and the Consequences of Buying into the Housing
Bubble
Russ Kashian PhD University of Wisconsin Whitewater
Jeremy Peterson University of Wisconsin Whitewater

International Research Journal of Applied Finance ISSN 2229 – 6891 Vol. IV Issue – 6 June, 2013
807
Abstract
This study addresses the relationship the assessment value to purchase price ratio had on the probability of that home being foreclosed on or experiencing a sheriff’s sale. Using housing data from 2002 to 2012, and controlling for the housing market crash in 2008, this study employs a binary logit regression to determine the effects of buying above assessed value of a home before and after the crash, while controlling for the hedonic variables of the home.
Introduction
The mortgage default crisis has been accompanied by a decline in property values throughout the United States. Prior to this crisis studies focused on the decrease in prices relative to the loan-to-value ratio where defaulting on a mortgage as a rational decision (Capozza, Kazarian, and Thomson, 1997; Ong, Neo and Spieler, 2006). However, what was left unstudied was how this decline was exacerbated by the challenges created by paying over assessed value on purchases. The idea that bidding above assessed value was unimportant in a rising market, a type of “irrational exuberance” exhibited earlier in the financial markets had merit, as long as the rising tide of home prices eventually lifted domiciles to a value above the purchase price. As this expectation of appreciation has proven false, the subsequent years of declining prices left little room for financial calamities.
To acknowledge the problem, this study looks at the impact the bid above assessment has had on the probability of default. Specifically, both sheriff sales and foreclosures are addressed. While it is noted that the default is due to a laundry list of individual factors, such as employment turmoil, family crisis, medical emergencies and such, the inability to sell the home in the face of such challenges results in an untenable condition. Given the lack of equity, and the possibility that the home’s loan-to-value ratio will be “underwater”, default is the potential outcome. In this model, the home is decomposed into its constituent characteristics and isolates the estimated contributory value of each characteristic. The variable of interest for this analysis is the level of “overbidding” (as defined by purchasing the home for more than the assessed value).
This study investigates patterns of mortgage default using a database of mortgages for the City of Muskego, Wisconsin. Muskego serves as a strong example of an exurb, just outside the City of Milwaukee. It is a bedroom community with a strong agricultural presence. With a population of 24,135 and a median household income of $83,994 with 2.1% of families living below the poverty line (United States Census Bureau), it is representative of the growing exurbs of recent years. The average home price in Muskego was $269,500. Waukesha County, where Muskego exists, has a median household income of $75,845 with 4.7% of the families living below the poverty line and an average home price of $261,100. As a result, Muskego is slightly wealthier than the overall county in which it exists.
Literature Review
While this paper focuses on the recent housing default crisis, it is also imbedded in the issue of market bubbles. The issue of investment behavior founded on an unfounded belief in ever rising prices was explored by Baker and Wurgler (2007). This idea intersects with a history of price swings in the housing market (Capozza and Seguin, 1995). Ong, Neo and Spieler (2006) use data from Singapore to examine the effect of housing purchase prices on subsequent defaults.

International Research Journal of Applied Finance ISSN 2229 – 6891 Vol. IV Issue – 6 June, 2013
808
Case and Shiller (1988) used survey data from New England to assess the impact positive appreciation expectations have on the purchase decision. However, this paper did not assess the subsequent default risk embedded in these expectations. Gerardi, Shapiro, and Willen (2007) suggest that the rise of foreclosures in 2006 and 2007 was driven by external factors. They point to evidence from Massachusetts showing that high home price appreciation correlates with low foreclosures, while low home price appreciation correlates with higher levels of foreclosures.
The literature that specifically relates to foreclosures is wide and varying. Much of it is based on the negative externality created by defaulting. These spatial papers began in Ernest in the 1960’s (Jung, 1962; Von Furtstenberg, 1969; Von Furtstenberg, 1970a; Von Furtstenberg, 1970b; Von Furtstenberg, 1974). This early literature provides a platform upon which future research develops and examines foreclosures according to a bank’s risk assessment. Given, our papers focus on the risk created by electing to pay in excess of the assessed value, this research serves to examine the relationship between mortgage default and loan-to-value ratios, risk factors, loan quality and interest rates. Much of the early foreclosure literature is covered in Quercia and Stegman (1992) and Vandell (1995).
Data and Descriptive Statistics
This analysis uses a ten-year panel from Muskego, Wisconsin that encompasses home sales from 2002 through 2012. The dataset begins in 2002 as there were a very limited number of sheriff sales that occurred prior to this. As the decade progressed, sheriff sales have become more commonplace and appear more often in the Muskego’s assessment records. The foreclosure and sheriff sale data was collected from a multitude of state and local sources. The City of Muskego Assessor Office keeps updated records on all homes sold during our data set. However, this set is limited to information on the sale price and assessed value. Note that the data is censored. Home sales prior to 2002 were not included, nor the possible (but not yet occurred) sheriff sales subsequent to 2012. Finally, only sheriff’s sales and foreclosures related to properties that sold during the 2002 to 2012 time frame are included. Given that property sales in the years 2011-2012 are not yet seasoned, there is limited knowledge regarding the full effect the housing bubble will have on current years until more time passes. Note that no property purchased subsequent to 2009 has experienced a sheriff’s sale as of December 31, 2012.
Information on the location of the property relative to Muskego landmarks was provided by a mapping system offered by the City Assessor. Data on the foreclosures that occurred in Muskego within the last decade was collected from the Wisconsin Circuit Court and aligned with the home sales information based on the address. Foreclosures that ultimately resulted in a sheriff sale were determined through the City Assessor’s personal notes that had been included with all property sales that indicated unusual sales circumstances.
Although the decline in home sales first began to manifest in 2008, the number of foreclosures and sheriff sales was on the rise as early as 2006. There was a rise in both, the number of foreclosures and the number of sheriff sales. While respectively, seeing a recent decrease in the amount of time between foreclosure and sheriff sale (almost one standard deviation below the mean in 2010). This could in part be caused through increased efficiency of selling properties by the bank, despite a depressed real estate market.

International Research Journal of Applied Finance ISSN 2229 – 6891 Vol. IV Issue – 6 June, 2013
809
The common home in Muskego is typical of what one would expect, with an average of three bedrooms and two bathrooms. A number of older homes were sold during this time period, some of which were built in the mid 1800’s. Properties located on one of Muskego’s three lakes were rare among the homes that sold, or sheriff-sold, with slightly more than five percent of the population having lakefront property.
Empirical Model
The model created considers a logit model that tests whether or not a property’s purchase price to assessed value ratio has any significant effect on the probability that foreclosed home ultimately becomes a sheriff sale. This paper regards Ambrose and Capone’s model as a baseline guide by which a test is developed to determine whether or not a home that is foreclosed can redeem itself (Ambrose and Capone, 1998). An important determinant in their model is the unique financial position of the home borrower. Our model looks at this cost as the important determinant.
Ambrose and Capone’s primary findings were twofold. First, a default can “be generated from borrowers with positive as well as negative equity” (Ambrose and Capone, 1998). Second, “the process and rates of transition from default to foreclosure are different for each of these groups of defaulters” (Ambrose and Capone, 1998). Specifically, they found that the resulting redemption occurs between 22.5 percent (for low loan to value (LTV) borrowers) and 49.7 percent (for high LTV borrowers). This is to be expected because the higher the LTV, the more likely those borrowers would have the financial means. The model included in this paper does not include any financial information on the homeowners. Rather, it incorporates hedonic housing characteristics along with the sales price and assessed value.
Our model builds upon earlier works and is conducted in two stages. The first stage, looks at whether price/assessed ration is a determinant to the probability that a sheriff’s sale would occur. In this binary logic analysis, hedonic variables are included as controls. The second stage examines that given a foreclosure was filed against a homeowner, whether or not a sheriff’s sale had occurred. Once again, hedonic variables are included. However, this test questions whether “overpaying” puts the homeowner in a corner once the foreclosure is filed.
In a fashion, this paper is akin to Ambrose and Capone (1998) in their conditional probability analysis of default by homeowners, whose loans were underwater. In that paper, the homeowners were separated into two groups. The first group experience loans that were underwater and “ruthless” whose strategy was to walk away from the home due to its lack of investment value. The second group, also witnesses the foreclosure process, but their equity position is positive and their foreclosure was due to actions beyond their control. Our paper does not create a conditional format. Rather, the paper determines if (1) the price/assessment ration was a significant variable in the probability to have a foreclosure action filed. The second question (2) was, whether price assessment was a significant variable in the probability that a home would progress to sheriff’s sale. Finally, (3) the data is reduced to those properties that were party to a foreclosure lawsuit, whether price/assessment was a positive and significant factor in the resulting sheriff’s sale.

International Research Journal of Applied Finance ISSN 2229 – 6891 Vol. IV Issue – 6 June, 2013
810
Results
For both Tables 1 and 2 (displayed below) the price/assessment ratio interaction variables, indicates with denotation (Ĭ), are significant from the years 2002-2008. This means that homeowners who bought housing above market value before the crash were more likely to foreclose on or have their property go to sheriff sale than someone who bought at or below the assessed value of the property. Although, running the binary logit revealed that these interaction variables were significant for both foreclosures and sheriff sales, the betas for these interactions were greater for sheriff sales. This indicates that buying above market value for a home greatly increased the probability of a home going to sheriff sale compared to a home going into foreclosure.
For sheriff sales exclusively, (Ĭ) 2009 was positive and significant. Buying above assessed value one year after the housing crash still increased the probability of the property going to sheriff sale, but there was no evidence to indicate that the probability of foreclosures would go up for overpaying in 2009. (Ĭ) The year 2010 was insignificant for both foreclosures and sheriff sales. Note, the years 2011 and 2012 were used as the reference groups in this set of binary logits.
For foreclosures exclusively, the age of the home at sale was positive and significant, however the beta on this variable is small. By being this small, the beta does not hold much predictive value. The more important descriptive variable of a property would be the sales price.
The sales price of a property was significant and negatively correlated with the probability of a property going to sheriff sale or being foreclosed upon. Buying above market value raised the probability of default; however buyers who buy expensive homes in general are less likely to default on their property payments.
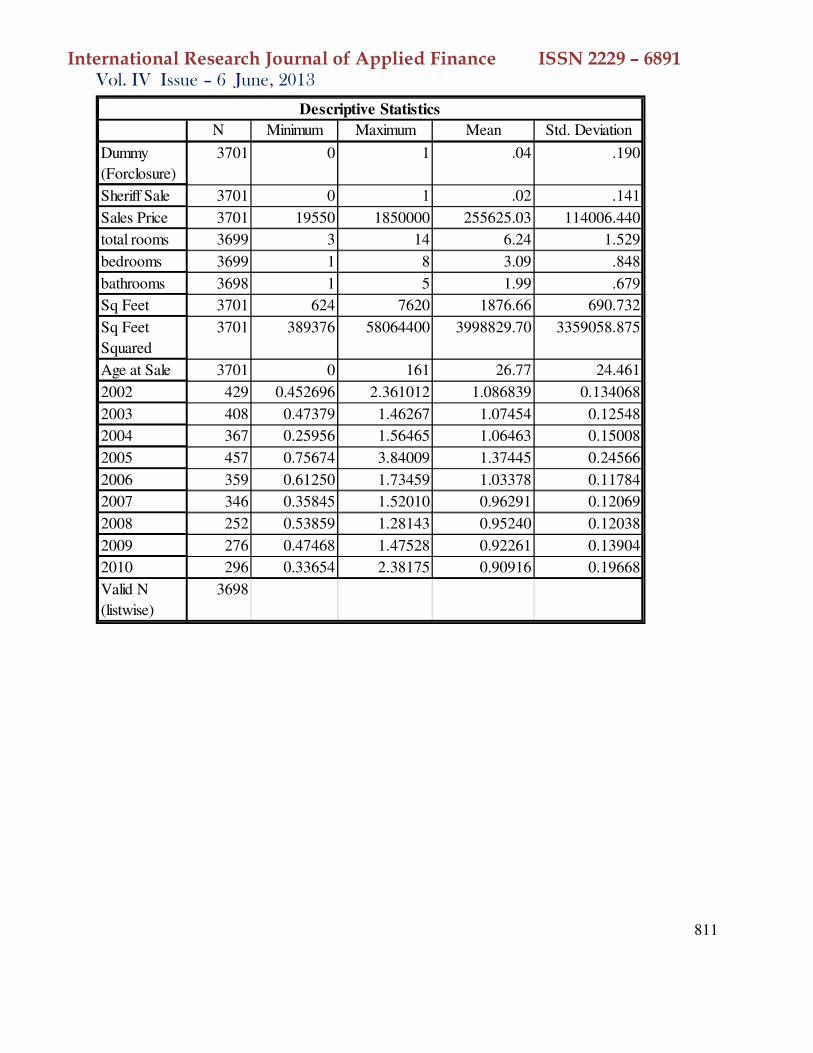
International Research Journal of Applied Finance ISSN 2229 – 6891 Vol. IV Issue – 6 June, 2013
811
N Minimum Maximum Mean Std. Deviation
Dummy
(Forclosure)
3701 0 1 .04 .190
Sheriff Sale 3701 0 1 .02 .141
Sales Price 3701 19550 1850000 255625.03 114006.440
total rooms 3699 3 14 6.24 1.529
bedrooms 3699 1 8 3.09 .848
bathrooms 3698 1 5 1.99 .679
Sq Feet 3701 624 7620 1876.66 690.732
Sq Feet
Squared
3701 389376 58064400 3998829.70 3359058.875
Age at Sale 3701 0 161 26.77 24.461
2002 429 0.452696 2.361012 1.086839 0.134068
2003 408 0.47379 1.46267 1.07454 0.12548
2004 367 0.25956 1.56465 1.06463 0.15008
2005 457 0.75674 3.84009 1.37445 0.24566
2006 359 0.61250 1.73459 1.03378 0.11784
2007 346 0.35845 1.52010 0.96291 0.12069
2008 252 0.53859 1.28143 0.95240 0.12038
2009 276 0.47468 1.47528 0.92261 0.13904
2010 296 0.33654 2.38175 0.90916 0.19668
Valid N
(listwise)
3698
Descriptive Statistics

International Research Journal of Applied Finance ISSN 2229 – 6891 Vol. IV Issue – 6 June, 2013
812
Coefficient (B) Standard Error P-Value
SalesPrice (***) -0.00000817 0.00000234 .000
totalrooms .172 .174 .323
bedrooms -.160 .246 .516
bathrooms -.230 .289 .426
SqFeet .001 .001 .218
SqFeetSquared .000 .000 .575
AgeatSale .000 .003 .971
(I) 2002 (***) 1.878 .521 .000
(I) 2003 (***) 2.017 .648 .002
(I) 2004 (***) 2.650 .639 .000
(I) 2005 (***) 2.257 .478 .000
(I) 2006 (***) 3.637 .678 .000
(I) 2007 (***) 2.783 .781 .000
(I) 2008 (***) 3.036 .788 .000
(I) 2009 (**) 2.130 .909 .019
(I) 2010 -28.915 3204.148 .993
Constant (***) -6.367 1.010 .000
(I) Signifies any variable that acts as an interaction variable
** Significant at the 5% level
* Significant at the 10% level
Years 2002-2010
Table 1: Sheriff Sales
*** Significant at the 1% level

International Research Journal of Applied Finance ISSN 2229 – 6891 Vol. IV Issue – 6 June, 2013
813
Conclusions
This paper looks at the impact purchase price (relative to assessed value) has on the probability of a sheriff’s sale. This relationship has been determined in the case of Muskego, Wisconsin. While there has been a growing amount of literature concerning foreclosures as a result of the most recent recession and the bursting of the housing property bubble, this research is limited in the area of “over-bidding” in the purchase price ideal of the housing market. This paper combines includes this idea in its analysis of the foreclosure market in Muskego, Wisconsin. By limiting the analysis to a single community, this paper has the advantage of confirming this negative factor while controlling for positive externalities. However, upon analysis, the relationship between positive externalities and foreclosure and sheriff’s sales was rare: only 4 properties of the 75 sheriff’s sales were located on a lake, abutted a golf course, or were adjacent to a working farm. While this limitation is noted, it leaves open a ripe area for future research. The unique property characteristics featured include traditional hedonic variables, such as the number of bedrooms, bathrooms and square feet.
Coefficient (B) Standard Error P-Value
SalesPrice (***) -0.00000546 .000 .001
totalrooms .037 .132 .778
bedrooms .091 .185 .624
bathrooms -.265 .213 .213
SqFeet .001 .001 .337
SqFeetSquared .000 .000 .690
AgeatSale (**) 0.00244 .001 .016
(I) 2002 (***) 1.531 .350 .000
(I) 2003 (***) 1.998 .407 .000
(I) 2004 (***) 1.862 .444 .000
(I) 2005 (***) 1.695 .323 .000
(I) 2006 (***) 2.767 .454 .000
(I) 2007 (***) 2.598 .496 .000
(I) 2008 (***) 2.334 .540 .000
(I) 2009 .811 .752 .280
(I) 2010 1.034 .665 .120
Constant (***) -5.0292 .712 .000
*** Significant at the 1% level
** Significant at the 5% level
* Significant at the 10% level
(I) Signifies any variable that acts as an interaction variable
Table 2: Foreclosures
Years 2002-2010

International Research Journal of Applied Finance ISSN 2229 – 6891 Vol. IV Issue – 6 June, 2013
814
This study found the interaction (Ĭ) 2002-2008 to be positive and significant for both foreclosure and sheriff sales and found (Ĭ) 2009 to be positive and significant for sheriff sale. Furthermore, it was found that sales price was significant and negatively correlated with foreclosures and sheriff sales. These results showed that buying over the market value of a property before the housing crash increased the probability of foreclosure and sheriff sale, but sheriff sales were more probable than foreclosures for overpayment.
References
Ambrose, B. and Capone, C. (1998). Modeling the Conditional Probability of Foreclosure in the Context of Single Family Mortgage Default Resolutions. Real Estate Economics, 26(3), 391-429. Baker, Malcolm and Wurgler, Jeffrey (2007). Investor Sentiment in the Stock Market. Journal
of Economic Perspectives, American Economic Association, 21(2), 129-152. Capozza, Dennis, Kazarian, Dick and Thomson, Thomas (1997). Mortgage Default in Local
Markets. Real Estate Economics, 25(4), 631-655. Capozza, Dennis and Seguin, Paul (1996). Expectations, Efficiency, and Euphoria in the
Housing Market. Regional Science and Urban Economics, Elsevier, 26(3-4), 369-386. Case, Karl and Shiller, Robert (1988). The Behavior of Home Buyers in Boom and Post-Boom
Markets. New England Economic Review, Federal Reserve Bank of Boston, issue Nov, 39-46.
Gerardi, Kristopher, Shapiro, Adam and Willen, Paul (2007). Subprime Outcomes: Risky Mortgages, Homeownership Experiences, and Foreclosures. FRB of Boston, Working Paper No. 07-15.
Jung, A.F. (1962). Terms on Conventional Mortgage Loans on Existing Houses. Journal of
Finance, 17(3), 432-443. Ong, Seow Eng, Neo, Poh Har and Spieler, Andrew C (2006). Price Premium and Foreclosure Risk. Real Estate Economics, Vol. 34(2), 211-242. Quercia, R.G and Stegman, M.A. (1992). Residential Mortgage Default: A Review of the Literature. Journal of Housing Research, 3(2), 341-379. Vandell, K.D (1995). How Ruthless is Mortgage Default? A Review and Synthesis of the Evidence. Journal of Housing Research, 6(2), 245-264. Von Furtstenberg, G (1969). Default Risk on FHA-Insured Home Mortgages as a Function of the Terms of Financing: A Quantitative Analysis. The Journal of Finance, 24(3), 459-477. Von Furtstenberg, G (1970a). Risk Structures and the Distribution of Benefits within the FHA Home Mortgage Insurance Program. The Journal of Money Credit and Banking, 2 (3), 303-322. Von Furtstenberg, G (1970b). Home Mortgage Delinquencies: A Cohort Analysis. The Journal
of Risk and Insurance, 37(3), 437-445. Von Furtstenberg, G (1974). Home Mortgage Delinquencies: A Cohort Analysis. The Journal
of Finance, 29(5), 1545-1548.

International Research Journal of Applied Finance ISSN 2229 – 6891 Vol. IV Issue – 6 June, 2013
815
An Economic Model for the Determination of the Efficiency of Outsourcing
Swapan Sen Winston Salem State University
601 S martin Luther King Jr. Drive Winston Salem, NC 27110
Niazur Rahim* Christopher Newport University
1 Avenue of the Arts, Newport News, VA 23606 [email protected]
.
*Contact Author

International Research Journal of Applied Finance ISSN 2229 – 6891 Vol. IV Issue – 6 June, 2013
816
Abstract
This paper examines the efficiency of outsourcing as a manufacturing arrangement. Assuming that outsourcing results in savings in both fixed and variable costs, the model presented in this study demonstrates that outsourcing is profitable only when outside contractor has lower variable costs than the outsourcing firm or the outsourcing firm’s fixed costs decline significantly as a result of outsourcing. Empirical data on the outsourcing of janitorial services by a leading airline supports the model’s predictions.
Key Words: outsourcing, outside contractor
I. Introduction
A major concern facing the corporations is to find ways of cutting costs in order to improve competitiveness. To address this issue, corporations may periodically revise strategies reduce the degree of backward integration in favor of purchasing goods and services from outside. When an original producer (OP) hires an outside contractor (OC) in exchange of a contractual payment (PMT) to supply or manufacture goods or services that could be produced in-house, the arrangement is called outsourcing. Since outsourcing arrangements are made with companies who are specialized and bulk producers, the OCs are expected to be able to produce and supply the goods at a lower cost than OPs (Giffi et al 1990, Hayes and Wheelwright, 1984). There may, however, be additional costs (CA) that OP incurs due to coordination, transportation and other reasons, which at times can be substantial [ Cross (1995), Lacity and Hirschheim (1995)]. Since contracting outside also means that OP will not need as many employees, outsourcing can reduce fixed costs in administrative head count and salaries. Thus, outsourcing can be convenient means of downsizing (Hskisson and Hitt, 1994). Sometimes it allows a firm to reduce an entire division to a few employees overseeing the outsourcing process or assembling jobs. Thus, outsourcing can be convenient means of downsizing (Hoskisson and Hitt, 1994). In addition, inventories can be substantially reduced and in high interest rate periods reduction of inventories can save interest costs substantially.
In spite of such advantages of outsourcing, corporations tend to differentiate between strategic and commodity based operations: if an operation is a core or strategic one, it may be kept in-house to retain control. If it is a commodity or service which a supplier can provide at a lower cost, it is likely to be outsourced (Lacity, Willcocks, and Feeny, 1995). This way OP will have to watch over fewer things, while OC keeps up with environmental changes in its area of specialization. Firms may outsource completely, partially, or not at all. The extent of outsourcing differs widely across firms in an industry and across industries. Partial outsourcing is not practical in certain situations (such as services) where outsourcing remains an all-or-nothing proposition.
The issue of outsourcing may not be readily understood by net present value (NPV) analysis, commonly applied in corporate finance. If OCs make profit (which they are observed to do) , then the projects have positive NPV. A firm should not pass up a positive NPV project. By

International Research Journal of Applied Finance ISSN 2229 – 6891 Vol. IV Issue – 6 June, 2013
817
cutting the cost of production to the level of OCs, OPs should be able to keep the profits to themselves. However, a project that is positive NPV for OC is not necessarily positive NPV for OP, because cutting OP’s costs to the level of OC may not be feasible for several reasons. First, OC is specialized in its core business and is perhaps more efficient than OP. Second, OC may have smaller overhead and labor costs than OP. Third, OC may be able to provide additional services which OP cannot provide except at higher costs. These explanations suggest that OC has to be intrinsically more efficient than OP for outsourcing to take place. In other words, for outsourcing to be rational, disintegration must generate positive synergy. If that indeed is the case, outsourcing is a win situation for both OP and OC and the society at large benefits from the replacement of high cost producers by low cost ones. To the extent over-diversification and excessive integration has occurred in the past, outsourcing has the potential for reducing inefficiencies (Buzzell, 1983). It can make both OP and OC more efficient as each concentrates on its core competencies.
The efficiency of outsourcing is, however, not automatic. Several difficulties arise; firms lose control over production processes, labor morale is compromised, quality of the product or service may suffer, and additional costs of transportation and management due to outsourcing may be substantial. There have been instances where outsourcing contracts have been terminated after a short period inducing heavy penalty for the original producer (See Cross, 1995 for IT outsourcing by BP). It is, therefore, useful to analyze conditions under which outsourcing is likely to succeed.
This paper utilizes the framework developed in Sen and Zhu (1996) to examine the efficiency of outsourcing. It determines conditions under which outsourcing is an efficient manufacturing arrangement. Our main conclusions are twofold: first, outsourcing is feasible (profitable) only when OC has lower variable costs than OP or OP’s fixed costs decline dramatically as a result of outsourcing. If such conditions are not met, outsourcing is not desirable at all. Second, an all or nothing outsourcing decision based on comparison of costs is efficient. Only in the event an intermediate degree of outsourcing is optimal, efficiency of outsourcing is uncertain. In such cases, additional conditions need to be satisfied, although such conditions do not appear to be very stringent. In developing the model, the following symbols are utilized:
V OP’s variable (material, capital and labor) cost per unit of output
γV OC’s variable cost per unit of output; (1γ>0)
CA OP’s additional costs due to outsourcing one unit of the product
P price of one unit of output
α portion of the production process outsourced expressed as a fraction of the product: 0 α 1.
F fixed cost per unit of output
n sensitivity of fixed cost; F, to outsourcing, n>0
PMT payment made by OP to OC for outsourcing one unit of output.

International Research Journal of Applied Finance ISSN 2229 – 6891 Vol. IV Issue – 6 June, 2013
818
Section II of this paper develops the conditions for efficient outsourcing and section III analyzes outsourcing decisions by a major airline to verify the implications of the model.
II. The Model
1. OP’S profit from own production (before outsourcing) is given by its revenue minus cost. Cost included both variable and fixed costs.
Π = P - V - F (1)
2. OP’S profits, with α portion outsourced, are given by:
Πop = P - (1 - α)n F - (1 - α)V - α(PMT + CA) which can be rewritten as
Πop = -(1 - α)n F + (P - V) + [V - (PMT + CA)]α (2)
(1 - α )n F represents OPs fixed costs when α portion is outsourced. A comparison with fixed costs without outsourcing in Equation 1 shows that outsourcing reduces fixed costs irrespective of the value n assumes. When n=1, fixed costs decline at a constant rate as α increases. When n>1 (n<1) fixed costs decline at a decreasing (increasing) rate. Thus, n represents the intensity of fixed costs’ response to outsourcing. To give an example, if 1% is outsourced, fixed costs reduce by 1% when n=1, by more (less) than 1% when n>1 (n<1). Thus fixed costs decline as a result of outsourcing by any amount. Variable costs are assumed not sensitive to outsourcing. 1 γ>0 implies that OC is not necessarily more efficient than OP. All costs are per unit or average costs. The product price is a constant.
3. With α portion outsourced, OC’s profits are given by
Πoc = α [PMT - (F + γV)] (3)
Because PMT is determined by selecting from competitive bids submitted by vendors, if OC does not overbid, it is expected to make a profit and such profits are proportional to the degree of outsourcing. It is possible that in its eagerness to win a bid, OC will understate its cost. We assume no such instance of winners curse (Thaler, 1992). Although fixed costs are assumed to be the same for both OP and OC, it is not a required assumption.
4. The combined profit of OP and OC is obtained by adding (2) and (3):
Πop + oc = -(1-α)n F
+ [(P-V) + (V - CA - PMT)α] + [PMT - F - γV]α (4)
Notice that in the absence of outsourcing, α=0, and (4) reduces to (1), when n=1.
5. PMT determines how gains from outsourcing is distributed between OP and OC. Typically, PMT is determined by inviting competitive bids from vendors. It is expected that OC will not bid below its cost and OP will not accept a bid above its own cost of production. Πoc0 yields PMTF + γV. For a given α=α0, the range of PMT depends on whether V (PMT + CA) or
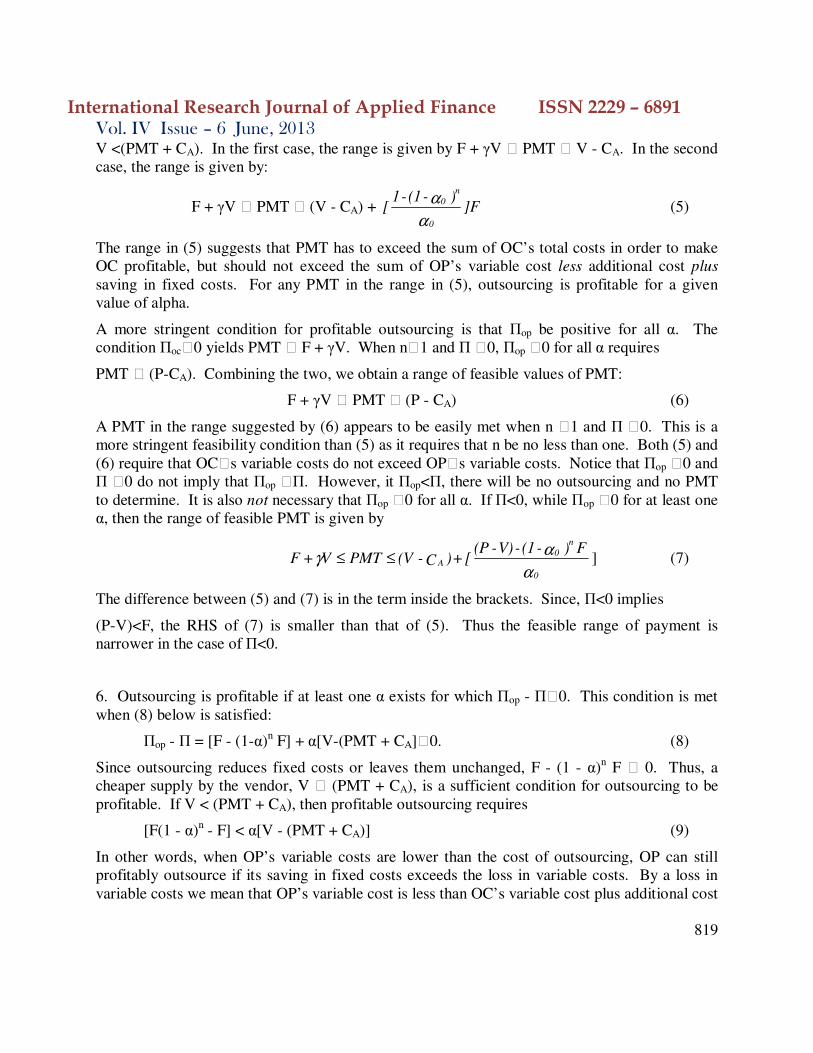
International Research Journal of Applied Finance ISSN 2229 – 6891 Vol. IV Issue – 6 June, 2013
819
V <(PMT + CA). In the first case, the range is given by F + γV PMT V - CA. In the second case, the range is given by:
F + γV PMT (V - CA) + ]F)-(1-1
[0
n
0
α
α (5)
The range in (5) suggests that PMT has to exceed the sum of OC’s total costs in order to make OC profitable, but should not exceed the sum of OP’s variable cost less additional cost plus saving in fixed costs. For any PMT in the range in (5), outsourcing is profitable for a given value of alpha.
A more stringent condition for profitable outsourcing is that Πop be positive for all α. The condition Πoc0 yields PMT F + γV. When n1 and Π 0, Πop 0 for all α requires
PMT (P-CA). Combining the two, we obtain a range of feasible values of PMT:
F + γV PMT (P - CA) (6)
A PMT in the range suggested by (6) appears to be easily met when n 1 and Π 0. This is a more stringent feasibility condition than (5) as it requires that n be no less than one. Both (5) and (6) require that OCs variable costs do not exceed OPs variable costs. Notice that Πop 0 and Π 0 do not imply that Πop Π. However, it Πop<Π, there will be no outsourcing and no PMT to determine. It is also not necessary that Πop 0 for all α. If Π<0, while Πop 0 for at least one α, then the range of feasible PMT is given by
α
αγ
0
n
0A
F)-(1-V)-(P[+)C-(VPMTV+F ≤≤ ] (7)
The difference between (5) and (7) is in the term inside the brackets. Since, Π<0 implies
(P-V)<F, the RHS of (7) is smaller than that of (5). Thus the feasible range of payment is narrower in the case of Π<0.
6. Outsourcing is profitable if at least one α exists for which Πop - Π0. This condition is met when (8) below is satisfied:
Πop - Π = [F - (1-α)n F] + α[V-(PMT + CA]0. (8)
Since outsourcing reduces fixed costs or leaves them unchanged, F - (1 - α)n F 0. Thus, a cheaper supply by the vendor, V (PMT + CA), is a sufficient condition for outsourcing to be profitable. If V < (PMT + CA), then profitable outsourcing requires
[F(1 - α)n - F] < α[V - (PMT + CA)] (9)
In other words, when OP’s variable costs are lower than the cost of outsourcing, OP can still profitably outsource if its saving in fixed costs exceeds the loss in variable costs. By a loss in variable costs we mean that OP’s variable cost is less than OC’s variable cost plus additional cost
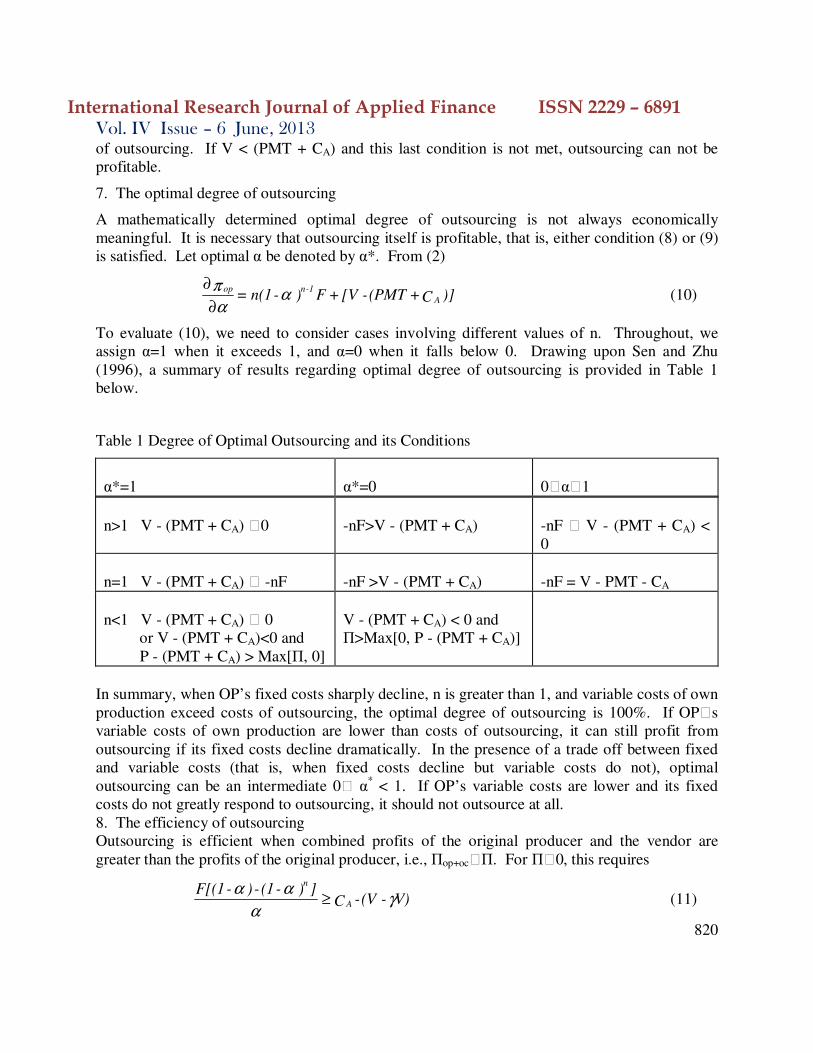
International Research Journal of Applied Finance ISSN 2229 – 6891 Vol. IV Issue – 6 June, 2013
820
of outsourcing. If V < (PMT + CA) and this last condition is not met, outsourcing can not be profitable.
7. The optimal degree of outsourcing
A mathematically determined optimal degree of outsourcing is not always economically meaningful. It is necessary that outsourcing itself is profitable, that is, either condition (8) or (9) is satisfied. Let optimal α be denoted by α*. From (2)
)]C+(PMT-[V+F)-n(1= A
1-nop αα
π
∂
∂ (10)
To evaluate (10), we need to consider cases involving different values of n. Throughout, we assign α=1 when it exceeds 1, and α=0 when it falls below 0. Drawing upon Sen and Zhu (1996), a summary of results regarding optimal degree of outsourcing is provided in Table 1 below.
Table 1 Degree of Optimal Outsourcing and its Conditions
α*=1
α*=0
0α1
n>1 V - (PMT + CA) 0
-nF>V - (PMT + CA)
-nF V - (PMT + CA) < 0
n=1 V - (PMT + CA) -nF
-nF >V - (PMT + CA)
-nF = V - PMT - CA
n<1 V - (PMT + CA) 0 or V - (PMT + CA)<0 and P - (PMT + CA) > Max[Π, 0]
V - (PMT + CA) < 0 and Π>Max[0, P - (PMT + CA)]
In summary, when OP’s fixed costs sharply decline, n is greater than 1, and variable costs of own production exceed costs of outsourcing, the optimal degree of outsourcing is 100%. If OPs variable costs of own production are lower than costs of outsourcing, it can still profit from outsourcing if its fixed costs decline dramatically. In the presence of a trade off between fixed and variable costs (that is, when fixed costs decline but variable costs do not), optimal outsourcing can be an intermediate 0 α* < 1. If OP’s variable costs are lower and its fixed costs do not greatly respond to outsourcing, it should not outsource at all. 8. The efficiency of outsourcing Outsourcing is efficient when combined profits of the original producer and the vendor are greater than the profits of the original producer, i.e., Πop+ocΠ. For Π0, this requires
V)-(V-C])-(1-)-F[(1
A
n
γα
αα≥ (11)
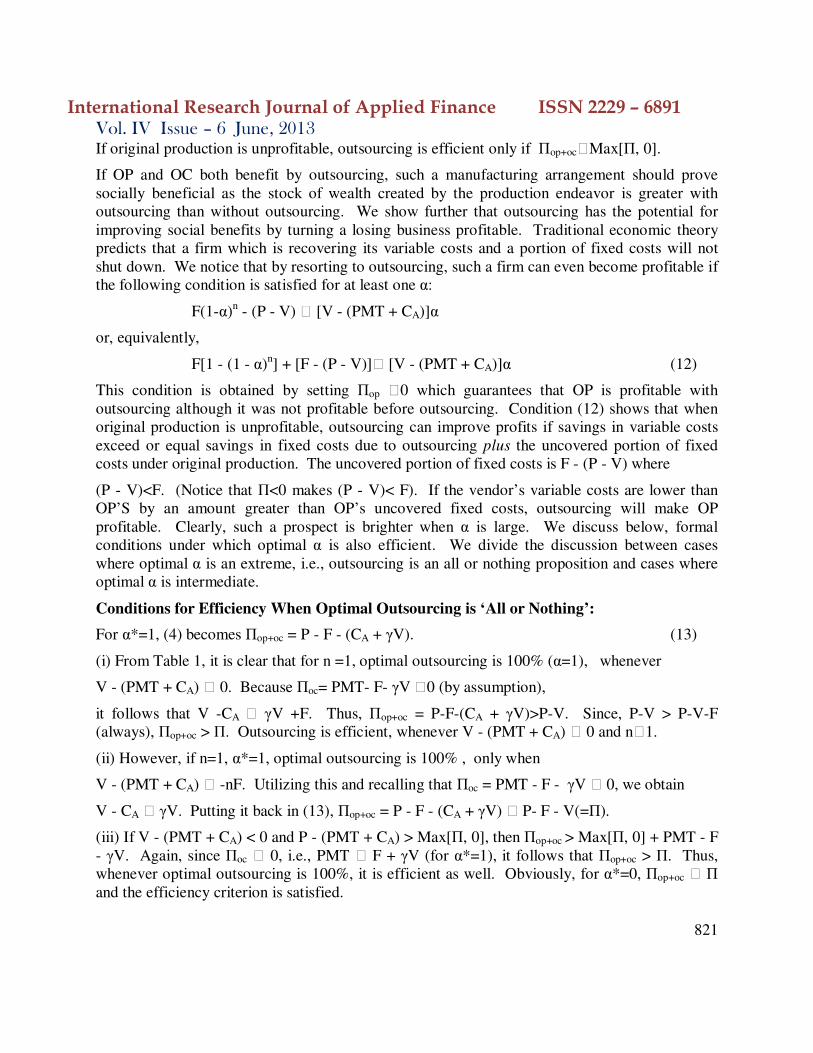
International Research Journal of Applied Finance ISSN 2229 – 6891 Vol. IV Issue – 6 June, 2013
821
If original production is unprofitable, outsourcing is efficient only if Πop+ocMax[Π, 0].
If OP and OC both benefit by outsourcing, such a manufacturing arrangement should prove socially beneficial as the stock of wealth created by the production endeavor is greater with outsourcing than without outsourcing. We show further that outsourcing has the potential for improving social benefits by turning a losing business profitable. Traditional economic theory predicts that a firm which is recovering its variable costs and a portion of fixed costs will not shut down. We notice that by resorting to outsourcing, such a firm can even become profitable if the following condition is satisfied for at least one α:
F(1-α)n - (P - V) [V - (PMT + CA)]α
or, equivalently,
F[1 - (1 - α)n] + [F - (P - V)] [V - (PMT + CA)]α (12)
This condition is obtained by setting Πop 0 which guarantees that OP is profitable with outsourcing although it was not profitable before outsourcing. Condition (12) shows that when original production is unprofitable, outsourcing can improve profits if savings in variable costs exceed or equal savings in fixed costs due to outsourcing plus the uncovered portion of fixed costs under original production. The uncovered portion of fixed costs is F - (P - V) where
(P - V)<F. (Notice that Π<0 makes (P - V)< F). If the vendor’s variable costs are lower than OP’S by an amount greater than OP’s uncovered fixed costs, outsourcing will make OP profitable. Clearly, such a prospect is brighter when α is large. We discuss below, formal conditions under which optimal α is also efficient. We divide the discussion between cases where optimal α is an extreme, i.e., outsourcing is an all or nothing proposition and cases where optimal α is intermediate.
Conditions for Efficiency When Optimal Outsourcing is ‘All or Nothing’:
For α*=1, (4) becomes Πop+oc = P - F - (CA + γV). (13)
(i) From Table 1, it is clear that for n =1, optimal outsourcing is 100% (α=1), whenever
V - (PMT + CA) 0. Because Πoc= PMT- F- γV 0 (by assumption),
it follows that V -CA γV +F. Thus, Πop+oc = P-F-(CA + γV)>P-V. Since, P-V > P-V-F (always), Πop+oc > Π. Outsourcing is efficient, whenever V - (PMT + CA) 0 and n1.
(ii) However, if n=1, α*=1, optimal outsourcing is 100% , only when
V - (PMT + CA) -nF. Utilizing this and recalling that Πoc = PMT - F - γV 0, we obtain
V - CA γV. Putting it back in (13), Πop+oc = P - F - (CA + γV) P- F - V(=Π).
(iii) If V - (PMT + CA) < 0 and P - (PMT + CA) > Max[Π, 0], then Πop+oc > Max[Π, 0] + PMT - F - γV. Again, since Πoc 0, i.e., PMT F + γV (for α*=1), it follows that Πop+oc > Π. Thus, whenever optimal outsourcing is 100%, it is efficient as well. Obviously, for α*=0, Πop+oc Π and the efficiency criterion is satisfied.

International Research Journal of Applied Finance ISSN 2229 – 6891 Vol. IV Issue – 6 June, 2013
822
Conditions of Efficiency When Optimal Outsourcing is Intermediate
From (12), if V - (PMT + CA) < 0, the First-Order-Condition yields
α* = 1 - _nF
V-)C+(PMT1-n
1A (14)
The RHS implies 0 α* <1 when -nF V - (PMT + CA) < 0. Plugging α* from (14) into (4), we get
Πop+oc = P - F - (CA + γV)α* + F[1 - (1 - α*)n-1](1 - α*) (15)
The sufficient condition for efficiency, Πop+oc Π, is
α*CA (1 - α*)V + (1 - α*)nF (16)
which makes (CA + V)α* + F[1 - (1 - α*)n-1](1 - α*) V
and, therefore, (CA + γV)α* + F[1 - (1 - α*)n-1](1 - α*) V (since, γ<1).
This, in turn, makes
Πop+oc = P - F - (CA + γV)α* + F[1 - (1 - α*)n-1](1 - α*) P - F - V(= Π)
Thus when intermediate outsourcing is optimal, the sufficient condition for efficiency in (16) requires that OP’s additional cost of outsourcing does not exceed its production costs. Although, efficiency of outsourcing in the intermediate case requires an additional condition, the condition appears not very restrictive. Assuming that such a condition is easily met, it is likely that intermediate outsourcing is efficient as well. Recall that outsourcing is optimal whenever OC’s variable costs are lower than OP’s. When OCs variable costs are not lower than OP’s, outsourcing is optimal only if OP’s fixed costs decline by an amount greater than the differential in variable costs of OP and OC.
III. Efficiency of Outsourcing - A Case Study
In this section, data from a major airline’s outsourcing of janitorial services in various airports are analyzed to test the efficiency of outsourcing implied in the above model. The airline serves several airports for which bids were invited through national advertising. Responses were received from both national and regional vendors and in some cases from workers organizations of the airline itself. The bidding was competitive and independently considered for each airport. Information provided by the bidders included the headcount and the rate of labor cost, supplies and equipment costs, overhead expenditure, profit rates and taxes. On receiving the bids, the airlines estimated expected savings and decided whether to outsource or not, and if it decided to outsource, a winning vendor was chosen. From this information, the methodology utilized by the airlines to make such decisions becomes transparent.
It appears that expected savings from outsourcing in each case were substantial and the primary source of savings was labor costs. Savings on labor costs arise due to reduction in the headcount as well as saving in labor rates. Table 2 below summarizes expected savings in labor costs from four airports.

International Research Journal of Applied Finance ISSN 2229 – 6891 Vol. IV Issue – 6 June, 2013
823
Table 2 Labor Saving From Outsourcing
HEADCOUNT
LABOR RATE
TOTAL SAVING
Saving over winning bid
Saving over average bid
Saving over winning bid
Saving over average bid
Saving over winning bid
Airport 1 Airport 2 Airport 3 Airport 4
14.5% 23.4 -.4 11.4
17.5% 17.2 -7.0 4.38
31.03% 28.4 42.7 42.2
39.4% 14.9 35.1 27.4
45.5% 40.6 42.3 53.6
It is clear that expected savings in labor costs were overwhelming. The airline’s own estimate of total savings from outsourcing was more moderate, implying that some of the savings in labor costs was offset by the airline’s non-labor costs. Interestingly, however, additional costs due to outsourcing, CA, were ignored completely, implying that the airline did not expect to spend resources on review and monitoring the vendor’s works. In addition, since cost savings were substantial and a markup was explicitly included in the bid, no winner’s curse phenomenon (Thaler, 1992) was suspected.
Decisions were made to outsource completely in each case, and contracts were offered, most often, but not always, to the lowest bidder. Judgement calls were made whenever bids were poorly specified (parts of the services were excluded) or quality of service was suspect.
Dividing the data on fixed and variable costs for the airlines (OP) and the bidding vendor (OC), we calculated the optimal degree of outsourcing in each airport for each pair of OP and OC. Because Π>0, and assuming n>1, and knowing that a 100% outsourcing decision was made in each case, we tested if α * turned out to be 1 for the winning bidders and 0 for the losing bidders. Notice that it is not expected that α*=0 for all non-winning bids. It is likely that many bidders will satisfy conditions for profitable outsourcing and only the best among them will be chosen. Recall that if V - (PMT + CA) 0, optimal α=1 for most n. We therefore, examined if this condition was satisfied by the winning bids.
Understanding that airport janitorial services are labor intensive (nearly three-fourths of all costs are labor costs), empirical estimates of γ were expected to be considerably below unity. Table 3 below shows values of γ implied by the bidders in different airports on the basis of labor costs alone. In 6 of 28 cases, were labor costs of vendors greater than 80% of the airline’s labor costs.

International Research Journal of Applied Finance ISSN 2229 – 6891 Vol. IV Issue – 6 June, 2013
824
Of these 6, the vendor’s variable costs exceeded the airline’s in 3 cases. In all 6 cases, in line with the prediction of the model, no outsourcing contract was reached between the airline and the vendors.
In column 6, we check if the condition V - (PMT + CA) 0 is satisfied by the vendor by placing a y for yes and an n for no. In column 7, actual outsourcing decision is indicated by 1 (if an outsourcing contract was offered to this vendor) or 0 (no outsourcing contract offered to this vendor).
Table 3: Efficiency Condition and Outsourcing Decision
γ
V - (PMT + CA) 0?
α*
airport
1
2
3
4
1
2
3
4
1
2
3
4
vendor 1 vendor 2 vendor 3 vendor 4 vendor 5 vendor 6 vendor 7 vendor 8 vendor 9 vendor 10
.58 1.16 .70 .50 .82 .62 1.02 1.01 .75 .84
.74 .98 .59 .48 .40 .75 .52 .51 .38
.63 .52 .39 .66 .66
.52 .62 .58 .40
y n y y n y n n y n
y n y y y y y y
y y y y y y
y y y y
1 0 0 0 0 0
1 0 0 0 0 0
0 1
1 0
Note: Airports are marked 1, 2, 3 and 4. If the condition V - (PMT + CA) 0 is satisfied by the vendor, a y to mean ‘yes’ is placed in the column. If it is not satisfied, an n is placed to mean a’no’. The last column shows the actual decision. If the vendor won the bid, the column shows a 1, 0 if it did not. Blanks indicate that no bid was made for the particular airport by the particular vendor.
It is found that α* had the right solution for seven of eight cases shown in the first two rows. Thus for vendors 1 and 2, actual decisions made by the airline are in conformity with the prediction of the model. Given the cost conditions offered by vendor 1, a 100% outsourcing is predicted for airports 1, 2 and 4. No outsourcing with vendor 1 is predicted for airport 3. Similarly, vendor 2 meets the conditions of 100% outsourcing for airports 3 and 4 and fails to meet the conditions for airports 1 and 2. In airport 4, vendor 1 had a superior bid. Airports 1, 2 and 4 were contracted out to vendor 1 and airport 3 was contracted out to vendor 2. The airline’s decisions are in line with the model’s predictions. The airline’s method of selection of bids was to choose the vendor which has the lowest costs. Preferences appear to have been given to national vendors over regional ones. Several
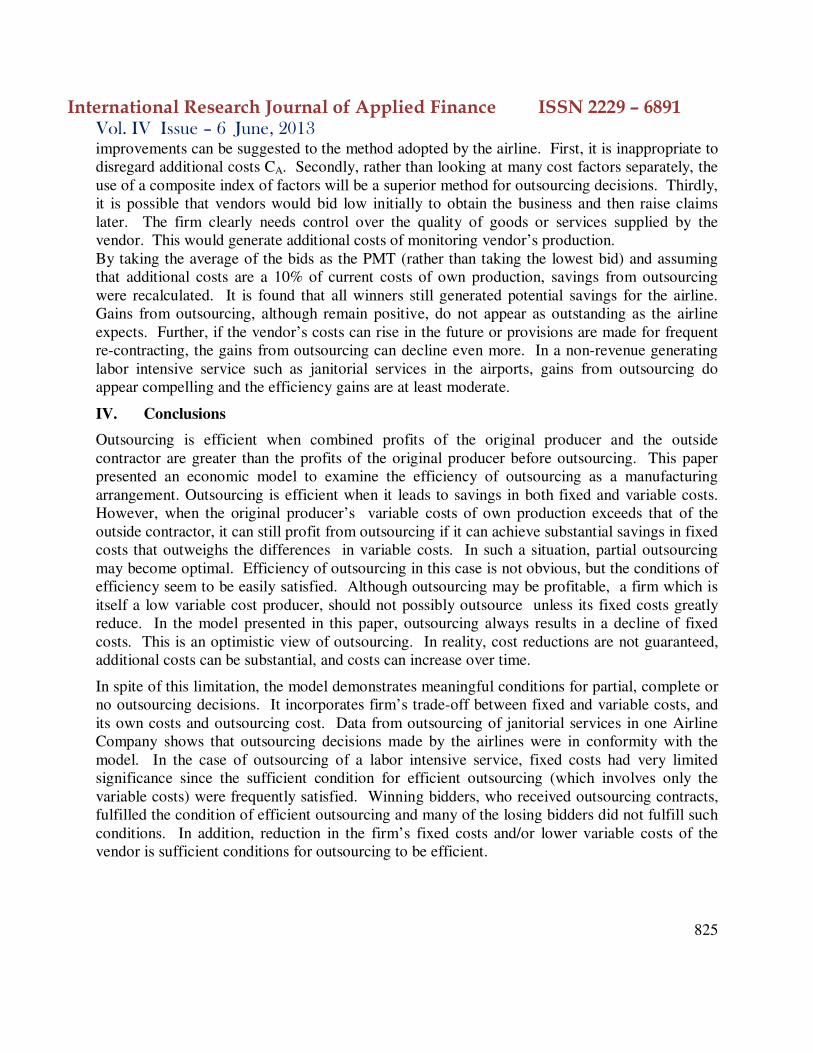
International Research Journal of Applied Finance ISSN 2229 – 6891 Vol. IV Issue – 6 June, 2013
825
improvements can be suggested to the method adopted by the airline. First, it is inappropriate to disregard additional costs CA. Secondly, rather than looking at many cost factors separately, the use of a composite index of factors will be a superior method for outsourcing decisions. Thirdly, it is possible that vendors would bid low initially to obtain the business and then raise claims later. The firm clearly needs control over the quality of goods or services supplied by the vendor. This would generate additional costs of monitoring vendor’s production. By taking the average of the bids as the PMT (rather than taking the lowest bid) and assuming that additional costs are a 10% of current costs of own production, savings from outsourcing were recalculated. It is found that all winners still generated potential savings for the airline. Gains from outsourcing, although remain positive, do not appear as outstanding as the airline expects. Further, if the vendor’s costs can rise in the future or provisions are made for frequent re-contracting, the gains from outsourcing can decline even more. In a non-revenue generating labor intensive service such as janitorial services in the airports, gains from outsourcing do appear compelling and the efficiency gains are at least moderate.
IV. Conclusions
Outsourcing is efficient when combined profits of the original producer and the outside contractor are greater than the profits of the original producer before outsourcing. This paper presented an economic model to examine the efficiency of outsourcing as a manufacturing arrangement. Outsourcing is efficient when it leads to savings in both fixed and variable costs. However, when the original producer’s variable costs of own production exceeds that of the outside contractor, it can still profit from outsourcing if it can achieve substantial savings in fixed costs that outweighs the differences in variable costs. In such a situation, partial outsourcing may become optimal. Efficiency of outsourcing in this case is not obvious, but the conditions of efficiency seem to be easily satisfied. Although outsourcing may be profitable, a firm which is itself a low variable cost producer, should not possibly outsource unless its fixed costs greatly reduce. In the model presented in this paper, outsourcing always results in a decline of fixed costs. This is an optimistic view of outsourcing. In reality, cost reductions are not guaranteed, additional costs can be substantial, and costs can increase over time.
In spite of this limitation, the model demonstrates meaningful conditions for partial, complete or no outsourcing decisions. It incorporates firm’s trade-off between fixed and variable costs, and its own costs and outsourcing cost. Data from outsourcing of janitorial services in one Airline Company shows that outsourcing decisions made by the airlines were in conformity with the model. In the case of outsourcing of a labor intensive service, fixed costs had very limited significance since the sufficient condition for efficient outsourcing (which involves only the variable costs) were frequently satisfied. Winning bidders, who received outsourcing contracts, fulfilled the condition of efficient outsourcing and many of the losing bidders did not fulfill such conditions. In addition, reduction in the firm’s fixed costs and/or lower variable costs of the vendor is sufficient conditions for outsourcing to be efficient.

International Research Journal of Applied Finance ISSN 2229 – 6891 Vol. IV Issue – 6 June, 2013
826
References Buzzell, Robert D. (Jan-Feb 1983). Is Vertical Integration Profitable? Harvard Business Review,
92-102. Cross, John. (May-June 1995). IT Outsourcing: British Petroleum’s Competitive Approach.
Harvard Business Review, 94-102. Giffi, C., A. Roth, and G. Seal. (1990). Competing in World Class Manufacturing, Business
One, Irwin, Homewood, IL. Hayes, Robert H., and Steven C. Wheelwright. (1984). Restoring our Competitive Edge, John
Wiley & Sons, New York. Hoskisson, R.E., and M.A. Hitt. (1995). Downscoping, Oxford University Press, New York,
NY. Lacity, Mary C., Leslie Willcocks, and David Feeny. (May-June 1995). IT Outsourcing:
Maximize Flexibility and Control. Harvard Business Review, 84-93. Lacity, Mary C., and Rudy Hirschheim. (1995). Beyond the Information Systems Outsourcing Bandwagon. John Wiley & Sons, New York. Sen, Swapan and Giangxhi Zhu. (Fall, 1996) The Optimal Degree of Outsourcing. Journal of
Financial and Strategic Decisions, 9(3), 63-70. Thaler, Richard. (1992). The Winner’s Curse - Paradoxes and Anomalies of Economic Life,
Princeton University Press. Princeton, NJ.
International Research Journal of Applied Finance ISSN 2229 – 6891 Vol. IV Issue – 6 June, 2013
827
Cost of Equity Adjustment for Wholly Owned Subsidiaries
H. Christine Hsu, PhD Professor of Finance College of Business
California State University, Chico [email protected]

International Research Journal of Applied Finance ISSN 2229 – 6891 Vol. IV Issue – 6 June, 2013
828
Abstract
As a parent company holds the subsidiary's equity as assets, its debt capacity is enhanced and more debt financing is feasible. Valuable interest tax shields are available to the parent company when the parent is profitable and paying taxes. If the wholly owned subsidiary is treated as an independent firm, the value of the parent’s interest tax shields is ignored and new investments with net incremental value to the parent will be rejected. Moreover, to prevent cross subsidies among the wholly owned subsidiaries, the subsidiary’s risk should be recognized in the subsidiary’s equity hurdle rate. This paper reinforces the point that the wholly owned subsidiary’s cost of equity should be adjusted to account for both the value of the parent’s interest tax shields and the subsidiary’s risk so as to maximize the value of the parent company in capital budgeting.
When 100% of an operating firm’s equity is owned by a parent company as assets, the firm is known as a wholly owned subsidiary. Wholly owned subsidiaries are widespread in the business world, especially in public utility, airline and banking industries. One common approach adopted in determining the costs of equity of public utility wholly owned subsidiaries is the double leverage approach. In this method, the parent’s weighted average cost of capital is employed as the cost of equity for its wholly owned subsidiaries. When all subsidiaries’ equity investments are evaluated using the same hurdle rate, the parent tends to over (under) allocate its resources to the higher (lower) risk subsidiaries. This approach is inconsistent with the goal of value maximization in capital budgeting. It is well documented that this traditional double leverage approach ignores subsidiary risk and results in misallocation of resources among the subsidiaries. See for example, Rozeff (1983), Beedles (1984), Sweeney (1985), Ezzell, Hsu and Miles (1991), O'Donnell and Walker (1989, 1993), and Hsu (2000), etc. Another popular approach used to define a wholly owned subsidiary’s cost of equity is the independent firm approach, supported by Pettway and Jordan (1983), and Beranek and Miles (1988), among others. Under the independent firm approach, the subsidiary is treated as an independent firm and the subsidiary’s required rate of return on equity is set to equal its standalone cost of equity. Ezzell, Hsu and Miles (1991) point out that the wholly owned subsidiary’s common stocks, held as the parent company’s assets, enhance the parent’s debt capacity and create valuable interest tax shields for the parent (i.e., the subsidiary’s shareholder). If the valuable interest tax shields are ignored, profitable investments may be rejected and the shareholder’s wealth will not be maximized. The objective of this paper is to reinforce the point that the wholly owned subsidiary’s cost of equity should be adjusted to account for the present value of interest tax shields via several simple numerical examples. These examples will be investigated using the adjusted net present value valuation framework established in Myers (1974) and the risk-adjusted cost of equity specified in Hsu (2000).
I. Analysis with numerical examples
For illustration and comparison purposes, the example with debt in the subsidiaries and no debt in the parent presented in Pettway and Jordan (1983) is employed as a starting point. The simplified book value balance sheets of the parent and the three wholly owned subsidiaries (Subsidiary 1, Subsidiary 2, and Subsidiary 3) are given below:

International Research Journal of Applied Finance ISSN 2229 – 6891 Vol. IV Issue – 6 June, 2013
829
where Ep is the parent’s equity, Ej is Subsidiary j’s equity (j = 1, 2, 3), Dj is Subsidiary j’s debt, and Aj are the Subsidiary j’s total assets (j = 1, 2, 3). Pettway & Jordan (1983) assume the following standalone cost of equity for the wholly owned Subsidiary j, kej, j = 1, 2, 3.
Standalone cost of equity for Subsidiary 1 = ke1 = 16.73% Standalone cost of equity for Subsidiary 2 = ke2 = 17.4% Standalone cost of equity for Subsidiary 3 = ke3 = 17.43% The subsidiary’s standalone cost of equity is affected by each subsidiary’s business risk and financial leverage. In other words, Subsidiary 1 has the lowest risk and Subsidiary 3 has the highest risk among the three wholly owned subsidiaries in this example. The parent’s weighted average cost of capital, WACCp, i.e., its required rate of return on assets, is the weighted average of the subsidiaries’ costs of equity capital.
WACCp = (55/200) (16.73%) + (50/200) (17.4%) + (95/200) (17.43%) = 17.225%
This is also the parent’s unlevered cost of capital, kup.
It is now assumed that the parent’s debt to total assets ratio is 10% (= 20/200), and the book value balance sheets for the parent and the subsidiaries are:
Parent Balance Sheet
(Book values)
E1 55 200 Ep
E2 50
E3 95
Total 200 200 Total Subsidiary 1 Balance Sheet Subsidiary 2 Balance Sheet Subsidiary 3 Balance Sheet
(Book values) (Book values) (Book values)
A1 100 45 D1 A2 100 50 D2 A3 120 25 D3
55 E1 50 E2 95 E3
Total 100 100 Total Total 100 100 Total Total 120 120 Total
Parent Balance Sheet
(Book values)
E1 55 20 Dp
E2 50 180 Ep
E3 95
Total 200 200 Total Subsidiary 1 Balance Sheet Subsidiary 2 Balance Sheet Subsidiary 3 Balance Sheet
(Book values) (Book values) (Book values)
A1 100 45 D1 A2 100 50 D2 A3 120 25 D3
55 E1 50 E2 95 E3
Total 100 100 Total Total 100 100 Total Total 120 120 Total
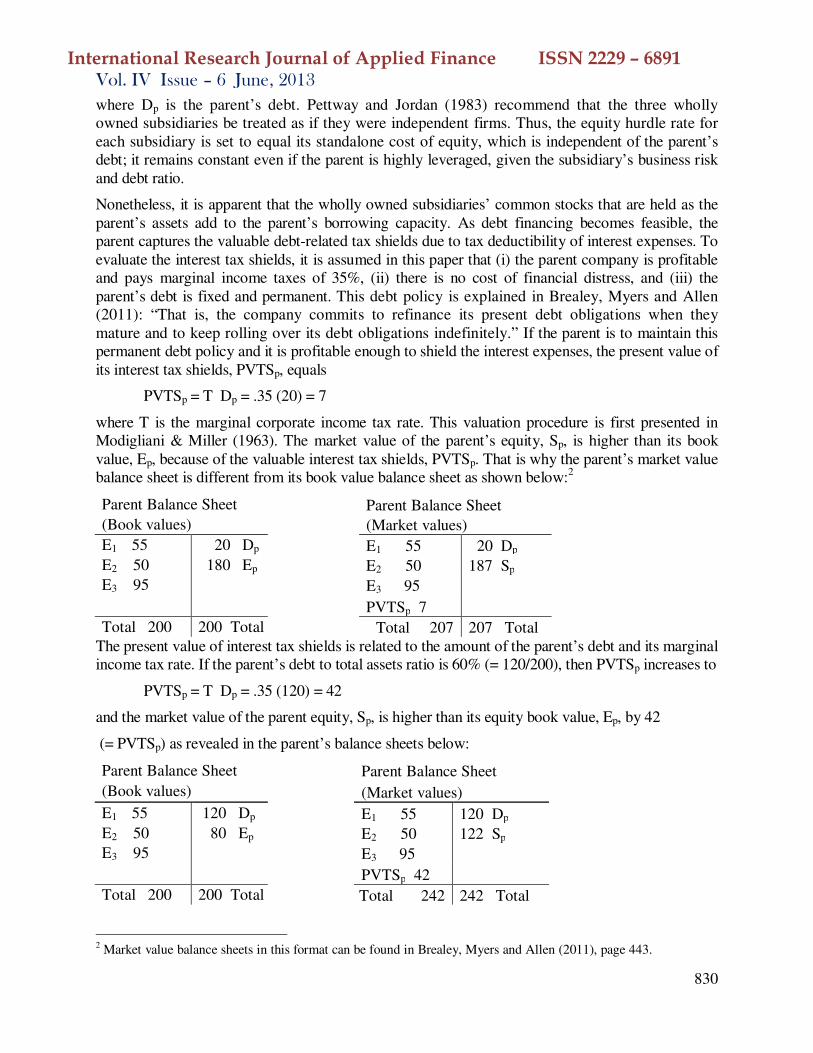
International Research Journal of Applied Finance ISSN 2229 – 6891 Vol. IV Issue – 6 June, 2013
830
where Dp is the parent’s debt. Pettway and Jordan (1983) recommend that the three wholly owned subsidiaries be treated as if they were independent firms. Thus, the equity hurdle rate for each subsidiary is set to equal its standalone cost of equity, which is independent of the parent’s debt; it remains constant even if the parent is highly leveraged, given the subsidiary’s business risk and debt ratio.
Nonetheless, it is apparent that the wholly owned subsidiaries’ common stocks that are held as the parent’s assets add to the parent’s borrowing capacity. As debt financing becomes feasible, the parent captures the valuable debt-related tax shields due to tax deductibility of interest expenses. To evaluate the interest tax shields, it is assumed in this paper that (i) the parent company is profitable and pays marginal income taxes of 35%, (ii) there is no cost of financial distress, and (iii) the parent’s debt is fixed and permanent. This debt policy is explained in Brealey, Myers and Allen (2011): “That is, the company commits to refinance its present debt obligations when they mature and to keep rolling over its debt obligations indefinitely.” If the parent is to maintain this permanent debt policy and it is profitable enough to shield the interest expenses, the present value of its interest tax shields, PVTSp, equals
PVTSp = T Dp = .35 (20) = 7
where T is the marginal corporate income tax rate. This valuation procedure is first presented in Modigliani & Miller (1963). The market value of the parent’s equity, Sp, is higher than its book value, Ep, because of the valuable interest tax shields, PVTSp. That is why the parent’s market value balance sheet is different from its book value balance sheet as shown below:2
Parent Balance Sheet Parent Balance Sheet
(Book values) (Market values)
E1 55 20 Dp E1 55 20 Dp
E2 50 180 Ep E2 50 187 Sp
E3 95
E3 95
PVTSp 7
Total 200 200 Total Total 207 207 Total The present value of interest tax shields is related to the amount of the parent’s debt and its marginal income tax rate. If the parent’s debt to total assets ratio is 60% (= 120/200), then PVTSp increases to
PVTSp = T Dp = .35 (120) = 42
and the market value of the parent equity, Sp, is higher than its equity book value, Ep, by 42
(= PVTSp) as revealed in the parent’s balance sheets below:
Parent Balance Sheet Parent Balance Sheet
(Book values) (Market values)
E1 55 120 Dp E1 55 120 Dp
E2 50 80 Ep E2 50 122 Sp
E3 95
E3 95
PVTSp 42
Total 200 200 Total Total 242 242 Total
2 Market value balance sheets in this format can be found in Brealey, Myers and Allen (2011), page 443.

International Research Journal of Applied Finance ISSN 2229 – 6891 Vol. IV Issue – 6 June, 2013
831
To maintain the parent’s value, a risk-adjusted cost of equity for a wholly owned Subsidiary j, RAej, is derived to account for the present value of the interest tax shields in Hsu (2000) as
RAej = kej (1 – T Lp)
where Lp is the parent’s debt to total assets ratio. This risk-adjusted cost of equity is different from the standalone cost of equity adopted under the independent firm approach as it is adjusted downward to account for the parent’s interest tax shields, T Lp. This risk-adjusted double leverage approach is also different from the traditional double leverage approach; it accounts for the subsidiary’s risk as reflected in the standalone cost of equity, kej.
Assuming a 10% parent’s debt to total assets ratio in Table I Panel A, the risk-adjusted cost of equity for each subsidiary is determined as
RAe1 = 16.73% (1- .35 (10%)) = 16.1445%
RAe2 = 17.4% (1- .35 (10%)) = 16.7910%
RAe3 = 17.43% (1- .35 (10%)) = 16.8200%
If the subsidiary’s expected rate of return on equity equals its risk-adjusted cost of equity, then the expected equity cash flows from the subsidiary’s equity investment are
Subsidiary 1’s expected equity cash flows = 16.1445% (55) = 8.8795
Subsidiary 2’s expected equity cash flows = 16.7910% (50) = 8.3955
Subsidiary 3’s expected equity cash flows = 16.8200% (95) = 15.9790
The present value of the subsidiary’s perpetual equity cash flows can be computed using its standalone cost of equity as the discount rate. That is
PV of Subsidiary 1’s expected equity cash flows = 8.8795 / 0.1673 = 53.0752
PV of Subsidiary 2’s expected equity cash flows = 8.3955 / 0.1740 = 48.2500
PV of Subsidiary 3’s expected equity cash flows = 15.9790 / 0.1743 = 91.6753
The net present value of the subsidiary’s equity investment, NPV, is the present value of its expected equity cash flows net of its equity investment outlay;
NPV of Subsidiary 1’s equity investment = 53.0752 - 55 = -1.925
NPV of Subsidiary 2’s equity investment = 48.2500 - 50 = -1.750
NPV of Subsidiary 3’s equity investment = 91.6753 - 95 = -3.325
Total NPV of Subsidiaries’ equity investments = -7.000
Note that the total NPV of the three investments adjusted for the present value of the parent’s interest tax shields (PVTSp = 7) equals zero. In other words, the shareholder’s wealth is maintained if the three investments are undertaken when each subsidiary’s expected return on equity equals its risk-adjusted cost of equity. Specifically, each subsidiary’s contribution to PVTSp is determined under the risk-adjusted double leverage approach as follows:
Subsidiary 1’s contribution = (55/200) (7) = .275 (7) = 1.925
Subsidiary 2’s contribution = (50/200) (7) = .250 (7) = 1.750
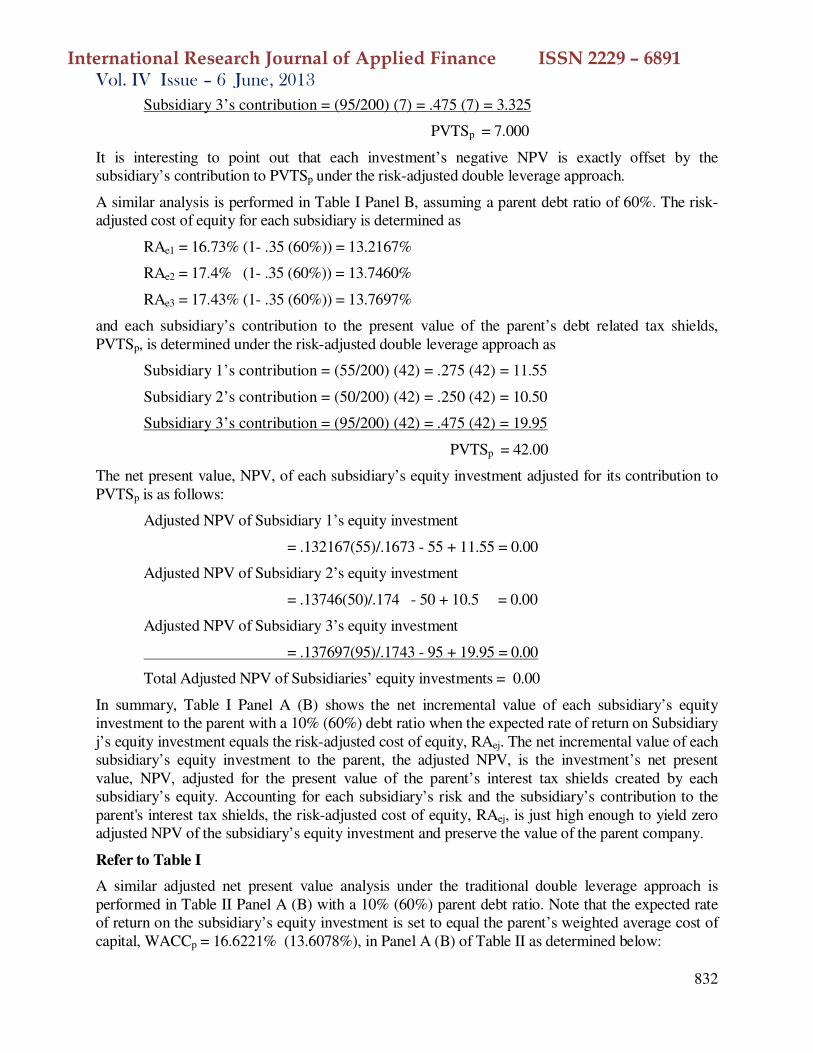
International Research Journal of Applied Finance ISSN 2229 – 6891 Vol. IV Issue – 6 June, 2013
832
Subsidiary 3’s contribution = (95/200) (7) = .475 (7) = 3.325
PVTSp = 7.000
It is interesting to point out that each investment’s negative NPV is exactly offset by the subsidiary’s contribution to PVTSp under the risk-adjusted double leverage approach.
A similar analysis is performed in Table I Panel B, assuming a parent debt ratio of 60%. The risk-adjusted cost of equity for each subsidiary is determined as
RAe1 = 16.73% (1- .35 (60%)) = 13.2167%
RAe2 = 17.4% (1- .35 (60%)) = 13.7460%
RAe3 = 17.43% (1- .35 (60%)) = 13.7697%
and each subsidiary’s contribution to the present value of the parent’s debt related tax shields, PVTSp, is determined under the risk-adjusted double leverage approach as
Subsidiary 1’s contribution = (55/200) (42) = .275 (42) = 11.55
Subsidiary 2’s contribution = (50/200) (42) = .250 (42) = 10.50
Subsidiary 3’s contribution = (95/200) (42) = .475 (42) = 19.95
PVTSp = 42.00
The net present value, NPV, of each subsidiary’s equity investment adjusted for its contribution to PVTSp is as follows:
Adjusted NPV of Subsidiary 1’s equity investment
= .132167(55)/.1673 - 55 + 11.55 = 0.00
Adjusted NPV of Subsidiary 2’s equity investment
= .13746(50)/.174 - 50 + 10.5 = 0.00
Adjusted NPV of Subsidiary 3’s equity investment
= .137697(95)/.1743 - 95 + 19.95 = 0.00
Total Adjusted NPV of Subsidiaries’ equity investments = 0.00
In summary, Table I Panel A (B) shows the net incremental value of each subsidiary’s equity investment to the parent with a 10% (60%) debt ratio when the expected rate of return on Subsidiary j’s equity investment equals the risk-adjusted cost of equity, RAej. The net incremental value of each subsidiary’s equity investment to the parent, the adjusted NPV, is the investment’s net present value, NPV, adjusted for the present value of the parent’s interest tax shields created by each subsidiary’s equity. Accounting for each subsidiary’s risk and the subsidiary’s contribution to the parent's interest tax shields, the risk-adjusted cost of equity, RAej, is just high enough to yield zero adjusted NPV of the subsidiary’s equity investment and preserve the value of the parent company.
Refer to Table I
A similar adjusted net present value analysis under the traditional double leverage approach is performed in Table II Panel A (B) with a 10% (60%) parent debt ratio. Note that the expected rate of return on the subsidiary’s equity investment is set to equal the parent’s weighted average cost of capital, WACCp = 16.6221% (13.6078%), in Panel A (B) of Table II as determined below:

International Research Journal of Applied Finance ISSN 2229 – 6891 Vol. IV Issue – 6 June, 2013
833
rej = WACCp = kup (1- T Lp) = 17.225% (1 - .35(.1)) = 16.6221%, j = 1, 2, 3
rej = WACCp = kup (1- T Lp) = 17.225% (1 - .35(.6)) = 13.6078%, j = 1, 2, 3
Refer to Table II
Table II Panel A shows the net present value of the subsidiary’s equity investment adjusted for the subsidiary’s contribution to PVTSp as follows:
Adjusted NPV of Subsidiary 1’s equity investment
= .166221(55)/.1673 - 55 +1.925 = 1.5703
Adjusted NPV of Subsidiary 2’s equity investment
= .166221(50)/.174 - 50 +1.75 = -0.4853
Adjusted NPV of Subsidiary 3’s equity investment
= .166221(95)/.1743 - 95 +3.325 = -1.0784
Total Adjusted NPV of Subsidiaries’ equity investments = 0.00
Additionally, Table II Panel B presents the adjusted NPV of each subsidiary’s equity investment financed with 60% parent debt:
Adjusted NPV of Subsidiary 1’s equity investment
= .136078 (55)/.1673 - 55 + 11.55 = 1.2857
Adjusted NPV of Subsidiary 2’s equity investment
= .136078 (50)/.174 - 50 + 10.5 = -0.3971
Adjusted NPV of Subsidiary 3’s equity investment
= .136078 (95)/.1743 - 95 + 19.95 = -0.8824
Total Adjusted NPV of Subsidiaries’ equity investments = 0.00
Notice from Table II that the parent value is maintained as the total adjusted NPV of the subsidiaries’ investments equals zero. Nonetheless, the lower risk subsidiary (Subsidiary 1) is subsidizing the higher risk subsidiaries (Subsidiary 2 and Subsidiary 3). This is because the subsidiary’s risk is ignored, resulting in cross subsidizations among the subsidiaries under the traditional double leverage approach.
In summary, Tables I and II illustrate that the value of the parent’s interest tax shields must be accounted for in the subsidiary’s cost of equity if the parent value is to be maintained and not enhanced. Both the risk-adjusted double leverage approach and the traditional double leverage approach achieve this goal, total adjusted NPV = 0. However, the risk-adjusted double leverage approach is superior to the traditional double leverage approach as it recognizes the subsidiary risk. The risk-adjusted cost of equity is the minimum acceptable rate of return on the subsidiary’s equity investment, and should be used as the hurdle rate to evaluate its proposed equity investment. In applying the internal rate of return decision rule in capital budgeting, when the expected internal rate of return on the subsidiary’s equity investment is greater than this adjusted
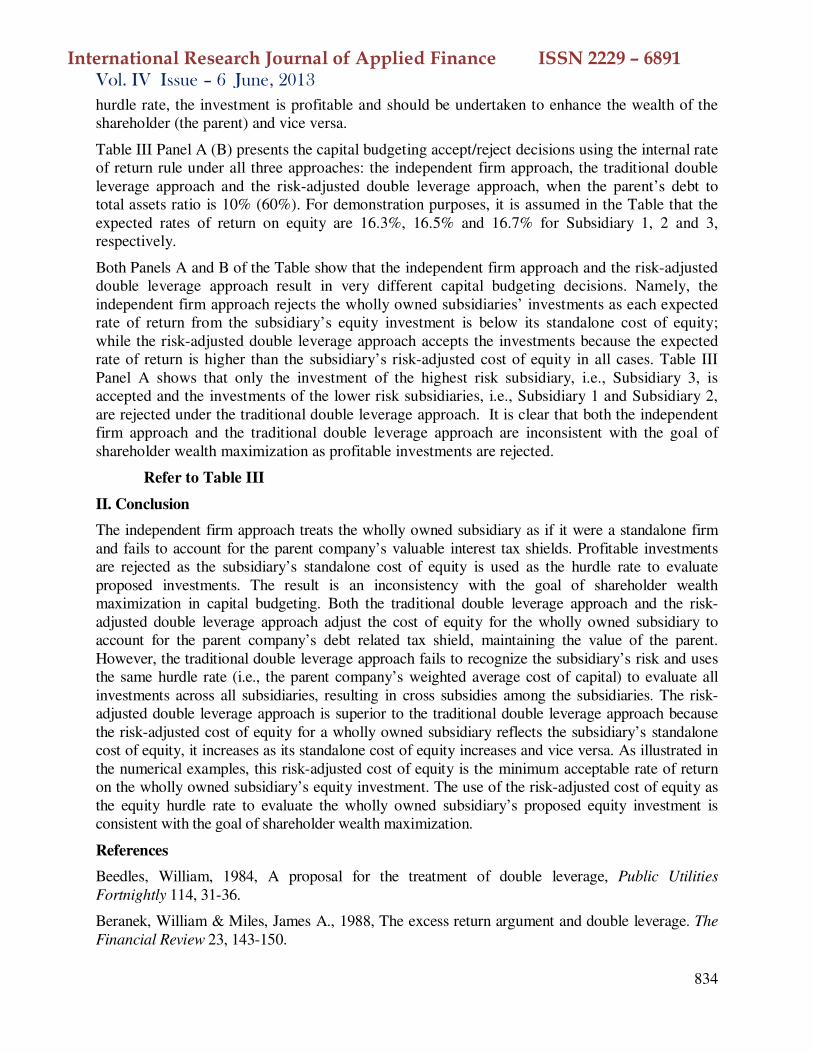
International Research Journal of Applied Finance ISSN 2229 – 6891 Vol. IV Issue – 6 June, 2013
834
hurdle rate, the investment is profitable and should be undertaken to enhance the wealth of the shareholder (the parent) and vice versa.
Table III Panel A (B) presents the capital budgeting accept/reject decisions using the internal rate of return rule under all three approaches: the independent firm approach, the traditional double leverage approach and the risk-adjusted double leverage approach, when the parent’s debt to total assets ratio is 10% (60%). For demonstration purposes, it is assumed in the Table that the expected rates of return on equity are 16.3%, 16.5% and 16.7% for Subsidiary 1, 2 and 3, respectively.
Both Panels A and B of the Table show that the independent firm approach and the risk-adjusted double leverage approach result in very different capital budgeting decisions. Namely, the independent firm approach rejects the wholly owned subsidiaries’ investments as each expected rate of return from the subsidiary’s equity investment is below its standalone cost of equity; while the risk-adjusted double leverage approach accepts the investments because the expected rate of return is higher than the subsidiary’s risk-adjusted cost of equity in all cases. Table III Panel A shows that only the investment of the highest risk subsidiary, i.e., Subsidiary 3, is accepted and the investments of the lower risk subsidiaries, i.e., Subsidiary 1 and Subsidiary 2, are rejected under the traditional double leverage approach. It is clear that both the independent firm approach and the traditional double leverage approach are inconsistent with the goal of shareholder wealth maximization as profitable investments are rejected.
Refer to Table III
II. Conclusion
The independent firm approach treats the wholly owned subsidiary as if it were a standalone firm and fails to account for the parent company’s valuable interest tax shields. Profitable investments are rejected as the subsidiary’s standalone cost of equity is used as the hurdle rate to evaluate proposed investments. The result is an inconsistency with the goal of shareholder wealth maximization in capital budgeting. Both the traditional double leverage approach and the risk-adjusted double leverage approach adjust the cost of equity for the wholly owned subsidiary to account for the parent company’s debt related tax shield, maintaining the value of the parent. However, the traditional double leverage approach fails to recognize the subsidiary’s risk and uses the same hurdle rate (i.e., the parent company’s weighted average cost of capital) to evaluate all investments across all subsidiaries, resulting in cross subsidies among the subsidiaries. The risk-adjusted double leverage approach is superior to the traditional double leverage approach because the risk-adjusted cost of equity for a wholly owned subsidiary reflects the subsidiary’s standalone cost of equity, it increases as its standalone cost of equity increases and vice versa. As illustrated in the numerical examples, this risk-adjusted cost of equity is the minimum acceptable rate of return on the wholly owned subsidiary’s equity investment. The use of the risk-adjusted cost of equity as the equity hurdle rate to evaluate the wholly owned subsidiary’s proposed equity investment is consistent with the goal of shareholder wealth maximization.
References
Beedles, William, 1984, A proposal for the treatment of double leverage, Public Utilities
Fortnightly 114, 31-36.
Beranek, William & Miles, James A., 1988, The excess return argument and double leverage. The
Financial Review 23, 143-150.

International Research Journal of Applied Finance ISSN 2229 – 6891 Vol. IV Issue – 6 June, 2013
835
Brealey, Richard A., Myers, Stewart C., & Allen Franklin, 2011. Principles of Corporate Finance. 10th edition (New York: McGraw-Hill).
Ezzell, John R., Hsu, H. Christine & Miles, James A., 1991, An analysis of regulated rates of return for wholly owned subsidiaries, Journal of Financial Research 14, 167-180.
Hsu, H. Christine, 2000, Capital budgeting analysis in wholly owned subsidiaries, Journal of
Financial and Strategic Decisions 13, http://www.studyfinance.com/jfsd/v13n1.html#hsu.
Modigliani, Franco & Miller, Merton H., 1963, Corporate income taxes and the cost of capital: A correction, American Economic Review 53, 433-443.
Myers, Stewart C., 1974, Interactions of corporate financing and investment decisions: Implications for capital budgeting, Journal of Finance 29, 1-25.
O'Donnell, John L., & Walker, Mark M., 1989, Double leverage and unregulated corporate practice, Public Utilities Fortnightly 124, 24-26.
O'Donnell, John L., & Walker, Mark M., 1993, A comparative market test of double leverage techniques, Arkansas Business and Economic Review 26, 1-11.
Pettway, Richard H., & Jordan, Bradford D., 1983, Diversification, double leverage, and the cost of capital. Journal of Financial Research 6, 289-300.
Rozeff, Michael, 1983, Modified double leverage: A new approach, Public Utilities Fortnightly 111, 31-36.
Sweeney, Robert, 1985, Limitations on the use of the modified double leverage approach, Public
Utilities Fortnightly 115, 41-44.

International Research Journal of Applied Finance ISSN 2229 – 6891 Vol. IV Issue – 6 June, 2013
836
Table I. Net incremental value of subsidiaries’ equity investments to the parent under
the risk-adjusted double leverage approach This Table shows that the net present value (NPV) of each subsidiary’s equity investment adjusted for its contribution to the present value of the parent’s interest tax shields, PVTSp, equals zero. The shareholder’s wealth (or the value of the parent company) is maintained when each wholly owned subsidiary’s expected return on equity, rej, equals its risk-adjusted cost of equity, RAej, with a parent debt to total assets ratio, Lp, of 10% (60%) in Panel A (B).
Panel A. Parent’s debt to total assets ratio = 10%
Subsidiary 1 Subsidiary 2 Subsidiary 3
Subsidiary j's standalone cost of equity: kej 16.73% 17.4% 17.43%
Expected return on equity to Subsidiary j: rej = RAej = kej (1 – T Lp) = kej (1-.35(.1))
16.1445% 16.791% 16.82%
Subsidiary j's equity investment outlay: Ej $55 $50 $95
Expected equity cash flows to Subsidiary j: rejEj $8.8795 $8.3955 $15.979
Present value of j's equity cash flows: rejEj/kej
$53.0752 $48.25 $91.6753
PVTSp created by subsidiaries’ equity: PVTSp = T Dp = .35 (20)
$7
Subsidiary j's contribution to PVTSp: Ej/Σi Ei = Ej /200
0.275 0.25 0.475
PVTSp created by Subsidiary j's equity: (Ej/Σi Ei) PVTSp = (Ej /200) (7)
$1.925 $1.75 $3.325
NPV of Subsidiary j's equity investment adjusted for PVTSp: rejEj/kej - Ej + (Ej/Σi Ei) PVTSp
$0.00 $0.00 $0.00
Incremental value to the parent: Sum of the adjusted NPVs
$0.00
Panel B. Parent’s debt to total assets ratio = 60%
Subsidiary 1 Subsidiary 2 Subsidiary 3
Subsidiary j's standalone cost of equity: kej 16.73% 17.40% 17.43%
Expected return on equity to Subsidiary j: rej = RAej = kej (1 – T Lp) = kej (1-.35(.6))
13.2167% 13.7460% 13.7697%
Subsidiary j's equity investment outlay: Ej $55 $50 $95
Expected equity cash flows to Subsidiary j: rejEj $7.2692 $6.8730 $13.0812
Present value of j's equity cash flows: rejEj/kej
$43.45 $39.50 $75.05
PVTSp created by subsidiaries’ equity: PVTSp = T Dp = .35 (120)
$42
Subsidiary j's contribution to PVTSp: Ej/Σi Ei = Ej /200
0.275 0.25 0.475
PVTSp created by Subsidiary j's equity: (Ej/Σi Ei) PVTSp = (Ej /200) (42)
$11.55 $10.50 $19.95
NPV of Subsidiary j's equity investment adjusted for PVTSp: rejEj/kej - Ej + (Ej/Σi Ei) PVTSp
$0.00 $0.00 $0.00
Incremental value to the parent: Sum of the adjusted NPVs
$0.00

International Research Journal of Applied Finance ISSN 2229 – 6891 Vol. IV Issue – 6 June, 2013
837
Table II. Net incremental value of subsidiary’s equity investment to the parent under
the traditional double leverage approach This Table shows that the value of the parent company (i.e., the shareholder’s wealth) is maintained when the wholly owned subsidiary’s expected return on equity equal the parent’s weighted average cost of capital, WACCp = kup (1- T Lp) = 17.225% (1- .35 Lp), with a parent debt to total assets ratio, Lp, of 10% (60%) in Panel A (B). Nonetheless, Subsidiary 1 (the lower risk subsidiary) is subsidizing Subsidiaries 1 and 2 (the higher risk subsidiaries).
Panel A. Parent’s debt to total assets ratio = 10%
Subsidiary 1 Subsidiary 2 Subsidiary 3
Subsidiary j's standalone cost of equity: kej 16.73% 17.4% 17.43%
Expected return on equity to Subsidiary j: rej = kup (1- T Lp) = 17.225% (1-.35(.1))
16.6221% 16.6221% 16.6221%
Subsidiary j's equity investment outlay: Ej $55 $50 $95
Expected equity cash flows to Subsidiary j: rejEj $9.1422 $8.3111 $15.7910
Present value of j's equity cash flows: rejEj/kej
$54.6453 $47.7647 $90.5966
PVTSp created by subsidiaries’ equity: PVTSp = T Dp = .35 (20)
$7
Subsidiary j's contribution to PVTSp: Ej/Σi Ei = Ej /200
0.275 0.25 0.475
PVTSp created by Subsidiary j's equity: (Ej/Σi Ei) PVTSp = (Ej /200) (7)
$1.925 $1.75 $3.325
NPV of Subsidiary j's equity investment adjusted for PVTSp: rejEj/kej - Ej + (Ej/Σi Ei) PVTSp
$1.5703 -$0.4853 -$1.0784
Incremental value to the parent: Sum of the adjusted NPVs
$1.5703- $0.4853 - $1.0784 = $0.00
Panel B. Parent’s debt to total assets ratio = 60%
Subsidiary 1 Subsidiary 2 Subsidiary 3
Subsidiary j's standalone cost of equity: kej 16.73% 17.4% 17.43%
Expected return on equity to Subsidiary j: rej = kup (1- T Lp) = 17.225% (1-.35(.6))
13.6078% 13.6078% 13.6078%
Subsidiary j's equity investment outlay: Ej $55 $50 $95
Expected equity cash flows to Subsidiary j: rejEj $7.4843 $6.8039 $12.9274
Present value of j's equity cash flows: rejEj/kej
$44.7357 $39.1029 $74.1676
PVTSp created by subsidiaries’ equity: PVTSp = T Dp = .35 (120)
$42
Subsidiary j's contribution to PVTSp: Ej/Σi Ei = Ej /200
0.275 0.25 0.475
PVTSp created by Subsidiary j's equity: (Ej/Σi Ei) PVTSp = (Ej /200) (42)
$11.55 $10.50 $19.95
NPV of Subsidiary j's equity investment adjusted for PVTSp: rejEj/kej - Ej + (Ej/Σi Ei) PVTSp
$1.2857 -$0.3971 -$0.8824
Incremental value to the parent: Sum of the adjusted NPVs
$1.2857 – $0.3971 – $0.8824 = $0.00
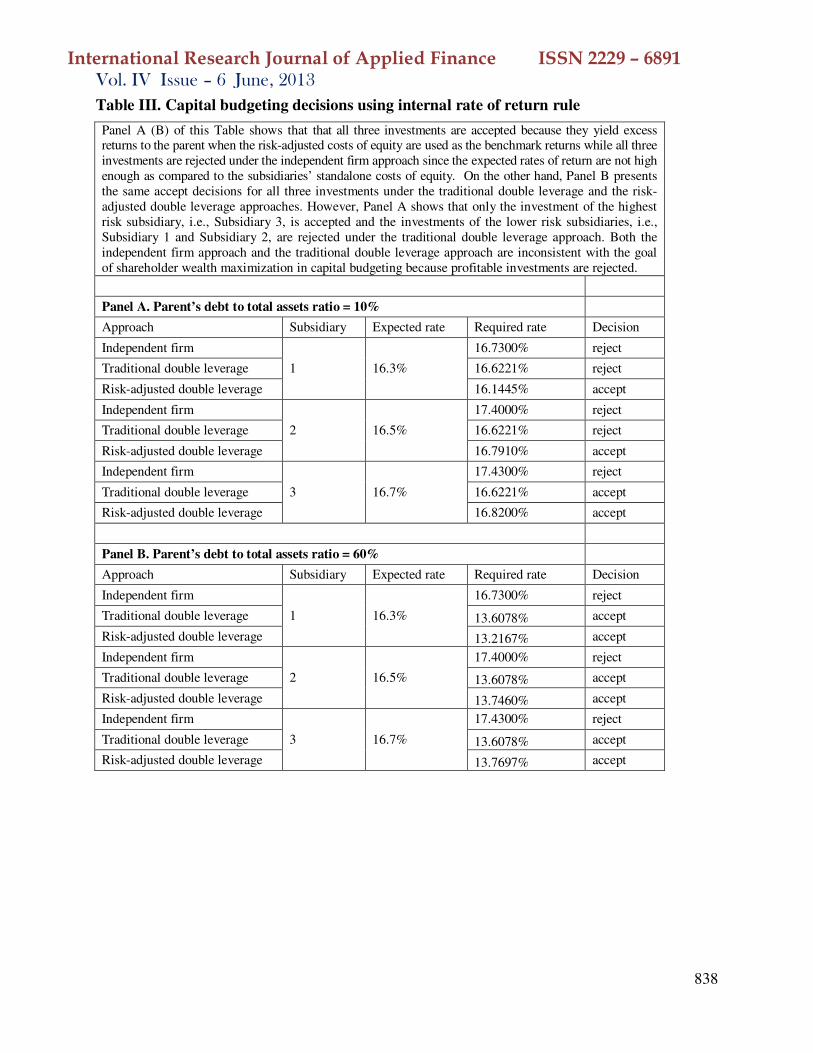
International Research Journal of Applied Finance ISSN 2229 – 6891 Vol. IV Issue – 6 June, 2013
838
Table III. Capital budgeting decisions using internal rate of return rule
Panel A (B) of this Table shows that that all three investments are accepted because they yield excess returns to the parent when the risk-adjusted costs of equity are used as the benchmark returns while all three investments are rejected under the independent firm approach since the expected rates of return are not high enough as compared to the subsidiaries’ standalone costs of equity. On the other hand, Panel B presents the same accept decisions for all three investments under the traditional double leverage and the risk-adjusted double leverage approaches. However, Panel A shows that only the investment of the highest risk subsidiary, i.e., Subsidiary 3, is accepted and the investments of the lower risk subsidiaries, i.e., Subsidiary 1 and Subsidiary 2, are rejected under the traditional double leverage approach. Both the independent firm approach and the traditional double leverage approach are inconsistent with the goal of shareholder wealth maximization in capital budgeting because profitable investments are rejected.
Panel A. Parent’s debt to total assets ratio = 10%
Approach Subsidiary Expected rate Required rate Decision
Independent firm
1 16.3%
16.7300% reject
Traditional double leverage 16.6221% reject
Risk-adjusted double leverage 16.1445% accept
Independent firm
2 16.5%
17.4000% reject
Traditional double leverage 16.6221% reject
Risk-adjusted double leverage 16.7910% accept
Independent firm
3 16.7%
17.4300% reject
Traditional double leverage 16.6221% accept
Risk-adjusted double leverage 16.8200% accept
Panel B. Parent’s debt to total assets ratio = 60%
Approach Subsidiary Expected rate Required rate Decision
Independent firm
1 16.3%
16.7300% reject
Traditional double leverage 13.6078% accept
Risk-adjusted double leverage 13.2167% accept
Independent firm
2 16.5%
17.4000% reject
Traditional double leverage 13.6078% accept
Risk-adjusted double leverage 13.7460% accept
Independent firm
3 16.7%
17.4300% reject
Traditional double leverage 13.6078% accept
Risk-adjusted double leverage 13.7697% accept

International Research Journal of Applied Finance ISSN 2229 – 6891 Vol. IV Issue – 6 June, 2013
839
On the constitutionality and Rationality of Dividend Distribution Tax
J P Singh
Professor Department of Management Studies
Indian Institute of Technology Roorkee, India [email protected]

International Research Journal of Applied Finance ISSN 2229 – 6891 Vol. IV Issue – 6 June, 2013
840
Abstract
It is surprising that the Hon’ble Supreme Court of India has not had opportunity to examine the rationality and constitutional validity of the Dividend Distribution Tax. A few of its pitfalls are elucidated in this article. It is believed that sufficient appreciation would be created to induce the prejudicially affected to prefer a plea to the apex court enabling a convincing and irrefutable determination of the contentious issues in this piece of legislation.
It is, indeed, intriguing to observe that the Hon’ble Supreme Court of India has not had opportunity to examine the constitutional validity of the Dividend Distribution Tax (DDT, hereinafter) despite this issue having cropped up for adjudication before several High Courts in the country e,g. Jayshree Tea & Industries Ltd. vs Union of India & Ors., (2006), 205 CTR Cal 370, Calcutta High Court; George Williamson (Assam) Ltd. vs Union of India & Ors., (2007) (6) TMI 174, Gauhati High Court; Godrej & Boyce Mfg. Co. Ltd. vs. Dy CIT, (2010) (8) TMI 15, Bombay High Court etc. Although, these Hon’ble Courts have unfailingly ruled in favour of the Revenue, the premises on which these decisions were taken have been varied and inequivalent leaving substantial scope for a once-for-all examination of the underlying issues by the apex court of the country.
The fact that DDT is not devoid of conflict, even within the legislature, is amply testified in the budget speeches of the Finance Ministers involved in the introduction/abolition and the reintroduction of DDT. DDT was incorporated into the statute books by the Finance Act, 1997 presented by the erstwhile Finance Minister M Chidambaram while observing in his budget speech, as to the rationale thereof, that:
“D0. Another area of vigorous debate over many years relates to the issue of tax on dividends.
I wish to end this debate. Hence I propose to abolish tax on dividends in the hands of the
shareholder.
D1. Some companies distribute exorbitant dividends. Ideally they should retain the bulk of
their profit and plough them into fresh investments. I intend to reward companies who invest in
future growth. Hence, I propose to levy a tax on distributed profits at the moderate rate of 10 per
cent on the amount so distributed. This tax shall be an incidence on the company and shall not
be passed on to the shareholder.”
However, Yashwant Sinha, while abolishing DDT observed in his budget speech of 2002 that:
“Under the existing provisions contained in Section 115O, in addition to the income-tax
chargeable in respect of the total income of a domestic company, any amount declared,
distributed or paid by way of dividends is charged to additional income-tax at the rate of 10 per
cent. The tax so paid by the company is treated as the final payment of tax in respect of the
amount declared, distributed or paid by way of dividend. Such dividend referred to in section
115O is exempt in the hands of the shareholders under Sub-Clause (i) of Clause (33) of Section
10. The incidence of tax is, thus, on the payer company and not on the recipient where it should
normally be.
The dividend is income in the hands of the shareholders and not in the hands of the company.
The incidence of the tax should therefore, be on the recipient. Moreover, the present provisions
levy tax at a flat rate of 10% on the distributed profits across the board irrespective of the

International Research Journal of Applied Finance ISSN 2229 – 6891 Vol. IV Issue – 6 June, 2013
841
marginal rate at which the recipient is otherwise taxed. The provisions are hence, considered,
iniquitous also.
It is, therefore, proposed to revert to earlier system of taxing dividend and shift the incidence of
tax on to the shareholder receiving the dividends…..”
However, DDT was reintroduced in the immediately following year by the Finance Act, 2003 by Jaswant Singh while observing, in his budget speech, that:
“89. From April 1, 2003, it is proposed that dividends be tax free in the hands of the
shareholders. Correspondingly, there will be a 12.5 percent dividend distribution tax on
domestic companies.”
Interestingly, both Yashwant Sinha & Jaswant Singh represented the same Government.
The iniquitous character and inconsistency insofar as the point of incidence of DDT have already been alluded to by Yashwant Sinha in his budget speech of 2002. Taxes, like other instruments of State management, must necessarily satisfy the tests of “rationality” and “reasonableness” to be non-violative of Article 14 of the Constitution of India. The author sincerely believes that there is immediate necessity to examine DDT on these counts threadbare.
“Dividend” is declared and paid by companies from post-tax profits i.e. from profits that have already suffered taxation in the hands of the company. Thus, levy of DDT (whose incidence also falls on the company) invariably amounts to double taxation of the portion of the profits that are distributed by way of dividend. In this context, it may be contended that the earlier scheme of dividend taxation suffered from a similar fallacy viz. it also involved double taxation of dividend. However, it may be argued to the contrary on the premises that (i) the earning of “dividend” has a causal proximity to the act of “investing” in the shares of the company rather than the act of earning profits by the company (Bacha F Guzdar vs CIT); (ii) “dividend” like any other income in the hands of the recipient is allowed to be aggregated/set off against other incomes/losses suffered by the recipient; and (iii) the company has a juristic personality so that the treating of “dividend” in the hands of shareholders as part of company’s income would tantamount to “lifting of the corporate veil” – an act that has, hitherto, been confined for the benefit of the Revenue rather than to its detriment (State of UP & Ors. vs Renusagar Power Corpn & Ors. (1988) AIR 1737 and citations therein).
The issue of “incidence of DDT” is of cardinal importance in assessing its constitutionality. As mentioned earlier, DDT is a tax that is levied on the profits distributed by a company out of its post-tax profits. The incidence of such tax, by design and intention of the legislature is on the dividend paying company and not on the dividend recipient. This issue was examined by the Hon’ble Calcutta High Court in Jayshree’s case (supra). Jayshree Tea & Industries Ltd. (JIL hereinafter) was engaged in the business of growing and manufacturing tea. Under Rule 8 of the Income Tax Rules, 1961, 60% of the income of such companies was to be treated as “agricultural income” that would be exempt from income-tax levied under the provisions of the Income Tax Act, 1961 and 40% of the income would be “industrial income” subject to tax under the Income Tax Act, 1961. Observing that “Section 115O provides additional tax on the company and not on the shareholder” Ashim Kumar Banerjee, J. held that only 40% of the amount allocated for distribution by JIL by way of dividend would be liable to DDT under the provisions of the impugned section. An immediate corollary to this judicial pronouncement is that distributed profits by the company retain the colour and flavour of the overall profits earned by it. If this is

International Research Journal of Applied Finance ISSN 2229 – 6891 Vol. IV Issue – 6 June, 2013
842
the true picture, then are the provisions of Section 115O not massively regressive, depriving the corporate sector of its cardinal attribute – that of a juristic personality?
This is another important fallout to the above pronouncement. Sec 115O provides, inter alia that
“…..a domestic company for any assessment year, any amount declared. distributed or paid by
such company by way of dividends (whether interim or otherwise) on or after the 1st day of April,
2003, whether out of current or accumulated profits shall be charged to additional income-tax
(hereafter referred to as tax on distributed profits) at the rate of fifteen per cent…..”
The highlighted words are important. The use of the words “accumulated profits” imply that (i) the legislature acknowledges that profits are earned on a year to year basis; (ii) such profits may either be distributed by way of dividend or carried forward e.g. as balances in the constituent accounts of “Reserves & Surplus” (iii) dividends may not only be paid out of current profits but also from brought forward profits so that profits subject to DDT could include accumulated profits of earlier years. This is clearly contrary to the provisions of Section 3 of the Income Tax Act, 1961 that defines “income-tax” as a tax on the income of the previous year and hence it should not take into account any income for the earlier years to be tagged with it. The possible contention that profits would lose their time-indexing once they get pooled as “distributed profits” would, it is submitted, go contrary to the views of Hon’ble Ashim Kumar Banerjee, J in JIT. Besides, the observation of Ashim Kumar Banerjee, J on this issue
“When a company earns a profit for a particular year and does not declare a dividend such
profit is automatically ploughed back to the company’s growth and in the next year the profit
earned by the company is a profit for that particular year for tax purpose.”
does not, on a literary construction of Sec 115O, seem to conform to the legislated language in view of the use of the words “current or accumulated profits” therein. The legislature seems to endorse the accounting description of “profits”. If it were otherwise, the highlighted words would not have been necessary.
It is pertinent to mention here that the law as regard the character of dividend in the hands of the recipient as being independent of the nature of the profit earning activities of the company is well settled by the apex court in Mrs Bacha F Guzdar vs CIT, (1955) SCR(1), 876 while holding that the dividends received by the shareholder do not partake the character of the profits of the company. The apex court adjudicated that:
“The dividend of a shareholder is the outcome of his right to participate in the profits of the
company arising out of the contractual relation between the company and the shareholder and
this right exists independently of any declaration of the dividend though until such declaration,
the enjoyment of the profits is postponed.
The shareholder by purchase of the share does not acquire any interest in the assets 'of the
company till after the company is wound up. The position of a shareholder of a company is
altogether different from that of a partner of a firm. A company is a juristic entity distinct from
the shareholders but the firm is a collective name or an alias for all the partners.”
This decision has been followed by the various High Courts in a catena of cases while holding, in essence, that
International Research Journal of Applied Finance ISSN 2229 – 6891 Vol. IV Issue – 6 June, 2013
843
(a) This necessarily leads to the conclusion that, even if the accumulated profits in the hands
of the company were derived from agriculture and as agricultural income these profit were
exempt from tax, the money received by the shareholder would not retain the same character. In
other words, neither a dividend nor a deemed dividend paid out of agricultural income is itself
agricultural income (S Kumaraswami vs ITO, Madras High Court).
(b) For these reasons I think that the immediate and effective source of the dividend is the
statutory contract between the company…..(Raja Bahadur Vishweshwara Singh vs CIT, Patna
High Court).
Apparently, the substratum of Mrs Bacha F Guzdar has been overlooked in JIT’s case. However, it needs be emphasized here that Bacha F Guzdar’s case relates to “dividend” in contradistinction to “distributed profits” of Section 115O. “Dividends” are profits that have been segregated and severed from the company and dispensed to the shareholders while “distributed profits” as envisaged by Section 115O may still retain their identity within the company – they are segregated from the total profits for distribution (declared) but may not have been severed from the company. In fact, something more needs to be done in relation thereto when they are paid out as “dividend” (or within fourteen days thereof) viz DDT has to be paid by the payer company and then they may be transferred to the recipient shareholders as “dividend” - such tax needs to be paid to the Central Government within 14 days of the dividend declaration, distribution or payment, whichever is earlier. In such a scenario, whether the ratio in Guzdar’s case would still hold needs to be settled at the highest level to finally adjudicate upon the constitutionality of Section 115O.
Article 246(1) of the Constitution confers exclusive power to legislate with respect to any matter enumerated in List I (Union list) in the Seventh Schedule upon Parliament and under Article 126(3) the State Legislature has exclusive power to make laws with respect to any of the matters enumerated in List II (State list) in the Seventh Schedule of the Constitution. Article 246(2) of the Constitution, empowers both Parliament and the State Legislature to make laws with respect to any matter enumerated in List III, i.e. Concurrent List, of the Seventh Schedule. Entry 82 of List I (Union List) deals with the subject “taxes on income other than agricultural income”. Entry 46 of List II (State List) deals with the subject “taxes on agricultural income”. Thus, the State Legislature has exclusive jurisdiction to legislate laws in respect of agricultural income tax and Parliament has the exclusive jurisdiction to legislate laws on matters other than agricultural income tax. How can the ratio of Guzdar’s case be extrapolated to enshrine “distributed profits” with the same characteristics as “dividend” – if it is inequitable for equate the payer company’s profits with dividends (Guzdar’s ratio) - it is, perhaps, more inequitable to equate dividends with distributed (Sec115O) profits since the latter have a completely different point of incidence of tax. The constitutional implications need to be explored by our apex court.
Furthermore, the effective rate of DDT, as of now, is 16.995% after including surcharge and education cess. This rate is a “blanket” rate and is irrespective of the income profile of the dividend recipient. Importantly, as of now, the marginal tax rate is zero for assessees with taxable income below Rs 1,80,000 and 10% for assessees with taxable income between Rs 1,80,000 and Rs 5,00,000. Thus, the DDT operates to the prejudice of the small investor. Furthermore, the fact that DDT is levied at a blanket rate makes it violative of the “ability to pay” norm on which most of the direct tax systems of the world are structured.

International Research Journal of Applied Finance ISSN 2229 – 6891 Vol. IV Issue – 6 June, 2013
844
Besides, DDT is mandated to be a final tax payment in respect of the amount in question and no credit is allowed to the recipient of dividend in respect of DDT deducted by the company on dividends received by him. This makes DDT different from TDS on dividends.
The observations of M Chidambaram, supra, are also open to serious debate. The issue of retaining/distributing profits earned by a company, should be entirely based on the existence and identification of alternative investment opportunities wherein the company could deploy its excess funds and thereby earn returns exceeding its cost of capital – introduction of DDT simply serves to distort this rationale. In the absence of such alternative avenues for investment, the company would be well served by distributing its profits to its investment community.
The decision to plough back/distribute its profits should be entirely intrinsic to the company being based on its plans and projections. It defies any kind of rationale to discourage the company from distributing its profits by putting additional tax burden on such profits. The amount of tax liability should not depend on the manner that “a person chooses to organize his affairs” – rather it should fairly and squarely relate to the quantum of profits earned. Claims that such taxation acts as an incentive to the company to reinvest its profit carry little weight, for the shareholders could as well reinvest their dividend receipts if congenial investment climate and opportunity subsists.
A few of the pitfalls of DDT have been elucidated in this article. It is believed that sufficient appreciation would be created in the fraternity to induce the prejudicially affected to prefer a plea to the apex court enabling a convincing and irrefutable determination of the contentious issues (of which, there are many) in this piece of legislation.
International Research Journal of Applied Finance ISSN 2229 – 6891 Vol. IV Issue – 6 June, 2013
845
Editorial Board
Editor-In-Chief
Prof. Y Rama Krishna, RK Business School, India Associate Editor Prof. Vinay Datar, Seattle University, USA Senior Sub-Editor
Dr. Moustafa Abu El Fadl, Rhode Island College, USA
Members Prof. Sunil Sapra, California State University, Los Angeles, USA Dr. Yu Hsing, Southeastern Louisiana University, USA Prof. Richard J. Cebula, Jacksonville University, USA Prof. Nur Adiana Hiau Abdullah, Universiti Utara Malaysia Dr. Mohammad Talha, King Fahd University of Petroleum & Minerals, Saudi Arabia Dr. Sorin A Tuluca, Fairleigh Dickinson University, USA Dr. Nozar Hashemzadeh, Radford University, USA Dr. Guneratne B Wickremasinghe, Victoria University, Australia Dr. Dar-Hsin Chen, National Taipei University, Taiwan Dr. Hayette Gatfaoui, Rouen Business School, France Dr. Emmanuel Fragnière, University of Bath, Switzerland Dr. Shwu - Jane Shieh, National Cheng-Chi University, Taiwan Dr. Raymond Li, The Hong Kong Polytechnic University, Hong Kong Prof. Yang-Taek Lim, Hanyang University, Korea Dr. Anson Wong, The Hong Kong Polytechnic University, Hong Kong Dr. Shaio Yan Huang, National Chung Cheng University, Taiwan Mr. Giuseppe Catenazzo, HEC-University of Geneva, Switzerland Prof. J P Singh, Indian Institute of Technology (R), India Dr. Jorge A. Chan-Lau, International Monetary Fund, Washington DC Prof. Carlos Machado-Santos, UTAD University, Portugal Dr. Osama D. Sweidan,University of Sharjah, UAE Dr. David Wang, Chung Yuan Christian University, Taiwan Prof. David McMillan, University of St Andrews, Scotland UK Dr. Abdullah Sallehhuddin, Multimedia University, Malaysia Dr. Burak Darici, Balikesir University, Turkey Dr. Mohamed Saidane, University of 7 November at Carthage, Tunisia Dr. Anthony DiPrimio, Holy Family University, USA Advisors
Dr. Michail Pazarskis, Technological Educational Institute of Serres, Greece Dr. Huseyin Aktas, Celal Bayar University, Turkey Dr. Panayiotis Tahinakis, University of Macedonia, Greece Dr. Ahmet Faruk Aysan, Bogazici University, Turkey Dr. Leire San Jose, Universidad del País Vasco, Spain Dr. Arqam Al-Rabbaie, The Hashemite University, Jordan
International Research Journal of Applied Finance ISSN 2229 – 6891 Vol. IV Issue – 6 June, 2013
846
Dr. Suleyman Degirmen, Mersin University, Turkey Prof. Dr. Ali Argun Karacabey, Ankara University, Dr. Moawia Alghalith, UWI, St Augustine, West Indies Dr. Michael P. Hanias, School of Technological Applications, Greece Dr. Mohd Tahir Ismail, Universiti Sains Malayasia, Malayasia Dr. Hai-Chin YU, Chung Yuan University, Taiwan Dr. Ma Carmen Lozano, Universidad Politécnica de Cartagena, Spain Dr. Mostafa Kamal Hassan, University of Sharjah, College of Business, UAE Prof. Muhammad Abdus Salam, State Bank of Pakistan, Pakistan
Related Documents


