EUROPEAN ECONOMY Occasional Papers 152 | June 2013 The 2013 Stability and Convergence Programmes: An Overview Economic and Financial Affairs ISSN 1725-3209

Welcome message from author
This document is posted to help you gain knowledge. Please leave a comment to let me know what you think about it! Share it to your friends and learn new things together.
Transcript
EUROPEAN ECONOMY
Occasional Papers 152 | June 2013
The 2013 Stability and Convergence Programmes: An Overview
Economic and Financial Affairs
ISSN 1725-3209

Occasional Papers are written by the Staff of the Directorate-General for Economic and Financial Affairs, or by experts working in association with them. The “Papers” are intended to increase awareness of the technical work being done by the staff and cover a wide spectrum of subjects. Views expressed do not necessarily reflect the official views of the European Commission. Comments and enquiries should be addressed to: European Commission Directorate-General for Economic and Financial Affairs Publications B-1049 Brussels Belgium E-mail: mailto:[email protected] Legal notice Neither the European Commission nor any person acting on its behalf may be held responsible for the use which may be made of the information contained in this publication, or for any errors which, despite careful preparation and checking, may appear. This paper exists in English only and can be downloaded from the website ec.europa.eu/economy_finance/publications A great deal of additional information is available on the Internet. It can be accessed through the Europa server (ec.europa.eu ) KC-AH-13-152-EN-N ISBN 978-92-79-29355-9 doi: 10.2765/48332 © European Union, 2013 Reproduction is authorised provided the source is acknowledged.
European Commission
Directorate-General for Economic and Financial Affairs
The 2013 Stability and Convergence Programmes: An Overview
EUROPEAN ECONOMY Occasional Papers 152


EXECUTIVE SUMMARY
3
This note provides an overview of the 2013 Stability and Convergence Programmes (SCPs) in the context of the European Semester. Its focus is on the Member States' fiscal consolidation plans over 2012-2016. It serves as background for the examination of the SCPs against the requirements of the Stability and Growth Pact - both the corrective and the preventive arm – and the principles for fiscal exit adopted by the Council. It offers the opportunity for Member States to take an overall view of the fiscal plans, both at the EU or euro area level and at the Member States level.
In 2012 a strong fiscal retrenchment was implemented in the EU, with a reduction in the aggregate structural balance by more than 1pp for the second year in a row in difficult economic conditions, with stagnating growth in the EU and a negative one in the euro area. The differences between the adjustments in nominal balances and the structural ones are to a large extent due to weaker-than-expected growth and to the changes in the composition of growth and its revenue intensity, which is related to the on-going rebalancing and restructuring of many EU economies from internal to external growth drivers. The fiscal consolidation of 2012 has been revenue-based, despite the announcements of an expenditure-based consolidation in the 2012 plans.
The comparison of the 2013 SCPs with the Commission 2013 Spring forecast shows that the plans are broadly plausible for 2013, but risks increase in 2014. While part of the difference between the plans and the Commission forecast beyond 2013 can be attributed to the no-policy-change assumption underlying the Commission 2013 Spring forecast, a large part of the difference, at least in some Member States, stems from too optimistic assumptions concerning both GDP growth and its tax richness.
Overall, the plans presented in the 2013 SCPs show that consolidation is set to continue, although its pace is expected to decelerate over time. This pattern of consolidation is consistent with a gradual correction of excessive deficits and is the result of frontloaded consolidation at the EU and EA level which resulted in significant consolidation efforts undertaken over 2010-2012 in many Member States. Further consolidation, even if more gradual, is needed to progress on the path towards the medium-term objectives (MTOs).
In their programmes Member States plan a significant decline in general government deficits, which should be reduced below 3% of GDP already this year in the euro area and next year in the EU as a whole, and continue declining thereafter. These improvements in nominal government balances stem mainly from continuous underlying fiscal effort, as the economy is expected to be still weak this year and start improving only in 2014. The pattern of consolidation across Member States continues to be broadly adequately differentiated according to the fiscal space. In particular, large adjustments are planned in Member States where there is no fiscal space.
The adjustment planned for 2013 in the EU and in particular in the euro area takes place at the time of a still widening negative output gap and amounts to a broadly pro-cyclical fiscal stance. The planned fiscal effort is even higher when gauged by complementary measures of the fiscal stance. In particular, based on such a complementary indicator, the measured fiscal effort has the same sign but is larger than what stems from the change in the structural balance in Member States undergoing rebalancing of their economies. On the contrary – although to a lesser extent – the effort has the same sign but is lower for Member States with a wider fiscal space. Altogether this observation confirms the conclusion about the appropriateness of the differentiated nature of consolidation in the EU. The pro-cyclicality of the fiscal stance is expected to be reduced in 2014 when the output gap starts closing down and the structural adjustment decelerates.
The composition of consolidation is planned to shift from revenue-based in 2013 to expenditure-based thereafter. This should be interpreted with caution in view of last year's experience, when consolidation – initially planned to be expenditure-based – turned out to be revenue-based. While the planned revenue measures can be broadly regarded as growth-friendly, plans contain relatively large cuts in investment spending.

4
In spite of significant consolidation efforts so far, government debt is not yet on a downward path, and will continue increasing till 2013-14. Nevertheless, it is reassuring that this year's plan are the first vintage of the SCPs since the beginning of the crisis, which show declining debt within the programme horizon. After peaking in 2013-14 at somewhat below 90% of GDP in the EU and somewhat above this level in the euro area, debt ratios are projected to decrease over the rest of the programme period. The declining debt path is supported by improvements in primary balances, but high interest payments and low growth continue weighing on debt prospects in particular in some vulnerable Member States. Still, debt forecasts presented in the SCPs will ensure compliance with the debt rule.
The improvements in the fiscal position observed in 2012 and planned for the programme horizon in most Member States also improve debt sustainability across the EU. The number of countries at fiscal risk in the short term has greatly reduced from the beginning of the crisis. Similarly, in the medium-to-long term, the full implementation of the SCPs would reduce sustainability risks for almost all EU Member States, even though some more effort will be needed by many Member States to improve their sustainability risk position from medium to low sustainability risks.
Overall projections of headline and structural balances
2012 2013 2014 2015 2016
COM COM SCP COM SCP SCP SCP
General government balance EU -3.7 -3.3 -3.4 -3.2 -2.6 -2.0 -1.2
EA -3.7 -2.9 -2.8 -2.8 -2.0 -1.4 -0.8
Structural balance EU -2.7 -2.0 -1.9 -2.1 -1.5 -1.2 -0.8
EA -2.1 -1.4 -1.3 -1.5 -0.8 -0.6 -0.4

ACKNOWLEDGEMENTS
This paper was prepared in the Directorate-General of Economic and Financial Affairs under the direction of Marco Buti, Director-General, Servaas Deroose, Deputy Director-General, and Lucio Pench, Director for Fiscal Policy.
Stéphanie Riso was the coordinator of the paper. The main contributors were Alessandra Cepparulo, Per Eckefeld, Francisco de Castro, Angela d’Elia, Chris Frayne, Matteo Governatori, Ombeline Gras, Asa Johannesson Linden, Gilles Mourre, Stéphanie Riso, Etienne Sail, Matteo Salto, Salvatore Serravalle, Marcin Zogala. Elizabeth Jaffee provided layout and editing support. In addition, the report benefitted from comments and suggestions by Lucio Pench.
Comments would be gratefully received and should be sent, by mail or e-mail to:
Stéphanie Riso European Commission Directorate-General for Economic and Financial Affairs Directorate for Fiscal Policy Office CHAR 12-040 B-1049 Brussels e-mail: [email protected] or Matteo Salto European Commission Directorate-General for Economic and Financial Affairs Directorate for Fiscal Policy Office CHAR 12-103 B-1049 Brussels e-mail: [email protected]


CONTENTS
7
1. Introduction 11
2. 2012 at a glance 13
3. Macroeconomic Scenarios in the 2013 Update of the SCPs 17
4. Fiscal Consolidation 19
4.1. Size and time profile of consolidation 19
4.2. Composition of consolidation 20
4.3. Fiscal effort and the convergence towards the MTO 25
4.3.1. Fiscal adjustments over 2013 to 2016 25
4.3.2. On the path towards the medium-term budgetary objectives 27
4.3.3. How large is the Member States' fiscal effort? 29
4.4. Risks to SCPs' targets: a tentative assessment 31
5. Debt Implications 35
6. Short, Medium and Long-term Fiscal Sustainability 37
6.1. Short-term challenges: the S0 indicator - early detection of fiscal stress 37
6.2. Medium- to long-term challenges 38
6.2.1. The S1 indicator – debt compliance risk 38
6.2.2. The S2 indicator –ageing-induced fiscal risks 40
Annex 1. Projections from SCPs and the Commission's 2013 Spring forecast 45
Annex 2. Complementing the analysis of the structural balance 53
LIST OF TABLES 2.1. Annual real GDP growth (%) in the EU and the euro area, in 2012 15
2.2. Composition of consolidation in the EU and the euro area (changes of GDP ratios 2011 to
2012) 16
4.1. Fiscal adjustment for the EU: 2013 SCPs vs. Commission 2013 Spring forecast 22
4.2. Comparing the short-term elasticities underlying the SCP and the Commission 2013 Spring
forecast figures of 2014, with the standard OECD elasticities 32
6.1. Risk classification in the 2013 assessment round, COM 'no-policy-change' scenario 43
A1.1: Real GDP growth (%) 45
A1.2: Nominal GDP Growth (%) 46
A1.3: General government balance (% of GDP) 47
A1.4: General government total revenue (% of GDP) 48
8
A1.5: General government total expenditure (% of GDP) 49
A1.6: General government total debt (% of GDP) 50
A1.7: Output Gap (% of GDP) 51
A1.8: Structural balance (% of GDP) 52
LIST OF GRAPHS 2.1. Change in structural balance (pps of GDP) in EU Member States, 2012-2011 13
2.2. Nominal deficit (% of GDP) in EU Member States in 2012 14
2.3. Observed changes in the EU Member States government budget balance vs planned
changes: breakdown (pps of GDP) 15
2.4. Annual real GDP growth (%) in EU Member States in 2012 16
3.1. GDP growth forecast for 2013 and 2014 as presented in the 2013 updates of the SCPs and
the Commission 2013 Spring forecast 18
4.1. Time profile of fiscal consolidation: the change in nominal budget deficits in EU Member
States over 2010-12 and plans, as presented in 2013 updates of SCPs 19
4.2. Projected change in expenditure and revenue ratio (2012-2016, % GDP) 20
4.3. Planned changes in main types of expenditure (2012-2016, % GDP) 23
4.4. Planned changes in main types of revenue (% of GDP, 2012-2016) 24
4.5. The change in structural budget balances over 2010-12 (cumulative, notified) and plans
from 2013 to 2016 (as presented in 2013 SCPs) in the EU Member States 26
4.6. Planned changes in the structural balance between 2012 and 2016 and MTOs 28
4.7. General government deficit for 2014: decomposition of the gap between SCPs plans and
the Spring Commission forecast for EU Member States 32
4.8. Revenue growth projected in SCPs for 2014 compared to revenue estimates at unchanged
policies as presented in SCPs and to the Commission forecast 33
5.1. Changes in general government debt projected in SCPs 2012-2016 35
5.2. Contributions to the change in the debt-to GDP ratio between 2012 and 2016 36
6.1. The S0 indicator, 2009 and 2012 37
6.2. Medium term debt projections for the EU 39
6.3. S1 indicator (fiscal adjustment required until 2020 to reach a 60% public debt/GDP ratio by
2030, in per cent of GDP) 40
6.4. The S2 sustainability gap decomposed 41
6.5. The S2 sustainability gap: 'COM no-policy-change' and 'SCP' scenarios 42
A2.1. EU Member States: DEB and changes in the structural balance, based on 2013 update of
the SCPs 54
A2.2. Differences between the DEB and the changes in structural balance based on the 2013
updates of the SCPs 57

9
LIST OF BOXES 4.1. TSCG and the calendar of convergence towards the MTO 28
4.2. Long- and short-term fiscal elasticities 30

1. INTRODUCTION
11
This note provides an overview of the 2013 updates of Stability and Convergence Programmes (SCPs) submitted by the Member States.(1) The note aims at offering a global, aggregated view of fiscal policy plans in the Union and the euro area as a whole.
In its conclusions of 15 March 2013, the Council indicated that fiscal consolidation has to be pursued and should be differentiated, growth-friendly, in line with the priorities set out in the Annual Growth Survey, and based on an appropriate mix of expenditure and revenue measures at the level of the Member States. Together with the SGP requirements, these principles represent the basis for the assessments of the SCPs. In the context of the European Semester, the Council recommendations are expected to feed into the national budgets for 2014. For these reasons plans for 2014 are given larger attention in the present note.
The note consists of five sections. Section 2 examines the implementation of SCPs in 2012 as requested by the members of the Economic and Financial Committee. Section 3 presents the macroeconomic scenarios with particular attention given to the gap between the SCPs projections and the Commission forecast. Section 4 highlights the fiscal consolidation strategy (pace, time profile and composition of the fiscal adjustment) in nominal and structural terms, the Member States' new medium-term budgetary objectives (MTOs) and the calendar of convergence towards them. Moreover, Section 4 briefly discusses the fiscal stance by complementing the structural balance with information based on the measures taken by the Member States. The risks present in the SCPs plans are then assessed, by focussing on risks on projections of macroeconomic variables and related revenue projections. Section 5 contains an assessment of short-term implications of the macroeconomic scenarios and the consolidation plans on debt dynamics. Section 6 looks at the longer term implications of the plans for fiscal sustainability, notably taking into account the projected changes in age-related expenditure. Annex I provides tables with data from both the SCPs and the Commission 2013 Spring forecast. Annex II further discusses the fiscal stance and the differences between the change in the structural balance and the indicator used as a complementary tool for the assessment of fiscal stance.
(1) The analysis is built on data reported by Member States in their 2013 Stability and Convergence Programmes, unless otherwise
specified. As Cyprus and Greece did not submit their programmes, they are not part of the analysis except for 2012 and are not accounted for in the weighted averages. Belgium and the UK have not submitted all tables required by the Code of Conduct. Slovenia sent its programme after the 30 April deadline. Bulgaria, the Czech Republic, Denmark, Estonia, France, Ireland and Romania provided small corrections after the deadline. The cut-off date for this note is 17 May 2013 close of business. The data for the UK correspond to fiscal years and, when relevant, other (Commission) data for the UK are adjusted to be comparable. Structural balances are recalculated, from programmes' data, according to the commonly agreed methodology for the cyclical adjustment of budget balances; small differences for 2012 with respect to Commission 2013 Spring forecast data may be explained by different accounting of one-off and temporary measures.


2. 2012 AT A GLANCE
13
As background for the discussion on the 2013 updates of the SCPs, it is useful to compare last year's SCPs' objectives with actual developments. This Section finds that despite sizeable improvements in the government structural balances most of the Member States did not achieve the planned nominal fiscal targets. The reasons behind this relate to weaker-than-expected growth in 2012, overestimation of tax elasticities, and smaller improvements in structural balances than projected. Finally, the analysis shows that the actual composition of the consolidation implemented in 2012 is more revenue based than the composition planned in the 2012 SCPs.
After a sizeable reduction in government structural deficits achieved in 2011, most Member States further improved their positions, through significant improvements of their structural balances (see Graph 2.1), despite the protraction of the cyclical slowdown throughout 2012. In the EU as a whole the structural budget balance improved by 1.1pps in 2012, while in the euro area it improved by 1.5pps. On the other hand, the structural balance deteriorated in some Member States outside the EDP (Finland, Malta and Luxembourg), while among EDP Member States the structural balance worsened in Cyprus.
Graph 2.1: Change in structural balance (pps of GDP) in EU Member States, 2012-2011
The graph plots the change in the structural balance according to the Commission 2013 Spring forecast. UK figures have been computed according to the financial year.
Still, the average nominal deficits came in at a higher level than planned in the 2012 SCPs: in the EU as a whole the nominal deficit stood at 3.7% of GDP (down from 4.3% in 2011), whereas it was planned be at 3.3%; in the euro area, it stood at 3.7% of GDP (down from 4.2% in 2011), whereas it was planned be at 2.9%.
Across Member States (see Graph 2.2), the nominal deficit (in % of GDP) came in much worse than expected in Spain, followed by Cyprus and Portugal. Belgium, the Czech Republic, Italy, Malta and Poland missed their deficit targets by more than one percentage point of GDP. On the other hand, Estonia and Germany recorded markedly better than planned government budget balances, which in the case of Germany materialised in a surplus (0.2% of GDP).
Graph 2.3 looks at the breakdown of the difference between planned and observed nominal balance changes, specifically between one-offs, cyclical and (residual) structural component changes. However, it should be recalled that the difference between planned and observed change in the structural balance is not only due to discretionary fiscal policy, but also to forecast errors linked to revisions in potential
European Commission The 2013 Stability and Convergence Programmes: An Overview
14
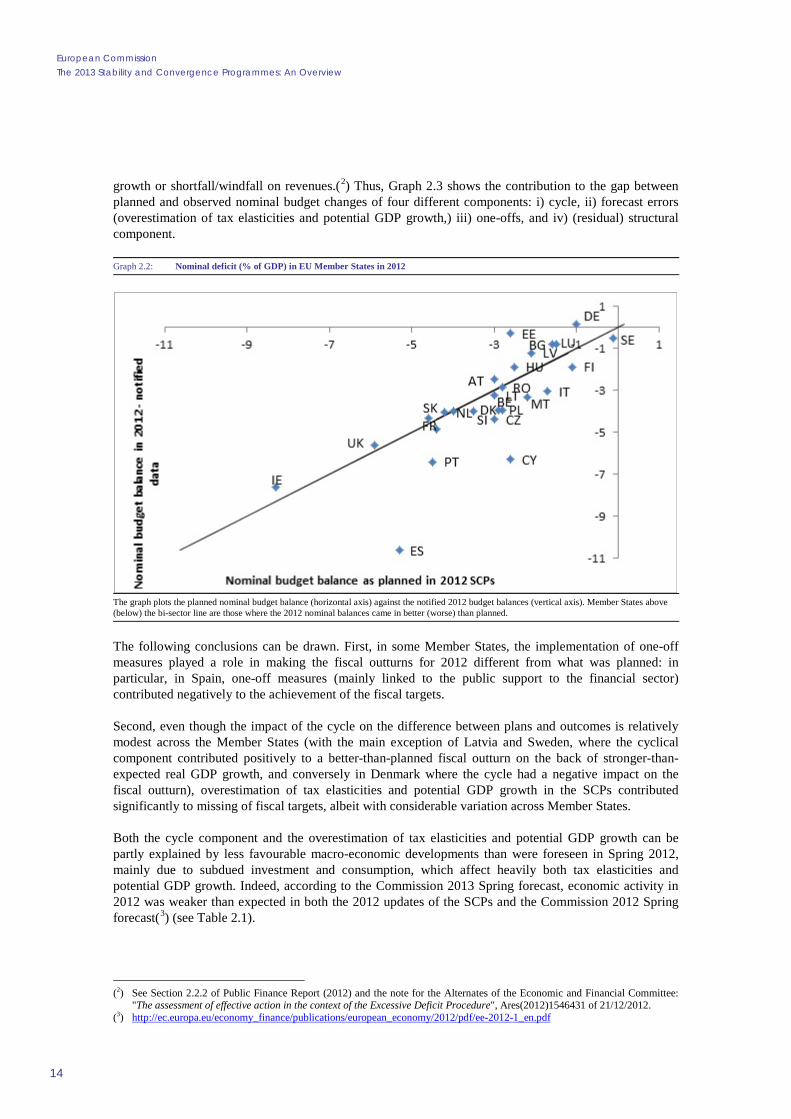
growth or shortfall/windfall on revenues.(2) Thus, Graph 2.3 shows the contribution to the gap between planned and observed nominal budget changes of four different components: i) cycle, ii) forecast errors (overestimation of tax elasticities and potential GDP growth,) iii) one-offs, and iv) (residual) structural component.
Graph 2.2: Nominal deficit (% of GDP) in EU Member States in 2012
The graph plots the planned nominal budget balance (horizontal axis) against the notified 2012 budget balances (vertical axis). Member States above (below) the bi-sector line are those where the 2012 nominal balances came in better (worse) than planned.
The following conclusions can be drawn. First, in some Member States, the implementation of one-off measures played a role in making the fiscal outturns for 2012 different from what was planned: in particular, in Spain, one-off measures (mainly linked to the public support to the financial sector) contributed negatively to the achievement of the fiscal targets.
Second, even though the impact of the cycle on the difference between plans and outcomes is relatively modest across the Member States (with the main exception of Latvia and Sweden, where the cyclical component contributed positively to a better-than-planned fiscal outturn on the back of stronger-than-expected real GDP growth, and conversely in Denmark where the cycle had a negative impact on the fiscal outturn), overestimation of tax elasticities and potential GDP growth in the SCPs contributed significantly to missing of fiscal targets, albeit with considerable variation across Member States.
Both the cycle component and the overestimation of tax elasticities and potential GDP growth can be partly explained by less favourable macro-economic developments than were foreseen in Spring 2012, mainly due to subdued investment and consumption, which affect heavily both tax elasticities and potential GDP growth. Indeed, according to the Commission 2013 Spring forecast, economic activity in 2012 was weaker than expected in both the 2012 updates of the SCPs and the Commission 2012 Spring forecast(3) (see Table 2.1).
(2) See Section 2.2.2 of Public Finance Report (2012) and the note for the Alternates of the Economic and Financial Committee:
"The assessment of effective action in the context of the Excessive Deficit Procedure", Ares(2012)1546431 of 21/12/2012. (3) http://ec.europa.eu/economy_finance/publications/european_economy/2012/pdf/ee-2012-1_en.pdf

2. 2012 at a glance
15
Graph 2.3: Observed changes in the EU Member States government budget balance vs planned changes: breakdown (pps of GDP)
The forecast error consists of errors on potential growth and revenue elasticities estimates of spring 2012. The impact of the potential growth error is estimated by multiplying the ratio of expenditures to potential GDP of the previous year by the difference between the outturn and the projected potential growth. The impact of elasticities error is estimated by multiplying the difference between the observed short-term elasticities and the elasticities of the Commission 2012 Spring forecast – after netting out discretionary measures from current revenues – by the revenues as a share of potential GDP.
Table 2.1: Annual real GDP growth (%) in the EU and the euro area, in 2012
2012 SCPs planned COM 2012 spring forecast
COM 2013 spring forecast
EU 0.2 0.0 -0.2
EA -0.1 -0.3 -0.6
Across Member States (see Graph 2.4), economic activity was much weaker than forecast in the 2012 SCPs in Cyprus, Hungary, Denmark, the Czech Republic, Slovenia and Italy; on the other hand, GDP growth surprised markedly on the positive side in Latvia, Lithuania and Estonia.
The residual structural gap is to be imputed to discretionary fiscal policy, which in some Member States (the United Kingdom, Slovenia, Malta, Cyprus and the Netherlands) has had a sizeable negative contribution.(4)
Finally, concerning the composition of consolidation, while it was set out to be broadly balanced between revenues and expenditures in both the EU as a whole and in the euro area, the observed adjustment was driven much more by increasing revenues, than by cuts in expenditure (which on the contrary increased.)
(4) As Slovenia and the United Kingdom did not present one-off figures in the 2012 updates of SCPs, they were assumed to be
equal to zero. This may magnify the size of the residual structural component.

European Commission The 2013 Stability and Convergence Programmes: An Overview
16
Graph 2.4: Annual real GDP growth (%) in EU Member States in 2012
The graph plots the 2012 planned GDP growth (horizontal axis) against 2012 actual GDP growth (vertical axis). Member States above (below) the bi-sector line are those where the 2012 real GDP growth came in better (worse) than planned.
Table 2.2: Composition of consolidation in the EU and the euro area (changes of GDP ratios 2011 to 2012)
2012 SCPs planned 2012 notifiedRevenues 0.4 0.6
Expenditures -0.4 0.3Revenues 0.4 0.9
Expenditures -0.2 0.4
EU
EA
3. MACROECONOMIC SCENARIOS IN THE 2013 UPDATE OF THE SCPS
17
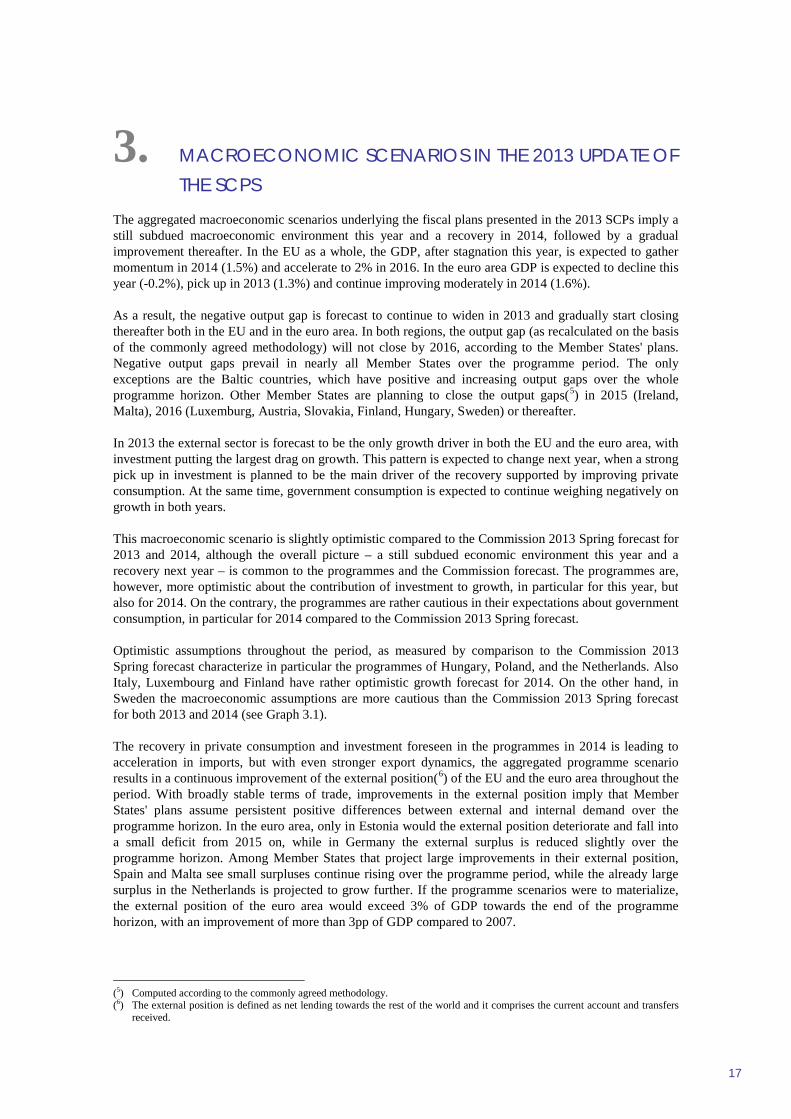
The aggregated macroeconomic scenarios underlying the fiscal plans presented in the 2013 SCPs imply a still subdued macroeconomic environment this year and a recovery in 2014, followed by a gradual improvement thereafter. In the EU as a whole, the GDP, after stagnation this year, is expected to gather momentum in 2014 (1.5%) and accelerate to 2% in 2016. In the euro area GDP is expected to decline this year (-0.2%), pick up in 2013 (1.3%) and continue improving moderately in 2014 (1.6%).
As a result, the negative output gap is forecast to continue to widen in 2013 and gradually start closing thereafter both in the EU and in the euro area. In both regions, the output gap (as recalculated on the basis of the commonly agreed methodology) will not close by 2016, according to the Member States' plans. Negative output gaps prevail in nearly all Member States over the programme period. The only exceptions are the Baltic countries, which have positive and increasing output gaps over the whole programme horizon. Other Member States are planning to close the output gaps(5) in 2015 (Ireland, Malta), 2016 (Luxemburg, Austria, Slovakia, Finland, Hungary, Sweden) or thereafter.
In 2013 the external sector is forecast to be the only growth driver in both the EU and the euro area, with investment putting the largest drag on growth. This pattern is expected to change next year, when a strong pick up in investment is planned to be the main driver of the recovery supported by improving private consumption. At the same time, government consumption is expected to continue weighing negatively on growth in both years.
This macroeconomic scenario is slightly optimistic compared to the Commission 2013 Spring forecast for 2013 and 2014, although the overall picture – a still subdued economic environment this year and a recovery next year – is common to the programmes and the Commission forecast. The programmes are, however, more optimistic about the contribution of investment to growth, in particular for this year, but also for 2014. On the contrary, the programmes are rather cautious in their expectations about government consumption, in particular for 2014 compared to the Commission 2013 Spring forecast.
Optimistic assumptions throughout the period, as measured by comparison to the Commission 2013 Spring forecast characterize in particular the programmes of Hungary, Poland, and the Netherlands. Also Italy, Luxembourg and Finland have rather optimistic growth forecast for 2014. On the other hand, in Sweden the macroeconomic assumptions are more cautious than the Commission 2013 Spring forecast for both 2013 and 2014 (see Graph 3.1).
The recovery in private consumption and investment foreseen in the programmes in 2014 is leading to acceleration in imports, but with even stronger export dynamics, the aggregated programme scenario results in a continuous improvement of the external position(6) of the EU and the euro area throughout the period. With broadly stable terms of trade, improvements in the external position imply that Member States' plans assume persistent positive differences between external and internal demand over the programme horizon. In the euro area, only in Estonia would the external position deteriorate and fall into a small deficit from 2015 on, while in Germany the external surplus is reduced slightly over the programme horizon. Among Member States that project large improvements in their external position, Spain and Malta see small surpluses continue rising over the programme period, while the already large surplus in the Netherlands is projected to grow further. If the programme scenarios were to materialize, the external position of the euro area would exceed 3% of GDP towards the end of the programme horizon, with an improvement of more than 3pp of GDP compared to 2007.
(5) Computed according to the commonly agreed methodology. (6) The external position is defined as net lending towards the rest of the world and it comprises the current account and transfers
received.
European Commission The 2013 Stability and Convergence Programmes: An Overview
18
Graph 3.1: GDP growth forecast for 2013 and 2014 as presented in the 2013 updates of the SCPs and the Commission 2013 Spring forecast
The graph plots the 2013 and 2014 planned GDP growth (vertical axis) against the GDP growth for 2013 and 2014 of the Commission 2013 Spring forecast (vertical axis). Member States below (above) the bi-sector line are those where the real GDP growth is projected to be worse (better) in SCP than forecast by the Commission.

4. FISCAL CONSOLIDATION
19
4.1. SIZE AND TIME PROFILE OF CONSOLIDATION
The plans contained in the SCPs show Member States continuing to consolidate with aggregate deficits falling every year, albeit at a slightly lower annual pace than in recent years. The EU average deficit should fall roughly by around 2½pp of GDP from its 2012 level to reach 1.2% in 2016, coming in below 3% of GDP in 2014 for the first time since 2008. At euro area level, the deficit should fall from 3.6% of GDP in 2012 to 0.8% in 2016, coming in below 3% already this year.
The continuing consolidation planned means that while in 2012 fourteen(7) of the Member States for which data is available had deficits above 3% of GDP, six of these Member States(8) plan for their deficits to fall below 3% in 2013. By 2016, only the United Kingdom is projecting a nominal deficit above the 3% Treaty reference value. The lower annual pace of deficit reduction for future years reflects the fact that more and more countries are exiting the EDP and moving over the preventive arm of the SGP.
Graph 4.1: Time profile of fiscal consolidation: the change in nominal budget deficits in EU Member States over 2010-12 and plans, as presented in 2013 updates of SCPs
The graph decomposes the change in the deficit-to-GDP ratio for each county over five time periods
Graph 4.1 shows the evolution in nominal balances from 2010 to 2016. It shows that on aggregate large reductions in deficits have already been undertaken with the deficits falling by over 1% of GDP per year between 2010 and 2012 in both the EU and euro area. Hence around half of the planned EU and euro area deficit reduction has already occurred, with the remaining half being spread over twice as many years.
(7) Belgium, the Czech Republic, Denmark, Ireland, Spain, France, Lithuania, Malta, the Netherlands, Poland, Portugal, Slovenia,
Slovakia, United Kingdom. (8) Belgium, the Czech Republic, Denmark, Lithuania, Malta, Slovakia.
European Commission The 2013 Stability and Convergence Programmes: An Overview
20
The improvements in the balances pencilled in for 2013-2016 are based on slightly easier economic conditions (see Section 3) and should therefore be delivered with a lower burden of measures. Section 4.3 and Annex II consider this in more detail.
The pattern of the closure of the deficits over time is broadly differentiated according to the different circumstances that Member States have found themselves in. Countries with the largest deficits in 2010 and the least fiscal space, are typically those that have already undertaken the greatest reduction of their deficit. On the other hand, countries with more fiscal space typically had both smaller reductions to make and less pressure to deliver them quickly.
4.2. COMPOSITION OF CONSOLIDATION
Since the beginning of the current consolidation strategy, the EU has emphasised the need for a differentiated and growth-friendly consolidation across Member States. This includes an appropriate composition of consolidation in terms of both the overall expenditure-revenue mix (e.g. for Member States with high shares of public expenditure and revenues, a fiscal consolidation based on expenditure cuts rather than tax increases is considered more supportive to growth in the long-run) and the selection of types of spending and taxes that are more supportive to growth and social fairness (see Annual Growth Survey 2013.)(9)
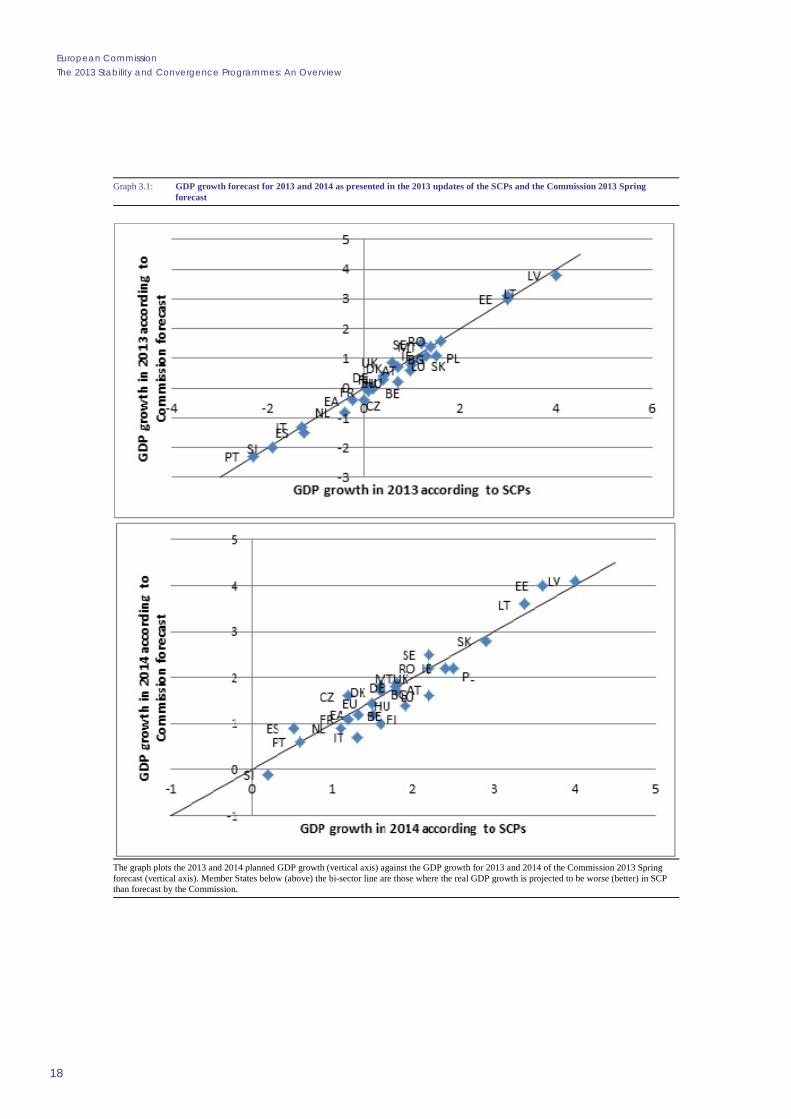
Graph 4.2: Projected change in expenditure and revenue ratio (2012-2016, % GDP)
The graph represents the planned changes in revenue and expenditure ratios (lhs) between 2012 and 2016 against the starting GDP ratios of expenditure and revenue ratios (rhs) as notified.
On average, from 2013 to 2016 the consolidations set out in the SCPs are almost entirely expenditure-based for the EU and primarily expenditure-based for the euro area.
(9) Available online at http://ec.europa.eu/europe2020/making-it-happen/annual-growth-surveys/index_en.htm
4. Fiscal Consolidation
21
Graph 4.2 presents the 2012 starting level for revenue and expenditure (as percentages of GDP) as well as the change for the two variables by 2016, as set out in the SCPs. It shows that, on average, general government expenditure is forecast to decrease by around 2 ½ pp of GDP in both the EU and the euro area (from 48.5% in 2012 to 46.1% of GDP in 2016 and from 49.8% in 2012 to 47.5% in 2016, respectively). The changes in the revenue ratios are overall smaller, with a forecasted increase of 0.5pp in the euro area (from 46.2% of GDP in 2012 to 46.7% in 2016), and of 0.2pp in the EU (from 44.7% of GDP to 44.9%). The change in the expenditure ratio corresponds to almost the entire reduction in the deficit in the EU and to 4/5 of the overall reduction planned in the euro area.
The expenditure-to-GDP ratio is set to fall between 2012 and 2016 in all Member States except Bulgaria and Luxembourg. Denmark, Estonia, Ireland, Spain, Latvia, Lithuania, Hungary, Portugal and Poland are forecasting reductions in expenditure of over 4pp of GDP. While almost all Member States are reducing expenditure, fifteen Member States are foreseeing an increase in the revenue-to-GDP ratio over the 2012-2016 programming period. Particularly Belgium, France, Malta and Finland are projecting an increase in the revenue ratio of 1pp or more. In contrast, ten Member States expect to reduce revenue over the period, some even quite substantially. Estonia, Latvia and Hungary project to reduce their revenue ratios by more than 3pp over the period, while the other Member States in this group plan a less drastic reduction of revenues.
Overall, the fiscal consolidation foreseen after 2013 – or change in budget composition for Member States which are not consolidating – is entirely expenditure-based in the Czech Republic, Denmark, Estonia, Germany, Lithuania, Latvia, Hungary, Poland, Slovakia and Sweden, while almost entirely expenditure-based in Ireland, Italy, Spain, Austria and Portugal. It is relatively evenly balanced between spending cuts and revenue increases in France, the Netherlands, Romania and, to a lesser extent, Belgium, while projected changes in deficit are primarily revenue-based only in Finland and Malta.
The fact that at EU level the planned fiscal consolidation is largely expenditure-based should reduce adverse effects on medium-term growth, given the high starting level of expenditure and revenue ratios, especially if the more growth-friendly spending items are preserved. However, the same conclusion does not necessarily hold for individual Member States since (i) expenditure and revenue ratios vary substantially by Member State, (ii) across Member States planned changes in expenditures and revenues are only weakly correlated with starting expenditure and revenue ratios, respectively (i.e. Member States cutting expenditures and revenues are not necessarily those with, respectively, higher expenditure and revenue ratios).
Table 4.1 displays the annual changes in the deficit, expenditure and revenue ratios at the aggregate EU level as projected in the SCPs between 2013 and 2016. They are compared with the corresponding changes according to the Commission 2013 Spring forecast for the years 2013 and 2014. The improvement in the headline balance according to the Commission forecast marginally exceeds that projected by SCPs for 2013, whereas for 2014 the improvement in the primary balance is much larger according to SCPs than in the Commission 2013 Spring forecast. This is unsurprising since 2014 figures in the Commission forecast are based on a no-policy change scenario.
Table 4.1 also shows the composition of the planned adjustment (expenditures vs. revenues). For 2013, the SCP adjustment is fully revenue-based, while the Commission forecast envisages a consolidation based for around 4/5 on revenues. Conversely, for 2014, 2015 and 2016, SCP consolidation is entirely expenditure-based, with revenues even decreasing (as a share of GDP) in 2015 and 2016. Overall, the envisaged adjustment appears to be front-loaded on the revenue side (albeit a small share of the overall adjustment) and slightly back-loaded on the expenditure side, raising the need to closely monitor the implementation of planned expenditure cuts by Member States over the programme horizon.

European Commission The 2013 Stability and Convergence Programmes: An Overview
22
Table 4.1: Fiscal adjustment for the EU: 2013 SCPs vs. Commission 2013 Spring forecast
It should be noted that, in general, a given expenditure path will result in different developments in the expenditure ratio, depending on GDP growth. Favourable assumptions about medium-term growth may therefore overstate the reduction in the expenditure ratio which will eventually materialise.
The Stability and Convergence Programmes also provide information on the envisaged composition of fiscal consolidation(10) by main type (or economic function) of government expenditure (see Graph 4.3.)(11) This allows a descriptive assessment of whether fiscal policy plans over 2012-2016 are growth-friendly, i.e. avoid expenditure cuts in areas that are expected to provide a greater contribution to economic growth. This analysis is subject to a number of caveats e.g. the selection of growth-friendly types of spending is not fully clear-cut and spending levels are not informative of its efficiency, (for a discussion see Commission report "The quality of public expenditure in the EU").(12) Moreover it does not consider any distributional consequences of the composition of consolidation.
Among the categories shown in Graph 4.3, capital spending cuts are most likely to be detrimental for economic recovery if investments are made in an efficient way. The figures show that a majority of Member States (nineteen out of twenty-five) plan to reduce government investment (as a share of GDP), albeit in a few cases by a small amount, with the exceptions of Bulgaria (which posts a remarkable increase by more than 2% of GDP), Romania (+1% of GDP), Slovenia, the Czech Republic, Malta and the United Kingdom. Estonia, Latvia, Lithuania, Hungary, Poland and Slovakia plan the highest cuts (by 1-2% of GDP with Estonia planning a cut of more than 3%). The widespread tendency to further cut capital expenditure (on top of cuts already undertaken in recent years) is all the more worrisome considering that this item accounts for a relatively low share of government spending (2.2% of GDP in the EU in 2012 according to SCPs, exceeding 4% only in Estonia, Poland and Romania).
On the other hand, reducing the wage bill can be connected to improvements in public sector efficiency. Cuts in this item are envisaged in a large majority of Member States (twenty-two out of twenty-five), the largest (by 1% of GDP or more) planned in Estonia, Ireland, Spain, Italy, Latvia, the Netherlands, Poland, Portugal, Slovenia and Slovakia. An increase in the spending on employee compensation is foreseen only in Luxembourg.
A reduction in the expenditure on social payments is envisaged in around half of Member States (thirteen out of twenty-five), although given the automatic stabilisers nature of some of this spending, coupled with current assumptions of gradual economic recovery over the programme horizon, this should at least partly be due to cyclical effects. Disentangling the changes that are due to actual discretionary cuts is highly complex and goes beyond the scope of this note, although it would appear that Member States envisaging
(10) Or overall changes in spending levels, for Member States which are not consolidating. (11) Data on intermediate consumption and compensation of employees are missing for Belgium; data on social payments,
intermediate consumption and compensation of employees are missing for the United Kingdom. (12) European Economy. Occasional Paper 125 – December 2012. http://ec.europa.eu/economy_finance/publications/occasional_paper/2012/pdf/ocp125_en.pdf .
2015 2016SCP planned Δ
EC forecastΔ
SCP planned Δ
EC forecastΔ
SCP planned Δ
SCP planned Δ
Revenues 0.4 0.7 0.0 -0.4 -0.2 0.0Expenditure 0.0 -0.2 -0.8 -0.5 -0.8 -0.8Government balance 0.4 0.4 0.8 0.2 0.6 0.8
2013 2014

4. Fiscal Consolidation
23
Graph 4.3: Planned changes in main types of expenditure (2012-2016, % GDP)
The graph decomposes the planned changes in the expenditure ratios showing the contributions of the main components represented by the different shading.
the greatest reductions are also those undertaking the largest discretionary cuts. The largest reductions are foreseen in Ireland (-2.4% of GDP) and Lithuania (-1.7%), followed by Latvia, Hungary, Slovakia, Sweden, Romania, Poland and Portugal (from 0.5 to 1% of GDP). Six Member States envisage a (slight) increase of spending in this area, i.e. Luxembourg, Finland, and the Netherlands and, to a lesser extent, Bulgaria, the Czech Republic and Italy, while social payments are projected to remain overall stable in Belgium, Denmark, Germany, France and Slovenia. It should be borne in mind that social payments are on average the biggest single spending item across the EU (around 23% of GDP for the EU in 2012, based on SCP data, ranging from 10% in Latvia to 26% in France).
Intermediate consumption is envisaged to be reduced in the majority of Member States (nineteen out of twenty-five), with the largest cuts planned in Latvia, Hungary, Spain, the Netherlands, Poland and Sweden (by close to 1% of GDP or higher). Conversely, an increase is foreseen only in Slovakia and Finland. Cuts in subsidies, albeit a rather small item within total public spending (1.2% of GDP in EU27 in 2012,(13) should not be overly detrimental to growth, given the availability of alternative tools – possibly more efficient - to provide support to ailing firms or sectors. Given small starting levels, envisaged changes are often minor (no more than 0.1% of GDP) except in Belgium, Ireland, Hungary, the Netherlands, Slovenia and Slovakia, where cuts by 0.2-0.4% of GDP are envisaged.
Overall a number of tentative conclusions can be drawn. However these conclusions have to be taken with the caveat that interpretations in terms of growth-friendliness of expenditure developments are difficult to be made at a high level of generality(14) and that a finer analysis is not always possible due to data limitations (SCPs do not provide functional (COFOG) breakdown of spending, including categories which should be prioritised according to the 2013 Annual Growth Survey).(15)
At the aggregate EU level two main developments are observed; (i) a generalised reduction of public investment, running against the Commission and Council recommendations to preserve this type of spending amid consolidations; and (ii) a generalised reduction in compensation of employees and intermediate consumption, which is often considered by the literature as growth-friendly over the medium
(13) With the highest figures in Austria (3.5%), Belgium (2.7) and Denmark (2.6). (14) Any type of spending within large categories can contain items that contribute to medium-term growth at least indirectly, for
example unemployment benefits with in-built job search incentives and training programmes within social protection expenditure.
(15) These are education, research and innovation.
European Commission The 2013 Stability and Convergence Programmes: An Overview
24
term. Therefore, even based on broad spending categories, no firm general conclusion can be drawn on whether the spending composition in the EU is to become more growth-friendly or less based on current SCP plans.
Nonetheless, trends in investment signal that Members States on average pay insufficient attention to the need to prioritise growth-friendly spending. Developments in social payments are more mixed, in line with the need to reconcile fiscal consolidation targets with coping with the distributional consequences of the economic and financial crisis.
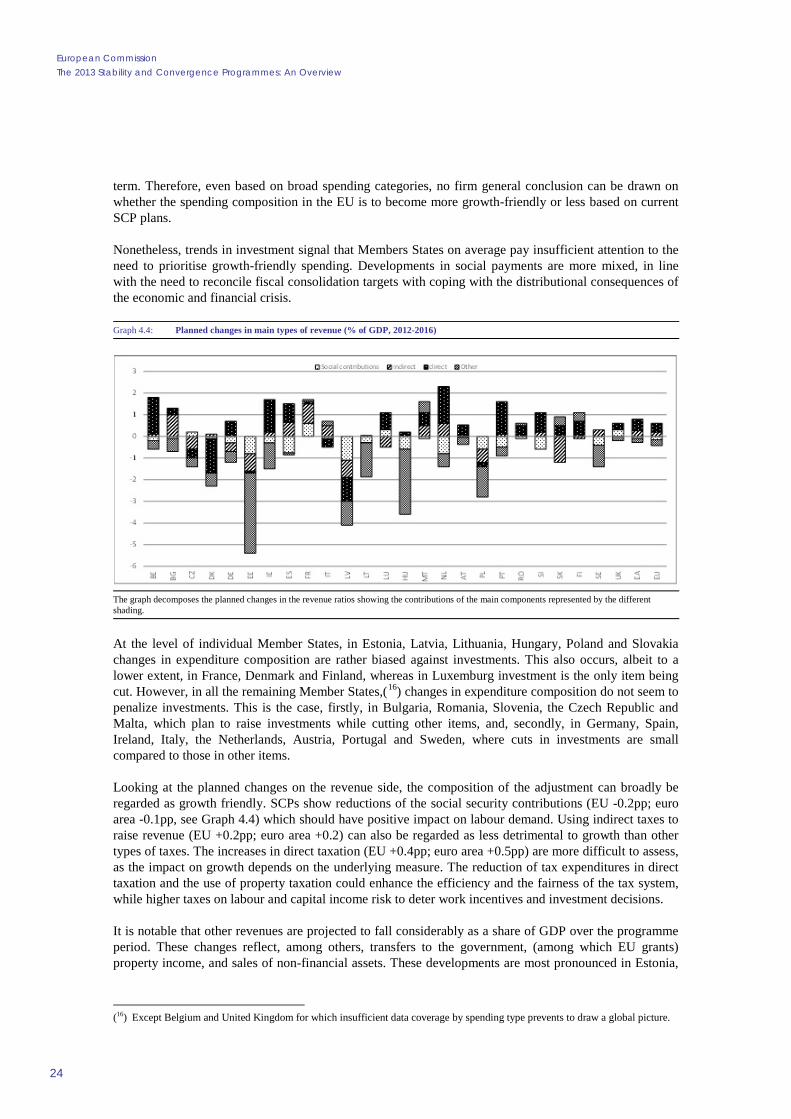
Graph 4.4: Planned changes in main types of revenue (% of GDP, 2012-2016)
The graph decomposes the planned changes in the revenue ratios showing the contributions of the main components represented by the different shading.
At the level of individual Member States, in Estonia, Latvia, Lithuania, Hungary, Poland and Slovakia changes in expenditure composition are rather biased against investments. This also occurs, albeit to a lower extent, in France, Denmark and Finland, whereas in Luxemburg investment is the only item being cut. However, in all the remaining Member States,(16) changes in expenditure composition do not seem to penalize investments. This is the case, firstly, in Bulgaria, Romania, Slovenia, the Czech Republic and Malta, which plan to raise investments while cutting other items, and, secondly, in Germany, Spain, Ireland, Italy, the Netherlands, Austria, Portugal and Sweden, where cuts in investments are small compared to those in other items.
Looking at the planned changes on the revenue side, the composition of the adjustment can broadly be regarded as growth friendly. SCPs show reductions of the social security contributions (EU -0.2pp; euro area -0.1pp, see Graph 4.4) which should have positive impact on labour demand. Using indirect taxes to raise revenue (EU +0.2pp; euro area +0.2) can also be regarded as less detrimental to growth than other types of taxes. The increases in direct taxation (EU +0.4pp; euro area +0.5pp) are more difficult to assess, as the impact on growth depends on the underlying measure. The reduction of tax expenditures in direct taxation and the use of property taxation could enhance the efficiency and the fairness of the tax system, while higher taxes on labour and capital income risk to deter work incentives and investment decisions.
It is notable that other revenues are projected to fall considerably as a share of GDP over the programme period. These changes reflect, among others, transfers to the government, (among which EU grants) property income, and sales of non-financial assets. These developments are most pronounced in Estonia,
(16) Except Belgium and United Kingdom for which insufficient data coverage by spending type prevents to draw a global picture.
4. Fiscal Consolidation
25
Lithuania and Hungary. Overall the tax-to-GDP-ratio is increasing both at the EU (0.4pp) and the euro area (0.6pp) level.
Looking at country-specific developments, several Member States foresee rather substantial increases in direct taxation, i.e. taxes on income and wealth over the period. This trend is particularly noticeable for Belgium, Ireland, the Netherlands and Portugal, which all project an increase of more than 1pp over the programme horizon. Twelve Member States project smaller increases. These increases in most cases aregradual throughout the whole programme period. Whether these projections can be considered as more growth-friendly or less would depend on the underlying measures. The information in the SCPs points at both an increased tax burden on labour and personal capital income, which is achieved both through higher rates or direct levies and reduced tax expenditures (e.g. reduced tax allowances, tax credits, tax exemptions, and deferrals). In parallel, the taxation of corporate income is being reduced in a few Member States and tax incentives are introduced to support investments, research and innovation.
Indirect taxation is also increasing slightly in the programmes, with ten Member States projecting an increase and eight Member States a reduction. In the aggregate, the indirect tax ratio increases in 2013, while remaining stable over the subsequent years. The SCPs indicate that this mostly reflects changes in VAT and various excise duties, in particular on energy and other environment-related taxes.
Concerning social security contributions (SSC), there appears to be a trend to reduce this revenue category. Eighteen Member States forecast reduced revenues, while only four Member States record increasing revenues over the 2012-2016 period. Estonia, Spain, Latvia and the Netherlands expect SSC revenues to fall by 0.8pp of GDP or more over the whole period, while only France reports a significant increase (0.6pp of GDP.) These revenue developments are likely to reflect policy measures that aim to support labour demand through reducing wage costs.
4.3. FISCAL EFFORT AND THE CONVERGENCE TOWARDS THE MTO
Over the SCPs horizon, the Member States generally plan continuous consolidation until the achievement of their medium-term budgetary objective (MTO). In order to provide a better understanding of the adjustment paths presented in Member States’ plans, the following sub-section starts with the general picture given by the planned changes in the structural balance, before introducing a measurement of the discretionary fiscal effort based on the expenditure benchmark.
4.3.1. Fiscal adjustments over 2013 to 2016
Over the last two years structural balances in the EU and the euro area have undergone significant adjustments (+2.1pp and 2.4 pp of GDP in 2011 and 2012 respectively). According to the SCPs, structural balances would continue to improve, though at a relatively more moderate pace in 2013 and 2014, followed by a further slowdown of the pace of consolidation in 2015 and 2016. Considering the overall adjustment period from 2010, when the Member States had been recommended to start consolidation under the fiscal exit strategy, until the end of the programmes period (2016) about three quarters of the cumulative improvement would have taken place by the end of 2013 (3.0 and 3.2 respectively in the EU and in the euro area out of 4.1pp of GDP of total adjustment in both cases,), thus indicating that the adjustment has been relatively frontloaded, in particular in the euro area. The cumulative changes in the structural balance of the general government over 2010 to 2016 are presented in Graph 4.5.
In 2013, the SCPs projection of a structural improvement of 0.5pp of GDP in the EU is more conservative than the Commission 2013 Spring forecast, according to which it should reach 0.8pp, in particular given that SCPs may take into account additional measures on top of those already included in the forecast. However, the main difference comes from a base effect, as the SCPs on average start from structural

European Commission The 2013 Stability and Convergence Programmes: An Overview
26
balances in 2012 relatively higher than those of the forecast,(17) thus allowing a lower effort to target the same end point for 2013. For the euro area, with a similar starting level, the adjustments planned, by 0.8pp of GDP, exactly match those forecast by the Commission services.
Graph 4.5: The change in structural budget balances over 2010-12 (cumulative, notified) and plans from 2013 to 2016 (as presented in 2013 SCPs) in the EU Member States
This graph presents the 2012-2010 structural effort achieved by Member States based on the 2010 estimate of the structural balance by the Commission 2013 Spring forecast and the (recalculated) 2012 estimate presented by the Member States in 2013 SCPs. Starting from 2012, structural efforts are directly reported from the SCPs, using the commonly agreed methodology to recalculate structural balances.
It needs to be noted, though, that the improvements foreseen by the 2013 SCPs, while remaining significant, have been somewhat scaled down compared to those announced in the 2012 SCPs, according to which structural balances in 2013 were supposed to improve by respectively ¾ and about 1pp in the EU and in the euro area (against 0.5 and 0.8pp of GDP in current plans). The Member States have downsized the planned adjustments for 2013, probably in the view of continuously less favourable macroeconomic conditions than forecast over the past years. Indeed, the negative output gap,(18) in both the EU and the euro area, instead of slowly shrinking as envisaged in 2012 SCPs, is significantly widening in 2013. The combination of a still significant structural adjustment and a widening negative output gap between 2012 and 2013, leads, again, to a pro-cyclical fiscal stance in 2013.
In 2014, consolidation should continue according to SCPs, with an annual adjustment set at about 0.5pp of GDP in both the EU and the euro area, i.e. stable with respect to 2013 in the EU, and pacing down in the euro area. Structural adjustments are planned to continue thereafter and until 2016, albeit at a moderate pace, at an average of 0.3pp of GDP per year in the EU, 0.2pp in the euro area. Hence,
(17) Most of the difference being explained by a different accounting of one-off and temporary measures, as the Commission 2013
Spring forecast are based on their commonly agreed definition (see Specifications on the implementation of the Stability and Growth Pact and Guidelines on the format and content of the Stability and Convergence Programmes, 3 September 2013, page 4).
(18) As calculated according to the commonly agreed methodology.

4. Fiscal Consolidation
27
according to the SCPs, the average level of structural deficits should reach, by the end of 2016, 0.8% of GDP in the EU and 0.4% of GDP in the euro area. This deceleration reflects the fact that more and more Member States will be able to pace down their fiscal adjustments as they progressively exit from the EDP and start adjusting towards their MTOs.
Although more than three-fourths of the Member States plan a strengthening of their fiscal position over the period, the rhythm of consolidation varies across Member States. The cumulated size of the structural adjustment tends to be related to the starting position of the Member States, reflecting their respective needs for fiscal tightening: for instance, all Member States planning a total improvement exceeding 3pp of GDP between 2012 and 2016 (i.e. Belgium, Ireland, Spain, France, Portugal, Lithuania) start from a structural balance around or below -3% of GDP in 2012. At the other end of the spectrum, the remaining fourth of the Member States, for which no structural improvement is planned between 2012 and the end of the programme (Bulgaria, the Czech Republic, Denmark, Hungary, Luxembourg and Latvia) all start from a structural position which is close to balance or in surplus (with the exception of Czech Republic). This confirms, despite a broadly pro-cyclical fiscal stance, the functioning of the differentiated fiscal strategy, which foresees a modulation of the fiscal effort to the fiscal space, in line with the guidance of the European Council.
4.3.2. On the path towards the medium-term budgetary objectives
Following an update of the common parameters used to define MTOs,(19) the 2013 SCPs show a significant number of revisions of the objectives. Six Member States changed their MTO with respect to last year in line with the SGP requirements: Belgium and Ireland have chosen a more ambitious target, while Lithuania, Hungary, Romania and Finland have loosened it. Slovenia posts an MTO not in line with the SGP requirements. The objectives now range from a deficit of 1.7pp of GDP (Hungary) to a surplus of 0.75 (Belgium), with on average, slightly more ambitious objectives for euro area Member States (above -¼ pp of GDP) than at the level of the EU (slightly below -½ pp of GDP), both of them broadly unchanged from last year. In the context of the entry into force of the Fiscal Compact, the Commission is publishing this year a calendar of convergence towards the MTOs for the Member States for which the TSCG will be binding (see Box 4.1). Graph 4.6 presents Member States' structural balance at the start (2012) and at the end of the programme period (2016), together with their MTOs.
(19) The 2012 Update of the Minimum Medium Term Objectives, Note for the Alternates of the Economic and Financial
Committee, agreed on 26 October 2012.

European Commission The 2013 Stability and Convergence Programmes: An Overview
28
Graph 4.6: Planned changes in the structural balance between 2012 and 2016 and MTOs
This graph presents the structural balances of Member States in 2012 and 2016 as presented in their programmes, recalculated according to the commonly agreed methodology, versus their MTO as announced in their 2013 SCP. Some differences between the Commission's forecast and SCPs for 2012 structural balances may appear, due to possible different accounting of one-offs - this is particularly significant for Malta. The United Kingdom is not providing any MTO in its Convergence Programme; the MTO set by Slovenia does not reflect the requirements of the SGP.
A very mixed picture in terms of adjustment towards the MTO emerges from Graph 4.6, with the possibility to distinguish four groups, on the basis of the structural balance as computed using the commonly agreed methodology.(20) On the one hand, Germany, Denmark, Estonia, Hungary, and Sweden have already achieved their MTO in 2012 and should maintain it through the programme, while Belgium, Italy, Lithuania, Austria, Poland, Portugal, Romania and Finland should gradually be reaching it by the end of 2016. On the other hand, Bulgaria, Luxembourg and Latvia are today planning to deviate from their MTO after having reached it in the course of the programme – generally reflecting country-specific events affecting the future structural balance, such as pension reforms or external shocks to revenues. Finally, the Czech Republic, Spain, France, Ireland, Malta, the Netherlands, Slovenia and Slovakia do not (20) The recalculation of structural balances according to the common methodology might have an effect on the exact year of the
MTO achievement as assessed in this note, when compared to the planned date presented in the programme.
Box 4.1: TSCG and the calendar of convergence towards the MTO
On 1 January 2013, the Treaty on Stability, Coordination and Governance in the EMU (TSCG) entered into force for the Member States which have ratified it. The provisions of the Fiscal Compact (Title III) are binding for Member States of the euro area, as well as to the other Contracting Parties which have notified to the Council their choice to be bound by it, i.e. Denmark and Romania by the cut-off date (28.05.2013).
In line with Article 3(2) of the TSCG, the Commission will publish a calendar for convergence towards the MTO concerning the Member States for which the Fiscal Compact is binding. This calendar will be based on the Commission's assessment of the adjustment paths provided by the Member States in their SCPs, based on the provisions set out in Articles 5(1) and 9(1) of Regulation (EC) 1466/97. The SGP provides for an annual structural improvement by 0.5% of GDP as a benchmark, to be modulated according to economic conditions (more in good times, less in bad times) as well as to parameters of fiscal sustainability and fiscal risks.
For this purpose, Member States were asked to submit data going beyond the usual programme horizon in order to assess the entire adjustment path until the attainment of the MTO.

4. Fiscal Consolidation
29
foresee to achieve the MTO under the programme horizon, either because the distance from the objective is large or because they do not plan the annual improvements which are expected under the SGP.(21)
4.3.3. How large is the Member States' fiscal effort?
For the reasons explained in Box 4.2 below, the changes in structural balances are likely to underrepresent the true effort implemented by Member States in the current juncture, especially for those experiencing a marked fiscal tightening. The main reason is related to the fact that revenue elasticities are pro-cyclical, i.e. that the short-term elasticity of revenues to GDP tend to be smaller than their long-term average in crisis periods and larger than their long-term average in boom periods, thus generating revenues shortfalls/windfalls.
It is therefore reasonable to conclude that the actual effort made by Member States in the current juncture is larger than indicated by the change in structural balances.
This implies that the underlying degree of policy retrenchment needed to deliver a given improvement in the structural balance is high under the present circumstances. In order to provide a complementary assessment of the fiscal effort projected by Member States, the deviation from the expenditure benchmark can be used as a complementary indicator of the fiscal effort.
The deviation from the expenditure benchmark is computed as the deviation of government expenditure growth, net of discretionary revenue measures, from the medium-term potential GDP growth rate, corrected for the one-offs. As detailed in Annex II, this indicator is the combination of a bottom-up indicator on the revenue side and a top-down indicator on the expenditure side. It has thus the advantage of limiting the difficulties of interpretation of the change in structural balance related to the short-term fluctuations of revenue elasticities but to keep a transparent assessment of the expenditure side.
The use of such an indicator supports the presumption that the change in structural balance is currently underestimating fiscal effort and shows that the differentiation in terms of fiscal effort undertaken by the Member States is more pronounced than shown by the change in the structural balance. This is true in particular in Member States implementing the most sizeable fiscal adjustments (see Annex II).
(21) Mind that Greece and Cyprus have not submitted the programmes and the MTOs this year and the United-Kingdom does not
have an MTO.
European Commission The 2013 Stability and Convergence Programmes: An Overview
30
(Continued on the next page)
Box 4.2: Long- and short-term fiscal elasticities
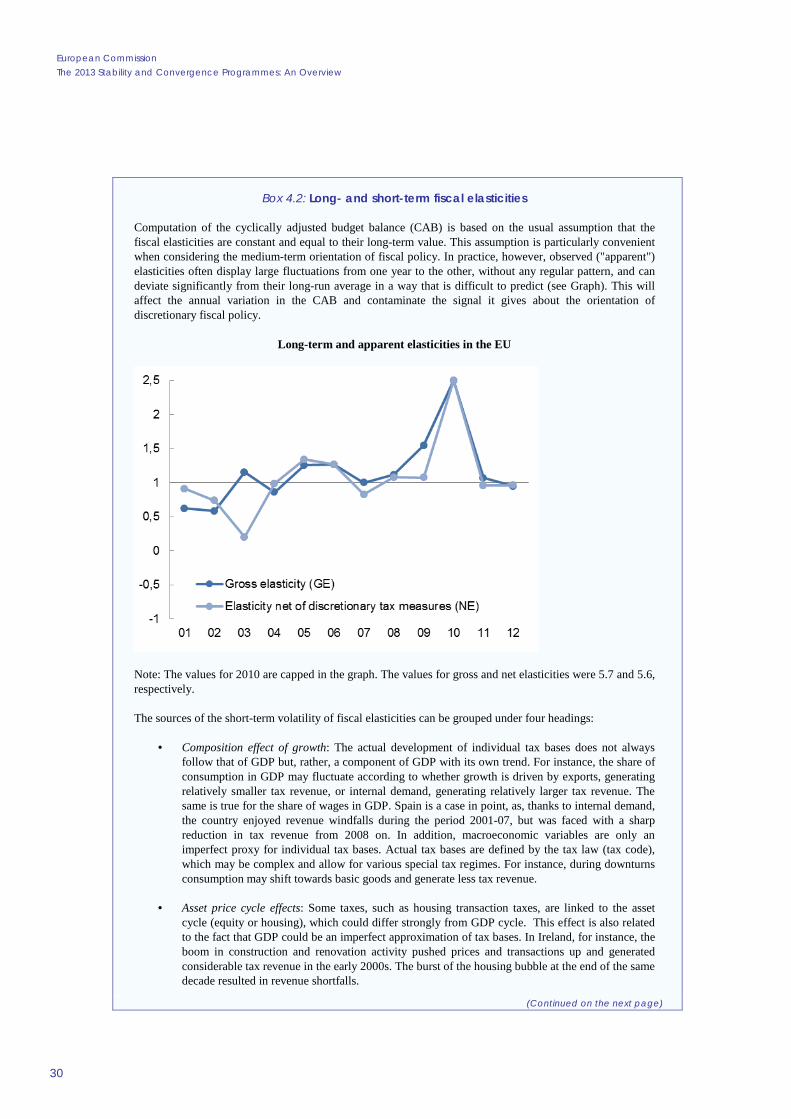
Computation of the cyclically adjusted budget balance (CAB) is based on the usual assumption that the fiscal elasticities are constant and equal to their long-term value. This assumption is particularly convenient when considering the medium-term orientation of fiscal policy. In practice, however, observed ("apparent") elasticities often display large fluctuations from one year to the other, without any regular pattern, and can deviate significantly from their long-run average in a way that is difficult to predict (see Graph). This will affect the annual variation in the CAB and contaminate the signal it gives about the orientation of discretionary fiscal policy.
Long-term and apparent elasticities in the EU
Note: The values for 2010 are capped in the graph. The values for gross and net elasticities were 5.7 and 5.6, respectively.
The sources of the short-term volatility of fiscal elasticities can be grouped under four headings:
· Composition effect of growth: The actual development of individual tax bases does not always follow that of GDP but, rather, a component of GDP with its own trend. For instance, the share of consumption in GDP may fluctuate according to whether growth is driven by exports, generating relatively smaller tax revenue, or internal demand, generating relatively larger tax revenue. The same is true for the share of wages in GDP. Spain is a case in point, as, thanks to internal demand, the country enjoyed revenue windfalls during the period 2001-07, but was faced with a sharp reduction in tax revenue from 2008 on. In addition, macroeconomic variables are only an imperfect proxy for individual tax bases. Actual tax bases are defined by the tax law (tax code), which may be complex and allow for various special tax regimes. For instance, during downturns consumption may shift towards basic goods and generate less tax revenue.
· Asset price cycle effects: Some taxes, such as housing transaction taxes, are linked to the asset cycle (equity or housing), which could differ strongly from GDP cycle. This effect is also related to the fact that GDP could be an imperfect approximation of tax bases. In Ireland, for instance, the boom in construction and renovation activity pushed prices and transactions up and generated considerable tax revenue in the early 2000s. The burst of the housing bubble at the end of the same decade resulted in revenue shortfalls.
4. Fiscal Consolidation
31
4.4. RISKS TO SCPS' TARGETS: A TENTATIVE ASSESSMENT
This section evaluates the risk underlying the SCP deficit projections against the Commission 2013 Spring forecast. With the 2013 deficit plans being close to the Commission figures, these risks are concentrated in 2014 where the SCPs show smaller deficits than in the Commission 2013 Spring forecast in almost all cases. Some of these differences are due to more optimistic growth assumptions in the programme in turn delivering a better budgetary outcome, but the largest part of the differences points to the need to adopt as yet unspecified policy measures, in order for the planned outturns to materialize. In some cases, Member States are forecasting higher revenues than the Commission forecast on an unchanged policy basis, indicating that they expect to see their deficit plans realized (at least in part) without the adoption of further measures. This represents an important risk, over and above the risk related to the political willingness to enact policy changes.
Graph 4.7 presents the SCP and Commission 2013 Spring forecast deficit figures for 2014 and decomposes the difference between the two into three components. First, the "2013 base effect", which captures the effect that a different starting deficit for 2013 has on the plans for 2014. The 2013 base effect is small both an average and for most Member States,(22) reflecting the fact that most of the SCPs included deficit plans for 2013 which were very close to the Commission 2013 Spring forecast. The EU average for 2013 is in line with the Commission forecast (3.4% of GDP), while at euro area level, the SCPs point to a deficit of 2.8% of GDP compared with the Commission's 2.9%.
The second component, the "2013 growth gap", measures the difference resulting from the different growth assumptions as set out in Section 3 with their effect computed on the basis of standard budget-to-output-gap semi-elasticities. The third component, the "2013 policy gap", represents the unexplained part of the differences in the deficit levels. It corresponds to the additional policy measures that SCP figures imply, when considered relative to the Commission 2013 Spring forecast, in order for the overall deficit figure to be realised. In this sense, a large and positive policy gap represents a risk to the plans. However, it should not be understood as the only risk – plans that rely on higher estimates of economic growth also contain within them an additional element of risk.
(22) In the case of Slovenia, the large based effect comes from the including of one-off operations in favour of the banking sector in
the 2013 SCP deficit.
Box (continued)
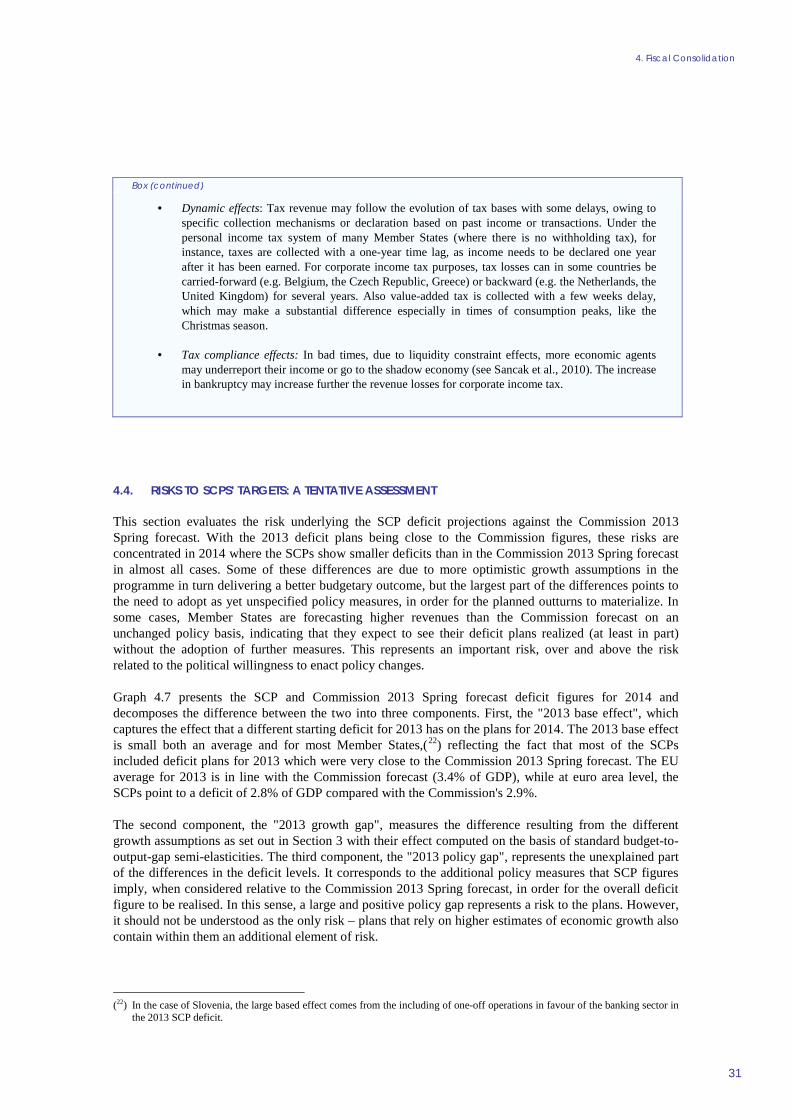
· Dynamic effects: Tax revenue may follow the evolution of tax bases with some delays, owing to specific collection mechanisms or declaration based on past income or transactions. Under the personal income tax system of many Member States (where there is no withholding tax), for instance, taxes are collected with a one-year time lag, as income needs to be declared one year after it has been earned. For corporate income tax purposes, tax losses can in some countries be carried-forward (e.g. Belgium, the Czech Republic, Greece) or backward (e.g. the Netherlands, the United Kingdom) for several years. Also value-added tax is collected with a few weeks delay, which may make a substantial difference especially in times of consumption peaks, like the Christmas season.
· Tax compliance effects: In bad times, due to liquidity constraint effects, more economic agents may underreport their income or go to the shadow economy (see Sancak et al., 2010). The increase in bankruptcy may increase further the revenue losses for corporate income tax.

European Commission The 2013 Stability and Convergence Programmes: An Overview
32
Graph 4.7: General government deficit for 2014: decomposition of the gap between SCPs plans and the Spring Commission forecast for EU Member States
The graph shows the level and component changes in Member States' deficit in 2014, as a percentage of GDP. The squares represent the deficit ratio from the Commission 2013 Spring forecast; the triangle the deficit planned in the SCPs. The point estimates show the actual values of the deficit, with the stacked lines representing the component. For the components, values above zero represent that the component has a deficit reducing effect in the SCP relative to the Commission 2013 Spring forecast, while values below zero indicate that the component increases the SCP deficit relative to the Commission's.
There are significant differences between the Commission forecast and the SCPs' projections for the deficit in 2014, both in aggregate and at individual country level, with the main driver being the policy gap. At EU level, the SCPs plans lead to an overall deficit of 2.6% of GDP, some 0.6% of GDP lower than the Commission figure. With a small 0.1% of GDP reduction in the deficit due to the slightly higher growth figures, the entire difference corresponds to the policy gap. At the euro area level, the difference between the SCPs and Commission deficits is higher. The SCPs show a deficit of 2.0% of GDP, which is 0.8% of GDP lower than the corresponding Commission figure of 2.8%. 0.1pp of this is the base effect due to the carry-over of the stronger figures being planned for 2013 and the remaining 0.6pp corresponds to the policy gap.
The policy gap can in turn be attributed to a number of differences. It can be due to Member States' intentions to introduce new policy measures or to restrain expenditure – if these measures were not adopted or the plans not sufficiently specified at the time of the Commission 2013 Spring forecast they would result in a policy gap. For example, Belgium, Spain, France, Slovakia and Hungary project significantly lower total expenditure ratios in their SCPs than in the Commission forecast for broadly similar growth assumptions and this is also the case for Slovakia which however offsets these with a reduction in tax revenues, while planning a deficit in line with the Commission forecast. However, the policy gap can also be comparable to the growth gap, in that it can represent a difference in assumptions. For example, countries can be forecasting revenues based on different elasticities than in the Commission forecast meaning that they expect to get higher (or lower) revenues with no additional policy measures. Similarly, different assumptions about factors outside the government's control, in particular as interest payments can also have an effect.
4. Fiscal Consolidation
33
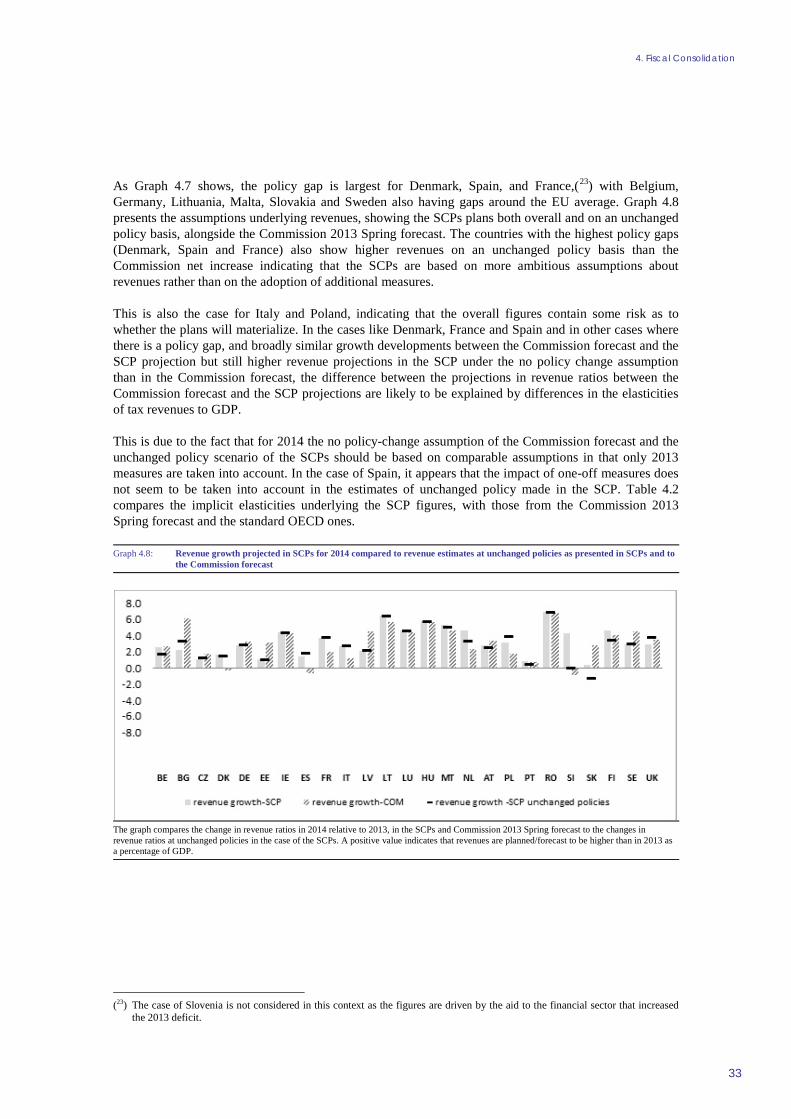
As Graph 4.7 shows, the policy gap is largest for Denmark, Spain, and France,(23) with Belgium, Germany, Lithuania, Malta, Slovakia and Sweden also having gaps around the EU average. Graph 4.8 presents the assumptions underlying revenues, showing the SCPs plans both overall and on an unchanged policy basis, alongside the Commission 2013 Spring forecast. The countries with the highest policy gaps (Denmark, Spain and France) also show higher revenues on an unchanged policy basis than the Commission net increase indicating that the SCPs are based on more ambitious assumptions about revenues rather than on the adoption of additional measures.
This is also the case for Italy and Poland, indicating that the overall figures contain some risk as to whether the plans will materialize. In the cases like Denmark, France and Spain and in other cases where there is a policy gap, and broadly similar growth developments between the Commission forecast and the SCP projection but still higher revenue projections in the SCP under the no policy change assumption than in the Commission forecast, the difference between the projections in revenue ratios between the Commission forecast and the SCP projections are likely to be explained by differences in the elasticities of tax revenues to GDP.
This is due to the fact that for 2014 the no policy-change assumption of the Commission forecast and the unchanged policy scenario of the SCPs should be based on comparable assumptions in that only 2013 measures are taken into account. In the case of Spain, it appears that the impact of one-off measures does not seem to be taken into account in the estimates of unchanged policy made in the SCP. Table 4.2 compares the implicit elasticities underlying the SCP figures, with those from the Commission 2013 Spring forecast and the standard OECD ones.
Graph 4.8: Revenue growth projected in SCPs for 2014 compared to revenue estimates at unchanged policies as presented in SCPs and to the Commission forecast
The graph compares the change in revenue ratios in 2014 relative to 2013, in the SCPs and Commission 2013 Spring forecast to the changes in revenue ratios at unchanged policies in the case of the SCPs. A positive value indicates that revenues are planned/forecast to be higher than in 2013 as a percentage of GDP.
(23) The case of Slovenia is not considered in this context as the figures are driven by the aid to the financial sector that increased
the 2013 deficit.

European Commission The 2013 Stability and Convergence Programmes: An Overview
34
Table 4.2: Comparing the short-term elasticities underlying the SCP and the Commission 2013 Spring forecast figures of 2014, with the standard OECD elasticities

5. DEBT IMPLICATIONS
35
According to the plans presented in the SCPs, general government debt in the EU is expected to peak at slightly above 90% in 2013-2014 and fall back to 86% in 2016 (see Graph 5.1). Similarly in the euro area, overall debt is projected to reach around 94% of GDP in 2013-2014 before decreasing to slightly below 90% in 2016. The trend of falling debt ratios as from 2014 would be the result of the fiscal consolidation that has taken place so far in the EU, and the average debt-to-GDP ratio in the EU in 2016 is expected to be almost 2.5 percentage points below the level in 2012.
For all Member States with a debt above the 60% of GDP, debt is projected to be lower in 2016 than in 2012 except in the United Kingdom and in Spain which project a large increase (and in the Netherlands and France but by a very small margin).(24)
Graph 5.1: Changes in general government debt projected in SCPs 2012-2016
Member States are ordered according to increasing debt level (horizontal axis). The bars indicate the change in debt-to-GDP ratio over the period. The graph shows no correlation between the size of debt reduction and the initial debt level.
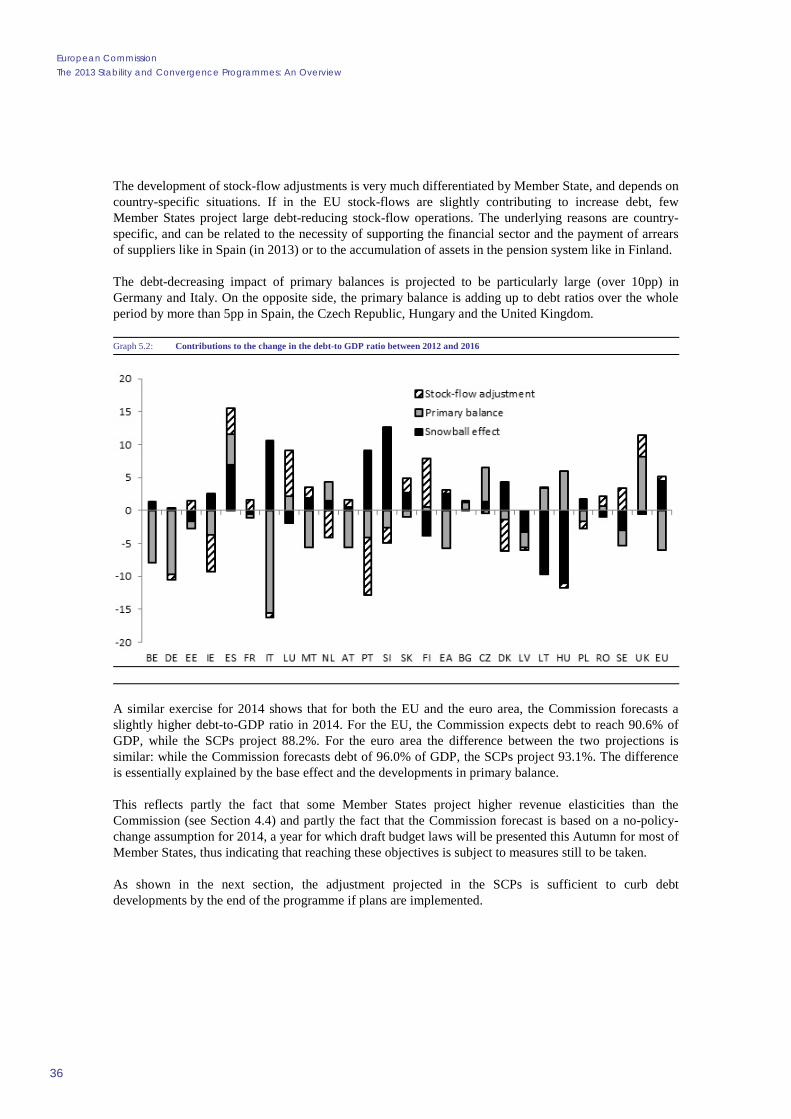
While consolidation is a prerequisite for the debt ratio to decrease in the long run, the debt dynamics also depends significantly on the interest rate-growth differential (i.e. the “snow-ball” effect) and on stock-flow adjustments.(25) Graph 5.2 shows the contribution of fiscal consolidation (change in primary balance), the difference between GDP growth and interest rates, and the stock-flow adjustment on the evolution of government debt. Specifically, Graph 5.3 shows the cumulative contribution of those three elements to the change in the debt-to-GDP ratio between 2012 and 2016.
The debt ratio is projected to fall on average between 2012 and 2016 as a result of improvements in the primary balance. The contribution of consolidation is expected to more than offset the debt-increasing effect of the snow-ball effect. The stock-flow adjustment is expected on average to play a minor role on the debt dynamic up to 2016.
(24) Based on plans, up to 2016, Member States concerned by the transition period of the debt criterion would overall implement
structural adjustments large enough to meet the debt benchmark by the end of their transition period. A detailed country-specific analysis is provided in the Staff Working Documents accompanying the CSRs.
(25) The change in the gross debt ratio can be decomposed as follows:
t
ttt
t
t
t
t
t
t
t
t
YSF
grYD
YPD
YD
YD
+÷÷ø
öççè
æ-+=-
-
-
-
- )(*1
1
1
1 where t is a time subscript; D, PD, Y and SF are the stock of
government debt, the primary deficit, nominal GDP and the stock-flow adjustment respectively, and r and g represent the average real interest rate and real rate of GDP growth. The term in parentheses represents the “snow-ball” effect, measuring the combined effect of interest expenditure and economic growth on the debt ratio.
European Commission The 2013 Stability and Convergence Programmes: An Overview
36
The development of stock-flow adjustments is very much differentiated by Member State, and depends on country-specific situations. If in the EU stock-flows are slightly contributing to increase debt, few Member States project large debt-reducing stock-flow operations. The underlying reasons are country-specific, and can be related to the necessity of supporting the financial sector and the payment of arrears of suppliers like in Spain (in 2013) or to the accumulation of assets in the pension system like in Finland.
The debt-decreasing impact of primary balances is projected to be particularly large (over 10pp) in Germany and Italy. On the opposite side, the primary balance is adding up to debt ratios over the whole period by more than 5pp in Spain, the Czech Republic, Hungary and the United Kingdom.
Graph 5.2: Contributions to the change in the debt-to GDP ratio between 2012 and 2016
A similar exercise for 2014 shows that for both the EU and the euro area, the Commission forecasts a slightly higher debt-to-GDP ratio in 2014. For the EU, the Commission expects debt to reach 90.6% of GDP, while the SCPs project 88.2%. For the euro area the difference between the two projections is similar: while the Commission forecasts debt of 96.0% of GDP, the SCPs project 93.1%. The difference is essentially explained by the base effect and the developments in primary balance.
This reflects partly the fact that some Member States project higher revenue elasticities than the Commission (see Section 4.4) and partly the fact that the Commission forecast is based on a no-policy-change assumption for 2014, a year for which draft budget laws will be presented this Autumn for most of Member States, thus indicating that reaching these objectives is subject to measures still to be taken.
As shown in the next section, the adjustment projected in the SCPs is sufficient to curb debt developments by the end of the programme if plans are implemented.

6. SHORT, MEDIUM AND LONG-TERM FISCAL SUSTAINABILITY
37
This section assesses the sustainability of public finances in the Member States, against the background of the impact of the financial, economic and fiscal crisis and the demographic ageing projected in the 2012 Ageing Report.(26)
The enhancement of the fiscal sustainability assessment framework in the Fiscal Sustainability Report 2012(27) supplements the traditional focus on long-term fiscal risks with medium- and short-term risk indicators. This multidimensional approach makes it possible to assess:(28)
I. short-term challenges, based on the S0 indicator (‘early detection of fiscal stress’); II. medium-term challenges, based on the modified S1 indicator (‘debt compliance risk’);
III. long-term challenges, based on the S2 indicator (‘ageing-induced fiscal risks’).
6.1. SHORT-TERM CHALLENGES: THE S0 INDICATOR - EARLY DETECTION OF FISCAL STRESS
In terms of short-term challenges, risks for fiscal stress have been reduced in nearly all Member States in the last years. While in 2009 almost two thirds of the EU Member States were above the critical threshold for the S0 indicator, indicating at that time elevated risks of fiscal stress for 2010, in following years short-term risks have been progressively reduced (see Graph 6.1).
Graph 6.1: The S0 indicator, 2009 and 2012
Source: Commission Services
In 2012, according to the S0 indicator highlighting fiscal risks for 2013, only two Member States appear to be still at risk, Spain and Cyprus (see also Table 6.1). However, full implementation of the planned
(26) European Commission (DG ECFIN) and Economic Policy Committee (AWG) (2012), "The 2012 Ageing Report: Economic
and budgetary projections for the27 EU Member States (2010-2060)", European Economy, No 2. (27) European Commission (2012), "Fiscal Sustainability Report 2012", European Economy, No 8. (28) The S1 and S2 indicators are traditional sustainability indicators based on forecasts for growth and fiscal balances, extrapolated
by incorporating the long-term projections of the 2012 Ageing Report, in particular the projected trend in age-related expenditure. The higher the values of the S1 and S2 sustainability indicators, the greater the required fiscal adjustment and thus the sustainability risk. The S0 indicator is a new indicator based on current data, aggregating fiscal and macro-financial variables which have proven to be good predictors of fiscal stress episodes. The methodology for the S0 indicator is fundamentally different from the S1 and S2 indicators mentioned above. It is not a quantification of the required fiscal adjustment as in the case of the S1 and S2 indicators, but a composite indicator which estimates the extent to which there might be a risk of fiscal stress in the short term.
fiscal adjustment in Spain would go a long way towards reducing the risk for fiscal stress in the short term.
6.2. MEDIUM- TO LONG-TERM CHALLENGES
In terms of medium and longer term implications for fiscal sustainability taking account of the projected changes in age-related expenditure, the macroeconomic scenario and the fiscal outlook and plans, two main scenarios are considered:
· the 'COM no-policy-change' scenario, with structural primary balance/GDP ratio kept constant at 2014 estimated level as in Commission 2013 Spring forecast (reflecting a "no-policy-change" assumption);
· the 'SCP' scenario (structural primary balance/GDP ratio kept constant at end of programme period covered by the SCPs), reflecting planned changes in fiscal policies as reported in the SCPs.
Graph 6.2 depicts the projected evolution for the government gross debt ratio (including the projected change in age-related expenditure), for the EU as a whole. The solid thick line shows the outcome for this scenario under the assumption of no fiscal consolidation measures beyond those contained in the Commission 2013 Spring forecast (structural primary balance/GDP ratio kept constant at 2014 estimated level) and incorporates expected future age-related spending, as projected in the 2012 Ageing Report.(29) The impact of pension reforms undertaken since the completion of the 2012 Ageing Report in Belgium, Denmark, Hungary and the Netherlands were incorporated in the Commission's Fiscal Sustainability Report 2012 released on 18 December 2012. In addition, the impact of pension reforms in Poland, Latvia, the Czech Republic, Bulgaria and Slovakia are included in the analysis in this section.
According to the Commission 2013 Spring forecast, debt rises to 90.9% of GDP in 2014 in the EU as a whole. Given the significant fiscal consolidation until 2014, debt is projected to decrease in the following years. Moreover, the cost of ageing as a share of GDP is almost stabilized in the years to the mid-2020s. However, from 2024 onwards, the ageing costs take hold more firmly, and debt starts rising. As a result, debt in the EU as a whole reaches 92% of GDP in 2030, though with large differences across Member States.
In contrast to the 'COM no-policy-change' scenario, the 'SCP' scenario would lead to a more marked reduction in the debt-to-GDP ratio. However, debt would still be above the Treaty reference value of 60% of GDP by 2030 (at 65% of GDP).
6.2.1. The S1 indicator – debt compliance risk
Another way of looking at the adjustment needed in the medium-to-long term with respect to unchanged policies is to calculate the additional fiscal adjustment required up to 2020 in order to stabilize the debt-to-GDP ratio at 60% by 2030 (see Graph 18). The improvement required in the structural primary balance to achieve a debt-to-GDP ratio target of 60% by 2030 amounts to 2.2 percentage points of GDP over the period 2015–2020 in the EU as a whole, i.e., an average annual fiscal consolidation effort of 1/3 percentage points per year. In other words, the structural primary balance in the EU has to improve from a forecasted surplus of 1.5% of GDP in 2014 (structural balance of -2.1% in 2014) to a surplus of 3.7% in 2020.
(29) This consists of projections of pension, health care, long-term care, education and unemployment benefit spending. In addition
the projected changes in property income and in taxes on pensions are incorporated.

6. Short, Medium and Long-term Fiscal Sustainability
39
However, the required consolidation effort varies significantly across Member States depending on the initial structural primary balances, starting debt ratios, future ageing costs and the growth prospects over the next 20 years. It should be noted that for some Member States, the structural primary balance in 2014 - the starting point for the medium-term projections - is very high compared with what has been achieved in the past.
Graph 6.2: Medium term debt projections for the EU
Source: Commission services, 2013 Stability and Convergence Programmes. Note: The medium-term projections are based on the Commission services’ Spring 2013 forecast (up to 2014), and the macro-economic scenario of the 2012 Ageing Report. As a general rule, the output gap is assumed to close in t+5, after which the potential growth rates converge linearly to the AWG baseline scenario by t+10. The inflation rate (GDP deflator) converges linearly to 2% in 2017, when the output gap is closed and remains constant thereafter, for all countries. The overall (real) implicit interest rate on maturing debt (new and rolled-over) converges to 3% by 2017. The structural primary balance is kept unchanged after 2014 apart from the projected change in age-related expenditure according to the AWG reference scenario from the 2012 Ageing Report. The primary balance is adjusted by using the budget sensitivities in the period until the output gap is assumed to be closed (by 2017 as a rule). No stock-flow adjustment assumed after 2014 (end of forecast horizon).
Due to substantial consolidation efforts, the structural primary balance in 2014 is estimated to be 2 pp. of GDP higher than observed on average over the period 1998-2012 in the Czech Republic, Romania and Slovakia, and more than 3 pp. of GDP higher in Greece, Italy, Hungary, Portugal.
The adjustment of the primary balance required to reach a 60% of GDP debt ratio under the assumption of the 'COM no-policy-change' scenario would be particularly demanding, indicating high risk (a fiscal consolidation effort over the period 2014-2020 higher than 3 pp of GDP) in Belgium, Spain, Malta, the Netherlands, Slovenia, and the United Kingdom. Fiscal sustainability risks would be medium for the Czech Republic, France, Italy, Lithuania, Austria, Poland, Slovakia, and Finland. The others are at low risk (Bulgaria, Denmark, Germany, Estonia, Luxemburg, Hungary, Romania and Sweden).
If the fiscal plans in the SCPs are fully implemented and additionally not weakened after the end of the programme horizon, additional fiscal consolidation, beyond the end of the period covered by the programmes (generally 2016) would be needed in Belgium, the Czech Republic, Spain, Luxemburg, the Netherlands, Austria, Slovakia, Finland and the United Kingdom, to reach 60% of GDP in 2030.
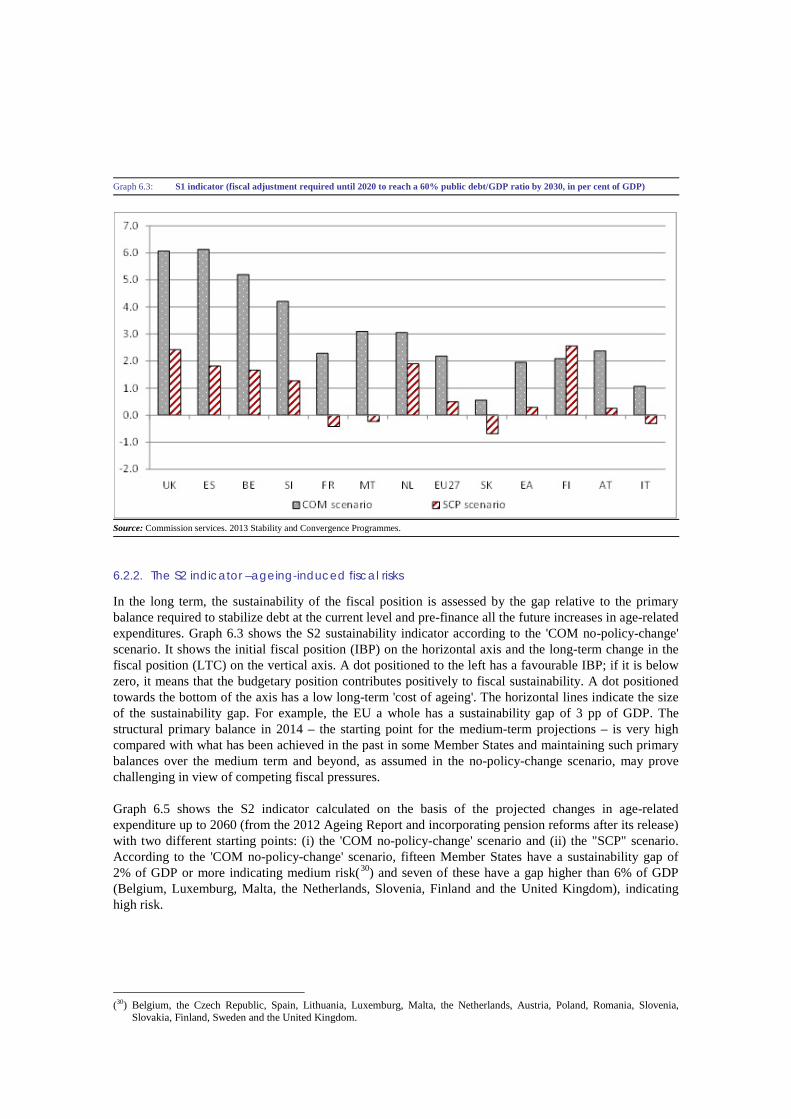
Graph 6.3: S1 indicator (fiscal adjustment required until 2020 to reach a 60% public debt/GDP ratio by 2030, in per cent of GDP)
Source: Commission services. 2013 Stability and Convergence Programmes.
6.2.2. The S2 indicator –ageing-induced fiscal risks
In the long term, the sustainability of the fiscal position is assessed by the gap relative to the primary balance required to stabilize debt at the current level and pre-finance all the future increases in age-related expenditures. Graph 6.3 shows the S2 sustainability indicator according to the 'COM no-policy-change' scenario. It shows the initial fiscal position (IBP) on the horizontal axis and the long-term change in the fiscal position (LTC) on the vertical axis. A dot positioned to the left has a favourable IBP; if it is below zero, it means that the budgetary position contributes positively to fiscal sustainability. A dot positioned towards the bottom of the axis has a low long-term 'cost of ageing'. The horizontal lines indicate the size of the sustainability gap. For example, the EU a whole has a sustainability gap of 3 pp of GDP. The structural primary balance in 2014 – the starting point for the medium-term projections – is very high compared with what has been achieved in the past in some Member States and maintaining such primary balances over the medium term and beyond, as assumed in the no-policy-change scenario, may prove challenging in view of competing fiscal pressures.
Graph 6.5 shows the S2 indicator calculated on the basis of the projected changes in age-related expenditure up to 2060 (from the 2012 Ageing Report and incorporating pension reforms after its release) with two different starting points: (i) the 'COM no-policy-change' scenario and (ii) the "SCP" scenario. According to the 'COM no-policy-change' scenario, fifteen Member States have a sustainability gap of 2% of GDP or more indicating medium risk(30) and seven of these have a gap higher than 6% of GDP (Belgium, Luxemburg, Malta, the Netherlands, Slovenia, Finland and the United Kingdom), indicating high risk.
(30) Belgium, the Czech Republic, Spain, Lithuania, Luxemburg, Malta, the Netherlands, Austria, Poland, Romania, Slovenia,
Slovakia, Finland, Sweden and the United Kingdom.
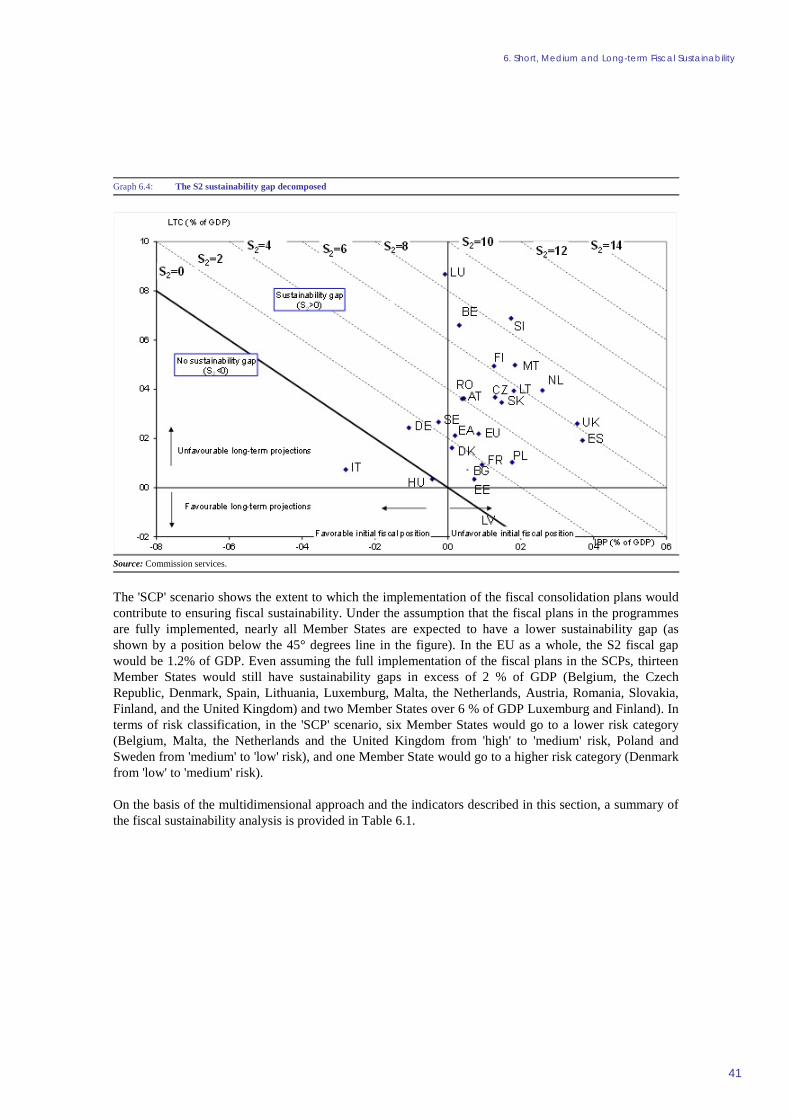
6. Short, Medium and Long-term Fiscal Sustainability
41
Graph 6.4: The S2 sustainability gap decomposed
Source: Commission services.
The 'SCP' scenario shows the extent to which the implementation of the fiscal consolidation plans would contribute to ensuring fiscal sustainability. Under the assumption that the fiscal plans in the programmes are fully implemented, nearly all Member States are expected to have a lower sustainability gap (as shown by a position below the 45° degrees line in the figure). In the EU as a whole, the S2 fiscal gap would be 1.2% of GDP. Even assuming the full implementation of the fiscal plans in the SCPs, thirteen Member States would still have sustainability gaps in excess of 2 % of GDP (Belgium, the Czech Republic, Denmark, Spain, Lithuania, Luxemburg, Malta, the Netherlands, Austria, Romania, Slovakia, Finland, and the United Kingdom) and two Member States over 6 % of GDP Luxemburg and Finland). In terms of risk classification, in the 'SCP' scenario, six Member States would go to a lower risk category (Belgium, Malta, the Netherlands and the United Kingdom from 'high' to 'medium' risk, Poland and Sweden from 'medium' to 'low' risk), and one Member State would go to a higher risk category (Denmark from 'low' to 'medium' risk).
On the basis of the multidimensional approach and the indicators described in this section, a summary of the fiscal sustainability analysis is provided in Table 6.1.

Graph 6.5: The S2 sustainability gap: 'COM no-policy-change' and 'SCP' scenarios
Source: Source: Commission services. 2013 Stability and Convergence Programmes.

6. Short, Medium and Long-term Fiscal Sustainability
43
Table 6.1: Risk classification in the 2013 assessment round, COM 'no-policy-change' scenario
Source: Commission services. Note: S0 indicator: Member States with a value for the overall composite indicator above the threshold (0.44) in 2012 are at risk for fiscal stress in the year ahead. The S1 indicator: The following thresholds were used to assess the scale of risk for 'debt compliance': if the S1 value is less than zero, the Member State is assigned low risk; if it is between 0 and 3 (thus requiring a structural adjustment in the primary balance of up to 0.5 pp of GDP per year – the benchmark adjustment in the SGP - until 2020), it is assigned medium risk; and, if it is greater than 3 (meaning a structural adjustment of more than 0.5 pp of GDP per year is necessary), it is assigned high risk. The S2 indicator: As was the case in the 2009 Sustainability Report, the following thresholds for the S2 indicator were retained: if the value of S2 is lower than 2, the Member State is assigned low risk; if it is between 2 and 6, it is assigned medium risk; and, if it is greater than 6, it is assigned high risk.


ANNEX 1 Tables comparing projections from SCPs and the Commission's 2013 Spring forecast
45
Table A1.1: Real GDP growth (%)*
In case of missing programmes: weighted average of the figures for those countries that have submitted a programme. * Commission EU averages are based on UK Fiscal year data.
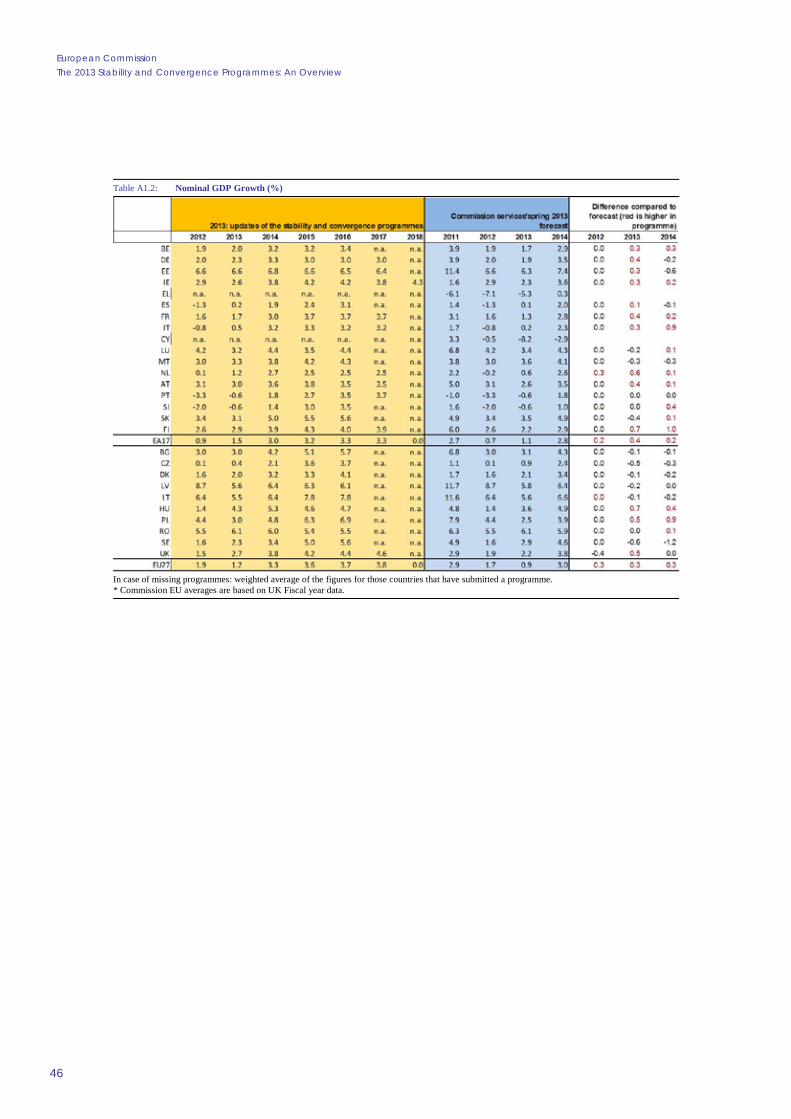
European Commission The 2013 Stability and Convergence Programmes: An Overview
46
Table A1.2: Nominal GDP Growth (%)
In case of missing programmes: weighted average of the figures for those countries that have submitted a programme. * Commission EU averages are based on UK Fiscal year data.

1. Tables comparing projections from SCPs and the Commission's 2013 Spring forecast
47
Table A1.3: General government balance (% of GDP)
In case of missing programmes: weighted average of the figures for those countries that have submitted a programme. * Commission EU averages are based on UK Fiscal year data.

European Commission The 2013 Stability and Convergence Programmes: An Overview
48
Table A1.4: General government total revenue (% of GDP)
In case of missing programmes: weighted average of the figures for those countries that have submitted a programme. * Commission EU averages are based on UK Fiscal year data.

1. Tables comparing projections from SCPs and the Commission's 2013 Spring forecast
49
Table A1.5: General government total expenditure (% of GDP)
In case of missing programmes: weighted average of the figures for those countries that have submitted a programme. * Commission EU averages are based on UK Fiscal year data.
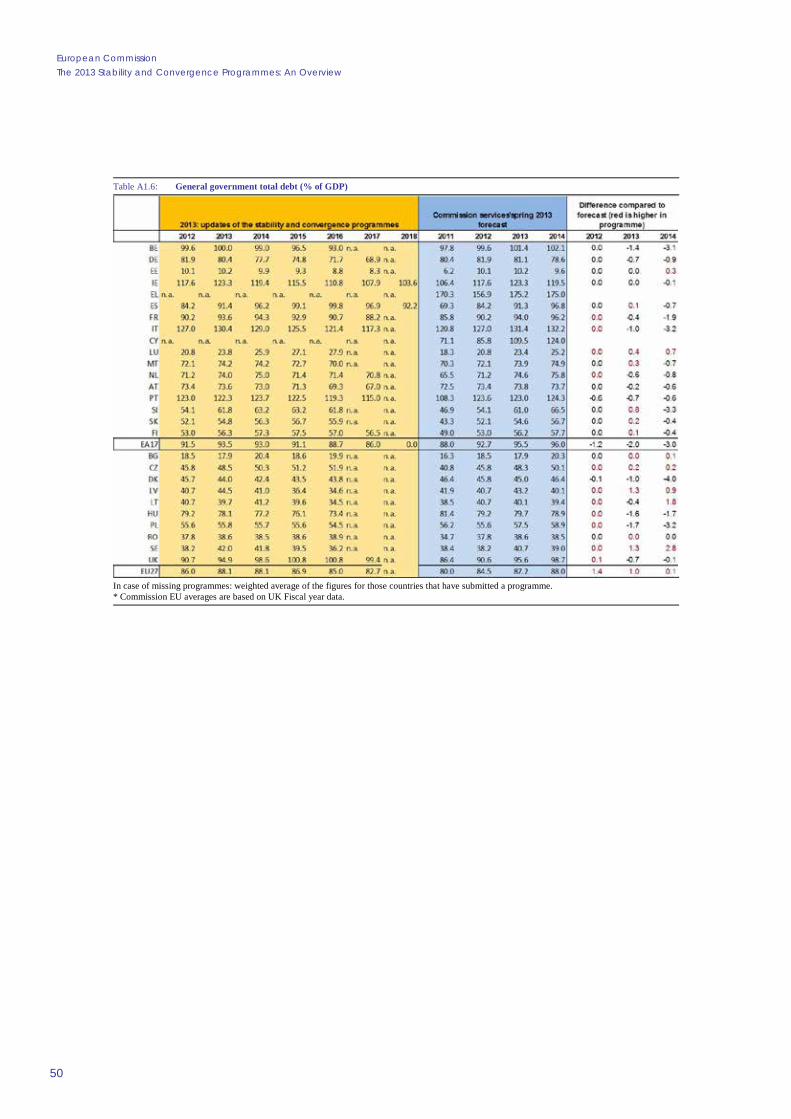
European Commission The 2013 Stability and Convergence Programmes: An Overview
50
Table A1.6: General government total debt (% of GDP)
In case of missing programmes: weighted average of the figures for those countries that have submitted a programme. * Commission EU averages are based on UK Fiscal year data.
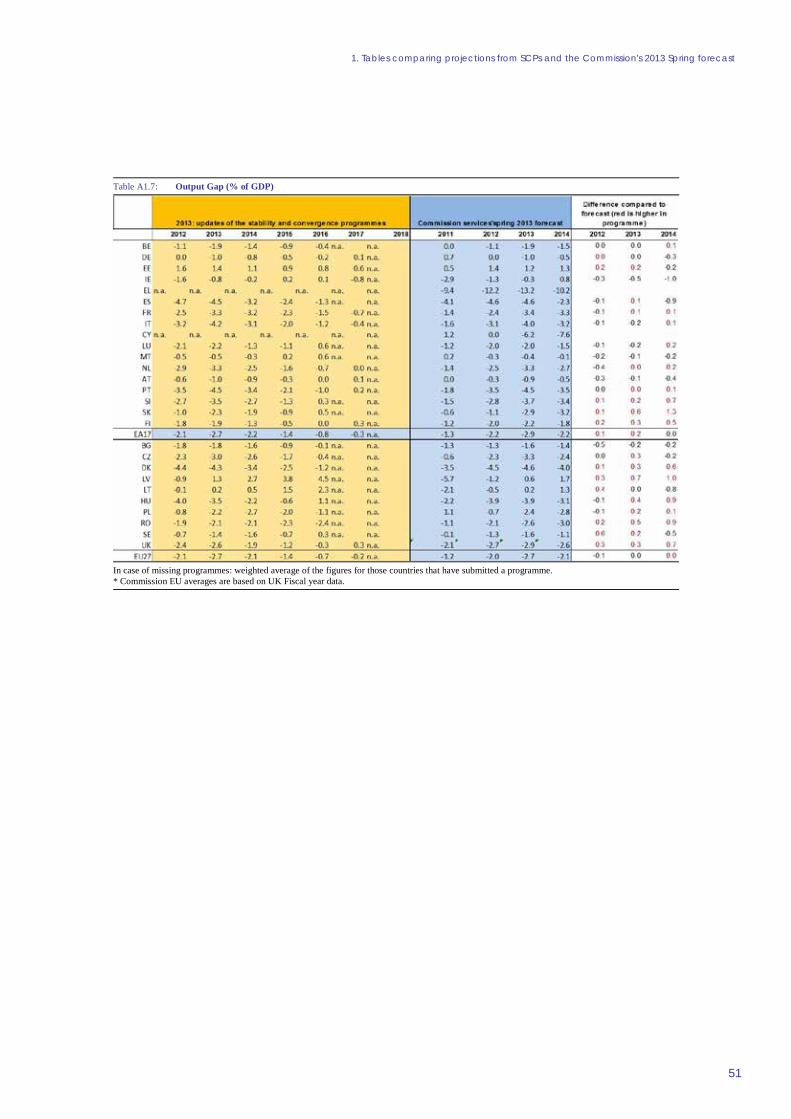
1. Tables comparing projections from SCPs and the Commission's 2013 Spring forecast
51
Table A1.7: Output Gap (% of GDP)
In case of missing programmes: weighted average of the figures for those countries that have submitted a programme. * Commission EU averages are based on UK Fiscal year data.

European Commission The 2013 Stability and Convergence Programmes: An Overview
52
Table A1.8: Structural balance (% of GDP) Cyclically-adjusted balance excluding one-off and other temporary measures. For SCPs: recalculated by Commission services on the basis of the information in the programme according to the commonly-agreed methodology.
In case of missing programmes: weighted average of the figures for those countries that have submitted a programme. * Commission EU averages are based on UK Fiscal year data.
ANNEX 2
Assessment of the Fiscal Effort and Fiscal Stance: Complementing the Analysis of the Structural Balance with the Deviation from the Expenditure Benchmark
53
Introducing a complementary measure of the discretionary fiscal effort
The usual indicator to assess the fiscal effort is the change in the structural balance (∆SB). It is a "top-down" indicator, which is routinely calculated, easily available and well-established in EU surveillance and policy discussions. The SB has the key advantage of simplicity: it indicates the government balance should the economy be at potential. This information is highly relevant per se and is directly used for sustainability analysis or surveillance purposes, where final outcome is what matters. This is why it is a core indicator of fiscal surveillance.
However, the ∆SB ratio is subject to a number of shortcomings when it comes to assessing the fiscal effort. In particular this measure is not necessarily a trustworthy indication of whether the government has actively pursued fiscal consolidation and has the consequence that using the ∆SB to define consolidation periods selects improvements in the structural balance that are driven by economic developments and not necessarily by explicit government action.(31) In particular, structural balances rely on fragile evaluations of the cyclical position, and their computation assumes a stable effect of output gaps on the fiscal accounts, relying on average values of tax and spending semi-elasticities. In practice these semi-elasticities tend to fluctuate markedly in the short term, giving rise to revenue windfall/shortfalls that by construction are assigned to the structural component while, in many cases, they are of temporary nature and are not linked to any discretionary policy action (see Box 2 in the text for further details.)(32) The same holds for the cyclical correction of unemployment expenditure. Hence, structural balances may for these reasons deliver an inaccurate view of the true underlying direction of fiscal policy.
Accordingly, the assessment of the fiscal effort can be enriched and complemented by introducing another indicator that relies on the expenditure benchmark (see below for a detailed discussion of the differences between the two indicators). Specifically, the deviation of government expenditure growth, net of discretionary revenue measures, from the medium-term potential GDP growth rate, corrected for the one-offs in order to be comparable with the structural balance concept, can be used as a complementary indicator of the fiscal effort. More precisely, it is the deviation from the expenditure benchmark ("DEB") that can be used together with the ∆SB to assess the fiscal effort.
On the revenue side, the DEB relies on a fully bottom-up approach: the fiscal effort is computed by adding-up the effects of new tax measures(33) in the year of interest. The main advantage over the structural balance is that this measure of the "effort" is not polluted by fluctuations in output elasticities of tax revenues.
On the expenditure side however, the DEB is essentially a top-down approach that measures the effort as the gap between actual growth of spending and the medium-term potential growth of the economy.(34) Thanks to its reliance on a 10-year window to average potential GDP growth, versus the annual approach of the cyclical adjustment of the budget balance, the DEB has the advantage of being less exposed to the
(31) See 'Assessing "effective action" in the excessive deficit procedure', Ref. Ares(2012)1037190. (32) Section 4.4 compares the standard revenue elasticities used in the Commission 2013 Spring forecast with the implicitly assumed
ones in the SCPs. (33) The tax measures used to calculate the DEB are those reported by Member States in the 2013 SCPs. (34) This approach seems preferable on the expenditure side because it avoids the main shortcoming of bottom-up approaches,
namely the lack of a counterfactual benchmark against which to gauge discretionary expenditure measures.

European Commission The 2013 Stability and Convergence Programmes: An Overview
54
volatility of the estimates of potential output. This may be especially relevant in the current juncture, where several economies of the EU are undergoing large shocks and adjustments, such as rebalancing towards tradable sectors that translate into temporary tax-poor growth and downward changes in potential growth.(35) Defined this way, a neutral stance would correspond to a situation where the authorities do not aim at changing the medium-term values of expenditure to GDP ratios; that is, there is no attempt to stimulate demand above or below medium-term growth.
Graph A2.1: EU Member States: DEB and changes in the structural balance, based on 2013 update of the SCPs
This graphs plots the DEB implied by 2013 SCPs versus the planned change in structural balances for year 2013. Note that the DEB as depicted in this graph is positive when there is a consolidation effort, for better comparability with ∆SB, as opposed to the deviation from the expenditure benchmark, which is negative when net expenditure grows at a slower pace than potential GDP. Source:
However, this indicator is not problem-free. First, since discretionary revenue measures are neither a national account concept nor an observed variable, their measurement may lack full replicability and comparability across Member States. This is due to the different "no-policy change" benchmark across countries. Moreover, the planned impact of discretionary revenue measures is not systematically revised ex-post for all Member States, even when the final magnitude thereof can be conditioned by the endogenous response of economic agents. Last but not least, to the extent that annual changes in potential output growth signal a permanent shock, e.g. a long-lasting reduction in the growth potential of the economy, the DEB would pick up such a change in economic prospects with a lag due to its smoothing property.
Thus while the weaknesses of the SB are due to the use of real-time output gap estimates and the assumption of stable elasticities, the DEB requires real-time estimate of revenue measures and an estimate of medium-term potential growth.
(35) It should however be noted that in the presence of permanent shocks to GDP, an averaging procedure would imply that such
shocks are taken into account with a delay.
2. Assessment of the Fiscal Effort and Fiscal Stance: Complementing the Analysis of the Structural Balance with the Deviation from the Expenditure Benchmark
.
55
A final reason for complementing the analysis of the fiscal effort with the DEB is that the expenditure benchmark serves as a reference, together with the ∆SB, for assessing progress towards the MTO in fiscal surveillance under the preventive arm of the SGP. Hence, for the analysis of the fiscal effort, the combination of the ∆SB with the DEB, is consistent with the overall assessment to be performed within the SGP context.
The fiscal stance in the EU and the EA in 2013
The two indicators generally deliver consistent messages regarding the direction of the fiscal stance, although they usually differ in terms of the intensity of the measured fiscal effort. As depicted by Graph A2.1, both the ∆SB and the DEB suggest fiscal tightening (both indicators are positive) in 15 out of 25 Member States in 2013. However, in most cases the DEB suggests a tighter fiscal stance than the change in the structural balance. This is the case of the EU and the euro area as a whole, where the DEB in 2013 suggests a tightening that exceeds by around 1% of GDP that indicated by the change in the structural balance (see also Graph A2.2 for the difference between the two indicators).
In particular, the degree of fiscal tightening as measured by the DEB turns out to be higher than the ∆SB measure in most Member States experiencing weak or negative growth and sustained rebalancing. The extent of fiscal consolidation would appear to be especially underestimated by using the ∆SB in the Czech Republic, Denmark, Ireland, Spain, Italy, Hungary, Latvia, Luxembourg, the Netherlands, Austria, Poland, Slovenia and Slovakia. In Slovenia (with 9.6% of GDP) and Spain (with 7.3% of GDP) the pace of consolidation as measured by the DEB would be extremely large. The consolidation effort gauged according to the same metric would be remarkably sizeable (almost 4% of GDP) in the Netherlands too.
The DEB posts large adjustments, especially in cases like Spain and Slovenia. When looking at such large numbers, it has to be borne in mind that the estimate of revenue measures is also subject to many uncertainties, as it requires modeling the impact of tax measures in real time, often based on difficult technical choices. The numbers have therefore to be taken as complementary information to the change in structural balance and not as their substitute.
There are six Member States (Bulgaria, the Czech Republic, Latvia, Hungary, Malta and Austria) where the two indicators differ in sign. With one exception (Malta), the DEB points towards fiscal tightening, whereas the ∆SB would suggest that these Member States are implementing a fiscal loosening.
A modest fiscal loosening according to both indicators appears to be in the pipeline in Estonia, Sweden and more pronouncedly in the United Kingdom, whereas the fiscal stance in Germany seems to be broadly neutral.
Overall, these results suggest that for most Member States, but especially for those experiencing a marked fiscal tightening, the underlying degree of policy retrenchment needed to deliver a given improvement in the structural balance is currently high. Moreover, the DEB shows that the differentiation in terms of fiscal effort undertaken by the Member States is far more pronounced than shown by the change in the structural balance in Member States implementing the most sizeable fiscal adjustments.
Graph A2.2 shows the overall difference between the ∆SB and the DEB and the differences stemming from their revenue and expenditure sides. Differences on the revenue side are particularly evident (discretionary revenue measures being higher than the change in structural revenues by at least 1% of GDP) in Spain, Italy, the Netherlands and Poland. These differences on the revenue side are essentially due to the fact that substantial revenue shortfalls are anticipated in these countries, which are not captured by standard elasticities. In general, the presence of revenue shortfalls tends to coincide with Member States being strongly affected by the crisis and rebalancing pressures.

European Commission The 2013 Stability and Convergence Programmes: An Overview
56
Differences between the two indicators on the expenditure side are sizeable (above 1% of GDP) in Bulgaria, the Czech Republic, Ireland, Spain, Hungary, Malta, the Netherlands, Austria, Romania, Slovenia and Slovakia. Two main factors are behind such differences. On the one hand, the expenditure aggregate used to calculate the (deviation from) the expenditure benchmark does not coincide with the aggregate covered by cyclically-adjusted expenditures. In particular, interest payments are removed from the expenditure aggregate used to compute the DEB. Changes in interest payments constitute a potentially important source of difference between the two indicators. This difference is particularly sizeable in Ireland (where interest payments are projected to rise by almost 1¼ per cent of GDP). More moderate increases are expected elsewhere, notably in Spain and Slovenia, whereas Belgium, Denmark, Germany, France, Italy, Hungary, Poland and Finland would benefit from some small declines in interest charges. Government expenditure programmes matched by EU funds and non-discretionary unemployment expenditure are also removed from the expenditure aggregate used to compute the DEB, while public investment is replaced by its four-year average in order to smooth the volatility observed in this variable.
On the other hand, the DEB measures the effort as the gap between actual growth of spending (excluding the above-mentioned items as well as non-discretionary unemployment expenditure) and the medium-term potential growth of the economy. Consequently, the volatility of potential growth with respect to its medium-term average and the changes in unemployment expenditure beyond those captured by the standard cyclical elasticities also explain some of the difference between the two indicators on the spending side. These factors are deemed to be especially relevant in deep recessions and under strong rebalancing.
Overall, in view of the largely negative output gaps, in many cases widening, the fiscal stance is deemed pro-cyclical by both indicators, and even more so when gauged by the DEB.
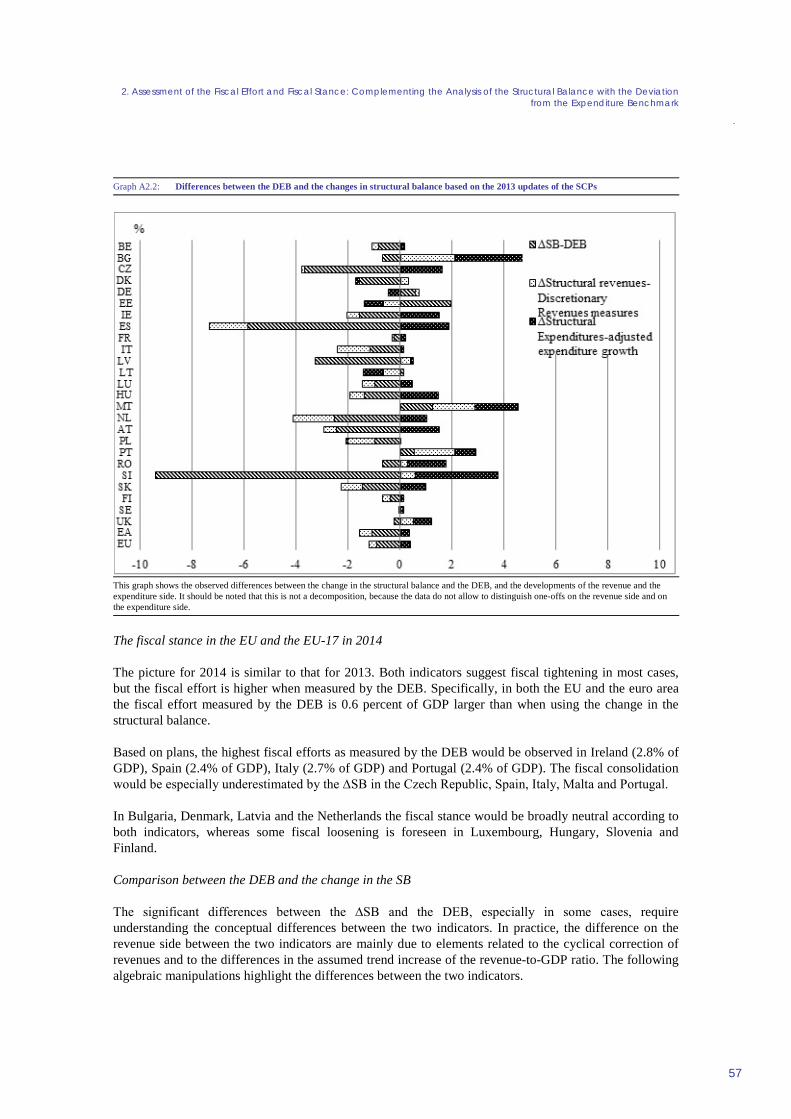
2. Assessment of the Fiscal Effort and Fiscal Stance: Complementing the Analysis of the Structural Balance with the Deviation from the Expenditure Benchmark
.
57
Graph A2.2: Differences between the DEB and the changes in structural balance based on the 2013 updates of the SCPs
This graph shows the observed differences between the change in the structural balance and the DEB, and the developments of the revenue and the expenditure side. It should be noted that this is not a decomposition, because the data do not allow to distinguish one-offs on the revenue side and on the expenditure side.
The fiscal stance in the EU and the EU-17 in 2014
The picture for 2014 is similar to that for 2013. Both indicators suggest fiscal tightening in most cases, but the fiscal effort is higher when measured by the DEB. Specifically, in both the EU and the euro area the fiscal effort measured by the DEB is 0.6 percent of GDP larger than when using the change in the structural balance.
Based on plans, the highest fiscal efforts as measured by the DEB would be observed in Ireland (2.8% of GDP), Spain (2.4% of GDP), Italy (2.7% of GDP) and Portugal (2.4% of GDP). The fiscal consolidation would be especially underestimated by the ∆SB in the Czech Republic, Spain, Italy, Malta and Portugal.
In Bulgaria, Denmark, Latvia and the Netherlands the fiscal stance would be broadly neutral according to both indicators, whereas some fiscal loosening is foreseen in Luxembourg, Hungary, Slovenia and Finland.
Comparison between the DEB and the change in the SB
The significant differences between the ∆SB and the DEB, especially in some cases, require understanding the conceptual differences between the two indicators. In practice, the difference on the revenue side between the two indicators are mainly due to elements related to the cyclical correction of revenues and to the differences in the assumed trend increase of the revenue-to-GDP ratio. The following algebraic manipulations highlight the differences between the two indicators.
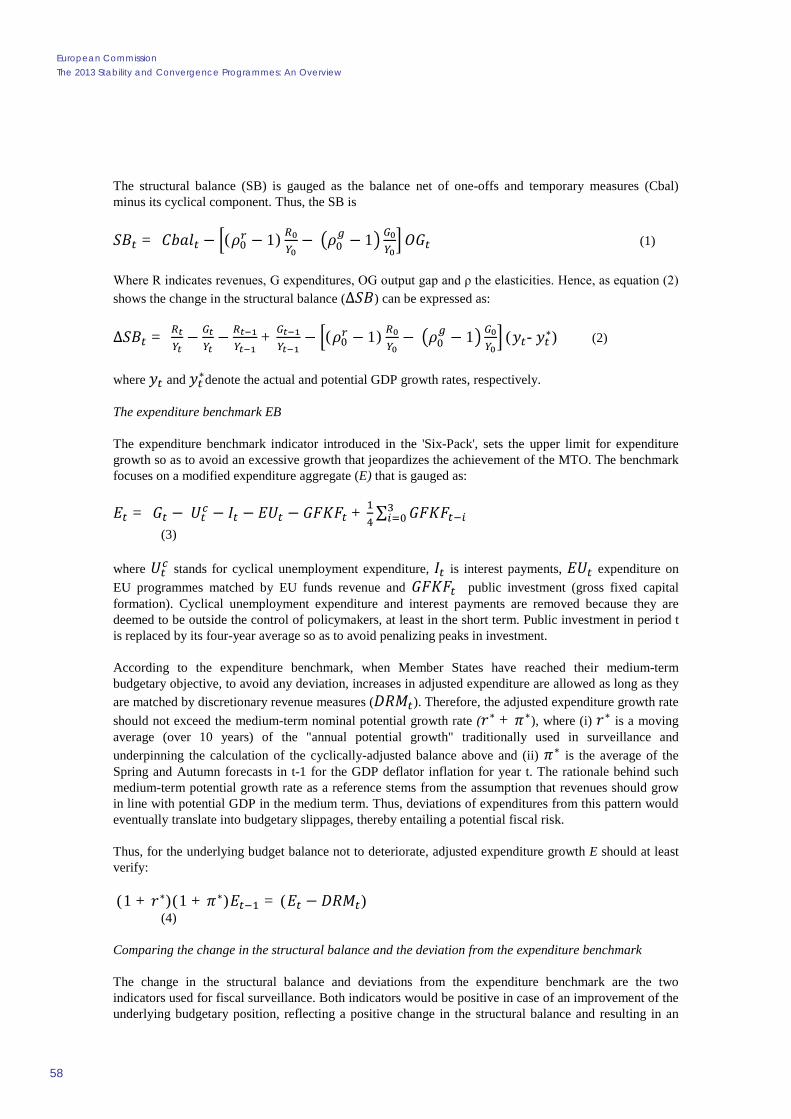
European Commission The 2013 Stability and Convergence Programmes: An Overview
58
The structural balance (SB) is gauged as the balance net of one-offs and temporary measures (Cbal) minus its cyclical component. Thus, the SB is
𝑆𝐵𝑡 = 𝐶𝑏𝑎𝑙𝑡 − �(𝜌0𝑟 − 1) 𝑅0
𝑌0− �𝜌0
𝑔 − 1� 𝐺0𝑌0
� 𝑂𝐺𝑡 (1)
Where R indicates revenues, G expenditures, OG output gap and ρ the elasticities. Hence, as equation (2) shows the change in the structural balance (∆𝑆𝐵) can be expressed as:
∆𝑆𝐵𝑡 = 𝑅𝑡𝑌𝑡
− 𝐺𝑡𝑌𝑡
− 𝑅𝑡−1𝑌𝑡−1
+ 𝐺𝑡−1𝑌𝑡−1
− �(𝜌0𝑟 − 1) 𝑅0
𝑌0− �𝜌0
𝑔 − 1� 𝐺0𝑌0
� (𝑦𝑡- 𝑦𝑡∗) (2)
where 𝑦𝑡 and 𝑦𝑡∗denote the actual and potential GDP growth rates, respectively.
The expenditure benchmark EB
The expenditure benchmark indicator introduced in the 'Six-Pack', sets the upper limit for expenditure growth so as to avoid an excessive growth that jeopardizes the achievement of the MTO. The benchmark focuses on a modified expenditure aggregate (E) that is gauged as:
𝐸𝑡 = 𝐺𝑡 − 𝑈𝑡𝑐 − 𝐼𝑡 − 𝐸𝑈𝑡 − 𝐺𝐹𝐾𝐹𝑡 + 1
4∑ 𝐺𝐹𝐾𝐹𝑡−𝑖
3𝑖=0
(3)
where 𝑈𝑡𝑐 stands for cyclical unemployment expenditure, 𝐼𝑡 is interest payments, 𝐸𝑈𝑡 expenditure on
EU programmes matched by EU funds revenue and 𝐺𝐹𝐾𝐹𝑡 public investment (gross fixed capital formation). Cyclical unemployment expenditure and interest payments are removed because they are deemed to be outside the control of policymakers, at least in the short term. Public investment in period t is replaced by its four-year average so as to avoid penalizing peaks in investment.
According to the expenditure benchmark, when Member States have reached their medium-term budgetary objective, to avoid any deviation, increases in adjusted expenditure are allowed as long as they are matched by discretionary revenue measures (𝐷𝑅𝑀𝑡). Therefore, the adjusted expenditure growth rate should not exceed the medium-term nominal potential growth rate (𝑟∗ + 𝜋∗), where (i) 𝑟∗ is a moving average (over 10 years) of the "annual potential growth" traditionally used in surveillance and underpinning the calculation of the cyclically-adjusted balance above and (ii) 𝜋∗ is the average of the Spring and Autumn forecasts in t-1 for the GDP deflator inflation for year t. The rationale behind such medium-term potential growth rate as a reference stems from the assumption that revenues should grow in line with potential GDP in the medium term. Thus, deviations of expenditures from this pattern would eventually translate into budgetary slippages, thereby entailing a potential fiscal risk.
Thus, for the underlying budget balance not to deteriorate, adjusted expenditure growth E should at least verify:
(1 + 𝑟∗)(1 + 𝜋∗)𝐸𝑡−1 = (𝐸𝑡 − 𝐷𝑅𝑀𝑡) (4)
Comparing the change in the structural balance and the deviation from the expenditure benchmark
The change in the structural balance and deviations from the expenditure benchmark are the two indicators used for fiscal surveillance. Both indicators would be positive in case of an improvement of the underlying budgetary position, reflecting a positive change in the structural balance and resulting in an

2. Assessment of the Fiscal Effort and Fiscal Stance: Complementing the Analysis of the Structural Balance with the Deviation from the Expenditure Benchmark
.
59
increase of expenditure net of new revenues below the benchmark. However, due to their different nature, they might not be satisfied simultaneously. Thus, it is useful to understand the conceptual differences between the two indicators. The deviation from the expenditure benchmark can be reformulated in terms of its contribution to the government balance as:
𝐷𝐸𝐵𝑡 = 𝐷𝑅𝑀𝑡 − (𝐸𝑡 − (1 + 𝑟∗)(1 + 𝜋∗)𝐸𝑡−1)
𝐷𝐸𝐵𝑡 = 𝐷𝑅𝑀𝑡 − �𝐺𝑡 − 𝑈𝑡𝑐 − 𝐼𝑡 − 𝐸𝑈𝑡 − 𝐺𝐹𝐾𝐹𝑡 + 1
4∑ 𝐺𝐹𝐾𝐹𝑡−𝑖
3𝑖=0 − (1 + 𝑟∗)(1 +
𝜋∗) �𝐺𝑡−1 − 𝑈𝑡−1𝑛𝑑 − 𝐼𝑡−1 − 𝐸𝑈𝑡−1 − 𝐺𝐹𝐾𝐹𝑡−1 + 1
4∑ 𝐺𝐹𝐾𝐹𝑡−1−𝑖
3𝑖=0 ��
(5)
As the change in the structural balance is measured in relation to GDP, the effect of the expenditure benchmark on the balance (5) can be expressed accordingly.
𝐷𝐸𝐵𝑡 = 𝐷𝑅𝑀𝑡𝑌𝑡
− �𝐺𝑡𝑌𝑡
− 𝑈𝑡𝑐
𝑌𝑡− 𝐼𝑡
𝑌𝑡− 𝐸𝑈𝑡
𝑌𝑡− 𝐺𝐹𝐾𝐹𝑡
𝑌𝑡+ 1
4∑ 𝐺𝐹𝐾𝐹𝑡−𝑖
3𝑖=0
𝑌𝑡� + (1+𝑟∗)(1+𝜋∗)
(1+𝑦𝑡) �𝐺𝑡−1𝑌𝑡−1
−
𝑈𝑡−1𝑐
𝑌𝑡−1− 𝐼𝑡−1
𝑌𝑡−1− 𝐸𝑈𝑡−1
𝑌𝑡−1− 𝐺𝐹𝐾𝐹𝑡−1
𝑌𝑡−1+ 1
4∑ 𝐺𝐹𝐾𝐹𝑡−1−𝑖
3𝑖=0
𝑌𝑡−1�
(6)
where the nominal medium-term potential growth rate can be expressed as:
(1 + 𝑛∗) = (1 + 𝑟∗)(1 + 𝜋∗)
The different terms in (6) can be regrouped so as to distinguish more clearly between the revenue and expenditure parts embedded in the expenditure benchmark. So (6) is at first order approximation equal to:
𝐷𝐸𝐵𝑡 = 𝐷𝑅𝑀𝑡𝑌𝑡
+ (𝑛∗ − 𝑦𝑡) �𝐺𝑡−1𝑌𝑡−1
− 𝑈𝑡−1𝑐
𝑌𝑡−1− 𝐼𝑡−1
𝑌𝑡−1− 𝐸𝑈𝑡−1
𝑌𝑡−1− 𝐺𝐹𝐾𝐹𝑡−1
𝑌𝑡−1+ 1
4∑ 𝐺𝐹𝐾𝐹𝑡−1−𝑖
3𝑖=0
𝑌𝑡−1� −
�∆ 𝐺𝑡𝑌𝑡
− ∆ 𝑈𝑡𝑐
𝑌𝑡− ∆ 𝐼𝑡
𝑌𝑡− ∆ 𝐸𝑈𝑡
𝑌𝑡− ∆ 𝐺𝐹𝐾𝐹𝑡
𝑌𝑡+ 1
4∆ ∑ 𝐺𝐹𝐾𝐹𝑡−𝑖
3𝑖=0
𝑌𝑡�
(7)
where 𝐺𝐹𝐾𝐹𝑡��������� = 14
∑ 𝐺𝐹𝐾𝐹𝑡−𝑖3𝑖=0
The revenue side
Discretionary revenue measures in the expenditure benchmark comprise both permanent and temporary measures. In turn, the structural balance nets out the effect of one-offs and temporary measures. Likewise, the difference between the change in the structural balance and the deviation from the expenditure benchmark regarding the revenue side can be written as the difference between the relevant terms in (2) and (7):
∆𝑆𝐵𝑡𝑅 − 𝐷𝐸𝐵𝑡
𝑅 =�𝑅𝑡
𝑌𝑡− 𝑅𝑡−1
𝑌𝑡−1− 𝐷𝑅𝑀𝑡
𝑌𝑡� − (𝜌0
𝑟 − 1) 𝑅0𝑌0
(𝑦𝑡- 𝑦𝑡∗) + (𝑦𝑡 −
𝑛∗) �𝐺𝑡−1−𝑈𝑡−1𝑐 −𝐼𝑡−1−𝐸𝑈𝑡−1−𝐺𝐹𝐾𝐹𝑡−1+𝐺𝐹𝐾𝐹𝑡−1������������
𝑌𝑡−1� (8)

European Commission The 2013 Stability and Convergence Programmes: An Overview
60
The observed output elasticity of revenues is defined as:
ρtr = (Rt−𝐷𝑅𝑀𝑡−Rt−1)/Rt−1
(Yt−Yt−1)/Yt−1
And rearranging this expression leads to
�𝑅𝑡
𝑌𝑡−
𝑅𝑡−1
𝑌𝑡−1−
𝐷𝑅𝑀𝑡
𝑌𝑡� = (𝜌𝑡
𝑟 − 1)𝑦𝑡𝑅𝑡−1
𝑌𝑡−1
Thus the differences on the revenue side can be explained by the following elements
· Revenue windfalls/shortfalls that show up when the actual output elasticity of revenues differs from the standard elasticity used for the cyclical adjustment in the structural balance. Such deviations are not necessarily structural and can be short-term in nature they may show up because of fluctuations of the tax bases, by the decoupling between tax bases and GDP and GDP composition effects. By contrast, in the case of the DEB, corrected for one-offs, the change in total revenues is only reflected by the estimated discretionary revenue measures, for which this indicator provides a more stable view than the ∆SB on the revenue side. However, it may not capture structural shifts in revenues that would be reflected in ∆SB.
In fact, an atypical behaviour of revenue elasticities is deemed to be one of the main explanatory elements behind the difference between both indicators on the revenue side. This is particularly relevant for Member States implementing sizeable tax reforms or undergoing major structural changes in their economies following the correction of previously accumulated macro and financial imbalances which generally lead to significant deviations of the observed tax elasticities from the standard ones. Revenue windfalls/shortfalls are also likely to be large in the presence of significant accumulation of assets or pronounced deleveraging.
· Changes in revenue/GDP ratio and in composition of revenues. Fixed weights, based on 10-year averages, are used for the calculation of the cyclical component of revenues in the structural
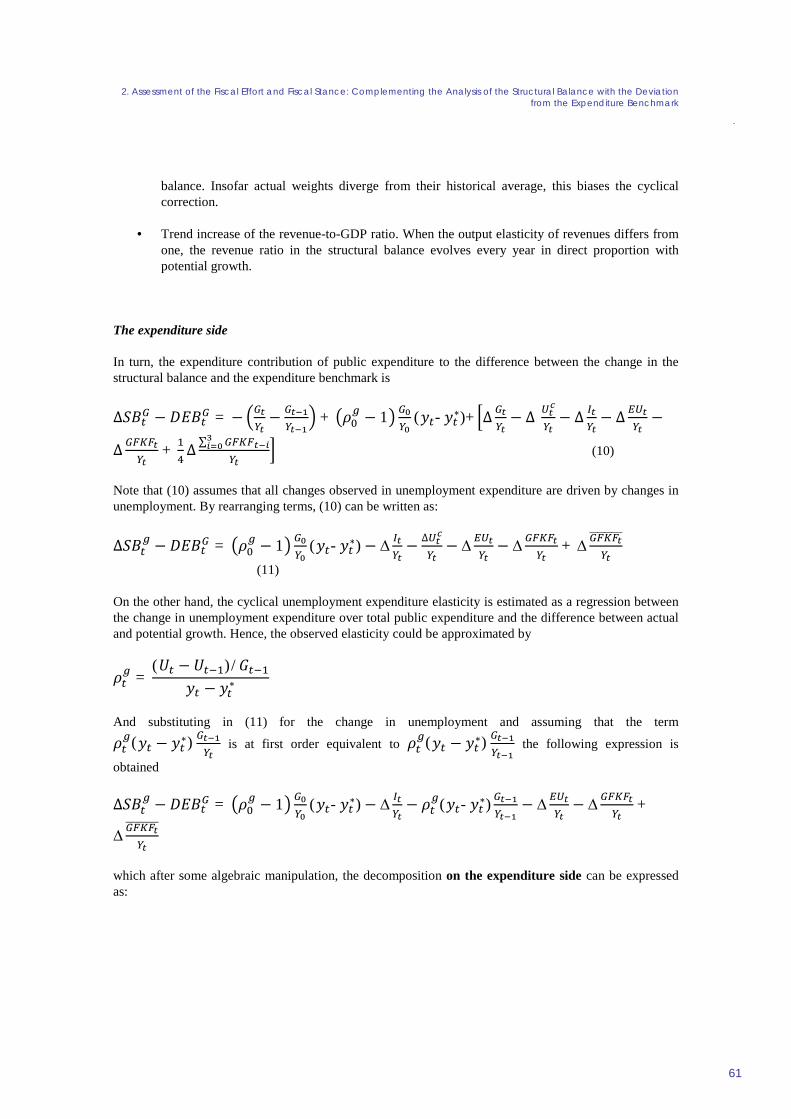
2. Assessment of the Fiscal Effort and Fiscal Stance: Complementing the Analysis of the Structural Balance with the Deviation from the Expenditure Benchmark
.
61
balance. Insofar actual weights diverge from their historical average, this biases the cyclical correction.
· Trend increase of the revenue-to-GDP ratio. When the output elasticity of revenues differs from one, the revenue ratio in the structural balance evolves every year in direct proportion with potential growth.
The expenditure side
In turn, the expenditure contribution of public expenditure to the difference between the change in the structural balance and the expenditure benchmark is
∆𝑆𝐵𝑡𝐺 − 𝐷𝐸𝐵𝑡
𝐺 = − �𝐺𝑡𝑌𝑡
− 𝐺𝑡−1𝑌𝑡−1
� + �𝜌0𝑔 − 1� 𝐺0
𝑌0(𝑦𝑡- 𝑦𝑡
∗)+ �∆ 𝐺𝑡𝑌𝑡
− ∆ 𝑈𝑡𝑐
𝑌𝑡− ∆ 𝐼𝑡
𝑌𝑡− ∆ 𝐸𝑈𝑡
𝑌𝑡−
∆ 𝐺𝐹𝐾𝐹𝑡𝑌𝑡
+ 14
∆ ∑ 𝐺𝐹𝐾𝐹𝑡−𝑖3𝑖=0
𝑌𝑡� (10)
Note that (10) assumes that all changes observed in unemployment expenditure are driven by changes in unemployment. By rearranging terms, (10) can be written as:
∆𝑆𝐵𝑡𝑔 − 𝐷𝐸𝐵𝑡
𝐺 = �𝜌0𝑔 − 1� 𝐺0
𝑌0(𝑦𝑡- 𝑦𝑡
∗) − ∆ 𝐼𝑡𝑌𝑡
− ∆𝑈𝑡𝑐
𝑌𝑡− ∆ 𝐸𝑈𝑡
𝑌𝑡− ∆ 𝐺𝐹𝐾𝐹𝑡
𝑌𝑡+ ∆ 𝐺𝐹𝐾𝐹𝑡���������
𝑌𝑡
(11)
On the other hand, the cyclical unemployment expenditure elasticity is estimated as a regression between the change in unemployment expenditure over total public expenditure and the difference between actual and potential growth. Hence, the observed elasticity could be approximated by
𝜌𝑡𝑔 =
(𝑈𝑡 − 𝑈𝑡−1)/𝐺𝑡−1
𝑦𝑡 − 𝑦𝑡∗
And substituting in (11) for the change in unemployment and assuming that the term
𝜌𝑡𝑔(𝑦𝑡 − 𝑦𝑡
∗) 𝐺𝑡−1𝑌𝑡
is at first order equivalent to 𝜌𝑡𝑔(𝑦𝑡 − 𝑦𝑡
∗) 𝐺𝑡−1𝑌𝑡−1
the following expression is
obtained
∆𝑆𝐵𝑡𝑔 − 𝐷𝐸𝐵𝑡
𝐺 = �𝜌0𝑔 − 1� 𝐺0
𝑌0(𝑦𝑡- 𝑦𝑡
∗) − ∆ 𝐼𝑡𝑌𝑡
− 𝜌𝑡𝑔(𝑦𝑡- 𝑦𝑡
∗) 𝐺𝑡−1𝑌𝑡−1
− ∆ 𝐸𝑈𝑡𝑌𝑡
− ∆ 𝐺𝐹𝐾𝐹𝑡𝑌𝑡
+
∆ 𝐺𝐹𝐾𝐹𝑡���������
𝑌𝑡
which after some algebraic manipulation, the decomposition on the expenditure side can be expressed as:

European Commission The 2013 Stability and Convergence Programmes: An Overview
62
Decomposition of the total discrepancy
By putting (10) and (12) together(36) it is possible to identify all the different sources of discrepancies between the change in the structural balance and the expenditure benchmark:
∆𝑆𝐵𝑡 − 𝐷𝐸𝐵𝑡 = (𝜌𝑡𝑟 − 𝜌0
𝑟)𝑦𝑡𝑅0𝑌0
+ (𝜌0𝑟 − 1)𝑦𝑡
∗ 𝑅0𝑌0
+(𝜌𝑡𝑟 − 1)𝑦𝑡 �𝑅𝑡−1
𝑌𝑡−1− 𝑅0
𝑌0� − (𝑦𝑡 −
𝑛∗) 𝐼𝑡−1+𝑈𝑡−1𝑐 +𝐸𝑈𝑡−1+𝐺𝐹𝐾𝐹𝑡−1−𝐺𝐹𝐾𝐹𝑡−1������������
𝑌𝑡−1+ �𝜌0
𝑔 − 𝜌𝑡𝑔�(𝑦𝑡- 𝑦𝑡
∗) 𝐺0𝑌0
+(𝑦𝑡∗ − 𝑛∗) 𝐺𝑡−1
𝑌𝑡−1− ∆ 𝐼𝑡
𝑌𝑡+
�1 − 𝜌𝑡𝑔�(𝑦𝑡- 𝑦𝑡
∗) �𝐺𝑡−1𝑌𝑡−1
− 𝐺0𝑌0
� − ∆ 𝐸𝑈𝑡𝑌𝑡
− �∆ 𝐺𝐹𝐾𝐹𝑡𝑌𝑡
− ∆ 𝐺𝐹𝐾𝐹𝑡���������
𝑌𝑡� (13)
On the expenditure side the main explanatory factors behind the difference between the two indicators of the fiscal stance are due to i) the cyclical adjustment of the structural balance, and ii) the specific construction of the expenditure benchmark, which is based on a modified expenditure aggregate that removes interest payments, government expenditure programmes matched by EU funds and non-discretionary unemployment expenditure; public investment is also removed and replaced by its four-year average in order to smooth the volatility observed in this variable. More concretely, these differences stem from:
· Windfall/shortfall in unemployment benefit expenditure. Both indicators perform a cyclical adjustment for unemployment benefit expenditure. As the structural balance relies on standard elasticities, a deviation of the actual output elasticity of unemployment benefits from this historical value leads to a bias in the cyclical correction, following the same mechanism as described above in the section on revenue windfalls/shortfalls. To the extent that the expenditure benchmark is based on similar aggregates to perform the cyclical correction, the magnitude of this term as a source of discrepancy is likely to be limited.
(36) Taking into account the fact that ( -∆ 𝐸𝑈𝑡
𝑌𝑡) stemming from (11) is actually matched by an equivalent increase ∆ 𝐸𝑈𝑡
𝑌𝑡 which is
included the ∆𝑆𝐵𝑡𝑅 but not in 𝐸𝐵𝑡
𝑅 (i.e. on the revenue side).

2. Assessment of the Fiscal Effort and Fiscal Stance: Complementing the Analysis of the Structural Balance with the Deviation from the Expenditure Benchmark
.
63
· Changes in expenditure-to-GDP ratio and composition of expenditure. A deviation of expenditure ratios with respect to the fixed weights used in the methodology to adjust the budget balance for the cycle would necessarily introduce a bias in the cyclical correction, with respect to the DEB.
· Effect of a change in the output gap on the expenditure ratio. This term, would show up in the ΔSB and would be expected to be sizeable in case of sudden accelerations and/or recessions, when the output gap is expected to widen quickly. Such dynamics operate through a denominator effect. The difference between the DEB and the ΔSB due to this factor are likely to be more pronounced the cases of Member States undergoing significant economic contractions.
· Changes in interest payments. The expenditure benchmark excludes interest payments. Significant year-on-year changes in the latter may drive a significant discrepancy between both indicators.
· Changes in expenditure matched by EU funds revenues. ESA95 recording rules ensure that, in the balance (thus in the structural balance), this amount is cancelled out by corresponding revenues from the EU on the same year. However, in the expenditure benchmark, by construction, the actual EU funds do not appear on the revenue side.
· Deviation of investment expenditures from 4-year average. The expenditure benchmark smoothens peaks in spending on gross fixed capital formation (GFCF), which can be a source of divergence with respect to the structural balance, which only takes into account yearly expenditure. This implies that the expenditure benchmark is going to be less stringent in years when an investment peak occurs, since it will smooth the need to finance this peak over the following three years, during which it will be more demanding than the simple change in the structural balance.
· The difference between the actual potential growth rate and the reference medium-term potential growth rate used to project expenditure in the expenditure benchmark.

KC-AH-13-152-EN
-N
Related Documents